Southern Copper Corporation (NYSE:SCCO) is one of the best commodity stocks to buy for the supercycle. On May 15, Scotiabank lifted the price target on Southern Copper Corporation (NYSE:SCCO) to $135 from $133, maintaining an Underperform rating on the shares. The firm told investors that it believes investors should find “attractive trading opportunities” with the industry facing increased volatility and scenarios of high metal price levels.
n
n
Southern Copper Corporation (NYSE:SCCO) also received a rating update from Wells Fargo on May 1, with the firm cutting the price target on the stock to $171 from $186 while maintaining an Equal Weight rating on the shares. The firm stated that fiscal Q1 benefited from solid byproduct credits, adding that energy cost risk was downplayed by management. It also cited the resolved Tia Maria permitting issues and believes that at about 13 times 2026 EV/EBITDA on $6/lb copper, near-term copper tightness appears largely priced in.
n
Southern Copper Corporation (NYSE:SCCO) is involved in the production, development, and exploration of zinc, copper, silver, and molybdenum. The company conducts its operations in the following segments: Peruvian Operations, Mexican Open-Pit Operations, and Mexican Underground Mining Operations.
n
n
While we acknowledge the potential of SCCO as an investment, we believe certain AI stocks offer greater upside potential and carry less downside risk. If you're looking for an extremely undervalued AI stock that also stands to benefit significantly from Trump-era tariffs and the onshoring trend, see our free report on the best short-term AI stock.
n
n
n
READ NEXT: 15 Stocks That Will Make You Rich in 10 Years AND 12 Best Stocks That Will Always Grow.
n
Disclosure: None. Follow Insider Monkey on Google News.
MEXICO CITY, May 26, 2026 (GLOBE NEWSWIRE) — The following is a statement by PODER:
This information is related to the worst environmental disaster in the history of metal mining in Mexico: the 2014 spill of 40 million liters of toxic waste in the Sonora and Bacanuchi rivers by Buenavista del Cobre, a mine owned by Grupo Mexico, affecting more than 22 thousand people. Government authorities have yet to abide by court rulings to repair the damages caused and accumulated over time, and Grupo México has used legal obstacles to avoid taking preventive measures and paying for the damages.
According to the Ministry of the Environment (Semarnat) in Mexico, the total cost of the spill amounts to MORE THAN ONE BILLION (USD). The company alleges it agreed to an arrangement with the government to provide around 86,500 million USD. This amount will contribute to the installation of a hospital and a few water treatment plants that can separate heavy metals. There is NO public information to confirm this. The amount committed is the bare minimum to remediate the damages, and to prevent future disasters that could add to the current social and environmental damages. Accoridng to this source, the company has proposed confidentiality clauses on issues related to the communities’ rights, making reparations contingent on this.
This will continue to have repercussions for its investors.
In the context of the 2026 AGM of Grupo Mexico and Southern Copper Corporation, affected communities urge its investors to:
- Be vocal in linking executive compensation for the new CEO Leonardo Contreras Lerdo de Tejada to ensuring that the company operates in accordance with an assessment of risks and benefits for all workers, surrounding communities, value chains, and shareholders, including a preventative plan to identify, mitigate, communicate, and address current social, environmental, and climate negative impacts.
- Require a clear plan, with a concrete timeline and designated funds, to actively and efficiently repair the damages to the people, environment, biodiversity, land, and territory caused by the 2014 toxic spill, and ensure that these continue until reparation is achieved.
- Ensure that existing and new tailings dams meets the necessary safety standards to prevent it from overflowing, rupturing, or leaking into aquifers or rivers, and that all liquids discharged by the company are properly managed, leaving only clean, potable water.
We urge you to ensure that the company keeps its investors informed with transparency and accountability, that it transforms verbal commitments into concrete actions on this distressing, painful and shameful case, and to prevent further ones.
The affected communities have asked Grupo Mexico's investors to address the issue, be vigilant of greenwashing, and fulfill their obligation to respect human rights.
PODER is a corporate accountability and human rights NGO accompanying the affected communities. https://poderlatam.org
Contact Information: comunicacion@poderlatam.org
Make better investment decisions with Simply Wall St's easy, visual tools that give you a competitive edge.
The latest update to Teck Resources’ valuation lifts the fair value estimate to CA$83.06 from CA$79.35, signalling a modest reassessment of what the stock could be worth. That shift sits alongside a series of Street price target moves around CA$79 that are closely linked to expectations for the Anglo American merger and how execution risks are being weighed. As you read on, you will see how these evolving targets fit into the broader analyst narrative and what that means for tracking the story from here.
What Wall Street Has Been Saying 🐂 Bullish Takeaways
- Several firms, including Deutsche Bank, JPMorgan, Scotiabank, CIBC, TD Securities and Canaccord, have raised price targets in recent months, signalling a generally constructive stance on Teck Resources’ value.
- Deutsche Bank has lifted its target multiple times, most recently to US$62 from US$60, and maintains a Buy rating. This points to ongoing confidence in the stock at current levels.
- CIBC moved its target to C$79 from C$77 and shifted its rating to Tender after Canadian approval of the Anglo American merger, highlighting the role of the deal in the equity story.
- Scotiabank’s target moves, including an increase to C$80 with a Sector Perform rating, indicate that some analysts see support for the current valuation range even with more reserved ratings.
🐻 Bearish Takeaways
- Canaccord has both raised and lowered its Teck Resources target over this period, which underscores that not all analysts view the risk and reward profile as one way.
- CIBC’s Tender stance around C$79 ties part of the thesis to successful completion of the Anglo American merger. Delays or issues around remaining approvals in China and South Korea could weigh on sentiment.
Do your thoughts align with the Bull or Bear Analysts? Perhaps you think there's more to the story. Head to the Simply Wall St Community to discover more perspectives!
TSX:TECK.B 1-Year Stock Price Chart
We've flagged 1 risk for Teck Resources. See which could impact your investment.
What's in the News
- Titan Mining and Teck Resources signed a cooperation agreement to evaluate recovering about 13,000 kg per year of contained germanium from Empire State Mines processing streams, using Teck's germanium recovery platform at Trail to assess feed specifications, volumes and potential long term offtake terms.
- Kodiak Copper, Teck Resources and Kay Copper announced a non binding letter of intent to combine Kodiak's Mohave project and Teck's Copper Hill project in Arizona into a new US focused copper exploration company. The new company is expected to seek a TSX Venture Exchange listing as Kay Copper Corp., with Teck set to hold about 28% and receive certain concentrate offtake rights, subject to approvals and financings.
- Copper Fox Metals outlined a planned CA$9.1 million program for 2026 at the Schaft Creek copper project in British Columbia, which is operated by Teck Resources with a 75% interest. The program targets work on the geological model, metallurgical testwork, tailings and mine plan options, road access studies and preparation for a potential Pre Feasibility Study.
How This Changes the Fair Value For Teck Resources
- Fair value estimate is CA$83.06, up from CA$79.35.
- Revenue growth assumption is 0.10%, reduced from 3.28%.
- Net profit margin assumption is 13.21%, down from 15.45%.
- Future P/E is 31.40x, up from 25.12x.
- Discount rate is 8.18%, slightly higher than the prior 8.00%.
Never Miss an Update: Follow The Narrative
Narratives link a company's real world projects, risks and milestones to a financial forecast and fair value that update as new information comes through. They help you see how individual data points fit into a bigger investment story.
Head over to the Simply Wall St Community and follow the Narrative on Teck Resources to stay up to date on:
- How copper growth projects like Highland Valley life extension, QB optimization and the Zafranal and San Nicolas pipeline are expected to reshape Teck Resources' production mix.
- The role of balance sheet strength, liquidity of about $8.9b and long running ESG focus in supporting project execution and access to capital.
- Key risks from project delays, cost inflation, permitting and commodity price weakness that could constrain margins and future earnings potential.
This article by Simply Wall St is general in nature. We provide commentary based on historical datan and analyst forecasts only using an unbiased methodology and our articles are not intended to be financial advice. It does not constitute a recommendation to buy or sell any stock, and does not take account of your objectives, or yourn financial situation. We aim to bring you long-term focused analysis driven by fundamental data.n Note that our analysis may not factor in the latest price-sensitive company announcements or qualitative material.n Simply Wall St has no position in any stocks mentioned.
Companies discussed in this article include TECK-B.TO.
Have feedback on this article? Concerned about the content? Get in touch with us directly. Alternatively, email editorial-team@simplywallst.com
Endeavour, Rio Tinto and Glencore lead rebounding miners as metals prices seesaw Proactive uses images sourced from Shutterstock
Mining stocks climbed on Tuesday as investors returned to metals after sharp gains in gold, silver and copper prices driven by hopes of easing geopolitical tensions in the Middle East.
n
Endeavour Mining PLC (LSE:EDV) led the FTSE 100 risers, up 3.5%, while Rio Tinto Ltd (LSE:RIO) gained 2.3%, Glencore PLC (LSE:GLEN) rose 2.2%, Antofagasta PLC (LSE:ANTO) 1.9%, Anglo American PLC (LSE:AAL) 1.4% and Fresnillo PLC (LSE:FRES) 0.8%.
n
The rally followed strong moves in metals markets on Monday after Donald Trump said a "memorandum of understanding" in talks to end the US and Israel's war on Iran "has been largely negotiated".
n
However, the US launched strikes on Iran overnight, targeting missile launch sites and vessels suspected of attempting to lay mines in what Washington described as “defensive” action.
n
Meanwhile, a senior delegation of Iranian negotiators is travelling to Qatar for fresh talks with the US over frozen financial assets and a possible wider deal.
n
Gold climbed from around $4,500 an ounce on Friday to about $4,570 on Monday before easing back to $4,535 on Tuesday morning. Silver followed a similar pattern, rising from $75.4 an ounce at the end of last week to above $78.5 before retreating to around $76.4.
n
Copper prices also surged, with US copper futures reaching $6.44 a pound and London Metal Exchange copper trading at $13,667.50 a tonne at one stage.
n
The moves helped lift both precious metal miners and diversified mining groups, with investors betting higher commodity prices could support earnings if geopolitical tensions remain elevated.
n
"For markets the message is straightforward: the peace trade is more fragile than Monday’s price action suggested," said market analyst Patrick Munnelly at Tickmill.
n
He said the latest round of strikes "complicates hopes for an interim deal to extend the ceasefire and reopen the Strait of Hormuz, even though Trump said talks were 'proceeding nicely' and Pakistan’s military chief Asim Munir reportedly told China that an agreement was close.
n
"Investors are still cautiously optimistic, but the risk premium has not disappeared. As long as military action and negotiations are running in parallel, energy markets will remain vulnerable to abrupt reversals."
Agnico Eagle Mines Limited (NYSE:AEM) is one of the cheap NYSE stocks to buy according to analysts. On May 20, Agnico Eagle Mines Limited announced a subscription agreement to acquire approximately 243.9 million common shares of Wallbridge Mining Company Limited for a total consideration of C$22.4 million. Expected to close around May 22, the transaction will increase Agnico Eagle’s stake in Wallbridge to approximately 19.62% on a non-diluted basis.
n
Upon closing, the companies will enter into an investor rights agreement, granting Agnico Eagle the right to maintain its pro-rata ownership in future equity financings and the option to nominate members to Wallbridge’s board of directors. This move aligns with Agnico Eagle’s broader corporate strategy of securing strategic interests in mining projects with high geological potential.
n
The investment is subject to standard closing conditions, including regulatory approval from the Toronto Stock Exchange. Agnico Eagle Mines Limited (NYSE:AEM) indicated that it may adjust its investment in Wallbridge in the future based on evolving market conditions, strategic priorities, and other relevant factors.
n
n
Agnico Eagle Mines Limited (NYSE:AEM) is a senior Canadian gold mining company and the world’s second-largest gold producer, focused on exploring, developing, and operating mines. It operates high-quality, low-risk assets primarily in Canada, Australia, Finland, and Mexico, with about 85% of its production coming from Canada.
n
n
While we acknowledge the potential of AEM as an investment, we believe certain AI stocks offer greater upside potential and carry less downside risk. If you're looking for an extremely undervalued AI stock that also stands to benefit significantly from Trump-era tariffs and the onshoring trend, see our free report on the best short-term AI stock.
n
n
n
READ NEXT: 33 Stocks That Should Double in 3 Years and Cathie Wood 2026 Portfolio: 10 Best Stocks to Buy.
n
Disclosure: None. Follow Insider Monkey on Google News.
Teck Resources Limited (NYSE:TECK) is one of the 10 Best Performing Canadian Stocks So Far in 2026.
n
On May 15, 2026, Deutsche Bank raised the firm’s price target on Teck Resources Limited (NYSE:TECK) to $62 from $60 previously and maintained a Buy rating on the shares.
n
JPMorgan also increased its price target on Teck Resources Limited (NYSE:TECK) to $48 from $45 previously while keeping a Neutral rating on the shares.
n
Last month, Teck Resources Limited (NYSE:TECK) reported Q1 adjusted EPS of C$1.75, compared to C$0.60 in the prior-year period. Revenue rose to C$3.94B from C$2.29B a year earlier. President and CEO Jonathan Price said the company delivered a strong start to 2026, driven by record quarterly copper sales, favorable commodity pricing, and steady operational execution across the portfolio. Management highlighted particularly strong performance from the Quebrada Blanca operation, which achieved record quarterly copper sales alongside continued operating stability. Price added that the quarter underscored both the resilience of Teck’s asset portfolio and the strength of its balance sheet as the company continues working toward completing its proposed merger of equals with Anglo American.
n Pixabay/Public Domainn
Teck Resources Limited (NYSE:TECK) is a diversified mining company involved in the exploration, development, processing, refining, and reclamation of mineral properties globally.
n
n
While we acknowledge the potential of TECK as an investment, we believe certain AI stocks offer greater upside potential and carry less downside risk. If you're looking for an extremely undervalued AI stock that also stands to benefit significantly from Trump-era tariffs and the onshoring trend, see our free report on the best short-term AI stock.
n
n
n
READ NEXT: 33 Stocks That Should Double in 3 Years and Cathie Wood 2026 Portfolio: 10 Best Stocks to Buy.
n
Disclosure: None. Follow Insider Monkey on Google News.
Find your next quality investment with Simply Wall St’s easy and powerful screener, trusted by over 7 million individual investors worldwide.
Why Southern Copper Stock Is Back in Focus
Southern Copper (SCCO) is back on investors radar after a stronger earnings outlook, continued quarterly earnings beats and a new US$318.6 million upgrade plan for its Cuajone mine in Peru.
See our latest analysis for Southern Copper.
The US$179.12 share price has eased in recent months, with the 90 day share price return down 10%, even as the year to date share price return sits at 22.7% and the 1 year total shareholder return is 110.7%. This hints that recent volatility contrasts with a much stronger longer term experience for investors.
If this kind of copper exposure has your attention, it may be worth broadening your search using our screener of 8 top copper producer stocks
With earnings estimates moving higher, recent quarterly beats, and a US$179.12 share price that sits above the average analyst target, the key question now is clear: is there still an opportunity for investors here, or is the market already pricing in future growth?
Most Popular Narrative: 10.2% Overvalued
At a last close of $179.12, the most followed narrative puts Southern Copper’s fair value at $162.54, creating a clear gap investors are watching.
Southern Copper has announced substantial capital investments totaling over $15 billion, including projects in Mexico and Peru, which are expected to drive future production growth and potentially boost revenue significantly. The company’s Buenavista zinc concentrator is now operating at full capacity, anticipated to drive a 31% increase in zinc production in 2025, likely enhancing revenues and improving net margins due to efficient operations.
Curious what kind of growth, margin profile and future earnings multiple could still justify a premium price tag on a slow and steady expansion plan? The full narrative lays out a detailed earnings path, explains how profitability might shift, and specifies a valuation multiple for those projected results.
Result: Fair Value of $162.54 (OVERVALUED)
Have a read of the narrative in full and understand what’s behind the forecasts.
However, this story can change quickly if cost pressures, community disruptions, or trade tensions between the U.S. and China weaken margins and project timelines.
Find out about the key risks to this Southern Copper narrative.
Next Steps
Given the mix of optimism and concern in this story, it makes sense to look at the figures yourself, consider both perspectives, and review the 2 key rewards and 1 important warning sign
Looking for more investment ideas?
If Southern Copper has your attention, do not stop here. Broaden your watchlist now so you are not relying on a single story for future decisions.
- Spot potential upside early by scanning screener containing 20 high quality undiscovered gems that combine strong fundamentals with quieter market attention.
- Strengthen your portfolio core with solid balance sheet and fundamentals stocks screener (46 results) that can help support resilience when conditions get choppy.
- Target income-focused opportunities by reviewing 10 dividend fortresses built around higher yields with stability in mind.
This article by Simply Wall St is general in nature. We provide commentary based on historical datan and analyst forecasts only using an unbiased methodology and our articles are not intended to be financial advice. It does not constitute a recommendation to buy or sell any stock, and does not take account of your objectives, or yourn financial situation. We aim to bring you long-term focused analysis driven by fundamental data.n Note that our analysis may not factor in the latest price-sensitive company announcements or qualitative material.n Simply Wall St has no position in any stocks mentioned.
Companies discussed in this article include SCCO.
Have feedback on this article? Concerned about the content? Get in touch with us directly. Alternatively, email editorial-team@simplywallst.com
Friday, May 22, 2026The Zacks Research Daily presents the best research output of our analyst team. Today's Research Daily features new research reports on 16 major stocks, including Texas Instruments Inc. (TXN), Linde plc (LIN) and BHP Group Ltd. (BHP), as well as two micro-cap stocks Landmark Bancorp, Inc. (LARK) and Global Self Storage, Inc. (SELF). The Zacks microcap research is unique as our research content on these small and under-the-radar companies is the only research of its type in the country.These research reports have been hand-picked from the roughly 70 reports published by our analyst team today.You can see all of today’s research reports here >>>Ahead of Wall StreetThe daily 'Ahead of Wall Street' article is a must-read for all investors who would like to be ready for that day's trading action. The article comes out before the market opens, attempting to make sense of that morning's economic releases and how they will affect that day's market action. You can read this article for free on our home page and can actually sign up there to get an email notification as this article comes out each morning.You can read today's AWS here >>> Pre-Markets Up to Finish the Week Ahead of Memorial DayToday's Featured Research ReportsTexas Instruments’ shares have outperformed the Zacks Semiconductor – General industry over the past six months (+95.2% vs. +30.2%). The company is benefiting from solid data center demand, which is boosting its prospects in the enterprise systems market. A sustained focus on expanding its product portfolio across the Analog and Embedded Processing segments helps capture market share. Texas Instruments’ deepening focus on internal manufacturing and advanced technology infusion is another positive. Its robust cash flows and aggressive shareholder return policies instill confidence in its long-term prospects. However, its overall growth might be impacted by a slow recovery in the industrial market as customers are cautiously spending amid ongoing macroeconomic uncertainties. Rising manufacturing costs and the growing tech war between the United States and China are other concerns. Our model estimates indicate that revenues are likely to witness a CAGR of 12.1% through 2026-2028.(You can read the full research report on Texas Instruments here >>>)Shares of Linde have outperformed the Zacks Chemical – Specialty industry over the past six months (+28.5% vs. +12.7%). The company is a leading industrial gas supplier serving energy, healthcare, manufacturing, metals and electronics markets through long-term contracts with minimum purchase commitments that support stable cash flows during downturns. LIN has a $9.9B project backlog, including $7.1B of long-term Sale of Gas projects, providing durable earnings visibility and double-digit returns. Management expects operating margins to expand above its traditional 40–60 basis-point range via cost controls, automation and AI-driven efficiency initiatives. LIN reported strong first-quarter 2026 earnings on higher pricing and incremental project start-ups. However, Linde faces pressure in EMEA from weak industrial activity, softer chemicals demand, geopolitical disruptions and policy uncertainty, which could reduce volumes, delay investments and weigh on profitability.(You can read the full research report on Linde here >>>)BHP’s shares have outperformed the Zacks Mining – Miscellaneous industry over the past six months (+61.8% vs. +39.1%). The company remains a high-quality diversified miner with leadership in iron ore and growing leverage to copper and potash, supported by low-cost operations and disciplined capital allocation. Recent updates point to resilient iron ore volumes despite weather disruption, strong execution at Escondida and Copper South Australia. BHP’s strategic shift toward future-facing commodities like copper and potash positions it well to benefit from global decarbonization and trends. Strong cash generation, efforts to lower debt and portfolio actions support funding flexibility. However, weak steel demand, commodity price volatility and cost pressures in parts of the footprint remain headwinds. Large project delivery and capital intensity at Jansen, along with the suspended nickel business and regulatory uncertainty in Australia, remain key risks. (You can read the full research report on BHP here >>>)Shares of Landmark Bancorp have gained +5.9% over the past six months against the Zacks Financial – Savings and Loan industry’s gain of +17.9%. This microcap company with a market capitalization of $170.37 million benefits from a diversified community banking franchise across Kansas and Missouri, supporting balanced exposure to residential, commercial, agricultural, and municipal lending markets. The company is strengthening profitability through disciplined deposit pricing, improved loan yields, and expansion in net interest margin, creating a more resilient earnings profile. Credit quality remains manageable with stable reserves and limited charge-offs despite modest increases in delinquencies. Capital levels and tangible book value continue to improve, supported by consistent earnings generation and a long history of dividend payments.Management is also enhancing funding flexibility by emphasizing core relationship deposits while reducing reliance on brokered funding. In addition, liquidity management and active securities portfolio positioning help mitigate interest-rate volatility.(You can read the full research report on Landmark Bancorp here >>>)Global Self Storage’s shares have gained +6.8% over the past six months against the Zacks REIT and Equity Trust – Other industry’s gain of +11.9%. This microcap company with a market capitalization of $59.51 million has its investment thesis centered on targeting underserved secondary and tertiary markets, where supply growth is more rational and competition is lower than in major metropolitan areas. Global Self Storage’s focus on operational efficiency, customer retention and technology-enabled revenue management has supported strong occupancy and recurring cash-flow generation. Growth opportunities remain tied to selective acquisitions, JVs and redevelopment initiatives that can expand earnings without significant development risk. Investors should monitor margin pressure from rising labor and property-tax costs, which have recently limited profitability. SELF’s small scale also increases sensitivity to localized fluctuations. Current valuation levels suggest the market is discounting concerns around scale and margins, though continued growth could support upside and dividends.(You can read the full research report on Global Self Storage here >>>)Other noteworthy reports we are featuring today include Vertiv Holdings Co (VRT), Spotify Technology S.A. (SPOT) and Symbotic Inc. (SYM).Mark VickerySenior EditorNote: Sheraz Mian heads the Zacks Equity Research department and is a well-regarded expert of aggregate earnings. He is frequently quoted in the print and electronic media and publishes the weekly Earnings Trends and Earnings Preview reports. If you want an email notification each time Sheraz publishes a new article, please click here>>>
Today's Must Read
Texas Instruments (TXN) Gains From Robust Data Center Demand
Lincoln (LNC) rides on Premium Growth, Elevated Expenses Hurt
BHP Group (BHP) Bets on Growth Investments as Costs Hurt Margins
Featured Reports
Large User Base and Pricing Power Aid Spotify (SPOT), No Dividends AilPer the Zacks analyst, SPOT's Strong subscriber growth and improving pricing power ensure revenue growth, but the absence of cash dividends may deter income-focused shareholders.
Warehouse Automation Aids Symbotic (SYM), Customer Concentration AilsThe Zacks analyst is concerned about the customer concentration risk at Symbotic. The long-term push by retailers and wholesalers to automate warehouse operations is, however, a positive.
Insmed (INSM) Rides on Sales Uptake for Bronchiectasis DrugThe Zacks Analyst believes the demand for Insmed's Brinsupri, the first treatment for non-CF bronchiectasis, is strong. The drug is expected to achieve blockbuster status in 2026.
Increasing Adoption of Dragonfly Platform Aids Onto Innovation (ONTO)Per the Zacks analyst, Onto Innovation's top-line is gaining from higher demand for the Dragonfly platform. Momentum in both advanced packaging and advanced nodes is a tailwind.
Disciplined Investments and Customer Additions Aid OGE Energy (OGE)Per the Zacks analyst, OGE Energy will benefit from its systematic capital investment to upgrade its infrastructure. Rising customer base will further boost its performance.
Lincoln (LNC) rides on Premium Growth, Elevated Expenses HurtPer the Zacks analyst, Lincoln's growing premium is driven by new products and the enhancement of the existing ones, which keep driving its top line. However, escalating expenses remain a concern.
Wendy's (WEN) Gains on Project Fresh Momentum Amid Cost PressuresPer the Zacks analyst, Wendy's is benefiting from Project Fresh initiatives, digital engagement and international expansion. However, soft comparable sales and elevated costs remain headwinds
New Upgrades
Vertiv (VRT) Rides on Strong AI-Driven Data Center Power NeedsPer the Zacks analyst, Vertiv is benefiting from rising data center power and thermal needs as AI deployments drive higher infrastructure density and faster build cycles.
Higher Nitrogen Demand and Prices Drive CF Industries (CF)Per the Zacks analyst, CF Industries will gain from higher demand for nitrogen fertilizers in major markets. Higher nitrogen prices amid lower supply availability will also drive its margins.
Par Pacific Continues to Bank on Excess RINs and Low DebtThe Zacks analyst likes Par Pacific because Renewable Identification Number (RIN) monetization could free up working capital, and its low debt load supports investments and opportunistic buybacks.
New Downgrades
Whirlpool (WHR) Witnesses Operational Headwinds and Tariff PressuresPer the Zacks analyst, Whirlpool's performance is reflecting ongoing operational and market challenges. It has been witnessing tariff pressures, weak housing demand and promotional intensity.
Rising Net Outflows and Weak Liquidity Hurts Lazard (LAZ) FinancialsPer the Zacks analyst, rising net outflows continue to weigh on Lazard's assets under management (AUM) growth. Also, weak liquidity position remains a key concern for the company.
Prestige Consumer (PBH) Struggles With Supply VolatilityThe Zacks analyst is concerned with Prestige Consumer's ongoing supply pressures in eye care, uneven shipment, lean safety stocks and rising execution risks that could weigh on fiscal 2027 growth.
Want the latest recommendations from Zacks Investment Research? Today, you can download 7 Best Stocks for the Next 30 Days. Click to get this free report
Texas Instruments Incorporated (TXN) : Free Stock Analysis Report
BHP Group Limited Sponsored ADR (BHP) : Free Stock Analysis Report
Linde PLC (LIN) : Free Stock Analysis Report
Landmark Bancorp Inc. (LARK): Free Stock Analysis Report
Global Self Storage, Inc. (SELF): Free Stock Analysis Report
Spotify Technology (SPOT) : Free Stock Analysis Report
Vertiv Holdings Co. (VRT) : Free Stock Analysis Report
Symbotic Inc. (SYM) : Free Stock Analysis Report
This article originally published on Zacks Investment Research (zacks.com).
Never miss an important update on your stock portfolio and cut through the noise. Over 7 million investors trust Simply Wall St to stay informed where it matters for FREE.
- If you are wondering whether BHP Group at A$59.75 is still priced attractively after a strong run, the starting point is to understand what the current share price implies about its underlying value.
- The stock is up 30.6% year to date and 62.3% over the past year, although it has slipped 1.2% over the last week while still showing a 6.4% gain over the past month. These changes can affect how you think about both upside potential and downside risk.
- Recent coverage around BHP has focused on its position within global resources and how shifts in commodity demand and market sentiment are feeding into expectations for the stock. This context helps explain why shorter term price moves can look choppy, while the longer term chart shows a very different picture.
- Despite this share price performance, BHP currently records a valuation score of 1 out of 6. The next sections will break down what traditional valuation tools say about the stock and then finish with a broader way to think about value that goes beyond just the headline multiples.
BHP Group scores just 1/6 on our valuation checks. See what other red flags we found in the full valuation breakdown.
Approach 1: BHP Group Discounted Cash Flow (DCF) Analysis
A Discounted Cash Flow, or DCF, model estimates what a stock could be worth by projecting the cash the company might generate in the future and then discounting those cash flows back to today.
For BHP Group, the model used is a 2 Stage Free Cash Flow to Equity approach based on cash flow projections. The latest twelve month Free Cash Flow is about $10.33b. Analyst estimates and subsequent extrapolations point to projected Free Cash Flow of $11.36b in 2030, with a series of annual forecasts in between. Simply Wall St uses analyst inputs for the first years and then extends the trend to build a 10 year cash flow curve.
On this basis, the discounted projected cash flows result in an estimated intrinsic value of $40.75 per share. Compared with the current share price of A$59.75, the model suggests BHP is trading at a premium, with the DCF output indicating the stock is 46.6% overvalued on this measure.
Result: OVERVALUED
Our Discounted Cash Flow (DCF) analysis suggests BHP Group may be overvalued by 46.6%. Discover 10 high quality undervalued stocks or create your own screener to find better value opportunities.
BHP Discounted Cash Flow as at May 2026
Approach 2: BHP Group Price vs Earnings
For profitable companies, the P/E ratio is a useful yardstick because it links what you pay for the stock directly to the earnings it currently generates. It is a quick way to see how much the market is paying for each dollar of profit.
What counts as a “normal” or “fair” P/E often reflects how the market views a company’s growth outlook and risk profile. Higher expected growth or lower perceived risk can justify a higher multiple, while slower growth or higher risk usually points to a lower one.
BHP Group currently trades on a P/E of 21.11x. That sits above the Metals and Mining industry average P/E of 12.76x, but below the peer group average of 31.36x. Simply Wall St also calculates a proprietary “Fair Ratio” of 19.40x, which is the P/E it would expect for BHP given factors such as its earnings characteristics, industry, profit margin, market cap and risk profile.
This Fair Ratio aims to be more tailored than a simple comparison against peers or the broad industry because it accounts for company specific features rather than just grouping everything together.
Comparing the Fair Ratio of 19.40x with the current P/E of 21.11x suggests the stock is trading a little above that fair level.
Result: OVERVALUED
ASX:BHP P/E Ratio as at May 2026
P/E ratios tell one story, but what if the real opportunity lies elsewhere? Start investing in legacies, not executives. Discover our 4 top founder-led companies.
Upgrade Your Decision Making: Choose your BHP Group Narrative
Earlier it was mentioned that there is an even better way to understand valuation. Narratives bring this to life by letting you attach a clear story about BHP Group to the numbers you care about, linking your view on its future revenue, earnings and margins to a forecast, a Fair Value and then a simple comparison with the current share price. All of this is available within an easy tool on Simply Wall St’s Community page that updates as new news or earnings arrive. The page already hosts very different perspectives, such as a lower fair value around A$31.79 that leans heavily on copper and project risks, and a higher fair value around A$121.48 that leans on scale, diversification and demand for critical commodities. This can help you see where your own view sits and how that might guide when you choose to act.
For BHP Group however we’ll make it really easy for you with previews of two leading BHP Group Narratives:
Fair value: A$121.48 per share
Implied discount to this fair value: about 50.8% below the narrative fair value
Revenue growth assumption: 28%
- Frames BHP as a large scale producer of iron ore, copper and metallurgical coal tied into long term infrastructure, steel and energy transition demand.
- Highlights FY2024 revenue of about US$55.7b and underlying profit of US$13.7b, with iron ore around 50% of revenue and copper about 33%.
- Sees BHP’s low cost operations and strong cash generation as key strengths, while flagging exposure to commodity price cycles and Chinese iron ore demand as the main risks.
Fair value: A$53.40 per share
Implied premium to this fair value: about 11.9% above the narrative fair value
Revenue growth assumption: 1.15%
- Sets out a view that BHP benefits from demand for critical minerals and steelmaking materials, supported by copper and potash projects and infrastructure spending in Asia and India.
- Notes analyst assumptions for modest revenue growth, higher profit margins over time and earnings of US$13.1b by about 2029, with a P/E of 19.1x applied to those earnings.
- Emphasizes risks around iron ore concentration, project execution, regulation, costs, and ESG pressures, and concludes that the current price sits close to the analyst consensus fair value.
If you find that your own expectations on growth, margins and risk line up with one of these narratives, that can help you decide whether today’s price feels stretched, conservative or somewhere in between, and whether BHP Group belongs on your watchlist or just on your radar for now.
Do you think there’s more to the story for BHP Group? Head over to our Community to see what others are saying!
ASX:BHP 1-Year Stock Price Chart
This article by Simply Wall St is general in nature. We provide commentary based on historical datan and analyst forecasts only using an unbiased methodology and our articles are not intended to be financial advice. It does not constitute a recommendation to buy or sell any stock, and does not take account of your objectives, or yourn financial situation. We aim to bring you long-term focused analysis driven by fundamental data.n Note that our analysis may not factor in the latest price-sensitive company announcements or qualitative material.n Simply Wall St has no position in any stocks mentioned.
Companies discussed in this article include BHP.AX.
Have feedback on this article? Concerned about the content? Get in touch with us directly. Alternatively, email editorial-team@simplywallst.com
Company Executives Share Vision and Answer Questions Live at VirtualInvestorConferences.com
NEW YORK, May 22, 2026 (GLOBE NEWSWIRE) — Virtual Investor Conferences, the leading proprietary investor conference series, today announced the presentations from Precious Metals & Critical Minerals Hybrid Virtual Investor Conference held May 21st are now available for online viewing.
The company presentations will be available 24/7 for 90 days. Investors, advisors, and analysts may download investor materials from the company’s resource section.
May 21st
| Company | Ticker(s) |
| Keynote: Jeff Christian, Managing Partner of CPM Group “The Bullish Outlook for Precious Metals” | |
| Viva Gold Corp. | (OTCQB: VAUCF | TSXV: VAU) |
| Cygnus Metals Limited | (OTCQB: CYGGF | TSXV: CYG) |
| Eloro Resources Ltd. | (OTCQX: ELRRF | TSX: ELO) |
| Oreterra Metals Corp. | (OTCID: OTMCF | TSXV: OTMC) |
| Metals One plc. | (OTCQB: MTOPF| LSE: MET1) |
| Amaroq Ltd. | (OTCQX: AMRQF | LSE: AMRQ) |
| Midnight Sun Mining Corp. | (OTCQX: MDNGF | TSXV: MMA) |
| Star Gold Corp. | (OTCQB: SRGZ) |
| Sirios Resources Inc. | (OTCQB: SIREF | TSXV: SOI) |
| Canadian Phosphate Limited | (Pink: FTZZF | ASX: CP8) |
| Honey Badger Silver Inc. | (OTCQB: HBEIF | TSXV: TUF) |
| Renforth Resources Inc. | (Pink: RFHRF | CSE: RFR) |
To facilitate investor relations scheduling and to view a complete calendar of Virtual Investor Conferences, please visit www.virtualinvestorconferences.com.
About Virtual Investor Conferences®
Virtual Investor Conferences (VIC) is the leading proprietary investor conference series that provides an interactive forum for publicly traded companies to seamlessly present directly to investors.
Providing a real-time investor engagement solution, VIC is specifically designed to offer companies more efficient investor access. Replicating the components of an on-site investor conference, VIC offers companies enhanced capabilities to connect with investors, schedule targeted one-on-one meetings and enhance their presentations with dynamic video content. Accelerating the next level of investor engagement, Virtual Investor Conferences delivers leading investor communications to a global network of retail and institutional investors.
Media Contact: OTC Markets Group Inc. +1 (212) 896-4428, media@otcmarkets.com
Virtual Investor Conferences
Greg Young
VP Corporate Services
OTC Markets Group
(212) 652-5958
This article first appeared on GuruFocus.
Gina Rinehart is sharpening Hancock Prospecting's exposure to two very different corners of the market: US defense and global mining. During the first quarter, the closely held firm bought shares in RTX (NYSE:RTX), Northrop Grumman (NYSE:NOC), L3Harris Technologies (NYSE:LHX), and Lockheed Martin (NYSE:LMT), with those US weapons-maker stakes worth a combined $97 million as of March 31, according to a regulatory filing. The move puts nearly $100 million behind aerospace and defense names at a time when the broader defense index has been under pressure.
- Warning! GuruFocus has detected 9 Warning Signs with AMD.
- Is RTX fairly valued? Test your thesis with our free DCF calculator.
Mining, however, still looks like the deeper portfolio bet. Hancock added 1.35 million shares to its Hudbay Minerals (NYSE:HBM) position and also took a stake in Newmont (NYSE:NEM). Those holdings, together with Hancock's positions in Teck Resources (NYSE:TECK) and MP Materials (NYSE:MP), make up nearly half of the firm's roughly $3.3 billion stock portfolio, based on Bloomberg calculations. That positioning could be notable for investors because the MSCI World Metals & Mining Index has returned 19% this year through Friday's close, outpacing the S&P 500's 8.2% rise.
The split matters because Rinehart appears to be leaning into mining strength while also possibly building optionality in defense. The MSCI World Aerospace & Defense Index has fallen 3.5%, creating a sharp contrast with the rally in metals and mining. Rinehart, 72, built her fortune developing massive iron ore deposits in Western Australia and is currently worth $43.8 billion, according to the Bloomberg Billionaires Index.
Source: Getty Images
Written by Demetris Afxentiou at The Motley Fool Canada
n
When trade tensions rise, investors seek out the stocks that can provide some defensive appeal to offset that market volatility. Often, these stocks can continue to offer growth, even when the market gets choppy. That means picking companies that can offer strong essential demand and recurring, stable revenue streams, over more volatile picks.
n
Trade tensions often create volatility in supply chains, impact commodity prices, and tend to influence corporate spending. And while not every company is exposed equally, there are some that can benefit from that volatility.
n
Trade tensions also tend to amplify supply‑chain bottlenecks, which can create uneven performance across sectors and highlight the value of those companies with stable demand.
n
So then, what are the stocks that offer that defensive appeal needed and thus an opportunity? Several great options on the market can meet that goal, and here’s a look at four of them.
nOption #1: Teck Resourcesn
Teck Resources (TSX:TECK.B) is one of the better-known mining companies in Canada. Teck’s appeal to investors stems from its exposure to certain commodities that are tied to global demand trends.
n
One of those commodities is copper. Copper is an essential metal used in power grids, construction, manufacturing, and renewable energy transition. Teck also has exposure to steelmaking coal and zinc. The sheer necessity of those metals makes them ideal options for defensive portfolios, even when trade tensions rise.
n
More importantly, this demand backdrop should continue to support Teck’s earnings even when the market turns unpredictable.
nnOption #2: Waste Connectionsn
Irrespective of how trade tensions impact the entire market, there are some services that persist with consistency. Waste Connections (TSX:WCN) is the perfect example of that.
n
Waste Connections provides essential waste management services, which is arguably one of the most stable industries on the market. Its business model is built on recurring revenue, long-term contracts, and steady pricing power.
n
This steady cash‑flow profile is attractive during periods when the broader market sentiment becomes unpredictable.
n
These factors make Waste Connections one of the better defensive options to consider amid trade tensions, especially compared to more cyclical sectors. Speaking of defensive appeal, the company’s focus on secondary and exclusive markets bolsters that moat further and reduces competitive pressure.
n
In short, Waste Connections is a great example of how essential‑services companies can anchor a portfolio with defensive appeal.
nnOption #3: Fairfax Financialn
Fairfax Financial (TSX:FFH) is the third option for investors looking to navigate volatile markets stemming from trade tensions. Fairfax has built a reputation around that stability, primarily through its insurance operations and disciplined investment approach.
n
The company’s diversified insurance operations generate consistent underwriting income, while its investment strategy protects capital during periods of uncertainty.
n
Fairfax has historically positioned itself conservatively when risks rise, giving it the flexibility to take advantage of opportunities when markets eventually stabilize. This makes Fairfax a stabilizing presence in a market full of uncertainties and trade tensions.
nnOption #4: Nutrienn
Wrapping up the list of stocks that persist through trade tensions is Nutrien (TSX:NTR).
n
Nutrien is a key global player in agriculture, supplying potash, nitrogen, and phosphate products. Those products support crop production worldwide, making Nutrien a defensive pick.
n
Food security concerns often intensify during periods of trade tension. Nutrien’s global distribution network and scale give it a strong competitive position as countries work to secure stable agricultural inputs.
n
Even when trade dynamics shift, demand for crop nutrients tends to remain steady, helping Nutrien maintain its important role across market cycles.
nnThese TSX stocks will outlast trade tensionsn
No stock, even the most defensive, is immune to risk. Fortunately, the four stocks mentioned above represent a well-diversified mix of options from different sectors of the market.
n
In my opinion, one or all of these stocks should be a small position in a larger, well-diversified portfolio.
n
The post Trade Tensions Are Rising Again — These 4 TSX Stocks Look Built to Keep Delivering appeared first on The Motley Fool Canada.
nn
nShould you invest $1,000 in Fairfax Financial right now?n
Before you buy stock in Fairfax Financial, consider this:
n
The Motley Fool Canada team has identified what they believe are the top 10 TSX stocks for 2026… and Fairfax Financial wasn’t one of them. The 10 stocks that made the cut could potentially produce monster returns in the coming years.
n
Consider MercadoLibre, which we first recommended on January 8, 2014 … if you invested $1,000 in the “eBay of Latin America” at the time of our recommendation, you’d have over $18,000!*
n
Now, it’s worth noting Stock Advisor Canada’s total average return is 94%* – a market-crushing outperformance compared to 85%* for the S&P/TSX Composite Index. Don’t miss out on our top 10 stocks, available when you join our mailing list!
nGet the 10 stocks instantlynnn#start_btn6 {nbackground:#0e6d04 none repeat scroll;color:#fff;font-size:1.2em;font-family:’Montserrat’, sans-serif;font-weight:600;height:auto;margin:30px 0;max-width:350px;text-align:center;width:auto;}nn#start_btn6 a {ncolor:#fff;display:block;padding:20px;padding-right:1em;padding-left:1em;}nn#start_btn6 a:hover {nbackground:#FFE300 none repeat scroll;color:#000;}nnn@media (max-width:480px) {ndiv#start_btn6 {nfont-size:1.1em;max-width:320px;}n}nnmargin_bottom_5 {margin-bottom:5px;}nmargin_top_10 {margin-top:10px;}nn
* Returns as of April 20th, 2026
n
n
More reading
Fool contributor Demetris Afxentiou has no position in any of the stocks mentioned. The Motley Fool has positions in and recommends Fairfax Financial and Waste Connections. The Motley Fool recommends Nutrien. The Motley Fool has a disclosure policy.
n
2026
Highlights
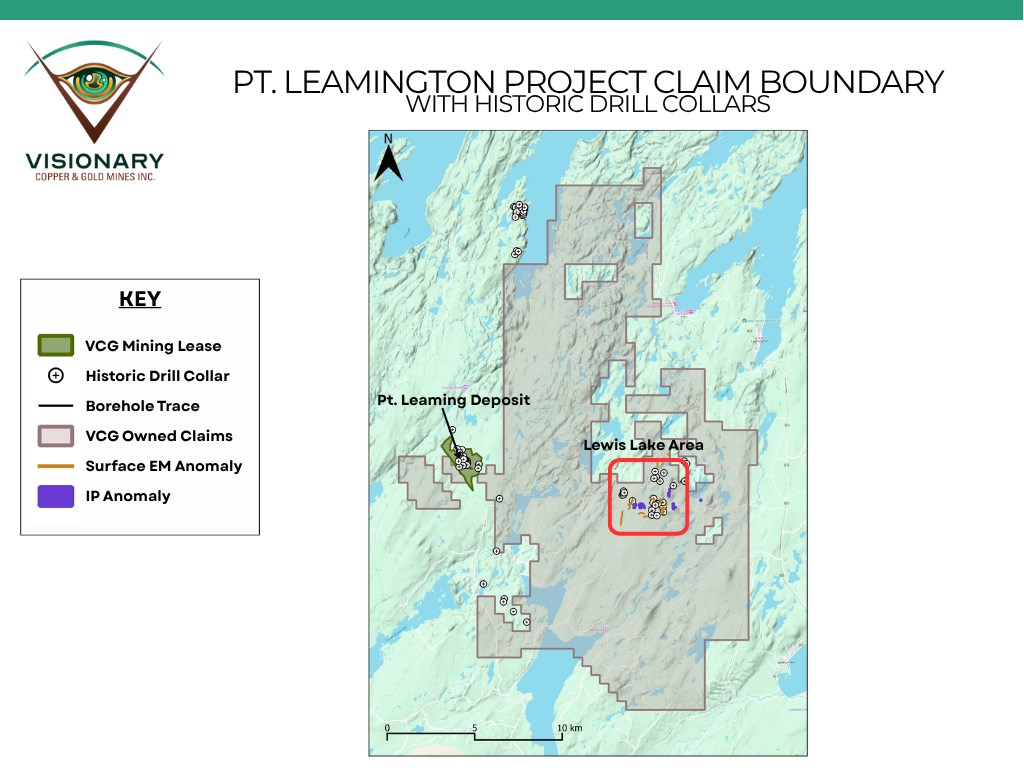
- District-scale land package expanded to ~30,000 hectares, covering the historic "Lewis Lake" area immediately east of the Pt. Leamington Deposit and a felsic volcanic-intrusive complex — geology that previous operators including Noranda, Billiton Exploration Canada Ltd. (now BHP), Altius Resources and Inmet Mining identified as prospective to host a volcanogenic massive sulphide ("VMS") deposit.
- Lewis Lake VMS thesis: Billiton/Rubicon defined the property target as a felsic volcanic-associated VMS deposit — comparable to other Wild Bight Group deposits including Pt. Leamington.
- Drill-confirmed permissive environment for a large VMS deposit: Billiton/Rubicon completed a 15-hole, 2,822 m Phase I diamond drilling program in 2000-2001 across six target areas and concluded that the drilling "established an environment that is permissive to host a large massive sulphide deposit".
- Multiple high-priority targets remain untested or partially tested, including undrilled Surface EM anomalies, strong off-hole EM conductors, IP Chargeability anomalies and untested airborne EM targets.
Vancouver, British Columbia–(Newsfile Corp. – May 21, 2026) – Visionary Copper and Gold Mines Inc. (TSXV: VCG) (OTCQB: VCGMF) (the "Company" or "Visionary") is pleased to announce that the Company has expanded its land package at its 100% owned Pt. Leamington Project (the "Project") located in central Newfoundland to nearly 30,000 hectares (300 km2). A portion of this newly staked ground covers the area historically referred to in assessment reports as "Lewis Lake," which was explored under a joint venture that included Billiton Exploration Canada Ltd. (now BHP) from 1999 to 2001, as well as adjacent ground previously worked by Noranda, Getty Canadian Metals, White Plains Resources, Altius Resources and Inmet Mining.
Max Porterfield, President & CEO of Visionary, stated, "Expanding our regional land package to ~30,000 hectares gives Visionary control over one of the most thoroughly studied — but most under-drilled — VMS districts in central Newfoundland. Billiton/BHP saw the same thing our team sees today: a felsic volcanic system with all the right ingredients to host a Pt. Leamington-scale, or larger, massive sulphide deposit. They did excellent work on very prospective ground which leaves us with the opportunity to quickly advance with our proven exploration model."
Dr. Stephen Piercey, Professional Geologist and Technical Advisor, added, "The Lewis Lake sequence is within similar rocks of the Wild Bight Group that hosts the Pt. Leamington deposit. Previous drilling by Billiton/Rubicon's drilling intersected sulphide mineralization and related VMS-style alteration coupled with multiple off-hole electromagnetic conductors that remain untested. These features, and presence in known VMS-hosting rocks of the Wild Bight Group warrant further drilling and testing of the Lewis Lake region."
Peter Dimmell, P.Geo., Visionary Director and Technical Advisor, who worked in the Wild Bight Group for Noranda Exploration and was on the drill for the discovery of the Pt. Leamington VMS deposit in 1971, over 50 years ago, commented, "Long after Noranda left the area, Billiton came in and confirmed the regional VMS potential with a 1,100-line-kilometre airborne survey. The survey identified fifteen conductive zones, some of which were drilled, but left behind undrilled priority targets which Visionary can systematically test with modern tools."
Regional VMS Opportunity – Lewis Lake
The Lewis Lake area lies within the Cambro-Ordovician Dunnage Zone of the Newfoundland Appalachians, specifically the Exploits Subzone, and is underlain by the Wild Bight Group. The Wild Bight Group is the host stratigraphy for the 100% owned Pt. Leamington VMS deposit (Pt. Leamington Project Area).
PT. LEAMINGTON PROJECT CLAIM BOUNDARYWITH HISTORIC DRILL COLLARS
To view an enhanced version of this graphic, please visit:https://images.newsfilecorp.com/files/3408/298362_61ca091b44672bab_001full.jpg
Billiton/Rubicon documented that the geology of the Lewis Lake area shares numerous characteristics with the host stratigraphy of the Pt. Leamington deposit, including (2001 Rubicon-Billiton Assessment Report, Property Geology, p. 4-5):
- A prevalence of massive and clastic (brecciated) quartz porphyritic rhyolite and high-level quartz porphyritic intrusive rocks (synvolcanic dyke swarm);
- Chert and jasper fragments and beds within heterolithic felsic-dominant volcaniclastic horizons;
- Areas of extensive hematite/magnetite (oxide-facies) volcanic and volcaniclastic rocks within and overlying the quartz porphyritic units – it is unknown if these oxide facies represent hydrothermal alteration or exhalative units and further work is required;
- An overall stratigraphic succession of footwall mafic volcanic rocks intruded by quartz porphyry, followed overlain by massive/brecciated quartz porphyritic rhyolite and heterolithic felsic-dominant volcaniclastic rocks — a similar stratigraphic sequence to the Pt. Leamington deposit; and
- Areas of extensive quartz-sericite (± biotite) plus pyrite alteration "typical of footwall alteration zones" (2001 Rubicon-Billiton Assessment Report, p. 5).
Between 1999 and early 2001, Billiton/Rubicon completed (2001 Rubicon-Billiton Assessment Report, Appendix II – Lewis Lake Project Status Report):
- A 1,100 line-kilometre Geoterrex airborne EM/Mag survey (1999) that identified 15 conductors or conductive zones across the property;
- 64.5 km of ground line cutting across seven grids with ground VLF/Mag and TEM (EM37) surveys (2000);
- 2.5 km of pole-dipole IP survey (2000) and an additional 19.9 km of pole-dipole IP and 34.4 km of ground magnetic surveys (2001);
- 115 prospecting and rock samples (2000), in addition to 67 samples collected during 1999 (1999 Rubicon Assessment Report, Executive Summary and p. 6-8); and
- A 15-hole, 2,822 m Phase I diamond drill program testing eight conductors and part of the large pole-dipole IP anomaly (2001 Rubicon-Billiton Assessment Report, p. 8-12, Table II).
Billiton/Rubicon concluded that this Phase I drilling had "established an environment that is permissive to host a large massive sulphide deposit" but recommended additional drilling of off-hole EM anomalies and untested surface and airborne EM anomalies that had not been tested (2001 Rubicon-Billiton Assessment Report, Conclusions and Recommendations, p. 12-14). No additional exploration was completed by Billiton/Rubicon following Phase I and no exploration drilling has been conducted in the area since.
Lewis Lake Target Areas
The following target inventory is a few of many opportunities drawn from Billiton/Rubicon's work in the Lewis Lake area:
Target Area One – Strong Off-Hole EM Conductors at JEN Grid
Billiton/Rubicon drilled four holes (LL2000-01 to LL2000-04) on the JEN grid to test three conductors (2001 Rubicon-Billiton Assessment Report, p. 6-7).
- LL2000-01 (152m) tested a strong shallow conductor and intersected several zones of sulphide-rich argillite and chert within mafic volcanics, potentially like the hanging wall/footwall contact at Pt. Leamington, from 88.85m to 99.60m, with a best interval of 0.50m of 480 ppm Cu and 460 ppm Zn at 93.20-93.70m (2001 Rubicon-Billiton Assessment Report, p. 6 and Table III, p. 12).
- LL2000-02 (490.7m) tested a strong deep 20-channel EM37 conductor and intersected a 50m sulphide-rich argillite/argillaceous tuff section from 393m to 443m within quartz porphyritic felsic volcanics. Best interval: 1.40m at 185 ppb Au (0.185 g/t Au), 0.84 g/t Ag, 178 ppm Cu, 459 ppm Zn from 392.60m (2001 Rubicon-Billiton Assessment Report, Table III, p. 12). Down-hole EM confirmed the in-hole sulphide source and identified a more highly conductive zone off-hole (2001 Rubicon-Billiton Assessment Report, p. 6).
- LL2000-03 (212m) intersected a 2.0m pyrrhotite-rich section with red-brown patchy sphalerite at 164.30-166.30m (best Table III interval 2.90m at 147 ppm Cu and 249 ppm Zn at 163.40-166.30 m). A down-hole Crone EM survey identified a strong off-hole anomaly at 170m, flagged as a "priority follow-up target for future drilling" (2001 Rubicon-Billiton Assessment Report, p. 7 and Table III, p. 12).
- LL2000-04 (220m) tested the eastern extension of the same deep conductor but was blocked before down-hole EM could be completed, leaving the strong deep conductor without an adequate explanation in this drill hole (2001 Rubicon-Billiton Assessment Report, p. 7).
Target Area Two – Strong, Undrilled 20-Channel Conductor at NBOG Grid
A single hole, LL2000-05 (100m), was drilled at the north end of the NBOG grid and intersected a 5.25m section of massive, very fine-grained laminated pyrrhotite with chert and jasper from 42.35m to 47.60m (best interval: 3.45m at 0.78 g/t Ag, 137 ppm Cu, 390 ppm Zn from 34.75m) (2001 Rubicon-Billiton Assessment Report, p. 7 and Table III, p. 12).
A separate strong 20-channel conductor in Northern Bog was proposed for drill testing in the vicinity of an old Noranda hole near 5500N/4000E but could not be drilled in 2000-2001 because of extremely wet bog conditions (2001 Rubicon-Billiton Assessment Report, p. 7 and p. 9).
Target Area Three – Multiple Untested Off-Hole EM Conductors at historic Fall Pond West
Five holes (LL2000-08 through LL2000-12) were drilled on the Fall Pond West grid. Several intersected variably altered and pyrrhotite/pyrite-mineralized basalts and chert-jasper horizons, with the conductor sources predominantly identified as off-hole by down-hole EM surveys (2001 Rubicon-Billiton Assessment Report, p. 8-9 and Table II, p. 9-10):
- LL2000-09 (143.4m): extensive bleached, pyrrhotite/pyrite-mineralized basalt; strong off-hole EM response at 75m correlating with strongest in-hole alteration; best interval 2.40m at 258 ppm Cu from 70.50m (2001 Rubicon-Billiton Assessment Report, p. 8-9 and Table III, p. 12).
- LL2000-10 (143.7m): chert-jasper section with pyrite/magnetite from 83.40m to 95.80m, with elevated gold values (158 ppb (0.158 g/t Au) and 182 ppb (0.182 g/t Au)) associated with arsenopyrite at/near the upper chert-jasper contact; down-hole EM identified an " off-hole response that is a priority follow-up target" (2001 Rubicon-Billiton Assessment Report, p. 9).
- LL2000-11 (128 m): lost in a fault zone at 127.30m, with the conductor still off the end of the hole (2001 Rubicon-Billiton Assessment Report, p. 9).
Target Area Four – Large IP Chargeability Anomaly
Target Area One hosts an IP chargeability anomaly that lies on the west edge of a large circular magnetic high (2001 Rubicon-Billiton Assessment Report, p. 12-13).
Drill hole LL2001-15 tested a limited area of this anomaly (2001 Rubicon-Billiton Assessment Report, p. 11-12):
- LL2001-15 (133.3m) was drilled after an expansion of the IP target through additional 2001 ground geophysics, intersected weakly mineralized quartz/quartz-feldspar porphyry with distinct chlorite-tremolite-biotite zones; best intersection 3.90 m of 341 ppm Cu (2001 Rubicon-Billiton Assessment Report, p. 12 and Table III).A weakly magnetic granodiorite body has been partially mapped within the northern part of the circular magnetic high (2001 Rubicon-Billiton Assessment Report, p. 13).Additionally, several chargeability anomalies associated with this larger IP grid remain untested.
Target Area Five – Surface Showings at Teddy's Barn
Rubicon's 1999 rock sampling discovered the Teddy's Barn showing: disseminated chalcopyrite in strongly chlorite-altered, quartz-phyric felsic rocks cut by mafic dykes, sampled over a 150 m strike length. Sourced samples include (1999 Rubicon Assessment Report, Tables 2 and 3, p. 7, and Appendix III ICP certificate 365-9233):
- RMR31262: 459 ppm Cu (chloritic quartz porphyry, trace to 1% chalcopyrite);
- RMR31263: 676 ppm Cu (quartz porphyry, strongly magnetic, possible native Cu);
- RMR31264: 535 ppm Cu (silicified quartz porphyry);
- RMR31266: 381 ppm Cu (pyritic quartz feldspar porphyry, 1-2% pyrite, 1% chalcopyrite); and
- Adjacent (~150 m to the east) grab samples returned 6,334 ppm Cu and 1,273 ppm Zn (RMR31316) and 2,687 ppm Cu (RMR31317) in banded fine-grained mafic/sedimentary rocks.
Future Exploration Plans
Visionary's regional exploration program at Lewis Lake is expected to incorporate:
- A property-wide geological re-interpretation incorporating the 2007 airborne EM/Mag, 2000 ground TEM/Mag/IP and 2001 expanded IP surveys (totalling more than 1,150 line-kilometres of geophysical coverage) together with all historic drill information where data is available;
- Detailed prospecting, soil geochemistry and ground geophysics over IP chargeability anomalies and untested airborne conductor areas;
- Modern Borehole Pulse Electromagnetic ("BPEM") surveys on historic Billiton/Rubicon drill holes (LL2000-03, LL2000-09, LL2000-10), if accessible, to vector towards undrilled off-hole conductors; and
- Drill testing of the untested Northern Bog conductor and the priority off-hole EM anomalies on the JEN and Fall Pond West grids.
Further details will be released in a separate news release in the near future.
QA / QC Protocols (Historic Data)
Historic Billiton/Rubicon drill core was sampled by saw-cut, with one-half submitted for assay and one-half retained for reference. Samples were prepared and analyzed by Eastern Analytical Ltd., Springdale, Newfoundland (Au by fire assay with AAS finish; multi-element ICP); with whole-rock analyses and check assays performed by ALS Chemex Laboratories (now ALS Global Labs), North Vancouver, British Columbia (2001 Rubicon-Billiton Assessment Report, Appendix I, p. 15 and Appendix IV analytical certificates).
All historic data discussed in this news release is sourced directly from publicly filed assessment reports lodged with the Geological Survey of Newfoundland and Labrador (Mineral Lands Division), including specifically:
- 1999 Rubicon Assessment Report – Assessment Report on the Lewis Lake Project, Licenses 5435M (2nd year), 6915M (1st year), Newfoundland (NTS 02E/3, 02E/4, 02E/5 & 02E/6): Prospecting and Rock Sampling, prepared by R. Bob Singh, Project Geologist, Rubicon Minerals Corporation, dated 12 June 2000;
- 2001 Rubicon-Billiton Assessment Report – Assessment Report on the Lewis Lake Project, Licenses 5435M, 6915M, 7206M, Newfoundland NTS 02E/3, 02E/4, 02E/5, 02E/6: Report on Diamond Drilling and Downhole Geophysical Surveys, prepared by Garfield MacVeigh, Project Geologist, Rubicon Minerals Corporation (operator for Billiton Exploration Canada Ltd.), dated 17 April 2001; and
- 2001 Rubicon-Billiton Assessment Report – Fifth Year Assessment Report on Linecutting, Geochemistry, Geology, Geophysics & Diamond Drilling for Mineral Licences 4782, 4783 & 7774M, New Bay Pond Area, Central Newfoundland, NTS Sheets 2E/04 & 2E/05, prepared by Dave Barbour, B.Sc., P.Geo., & Rodney A. Churchill, M.Sc., P.Geo., for Altius Resources Inc. and Inmet Mining, February 2001 (regional context only).
Pt. Leamington Project
The Pt. Leamington Project is located approximately 37 km by road and trails from the City of Grand Falls-Windsor and approximately 20 km from the provincial power grid. Pt. Leamington is a felsic-hosted VMS deposit that dips 70 degrees to the west, has a strike length of over 560 m and a maximum thickness of 85 m. Massive sulphides have been intersected to a depth of 360 m below surface from approximately 21,714 m of drilling in 72 holes. Regional government mapping and lithogeochemical sampling indicates that Pt. Leamington's host volcanic stratigraphy extends beyond the Deposit area.
The Deposit hosts a significant gold, copper, zinc, and silver resource, with a pit-constrained Indicated Mineral Resource of 5.0 Mt grading 2.5 g/t AuEq for 402 koz AuEq (145.7 koz gold, 60.0 Mlb copper, 153.5 Mlb zinc, 2.0 Moz silver, 1.5 Mlb lead), a pit-constrained Inferred Mineral Resource of 13.7 Mt grading 2.24 g/t AuEq for 986.5 koz AuEq (354.8 koz gold, 110.2 Mlb copper, 527.3 Mlb zinc, 6.2 Moz silver, 7.0 Mlb lead), and an out-of-pit Inferred Mineral Resource of 1.7 Mt grading 3.06 g/t AuEq for 168.5 koz AuEq (65.4 koz gold, 13.3 Mlb copper, 102.9 Mlb zinc, 1.4 Moz Ag, 2.6 Mlb lead) (see news release dated October 25, 2021).
Qualified Person
The technical and scientific information contained in this news release has been reviewed and approved by Aaryn Hutchins, P. Geo, a qualified person under National Instrument 43-101 Standards of Disclosure for Mineral Projects. Ms. Hutchins is a consultant for the Company and is independent of the Company. Historical information referenced in this news release, including all historic drilling, sampling and geophysical results from the Lewis Lake area, was verified from geological assessment reports filed with the Government of Newfoundland and Labrador by previous operators, as specifically cited above. The reader is cautioned that historical results have not been verified by the current operator beyond review of the publicly filed assessment reports and that historical sampling and analytical procedures may not meet current NI 43-101 standards. Visionary considers the historical data to be reliable for the purposes of describing the regional exploration opportunity and prioritizing follow-up work, but emphasizes that historic mineralized intersections on the regional ground are not currently part of a mineral resource estimate and that there is no guarantee that follow-up exploration will define a mineral resource on the regional targets discussed herein.
About Visionary Copper and Gold Mines Inc.
Visionary Copper and Gold Mines Inc. (TSXV: VCG) (OTCQB: VCGMF) is advancing its portfolio of base and precious metals rich deposits located in established Canadian mining jurisdictions. The focus of the portfolio is highlighted by the 100% owned Pt. Leamington Deposit in Newfoundland, located in one of the richest VMS and Gold Districts in Canada. The Company prepared a pit-constrained Indicated Mineral Resource of 5.0 Mt grading 2.5 g/t AuEq for 402 koz AuEq (145.7 koz gold, 60.0 Mlb copper, 153.5 Mlb zinc, 2.0 Moz silver, 1.5 Mlb lead), a pit-constrained Inferred Mineral Resource of 13.7 Mt grading 2.24 g/t AuEq for 986.5 koz AuEq (354.8 koz gold, 110.2 Mlb copper, 527.3 Mlb zinc, 6.2 Moz silver, 7.0 Mlb lead) and an out-of-pit Inferred Mineral Resource of 1.7 Mt grading 3.06 g/t AuEq for 168.5 koz AuEq (65.4 koz gold, 13.3 Mlb copper, 102.9 Mlb zinc, 1.4 Moz Ag, 2.6 Mlb lead) (see news release dated October 25, 2021). Additionally the Company is permitting the Rainbow deposit at its rich VMS Pine Bay Project located near existing infrastructure in the Flin Flon Mining District. The Company prepared an indicated mineral resource on the Rainbow deposit of 3.44 Mt grading 3.59% CuEq for 272.4 Mlb CuEq (238.3 Mlb Cu, 56.9 Mlb Zn, 37.6 koz Au, 692.8 koz Ag, 2.3 Mlb Pb), an inferred mineral resource on the Rainbow deposit of 1.28 Mt grading 2.95% CuEq containing 83.4 Mlb CuEq (72.1 Mlb Cu, 19.5 Mlb Zn, 11.1 koz Au, 222.2 Koz Ag, 0.8 Mlb Pb) and an inferred mineral resource at the Pine Bay deposit of 1.0 Mt grading 2.62% Cu containing 58.1 Mlb Cu (see news release dated July 10, 2023). Additionally, the portfolio includes the Nash Creek Project located in the VMS rich Bathurst Mining District of New Brunswick. A 2018 PEA generates a strong economic return with a pre-tax IRR of 34.1% (25.2% post-tax) and NPV8% of $230 million ($128 million post-tax) at $1.25 Zinc (see news release dated May 14, 2018).
For additional information, please contact:
Visionary Copper and Gold Mines Inc.
Max Porterfield, President and Chief Executive Officer
Phone: (604) 605-0885
E-mail: info@visionarycoppergold.com
Neither the TSX Venture Exchange nor its Regulation Services Provider (as that term is defined in the policies of the TSX Venture Exchange) accepts responsibility for the adequacy or accuracy of this release.
Some statements in this news release contain forward-looking information. These statements include, but are not limited to, statements with respect to future expenditures, the planning and timing of the exploration program at the Lewis Lake area, the prospectivity of the targets described herein, the ability to confirm the existence of a VMS deposit at Lewis Lake and the potential for the Lewis Lake area to host an economic mineral deposit. These statements address future events and conditions and, as such, involve known and unknown risks, uncertainties and other factors which may cause the actual results, performance or achievements to be materially different from any future results, performance or achievements expressed or implied by the statements. Such factors include, among others, the ability to complete the proposed exploration program and the timing and amount of expenditures, receipt of all necessary permits and approvals, availability of qualified personnel and equipment, results of exploration activities, accuracy of historical data, and general market and economic conditions. The reader is cautioned that historic exploration results, geophysical interpretations and conceptual deposit-type targets discussed herein are not indicative of the presence of an economic mineral deposit on the regional land package. Except as required under applicable securities laws, Visionary does not assume the obligation to update any forward-looking statement.
To view the source version of this press release, please visit https://www.newsfilecorp.com/release/298362
Freeport-McMoRan Inc. FCX and Southern Copper Corporation SCCO are two heavyweights in the copper mining industry. Both operate on a global scale, extracting and processing copper and other metals. Also, both are navigating fluctuating copper prices and global economic uncertainties. Copper prices started 2026 on a strong note, underpinned by robust demand from China and the United States. Structural tailwinds, including electric vehicles (EVs), renewable energy projects, data center growth and grid modernization, continue to boost copper consumption. Worries about tightening supply amid rising EV and infrastructure demand also supported the red metal. These factors led to prices surging to roughly $6.4 per pound in late January. Prices of the red metal were mostly volatile during February, largely trading near $6 per pound. Copper prices came under pressure in March amid concerns about the impact of surging oil prices on the global economy due to the war in the Middle East, dragging down prices to a three-month low of around $5.3 per pound in late March. Prices rebounded in April on hopes of a de-escalation in the Iran war. Prices shot up to a record high of around $6.6 per pound last week amid robust demand in China and supply worries linked to the Middle East conflict. Prices have pulled back from that level amid war-related uncertainties and are currently hovering near $6.3 per pound. Let’s dive deep and closely compare the fundamentals of these two copper mining companies to determine which one is a better investment now.
The Case for Freeport
Freeport continues to leverage its portfolio of high-quality copper assets, emphasizing disciplined execution and organic growth initiatives to strengthen its production profile. It has completed the evaluation of a large-scale expansion at El Abra in Chile to define a large sulfide resource that could potentially support a major mill project similar to the large-scale concentrator at Cerro Verde, with an estimated resource of approximately 20 billion recoverable pounds of copper. In Arizona, FCX is progressing with pre-feasibility studies at its Safford/Lone Star operations, with completion targeted for 2026, to assess a sizable sulfide expansion opportunity. It has expansion opportunities at Bagdad in Arizona that can more than double the concentrator capacity of the operation. Technical and economic studies have revealed the potential to build concentrating facilities to boost copper production by 200-250 million pounds annually. PT Freeport Indonesia (PT-FI) is developing the Kucing Liar ore body within the Grasberg district with a targeted ramp-up to commence in 2030. FCX completed studies in 2025 that showed an opportunity to increase Kucing Liar’s design capacity to 130,000 metric tons of ore per day and reserves by roughly 20% at low costs. FCX has a strong liquidity profile and generates substantial cash flows, providing ample flexibility to fund expansion projects, reduce debt and enhance shareholder returns. It generated solid operating cash flows of $5.6 billion in 2025. Cash flows provided by operations surged 36% year over year to around $1.5 billion in the first quarter of 2026. Freeport ended the first quarter with strong liquidity, including $3.7 billion in cash and cash equivalents, $3 billion in availability under the FCX revolving credit facility, and $1.5 billion in availability under the PT-FI credit facility.At the end of the first quarter, Freeport had a net debt of $2.4 billion, excluding PTFI’s new downstream processing facilities. Its net debt is below its targeted range of $3-$4 billion. Freeport has a policy of distributing 50% of the available cash to its shareholders and the balance to either reduce debt or invest in growth projects. FCX has no significant debt maturities until 2027. FCX offers a dividend yield of roughly 0.5% at the current stock price. Its payout ratio is 14% (a ratio below 60% is a good indicator that the dividend will be sustainable). Backed by strong financial health, the company's dividend is perceived to be safe and reliable.Despite these positives, Freeport faces headwinds from higher costs. Its outlook for the second quarter of 2026 suggests higher costs on a sequential basis. It expects unit net cash costs to rise to $2.24 per pound, while projecting a full-year average of roughly $1.95 (compared with $1.65 in 2025). The projected second-quarter unit cost reflects a roughly 98% year over year and 17% increase from the prior quarter. The uptick in costs reflects higher costs of energy and other consumables due to the Middle East conflict and persistent pressure on volumes. Higher costs are expected to weigh on the company's margins. Freeport’s copper sales volumes tumbled approximately 25% year over year in the first quarter to 657 million pounds, and fell from 709 million pounds in the prior quarter. The downside primarily resulted from lower operating rates due to the temporary suspension of operations since the mud rush incident at the Grasberg Block Cave mine in Indonesia in September 2025. While the company’s outlook for copper sales volumes for the second quarter of 2026 of 690 million pounds indicates a sequential improvement, it still suggests a 32% year-over-year decline. For full-year 2026, consolidated sales volume projections were revised lower to around 3.1 billion pounds of copper from the prior view of 3.4 billion pounds due to an expected delay in achieving full ramp-up of the Grasberg Block Cave mine. Lower sales volumes are expected to weigh on its top line.
The Case for Southern Copper
Southern Copper has a strong pipeline of world-class copper greenfield projects and other promising opportunities. It operates high-quality assets in investment-grade countries such as Mexico and Peru. Backed by its constant commitment to increasing low-cost production and growth investments, the company is well poised to continue delivering enhanced performance.SCCO holds the largest copper reserves among listed peers. Its low-cost, integrated operations and deep pipeline of world-class greenfield projects further strengthen its competitive positioning. The company is well-positioned to capitalize on the expected surge in copper demand in the year to come, backed by the energy transition trend. The company continues to build its presence in Peru as the country is the second-largest producer of copper. Peru holds about 9% of the world’s copper reserves. Despite the near-term production headwinds, SCCO expects to produce 915,000 tons of copper in 2026. Southern Copper expected to take this up to roughly 1.6 million tons by the middle of the next decade, implying a compound annual growth rate (CAGR) of approximately 5.3% from 2025 levels. To support this growth plan, the company intends to invest more than $20.5 billion over this decade, with the bulk of the capital allocated to projects in Peru. The company’s key growth catalysts include the Tía María, Los Chancas and Michiquillay projects in Peru, along with El Pilar and El Arco in Mexico, all of which underpin SCCO’s long-term expansion pipeline. The Tia Maria project, located in Arequipa, Peru, with an annual capacity of 120,000 tons of SX- EW copper cathodes, is expected to start in 2027. Peru’s Los Chancas project is slated to add 130,000 tons of copper starting in 2031. This will be followed by Michiquillay in 2032, adding an expected 225,000 tons of copper. It is projected to become one of Peru's largest copper mines with an expected mine life of more than 25 years. In Mexico, the El Pilar project will contribute around 36,000 tons of copper cathodes annually. This project will use highly cost-efficient and environmentally friendly SX-EW technology. El Arco in Baja California is a world-class copper deposit. The project includes an open-pit mine with a combined 120,000 tons per day concentrator and 28,000 tons per year SX-EW operations. SCCO generated net cash from operating activities of $4.75 billion in 2025, up roughly 7.5% from $4.42 billion in 2024, attributable to higher net income. Net cash from operating activities was around $1.69 billion in the first quarter of 2026, up 135% from $721.4 million in the prior-year quarter, driven by strong cash generation in its operations. SCCO offers a dividend yield of 2.4% at the current stock price. Its payout ratio is 66%, with a five-year annualized dividend growth rate of roughly -2.3%.However, SCCO faces headwinds from near-term production declines. For 2025, copper production decreased 1.8% to 956,270 tons, which came in 1% lower than the company’s expected 965,000 tons. Lower output at Buenavista and the Peruvian mines, partially offset by a rise in production at IMMSA and La Caridad mines, led to lower output. Its first-quarter output also fell 4% year over year, impacted by lower production at its Peruvian operations (down 10%) due to lower ore grades. While grades are expected to improve later this year, the company's copper production guidance for 2026 implies a decrease of 4.3% from 2025. Lower production is expected to weigh on its performance.
Price Performance and Valuation of FCX & SCCO
FCX stock has gained 61.4% over a year, while SCCO stock has rallied 92.5% compared with the Zacks Mining – Non Ferrous industry’s rise of 59.9%.
Image Source: Zacks Investment Research
FCX is currently trading at a forward 12-month earnings multiple of 20.98, modestly higher than its five-year median. This represents a roughly 1.1% premium when stacked up with the industry average of 20.75X.
Image Source: Zacks Investment Research
SCCO is currently trading at a forward 12-month earnings multiple of 25.54, higher than its five-year median and above the industry.
Image Source: Zacks Investment Research
How Does Zacks Consensus Estimate Compare for FCX & SCCO?
The Zacks Consensus Estimate for FCX’s 2026 sales and EPS implies a 5.1% and 44.6% increase year over year, respectively. The EPS estimates for 2026 have been trending higher over the past 60 days.
Image Source: Zacks Investment Research
The consensus estimate for SCCO’s 2026 sales and EPS implies year-over-year growth of 23.2% and 33%, respectively. The EPS estimates for 2026 have been going up over the past 60 days.
Image Source: Zacks Investment Research
FCX or SCCO: Which Stock Should You Bet on?
Both FCX and SCCO currently have a Zacks Rank #3 (Hold), so picking one stock is not easy. You can see the complete list of today’s Zacks #1 Rank (Strong Buy) stocks here.Both Freeport and Southern Copper are making progress with their growth projects amid a volatile yet favorable copper pricing environment. FCX is poised to gain from progress in its expansion activities that will boost production capacity. However, a weaker sales volume outlook and higher expected unit costs weigh on its prospects. On the other hand, SCCO’s case is backed by its constant commitment to increasing low-cost production and growth investments amid challenges from weaker expected near-term production. FCX’s more attractive valuation and higher earnings growth projections suggest that it may offer better investment prospects in the current market environment.
Want the latest recommendations from Zacks Investment Research? Today, you can download 7 Best Stocks for the Next 30 Days. Click to get this free report
Freeport-McMoRan Inc. (FCX) : Free Stock Analysis Report
Southern Copper Corporation (SCCO) : Free Stock Analysis Report
This article originally published on Zacks Investment Research (zacks.com).
Investors with an interest in Mining – Miscellaneous stocks have likely encountered both Norsk Hydro ASA (NHYDY) and BHP (BHP). But which of these two stocks offers value investors a better bang for their buck right now? We'll need to take a closer look.
We have found that the best way to discover great value opportunities is to pair a strong Zacks Rank with a great grade in the Value category of our Style Scores system. The proven Zacks Rank emphasizes companies with positive estimate revision trends, and our Style Scores highlight stocks with specific traits.
Norsk Hydro ASA has a Zacks Rank of #1 (Strong Buy), while BHP has a Zacks Rank of #3 (Hold) right now. The Zacks Rank favors stocks that have recently seen positive revisions to their earnings estimates, so investors should rest assured that NHYDY has an improving earnings outlook. But this is only part of the picture for value investors.
Value investors also try to analyze a wide range of traditional figures and metrics to help determine whether a company is undervalued at its current share price levels.
The Style Score Value grade factors in a variety of key fundamental metrics, including the popular P/E ratio, P/S ratio, earnings yield, cash flow per share, and a number of other key stats that are commonly used by value investors.
NHYDY currently has a forward P/E ratio of 9.44, while BHP has a forward P/E of 16.39. We also note that NHYDY has a PEG ratio of 0.74. This popular figure is similar to the widely-used P/E ratio, but the PEG ratio also considers a company's expected EPS growth rate. BHP currently has a PEG ratio of 1.10.
Another notable valuation metric for NHYDY is its P/B ratio of 2.15. Investors use the P/B ratio to look at a stock's market value versus its book value, which is defined as total assets minus total liabilities. By comparison, BHP has a P/B of 3.75.
These are just a few of the metrics contributing to NHYDY's Value grade of B and BHP's Value grade of C.
NHYDY sticks out from BHP in both our Zacks Rank and Style Scores models, so value investors will likely feel that NHYDY is the better option right now.
Want the latest recommendations from Zacks Investment Research? Today, you can download 7 Best Stocks for the Next 30 Days. Click to get this free report
Norsk Hydro ASA (NHYDY) : Free Stock Analysis Report
BHP Group Limited Sponsored ADR (BHP) : Free Stock Analysis Report
This article originally published on Zacks Investment Research (zacks.com).
Star Copper (STCU.CN) has entered into a consulting services agreement dated effective as of May 15, 2026 with Klaus Heppe, a Vancouver-based technical advisor with a track record of porphyry development from exploration to commercialization, the company said on Wednesday. nnHeppe will, among other things, support, assist and advise the company and board on certain technical, exploration and strategic project development options, said the company.nnHeppe is a "seasoned executive" with more than 20 years of experience advancing multi-commodity exploration, discovery, and resource growth across the Americas, from early-stage exploration through feasibility studies and large-scale mine operations, stated the company. He spent most of his career with Teck Resources Limited (TECK-A.TO, TECK-B.TO), where he held several senior leadership roles, including Exploration Manager, Chile and Director, Exploration – Discovery Excellence, it said. nnHeppe currently serves as VP of Exploration at Quilla Resources Inc, a Canadian/Peruvian company that has brought the Chapi copper mine in Peru back into production in record time, added the company.nn"As we quickly head into the largest and most coordinated exploration effort in the history of the Star Project, we are extremely grateful to have Klaus supporting our team," said the company's Chief Executive Officer, Darryl Jones. "He brings significant technical, managerial, and scientific horsepower to what is shaping up to what could be our most intensive and rewarding exploration season ever."
Vancouver, British Columbia–(Newsfile Corp. – May 20, 2026) – NexGen Energy Ltd. (TSX: NXE) (NYSE: NXE) (ASX: NXG) ("NexGen" or the "Company") is pleased to announce the appointment of Ryan Podrasky as Chief Financial Officer ("CFO"), effective May 25, 2026. Mr. Podrasky succeeds Benjamin ("Ben") Salter, who is stepping down as CFO. Mr. Salter will continue to support the Company in an advisory capacity to ensure a seamless transition.
Ryan Podrasky is a CPA-designated finance executive with more than 25 years of leadership across global mining and oil and gas companies. He most recently served as Chief Financial Officer of Elk Valley Resources – formerly the coal business of Teck Resources and now majority-owned by Glencore – where he led the finance function for a $10B+ revenue business that is the largest steelmaking coal producer in Canada and the second-largest seaborne supplier globally. In that capacity he had oversight of approximately $5B in annual operating and capital expenditures across a complex, multi-site, fully integrated mine-to-port value chain employing 5,700+ people and led a comprehensive and strategic finance organization. Ryan has served for over five years as Board Director of Neptune Bulk Terminals (Canada) Ltd., where he chaired the Audit, Finance, and Insurance Committees.
Prior to being appointed full-time CFO, Ryan served as Acting CFO during the separation of Teck's coal business into a standalone entity, where he helped lead one of Canada's most complex large-scale corporate carve-outs. He worked closely with the corporate teams in Vancouver establishing the standalone capital structure, treasury framework, financial systems, and governance model for a multi-billion-dollar mining organization.
Before joining Teck, Ryan spent over a decade at Nexen Inc. in Calgary, progressing from Joint Venture Auditor through to Corporate Development, where he supported enterprise strategy, capital projects, and joint venture partnerships across large-scale oil sands and international operations. He also held a commercial leadership role at Talisman Energy, where he led a cross-functional team supporting planning, performance management, and strategic decision-making across North American operations.
Leigh Curyer, Founder & Chief Executive Officer, commented: "It's with great pleasure that we announce Ryan has been appointed Chief Financial Officer of NexGen effective May 25, 2026. Ryan joins NexGen with significant experience on successful large-scale resource projects covering the financing, reporting, budgetary management and commercial functions during the construction and operating phases. I would like to take the opportunity to acknowledge and thank Ben for his commitment, dedication and positive influence in his role as Chief Financial Officer of NexGen for the past 3 years. He has overseen the finance function with distinction and has been an absolute pleasure to work alongside in the senior executive team. His contribution to NexGen is and will always be highly regarded.
The Board and Executive wish Ben all the very best in his future as he takes some well-deserved time off to spend with his family and pursue personal interests."
About NexGen
NexGen Energy is a Canadian company focused on delivering clean energy fuel for the future. The Company's flagship Rook I Project is being optimally developed into the largest low cost producing uranium mine globally, incorporating the most elite standards in environmental and social governance. The Rook I Project is supported by a NI 43-101 compliant Feasibility Study which outlines the elite environmental performance and industry leading economics. NexGen is led by a team of experienced uranium and mining industry professionals with expertise across the entire mining life cycle, including exploration, financing, project engineering and construction, operations and closure. NexGen is leveraging its proven experience to deliver a Project that leads the entire mining industry socially, technically and environmentally. The Project and prospective portfolio in northern Saskatchewan will provide generational long-term economic, environmental, and social benefits for Saskatchewan, Canada, and the world.
NexGen is listed on the Toronto Stock Exchange, the New York Stock Exchange under the ticker symbol "NXE" and on the Australian Securities Exchange under the ticker symbol "NXG" providing access to global investors to participate in NexGen's mission of solving three major global challenges in decarbonization, energy security and access to power. The Company is headquartered in Vancouver, British Columbia, with its primary operations office in Saskatoon, Saskatchewan.
Contact Information
Leigh CuryerChief Executive OfficerNexGen Energy Ltd.+1 604 428 4112 lcuryer@nxe-energy.ca www.nexgenenergy.ca
Travis McPhersonChief Commercial OfficerNexGen Energy Ltd.+1 604 428 4112tmcpherson@nxe-energy.ca www.nexgenenergy.ca
Monica KrasVice President, Corporate DevelopmentNexGen Energy Ltd.+44 7307 191933mkras@nxe-energy.ca www.nexgenenergy.ca
Forward-Looking Information
The information contained herein contains "forward-looking statements" within the meaning of applicable United States securities laws and regulations and "forward-looking information" within the meaning of applicable Canadian securities legislation. "Forward-looking information" includes, but is not limited to, statements with respect to mineral reserve and mineral resource estimates, the 2021 Arrow Deposit, Rook I Project and estimates of uranium production, grade and long-term average uranium prices, anticipated effects of completed drill results on the Rook I Project, planned work programs, completion of further site investigations and engineering work to support basic engineering of the project and expected outcomes. Generally, but not always, forward-looking information and statements can be identified by the use of words such as "plans", "expects", "is expected", "budget", "scheduled", "estimates", "forecasts", "intends", "anticipates", or "believes" or the negative connotation thereof or variations of such words and phrases or state that certain actions, events or results "may", "could", "would", "might" or "will be taken", "occur" or "be achieved" or the negative connotation thereof. Statements relating to "mineral resources" are deemed to be forward-looking information, as they involve the implied assessment that, based on certain estimates and assumptions, the mineral resources described can be profitably produced in the future.
Forward-looking information and statements are based on the then current expectations, beliefs, assumptions, estimates and forecasts about NexGen's business and the industry and markets in which it operates. Forward-looking information and statements are made based upon numerous assumptions, including among others, that the mineral reserve and resources estimates and the key assumptions and parameters on which such estimates are based are as set out in this news release and the technical report for the property, the results of planned exploration activities are as anticipated, the price and market supply of uranium, the cost of planned exploration activities, that financing will be available if and when needed and on reasonable terms, that third party contractors, equipment, supplies and governmental and other approvals required to conduct NexGen's planned exploration activities will be available on reasonable terms and in a timely manner and that general business and economic conditions will not change in a materially adverse manner. Although the assumptions made by the Company in providing forward-looking information or making forward-looking statements are considered reasonable by management at the time, there can be no assurance that such assumptions will prove to be accurate in the future.
Forward-looking information and statements also involve known and unknown risks and uncertainties and other factors, which may cause actual results, performances and achievements of NexGen to differ materially from any projections of results, performances and achievements of NexGen expressed or implied by such forward-looking information or statements, including, among others, the existence of negative operating cash flow and dependence on third party financing, uncertainty of the availability of additional financing, the risk that pending assay results will not confirm previously announced preliminary results, conclusions of economic valuations, the risk that actual results of exploration activities will be different than anticipated, the cost of labour, equipment or materials will increase more than expected, that the future price of uranium will decline or otherwise not rise to an economic level, the appeal of alternate sources of energy to uranium-produced energy, that the Canadian dollar will strengthen against the U.S. dollar, that mineral resources and reserves are not as estimated, that actual costs or actual results of reclamation activities are greater than expected, that changes in project parameters and plans continue to be refined and may result in increased costs, of unexpected variations in mineral resources and reserves, grade or recovery rates or other risks generally associated with mining, unanticipated delays in obtaining governmental, regulatory or First Nations approvals, risks related to First Nations title and consultation, reliance upon key management and other personnel, deficiencies in the Company's title to its properties, uninsurable risks, failure to manage conflicts of interest, failure to obtain or maintain required permits and licences, risks related to changes in laws, regulations, policy and public perception, as well as those factors or other risks as more fully described in NexGen's Annual Information Form dated March 3, 2026 filed with the securities commissions of all of the provinces of Canada and in NexGen's 40-F filed with the United States Securities and Exchange Commission, which are available on SEDAR+ at www.sedarplus.ca and Edgar at www.sec.gov.
Although the Company has attempted to identify important factors that could cause actual results to differ materially from those contained in the forward-looking information or statements or implied by forward-looking information or statements, there may be other factors that cause results not to be as anticipated, estimated or intended. Readers are cautioned not to place undue reliance on forward-looking information or statements due to the inherent uncertainty thereof.
There can be no assurance that forward-looking information and statements will prove to be accurate, as actual results and future events could differ materially from those anticipated, estimated or intended. Accordingly, readers should not place undue reliance on forward-looking statements or information. The Company undertakes no obligation to update or reissue forward-looking information as a result of new information or events except as required by applicable securities laws.
To view the source version of this press release, please visit https://www.newsfilecorp.com/release/298160
Track your investments for FREE with Simply Wall St, the portfolio command center trusted by over 7 million individual investors worldwide.
Titan Mining’s cooperation agreement with Teck Resources (TSX:TECK.B) to assess germanium recovery from existing Empire State Mines waste streams has drawn fresh attention and is tying the stock to critical minerals for defense and semiconductor supply chains.
See our latest analysis for Teck Resources.
Teck Resources’ cooperation with Titan Mining on germanium recovery comes after a period where the stock has pulled back in the very short term, with a 1-day share price return of 3.19% and 7-day share price return of 9.73%. The stock still shows a year to date share price return of 23.73% and a 1-year total shareholder return of 64.58%, which points to strong longer term momentum despite recent volatility.
If this germanium development has you thinking about other critical mineral and materials opportunities, it could be a good moment to scan the market using our 28 best rare earth metal stocks
With Teck Resources trading close to its CA$82.35 analyst price target after strong multi year returns, the key question is whether the market already reflects its critical minerals potential or if there is still a mispriced opportunity here.
Most Popular Narrative: 3% Overvalued
With Teck Resources last closing at CA$81.65 against a narrative fair value of CA$79.35, the widely followed view points to a modest premium that hinges on future copper growth projects and merger benefits actually playing out.
Teck is progressing lower risk, high return copper growth projects (Zafranal, San Nicolas) that are well advanced in permitting and construction readiness, offering near term expansion opportunities in stable jurisdictions and positioning the company to capture outsized volume growth and improved net margins versus industry peers.
Curious what sits behind that copper growth story? The narrative leans on projected volumes, richer margins, and a future earnings multiple that assumes investors stay willing to pay up for those outcomes.
Result: Fair Value of CA$79.35 (OVERVALUED)
Have a read of the narrative in full and understand what’s behind the forecasts.
However, there is still clear execution risk around large copper projects and regulatory approvals. This could delay planned growth and challenge those earnings assumptions.
Find out about the key risks to this Teck Resources narrative.
Next Steps
Given the mix of optimism and concern running through this story, this is a good time to look at the data yourself and decide where you stand. To help weigh both sides of the argument, take a close look at the 1 key reward and 1 important warning sign.
Looking for more investment ideas?
If you stop here, you could miss stocks that better fit your goals, so take a few minutes to scan the market with these focused ideas.
- Target potential mispricings by running your filters across 11 high quality undervalued stocks that combine solid fundamentals with room for market recognition.
- Strengthen your income stream by scanning for 5 dividend fortresses that aim to pair higher yields with business resilience.
- Prioritise resilience first by searching through 12 resilient stocks with low risk scores that score well on stability and financial strength.
This article by Simply Wall St is general in nature. We provide commentary based on historical datan and analyst forecasts only using an unbiased methodology and our articles are not intended to be financial advice. It does not constitute a recommendation to buy or sell any stock, and does not take account of your objectives, or yourn financial situation. We aim to bring you long-term focused analysis driven by fundamental data.n Note that our analysis may not factor in the latest price-sensitive company announcements or qualitative material.n Simply Wall St has no position in any stocks mentioned.
Companies discussed in this article include TECK-B.TO.
Have feedback on this article? Concerned about the content? Get in touch with us directly. Alternatively, email editorial-team@simplywallst.com
Company invites individual and institutional investors, as well as advisors and analysts, to attend real-time, interactive presentations on VirtualInvestorConferences.com
TORONTO, May 19, 2026 (GLOBE NEWSWIRE) — Honey Badger Silver Inc., (TSX-V: TUF; OTCQB: HBEIF; FSE: 1QA; Tradegate: 1QA), based in Toronto, Ontario, is focused on advancing its flagship Prairie Creek Project, a fully permitted high-grade silver-zinc-lead project in the Northwest Territories, alongside a portfolio of 7 other silver assets across Canada. Honey Badger Silver today announced that Chad Williams, Executive Chairman & CEO will present live at the Precious Metals & Critical Minerals Hybrid Investor Conference, hosted by VirtualInvestorConferences.com, on May 21st, 2026.
DATE: May 21st, 2026TIME: 3:15 – 3:45 PM EST
REGISTER HEREAvailable for in-person 1×1 meetings on May 21st. Schedule meetings here.
This will be a live, interactive in-person and online event where investors are invited to ask the company questions in real-time. If you would like to attend in-person, please email greg@otcmarkets.com for an attendee pass. If attendees are not able to join the event live on the day of the conference, an archived webcast will also be made available after the event.
It is recommended that investors pre-register and run the online system check to expedite participation and receive event updates.
Learn more about the event at www.virtualinvestorconferences.com.
About Honey Badger Silver (TSXV: TUF) (OTCQB: HBEIF) (FSE: 1QA) (Tradegate: 1QA)
Honey Badger Silver is unlocking some of Canada's richest untapped silver potential. With the acquisition of the fully permitted, high-grade PC Silver Project, the Company has become a leading North American silver and critical minerals company.
Backed by an impressive portfolio of 8 high-quality silver mineral projects across the Northwest Territories, Yukon, and Nunavut, including the Sunrise Lake, Plata, and Nanisivik properties, Honey Badger controls district- scale land positions in some of the most metal-rich jurisdictions on the continent.
What sets Honey Badger apart is its strategic blend of real silver ownership and growth leverage: the Company holds 10,000 ounces of physical silver yielding 12% annually, reinforcing tangible asset value while advancing aggressive exploration and acquisition plans.
Led by a proven team of mine-builders and capital markets professionals, Honey Badger is building a cash-generating, asset-backed platform for the bull cycle in precious and critical metals.
More information is available at www.honeybadgersilver.com
About Virtual Investor Conferences®Virtual Investor Conferences (VIC) is the leading proprietary investor conference series that provides an interactive forum for publicly traded companies to seamlessly present directly to investors.
Providing a real-time investor engagement solution, VIC is specifically designed to offer companies more efficient investor access. Replicating the components of an on-site investor conference, VIC offers companies enhanced capabilities to connect with investors, schedule targeted one-on-one meetings and enhance their presentations with dynamic video content. Accelerating the next level of investor engagement, Virtual Investor Conferences delivers leading investor communications to a global network of retail and institutional investors.
CONTACTS:Honey Badger Silver Inc. Sonya Pekar | Investor Relations. P: (647) 498 – 8244E: spekar@honeybadgersilver.com
Virtual Investor ConferencesGreg Young VP Corporate Services OTC Markets Group (212) 652-5958 greg@otcmarkets.com
Source: Getty Images
Written by Adam Othman at The Motley Fool Canada
n
This earnings season has passed and left many investors feeling unsatisfied with all the disappointing results. However, it has also set low expectations that most investors will carry till the next season. This is an opportunity for savvier investors to identify undervalued stocks that might not look great right now but become no-brainer buys later.
n
Today, we’re going to be looking at three TSX stocks that fit the bill for appearing to be messy investments, but might go through the kind of turnarounds that make them winners for your self-directed investment portfolio.
Magna International (TSX:MG) is a $23.85 billion market-cap company that holds the position of being Canada’s biggest auto supplier. The company makes its own vehicles, but primarily focuses on providing vision and power systems, seating, body structures, vehicle assemblies, and more to manufacturers.
n
Lower vehicle production amid the tariff-fueled developments has led to issues for auto suppliers. Despite the headwinds, Magna has performed well in the first quarter of Fiscal 2026. The company’s sales increased by 3% year over year. While the company had to reduce its full-year sales guidance from US$43.1 billion to US$41.5 billion due to tariffs, the move can benefit the stock and its investors if it beats expectations.
Nutrien (TSX:NTR) is one of the world’s most important providers of ingredients critical to large-scale agriculture. The scale of farming operations required to meet global food requirements necessitates high-quality agricultural inputs to increase yields. Nutrien happens to be one of the biggest producers of phosphates and nitrogen. Fertilizer markets are facing challenges due to global supply chain issues.
n
The problem is leading to increased prices for crop inputs. Higher prices can mean better profit margins for the $46.91 billion market-cap crop nutrient company. Trading at only 14.6 times earnings, it might not be the cheapest stock on paper. However, strong future demand means the ability to generate significant cash flows. I think this stock has plenty of upside that investors can capture by investing at current levels.
Teck Resources (TSX:TECK.B) is a $44.02 billion market capitalization company that focuses on providing metals essential to the energy transition and economic development, and it does so responsibly. It has a globally diversified portfolio of copper and zinc mining operations, and a copper growth pipeline that is second to none in the industry.
n
Copper demand is only going to grow in the coming decades, and the company’s merger with Anglo American is setting itself up to become one of the world’s largest copper producers. If successful, this move can cement Teck Resources stock into an unbeatable position. Copper prices will eventually increase amid growing demand. Investors interested in this sector of the economy might be wise to add TECK.B to their self-directed investment portfolios.
The next round of earnings could provide better clarity on which stocks are the winners and which look like value traps. Together, these three stocks offer the kind of long-term appeal and earnings momentum that can turn into a massive surge in tailwinds when the next earnings arrive.
n
The post 3 Dirt-Cheap Stocks to Buy With $1,000 Right Now appeared first on The Motley Fool Canada.
nn
nShould you invest $1,000 in Magna International right now?n
Before you buy stock in Magna International, consider this:
n
The Motley Fool Canada team has identified what they believe are the top 10 TSX stocks for 2026… and Magna International wasn’t one of them. The 10 stocks that made the cut could potentially produce monster returns in the coming years.
n
Consider MercadoLibre, which we first recommended on January 8, 2014 … if you invested $1,000 in the “eBay of Latin America” at the time of our recommendation, you’d have over $18,000!*
n
Now, it’s worth noting Stock Advisor Canada’s total average return is 94%* – a market-crushing outperformance compared to 85%* for the S&P/TSX Composite Index. Don’t miss out on our top 10 stocks, available when you join our mailing list!
nGet the 10 stocks instantlynnn#start_btn6 {nbackground:#0e6d04 none repeat scroll;color:#fff;font-size:1.2em;font-family:’Montserrat’, sans-serif;font-weight:600;height:auto;margin:30px 0;max-width:350px;text-align:center;width:auto;}nn#start_btn6 a {ncolor:#fff;display:block;padding:20px;padding-right:1em;padding-left:1em;}nn#start_btn6 a:hover {nbackground:#FFE300 none repeat scroll;color:#000;}nnn@media (max-width:480px) {ndiv#start_btn6 {nfont-size:1.1em;max-width:320px;}n}nnmargin_bottom_5 {margin-bottom:5px;}nmargin_top_10 {margin-top:10px;}nn
* Returns as of April 20th, 2026
n
n
More reading
Fool contributor Adam Othman has no position in any of the stocks mentioned. The Motley Fool recommends Magna International and Nutrien. The Motley Fool has a disclosure policy.
n
2026
Find your next quality investment with Simply Wall St's easy and powerful screener, trusted by over 7 million individual investors worldwide.
- BHP Group has shifted its primary earnings driver from iron ore to copper as part of a broader transformation of its portfolio.
- The company is prioritising long term copper production plans and significant investments aligned with demand from electrification and AI infrastructure.
- BHP has outlined a focus on bolt on acquisitions and organic growth rather than large scale takeovers, supported by new board expertise in industrial operations.
For investors watching ASX:BHP, this pivot comes at a time when the stock is trading around A$58.77, with a return of 28.4% year to date and 58.0% over the past year. The shift in earnings mix toward copper puts more attention on projects and assets that are tied to electrification and data centre build outs, rather than the iron ore segment that has long been central to BHP's profile.
The renewed emphasis on copper, together with the decision to prioritise organic growth and bolt on deals, may influence how BHP allocates capital and manages risk across the cycle. The recent appointment of a director with industrial operations experience indicates that governance is being aligned with this direction, which investors may watch closely as the copper strategy progresses.
Stay updated on the most important news stories for BHP Group by adding it to your watchlist or portfolio. Alternatively, explore our Community to discover new perspectives on BHP Group.
ASX:BHP 1-Year Stock Price Chart
BHP's decision to make copper its primary earnings driver puts more weight on execution and leadership than headline commodity exposure alone. Incoming CEO Brandon Craig is steering the company towards organic growth and smaller bolt on deals, which can reduce the risk of large acquisition missteps but also places greater importance on project delivery and capital discipline. The appointment of Mark Vassella as a non executive director adds heavy industrial operations experience and a track record in steel and materials, which aligns with BHP's push to grow long life copper assets tied to electrification and AI infrastructure. For you as an investor, this combination of copper centric growth plans and refreshed board expertise suggests BHP is trying to match its governance and capital allocation approach with a more complex project pipeline across the Americas and Australia. The share price reaction following the strategy comments and weaker commodity prices shows that markets are already testing how credible and resilient this shift will be through the cycle.
How This Fits Into The BHP Group Narrative
- The pivot toward copper and focus on long life assets supports the narrative that BHP is aligning with decarbonisation and electrification trends that could underpin long term demand for critical minerals.
- A greater reliance on copper, alongside a reset of M&A ambitions, could challenge assumptions about earnings stability that previously leaned on lower cost iron ore exposure and larger scale deal making.
- The addition of Mark Vassella and the emphasis on capital allocation discipline and decarbonisation focus are governance elements that are not fully reflected in the original narrative but may influence how BHP manages project and ESG risks.
Knowing what a company is worth starts with understanding its story.n Check out one of the top narratives in the Simply Wall St Community for BHP Group to help decide what it's worth to you.
The Risks and Rewards Investors Should Consider
- ⚠️ Higher exposure to copper prices and potential project execution issues in growth assets could increase earnings volatility if new developments underperform or face delays.
- ⚠️ Analysts have flagged an unstable dividend track record, so income focused investors may want to pay close attention to how capital is split between growth projects and shareholder returns.
- 🎁 The earnings mix now tied more closely to copper may benefit from structural demand linked to data centres, energy transition and electrification if these themes continue to support long term consumption.
- 🎁 The combination of smaller bolt on deals, organic growth and strengthened board experience may support more disciplined capital allocation compared with large scale acquisition strategies used by some peers such as Rio Tinto and Vale.
What To Watch Going Forward
From here, it is worth tracking how BHP delivers on its copper growth plans, including progress at Olympic Dam and Resolution Copper, and how closely board and management decisions stick to the stated focus on organic growth and bolt on acquisitions. Watch for further commentary from Brandon Craig in conference presentations, any updates to capital spending plans, and how the company balances dividends against investment in long life copper projects. Changes in copper and iron ore prices, as well as how peers like Rio Tinto and Glencore position their own copper portfolios, will also help you assess how this shift in earnings mix affects BHP's relative appeal over time.
To ensure you're always in the loop on how the latest news impacts the investment narrative for BHP Group, head to then community page for BHP Group to never miss an update on the top community narratives.
This article by Simply Wall St is general in nature. We provide commentary based on historical datan and analyst forecasts only using an unbiased methodology and our articles are not intended to be financial advice. It does not constitute a recommendation to buy or sell any stock, and does not take account of your objectives, or yourn financial situation. We aim to bring you long-term focused analysis driven by fundamental data.n Note that our analysis may not factor in the latest price-sensitive company announcements or qualitative material.n Simply Wall St has no position in any stocks mentioned.
Companies discussed in this article include BHP.AX.
Have feedback on this article? Concerned about the content? Get in touch with us directly. Alternatively, email editorial-team@simplywallst.com
Shares of USA Rare Earth, Inc. USAR have surged a solid 70.5% in the past six months. It outperformed both the industry and the S&P 500, which have returned 36.7% and 12.8%, respectively. In comparison, the company’s peers like MP Materials MP and BHP Group Limited BHP have declined 3.6% and increased 57.8%, respectively, over the same time frame.
USAR Outperforms Industry & S&P 500
Image Source: Zacks Investment Research
Closing at $24.39 in the last trading session, the stock is trading below its 52-week high of $43.98 but higher than its 52-week low of $8.00. The stock is trading above both its 50-day and 200-day moving averages, indicating solid upward momentum and confidence in the company's long-term prospects.
USAR Stock’s 50-Day & 200-Day Moving Averages
Image Source: Zacks Investment Research
Let’s take a look at USAR’s fundamentals to better analyze how to play the stock.
Factors Driving USAR’s Performance
USAR has achieved a key milestone with the commissioning of Phase 1a of its commercial magnet production line at the Stillwater facility in Oklahoma. The development enables USAR to start fulfilling customer orders for sintered neodymium-iron-boron (NdFeB) permanent magnets in the second quarter of 2026.During 2025, the company installed equipment, assembled Line 1a and prepared the Stillwater site for commercial commissioning in 2026. USAR also strengthened its operational capabilities by hiring and training engineers and technicians to support production scale-up and long-term customer agreements.The successful commissioning demonstrates the facility’s ability to manage a complex, multi-step manufacturing process at commercial scale. The process converts rare earth and metallic elements into ultra-fine powder, which is refined through jet milling in a controlled environment before being shaped, coated and magnetized into NdFeB permanent magnets. These magnets are widely used across defense, aerospace, automotive and other fast-growing industries.Phase 1a is expected to reach an annual run-rate production capacity of 600 metric tons by the end of 2026. The planned addition of Phase 1b is projected to double the Stillwater facility’s total capacity to 1,200 metric tons annually by the first quarter of 2027.Once fully operational, the Stillwater facility is expected to become one of the first large-scale NdFeB magnet manufacturing plants in the United States, strengthening the domestic rare earth supply chain.In May 2026, USAR received a $14.2 million grant from the Texas Semiconductor Innovation Fund to speed up the development of its Round Top Mountain rare earth project in West Texas. The project is expected to help build a U.S.-based supply chain for critical rare earth materials used in defense, semiconductors, AI and advanced technologies.USAR strengthened its financial position through PIPE financing and warrant exercises. In January 2026, the company completed a $1.5 billion PIPE financing, with proceeds to be used for upgrades at the Stillwater facility, expansion of magnet finishing operations and completion of Line 1b, which is expected to raise total NdFeB magnet production capacity to approximately 1,200 metric tons.In March 2026, USAR entered into a deal to acquire Texas Mineral Resources Corp. in an all-stock deal worth about $73 million. This will give the company full ownership and operational control of the Round Top Project. USAR expects commercial production at Round Top to begin in 2028, with a target to process around 40,000 metric tons of rare earth and critical mineral feedstock per day by 2030. Also, USAR completed the acquisition of Less Common Metals in November 2025, which will supply critical metal and alloy feedstock for the Stillwater plant.In January 2026, USA Rare Earth entered into a non-binding Letter of Intent (the LOI) with the U.S. Department of Commerce and announced collaboration with the U.S. Department of Energy (DOE). The Department of Commerce’s CHIPS Program has provided an LOI entailing $277 million in proposed federal funding and a $1.3 billion senior secured loan under the CHIPS Act, a total of $1.6 billion. However, the company remains in the early stages of commercial development and continues to incur losses as it scales its operations. Though it began generating revenues following the acquisition of Less Common Metals, rising operating expenses related to business expansion, acquisitions and workforce growth continue to weigh on profitability. In first-quarter 2026, USAR’s selling, general and administrative expenses increased to $21.2 million from $7 million in the year-ago quarter due to a rise in legal & consulting costs, higher headcount & recruiting fees, and other costs.Research and development expenses rose to $14.2 million compared with $1.7 million reported in the year-ago quarter due to an increase in higher employee-related and development costs. USAR operates in the mineral exploration and mining markets, which include major industry players like MP Materials and BHP Group.
USAR’s Estimate Revisions
Image Source: Zacks Investment Research
The Zacks Consensus Estimate for USAR’s bottom line for 2026 has decreased in the past 60 days.
Valuation
Image Source: Zacks Investment Research
From a valuation standpoint, USA Rare Earth is trading at a forward price-to-earnings ratio of a negative 50.98X against the industry average of 15.22X. In comparison, BHP Group and MP Materials are trading at 16.36X and 135.53X, respectively.
Final Take
USAR recently commissioned Phase 1a of its commercial magnet production line at the Stillwater facility in Oklahoma and strengthened its long-term strategy through the acquisition of Less Common Metals and the planned acquisition of Texas Mineral Resources to secure full ownership of the Round Top Project. The company has also enhanced its growth prospects through significant financing initiatives, government support and expansion plans aimed at building a domestic rare earth supply chain.However, despite beginning to generate revenues, USAR continues to incur losses as rising operating and research & development expenses related to expansion and commercialization are likely to weigh on its near-term performance. Holding on to this Zacks Rank #4 (Sell) company at present does not seem prudent. You can see the complete list of today’s Zacks #1 Rank (Strong Buy) stocks here.
Want the latest recommendations from Zacks Investment Research? Today, you can download 7 Best Stocks for the Next 30 Days. Click to get this free report
BHP Group Limited Sponsored ADR (BHP) : Free Stock Analysis Report
MP Materials Corp. (MP) : Free Stock Analysis Report
USA Rare Earth Inc. (USAR) : Free Stock Analysis Report
This article originally published on Zacks Investment Research (zacks.com).
Source: Getty Images
Written by Amy Legate-Wolfe at The Motley Fool Canada
n
Today, we’re not going to talk about tech stocks. No, we’ve done enough of that when it comes to artificial intelligence (AI) stocks. However, there are so many companies that can be affected by AI and its spread across the world. From the smallest parts to the biggest infrastructure, so many stocks could see a surge.
n
In fact, Ottawa has put $2 billion behind its Canadian Sovereign AI Compute Strategy, including $700 million aimed at private-sector investment in new or expanded data centres. Canada also unveiled a plan to double electricity-grid capacity by 2050. So let’s look at some less obvious companies that could benefit from the AI boom.
nnPAASn
Pan American Silver (TSX:PAAS) is one of the world’s larger silver producers, with gold exposure as well. It mines silver and gold across the Americas, giving investors direct exposure to precious metals. Silver plays a role in electronics, power systems, and advanced industrial demand, so stronger electrification and data-centre buildouts can support the long-term silver story.
n
Recent news has been strong. In May 2026, Pan American reported first-quarter results and announced a shareholder-return framework targeting up to US$1 billion in 2026. Furthermore, in Q1 2026, sales rose to US$1.2 billion from US$773 million a year earlier. Net income climbed to US$457 million from US$169 million, while earnings per share (EPS) from continuing operations rose to US$1.08 from US$0.47.
n
Better still? Revenue jumped by nearly 49%, while net income almost tripled. Yet at writing, PAAS only trades at about 18 times earnings, with a nice 1% dividend yield as well. If AI spending keeps feeding electrification demand while uncertainty supports precious metals, PAAS could stay on investors’ radar.
nGRTn
Granite REIT (TSX:GRT.UN) is a Canadian industrial and logistics real estate trust that owns and manages warehouses, logistics buildings, and industrial properties across North America and Europe. When it comes to AI infrastructure, there’s a need for industrial land, logistics networks, power-adjacent properties, and supply-chain capacity. Therefore, GRT can benefit as companies expand the physical backbone around AI investment.
n
Q1 2026 shows why it’s more than a yield stock. Granite reported funds from operations (FFO) per unit of $1.57, up 7.5% year over year, while same-property net operating income rose 8.3%. Adjusted FFO per unit came in at $1.41, and the AFFO payout ratio was 63%, compared with 60% a year earlier. Occupancy stood at 97.5% at the end of Q1 2026, which points to strong demand for its properties.
n
Yet again, it looks valuable trading at just 14 times earnings with a solid 3.8% dividend yield as well. That’s even after gaining 35% in the last year alone. All in all, Granite gives investors a steadier real-estate angle on the AI buildout.
nLUNn
Finally, we have Lundin Mining (TSX:LUN), a clear metals-and-electrification pick. The company produces copper, along with gold, nickel, and zinc. Copper is the wiring metal behind grids, data centres, electric vehicles, power equipment, and industrial growth. Massive AI spending increases power demand, and power demand drives grid upgrades. Copper sits at the centre of that chain.
n
In Q1 2026, Lundin stock reported revenue of about US$1.2 billion, adjusted earnings before interest, taxes, depreciation and amortization (EBITDA) of about US$627 million, adjusted operating cash flow of about US$450 million, and free cash flow from continuing operations of about US$380 million. Copper production hit 30,808 tonnes from continuing operations and 145,471 tonnes on a pro forma combined basis, reflecting the bigger copper platform.
n
Yet again, even after a massive 209% run, it trades at 20.5 times earnings. However, it also trades at 3.4 times book value, so not exactly a deal. However, copper names rarely stay cheap when investors chase electrification.
nBottom linen
Sometimes it’s a good idea to look beyond the obvious. These three offer different ways to play AI spending without buying a traditional tech stock. If the next phase of AI spending moves into mines, warehouses, power systems, and industrial supply chains, these three Canadian stocks could have more upside than the market gives them credit for right now.
n
The post 3 Canadian Stocks That Could Win Big From AI Spending appeared first on The Motley Fool Canada.
nn
nShould you invest $1,000 in Granite Real Estate Investment Trust right now?n
Before you buy stock in Granite Real Estate Investment Trust, consider this:
n
The Motley Fool Canada team has identified what they believe are the top 10 TSX stocks for 2026… and Granite Real Estate Investment Trust wasn’t one of them. The 10 stocks that made the cut could potentially produce monster returns in the coming years.
n
Consider MercadoLibre, which we first recommended on January 8, 2014 … if you invested $1,000 in the “eBay of Latin America” at the time of our recommendation, you’d have over $18,000!*
n
Now, it’s worth noting Stock Advisor Canada’s total average return is 94%* – a market-crushing outperformance compared to 85%* for the S&P/TSX Composite Index. Don’t miss out on our top 10 stocks, available when you join our mailing list!
nGet the 10 stocks instantlynnn#start_btn6 {nbackground:#0e6d04 none repeat scroll;color:#fff;font-size:1.2em;font-family:’Montserrat’, sans-serif;font-weight:600;height:auto;margin:30px 0;max-width:350px;text-align:center;width:auto;}nn#start_btn6 a {ncolor:#fff;display:block;padding:20px;padding-right:1em;padding-left:1em;}nn#start_btn6 a:hover {nbackground:#FFE300 none repeat scroll;color:#000;}nnn@media (max-width:480px) {ndiv#start_btn6 {nfont-size:1.1em;max-width:320px;}n}nnmargin_bottom_5 {margin-bottom:5px;}nmargin_top_10 {margin-top:10px;}nn
* Returns as of April 20th, 2026
n
n
More reading
Fool contributor Amy Legate-Wolfe has no position in any of the stocks mentioned. The Motley Fool recommends Granite Real Estate Investment Trust. The Motley Fool has a disclosure policy.
n
2026
In the last year, multiple insiders have substantially increased their holdings of Honey Badger Silver Inc. (CVE:TUF) stock, indicating that insiders' optimism about the company's prospects has increased.
Although we don't think shareholders should simply follow insider transactions, logic dictates you should pay some attention to whether insiders are buying or selling shares.
The Last 12 Months Of Insider Transactions At Honey Badger Silver
Notably, that recent purchase by Eric Sprott is the biggest insider purchase of Honey Badger Silver shares that we've seen in the last year. We do like to see buying, but this purchase was made at well below the current price of CA$0.88. While it does suggest insiders consider the stock undervalued at lower prices, this transaction doesn't tell us much about what they think of current prices.
In the last twelve months insiders purchased 18.31m shares for CA$7.8m. But they sold 384.62k shares for CA$94k. In the last twelve months there was more buying than selling by Honey Badger Silver insiders. The average buy price was around CA$0.43. It is certainly positive to see that insiders have invested their own money in the company. But we must note that the investments were made at well below today's share price. The chart below shows insider transactions (by companies and individuals) over the last year. If you click on the chart, you can see all the individual transactions, including the share price, individual, and the date!
See our latest analysis for Honey Badger Silver
TSXV:TUF Insider Trading Volume May 18th 2026
Honey Badger Silver is not the only stock insiders are buying. So take a peek at this free list of under-the-radar companies with insider buying.
Insiders At Honey Badger Silver Have Bought Stock Recently
Over the last three months, we've seen significant insider buying at Honey Badger Silver. Overall, five insiders shelled out CA$7.4m for shares in the company — and none sold. This is a positive in our book as it implies some confidence.
Does Honey Badger Silver Boast High Insider Ownership?
For a common shareholder, it is worth checking how many shares are held by company insiders. Usually, the higher the insider ownership, the more likely it is that insiders will be incentivised to build the company for the long term. Insiders own 31% of Honey Badger Silver shares, worth about CA$42m. While this is a strong but not outstanding level of insider ownership, it's enough to indicate some alignment between management and smaller shareholders.
So What Does This Data Suggest About Honey Badger Silver Insiders?
It is good to see recent purchasing. And the longer term insider transactions also give us confidence. However, we note that the company didn't make a profit over the last twelve months, which makes us cautious. Given that insiders also own a fair bit of Honey Badger Silver we think they are probably pretty confident of a bright future. So these insider transactions can help us build a thesis about the stock, but it's also worthwhile knowing the risks facing this company. In terms of investment risks, we've identified 3 warning signs with Honey Badger Silver and understanding them should be part of your investment process.
Of course Honey Badger Silver may not be the best stock to buy. So you may wish to see this free collection of high quality companies.
For the purposes of this article, insiders are those individuals who report their transactions to the relevant regulatory body. We currently account for open market transactions and private dispositions of direct interests only, but not derivative transactions or indirect interests.
Have feedback on this article? Concerned about the content? Get in touch with us directly. Alternatively, email editorial-team (at) simplywallst.com.This article by Simply Wall St is general in nature. We provide commentary based on historical data and analyst forecasts only using an unbiased methodology and our articles are not intended to be financial advice. It does not constitute a recommendation to buy or sell any stock, and does not take account of your objectives, or your financial situation. We aim to bring you long-term focused analysis driven by fundamental data. Note that our analysis may not factor in the latest price-sensitive company announcements or qualitative material. Simply Wall St has no position in any stocks mentioned.
Find winning stocks in any market cycle. Join 7 million investors using Simply Wall St's investing ideas for FREE.
- Peru's government has revoked the construction permit for Southern Copper's Tía María project, affecting one of NYSE:SCCO's key growth assets.
- The decision introduces fresh regulatory and political uncertainty for the company’s project pipeline in Peru.
- Investors are reassessing long term risk around capital deployment and future approvals in resource rich but politically sensitive regions.
Southern Copper, listed as NYSE:SCCO, is a major copper producer with a portfolio that includes large scale assets in Peru. The Tía María project has been part of its growth plan, so the loss of the construction permit lands at a time when copper remains central to long term demand themes tied to electrification and grid investment. For you as an investor, this means company specific regulatory risk now sits more clearly alongside broader sector demand drivers.
Looking ahead, attention is likely to focus on how Southern Copper responds in terms of project sequencing, capital allocation, and engagement with Peruvian authorities. You may want to watch for company updates on alternative projects, timelines, and any revisions to investment plans, as these could reshape the risk profile and potential production mix over the coming years.
Stay updated on the most important news stories for Southern Copper by adding it to your watchlist or portfolio. Alternatively, explore our Community to discover new perspectives on Southern Copper.
NYSE:SCCO 1-Year Stock Price Chart
The permit revocation at Tía María directly affects one of Southern Copper's Peru projects, so the immediate question for you is how much of the planned US$20.5b capex over the next decade is now at risk of delay or reallocation. The decision reinforces that regulatory approvals in Peru are not a one time hurdle but an ongoing process that can be revisited. That can feed into higher project specific risk premiums, potentially stricter environmental or social conditions, and a longer timetable before capital begins to earn returns. It also comes at a time when some analysts are already cautious, pointing to valuation concerns and regulatory risk as contributors to recent share price weakness. For investors tracking other copper producers such as Freeport McMoRan or Lundin Mining, this episode underlines how project jurisdiction can matter as much as ore quality or cost position.
How This Fits Into The Southern Copper Narrative
- The setback at Tía María lines up with existing concerns in the narrative about large Peru and Mexico projects facing community issues and operational disruptions, so it reinforces the idea that execution risk is central to the story.
- It challenges earlier expectations that projects like Tía María would progress on the original timetable, which was an important pillar for the long term production growth and capex plan discussed in the narrative.
- The specific risk that a previously granted permit can be revoked may not be fully reflected in high level growth assumptions that focus on aggregate capex and capacity rather than project by project regulatory fragility.
Knowing what a company is worth starts with understanding its story.n Check out one of the top narratives in the Simply Wall St Community for Southern Copper to help decide what it is worth to you.
The Risks and Rewards Investors Should Consider
- The news highlights concentrated exposure to Peru specific regulatory and political risk, where approvals can be reversed even after significant planning and pre construction work.
- A disrupted project pipeline increases the chance that Southern Copper needs to reshuffle or slow its multi year US$20.5b investment plan, which could affect timing of future production and cash flow compared with what some investors expect.
- The company still has a broad portfolio of projects across Peru and Mexico and has recently reported strong earnings and dividends, giving it financial flexibility to adjust capital deployment if one asset stalls.
- Analysts have already flagged 2 key rewards and 1 important risk, so part of this regulatory uncertainty is on the radar, which can help set expectations more realistically than if the issue had not been identified at all.
What To Watch Going Forward
From here, focus on whether Southern Copper can secure a legal or administrative resolution on Tía María, or if it formally pivots capital toward other projects in its pipeline. Any new guidance on capex phasing, production targets, or project mix will help you gauge how material this setback is to long term output. Also keep an eye on commentary from regulators and local communities in Peru, as that will shape the probability of future approvals both for Tía María and for other planned developments. For context, it can be useful to compare how peers such as Freeport McMoRan or Lundin Mining describe their permitting and community relations in different jurisdictions.
To ensure you are always in the loop on how the latest news impacts the investment narrative for Southern Copper, head to then community page for Southern Copper to never miss an update on the top community narratives.
This article by Simply Wall St is general in nature. We provide commentary based on historical datan and analyst forecasts only using an unbiased methodology and our articles are not intended to be financial advice. It does not constitute a recommendation to buy or sell any stock, and does not take account of your objectives, or yourn financial situation. We aim to bring you long-term focused analysis driven by fundamental data.n Note that our analysis may not factor in the latest price-sensitive company announcements or qualitative material.n Simply Wall St has no position in any stocks mentioned.
Companies discussed in this article include SCCO.
Have feedback on this article? Concerned about the content? Get in touch with us directly. Alternatively, email editorial-team@simplywallst.com
Never miss an important update on your stock portfolio and cut through the noise. Over 7 million investors trust Simply Wall St to stay informed where it matters for FREE.
- Lundin Mining (TSX:LUN) has appointed Michael Steinmann, CEO of Pan American Silver, to its Board of Directors.
- Steinmann brings experience in mine construction, corporate planning, and sustainability oversight across base and precious metals operations, including in South America.
Lundin Mining shares recently closed at CA$38.65, with the stock up 4.0% over the past week and 30.1% year to date. Over the past year the share price has risen significantly and over five years the return has been more than three times, which helps explain why investors closely follow changes in leadership and governance at TSX:LUN.
For shareholders or potential investors, the arrival of a director with operating and project experience may influence how the company frames future projects and risk oversight. It may be useful to watch how Steinmann’s board role relates to decisions on capital allocation, project timelines, and sustainability priorities at Lundin Mining.
Stay updated on the most important news stories for Lundin Mining by adding it to your watchlist or portfolio. Alternatively, explore our Community to discover new perspectives on Lundin Mining.
TSX:LUN 1-Year Stock Price Chart
Quick Assessment
- ⚖️ Price vs Analyst Target: At CA$38.65, Lundin Mining trades about 2.2% below the CA$39.54 analyst target, which is close to consensus expectations.
- ❌ Simply Wall St Valuation: Shares are assessed as trading 253.5% above estimated fair value, suggesting a rich valuation.
- ❌ Recent Momentum: The stock is down 5.6% over the past 30 days, following a period of strong longer term performance.
Investors can find more detail on whether it may be the right time to buy, sell or hold Lundin Mining in Simply Wall St’sncompany report on Lundin Mining’s fair value.
Key Considerations
- 📊 Steinmann’s board appointment adds mining and project experience at a time when the stock is trading close to the analyst target but well above the estimated fair value.
- 📊 It may be useful to monitor how board decisions influence capital allocation, new project approvals and any changes to production or cost guidance.
- ⚠️ Earnings are forecast to decline by an average of 0.5% per year over the next 3 years, which could matter more if valuation stays elevated.
Dig Deeper
For the full picture, including more risks and potential rewards, check out thencomplete Lundin Mining analysis. You can also visit thencommunity page for Lundin Mining to see how other investors believe this latest news may affect the company’s narrative.
This article by Simply Wall St is general in nature. We provide commentary based on historical datan and analyst forecasts only using an unbiased methodology and our articles are not intended to be financial advice. It does not constitute a recommendation to buy or sell any stock, and does not take account of your objectives, or yourn financial situation. We aim to bring you long-term focused analysis driven by fundamental data.n Note that our analysis may not factor in the latest price-sensitive company announcements or qualitative material.n Simply Wall St has no position in any stocks mentioned.
Companies discussed in this article include LUN.TO.
Have feedback on this article? Concerned about the content? Get in touch with us directly. Alternatively, email editorial-team@simplywallst.com
Road Town, Tortola, British Virgin Islands–(Newsfile Corp. – May 15, 2026) – Talon Metals Corp. (TSX: TLO) (OTCID: TLOFF) ("Talon" or the "Company") today reported its first quarter 2026 financial results. This is the first quarter in which results from the recently acquired Eagle Mine and Humboldt Mill ("Eagle") are included. Results from Eagle have been included commencing January 9, 2026, the closing date of the Company's acquisition of Eagle from Lundin Mining Corporation. All dollar amounts presented in this news release are in U.S. dollars. On January 1, 2026, the Company changed its presentation currency from Canadian dollars to U.S. dollars.
HighlightsFor the three-month period ending March 31, 2026, the Company reported:
- Revenue of $46.9 million (Q1 2025: $nil million);
- Net income of $1.6 million or $0.01 per share (basic and diluted) (Q1 2025: net loss of $0.6 million or ($0.01) per share (basic and diluted));
- EBITDA1 of $7.8 million (Q1 2025: negative EBITDA of $0.6 million);
- Adjusted EBITDA1 of $8.7 million (Q1 2025: negative EBITDA of $0.6 million);
- Cash provided by operating activities was $5.2 million (Q1 2025: $5.1 million);
- Capitalized exploration and evaluation costs on the Tamarack Nickel-Copper-Cobalt Project for the three months ended March 31, 2026, amounted to $7.2 million (Q1 2025: $4.0 million).
As at March 31, 2026, the Company reported:
- Cash, cash equivalents, treasury bills, and term deposits of $31.5 million (December 31, 2025 – $25.4 million);
- Working capital of $48.6 million (December 31, 2025 – $19.3 million).
As at May 15, 2026, the Company reported cash, cash equivalents, treasury bills, and term deposits of $55.1 million.
Darby Stacey, Chief Executive Officer of Talon, commented: "We're pleased to report our first quarterly results since our transformational acquisition of Eagle Mine on January 9, 2026. The integration of the Eagle assets has progressed to plan, and we're excited to see these excellent teams begin working together toward our exciting future for the Company. Operationally, it was a challenging period with historical snowfall and issues related to excessive blocky material in the active mining stopes that negatively impacted ore flow. Our operations teams have successfully navigated through these challenges, and now resolved, we're executing well with stable performance in Q2. With $55.1 million of cash and short-term investments as of May 15, 2026, the Company is well-positioned to execute on its exploration and development plans in Minnesota and Michigan."
Consolidated Financial Statements for the three months ending March 31, 2026, and 2025, together with Management's Discussion and Analysis, have been filed under the Company's profile on SEDAR+ and are available at www.sedarplus.ca.
Table 1 – Financial and Operating Metrics4
To view an enhanced version of this graphic, please visit:https://images.newsfilecorp.com/files/2443/297695_7ddb201ca482cbfd_001full.jpg
1 Cash cost includes at-mine cash operating costs, treatment and refining charges, selling costs, and transportation costs, and is reported on a $/lb of nickel sold basis. Cash cost may also include royalties, and so cash cost has been presented excluding and including royalties.2 Royalties include state and private royalties, and Michigan severance tax. Michigan severance tax, which is in lieu of state tax, is calculated similarly to a royalty as a percentage of revenue.3 All-in sustaining cost ("AISC") includes cash cost (as defined above), sustaining capital expenditure, current period closure costs (cash basis), and lease payments (cash basis).4 EBITDA, Adjusted EBITDA, cash costs, AISC, and sustaining capital expenditures are non-GAAP financial measures or ratios. Refer to the "Non-Performance Measures" section in this News Release for more information, including reconciliations to the nearest comparable IFRS measure.5 Results from Eagle have been included commencing January 9, 2026.
Qualified PersonEtienne Dinel, Vice President, Geology of Talon, is a Qualified Person within the meaning of National Instrument 43-101. Mr. Dinel has reviewed and approved the scientific and technical information disclosed in this news release.
Non-GAAP Performance MeasuresThe Company uses certain performance measures in its analysis and disclosure. These performance measures have no standardized meaning within generally accepted accounting principles under IFRS Accounting Standards, and, therefore, amounts presented may not be comparable to similar data presented by other mining companies. This data is intended to provide additional information and should not be considered in isolation or as a substitute for measures of performance prepared in accordance with IFRS Accounting Standards. The following are non-GAAP performance measures that the Company uses as key performance indicators that are included in this news release. The tables below provide a reconciliation of these non-GAAP performance measures to the most directly comparable IFRS measure as contained within the Company's issued financial statements for the three months ended March 31, 2026.
EBITDA and Adjusted EBITDA
EBITDA represents net earnings or loss for the period before income tax expense or recovery, depreciation and amortization, and finance costs, net.
Adjusted EBITDA removes the effects of items that do not reflect the Company's underlying operating performance and are not necessarily indicative of future operating results. These may include: unrealized foreign exchange, unrealized gains or losses from derivative contracts, revaluation gains or losses on marketable securities, derivative liabilities, contingent consideration and purchase options, expenses for acquisition-related fair value adjustments to inventory, non-cash impairment charges and reversals, non-cash stockpile inventory or fixed asset write-downs or reversals, goodwill impairment, insurance proceeds, and litigation and settlements. The following is a reconciliation from net income (loss) under IFRS to EBITDA and Adjusted EBITDA:
To view an enhanced version of this graphic, please visit:https://images.newsfilecorp.com/files/2443/297695_7ddb201ca482cbfd_002full.jpg
Cash Cost Including and Excluding Royalties
Cash cost excluding royalties includes costs directly attributable to mining operations (including mining, processing, and administration), treatment, refining, and transportation charges, but excludes royalty expenses, expenses associated with non-cash fair value adjustments to inventory, depreciation and amortization, and capital expenditures. Revenue from sales of by-products reduce cash cost.
Cash cost, including royalties, includes cash cost excluding royalties plus state royalties, private royalties, and state severance tax, which is administered as a royalty.
Cash cost per pound sold is calculated by dividing cash cost, including or excluding royalties, by the sales volume of the primary metal, which is nickel in the case of Eagle.
All-in Sustaining Costs
All-in sustaining cost ("AISC") includes cash cost (as defined above), sustaining capital expenditure (including underground mine development), current period closure costs (cash basis), and lease payments (cash basis). As this measure seeks to reflect the full cost of production from current operations, expansionary capital and certain exploration costs are excluded as these are costs typically incurred to extend mine life or materially increase the productive capacity of existing assets, or for new operations. Corporate general and administrative expenses have also been excluded, as any attribution of these costs to an operating site would not necessarily be reflective of costs directly attributable to the administration of the site. Certain other cash expenditures, including tax payments, financing charges (including capitalized interest), and costs related to business combinations, asset acquisitions, and asset disposals, are also excluded.
AlSC per pound sold is calculated by dividing AISC by the sales volume of the primary metal, which is nickel in the case of Eagle. The following is a reconciliation from total production costs under IFRS to cash cost, including and excluding royalties, and to AISC.
To view an enhanced version of this graphic, please visit:https://images.newsfilecorp.com/files/2443/297695_talon1.jpg
Sustaining capital expenditures
The following is a reconciliation from total property, plant, and equipment additions under IFRS to sustaining capital expenditures:
To view an enhanced version of this graphic, please visit:https://images.newsfilecorp.com/files/2443/297695_7ddb201ca482cbfd_004full.jpg
ABOUT TALONTalon is a TSX-listed base metals company advancing and operating high-grade nickel-copper assets in the United States, including 100% ownership of the Eagle Mine and Humboldt Mill in Michigan, the only primary nickel mine currently operating in the United States, and the Tamarack Nickel-Copper-Cobalt Project in Minnesota. Talon is in a joint venture with Rio Tinto on the high-grade Tamarack Nickel-Copper-Cobalt Project located in central Minnesota. Talon's shares are also traded in the US over the OTC market under the symbol TLOFF. The Tamarack Nickel-Copper-Cobalt Project comprises a large land position (18km of strike length) with additional high-grade intercepts outside the current resource area. Talon has an earn-in right to acquire up to 60% of the Tamarack Nickel-Copper-Cobalt Project and currently owns 51%. Talon has a neutrality and workforce development agreement in place with the United Steelworkers union. Talon's Beulah Mineral Processing Facility in Mercer County was selected by the US Department of Energy for a US$114.8 million funding grant from the Bipartisan Infrastructure Law, and the US Department of War awarded Talon a grant of US$20.6 million to support and accelerate Talon's exploration efforts in both Minnesota and Michigan. Talon has well-qualified and experienced exploration, mine permitting, mine development, operations, and community relations teams.
For additional information on Talon, please visit the Company's website at www.talonmetals.com or contact:
| Media Contact:Jen Heikkilajen.heikkila@talonmetals.com | Investor Contact:Mike Kiciskicis@talonmetals.com |
FORWARD-LOOKING STATEMENTSThis news release contains certain "forward-looking statements". All statements, other than statements of historical fact, that address activities, events, or developments that the Company believes, expects, or anticipates will or may occur in the future are forward-looking statements. These forward-looking statements reflect the current expectations or beliefs of the Company based on information currently available to the Company. Such forward-looking statements include statements relating to delivering stable performance in Q2 2026 and the Company being well-positioned to execute on its exploration and development plans in Minnesota and Michigan. Forward-looking statements are subject to significant risks and uncertainties and other factors that could cause the actual results to differ materially from those discussed in the forward-looking statements, and even if such actual results are realized or substantially realized, there can be no assurance that they will have the expected consequences to, or effects on, the Company.
Any forward-looking statement speaks only as of the date on which it is made and, except as may be required by applicable securities laws, the Company disclaims any intent or obligation to update any forward-looking statement, whether as a result of new information, future events, or results or otherwise. Although the Company believes that the assumptions inherent in the forward-looking statements are reasonable, forward-looking statements are not guarantees of future performance and accordingly undue reliance should not be put on such statements due to the inherent uncertainty therein.
1 EBITDA and Adjusted EBITDA are non-GAAP financial measures. Refer to the "Non-GAAP Performance Measures" section in this news release for more information, including reconciliations to the nearest comparable IFRS measure.
To view the source version of this press release, please visit https://www.newsfilecorp.com/release/297695
For Immediate Release
Chicago, IL – May 15, 2026 – Today, Zacks Equity Research discusses Southern Copper Corp. SCCO, Freeport-McMoRan Inc. FCX and Lundin Mining Corp. LUNMF.
Industry: Mining – Non-Ferrous Metals
Link: https://www.zacks.com/commentary/2921005/3-non-ferrous-metal-mining-stocks-to-watch-in-a-challenging-industry
The prospects of the Zacks Mining – Non Ferrous industry remain challenged amid the current volatility in metal prices. Industry players also grapple with inflated costs, labor shortages and supply-chain issues. However, the demand for non-ferrous metals is expected to be supported by the energy-transition trend, which should buoy the industry.
Against this backdrop, we suggest keeping an eye on companies like Southern Copper Corp., Freeport-McMoRan Inc. and Lundin Mining Corp. These companies are poised to gain from their endeavors to build reserves and control costs while investing in technology and improving production efficiency.
About the Industry
The Zacks Mining – Non Ferrous industry comprises companies that produce non-ferrous metals, including copper, gold, silver, cobalt, molybdenum, zinc, aluminum and uranium. These metals are used by various industries, including aerospace, automotive, packaging, construction, machinery, electronics, transportation, jewelry, chemical and nuclear energy. Mining is a long, complex and capital-intensive process.
The actual mining operations are preceded by significant exploration and development to evaluate the size of the deposit. The process is followed by the assessment of ways to extract and process the ores efficiently, safely and responsibly. Miners seek opportunities to grow their reserves and resources through targeted near-mine exploration and business development. They strive to upgrade and improve the quality of their existing assets internally and through acquisitions.
What's Shaping the Future of the Mining – Non Ferrous Industry?
Metal Price Swings Cloud Near-Term Outlook: Copper prices started 2026 on a strong note, supported by demand from electric vehicles (EVs), renewable energy projects, data center growth and grid modernization. Meanwhile, disruptions at major global mining operations fueled supply concerns, boosting prices to a high of roughly $6.40 per pound in late January. Prices were mostly volatile during February, largely trading near $6 per pound.
Concerns about the impact of surging oil prices on the global economy due to the war in the Middle East dragged down prices to a three-month low of around $5.3 per pound in late March. Prices rebounded in April on hopes of a de-escalation in the Iran war. Copper hit a record high of $6.60 per pound earlier this week, as supply disruptions and booming AI-related infrastructure demand fueled a rally in the metal.
However, it has since eased toward $6.5 per pound as traders took profits while reassessing underlying supply and demand conditions. Gold prices have retreated from January 2026 record highs of $5,608.35 an ounce as persistent inflation, a stronger U.S. dollar and expectations of higher-for-longer interest rates weighed on investor sentiment. Gold is currently trading near $4,700 an ounce.
Silver, meanwhile, climbed toward $88 an ounce, reaching its highest level in two months and outperforming other precious metals as industrial demand prospects have improved. However, reduced expectations for Federal Reserve rate cuts limited further upside. Uranium futures were above $86.50 per pound, near their highest level in two months, on optimism surrounding long-term nuclear power demand.
Labor Shortage, High Costs Remain Worrisome: The industry has been facing a shortage of skilled workforce lately, which has hiked wages. Labor-related disputes can be damaging to production and revenues. Industry players are grappling with escalating production costs, including electricity, water and materials, as well as higher freight expenses and supply-chain issues.
Since the industry cannot control the prices of its products, it focuses on improving the sales volume, increasing the operating cash flow and lowering unit net cash costs. Industry participants are opting for alternate energy sources to minimize fuel-price volatility and secure supply. Miners are now committed to cost-reduction strategies and digital innovation to drive operating efficiencies.
Strong Demand to Support the Industry: The demand for non-ferrous metals is expected to remain high in the future, given their wide use in primary sectors, including transportation, electricity, construction, telecommunication, energy and information technology. The surging demand for electric vehicles and renewable energy is expected to be a significant growth driver for metals like copper and nickel in the years to come. The overhauling and upgrading of the nation’s infrastructure and promoting green policies per the U.S. Infrastructure Investment and Jobs Act will also require a huge amount of non-ferrous metals.
Zacks Industry Rank Indicates Bleak Prospects
The group’s Zacks Industry Rank, which is basically the average of the Zacks Rank of all the member stocks, indicates dull prospects for the near term. The Zacks Mining – Non Ferrous industry, a nine-stock group within the broader Zacks Basic Materials Sector, currently carries a Zacks Industry Rank #156, which places it in the bottom 36% of 243 Zacks industries. Our research shows that the top 50% of the Zacks-ranked industries outperform the bottom 50% by a factor of more than two to one.
Before we present a few stocks that you may want to consider for your portfolio, let us look at the industry’s recent stock-market performance and its valuation picture.
Industry Versus S&P 500 & Sector
The Zacks Mining- Non Ferrous Industry has outperformed its sector and the Zacks S&P 500 composite over the past 12 months. The stocks in this industry have collectively gained 93.9% in the past year compared with the Zacks Basic Materials sector’s rise of 49.6%. The S&P 500 has risen 31.2% in the said time frame.
Industry's Current Valuation
Based on the trailing 12-month EV/EBITDA ratio, a commonly used multiple for valuing Mining- Non Ferrous stocks, we see that the industry is currently trading at 14.92X compared with the S&P 500’s 18.59X. The Basic Materials sector’s trailing 12-month EV/EBITDA is 15.31X.
Over the past three years, the industry has traded as high as 17.79X and as low as 3.95X, the median being 9.24X.
3 Mining – Non Ferrous Stocks to Keep an Eye On
Southern Copper: The company has the largest copper reserve in the industry and operates world-class assets in investment-grade countries, such as Mexico and Peru. SCCO expects to produce 915,000 tons of copper in 2026. Southern Copper expected to take this up to roughly 1.6 million tons by 2035, implying a compound annual growth rate (CAGR) of approximately 5.3% from 2025 levels.
To support this growth plan, the company intends to invest more than $20.5 billion over the next decade, with the bulk of the capital allocated to projects in Peru. Key growth catalysts include the Tía María, Los Chancas and Michiquillay projects in Peru, along with El Pilar and El Arco in Mexico, all of which underpin SCCO’s long-term expansion pipeline. Given its constant commitment to increasing low-cost production and growth investments, SCCO is well-poised to continue delivering an enhanced performance.
The Zacks Consensus Estimate for the Phoenix, AZ-based company’s fiscal 2026 earnings indicates year-over-year growth of 33.4%. The estimate has moved up 6.4% over the past 60 days. The company has a trailing four-quarter earnings surprise of 9.1%, on average. SCCO has a long-term estimated earnings growth rate of 14.6% and currently carries a Zacks Rank #3 (Hold).
You can see the complete list of today’s Zacks #1 Rank (Strong Buy) stocks here.
Freeport-McMoRan: The company remains well-positioned for growth, supported by its high-quality copper assets, large reserve base and strong organic expansion opportunities in the United States. Its organic project pipeline contains the Bagdad expansion, Safford/Lone Star Expansions and the Kucing Liar project. FCX is also deploying the latest technologies and data analytics in its leaching processes across its North America and South America operations. Incremental copper production from these initiatives totaled 214 million pounds in 2025.
The company is targeting an annual run rate of 300-400 million pounds by 2026/2027 in North America and subsequently 800 mm pounds annually by 2030. In addition, FCX is leveraging automation, new technologies and analytics to enhance operating efficiencies while lowering costs and capital intensity across existing operations and future projects. The company commenced the phased ramp-up of the Grasberg Block Cave underground mine in March 2026, following the temporary suspension of operations following the September 2025 mud rush incident.
The Zacks Consensus Estimate for FCX’s earnings for fiscal 2026 indicates year-over-year growth of 44.6%. The estimate has moved up 0.4% over the past 60 days. FCX has a trailing four-quarter earnings surprise of 32.12%, on average. It has a long-term estimated earnings growth rate of 32.4%. The Phoenix, AZ-based company currently carries a Zacks Rank of 3.
Lundin Mining: The company recently acquired an additional 5% equity interest in SCM Minera Lumina Copper Chile, owner of the Caserones copper-molybdenum mine, along with a 30.9% interest in the Los Helados Project and a 0.62% net smelter return royalty on Los Helados from JX Advanced Metals Corp. and affiliates for a total consideration of $215 million. This acquisition increased LUNMF’s ownership in Caserones to 75%, adding annual attributable copper production of approximately 6,500-7,000 tons, while the 30.9% interest in the Los Helados Project strengthens the company's copper and gold Mineral Resource base and provides compelling long-term growth optionality, including potential synergies with the nearby Caserones operation.
With the completion of the sale of the Eagle mine to Talon Metals, it is now a copper-dominant mining company, with approximately 85% of quarterly revenues generated from copper. Results of the technical study for the Vicuña project, which comprises the Filo del Sol deposit and the Josemaria deposit, underscore its potential as a Tier 1 asset with peak annual copper production exceeding 500,000 tons and peak gold production exceeding 800,000 ounces per annum. It is expected to rank among the top five copper, gold and silver mines globally. A sanction decision is expected this year.
The Zacks Consensus Estimate for Vancouver, Canada-based LUNMF’s fiscal 2026 earnings indicates a year-over-year improvement of 51.3%. The estimate has moved up 15% over the past 60 days. It has a long-term estimated earnings growth rate of 17.8%. The company currently carries a Zacks Rank of 3.
Why Haven't You Looked at Zacks' Top Stocks?
Since 2000, our top stock-picking strategies have blown away the S&P's +7.7% average gain per year. Amazingly, they soared with average gains of +48.4%, +50.2% and +56.7% per year.
Today you can access their live picks without cost or obligation.
See Stocks Free >>
Media Contact
Zacks Investment Research
800-767-3771 ext. 9339
support@zacks.com
https://www.zacks.com
Past performance is no guarantee of future results. Inherent in any investment is the potential for loss. This material is being provided for informational purposes only and nothing herein constitutes investment, legal, accounting or tax advice, or a recommendation to buy, sell or hold a security. No recommendation or advice is being given as to whether any investment is suitable for a particular investor. It should not be assumed that any investments in securities, companies, sectors or markets identified and described were or will be profitable. All information is current as of the date of herein and is subject to change without notice. Any views or opinions expressed may not reflect those of the firm as a whole. Zacks Investment Research does not engage in investment banking, market making or asset management activities of any securities. These returns are from hypothetical portfolios consisting of stocks with Zacks Rank = 1 that were rebalanced monthly with zero transaction costs. These are not the returns of actual portfolios of stocks. The S&P 500 is an unmanaged index. Visit https://www.zacks.com/performance for information about the performance numbers displayed in this press release.
Want the latest recommendations from Zacks Investment Research? Today, you can download 7 Best Stocks for the Next 30 Days. Click to get this free report
Freeport-McMoRan Inc. (FCX) : Free Stock Analysis Report
Southern Copper Corporation (SCCO) : Free Stock Analysis Report
Lundin Mining Corp. (LUNMF) : Free Stock Analysis Report
This article originally published on Zacks Investment Research (zacks.com).
Toronto, Ontario–(Newsfile Corp. – May 15, 2026) – Eric Sprott announces that on May 14, 2026, 2176423 Ontario Ltd., a corporation which is beneficially owned by him, acquired 8,500,500 common shares (Shares) of Honey Badger Silver Inc. over the TSX Venture Exchange (representing approximately 5.5% of the outstanding shares on non-diluted basis) at an average price of $0.72 per share for aggregate consideration of $6,120,360.00.
Prior to the acquisition of Shares, Mr. Sprott beneficially owned 4,278,195 Shares and 3,333,333 Share purchase warrants (Warrants), representing approximately 2.7% of the outstanding Shares on a non-diluted basis and 4.8% of the outstanding Shares on a partially-diluted basis assuming exercise of such Warrants. In addition, Mr. Sprott beneficially owned 5,000,000 subscription receipts (Subscription Receipts) of Honey Badger Silver that were acquired on April 15, 2025 through a private placement. Each Subscription Receipt will automatically convert into one Unit of Honey Badger Silver if certain escrow release conditions are satisfied on or before June 15, 2026. (See Honey Badger Silver's press release dated April 15, 2026). Each Unit consists of one Share and one Warrant. As a result of the acquisition of Shares on May 14, 2026, Mr. Sprott now beneficially owns 12,778,695 Shares and 3,333,333 Warrants, representing approximately 8.2% of the outstanding Shares on a non-diluted basis and 10.1% of the outstanding Shares on a partially-diluted basis assuming exercise of such Warrants. The acquisition resulted in an increase in holdings to above 10% of the outstanding Shares and therefore, requires the filing of an early warning report.
Assuming the conversion of the Subscription Receipts, Mr. Sprott will own 17,778,695 Shares and 8,333,333 Warrants, representing approximately 7.8% of the outstanding Shares on a non-diluted basis and 11.1% of the outstanding Shares on a non-diluted basis.
The Shares were acquired for investment purposes. Mr. Sprott has a long-term view of the investment and may acquire additional securities including on the open market or through private acquisitions or sell the securities including on the open market or through private dispositions in the future depending on market conditions, reformulation of plans and/or other relevant factors.
Honey Badger Silver is located at 620-1111 Melville Street, Vancouver, BC, V6E 3V6. A copy of the early warning report with respect to the foregoing will appear on Honey Badger Silver's profile on SEDAR+ at www.sedarplus.ca and may also be obtained by calling Mr. Sprott's office at (416) 945-3294 (2176423 Ontario Ltd., 7 King Street East, Suite 1106, Toronto, ON M5C 3C5).
To view the source version of this press release, please visit https://www.newsfilecorp.com/release/297625
Toronto, Ontario–(Newsfile Corp. – May 14, 2026) – Mogotes Metals Inc. (TSXV: MOG) (FSE: OY4) (OTCQB: MOGMF) ("Mogotes", or the "Company") is pleased to announce partial laboratory assay results from diamond drillhole FS_DDH_016 at the Company's flagship Filo Sur project in Argentina, immediately along strike from BHP and Lundin Mining's Filo del Sol copper-gold-silver discovery¹.
Assays received for the first 194 m within the 464 m deep hole confirm a continuous zone starting from 108 m depth of near surface, high-grade copper-gold-silver-molybdenum mineralization within chalcopyrite – bornite – covellite bearing breccias, stockwork and dissemination within the altered porphyry matrix (Table 1). Mogotes geologists have noted strong parallels with the characteristics of mineralization in hole FS_DDH_016 and those reported from the nearby Filo del Sol deposit2.
Highlights
- 86 m at 0.7% Cu, 0.55 g/t Au, 2.7 g/t Ag & 169 ppm Mo from 108 m to 194 m down hole to end of assays received to date. (Table 1)
- Including 43 m at 1.1% Cu, 0.82 g/t Au, 4.0 g/t Ag & 281 ppm Mo from 111 m
- Reported interval ends in mineralization
- Assays for the remaining 270 m of the hole are pending.
- This interval also includes peak intercepts of:
- 10 m at 1.4% Cu, 1.2 g/t Au, 4.6 g/t Ag and 383 ppm Mo from 133 m.
- 5 m at 1.75% Cu, 1.1 g/t Au, 3.6 g/t Ag and 393 ppm Mo from 146 m.
- Core shows evidence of several stages of mineralization as is seen in the nearby Filo del Sol deposit (Figure 3): chalcopyrite – bornite with porphyry-stage potassic alteration (breccias, stockwork, dissemination and anhydrite megacryst pegmatite veins), interpreted hypogene epithermal enrichment with fine grained dark copper minerals including probable covellite/digenite as disseminated overgrowths on pyrite and distinctive fracture coatings and localized sulphide rich veins with enargite, as well as some evidence of supergene copper mineralization with localized fracture coat malachite, brochantite and probable chalcocite.
- Shallow high-grade copper, gold, silver and molybdenum mineralization: mineralization starts at 108 m down hole, and trenching results along strike at surface indicate that mineralization projects to surface beneath a thin scree cover that may also be concealing a larger mineralized target.
- Generally low levels of arsenic for the Vicuña district: Arsenic levels are typically low (median for this interval is 2 ppm As) within this mineralized interval with only specific narrow structures with elevated arsenic indicating the local presence of the copper-bearing epithermal mineral enargite.
- Larger mineral system at play: The newly identified "Albor" target is part of a 3.5 km long Mogotes (Meseta – Luz del Sol – Cumbre – Albor) Miocene age target trend aligned within the regional scale, transorogen, Macho Muerto Fault Zone. Observed multistage alteration and mineralization features in the drill core suggest association with a larger Cu-Au-Ag-Mo mineral system.
- "Albor" is the second copper-gold-silver-molybdenum discovery by Mogotes in its inaugural drilling season at Filo Sur (see Cruz del Sur press release) and is part of the large Luz del Sol target trend where drill results are pending for a number of holes drilled in the 2025-2026 exploration season.
Figure 1: Core from 125.75m (FS_DDH_016), 125-126m assays at 1.67% Cu, 1.62 g/t Au, 1.69 g/t Ag, 685 ppm Mo
To view an enhanced version of this graphic, please visit:https://images.newsfilecorp.com/files/10597/297424_bac167e3f45afbcc_002full.jpg
CEO Comment
Allen Sabet, President and CEO of Mogotes, commented:
"In our first fully funded drill season at Filo Sur we have now made two significant copper-gold-silver-molybdenum discoveries at Cruz del Sur and at the Albor target, where we have just scratched the surface of something we believe will be significant.
"This partial assay release from Albor is a first hole into a shallow and high-grade copper-gold-silver-molybdenum system, strategically located adjacent to the large Vicuña district deposits, where BHP and Lundin Mining are developing the Josemaria copper-gold porphyry and evaluating development options for the very large Filo del Sol deposit.
"As this style of mineralization has implications for the broader Vicuña district, we felt it prudent to release partial results for FS_DDH_016 as received. We continue to be humbled by the geological endowment of this very special part of the world and are grateful for the continued support of our patient shareholders. Stay tuned for more!"
Figure 2: Plan View of Drillhole FS_DDH_016 and Albor Target Zones
Albor target zones untested by drilling prior to this campaign.
To view an enhanced version of this graphic, please visit:https://images.newsfilecorp.com/files/10597/297424_bac167e3f45afbcc_003full.jpg
Figure 3: Core photographs of FS_DDH_016 up to 194 m
All intervals shown are down-hole depth. (A, B, E, and G) Pyrite + chalcopyrite + bornite ± covellite ± digenite in hydrothermal breccia matrix. (A) 113-114 m. (B) 119-120 m. (E) 157-158 m. (G) 187-188m. (C, F, and D) Pyrite + chalcopyrite + covellite/digenite veins. (C) 116-117 m. (F) 180-181 m. (D) 135-136 m.
To view an enhanced version of this graphic, please visit:https://images.newsfilecorp.com/files/10597/297424_bac167e3f45afbcc_004full.jpg
Next Steps on rest of Filo Sur drill campaign:
- Lab assays for the 194–464 m portion of FS_DDH_016 are expected by end of May 2026.
- The drill campaign has now formally ended, with both Chile and Argentina field camps demobilized.
- Efforts were made to drill as much as possible this season, using 4 rigs and drilling a total of 6207 metres, of which 2652 metres have been reported on including in this press release.
- 3681 metres of drilling will be reported on in the coming months.
- Chile drill holes started later in the season and will be reported later than the Argentina drill holes due to timing of drilling and laboratory assay timing.
Figure 4: Filo Sur Project Luz del Sol Trend
To view an enhanced version of this graphic, please visit:https://images.newsfilecorp.com/files/10597/297424_bac167e3f45afbcc_005full.jpg
To view an enhanced version of this graphic, please visit:https://images.newsfilecorp.com/files/10597/297424_bac167e3f45afbcc_007full.jpg
To view an enhanced version of this graphic, please visit:https://images.newsfilecorp.com/files/10597/297424_bac167e3f45afbcc_008full.jpg
To view an enhanced version of this graphic, please visit:https://images.newsfilecorp.com/files/10597/297424_bac167e3f45afbcc_009full.jpg
To view an enhanced version of this graphic, please visit:https://images.newsfilecorp.com/files/10597/297424_bac167e3f45afbcc_010full.jpg
To view an enhanced version of this graphic, please visit:https://images.newsfilecorp.com/files/10597/297424_bac167e3f45afbcc_011full.jpg
To view an enhanced version of this graphic, please visit:https://images.newsfilecorp.com/files/10597/297424_bac167e3f45afbcc_012full.jpg
Table 2: Location details of FS_DDH_016
| Hole number | Initial Azimuth | Initial Dip | Depth (m) | Grid | Easting | Northing |
| FS_DDH_016 | 245.4 | -69.8 | 464 | UTM zone 19S | 435711 | 6842226 |
References
1 May 4, 2025. News Release, Lundin Mining Announces Initial Mineral Resource at Filo del Sol Demonstrating One of the World's Largest Copper, Gold, and Silver Resources. Lundin Mining
2 Perelló, J., Sillitoe, R. H., Rossello, J., Forestier, J., Merino, G., & Charchaflié, D. (2023). Geology of porphyry Cu-Au and epithermal Cu-Au-Ag mineralization at Filo del Sol, Argentina-Chile: Extreme telescoping during Andean uplift. Economic Geology, 118(3), 611–654.
About Mogotes Metals Inc.
Mogotes Metals Inc. is a mineral exploration company focused on copper, gold, and silver in the prospective Vicuña district of Argentina and Chile. The Company's flagship Filo Sur project adjoins Lundin Mining's Filo del Sol — one of the world's largest copper-gold-silver discoveries¹ — and lies along the same N-S trending belt as the Filo del Sol–Aurora deposits and NGEx Minerals' Lunahuasi and Los Helados copper-gold deposits.
For further information, please contact:
Mogotes Metals Inc.Allen Sabet, President and Chief Executive OfficerPhone: (647) 846-3313Email: info@mogotesmetals.com
Follow Us
Twitter: https://x.com/mogotesmetals
Additional Information
The information contained in this news release was accurate at the time of dissemination but may be superseded by subsequent news release(s). The Company is under no obligation, nor does it intend to update or revise the forward-looking information, whether as a result of new information, future events or otherwise.
Qualified Persons
The scientific and technical disclosure for the Filo Sur project included in this news release have been reviewed and approved by Stephen Nano who is the Qualified Person as defined by NI 43-101. Mr. Nano is a Director and Technical Advisor of the Company and is not independent.
Note that the Qualified Person has not verified the information regarding adjacent properties such as Filo del Sol and that the information regarding the mineralization of the Filo del Sol project is not necessarily indicative of the mineralization on the Filo Sur project.
Mogotes applies industry-standard exploration sampling methodologies and techniques. All geochemical soil, stream, rock and drill samples are collected under the supervision of the company's geologists in accordance with industry practice. Geochemical assays are obtained and reported under a quality assurance and quality control (QA/QC) program. Samples from Argentina are dispatched bagged in raffia bags and packaged for shipment by a dedicated truck to the ALS laboratory in Mendoza, Argentina. Samples from Chile are dispatched bagged in raffia bags and delivered to the ALS laboratory in Copiapo, Chile. These facilities carried out sample preparation (PREP-31B) which includes crush to 70% less than 2 mm, riffle split off 1 kg, pulverize to 85% passing 75 microns. The prepared samples are sent to the ALS laboratory in Lima, Peru for gold and multi-element analysis. Gold (Au-ICP21) was analyzed by fire assay fusion with ICP-AES finish on a 30 g sample. Samples were also analyzed for a suite of 48 elements (ME-MS61) with four acid digestion and ICP-MS finish.
Assay results from drill core samples may be higher, lower or similar to results obtained from surface rock, channel, trench samples due to surficial oxidation and enrichment processes or due to natural geological grade variations in the primary mineralization.
Cautionary Note Regarding Forward-Looking Statements:
Neither TSX Venture Exchange nor its Regulation Services Provider (as that term is defined in the policies of the TSX Venture Exchange) accepts responsibility for the adequacy or accuracy of this release.
Certain statements made and information contained herein constitute "forward-looking information" and "forward-looking statements" within the meaning of applicable securities legislation (collectively, "forward-looking information"). The forward-looking information contained in this news release is based on information available to the Company as of the date of this news release. Except as required under applicable securities legislation, the Company does not intend, and does not assume any obligation, to update this forward-looking information. Generally, this forward-looking information can frequently, but not always, be identified by use of forward-looking terminology such as "plans", "expects" or "does not expect", "is expected", "budget", "scheduled", "estimates", "forecasts", "intends", "projects", "targets", "assumes", "strategy", "goals", "objectives", "potential", "possible", "anticipates" or "does not anticipate", or "believes", or variations of such words and phrases or statements that certain actions, events, conditions or results "will", "may", "could", "would", "should", "might" or "will be taken", "will occur" or "will be achieved" or the negative connotations thereof. All statements other than statements of historical fact may be forward-looking statements.
No assurance can be given that this information will prove to be correct and such forward-looking information included in this news release should not be relied upon. In particular, this press release contains forward-looking information pertaining to assumptions made in the interpretation of drill results, geology, grade, geochemistry, potential implications of geophysics interpretations, and continuity of mineral deposits; the assumption that any further assay results from the remaining approximately 270 m of drill hole FS_DDH_016, or from any other drill hole at the Filo Sur project, will return grades, widths or styles of mineralization comparable to the partial assay results from FS_DDH_016 reported in this news release; the assumption that visual estimates, core-logging observations and pXRF measurements referenced in this news release (including in the figure captions) will be confirmed by subsequent laboratory assays; the assumption that future drill holes at the Albor target or elsewhere on the Filo Sur project will encounter mineralization of similar grade, width, continuity or character to that reported herein; expectations regarding access and demand for equipment, skilled labour and services needed for exploration and development of mineral properties; and that activities will not be adversely disrupted or impeded by exploration, development, operating, regulatory, political, community, economic, environmental and/or health and safety risks. In addition, this news release may contain forward-looking statements or information pertaining to: potential exploration upside at the Filo Sur Project, including the extent and significance of the porphyry copper-gold system and the prospectivity of exploration targets; exploration plans and expenditures; the ability of the Company to conduct its field programs as planned; the success of future exploration activities; potential for resource expansion; ability to build shareholder value; expectations with regard to adding to its Mineral Reserves or Resources through exploration; ability to execute planned work programs; plans or ability to mobilize or add additional drill rigs; timing or anticipated results of laboratory results; government regulation of mining activities; environmental risks; unanticipated reclamation expenses; title disputes or claims; limitations on insurance coverage; and other risks and uncertainties. While the Company anticipates running an exploration program, it may encounter unexpected logistics, community, access, permitting, legal, environmental, drilling and other challenges, costs, or delays that could prevent the Company from completing the program on the expected timeline or at all. Any further drilling is dependent on pending results from this year's program and the Company securing additional funding. This program could be delayed or not be carried out at all.
Although the Company believes that the expectations reflected in such forward-looking statements and/or information are based on assumptions that are reasonable, undue reliance should not be placed on forward-looking statements since the Company can give no assurance that such expectations will prove to be correct. These statements involve known and unknown risks, uncertainties and other factors that may cause actual results or events to differ materially from those anticipated in such forward-looking statements, including the risks, uncertainties and other factors identified in the Company's periodic filings with Canadian securities regulators, available under the Company's SEDAR+ profile at www.sedarplus.ca, as well as among other things: general business, economic and mining industry conditions; foreign exchange rates; geological conditions; the supply and demand for commodities; that financing will be available if and when needed on reasonable terms and that the Company will not experience any material labour dispute, accident, or failure of plant or equipment; the stability and predictability of the political environments and legal and regulatory frameworks; the ability of the Company to obtain, maintain, renew and/or extend required permits, licences, authorizations and/or approvals from the appropriate regulatory authorities; that contractual counterparties perform as agreed; and the ability of the Company to continue to obtain qualified staff and equipment in a timely and cost-efficient manner to meet its needs. These factors are not, and should not be construed as being, exhaustive. Although the Company has attempted to identify important factors that would cause actual results to differ materially from those contained in forward-looking information, there may be other factors that cause results not to be as anticipated, estimated, or intended. There can be no assurance that such statements will prove to be accurate, as actual results and future events could differ materially from those anticipated in such statements. All of the forward-looking information contained in this document is qualified by these cautionary statements. Readers are cautioned not to place undue reliance on forward-looking information due to the inherent uncertainty thereof. Statements relating to "mineral resources" are deemed to be forward-looking information, as they involve the implied assessment, based on certain estimates and assumptions that the mineral resources described can be profitably produced in the future. Forward-looking information is provided for the purpose of providing information about management's current expectations and plans and allowing investors and others to get a better understanding of the Company's operating environment.
To view the source version of this press release, please visit https://www.newsfilecorp.com/release/297424
If you would like to receive our free newsletter via email, simply enter your email address below & click subscribe.
 Follow us on Twitter
 Become our facebook fan
CONNECT WITH US
Tweets
Tweet with hash tag #miningfeeds or @miningfeeds and your tweets will be displayed across this site.
MOST ACTIVE MINING STOCKS
Daily Gainers
 CMC Metals Ltd. CMC Metals Ltd. |
CMB.V | +900.00% |
 Eden Energy Ltd Eden Energy Ltd |
EDE.AX | +200.00% |
| GoviEx Uranium Inc. |
GXU.V | +42.86% |
| Eagle Nickel Ltd. |
ENL.AX | +41.67% |
| Citigold Corp. Limited |
CTO.AX | +33.33% |
| Mount Burgess Mining NL |
MTB.AX | +33.33% |
| Exalt Resources Limited |
ERD.AX | +31.94% |
| Casa Minerals Inc. |
CASA.V | +30.00% |
| Cariboo Rose Resources Ltd |
CRB.V | +28.57% |
| Belmont Resources Inc. |
BEA.V | +28.57% |