VANCOUVER, BC / ACCESSWIRE / September 28, 2021 / Strategic Metals Ltd. (TSXV:SMD) ("Strategic") reports that on September 27, 2021, CAVU Mining Corp. ("CAVU") announced excellent drill results from a new area of skarn mineralization at the Hopper copper-gold-silver project, located in southwestern Yukon. CAVU holds the Hopper project under option and can acquire a 70% interest in the project by incurring $5 million in exploration expenditures, paying Strategic $700,000 in cash, and issuing Strategic 500,000 CAVU shares, by March 31, 2025.
Highlights from the first three drill holes recently announced by CAVU were:
-
1.405% copper, 0.532 g/t gold and 11.7 g/t silver over 22.28 m in hole 1;
-
0.622% copper, 0.197 g/t gold and 4.2 g/t silver over 9.39 m in hole 2; and,
-
1.365% copper, 0.488 g/t gold and 9.6 g/t silver over 10.96 in hole 3.
Details concerning the drill results, locations of the holes and photos of the mineralized intervals appear on CAVU's website cavumining.com.
"Strategic congratulates CAVU on its discovery and anticipates that future drilling will result in more discoveries within this large skarn/porphyry complex," states Doug Eaton, CEO of Strategic. "CAVU's discovery spotlights the copper potential of southwestern Yukon, an area which hosts several mines, former mines and undeveloped copper deposits. Strategic owns a number of other promising copper-gold projects in this area and sees CAVU's success a potential stimulus for exploration throughout the district."
The Hopper project is located along the Ashihik road, 50 km from its junction with the Alaska Highway and 22 km north of the Ashihik hydroelectric dam. A system of 4 by 4 roads provides access to the main exploration areas. The project is comprised of 365 mineral claims encompassing a 74 sq. km. area. The Hopper project is situated within the Tradition Territory of the Champagne and Ashihik First Nation, which has an exploration benefits agreement with Strategic.
QP Statement
Roger Hulstein, P. Geo., is the qualified person for the Company as defined in the National Instrument 43-101 and has reviewed the technical information presented within the news release.
About Strategic Metals Ltd.
Strategic is a project generator with 11 royalty interests, 8 projects under option to others, and a portfolio of more than 100 wholly owned projects that are the product of over 50 years of focussed exploration and research by a team with a track record of major discoveries. Projects available for option, joint venture or sale include drill-confirmed prospects and drill-ready targets with high-grade surface showings and/or geochemical anomalies and geophysical features that resemble those at nearby deposits.
Strategic has a current cash position of $7.5 million and large shareholdings in a number of active mineral exploration companies including 40% of Broden Mining Ltd., 38.9% of GGL Resources Corp., 33.5% of Rockhaven Resources Ltd., 19.9% of Honey Badger Silver Inc., 19.2% of Precipitate Gold Corp. and 18.7% of Silver Range Resources Ltd. All of these companies are well funded and are engaged in promising exploration projects. Strategic also owns 21.9% of Terra CO2 Technologies Holdings Inc., a private Delaware corporation which recently completed a US$9.2 million financing to advance its environmentally-friendly, cost-effective alternative to Portland cement. The current value of Strategic's stock portfolio, excluding Broden Mining Ltd is approximately $21 million.
ON BEHALF OF THE BOARD
"W. Douglas Eaton"
President and Chief Executive Officer
For further information concerning Strategic or its various exploration projects please visit our website at www.strategicmetalsltd.com or contact:
Corporate Information
Strategic Metals Ltd.
W. Douglas Eaton
President and C.E.O.
Tel: (604) 688-2568
Investor Inquiries
Richard Drechsler
V.P. Communications
Tel: (604) 687-2522
NA Toll-Free: (888) 688-2522
rdrechsler@strategicmetalsltd.com
http://www.strategicmetalsltd.com
Neither the TSX Venture Exchange nor its Regulation Services Provider (as that term is defined in the policies of the TSX Venture Exchange) accepts responsibility for the adequacy or accuracy of this release.
This news release may contain forward looking statements based on assumptions and judgments of management regarding future events or results that may prove to be inaccurate as a result of exploration and other risk factors beyond its control, and actual results may differ materially from the expected results.
SOURCE: Strategic Metals Ltd.
View source version on accesswire.com:
https://www.accesswire.com/665721/Strategic-Metals-Receives-Drill-Results-from-Its-Hopper-Cu-Au-Ag-Project-Yukon
The proven Zacks Rank system focuses on earnings estimates and estimate revisions to find winning stocks. Nevertheless, we know that our readers all have their own perspectives, so we are always looking at the latest trends in value, growth, and momentum to find strong picks.
Looking at the history of these trends, perhaps none is more beloved than value investing. This strategy simply looks to identify companies that are being undervalued by the broader market. Value investors rely on traditional forms of analysis on key valuation metrics to find stocks that they believe are undervalued, leaving room for profits.
On top of the Zacks Rank, investors can also look at our innovative Style Scores system to find stocks with specific traits. For example, value investors will want to focus on the "Value" category. Stocks with high Zacks Ranks and "A" grades for Value will be some of the highest-quality value stocks on the market today.
One stock to keep an eye on is Teck Resources Ltd (TECK). TECK is currently holding a Zacks Rank of #2 (Buy) and a Value grade of A.
Investors should also recognize that TECK has a P/B ratio of 0.75. The P/B ratio is used to compare a stock's market value with its book value, which is defined as total assets minus total liabilities. This stock's P/B looks solid versus its industry's average P/B of 1.09. TECK's P/B has been as high as 0.84 and as low as 0.40, with a median of 0.67, over the past year.
Value investors also use the P/S ratio. The P/S ratio is is calculated as price divided by sales. Some people prefer this metric because sales are harder to manipulate on an income statement. This means it could be a truer performance indicator. TECK has a P/S ratio of 1.7. This compares to its industry's average P/S of 2.35.
Finally, our model also underscores that TECK has a P/CF ratio of 9.66. This data point considers a firm's operating cash flow and is frequently used to find companies that are undervalued when considering their solid cash outlook. TECK's current P/CF looks attractive when compared to its industry's average P/CF of 13.02. Within the past 12 months, TECK's P/CF has been as high as 26.17 and as low as -25.05, with a median of 10.06.
These are only a few of the key metrics included in Teck Resources Ltd's strong Value grade, but they help show that the stock is likely undervalued right now. When factoring in the strength of its earnings outlook, TECK looks like an impressive value stock at the moment.
Want the latest recommendations from Zacks Investment Research? Today, you can download 7 Best Stocks for the Next 30 Days. Click to get this free report
Teck Resources Ltd (TECK) : Free Stock Analysis Report
To read this article on Zacks.com click here.
VANCOUVER, BC / ACCESSWIRE / September 27, 2021 / Tinka Resources Limited ("Tinka" or the "Company") (TSXV:TK)(BVL:TK)(OTCQB:TKRFF) is pleased to announce an updated Mineral Resource estimate for its 100%-owned Ayawilca project in Peru. Mineral Resource estimates for two Ayawilca deposits (the "Zinc Zone" and "Tin Zone", respectively) have been updated as a result of nearly 12,000 metres of drilling completed in the past 18 months.
Key Highlights of the Updated Mineral Resource Estimates at Ayawilca:
-
Indicated Zinc Zone Mineral Resource of 19.0 million tonnes grading 7.2% zinc, 0.2% lead and 16.8 g/t silver containing :
-
3.0 billion pounds of zinc;
-
10.3 million ounces of silver; and
-
87 million pounds of lead.
-
-
Inferred Zinc Zone Mineral Resource of 47.9 million tonnes grading 5.4% zinc, 0.4% lead & 20.0 g/t silver containing :
-
5.7 billion pounds of zinc;
-
30.7 million ounces of silver; and
-
370 million pounds of lead.
-
-
Inferred Tin Mineral Resource of 8.4 million tonnes grading 1.0% tin, containing :
-
189 million pounds of tin.
-
The Tin Zone and Zinc Zone resources do not overlap, with the Tin Zone situated predominantly beneath the Zinc Zone. The Mineral Resources are reported above a net smelter return (NSR) cut-off value of US$55/tonne for the Zinc Zone and US$60/tonne for the Tin Zone, as estimated by SLR Consulting (Canada) Ltd (SLR). A plan view showing all estimated Mineral Resources at Ayawilca is presented in Figure 1, and Indicated and Inferred Zinc Zone Mineral Resources are presented in Figure 2.
Dr. Graham Carman, Tinka's President and CEO, stated: "We are very pleased to report an updated mineral resource estimation for the Ayawilca Zinc and Tin Zones. A major step forward is the large increase in Indicated Zinc Zone resources to 3.0 billion pounds of contained zinc (previously 1.8 billion pounds), a 68% increase. The Indicated Zinc Zone resource has remained at a high grade of 7.2% zinc (+ silver + lead), while the Indicated Mineral Resource category now constitutes 35% of the total zinc inventory (previously 24%) at Ayawilca. New drilling also added resources to Inferred Mineral Resources that effectively replaced those resources upgraded to the Indicated category, with contained zinc in the Inferred category increasing 1% to 5.7 billion pounds zinc compared to the 2018 estimate."
"In addition, the updated Tin Zone Mineral Resource is now at a substantially higher grade (1.0% Sn) compared to the previous resource (0.63% Sn) with the discovery of new high grade tin mineralization at South Ayawilca."
"Tinka has been growing the Ayawilca Mineral Resources consistently since 2015, and we have taken great strides positioning it as one of the largest and highest grade undeveloped zinc dominant deposits in the Americas. We look forward to completing and announcing results of an updated PEA for Ayawilca in the coming weeks. The Company's work programs are fully funded for the foreseeable future, with C$13 million in cash and no debt as at the end of June 2021."
Figure 1 – Ayawilca drill hole map highlighting updated Mineral Resource wireframes and 2019-2021 holes

Figure 2 -3D image of Ayawilca Zinc Zone resource wireframes and resource classification

Detail of Mineral Resource Estimates
The updated Mineral Resource estimates for the Ayawilca Zinc Zone and Ayawilca Tin Zone, with an effective date of August 30, 2021, were prepared by SLR Consulting (Canada) Limited (SLR). Estimated Mineral Resources prepared by SLR used drill results available to February 28, 2021. The Ayawilca deposit resource database includes 209 drill holes totalling 88,110 m of drilling. The Zinc Zone Mineral Resources are hosted as lenses and veins of semi-massive to massive sulphides (mostly sphalerite, pyrite, galena and pyrrhotite) and magnetite hosted by Pucará Group limestone of Mesozoic age beneath a flat-dipping sandstone 150 m to 200 m thick belonging to the Goyllar Group. The Zinc Zone and Tin Zone Mineral Resources are reported separately as they host different metals and are spatially separated. The Mineral Resource estimates conform to Canadian Institute of Mining, Metallurgy and Petroleum Definition Standards for Mineral Resources and Mineral Reserves dated May 10, 2014 (CIM 2014 definitions).
Indicated Mineral Resources are estimated to total 19.0 Mt at average grades of 7.15% Zn, 16.8 g/t Ag, and 0.21 % Pb and Inferred Mineral Resources are reported at 47.9 Mt at average grades of 5.36% Zn, 20.0 g/t Ag, and 0.35% Pb. Mineral Resources within the Zinc Zone are reported at a US$55/t NSR cut-off value – Table 1.
Table 1: Ayawilca Zinc Zone Mineral Resources as of August 30, 2021
Tinka Resources Limited – Ayawilca Property
|
Classification/ |
Tonnage |
NSR |
Grade |
Contained Metal |
||||||
|
(% Zn) |
(g/t Ag) |
(% Pb) |
(Mlb Zn) |
(Moz Ag) |
(Mlb Pb) |
|||||
|
Indicated |
||||||||||
|
West |
11.6 |
108 |
6.26 |
15.9 |
0.25 |
1,607 |
6.0 |
65 |
||
|
South |
7.3 |
145 |
8.56 |
18.3 |
0.13 |
1,383 |
4.3 |
22 |
||
|
Total Indicated |
19.0 |
123 |
7.15 |
16.8 |
0.21 |
2,990 |
10.3 |
87 |
||
|
Inferred |
||||||||||
|
West |
5.5 |
106 |
5.90 |
20.8 |
0.42 |
719 |
3.7 |
52 |
||
|
South |
9.0 |
134 |
7.45 |
34.4 |
0.33 |
1,477 |
10.0 |
65 |
||
|
Central |
17.4 |
81 |
4.55 |
13.8 |
0.34 |
1,747 |
7.7 |
132 |
||
|
East |
10.6 |
88 |
5.04 |
14.4 |
0.20 |
1,177 |
4.9 |
46 |
||
|
Silver |
0.4 |
93 |
3.58 |
106.7 |
0.65 |
33 |
1.4 |
6 |
||
|
Buffer |
4.9 |
87 |
4.66 |
19.2 |
0.63 |
504 |
3.0 |
69 |
||
|
Total Inferred |
47.9 |
96 |
5.36 |
20.0 |
0.35 |
5,657 |
30.7 |
370 |
||
Notes:
-
CIM (2014) definitions were followed for Mineral Resources.
-
Mineral Resources are reported above a cut-off net smelter return (NSR) value of US$55/t.
-
The requirement of a reasonable prospect of eventual economic extraction is met by having a minimum modelling width for mineralized zones of three metres, a cut-off based on reasonable input parameters, and continuity of mineralization consistent with a potential underground mining scenario.
-
The NSR value was based on estimated metallurgical recoveries, assumed metal prices, and smelter terms, which include payable factors, treatment charges, penalties, and refining charges. Metal price assumptions were, US$1.20/lb Zn, US$22/oz Ag, and US$0.95/lb Pb. Metal recovery assumptions were, 92% Zn, 85% Ag, and 70% Pb. The NSR value for each block was calculated using the following NSR factors; US$16.23/% Zn, US$0.27/g Ag, and US$10.20/% Pb.
-
Payability is as follows; Zn 84%, Pb 94% and Ag 47%
-
The NSR value was calculated using the following formula:
NSR = Zn(%)*US$16.23+Ag(g/t)*US$0.27+Pb(%)*US$10.20 -
Numbers may not add due to rounding.
Indium was previously included in the Zinc Zone resource estimation but is no longer reported.
The Tin Zone Mineral Resources are hosted as disseminated cassiterite in massive to semi-massive pyrrhotite lenses typically (but not always) near the contact between the Pucara Group and underlying phyllite of the Devonian Excelsior Group.
Inferred Mineral Resources within the Tin Zone, reported at an NSR cut-off value of $60/t, are estimated to total 8.4 million tonnes at average grades of 1.02% Sn. Two different NSR factors for tin were used to estimate the Tin Zone resource depending on the ratio of Sn:Cu – a higher NSR was applied to mineralization with a higher Sn:Cu ratio. See Table 2.
Table 2: Ayawilca Tin Zone Inferred Mineral Resources as of August 30, 2021
Tinka Resources Limited – Ayawilca Property
|
Classification |
Tonnage |
NSR |
Grade |
Contained Metal |
|
Inferred |
8.4 |
103 |
1.02 |
189 |
Notes:
-
CIM (2014) definitions were followed for Mineral Resources.
-
Mineral Resources are reported above a cut-off grade NSR value of US$60/t.
-
The requirement of a reasonable prospect of eventual economic extraction is met by having a minimum modelling width for mineralized zones of three metres, a cut-off based on reasonable input parameters, and continuity of mineralization consistent with a potential underground mining scenario.
-
The NSR value was based on estimated metallurgical recoveries, assumed metal prices, and smelter terms, which include payable factors, treatment charges, penalties, and refining charges. Metal price assumptions were, US$11.00/lb Sn. Metal recovery assumptions were, 70% Sn for blocks with Sn:Cu ≥ 5 and 40% for Sn:Cu < 5. The NSR value for each block was calculated using the following NSR factors, US$141.64 per % Sn for blocks with Sn:Cu ≥ 5 and US$80.94 for blocks with Sn:Cu <5.
-
The NSR value was calculated using the following formulae:
If Sn:Cu ≥ 5: US$NSR = Sn(%)*US$141.64 -
If Sn:Cu < 5: US$NSR = Sn(%)*US$80.94
-
Numbers may not add due to rounding.
Copper and silver were reported in the Tin Zone previously but are no longer reported because they are not expected to contribute materially to the economics of the project.
Depending on the deposit area, high grade tin and silver values were capped to 4% Sn and 100 g/t Ag to 175 g/t Ag. Assays within the wireframe domains were composited to two metre lengths. Block model grades within the wireframe models were interpolated by the inverse distance cubed (ID 3 ) method. While lead grades are low, it is assumed that lead and silver will be recovered in a lead concentrate. Density was estimated to be 3.5 t/m 3 and 3.7 t/m 3 for the Ayawilca Zinc Zone and 3.9 t/m 3 for the Ayawilca Tin Zone based on density measurements of typical mineralization from each zone. The Buffer Zone area outside the resource wireframes was assigned a density value of 3.5 t/m 3 . The Mineral Resources were assigned Indicated and Inferred category in the Ayawilca Zinc Zone and Inferred only in the Ayawilca Tin Zone due to the widely spaced drilling. The drill hole spacing within the area assigned as Indicated category commonly ranges from 40 m to 70 m. No Mineral Reserves have yet been estimated at Ayawilca.
The Mineral Resource estimate for the Colquipucro silver oxide deposit (also referred to as "Colqui"), located 1.5 km from the Ayawilca deposit, remains unchanged since the 2016 effective date and is presented in Table 3.
Table 3: Colquipucro Silver Oxide Deposit Mineral Resources as of May 25, 2016
Tinka Resources Limited – Ayawilca Property
|
Classification/Zone |
Tonnage |
Grade |
Contained Metal |
|
Indicated |
|||
|
High Grade Lenses |
2.9 |
112 |
10.4 |
|
Low Grade Halo |
4.5 |
27 |
3.9 |
|
Total Indicated |
7.4 |
60 |
14.3 |
|
Inferred |
|||
|
High Grade Lenses |
2.2 |
105 |
7.5 |
|
Low Grade Halo |
6.2 |
28 |
5.7 |
|
Total Inferred |
8.5 |
48 |
13.2 |
Notes:
-
CIM (2014) definitions were followed for Mineral Resources.
-
Mineral Resources are reported within a preliminary pit shell and above a cut-off grade of 15 g/t Ag for the low grade halo and 60 g/t Ag for the high grade lenses.
-
The cut-off grade is based on a price of US$24/oz Ag.
-
Numbers may not add due to rounding.
Discussion and Analysis
A comparison of the 2021 and 2018 Zinc Zone resources at US$55/t cut off is highlighted graphically in Figure 3. The increase in Indicated Resources in the 2021 resource estimation is due to discovery of new mineralization as well as a significant increase in the understanding of the litho-structural setting, following the completion of 11,633 metres of diamond drilling between 2019 to 2021.
Figure 3 – Ayawilca Zinc Zone deposit classification model
 |
 |
The geological model and wireframes for the updated model were produced in-house by Tinka. SLR refined the resource domains to align with the stratigraphy and limited their extent to the Pucará and Lower and Mid-Goyllar Formations. Similarly, the domains were constrained by the faults that are known to limit the mineralization. The new geological model, improved mineralization domains, as well as the new infill drilling led to an increase in resources assigned to the Indicated category. SLR constructed a buffer zone to allow interpolation in a limited area of 50 m surrounding the mineralization wireframe models. The Buffer Zone captures local high grade mineralization, in particular post-main stage zinc mineralization for which controls are not yet well constrained, and is highlighted in Figure 3. A generalized layout of the Zinc Zones at South Ayawilca is shown in Figure 4.
Increased average grades of lead and silver in the Ayawilca Zinc Zone resource are due to the inclusion of new resource areas higher in lead and silver (i.e., silver rich domains in the South Area) but low in zinc. These new areas are now included in the resource estimate due to higher NSR factors for both lead and zinc. The removal of indium from the 2018 NSR value calculation for the Ayawilca Zinc Zone has slightly improved the average zinc grade by narrowing the resource wireframes to better represent the zinc mineralization. In addition, although the NSR cut-off value is the same as in 2018 (US$55/t), the NSR factors for each metal used to calculate the value of a block have all increased.
While the mineralization domains were expanded for the Ayawilca Tin Zone in the current estimation, there was nevertheless a decrease in tonnage from the 2018 resource estimation. The decrease in tonnage was accompanied by a significant increase in tin grade. The increase in average tin grade is due to several factors including:
-
The discovery of new high grade tin mineralization in 2020 and 2021;
-
A higher effective NSR cut-off value applied to the Mineral Resource (US$60/t);
-
The removal of copper and silver mineralization from NSR value; and
-
A decrease in the tin factor in the NSR value calculation.
A National Instrument 43-101 Technical Report will be filed on SEDAR within 45 days.
Figure 4 – 3D view of Ayawilca Zinc Zone wireframes

Figure 5 – Generalized E-W cross section of Zinc Zones at South Ayawilca

Qualified Person – Mineral Resources: The Mineral Resources disclosed in this press release have been estimated by Ms. Dorota El Rassi, P.Eng., SLR Consultant Engineer and Ms. Katharine M. Masun, MSA, M.Sc., P.Geo., SLR Consultant Geologist, both independent of Tinka. By virtue of their education and relevant experience, Ms. El Rassi and Ms. Masun are "Qualified Persons" for the purpose of National Instrument 43-101. The Mineral Resources have been classified in accordance with CIM Definition Standards for Mineral Resources and Mineral Reserves (May, 2014). Ms. El Rassi and Ms. Masun have read and approved the contents of this press release as it pertains to the disclosed Mineral Resource estimates.
The Qualified Person, Dr. Graham Carman, Tinka's President and CEO, and a Fellow of the Australasian Institute of Mining and Metallurgy, has reviewed and verified the technical contents of this release.
Disclaimer: As a result of the new resource estimation, the Company's previously disclosed preliminary economic assessment on the Ayawilca project is no longer current and should not be relied on. The Company has commissioned an updated PEA on the Ayawilca project based on the new resource estimate and upon receipt of the updated PEA (expected in approximately 2 weeks), the Company intends to issue a news release disclosing the results of the PEA.
|
On behalf of the Board, "Graham Carman" |
Further Information: |
About Tinka Resources Limited
Tinka is an exploration and development company with its flagship property being the 100%-owned Ayawilca zinc-silver-tin project in central Peru. The Zinc Zone deposit has an estimated Indicated Mineral Resource of 19.0 Mt grading 7.15% Zn, 16.8 g/t Ag & 0.2% Pb and an Inferred mineral resource of 47.9 Mt grading 5.4% Zn, 20.0 g/t Ag & 0.4% Pb (dated August 30, 2021). The Ayawilca Tin Zone has an estimated Inferred mineral resource of 8.4 Mt grading 1.02% Sn (dated August 30, 2021). Tinka also owns and is actively exploring early stage copper-gold skarn mineral systems within its highly prospective land package in central Peru.
Forward Looking Statements: Certain information in this news release contains forward-looking statements and forward-looking information within the meaning of applicable securities laws (collectively "forward-looking statements"). All statements, other than statements of historical fact are forward-looking statements. Forward-looking statements are based on the beliefs and expectations of Tinka as well as assumptions made by and information currently available to Tinka's management. Such statements reflect the current risks, uncertainties and assumptions related to certain factors including, without limitations: timing of planned work programs and results varying from expectations; delay in obtaining results; changes in equity markets; uncertainties relating to the availability and costs of financing needed in the future; equipment failure, unexpected geological conditions; imprecision in resource estimates or metal recoveries; success of future development initiatives; competition and operating performance; environmental and safety risks; the Company's expectations regarding the Ayawilca Project PEA; the political environment in which the Company operates continuing to support the development and operation of mining projects; risks related to negative publicity with respect to the Company or the mining industry in general; the threat associated with outbreaks of viruses and infectious diseases, including the novel COVID-19 virus; delays in obtaining or failure to obtain necessary permits and approvals from local authorities; community agreements and relations; and, other development and operating risks. Should any one or more of these risks or uncertainties materialize, or should any underlying assumptions prove incorrect, actual results may vary materially from those described herein. Although Tinka believes that assumptions inherent in the forward-looking statements are reasonable, forward-looking statements are not guarantees of future performance and accordingly undue reliance should not be put on such statements due to the inherent uncertainty therein. Except as may be required by applicable securities laws, Tinka disclaims any intent or obligation to update any forward-looking statement.
Neither the TSX Venture Exchange nor its Regulation Services Provider (as that term is defined in the policies of the TSX Venture Exchange) accepts responsibility for the adequacy or accuracy of this news release
SOURCE: Tinka Resources Limited
View source version on accesswire.com:
https://www.accesswire.com/665504/Tinka-Increases-Indicated-Zinc-Resources-at-Ayawilca-by-68
These are the top dividend stocks in the Russell 1000 with the highest forward dividend yield for October.
Vancouver, British Columbia and Val-d'Or, Quebec–(Newsfile Corp. – September 27, 2021) – Gold Royalty Corp. (NYSE American: GROY) ("Gold Royalty" or the "Company"), Abitibi Royalties Inc. (TSXV: RZZ) (OTCQX: ATBYF) ("Abitibi Royalties") and Golden Valley Mines and Royalties Ltd. (TSXV: GZZ) (OTCQX: GLVMF) ("Golden Valley") are pleased to announce an update on certain royalties that will form part of the new Gold Royalty upon closing of the transactions announced on September 7, 2021. This news release highlights the internal growth that exists across the new Gold Royalty's cash flowing, development and exploration stage royalties for selected key assets. Going forward, the Company expects to issue royalty and asset updates to shareholders quarterly.
Update on Cash Flowing Royalties
In addition to cash generated from the new Gold Royalty's Project and Royalty Generator Model and marketable securities, the Company will have six royalty interests on five producing mines, which include portions of the Canadian Malartic open pit, Jerritt Canyon (two royalties), Isabella Pearl, Marigold and the Rawhide Mine.
Jerritt Canyon Mine – Nevada (0.50% Net Smelter Return Royalty "NSR" & Per Ton Royalty)
New Owner, Excess Plant Capacity, 25 High Priority Exploration Targets Being Drilled
The Jerritt Canyon Mine has been in production since 1981 having produced over 9.5 million ounces of gold during its 40-year production history, with peak annual production having exceeded 450,000 gold ounces. In 2020, Jerritt Canyon produced 112,749 ounces of gold at a cash cost of US$1,289 per ounce according to First Majestic Silver Corp. ("First Majestic"). The 119 square mile land package at Jerritt Canyon holds significant exploration potential, but has been starved of capital for nearly 20 years under various owners. Gold Royalty believes that First Majestic, which acquired the mine in April 2021, possesses the experience and resources to transform the mine once again into a significant gold producer.
First Majestic purchased Jerritt Canyon for share consideration totaling US$470 million and 5 million share purchase warrants on April 30, 2021. On August 16, 2021, First Majestic announced that during May and June of 2021 (62 days) Jerritt Canyon produced 18,762 ounces of gold and processed 146,611 tons of ore. There remains significant opportunity to increase the mining and processing rates at the mine under First Majestic's ownership as the processing plant on average is operating at approximately 2,200 tpd which is approximately 50% of its designed capacity.
Recent drilling announced by First Majestic on July 13, 2021 successfully intersected 1.65 grams per tonne ("gpt") gold over 76.2 metres, including 4.63 gpt gold over 7.6 metres at the Waterpipe II area. First Majestic reports that this area of the property is developing into a target with open pit potential. Over the next 6 to 12 months, First Majestic has planned an aggressive exploration program to follow-up and test more than 25 near-mine and greenfield targets. At the end of the second quarter of 2021, five drill rigs were operating at Jerritt Canyon.
The combination of First Majestic's ownership, excess processing capacity and the mine's exploration potential, should continue to benefit the new Gold Royalty for many years to come.
Isabella Pearl Mine – Nevada (0.375% – 3.0% NSR)
Currently One of the Word's Lowest Cost Mines – Exploration Key Driver
Gold Royalty holds a 0.375% NSR on the operating portion of the Isabella Pearl Mine located in Nevada. Isabella Pearl is operated by Fortitude Gold Corp. ("Fortitude"). During the second quarter of 2021, the Isabella Pearl Mine produced 14,579 ounces of gold at an all-in sustaining cost of US$628 per ounce, making it one of the world's lowest cost gold producers during the quarter.
Near mine exploration drill results (650 metres north-west of Isabella Pearl) released on August 24, 2021 by Fortitude from the Scarlet (2.5% NSR) area returned substantial widths and gold grades that intercepted oxide mineralization with potential to be processed at Fortitude's Isabella Pearl heap leach pad and gold process plant. Drill highlights include 1.57 gpt gold over 19.81 metres, 1.56 gpt gold over 19.81 metres, 2.23 gpt gold over 16.76 metres and 1.60 gpt gold over 24.38 metres. The drill program at Scarlet was designed to further define the lower oxide-sulfide boundary, as well as test the margins of the known mineralization. Scarlet remains a high priority target for additional delineation drilling.
Gold Royalty holds additional royalties on key exploration areas near the Isabella Pearl Mine and operated by Fortitude, which includes a 2.5% NSR on County Line, 2.0 – 3.0% NSR at Mina Gold and 2.0% NSR on certain claims at Camp Douglas, potentially extending Gold Royalty's cash flows from Isabella Pearl well into the future.
Royalties Under Development
The new Gold Royalty will have seven royalty interests on six projects that are currently under development and represent potential additional near to medium term increases in cash flow. These include the Odyssey project (Canadian Malartic), Ren Project (Carlin Complex; two royalties), Gold Rock (Pan Mine), Beaufor Mine, Beacon Mill and Lincoln Hill (Rochester Mine).
Canadian Malartic – Odyssey Project – Quebec (3.0% NSR)
Cornerstone Royalty Continues to Advance with Ramp & Shaft Construction
During the second quarter of 2021, underground development of the ramp at Odyssey continued. Approximately 402 linear metres of ramp development has been completed, which is ahead of schedule and at a lower development unit cost than anticipated. The ramp is designed to support mining the upper zones of the Odyssey Project and provide further underground exploration access.
On July 27, 2021, it was announced that the excavation of the shaft collar and the concrete lining of the first 27 metres were completed. The headframe foundations are in progress and headframe construction is expected to start in the fourth quarter of 2021. All of the mechanical and electrical purchase orders for the sinking hoist and auxiliary hoist have been issued. Both hoists are expected to be delivered and installed by the fourth quarter of 2022. All surface construction activities are on target and shaft sinking is expected to resume in the second half of 2022 once the headframe construction and hoists installations are completed.
On July 8, 2021, Agnico Eagle Mines Limited ("Agnico") announced an update on the Odyssey exploration drilling, which included two drill holes from the Chert Zone which was historically part of the East Malartic Mine. The drill holes included 7.0 gpt gold over 77.9 metres and 6.1 gpt gold over 28.2 metres at a depth of approximately 900 metres below surface. Both holes are reported as core length, with the true thickness currently unknown. The results in the Chert Zone suggest the potential to add additional mineral resource between the East Malartic and East Gouldie deposits. Also, as reported by Abitibi Royalties, regional exploration at the Radium-Nord property (15% net profit interest) has returned significant gold values from the Radium gold zone and confirmed the modelled geometry. The Radium-Nord property is immediately adjacent to the west side of the Canadian Malartic open pit and south of the East Amphi deposit and represents an underexplored part of the property.
In addition, the Canadian Malartic Mine is budgeting approximately US$4 million to test for possible extensions of the East Gouldie Zone. The East Gouldie mineralization remains open for expansion, especially at depth to the east. Exploration drilling suggests that East Gouldie may potentially trend onto the Company's 3.0% NSR at depth.
The operators, Agnico and Yamana Gold Inc., also announced that the first underground exploration drill bay was completed in the second quarter of 2021 and underground drilling started on July 7, 2021. The underground drill program will aim to define and validate the upper levels of the Odyssey South Zone and to better understand the local geology of the Internal Zones at Odyssey.
Beaufor Mine & Beacon Mill – Quebec (1.0% NSR & Per Tonne Royalty, respectively)
Production Targeted for 2022 – Significant Increase in Gold Resources
Monarch Mining Corporation ("Monarch") is currently advancing the Beaufor Mine and the Beacon Mill for restart of production by June 2022. Both Beaufor and the Beacon Mill are located near Val-d'Or Quebec. The Beaufor Mine produced 1,169,000 gold ounces between 1930 – 2019. Monarch is currently recruiting the required personnel in preparation for the reopening of operations and investing C$12.5 million into exploration and development. The Beacon Mill has a nameplate capacity of 750 tonnes per day and is currently being refurbished at an approximate cost of C$5 million.
On July 28, 2021, Monarch announced an updated Mineral Resource Estimate for the Beaufor Mine. Beaufor now has an estimated Measured Mineral Resource of 328,500 tonnes grading 5.7 gpt gold for a total of 59,900 ounces of gold and an estimated Indicated Mineral Resource of 956,400 tonnes grading 5.2 gpt gold for a total of 159,300 ounces of gold, which equates to a 136% increase as compared to the prior Mineral Resource estimate. In addition, Inferred Resources are estimated at 818,900 tonnes at 4.7 gpt gold for a total of 122,500 gold ounces; a 307% increase versus the prior Mineral Resource estimate.
Monarch is currently undertaking a 42,500 metre diamond drill program at Beaufor. A total of 24,500 metres of this planned drilling is not included in the update Mineral Resource estimate above.
Feasibility/PEA Stage Royalties
The new Gold Royalty will have royalty interests on nine projects currently in the Feasibility/PEA Stage of development, which includes Fenelon, Hog Ranch, Railroad-Pinion, Cheechoo, Sao Jorge, Yellowknife, La Mina, Sleeper and Mt. Hamilton. These projects represent potential medium to long term additions to the new Gold Royalty's cash flows.
Fenelon – Quebec (2.0% NSR)
Advancing One of Canada's Most Exciting Gold Discoveries
The Fenelon Gold Property is currently subject to one of the largest exploration programs in Canada by Wallbridge Mining Company Limited ("Wallbridge"). A total of 170,000 metres of drilling and 4,800 metres of underground exploration development (Phase 1 of a 10,000 metre two-year program) at an approximate cost of C$75 million is being completed in 2021, which was announced on January 11, 2021.
On September 15, 2021, Wallbridge issued an exploration update for the Fenelon Gold Property, where drilling successfully expanded the gold mineralization with high-grade intersections at both the eastern and northwestern edges of the area tested by the current resource drilling. In the northwest, exploration drilling successfully expanded the footprint of Area 51, with near surface intersections including 11.60 gpt gold over 14.05 metres. In the east, exploration drilling to follow-up the discovery hole of the Gabbro Zones, East Extension (17.79 gpt gold over 16.60 metres, Wallbridge news release April 29, 2021), confirmed the presence of strong gold mineralization, with the first follow-up hole returning 9.00 gpt gold over 10.00 metres. Assays for the remaining three holes drilled to the east are pending.
Wallbridge has stated that the company expects to announce the inaugural mineral resource statement for the Fenelon Gold Property by the end of October, 2021. Following the expected publication of the mineral resource estimate and associated economic studies, Wallbridge is planning to submit permitting applications, supported by an updated project description and environmental and social impact assessment ("ESIA").
Hog Ranch – Nevada (2.25% NSR)
New Gold Discovery Points to Resource Expansion Potential
The Hog Ranch Property, which was previously in production from 1985 – 1992, is located in north-west Nevada and is owned by Rex Minerals Ltd. ("Rex") based in Australia. Hog Ranch has a reported Indicated and Inferred Mineral Resource of 165 Mt grading 0.43 gpt gold for 2.26 million ounces of gold (JORC Code) with an accompanying preliminary economic assessment ("PEA") that was completed in June 2020.
On April 22, 2021, Rex announced that exploration drilling had resumed at Hog Ranch and was designed to test both new mineral targets and also extend known gold zones that remain open for expansion. On July 26, 2021, Rex issued a news release highlighting a new gold discovery at the Airport area of the Hog Ranch Property that intersected 0.64 gpt gold over 114 metres, including a higher-grade zone that returned 1.4 gpt gold over 36.6 metres. Rex has stated that this gold mineralization is likely to extend along strike and up and down dip; the full extent of which will require additional drilling to confirm.
On August 27, 2021, Rex announced further drill results from the Airport area of Hog Ranch. Drill highlights included 2.12 gpt gold over 56.4 metres. Rex stated that the findings from the drilling point to further large-scale gold mineralization at the Airport structure and provides solid evidence that the Airport area can grow to become another significant gold deposit at Hog Ranch.
Further information regarding the above resource estimate and scoping study for the Hog Ranch Property is set out in Rex's announcement dated July 1, 2020.
Cheechoo – Quebec (2.25-4.0% NSR)
Updated Resource Estimate & Initial PEA Study Set for 2022
The Cheechoo Project, located near Newmont's Eleonore Mine in Quebec, contains an Inferred Resource of 1,955,000 ounces of gold (93.0 million tonnes grading 0.65 gpt gold) and is owned by Sirios Resources Inc. ("Sirios"). Sirios is taking a number of steps in order to advance the project including 1) Resource expansion, definition and regional drilling, 2) Reanalysis of gold grades with more representative sample sizes with the goal of increasing the overall grade, 3) Conducting metallurgical test work to determine the optimum recovery method, 4) Updated resource estimate and 5) Publish the results of a PEA that is scheduled to be completed in 2022.
Although at an earlier stage, Sirios envisions Cheechoo becoming a bulk tonnage heap leach mine similar to comparable operations such as Victoria Gold Corp.'s Eagle Mine (Yukon) and Kinross Corporation's Fort Knox Mine (Alaska).
Further information regarding the above Cheechoo Project resource estimate is set out in the technical report titled "Mineral Resource Estimate Update for the Cheechoo Project" with an effective date of October 31, 2020, prepared for Sirios and available under its profile at www.sedar.com.
Project and Royalty Generator Model
As part of the new Gold Royalty's strategy to expand its royalty holdings through organic growth, the Company will continue to execute on the successful project generator model's established by Ely Gold Royalties Inc., Abitibi Royalties and Golden Valley. The model calls for staking, selling or optioning mineral projects while retaining a royalty. The initiative is designed to generate a competitive return on capital, expand the Company's royalty holdings, while deploying a limited amount of working capital.
Tonopah West – Nevada (3.0% NSR)
Blackrock Silver Drills Multiple High-Grade Silver Intercepts
On September 1, 2021, Blackrock Silver Corp. ("Blackrock") announced new high-grade silver and gold drill intercepts from its core and RC drilling program on the 100% controlled Tonopah West project located in the Walker Lane trend of western Nevada. These new results continue to demonstrate robust continuity of high-grade mineralization at both the DPB and Victor targets; additional in-fill drill results highlight the potential for this deposit as Blackrock works towards delivery of a maiden resource estimate. In addition to the 3.0% NSR, Gold Royalty is entitled to option payments from Blackrock totaling US$2,350,000 over the next 30 months.
Rodeo Creek – Nevada (2.0% NSR)
Nevada Gold Mines (Barrick & Newmont) To Assume Control
On September 7, 2021, i-80 Gold Corp. announced that it had exercised its option to acquire the Rodeo Creek exploration property to Nevada Gold Mines LLC ("NGM"), which is jointly owned by Barrick Gold Corporation and Newmont Corporation. The Rodeo Creek property is located approximately 6 kilometres north-east of Gold Royalty's Ren property (also operated by NGM) and further consolidates the north Carlin Trend area. The Rodeo Creek property is currently being optioned from Gold Royalty, where the Company is entitled to US$125,000 in remaining option payments in November 2021 and November 2022.
Centremaque Property – Quebec (1.5% NSR & 20% Free-Carried Interest)
Conversion to Royalty Interest
On September 13, 2021, Golden Valley announced that it has been informed by O3 Mining Inc. ("O3"), that it is exercising its option to acquire 80% interest in the Centremaque property pursuant to the terms of the option agreement dated April 20, 2017. In order to reach the minimum amount of expenditures set out in the option agreement, O3 will issue shares to Golden Valley equal to C$209,260.
Golden Valley will have a 20% free-carried interest in Centremaque, such that Golden Valley will not be responsible for any project costs, including without limitation, construction costs, exploration costs, mine costs and operating costs, until the commencement of commercial production. In addition, Golden Valley retains a 1.5% NSR, of which a 0.5% may be purchased for C$1,000,000.
QUALIFIED PERSONS
Mr. Alastair Still, P.Geo., Director of Technical Services of Gold Royalty, is a Qualfied Person (as defined in National Instrument 43-101 – Standards of Disclosure for Mineral Projects) who has reviewed this news release as it pertains to the royalties and other interests held by Gold Royalty based solely on the public disclosure of the various owners and operators of the underlying projects and without independent verification.
Mr. Glenn Mullan, Chairman of Abitibi Royalties and President/CEO of Golden Valley, is a Qualified Person (as defined in National Instrument 43-101 – Standards of Disclosure for Mineral Projects) who has reviewed this news release as it pertains to the royalties and other interests owned by each of Abitibi Royalties and Golden Valley based solely on the public disclosure by the various owners and operators of the underlying projects and without independent verification.
About Gold Royalty Corp.
Gold Royalty Corp. is a gold-focused royalty company offering creative financing solutions to the metals and mining industry. Its mission is to acquire royalties, streams and similar interests at varying stages of the mine life cycle to build a balances portfolio offering near, medium and longer-term attractive returns for its investors. Gold Royalty's diversified portfolio currently consists primarily of net smelter return royalties on gold properties located in the Americas.
About Abitibi Royalties Inc.
Abitibi Royalties Inc. owns various royalties at the Canadian Malartic Mine near Val-d'Or, Quebec. In addition, Abitibi Royalties is building a portfolio of royalties on early-stage properties near producing mines and generating mineral projects for option or sale.
About Golden Valley Mines and Royalties Ltd.
Golden Valley Mines and Royalties Ltd. is focused on project and royalty generation and continues to evaluate opportunities to enhance its mining exploration property portfolio. Golden Valley is able to grow its current assets by way of partner-funded option/joint ventures and through its shareholdings in related-entities.
Additional Information
Further details on the respective the proposed acquisitions of each of Abitibi Royalties and Golden Valley by Gold Royalty by way of plans of arrangement and related agreements will be contained in management information circulars to be prepared by Abitibi Royalties and Golden Valley in connection with their respective shareholder meetings and filed on their respective SEDAR profiles on www.sedar.com at the time that such circulars are mailed to shareholders. All shareholders are urged to read the applicable management information circular once it becomes available as it will contain additional important information concerning such proposed transactions.
For additional information, please contact:
Abitibi Royalties Inc.
Ian Ball, President & CEO
Tel.: 1-888-392-3857
Email: info@abitibiroyalties.com
Golden Valley Mines and Royalties Ltd.
Glenn Mullan, President & CEO
Tel.: 1-819-824-2808 ext.204
Email: glenn.mullan@goldenvalleymines.com
Gold Royalty Corp.
David Garofalo, CEO, President and Chairman
Tel.: 1-833-396-3066
Email: info@goldroyalty.com
Technical Information
The disclosure herein and relating to properties and operations on the properties in which Gold Royalty, Abitibi Royalties and Golden Valley (the "Companies") hold royalty or other interests is based on information publicly disclosed by the owners or operators of these properties and information/data available in the public domain as at the date hereof, and none of this information has been independently verified by the Companies. As a holder of royalties and similar interests, the Companies have limited or no access to the properties underlying their respective interests. They are each also largely dependent on: (i) the operators of the properties and their qualified persons to provide information to them, or (ii) on publicly available information to prepare disclosure pertaining to properties and operations on the properties on which they hold interests, with generally limited or no ability to independently verify such information. Although the Companies do not have any knowledge that such information may not be accurate, there can be no assurance that such third-party information is complete or accurate. In addition, certain information publicly reported by operators may relate to a larger property than the area covered by the Companies interest, which often may only apply to a portion of the overall project area or applicable mineral resources or reserves.
Unless otherwise indicated, the technical and scientific disclosure contained or referenced in this news release, including any references to mineral resources or mineral reserves, was prepared in accordance with Canadian National Instrument 43-101 ("NI 43- 101"), which differs significantly from the requirements of the U.S. Securities and Exchange Commission (the "SEC") applicable to domestic issuers. Accordingly, the scientific and technical information contained or referenced in this press release may not be comparable to similar information made public by U.S. companies subject to the reporting and disclosure requirements of the SEC. In addition to NI 43-101, certain resource estimates disclosed herein have been prepared by the underlying operator in accordance with the Australasian Code for Reporting of Exploration Results, Mineral Resources and Ore Reserves (JORC), which differs from the requirements of NI 43-101 and the requirements of the SEC.
It cannot be assumed that all or any part of an measured, indicated or inferred resource will ever be upgraded to a higher category. "Inferred mineral resources" have a greater amount of uncertainty as to their existence and great uncertainty as to their economic and legal feasibility.
Cautionary Statement on Forward-Looking Information:
Certain of the information contained in this news release constitutes 'forward-looking information' and 'forward-looking statements' within the meaning of applicable Canadian and U.S. securities laws ("forward-looking statements") and involve known and unknown risks, uncertainties and other factors that may cause each of the Companies' actual results, performance and achievements to be materially different from the results, performance or achievements expressed or implied therein. Such forward-looking statements, including but not limited to statements relating to: the expected development of the properties underlying the Companies' respective royalty and other interests; the exploration and development plans of the operators thereof, and the proposed business combination transactions involving the Companies and the Companies' future growth plans and strategies, involve risks, uncertainties and other factors which may cause the actual results to be materially different from those expressed or implied by such forward-looking statements. Such factors include, among others, any inability of the operators of the properties underlying the parties' royalty and other interests to execute proposed plans for such properties, risks related to such operators or the exploration, development and mining operations of the properties underlying the parties' royalty and other interests; the Companies' ability to satisfy the conditions to their proposed business combinations, including obtaining required court, shareholder and regulatory approvals, impacts of macroeconomic developments as well as the impact of and the responses of relevant governments to the COVID-19 pandemic and the effectiveness of such responses; any inability of the Companies to carry out growth plans; and other risk factors set forth in the disclosure documents filed by each of the Companies under their profiles at www.sedar.com. Although each of the Companies has attempted to identify important factors that could cause actual results to differ materially from those contained in forward-looking statements, there may be other factors that cause results not to be as anticipated, estimated or intended. There can be no assurance that such statements will prove to be accurate, as actual results and future events could differ materially from those anticipated in such statements. Accordingly, readers should not place undue reliance on forward-looking statements. None of the Companies undertakes to update any forward-looking statements, except in accordance with applicable securities laws.
Neither TSX Venture Exchange nor its Regulation Services Provider (as that term is defined in policies of the TSX Venture Exchange) accepts responsibility for the adequacy or accuracy of this release.

To view the source version of this press release, please visit https://www.newsfilecorp.com/release/97699
Vancouver, British Columbia–(Newsfile Corp. – September 27, 2021) – InZinc Mining Ltd. (TSXV: IZN) ("InZinc" or the "Company") is pleased to announce an amending agreement (the "Amendment Agreement") for the acceleration of the payments and earn-in terms of the West Desert option agreement (the "Original Agreement") with American West Metals Limited ("American West"), a private Australian company.
"The accelerated payments, as well as the continuing leverage through prospective shareholdings in a new and aggressive Australian Securities Exchange ("ASX") – listed North American copper-zinc metal explorer, will set the stage for a new era for InZinc. This will provide the flexibility to scale up self-financed exploration programs at the Indy Sedex project in central British Columbia where very large zinc and new silver targets are now defined. It further enables InZinc to consider new value-creating prospects," commented Wayne Hubert, CEO of InZinc.
The revised and accelerated option terms in the Amendment Agreement will result in payments to InZinc of:
-
US$125,000 in cash upon signing of the Amendment Agreement;
-
(a) CDN$1,000,000 in cash; (b) US$1,225,000 in cash (previously US$1,500,000); and (c) 13,385,000 in shares of American West, upon American West completing the listing of its shares on the ASX through an initial public offering or other going public transaction (an "IPO").
Under the terms of the Amending Agreement, American West will also accelerate the reimbursement to the Company approximately USD$96,577, being the amount of the reclamation bond currently posted by InZinc with respect to the West Desert Project.
Under the terms of the Original Agreement, InZinc has received an initial non-refundable cash payment of US$500,000.
If, on or before June 1, 2022 (or such later date as the parties may agree to in writing), American West does not receive applications pursuant to the IPO for the issue of not less than 85,000,000 shares of American West at an issue price of AUD$0.20 per share for minimum proceeds of AUD$17,000,000; or ASX conditional approval to admit its securities to the official list of the ASX, the Amendment Agreement will be of no force and effect and the terms of the Original Agreement will be restored, including payment by American West to the Company of CDN$1,000,000 by June 1, 2022 to continue with the terms of the Original Agreement.
Terms of the Original Agreement which have not been amended include: InZinc receiving 50% of the revenue from the sale of indium mined from the West Desert project determined on a Net Smelter Return ("NSR") basis. American West will have the right to reduce the NSR to 25% by paying InZinc US$5,000,000 in cash at any time prior to the first sale of indium from the project.
About American West
American West is a new Australian company with a strategy to achieve growth in shareholder wealth through the discovery and development of major mineral deposits. American West is aiming to list its securities on the ASX in H2 2021. American West has acquired interests in the following three polymetal / base metal projects in North America which it believes have the potential to generate significant economic resource inventories and robust mining proposals:
-
The West Desert Project in Utah, USA;
-
The Storm Copper and Seal Zinc Projects in Nunavut, Canada; and
-
The Copper Warrior Project in Utah, USA.
For further information on American West, see www.americanwestmetals.com
About InZinc
InZinc is focused on growth through exploration and advancement of its interest in multiple North American base metals projects. The road-accessible Indy project (100% option), located in central British Columbia, comprises discoveries of near surface mineralization and large untested exploration targets along a 25-km long trend with potential for the discovery of a new regional scale zinc belt. The West Desert Option (100% option to American West) provides significant cash payments and continuing leverage through ownership in American West as it funds the advancement of the West Desert project, the Storm Copper and Copper Warrior projects in North America. In addition, upon exercise of the West Desert option, InZinc will receive 50% of the revenue from the sale of indium mined from West Desert.
InZinc Mining Ltd.
"Wayne Hubert"
CEO and Director
Phone: 604.687.7211
Website: www.inzincmining.com
For further information contact:
Joyce Musial
Vice President, Corporate Affairs
Phone: 604.317.2728
Email: joyce@inzincmining.com
Cautionary Note Regarding Forward-Looking Statements
This news release contains forward-looking statements and forward-looking information (collectively, "forward-looking statements") within the meaning of applicable securities legislation. All statements, other than statements of historical fact, included herein are forward-looking statements. Forward-looking information includes, but are not limited to, statements that address activities, events or developments that the Company expects or anticipates will or may occur in the future, including such things as the occurrence of the amending conditions that will give rise to the amendments in the Amending Agreement, the Company receiving the cash payments and Consideration Shares pursuant to the Amending Agreement, and the successful completion of American West's IPO on the ASX. Although the Company believes that such statements are reasonable, it can give no assurance that such expectations will prove to be correct. Forward-looking statements are typically identified by words such as: "believe", "expect", "anticipate", "intend", "estimate", "plan", "design", "postulate" and similar expressions, or are those, which, by their nature, refer to future events. The Company cautions investors that any forward-looking statements by the Company are not guarantees of future results, performance, or actions and that actual results and actions may differ materially from those in forward-looking statements as a result of various factors, including, but not limited to, those risks and uncertainties disclosed in the Company's Management Discussion and Analysis for the year ended December 31, 2020 and for the six months ended June 30, 2021 filed with certain securities commissions in Canada and other information released by the Company and filed with the appropriate regulatory agencies. All of the Company's Canadian public disclosure filings may be accessed via www.sedar.com.
Neither the TSX Venture Exchange nor its Regulation Services Provider (as that term is defined in the policies of the TSX Venture Exchange) accepts responsibility for the adequacy or accuracy of this release.

To view the source version of this press release, please visit https://www.newsfilecorp.com/release/97695
VANCOUVER, British Columbia, Sept. 27, 2021 (GLOBE NEWSWIRE) — Silver Bull Resources, Inc. (OTCQB: SVBL, TSX: SVB) (“Silver Bull” or the “Company”) is pleased to announce the completion of the previously announced distribution of shares of Arras Minerals Corp. (“Arras”) to Silver Bull shareholders (the “Distribution”).
The Distribution was effective as of September 24, 2021. Pursuant to the Distribution, shareholders of Silver Bull common stock as of September 10, 2021 were entitled to receive one common share of Arras for each share of Silver Bull common stock held as of that date.
In connection with the Distribution, Silver Bull’s shareholders were issued a total of 34,547,838 common shares of Arras, collectively representing approximately 84% of Arras, on a non-diluted basis. Silver Bull continues to own approximately 4% of Arras, on a non-diluted basis. The remaining approximately 12% of Arras is held by those who participated in Arras’ private placement in April 2021.
Registered Silver Bull shareholders holding physical share certificates or shares in book-entry form with the Company’s transfer agent (Olympia Trust Company) were issued Arras shares in book-entry form. Silver Bull shareholders who hold their shares of Silver Bull stock through a bank, broker or other nominee had or will have their Arras shares credited to their accounts by their bank, broker or other nominee. For questions relating to the transfer or mechanics of the Distribution, please contact Olympia Trust Company by telephone at 1-833-684-1546 (toll free in North America) or by online inquiry at cssinquiries@olympiatrust.com.
Arras is not currently listed on a public stock exchange but will report under the U.S. Securities Exchange Act of 1934, as amended (the “Exchange Act”), as a non-U.S. company with foreign private issuer status. The Arras shares distributed to Silver Bull shareholders, though freely transferable in the United States, may be illiquid until such time as the shares are listed or a trading market develops, if at all. The Distribution of Arras shares by Silver Bull constitutes a distribution of securities that is exempt from the prospectus requirements of Canadian securities legislation. As such, the first trade in Arras shares in Canada will be a distribution for the purposes of Canadian securities laws and subject to prospectus requirements unless certain conditions are satisfied. Until such conditions are satisfied, Arras shares may only be resold in Canada pursuant to an exemption from prospectus requirements. Silver Bull warrants and options will also be adjusted pursuant to the Distribution. For further details regarding the Canadian resale restrictions on the Arras shares distributed by Silver Bull and the adjustments being made to Silver Bull warrants and options in connection with the Distribution, please refer to the Registration Statement on Form 20-F of Arras filed on September 1, 2021 with the U.S. Securities and Exchange Commission (the “SEC”) on EDGAR at www.sec.gov/edgar (the “20-F”).
Tax Implications
The following discussion is qualified in its entirety by the discussion of tax matters set forth in the 20-F. Silver Bull shareholders who were entitled to receive the Distribution of Arras shares should make reference to that discussion for further details regarding the tax consequences of the Distribution.
For U.S. federal income tax purposes, the receipt of Arras common shares by Silver Bull shareholders should be treated as a distribution of property in an amount equal to the fair market value of the common shares received. The Distribution of Arras common shares should be treated as dividend income to the extent considered paid out of Silver Bull’s current and accumulated earnings and profits. Distributions in excess of Silver Bull’s current and accumulated earnings and profits will be treated as a non-taxable return of capital to the extent of the holder’s basis in its Silver Bull shares and thereafter as capital gain. Silver Bull will not be able to determine the amount of the Distribution that will be treated as a dividend until after the close of the taxable year of the Distribution because its current year earnings and profits will be calculated based on its income for the entire taxable year in which the Distribution occurs. However, based on current projections, it is reasonably expected that a portion of the Distribution of Arras common shares should be treated as a return of capital rather than a dividend. Silver Bull’s tax year-end is October 31, and as such, the Company expects to advise shareholders of these determinations by no later than January 31, 2022.
For Canadian tax purposes, the Distribution of Arras shares is considered a dividend in kind on the Silver Bull shares to shareholders resident in Canada. Such shareholders will be required to include in computing their income for a taxation year the amount of such dividend (equal to the fair market value of the Arras shares received). A dividend in kind of the Arras shares paid in respect of the Silver Bull shares to a shareholder who is not a resident of Canada will not be subject to Canadian withholding tax or other income tax under the Income Tax Act (Canada).
Management Focus
Silver Bull is continuing to focus on the Sierra Mojada asset and surrounding area in Mexico and managing the joint venture option with South32. It continues to trade under the symbol “SVB” on the TSX and “SVBL” on the OTCQB. The current management and board are remaining in place to continue to run the Company.
Arras is focused on the Beskauga deposit located in Kazakhstan along with additional exploration licenses held or under application in the country. In addition, current Silver Bull management and directors have been appointed as management and directors of Arras, along with G. Wesley Carson as an additional independent director.
Both companies remain headquartered in Vancouver.
On behalf of the Board of Directors
“Tim Barry”
Tim Barry, CPAusIMM
Chief Executive Officer, President and Director
INVESTOR RELATIONS:
+1 604 687 5800 info@silverbullresources.com
Cautionary note regarding forward looking statements: This news release contains forward-looking statements regarding future events and Silver Bull’s future results that are subject to the safe harbors created under the U.S. Private Securities Litigation Reform Act of 1995, the Securities Act of 1933, as amended, and the Exchange Act, and applicable Canadian securities laws. Forward-looking statements include, among others, statements regarding the expected income tax consequences and other aspects of the Distribution and expected management focus. These statements are based on current expectations, estimates, forecasts, and projections about Silver Bull’s exploration projects, the industry in which Silver Bull operates and the beliefs and assumptions of Silver Bull’s management. Words such as “expects,” “anticipates,” “targets,” “goals,” “projects,” “intends,” “plans,” “believes,” “seeks,” “estimates,” “continues,” “may,” variations of such words, and similar expressions and references to future periods, are intended to identify such forward-looking statements. Forward-looking statements are subject to a number of assumptions, risks and uncertainties, many of which are beyond our control, including such factors as whether some or all of the expected benefits of the Distribution will be achieved, the impact of the Distribution on Silver Bull shareholders, whether management’s focus will be as described in this news release following the Distribution, the results of exploration activities and whether the results continue to support continued exploration activities, unexpected variations in ore grade, types and metallurgy, volatility and level of commodity prices, the availability of sufficient future financing, and other matters discussed under the caption “Risk Factors” in our Annual Report on Form 10-K for the fiscal year ended October 31, 2020 and our Quarterly Report on Form 10-Q for the interim periods ended January 31, 2021, April 30, 2021, and July 31, 2021 and our other periodic and current reports filed with the SEC and available on www.sec.gov and with the Canadian securities commissions available on www.sedar.com. Readers are cautioned that forward-looking statements are not guarantees of future performance and that actual results or developments may differ materially from those expressed or implied in the forward-looking statements. Any forward-looking statement made by us in this release is based only on information currently available to us and speaks only as of the date on which it is made. We undertake no obligation to publicly update any forward-looking statement, whether written or oral, that may be made from time to time, whether as a result of new information, future developments or otherwise.

TORONTO, Sept. 27, 2021 (GLOBE NEWSWIRE) — Hudbay Minerals Inc. (“Hudbay” or the “company”) (TSX, NYSE: HBM) today announced that new three-and-a-half year collective agreements have been ratified by the members of United Steelworkers (“USW”) Local 7106 and USW Local 9338. Members of the other four unions at Hudbay’s Manitoba operations ratified their respective three-and-a-half year collective agreements in July, as announced with the company’s second quarter results on August 9, 2021. This completes the collective bargaining process with all six of the company’s unions in Manitoba.
About Hudbay
Hudbay (TSX, NYSE: HBM) is a diversified mining company primarily producing copper concentrate (containing copper, gold and silver) and zinc metal. Directly and through its subsidiaries, Hudbay owns three polymetallic mines, four ore concentrators and a zinc production facility in northern Manitoba and Saskatchewan (Canada) and Cusco (Peru), and copper projects in Arizona and Nevada (United States). The company’s growth strategy is focused on the exploration, development, operation and optimization of properties it already controls, as well as other mineral assets it may acquire that fit its strategic criteria. Hudbay’s vision is to be a responsible, top-tier operator of long-life, low-cost mines in the Americas. Hudbay’s mission is to create sustainable value through the acquisition, development and operation of high-quality, long-life deposits with exploration potential in jurisdictions that support responsible mining, and to see the regions and communities in which the company operates benefit from its presence. The company is governed by the Canada Business Corporations Act and its shares are listed under the symbol "HBM" on the Toronto Stock Exchange, New York Stock Exchange and Bolsa de Valores de Lima. Further information about Hudbay can be found on www.hudbay.com.
For further information, please contact:
Candace Brûlé
Director, Investor Relations
(416) 814-4387
candace.brule@hudbay.com

Quarterly financial reports play a vital role on Wall Street, as they help investors see how a company has performed and what might be coming down the road in the near-term. And out of all of the metrics and results to consider, earnings is one of the most important.
We know earnings results are vital, but how a company performs compared to bottom line expectations can be even more important when it comes to stock prices, especially in the near-term. This means that investors might want to take advantage of these earnings surprises.
Now that we know how important earnings and earnings surprises are, it's time to show investors how to take advantage of these events to boost their returns by utilizing the Zacks Earnings ESP filter.
The Zacks Earnings ESP, Explained
The Zacks Earnings ESP is more formally known as the Expected Surprise Prediction, and it aims to grab the inside track on the latest analyst estimate revisions ahead of a company's report. The idea is relatively intuitive as a newer projection might be based on more complete information.
The core of the ESP model is comparing the Most Accurate Estimate to the Zacks Consensus Estimate, where the resulting percentage difference between the two equals the Expected Surprise Prediction. The Zacks Rank is also factored into the ESP metric to better help find companies that appear poised to top their next bottom-line consensus estimate, which will hopefully help lift the stock price.
In fact, when we combined a Zacks Rank #3 (Hold) or better and a positive Earnings ESP, stocks produced a positive surprise 70% of the time. Perhaps most importantly, using these parameters has helped produce 28.3% annual returns on average, according to our 10 year backtest.
Most stocks, about 60%, fall into the #3 (Hold) category, and they are expected to perform in-line with the broader market. Stocks with a #2 (Buy) and #1 (Strong Buy) rating, or the top 15% and top 5% of stocks, respectively, should outperform the market, with Strong Buy stocks outperforming more than any other rank.
Should You Consider Southern Copper?
The final step today is to look at a stock that meets our ESP qualifications. Southern Copper (SCCO) earns a #3 (Hold) 28 days from its next quarterly earnings release on October 25, 2021, and its Most Accurate Estimate comes in at $1.13 a share.
SCCO has an Earnings ESP figure of 1.97%, which, as explained above, is calculated by taking the percentage difference between the $1.13 Most Accurate Estimate and the Zacks Consensus Estimate of $1.10. Southern Copper is one of just a large database of stocks with positive ESPs. These stocks can be filtered by ESP, Zacks Rank, % Surprise (Last Qtr.), and Reporting date.
Using the Zacks Earnings ESP to your advantage is just the start. Make sure to check out the Earnings ESP Home Page for even more earnings-related tips and tricks to design a winning investment portfolio.
Find Stocks to Buy or Sell Before They're Reported
Use the Zacks Earnings ESP Filter to turn up stocks with the highest probability of positively, or negatively, surprising to buy or sell before they're reported for profitable earnings season trading. Check it out here >>
Want the latest recommendations from Zacks Investment Research? Today, you can download 7 Best Stocks for the Next 30 Days. Click to get this free report
Southern Copper Corporation (SCCO) : Free Stock Analysis Report
To read this article on Zacks.com click here.
First Interstate Bancsystem will significantly increase its presence in the Western region after announcing an acquisition that will add $13 billion of assets to the bank.
(Reuters) – Rio Tinto and Canadian union Unifor have reached a labour agreement in principle for the global miner's operations in the western Canadian province of British Columbia, the company said on Sunday.
The agreement comes after weeks of second-round talks between the two parties after the first round of negotiations over proposed changes to workers' retirement benefits and unresolved grievances had failed to go through in July.
Unifor, which represents about 900 workers at the miner's aluminium smelting plant in Kitimat and power generating facility in Kemano, had started a strike action at BC Works in July after the failed first round of talks.
"Both parties are satisfied that the proposed agreement will provide a foundation for respect in the workplace and underpin a competitive and sustainable future for BC Works," Rio Tinto said in a statement on its website on Sunday.
Both parties, however, refrained from revealing the details of the agreement until Unifor presented the proposed deal to its members and sought a ratification vote, which is expected to be conducted in the coming days, Rio added.
(Reporting by Sameer Manekar in Bengaluru; Editing by Emelia Sithole-Matarise)
The big shareholder groups in Hudbay Minerals Inc. (TSE:HBM) have power over the company. Large companies usually have institutions as shareholders, and we usually see insiders owning shares in smaller companies. We also tend to see lower insider ownership in companies that were previously publicly owned.
With a market capitalization of CA$2.0b, Hudbay Minerals is a decent size, so it is probably on the radar of institutional investors. Our analysis of the ownership of the company, below, shows that institutions own shares in the company. Let's take a closer look to see what the different types of shareholders can tell us about Hudbay Minerals.
View our latest analysis for Hudbay Minerals

What Does The Institutional Ownership Tell Us About Hudbay Minerals?
Institutional investors commonly compare their own returns to the returns of a commonly followed index. So they generally do consider buying larger companies that are included in the relevant benchmark index.
Hudbay Minerals already has institutions on the share registry. Indeed, they own a respectable stake in the company. This suggests some credibility amongst professional investors. But we can't rely on that fact alone since institutions make bad investments sometimes, just like everyone does. When multiple institutions own a stock, there's always a risk that they are in a 'crowded trade'. When such a trade goes wrong, multiple parties may compete to sell stock fast. This risk is higher in a company without a history of growth. You can see Hudbay Minerals' historic earnings and revenue below, but keep in mind there's always more to the story.

Our data indicates that hedge funds own 13% of Hudbay Minerals. That catches my attention because hedge funds sometimes try to influence management, or bring about changes that will create near term value for shareholders. Our data shows that Waterton Global Resource Management, Inc. is the largest shareholder with 17% of shares outstanding. With 13% and 6.4% of the shares outstanding respectively, GMT Capital Corp. and Letko, Brosseau & Associates Inc. are the second and third largest shareholders.
We did some more digging and found that 9 of the top shareholders account for roughly 51% of the register, implying that along with larger shareholders, there are a few smaller shareholders, thereby balancing out each others interests somewhat.
While it makes sense to study institutional ownership data for a company, it also makes sense to study analyst sentiments to know which way the wind is blowing. Quite a few analysts cover the stock, so you could look into forecast growth quite easily.
Insider Ownership Of Hudbay Minerals
The definition of company insiders can be subjective and does vary between jurisdictions. Our data reflects individual insiders, capturing board members at the very least. The company management answer to the board and the latter should represent the interests of shareholders. Notably, sometimes top-level managers are on the board themselves.
Insider ownership is positive when it signals leadership are thinking like the true owners of the company. However, high insider ownership can also give immense power to a small group within the company. This can be negative in some circumstances.
Our most recent data indicates that insiders own less than 1% of Hudbay Minerals Inc.. It's a big company, so even a small proportional interest can create alignment between the board and shareholders. In this case insiders own CA$18m worth of shares. It is good to see board members owning shares, but it might be worth checking if those insiders have been buying.
General Public Ownership
The general public holds a 29% stake in Hudbay Minerals. While this group can't necessarily call the shots, it can certainly have a real influence on how the company is run.
Private Equity Ownership
With an ownership of 17%, private equity firms are in a position to play a role in shaping corporate strategy with a focus on value creation. Some might like this, because private equity are sometimes activists who hold management accountable. But other times, private equity is selling out, having taking the company public.
Next Steps:
I find it very interesting to look at who exactly owns a company. But to truly gain insight, we need to consider other information, too.
I always like to check for a history of revenue growth. You can too, by accessing this free chart of historic revenue and earnings in this detailed graph.
If you are like me, you may want to think about whether this company will grow or shrink. Luckily, you can check this free report showing analyst forecasts for its future.
NB: Figures in this article are calculated using data from the last twelve months, which refer to the 12-month period ending on the last date of the month the financial statement is dated. This may not be consistent with full year annual report figures.
This article by Simply Wall St is general in nature. We provide commentary based on historical data and analyst forecasts only using an unbiased methodology and our articles are not intended to be financial advice. It does not constitute a recommendation to buy or sell any stock, and does not take account of your objectives, or your financial situation. We aim to bring you long-term focused analysis driven by fundamental data. Note that our analysis may not factor in the latest price-sensitive company announcements or qualitative material. Simply Wall St has no position in any stocks mentioned.
Have feedback on this article? Concerned about the content? Get in touch with us directly. Alternatively, email editorial-team (at) simplywallst.com.
The big shareholder groups in Hudbay Minerals Inc. (TSE:HBM) have power over the company. Large companies usually have institutions as shareholders, and we usually see insiders owning shares in smaller companies. We also tend to see lower insider ownership in companies that were previously publicly owned.
With a market capitalization of CA$2.0b, Hudbay Minerals is a decent size, so it is probably on the radar of institutional investors. Our analysis of the ownership of the company, below, shows that institutions own shares in the company. Let's take a closer look to see what the different types of shareholders can tell us about Hudbay Minerals.
View our latest analysis for Hudbay Minerals
What Does The Institutional Ownership Tell Us About Hudbay Minerals?
Institutional investors commonly compare their own returns to the returns of a commonly followed index. So they generally do consider buying larger companies that are included in the relevant benchmark index.
Hudbay Minerals already has institutions on the share registry. Indeed, they own a respectable stake in the company. This suggests some credibility amongst professional investors. But we can't rely on that fact alone since institutions make bad investments sometimes, just like everyone does. When multiple institutions own a stock, there's always a risk that they are in a 'crowded trade'. When such a trade goes wrong, multiple parties may compete to sell stock fast. This risk is higher in a company without a history of growth. You can see Hudbay Minerals' historic earnings and revenue below, but keep in mind there's always more to the story.
Our data indicates that hedge funds own 13% of Hudbay Minerals. That catches my attention because hedge funds sometimes try to influence management, or bring about changes that will create near term value for shareholders. Our data shows that Waterton Global Resource Management, Inc. is the largest shareholder with 17% of shares outstanding. With 13% and 6.4% of the shares outstanding respectively, GMT Capital Corp. and Letko, Brosseau & Associates Inc. are the second and third largest shareholders.
We did some more digging and found that 9 of the top shareholders account for roughly 51% of the register, implying that along with larger shareholders, there are a few smaller shareholders, thereby balancing out each others interests somewhat.
While it makes sense to study institutional ownership data for a company, it also makes sense to study analyst sentiments to know which way the wind is blowing. Quite a few analysts cover the stock, so you could look into forecast growth quite easily.
Insider Ownership Of Hudbay Minerals
The definition of company insiders can be subjective and does vary between jurisdictions. Our data reflects individual insiders, capturing board members at the very least. The company management answer to the board and the latter should represent the interests of shareholders. Notably, sometimes top-level managers are on the board themselves.
Insider ownership is positive when it signals leadership are thinking like the true owners of the company. However, high insider ownership can also give immense power to a small group within the company. This can be negative in some circumstances.
Our most recent data indicates that insiders own less than 1% of Hudbay Minerals Inc.. It's a big company, so even a small proportional interest can create alignment between the board and shareholders. In this case insiders own CA$18m worth of shares. It is good to see board members owning shares, but it might be worth checking if those insiders have been buying.
General Public Ownership
The general public holds a 29% stake in Hudbay Minerals. While this group can't necessarily call the shots, it can certainly have a real influence on how the company is run.
Private Equity Ownership
With an ownership of 17%, private equity firms are in a position to play a role in shaping corporate strategy with a focus on value creation. Some might like this, because private equity are sometimes activists who hold management accountable. But other times, private equity is selling out, having taking the company public.
Next Steps:
I find it very interesting to look at who exactly owns a company. But to truly gain insight, we need to consider other information, too.
I always like to check for a history of revenue growth. You can too, by accessing this free chart of historic revenue and earnings in this detailed graph.
If you are like me, you may want to think about whether this company will grow or shrink. Luckily, you can check this free report showing analyst forecasts for its future.
NB: Figures in this article are calculated using data from the last twelve months, which refer to the 12-month period ending on the last date of the month the financial statement is dated. This may not be consistent with full year annual report figures.
This article by Simply Wall St is general in nature. We provide commentary based on historical data and analyst forecasts only using an unbiased methodology and our articles are not intended to be financial advice. It does not constitute a recommendation to buy or sell any stock, and does not take account of your objectives, or your financial situation. We aim to bring you long-term focused analysis driven by fundamental data. Note that our analysis may not factor in the latest price-sensitive company announcements or qualitative material. Simply Wall St has no position in any stocks mentioned.
Have feedback on this article? Concerned about the content? Get in touch with us directly. Alternatively, email editorial-team (at) simplywallst.com.
(Bloomberg) — In the Outback’s blistering-hot mining sites, the hours are long and the flies relentless. Now, in a bid to attract skilled workers and overcome a labor supply crunch, Australia’s iron ore companies are turning to Olympic-sized swimming pools, virtual golf arcades and fine dining.
Most Read from Bloomberg
-
School Reopenings Falter as U.S. Kids Near 1 Million Covid Cases
-
In Paris, the Wrapped Arc de Triomphe Is a Polarizing Package
-
Istanbul Turns Taps on Old Fountains, Joining Global Push for Free Drinks
When production starts at Mineral Resources Ltd.’s Ashburton iron ore hub around mid-2023, staff will be offered what it calls resort-style accommodation twice the size of the industry average, featuring a queen-sized bed, kitchen and lounge areas. And to overcome the strains of working remotely, a full-time mental health consultant will be on hand.
“We want to figure out how to make sure we keep the people that are working for us with us until they retire,” the company’s chief executive, Chris Ellison, said.
Meanwhile, the mining giants are also upping their game. BHP Group’s South Flank, which started production in June, features a worker village with a pool, tennis and squash courts, an indoor golf range and a range of bars and restaurants.
And Rio Tinto Group is seeking workers for its $2.6 billion Gudai-Darri project, due to start early next year, promising them comfortable living and high-speed connectivity at a site where workers will “genuinely respect each other.”
It’s a far cry from the industry’s traditional image of so-called fly-in, fly-out workers — flown in to work at mines in the desert for weeks at a time — being offered accommodation in sites resembling testosterone-fueled, heavy-drinking boot-camps, and sleeping in tiny rooms known as dongas after grueling 12-hour shifts.
The industry is also trying to clean up its sites after coming under attack due to sexual harassment claims made by women. BHP fired dozens of workers after it verified the claims, including substantiated allegations of rape. Rio also responded with steps to improve safety for female workers at its mines, including a buddy system, greater supervision and training, shorter rosters and a four-drink daily limit on alcohol consumption. BHP also has a four-drink cut-off at its sites.
“We’re trying to soften the sites down to attract a more diverse workforce,” Ellison said.
Read: Mining Giants Face a Sexual Harassment Reckoning as BHP Fires 48
Mining companies know the ability to attract workers to their sites, and then keep them, is crucial. Despite an historic crash in iron ore prices this week to a 16-month low of $90, major miners like BHP and Rio still profit given their cost of production can be less than $20 per ton.
They’re also used to volatile prices swings, so their hunt for talent is unlikely to change for now. Iron ore is responsible for about a third of Australia’s export revenue, or a record A$152 billion ($110 billion) in the year to June 30. while the industry employs around 280,000 people.
A recent report showed Western Australia’s resources industry needs to attract as many as 40,000 extra workers over the next two years or risk delays and potential postponement of some A$140 billion in projects. That challenge has been further complicated by the state’s border closures to keep out Covid-19, while workers are also often headhunted to work in high-skilled industries such as tech and finance, despite being offered wages around double the national average at the mines.
For Mineral Resources, it’s not only about attracting and keeping the best workers: Ellison says it’s just as important to provide a safe and comfortable environment which supports the mental well-being of employees. The company is breaking the mold by planning to build accommodation to suit couples and families, seeking to get them to permanently reside and play an active part in the local community.
Still, the bulk of Western Australia’s mining-site workforce is destined to remain tied to their homes and families based hundreds of miles away, and from whom they need to remain physically distanced from for sometimes weeks at a time. Mineral Resources’ head of mental health, Chris Harris, said fly-in, fly-out workers suffered twice as much psychological distress as other Australian workers.
“Some of those challenges are just the nature of sector,” Harris said. “The question is: how do we support people to navigate those challenges?”
Most Read from Bloomberg Businessweek
-
A Tiny Piece of Plastic Is Helping Farmers Use Far Less Water
-
Evergrande Debt Crisis Is Financial Stress Test No One Wanted
-
Microsoft and an Army of Tiny Telecoms Are Part of a Plan to Wire Rural America
-
In Amazon’s Flagship Fulfillment Center, the Machines Run the Show
©2021 Bloomberg L.P.
VANCOUVER, British Columbia, September 24, 2021–(BUSINESS WIRE)–Fancamp Exploration Ltd. ("Fancamp" or the "Corporation") (TSX Venture Exchange: FNC) today announced that its annual general meeting ("AGM") will take place on Tuesday, October 5, 2021 at 10:00 a.m. ET. Shareholders as of the record date of Friday, May 28, 2021 will be eligible to vote at the AGM. At the AGM, shareholders will be asked to vote FOR Fancamp’s director nominees.
The AGM was originally scheduled for Tuesday, June 29, 2021, but was postponed to accommodate a court application. Following the recent decision of the Supreme Court (British Columbia) in favour of Fancamp, some members of the dissident group reached an agreement with the Corporation and will support the management slate. The Corporation is holding the AGM in a timely manner and the original record date for the meeting has been preserved.
Meeting Details
-
Date and Time: Tuesday, October 5, 2021 at 10:00 a.m. ET
-
In Person: Hotel Fairmont The Queen Elizabeth, 900 René-Lévesque Blvd W., Montreal
-
Live Webcast: https://web.lumiagm.com/218675958
Vote Your Gold Proxy – Deadline: Friday, October 1, 2021 at 10:00 a.m. ET
Shareholders are encouraged to continue voting on the GOLD proxy FOR Fancamp’s director nominees. If you have any questions or need help voting, please contact Kingsdale Advisors at 1-800-749-9890 or contactus@kingsdaleadvisors.com.
Advisors
Lavery, de Billy, L.L.P. and Goodmans LLP are serving as legal advisor to Fancamp. Harris & Company LLP is serving as litigation counsel to Fancamp. Kingsdale Advisors is acting as strategic shareholder and communications advisor to Fancamp. Koffman Kalef LLP is serving as legal advisor to the Special Committee.
About Fancamp Exploration Ltd. (TSX-V: FNC)
Fancamp is a growing Canadian mineral exploration corporation dedicated to its value-added strategy of advancing mineral properties through exploration and development. The Corporation owns numerous mineral resource properties in Quebec, Ontario and New Brunswick, including gold, rare earth metals, strategic and base metals, zinc, chromium, titanium and more. Fancamp is also building on the industrial possibilities inherent in dealing with some of these materials, notable being the development of its Titanium technology strategy. The Corporation is managed by a new and focused leadership team with decades of mining, exploration and complementary technology experience.
Neither TSX Venture Exchange nor its Regulation Services Provider (as that term is defined in policies of the TSX Venture Exchange) accepts responsibility for the adequacy or accuracy of this news release.
View source version on businesswire.com: https://www.businesswire.com/news/home/20210924005497/en/
Contacts
For Further Information
Rajesh Sharma, Chief Executive Officer
+1 (604) 434 8829
info@fancamp.ca
Debra Chapman, Chief Financial Officer
+1 (604) 434 8829
info@fancamp.ca
Media Contact
Hyunjoo Kim
Director, Communication, Marketing & Digital Strategy
Kingsdale Advisors
Phone: 416-867-2357
Cell: 416-899-6463
Email: hkim@kingsdaleadvisors.com
The major global iron-ore producers— BHP Group Vale and Rio Tinto —look appealing after the recent sharp declines in their stock prices because they are now discounting lower commodity prices. The stocks are discounting an iron-ore price of $86.37 a metric ton, against the current spot price of $107 a ton, Chris LaFemina, a Jefferies analyst, says in a note titled “What Iron Price is Priced In.” “If the reality in China is a soft landing in which the government manages the Evergrande collapse without causing contagion, these shares are undervalued and would likely outperform,” he wrote.
VANCOUVER, British Columbia, Sept. 23, 2021 (GLOBE NEWSWIRE) — Candente Copper Corp. (TSX: DNT, BVL: DNT) ("Candente Copper", "the Company") is pleased to announce that Yaku Consultores ("Yaku") has completed all field work required for an updated Environmental Impact Study “EIAsd”. The EIAsd is required in order to obtain drilling permits for the Cañariaco Project located in Northern Peru.
Data will now be compiled such that the drilling permit application can be submitted in approximately 6 weeks.
"The completion of this fieldwork by Yaku is very timely as it will also form an important component of the environmental and social aspects of the Preliminary Economic Assessement (“PEA”) underway by Ausenco," says Joanne Freeze, President and CEO of Candente Copper.
Candente Copper has also been collaborating with local authorities for the maintenance and expansions of community roads and an irrigation canal, as well as increasing internet and mobile telephone coverage in the community. This work is part of the Company’s commitment to the practice of Shared Value, which joins efforts between the community, the company and the government to ensure mutual benefit.
About Candente Copper
Candente Copper is a mineral exploration company engaged in the acquisition, exploration, and development of mineral properties. The Company’s most advanced project is its 100% owned Cañariaco project, which includes the Cañariaco Norte deposit as well as the Cañariaco Sur deposit and Quebrada Verde prospect, located within the western Cordillera of the Peruvian Andes in the Department of Lambayeque in Northern Peru.
Ausenco Engineering Inc. has been engaged to conduct an updated PEA to evaluate a new development strategy for the Cañariaco Norte Project. The updated PEA will evaluate new options (identified in the recently completed Desktop Study) to reduce both the CapEx and OpEx from the analyses conducted between 2010 and 2014. The updated PEA study is estimated to be completed before the end of Q4 2021.
Considerations for the PEA are various initial concentrator throughputs including 40,000; 50,000; and 60,000 tonnes per day (“tpd”) followed by a staged expansion of production rate.
Geometallurgical modelling of the deposit and updated smelting costs have indicated that the Outotec Roaster proposed during previous studies will not be required, and therefore it will not be contemplated in the PEA.
Tailings storage methodologies which could improve ESG practices will be assessed in more detail as part of the PEA. The scope of work will include cost-effective mining, process plant and infrastructure design concepts, as well as managing the overall NI 43-101 PEA to drive value-adding initiatives across the entire project, while meeting Candente Copper’s ESG vision.
Joanne C. Freeze, P.Geo., CEO, is the Qualified Person as defined by National Instrument 43-101 for the projects discussed above. She has reviewed and approved the contents of this release.
This news release may contain forward-looking information (as such term is defined under Canadian securities laws) including but not limited to the potential for discovery on the Cañariaco Property and other statements that are not historical facts including comments regarding the timing and content of upcoming work programs, geological interpretations, potential mineral recovery processes, the completion of a favourable PEA and the expected results thereof and the acquisition of various permits. While such forward-looking information is expressed by Candente Copper in good faith and believed by Candente Copper to have a reasonable basis, they address future events and conditions and are therefore subject to inherent risks and uncertainties including those set out in Candente Copper’s MD&A. Actual results may differ materially from those currently anticipated in such statements. Candente relies upon litigation protection for forward-looking statements. Factors that cause the actual results to differ materially from those in forward-looking information include, without limitation, metal prices, results of exploration and development activities, regulatory changes, defects in title, availability of materials and equipment, timeliness of government approvals, potential environmental issues, availability of capital and financing and general economic, market or business conditions. Candente Copper expressly disclaims any intention or obligation to update or revise any forward-looking information, whether as a result of new information, future events or otherwise, except in accordance with applicable securities laws.
On behalf of the Board of Candente Copper Corp.
“Joanne C. Freeze” P.Geo.
President, CEO and Director
___________________________________
For further information please contact:
info@candentecopper.com
www.candentecopper.com
NR-139

If we want to find a potential multi-bagger, often there are underlying trends that can provide clues. Ideally, a business will show two trends; firstly a growing return on capital employed (ROCE) and secondly, an increasing amount of capital employed. Basically this means that a company has profitable initiatives that it can continue to reinvest in, which is a trait of a compounding machine. So when we looked at the ROCE trend of BHP Group (ASX:BHP) we really liked what we saw.
Return On Capital Employed (ROCE): What is it?
If you haven't worked with ROCE before, it measures the 'return' (pre-tax profit) a company generates from capital employed in its business. The formula for this calculation on BHP Group is:
Return on Capital Employed = Earnings Before Interest and Tax (EBIT) ÷ (Total Assets – Current Liabilities)
0.32 = US$30b ÷ (US$109b – US$16b) (Based on the trailing twelve months to June 2021).
Thus, BHP Group has an ROCE of 32%. In absolute terms that's a great return and it's even better than the Metals and Mining industry average of 9.8%.
View our latest analysis for BHP Group

In the above chart we have measured BHP Group's prior ROCE against its prior performance, but the future is arguably more important. If you're interested, you can view the analysts predictions in our free report on analyst forecasts for the company.
What The Trend Of ROCE Can Tell Us
BHP Group is showing promise given that its ROCE is trending up and to the right. More specifically, while the company has kept capital employed relatively flat over the last five years, the ROCE has climbed 619% in that same time. So it's likely that the business is now reaping the full benefits of its past investments, since the capital employed hasn't changed considerably. It's worth looking deeper into this though because while it's great that the business is more efficient, it might also mean that going forward the areas to invest internally for the organic growth are lacking.
In Conclusion…
As discussed above, BHP Group appears to be getting more proficient at generating returns since capital employed has remained flat but earnings (before interest and tax) are up. And a remarkable 138% total return over the last five years tells us that investors are expecting more good things to come in the future. So given the stock has proven it has promising trends, it's worth researching the company further to see if these trends are likely to persist.
BHP Group does come with some risks though, we found 4 warning signs in our investment analysis, and 1 of those is concerning…
BHP Group is not the only stock earning high returns. If you'd like to see more, check out our free list of companies earning high returns on equity with solid fundamentals.
This article by Simply Wall St is general in nature. We provide commentary based on historical data and analyst forecasts only using an unbiased methodology and our articles are not intended to be financial advice. It does not constitute a recommendation to buy or sell any stock, and does not take account of your objectives, or your financial situation. We aim to bring you long-term focused analysis driven by fundamental data. Note that our analysis may not factor in the latest price-sensitive company announcements or qualitative material. Simply Wall St has no position in any stocks mentioned.
Have feedback on this article? Concerned about the content? Get in touch with us directly. Alternatively, email editorial-team (at) simplywallst.com.
Even when a business is losing money, it's possible for shareholders to make money if they buy a good business at the right price. For example, Hannans (ASX:HNR) shareholders have done very well over the last year, with the share price soaring by 286%. But the harsh reality is that very many loss making companies burn through all their cash and go bankrupt.
So notwithstanding the buoyant share price, we think it's well worth asking whether Hannans' cash burn is too risky. For the purposes of this article, cash burn is the annual rate at which an unprofitable company spends cash to fund its growth; its negative free cash flow. The first step is to compare its cash burn with its cash reserves, to give us its 'cash runway'.
View our latest analysis for Hannans
How Long Is Hannans' Cash Runway?
A cash runway is defined as the length of time it would take a company to run out of money if it kept spending at its current rate of cash burn. As at December 2020, Hannans had cash of AU$1.7m and no debt. In the last year, its cash burn was AU$1.9m. So it had a cash runway of approximately 11 months from December 2020. That's quite a short cash runway, indicating the company must either reduce its annual cash burn or replenish its cash. You can see how its cash balance has changed over time in the image below.

How Is Hannans' Cash Burn Changing Over Time?
Because Hannans isn't currently generating revenue, we consider it an early-stage business. So while we can't look to sales to understand growth, we can look at how the cash burn is changing to understand how expenditure is trending over time. Over the last year its cash burn actually increased by a very significant 57%. While this spending increase is no doubt intended to drive growth, if the trend continues the company's cash runway will shrink very quickly. Hannans makes us a little nervous due to its lack of substantial operating revenue. So we'd generally prefer stocks from this list of stocks that have analysts forecasting growth.
Can Hannans Raise More Cash Easily?
Given its cash burn trajectory, Hannans shareholders should already be thinking about how easy it might be for it to raise further cash in the future. Issuing new shares, or taking on debt, are the most common ways for a listed company to raise more money for its business. One of the main advantages held by publicly listed companies is that they can sell shares to investors to raise cash and fund growth. By comparing a company's annual cash burn to its total market capitalisation, we can estimate roughly how many shares it would have to issue in order to run the company for another year (at the same burn rate).
Since it has a market capitalisation of AU$64m, Hannans' AU$1.9m in cash burn equates to about 2.9% of its market value. That means it could easily issue a few shares to fund more growth, and might well be in a position to borrow cheaply.
So, Should We Worry About Hannans' Cash Burn?
Even though its increasing cash burn makes us a little nervous, we are compelled to mention that we thought Hannans' cash burn relative to its market cap was relatively promising. Even though we don't think it has a problem with its cash burn, the analysis we've done in this article does suggest that shareholders should give some careful thought to the potential cost of raising more money in the future. On another note, Hannans has 6 warning signs (and 2 which are a bit concerning) we think you should know about.
Of course Hannans may not be the best stock to buy. So you may wish to see this free collection of companies boasting high return on equity, or this list of stocks that insiders are buying.
This article by Simply Wall St is general in nature. We provide commentary based on historical data and analyst forecasts only using an unbiased methodology and our articles are not intended to be financial advice. It does not constitute a recommendation to buy or sell any stock, and does not take account of your objectives, or your financial situation. We aim to bring you long-term focused analysis driven by fundamental data. Note that our analysis may not factor in the latest price-sensitive company announcements or qualitative material. Simply Wall St has no position in any stocks mentioned.
Have feedback on this article? Concerned about the content? Get in touch with us directly. Alternatively, email editorial-team (at) simplywallst.com.

The last 60 days have been a brutal stretch for iron investors.
As a result of China cutting back on iron ore production as a means of reducing pollution, the iron and steel sectors have both been walloped.
Iron ore prices have collapsed about 60% since a record in May. And in less than two months, three of the world's largest ore miners, Rio Tinto, BHP and Vale have lost roughly $110 billion in market value.
What can we say? It’s tough being Iron Man.
But if you’ve been sniffing around the ore space waiting for the right time to get in, this could be it. China’s restrictions may provide short-term pain for investors, but the planet’s need for iron ore and steel isn’t going away.
Here are four iron-related investments that might be worth pouncing on — maybe even with your spare change.
1. Rio Tinto (RIO)

Rio Tinto, despite its stock being down almost 30% since the end of July, may be the most intriguing option out there. As one of the world’s largest producers of iron ore, Rio’s shares may be the ones most likely to benefit from an eventual rebound.
In addition to the 16 mines Rio operates in Australia, it also has projects in Serbia, Canada, Mongolia, Guinea and the U.S.
Rio Tinto is not solely an iron play. The company produces a variety of products — copper, diamonds, titanium, aluminum — that the world needs a continual supply of.
Its extensive reach has led to some serious profits: Earnings over the first half of 2021 were $12.2 billion, leading to an interim dividend of $5.61 per share.
Rio Tinto currently trades at just under $70 per share. But you can get a piece of Rio Tinto using a popular stock trading app that allows you to buy fractions of shares with as much money as you’re willing to spend.
2. Vale SA (VALE)

Shares in Brazil’s Vale SA have lost about 13% of their value in the last month, but a massive first six months of 2021 led the company to announce $7.6 billion in first-half dividends.
That’s the largest payout to investors since 2019.
Vale says it is the world’s largest producer of iron ore and iron pellets. Its biggest operation is its iron ore mine in Carajas, Brazil, one of the richest iron deposits in the world, but it also runs a plant in Oman and has various stakes in joint ventures in China.
In the most recent quarter, Vale posted earnings of $7.6 billion, up more than 600% year-over-year. To be sure, those results were helped by higher iron ore prices at the time.
But with the company on track to hit 2021 guidance of between 315 and 335 million tons of ore production, Vale remains a potent bet on the steelmaking metal.
3. BHP Group (BHP)

Australia’s BHP Group has fared even worse than its competitors over the last two months, with its stock losing more than 40% of its value since July 29.
Like Rio Tinto, BHP is involved in more than just iron ore mining. It also has its fingers in petroleum, coal and copper, which makes it a somewhat diversified play.
BHP has been receiving lukewarm assessments from analysts. Zacks, Berenberg Bank and Deutsche Bank all recently rated the company a “hold”, while Liberium Capital downgraded BHG from “hold” to “sell” in July.
The company reported profits of $25.9 billion for the financial year ending June 30. And with BHP having generated $19.3 billion in free cash flow over the past 12 months, it should have some cushion to weather the current storm afflicting iron ore.
If you're still cautious about buying into BHP, some investing apps will give you a free share of BHP just for signing up.
4. VanEck Vectors Steel ETF (SLX)

The VanEck Vectors Steel ETF was riding high from May to August, as rising iron ore prices lifted the fund to its highest value since July of 2011.
The last month has seen the price of SLX shares shrink by about 11%, but compared to the individual companies featured here, that’s not so bad.
SLX tracks the performance of some of the world’s biggest ore producers, including Rio Tinto and Vale, but it also holds large steelmakers including Arcelormittal, Nucor, and U.S. Steel. This bit of diversification should help spread some of your risks around in the event iron ore hits the skids once again.
As of Sept. 21, shares in SLX were selling for around $54.53. The most recent dividend paid out was $0.83 a share in December of 2020.
A quieter commodity play
If the volatility in iron ore markets has you questioning your future as an iron/steel investor, there’s another asset that also provides exposure to rising commodity prices: U.S. farmland.
An investment in farmland allows you to profit from both rising food prices, which should only keep increasing as the global demand for food intensifies, and a rapidly decreasing amount of arable land.
An investment in farmland can also be considered an investment in sustainability.
It’s become a hot topic among ESG investors, and will only continue to grow in prominence now that it’s so easy to invest in.
This article provides information only and should not be construed as advice. It is provided without warranty of any kind.
(Bloomberg) — A bidding war for a small Canadian nickel miner is showing no signs of cooling as its largest shareholder, Australian mining magnate Andrew Forrest, took a formal step to increase ownership.
Most Read from Bloomberg
-
Istanbul Turns Taps on Old Fountains, Joining Global Push for Free Drinks
-
The Global Housing Market Is Broken, and It’s Dividing Entire Countries
-
In Paris, the Wrapped Arc de Triomphe Is a Polarizing Package
-
Berlin Referendum Could Determine the Future of the City’s Housing
Forrest’s Wyloo Metals Pty Ltd. said it notified Noront Resources Ltd. to swap its $15 million convertible loan for common shares of Noront. That will increase Wyloo’s equity ownership to about 37.3% from 24.2%, according to a statement Wednesday.
Wyloo has offered to buy Noront for C$0.70 per share, beating the C$0.55 offer made by BHP Group in July that Noront’s board agreed to support. Wyloo said last month its proposal is more likely to succeed because it owns a chunk of Noront’s shares and doesn’t intend to support BHP’s offer.
Mining heavyweight are racing to control more supplies of raw materials that are key to the transition to low-carbon energy sources. Noront has been developing one of Canada’s largest potential mineral reserves, in a largely untapped northern Ontario region dubbed the Ring of Fire. Nickel is one of the key metals used in batteries for electric vehicles.
Canadian Nickel Miner Still Wants BHP Takeover, Shunning Forrest
Mining Magnate Forrest Snubs BHP Offer to Buy His Noront Shares
©2021 Bloomberg L.P.
Teck Resources Ltd TECK has lowered the annual steelmaking coal and refined Zinc production guidance 2021, due to the forest fire incident in British Columbia, which hurt the company’s third-quarter operations.
In August, Teck’s Trail Operations metallurgical facility was impacted by wildfire smoke following which, Trail’s oxygen plant was temporarily shut down due to the poor air quality. On Aug 13, Trail’s oxygen plants resumed operations. However, the plant closure negatively impacted the company’s zinc production, as a result of which, the company now expects 2021 zinc production to be between 285,000 tons and 290,000 tons, lower from the prior range of 290,000 to 300,000 tons.
The refined zinc production for the third quarter is expected between 72,000 tons and 75,000 tons. The company produced 76,000 tons refined zinc in third-quarter 2020.
On Aug 14, Teck suspended its Highland Valley Copper (HVC) operations for a period of four days due to the wildfire evacuation order issued by the District of Logan Lake. As copper production was not impacted significantly, the company maintained its HVC annual contained copper production guidance at 128,000 to 133,000 tons. However, the shipment timing of copper concentrate from HVC has been impacted due to the wildfires and logistics troubles.
The wildfire mishap has also impacted the company’s steelmaking coal business. Teck, hence, had incorporated the impact in the steelmaking coal segment’s third-quarter sales volume and annual production guidance provided in the second-quarter’s earnings call. The segment’s sales are expected between 5.7 million tons and 6.1 million tons for the third quarter.
The company projects steelmaking coal production between 25 million tons and 26 million tons in 2021. Additionally, the annual steelmaking coal production at the Elk Valley operation is likely to be impacted by the incident, coupled with increased labor absence related to the COVID-19 protocols.
Teck has lowered the third-quarter sales guidance for zinc concentrate at Red Dog operation, due to the weather and ice situations as well as weather-induced shipping delays in July and August. The company now expects third-quarter contained zinc sales in the band of 145,000-155,000 tons, down from the prior estimate of 180,000-200,000 tons. Though the company is facing shipping shortages in the third quarter, management expects to ship all Red Dog zinc concentrates during the current shipping season assuming normal weather conditions.
Teck continues to implement its innovation-driven efficiency program, RACE21, which is expected to improve proficiency and productivity across the business. Savings from this program will likely offset cost inflation, supply-related challenges, higher labor costs and lower production.
Price Performance
The company’s shares have gained 27.9% so far this year, as against the industry’s decline of 1.3%.

Image Source: Zacks Investment Research
Zacks Rank & Stocks to Consider
Teck currently carries a Zacks Rank #3 (Hold).
Better-ranked stocks in the basic materials space include Avient Corp. AVNT, The Mosaic Co. MOS and Veritiv Corp. VRTV, each sporting a Zacks Rank #1 (Strong Buy), currently. You can see the complete list of today’s Zacks #1 Rank stocks here.
Avient has a projected earnings growth rate of 75% for 2021. The company’s shares have gained 17.7%, so far this year.
Mosaic has an estimated earnings growth rate of 472.9% for the current year. So far this year, the company’s shares have appreciated 40.1%.
Veritiv has an estimated earnings growth rate of 215% for the current year. The company’s shares have soared 320.1%, year to date.
Want the latest recommendations from Zacks Investment Research? Today, you can download 7 Best Stocks for the Next 30 Days. Click to get this free report
The Mosaic Company (MOS) : Free Stock Analysis Report
Veritiv Corporation (VRTV) : Free Stock Analysis Report
Teck Resources Ltd (TECK) : Free Stock Analysis Report
Avient Corporation (AVNT) : Free Stock Analysis Report
To read this article on Zacks.com click here.
VANCOUVER, British Columbia, September 22, 2021–(BUSINESS WIRE)–Fancamp Exploration Ltd. ("Fancamp" or the "Corporation") (TSX Venture Exchange: FNC) is pleased to announce that Mr. Greg Ferron has been appointed to its Board of Directors (the "Board"), effective immediately. As previously announced, Mr. Ferron has replaced Mr. Paul Ankcorn, who has stepped down from the Board.
Mr. Ferron has 20 years of mining industry and capital markets experience, and is the former director and CEO of Treasury Metals Inc. Previously, he held various corporate finance, corporate development and investor relations roles, including Laramide Resources Ltd., Treasury Metals, TMX Group, and Scotiabank. Mr. Ferron has diverse M&A experience completing joint ventures, project acquisitions, asset sales and project divestitures, including Laramide's Westwater ISR project acquisition and Treasury's merger with the Goldlund Gold Project, creating one of Canada’s largest gold developers. He currently serves on the board of directors at Platinex Inc. and provides corporate development and advisory services to mining clients.
"We are pleased to have Mr. Ferron join our Board and look forward to his contributions," said Mr. Mark Billings, Chairman of the Board. "Drawing on his years of experience, Mr. Ferron will be a key player in helping Fancamp advance its strategic plan. I am confident he will be an outstanding director who makes the interests of our shareholders a priority."
"We would also like to thank Mr. Ankcorn for his exceptional service on our Board. Fancamp benefitted greatly from Mr. Ankcorn’s dedication and leadership, and it has been a privilege to work closely and serve alongside him," added Mr. Billings.
"I am delighted to join the Fancamp Board," said Mr. Ferron. "With their commitment to delivering shareholder value and growing the business through exploration properties, titanium technology and strategic alternatives, shareholders should be excited about Fancamp’s bright future. I look forward to supporting Rajesh and working with my fellow directors as well as our advisory members and shareholders to build our business for growth."
Mr. Ferron’s appointment comes after an agreement that further aligns the interests of shareholders with the Board and management. As part of the agreement, Fancamp also terminated the ScoZinc transaction for a private placement, which will allow the Corporation to benefit from ScoZinc’s production potential and corporate upside, and following the annual general meeting ("AGM"), the Board will advance the Corporation’s strategic plan.
Vote Your Gold Proxy Today
Shareholders are encouraged to continue voting on the GOLD proxy FOR Fancamp’s director nominees. Fancamp remains committed to holding the AGM as soon as possible and will advise shareholders of a new date in due course.
If you have any questions or need help voting, please contact Kingsdale Advisors at 1-800-749-9890 or contactus@kingsdaleadvisors.com.
Advisors
Lavery, de Billy, L.L.P. and Goodmans LLP are serving as legal advisor to Fancamp. Harris & Company LLP is serving as litigation counsel to Fancamp. Kingsdale Advisors is acting as strategic shareholder and communications advisor to Fancamp. Koffman Kalef LLP is serving as legal advisor to the Special Committee.
About Fancamp Exploration Ltd. (TSX-V: FNC)
Fancamp is a growing Canadian mineral exploration corporation dedicated to its value-added strategy of advancing mineral properties through exploration and development. The Corporation owns numerous mineral resource properties in Quebec, Ontario and New Brunswick, including gold, rare earth metals, strategic and base metals, zinc, chromium, titanium and more. Fancamp is also building on the industrial possibilities inherent in dealing with some of these materials, notable being the development of its Titanium technology strategy. It has recently announced the acquisition of ScoZinc, a Canadian exploration and mining corporation that has full ownership of the Scotia Mine and related facilities near Halifax, Nova Scotia, as well as several prospective exploration licenses in surrounding regions. The Corporation is managed by a new and focused leadership team with decades of mining, exploration and complementary technology experience.
Forward-looking Statements
This news release includes certain statements which are not comprised of historical facts and that constitute "forward-looking information" and "forward-looking statements" within the meaning of applicable Canadian securities laws. Forward-looking statements include estimates and statements that describe Fancamp’s future plans, objectives or goals, including words to the effect that Fancamp or its management expects a stated condition or result to occur. Forward-looking statements may be identified by such terms as "believes," "anticipates," "expects," "estimates," "may," "could," "would," "will," "foresees" or "plan." Since forward-looking statements are based on multiple factors, assumptions and address future events and conditions, by their very nature they involve inherent risks and uncertainties. Although these statements are based on information currently available to Fancamp, Fancamp provides no assurance that actual results will meet the management’s expectations. Risks, uncertainties and other factors involved with forward-looking information could cause actual events, results, performance, prospects and opportunities to differ materially or simply fail to materialize from those expressed or implied by such forward-looking information. Forward-looking information in this news release includes, but is not limited to, information and statements relating to the Corporation’s annual general meeting, and objectives, goals or future plans. There can be no assurance that forward-looking statements will prove to be accurate and actual results and future events could differ materially from those anticipated in such statements. Important factors that could cause actual results to differ materially from Fancamp’s expectations include, among others, political, economic, environmental and permitting risks, mining operational and development risks, litigation risks, regulatory restrictions, environmental and permitting restrictions and liabilities, the inability of Fancamp to raise capital or secure necessary financing in the future, as well as factors discussed in the section entitled "Risks and Uncertainties" in Fancamp’s management’s discussion and analysis of Fancamp’s financial statements for the period ended January 31, 2021. Although Fancamp has attempted to identify important factors that could cause actual results to differ materially, there may be other factors that cause results not to be as anticipated, estimated or intended. Fancamp considers its assumptions to be reasonable based on information currently available, but there can be no assurance that such statements will prove to be accurate as actual results and future events could differ materially from those anticipated in such statements. Accordingly, readers should not place undue reliance on forward-looking statements.
Neither TSX Venture Exchange nor its Regulation Services Provider (as that term is defined in policies of the TSX Venture Exchange) accepts responsibility for the adequacy or accuracy of this news release.
View source version on businesswire.com: https://www.businesswire.com/news/home/20210922005611/en/
Contacts
Rajesh Sharma, Chief Executive Officer
+1 (604) 434 8829
info@fancamp.ca
Debra Chapman, Chief Financial Officer
+1 (604) 434 8829
info@fancamp.ca
Media
Hyunjoo Kim
Director, Communication, Marketing & Digital Strategy
Kingsdale Advisors
Phone: 416-867-2357
Cell: 416-899-6463
Email: hkim@kingsdaleadvisors.com
TORONTO, September 22, 2021–(BUSINESS WIRE)–Nickel 28 Capital Corp. ("Nickel 28" or the "Company") (TSXV: NKL) (FSE: 3JC) is pleased to announce today the voting results for the election of its board of directors, which took place at the Company’s Annual General and Special Meeting held on September 16, 2021 in Toronto, Ontario, Canada. The number of directors was set at four and all of the nominees listed in the management proxy circular dated August 19, 2021 (the "Circular") were elected as directors of Nickel 28 at the meeting. Detailed results of the votes are set out below:
|
Election of Directors |
Outcome of the Vote |
||||
|
Votes for (#) |
Votes for (%) |
Votes |
Votes |
||
|
Justin Cochrane |
Elected |
12,189,245 |
94.914% |
653,132 |
5.086% |
|
Anthony Milewski |
Elected |
12,756,226 |
99.329% |
86,151 |
0.671% |
|
Maurice Swan |
Elected |
12,383,203 |
96.425% |
459,174 |
3.575% |
|
Philip Williams |
Elected |
12,807,826 |
99.371% |
34,551 |
0.269% |
At the Annual General and Special Meeting, the shareholders of the Company also approved: (i) the re-appointment of Baker Tilly WM LLP as auditor and authorized the directors to fix their remuneration; and (ii) on a disinterested basis, authorized the omnibus long-term incentive plan of the Company, all as more particularly described in the Circular. The voting results on each resolution are set out below:
|
Set Number of Directors at 4 |
||
|
Outcome of the Vote |
||
|
Votes for |
Votes against |
|
|
Carried |
12,773,897 |
68,480 |
|
99.467% |
0.533% |
|
|
Appointment of Auditor |
||
|
Outcome of the Vote |
||
|
Votes for |
Votes withheld |
|
|
Carried |
20,992,447 |
4,816 |
|
99.977% |
0.023% |
|
|
Approval of Omnibus Long-Term Incentive Plan |
||
|
Outcome of the Vote * |
||
|
Votes for |
Votes against |
|
|
Carried |
9,386,049 |
714,488 |
|
92.926% |
7.074% |
|
* Excluding an aggregate of 2,740,040 common shares voted at the Meeting that are beneficially owned by insiders of the Company in accordance with the rules of the TSX Venture Exchange.
Omnibus Long-Term Incentive Plan Amendments
In connection with the Meeting, the Company also adopted certain clarifying amendments to the Company’s omnibus long-term incentive plan (the "LTIP") approved by the board of directors in accordance with the terms of the LTIP and the authorizing resolution of shareholders approved at the Meeting. Specifically, the Company has amended the LTIP to clarify that: (a) any awards granted prior to becoming an insider of the Company are included in the calculation of the insider limitations under the rules of the TSX Venture Exchange ("TSXV") contained in the LTIP; (b) the extension of the expiration of any awards that would otherwise expire or settle during a blackout period is for a maximum of 10 days following the lifting of the blackout; (c) in the event of a participant ceasing to be eligible under the LTIP due to resignation, the maximum allowable extension of expiration of any award by the board of directors is one (1) year; (d) awards under the LTIP are both non-assignable and non-transferable other than in case of death (and that the LTIP cannot be amended in this regard while the Company is listed on the TSXV); and (e) any amendment to add or amend provisions relating to the granting of cash-settled awards, provision of financial assistance or clawbacks and any amendment to a cash-settled award, financial assistance or clawbacks provisions would require shareholder approval.
A copy of the amended LTIP will be made available on the Company’s profile on SEDAR at www.sedar.com and on the Company’s website at www.nickel28.com.
About Nickel 28
Nickel 28 Capital Corp. is a nickel-cobalt producer through its 8.56% joint-venture interest in the producing, long-life and world-class Ramu Nickel-Cobalt Operation located in Papua New Guinea. Ramu provides Nickel 28 with significant attributable nickel and cobalt production thereby offering our shareholders direct exposure to two metals which are critical to the adoption of electric vehicles. In addition, Nickel 28 manages a portfolio of 13 nickel and cobalt royalties on development and exploration projects in Canada, Australia and Papua New Guinea.
Cautionary Note Regarding Forward-Looking Statements
This news release contains certain information which constitutes ‘forward-looking statements’ and ‘forward-looking information’ within the meaning of applicable Canadian securities laws. Any statements that are contained in this news release that are not statements of historical fact may be deemed to be forward-looking statements. Forward-looking statements are often identified by terms such as "may", "should", "anticipate", "expect", "potential", "believe", "intend" or the negative of these terms and similar expressions. Forward-looking statements in this news release include, but are not limited to: statements and figures with respect to the operational and financial results; statements with respect to the prospects of nickel and cobalt in the global electrification of vehicles; statements related to the repayment of the Company’s Ramu operating debt; statements related to the production impacts of the Covid-19 pandemic; and statements with respect to the business and assets of the Company and its strategy going forward. Readers are cautioned not to place undue reliance on forward-looking statements. Forward-looking statements involve known and unknown risks and uncertainties, most of which are beyond the Company’s control. Should one or more of the risks or uncertainties underlying these forward-looking statements materialize, or should assumptions underlying the forward-looking statements prove incorrect, actual results, performance or achievements could vary materially from those expressed or implied by the forward-looking statements.
The forward-looking statements contained herein are made as of the date of this release and, other than as required by applicable securities laws, the Company does not assume any obligation to update or revise them to reflect new events or circumstances. The forward-looking statements contained in this release are expressly qualified by this cautionary statement.
Neither the TSX Venture Exchange nor its Regulation Services Provider (as that term is defined in the policies of the TSX Venture Exchange) accepts responsibility for the adequacy or accuracy of this release. No securities regulatory authority has either approved or disapproved of the contents of this news release.
View source version on businesswire.com: https://www.businesswire.com/news/home/20210922005779/en/
Contacts
Investor Contact:
Nickel 28 Investor Relations
Justin Cochrane
Tel: 647.846.7765
Email: info@nickel28.com
PERTH, Australia, Sept. 22, 2021 (GLOBE NEWSWIRE) — Wyloo Metals Pty Ltd ("Wyloo Metals") has today submitted a conversion notice to Noront Resources Ltd (TSXV:NOT) ("Noront"), notifying Noront to convert its US$15m convertible loan ("Convertible Loan") into common shares of Noront. Conversion of the loan will increase Wyloo Metals' ownership from 24.2% to approximately 37.3% of the outstanding common shares of Noront.
ABOUT WYLOO METALS
Wyloo Metals is the metals and mining subsidiary of Tattarang, one of Australia's largest private investment groups. Led by a multidisciplinary team of geologists, engineers and financial professionals, Wyloo Metals manages a diverse portfolio of exploration and development projects and cornerstone interests in a number of public and private companies. Wyloo Metals seeks to work closely with all stakeholders to accelerate projects through the development cycle while meeting the highest international environmental, social and governance standards. See more at: www.wyloometals.com.
Wyloo Canada Holdings Pty Ltd ("Wyloo Canada"), a wholly owned subsidiary of Wyloo Metals, currently holds an aggregate of 111,815,458 common shares of Noront, representing approximately 24.2% of the outstanding common shares of Noront. Wyloo Metals will convert its US$15 million Convertible Loan into common shares of Noront on the maturity date of September 30, 2021. At an exchange rate of 0.779 US Dollars per Canadian Dollar1, Wyloo Canada would acquire an additional 96,269,996 common shares of Noront upon conversion of its Convertible Loan, following which it would hold 208,085,454 common shares of Noront, representing approximately 37.3% of the outstanding common shares of Noront on a partially diluted basis.
Wyloo Canada also holds warrants ("Noront Warrants") to acquire 1,774,664 common shares of Noront at an exercise price of Cdn$0.35 per share. If the Noront Warrants are also fully exercised, Wyloo Canada would hold 209,860,118 common shares of Noront, representing approximately 37.5% of the outstanding common shares of Noront on a partially diluted basis.
DISCLAIMER
Some of the statements in this press release may be forward looking statements or statements of future expectations based on currently available information. Such statements are naturally subject to risks and uncertainties. Factors such as the development of general economic conditions, future market conditions, unusual catastrophic loss events, changes in the capital markets and other circumstances may cause the actual events or results to be materially different from those anticipated by such statements. Wyloo Metals does not make any representation or warranty, express or implied, as to the accuracy, completeness or updated status of such statements. Therefore, in no case whatsoever will Wyloo Metals and its affiliate companies be liable to anyone for any decision made or action taken in connection with the information and/or statements in this press release or for any related damages.
This press release is issued pursuant to National Instrument 62-103 — The Early Warning System and Related Take-Over Bid and Insider Reporting Issues, which requires a report to be filed under Noront's profile on SEDAR (www.sedar.com) containing additional information with respect to the foregoing matters. A copy of such report may be obtained by contacting Wyloo Metals at info®wyloometals.com. The address of Wyloo Metals is PO Box 3155, Broadway Nedlands, WA 6009 Western Australia.
___________________________
1At September 21, 2021
MEDIA CONTACT:
Andrew Bennett
M +61 427 782 503
P +61 8 6460 4949
E abennett@tattarang.com

Warren Buffett famously said, 'Volatility is far from synonymous with risk.' So it might be obvious that you need to consider debt, when you think about how risky any given stock is, because too much debt can sink a company. As with many other companies Aurelia Metals Limited (ASX:AMI) makes use of debt. But the real question is whether this debt is making the company risky.
When Is Debt Dangerous?
Debt assists a business until the business has trouble paying it off, either with new capital or with free cash flow. Part and parcel of capitalism is the process of 'creative destruction' where failed businesses are mercilessly liquidated by their bankers. While that is not too common, we often do see indebted companies permanently diluting shareholders because lenders force them to raise capital at a distressed price. Of course, the upside of debt is that it often represents cheap capital, especially when it replaces dilution in a company with the ability to reinvest at high rates of return. When we examine debt levels, we first consider both cash and debt levels, together.
Check out our latest analysis for Aurelia Metals
How Much Debt Does Aurelia Metals Carry?
The image below, which you can click on for greater detail, shows that at June 2021 Aurelia Metals had debt of AU$34.4m, up from none in one year. But on the other hand it also has AU$74.5m in cash, leading to a AU$40.1m net cash position.

How Strong Is Aurelia Metals' Balance Sheet?
The latest balance sheet data shows that Aurelia Metals had liabilities of AU$84.9m due within a year, and liabilities of AU$150.3m falling due after that. Offsetting these obligations, it had cash of AU$74.5m as well as receivables valued at AU$26.9m due within 12 months. So its liabilities outweigh the sum of its cash and (near-term) receivables by AU$133.7m.
While this might seem like a lot, it is not so bad since Aurelia Metals has a market capitalization of AU$389.0m, and so it could probably strengthen its balance sheet by raising capital if it needed to. But we definitely want to keep our eyes open to indications that its debt is bringing too much risk. Despite its noteworthy liabilities, Aurelia Metals boasts net cash, so it's fair to say it does not have a heavy debt load!
Better yet, Aurelia Metals grew its EBIT by 108% last year, which is an impressive improvement. If maintained that growth will make the debt even more manageable in the years ahead. There's no doubt that we learn most about debt from the balance sheet. But ultimately the future profitability of the business will decide if Aurelia Metals can strengthen its balance sheet over time. So if you're focused on the future you can check out this free report showing analyst profit forecasts.
Finally, a company can only pay off debt with cold hard cash, not accounting profits. While Aurelia Metals has net cash on its balance sheet, it's still worth taking a look at its ability to convert earnings before interest and tax (EBIT) to free cash flow, to help us understand how quickly it is building (or eroding) that cash balance. During the last three years, Aurelia Metals produced sturdy free cash flow equating to 56% of its EBIT, about what we'd expect. This free cash flow puts the company in a good position to pay down debt, when appropriate.
Summing up
While Aurelia Metals does have more liabilities than liquid assets, it also has net cash of AU$40.1m. And we liked the look of last year's 108% year-on-year EBIT growth. So we don't think Aurelia Metals's use of debt is risky. There's no doubt that we learn most about debt from the balance sheet. But ultimately, every company can contain risks that exist outside of the balance sheet. These risks can be hard to spot. Every company has them, and we've spotted 3 warning signs for Aurelia Metals you should know about.
When all is said and done, sometimes its easier to focus on companies that don't even need debt. Readers can access a list of growth stocks with zero net debt 100% free, right now.
This article by Simply Wall St is general in nature. We provide commentary based on historical data and analyst forecasts only using an unbiased methodology and our articles are not intended to be financial advice. It does not constitute a recommendation to buy or sell any stock, and does not take account of your objectives, or your financial situation. We aim to bring you long-term focused analysis driven by fundamental data. Note that our analysis may not factor in the latest price-sensitive company announcements or qualitative material. Simply Wall St has no position in any stocks mentioned.
Have feedback on this article? Concerned about the content? Get in touch with us directly. Alternatively, email editorial-team (at) simplywallst.com.
VANCOUVER, British Columbia, Sept. 20, 2021 (GLOBE NEWSWIRE) — Teck Resources Limited (TSX: TECK.A and TECK.B, NYSE: TECK) (“Teck”) is hosting its virtual Investor and Analyst Day on Tuesday, September 21, 2021.
The event will commence at 1:00 p.m. ET / 10:00 a.m. PT, with presentations by President and Chief Executive Officer Don Lindsay and members of the senior management team. The agenda includes Teck’s strategy to capitalize on its industry-leading copper growth profile to rebalance its portfolio towards low-carbon metals, capital allocation priorities, market and operations update, progress on the RACE21TM initiative, and Teck’s commitment to ESG leadership.
The webcast and presentation materials will be available on the Teck’s website at www.teck.com. Participants who wish to participate in the question-and-answer sessions after each panel discussion can access the conference facility by dialing 416.340.2217 or toll free 800.806.5484 (quote 7240967 if requested). Media are invited to attend on a listen-only basis.
Guidance Update
In conjunction with Investor and Analyst Day, Teck provided an update today on guidance.
Wildfires in British Columbia negatively affected our operations in the third quarter. As previously announced, the oxygen plant at Trail Operations resumed on August 13, 2021 following a temporary shutdown of approximately 10 days related to poor ambient air quality resulting from wildfires. The closure negatively impacted zinc production. As a result, we have reduced our 2021 annual refined zinc production guidance to 285,000 – 290,000 tonnes from 290,000 – 300,000 tonnes previously. We expect refined zinc production to be in the range of 72,000 – 75,000 tonnes in Q3 2021.
At Highland Valley Copper (HVC), operations were fully suspended on August 14, 2021 for a period of four days due to an evacuation order issued by the District of Logan Lake in response to wildfire activity in the area. The impact on production was not material and our annual contained copper production guidance for HVC is unchanged at 128,000 – 133,000 tonnes. However, concentrate shipment timing from HVC has been impacted due to wildfires and logistics disruptions, and we do not expect to catch up on the differential between higher production than sales from H1 2021. For our copper business unit, we expect sales in Q3 to be similar to production in Q3.
The impacts of wildfires on Teck’s steelmaking coal business have been previously incorporated into our coal guidance dated July 26, 2021.
At Red Dog, the latest start to the shipping season since 2010 due to weather and ice conditions, combined with record weather-related shipping delays in July and August, have reduced third quarter sales of zinc concentrate. We now expect Q3 2021 sales to be 145,000 – 155,000 tonnes of contained zinc, down from 180,000 – 200,000 tonnes previously. Despite the third quarter shortfall in shipping, assuming normal weather conditions, we continue to expect to be able to ship all zinc concentrates from Red Dog during the current shipping season as originally planned.
At our steelmaking coal operations in the Elk Valley, annual production is expected to be at the lower end of the current guidance range due to the previously noted wildfire impacts, compounded by increased absenteeism associated with COVID-19 exposure isolation protocols. Current inflationary cost pressures, notably diesel price, supplies and higher labour premiums, and lower production, have been partially offset with savings attributable to our RACE21™ program. At current unprecedented steelmaking coal prices, we have made decisions to maintain available production for sale by operating higher cost equipment and relying on overtime to offset the increased absenteeism, which has also contributed to higher unit costs. Further, although we typically balance maintenance outages between the second and third quarters, we made the decision in the second quarter to defer the maintenance outage at our Fording River Operations to the third quarter to meet demand for our products. Due to this deferral along with the above noted production decisions and cost pressures, our third quarter adjusted cost of sales is expected to come in at $66 to $68 per tonne and exceed the higher end of the annual guidance range. We note that this is an increase in Q3 costs of only $3 per tonne, based on the mid-point of quarterly guidance, versus an increase of USD$192 per tonne in the steelmaking coal price on an FOB basis since June 30, 2021. With our planned major processing shutdowns behind us combined with higher production in the fourth quarter versus the first three quarters of this year, we expect reduced fourth quarter unit costs and, as a result, we anticipate to come in at or slightly above the upper end of the annual guidance range of $59 to $64 per tonne.
Cautionary Statement on Forward-Looking Statements
This news release contains certain forward-looking information and forward-looking statements as defined in applicable securities laws (collectively referred to as forward-looking statements). These statements relate to future events or our future performance. All statements other than statements of historical fact are forward-looking statements. The use of any of the words “anticipate”, “plan”, “continue”, “estimate”, “expect”, “may”, “will”, “project”, “predict”, “potential”, “should”, “believe” and similar expressions is intended to identify forward-looking statements. These statements involve known and unknown risks, uncertainties and other factors that may cause actual results or events to differ materially from those anticipated in such forward-looking statements. These statements speak only as of the date of this news release.
These forward-looking statements include, but are not limited to, statements concerning: 2021 annual and Q3 refined zinc production guidance; annual contained copper production guidance for HVC; confirmation of steelmaking coal guidance provided July 26, 2021; Q3 contained zinc sales guidance; the expectation that we will be able to ship all zinc concentrates from Red Dog for the current shipping season; adjusted annual and third quarter cost of sales guidance for steelmaking coal; and all other estimates and projections associated with our business and operations.
These statements are based on a number of assumptions, including, but not limited to, assumptions regarding general business and economic conditions; commodity prices; acts of foreign or domestic governments, the supply and demand for, deliveries of, and the level and volatility of prices of copper, steelmaking coal and zinc; our ability to secure adequate transportation, including rail, pipeline and port services, for our products; continuing availability of water and power resources for our operations; our ability to procure equipment and operating supplies in sufficient quantities and on a timely basis; the availability of qualified employees and contractors for our operations; the outcome of our coal volume negotiations with customers; and our ongoing relations with our employees and with our business and joint venture partners. Statements concerning future production costs and volumes are based on numerous assumptions regarding operating matters and on assumptions that: counterparties perform their contractual obligations; operating and capital plans will not be disrupted by issues such as mechanical failure, unavailability of parts and supplies, labour disturbances, interruption in transportation or utilities, and adverse weather conditions. The foregoing list of assumptions is not exhaustive.
Factors that may cause actual results to vary materially include, but are not limited to: changes in market demand for our products; inaccurate geological and metallurgical assumptions (including with respect to the size, grade and recoverability of mineral reserves and resources); unanticipated operational difficulties (including failure of plant, equipment or processes to operate in accordance with specifications or expectations, cost escalation, unavailability of materials and equipment; government action; industrial disturbances or other job action, adverse weather conditions and unanticipated events related to health, safety and environmental matters); union labour disputes; impact of COVID-19 mitigation protocols; failure of customers or counterparties (including logistics suppliers) to perform their contractual obligations; and negative changes or deterioration in general economic conditions.
The forward-looking statements in this news release and actual results will also be impacted by the effects of COVID-19 and related matters. The overall effects of COVID-19 related matters on our business and operations and projects will depend on how the ability of our sites to maintain normal operations, and on the impacts on our suppliers, customers and markets for our products. Continuing operating activities is highly dependent on the progression of the pandemic and the success of measures taken to prevent transmission.
We assume no obligation to update forward-looking statements except as required under securities laws. Further information concerning risks and uncertainties associated with these forward-looking statements and our business can be found in our Annual Information Form for the year ended December 31, 2020, filed under our profile on SEDAR (www.sedar.com) and on EDGAR (www.sec.gov) under cover of Form 40-F, as well as subsequent filings that can also be found under our profile.
About Teck
As one of Canada’s leading mining companies, Teck is committed to responsible mining and mineral development with major business units focused on copper, zinc, and steelmaking coal, as well as investments in energy assets. Copper, zinc and high-quality steelmaking coal are required for the transition to a low-carbon world. Headquartered in Vancouver, Canada, Teck’s shares are listed on the Toronto Stock Exchange under the symbols TECK.A and TECK.B and the New York Stock Exchange under the symbol TECK. Learn more about Teck at www.teck.com or follow @TeckResources.
Investor Contact
Fraser Phillips
Senior Vice President, Investor Relations & Strategic Analysis
604.699.4621
fraser.phillips@teck.com
Media Contact
Chris Stannell
Public Relations Manager
604.699.4368
chris.stannell@teck.com

Rio Tinto Plc RIO recently announced that it has partnered with leading global energy producer, EDL. Per the deal, EDL will expand an existing solar installation at Rio Tinto’s Weipa mine in Queensland. Australia. EDL will add a 4 MW solar power generating capacity and 4 MW/4 MWh of battery storage, which will effectively triple the supply of clean, reliable energy to Rio Tinto’s bauxite mine operations in Weipa and the remote township. This move is in sync with Rio Tinto’s focus on lowering its carbon footprint across its operations and marks a step toward its goal of attaining net zero emissions by 2050.
Rio Tinto’s Weipa operations includes three bauxite mines (East Weipa, Andoom and Amrun), processing facilities, shiploaders, an export wharf, two ports, power stations, a rail network and ferry terminals. The development of Amrun, its newest mine that was completed in 2018, has extended the life of the Weipa bauxite operations by several decades.
In 2015, Rio Tinto had announced the launch of the Weipa Solar plant, which was the largest solar facility at an off-grid Australian mine site at that time. It was a pathbreaking project, which exhibited the viability of renewable energy systems in remote locations. EDL will now build, own and operate a new 4 MW solar plant and 4 MW/4 MWh of battery storage at Weipa that will complement the existing 1.6 MW solar farm. Work on the project is expected to be completed by late next year.
Once operational, the combined 4 MW solar capacity and 4 MW/4 MWh battery will have an annual capacity of 11 gigawatt hours of energy. Combined with upgrades to the existing Weipa power generation network, it will effectively cut down Weipa Operations’ diesel consumption by around 7 million litres per year. It will also help lower its annual carbon dioxide emissions by about 20,000 tons — the equivalent of taking more than 3,750 cars off the road.
Rio Tinto has earmarked approximately $1 billion in investments over the next five years to get its operations down to net zero emissions by 2050. Earlier this month, the company announced that it has teamed up with Caterpillar, Inc. CAT to develop zero-emissions autonomous haul trucks for use at Gudai-Darri, which is Rio Tinto’s most technically advanced iron ore mine in the Pilbara region, Western Australia. Earlier in June, the company announced that it will deploy the world’s first fully autonomous water truck at its Gudai-Darri mine also in partnership with Caterpillar.
Price Performance

Image Source: Zacks Investment Research
In the past year, shares of Rio Tinto have gained 7.5%, compared with the industry’s growth of 9.0%.
Zacks Rank & Stocks to Consider
Rio Tinto currently has a Zacks Rank #5 (Strong Sell).
Some better-ranked stocks in the basic materials space are Nucor Corporation NUE and The Chemours Company CC.
Nucor has a projected earnings growth rate of around 508% for the current year. The company’s shares have soared 112% in a year. It currently sports a Zacks Rank #1 (Strong Buy). You can see the complete list of today’s Zacks #1 Rank stocks here.
Chemours has an expected earnings growth rate of around 86.4% for the current year. The company’s shares have gained 39% in the past year. It currently carries a Zacks Rank #2 (Buy).
Want the latest recommendations from Zacks Investment Research? Today, you can download 7 Best Stocks for the Next 30 Days. Click to get this free report
Rio Tinto PLC (RIO): Free Stock Analysis Report
Caterpillar Inc. (CAT) : Free Stock Analysis Report
Nucor Corporation (NUE) : Free Stock Analysis Report
The Chemours Company (CC) : Free Stock Analysis Report
To read this article on Zacks.com click here.
Vancouver, British Columbia–(Newsfile Corp. – September 21, 2021) – Thesis Gold Inc. (TSXV: TAU) ("Thesis" or the "Company") is pleased to announce the commencement of an airborne light detection and ranging ("LiDAR") survey and a ground-based induced polarization ("IP") geophysical survey at its Ranch Gold-Copper Project, located in the Golden Horseshoe area of north-central British Columbia, Canada.
Ewan Webster, President and CEO, commented, "The IP survey is targeting new zones with extensive alteration footprints typically associated with epithermal and porphyry mineralization. The survey will allow us to look deep in the subsurface to help delineate drill targets for this and future campaigns. Combined these datasets will provide strong value to the project and increase confidence in future drilling."
Thesis has previously reviewed historical IP geophysics against ground magnetics, surface geochemistry, and drilling to produce a geophysical fingerprint for gold mineralization at Ranch. The 2021 IP survey is expected to cover approximately 9.48km2 and will be merged with historical IP data to produce a contiguous grid (Figure 1). The completion of this additional IP will leverage all previous work and is expected to produce strong epithermal and porphyry drill targets in conjunction with the extensive surface geochemistry programs already in progress.
LiDAR is a cost-effective survey method with multiple applications, including delineating structural breaks, mapping lithology, identifying zones of alteration, and providing extremely detailed imagery and topographic data. The survey will provide coverage of the entire project area and is expected to contextualize structural controls on known mineralization within the Property and outline new targets for subsequent surface work and drilling follow-up.
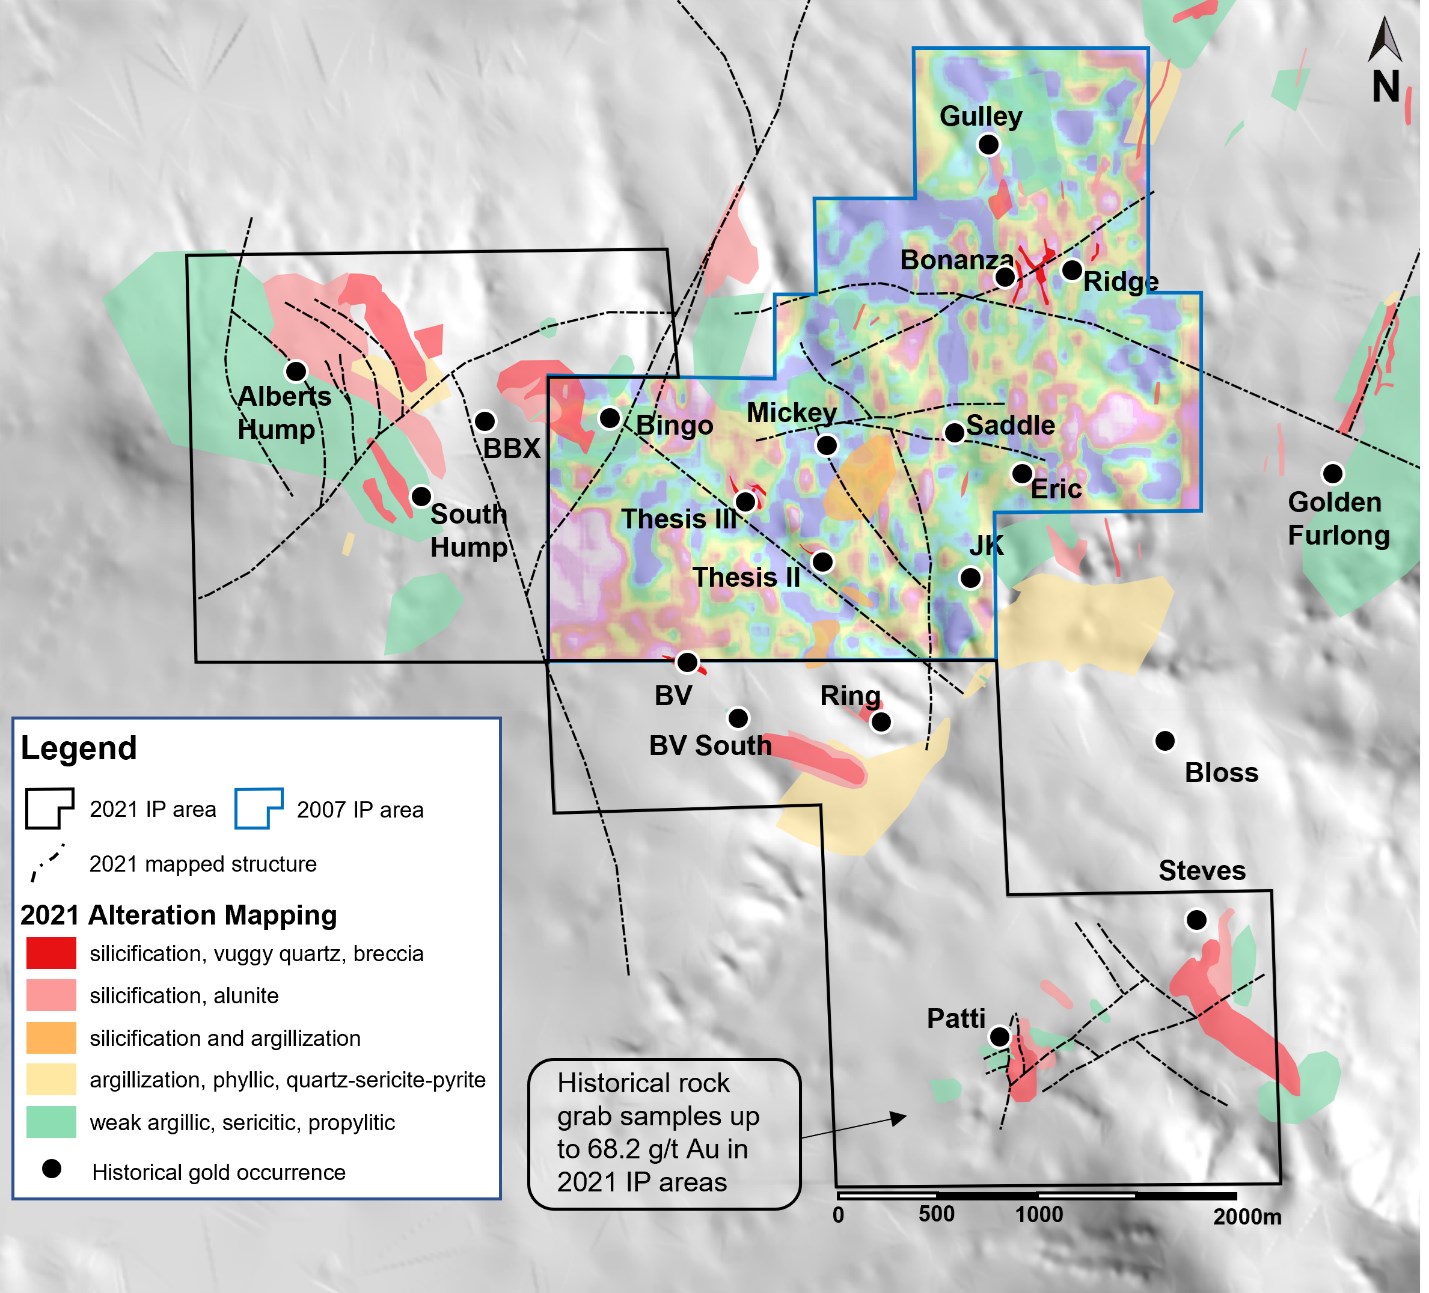
Figure 1: Historical IP (chargeability), 2021 IP areas, and 2021 alteration and structural mapping at Ranch.
To view an enhanced version of Figure 1, please visit:
https://orders.newsfilecorp.com/files/2191/97093_8cbcac5bf47818a6_001full.jpg
Figure 2: Photos of the ground-based induced polarization geophysical survey in progress. Left: DIAS32 Resistivity/IP System recorder. Right: Field technician installing a receiver electrode.
To view an enhanced version of Figure 2, please visit:
https://orders.newsfilecorp.com/files/2191/97093_image2.jpg
The technical content of this news release has been reviewed and approved by Michael Dufresne, M.Sc, P.Geol., P.Geo., a qualified person as defined by National Instrument 43-101.
On behalf of the Board of Directors
Thesis Gold Inc.
"Ewan Webster"
Ewan Webster Ph.D., P.Geo.
President, CEO and Director
About Thesis Gold Inc.
Thesis Gold is a mineral exploration company focused on proving and developing the resource potential of the 17,832-hectare Ranch Gold Project located in the "Golden Horseshoe" area of northern British Columbia, approximately 300 km north of Smithers, B.C. For further details about the Ranch Gold Project, please refer to the Company's current geological Technical Report dated September 18, 2020 available under the Company's profile on SEDAR at www.sedar.com.
Neither the TSX Venture Exchange nor its Regulation Services Provider (as that term is defined in the policies of the TSX Venture Exchange) accepts responsibility for the adequacy or accuracy of this press release.
Cautionary Statement Regarding Forward-Looking Information
This press release contains "forward-looking information" within the meaning of applicable Canadian securities legislation. Forward-looking information includes, without limitation, statements regarding the use of proceeds from the Company's recently completed financings, and the future plans or prospects of the Company. Generally, forward-looking information can be identified by the use of forward-looking terminology such as "plans", "expects" or "does not expect", "is expected", "budget", "scheduled", "estimates", "forecasts", "intends", "anticipates" or "does not anticipate", or "believes", or variations of such words and phrases or state that certain actions, events or results "may", "could", "would", "might" or "will be taken", "occur" or "be achieved". Forward-looking statements are necessarily based upon a number of assumptions that, while considered reasonable by management, are inherently subject to business, market and economic risks, uncertainties and contingencies that may cause actual results, performance or achievements to be materially different from those expressed or implied by forward-looking statements. Although the Company has attempted to identify important factors that could cause actual results to differ materially from those contained in forward-looking information, there may be other factors that cause results not to be as anticipated, estimated or intended. There can be no assurance that such information will prove to be accurate, as actual results and future events could differ materially from those anticipated in such statements. Accordingly, readers should not place undue reliance on forward-looking information. Other factors which could materially affect such forward-looking information are described in the risk factors in the Company's most recent annual management's discussion and analysis which is available on the Company's profile on SEDAR at www.sedar.com. The Company does not undertake to update any forward-looking information, except in accordance with applicable securities laws.
For further information:
Nick Stajduhar
Director
Telephone: 780-701-3216
Email: nicks@thesisgold.com
To view the source version of this press release, please visit https://www.newsfilecorp.com/release/97093
If you would like to receive our free newsletter via email, simply enter your email address below & click subscribe.
 Follow us on Twitter
 Become our facebook fan
CONNECT WITH US
Tweets
Tweet with hash tag #miningfeeds or @miningfeeds and your tweets will be displayed across this site.
MOST ACTIVE MINING STOCKS
Daily Gainers
 CMC Metals Ltd. CMC Metals Ltd. |
CMB.V | +900.00% |
 Eden Energy Ltd Eden Energy Ltd |
EDE.AX | +200.00% |
| GoviEx Uranium Inc. |
GXU.V | +42.86% |
| Eagle Nickel Ltd. |
ENL.AX | +41.67% |
| Citigold Corp. Limited |
CTO.AX | +33.33% |
| Mount Burgess Mining NL |
MTB.AX | +33.33% |
| Exalt Resources Limited |
ERD.AX | +31.94% |
| Casa Minerals Inc. |
CASA.V | +30.00% |
| Cariboo Rose Resources Ltd |
CRB.V | +28.57% |
| Belmont Resources Inc. |
BEA.V | +28.57% |


