MELBOURNE, Australia, August 19, 2021–(BUSINESS WIRE)–Rio Tinto is partnering with the Western Australian Government to launch a COVID-19 vaccination blitz targeting communities in the Pilbara and the fly-in fly-out workforce.
Following positive discussions between Rio Tinto and the WA Department of Health, vaccination hubs will be established in the Pilbara and at a trial clinic at Perth Airport to make vaccinations more accessible.
Starting with Tom Price, planning is underway for hubs at several locations in the Pilbara, with vaccines available to members of the local community, Indigenous communities, Rio Tinto employees, contractors and their families.
Rio Tinto is working with the Department of Health and the Shire of Ashburton and is close to finalising a location for the proposed Tom Price hub. The facility could potentially offer vaccines to the entire adult population of Tom Price and surrounding communities.
Rio Tinto’s COVID-19 screening facilities at Perth Airport (T2 and T3) will also be modified to include ‘pop-up’ vaccination hubs to target workers returning to Perth. The hubs will initially be available to Rio Tinto’s FIFO workforce, who regularly travel to and from the Pilbara, with the option to expand the vaccination service to the wider FIFO community.
The initial vaccination blitz is expected to commence in September, subject to availability of vaccines. Rio Tinto will work with the WA Government to finalise details in the coming weeks.
Rio Tinto Iron Ore chief executive Simon Trott said the company stood ready to support the WA Government’s vaccination rollout in any way it can.
"We are pleased to work in partnership with the WA Government on this industry-first vaccination blitz, which we expect will help boost vaccination rates in the Pilbara.
"This is an important development in our state’s effort to combat COVID-19. We know vaccinations are our best way out of this pandemic and we are very happy to convert our existing screening facilities, which have helped keep COVID-19 out of our operations and vulnerable communities for almost 18 months, to include vaccination hubs.
"Given Rio Tinto’s large operational footprint in the Pilbara, we are well positioned to support the WA Government’s vaccination rollout in the region, ensuring the vaccine is more accessible to remote and vulnerable communities.
"Plans are being developed to establish additional hubs in places like Paraburdoo, Pannawonica and Dampier, following the Tom Price vaccine blitz.
"While the initial vaccine blitz at Perth Airport will target Rio Tinto’s FIFO workforce, we will work with the WA Government to make our facilities available to others in the industry and community.
"Throughout the COVID-19 pandemic, the resources sector has worked hard to continue to operate in a COVID-safe way. The next step in is to play our part in making the vaccine accessible to as many Western Australians as possible."
View source version on businesswire.com: https://www.businesswire.com/news/home/20210818005863/en/
Contacts
Please direct all enquiries to
Media.enquiries@riotinto.com
Media Relations, Australia
Jonathan Rose
M +61 447 028 913
Matt Chambers
M +61 433 525 739
Jesse Riseborough
M +61 436 653 412
Jamie Macdonald
M +61 467 725 517
Rio Tinto plc
6 St James’s Square
London SW1Y 4AD
United Kingdom
T +44 20 7781 2000
Registered in England
No. 719885
Rio Tinto Limited
Level 7, 360 Collins Street
Melbourne 3000
Australia
T +61 3 9283 3333
Registered in Australia
ABN 96 004 458 404
Category: General
TSX-V: GBR
VANCOUVER, BC, Aug. 19, 2021 /CNW/ – Great Bear Resources Ltd. (the "Company" or "Great Bear") (TSXV: GBR) (OTCQX: GTBAF) today provides an update regarding its ongoing fully funded $45 million 2021 exploration program at its 100% owned flagship Dixie Project in the Red Lake district of Ontario.

Significant improvements in the forest fire situation in Northwestern Ontario have allowed the Ministry of Northern Development, Mines, Natural Resources and Forestry (MNRF) of Ontario to remove a work suspension order which was originally issued on July 21st, which had restricted industrial activities over a large area of the Province. With the work suspension rescinded on August 18th, Great Bear will now commence Phase 2 drilling, consisting of:
-
Ongoing expansion drilling of the LP Fault below 450 metres depth, and along strike beyond the 4 kilometre long Phase 1 grid drilling area,
-
Any additional infill drilling of the Phase 1 LP Fault grid drilling area that may be required,
-
Expansion and infill drilling of the Hinge, Limb and Arrow zones, and
-
Testing of new regional targets at Dixie.
Drills are expected to be active on the Dixie property as of Monday, August 23rd.
About the Dixie Project
The Dixie Project is 100% owned, comprised of 9,140 hectares of contiguous claims that extend over 22 kilometres, and is located approximately 25 kilometres southeast of the town of Red Lake, Ontario. The project is accessible year-round via a 15 minute drive on a paved highway which runs the length of the northern claim boundary and a network of well-maintained logging roads.
The Dixie Project hosts two principal styles of gold mineralization:
-
High-grade gold in quartz veins and silica-sulphide replacement zones (Dixie Limb, Hinge and Arrow zones). Hosted by mafic volcanic rocks and localized near regional-scale D2 fold axes. These mineralization styles are also typical of the significant mined deposits of the Red Lake district.
-
High-grade disseminated gold with broad moderate to lower grade envelopes (LP Fault). The LP Fault is a significant gold-hosting structure which has been seismically imaged to extend to 14 kilometres depth (Zeng and Calvert, 2006), and has been interpreted by Great Bear to have up to 18 kilometres of strike length on the Dixie property. High-grade gold mineralization is controlled by structural and geological contacts, and moderate to lower-grade disseminated gold surrounds and flanks the high-grade intervals. The dominant gold-hosting stratigraphy consists of felsic sediments and volcanic units.
About Great Bear
Great Bear Resources Ltd. is a well-financed gold exploration company managed by a team with a track record of success in mineral exploration. Great Bear is focused in the prolific Red Lake gold district in northwest Ontario, where the company controls over 200 km2 of highly prospective tenure across 4 projects, all 100% owned: The flagship Dixie Project, the Pakwash Property, the Sobel Property, and the Red Lake North Property, all of which are accessible year-round through existing roads.
Qualified Person and NI 43-101 Disclosure
Mr. R. Bob Singh, P.Geo, VP Exploration, and Ms. Andrea Diakow P.Geo, VP Projects for Great Bear are the Qualified Persons as defined by National Instrument 43-101 responsible for the accuracy of technical information contained in this news release.
ON BEHALF OF THE BOARD
"Chris Taylor"
Chris Taylor, President and CEO
Cautionary note regarding forward-looking statements
This release contains certain "forward looking statements" and certain "forward-looking information" as defined under applicable Canadian and U.S. securities laws. Forward-looking statements and information can generally be identified by the use of forward-looking terminology such as "may", "will", "should", "expect", "intend", "estimate", "anticipate", "believe", "continue", "plans" or similar terminology. The forward-looking information contained herein is provided for the purpose of assisting readers in understanding management's current expectations and plans relating to the future. Readers are cautioned that such information may not be appropriate for other purposes.
Forward-looking information are based on management of the parties' reasonable assumptions, estimates, expectations, analyses and opinions, which are based on such management's experience and perception of trends, current conditions and expected developments, and other factors that management believes are relevant and reasonable in the circumstances, but which may prove to be incorrect.
Such factors, among other things, include: impacts arising from the global disruption caused by the Covid-19 coronavirus outbreak, business integration risks; fluctuations in general macroeconomic conditions; fluctuations in securities markets; fluctuations in spot and forward prices of gold or certain other commodities; change in national and local government, legislation, taxation, controls, regulations and political or economic developments; risks and hazards associated with the business of mineral exploration, development and mining (including environmental hazards, industrial accidents, unusual or unexpected formations pressures, cave-ins and flooding); discrepancies between actual and estimated metallurgical recoveries; inability to obtain adequate insurance to cover risks and hazards; the presence of laws and regulations that may impose restrictions on mining; employee relations; relationships with and claims by local communities and indigenous populations; availability of increasing costs associated with mining inputs and labour; the speculative nature of mineral exploration and development (including the risks of obtaining necessary licenses, permits and approvals from government authorities); and title to properties.
Great Bear undertakes no obligation to update forward-looking information except as required by applicable law. Such forward-looking information represents management's best judgment based on information currently available. No forward-looking statement can be guaranteed and actual future results may vary materially. Accordingly, readers are advised not to place undue reliance on forward-looking statements or information.

View original content to download multimedia:https://www.prnewswire.com/news-releases/great-bear-begins-phase-2-drilling-at-dixie-project-301358592.html
SOURCE Great Bear Resources Ltd.

View original content to download multimedia: http://www.newswire.ca/en/releases/archive/August2021/19/c9216.html
VANCOUVER, August 19, 2021–(BUSINESS WIRE)–Capstone Mining Corp. ("Capstone" or the "Company") (TSX:CS) announces that Mr. Richard N. Zimmer has retired from the Board of Directors of the Company effective August 17, 2021.
Prior to Capstone, Mr. Zimmer was Chief Executive Officer of Far West Mining Ltd. ("Far West"), the previous owner and operator of the Santo Domingo project. He joined the Company’s Board of Directors in 2011 following Capstone’s acquisition of Far West. At Capstone, Mr. Zimmer served as the Chair of the Technical, Health, Environmental, Safety and Sustainability Committee from June 2011 until April 2019, and most recently served as Chair of the Corporate Governance & Nominating Committee.
Darren Pylot, President & CEO commented, "Rick was instrumental in the integration and advancement of the Santo Domingo project and contributed his invaluable expertise to our Board through the years. We thank him for his significant contributions and dedication to Capstone over his ten years of service on our Board."
ABOUT CAPSTONE MINING CORP.
Capstone Mining Corp. is a Canadian base metals mining company, focused on copper. We are committed to the responsible development of our assets and the environments in which we operate. Our two producing mines are the Pinto Valley copper mine located in Arizona, US and the Cozamin copper-silver mine in Zacatecas State, Mexico. In addition, Capstone owns 100% of Santo Domingo, a large scale, fully permitted, copper-iron-gold project in Region III, Chile, as well as a portfolio of exploration properties. Capstone's strategy is to focus on the optimization of operations and assets in politically stable, mining-friendly regions, centred in the Americas. Our headquarters are in Vancouver, Canada and we are listed on the Toronto Stock Exchange (TSX). Further information is available at www.capstonemining.com.
View source version on businesswire.com: https://www.businesswire.com/news/home/20210818005834/en/
Contacts
Jerrold Annett, SVP, Strategy and Capital Markets
647-273-7351
jannett@capstonemining.com
Kettina Cordero, Director, Investor Relations & Communications
604-262-9794
kcordero@capstonemining.com
Teck Resources Ltd TECK recently announced that the wildfire evacuation order issued by the District of Logan Lake has been lifted for the company’s Highland Valley Copper Operations (HVC). HVC has resumed operations and is on track to ramp up to full production. On Aug 14, Teck temporarily suspended its British Columbia-based HVC operations in response to the forest fire incident.
Earlier this month, Teck reported smoke from wildfires in southwestern British Columbia that impacted its Trail Operations metallurgical facility. Trail’s oxygen plant was closed down due to poor air quality. While Zinc and Lead refining operations continue to operate normally, lead smelting operations were temporarily idled.
On Aug 13, Trail’s oxygen plants restarted following an improvement in air quality. Operations at the Trail metallurgical facility are ramping back up to full capacity.
The company is focused on safeguarding the health and safety of employees and contractors, and continues to monitor wildfire and regional air quality conditions.
Last month, the company reported second-quarter 2021 results, wherein earnings beat the Zacks Consensus Estimate but sales missed the same. Both the bottom-and top-line figures increased year over year.
Teck Resources expects steelmaking coal production between 25 million tons and 26 million tons in 2021. Copper production is anticipated within 275,000-290,000 tons. Zinc production is projected between 605,000 tons and 630,000 tons. The company estimates Bitumen production for 2021 between 6.6 million barrels and 8.1 million barrels.
For the third quarter, at Red Dog, the company projects sales of zinc in concentrate to be 180,000-200,000 tons. Steelmaking coal sales are projected to be 5.7-6.1 million for the quarter.
Price Performance
The company’s shares have soared 83.9% over the past year, outperforming the industry’s rally of 25.9%.

Image Source: Zacks Investment Research
Zacks Rank & Stocks to Consider
Teck Resources currently carries a Zacks Rank #3 (Hold).
Better-ranked stocks in the basic materials space include Avient Corporation AVNT, Veritiv Corporation VRTV and Commercial Metals Company CMC. While Avient and Veritiv flaunt a Zacks Rank #1 (Strong Buy), Commercial Metals carries a Zacks Rank #2. You can see the complete list of today’s Zacks #1 Rank stocks here.
Avient has a projected earnings growth rate of 75% for 2021. The company’s shares have soared 92% in the past year.
Veritiv has an estimated earnings growth rate of 215% for the current year. Over the past year, the company’s shares have soared 340%.
Commercial Metals has an expected earnings growth rate of 32.8% for the current fiscal year. The company’s shares have gained 54% in a year’s time.
Want the latest recommendations from Zacks Investment Research? Today, you can download 7 Best Stocks for the Next 30 Days. Click to get this free report
Commercial Metals Company (CMC) : Free Stock Analysis Report
Veritiv Corporation (VRTV) : Free Stock Analysis Report
Teck Resources Ltd (TECK) : Free Stock Analysis Report
Avient Corporation (AVNT) : Free Stock Analysis Report
To read this article on Zacks.com click here.
PERTH, Australia, Aug. 19, 2021 (GLOBE NEWSWIRE) —
Wyloo Metals Pty Ltd (“Wyloo Metals”) provides the following update regarding its intentions in relation to the offer by BHP Western Mining Resources International Pty Ltd ("BHP") to acquire all of the outstanding common shares of Noront Resources Ltd (TSXV:NOT) ("Noront").
Response to BHP’s offer
Noront’s Ring of Fire land package hosts some of the most prospective mineral deposits in the world. These deposits have the potential to become Canada’s next great mineral district, supporting the production of future-facing commodities for multiple generations. Wyloo Metals continues to firmly believe in the immense potential of the Ring of Fire and therefore does not intend to support or tender its Noront shares to BHP's offer.
Wyloo Metals was disappointed that the Noront Board did not seek to meaningfully engage or negotiate with it prior to accepting the BHP offer. Given Wyloo Metals’ cornerstone interest of approximately 37.5% (partially diluted) of Noront, the minimum mandatory tender condition for BHP's bid is unlikely to be satisfied without Wyloo Metals' support and a second step acquisition transaction is impossible.
Superior offer by Wyloo Metals
Wyloo Metals would consider proposing a superior offer to acquire the outstanding common shares of Noront it does not already own, should it be provided with access to due diligence. Despite numerous attempts to date, the Noront Board has denied Wyloo Metals from obtaining access to due diligence on reasonable terms for a shareholder with a cornerstone position.
Unfortunately, the total value of any superior offer contemplated by Wyloo Metals must accommodate the Cdn$13 million break fee payable to BHP, which was agreed to by the Noront Board to the direct detriment of Noront’s shareholders.
ABOUT WYLOO METALS
Wyloo Metals is the metals and mining subsidiary of Tattarang, one of Australia’s largest private investment groups. Led by a multidisciplinary team of geologists, engineers and financial professionals, Wyloo Metals manages a diverse portfolio of exploration and development projects and cornerstone interests in a number of public and private companies. Wyloo Metals seeks to work closely with all stakeholders to accelerate projects through the development cycle while meeting the highest international environmental, social and governance standards. See more at: www.wyloometals.com.
Wyloo Canada Holdings Pty Ltd (“Wyloo Canada”), a wholly owned subsidiary of Wyloo Metals, currently holds an aggregate of 111,815,458 common shares of Noront, representing approximately 24.4% of the outstanding common shares of Noront. As previously announced on July 23, 2021, Wyloo Metals intends to convert its US$15 million convertible loan (“Convertible Loan”) into common shares of Noront at or before the September 30, 2021 maturity date. At an exchange rate of 0.792 US Dollars per Canadian Dollar1, Wyloo Canada would acquire an additional 94,702,494 common shares of Noront upon conversion of its Convertible Loan, following which it would hold 206,517,952 common shares of Noront, representing approximately 37.3% of the outstanding common shares of Noront on a partially diluted basis.
Wyloo Canada also holds warrants (“Noront Warrants”) to acquire 1,774,664 common shares of Noront at an exercise price of Cdn$0.35 per share. If the Noront Warrants are also fully exercised, Wyloo Canada would hold 208,292,616 common shares of Noront, representing approximately 37.5% of the outstanding common shares of Noront on a partially diluted basis.
DISCLAIMER
Some of the statements in this press release may be forward looking statements or statements of future expectations based on currently available information. Such statements are naturally subject to risks and uncertainties. Factors such as the development of general economic conditions, future market conditions, unusual catastrophic loss events, changes in the capital markets and other circumstances may cause the actual events or results to be materially different from those anticipated by such statements. Wyloo Metals does not make any representation or warranty, express or implied, as to the accuracy, completeness or updated status of such statements. Therefore, in no case whatsoever will Wyloo Metals and its affiliate companies be liable to anyone for any decision made or action take in connection with the information and/or statements in this press release or for any related damages.
This press release is issued pursuant to National Instrument 62-103 – The Early Warning System and Related Take-Over Bid and Insider Reporting Issues, which requires a report to be filed under Noront’s profile on SEDAR (www.sedar.com) containing additional information with respect to the foregoing matters. A copy of such report may be obtained by contacting Wyloo Metals at info@wyloometals.com. The address of Wyloo Metals is PO Box 3155, Broadway Nedlands, WA 6009 Western Australia.
1 At August 18, 2021.

Vancouver, British Columbia–(Newsfile Corp. – August 19, 2021) – EMX Royalty Corporation (NYSE American: EMX) (TSXV: EMX) (FSE: 6E9) (the "Company" or "EMX") announces that pursuant to the Company's Stock Option Plan, incentive stock options (the "Options") to purchase an aggregate of 500,000 common shares, exercisable at a price of $3.66 per share for a period of five years, has been granted to certain directors, and a consultant of the Company.
About EMX. EMX is a precious, base and battery metals royalty company. EMX's investors are provided with discovery, development, and commodity price optionality, while limiting exposure to risks inherent to operating companies. The Company's common shares are listed on the NYSE American Exchange and TSX Venture Exchange under the symbol "EMX"; and on the Frankfurt exchange under the symbol "6E9". Please see www.EMXroyalty.com for more information.
For further information contact:
David M. Cole
President and Chief Executive Officer
Phone: (303) 979-6666
Dave@EMXroyalty.com
Scott Close
Director of Investor Relations
Phone: (303) 973-8585
SClose@EMXroyalty.com
Isabel Belger
Investor Relations (Europe)
Phone: +49 178 4909039
Ibelger@EMXroyalty.com
Neither the TSX Venture Exchange nor its Regulation Services Provider (as that term is defined in policies of the TSX Venture Exchange) accepts responsibility for the adequacy or accuracy of this release.

To view the source version of this press release, please visit https://www.newsfilecorp.com/release/93798
Shares of United States Steel (X) have been strong performers lately, with the stock up 27.7% over the past month. The stock hit a new 52-week high of $30.57 in the previous session. United States Steel has gained 75.6% since the start of the year compared to the 9.6% move for the Zacks Basic Materials sector and the 56.9% return for the Zacks Steel – Producers industry.
What's Driving the Outperformance?
The stock has an impressive record of positive earnings surprises, as it hasn't missed our earnings consensus estimate in any of the last four quarters. In its last earnings report on July 29, 2021, U.S. Steel reported EPS of $3.37 versus consensus estimate of $3.16.
For the current fiscal year, U.S. Steel is expected to post earnings of $11.92 per share on $18.98 billion in revenues. This represents a 355.25% change in EPS on a 94.87% change in revenues. For the next fiscal year, the company is expected to earn $4.66 per share on $16.35 billion in revenues. This represents a year-over-year change of -60.87% and -13.88%, respectively.
Valuation Metrics
U.S. Steel may be at a 52-week high right now, but what might the future hold for the stock? A key aspect of this question is taking a look at valuation metrics in order to determine if the company has run ahead of itself.
On this front, we can look at the Zacks Style Scores, as they provide investors with an additional way to sort through stocks (beyond looking at the Zacks Rank of a security). These styles are represented by grades running from A to F in the categories of Value, Growth, and Momentum, while there is a combined VGM Score as well. Investors should consider the style scores a valuable tool that can help you to pick the most appropriate Zacks Rank stocks based on their individual investment style.
U.S. Steel has a Value Score of B. The stock's Growth and Momentum Scores are B and F, respectively, giving the company a VGM Score of B.
In terms of its value breakdown, the stock currently trades at 2.5X current fiscal year EPS estimates. This isn't enough to put the company in the top echelon of all stocks we cover from a value perspective.
Zacks Rank
We also need to consider the stock's Zacks Rank, as this supersedes any trend on the style score front. Fortunately, U.S. Steel currently has a Zacks Rank of #1 (Strong Buy) thanks to rising earnings estimates.
Since we recommend that investors select stocks carrying Zacks Rank of 1 (Strong Buy) or 2 (Buy) and Style Scores of A or B, it looks as if U.S. Steel meets the list of requirements. Thus, it seems as though U.S. Steel shares could have a bit more room to run in the near term.
How Does U.S. Steel Stack Up to the Competition?
Shares of U.S. Steel have been soaring, and the company still appears to be a decent choice, but what about the rest of the industry? Some of its industry peers are also impressive, including Commercial Metals (CMC), Ternium (TX), and Nucor (NUE), all of which currently have a Zacks Rank of at least #2 and a VGM Score of at least B, making them well-rounded choices.
The Zacks Industry Rank is in the top 5% of all the industries we have in our universe, so it looks like there are some nice tailwinds for U.S. Steel, even beyond its own solid fundamental situation.
Want the latest recommendations from Zacks Investment Research? Today, you can download 7 Best Stocks for the Next 30 Days. Click to get this free report
United States Steel Corporation (X) : Free Stock Analysis Report
Nucor Corporation (NUE) : Free Stock Analysis Report
Ternium S.A. (TX) : Free Stock Analysis Report
Commercial Metals Company (CMC) : Free Stock Analysis Report
To read this article on Zacks.com click here.
Zacks Investment Research
ST. JOHN’S, Newfoundland and Labrador, August 19, 2021–(BUSINESS WIRE)–Altius Minerals Corporation (ALS:TSX) (ATUSF: OTCQX) ("Altius" or the "Corporation") is pleased to announce that it has renewed its Normal Course Issuer Bid ("NCIB") and may purchase at market price up to 1,642,612 common shares ("Shares"), being approximately 3.96% of the 41,504,497 common shares issued and outstanding as of August 18, 2021, by way of an NCIB through the facilities of the Toronto Stock Exchange ("TSX") or a Canadian alternative trading system. The NCIB is subject to regulatory approval. The NCIB will commence August 22, 2021 and will end no later than August 21, 2022. Any Shares purchased pursuant to the NCIB will be cancelled and returned to treasury.
The TSX rules permit Altius to purchase daily, through TSX facilities or approved alternative trading systems, a maximum of 30,870 Shares under the NCIB. From August 22, 2020 to August 21, 2021 Altius purchased a total of 477,400 Shares through market purchases on the TSX and alternative trading systems at a weighted average price of $15.55 per Share, while its approval allowed for it to purchase a maximum number of 1,622,920 Shares. The reason for the NCIB is that, in the opinion of the board of directors, the value of Altius Shares, based on anticipated cash flows and underlying asset values, is from time to time greater than the market price of the Shares and accordingly the acquisition of Shares under the NCIB represents an appropriate use of funds. Altius has had an active NCIB program every year since 2010.
About Altius
Altius’s strategy is to create per share growth through a diversified portfolio of royalty assets that relate to long life, high margin operations. This strategy further provides shareholders with exposures that are well aligned with sustainability-related global growth trends including the electricity generation transition from fossil fuel to renewables, transportation electrification, reduced emissions from steelmaking and increasing agricultural yield requirements. These macro-trends each hold the potential to cause increased demand for many of Altius’s commodity exposures including copper, renewable based electricity, several key battery metals (lithium, nickel and cobalt), clean iron ore, and potash. In addition, Altius runs a successful Project Generation business that originates mineral projects for sale to developers in exchange for equity positions and royalties. Altius has 41,504,497 common shares issued and outstanding that are listed on Canada’s Toronto Stock Exchange. It is a member of both the S&P/TSX Small Cap and S&P/TSX Global Mining Indices.
Forward-looking information
This news release contains forward‐looking information. The statements are based on reasonable assumptions and expectations of management and Altius provides no assurance that actual events will meet management's expectations. In certain cases, forward‐looking information may be identified by such terms as "anticipates", "believes", "could", "estimates", "expects", "may", "shall", "will", or "would". Although Altius believes the expectations expressed in such forward‐looking statements are based on reasonable assumptions, such statements are not guarantees of future performance and actual results or developments may differ materially from those projected. Readers should not place undue reliance on forward-looking information. Altius does not undertake to update any forward-looking information contained herein except in accordance with securities regulation.
View source version on businesswire.com: https://www.businesswire.com/news/home/20210819005068/en/
Contacts
Flora Wood
Email: Fwood@altiusminerals.com
Tel: 1.877.576.2209
Direct: +1(416)346.9020
Ben Lewis
Email: Blewis@altiusminerals.com
Tel: 1.877.576.2209
(Bloomberg) — Iron ore extended its rout as BHP Group warned it sees an increasing likelihood of “stern cuts” to China’s steel output this year.
The prospect of much lower steel production in the second-half is “testing the bullish resolve of the futures markets,” BHP wrote in a commodities outlook report on its website. Iron ore in Singapore has plunged by a third since spiking to an all-time high in May.
China’s steel industry is under pressure after pledging to reduce output this year, a goal that requires huge second-half curbs to offset booming output earlier in 2021. Production in July was more than 8% lower year-on-year, data on Monday showed.
Futures in Singapore fell 6.5% to $147.95 a ton by 6:49 p.m. local time, and were heading for a fifth weekly loss. In China, futures dropped 2.5% to close at the lowest level since November.
While investor attention is very focused on China’s output curbs in the second half, the nation’s demand trends will also be critical. Beijing is pushing a range of measures to control the property sector, which accounts for big chunk of steel usage and has traditionally helped drive surges in iron ore prices.
“Policymakers are clearly concerned about over-investment and concentrated credit risk in the property sector,” Commonwealth Bank of Australia wrote in an emailed note. And even if China swings to more pro-growth policies to battle recent weakness, “there’s a good chance that the property sector is left out”.
Shanghai steel futures also dropped, with hot-rolled coil down 3.3% and rebar down 3.8%.
More stories like this are available on bloomberg.com
Subscribe now to stay ahead with the most trusted business news source.
©2021 Bloomberg L.P.
BHP Group BHP reported underlying attributable profit of $17.1 billion in the fiscal 2021 (ended Jun 30, 2021), which was up 88% year over year, reflecting higher commodity prices and strong operational performance. Earnings per American Depositary Share (ADS) was $6.75 in fiscal 2021, up from $3.58 in fiscal 2020 but missed the Zacks Consensus Estimate of $6.93. Underlying earnings per share was $3.38, compared with $1.79 in fiscal 2020. The company’s each American Depositary Shares represents two fully-paid ordinary shares. It also made a flurry of announcements — to exit its oil and gas operations as it strikes a merger deal with Woodside Petroleum Ltd, approval of $5.7 billion in capital expenditure in Jansen Potash Mine in Canada and its decision to unify its dual-listed structure.
The company’s attributable profit amounted to $11.3 billion in fiscal 2021, including an exceptional loss of $5.8 billion. The exceptional loss was related to the impairments of potash and energy coal assets as well as the current year impact of the Samarco dam failure. Attributable profit in fiscal 2020 was $7.9 billion, which included an exceptional loss of $1.1 billion.
Revenues & Margin Performance
Revenues for fiscal 2021 totaled $60.8 billion, which beat the Zacks Consensus Estimate of $60.2 billion. It marked an improvement of 42%from revenues of $42.9 billion in the prior fiscal. The Iron ore segment’s revenues surged 66% year over year to $34 billion on higher prices and record production achieved at WAIO. Revenues in the Copper segment rose 47% to $15.7 billion, reflecting higher prices. Revenues in the Petroleum fell 3% year over year to $3.9 billion. The Coal segment’s revenues slumped 17% to $5 billion.
Adjusted profit from operations in fiscal 2021 soared 91% year over year to $30.3 billion owing to higher commodity prices and strong underlying operational performance, lower deferred stripping depletion at Escondida, lessened fuel and energy costs, and savings from the company’s cost reduction initiatives. Unfavorable impacts of exchange rate movements, copper grade decline, natural field decline in Petroleum, inflation, adverse weather and planned maintenance somewhat mitigated these impacts. Underlying earnings before interest, taxes, depreciation, and amortization (EBITDA) were $37.4 billion for fiscal 2021, up 69% year over year.
Balance Sheet & Cash Flow
Net operating cash flow for fiscal 2021 was $27.2 billion compared with $15.7 billion in fiscal 2020. This marked 15th consecutive year of generating net operating cash flow above the $15 billion mark. The company reported record free cash flow of $19.4 billion, courtesy of higher iron ore and copper prices, and a strong operational performance.
Cash and cash equivalents as of Jun 30, 2021 amounted to $15.2 billion, up from $13.4 billion at the end of fiscal 2020. Capital and exploration expenditure totaled $7.1 billion, down 7% from the prior fiscal. The company provided capital and exploration guidance at $7.1 billion for fiscal 2022. As of the end of fiscal 2021, net debt was $4 billion, substantially lower than $12 billion reported as of fiscal 2020. Backed by strong fiscal 2021 results, BHP Group’s board announced a record final dividend of $2.00 per share.
Other Updates
In fiscal 2021, the company successfully achieved first production at four major development projects — on or ahead of schedule and on budget. It acquired an additional 28% working interest in Shenzi in November 2020. The Shenzi North development, a two-well subsea tie-in to the Shenzi platform, was approved in August 2021. At the end of fiscal 2021, BHP Group had two major projects under development — Mad Dog Phase 2 in petroleum and Jansen mine shafts in potash.
Significant Announcements
BHP Group approved $5.7 billion in capital expenditure for the Jansen Stage 1 potash project. First ore is expected in 2027. Once operational, Jansen S1 is expected to produce approximately 4.35 million ton of potash per year. This will provide the company exposure to a commodity with a strong demand outlook and immense growth potential.
The company has agreed to pursue a merger of its Petroleum business with Woodside Petroleum Ltd, which will create a global top 10 independent energy company by production. The combined business will have a high margin oil portfolio and long life LNG assets. Woodside would issue new shares to be distributed to BHP Group’s shareholders. Woodside shareholders will own 52% of the merged group, while BHP Group’s shareholders owning the remaining 48%. Woodside and BHP Group have estimated annual synergies in excess of $400 million per year. The Petroleum segment generated 6% of BHP Group’s fiscal 2021 revenues.
BHP Group intends to unify its corporate structure under its existing Australian parent company to realize simplification and enhanced strategic flexibility benefits.
Fiscal 2022 Production & Cost Guidance
In fiscal 2022, the company expects to produce between 249 Mt and 259 Mt of iron ore compared with 254 Mt produced in fiscal 2021 as WAIO continues to focus on incremental volume growth through productivity improvements. The petroleum production guidance is 99-106 MMboe. BHP Group anticipates copper production between 1,590 kt and 1,760 kt. Production guidance of Metallurgical coal for fiscal 2022 is at 39-44 Mt, while the same for energy coal is at 13-15 Mt. Nickel production is expected between 85 kt and 95 kt.
Conventional Petroleum unit cost is projected at $11-$12 per barrels of oil equivalent (boe) for fiscal 2022. Escondida unit cost is anticipated at $1.20-$1.40 per pound. Queensland Coal unit cost for the fiscal is expected at $80-$90 per ton. WAIO unit cost guidance is projected to be $17.50-$18.50 per ton.
The company expects demand for energy, metals and fertilizers to remain strong in the years to come, fueled by global economic growth, population growth and rising living standards. The near-term outlook, however, remains cloudy due to the uncertainties associated with the COVID-19 pandemic.
Price Performance

Image Source: Zacks Investment Research
BHP Group’s shares have gained 22.7% over the past year compared with the industry’s growth of 21%.
Zacks Rank & Other Key Picks
BHP Group currently carries a Zacks Rank #2 (Buy). You can see the complete list of today’s Zacks #1 Rank (Strong Buy) stocks here.
Some other top-ranked stocks in the basic materials space include Avient Corporation AVNT, Veritiv Corporation VRTV and Commercial Metals Company CMC. While Avient and Veritiv flaunt a Zacks Rank #1, Commercial Metals carries a Zacks Rank #2.
Avient has a projected earnings growth rate of 75% for 2021. The company’s shares have soared 92% in the past year.
Veritiv has an estimated earnings growth rate of 215% for the current year. Over the past year, the company’s shares have soared 340%.
Commercial Metals has an expected earnings growth rate of 32.8% for the current fiscal year. The company’s shares have gained 54% in a year’s time.
Want the latest recommendations from Zacks Investment Research? Today, you can download 7 Best Stocks for the Next 30 Days. Click to get this free report
BHP Group Limited Sponsored ADR (BHP) : Free Stock Analysis Report
Commercial Metals Company (CMC) : Free Stock Analysis Report
Veritiv Corporation (VRTV) : Free Stock Analysis Report
Avient Corporation (AVNT) : Free Stock Analysis Report
To read this article on Zacks.com click here.
By Sonali Paul
(Reuters) – Australia's Woodside Petroleum Ltd shares fell more than 4% on Wednesday in the market's first verdict on a merger with BHP Group's petroleum business that will turn it into a global top 10 oil and gas producer.
The deal, announced after the market closed on Tuesday, involves Woodside doubling its share base to acquire BHP's oil and gas arm in a nil-premium merger to create a roughly A$40 billion ($29 billion) company.
Woodside shareholders will own 52% of the merged group, with BHP shareholders owning 48%.
The merger, expected to be completed in mid-2022, will double Woodside's output and market capitalisation.
Some analysts praised the deal, saying the share price drop reflected worries about a stock overhang as many BHP shareholders who want out of fossil fuels may dump the shares.
"The price of all this funding headroom is a huge share overhang, which … could leave the better part of A$10 billion of Woodside's stock to change hands," CLSA analysts said in a note which maintained an underperform rating on the stock.
"However, we emphasise Woodside 2.0 will be more attractive fundamentally, and our recommendation could become significantly more positive once the market digests the new deal and the new shares," CLSA said.
Others, however, were more negative.
Fund manager Van Eck Australia questioned the value of the merger and said it may have difficulty winning approval from Woodside shareholders.
"While the merger offers Woodside increased diversification, it is also forcing the company to take on aging oil fields and remediation issues," said Jamie Hannah, deputy head of investments at fund manager Van Eck Australia.
The shares partly recovered in morning trade to be down 2.1% in a flat broader market. The stock had already fallen 5% since speculation started swirling in July about a potential merger with BHP petroleum involving a huge issue of shares.
Woodside earlier reported a 17% rise in first-half underlying profit on a rebound from last year's pandemic-hit oil prices, but missed broker forecasts and trimmed its annual production outlook.
Woodside's underlying net profit rose to $354 million for the six months to June 30 from $303 million a year earlier. That was well short of broker forecasts around $413 million on Visible Alpha.
The company trimmed the top end of its annual production outlook to 93 million barrels of oil equivalent (mmboe) from 95 mmboe, implying a drop of at least 7% from last year's record output.
Most of the decline is due to falling output at its ageing, mainstay North West Shelf LNG project. Woodside, the operator, will be doubling its stake to one-third of North West Shelf with the BHP merger.
($1 = 1.3782 Australian dollars)
(Reporting by Sonali Paul; Additional reporting by Soumyajit Saha and Shashwat Awasthi in Bengaluru; Editing by Aditya Soni, Stephen Coates and Richard Pullin)
Vancouver, British Columbia–(Newsfile Corp. – August 18, 2021) – David H. Brett, President and CEO, Pacific Bay Minerals Ltd. (TSXV: PBM) ("Pacific Bay" or the "Company") is pleased to announce that Precision GeoSurveys Inc. ("Precision") has completed the airborne magnetic survey (the "Survey"), announced on June 16, 2021, over the Company's 100% owned Wheaton Creek Gold property (the "Property") in Northern British Columbia. The survey has successfully outlined distinctive magnetic features that will assist the drill targeting in the upcoming program.
From the Company's VP of Exploration, Sebastien Ah Fat, "We are very pleased to find that the Survey has successfully confirmed our initial theory that a well-defined ultramafic contact boundary exists on the Property. The discovery of thick zones of magnetic lows that abruptly transition from magnetic highs may be associated with liswanite mineralization. Listwanite, being formed by the carbonization of serpentinized ultramafic rock, is a key alteration indicator commonly associated with mesothermal quartz carbonate gold deposits and we hope to confirm this via our future drilling programs at Wheaton Creek Gold."
The Survey successfully identified magnetic high anomalies of the Cache Creek Ultramafic Complex and distinctive contact fault boundaries which are prospective for hydrothermal deposition. Furthermore, a thick, northwest-trending, magnetic low anomaly adjoining the Cache Creek Ultramafic Complex to the east may correlate with carbonization of serpentinized ultramafic rock known as liswanite. Listwanite is a distinctive alteration feature commonly associated with lode gold, quartz carbonate gold deposits. These findings reinforce the thesis that Wheaton Creek bears many geologic similarities to the Atlin Mining Camp where the source of the placer gold was found to be at or near fault boundaries of ultramafic and sedimentary rock.
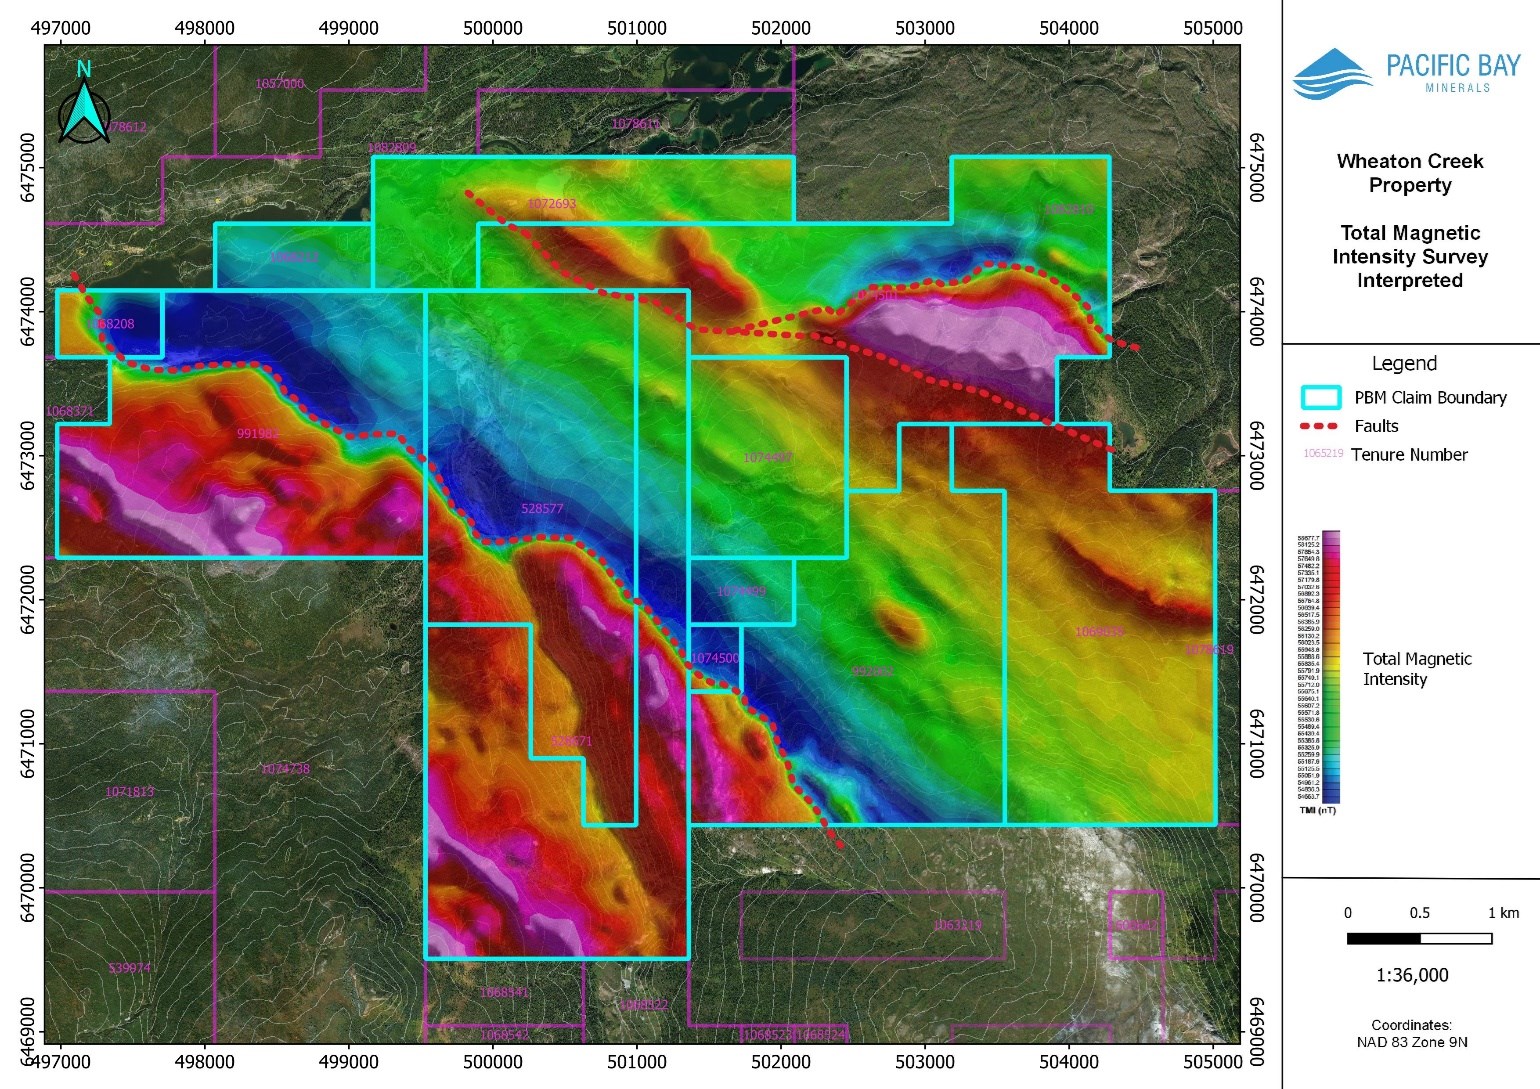
Figure 1: Wheaton Creek Gold, Total Magnetic Intensity Survey Results with Interpreted Fault Boundaries
To view an enhanced version of this graphic, please visit:
https://orders.newsfilecorp.com/files/3362/93395_c890000fe49298fd_002full.jpg

Figure 2: Wheaton Creek Gold, Calculated Vertical Gradient Survey Results with Interpreted Carbonization Alteration Zone.
To view an enhanced version of this graphic, please visit:
https://orders.newsfilecorp.com/files/3362/93395_c890000fe49298fd_003full.jpg
Pacific Bay's Vice President of Operations, Antonio Vespa, explains, "We want to take a data driven approach for our exploration programs. Now that we have completed our initial site visit and the airborne magnetic survey, we have increased confidence in our proposed drill targets. We are very excited to receive further interpretation of the data gathered so far and continue with exploration later this year."
Mr. Vespa and Mr. Ah Fat, completed a site visit on the 17th of June, 2021. The site visit was successful in gathering information about the current state of the Property, including:
-
Accessibility to the site
-
Condition of infrastructure, including camp availability, in the area
-
Location of previous drillholes
-
Drone photogrammetry
The Company plans to proceed with the diamond drilling of 3-5 drillholes in September/October of 2021, subject to drill contractor availability and permit amendments with new drill sites.
Wheaton Creek Highlights:
-
3,019 hectares of mineral tenures 100% owned by the Company
-
1986 drillhole 86-01 intercepted 5.38 grams per tonne of gold over 3.05 metres with visible gold
-
5-year multi-year area based (MYAB) permit in good standing
-
Notice of work (NOW) application approved
Note: all above reported intercepts are core lengths only as the true width of the structures has not yet been determined.
Sebastien Ah Fat, P.Geo., a Qualified Person as defined by National Instrument 43-101, approved the technical information in this release.
On Behalf of the Board of Directors
David Brett, CEO
dbrett@pacificbayminerals.com
(604) 682-2421
Helder Carvalho, Vice President, Corporate Development
hcarvalho@pacificbayminerals.com
pacificbayminerals.com / Twitter / LinkedIn
This news release contains "forward‐looking statements" within the meaning of Canadian securities legislation. Forward‐looking statements include, but are not limited to, statements with respect to the expected use of proceeds of the Financing. Such statements and information are based on numerous assumptions regarding present and future business strategies and the environment in which Pacific Bay will operate in the future. Certain important factors that could cause actual results, performances or achievements to differ materially from those in the forward‐looking statements include, amongst others, the global economic climate, dilution, share price volatility and competition. Although Pacific Bay has attempted to identify important factors that could cause actual results to differ materially from those contained in forward‐looking statements, there may be other factors that cause results not to be as anticipated, estimated or intended. There can be no assurance that such statements will prove to be accurate, as actual results and future events could differ materially from those anticipated in such statements. Accordingly, readers should not place undue reliance on forward‐looking statements. Pacific Bay does not undertake to update any forward‐looking statements, except in accordance with applicable securities laws.
Neither the TSX Venture Exchange nor its Regulation Services Provider (as that term is defined in the policies of the TSX Venture Exchange) accepts responsibility for the adequacy or accuracy of this release.
NOT FOR DISTRIBUTION TO U.S. NEWSWIRE SERVICES OR FOR RELEASE, PUBLICATION, DISTRIBUTION OR DISSEMINATION DIRECTLY, OR INDIRECTLY, IN WHOLE OR IN PART, IN OR INTO THE UNITED STATES.

To view the source version of this press release, please visit https://www.newsfilecorp.com/release/93395
(Bloomberg) — BHP Group’s go-ahead to spend $5.7 billion on a giant Canadian potash mine is shining a spotlight on a commodity vital to feeding the world.
Prices of the nutrient essential to producing food for growing populations soared after a crop rally helped farmers boost fertilizer purchases. Unlike oil or most metals and grains, potash trade is focused on annual contracts or in the spot market, rather than on a futures exchange — and supplies are mostly controlled by just a handful of producers.
The fertilizer is part of mining giant BHP’s shift toward commodities of the future as it exits fossil fuels, though production won’t start for another six years. For now, much of the focus will be on how U.S. sanctions on Belarus’s state-owned producer affect supply.
Here’s why potash is important and what’s driving the market:
Market Rally
Grains output jumped about 25% in almost a decade on rising global food demand, while a crop rally in the past year encouraged farmers to expand planting and use more fertilizers. That’s seen spot potash prices in Brazil and the U.S. hit the highest in at least eight years.
Nutrien Ltd., the biggest fertilizer company, earlier this year said it will raise potash production amid a tightening market. Last week, the Canadian company revised its forecast for global potash shipments to a record on strong demand.
Miners Join Party
BHP on Tuesday finally approved spending on the Jansen potash mine in Canada, after years of wavering over the huge cost. Potash offers the world’s top mining company a long-term future profit driver as it retreats from fossil fuels and focuses on commodities that should benefit from rising populations or the green-energy transition.
Jansen could operate for a century, and is a scalable business that could grow to rival BHP’s Pilbara iron ore operations and its copper mines in Chile in importance, Ragnar Udd, president of BHP’s Minerals Americas business, said on a media call on Wednesday. BHP isn’t the only miner moving into fertilizers — Anglo American Plc took over a $4 billion U.K. mine in 2020 as it shifts from coal to more environmentally-friendly commodities.
There are other big projects in the works. Russia’s Acron Group is speeding up construction of Talitsky potash mine and targets the first supplies in 2025. In Belarus, Slavkali plans to start a 2 million tons-a-year mine in 2023.
Supply Uncertainty
Output is mostly concentrated in North America and former Soviet nations like Russia and Belarus, from underground deposits formed by evaporated sea beds millions of years ago. Nutrien, Mosaic Co., Belaruskali OAO and Uralkali PJSC are among the main producers.
The U.S. last week sanctioned Belaruskali as it targeted companies with ties to President Alexander Lukashenko, though it’s not clear how that will affect supply. Counterparts have until December to wind down transactions with Belaruskali, while Belarusian Potash Co., which handles all of the country’s potash exports, wasn’t itself sanctioned.
Still, BPC told RIA Novosti the sanctions will lead to higher potash prices and less availability on the world market.
Potash Trade
Unlike say crude, copper or wheat, benchmark prices are largely derived from annual deals between producers and buyers, rather than on a futures exchange. The nutrient is also traded in spot markets.
Prices at multiyear highs “revived projects like Jensen or Talitsky in Russia, even as the market is still in oversupply,” said VTB Capital analyst Elena Sakhnova. “It’s not clear how long potash price dynamics will sustain, as it is driven by speculative factors and uncertainty over Belarusian shipments.”
BHP’s Udd said he was confident the market could absorb the extra supply from Jansen, with first production targeted for 2027. “The feedback we’re getting from customers at this point is that they will really relish the competition this will induce in the market.”
(Adds comments from BHP’s Udd throughout.)
More stories like this are available on bloomberg.com
Subscribe now to stay ahead with the most trusted business news source.
©2021 Bloomberg L.P.
(Expressed in United States dollars except where otherwise indicated)
MONTREAL, Aug. 18, 2021 (GLOBE NEWSWIRE) — (TSXV: GMN) GobiMin Inc. (“GobiMin” or the “Company”, together with its subsidiaries collectively the “Group”) reports its financial and operating results for the second quarter of 2021. The unaudited condensed interim consolidated financial statements along with quarterly highlights of management’s discussion and analysis have been filed with SEDAR (www.sedar.com) and are also available at the website of the Company (www.gobimin.com).
Financial Highlights
|
Three months ended June 30, |
Year ended |
||
|
2021 |
2020 |
December 31, 2020 |
|
|
$’000 |
$’000 |
$’000 |
|
|
Revenue |
220 |
202 |
891 |
|
(Loss)/gain on disposal of financial assets |
(22) |
124 |
266 |
|
Fair value (loss)/gain on financial assets |
(26) |
194 |
(106) |
|
Net loss for the period/year |
(479) |
(70) |
(3,349) |
|
Loss attributable to shareholders of the Company |
(402) |
(30) |
(3,057) |
|
Basic and diluted loss per share (in $) |
(0.008) |
(0.001) |
(0.062) |
|
(LBITDA)/EBITDA (1) |
(415) |
10 |
(3,002) |
|
(LBITDA)/EBITDA per share (in $) (1) |
(0.008) |
0.0002 |
(0.061) |
|
As at June 30, |
As at |
||
|
2021 |
2020 |
December 31, 2020 |
|
|
$’000 |
$’000 |
$’000 |
|
|
Cash and cash equivalents |
18,636 |
17,886 |
19,471 |
|
Cash and cash equivalents per share (in $) (1) |
0.38 |
0.36 |
0.40 |
|
Working capital |
20,528 |
21,190 |
21,306 |
|
Total current liabilities |
2,512 |
2,272 |
2,536 |
|
Total assets |
74,266 |
73,296 |
74,985 |
Note:
(1) As non-IFRS measurements, (LBITDA)/EBITDA ((loss)/earnings before interest income and expense, income taxes, depreciation and amortization), (LBITDA)/EBITDA per share and Cash and cash equivalents per share are not mandatorily required by IFRS and, therefore, the amounts presented in the above table may not be comparable to similar data presented by other companies. The data is intended to provide additional information and should not be considered in isolation or as a substitute for measures of performance prepared in accordance with IFRS.
Business Summary and Development
1. Gold Project in Xinjiang
The Company owns 70% equity interests in Xinjiang Tongyuan Minerals Limited which operates the Sawayaerdun Gold Project (“Gold Project”) in Xinjiang. Its exploration licence had been renewed with expiry date on June 15, 2023. Upon the settlement of the mining royalties of $1,481,000 (equivalent to RMB9,560,000) in July 2021, the mining licence had been renewed with expiry date on March 22, 2023.
The on-site industrial test on applying bio-tech methodology on extraction of metals from large-scale samples of gold ores was running behind schedule attributable to the COVID-19 pandemic. According to the analysis results on the ore samples and the immersion gold tests conducted by the Research Institute, arsenic and iron in the ore samples have been successfully removed by oxidation. It is almost the end of the pre-oxidation stage. Upon the satisfaction in maintaining the alkali balance, the industrial test would enter into the final stage of gold immersion process in late 2021.
For the six months ended June 30, 2021, there was no addition to exploration and evaluation assets. As at June 30, 2021, the Group had a contractual commitment of $1,653,000 for the future development of the Gold Project.
2. Financial Assets
(i) Listed Securities
As at June 30, 2021, the fair value of listed securities held by the Group amounted to $313,000 (December 31, 2020: $247,000) which include investments in listed stock, futures and options of $252,000 (December 31, 2020: $127,000) trading through registered brokerage firms in Hong Kong and a listed stock in Canada of $61,000 (December 31, 2020: $120,000). For the six months ended June 30, 2021, the loss on disposal of listed stock, indexes, futures and options amounted to $137,000 (six months ended June 30, 2020: gain of $84,000) and fair value loss on listed securities was $88,000 (six months ended June 30, 2020: $76,000).
(ii) Unlisted Investments
The Group holds 670,000 shares of Dragon Silver Holdings Limited (“Dragon Silver”) representing 9.90% of its total issued capital at an investment cost of $1,121,000 (equivalent to HK$8,710,000). Dragon Silver is a Hong Kong based company which mainly engaged in trading, production, processing and investment in precious metals and non-ferrous metals and related products. In consideration of the continuous difficult market conditions and the impact of COVID-19, the Group agreed to waive further the profit guarantee compensation for the years ended June 30, 2021 and 2022 as requested by the guarantor. There were no material fair value changes for the investments in Dragon Silver for the six months ended June 30, 2021 (six months ended June 30, 2020: nil).
As at June 30, 2021, unlisted investments held by the Group other than Dragon Silver amounted to $268,000 (December 31, 2020: $257,000). During the period under review, the fair value gain on other unlisted investments was $4,000 (six months ended June 30, 2020: gain of $5,000).
(iii) Debentures and Certificate of Deposit
As at June 30, 2021, the Group held debentures of $2,551,000 (December 31, 2020: $2,741,000) with coupon rates ranged from 4.250% to 7.375% (December 31, 2020: 4.250% to 7.375%) per annum and maturities ranged between November 30, 2026 and perpetual (December 31, 2020: May 31, 2021 and perpetual).
For the six months ended June 30, 2021, interest income from debentures was $79,000 (six months ended June 30, 2020: $98,000) and fair value gain on debentures amounted to $10,000 (six months ended June 30, 2020: loss of $138,000). No gain or loss on disposal of debentures (six months ended June 30, 2020: gain of $4,000) was recorded for the six months ended June 30, 2021.
3. Liquidity and Capital Resources
As at June 30, 2021, working capital of the Group was amounted to about $20,528,000 (December 31, 2020: $21,306,000), which is computed by netting off its current assets of $23,040,000 (December 31, 2020: $23,842,000) with its current liabilities of $2,512,000 (December 31, 2020: $2,536,000).
Taking into account of its financial position, management of the Group considered that its cash and cash equivalents will be more than sufficient to finance its operation, including the contractual commitments of the Gold Project of approximately $1,653,000 (December 31, 2020: $1,633,000) as at June 30, 2021.
For further information, please contact:
Felipe Tan, Chief Executive Officer
Tel: (852) 3586-6500
Email: felipe.tan@gobimin.com
Certain statements contained in this press release constitute forward-looking information. Such statements are based on the current expectations of management of GobiMin. You are cautioned that such statements are subject to a multitude of risks and uncertainties that could cause actual results, future circumstances or events to differ materially from those projected in the forward-looking information. Forward looking information includes without limitation, statements regarding the size and quality of the Company’s mineral resources, progress in development of mineral properties, the prospective mineralization of the properties, and planned exploration programs. The reader should not place undue reliance on the forward-looking information included in this press release given that (i) actual results could differ materially from a conclusion, forecast or projection in the forward-looking information, and (ii) certain material factors or assumptions were applied in drawing a conclusion or making a forecast or projection as reflected in the forward-looking information could prove to be inaccurate. These statements speak only as of the date they are made, and GobiMin assumes no obligation to revise such statements as a result of any event, circumstance or otherwise, except in accordance with law.
“Neither TSX Venture Exchange nor its Regulation Services Provider (as that term is defined in the policies of the TSX Venture Exchange) accepts responsibility for the adequacy or accuracy of this release.”
To receive GobiMin press releases by email, send a message to info@gobimin.com and
specify “GobiMin press releases” on the subject line
To unsubscribe GobiMin press releases, please send a message to unsubscribe@gobimin.com

VANCOUVER, BC / ACCESSWIRE / August 18, 2021 / Strategic Metals Ltd. (TSXV:SMD) ("Strategic" or the "Company") announces results from a recently completed program comprising geological mapping and soil geochemical sampling at its Nikki copper-gold porphyry project, which is located in the Kluane belt where the Company's research and exploration has recognized a string of promising high-level porphyry copper-gold prospects.
The Nikki project is situated in southwestern Yukon, 25 km northwest of the Mint project (see Company news release dated August 11, 2021) and 16 km west of the Alaska Highway (Figure 1). Both Nikki and Mint are 100% owned by Strategic and neither is subject to underlying royalty interests. The Nikki project comprises 40 mineral claims, encompassing 800 hectares (8 km2), and is located within the Traditional Territory of the White River First Nation.
The Nikki area was first staked in 1910, making it one of the oldest mineral occurrences in western Yukon, but little exploration was done on it prior to Strategic staking its claims in 2004 despite the fact that it was recognized as a porphyry target in the late 1960s soon after Western Copper and Gold's Casino deposit was discovered 120 km to the northeast.
The Nikki porphyry system is hosted in a northwesterly-elongated, early Cretaceous intrusive complex composed of tabular bodies of fine grained diorite and younger porphyritic granodiorite, which intrude a section of Paleozoic argillites with minor limestone lenses. A system of Miocene porphyry dykes cut the older intrusions and sedimentary wallrocks. The target is marked by very strong copper and gold stream sediment anomalies, a magnetic high and a large gossan.
Work by Strategic has defined a 2000 m long by up to 1100 m wide soil geochemical anomaly that is cored by high copper values with scattered anomalous values for lead, zinc and silver on the northern and eastern flanks. Gold-in-soil values are strong within the porphyry but are also high on the flanks where mineralized skarns and veins have been noted. Peak soil values are 3060 ppm copper, 1590 ppb gold, 45.5 ppm silver, 4970 ppm lead and 3950 ppm zinc, as illustrated on Figures 2-6.
The Nikki project has also responded well to geophysical surveys (magnetic, radiometric and induced polarization). A pronounced magnetic high that coincides with the diorite/granodiorite complex (Figure 7) is locally accompanied by strong radiometric highs that are attributed to potassic alteration (Figure 8), and areas of moderate chargeability. The geological setting, soil geochemical patterns and geophysical response are all consistent with a high-level alkalic porphyry system.
A total of seven shallow diamond drill holes have tested the upper portion of the porphyry target, with two holes in 1971 totalling 290 m, four holes in 2010 totalling 1308 m and one hole in 2012 reaching 298 m. All of the holes contain porphyry style alteration and mineralization. The 1971 holes were not analyzed for gold but return promising copper values, with one hole averaging 0.15% over 150 m and the other 0.12% over 140 m. The best results from the 2010 and 2012 drilling came from the bottom of hole 10-02, which averaged 0.13 % copper and 0.076 g/t gold over the last 64 m (Figure 9). Nearby hand trenches also produced encouraging results with chip samples from one trench grading 0.38% copper and 0.364 g/t gold over its entire 6 m length and those from the other trench averaging 0.47% copper and 0.194 g/t gold over its 8 m length.
Little effort has been directed towards evaluating precious metal mineralization in skarns and veins on the fringes of the porphyry system. Most of the gold-enriched rock samples taken on the property were collected up-slope to the northeast of the drill holes (Figure 10). The best gold-in-rock result came from a chip sample across part of a copper-bearing skarn exposure, located about 500 m north of the historical drill holes, which returned 11.95 g/t gold over 2 m. The strongest gold-in-soil values approximately coincide with a broad area characterized by high potassium radiometrics and moderately strong magnetics.
"Historical work has identified a broad zone of copper-enriched porphyry mineralization within the diorite/granodiorite complex, but recent work at Nikki and elsewhere in the Kluane belt suggests that the younger dykes may have played an important role in localizing mineralization, particularly gold." states Doug Eaton CEO of Strategic. "The best results from soils and rocks are mostly located up-slope to the north of the historical drill holes in an area with elevated radiometric and magnetic response. This signature suggests that potassic alteration may have occurred in wallrocks above deeper porphyry mineralization."
Rock sample preparation and multi-element analyses were carried out at ALS in Whitehorse, YT and North Vancouver, BC, respectively. Each sample was dried, fine crushed to better than 70% passing 2 mm and then a 250 g split was pulverized to better than 85% passing 75 microns. The fine fractions were analyzed for 35 elements using aqua regia digestion followed by inductively coupled plasma (ME-ICP41). An additional 50 g charge was further analysed for gold by fire assay and atomic absorption spectroscopy finish (Au-AA24). Samples with overlimit values were further analyzed by four-acid digestion for silver and zinc using Ag-OG46 and Zn-OG46.
Technical information in this news release has been approved by Heather Burrell, P.Geo., a senior geologist with Archer, Cathro & Associates (1981) Limited and qualified person for the purpose of National Instrument 43-101.
About Strategic Metals Ltd.
Strategic is a project generator with 11 royalty interests, 8 projects under option to others, and a portfolio of more than 100 wholly owned projects that are the product of over 50 years of focussed exploration and research by a team with a track record of major discoveries. Projects available for option, joint venture or sale include drill-confirmed prospects and drill-ready targets with high-grade surface showings and/or geochemical anomalies and geophysical features that resemble those at nearby deposits.
Strategic has a current cash position of over $8 million and large shareholdings in a number of active mineral exploration companies including 38.9% of GGL Resources Corp., 33.5% of Rockhaven Resources Ltd., 19.9% of Honey Badger Silver Inc., 19.2% of Precipitate Gold Corp. and 18.7% of Silver Range Resources Ltd. All of these companies are well funded and are engaged in promising exploration projects. Strategic also owns 21.9% of Terra CO2 Technologies Holdings Inc., a private Delaware corporation which recently completed a US$9.2 million financing to advance its environmentally-friendly, cost-effective alternative to Portland cement. The current value of Strategic's stock portfolio is approximately $22 million.
ON BEHALF OF THE BOARD
"W. Douglas Eaton"
President and Chief Executive Officer
For further information concerning Strategic or its various exploration projects please visit our website at www.strategicmetalsltd.com or contact:
Corporate Information
Strategic Metals Ltd.
W. Douglas Eaton
President and C.E.O.
Tel: (604) 688-2568
Investor Inquiries
Richard Drechsler
V.P. Communications
Tel: (604) 687-2522
NA Toll-Free: (888) 688-2522
rdrechsler@strategicmetalsltd.com
http://www.strategicmetalsltd.com
Neither the TSX Venture Exchange nor its Regulation Services Provider (as that term is defined in the policies of the TSX Venture Exchange) accepts responsibility for the adequacy or accuracy of this release.
This news release may contain forward looking statements based on assumptions and judgments of management regarding future events or results that may prove to be inaccurate as a result of exploration and other risk factors beyond its control, and actual results may differ materially from the expected results.


SOURCE: Strategic Metals Ltd.
View source version on accesswire.com:
https://www.accesswire.com/660211/Strategic-Metals-Updates-Results-from-Its-Nikki-Project-Located-in-the-Newly-Recognized-Kluane-Porphyry-Cu-Au-Belt-SW-Yukon
(Corrects to A$40 billion from $40 billion in first paragraph)
MELBOURNE (Reuters) -Shares in BHP Group Ltd. and Woodside Petroleum fell on Wednesday as investors digested details of the Perth-based oil and gas group's A$40 billion ($29 billion) merger with BHP's petroleum arm, with some questioning the value of the deal for Woodside.
While a 6% fall in BHP's share price was linked to a decision to end its UK dual listing, where its shares have traditionally traded at a large discount, a fall of up to 4% in Woodside reflected concerns about the expansion, they said.
"It may be difficult to get a vote across the line, with Woodside shareholders likely to question the value of the merger," said Jamie Hannah, deputy head of investments at Van Eck Australia, a shareholder in both BHP and Woodside.
"Woodside is one of the worst-performing companies within the energy sector globally post-COVID; the company doesn't yet have a strong mandate to enter a deal of such questionable value and this could further drag on Woodside's shares," he said.
BHP agreed to hive off its petroleum business to Woodside in a nil-premium merger, in return for new Woodside shares which will go to BHP shareholders, who will own 48% of the enlarged group.
The deal will make Woodside a top 10 global independent oil and gas producer, giving it oil assets in the Gulf of Mexico, gas in Trinidad and Tobago and ageing assets in Australia's Bass Strait, while doubling its stake in North West Shelf LNG.
However, it has raised concerns about the strategic sense of expanding in oil and taking on ageing gas assets with big decommissioning costs.
Investors said the fall in Woodside shares was also partly due to worries about an overhang of stock as BHP investors who want to get out of fossil fuels would look to dump the shares.
The stock was down 0.7% in afternoon trade, underperforming local rivals Santos and Oil Search, which were both up 1%.
Woodside's new chief executive, Meg O'Neill, said while investors were very familiar with BHP's Australian oil and gas assets, they did not appreciate the value of its Gulf of Mexico oil stakes – Mad Dog, Atlantis and Shenzi.
"Those are just first-class top-tier assets that will be very cash accretive to the merged company," O'Neill told Reuters.
Analysts were more upbeat about the long term, saying the deal would give Woodside more growth options, beyond its $12 billion Scarborough gas project and Pluto LNG expansion, and the company would benefit from strong cash generation at BHP's debt-free assets.
"It's a logical deal between the parties," said Argo Investments portfolio manager Andy Forster. "I do think ultimately shareholders will vote for it."
Woodside aims to put the deal to a vote in the second quarter of 2022.
Credit Suisse analyst Saul Kavonic said Woodside shareholders may be painted into a corner, noting that, as part of the deal, Woodside gave BHP an option to give up its stake in the Scarborough project for $1 billion if Woodside makes a final investment decision on the project by Dec. 15.
Woodside would then be the sole owner of Scarborough and have to fund the whole project by itself, which it currently cannot afford.
"Shareholders may have little choice but to vote the merger through because it would pose a serious balance sheet overhang," Kavonic said.
($1 = 1.3770 Australian dollars)
(Reporting by Sonali Paul; editing by Richard Pullin)
VANCOUVER, British Columbia, Aug. 18, 2021 (GLOBE NEWSWIRE) — Teck Resources Limited (TSX: TECK.A and TECK.B, NYSE: TECK) (“Teck”) today announced that the wildfire evacuation order for Highland Valley Copper Operations (HVC) issued by the District of Logan Lake previously announced on August 15 has been lifted. HVC has resumed operations and is now in the process of ramping back up to full production.
Teck is focused on protecting the health and safety of employees and contractors and we are continuing to closely monitor wildfire and regional air quality conditions.
Teck’s copper production guidance will be updated as necessary after the risk of further effect on operations from wildfires subsides.
About Teck
As one of Canada’s leading mining companies, Teck is committed to responsible mining and mineral development with major business units focused on copper, zinc, and steelmaking coal, as well as investments in energy assets. Copper, zinc and high-quality steelmaking coal are required for the transition to a low-carbon world. Headquartered in Vancouver, Canada, Teck’s shares are listed on the Toronto Stock Exchange under the symbols TECK.A and TECK.B and the New York Stock Exchange under the symbol TECK. Learn more about Teck at www.teck.com or follow @TeckResources.
Teck Media Contact:
Chris Stannell
Public Relations Manager
604.699.4368
chris.stannell@teck.com
Teck Investor Contact:
Fraser Phillips
Senior Vice President, Investor Relations & Strategic Analysis
604.699.4621
fraser.phillips@teck.com

By Sonali Paul and Melanie Burton
MELBOURNE (Reuters) -Shares in BHP Group and Woodside Petroleum fell on Wednesday as investors on both sides raised questions about the value of the Perth-based oil and gas group's proposed $29 billion merger with BHP's petroleum arm.
While a 6% fall in BHP's share price was linked to a decision to end its UK dual listing, where its shares have traditionally traded at a large discount, a fall of up to 4% in Woodside reflected concerns about the expansion, they said.
"Woodside is one of the worst-performing companies within the energy sector globally post-COVID; the company doesn't yet have a strong mandate to enter a deal of such questionable value and this could further drag on Woodside's shares," said Jamie Hannah, deputy head of investments at Van Eck Australia, a shareholder in both companies.
BHP agreed to hive off its petroleum business to Woodside in a nil-premium merger, in return for new Woodside shares which will go to BHP shareholders, who will own 48% of the enlarged group.
The deal will make Woodside a top 10 global independent oil and gas producer, giving it oil assets in the Gulf of Mexico, gas in Trinidad and Tobago and ageing assets in Australia's Bass Strait, while doubling its stake in North West Shelf LNG.
However, it raised concerns about the strategic sense of expanding in oil and taking on ageing gas assets with big decommissioning costs.
Investors said the fall in Woodside shares was also partly due to worries about an overhang of stock as BHP investors who want to get out of fossil fuels would look to dump the shares.
The stock was down 1.2% in afternoon trade, underperforming a 1% rise in local rivals Santos and Oil Search.
Woodside's new chief executive, Meg O'Neill, said while investors were very familiar with BHP's Australian oil and gas assets, they did not appreciate the value of its Gulf of Mexico oil stakes – Mad Dog, Atlantis and Shenzi.
"Those are just first-class top-tier assets that will be very cash accretive to the merged company," O'Neill told Reuters.
Analysts and two BHP investors said Woodside got the BHP assets relatively cheaply.
"I'd much rather have just hung on to them and harvested the capital because demonstrably the returns from the growth parts of those projects are much higher than Jansen," said a Sydney-based fund manager, referring to the $5.7 billion Jansen potash project BHP approved on Tuesday.
Tribeca Investment Partners CEO Ben Cleary, a BHP shareholder, said what BHP lost with the discount on its petroleum assets would be offset by a higher valuation multiple for no longer holding oil and gas.
"Long term the deal makes sense. I think BHP looks more attractive for a wider audience," said Matt Haupt, portfolio manager at Wilson Asset Management, a BHP shareholder.
Analysts were upbeat about the long term for Woodside, saying the deal would give it more growth options, beyond its $12 billion Scarborough gas project and Pluto LNG expansion, funded by strong cash generation at BHP's debt-free assets.
"It's a logical deal between the parties," said Argo Investments portfolio manager Andy Forster. "I do think ultimately shareholders will vote for it."
Woodside aims to put the deal to a vote in the second quarter of 2022.
Credit Suisse analyst Saul Kavonic said Woodside shareholders may be painted into a corner, noting that, as part of the deal, Woodside gave BHP an option to hand over its stake in the Scarborough project for $1 billion if Woodside makes a final investment decision on the project by Dec. 15.
Woodside would then be the sole owner of Scarborough and have to fund the project by itself, which it cannot afford.
"Shareholders may have little choice but to vote the merger through because otherwise it would pose a serious balance sheet overhang," Kavonic said.
($1 = 1.3770 Australian dollars)
(Reporting by Sonali Paul; editing by Richard Pullin)
Investors focused on the Basic Materials space have likely heard of United States Steel (X), but is the stock performing well in comparison to the rest of its sector peers? One simple way to answer this question is to take a look at the year-to-date performance of X and the rest of the Basic Materials group's stocks.
United States Steel is a member of the Basic Materials sector. This group includes 251 individual stocks and currently holds a Zacks Sector Rank of #5. The Zacks Sector Rank gauges the strength of our 16 individual sector groups by measuring the average Zacks Rank of the individual stocks within the groups.
The Zacks Rank is a proven model that highlights a variety of stocks with the right characteristics to outperform the market over the next one to three months. The system emphasizes earnings estimate revisions and favors companies with improving earnings outlooks. X is currently sporting a Zacks Rank of #1 (Strong Buy).
Over the past 90 days, the Zacks Consensus Estimate for X's full-year earnings has moved 69.90% higher. This means that analyst sentiment is stronger and the stock's earnings outlook is improving.
Based on the latest available data, X has gained about 68.51% so far this year. Meanwhile, stocks in the Basic Materials group have gained about 12% on average. As we can see, United States Steel is performing better than its sector in the calendar year.
Looking more specifically, X belongs to the Steel – Producers industry, a group that includes 24 individual stocks and currently sits at #12 in the Zacks Industry Rank. This group has gained an average of 57.05% so far this year, so X is performing better in this area.
Going forward, investors interested in Basic Materials stocks should continue to pay close attention to X as it looks to continue its solid performance.
Want the latest recommendations from Zacks Investment Research? Today, you can download 7 Best Stocks for the Next 30 Days. Click to get this free report
United States Steel Corporation (X) : Free Stock Analysis Report
To read this article on Zacks.com click here.
Cleveland-Cliffs is still in buy range from a conventional entry of 24.87.
(Bloomberg) — The U.K.’s blue-chip FTSE 100 Index will lose its second-biggest stock by market value and the world’s largest mining company, after BHP Group announced plans to simplify its listing structure.
BHP will move to a primary listing in Australia after collapsing a dual arrangement that dates back to the company’s creation 20 years ago when Australia’s BHP Ltd. merged with rival Billiton. The change, one of several announced Tuesday that also included a plan to exit the oil and gas business, means BHP can be more nimble in pursuing deals, Chief Executive Officer Mike Henry told reporters.
However, the deletion from the FTSE 100 will also prompt asset managers and exchange-traded funds which track the benchmark to sell their holdings in BHP. And the loss will be a blow to the index — the London Stock Exchange is seeking to attract new listings as the U.K. maps its future outside the European Union. It still includes several of the world’s other huge mining companies though, including No. 2 Rio Tinto Group, another dual-listed stock.
“Clearly it’s a big blow losing such a heavyweight,” Neil Wilson, chief market analyst at Markets.com, said in an email. “But it will help balance the FTSE 100 a bit more with less leaning on basic resources. Bit less mining, bit more room for up-and-coming tech is surely not a terrible thing,” he said, adding that ultimately BHP is an Australian company at heart and should be listed there.
While BHP is the second-largest company in the FTSE 100, behind AstraZeneca Plc, it only ranks 10th by weighting because of the dual listing, representing 2.6% of the index. The proposal — which is subject to approvals including by the company’s board — would leave BHP with secondary listings in London, Johannesburg and New York. Shareholders of the London-listed vehicle will get shares of the Sydney-listed entity on a one-for-one basis.
The miner has been reviewing its listing structure for years after Elliott Management Corp. pushed BHP to reorganize as a single company. Elliott — which also advocated for the company to get out of oil and gas — argued that removing the dual listing would eliminate a discount between its shares in London and Sydney, reduce costs and bolster transparency.
“Could there be some shareholders who are forced sellers? Yes, clearly,” BHP’s Henry said in a Bloomberg TV interview. “We continue to see shareholders in the Plc as very important and I want to see as many of those as possible continue to hold BHP.”
Under the current arrangement, BHP has two headquarters and two main stock market listings, but is run as a single entity under the same management and board. The company announced the change to its structure as part of its annual earnings results Tuesday, confirming an earlier Bloomberg News report.
(Updates with CEO comments in penultimate paragraph.)
More stories like this are available on bloomberg.com
Subscribe now to stay ahead with the most trusted business news source.
©2021 Bloomberg L.P.
The new week started with stocks solidly in the red on Monday morning, but then the S&P and Dow staged another comeback that kept their record-setting pace alive. Meanwhile, we’re getting ready for a week full of retail earnings and data that should give us a read on the consumer and, therefore, the economic recovery.
“Equities saw pressure in the morning, then grinded their way higher all day. Sound familiar?”, said Jeremy Mullin in Counterstrike. “Things continue to be quite confusing, but the model to follow has been selling in the morning and buying in the afternoon.”
The Dow was down by nearly 300 points at its worst of the session, but finished higher by 110 points. It was up 0.31% to 35,625.40. The S&P rose 0.26% to 4479.71. These indices have now put together five consecutive sessions of record closes.
The NASDAQ, however, slipped 0.20% (or about 29 points) to 14,793.76. The tech-heavy index is under much more pressure than its counterparts these days. It was down by nearly 13 points last week, while the Dow and S&P were up 0.9% and 0.7%, respectively.
Softer-than-expected retail sales in China were one of the reasons why stocks had such a sluggish morning. And it just so happens that U.S. retail sales will be released tomorrow. You may remember that last month’s print was a pleasant surprise, climbing 0.6% in June to beat expectations calling for a slight loss. It was also a noteworthy improvement from the 1.7% plunge in May.
And that report is just the tip of the iceberg when it comes to retail news this week. Earnings season may be winding down, but we always finish up on an exciting note when some of the biggest retailers in the world take the stage.
Tomorrow we get releases from Walmart (WMT) and Home Depot (HD) before the bell, which were up 0.82% and 1.13% today, respectively. And on Wednesday this week we get the Fed minutes for the July meeting. The release is always a big deal, but it may take on even more importance as many investors feel that a taper announcement is drawing near.
Today's Portfolio Highlights:
Blockchain Technology: You might not think this portfolio needs a mining company, but Rio Tinto (RIO) is proving that this innovative technology can be used anywhere. The company launched a blockchain-based program called START earlier this year, which is the first sustainable label for aluminum using blockchain technology. It’ll be similar to a nutrition label on food, except it will offer information on things like carbon footprint, regulatory compliance and much more. Earnings estimates for RIO are going “through the roof”, which explains why the stock is a Zacks Rank #2 (Buy). Read the full write-up for a lot more on this new addition and be ready for another buy later this week.
Surprise Trader: Earnings season may be slowing down, but it’s not over. In fact, the tail end is when the retailers come out to report, which is where Dave went for his first of four additions this week. He picked up Tapestry (TPR), a designer and marketer of fine accessories and gifts (formerly known as Coach). This Zacks Rank #2 (Buy) has beaten the Zacks Consensus Estimate for four straight quarters with a positive surprise of 70% last time. And now it has a positive Earnings ESP of 6.06% heading into its next release on Thursday after the bell. The editor added TPR on Monday with a 12.5% allocation, while also getting out of the “meandering” Middleby Corp. (MIDD) position. Read the complete commentary for more.
Black Box Trader: The portfolio replaced four names in this week's adjustment. The stock that were sold on Monday included:
• Target (TGT, +5.1%)
• Interpublic Group of Cos. (IPG, +5%)
• Mattel (MAT)
• Skechers U.S.A. (SKX)
The new buys that filled these spots are:
• Avis Budget Group (CAR)
• DICK'S Sporting Goods (DKS)
• Nucor (NUE)
• Urban Outfitters (URBN)
Read the Black Box Trader’s Guide to learn more about this computer-driven service. By the way, this portfolio had a top performer on Monday with AutoNation (AN) advancing 5.7%.
Options Trader: "Stocks closed mostly higher today with the Dow and S&P both hitting new all-time highs in the process.
"The markets were weaker in the morning and for a portion of the afternoon. But after hitting their worst levels early on, they spent the rest of the day making their way back and then some.
"A stellar Q2 earnings season has really lifted stocks. And even though it's winding down, the robust outlooks for Q3 and beyond suggests there's a lot more upside to go.
"Same goes for the economic reports. Although, while some reports have beaten expectations, like the recent employment report which showed 943,000 new jobs were created last month, some have slowed down a bit. But we continue to see strong economic activity from a rebounding economy eager to open back up." — Kevin Matras
All the Best,
Jim Giaquinto
Recommendations from Zacks' Private Portfolios:
Believe it or not, this article is not available on the Zacks.com website. The commentary is a partial overview of the daily activity from Zacks' private recommendation services. If you would like to follow our Buy and Sell signals in real time, we've made a special arrangement for readers of this website. Starting today you can see all the recommendations from all of Zacks' portfolios absolutely free for 7 days. Our services cover everything from value stocks and momentum trades to insider buying and positive earnings surprises (which we've predicted with an astonishing 80%+ accuracy). Click here to "test drive" Zacks Ultimate for FREE >>
Globex Mining Enterprises (TSE:GMX) has had a rough three months with its share price down 17%. However, stock prices are usually driven by a company’s financial performance over the long term, which in this case looks quite promising. In this article, we decided to focus on Globex Mining Enterprises' ROE.
Return on Equity or ROE is a test of how effectively a company is growing its value and managing investors’ money. Simply put, it is used to assess the profitability of a company in relation to its equity capital.
See our latest analysis for Globex Mining Enterprises
How Do You Calculate Return On Equity?
The formula for ROE is:
Return on Equity = Net Profit (from continuing operations) ÷ Shareholders' Equity
So, based on the above formula, the ROE for Globex Mining Enterprises is:
73% = CA$13m ÷ CA$18m (Based on the trailing twelve months to June 2021).
The 'return' is the amount earned after tax over the last twelve months. Another way to think of that is that for every CA$1 worth of equity, the company was able to earn CA$0.73 in profit.
What Is The Relationship Between ROE And Earnings Growth?
Thus far, we have learned that ROE measures how efficiently a company is generating its profits. We now need to evaluate how much profit the company reinvests or "retains" for future growth which then gives us an idea about the growth potential of the company. Assuming everything else remains unchanged, the higher the ROE and profit retention, the higher the growth rate of a company compared to companies that don't necessarily bear these characteristics.
Globex Mining Enterprises' Earnings Growth And 73% ROE
To begin with, Globex Mining Enterprises has a pretty high ROE which is interesting. Additionally, the company's ROE is higher compared to the industry average of 16% which is quite remarkable. As a result, Globex Mining Enterprises' exceptional 73% net income growth seen over the past five years, doesn't come as a surprise.
As a next step, we compared Globex Mining Enterprises' net income growth with the industry, and pleasingly, we found that the growth seen by the company is higher than the average industry growth of 30%.

The basis for attaching value to a company is, to a great extent, tied to its earnings growth. What investors need to determine next is if the expected earnings growth, or the lack of it, is already built into the share price. By doing so, they will have an idea if the stock is headed into clear blue waters or if swampy waters await. One good indicator of expected earnings growth is the P/E ratio which determines the price the market is willing to pay for a stock based on its earnings prospects. So, you may want to check if Globex Mining Enterprises is trading on a high P/E or a low P/E, relative to its industry.
Is Globex Mining Enterprises Making Efficient Use Of Its Profits?
Summary
Overall, we are quite pleased with Globex Mining Enterprises' performance. Particularly, we like that the company is reinvesting heavily into its business, and at a high rate of return. Unsurprisingly, this has led to an impressive earnings growth. If the company continues to grow its earnings the way it has, that could have a positive impact on its share price given how earnings per share influence long-term share prices. Not to forget, share price outcomes are also dependent on the potential risks a company may face. So it is important for investors to be aware of the risks involved in the business. Our risks dashboard would have the 3 risks we have identified for Globex Mining Enterprises.
This article by Simply Wall St is general in nature. We provide commentary based on historical data and analyst forecasts only using an unbiased methodology and our articles are not intended to be financial advice. It does not constitute a recommendation to buy or sell any stock, and does not take account of your objectives, or your financial situation. We aim to bring you long-term focused analysis driven by fundamental data. Note that our analysis may not factor in the latest price-sensitive company announcements or qualitative material. Simply Wall St has no position in any stocks mentioned.
Have feedback on this article? Concerned about the content? Get in touch with us directly. Alternatively, email editorial-team (at) simplywallst.com.
The big shareholder groups in Imperial Metals Corporation (TSE:III) have power over the company. Generally speaking, as a company grows, institutions will increase their ownership. Conversely, insiders often decrease their ownership over time. I generally like to see some degree of insider ownership, even if only a little. As Nassim Nicholas Taleb said, 'Don’t tell me what you think, tell me what you have in your portfolio.
Imperial Metals is not a large company by global standards. It has a market capitalization of CA$600m, which means it wouldn't have the attention of many institutional investors. In the chart below, we can see that institutions don't own many shares in the company. We can zoom in on the different ownership groups, to learn more about Imperial Metals.
View our latest analysis for Imperial Metals

What Does The Institutional Ownership Tell Us About Imperial Metals?
Institutions typically measure themselves against a benchmark when reporting to their own investors, so they often become more enthusiastic about a stock once it's included in a major index. We would expect most companies to have some institutions on the register, especially if they are growing.
Less than 5% of Imperial Metals is held by institutional investors. This suggests that some funds have the company in their sights, but many have not yet bought shares in it. So if the company itself can improve over time, we may well see more institutional buyers in the future. It is not uncommon to see a big share price rise if multiple institutional investors are trying to buy into a stock at the same time. So check out the historic earnings trajectory, below, but keep in mind it's the future that counts most.

Our data indicates that hedge funds own 19% of Imperial Metals. That worth noting, since hedge funds are often quite active investors, who may try to influence management. Many want to see value creation (and a higher share price) in the short term or medium term. The company's largest shareholder is Norman Edwards, with ownership of 40%. Fairholme Capital Management, L.L.C. is the second largest shareholder owning 19% of common stock, and Larry G. Moeller holds about 2.5% of the company stock. Larry G. Moeller, who is the third-largest shareholder, also happens to hold the title of Lead Director. In addition, we found that J. Kynoch, the CEO has 1.0% of the shares allocated to their name.
To make our study more interesting, we found that the top 2 shareholders have a majority ownership in the company, meaning that they are powerful enough to influence the decisions of the company.
While studying institutional ownership for a company can add value to your research, it is also a good practice to research analyst recommendations to get a deeper understand of a stock's expected performance. As far I can tell there isn't analyst coverage of the company, so it is probably flying under the radar.
Insider Ownership Of Imperial Metals
The definition of company insiders can be subjective and does vary between jurisdictions. Our data reflects individual insiders, capturing board members at the very least. Management ultimately answers to the board. However, it is not uncommon for managers to be executive board members, especially if they are a founder or the CEO.
Most consider insider ownership a positive because it can indicate the board is well aligned with other shareholders. However, on some occasions too much power is concentrated within this group.
It seems insiders own a significant proportion of Imperial Metals Corporation. Insiders have a CA$266m stake in this CA$600m business. This may suggest that the founders still own a lot of shares. You can click here to see if they have been buying or selling.
General Public Ownership
The general public, with a 31% stake in the company, will not easily be ignored. While this group can't necessarily call the shots, it can certainly have a real influence on how the company is run.
Next Steps:
It's always worth thinking about the different groups who own shares in a company. But to understand Imperial Metals better, we need to consider many other factors. Take risks for example – Imperial Metals has 2 warning signs we think you should be aware of.
If you would prefer check out another company — one with potentially superior financials — then do not miss this free list of interesting companies, backed by strong financial data.
NB: Figures in this article are calculated using data from the last twelve months, which refer to the 12-month period ending on the last date of the month the financial statement is dated. This may not be consistent with full year annual report figures.
This article by Simply Wall St is general in nature. We provide commentary based on historical data and analyst forecasts only using an unbiased methodology and our articles are not intended to be financial advice. It does not constitute a recommendation to buy or sell any stock, and does not take account of your objectives, or your financial situation. We aim to bring you long-term focused analysis driven by fundamental data. Note that our analysis may not factor in the latest price-sensitive company announcements or qualitative material. Simply Wall St has no position in any stocks mentioned.
Have feedback on this article? Concerned about the content? Get in touch with us directly. Alternatively, email editorial-team (at) simplywallst.com.
Even when a business is losing money, it's possible for shareholders to make money if they buy a good business at the right price. For example, Strike Resources (ASX:SRK) shareholders have done very well over the last year, with the share price soaring by 105%. But the harsh reality is that very many loss making companies burn through all their cash and go bankrupt.
Given its strong share price performance, we think it's worthwhile for Strike Resources shareholders to consider whether its cash burn is concerning. For the purpose of this article, we'll define cash burn as the amount of cash the company is spending each year to fund its growth (also called its negative free cash flow). We'll start by comparing its cash burn with its cash reserves in order to calculate its cash runway.
Check out our latest analysis for Strike Resources
How Long Is Strike Resources' Cash Runway?
A company's cash runway is calculated by dividing its cash hoard by its cash burn. When Strike Resources last reported its balance sheet in December 2020, it had zero debt and cash worth AU$4.8m. In the last year, its cash burn was AU$2.9m. So it had a cash runway of approximately 19 months from December 2020. That's not too bad, but it's fair to say the end of the cash runway is in sight, unless cash burn reduces drastically. Depicted below, you can see how its cash holdings have changed over time.

How Is Strike Resources' Cash Burn Changing Over Time?
While Strike Resources did record statutory revenue of AU$100k over the last year, it didn't have any revenue from operations. That means we consider it a pre-revenue business, and we will focus our growth analysis on cash burn, for now. Over the last year its cash burn actually increased by 29%, which suggests that management are increasing investment in future growth, but not too quickly. That's not necessarily a bad thing, but investors should be mindful of the fact that will shorten the cash runway. Strike Resources makes us a little nervous due to its lack of substantial operating revenue. We prefer most of the stocks on this list of stocks that analysts expect to grow.
How Easily Can Strike Resources Raise Cash?
While Strike Resources does have a solid cash runway, its cash burn trajectory may have some shareholders thinking ahead to when the company may need to raise more cash. Generally speaking, a listed business can raise new cash through issuing shares or taking on debt. Many companies end up issuing new shares to fund future growth. We can compare a company's cash burn to its market capitalisation to get a sense for how many new shares a company would have to issue to fund one year's operations.
Strike Resources' cash burn of AU$2.9m is about 4.8% of its AU$61m market capitalisation. Given that is a rather small percentage, it would probably be really easy for the company to fund another year's growth by issuing some new shares to investors, or even by taking out a loan.
How Risky Is Strike Resources' Cash Burn Situation?
Even though its increasing cash burn makes us a little nervous, we are compelled to mention that we thought Strike Resources' cash burn relative to its market cap was relatively promising. While we're the kind of investors who are always a bit concerned about the risks involved with cash burning companies, the metrics we have discussed in this article leave us relatively comfortable about Strike Resources' situation. On another note, Strike Resources has 5 warning signs (and 2 which are potentially serious) we think you should know about.
Of course, you might find a fantastic investment by looking elsewhere. So take a peek at this free list of companies insiders are buying, and this list of stocks growth stocks (according to analyst forecasts)
This article by Simply Wall St is general in nature. We provide commentary based on historical data and analyst forecasts only using an unbiased methodology and our articles are not intended to be financial advice. It does not constitute a recommendation to buy or sell any stock, and does not take account of your objectives, or your financial situation. We aim to bring you long-term focused analysis driven by fundamental data. Note that our analysis may not factor in the latest price-sensitive company announcements or qualitative material. Simply Wall St has no position in any stocks mentioned.
Have feedback on this article? Concerned about the content? Get in touch with us directly. Alternatively, email editorial-team (at) simplywallst.com.
Vancouver, British Columbia–(Newsfile Corp. – August 17, 2021) – EMX Royalty Corporation (NYSE American: EMX) (TSX: EMX) (FSE: 6E9) (the "Company", or "EMX") is pleased to announce that it has entered into an agreement dated August 16th, 2021 to acquire an effective 0.418% Net Smelter Return ("NSR") royalty on the operating Caserones Copper-Molybdenum Mine (the "Caserones Royalty") located in northern Chile for US$34.1 million in cash. Closing is anticipated to take place in two phases with both closings being completed by September 1st, 2021. In completing this transaction, EMX expects immediate and long term cash flow from a large porphyry copper-molybdenum deposit in a top tier mining jurisdiction.
To purchase the Caserones Royalty, EMX has formed a 50%-50% partnership with Altus Strategies Plc ("Altus" (AIM: ALS) (TSXV: ALTS) (OTCQX: ALTUF) to acquire an effective 0.836% NSR royalty for US$68.2 million (see below for additional acquisition details). EMX and Altus will each control an effective 0.418% royalty interest and will each be responsible for $34.1 million of the purchase price.
To finance its US$34.1 million portion of the US$68.2 million purchase price, the Company has entered into a Credit Agreement (the "Credit Agreement") with Sprott Private Resource Lending II (Collector), LP ("Sprott"). The Credit Agreement will increase the Company's current proposed US$10 million credit facility with Sprott, in connection with the Company's recently announced transaction with SSR Mining (see Company News Release dated July 29, 2021), to US$44 million (the "Credit Facility") to include financing for the Caserones Royalty acquisition. Further details of the Credit Agreement are provided below.
The acquisition of the Caserones Royalty represents an important strategic development for EMX, by further enhancing the Company's royalty cash flow and long-term exposure to copper as a key metal for the global economy. Recognition of the opportunity directly resulted from EMX's ongoing assessment work in the region and serves as another example of how the Company leverages its regional expertise in various jurisdictions around the world to identify value enhancing business opportunities.
Caserones Mine Overview. The Caserones open pit mine is developed upon a significant porphyry copper-molybdenum deposit in the Atacama Region of the northern Chilean Andean Cordillera, 162 kilometers southeast of the city of Copiapó, at an approximate elevation of 4,300 meters above sea level. The Mine is operated by SCM Minera Lumina Copper Chile SpA, which is indirectly 100% owned by JX Nippon Mining & Metals Corporation ("JX Nippon").
Caserones is located at the southern end of the well documented Maricunga mineral belt and comprises an Early-Miocene porphyry system associated with a cluster of dacite porphyries and breccias intruding Palaeozoic granitic, volcanic, and metamorphic rocks. Caserones has a well-developed supergene enrichment profile of oxide copper and secondary chalcocite that overlies hypogene sulfide (chalcopyrite-molybdenite) mineralization.
Caserones produces copper and molybdenum concentrates from a conventional crusher, mill and flotation plant, as well as copper cathodes from a dump leach, solvent extraction and electrowinning plant. In 2020 the mine produced 104,917 tonnes of fine copper in concentrate, 2,453 tonnes of fine molybdenum in concentrate, and 22,056 tonnes of fine copper in cathodes. The Caserones open pit has operated with an average waste: ore strip ratio of 0.47, has 17 years remaining in its current mine plan, along with excellent exploration potential. In a news release dated November 9, 2020, JX Nippon announced plans for "stepping up exploration efforts in areas around the mine" in an effort to expand production and extend the mine life.
Acquisition Details. The Caserones Mine is subject to a 2.88% NSR royalty provided for in a 2009 agreement between Minera Lumina Copper Chile S.A. as purchaser, and Compañía Minera Caserones ("CMC") and Sociedad Legal Minera California Una de la Sierra Peña Negra ("SLM California") as vendors. CMC and SLM California originally staked the mineral claims that overlie the Caserones deposit, and ownership of the 2.88% NSR royalty is currently divided between CMC (32.5%) and SLM California (67.5%). EMX and Altus will each be indirectly purchasing a portion of the SLM California royalty. Under the 2009 agreement, the NSR interest will be reduced to 2% and 1% if the London Metal Exchange ("LME") quoted copper price falls below US$1.25 and US$1.00 per pound respectively.
EMX and Altus have formed a Chilean company, Minera Tercero, Spa ("Tercero"), of which the EMX and Altus each own 50%. Tercero will purchase 43% of the issued and outstanding shares of SLM California through a Share Purchase Agreement with 16 shareholders of SLM California (represented by Leonel Polgatti Goycoolea, a shareholder) for US$68.2 million. Tercero will enter into a shareholder's agreement with the selling shareholders of SLM California, that together with Tercero hold approximately 89% of SLM Californa's issued and outstanding shares, to govern SLM California. SLM California's sole purpose is to administer the company, pay Chilean taxes and distribute its royalty proceeds to the shareholders, including Tercero.
Sprott Credit Agreement. In order to finance its US$34.1 million portion of the US$68.2 million purchase price under the Share Purchase Agreement, the Company has entered into the Credit Agreement, which encompasses the previously proposed financing related to EMX's recent transaction to acquire the SSR Royalty Portfolio. The senior secured Credit Facility is in the principal amount of US$44 million, which includes up to US $10 million which will be used to finance a portion of the purchase price of the SSR Royalty Portfolio.
Under the Credit Agreement, the Credit Facility matures on July 31, 2022, bears interest at a rate of 7% per annum, and is secured by general security agreements over the assets of the Company and certain of its subsidiaries, and pledges of the shares of certain of the Company's subsidiaries, who will, at Sprott's election, also be guarantors of the loan. In addition to interest payable, the US$44,000,000 advanced under the Credit Facility was subject to an original issue discount equal to 4.61364% of the amount of the advance. Under the Credit Agreement, the Company will be required to maintain minimum unrestricted cash of USD $1,500,000.
In conjunction with the Credit Agreement, Sprott subscribed for US$1,235,000 of common shares of the Company ("Common Shares") at a deemed price equal to a 10% discount to the 5-day VWAP of the Common Shares on the NYSE American exchange immediately prior to July 12, 2021 of $US 3.0450, which resulted in the issuance of 450,730 Common Shares.
Summary. The acquisition of the Caserones Royalty provides immediate enhancement to EMX's royalty cash flow and secures long-term proceeds from copper and molybdenum production in one of the world's top mining regions. This transaction nicely compliments the Company's growing portfolio of royalty interests in South America, which has become a recent emphasis in the Company's growth strategy.
Eric P. Jensen, CPG, a Qualified Person as defined by National Instrument 43-101 and an employee of the Company, has reviewed, verified, and approved the disclosure of the technical information contained in this news release.
About EMX. EMX is a precious, base and battery metals royalty company. EMX's investors are provided with discovery, development, and commodity price optionality, while limiting exposure to risks inherent to operating companies. The Company's common shares are listed on the NYSE American Exchange and TSX Venture Exchange under the symbol EMX. Please see www.EMXroyalty.com for more information.
For further information contact:
David M. Cole
President and Chief Executive Officer
Phone: (303) 979-6666
Dave@EMXroyalty.com
Scott Close
Director of Investor Relations
Phone: (303) 973-8585
SClose@EMXroyalty.com
Isabel Belger
Investor Relations (Europe)
Phone: +49 178 4909039
Ibelger@EMXroyalty.com
Neither the TSX-V nor its Regulation Services Provider (as that term is defined in policies of the TSX-V) accepts responsibility for the adequacy or accuracy of this release.
Forward-Looking Statements
This news release may contain "forward looking statements" that reflect the Company's current expectations and projections about its future results. These forward-looking statements may include statements regarding completion of the transaction, perceived merits of properties, exploration results and budgets, mineral reserves and resource estimates, work programs, capital expenditures, timelines, strategic plans, market prices for precious and base metal, or other statements that are not statements of fact. When used in this news release, words such as "estimate," "intend," "expect," "anticipate," "will", "believe", "potential", "upside" and similar expressions are intended to identify forward-looking statements, which, by their very nature, are not guarantees of the Company's future operational or financial performance, and are subject to risks and uncertainties and other factors that could cause the Company's actual results, performance, prospects or opportunities to differ materially from those expressed in, or implied by, these forward-looking statements. These risks, uncertainties and factors may include, but are not limited to: unavailability of financing, failure to identify commercially viable mineral reserves, fluctuations in the market valuation for commodities, difficulties in obtaining required approvals for the development of a mineral project, increased regulatory compliance costs, expectations of project funding by joint venture partners and other factors. It is possible EMX may not complete the transaction, as a result of failure to fulfill conditions of closing, unavailability of financing or for other reasons EMX cannot anticipate at this time.
Readers are cautioned not to place undue reliance on these forward-looking statements, which speak only as of the date of this news release or as of the date otherwise specifically indicated herein. Due to risks and uncertainties, including the risks and uncertainties identified in this news release, and other risk factors and forward-looking statements listed in the Company's MD&A for the quarter ended June 30, 2021 and the year ended December 31, 2020 (the "MD&A"), and the most recently filed Revised Annual Information Form (the "AIF") for the year ended December 31, 2020, actual events may differ materially from current expectations. More information about the Company, including the MD&A, the AIF and financial statements of the Company, is available on SEDAR at www.sedar.com and on the SEC's EDGAR website at www.sec.gov.

To view the source version of this press release, please visit https://www.newsfilecorp.com/release/93362
Momentum investing is essentially the opposite of the tried-and-tested Wall Street adage — "buy low and sell high." Investors following this investing style typically avoid betting on cheap stocks and waiting long for them to recover. They believe instead that one could make far more money in lesser time by "buying high and selling higher."
Who doesn't like betting on fast-moving trending stocks? But determining the right entry point isn't easy. Often, these stocks lose momentum once their valuation moves ahead of their future growth potential. In such a situation, investors find themselves loaded up on expensive shares with limited to no upside or even a downside. So, going all-in on momentum could be risky at times.
It could be safer to invest in bargain stocks that have been witnessing price momentum recently. While the Zacks Momentum Style Score (part of the Zacks Style Scores system), which pays close attention to trends in a stock's price or earnings, is pretty useful in identifying great momentum stocks, our 'Fast-Paced Momentum at a Bargain' screen comes handy in spotting fast-moving stocks that are still attractively priced.
United States Steel (X) is one of the several great candidates that made it through the screen. While there are numerous reasons why this stock is a great choice, here are the most vital ones:
A dash of recent price momentum reflects growing interest of investors in a stock. With a four-week price change of 34.8%, the stock of this steel maker is certainly well-positioned in this regard.
While any stock can see a spike in price for a short period, it takes a real momentum player to deliver positive returns for a longer time frame. X meets this criterion too, as the stock gained 19.2% over the past 12 weeks.
Moreover, the momentum for X is fast paced, as the stock currently has a beta of 2.16. This indicates that the stock moves 116% higher than the market in either direction.
Given this price performance, it is no surprise that X has a Momentum Score of A, which indicates that this is the right time to enter the stock to take advantage of the momentum with the highest probability of success.
In addition to a favorable Momentum Score, an upward trend in earnings estimate revisions has helped X earn a Zacks Rank #1 (Strong Buy). Our research shows that the momentum-effect is quite strong among Zacks Rank #1 and #2 stocks. That's because as covering analysts raise their earnings estimates for a stock, more and more investors take an interest in it, helping its price race to keep up. You can see the complete list of today's Zacks Rank #1 (Strong Buy) stocks here >>>>
Most importantly, despite possessing fast-paced momentum features, X is trading at a reasonable valuation. In terms of Price-to-Sales ratio, which is considered as one of the best valuation metrics, the stock looks quite cheap now. X is currently trading at 0.58 times its sales. In other words, investors need to pay only 58 cents for each dollar of sales.
So, X appears to have plenty of room to run, and that too at a fast pace.
In addition to X, there are several other stocks that currently pass through our 'Fast-Paced Momentum at a Bargain' screen. You may consider investing in them and start looking for the newest stocks that fit these criteria.
This is not the only screen that could help you find your next winning stock pick. Based on your personal investing style, you may choose from over 45 Zacks Premium Screens that are strategically created to beat the market.
However, keep in mind that the key to a successful stock-picking strategy is to ensure that it produced profitable results in the past. You could easily do that with the help of the Zacks Research Wizard. In addition to allowing you to backtest the effectiveness of your strategy, the program comes loaded with some of our most successful stock-picking strategies.
Click here to sign up for a free trial to the Research Wizard today.
Want the latest recommendations from Zacks Investment Research? Today, you can download 7 Best Stocks for the Next 30 Days. Click to get this free report
United States Steel Corporation (X) : Free Stock Analysis Report
To read this article on Zacks.com click here.
By Sonali Paul
MELBOURNE (Reuters) -BHP Group has agreed to sell its petroleum business to Woodside Petroleum in a merger to create a top 10 independent oil and gas producer worth A$38.5 billion ($28 billion) with growth assets in Australia and the Americas.
BHP's exit from petroleum, which made up just 5% of its annual earnings, speeds up its exit from fossil fuels amid pressure from environmentally conscious investors. BHP CEO Mike Henry, however, said the company remained committed to metallurgical coal used in steel making.
BHP shareholders will be paid in Woodside stock, giving BHP investors a 48% stake in the merged group.
That effectively values BHP's petroleum arm at about A$18.5 billion ($13 billion) on Tuesday's close, roughly in the middle of analysts' valuations between $10 billion and $17 billion.
For Woodside, the deal is transformational, doubling its output, expanding its footprint in liquefied natural gas, removing the main obstacle to its $12 billion Scarborough gas project and giving it near-term growth options in the Gulf of Mexico.
BHP's assets, including its ageing assets in Australia's Bass Strait where its petroleum business originated, generate cash that will help Woodside fund the Scarborough project as well as developments in the Gulf of Mexico.
"Merging Woodside with BHP's oil and gas business delivers a stronger balance sheet, increased cash flow and enduring financial strength to fund planned developments in the near term and new energy sources into the future," Woodside Chief Executive Meg O'Neill said in a statement.
"We will have more optionality in where we invest and can prioritise the highest return opportunities," she told analysts.
The merger ratio involved no premium for BHP's assets, she said.
The deal was announced at the same time as Woodside appointed O'Neill as chief executive, following a stint as acting CEO. Some analysts had speculated BHP's petroleum chief Geraldine Slattery, would get the job.
"The proposed transaction de-risks and supports Scarborough FID (final investment decision) later this year and enables more flexible capital allocation," O'Neill said.
The companies said the merger would generate annual savings of more than $400 million from 2023, the year after the deal is expected to close.
Woodside plans to put the share issue to a vote in the second quarter of 2022.
A big Woodside investor, Allan Gray Australia, has raised concerns about a deal, especially if it involved a massive share issue.
"It's very unlikely that shareholders would jump at that idea. We certainly wouldn't," Allan Gray Australia Chief Investment Officer Simon Mawhinney told Reuters last week.
O'Neill played down concerns that many BHP investors who don't want fossil fuels or an Australian stock might dump the Woodside shares, saying there is already overlap among investors in the company and it would consider secondary listings in London and New York to help keep "high value" investors on board. Analysts raised concern about the near-term decommissioning liabilities Woodside will be inheriting with BHP's stake in the Bass Strait oil and gas fields. Analysts have estimated those costs at least $2 billion, but O'Neill would not put a figure on it.
"We feel good about how we've valued the decommissioning obligation in setting the merger ratio," she said.
($1 = 1.3732 Australian dollars)
(Reporting by Sonali Paul; editing by David Evans)
Sea Ltd. and Global-e were early risers,, Home Depot dragged on the Dow Jones today, as stock futures swung toward a weak start.
BBL earnings call for the period ending June 30, 2021.
If you would like to receive our free newsletter via email, simply enter your email address below & click subscribe.
 Follow us on Twitter
 Become our facebook fan
CONNECT WITH US
Tweets
Tweet with hash tag #miningfeeds or @miningfeeds and your tweets will be displayed across this site.
MOST ACTIVE MINING STOCKS
Daily Gainers
 CMC Metals Ltd. CMC Metals Ltd. |
CMB.V | +900.00% |
 Eden Energy Ltd Eden Energy Ltd |
EDE.AX | +200.00% |
| GoviEx Uranium Inc. |
GXU.V | +42.86% |
| Eagle Nickel Ltd. |
ENL.AX | +41.67% |
| Citigold Corp. Limited |
CTO.AX | +33.33% |
| Mount Burgess Mining NL |
MTB.AX | +33.33% |
| Exalt Resources Limited |
ERD.AX | +31.94% |
| Casa Minerals Inc. |
CASA.V | +30.00% |
| Cariboo Rose Resources Ltd |
CRB.V | +28.57% |
| Belmont Resources Inc. |
BEA.V | +28.57% |


