Unfortunately, investing is risky – companies can and do go bankrupt. But if you pick the right business to buy shares in, you can make more than you can lose. For example, the Metals X Limited (ASX:MLX) share price has soared 188% return in just a single year. Also pleasing for shareholders was the 70% gain in the last three months. On the other hand, longer term shareholders have had a tougher run, with the stock falling 73% in three years.
See our latest analysis for Metals X
Because Metals X made a loss in the last twelve months, we think the market is probably more focussed on revenue and revenue growth, at least for now. Shareholders of unprofitable companies usually expect strong revenue growth. That's because fast revenue growth can be easily extrapolated to forecast profits, often of considerable size.
In the last year Metals X saw its revenue grow by 3.2%. That's not a very high growth rate considering it doesn't make profits. In contrast, the share price took off during the year, gaining 188%. We're happy that investors have made money, though we wonder if the increase will be sustained. We're not so sure that revenue growth is driving the market optimism about the stock.
The graphic below depicts how earnings and revenue have changed over time (unveil the exact values by clicking on the image).

Balance sheet strength is crucial. It might be well worthwhile taking a look at our free report on how its financial position has changed over time.
A Different Perspective
It's good to see that Metals X has rewarded shareholders with a total shareholder return of 188% in the last twelve months. Notably the five-year annualised TSR loss of 9% per year compares very unfavourably with the recent share price performance. This makes us a little wary, but the business might have turned around its fortunes. It's always interesting to track share price performance over the longer term. But to understand Metals X better, we need to consider many other factors. Even so, be aware that Metals X is showing 2 warning signs in our investment analysis , you should know about…
If you are like me, then you will not want to miss this free list of growing companies that insiders are buying.
Please note, the market returns quoted in this article reflect the market weighted average returns of stocks that currently trade on AU exchanges.
This article by Simply Wall St is general in nature. It does not constitute a recommendation to buy or sell any stock, and does not take account of your objectives, or your financial situation. We aim to bring you long-term focused analysis driven by fundamental data. Note that our analysis may not factor in the latest price-sensitive company announcements or qualitative material. Simply Wall St has no position in any stocks mentioned.
Have feedback on this article? Concerned about the content? Get in touch with us directly. Alternatively, email editorial-team (at) simplywallst.com.
KELOWNA, BC, April 19, 2021 /CNW/ – Metalex Ventures Ltd. (TSXV: MTX) (the "Company") is pleased to report that exceptionally anomalous amounts of ilmenite as well as highly anomalous scandium analyses of ilmenite-rich concentrates have been received for 22 of the 24 heavy mineral samples tested and collected on its 100% owned gold-scandium claims located 100km southeast of Chibougamau, Quebec.
These results are consistent with the claims being underlain by an extensive massive ilmenite horizon highly anomalous in scandium. Rio Tinto are presently mining an extensive massive ilmenite horizon near Allard Lake, Quebec. The ilmenite ore is railed 42km and then shipped about 900km along the St. Lawrence River to their Fer et Titane metallurgical complex near Montreal where titanium oxide, iron, steel and metal powders are recovered from the ilmenite ore. A plant to recover scandium from the ilmenite tailings is presently being constructed that is expected to produce 20% of the global scandium supply. Scandium is used primarily in the aerospace, automotive, military and 3D printing industries.
The Metalex claims are located adjacent to Highway 167, 520 kilometres by road from the Rio Tinto metallurgical complex.
Table 1, below, presents the results from the 0.25mm to 0.5mm sized heavy (> 3.27 specific gravity), weakly magnetic, conductive concentrate recovered from the sample. This concentrate should contain the vast majority of the ilmenite grains of this size fraction. For each sample, a representative split of the concentrate was picked, with the number of ilmenites within the sample extrapolated from this. The table contains the number of ilmenites (normalized to a 10kg sample size) along with the scandium content of the concentrate as determined by neutron activation analysis at Activation Laboratories.
Table 1. Ilmenite counts and scandium content of the 0.25mm to 0.5mm heavy, weakly magnetic, conductive concentrate.
|
Sample Name |
Picked ilmenites |
Scandium |
|
Normalized |
ppm |
|
|
RQ0571 |
7,694 |
41.3 |
|
RQ0722 |
127,702 |
19.6 |
|
RQ0723 |
13,446 |
26.8 |
|
RQ0724 |
46,007 |
31.0 |
|
RQ0725 |
154 |
53.1 |
|
RQ0751 |
83,629 |
29.1 |
|
RQ0752 |
8,609 |
32.4 |
|
RQ0753 |
6,213 |
25.6 |
|
RQ0754 |
9,299 |
56.4 |
|
RQ0755 |
8,382 |
34.4 |
|
RQ0756 |
68,668 |
22.9 |
|
RQ0757 |
26,022 |
29.5 |
|
RQ0760 |
43 |
57.8 |
|
RQ0765 |
56,726 |
27.4 |
|
RQ0766 |
402 |
49.8 |
|
RQ4076 |
275 |
39.1 |
|
RQ4077 |
84,010 |
31.9 |
|
RQ4078 |
142,754 |
24.2 |
|
RQ4079 |
2,243,805 |
31.9 |
|
RQ5046 |
81 |
53.5 |
|
RQ5047 |
56,564 |
28.3 |
|
RQ5048 |
17,375 |
33.0 |
|
RQ5049 |
2,627 |
42.3 |
|
RQ5050 |
60,157 |
30.0 |
According to Alexandsandrovsky et al., Ores and Metals Publishers, Moscow, 2004, about 2 million tons per year of ilmenite containing 10 to 20ppm scandium yields about 20 to 40 tons of scandium oxide. As seen in the table above, the ilmenite rich concentrates exceed these global ppm values.
Upon review of the Company's proprietary 8,698 regional heavy mineral samples database covering central Quebec ten samples were selected that also yielded anomalous scandium in the -0.25mm sized heavy, non-magnetic concentrates of these +/- 10kg samples. 0.25mm to 0.5mm, weakly magnetic, conductive concentrates (which would contain the bulk of the ilmenite grains) were prepared. Picking at CF Minerals using a binocular microscope of a portion of each concentrate yielded abundant ilmenites from seven of ten samples. These concentrates have also been submitted for neutron activation analysis for scandium and 33 other elements. Metalex awaits these results to see whether other areas in Quebec could also host scandium rich ilmenite.
Metalex directors are optimistic that an extensive ilmenite-rich body high in scandium will be discovered within the claims. A combined magnetic-electromagnetic survey is expected to commence over the claims within the next month which should provide drill targets.
The technical information and results reported here have been reviewed by Mr. Chad Ulansky P.Geol., a Qualified Person under National Instrument 43-101, who is responsible for the technical content of this release.
Signed,
Charles Fipke
Charles Fipke
Chairman
Forward Looking Statements
Some of the statements contained herein may be forward-looking statements which involve known and unknown risks and uncertainties. Without limitation, statements regarding potential mineralization and resources, exploration and financing results, and future plans and objectives of the Company are forward looking statements that involve various risks. The following are important factors that could cause the Company's actual results to differ materially from those expressed or implied by such forward looking statements: changes in the world wide price of mineral commodities, general market conditions, risks inherent in mineral exploration, risks associated with development, construction and mining operations, the uncertainty of future profitability and the uncertainty of access to additional capital. There can be no assurance that forward-looking statements will prove to be accurate as actual results and future events may differ materially from those anticipated in such statements. In particular there is no assurance that the Offering detailed herein will complete in full or at all. Metalex undertakes no obligation to update such forward-looking statements if circumstances or management's estimates or opinions should change. The reader is cautioned not to place undue reliance on such forward-looking statements.
Neither TSX Venture Exchange nor its Regulation Services Provider (as that term is defined in the policies of the TSX Venture Exchange) accepts responsibility for the adequacy or accuracy of this release.
SOURCE Metalex Ventures Ltd.

View original content: http://www.newswire.ca/en/releases/archive/April2021/19/c6116.html
SUDBURY, ON / ACCESSWIRE / April 19, 2021 / Northern Superior Resources ("Northern Superior" or the "Company") (TSXV:SUP)(OCTQB:NSUPF) is pleased to announce that it has expanded its previously announced 10,000 meter ("m") core drill program on its 100% owned Lac Surprise property (see Northern Superior press release, March 15, 2021). The expanded Phase II drill program has been increased to a minimum of 13,000m, and will consist of two stages.
Stage 1, expanded to 8,000m, is designed to better define and expand the newly discovered Falcon Gold Zone, believed to be the western extension of the neighboring IAMGold/Vanstar's Nelligan gold deposit located approximately 2.4 kilometers ("km") to the east with an inferred resource* of 3.2 million ounces at 1.02 g/t gold ("Au") (see Figure 1).
Stage 2, consisting of approximately 5,000m, is designed to test three early-stage gold targets west of Target 1; Target 3; the Fox Gold showing and the Confluence Area (see Figure 2).
Stage 1: Target 1, Better Defining the Falcon Gold Zone
Based on the progress of the drill program to date the board has approved an expansion of the Stage 1 drill program on the Falcon Zone to 27 holes over 8,000m from its prior 16 holes over 5,000m. Eight holes (2,591m) of the now expanded 8,000m Stage 1 program have been completed. Five of the first eight holes have been processed with 1,134 samples submitted for assays, with material from another two holes expected to be delivered to the lab by the end of next week. These first eight holes cover a strike length of 450m from the property boundary near the first discovery hole of the Falcon Gold Zone (LCS20-13, 1.07 g/t gold equivalent ("AuEq")** over 35.5m with a high-grade interval of 8.22 g/t AuEq over 2.6m) to 150m west of the second discovery hole (LCS19-005ext., 1.55 g/t AuEq over 44.9m, including 3.82 g/t AuEq over 15m). Although most of these holes are relatively shallow (~250m), one deep hole has been completed (375m) while a second deep hole of (350m) is in progress currently. The expanded 27 hole program will test a potential strike length of approximately 900m.
Dr. T.F. Morris, President and CEO states: "We are very pleased with the drill progress made to date at Target 1, having learned much about the Falcon Gold Zone from the Fall 2020 drill program we have been able to apply this knowledge to the current program. The expanded Phase II drill program of 13,000 meters will allow us to fully define the full potential of this exciting new discovery for our shareholders.
We are also very excited to share details of our plans for Stage 2 of this program, having completed a thorough evaluation of highly prospective targets at Target 3, the Fox Gold Zone and the Confluence Area. In addition, initiating a drone magnetic survey over the central part of the property will provide high quality magnetic data, the same type of magnetic data used to assist in discovering the Falcon Gold Zone at Target 1 and defining the geophysical parameters associated with Target 3. This data will go a long way to refining drill targets in the Confluence area and the area directly to the south and west.
We look forward to sharing the progress and the results of these various initiatives on the Lac Surprise property as assays become available."
Stage 2: Target 3, Falcon Showing and the Confluence Area
Target 3
Target 3 is a compelling, large geophysical target located 7km west of the Nelligan gold deposit (see Figure 2). The geophysical signature of this target consists of a number of similarities to the Nelligan geophysical signature that led to the discovery of the Falcon Gold Zone. The geophysical attributes include:
-
A large, deeply rooted intrusion;
-
Associated with 60° faults; and
-
Associated large areas magnetic lows suggesting areas of silicification and alteration leading to magnetic destruction. There are three such large areas identified to the southeast (~4.0 x 1.0kms), northeast (~2.0 x 2.0kms) and northwest (~1.0km x 1.0km) of the proposed intrusion (Figure 3).
Our Initial Drilling on Target 3 will focus on the largest target to the southeast (4.0 x 1.0 kms) and will be tested with 3 core drill holes, each 400m long.
Fox Gold Showing
The Fox gold showing is located along the southwest part of the southeast area of Target 3. Unlike the targets associated with Target 3, the Fox showing is associated with a high magnetic signature suggesting an association with a more iron-rich environment. Gold-bearing material associated with this showing was collected from two channel samples (up to 6.76 g/t Au over 1.0m: Fox North showing; up to 2.95 g/t Au over 1.0m: Fox Showing) and grab samples from SOQUEM trenches (up to 900 ppb Au; ref. GM49908)(see Figure 4).
Four drill holes for a total of approximately 1,000m is currently proposed to test this target.
Confluence Area
The Confluence is an area where two prominent deformation zones converge (Remick and Doda: the "Confluence Area"; see Figure 2). This area contains a prominent gold grain dispersal train (maximum 49 gold grains, 10 kilogram ("kg") till sample). A 10kg stream sediment sample just west and at the intersection of two faults yielded 107 gold grains. This area also has a gold showing with a grab sample that assayed 1.35 g/t Au.
To test the prospectivity for gold mineralization in this area, three targets were selected based on a careful evaluation of the Company's Induced Polarization geophysical data, distribution of gold grain data and historical drilling (see Figure 5).
These targets will be tested with 5 drill holes, each 300m in length.
Drone Magnetic Survey
Northern Superior is also pleased to announce that it has initiated a 954 line-kilometer, 50m spaced, drone magnetic survey over the central part of the property (see Figure 6). The geophysical product derived from this program will be the same high-quality data used to identify the geophysical properties associated with the Falcon Gold Zone discovered in Target Area 1 and the geophysical properties associated with Target 3. The data will also be used to refine targets in the Confluence Area and the area to the south and southwest of the Confluence Area.
* Reference for IAMGOLD/Vanstar's Nelligan 3.2MM Inferred Gold Resource: "Carrier, Alain (M.Sc., P.Geo); Nadeau-Benoit, Vincent (P.Geo); Fauvre, Stéphane (PhD., P.Geo). October 22, 2019. NI 43-101 Technical Report and Initial Resource Estimate for the Nelligan Project, Québec, Canada."
** Gold equivalent grades calculated based on a 75 Au:Ag factor ratio.
Qualified Person
Michel Leblanc (P.Geo.) is a Qualified Person ("QP") within the meaning of National Instrument 43-101. Mr. Leblanc has reviewed, and approved information disclosed in this press release. Michael Leblanc, who is also a Qualified Person ("QP") will be overseeing the core drill program.
Note to readers: Mineralization hosted on adjacent and/or nearby properties is not necessarily indicative of mineralization hosted on the Company's property.
About Northern Superior Resources Inc.
The Lac Surprise gold property is one of three key mineral properties 100% owned by Northern Superior Resources. The other two properties (TPK and Croteau Est) also represent regional scale exploration opportunities (see Northern Superior Corporate Presentation, www.nsuperior.com).
Northern Superior is a reporting issuer in British Columbia, Alberta, Ontario and Québec, and trades on the TSX Venture Exchange under the symbol SUP, and the OTCQB Venture Market under the symbol NSUPF.
For Further Information
Please refer to Northern Superior news available on the Company's website (www.nsuperior.com) and on SEDAR (www.sedar.com) or contact:
Thomas F. Morris P.Geo., PhD., FGAC
President and CEO
Tel: (705) 525 ‐0992
Fax: (705) 525 ‐7701
e‐mail: info@nsuperior.com
Cautionary Note Regarding Forward-Looking Statements
This Press Release contains forward-looking statements that involve risks and uncertainties, which may cause actual results to differ materially from the statements made. When used in this document, the words "may", "would", "could", "will", "intend", "plan", "anticipate", "believe", "estimate", "expect" and similar expressions are intended to identify forward-looking statements. Such statements reflect our current views with respect to future events and are subject to such risks and uncertainties. Many factors could cause our actual results to differ materially from the statements made, including those factors discussed in filings made by us with the Canadian securities regulatory authorities. Should one or more of these risks and uncertainties, such actual results of current exploration programs, the general risks associated with the mining industry, the price of gold and other metals, currency and interest rate fluctuations, increased competition and general economic and market factors, occur or should assumptions underlying the forward looking statements prove incorrect, actual results may vary materially from those described herein as intended, planned, anticipated, or expected. We do not intend and do not assume any obligation to update these forward-looking statements, except as required by law. Shareholders are cautioned not to put undue reliance on such forward-looking statements.
Neither the TSX Venture Exchange nor its Regulation Services Provider (as that term is defined in the policies of the TSX Venture Exchange) accepts responsibility for the adequacy or accuracy of this release.
Figure 1: Phase II Stage I core drill plan, Target Area 1.

Figure 2: Location of Target 3, the Fox Showing and the Confluence area.

Figure 3: Target Area 3, surface expression. Note the three deep blue areas representing the large areas of potential alteration zones in addition to the large intrusive complex (potential heat source) and structural environment.

Figure 4: Geophysical signature and gold showings associated with the Fox Gold Showing.

Figure 5. Three target areas to be tested associated with the Confluence Area, drill collars and traces. Each drill hole will be ~300m long.

Figure 6. Areas covered by the ongoing Drone magnetic survey, total of 954km of flight lines at 50m spacing. Data will be the same high-quality data derived from the drone survey completed in 2019 used to help define the Falcon Gold Zone, target Area 1 and the geophysical properties associated with target Area 3. Same data will also refine targeting in the Confluence Area and the area to the south and south west.

SOURCE: Northern Superior Resources Inc.
View source version on accesswire.com:
https://www.accesswire.com/640777/Northern-Superior-Announces-Progress-Update-and-Expansion-of-Phase-II-Drill-Program-at-Lac-Surprise-to-a-Minimum-of-13000-Meters
Vancouver, British Columbia–(Newsfile Corp. – April 19, 2021) – International Lithium Corp. (TSXV: ILC) (the "Company" or "ILC") is pleased to announce that the Company has completed a maiden diamond drilling program on the Raleigh Lake Lithium project near Ignace, Ontario, Canada. A total of 1,504 metres of NQ core drilling were completed in eight holes to test the continuity of spodumene bearing pegmatites and their associated lithium, tantalum and cesium mineralization down dip and along strike from outcrop and previous operators' drilling.
The royalty-free, 100-percent-owned Raleigh Lake project comprising a total of 3,027 hectares hosts a number of outcropping pegmatite bodies. The recent drilling focused on what the Company now refers to as Zone 1 (Figure 1), an area of approximately one square kilometre (100 hectares) that hosts Pegmatites 1 and 3. The two shallow dipping pegmatite dykes have been mapped at surface with Pegmatite 1 exposed along strike for at least 300 metres and intersected 400 metres downdip by drilling conducted prior to ILC's drilling campaign. Seven of ILC's eight widely dispersed holes, covering an area approximately 600 x 300 metres, intersected pegmatite.
The core has been logged and cut with samples submitted for chemical analysis. Assay results are expected by mid-May.
Logistics of the drill program were excellent as the project is road accessible and is just a short distance from the Trans-Canada Highway. The Raleigh project is located less than 20 kilometres directly west of the Township of Ignace, Ontario. It distinguishes itself from other lithium projects in Canada by being very well situated near to major public infrastructure; the Trans-Canada Highway, with direct access to Thunder Bay on Lake Superior, is less than six kilometres north of the project as is the mainline of the Canadian Pacific Railway, natural gas pipelines, and the hydro power line junction at Raleigh Lake. By having relatively easy access to public services coupled with no need to spend significant sums of money on building new roads or electric power lines to service the site nor buildings to house contractors, the Raleigh project posesses a substantial advantage over more remote mining projects.
With the drilling taking place exclusively in Zone 1, which is within one kilometre of the historic drilling, there are no results yet for Zones 2 to 5. These additional zones include claims acquired by ILC in 2016 and 2018 and include some with surface pegmatite exposures. ILC intends to carry out wider drilling in various phases on Zones 2 to 5 as targets are prioritized in these areas.
John Wisbey, Chairman and CEO of International Lithium Corp. commented "This was an encouraging drilling program for ILC with what appear to be good and solid results in Raleigh Lake Zone 1 that build significantly on our confidence of the project's potential. If the chemical analysis received over the next few weeks is favourable, that may well be sufficient to warrant follow-up with some preliminary economic analyses prior to further drilling in Zone 1. The board also believes that investment in further drilling in Zones 2 to 5 is highly warranted and remains hopeful, based on earlier geological analysis, that it could deliver even greater potential than we are defining at Zone 1."
Quality assurance/quality control procedures
International Lithium Corp. has implemented a rigorous quality assurance/quality control program to ensure best practices in sampling and analysis of diamond drill core. All assays are performed by Activation Laboratories Ltd. (ActLabs), with sample preparation and analysis carried out in their full-service facility in Dryden, Ontario. Sample preparation involves crushing the entire sample to 80% passing 2 mm, riffle split 250g and pulverize to 95% passing 105 µm.
Primary analysis method: Peroxide (Total) Fusion, ICP-OES & ICP-MS with 55 elements including Li (3ppm – 5%). Sodium peroxide fusion provides total metal recovery and is effective for the decomposition of sulphides and refractory minerals.
Over limit analysis method: If Li >5%, then re-analyse by Assay Grade, Peroxide (Total) Fusion, including Li from 0.01%.
The drill program was under the control of a Professional Geoscientist, registered with The Association of Engineers and Geoscisntists of the Province of British Columbia.The Company and its contractors carried out the program under full compliance with COVID-19 protocols based on guidelines issued by the Provincial Health Officer (PHO) of British Columbia to ensure the safety and health, for all personnel.
Qualified person
Patrick McLaughlin, P.Geo, a "Qualified Person" as defined by National Instrument 43-101 – Standards of Disclosure for Mineral Projects has reviewed and approved the technical information in this press release.
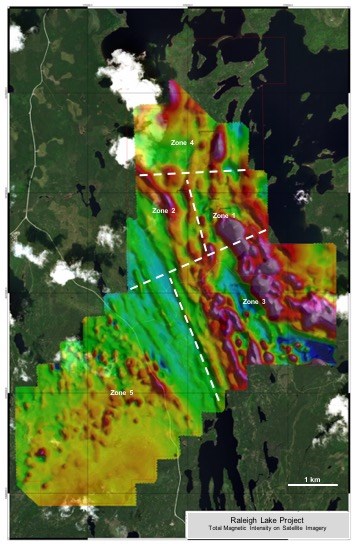
Figure 1: Total magnetic intensity image over the mineral claim outline divided into five Zones for various staged exploration activities at the Raleigh Lake Lithium project.
To view an enhanced version of Figure 1, please visit:
https://orders.newsfilecorp.com/files/3232/80715_8c2d9e82c48ab894_003full.jpg
About International Lithium Corp.
International Lithium Corp. believes that the '20s will be the decade of battery metals, at a time that the world faces a major turning point in the energy market's dependence on oil and gas and in the governmental and public view of climate change. Our key mission in the new decade is to make money for our shareholders from lithium and battery metals while at the same time helping to create a greener, cleaner planet. This includes optimizing the value of our existing projects in Canada, Argentina and Ireland as well as finding, exploring and developing projects that have the potential to become world class lithium and rare metal deposits. In addition, we have seen the clear and growing wish by the USA and Canada to safeguard their supplies of critical battery metals, and our Canadian properties are strategic in that respect.
A key goal in the new decade is to become a well funded company to turn our aspirations into reality.
International Lithium Corp. has a significant portfolio of projects, strong management, and strong partners. Partners include Ganfeng Lithium Co. Ltd., ("Ganfeng Lithium") a leading China-based lithium product manufacturer quoted on the Shenzhen and Hong Kong stock exchanges (A share code: 002460, H share code: 1772) and Essential Metals Limited, quoted on the Australian Stock exchange.
The Company's primary strategic focus is now on the Mariana project in Argentina and on the Raleigh Lake project in Canada.
The Company has a strategic stake in the Mariana lithium-potash brine project located within the renowned South American "Lithium Belt" that is the host to the vast majority of global lithium resources, reserves and production. The Mariana project strategically encompasses an entire mineral rich evaporite basin, totalling 160 square kilometres, that ranks as one of the more prospective salars or 'salt lakes' in the region. Current ownership of the project is through a joint venture company, Litio Minera Argentina S. A., a private company registered in Argentina, now owned 89.0% by Ganfeng Lithium and 11.0% by ILC (percentages are estimates and subject to audit). In addition, ILC has an option to acquire a further 10% in the Mariana project through a back-in right.
The Raleigh Lake project, now consisting of 3,027 hectares of adjoining mineral claims in Ontario, is regarded by ILC management as ILC's most significant project in Canada. It is 100% owned by ILC, is not subject to any encumbrances, and is royalty free.
Complementing the Company's lithium brine project at Mariana and rare metal pegmatite property at Raleigh Lake, are interests in two other rare metal pegmatite properties in Ontario, Canada known as the Mavis Lake and Forgan Lake projects, and the Avalonia project in Ireland, which encompasses an extensive 50-km-long pegmatite belt.
The ownership of the Mavis Lake project is now 51% Essential Metals Limited and 49% ILC. In addition, ILC owns a 1.5% NSR on Mavis Lake. ESS has an option to earn an additional 29% by sole-funding a further CAD $8.5 million expenditures of exploration activities, at which time the ownership will be 80% ESS and 20% ILC.
The Forgan Lake project will, upon Ultra Resources Inc. meeting its contractual requirements pursuant to its agreement with ILC, become 100% owned by Ultra Resources, and ILC will retain a 1.5% NSR on Forgan Lake.
The ownership of the Avalonia project is currently 55% Ganfeng Lithium and 45% ILC. Ganfeng Lithium has an option to earn an additional 24% by either incurring CAD $10 million expenditures on exploration activities or delivering a positive feasibility study on the project, at which time the ownership will be 79% Ganfeng Lithium and 21% ILC.
With the increasing demand for high tech rechargeable batteries used in electric vehicles and electrical storage as well as portable electronics, lithium has been designated "the new oil", and is a key part of a "green tech" sustainable economy. By positioning itself with solid strategic partners and projects with significant resource potential, ILC aims to be one of the lithium and battery metals resource developers of choice for investors and to continue to build value for its shareholders in the '20s, the decade of battery metals.
On behalf of the Company,
John Wisbey
Chairman and CEO
For further information concerning this news release please contact +1 604-449-6520
Neither TSX Venture Exchange nor its Regulation Services Provider (as that term is defined in the policies of the TSX Venture Exchange) accepts responsibility for the adequacy or accuracy of this release.
Cautionary Statement Regarding Forward-Looking Information
Except for statements of historical fact, this news release contains certain "forward-looking information" within the meaning of applicable securities law. Forward-looking information or forward-looking statements in this or other news releases may include: the effect of results of the preliminary economic assessment of the Mariana Joint Venture Project, timing of publication of the PEA technical report, anticipated production rates, the timing and/or anticipated results of drilling on the Raleigh Lake or Mavis Lake projects, the expectation of feasibility studies, lithium recoveries, modeling of capital and operating costs, results of studies utilizing membrane technology at the Mariana Project, budgeted expenditures and planned exploration work on the Avalonia Joint Venture, satisfactory completion of the sale of mineral rights at Forgan Lake, satisfactory completion of the purchase of additional mineral rights at Raleigh Lake, increased value of shareholder investments, and continued agreement between the Company and Jiangxi Ganfeng Lithium Co. Ltd. regarding the Company's percentage interest in the Mariana project. Such forward-looking information is based on a number of assumptions and subject to a variety of risks and uncertainties, including but not limited to those discussed in the sections entitled "Risks" and "Forward-Looking Statements" in the interim and annual Management's Discussion and Analysis which are available at www.sedar.com. While management believes that the assumptions made are reasonable, there can be no assurance that forward-looking statements will prove to be accurate. Should one or more of the risks, uncertainties or other factors materialize, or should underlying assumptions prove incorrect, actual results may vary materially from those described in forward-looking information. Forward-looking information herein, and all subsequent written and oral forward-looking information are based on expectations, estimates and opinions of management on the dates they are made that, while considered reasonable by the Company as of the time of such statements, are subject to significant business, economic and competitive uncertainties and contingencies. These estimates and assumptions may prove to be incorrect and are expressly qualified in their entirety by this cautionary statement. Except as required by law, the Company assumes no obligation to update forward-looking information should circumstances or management's estimates or opinions change.
To view the source version of this press release, please visit https://www.newsfilecorp.com/release/80715
Figure 1

Grace Shear Zone with the 2017 RPX Diamond Drilling intercept and the War Eagle Showing
Figure 2

Location of the War Eagle Claims
TORONTO, April 19, 2021 (GLOBE NEWSWIRE) — Red Pine Exploration Inc. (TSX-V: RPX) (“Red Pine” or the “Company”) announces that it has entered into a definitive property purchase agreement with 2533258 ONTARIO CORP. (the “Vendor”), dated April 16th, 2021 to acquire 100% interest in additional mining claims located in the McMurray Township, Michipicoten region of Ontario. This acquisition aligns with the Company’s strategy of consolidation of the Wawa Gold Project land package.
The acquisition of these properties, covering a total area of 50.2 hectares located East of Mountain Lake, is an integral part of Red Pine’s exploration strategy to increase the Company’s interests and developments in the region. Red Pine is pleased to secure this claim block surrounded by and adjacent to the Company’s flagship 100% owned Wawa Gold Project. The acquisition remains subject the receipt of TSX Venture Exchange approval.
Quentin Yarie, President and CEO of Red Pine, stated, “We are excited with the successful acquisition of these strategically located claims with gold showings exhibiting similar characteristics to our highly prospective Grace Darwin structures. Grace Darwin is a high priority, high grade exploration target planned for drilling in 2021.”
These additional properties sit on the projected Southern extension of the Grace Shear Zone in which intermittent historic mining between 1901 and 1944 in the Darwin-Grace Mine produced 17,634 ounces of gold at 13.27 g/t. Of the newly acquired claims, significant gold mineralization is known to occur at the War Eagle showing located along the strike of the projected southern extension of the Grace Shear Zone (see Figure 1). The best historic channel samples taken at the showing contained 15.43 g/t Au over 0.82 metre, and grab samples contained up to 16.32 g/t gold (Simson, W.E., Synopsis of Report on the Grace Mine, October 1, 1924). The reader is cautioned that the qualified person has not done sufficient work to independently verify the reported historic results, and that grab samples are selective by nature and may not represent the true grade or style of gold mineralization.
Figure 1: Grace Shear Zone with the 2017 RPX Diamond Drilling intercept and the War Eagle Showing is available at
https://www.globenewswire.com/NewsRoom/AttachmentNg/aa5f3771-38fc-4224-a5be-0c9cf0fcfc34
Previous Red Pine drilling conducted in 2017 in the Grace Shear Zone confirmed that high-grade gold mineralization extends beyond the known footprints of the Darwin-Grace mine and defined the Grace Shear Zone as a significant exploration target of the Wawa Gold Project (see Red Pine’s news release of March 3, 2017 for drilling results in the Grace Shear Zone and Figure 1). Notable results from Red Pine’s 2017 drilling are 57.31 g/t gold over 3.14 metres.
Pursuant to this agreement, Red Pine will purchase from 2533258 ONTARIO CORP. all the rights, titles and interests in and to the mineral properties located in the Sault Ste. Marie Mining Division, for a sale price of CAD$240,000 in cash and the issuance of 83,000 common shares at closing. The common shares issued in connection with the purchase agreement are subject to a standard 4 month hold period.
The description of mineral properties subject to this agreement are noted below and displayed in Figure 2:
-
PIN: 31169-0293 (MLAS ID: PAT-775): PCL 1785 SEC AWS; MINING CLAIM SSM3492 MCMURRAY; MICHIPICOTEN
-
PIN: 31169-0302 (MLAS ID: PAT-776 and PAT-777): PCL 1833 SEC AWS; MINING CLAIM SSM3809 MCMURRAY; MINING CLAIM SSM3810 MCMURRAY; MICHIPICOTEN
Figure 2: Location of the War Eagle Claims is available at
https://www.globenewswire.com/NewsRoom/AttachmentNg/0e297e02-194d-42e9-8511-eadad2c98509
The information is not necessarily indicative of the mineralization on the property. The Company will need to conduct an exploration program to confirm historical mineralization reported on the property and there is no guarantee that significant discovery will be made as a result of its exploration efforts.
Qualified Person
Quentin Yarie, P.Geo. and Chief Executive Officer of Red Pine and the Qualified Person, as defined by National Instrument 43-101, has reviewed and approved the news release’s technical information.
COVID-19 Precautions
Red Pine has developed and implemented compliant precautions and procedures according to guidelines for the Province of Ontario. Protocols were put in place to ensure our employees’ and contractors’ safety, thereby reducing the potential for community contact and spreading of the virus.
About Red Pine Exploration Inc.
Red Pine Exploration Inc. is a gold exploration company headquartered in Toronto, Ontario, Canada. The Company's common shares trade on the TSX Venture Exchange under the symbol "RPX".
For more information about the Company, visit www.redpineexp.com
Or contact:
Quentin Yarie, President and CEO, (416) 364-7024, qyarie@redpineexp.com
Or Tara Asfour, Investor Relations Manager, (514) 833-1957 tasfour@redpineexp.com
1National Instrument 43-101 Technical Report for the Wawa Gold Project, Brian Thomas P.Geo. Golder Associates Ltd, effective July 16, 2019
Neither TSX Venture Exchange nor its Regulation Services Provider (as that term is defined in policies of the TSX Venture Exchange) accepts responsibility for the adequacy or accuracy of this release.
This News Release contains forward-looking statements. In some cases, you can identify forward-looking statements by terminology such as "may", "should", "expects", "plans", "anticipates", "believes", "estimates", "predicts", "potential" or "continue" or the negative of these terms or other comparable terminology. These statements are only predictions and involve known and unknown risks, uncertainties and other factors that may cause our or our industry's actual results, levels of activity, performance or achievements to be materially different from any future results, levels of activity, performance or achievements expressed or implied by these forward-looking statements.
Although the Company believes that the assumptions and factors used in preparing the forward-looking information in this news release are reasonable, undue reliance should not be placed on such information, which only applies as of the date of this news release. The Company disclaims any intention or obligation to update or revise any forward-looking information, whether as a result of new information, future events or otherwise, other than as required by law.
Merger creates the 5th largest global lithium chemicals company with a diversified production base and exciting growth platform, with potential to unlock significant synergies and realise value to be shared by all shareholders.
BRISBANE, Australia, April 19, 2021 (GLOBE NEWSWIRE) — Orocobre Limited (ASX:ORE, TSX:ORL) (Orocobre) and Galaxy Resources Limited (ASX:GXY) (Galaxy) are pleased to announce that they have entered into a binding Merger Implementation Deed (MID) under which the two companies will merge via a Galaxy Scheme of Arrangement (Scheme) pursuant to which Orocobre will acquire 100% of the shares in Galaxy.
Galaxy shareholders will receive 0.569 Orocobre shares for each Galaxy share held at the Scheme record date. Upon implementation of the Scheme, Orocobre shareholders will own 54.2% of the fully diluted share capital of the combined entity and Galaxy shareholders will own the remaining 45.8%.
The Scheme is unanimously recommended by the Board of Galaxy and each Galaxy Director intends to vote all the shares that they hold in Galaxy in favour of the Scheme (in both cases, subject to no superior proposal emerging and the Independent Expert concluding (and continuing to conclude) that the Scheme is in the best interests of Galaxy shareholders).
The Scheme is endorsed and supported by the Board of Orocobre, subject to no proposal for Orocobre emerging.
As part of the proposed Scheme, Martin Rowley would become Non-Executive Chairman, Robert Hubbard would become Deputy Chairman, and Martín Pérez de Solay would remain CEO and Managing Director of the group, with a highly experienced and complementary Board and management team drawn from the combined group.
A new name for the merged entity will be selected in due course representing the global reach of the new entity, which will have its head office in Buenos Aires, Argentina, a corporate headquarters on the Australian East Coast and an office in Perth.
Highlights Summary
-
Creating a Top 5 global lithium chemicals company1
-
Highly complementary portfolio of assets delivering geographical and product diversification across brine, hard rock and vertical integration across the supply chain
-
Industry leading growth profile with enhanced financial position to optimise and potentially accelerate development with the ability and intent to capture further downstream value
-
Compelling industrial logic with significant value creation opportunities unique to this merger
-
Highly experienced and complementary Board and senior management teams to drive growth
-
Potential to generate significant shareholder value with enhanced scale and financial capacity
Galaxy Chairman Martin Rowley commented: “This transaction has the potential to be a significant value-creating opportunity for Galaxy and Orocobre shareholders. The Scheme provides shareholders of Galaxy with the opportunity to share in the significant benefits of being part of a larger diversified group and the synergies expected to be available to help enhance and progress our portfolio of world class assets. The merged entity's growth opportunities in both brine and hard rock position it uniquely to take advantage of expected rising EV demand for lithium.”
Orocobre Chairman Robert Hubbard commented: “The logic of this merger is compelling. Both Orocobre and Galaxy shareholders, will benefit from the diversification, growth and scale of a top 5 global lithium chemicals company. I take this opportunity to re-iterate the group's ongoing commitment to the principles of delivering the highest level of transparency of our environmental, social and governance performance, the foundations upon which our assets have and will continue to be developed.”
Orocobre CEO and Managing Director Martín Pérez de Solay commented: “The merger brings together assets and teams with highly complementary skills and knowledge, with a unique opportunity to create a leading independent lithium company. The merger consolidates the combined group’s position in Argentina and will give us significant operational, technical and financial flexibility to deliver the full value of our combined portfolio.”
Galaxy CEO Simon Hay commented: “The merger with Orocobre represents an exciting opportunity for both Orocobre and Galaxy shareholders to consolidate and realise the full potential of our asset portfolios and technical capabilities. The transaction will allow the group to materially accelerate the development of our combined growth projects.”
Orocobre and Galaxy will be hosting a joint investor call at 10.30am AEST (8.30am AWST) today, 19 April 2021. Orocobre and Galaxy are announcing their respective quarterly results today.
The call can be accessed via the following link:
https://services.choruscall.com.au/webcast/ubs-210419.html
Transaction Summary
Orocobre Limited (ASX:ORE, TSX:ORL) and Galaxy Resources Limited (ASX:GXY) have entered into a binding Merger Implementation Deed (MID) under which the two companies will merge via a Galaxy Scheme.
Under the Scheme, Galaxy shareholders will receive 0.569 Orocobre shares for each Galaxy share held on the record date for the Scheme. Orocobre shareholders will own 54.2% of the fully diluted share capital of the combined entity and Galaxy shareholders will own the remaining 45.8%.
The Galaxy Board of Directors unanimously recommends that Galaxy shareholders vote in favour of the Scheme and each Galaxy Director intends to vote all the shares that they hold in Galaxy in favour of the Scheme (in both cases, subject to the Independent Expert opining that the Scheme is in the best interests of Galaxy shareholders and in the absence of a superior proposal).
The Orocobre Board endorses and supports the transaction in the absence of a proposal for Orocobre.
Under the Scheme, Galaxy Chairman Martin Rowley would become Non-Executive Chairman, Orocobre Chairman Robert Hubbard would become Deputy Chairman, Martín Pérez de Solay would remain CEO of the group and Simon Hay will would become President of International Business reporting to the CEO. The CEO together with the Board will commence an integration process to determine the optimal management team drawing from employees from both companies based on a best fit basis.
On implementation of the Scheme, the Board of Directors will comprise four Independent Directors from Orocobre (including Mr Hubbard), four Independent Directors from Galaxy (including Mr Rowley), and the CEO Mr Pérez de Solay. It is agreed that both Mr Rowley and Mr Hubbard will retire from their roles within 12 months of implementation. They will lead a process to ensure that the longer-term Board composition is ideally placed to lead the merged entity going forward.
Strategic Rationale
-
Creating a Top 5 global lithium chemicals company
-
Creates the leading ASX lithium company and a top 5 global lithium chemicals company2
-
One of the world’s largest, most geographically diversified producers of lithium chemicals
-
Vertically integrated and able to service multiple markets and customers
-
-
Highly complementary portfolio of assets delivering diversification of production and vertical integration
-
Diversified across geography, lithium source and end products
-
Combines two complementary, large scale tier-one assets
-
Vertically integrated product strategy for all key assets
-
-
Industry leading growth profile with enhanced financial position to optimise and potentially accelerate development with the ability and intent to capture further downstream value
-
Significant portfolio of upstream and downstream growth projects
-
Growth pipeline evenly balanced between production optimisation, construction, advanced projects, brownfield expansions and early-stage projects
-
Unique platform of expertise, capacity and geographic presence to consider further inorganic growth opportunities
-
-
Compelling industrial logic with potentially significant value creation unique to this merger
-
Ability to apply combined management and technical expertise across the merged group and shared IP to further de-risk Sal de Vida and optimise Olaroz
-
Potential for substantial savings in Argentina from expertise sharing, employee and contractor sharing and procurement savings
-
Marketing synergies expected from expanded customer relationships and a broader product base
-
-
Highly experienced and complementary Board and senior management teams to drive growth
-
Global team with significant technical expertise to deliver brine projects in Argentina
-
Proven track record of successfully delivering projects across brine, hard rock, and processing
-
Extensive experience within Argentina shared across the combined board and senior management team
-
-
Potential to generate significant shareholder value with enhanced scale and financial capacity
-
Combined entity expected to be included in the ASX 200 index and approach ASX 100 index thresholds
-
Significantly enhanced liquidity and capital markets profile
-
Strengthened balance sheet with pro forma gross cash of US$487m3 well placed to deliver a world class project pipeline
-
Conditions
Key conditions to the implementation of the Scheme include:
-
Galaxy shareholder approval;
-
Approval by the Court;
-
The Independent Expert concluding that the Scheme is in the best interests of Galaxy shareholders and not changing, withdrawing or qualifying that conclusion;
-
No material adverse effect or prescribed event (as each defined in the MID) occurring in relation to either Orocobre or Galaxy (as applicable); and
-
Other conditions customary for a transaction of this nature.
The MID includes reciprocal exclusivity arrangements (including “no shop”, “no talk” and “no due diligence” restrictions and notification obligations) in favour of both parties, a matching right regime in favour of Orocobre and break fees in favour of both parties. The exclusivity arrangements are subject to customary exceptions that enable the directors of Galaxy and Orocobre to comply with their respective fiduciary and / or statutory duties.
Full details of the terms and conditions are set out in the MID, a copy of which is set out in Annexure A.
Timetable and next steps
Galaxy shareholders do not need to take any action in relation to the Scheme at this stage.
A scheme booklet containing information in relation to the Scheme, including the basis for the Galaxy Board’s unanimous recommendation, an Independent Expert Report and details of the Scheme is expected to be circulated to all Galaxy shareholders in late June 2021.
An indicative timetable (which remains subject to change) is set out below:
|
Event |
Estimated date |
|
First Court Hearing |
Late June 2021 |
|
Dispatch scheme booklet to Galaxy shareholders |
Late June 2021 |
|
Scheme Meeting |
Late July 2021 |
|
Second Court hearing |
Late July – Early August 2021 |
|
Effective Date |
Late July – Early August 2021 |
|
Record Date |
Early – Mid August 2021 |
|
Implementation Date |
Mid August 2021 |
Advisers
Orocobre’s financial adviser is UBS AG, Australia Branch and its legal adviser is Jones Day.
Galaxy’s financial adviser is Standard Chartered Bank and its legal adviser is Ashurst.
Conference Call
Orocobre and Galaxy will host a joint investor call at 10.30am AEST (8.30am AWST) today, 19 April 2021. The call can be accessed via the following link:
https://services.choruscall.com.au/webcast/ubs-210419.html
This release was authorised by the Board of Galaxy Resources Limited and the Board of Orocobre Limited.
Investor Relations Enquiries
|
Andrew Barber |
Phoebe Lee |
Media Enquiries
|
Justin Kirkwood |
Scott Rochfort |
IMPORTANT NOTICES
This announcement is a joint announcement by Galaxy Resources Limited ACN 071 976 442 (Galaxy) and Orocobre Limited ACN 112 589 910 (Orocobre).
This presentation has been prepared in relation to the proposed merger between Galaxy and Orocobre by way of scheme of arrangement under Part 5.1 of the Corporations Act 2001 (Cth) (Scheme). Under the Scheme, Orocobre would acquire 100% of the fully paid ordinary shares in Galaxy in exchange for the issue of new fully paid ordinary shares in Orocobre. The Scheme is subject to the terms and conditions described in the merger implementation deed entered into between Galaxy and Orocobre on or about the date of this announcement (Merger Implementation Deed). A copy of the Merger Implementation Deed is attached to this announcement and available on the ASX website (at www.asx.com.au).
Galaxy and Orocobre have jointly prepared this announcement based on information available to them as at the date of this announcement. No representation or warranty, express or implied, is made as to the fairness, accuracy, completeness or correctness of the information, opinions and conclusions contained in this announcement. To the maximum extent permitted by law, none of Galaxy or Orocobre, their respective directors, employees, agents or advisers, or any other person, accepts any liability, including, without limitation, any liability arising from fault or negligence on the part of any of them or any other person, for any loss arising from the use of this announcement or its contents or otherwise arising in connection with it.
Forward Looking Statements
This announcement contains forward looking statements concerning Galaxy, Orocobre and the merged group which are made as at the date of this announcement (unless otherwise indicated), including statements about intentions, beliefs and expectations, plans, strategies and objectives of the directors and management of Galaxy and Orocobre for Galaxy, Orocobre and the merged group, the anticipated timing for and outcome and effects of the Scheme (including expected benefits to shareholders of Galaxy and Orocobre), indications of and guidance on synergies, future earnings or financial position or performance, anticipated production or construction or development commencement dates, costs or production outputs, capital expenditure and future demand for lithium, expectations for the ongoing development and growth potential of the merged group and the future operation of Galaxy and Orocobre.
Forward looking statements are not statements of historical fact and actual events and results may differ materially from those contemplated by the forward looking statements as a result of a variety of risks, uncertainties and other factors, many of which are outside the control of Galaxy, Orocobre and the merged group. Such factors may include, among other things, risks relating to funding requirements, lithium and other commodity prices, exploration, development and operating risks (including unexpected capital or operating cost increases), production risks, competition and market risks, regulatory restrictions (including environmental regulations and associated liability, changes in regulatory restrictions or regulatory policy and potential title disputes) and risks associated with general economic conditions. Any forward-looking statements, as well as any other opinions and estimates, provided in this announcement are based on assumptions and contingencies which are subject to change without notice and may prove ultimately to be materially incorrect, as are statements about market and industry trends, which are based on interpretations of current market conditions.
There can be no assurance that the Scheme will be implemented or that plans of the directors and management of Galaxy and Orocobre for the merged group will proceed as currently expected or will ultimately be successful. You are strongly cautioned not to place undue reliance on forward looking statements, including in respect of the financial or operating outlook for Galaxy, Orocobre or the merged group (including the realisation of any expected synergies), particularly in light of the current economic climate and the significant volatility, uncertainty and disruption caused by the ongoing COVID-19 pandemic.
Except as required by law or the ASX listing rules, Galaxy and Orocobre assume no obligation to provide any additional or updated information or to update any forward looking statements, whether as a result of new information, future events or results, or otherwise. Nothing in this announcement will, under any circumstances (including by reason of this announcement remaining available and not being superseded or replaced by any other presentation or publication with respect to Galaxy, Orocobre or the merged group, or the subject matter of this announcement), create an implication that there has been no change in the affairs of Galaxy or Orocobre since the date of this announcement.
Mineral Resources and Ore Reserves reporting (by Galaxy and Orocobre)
Any information in this announcement that relates to Sal de Vida Project Mineral Resources and Ore Reserves is extracted from the ASX announcement entitled “Sal de Vida Resource and Reserve Update” dated 14 April 2021 which is available to view on www.gxy.com and www.asx.com.au. Galaxy confirms that it is not aware of any new information or data that materially affects the information included in the original market announcements and that all material assumptions and technical parameters underpinning the Mineral Resources and Ore Reserves estimates in the relevant market announcement continue to apply and have not materially changed. Galaxy confirms that the form and context in which the Competent Person’s findings are presented have not been materially modified from the original market announcement.
Any information in this announcement that relates to James Bay Mineral Resources is extracted from the ASX announcement, entitled “James Bay Resource Update” dated 4 December 2017 which is available to view on www.gxy.com and www.asx.com.au. Galaxy confirms that it is not aware of any new information or data that materially affects the information included in the original market announcement and that all material assumptions and technical parameters underpinning the Mineral Resources in the relevant market announcement continue to apply and have not materially changed. Galaxy confirms that the form and context in which the Competent Person’s findings are presented have not been materially modified from the original market announcement.
Any information in this announcement that relates to Mt Cattlin Mineral Resources and Ore Reserves is extracted from the report entitled “2020 Resource & Reserve Update” dated 17 March 2021 which is available to view on www.gxy.com and www.asx.com.au. Galaxy confirms that it is not aware of any new information or data that materially affects the information included in the original market announcement and that all material assumptions and technical parameters underpinning the Mineral Resources and Ore Reserves estimates in the relevant market announcement continue to apply and have not materially changed. Galaxy confirms that the form and context in which the Competent Person’s findings are presented have not been materially modified from the original market announcement.
Orocobre is not in possession of any new information or data relating to historical estimates that materially impacts on the reliability of the estimates or Orocobre's ability to verify the historical estimates as mineral resources, in accordance with the JORC Code. The supporting information provided in the initial market announcement on 21/08/12 continues to apply and has not materially changed. Additional information relating to Orocobre's Olaroz Lithium Facility is available on Orocobre's website in “Technical Report – Salar de Olaroz Lithium-Potash Project, Argentina” dated May 13 2011, which was prepared by John Houston, Consulting Hydrogeologist, together with Mr. Michael Gunn, Consulting Processing Engineer, in accordance with NI 43-101.
The information in this report that relates to exploration reporting at the Cauchari project has been prepared by Mr. Murray Brooker. Mr. Brooker is a geologist and hydrogeologist and is a Member of the Australian Institute of Geoscientists. Mr. Brooker is an employee of Hydrominex Geoscience Pty Ltd and is independent of Orocobre. Mr. Brooker has sufficient relevant experience to qualify as a competent person as defined in the 2012 edition of the Australasian Code for Reporting of Exploration Results, Mineral Resources and Ore Reserves. He is also a “Qualified Person” as defined in NI 43-101. Mr. Brooker consents to the inclusion in this announcement of this information in the form and context in which it appears.
Note on synergies
Please also refer to the investor presentation (including slides 7, 8, 13, 14 and 15) released by Galaxy and Orocobre to ASX simultaneously with this announcement for further information about the basis and assumptions underlying any statements about expected synergies in this announcement.
Not for release or distribution in the United States
This announcement has been prepared for publication in Australia and may not be released to U.S. wire services or distributed in the United States. This announcement does not constitute an offer to sell, or a solicitation of an offer to buy, securities in the United States or any other jurisdiction, and neither this announcement or anything attached to this announcement shall form the basis of any contract or commitment. Any securities described in this announcement have not been, and will not be, registered under the U.S. Securities Act of 1933 and may not be offered or sold in the United States except in transactions registered under the U.S. Securities Act of 1933 or exempt from, or not subject to, the registration of the U.S. Securities Act of 1933 and applicable U.S. state securities laws.
TSX matters
Orocobre is an “Eligible Interlisted Issuer” for purposes of the TSX and intends to rely on the exemptions set forth in Section 602.1 of the TSX Company Manual in respect of the Scheme. The issuance of shares by Orocobre pursuant to the Scheme is subject to acceptance by the TSX.
___________________
1 Based on market capitalisation as at ASX market close on 16 April 2021.
2 Based on market capitalisation as at ASX market close on 16 April 2021.
3 As at 31 March 2021 and includes restricted cash of US$108m.
Whilst it may not be a huge deal, we thought it was good to see that the Oklo Resources Limited (ASX:OKU) MD, CEO & Director, Simon Taylor, recently bought AU$109k worth of stock, for AU$0.14 per share. That purchase might not be huge but it did increase their holding by 13%.
View our latest analysis for Oklo Resources
The Last 12 Months Of Insider Transactions At Oklo Resources
In fact, the recent purchase by Simon Taylor was the biggest purchase of Oklo Resources shares made by an insider individual in the last twelve months, according to our records. So it's clear an insider wanted to buy, at around the current price, which is AU$0.14. Of course they may have changed their mind. But this suggests they are optimistic. If someone buys shares at well below current prices, it's a good sign on balance, but keep in mind they may no longer see value. The good news for Oklo Resources share holders is that an insider was buying at near the current price. Simon Taylor was the only individual insider to buy during the last year.
Simon Taylor bought a total of 1.60m shares over the year at an average price of AU$0.18. The chart below shows insider transactions (by companies and individuals) over the last year. By clicking on the graph below, you can see the precise details of each insider transaction!

Oklo Resources is not the only stock that insiders are buying. For those who like to find winning investments this free list of growing companies with recent insider purchasing, could be just the ticket.
Insider Ownership
Looking at the total insider shareholdings in a company can help to inform your view of whether they are well aligned with common shareholders. We usually like to see fairly high levels of insider ownership. From our data, it seems that Oklo Resources insiders own 11% of the company, worth about AU$7.0m. But they may have an indirect interest through a corporate structure that we haven't picked up on. Whilst better than nothing, we're not overly impressed by these holdings.
So What Does This Data Suggest About Oklo Resources Insiders?
It is good to see the recent insider purchase. We also take confidence from the longer term picture of insider transactions. However, we note that the company didn't make a profit over the last twelve months, which makes us cautious. We would certainly prefer see higher levels of insider ownership but analysis of the insider transactions suggests that Oklo Resources insiders are expecting a bright future. So these insider transactions can help us build a thesis about the stock, but it's also worthwhile knowing the risks facing this company. For example, Oklo Resources has 6 warning signs (and 3 which are concerning) we think you should know about.
Of course, you might find a fantastic investment by looking elsewhere. So take a peek at this free list of interesting companies.
For the purposes of this article, insiders are those individuals who report their transactions to the relevant regulatory body. We currently account for open market transactions and private dispositions, but not derivative transactions.
This article by Simply Wall St is general in nature. It does not constitute a recommendation to buy or sell any stock, and does not take account of your objectives, or your financial situation. We aim to bring you long-term focused analysis driven by fundamental data. Note that our analysis may not factor in the latest price-sensitive company announcements or qualitative material. Simply Wall St has no position in any stocks mentioned.
Have feedback on this article? Concerned about the content? Get in touch with us directly. Alternatively, email editorial-team (at) simplywallst.com.
Warren Buffett famously said, 'Volatility is far from synonymous with risk.' So it might be obvious that you need to consider debt, when you think about how risky any given stock is, because too much debt can sink a company. Importantly, Antofagasta plc (LON:ANTO) does carry debt. But the more important question is: how much risk is that debt creating?
When Is Debt A Problem?
Generally speaking, debt only becomes a real problem when a company can't easily pay it off, either by raising capital or with its own cash flow. Ultimately, if the company can't fulfill its legal obligations to repay debt, shareholders could walk away with nothing. However, a more usual (but still expensive) situation is where a company must dilute shareholders at a cheap share price simply to get debt under control. Of course, plenty of companies use debt to fund growth, without any negative consequences. The first step when considering a company's debt levels is to consider its cash and debt together.
Check out our latest analysis for Antofagasta
What Is Antofagasta's Net Debt?
You can click the graphic below for the historical numbers, but it shows that as of December 2020 Antofagasta had US$3.55b of debt, an increase on US$2.51b, over one year. But it also has US$3.67b in cash to offset that, meaning it has US$126.2m net cash.

How Strong Is Antofagasta's Balance Sheet?
We can see from the most recent balance sheet that Antofagasta had liabilities of US$1.63b falling due within a year, and liabilities of US$4.90b due beyond that. On the other hand, it had cash of US$3.67b and US$1.07b worth of receivables due within a year. So its liabilities total US$1.78b more than the combination of its cash and short-term receivables.
Given Antofagasta has a humongous market capitalization of US$25.9b, it's hard to believe these liabilities pose much threat. Having said that, it's clear that we should continue to monitor its balance sheet, lest it change for the worse. While it does have liabilities worth noting, Antofagasta also has more cash than debt, so we're pretty confident it can manage its debt safely.
And we also note warmly that Antofagasta grew its EBIT by 17% last year, making its debt load easier to handle. There's no doubt that we learn most about debt from the balance sheet. But it is future earnings, more than anything, that will determine Antofagasta's ability to maintain a healthy balance sheet going forward. So if you're focused on the future you can check out this free report showing analyst profit forecasts.
Finally, while the tax-man may adore accounting profits, lenders only accept cold hard cash. Antofagasta may have net cash on the balance sheet, but it is still interesting to look at how well the business converts its earnings before interest and tax (EBIT) to free cash flow, because that will influence both its need for, and its capacity to manage debt. During the last three years, Antofagasta produced sturdy free cash flow equating to 52% of its EBIT, about what we'd expect. This cold hard cash means it can reduce its debt when it wants to.
Summing up
We could understand if investors are concerned about Antofagasta's liabilities, but we can be reassured by the fact it has has net cash of US$126.2m. And we liked the look of last year's 17% year-on-year EBIT growth. So is Antofagasta's debt a risk? It doesn't seem so to us. When analysing debt levels, the balance sheet is the obvious place to start. But ultimately, every company can contain risks that exist outside of the balance sheet. Be aware that Antofagasta is showing 1 warning sign in our investment analysis , you should know about…
Of course, if you're the type of investor who prefers buying stocks without the burden of debt, then don't hesitate to discover our exclusive list of net cash growth stocks, today.
This article by Simply Wall St is general in nature. It does not constitute a recommendation to buy or sell any stock, and does not take account of your objectives, or your financial situation. We aim to bring you long-term focused analysis driven by fundamental data. Note that our analysis may not factor in the latest price-sensitive company announcements or qualitative material. Simply Wall St has no position in any stocks mentioned.
Have feedback on this article? Concerned about the content? Get in touch with us directly. Alternatively, email editorial-team (at) simplywallst.com.
Vancouver, British Columbia–(Newsfile Corp. – April 16, 2021) – Margaret Lake Diamonds Inc. (TSXV: DIA) (FSE: M85) (OTC: DDIAF) ("MLD" or the "Company") is pleased to announce Arctic Star Exploration Corp. ("Arctic Star" or the "Company") (TSXV: ADD) (FSE: 82A2) (WKN: A2DFY5) (OTC Pink: ASDZF) has made a new discovery on the Diagras project in the Lac de Gras kimberlite field, Northwest Territory 380km north of Yellowknife. The discovery has been named the Birch Kimberlite.
It was discovered by drilling a vertical hole into a EM and gravity anomaly. The anomaly also occupies a distinct gap in an otherwise continuous Mackenzie diabase dyke in the magnetic data.
Kimberlite was discovered after drilling 28m through 11m of water and 17m of overburden (glacial till). The drill exited the kimberlite at 71m. A second hole from the same drill setup is underway to obtain more kimberlite for caustic fusion.
The drill collar is 220m SE of the known Black Spruce kimberlite discovered in the 1990s. The Black Spruce kimberlite was discovered by drilling a discrete magnetic low. In contrast, the Birch kimberlite has no magnetic signature.
Buddy Doyle, VP Exploration of Arctic, said, "We are all elated to strike kimberlite so early in our 2021 exploration program. It proves our exploration concept, we expect more discoveries as we proceed." Mr. Doyle continued, "After completing the current drill hole we will move from the Birch discovery to test other similar targets. The priority is to make as many discoveries as we can before the ice melts. Material from each discovery will be sent for caustic fusion. We will return to those kimberlites with the highest micro-diamond counts and give them further attention."
The Diagras project is a Joint Venture with Margaret Lake Diamonds Inc. Arctic is the manager and operator of this joint venture.
Qualified Person
The Qualified Person for this news release is Buddy Doyle, AUSIMM, a Geologist of over 30 years' experience in diamond exploration, discovery, and evaluation. A Qualified Person under the provisions of National Instrument 43-101.
Contact Information
Neil Foran
Chief Executive Officer
(604) 681-7735
neil@margaretlakediamonds.com
Neither TSX Venture Exchange nor its Regulation Services Provider (as that term is defined in the policies of the TSX Venture Exchange) accepts responsibility for the adequacy or accuracy of this release.
Forward-Looking Statements
This press release contains forward-looking information or forward-looking statements (collectively "forward-looking information") within the meaning of applicable securities laws. Forward-looking information is typically identified by words such as: "believe", "expect", "anticipate", "intend", "estimate", "potentially" and similar expressions, or are those, which, by their nature, refer to future events. The Company cautions investors that any forward-looking information provided by the Company is not a guarantee of future results or performance, and that actual results may differ materially from those in forward-looking information as a result of various factors. The reader is referred to the Company's public filings for a more complete discussion of such risk factors and their potential effects, which may be accessed through the Company's profile on SEDAR at www.sedar.com.
To view the source version of this press release, please visit https://www.newsfilecorp.com/release/80724
Vancouver, British Columbia–(Newsfile Corp. – April 16, 2021) – InZinc Mining Ltd. (TSXV: IZN) ("InZinc" or the "Company") is pleased that, further to the news release of December 22, 2020, it has entered into an agreement (the "Option Agreement") with American West Metals Limited ("American West"), a private Australian company, pursuant to which InZinc granted to a wholly-owned subsidiary of American West an option ("Option") to earn a 100% interest in InZinc's West Desert project ("West Desert") located in Utah, USA. The Option Agreement is subject to, among other things, shareholder and regulatory approval.
"The proposed option agreement will benefit InZinc with improved financial flexibility and exposure to a broader, active portfolio of North American zinc and copper projects. The proposed shareholding in American West will provide InZinc continuing leverage at West Desert as a planned multi-year drill campaign to advance to prefeasibility is undertaken as well as exposure to activities at the Storm copper project, which American West recently optioned from Aston Bay Holdings Ltd. The financial terms offered by the proposed agreement will further provide InZinc the flexibility to advance, including drilling, the near surface discoveries and large untested targets at the prospective Indy Sedex project in BC, and assess new opportunities," said Wayne Hubert, CEO of InZinc.
The principal terms of the Option Agreement include:
1) An initial cash payment of US$500,000 to InZinc on the effective date (the "Effective Date") of the Option Agreement.
2) Required payments to InZinc during the 24 months following the effective date of the Option Agreement to comprise:
-
CDN$1,000,000 within 30 days of American West listing its shares on the Australian Securities Exchange ("ASX") through an initial public offering or other going public transaction ("IPO") or 12 months after the Effective Date, whichever is earlier;
-
US$1,500,000 upon the announcement by American West to the ASX of a completed Prefeasibility Study for West Desert or 24 months after the Effective Date, whichever is earlier; and
-
CDN$2,500,000 by way of shares of American West ranking equally with the shares of American West issued under the IPO (the "Consideration Shares"). If American West has not completed the IPO on the ASX within 12 months of the Effective Date, InZinc may elect to receive CDN$1,250,000 in cash from American West in lieu of Consideration Shares. If American West has not completed the IPO on the ASX within 24 months of the Effective Date, InZinc may elect to receive CDN$2,500,000 in cash in lieu of Consideration Shares.
3) Exercise of Option and Indium Revenue Share
Upon American West having paid the cash payments above and either having delivered the Consideration Shares or having paid the applicable cash payment in lieu of delivering Consideration Shares, American West may exercise the Option and acquire West Desert. InZinc will receive 50% of the revenue from the sale of indium mined from West Desert determined on a Net Smelter Return basis in accordance with generally accepted industry practice ("NSR"). American West will have the right to reduce the NSR to 25% by paying InZinc US$5,000,000 in cash at any time prior to the first sale of indium from the project.
4) Termination of Option
During the Option period, American West will be the operator of West Desert. If payments referred to above are not paid when due and American West does not rectify the failure within 45 days, InZinc would have the right to terminate the Option Agreement and American West shall surrender West Desert promptly to InZinc.
A meeting of InZinc shareholders to consider and, if thought fit, approve the Option Agreement and other matters is expected to be held in May 2021. An Information circular will be filed with regulatory authorities and mailed to InZinc shareholders.
American West Metals Ltd.
American West is targeting to be listed on the ASX in Q3 2021.
About InZinc
InZinc is focused on growth in zinc through exploration and expansion of the advanced stage West Desert project (100%) in Utah and exploration of the early-stage Indy Sedex project (100% option) in British Columbia. West Desert has a large underground resource open for expansion and has district scale exploration potential. A West Desert preliminary economic assessment completed in 2014 forecasted 1.6 billion pounds of zinc production over 15 years. By-products would include copper, magnetite and indium, the latter being identified by the United States in 2017 as a critical mineral. West Desert is well located with easy access and existing infrastructure. The Indy Sedex project comprises near surface discoveries, large untested exploration targets and regional discovery potential. Indy is readily accessible by road from Prince George, the major hub for transportation and heavy industry in central British Columbia and is located 85 kms south of the Canadian National Railway.
InZinc Mining Ltd.
"Wayne Hubert"
CEO and Director
Phone: 604.687.7211
Website: www.inzincmining.com
For further information contact:
Joyce Musial
Vice President, Corporate Affairs
Phone: 604.317.2728
Email: joyce@inzincmining.com
Cautionary Note Regarding Forward-Looking Statements
This news release contains forward-looking statements and forward-looking information (collectively, "forward-looking statements") within the meaning of applicable securities legislation. All statements, other than statements of historical fact, included herein are forward-looking statements. Although the Company believes that such statements are reasonable, it can give no assurance that such expectations will prove to be correct. Forward-looking statements are typically identified by words such as: "believe", "expect", "anticipate", "intend", "estimate", "plan", "design", "postulate" and similar expressions, or are those, which, by their nature, refer to future events. The Company cautions investors that any forward-looking statements by the Company are not guarantees of future results, performance, or actions and that actual results and actions may differ materially from those in forward-looking statements as a result of various factors, including, but not limited to, those risks and uncertainties disclosed in the Company's Management Discussion and Analysis for the year ended December 31, 2019 and for the nine months ended September 30, 2020 filed with certain securities commissions in Canada and other information released by the Company and filed with the appropriate regulatory agencies. All of the Company's Canadian public disclosure filings may be accessed via www.sedar.com and readers are urged to review these materials, including the technical reports filed with respect to the Company's mineral properties.
Neither the TSX Venture Exchange nor its Regulation Services Provider (as that term is defined in the policies of the TSX Venture Exchange) accepts responsibility for the adequacy or accuracy of this release.

To view the source version of this press release, please visit https://www.newsfilecorp.com/release/80659
TORONTO, April 16, 2021 (GLOBE NEWSWIRE) — Waseco Resources Inc. (“Waseco” or “the Company”) (“WRI”- TSX-V) (“WSE” – Frankfurt) reports that the Board of Directors has approved the granting of a total of 2.4 million options to its Board Members and Technical Advisory Committee Members and two consultants. The options are exercisable prior to April 9, 2024 at a price of $0.075.
Waseco is an exploration company focused on exploring for gold in Nevada. The Company is listed on the TSX Venture Exchange (“WRI”) and the Frankfurt Stock Exchange (“WSE”). There are currently 41,681,390 shares issued and outstanding.
For further information on the Company, please visit the Waseco web site at www.wasecoresources.com or contact Richard Williams at (416) 364-3123- e-mail: rickw@wasecoresources.com.
On Behalf of the Board of Directors
Richard Williams
President & C.E.O.
Neither the TSX Venture Exchange nor its regulatory service providers as that term is defined in the policies of the TSX Venture Exchange accepts responsibility of the accuracy or adequacy of this release.
TORONTO, April 15, 2021 (GLOBE NEWSWIRE) — Signature Resources Ltd. (TSXV: SGU, OTCQB: SGGTF, FSE 3S3) ("Signature" or the "Company") is pleased to completed several new initiatives that were designed to help investors understand the scope of our 100% Lingman Lake Gold Project. These tools will be especially useful as new data is added to these platforms over the coming months. In this way, we expect to demonstrate material project progress and value creation for all our stakeholders.
Highlights:
-
Launch of its newly designed website at www.signatureresources.ca
-
Launch of a new Moon Patrol Corporate Video
-
Launch of its VRIFY online Corporate Presentation
“We have developed and launched several new tools that should help investors understand the opportunity and scale that we hope to show at our 100% owned Lingman Lake Gold Project. We are pleased to invite all to view our updated website, our new corporate video and our newly launched VRIFY corporate presentation. As we add material data, we aim to update these platforms to demonstrate our progress over time. We invite interested parties to join our mailing list to keep up to date with our progress.”
Robert Vallis – President, CEO, and Director
Launch of New Website and Corporate Video:
Signature has launched a new website to reflect the new look and direction of the Company. The design is focused on providing a concise delivery of relevant information. In addition, the corporate video has been designed to present an executive summary of our 100% owned Lingman Lake Gold deposit.
Launch of VRIFY Corporate Presentation:
Inclusive within the enhanced content of the new website, Signature has launched its VRIFY Corporate Presentation. The fully online format allows for a much more data rich and informative experience for the viewer with the inclusion of interactive satellite imagery and 3D modeling. The added features present details of its 100% owned Lingman Lake Gold Project such as location, infrastructure, land tenure, geologic setting, 3D model of mineralization, drilling, regional exploration activities and upside target potential. The VRIFY platform delivers a strong, clear message of the vast regional discovery potential of the project and immense land tenure in the prolific northern Red Lake geologic district.
About Signature
The Lingman Lake gold property consists of 1,389 staked claims, four free hold full patented claims and 14 mineral rights patented claims totaling approximately 26,393 hectares. The property hosts an historical estimate of 234,684 oz of gold* (1,063,904 tonnes grading 6.86 g/t with 2.73 gpt cut-off) and includes what has historically been referred to as the Lingman Lake Gold Mine, an underground substructure consisting of a 126.5-meter shaft, and 3-levels at 46-meters, 84-meters and 122-meters depths.
*This historical resource estimate is based on prior data and reports obtained and prepared by previous operators, and information provided by governmental authorities. A Qualified Person has not done sufficient work to verify the classification of the mineral resource estimates in accordance with current CIM categories. The Company is not treating the historical estimate as a current NI 43-101 mineral resource estimate. Establishing a current mineral resource estimate on the Lingman Lake deposit will require further evaluation, which the Company and its consultants intend to complete in due course. Additional information regarding historical resource estimates is available in the technical report entitled, "Technical Report on the Lingman Lake Gold Property" dated January 31, 2020, prepared by John M. Siriunas, P.Eng. and Walter Hanych, P.Geo., available on the Company's SEDAR profile at www.sedar.com.
To find out more about Signature Resources Limited, visit our website at www.signatureresources.ca, or contact:
Jonathan Held
Chief Financial Officer
416-270-9566
Cautionary Notes
Neither TSX Venture Exchange nor its Regulation Services Provider (as that term is defined in the policies of the TSX Venture Exchange) accepts responsibility for the adequacy or accuracy of this news release.
This news release contains forward-looking statements which are not statements of historical fact. Forward-looking statements include estimates and statements that describe the Company’s future plans, objectives or goals, including words to the effect that the Company or management expects a stated condition or result to occur. Forward-looking statements may be identified by such terms as “believes”, “anticipates”, “expects”, “estimates”, “may”, “could”, “would”, “will”, or “plan”. Since forward-looking statements are based on assumptions and address future events and conditions, by their very nature they involve inherent risks and uncertainties. Although these statements are based on information currently available to the Company, the Company provides no assurance that actual results will meet management’s expectations. Risks, uncertainties and other factors involved with forward-looking information could cause actual events, results, performance, prospects and opportunities to differ materially from those expressed or implied by such forward-looking information. Forward looking information in this news release includes, but is not limited to, the Company’s objectives, goals or future plans, statements, exploration results, potential mineralization, the estimation of mineral resources, exploration and mine development plans, timing of the commencement of operations and estimates of market conditions and risks associated with infectious diseases, including COVID-19. Factors that could cause actual results to differ materially from such forward-looking information include, but are not limited to changes in general economic and financial market conditions, failure to identify mineral resources, failure to convert estimated mineral resources to reserves, the inability to complete a feasibility study which recommends a production decision, the preliminary nature of metallurgical test results, delays in obtaining or failures to obtain required governmental, environmental or other project approvals, political risks, inability to fulfill the duty to accommodate First Nations and other indigenous peoples, uncertainties relating to the availability and costs of financing needed in the future, changes in equity markets, inflation, changes in exchange rates, fluctuations in commodity prices, delays in the development of projects, capital and operating costs varying significantly from estimates and the other risks involved in the mineral exploration and development industry, and those risks set out in the Company’s public documents filed on SEDAR. Although the Company believes that the assumptions and factors used in preparing the forward-looking information in this news release are reasonable, undue reliance should not be placed on such information, which only applies as of the date of this news release, and no assurance can be given that such events will occur in the disclosed time frames or at all. The Company disclaims any intention or obligation to update or revise any forward-looking information, whether as a result of new information, future events or otherwise, other than as required by law.
For Immediate Release
Chicago, IL – April 15, 2021 – Zacks.com announces the list of stocks featured in the Analyst Blog. Every day the Zacks Equity Research analysts discuss the latest news and events impacting stocks and the financial markets. Stocks recently featured in the blog include: Barrick Gold Corporation GOLD, Harmony Gold Mining Company Limited HMY, IAMGOLD Corporation IAG and New Gold Inc. NGD.
Here are highlights from Wednesday’s Analyst Blog:
Gold Rebounds on U.S. Inflation Data: 4 Stocks to Watch
Gold prices have rebounded on government data showing a slightly higher-than-expected reading on U.S. inflation. This bolstered bullion’s appeal as an inflation hedge and put pressure on the dollar.
Further, the Food and Drug Administration’s recommendation to states to pause the use of Johnson & Johnson's coronavirus vaccine after six cases of blood clots, fueled the safe-haven demand for the metal and propped up prices. Spot gold gained 0.5% to $1,744.80 an ounce on Apr 12 and gold futures for June delivery advanced 0.87% to $1,746.20.
Per the U.S. Bureau of Labor Statistics, the consumer-price index rose 0.6% — the biggest rise since August 2012. It followed an increase of 0.4% in February and came ahead of the consensus of a rise of 0.5%. For 12 months ending March 2021, the inflation rate in the United States accelerated to 2.6%, higher than the 1.7% in February and above the market consensus of 2.5%. It was also the highest since August 2018.
The US Dollar Index lost 0.33% to 91.844 on Apr 13 on these higher-than-expected figures. The US 10-year bond yield remains at 1.63%, near three-week lows of 1.618%. After reaching 14-month highs of 1.78% in March, treasury yields have been declining this month on encouraging economic data from the United States and concerns over a spike in inflation.
Overall, the yellow metal has lost 8% of its value so far this year due to vaccine rollouts and optimism over economic recovery. Global gold ETFs lost 107.5 tons ($5.9 billion) in March, marking outflows for the second month in a row in which net outflows ranked the top 10 worst outflows historically. In the first quarter of 2021, global gold ETFs lost 177.9 tons ($9.5 billion).
As of the quarter-end, global assets under management (AUM) stand at 3,574 tons ($194.5 billion) — at levels last seen in June 2020. Since the peak attained in November 2020, gold ETF holdings have declined 9% in tonnage terms, at par with the drop in gold price.
During the quarter, North American funds represented 86% of global net outflows, falling 145.4 tons ($8.1 billion). European funds lost 51.7 tons ($2.5 billion) during the quarter. The bright spot was Asian-listed funds, which collectively added 17.8 tons ($1 billion), driven by China, India, and Japan. This was primarily due to opportunistic “dip buying” during gold price weakness.
Going forward, India and China (that roughly account for around 50% of consumer gold demand), will sustain demand for the yellow metal. The ongoing economic recovery in China will lead to higher demand for the yellow metal. Gold demand in India is seasonally high in the later part of 2020, courtesy of the wedding and festive seasons when buying the yellow metal is considered auspicious. Central banks also continue to buy gold. Thus, demand for gold is likely to improve this year.
Mine production is expected to recover this year following the pandemic induced shutdowns in the earlier part of last year. Although pandemic-related uncertainty still lingers in 2021, production is unlikely to be impacted again as major companies have introduced protocols and procedures that should reduce the impact of stoppages compared to those seen in the early stages of the pandemic.
Inflation expectations are likely to move higher, which will support the yellow metal. Historically, gold has performed well in high inflationary environments.
The Zacks Gold Mining industry has gained 5.8% year to date compared with the S&P 500’s rally of 4.5%. The industry falls under the broader Basic Materials sector that gained 1.9%.
The gold mining industry currently carries a Zacks Industry Rank #229, which places it at the bottom 10% of 256 Zacks industries. Our research shows that the top 50% of the Zacks-ranked industries outperforms the bottom 50% by a factor of more than 2 to 1.
Per the latest Earnings Trends, after remaining in the red for the past four quarters, the Basic Materials sector returned to growth with an earnings improvement of 28.1% in fourth-quarter 2020. The sector is expected to witness growth of 65.8% in earnings in first-quarter 2020, followed by 162.7%, 49.4% and 12.3% in the second, third and fourth quarters, respectively. The prospects for 2021 look promising for the sector with an impressive earnings growth projection of 58.8%.
We have handpicked four gold stocks that are likely to deliver improved earnings performance in their upcoming Q1 results. All the five stocks have a Zacks Rank # 3 (Hold) and a VGM Score of A or B. Our research shows that stocks with such a combination offer the best investment opportunities. You can see the complete list of today’s Zacks #1 Rank (Strong Buy) stocks here.
Barrick Gold Corp: Headquartered in Toronto, Canada, Barrick Gold engages in the exploration, mine development, production, and sale of gold and copper properties.
The company is expected to gain from progress of its key growth projects that are likely to contribute to its production. Barrick Gold has a strong liquidity position and generates healthy cash flows, which positions it well to take advantage of attractive development, exploration and acquisition opportunities.
The company should gain from its merger with Randgold, which formed an industry-leading gold company and fortified its position among senior gold peers. Further, it is close to finalizing an agreement with the Papua New Guinea government to reopen the Porgera gold mine. Porgera churned out about 600,000 ounces of gold in 2019 before being put on care and maintenance.
The company has a long-term estimated earnings growth rate of 2%. The Zacks Consensus Estimate for the company’s fiscal 2021 earnings suggests year-over-year growth of 7.8%. The stock has a Zacks Rank #3 and a VGM Score of A. The company has a trailing four-quarter earnings surprise of 15.5%, on average.
Harmony Gold Mining Company: Headquartered in Randfontein, South Africa, Harmony Gold Mining engages in the exploration, extraction, and processing of gold in South Africa and Papua New Guinea.
The company’s development projects currently in progress include the development of the Wafi-Golpu, a copper/gold deposit in Papua New Guinea, which received the environment permit in late 2020 and is expected to increase production. The Golpu project is believed to be a game changer for the company. According to the company, Golpu is a promising orebody that contains mineral resources of 20 million ounces of gold and 9.4 million tons of copper. Further, its efforts to reduce debt levels remain commendable.
The Zacks Consensus Estimate for the company’s fiscal 2021 earnings is currently pegged at 69 cents, suggesting a turnaround from a loss of 10 cents reported in the prior fiscal. The company has an estimated long-term earnings growth of 7.9%. The company currently has a Zacks Rank #3 and a VGM Score of B.
IAMGOLD Corp: Headquartered in Toronto, Canada, IAMGOLD Corporation explores for, develops, and operates gold mining properties in North and South America, and West Africa.
The company’s strong liquidity position continues to provide security and financial flexibility. IAMGOLD's transformational strategy centres on delivering the lower cost Côté Gold Project, de-risking the Boto Gold Project, optimizing its current operations and continuing to invest in its pipeline of brownfield and greenfield exploration. Robust development and exploration pipeline supports attractive and profitable long-term growth to over one million ounces of annual production in the coming years.
The company has a long-term estimated earnings growth rate of 3%. The Zacks Consensus Estimate for the company’s fiscal 2021 earnings suggests year-over-year growth of 79%. The stock has a Zacks Rank #3 and a VGM Score of A.
New Gold: Headquartered in Toronto, Canada, New Gold is an intermediate gold mining company, which engages in the development and operation of mineral properties.
New Gold will benefit from higher production levels at Rainy River Mine, at lower costs, as deferred capital projects have been completed and the mine transitions to generating free cash flow. The New Afton mine continues to ramp- up production. Moreover, the company remains committed to operational and cost optimizations at both Rainy River and New Afton, launching B3 production, advancing C-Zone development at New Afton, and following up on key targets from the exploration drilling programs.
The company has a long-term estimated earnings growth rate of 5%. The Zacks Consensus Estimate for the company’s fiscal 2021 earnings indicates year-over-year growth of 667%. The stock has a Zacks Rank #3 and a VGM Score of B.
Breakout Biotech Stocks with Triple-Digit Profit Potential
The biotech sector is projected to surge beyond $775 billion by 2024 as scientists develop treatments for thousands of diseases. They’re also finding ways to edit the human genome to literally erase our vulnerability to these diseases.
Zacks has just released Century of Biology: 7 Biotech Stocks to Buy Right Now to help investors profit from 7 stocks poised for outperformance. Our recent biotech recommendations have produced gains of +50%, +83% and +164% in as little as 2 months. The stocks in this report could perform even better.
See these 7 breakthrough stocks now>>
Media Contact
Zacks Investment Research
800-767-3771 ext. 9339
support@zacks.com
https://www.zacks.com
Past performance is no guarantee of future results. Inherent in any investment is the potential for loss. This material is being provided for informational purposes only and nothing herein constitutes investment, legal, accounting or tax advice, or a recommendation to buy, sell or hold a security. No recommendation or advice is being given as to whether any investment is suitable for a particular investor. It should not be assumed that any investments in securities, companies, sectors or markets identified and described were or will be profitable. All information is current as of the date of herein and is subject to change without notice. Any views or opinions expressed may not reflect those of the firm as a whole. Zacks Investment Research does not engage in investment banking, market making or asset management activities of any securities. These returns are from hypothetical portfolios consisting of stocks with Zacks Rank = 1 that were rebalanced monthly with zero transaction costs. These are not the returns of actual portfolios of stocks. The S&P 500 is an unmanaged index. Visit https://www.zacks.com/performance for information about the performance numbers displayed in this press release.
Want the latest recommendations from Zacks Investment Research? Today, you can download 7 Best Stocks for the Next 30 Days. Click to get this free report
Iamgold Corporation (IAG) : Free Stock Analysis Report
Harmony Gold Mining Company Limited (HMY) : Free Stock Analysis Report
To read this article on Zacks.com click here.
Zacks Investment Research
GEORGE TOWN, Cayman Islands, April 15, 2021 /CNW/ – Vox Royalty Corp. (TSXV: VOX) ("Vox" or the "Company"), a high growth precious metals focused royalty company, is pleased to provide recent development updates from royalty operating partners Silver Mines Limited (ASX: SVL) ("Silver Mines"), Axis Minerals Pty Ltd ("Axis"), ValOre Metals Corp. (TSXV: VO) ("ValOre"), Genesis Minerals Limited (ASX: GMD) ("Genesis") and Metalicity Limited (ASX: MCT) ("Metalicity").

Riaan Esterhuizen, Executive Vice President – Australia stated, "We are excited to share another month of positive operator newsflow for our development and exploration stage royalties. The Bowdens mining lease application, which covers the largest undeveloped primary silver project in Australia, continues to demonstrate a clear pathway to production, which would generate >$1M annual royalty revenues for Vox investors over its 16 year feasibility mine plan. The potential restart of the Mt Moss Mine over the coming months has the potential to unlock royalty revenue ahead of Vox management expectations. From an exploration perspective, significant 2021 drilling at Pedra Branca, the largest PGM project in South America, and the Puzzle North discovery at Kookynie further support our confidence in medium-term cashflow generation."
Summary of Development Updates
-
Bowdens silver project submission of mining lease application for development by Silver Mines;
-
Mt Moss iron ore-copper-zinc mine ownership change and restart plans by Axis;
-
Pedra Branca platinum-group-elements (PGE) project – 8,000m drill program commenced for 2021; and
-
Kookynie gold projects – Puzzle North discovery from Genesis and a drilling update from Metalicity.
Bowdens (Feasibility) – Mining Lease Application
-
Vox holds a 0.85% gross revenue royalty on the Bowdens silver-lead-zinc project and a 1.0% gross revenue over surrounding regional exploration tenure;
-
On March 24, 2021, Silver Mines announced that:
Mt Moss (Care & Maintenance) – Ownership Change and 2021 Restart Plans
-
Vox holds a 1.5% NSR royalty over base metal, magnetite and silver production from mining lease ML10171 which covers the Mt Moss Fe-Cu-Zn Skarn Project ("Mt Moss Mine") located 150km NW of Townsville in northern Queensland, which was on care and maintenance when Vox acquired the royalty in 2020;
-
Axis has recently acquired 100% of Mt Moss Mining Pty Ltd which in turn owns 100% of the Mt Moss Mine located on ML10171;
-
The Mt Moss Mine is one of the largest skarn magnetite-marble-base metal deposit on the Australian east coast1. The Mt Moss Mine historically had production capacity of approximately 500,000tpa magnetite prior to operations being placed on care & maintenance;
-
According to Axis, Mt Moss Mining Pty Ltd is the holder of a range of approved Mining Leases and freehold land parcels containing a JORC resource of 15.1Mt @ 43.1% Fe and a non-JORC resource estimate of greater than 20Mt of potential base metal ore;
-
Mt Moss has a complete beneficiation plant, including crushing, screening, dry magnetic separation, milling, wet gravity and wet magnetic separation circuits. The Mt Moss Mine has all infrastructure and supporting ancillary assets in situ, including workshops, laboratory, offices, 100 person mining camp, diesel storage, weighbridge, power generation, and all bitumen access road;
-
Axis is expecting to reopen the Mt Moss Mine in the first half of 2021; and
-
For further information on the Mt Moss Mine please refer to the Axis website: https://www.axismines.co/mt-moss
Pedra Branca (Preliminary Economic Assessment) – 2021 Exploration Program and 8,000m Drilling
-
Vox holds a 1% net smelter return royalty on the Pedra Branca PGE project held by ValOre;
-
On April 12, 2021, ValOre announced the commencement of their 2021 Exploration Program:
-
The Pedra Branca PGE Project comprises 39 exploration licenses covering a total area of 39,987 hectares (98,810 acres) in northeastern Brazil. At Pedra Branca, 5 distinct PGE+Au deposit areas host, in aggregate, a current Inferred Resource1 of 1,067,000 ounces 2PGE+Au contained in 27.2 million tonnes grading 1.22 g/t 2PGE+Au (click here for ValOre's July 23, 2019 news release). According to ValOre all the currently known Pedra Branca inferred PGE resources are potentially open pittable.
Kookynie (Advanced Exploration) – Puzzle North Discovery and Drilling Update
-
Vox holds a A$1/t ore production royalty (with gold grade escalator2) on part of the Kookynie gold project held by Genesis and Metalicity;
-
On April 9, 2021, Genesis announced that:
-
On March 18, 2021, Metalicity announced the following drilling highlights:
Qualified Person
Timothy J. Strong, MIMMM, of Kangari Consulting Limited and a "Qualified Person" under National Instrument 43-101 – Standards of Disclosure for Mineral Projects, has reviewed and approved the scientific and technical disclosure contained in this press release.
About Vox
Vox is a high growth precious metals royalty and streaming company with a portfolio of 50 royalties and streams spanning nine jurisdictions. The Company was established in 2014 and has since built unique intellectual property, a technically focused transactional team and a global sourcing network which has allowed Vox to become the fastest growing company in the royalty sector. Since the beginning of 2019, Vox has announced over 20 separate transactions to acquire over 45 royalties.
Further information on Vox can be found at www.voxroyalty.com.
Cautionary Note Regarding Forward Looking Information
This news release contains certain forward-looking statements. Any statements that express or involve discussions with respect to predictions, expectations, beliefs, plans, projections, objectives, assumptions or future events or performance (often, but not always, using words or phrases such as "expects" or "does not expect", "is expected", "anticipates" or "does not anticipate" "plans", "estimates" or "intends" or stating that certain actions, events or results " may", "could", "would", "might" or "will" be taken, occur or be achieved) are not statements of historical fact and may be "forward-looking statements".
The forward-looking statements and information in this press release include, but are not limited to, statements regarding expectations for the timing of commencement of resource production from various mining projects, expectations regarding the size, quality and exploitability of the resources at various mining projects, future operations and work programs of Vox's mining operator partners and future royalty payments derived from various royalty assets of Vox.
Forward-looking statements and information are based on forecasts of future results, estimates of amounts not yet determinable and assumptions that, while believed by management to be reasonable, are inherently subject to significant business, economic and competitive uncertainties and contingencies. Forward-looking statements and information are subject to various known and unknown risks and uncertainties, many of which are beyond the ability of Vox to control or predict, that may cause Vox's actual results, performance or achievements to be materially different from those expressed or implied thereby, and are developed based on assumptions about such risks, uncertainties and other factors set out herein, including but not limited to: the requirement for regulatory approvals and third party consents, the impact of general business and economic conditions, the absence of control over the mining operations from which Vox will receive royalties, including risks related to international operations, government relations and environmental regulation, the inherent risks involved in the exploration and development of mineral properties; the uncertainties involved in interpreting exploration data; the potential for delays in exploration or development activities; the geology, grade and continuity of mineral deposits; the impact of the COVID-19 pandemic; the possibility that future exploration, development or mining results will not be consistent with Vox's expectations; accidents, equipment breakdowns, title matters, labor disputes or other unanticipated difficulties or interruptions in operations; fluctuating metal prices; unanticipated costs and expenses; uncertainties relating to the availability and costs of financing needed in the future; the inherent uncertainty of production and cost estimates and the potential for unexpected costs and expenses, commodity price fluctuations; currency fluctuations; regulatory restrictions, including environmental regulatory restrictions; liability, competition, loss of key employees and other related risks and uncertainties.
Vox has assumed that the material factors referred to in the previous paragraph will not cause such forward looking statements and information to differ materially from actual results or events. However, the list of these factors is not exhaustive and is subject to change and there can be no assurance that such assumptions will reflect the actual outcome of such items or factors. The forward-looking information contained in this press release represents the expectations of Vox as of the date of this press release and, accordingly, is subject to change after such date. Readers should not place undue importance on forward looking information and should not rely upon this information as of any other date. While Vox may elect to, it does not undertake to update this information at any particular time except as required in accordance with applicable laws.
Neither the TSX Venture Exchange nor its Regulation Services Provider (as that term is defined in policies of the TSX Venture Exchange) accepts responsibility for the adequacy or accuracy of this release.
Technical and Third-Party Information
Except where otherwise stated, the disclosure in this press release is based on information publicly disclosed by project operators based on the information/data available in the public domain as at the date hereof and none of this information has been independently verified by Vox. Specifically, as a royalty investor, Vox has limited, if any, access to the royalty operations. Although Vox does not have any knowledge that such information may not be accurate, there can be no assurance that such information from the project operators is complete or accurate. Some information publicly reported by the project operators may relate to a larger property than the area covered by Vox's royalty interests. Vox's royalty interests often cover less than 100% and sometimes only a portion of the publicly reported mineral reserves, mineral resources and production of a property.
Technical References & Notes:
-
Sources for Mt Moss Mine references are as follows:
-
The Pedra Branca mineral resource is based on the following:
-
Royalty = A$1 / Tonne (for each Ore Reserve with a gold grade <= 5g/t Au), for grades > 5g/t Au royalty = ((Ore grade per Tonne – 5) x 0.5)+1)
SOURCE Vox Royalty Corp.

View original content to download multimedia: http://www.newswire.ca/en/releases/archive/April2021/15/c0053.html
One simple way to benefit from the stock market is to buy an index fund. But many of us dare to dream of bigger returns, and build a portfolio ourselves. For example, APN Convenience Retail REIT (ASX:AQR) shareholders have seen the share price rise 32% over three years, well in excess of the market return (19%, not including dividends).
Check out our latest analysis for APN Convenience Retail REIT
While markets are a powerful pricing mechanism, share prices reflect investor sentiment, not just underlying business performance. By comparing earnings per share (EPS) and share price changes over time, we can get a feel for how investor attitudes to a company have morphed over time.
APN Convenience Retail REIT was able to grow its EPS at 26% per year over three years, sending the share price higher. The average annual share price increase of 10% is actually lower than the EPS growth. So it seems investors have become more cautious about the company, over time.
The graphic below depicts how EPS has changed over time (unveil the exact values by clicking on the image).

We like that insiders have been buying shares in the last twelve months. Having said that, most people consider earnings and revenue growth trends to be a more meaningful guide to the business. Before buying or selling a stock, we always recommend a close examination of historic growth trends, available here..
What About Dividends?
It is important to consider the total shareholder return, as well as the share price return, for any given stock. The TSR incorporates the value of any spin-offs or discounted capital raisings, along with any dividends, based on the assumption that the dividends are reinvested. So for companies that pay a generous dividend, the TSR is often a lot higher than the share price return. We note that for APN Convenience Retail REIT the TSR over the last 3 years was 62%, which is better than the share price return mentioned above. The dividends paid by the company have thusly boosted the total shareholder return.
A Different Perspective
Over the last year APN Convenience Retail REIT shareholders have received a TSR of 35%. It's always nice to make money but this return falls short of the market return which was about 40% for the year. On the other hand, the TSR over three years was worse, at just 17% per year. This suggests the company's position is improving. If the business can justify the share price gain with improving fundamental data, then there could be more gains to come. I find it very interesting to look at share price over the long term as a proxy for business performance. But to truly gain insight, we need to consider other information, too. Case in point: We've spotted 3 warning signs for APN Convenience Retail REIT you should be aware of.
If you like to buy stocks alongside management, then you might just love this free list of companies. (Hint: insiders have been buying them).
Please note, the market returns quoted in this article reflect the market weighted average returns of stocks that currently trade on AU exchanges.
This article by Simply Wall St is general in nature. It does not constitute a recommendation to buy or sell any stock, and does not take account of your objectives, or your financial situation. We aim to bring you long-term focused analysis driven by fundamental data. Note that our analysis may not factor in the latest price-sensitive company announcements or qualitative material. Simply Wall St has no position in any stocks mentioned.
Have feedback on this article? Concerned about the content? Get in touch with us directly. Alternatively, email editorial-team (at) simplywallst.com.
VACAVILLE, CA / ACCESSWIRE / April 15, 2021 / Athena Gold Corp. (OTCQB:AHNR) has been informed by FINRA that it has completed their processing of the Company's name change from Athena Silver Corp. to Athena Gold Corp.

The name change will be on the Daily List Announcement on April 15, 2021 and will have a Market Effective Date of April 16, 2021.
The ticker symbol for the Company's common stock, AHNR, will remain unchanged.
About Athena Gold Corporation
Athena is focused on the exploration and development of precious metals in the Western United States.
The Company's flagship Excelsior Springs Project is located in Esmeralda County, Nevada in the prolific Walker-Lane tectonic zone, an area that has seen a recent resurgence with several important gold discoveries, new mines going into production and hosts a number of large historic gold mines. Total gold production from the Walker-Lane tectonic zone has exceeded 20 million ounces (Moz) including notable deposits by Goldfields (5 Moz), Bullfrog (2 Moz), Tonopah (2 Moz), Mineral Ridge (1.5 Moz) and Comstock (8 Moz Au, 200 Moz Ag). Readers are cautioned that the Company has no interest in or right to acquire any interest in any of the above mentioned properties, other than the Excelsior Springs Project, and that the mineral deposits, and the results of any mining thereof, on adjacent or similar properties are not indicative of mineral deposits on Excelsior Springs Project or any potential exploitation thereof.
From the mid-1980s through 2011, a number of exploration companies conducted drilling programs, primarily on the patented claims, that began to define the near-surface Buster Mine gold zone. Gold mineralization at the Property occurs within an east-west trending zone that is 200 to 400m wide and at least 3 km long.
Gold mineralization discovered at Excelsior Springs to date occurs in quartz vein stock-works and silicified zones in hornfels and calc-silicate altered country rock and is generally close to porphyry dykes. The best mineralization (grade and thickness) is found in altered sediments immediately above porphyry dykes that have intruded along existing east- and east-northeast trending faults. The mineralized stock-work vein zones are shallow and have a relatively flat plunge, making them amenable to open pit mining methods.
Most historical exploration at Excelsior Springs has focused on a 2.5 km long section in the central part of the Buster zone where mineralization is at or near the surface. Surface mapping and an Induced Polarization (IP) geophysical survey conducted by Zonge International Inc identified multiple zones of silicification that correlate well with the known mineralization. Many of the silicified zones defined by the IP (resistivity highs) surveys have not been tested by drilling and remain targets for future exploration.
An NI 43‐101 Technical Report dated September 28, 2010 entitled "Technical Report for the Excelsior Springs Property Esmeralda County, Nevada, U.S.A." prepared by Ken Brook, RPG, QP, was filed on SEDAR by Nubian for Excelsior Springs in 2010.
Athena's agreement with Nubian includes 100% of the 140 unpatented claims at Excelsior Springs with two additional patented claims held under a lease option that are subject to a 2% net smelter returns royalty on gold production. Under the terms of the Option Agreement, Nubian will retain a 1% net smelter returns royalty ("NSR Royalty") on the Excelsior Springs Project if Athena fully exercises the option. Athena will have the right to purchase 0.5% (being one half) of the NSR Royalty for CAD $500,000 and the remaining 0.5% of the NSR Royalty at fair market value.
For more information contact: John Power, President, 707-291-6198
Cautionary Statement to U.S. Investors
This press release references NI 43-101, which differs from the requirements of U.S. securities laws. NI 43‑101 is a rule developed by the Canadian Securities Administrators that establishes standards for all public disclosure an issuer makes of scientific and technical information concerning mineral projects.
The United States Securities and Exchange Commission ("SEC") permits mining companies, in their filings with the SEC, to disclose only those mineral deposits that a company can legally extract or produce. Pursuant to SEC Industry Guide 7 under the United States Securities Act of 1933, as amended, a "final" or "bankable" feasibility study is required to report reserves. Currently Athena has not delineated "reserves" on any of its properties. Athena cannot be certain that any deposits at its properties will ever be confirmed or converted into SEC Industry Guide 7 or any successor rule or regulation compliant "reserves". Investors are cautioned not to assume that any part or all of the historic Buster Mine gold zone will ever be confirmed or converted into reserves or that it can be economically or legally extracted.
The SEC has adopted amendments to its disclosure rules to modernize the mineral property disclosure requirements for issuers whose securities are registered with the SEC under the United States Securities Exchange Act of 1934, as amended. These amendments became effective February 25, 2019 and, on January 1, 2021, will replace the historical property disclosure requirements for mining registrants that were included in SEC Industry Guide 7, which will be rescinded from and after such date.
Forward-Looking Statements
This press release contains forward-looking statements and forward-looking information (collectively, "forward-looking statements") within the meaning of applicable Canadian and U.S. securities laws. All statements, other than statements of historical fact, included herein including, without limitation, statements regarding the exercise of the option to acquire the Excelsior Springs Project, the receipt of a new CUSIP number in connection with the Name Change, the approval of FINRA and OTC for the Shares to trade under the new name, the preparation of a technical report for the Excelsior Springs Project, the application to list the Shares on the CSE, anticipated business plans and timing of future activities of the Company, are forward-looking statements. Although the Company believes that such statements are reasonable, it can give no assurance that such expectations will prove to be correct. Forward-looking statements are typically identified by words such as: "believes", "will", "expects", "anticipates", "intends", "estimates", "plans", "may", "should", "potential", "scheduled", or variations of such words and phrases and similar expressions, which, by their nature, refer to future events or results that may, could, would, might or will occur or be taken or achieved. In making the forward-looking statements in this press release, the Company has applied several material assumptions, including without limitation, that there will be investor interest in future financings, market fundamentals will result in sustained precious metals demand and prices, the receipt of any necessary permits, licenses and regulatory approvals in connection with the future exploration and development of the Company's projects in a timely manner, the availability of financing on suitable terms for the exploration and development of the Company's projects and the Company's ability to comply with environmental, health and safety laws.
The Company cautions investors that any forward-looking statements by the Company are not guarantees of future results or performance, and that actual results may differ materially from those in forward-looking statements as a result of various factors, including, operating and technical difficulties in connection with mineral exploration and development activities, actual results of exploration activities, the estimation or realization of mineral reserves and mineral resources, the inability of the Company to obtain the necessary financing required to conduct its business and affairs, as currently contemplated, the timing and amount of estimated future production, the costs of production, capital expenditures, the costs and timing of the development of new deposits, requirements for additional capital, future prices of precious metals, changes in general economic conditions, changes in the financial markets and in the demand and market price for commodities, lack of investor interest in future financings, accidents, labour disputes and other risks of the mining industry, delays in obtaining governmental approvals, permits or financing or in the completion of development or construction activities, risks relating to epidemics or pandemics such as COVID-19, including the impact of COVID-19 on the Company's business, financial condition and results of operations, changes in laws, regulations and policies affecting mining operations, title disputes, the inability of the Company to obtain any necessary permits, consents, approvals or authorizations, including stock exchange approvals and approval for a new CUSIP number in connection with the Name Change, the timing and possible outcome of any pending litigation, environmental issues and liabilities, and other factors that are discussed in the Company's periodic filings with the SEC.
Readers are cautioned not to place undue reliance on forward-looking statements. The Company undertakes no obligation to update any of the forward-looking statements in this press release or incorporated by reference herein, except as otherwise required by law.
SOURCE: Athena Gold Corporation
View source version on accesswire.com:
https://www.accesswire.com/640501/Athena-Gold-Corporation-Announces-Finalization-of-Name-Change
Bridal Veil – Preliminary Site Visit – Nov 2020

Bridal Veil Sample Locations and Magnetic Anomalies
VANCOUVER, British Columbia, April 15, 2021 (GLOBE NEWSWIRE) — CMC Metals Ltd. (“CMC” or the “Company”) (TSXV:CMB) (OTC:CMCXF) (Frankfurt:ZM5N) is pleased to announce positive preliminary exploration results from a reconnaissance site visit conducted on its Bridal Veil Property in Newfoundland.
A brief visit involving the sampling of known showings on the property resulted in the identification of an extensive area of anomalous copper and bismuth mineralization with minor silver. The area has coincident EM anomalies that are yet to be explained. Values from grab samples of veined psammitic metasediments ranged from 0.041% to 3.473% copper, 0.74-136.96 g/t bismuth, and 1069-19340 ppb silver. Historical sampling have returned grades of up to 9.4% copper, 10.2% lead, 7.8 oz/t silver and 3.75 g/t gold. The Bridal Veil mineral occurrences have been previously identified as being related to an epigenetic copper-silver +/- lead and gold orogenic vein system hosted in deeply dipping shear zones. The property is transected by the Trans Canada Highway approximately 10 kilometers east of Gander and 15 km east of Newfound Gold’s Queensway Project.
Kevin Brewer, P.Geo. President and CEO of CMC noted, “We are highly encouraged about these preliminary results at Bridal Veil. Less than 15% of the property area has been explored to date. At this stage it is clear we need to better understand the mineralizing system as the tenure of mineralization is very encouraging. It is now a matter of determining the extent, possible continuity, and subsurface potential of this mineralization throughout the property. Our plans are to further examine this property in the fall after work is completed on our flagship property at Silver Hart in Yukon.”
About CMC Metals Ltd.
CMC Metals Ltd. is a growth stage exploration company focused on opportunities for silver in Yukon and British Columbia and polymetallic deposits in Yukon and Newfoundland. Our silver-lead-zinc prospects include the Silver Hart Deposit and Blue Heaven claims (the “Silver Hart Project”) and the recently acquired Rancheria South, Amy and Silverknife claims (the “Rancheria South Project”). Our polymetallic projects with potential for copper-silver-gold and other metals include Logjam (Yukon), Bridal Veil and Terra Nova (both in Newfoundland).
Qualified Person
Kevin Brewer, a registered professional geoscientist in BC and Yukon, is the Company’s President and CEO, and Qualified Person (as defined by National Instrument 43-101). He has approved the technical information reported herein. The Company is committed to meeting the highest standards of integrity, transparency and consistency in reporting technical content, including geological reporting, geophysical investigations, environmental and baseline studies, engineering studies, metallurgical testing, assaying and all other technical data.
On behalf of the Board:
“John Bossio”
John Bossio, Chairman
CMC METALS LTD.
For further information concerning the CMC Metals Ltd., or its exploration projects, please contact:
|
Investor Inquiries: |
Kevin Brewer, P. Geo. |
|
President, CEO and Director |
|
|
Tel: (604) 605-0166 |
|
To be added to CMC's news distribution list, please send an email to info@cmcmetals.ca or contact Mr. Kevin Brewer at 604-605-0166.
Neither the TSX Venture Exchange nor its Regulation Services Provider (as that term is defined in the policies of the TSX Venture Exchange) accepts responsibility for the adequacy or accuracy of this release.
“This news release may contain certain statements that constitute “forward-looking information” within the meaning of applicable securities law, including without limitation, statements that address the timing and content of upcoming work programs, geological interpretations, receipt of property titles and exploitation activities and developments. In this release disclosure regarding the potential to undertake future exploration work comprise forward looking statements. Forward-looking statements address future events and conditions and are necessarily based upon a number of estimates and assumptions. While such estimates and assumptions are considered reasonable by the management of the Company, they are inherently subject to significant business, economic, competitive and regulatory uncertainties and risks, including the ability of the Company to raise the funds necessary to fund its projects, to carry out the work and, accordingly, may not occur as described herein or at all. Actual results may differ materially from those currently anticipated in such statements. Factors that could cause actual results to differ materially from those in forward looking statements include market prices, exploitation and exploration successes, the timing and receipt of government and regulatory approvals, the impact of the constantly evolving COVID-19 pandemic crisis and continued availability of capital and financing and general economic, market or business conditions. Readers are referred to the Company’s filings with the Canadian securities regulators for information on these and other risk factors, available at www.sedar.com. Investors are cautioned that forward-looking statements are not guarantees of future performance or events and, accordingly are cautioned not to put undue reliance on forward-looking statements due to the inherent uncertainty of such statements. The forward-looking statements included in this news release are made as of the date hereof and the Company disclaims any intention or obligation to update or revise any forward-looking statements, whether as a result of new information, future events or otherwise, except as expressly required by applicable securities legislation.”
A photo accompanying this announcement is available at https://www.globenewswire.com/NewsRoom/AttachmentNg/c74965da-d72f-4cff-8965-9d2c88caa0d4
VANCOUVER, British Columbia, April 15, 2021 (GLOBE NEWSWIRE) — Search Minerals Inc. (TSXV: SMY) (“Search” or the “Company”) is pleased to announce its 2021 exploration program for Critical Rare Earth Elements (CREE), Zirconium (Zr) and Hafnium (Hf) in the Port Hope Simpson – St. Lewis CREE District in SE Labrador and the Red Wine District in central Labrador. The program includes three different drill programs at DEEP FOX and channel sampling programs at SILVER FOX and FOX MEADOW, and a helicopter-supported, prospecting and sampling program in the RED WINE district.
EXPECTATIONS FOR THE 2021 EXPLORATION PROGRAM
-
DEEP FOX
-
Phase III exploration drill program to commence in May 2021;
-
Geotechnical drill program to commence in summer 2021;
-
Phase IV infill drill program to commence in fall 2021;
-
-
FOX MEADOW
-
Surface channel program aims to expand the previously successful channel sampling programs to make this mineralized zone ready for a Phase I exploration drill program;
-
-
SILVER FOX
-
sample high-grade zirconium-hafnium mineralization on surface to make Silver Fox ready for a Phase I drill program;
-
-
RED WINE DISTRICT
-
prospecting, mapping and channel sampling program will be carried out in the summer of 2021 to expand the known occurrences of HREE mineralization in five licenses in the district.
-
Greg Andrews, President/CEO states; “Our immediate goal is to advance our Critical Rare Earth Element District to production. This will require (a) advancing our DEEP FOX project to a measured and indicated resource, (b) provide engineering and economic studies such as Preliminary Economic Assessments and Feasibility Studies and (c) develop and submit an Environmental Assessment report to initiate the environmental and permitting process for DEEP FOX. The recent $ 2.52M flow-through funding will support the Phase III drill program and geotechnical work at Deep Fox and the exploration work for Fox Meadow, Silver Fox and Red Wine District. Permits for Deep Fox Phase III and geotechnical work have been received and our drilling contractor confirmed. In addition, we have been permitted to retrieve a bulk sample of 1000t of surface material from DEEP FOX to be used for our proposed demonstration plant. We are looking forward to advancing our Critical Rare Earth Element District. A secure supply of rare earth elements, from Newfoundland/Labrador, can contribute to the electric mobility, and other electrification initiatives in Canada, North America and Europe.”
DEEP FOX
A Phase III drill program is proposed to start in May 2021 for the DEEP FOX DEPOSIT. This program will consist of up to 7000m of drilling in 30-35 holes, to:
|
a) |
extend the current resource (see Search Minerals News Release, Oct. 1, 2019) to the 200m level with a 50m x 50m grid; |
|
|
b) |
drill on a 25 x 25m grid to the 50m level; |
|
|
c) |
drill two cross-sections (25m spacing) to the 200m level; and |
|
|
d) |
explore to the 250m level. |
This drill program will provide data to estimate a resource for an open pit to the 200m level. The 25m grid and cross-section drill holes will help to evaluate what density of drilling is required to estimate a measured and indicated resource for a Bankable Feasibility study. The Company will prepare an updated resource estimate following the completion of this program.
The Geotechnical drill program will consist of 5-10 holes, about 1000-2000m, as required to determine the geotechnical parameters of the proposed open pit to mine the deposit. This program will commence after Phase III is complete, probably in the summer of 2021.
The Phase IV drill program will be an estimated 25-30 holes totaling about 5100m. This program will be based on the conclusions derived from the previous three drill programs. The aim is to obtain enough data to be able to classify most of the DEEP FOX resource as an indicated or measured resource – this resource is required for a Bankable Feasibility study. This program will commence in the fall after a resource estimate has been made using Phase III drill data.
The DEEP FOX DEPOSIT occurs about 2 km northeast of St. Lewis and 12 km east of the FOXTROT DEPOSIT.
FOX MEADOW
The proposed channel sample program will consist of 5 new channels and 5 channel extensions totaling about 700m and aims to:
|
a) |
expand the strike length of the mineralized zone to the SE (now 790m), |
|
|
b) |
explore the width of the mineralized zone (currently over 175m wide), |
|
|
c) |
provide infill information throughout the 790m known strike length (see Search News Release October 28, 2020), and, |
|
|
d) |
allow further integration of aeromagnetic data and the surface extent of the mineralization. |
All channels occur in overburden-covered treed areas that will require trenching to expose bedrock. This program will make the FOX MEADOW mineralized zone “drill ready”.
The FOX MEADOW prospect occurs about 11 km west of Port Hope Simpson and 1 km from a gravel- covered, three-season forest access road. Port Hope Simpson is about 40 km northwest of FOXTROT and 50 km from DEEP FOX on paved and all-season graveled roads.
SILVER FOX
The SILVER FOX mineralized zone contains some of the highest grades of Zr and Hf mineralization observed in the District (see Search Minerals News Release, April 8, 2020 & October 22, 2020). The 2021 channel sample program, about 200m, will include seven infill channels and two channels to test the limits of the mineralized zone to the east and west; all channels will require trenching to expose bedrock for channel sampling. This channel program will make the SILVER FOX mineralized zone “drill ready”. The SILVER FOX prospect occurs about 12 km east of St. Lewis, 2 km west of FOXTROT and within 1 km of a graveled all-season highway.
RED WINE DISTRICT
Search has recently staked three new licenses and holds two other licenses in the Red Wine District of central Labrador, about 80 km NE of Churchill Falls. The exploration program will consist of helicopter-supported prospecting, geological mapping and sampling (grab and channel) in three different projects.
The Narnia Hill Project in the district consists of License 025298, staked in 2009, and new License 032428, staked in 2021. The 2021 program will look for REE mineralization associated with peralkaline volcanic rocks in/near a volcanic vent.
The Merlot Project consists of the north central part of License 013144, staked in 2009, and new License 032044, staked in 2021. The 2021 program will consist of prospecting, mapping, grab sampling and channel sampling to expand the extent of the Merlot-type heavy REE peralkaline pyroxenite-hosted mineralization (see Search News Release, January 16, 2012).
Merlot-type REE mineralization has been reported in new License 032427, staked in 2021. The 2021 program will focus on prospecting for and mapping Merlot-type REE mineralization in this license and to obtain grab samples and possible channel samples for further evaluation.
A sample of Merlot-type mineralization will be tested to evaluate magnetic separation as a method to prepare a REE mineral concentrate (see Search News Release April 12, 2021).
Qualified Person:
Dr. Randy Miller, Ph.D., P.Geo, is the Company's Vice President, Exploration, and Qualified Person (as defined by National Instrument 43-101) who has supervised the preparation of and approved the technical information reported herein. The Company will endeavour to meet high standards of integrity, transparency, and consistency in reporting technical content, including geological and assay (e.g., REE) data.
About Search Minerals Inc.
Led by a proven management team and board of directors, Search is focused on finding and developing Critical Rare Earths Elements (CREE), Zirconium (Zr) and Hafnium (Hf) resources within the emerging Port Hope Simpson – St. Lewis CREE District of South East Labrador. The Company controls a belt 63 km long and 2 km wide and is road accessible, on tidewater, and located within 3 local communities. Search has completed a preliminary economic assessment report for FOXTROT, and a resource estimate for DEEP FOX. Search is also working on three exploration prospects along the belt which include: FOX MEADOW, SILVER FOX and AWESOME FOX.
Search has continued to optimize our patented Direct Extraction Process technology with the generous support from the Department of Tourism, Culture, Industry and Innovation, Government of Newfoundland and Labrador, and from the Atlantic Canada Opportunity Agency. We have completed two pilot plant operations and produced highly purified mixed rare earth carbonate concentrate and mixed REO concentrate for separation and refining.
For further information, please contact:
Greg Andrews
President and CEO
Tel: 604-998-3432
E-mail: info@searchminerals.ca
Neither the TSX Venture Exchange nor its Regulation Services Provider (as that term is defined in the policies of the TSX Venture Exchange) accepts responsibility for the adequacy or accuracy of this release.
Cautionary Statement Regarding “Forward-Looking” Statements:
Except for the statements of historical fact, this news release contains "forward-looking information" within the meaning of the applicable Canadian securities legislation that is based on expectations, estimates and projections as at the date of this news release. "Forward-looking information" in this news release includes information about the Company’s proposed exploration programs described herein, and other forward-looking information. Factors that could cause actual results to differ materially from those described in such forward-looking information include, but are not limited to, the inability to obtain the necessary resources to complete the exploration programs and poor exploration results.
The forward-looking information in this news release reflects the current expectations, assumptions and/or beliefs of the Company based on information currently available to the Company. In connection with the forward-looking information contained in this news release, the Company has made assumptions about the Company's financial condition and development plans do not change as a result of unforeseen events, and that the Company will receive all required regulatory approvals,.
Although the Company believes that the assumptions inherent in the forward-looking information are reasonable, forward-looking information is not a guarantee of future performance and accordingly undue reliance should not be put on such information due to the inherent uncertainty therein. The Company does not assume any obligation to update the forward-looking statements, or to update the reasons why actual results could differ from those reflected in the forward-looking statements, unless and until required by applicable securities laws. Additional information identifying risks and uncertainties is contained in the Company's filings with the Canadian securities regulators, which filings are available at www.sedar.com.
VANCOUVER, British Columbia, April 15, 2021 (GLOBE NEWSWIRE) — HUDSON RESOURCES INC. (“Hudson” or the “Company”) (TSX Venture Exchange “HUD”, OTC “HUDRF”).
On April 6th, 2021, Greenland held elections in which the Inuit Ataqatigiit party (IA) won 12 of the 31 seats with 37% of the votes. The IA party is currently in negotiations with other parties to form a coalition government. The party is led by Múte Egede who was a former Minister of Mining in Greenland between 2016 and 2018 during which time he visited the White Mountain anorthosite project.
Since winning the election, the IA party has publicly stated that they are pro-mining and cited Hudson as a good example of the importance of mining in Greenland. The IA party has a strong environmental platform which Hudson is supportive of.
The IA party has stated that it is opposed to the export of uranium for nuclear purposes. Under Greenland mineral legislation all exploration licenses, including those granted to Hudson, do not provide the right to export and sell radioactive elements. Although Hudson’s rare earth element and niobium-tantalum projects do contain minor amounts of thorium or uranium, Hudson will not export and sell these elements and they will be dealt with in an environmentally responsible manner. The nearest community to Hudson’s projects is approximately 80 km away.
Jim Cambon, President commented: “I have congratulated Múte Egede on his victory and have also reached out to numerous government officials and community leaders in Greenland. Based on these discussions we are confident that it is business as usual for Hudson’s projects. Hudson has always done what we promised in Greenland and treated people fairly while respecting all stakeholders and the environment, and as such, we believe we have earned the respect of local communities and the government. We look forward to working with the new government in the continued operation of the White Mountain anorthosite mine and in the advancement of our rare earth elements project and our niobium-tantalum project.”
Hudson owns 100% of the Sarfartoq REE project and Nukittooq niobium-tantalum project in Greenland and also holds a 31.1% interest in Hudson Greenland A/S which owns the White Mountain Anorthosite mine in Greenland, where the Company provides operational, marketing and sales support.
ON BEHALF OF THE BOARD OF DIRECTORS
“Jim Cambon”
President and Director
For further information:
Ph: 604-628-5002
Forward-Looking Statements
CAUTIONARY STATEMENT REGARDING FORWARD-LOOKING INFORMATION: This News Release includes certain "forward-looking statements" which are not comprised of historical facts. Forward looking statements include estimates and statements that describe the Company’s future plans, objectives or goals, including words to the effect that the Company or management expects a stated condition or result to occur. Forward-looking statements may be identified by such terms as “believes”, “anticipates”, “expects”, “estimates”, “may”, “could”, “would”, “will”, or “plan”. Since forward-looking statements are based on assumptions and address future events and conditions, by their very nature they involve inherent risks and uncertainties. Although these statements are based on information currently available to the Company, the Company provides no assurance that actual results will meet management’s expectations. Risks, uncertainties and other factors involved with forward-looking information could cause actual events, results, performance, prospects and opportunities to differ materially from those expressed or implied by such forward-looking information. Forward looking information in this news release includes, but is not limited to, the Company’s objectives, goals or future plans, statements, exploration results, potential mineralization, the estimation of mineral resources, exploration and mine development plans, timing of the commencement of operations and estimates of market conditions. Factors that could cause actual results to differ materially from such forward-looking information include, but are not limited to failure to identify mineral resources, failure to convert estimated mineral resources to reserves, the inability to complete a feasibility study which recommends a production decision, the preliminary nature of metallurgical test results, delays in obtaining or failures to obtain required governmental, environmental or other project approvals, political risks, inability to fulfill the duty to accommodate indigenous peoples, uncertainties relating to the availability and costs of financing needed in the future, changes in equity markets, inflation, changes in exchange rates, fluctuations in commodity prices, delays in the development of projects, capital and operating costs varying significantly from estimates and the other risks involved in the mineral exploration and development industry, , an inability to predict and counteract the effects of COVID-19 on the business of the Company, including but not limited to the effects of COVID-19 on the price of commodities, capital market conditions, restriction on labour and international travel and supply chains, and those risks set out in the Company’s public documents filed on SEDAR. Although the Company believes that the assumptions and factors used in preparing the forward-looking information in this news release are reasonable, undue reliance should not be placed on such information, which only applies as of the date of this news release, and no assurance can be given that such events will occur in the disclosed time frames or at all. The Company disclaims any intention or obligation to update or revise any forward-looking information, whether as a result of new information, future events or otherwise, other than as required by law.
Neither the TSX Venture Exchange nor its Regulation Services Provider (as that term is defined in the policies of the TSX Venture Exchange) accepts responsibility for the adequacy or accuracy of this release.
VANCOUVER, BC / ACCESSWIRE / April 15, 2021 / Heatherdale Resources Ltd. ("Heatherdale" or the "Company") (TSXV:HTR) announces that it has closed its previously announced private placement of common shares (the "Offering"). A total of 6,747,500 common shares (the "Common Shares") were sold at price of $0.80 per Common Share, for aggregate gross proceeds of $5,398,000. The proposed name change will follow shortly.
The net proceeds of the Offering will be used to fund exploration activities on the Company's Niblack Cu-Au-Zn-Ag project located in Alaska, property acquisitions and working capital purposes.
The Company paid aggregate finder's fees of $110,280 and issued 137,850 share purchase warrants (the "Finder's Warrants") in connection with subscriptions from subscribers introduced by certain finders. Each Finder's Warrant is exercisable to acquire one share in the capital of the Company at an exercise price of $0.90 per share until April 15, 2022.
Certain insiders of the Company acquired 12,500 Common Shares pursuant to the Offering. Such participation is considered to be a "related party transaction" as defined under Multilateral Instrument 61-101 ("MI 61-101"). The Company is relying on the exemptions from the valuation and minority shareholder approval requirements of MI 61-101 contained in sections 5.5(a) and 5.7(1)(a) of MI 61-101, as the fair market value of the participation in the Offering by insiders does not exceed 25% of the market capitalization of the Company, as determined in accordance with MI 61-101. The Company did not file a material change report more than 21 days before the expected closing of the Offering, as the details of the Offering were not settled until shortly prior to closing and the Company wished to close on an expedited basis for sound business reasons and in a timeframe consistent with usual market practices for transactions of this nature.
The Offering remains subject to final approval of the TSX Venture Exchange. The Common Shares and the Finder's Warrants issued under the Offering are subject to a statutory hold period of four months plus one day.
This news release does not constitute an offer to sell or a solicitation of an offer to buy any of the securities in the United States. The securities have not been and will not be registered under the United States Securities Act of 1933, as amended (the "U.S. Securities Act") or any state securities laws and may not be offered or sold within the United States or to U.S. Persons unless registered under the U.S. Securities Act and applicable state securities laws or an exemption from such registration is available.
About Heatherdale Resources
Heatherdale Resources Ltd.'s founding vision is to be an industry leader in transparency, inclusion and innovation. Guided by our Vision and through collaboration with local and Indigenous communities and stakeholders, Heatherdale builds shareholder value through our technical expertise in mineral exploration, engineering and permitting. The Company holds a 100% interest in the high-grade Niblack copper-gold-zinc-silver VMS project, located adjacent to tidewater in southeast Alaska. For more information on Heatherdale, please visit the Company's website at www.heatherdaleresources.com.
On behalf of the Board of Directors
"Robert McLeod"
Robert McLeod, P.Geo
President, CEO and Director
For more information, contact:
Rob McLeod
604-617-0616 (Mobile)
604-343-2997 (Office)
rm@bwcg.ca
Liam Morrison
604-897-9952 (Mobile)
604-343-2997 (Office)
lm@bwcg.ca
Neither the TSX Venture Exchange nor its Regulation Services Provider (as that term is defined in the policies of the TSX Venture Exchange) accepts responsibility for the adequacy or accuracy of this release.
Cautionary Note Regarding Forward-Looking Statements:
This release includes certain statements and information that may constitute forward-looking information within the meaning of applicable Canadian securities laws. Forward-looking statements relate to future events or future performance and reflect the expectations or beliefs of management of the Company regarding future events. Generally, forward-looking statements and information can be identified by the use of forward-looking terminology such as "intends" or "anticipates", or variations of such words and phrases or statements that certain actions, events or results "may", "could", "should", "would" or "occur". This information and these statements, referred to herein as "forward‐looking statements", are not historical facts, are made as of the date of this news release and include without limitation, statements regarding the use of proceeds of the Offering. These forward‐looking statements involve numerous risks and uncertainties and actual results might differ materially from results suggested in any forward-looking statements. These risks and uncertainties include, among other things, receipt of regulatory approvals of the Offering, market volatility; the state of the financial markets for the Company's securities; and changes in the Company's business plans. In making the forward looking statements in this news release, the Company has applied several material assumptions that the Company believes are reasonable, including without limitation, that required regulatory approvals will be obtained and the Company will continue with its stated business objectives. Although management of the Company has attempted to identify important factors that could cause actual results to differ materially from those contained in forward-looking statements or forward-looking information, there may be other factors that cause results not to be as anticipated, estimated or intended. There can be no assurance that such statements will prove to be accurate, as actual results and future events could differ materially from those anticipated in such statements. Accordingly, readers should not place undue reliance on forward-looking statements and forward-looking information. Readers are cautioned that reliance on such information may not be appropriate for other purposes. The Company does not undertake to update any forward-looking statement, forward-looking information or financial out-look that are incorporated by reference herein, except in accordance with applicable securities laws. The Company seeks safe harbor.
For more information on the Company, investors should review the Company's continuous disclosure filings that are available at www.sedar.com.
SOURCE: Heatherdale Resources Ltd.
View source version on accesswire.com:
https://www.accesswire.com/640527/Heatherdale-Announces-Closing-of-54-Million-Private-Placement
DENVER, CO / ACCESSWIRE / April 14, 2021 /Solitario Zinc Corp. ("Solitario") (NYSE American:XPL)(TSX:SLR) today announced it will be featured as a presenting company at the H.C. Wainwright Spring Mining Conference. The conference is being held on April 19-20, 2021 virtually.
Christopher Herald, CEO of Solitario, will provide an overview of the Company's business during the live presentation and will be available to participate in one-on-one meetings with investors who are registered to join the conference.
If you are an institutional investor and would like to attend the conference, please register at the following link: www.hcwevents.com/mining. We invite all investors to listen to the Solitario's presentation online at: https://journey.ct.events/view/b4203305-a368-4424-abf5-d719cb9ef83b starting on April 19th at 3:00 p.m. EDT and archived for 90 days. Over 60 corporate presentations are available live and on-demand on April 19-20, 2021, starting at 9:00 A.M. (EDT).
Event: H.C. Wainwright Spring Mining Conference (Virtual Conference)
Date: April 19th, 2021
Time: 3:00 p.m. (Eastern Time)
Location: Virtual Conference
Company Webcasting Link: https://journey.ct.events/view/b4203305-a368-4424-abf5-d719cb9ef83b
About Solitario
Solitario is a well-funded emerging zinc exploration and development company traded on the NYSE American ("XPL") and on the Toronto Stock Exchange ("SLR"). Solitario holds 50% joint venture interest (Teck Resources 50%) in the high-grade, open-pittable Lik zinc deposit in Alaska and a 39% joint venture interest (Nexa Resources holds the remaining 61% interest) on the high-grade Florida Canyon zinc project in Peru. Management and Directors hold approximately 9.6% (excluding options) of the Company's 58.4 million shares outstanding. Solitario's cash balance and marketable securities stand at approximately US$7.7 million. Additional information about Solitario is available online at www.solitariozinc.com.
About H.C. Wainwright & Co.
H.C. Wainwright is a full‐service investment bank dedicated to providing corporate finance, strategic advisory and related services to public and private companies across multiple sectors and regions. H.C. Wainwright & Co. also provides research and sales and trading services to institutional investors. According to Sagient Research Systems, H.C. Wainwright's team is ranked as the #1 Placement Agent in terms of aggregate CMPO (confidentially marketed public offering), RD (registered direct offering) and PIPE (private investment in public equity) executed cumulatively since 1998.
For more information visit H.C. Wainwright & Co. on the web at www.hcwco.com
FOR MORE INFORMATION, CONTACT:
Christopher E. Herald
President & CEO
(303) 534-1030, Ext. 14
Valerie Kimball
Director – Investor Relations
(720) 933-1150
(800) 229-6827
SOURCE: Solitario Zinc Corp.
View source version on accesswire.com:
https://www.accesswire.com/640279/Solitario-Announces-Participation-at-the-HC-Wainwright-Spring-Mining-Conference-April-19-20-2021-Virtual-Conference
Vancouver, British Columbia–(Newsfile Corp. – April 14, 2021) – Playfair (TSXV: PLY) (FSE: P1J1) (OTC: PLYFF) is planning a core drilling program on its large (201 square kilometers) 100% owned RKV Copper Project in South Central Norway. Playfair has delineated seven drill targets and has filed Drill Notifications with the Norwegian Directorate of Mining (six are approved to date).
The seven drill targets are shown on the attached map and were previously described: Storboren (November 07, 2019 and December 05, 2019 News Releases), Sæterfjellet, (January 06, 2021 News Release), Kletten North and Kletten South (January 28, 2021 News Release), Røstvangen Northeast and Røstvangen Southwest (February 17, 2021 News Release) and Rødalen (March 11, 2021 News Release).

Figure 1
To view an enhanced version of this map, please visit:
https://orders.newsfilecorp.com/files/7302/80248_06a228b4a4d9bb5d_002full.jpg
The drill targets are MMI (Mobile Metal Ion) copper anomalies discovered by sampling target areas generated by Windfall Geotek's proprietary Computer Aided Resources Detection System (CARDS).
All seven drill targets show compelling coherent MMI Cu anomalies with multiple MMI Cu values greater than 6,000 ppb. The highest value recorded was 53,300 ppb MMI Cu. A short MMI Report by SGS states that values greater than 6,000 ppb MMI Cu "are likely to be associated with weathering copper sulphides."
A presentation on the drilling plans can be found at the following direct link: RKV Drill Plans or on Playfair's website.
The technical contents of this release were approved by Greg Davison, PGeo, a qualified person as defined by National Instrument 43-101.
The road to a cleaner environment includes electric vehicles. Electric vehicles need copper, nickel, and cobalt. There is no green future without minerals.
For further information visit our website at www.playfairmining.com or contact:
Donald G. Moore
CEO and Director
Phone: 604-377-9220
Email: dmoore@wascomgt.com
D. Neil Briggs
Director
Phone: 604-562-2578
Email: nbriggs@wascomgt.com
Forward-Looking Statements: This Playfair Mining Ltd News Release may contain certain "forward-looking" statements and information relating to Playfair which are based on the beliefs of Playfair management, as well as assumptions made by and information currently available to Playfair management. Such statements reflect the current risks, uncertainties and assumptions related to certain factors including, without limitations, exploration and development risks, expenditure and financing requirements, title matters, operating hazards, metal prices, political and economic factors, competitive factors, general economic conditions, relationships with vendors and strategic partners, governmental regulation and supervision, seasonality, technological change, industry practices, and one-time events. Should any one or more of these risks or uncertainties materialize or change, or should any underlying assumptions prove incorrect, actual results and forward-looking statements may vary materially from those described herein.

To view the source version of this press release, please visit https://www.newsfilecorp.com/release/80248
Vancouver, British Columbia–(Newsfile Corp. – April 13, 2021) – Dynasty Gold Corp. (TSXV: DYG) (FWB: D5G) (OTC Pink: DGDCF) ("Dynasty" or the "Company"), further to the press release of April 9, is pleased to announce that subject to Exchange approval, it has closed an oversubscribed non-brokered private placement of 3,126,176 units for gross proceeds of $531,450. Each unit consists of one common share at $0.17 and one common share purchase warrant at $0.25 for a period of two years. The Company shall have the right to call the outstanding Warrants for expiry upon 20 days notice in the event that the closing price of the common shares of the Company on the TSX-V is above $0.35 for 10 consecutive trading days. The units issued under the private placement are subject to a four-month hold period from the date of closing.
The proceeds from the private placement will be used to advance the company's gold projects and for general corporate purposes.
The Company is in preparation for an upcoming field season. Further details will be announced in due course.
About Dynasty Gold Corp.
Dynasty Gold Corp. is a Canadian exploration company currently focused on gold exploration in North America with projects located in greenstone belts in Ontario and the Midas gold camp in Nevada. Currently, the 70% owned Hatu Qi2 gold mine in the Tien Shan Gold belt, Xinjiang, China, is in legal dispute with Xinjiang Non-Ferrous Industrial Metals Group and its subsidiary Western Region Gold Co. Ltd.. For more information, please visit Company's website www.dynastygoldcorp.com.
ON BEHALF OF THE BOARD OF DYNASTY GOLD CORP.
"Ivy Chong"
_________________________________
Ivy Chong, President & CEO
For additional information please contact:
Vancouver Office:
Ivy Chong
Phone: 604.633.2100. Email: ichong@dynastygoldcorp.com
This press release contains certain "forward-looking statements" that involve a number of risks and uncertainties. There can be no assurance that such statements will prove to be accurate and actual results and future events could differ materially from those anticipated in such statements. The TSX Venture Exchange has not reviewed and does not accept responsibility for the adequacy or accuracy of this release.

To view the source version of this press release, please visit https://www.newsfilecorp.com/release/80377
Craig J. Nelsen Appointed Chairman
Toronto, Ontario–(Newsfile Corp. – April 14, 2021) – ATEX Resources Inc. (TSXV: ATX) ("ATEX") announces that all matters submitted to shareholders for approval, as set out in ATEX's Management Information Circular dated February 22, 2021, were approved by the requisite majority of votes cast at its Annual General Meeting of Shareholders held in Toronto, Ontario, including resolutions:
-
Election of Craig J. Nelsen, Dr. Raymond Jannas, Carl Hansen, Robert Suttie and William Jung as directors of ATEX;
-
Re-appointment of DeVisser Gray LLP as the auditors of ATEX for the ensuing year; and,
-
Approval of the continuation of ATEX's incentive "Stock Option Plan".
Craig J. Nelsen, the newly appointed Chairman of the Board, commented, "I am pleased to see that all resolutions were passed at the Annual General Meeting and I am excited to transition to the Chairman of the Board and take a more active role in the direction of ATEX. I would also like to take the opportunity to thank Carl Hansen, who stepped down as Chairman, for his dedication after 10 years as Chairman of ATEX and its predecessor company and I am pleased that Mr. Hansen will continue as an active ATEX director."
Mr. Nelsen has extensive exploration experience with senior management roles at major mining companies along with a strong corporate background as a board member of a number of exploration and gold mining companies, including New Gold, Golden Star and OceanaGold. He has been involved in a number of major discoveries and development projects in South America including the Pascua gold deposit and the El Morro copper gold deposit, both located in Chile, the Cerro San Pedro gold silver deposit in Mexico and the Cerro Corona gold deposit in Peru.
About ATEX Resources Inc.
ATEX is a mineral exploration company, listed on the TSX Venture Exchange, dedicated to the acquisition, development and monetization of projects throughout the Americas. ATEX's flagship Valeriano Copper Gold Property is located in Chile's prolific El Indio Mineral Belt.
On behalf of ATEX Resources Inc.
Dr. Raymond Jannas, CEO
For additional information, please email info@atexresources.com or call 1-647-287-3778.
CAUTIONARY NOTE REGARDING FORWARD-LOOKING STATEMENTS:
This new release may contain forward-looking statements. These statements are based on current expectations and assumptions that are subject to risks and uncertainties. Actual results could differ materially because of factors discussed in the management discussion and analysis section of our interim and most recent annual financial statement or other reports and filings with the TSX Venture Exchange and applicable Canadian securities regulations. We do not assume any obligation to update any forward-looking statements.
Neither TSX Venture Exchange nor its Regulation Services Provider (as that term is defined in the policies of the TSX Venture Exchange) accepts responsibility for the adequacy or accuracy of this press release.

To view the source version of this press release, please visit https://www.newsfilecorp.com/release/80459
Gold prices have rebounded on government data showing a slightly higher-than-expected reading on U.S. inflation. This bolstered bullion’s appeal as an inflation hedge and put pressure on the dollar. Further, Food and Drug Administration’s recommendation to states to pause the use of Johnson & Johnson's coronavirus vaccine after six cases of blood clots, fueled the safe-haven demand for the metal and propped up prices. Spot gold gained 0.5% to $1,744.80 an ounce on Apr 12 and gold futures for June delivery advanced 0.87% to $1,746.20.
Per the U.S. Bureau of Labor Statistics, the consumer-price index rose 0.6% — the biggest rise since August 2012. It followed an increase of 0.4% in February and came ahead of the consensus of a rise of 0.5%. For 12 months ending March 2021, the inflation rate in the United States accelerated to 2.6%, higher than the 1.7% in February and above the market consensus of 2.5%. It was also the highest since August 2018.
The US Dollar Index lost 0.33% to 91.844 on Apr 13 on this higher-than-expected figures. The US 10-year bond yields remains at 1.63%, near three-week lows of 1.618%. After reaching 14-month highs of 1.78% in March, treasury yields have been declining this month on encouraging economic data from the United States and concerns over a spike in inflation.
Overall, the yellow metal has lost 8% of its value so far this year due to vaccine rollouts and optimism over economic recovery. Global gold ETFs lost 107.5 tons ($5.9 billion) in March, marking outflows for the second month in a row in which net outflows ranked the top 10 worst outflows historically. In the first quarter of 2021, global gold ETFs lost 177.9 tons ($9.5 billion). As of the quarter-end, global assets under management (AUM) stand at 3,574 tons ($194.5 billion) — at levels last seen in June 2020. Since the peak attained in November 2020, gold ETF holdings have declined 9% in tonnage terms, at par with the drop in gold price.
During the quarter, North American funds represented 86% of global net outflows, falling 145.4 tons ($8.1 billion). European funds lost 51.7 tons ($2.5 billion) during the quarter. The bright spot was Asian-listed funds, which collectively added 17.8 tons ($1 billion), driven by China, India, and Japan. This was primarily due to opportunistic “dip buying” during gold price weakness.
Going forward, India and China (that roughly account for around 50% of consumer gold demand), will sustain demand for the yellow metal. The ongoing economic recovery in China will lead to higher demand for the yellow metal. Gold demand in India is seasonally high in the later part 2020, courtesy of the wedding and festive seasons when buying the yellow metal is considered auspicious. Central banks also continue to buy gold. Thus, demand for gold is likely to improve this year.
Mine production is expected to recover this year following the pandemic induced shutdowns in the earlier part of last year. Although pandemic-related uncertainty still lingers in 2021, production is unlikely to be impacted again as major companies have introduced protocols and procedures that should reduce the impact of stoppages compared to those seen in the early stages of the pandemic. Inflation expectations are likely to move higher, which will support the yellow metal. Historically, gold has performed well in high inflationary environments.
The Zacks Gold Mining industry has gained 5.8% year to date compared with the S&P 500’s rally of 4.5%. The industry falls under the broader Basic Materials sector that gained 1.9%.

The gold mining industry currently carries a Zacks Industry Rank #229, which places it at the bottom 10% of 256 Zacks industries. Our research shows that the top 50% of the Zacks-ranked industries outperforms the bottom 50% by a factor of more than 2 to 1.
Per the latest Earnings Trends, after remaining in the red for the past four quarters, the Basic Materials sector returned to growth with an earnings improvement of 28.1% in fourth-quarter 2020. The sector is expected to witness growth of 65.8% in earnings in first-quarter 2020, followed by 162.7%, 49.4% and 12.3% in the second, third and fourth quarters, respectively. The prospects for 2021 look promising for the sector with an impressive earnings growth projection of 58.8%.
We have handpicked four gold stocks that are likely to deliver improved earnings performance in their upcoming Q1 results. All the five stocks have a Zacks Rank # 3 (Hold) and a VGM Score of A or B. Our research shows that stocks with such a combination offer the best investment opportunities. You can see the complete list of today’s Zacks #1 Rank (Strong Buy) stocks here.
Barrick Gold Corp GOLD: Headquartered in Toronto, Canada, Barrick Gold engages in the exploration, mine development, production, and sale of gold and copper properties.
The company is expected to gain from progress of its key growth projects that are likely to contribute to its production. Barrick Gold has a strong liquidity position and generates healthy cash flows, which positions it well to take advantage of attractive development, exploration and acquisition opportunities. The company should gain from its merger with Randgold, which formed an industry-leading gold company and fortified its position among senior gold peers. Further, it is close to finalizing an agreement with the Papua New Guinea government to reopen the Porgera gold mine. Porgera churned out about 600,000 ounces of gold in 2019 before being put on care and maintenance.
The company has a long-term estimated earnings growth rate of 2%. The Zacks Consensus Estimate for the company’s fiscal 2021 earnings suggests year-over-year growth of 7.8%. The stock has a Zacks Rank #3 and a VGM Score of A. The company has a trailing four-quarter earnings surprise of 15.5%, on average.
Harmony Gold Mining Company Limited HMY: Headquartered in Randfontein, South Africa, Harmony Gold Mining engages in the exploration, extraction, and processing of gold in South Africa and Papua New Guinea.
The company’s development projects currently in progress include the development of the Wafi-Golpu, a copper/gold deposit in Papua New Guinea, which received the environment permit in late 2020 and is expected to increase production. The Golpu project is believed to be a game changer for the company. According to the company, Golpu is a promising orebody that contains mineral resources of 20 million ounces of gold and 9.4 million tons of copper. Further, its efforts to reduce debt levels remain commendable.
The Zacks Consensus Estimate for the company’s fiscal 2021 earnings is currently pegged at 69 cents, suggesting a turnaround from a loss of 10 cents reported in the prior fiscal. The company has an estimated long-term earnings growth of 7.9%. The company currently has a Zacks Rank #3 and a VGM Score of B.
IAMGOLD Corporation IAG: Headquartered in Toronto, Canada, IAMGOLD Corporation explores for, develops, and operates gold mining properties in North and South America, and West Africa.
The company’s strong liquidity position continues to provide security and financial flexibility. IAMGOLD's transformational strategy centres on delivering the lower cost Côté Gold Project, de-risking the Boto Gold Project, optimizing its current operations and continuing to invest in its pipeline of brownfield and greenfield exploration. Robust development and exploration pipeline supports attractive and profitable long-term growth to over one million ounces of annual production in the coming years.
The company has a long-term estimated earnings growth rate of 3%. The Zacks Consensus Estimate for the company’s fiscal 2021 earnings suggests year-over-year growth of 79%. The stock has a Zacks Rank #3 and a VGM Score of A.
New Gold Inc. NGD: Headquartered in Toronto, Canada, New Gold is an intermediate gold mining company, which engages in the development and operation of mineral properties.
New Gold will benefit from higher production levels at Rainy River Mine, at lower costs, as deferred capital projects have been completed and the mine transitions to generating free cash flow. The New Afton mine continues to ramp- up production. Moreover, the company remains committed to operational and cost optimizations at both Rainy River and New Afton, launching B3 production, advancing C-Zone development at New Afton, and following up on key targets from the exploration drilling programs.
The company has a long-term estimated earnings growth rate of 5%. The Zacks Consensus Estimate for the company’s fiscal 2021 earnings indicates year-over-year growth of 667%. The stock has a Zacks Rank #3 and a VGM Score of B.
Breakout Biotech Stocks with Triple-Digit Profit Potential
The biotech sector is projected to surge beyond $775 billion by 2024 as scientists develop treatments for thousands of diseases. They’re also finding ways to edit the human genome to literally erase our vulnerability to these diseases.
Zacks has just released Century of Biology: 7 Biotech Stocks to Buy Right Now to help investors profit from 7 stocks poised for outperformance. Our recent biotech recommendations have produced gains of +50%, +83% and +164% in as little as 2 months. The stocks in this report could perform even better.
See these 7 breakthrough stocks now>>
Want the latest recommendations from Zacks Investment Research? Today, you can download 7 Best Stocks for the Next 30 Days. Click to get this free report
Barrick Gold Corporation (GOLD) : Free Stock Analysis Report
Iamgold Corporation (IAG) : Free Stock Analysis Report
Harmony Gold Mining Company Limited (HMY) : Free Stock Analysis Report
To read this article on Zacks.com click here.
VANCOUVER, British Columbia, April 14, 2021 (GLOBE NEWSWIRE) — Medallion Resources Ltd. (TSX-V: MDL; OTCQB: MLLOF; Frankfurt: MRDN) – “Medallion” or the “Company”), announces completion of a suite of diagnostic test work at the Australian Nuclear Science and Technology Organization (ANSTO) in Sydney, to extract rare earth elements (REE) from mineral sand monazite. The monazite was sourced from an Australian mineral sand mine. Discussion is ongoing with additional prospective suppliers.
Mineral sand monazite is an abundant REE-rich feedstock, that can be accessed as a by-product from global mineral-sand mines that target zirconium and titanium, without the need for additional mining. Medallion’s business model is centered on the Medallion Monazite Process, a transferable and scalable technology designed to accept multiple mineral-sand monazite feedstocks and extract high-value REEs with high efficiency, high recovery and zero liquid waste.
Current and ongoing test work is focused on correlating low cost “diagnostic” mineralogical and chemical data from “run of mine” monazite, sourced from operating mines and prospective producers, with extraction results from the Medallion Monazite Process. This growing data bank will ensure optimal process conditions can be anticipated for all monazite sources and optimal sites identified for a Medallion Monazite Processing hub.
The diagnostic test work builds upon research completed by Medallion over the past 5 years in Saskatchewan, Canada. ANSTO’s deep experience in REE-processing and mineral sand monazite makes it an unrivaled research partner for Medallion’s ongoing work.
Medallion utilizes Life Cycle Assessment (LCA) as a tool to help reduce the environmental and CO2 impact of REE production wherever possible. Processing mineral-sand monazite close to source presents the most sustainable solution versus long distance transport. As Australia, South East Asia and the Indian Ocean region are the dominant global sources of mineral sand monazite, expanding research networks in this region, with partners like ANSTO, is highly relevant for future business opportunities.
“The study we have just completed at ANSTO enables us to be increasingly predictive toward REE- extraction and separation process conditions,” said Mark Saxon, CEO and President. “By acquiring a simple set of data from monazite suppliers, we can be predictive on the process conditions, costs and quantity of market-ready REE products.”
Techno-Economic Assessment (TEA) Update
Utilizing independent consultants, Medallion is presently finalizing a Techno-Economic Assessment (TEA) and Life Cycle Assessment (LCA) for the Medallion Monazite Process (see press release dated November 10 2020) and January 5 2021. These studies draw together Medallion’s engineering, financial and environmental impact data and will become the foundation of Medallion’s technology execution strategy.
Delivery of the TEA has unfortunately been impacted by COVID-19 staffing restrictions within consulting service providers. Results are now anticipated by mid-May 2021.
Mark Saxon further commented, “while reporting delays are never ideal, we acknowledge the current challenges and restrictions faced by consultants and researchers in the execution of their business. The financial and LCA model is a far-reaching study that will allow us to compare and prioritize operating locations and feedstocks to ensure the most profitable and lowest-environmental impact decisions are made.”
About Medallion Resources
Medallion Resources has developed a proprietary process and related business model to achieve low-cost, near-term, rare-earth element (REE) production by exploiting monazite. Monazite is a rare-earth phosphate mineral that is widely available as a by-product from mineral sand mining operations. Furthermore, Medallion has recently licensed an innovative REE separation technology from Purdue University which can be utilized by Medallion and sub-licensed by Medallion to third-party REE producers.
REEs are critical inputs to electric and hybrid vehicles, electronics, imaging systems, wind turbines and strategic defense systems. Medallion is committed to following best practices and accepted international standards in all aspects of mineral transportation, processing and the safe management of waste materials. Medallion utilizes Life Cycle Assessment methodology to support investment and process decision making.
More about Medallion (TSX-V: MDL; OTCQB: MLLOF; Frankfurt: MRDN) can be found at medallionresources.com.
Contact(s):
Mark Saxon, President & CEO
Donald Lay, Director & VP, Corporate Development
+1.604.681.9558 or info@medallionresources.com
Neither TSX Venture Exchange nor its Regulation Services Provider (as that term is defined in the policies of the TSX Venture Exchange) accepts responsibility for the adequacy or accuracy of this release.
Medallion management takes full responsibility for content and has prepared this news release. Some of the statements contained in this release are forward-looking statements, such as statements that describe Medallion’s plans with respect to the completion of additional tranche(s) of the Offering and the intended use of the proceeds. Since forward-looking statements address future events and conditions, by their very nature, they involve inherent risks and uncertainties, including the risks related to market conditions and regulatory approval and other risks outlined in the Company’s management discussions and analysis of financial results. Actual results in each case could differ materially from those currently anticipated in these statements. Also, in order to proceed with Medallion’s plans, additional funding will be necessary and, depending on market conditions, this funding may not be forthcoming on a schedule or on terms that facilitate Medallion’s plans. These forward-looking statements are made as of the date of this press release, and, other than as required by applicable securities laws, Medallion disclaims any intent or obligation to update publicly any forward-looking statements, whether as a result of new information, future events or results or otherwise.
NOT FOR DISTRIBUTION TO UNITED STATES NEWSWIRE SERVICES OR FOR DISSEMINATION IN THE UNITED STATES
CALGARY, AB / ACCESSWIRE / April 13, 2021 / New Stratus Energy Inc. (TSXV:NSE) ("New Stratus" or the "Corporation") announces the grant of incentive stock options to acquire a total of 1,290,000 common shares of the Corporation to various directors, officers and consultants of the Corporation pursuant to the Corporation's stock option plan and subject to any regulatory approval. Each stock option, vests immediately and is exercisable at a price of $0.24 per share for a period of five years from the grant date.
Contact Information:
|
Jose Francisco Arata |
Mario A. Miranda |
Neither the TSX Venture Exchange nor its Regulation Services Provider (as that term is defined in policies of the TSX Venture Exchange) accepts responsibility for the adequacy or accuracy of this release.
SOURCE: New Stratus Energy Inc.
View source version on accesswire.com:
https://www.accesswire.com/640313/New-Stratus-Energy-Announces-Option-Grants
Initial 15-hole drill program expected to commence in June
Geophysical Surveys

Geology reconnaissance and surface sampling; helicopter borne magnetometry and radiometric (“Heli-mag”); and a 14-line Controlled Source Audio Magneto Telluric survey, (“CSAMT”)
WATCH VIDEO SUMMARY OF THE PRESS RELEASE
WINNEMUCCA, Nevada, April 13, 2021 (GLOBE NEWSWIRE) — Paramount Gold Nevada Corp. (NYSE American: PZG) announced today that it has received all required permits to conduct exploratory drilling at the Frost Project (“Frost”) in Eastern Oregon from the Bureau of Land Management (“BLM”), the Oregon Department of Geology and Mineral Industries (“DOGAMI”) and associated agencies.
Frost is comprised of 84 unpatented lode claims covering approximately 1,730 acres located 12 miles southwest of the Company’s proposed high-grade, underground Grassy Mountain gold mine in Malheur County, Oregon (“Grassy”).
Paramount CEO, Rachel Goldman stated: “Our team is excited to undertake the upcoming drill program at Frost given the high-grade nature of the historic intercepts which yielded up to 25 g/T gold and 27 g/T silver but were never properly evaluated.”
Given the proximity of Frost to Grassy, mineralized material would be trucked as mill feed to the Grassy processing facility. Every incremental 270,000 tonnes of economic mineralized material would extend the mine life by a year, improving overall project economics as defined in the Grassy Feasibility study.
The interpretation of the historic drilling data in conjunction with geophysical survey results provided the basis for the planned 9,000 ft., 15-hole reverse circulation drill campaign which is expected to start in late Q2, 2021.
The historic high-grade gold encountered at Frost was from structures exhibiting magnetic lows in rock formations similar in nature to those found at Grassy.
Since acquiring the Frost Project in 2018, Paramount has completed multiple surveys, including: geology reconnaissance and surface sampling; helicopter borne magnetometry and radiometric (“Heli-mag”); and a 14-line Controlled Source Audio Magneto Telluric survey, (“CSAMT”).
-
Heli-mag & Radiometric: Due to the nature of deposits like Grassy and the Frost prospect, alteration and/or oxidation along mineralized or fluid conducting structures, exhibit a relatively lower magnetic signature. Additionally, potassium rich minerals such as adularia and sericite are often associated with gold deposition and since potassium is a slightly radiometric element, it can be mapped by sensors.
-
CSAMT: This study measures the variation in electrical conductivity of different rock types, enabling the favourable rocks and faults to be mapped at varying elevations to create a three-dimensional model. Grassy and Frost are the type of deposits where gold is also associated with an increase in non-conductive silica. By mapping conductivity, areas of increased silicification are identified as zones of very low conductivity or inversely, as high resistivity.
Paramount President and COO, Glen van Treek explained: “All of these surveys, along with field examination, rock sampling, mapping, geological staff experiences and 3-D analysis have helped to design the upcoming drilling campaign.”
A photo accompanying this announcement is available at https://www.globenewswire.com/NewsRoom/AttachmentNg/6895e0c1-f156-418d-8d53-141d200e30f7
About Paramount Gold Nevada Corp.
Paramount Gold Nevada Corp. is a U.S. based precious metals exploration and development company. Paramount’s strategy is to create shareholder value through exploring and developing its mineral properties and to realize this value for its shareholders in three ways: by selling its assets to established producers; entering into joint ventures with producers for construction and operation; or constructing and operating mines for its own account.
Paramount owns 100% of the Grassy Mountain Gold Project which consists of approximately 8,200 acres located on private and BLM land in Malheur County, Oregon. The Grassy Mountain Gold Project contains a gold-silver deposit (100% located on private land) for which results of a positive Feasibility Study have been released and key permitting milestones accomplished.
Paramount owns a 100% interest in the Sleeper Gold Project located in Northern Nevada, the world’s premier mining jurisdiction. The Sleeper Gold Project, which includes the former producing Sleeper mine, totals 2,322 unpatented mining claims (approximately 60 square miles or 15,500 hectares). The Sleeper gold project is host to a large gold deposit (over 4 million ounces of mineralized material) and the Company has completed and released a positive Preliminary Economic Assessment. With higher gold prices, Paramount has begun work to update and improve the economics of the Sleeper project.
Safe Harbor for Forward-Looking Statements
This release and related documents may include "forward-looking statements" and “forward-looking information” (collectively, “forward-looking statements”) pursuant to applicable United States and Canadian securities laws. Paramount’s future expectations, beliefs, goals, plans or prospects constitute forward-looking statements within the meaning of the United States Private Securities Litigation Reform Act of 1995 and other applicable securities laws. Words such as "believes," "plans," "anticipates," "expects," "estimates" and similar expressions are intended to identify forward-looking statements, although these words may not be present in all forward-looking statements. Forward-looking statements included in this news release include, without limitation, statements with respect to the use of proceeds from the Offerings. Forward-looking statements are based on the reasonable assumptions, estimates, analyses and opinions of management made in light of its experience and its perception of trends, current conditions and expected developments, as well as other factors that management believes to be relevant and reasonable in the circumstances at the date that such statements are made, but which may prove to be incorrect. Management believes that the assumptions and expectations reflected in such forward-looking statements are reasonable. Assumptions have been made regarding, among other things: the conclusions made in the feasibility study for the Grassy Mountain Gold Project (the “FS”); the quantity and grade of resources included in resource estimates; the accuracy and achievability of projections included in the FS; Paramount’s ability to carry on exploration and development activities, including construction; the timely receipt of required approvals and permits; the price of silver, gold and other metals; prices for key mining supplies, including labor costs and consumables, remaining consistent with current expectations; work meeting expectations and being consistent with estimates and plant, equipment and processes operating as anticipated. There are a number of important factors that could cause actual results or events to differ materially from those indicated by such forward-looking statements, including, but not limited to: uncertainties involving interpretation of drilling results; environmental matters; the ability to obtain required permitting; equipment breakdown or disruptions; additional financing requirements; the completion of a definitive feasibility study for the Grassy Mountain Gold Project; discrepancies between actual and estimated mineral reserves and mineral resources, between actual and estimated development and operating costs and between estimated and actual production; the global epidemics, pandemics, or other public health crises, including the novel coronavirus (COVID-19) global health pandemic, and the spread of other viruses or pathogens and the other factors described in Paramount’s disclosures as filed with the SEC and the Ontario, British Columbia and Alberta Securities Commissions.
Except as required by applicable law, Paramount disclaims any intention or obligation to update any forward-looking statements as a result of developments occurring after the date of this document.
Paramount Gold Nevada Corp.
Rachel Goldman, Chief Executive Officer
Christos Theodossiou, Director of Corporate Communications
866-481-2233
Twitter: @ParamountNV
Toronto, Ontario–(Newsfile Corp. – April 13, 2021) – Maritime Resources Corp. (TSXV: MAE) ("Maritime" or the "Company") is pleased to announce the exercise of 12,959,357 common share purchase warrants for gross proceeds of $1.94 million. Each common share purchase warrant was exercisable for one whole common share of the Company, for a period of two years at an exercise price of $0.15. The warrants were issued in connection with a non-brokered private placement announced on March 14, 2019. Maritime currently has 7.9 million common share purchase warrants outstanding.
"This infusion of cash further strengthens Maritime's balance sheet, which following the close of Tembo Capital's private placement and the purchase of the Nugget Pond gold circuit announced earlier today brings the Company's current cash position to $11.5 million," commented Garett Macdonald, President and CEO of Maritime. "2021 will be a pivotal year for Maritime as we advance the Hammerdown Gold Project through feasibility and permitting while conducting an extensive exploration program across our key projects in Newfoundland and Labrador," continued Mr. Macdonald.
Maritime would like to acknowledge the financial support provided through the Government of Newfoundland and Labrador's Junior Exploration Assistance Program for the Company's exploration program conducted at the Green Bay project during 2020.
About Maritime Resources Corp.
Maritime holds a 100% interest, directly and subject to option agreements entitling it to earn 100% ownership, in the Green Bay Property, including the former Hammerdown gold mine, and the Orion gold project plus the Whisker Valley exploration project, all located in the Baie Verte Mining District near the town of King's Point, Newfoundland and Labrador. The Hammerdown Gold Project is characterized by near-vertical, narrow mesothermal quartz veins containing gold associated with pyrite. Hammerdown was last operated by Richmont Mines between 2000-2004.
On Behalf of the Board:
Garett Macdonald, MBA, P.Eng.
President and CEO
For further information, please contact:
Tania Barreto, CPIR
Head of Investor Relations
1900-110 Yonge Street, Toronto, ON M5C 1T4
416-365-5323
www.maritimeresourcescorp.com
Twitter
Facebook
LinkedIn
YouTube
Caution Regarding Forward Looking Statements:
Certain of the statements made and information contained herein is "forward-looking information" within the meaning of National Instrument 51-102 – Continuous Disclosure Obligations. Forward-looking statements are often identified by terms such as "will", "may", "should", "anticipate", "expects", "intends", "indicates" "plans" and similar expressions. Forward-looking statements include statements concerning the potential to increase mineral resource and mineral reserve estimates, the Company's decision to restart the Project, the Company's plans regarding depth extension of the deposit at Hammerdown, the Company's plans regarding completing additional infill and grade control testing within the PEA mine plan, the Company's plans regarding drilling targets previously identified, the anticipated timing of provincial environmental assessment approval for Hammerdown, the Company's plans related to the Nugget Pond gold circuit, including receipt of certain approvals related to those activities, and the Company's decision to acquire new mineral property interests and assets and other business opportunities, amongst other things, which involve known and unknown risks, uncertainties and other factors which may cause the actual results, performance or achievements of the Company, or industry results, to be materially different from any future results, performance or achievements expressed or implied by such forward-looking information. All forward-looking statements and forward-looking information are based on reasonable assumptions that have been made by the Company in good faith as at the date of such information. Such assumptions include, without limitation, the price of and anticipated costs of recovery of, base metal concentrates, gold and silver, the presence of and continuity of such minerals at modeled grades and values, the capacities of various machinery and equipment, the use of ore sorting technology will produce positive results, the availability of personnel, machinery and equipment at estimated prices, mineral recovery rates, and others. Forward-looking information is subject to a variety of risks and uncertainties which could cause actual events or results to differ from those reflected in the forward-looking information, including, without limitation, the ability of the Company to continue to be able to access the capital markets for the funding necessary to acquire, maintain and advance exploration properties or business opportunities; global financial conditions, including market reaction to the coronavirus outbreak; competition within the industry to acquire properties of merit or new business opportunities, and competition from other companies possessing greater technical and financial resources; difficulties in advancing towards a development decision at Hammerdown and executing exploration programs at its Newfoundland and Labrador properties on the Company's proposed schedules and within its cost estimates, whether due to weather conditions, availability or interruption of power supply, mechanical equipment performance problems, natural disasters or pandemics in the areas where it operates; increasingly stringent environmental regulations and other permitting restrictions or maintaining title or other factors related to exploring of its properties, such as the availability of essential supplies and services; factors beyond the capacity of the Company to anticipate and control, such as the marketability of mineral products produced from the Company's properties; uncertainty as to whether the acquisition of assets and new mineral property interests will be completed in the manner currently contemplated by the parties; uncertainty as to whether mineral resources will ever be converted into mineral reserves once economic considerations are applied; uncertainty as to whether inferred mineral resources will be converted to the measured and indicated categories through further drilling, or into mineral reserves, once economic considerations are applied; government regulations relating to health, safety and the environment, and the scale and scope of royalties and taxes on production; and the availability of experienced contractors and professional staff to perform work in a competitive environment and the resulting adverse impact on costs and performance and other risks and uncertainties, including those described in each MD&A of financial condition and results of operations. In addition, forward-looking information is based on various assumptions including, without limitation, assumptions associated with exploration results and costs and the availability of materials and skilled labour. Should one or more of these risks and uncertainties materialize, or should underlying assumptions prove incorrect, actual results may vary materially from those described in forward-looking statements. Accordingly, readers are advised not to place undue reliance on forward-looking information. Except as required under applicable securities legislation, Maritime undertakes no obligation to publicly update or revise forward-looking information, whether as a result of new information, future events or otherwise.
Neither TSX Venture Exchange ("TSX-V") nor its Regulation Services Provider (as that term is defined in the policies of the TSX-V) accepts responsibility for the adequacy or accuracy of this release.

To view the source version of this press release, please visit https://www.newsfilecorp.com/release/80326
When you buy a stock there is always a possibility that it could drop 100%. But on the bright side, you can make far more than 100% on a really good stock. One great example is Hargreaves Services Plc (LON:HSP) which saw its share price drive 102% higher over five years. Also pleasing for shareholders was the 15% gain in the last three months.
Check out our latest analysis for Hargreaves Services
While markets are a powerful pricing mechanism, share prices reflect investor sentiment, not just underlying business performance. By comparing earnings per share (EPS) and share price changes over time, we can get a feel for how investor attitudes to a company have morphed over time.
Hargreaves Services' earnings per share are down 33% per year, despite strong share price performance over five years.
Essentially, it doesn't seem likely that investors are focused on EPS. Because earnings per share don't seem to match up with the share price, we'll take a look at other metrics instead.
The modest 1.7% dividend yield is unlikely to be propping up the share price. The revenue reduction of 13% per year is not a positive. So it seems one might have to take closer look at earnings and revenue trends to see how they might influence the share price.
The image below shows how earnings and revenue have tracked over time (if you click on the image you can see greater detail).

We consider it positive that insiders have made significant purchases in the last year. Having said that, most people consider earnings and revenue growth trends to be a more meaningful guide to the business. This free report showing analyst forecasts should help you form a view on Hargreaves Services
What About Dividends?
As well as measuring the share price return, investors should also consider the total shareholder return (TSR). Whereas the share price return only reflects the change in the share price, the TSR includes the value of dividends (assuming they were reinvested) and the benefit of any discounted capital raising or spin-off. Arguably, the TSR gives a more comprehensive picture of the return generated by a stock. As it happens, Hargreaves Services' TSR for the last 5 years was 124%, which exceeds the share price return mentioned earlier. And there's no prize for guessing that the dividend payments largely explain the divergence!
A Different Perspective
It's good to see that Hargreaves Services has rewarded shareholders with a total shareholder return of 55% in the last twelve months. And that does include the dividend. Since the one-year TSR is better than the five-year TSR (the latter coming in at 18% per year), it would seem that the stock's performance has improved in recent times. In the best case scenario, this may hint at some real business momentum, implying that now could be a great time to delve deeper. While it is well worth considering the different impacts that market conditions can have on the share price, there are other factors that are even more important. To that end, you should be aware of the 2 warning signs we've spotted with Hargreaves Services .
Hargreaves Services is not the only stock insiders are buying. So take a peek at this free list of growing companies with insider buying.
Please note, the market returns quoted in this article reflect the market weighted average returns of stocks that currently trade on GB exchanges.
This article by Simply Wall St is general in nature. It does not constitute a recommendation to buy or sell any stock, and does not take account of your objectives, or your financial situation. We aim to bring you long-term focused analysis driven by fundamental data. Note that our analysis may not factor in the latest price-sensitive company announcements or qualitative material. Simply Wall St has no position in any stocks mentioned.
Have feedback on this article? Concerned about the content? Get in touch with us directly. Alternatively, email editorial-team (at) simplywallst.com.
If you would like to receive our free newsletter via email, simply enter your email address below & click subscribe.
 Follow us on Twitter
 Become our facebook fan
CONNECT WITH US
Tweets
Tweet with hash tag #miningfeeds or @miningfeeds and your tweets will be displayed across this site.
MOST ACTIVE MINING STOCKS
Daily Gainers
 CMC Metals Ltd. CMC Metals Ltd. |
CMB.V | +900.00% |
 Eden Energy Ltd Eden Energy Ltd |
EDE.AX | +200.00% |
| GoviEx Uranium Inc. |
GXU.V | +42.86% |
| Eagle Nickel Ltd. |
ENL.AX | +41.67% |
| Citigold Corp. Limited |
CTO.AX | +33.33% |
| Mount Burgess Mining NL |
MTB.AX | +33.33% |
| Exalt Resources Limited |
ERD.AX | +31.94% |
| Casa Minerals Inc. |
CASA.V | +30.00% |
| Cariboo Rose Resources Ltd |
CRB.V | +28.57% |
| Belmont Resources Inc. |
BEA.V | +28.57% |


