There's no doubt that money can be made by owning shares of unprofitable businesses. For example, biotech and mining exploration companies often lose money for years before finding success with a new treatment or mineral discovery. But while history lauds those rare successes, those that fail are often forgotten; who remembers Pets.com?
So should Native Mineral Resources Holdings (ASX:NMR) shareholders be worried about its cash burn? In this report, we will consider the company's annual negative free cash flow, henceforth referring to it as the 'cash burn'. First, we'll determine its cash runway by comparing its cash burn with its cash reserves.
Check out our latest analysis for Native Mineral Resources Holdings
Does Native Mineral Resources Holdings Have A Long Cash Runway?
A company's cash runway is calculated by dividing its cash hoard by its cash burn. As at December 2020, Native Mineral Resources Holdings had cash of AU$3.3m and no debt. Importantly, its cash burn was AU$1.9m over the trailing twelve months. Therefore, from December 2020 it had roughly 22 months of cash runway. While that cash runway isn't too concerning, sensible holders would be peering into the distance, and considering what happens if the company runs out of cash. Depicted below, you can see how its cash holdings have changed over time.

How Is Native Mineral Resources Holdings' Cash Burn Changing Over Time?
Because Native Mineral Resources Holdings isn't currently generating revenue, we consider it an early-stage business. Nonetheless, we can still examine its cash burn trajectory as part of our assessment of its cash burn situation. Remarkably, it actually increased its cash burn by 289% in the last year. Given that sharp increase in spending, the company's cash runway will shrink rapidly as it depletes its cash reserves. Native Mineral Resources Holdings makes us a little nervous due to its lack of substantial operating revenue. So we'd generally prefer stocks from this list of stocks that have analysts forecasting growth.
How Hard Would It Be For Native Mineral Resources Holdings To Raise More Cash For Growth?
While Native Mineral Resources Holdings does have a solid cash runway, its cash burn trajectory may have some shareholders thinking ahead to when the company may need to raise more cash. Companies can raise capital through either debt or equity. Many companies end up issuing new shares to fund future growth. By looking at a company's cash burn relative to its market capitalisation, we gain insight on how much shareholders would be diluted if the company needed to raise enough cash to cover another year's cash burn.
Since it has a market capitalisation of AU$27m, Native Mineral Resources Holdings' AU$1.9m in cash burn equates to about 6.8% of its market value. That's a low proportion, so we figure the company would be able to raise more cash to fund growth, with a little dilution, or even to simply borrow some money.
Is Native Mineral Resources Holdings' Cash Burn A Worry?
On this analysis of Native Mineral Resources Holdings' cash burn, we think its cash burn relative to its market cap was reassuring, while its increasing cash burn has us a bit worried. Cash burning companies are always on the riskier side of things, but after considering all of the factors discussed in this short piece, we're not too worried about its rate of cash burn. Its important for readers to be cognizant of the risks that can affect the company's operations, and we've picked out 2 warning signs for Native Mineral Resources Holdings that investors should know when investing in the stock.
Of course, you might find a fantastic investment by looking elsewhere. So take a peek at this free list of companies insiders are buying, and this list of stocks growth stocks (according to analyst forecasts)
This article by Simply Wall St is general in nature. It does not constitute a recommendation to buy or sell any stock, and does not take account of your objectives, or your financial situation. We aim to bring you long-term focused analysis driven by fundamental data. Note that our analysis may not factor in the latest price-sensitive company announcements or qualitative material. Simply Wall St has no position in any stocks mentioned.
Have feedback on this article? Concerned about the content? Get in touch with us directly. Alternatively, email editorial-team (at) simplywallst.com.
If you're looking for a multi-bagger, there's a few things to keep an eye out for. One common approach is to try and find a company with returns on capital employed (ROCE) that are increasing, in conjunction with a growing amount of capital employed. Ultimately, this demonstrates that it's a business that is reinvesting profits at increasing rates of return. And in light of that, the trends we're seeing at Zimplats Holdings' (ASX:ZIM) look very promising so lets take a look.
Return On Capital Employed (ROCE): What is it?
For those who don't know, ROCE is a measure of a company's yearly pre-tax profit (its return), relative to the capital employed in the business. The formula for this calculation on Zimplats Holdings is:
Return on Capital Employed = Earnings Before Interest and Tax (EBIT) ÷ (Total Assets – Current Liabilities)
0.35 = US$619m ÷ (US$2.0b – US$199m) (Based on the trailing twelve months to December 2020).
Thus, Zimplats Holdings has an ROCE of 35%. In absolute terms that's a great return and it's even better than the Metals and Mining industry average of 11%.
View our latest analysis for Zimplats Holdings

While the past is not representative of the future, it can be helpful to know how a company has performed historically, which is why we have this chart above. If you want to delve into the historical earnings, revenue and cash flow of Zimplats Holdings, check out these free graphs here.
How Are Returns Trending?
Zimplats Holdings has recently broken into profitability so their prior investments seem to be paying off. About five years ago the company was generating losses but things have turned around because it's now earning 35% on its capital. Not only that, but the company is utilizing 50% more capital than before, but that's to be expected from a company trying to break into profitability. This can tell us that the company has plenty of reinvestment opportunities that are able to generate higher returns.
What We Can Learn From Zimplats Holdings' ROCE
In summary, it's great to see that Zimplats Holdings has managed to break into profitability and is continuing to reinvest in its business. Since the stock has returned a staggering 590% to shareholders over the last five years, it looks like investors are recognizing these changes. Therefore, we think it would be worth your time to check if these trends are going to continue.
Zimplats Holdings does have some risks though, and we've spotted 2 warning signs for Zimplats Holdings that you might be interested in.
If you'd like to see other companies earning high returns, check out our free list of companies earning high returns with solid balance sheets here.
This article by Simply Wall St is general in nature. It does not constitute a recommendation to buy or sell any stock, and does not take account of your objectives, or your financial situation. We aim to bring you long-term focused analysis driven by fundamental data. Note that our analysis may not factor in the latest price-sensitive company announcements or qualitative material. Simply Wall St has no position in any stocks mentioned.
Have feedback on this article? Concerned about the content? Get in touch with us directly. Alternatively, email editorial-team (at) simplywallst.com.
Toronto, Ontario–(Newsfile Corp. – March 8, 2021) – ATEX Resources Inc. (TSXV: ATX) ("ATEX") is pleased to announce the metallurgical test results from 13 bottle roll leach tests from the Valeriano Oxide Gold Deposit. Table 1 provides details from the metallurgical program.
Highlights from the metallurgical testing include:
-
average gold recoveries of 70.8%;
-
significant amounts of exposed gold at coarse sizes were visible; and
-
average NaCN consumption of 0.29 kg/t and average lime consumption of 7.0 kg/t (see "Discussion").
"The positive results from the preliminary metallurgical program represent a significant step forward towards the potential development of the Valeranio Oxide Gold Deposit by demonstrating that the oxide gold mineralization at Valeriano is amenable to heap leach processing", said Raymond Jannas, CEO of ATEX. "While the main goal of the ongoing 3,000 metre drill program is to expand the existing near surface oxide gold resource and convert a portion of inferred gold resource to the measured and indicated categories, the drill program will also provide addition samples for further detailed metallurgical test work with results available during the second half of 2021."
Table 1 – Metallurgical Test Results, Valeriano Oxide Gold Deposit
|
Composite Sample |
Crush Size |
Head Grade |
Gold Recovery |
NaCN Consumption |
Ca(OH)2 |
Sample Location |
|
(P80 – mm) |
(g/t Au) |
(%) |
(kg/t) |
(kg/t) |
(drill hole #) |
|
|
172488 |
2.68 |
0.695 |
77 |
0.30 |
1.04 |
VALDD12-009 |
|
172498 |
2.61 |
0.504 |
67 |
0.18 |
0.82 |
VALDD12-009 |
|
172499 |
2.58 |
0.600 |
78 |
0.20 |
2.77 |
VALDD12-009 |
|
172505 |
2.57 |
0.891 |
89 |
0.29 |
0.78 |
VALDD12-009 |
|
172528 |
2.79 |
0.727 |
69 |
0.39 |
0.71 |
VALDD12-009 |
|
173035 |
2.57 |
0.270 |
66 |
0.33 |
13.78 |
VALDD12-010 |
|
173036 |
2.80 |
0.540 |
76 |
0.47 |
25.74 |
VALDD12-010 |
|
173043 |
2.66 |
0.346 |
59 |
0.54 |
21.47 |
VALDD12-010 |
|
173048 |
2.80 |
0.328 |
63 |
0.45 |
6.31 |
VALDD12-010 |
|
173072 |
2.60 |
0.412 |
52 |
0.24 |
12.55 |
VALDD12-010 |
|
184069 |
2.27 |
0.550 |
75 |
0.19 |
2.13 |
VALDD12-011 |
|
184830 |
3.19 |
0.409 |
60 |
0.03 |
2.22 |
VALDD12-012 |
|
185536 |
2.77 |
0.200 |
87 |
0.18 |
1.16 |
VALDD13-013 |
Discussion
Ca(OH)2, (lime) consumption average 7.0 kilograms per tonne, however, this figure was impacted by elevated consumption associated with samples collected from drill hole VALDD012-010 which occurs adjacent to but outside the 0.275 g/t Au resource envelope. Removing the results from VALDD012-010 from the study decreases lime consumption to 1.45 kg/t while gold recoveries increase to 75.3%. Core from VALDD012-010 will be examined to determine the cause of the elevated lime consumption.
NaCN consumption averaged 0.29 kilograms per tonne. While bottle roll tests are not particularly useful in predicting actual NaCN consumption, the results are indicative of potential issues. No issues were noted during the test work.
While the samples were being prepared, Advanced Mineral Technology Laboratory Ltd. ("AMTEL") noted that significant amounts of exposed gold at coarse sizes were visible. Studies are being undertaken to characterize the nature of gold mineralization.
Summary of Metallurgical Test Protocols
Thirteen metallurgical test samples, varying from 4 to 6 kilograms, were collected from diamond drill core sample rejects from Hochschild Mining's 2012-2013 drill program. The availability of diamond drill holes which cut the Valeriano Gold Oxide deposit was limited. The samples were shipped to the AMTEL laboratory located in London, Canada. AMTEL was responsible for all aspects of the metallurgical test work.
Samples were crushed to a target size of P80 2 mm and split to 1,000 gram charges for testing. The bottle roll leach tests were performed at 60% solids : 40% liquids, under intensive leach conditions of 5 g/L NaCN for a period of 24 hours. The samples were split into representative aliquots for study and assay. Duplicate fire assays were performed on head samples, and single assays were performed on 'coarse', CIL and pulverized CN residues. Fire assay were checked by internal AMTEL QA-QC samples.
Valeriano Oxide Gold Resource Estimate
The Valeriano epithermal oxide gold deposit contains 0.585 million ounces of gold and 2.65 million ounces of silver for 0.623 million gold equivalent ounces in the inferred category hosted in 34.4 million tonnes at a grade of 0.528 grams per tonne ('g/t") gold and 2.4 g/t silver for a gold equivalent grade of 0.561 g/t at a 0.275 g/t gold cut-off grade.
The mineral resource is not confined by economic or mining parameters. Equivalent grades are calculated based upon a gold price of $1,800 per ounce and a silver price of $25.00 per ounce. The formula for the equivalent grade calculations are as follows: Aueq g/t =Augt + (Ag g/t*Agprice / Auprice). All prices are in US$.For further details on the Valeriano resource estimates, see ATEX's "NI 43-101 Technical Report Valeriano Project Inferred Resources Estimates" dated November 13, 2020 filed at www.sedar.com.
NI 43-101 Disclosure
David Hopper, a geological consultant and resident of El Arrayán, Santiago, Chile, is the qualified person ("QP"), as defined by National Instrument 43-101 Standards for Disclosure for Mineral Projects, for the Valeriano Project. Mr. Hopper is a Chartered Geologist of the Geological Society of London, Fellow No. 1030584. The Valeriano Project resource estimates were undertaken by SRK Consulting (Chile) SpA. Joled Nur, Civil Mining Engineer, SRK Consulting (Chile) SpA, a member of the Public Register of Competent Persons in Mining Resources and Reserves of Chile, No. 181, was the independent QP who prepared the resource estimates.
About ATEX Resources Inc.
ATEX is a mineral exploration company focused on the acquisition, development and monetization of projects throughout the Americas. ATEX's flagship Valeriano Project is located in Chile's prolific El Indio Mineral Belt.
On behalf of ATEX Resources Inc.
Dr. Raymond Jannas, CEO
For additional information, please email rjannas@atexresources.com or call 1-647-287-3778
CAUTIONARY NOTE REGARDING FORWARD-LOOKING STATEMENTS:
This news release contains forward-looking statements, including predictions, projections and forecasts. Forward-looking statements include, but are not limited to: plans for the evaluation of the Valeriano property; the success of evaluation plans; the success of exploration activities; mine development prospects; and, potential for future metals production. Often, but not always, forward-looking statements can be identified by the use of words such as "plans", "planning", "expects" or "does not expect", "continues", "scheduled", "estimates", "forecasts", "intends", "potential", "anticipates", "does not anticipate", or describes a "goal", or variation of such words and phrases or state that certain actions, events or results "may", "could", "would", "might" or "will" be taken, occur or be achieved.
Forward-looking statements involve known and unknown risks, future events, conditions, uncertainties and other factors which may cause the actual results, performance or achievements to be materially different from any future results, prediction, projection, forecast, performance or achievements expressed or implied by the forward-looking statements. Such factors include, among others, changes in economic parameters and assumptions, the interpretation and actual results of current exploration activities; changes in project parameters as plans continue to be refined; the conversion of inferred resources to the measured and indicated category; the timing of metallurgical test results; the results of regulatory and permitting processes; future metals price; possible variations in grade or recovery rates; failure of equipment or processes to operate as anticipated; labour disputes and other risks of the mining industry; the results of economic and technical studies, delays in obtaining governmental approvals or financing or in the completion of exploration, as well as those factors disclosed in ATEX's publicly filed documents.
Although ATEX has attempted to identify important factors that could cause actual actions, events or results to differ materially from those described in forward-looking statements, there may be other factors that cause actions, events or results not to be as anticipated, estimated or intended. There can be no assurance that forward-looking statements will prove to be accurate, as actual results and future events could differ materially from those anticipated in such statements. Accordingly, readers should not place undue reliance on forward-looking statements.
Neither TSX Venture Exchange nor its Regulation Services Provider (as that term is defined in the policies of the TSX Venture Exchange) accepts responsibility for the adequacy or accuracy of this press release.

To view the source version of this press release, please visit https://www.newsfilecorp.com/release/76470
VANCOUVER, BC, March 8, 2021 /CNW/ – The following issues have been halted by IIROC:
Company: Sonora Gold & Silver Corp.
TSX-Venture Symbol: SOC
All Issues: No
Reason: At the Request of the Company Pending News
Halt Time (ET): 10:53 AM
IIROC can make a decision to impose a temporary suspension (halt) of trading in a security of a publicly-listed company. Trading halts are implemented to ensure a fair and orderly market. IIROC is the national self-regulatory organization which oversees all investment dealers and trading activity on debt and equity marketplaces in Canada.
SOURCE Investment Industry Regulatory Organization of Canada (IIROC) – Halts/Resumptions


View original content: http://www.newswire.ca/en/releases/archive/March2021/08/c3093.html
Venturex Resources Limited (ASX:VXR) is possibly approaching a major achievement in its business, so we would like to shine some light on the company. Venturex Resources Limited, together with its subsidiaries, engages in the exploration and development of mineral resources in Australia. The AU$141m market-cap company announced a latest loss of AU$3.9m on 30 June 2020 for its most recent financial year result. As path to profitability is the topic on Venturex Resources' investors mind, we've decided to gauge market sentiment. In this article, we will touch on the expectations for the company's growth and when analysts expect it to become profitable.
Check out our latest analysis for Venturex Resources
Expectations from some of the Australian Metals and Mining analysts is that Venturex Resources is on the verge of breakeven. They anticipate the company to incur a final loss in 2022, before generating positive profits of AU$19m in 2023. The company is therefore projected to breakeven around 2 years from today. What rate will the company have to grow year-on-year in order to breakeven on this date? Using a line of best fit, we calculated an average annual growth rate of 110%, which is rather optimistic! Should the business grow at a slower rate, it will become profitable at a later date than expected.

Underlying developments driving Venturex Resources' growth isn’t the focus of this broad overview, though, keep in mind that generally metals and mining companies, depending on the stage of operation and metals mined, have irregular periods of cash flow. This means, large upcoming growth rates are not abnormal as the company is beginning to reap the benefits of earlier investments.
One thing we’d like to point out is that The company has managed its capital judiciously, with debt making up 9.2% of equity. This means that it has predominantly funded its operations from equity capital, and its low debt obligation reduces the risk around investing in the loss-making company.
Next Steps:
This article is not intended to be a comprehensive analysis on Venturex Resources, so if you are interested in understanding the company at a deeper level, take a look at Venturex Resources' company page on Simply Wall St. We've also put together a list of important aspects you should further research:
-
Historical Track Record: What has Venturex Resources' performance been like over the past? Go into more detail in the past track record analysis and take a look at the free visual representations of our analysis for more clarity.
-
Management Team: An experienced management team on the helm increases our confidence in the business – take a look at who sits on Venturex Resources' board and the CEO’s background.
-
Other High-Performing Stocks: Are there other stocks that provide better prospects with proven track records? Explore our free list of these great stocks here.
This article by Simply Wall St is general in nature. It does not constitute a recommendation to buy or sell any stock, and does not take account of your objectives, or your financial situation. We aim to bring you long-term focused analysis driven by fundamental data. Note that our analysis may not factor in the latest price-sensitive company announcements or qualitative material. Simply Wall St has no position in any stocks mentioned.
Have feedback on this article? Concerned about the content? Get in touch with us directly. Alternatively, email editorial-team (at) simplywallst.com.
With its stock down 16% over the past three months, it is easy to disregard Red River Resources (ASX:RVR). However, a closer look at its sound financials might cause you to think again. Given that fundamentals usually drive long-term market outcomes, the company is worth looking at. Specifically, we decided to study Red River Resources' ROE in this article.
Return on equity or ROE is a key measure used to assess how efficiently a company's management is utilizing the company's capital. Simply put, it is used to assess the profitability of a company in relation to its equity capital.
Check out our latest analysis for Red River Resources
How To Calculate Return On Equity?
The formula for ROE is:
Return on Equity = Net Profit (from continuing operations) ÷ Shareholders' Equity
So, based on the above formula, the ROE for Red River Resources is:
14% = AU$9.4m ÷ AU$65m (Based on the trailing twelve months to December 2020).
The 'return' is the profit over the last twelve months. That means that for every A$1 worth of shareholders' equity, the company generated A$0.14 in profit.
What Has ROE Got To Do With Earnings Growth?
So far, we've learned that ROE is a measure of a company's profitability. We now need to evaluate how much profit the company reinvests or "retains" for future growth which then gives us an idea about the growth potential of the company. Generally speaking, other things being equal, firms with a high return on equity and profit retention, have a higher growth rate than firms that don’t share these attributes.
Red River Resources' Earnings Growth And 14% ROE
To start with, Red River Resources' ROE looks acceptable. Further, the company's ROE is similar to the industry average of 13%. This probably goes some way in explaining Red River Resources' moderate 19% growth over the past five years amongst other factors.
As a next step, we compared Red River Resources' net income growth with the industry and were disappointed to see that the company's growth is lower than the industry average growth of 33% in the same period.

Earnings growth is an important metric to consider when valuing a stock. What investors need to determine next is if the expected earnings growth, or the lack of it, is already built into the share price. By doing so, they will have an idea if the stock is headed into clear blue waters or if swampy waters await. One good indicator of expected earnings growth is the P/E ratio which determines the price the market is willing to pay for a stock based on its earnings prospects. So, you may want to check if Red River Resources is trading on a high P/E or a low P/E, relative to its industry.
Is Red River Resources Efficiently Re-investing Its Profits?
Summary
On the whole, we feel that Red River Resources' performance has been quite good. In particular, it's great to see that the company is investing heavily into its business and along with a high rate of return, that has resulted in a respectable growth in its earnings. That being so, the latest analyst forecasts show that the company will continue to see an expansion in its earnings. To know more about the company's future earnings growth forecasts take a look at this free report on analyst forecasts for the company to find out more.
This article by Simply Wall St is general in nature. It does not constitute a recommendation to buy or sell any stock, and does not take account of your objectives, or your financial situation. We aim to bring you long-term focused analysis driven by fundamental data. Note that our analysis may not factor in the latest price-sensitive company announcements or qualitative material. Simply Wall St has no position in any stocks mentioned.
Have feedback on this article? Concerned about the content? Get in touch with us directly. Alternatively, email editorial-team (at) simplywallst.com.
Every investor in Hastings Technology Metals Limited (ASX:HAS) should be aware of the most powerful shareholder groups. Institutions will often hold stock in bigger companies, and we expect to see insiders owning a noticeable percentage of the smaller ones. Warren Buffett said that he likes "a business with enduring competitive advantages that is run by able and owner-oriented people." So it's nice to see some insider ownership, because it may suggest that management is owner-oriented.
Hastings Technology Metals is not a large company by global standards. It has a market capitalization of AU$279m, which means it wouldn't have the attention of many institutional investors. Our analysis of the ownership of the company, below, shows that institutions don't own many shares in the company. We can zoom in on the different ownership groups, to learn more about Hastings Technology Metals.
View our latest analysis for Hastings Technology Metals

What Does The Institutional Ownership Tell Us About Hastings Technology Metals?
Institutional investors commonly compare their own returns to the returns of a commonly followed index. So they generally do consider buying larger companies that are included in the relevant benchmark index.
Institutions have a very small stake in Hastings Technology Metals. That indicates that the company is on the radar of some funds, but it isn't particularly popular with professional investors at the moment. So if the company itself can improve over time, we may well see more institutional buyers in the future. When multiple institutional investors want to buy shares, we often see a rising share price. The past revenue trajectory (shown below) can be an indication of future growth, but there are no guarantees.

Hastings Technology Metals is not owned by hedge funds. From our data, we infer that the largest shareholder is Foon Lew (who also holds the title of Top Key Executive) with 10% of shares outstanding. Its usually considered a good sign when insiders own a significant number of shares in the company, and in this case, we're glad to see a company insider play the role of a key stakeholder. Meanwhile, the second and third largest shareholders, hold 6.6% and 3.2%, of the shares outstanding, respectively.
A deeper look at our ownership data shows that the top 16 shareholders collectively hold less than half of the register, suggesting a large group of small holders where no single shareholder has a majority.
While studying institutional ownership for a company can add value to your research, it is also a good practice to research analyst recommendations to get a deeper understand of a stock's expected performance. There is a little analyst coverage of the stock, but not much. So there is room for it to gain more coverage.
Insider Ownership Of Hastings Technology Metals
The definition of an insider can differ slightly between different countries, but members of the board of directors always count. Management ultimately answers to the board. However, it is not uncommon for managers to be executive board members, especially if they are a founder or the CEO.
Insider ownership is positive when it signals leadership are thinking like the true owners of the company. However, high insider ownership can also give immense power to a small group within the company. This can be negative in some circumstances.
Our most recent data indicates that insiders own a reasonable proportion of Hastings Technology Metals Limited. It has a market capitalization of just AU$279m, and insiders have AU$50m worth of shares in their own names. It is great to see insiders so invested in the business. It might be worth checking if those insiders have been buying recently.
General Public Ownership
The general public, mostly retail investors, hold a substantial 58% stake in Hastings Technology Metals, suggesting it is a fairly popular stock. This level of ownership gives retail investors the power to sway key policy decisions such as board composition, executive compensation, and the dividend payout ratio.
Next Steps:
While it is well worth considering the different groups that own a company, there are other factors that are even more important. Take risks for example – Hastings Technology Metals has 3 warning signs (and 1 which is a bit concerning) we think you should know about.
If you are like me, you may want to think about whether this company will grow or shrink. Luckily, you can check this free report showing analyst forecasts for its future.
NB: Figures in this article are calculated using data from the last twelve months, which refer to the 12-month period ending on the last date of the month the financial statement is dated. This may not be consistent with full year annual report figures.
This article by Simply Wall St is general in nature. It does not constitute a recommendation to buy or sell any stock, and does not take account of your objectives, or your financial situation. We aim to bring you long-term focused analysis driven by fundamental data. Note that our analysis may not factor in the latest price-sensitive company announcements or qualitative material. Simply Wall St has no position in any stocks mentioned.
Have feedback on this article? Concerned about the content? Get in touch with us directly. Alternatively, email editorial-team (at) simplywallst.com.
VANCOUVER, BC, March 5, 2021 /CNW/ – Callinex Mines Inc. (the "Company" or "Callinex") (TSXV: CNX) (OTC: CLLXF) announces that it has granted 160,000 stock options to its directors, officers and consultants. The options are exercisable at $5.00 per share, subject to certain vesting requirements and expire five years from the date of grant.

About Callinex Mines Inc.
Callinex Mines Inc. (TSXV: CNX) (OTC: CLLXF) is advancing its portfolio of base and precious metals rich deposits located in established Canadian mining jurisdictions. The portfolio is highlighted by its Nash Creek and Superjack deposits in the Bathurst Mining District of New Brunswick. A 2018 PEA outlined a mine plan that generates a strong economic return with a pre-tax IRR of 34.1% (25.2% post-tax) and NPV8% of $230 million ($128 million post-tax). The projects have significant exploration upside over a district-scale land package that encompasses several high-grade mineral occurrences along a 20km trend. Click here to view a video overview of the Nash Creek Project.
Callinex has a project portfolio that also includes projects within the Flin Flon Mining District of Manitoba that are located 25km to an operating processing facility that requires additional ore.
Neither the TSX Venture Exchange nor its Regulation Services Provider (as that term is defined in the policies of the TSX Venture Exchange) accepts responsibility for the adequacy or accuracy of this release.
Some statements in this news release contain forward-looking information. These statements include, but are not limited to, statements with respect to future expenditures. These statements address future events and conditions and, as such, involve known and unknown risks, uncertainties and other factors which may cause the actual results, performance or achievements to be materially different from any future results, performance or achievements expressed or implied by the statements. Such factors include, among others, the ability to complete the proposed drill program and the timing and amount of expenditures. Except as required under applicable securities laws, Callinex does not assume the obligation to update any forward-looking statement.

View original content to download multimedia:http://www.prnewswire.com/news-releases/callinex-grants-stock-options-301241193.html
SOURCE Callinex Mines Inc.


View original content to download multimedia: http://www.newswire.ca/en/releases/archive/March2021/05/c1616.html
Toronto, Ontario–(Newsfile Corp. – March 4, 2021) – Monarca Minerals, Inc. (TSXV: MMN) ("Monarca" or the "Company") is pleased to announce that it continues to advance the permitting process for its upcoming drilling program on the San Jose Silver Project ("San Jose") located near the USA border in Chihuahua, Mexico.
Surface lands for the San Jose project area are partially covered by "Ejido" lands and "Colonia" lands (community or communal lands), therefore the Company is required to sign a surface rights agreement with both the Ejido and Colonia authorities to advance its environmental permit to proceed with its planned drilling program.
On February 21, 2021, Colonia elected its new authorities and plans to sign an agreement with Monarca Mining (Mexican subsidiary of Monarca Minerals) to change the use of land and temporary occupation allowing the Company to complete its drilling program at San Jose.
An environmental assessment report for the planned drilling area, which is a requirement to obtain a drilling permit, has been completed and will be submitted to the Mexican authorities as soon as a surface rights agreement with Colonia has been signed and ratified by a Mexican Public Notary. The Company expects this agreement to be signed by next week.
The Company has also received three drilling contractor proposals for the San Jose drilling program and will be making a final decision on a drilling contract soon. The initial drilling program at San Jose includes ten targets and approximately 5,000 metres of drilling. Eight targets are located on Colonia lands and two targets on Ejido lands. Prospecting and field mapping has already been completed.
Two drill holes (SJ1 and SJ2) are planned in the area of the Guadalupana mine at the southern end of the geophysical survey area (refer to the Company's December 15, 2020 news release). These drilling targets are located over strong IP anomalies, adjacent to the southeast margin of a large magnetic anomaly, which is interpreted as a buried mineralized intrusive body. Drill hole SJ1 is designed to intercept the Guadalupana vein, which historically has returned high precious and base metal grades and is interpreted from the IP survey as "leakage" from a larger area of buried mineralization (refer to geophysical cross section and sampling photo below).
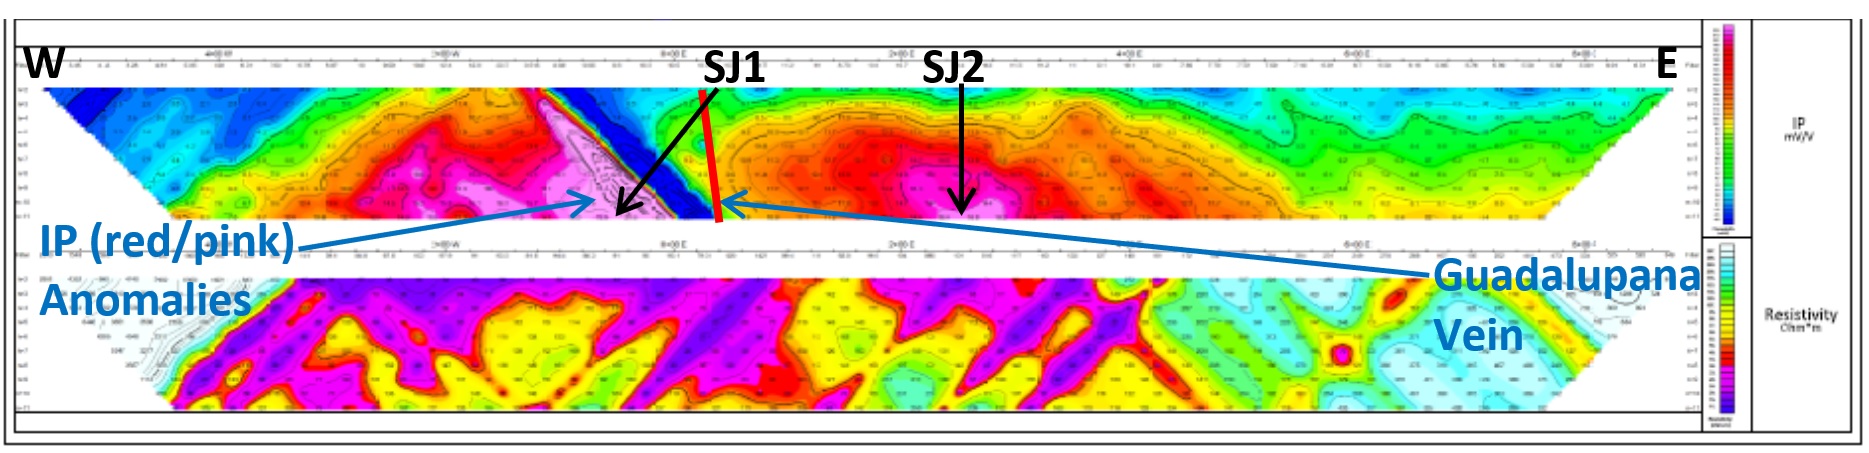
GEOPHYSICAL CROSS SECTION LOOKING NORTH – DRILL HOLES SJ1 AND SJ2 TARGETING IP ANOMALIES
To view an enhanced version of this graphic, please visit:
https://orders.newsfilecorp.com/files/2584/76043_fig1.jpg

SAMPLING PHOTO – GUADALUPANA MINE CHANNEL SAMPLE: SJ0007
To view an enhanced version of this graphic, please visit:
https://orders.newsfilecorp.com/files/2584/76043_fig2.jpg
Quality Assurance and Quality Control Statement
Procedures have been implemented by Monarca to assure Quality Assurance Quality Control (QAQC) of all assaying completed at ALS Global, which is an ISO Accredited laboratory and independent of Monarca. All grab samples taken in the field were placed in plastic bags closed with zip ties and stored in a secure location until shipment by Monarca personnel to the ALS sample preparation facility in Chihuahua, Mexico. A sterile blank sample (unmineralized rhyolite) and a mineralized reference standard (used by Monarca since 2009) were alternately placed in the sample sequence every 15th sample. The assays received for the QAQC samples were reviewed for acceptable values by Monarca's Qualified Person, who determined in all cases that results were satisfactory, resulting in a high level of confidence in the assays reported for the San Jose Project. The sterile (blank) QAQC samples all reported low or nil values for the metals of interest. The mineralized reference standard samples all reported gold assays within 2 standard deviations of the accepted value (1.15ppm) and the silver assays reported within 3 standard deviations of the accepted value (83.9ppm).
Qualified Person Statement
Michael R. Smith is the Qualified Person (QP) who has prepared and approved the scientific and technical information disclosed in this news release. Mr. Smith is a Registered Member (#04167376 – Geology) of the Society for Mining, Metallurgy & Exploration (SME) and the Executive Vice President, Exploration for Monarca Minerals Inc.
About Monarca Minerals Inc.
Monarca is a Canadian mining company listed on the TSX Venture Exchange (TSXV: MMN) and focused on the exploration and development of silver projects along a highly productive mineralized belt in Mexico. The Company has a portfolio of silver projects including an Inferred Mineral Resource of 19.8 million tonnes at 45.0 g/t Ag (28.7 million ounces of contained silver) at its Tejamen deposit in Durango, Mexico.
For further information, please contact:
Carlos Espinosa
President, CEO & Director
Monarca Minerals Inc.
E: cespinosa@slgmexico.com
Cautionary Note Regarding Forward-Looking Statements Forward-Looking Statements:
The above contains forward-looking statements that are subject to a number of known and unknown risks, uncertainties and other factors that may cause actual results to differ materially from those anticipated in our forward-looking statements. Factors that could cause such differences include: changes in world commodity markets, equity markets, costs and supply of materials relevant to the mining industry, change in government and changes to regulations affecting the mining industry. Forward-looking statements in this release include statements regarding future exploration programs, operation plans, geological interpretations, mineral tenure issues and mineral recovery processes. Although we believe the expectations reflected in our forward-looking statements are reasonable, results may vary, and we cannot guarantee future results, levels of activity, performance or achievements.
Neither the TSX Venture Exchange nor its Regulation Service Provider (as that term is defined in the policies of the TSX Venture Exchange) accepts responsibility for the adequacy or accuracy of this release.
/NOT FOR DISTRIBUTION TO UNITED STATES WIRE SERVICES OR DISSEMINATION IN THE UNITED STATES/

To view the source version of this press release, please visit https://www.newsfilecorp.com/release/76043
NOT FOR DISTRIBUTION TO U.S. NEWS WIRE SERVICES OR DISSEMINATION IN THE UNITED STATES
VANCOUVER British Columbia, March 03, 2021 (GLOBE NEWSWIRE) — AZINCOURT ENERGY CORP. (“Azincourt” or the “Company”) (TSX.V: AAZ), is pleased to announce that it has completed the final tranche of its non-brokered private placement and has issued 65,080,000 non-flow-through units (each, an “NFT Unit”) at a price of $0.05 per NFT Unit for gross proceeds of $3,254,000. The gross proceeds to the Company of both Tranche 1 and Tranche 2 totaled $4,241,500. A single institutional investor accounted for $1,850,000 (37,000,000 units) of the final tranche. In addition, the Company has issued 2,000,000 flow-through units (each, a “FT Unit”) at a price of $0.05 per FT Unit for an additional $100,000.
Each NFT Unit and FT Unit consists of one common share of the Company and one common share purchase warrant (each, a “Warrant”). Each warrant entitles the holder to acquire an additional common share at a price of $0.07 until March 3, 2026.
The proceeds from the private placement will be applied to the Company's exploration projects, and for general working capital purposes. The gross proceeds from the FT Units will be used to finance Canadian exploration expenses (within the meaning of the Income Tax Act (Canada)) which shall qualify as flow-through mining expenditures, for the purposes of the Income Tax Act (Canada). It is anticipated that expenditures will largely be focused on continuation of the Company's continuing diamond drilling program at the East Preston uranium project, located in the western Athabasca basin, Saskatchewan, Canada.
All securities issued in connection with the private placement are subject to a statutory hold period in accordance with applicable securities laws until July 4, 2021. In connection with completion of the final tranche of the private placement, the Company has paid $80,800 and issued 4,796,000 Warrants and 3,180,000 finder’s shares to certain arms-length third-parties who assisted in introducing subscribers to the Company.
About Azincourt Energy Corp.
Azincourt Energy is a Canadian-based resource company specializing in the strategic acquisition, exploration, and development of alternative energy/fuel projects, including uranium, lithium, and other critical clean energy elements. The Company is currently active at its joint venture East Preston uranium project in the Athabasca Basin, Saskatchewan, Canada, and the Escalera Group uranium-lithium project located on the Picotani Plateau in southeastern Peru.
ON BEHALF OF THE BOARD OF AZINCOURT ENERGY CORP.
“Alex Klenman”
Alex Klenman, President & CEO
Neither the TSX Venture Exchange nor its regulation services provider (as that term is defined in the policies of the TSX Venture Exchange) accepts responsibility for the adequacy or accuracy of this release.
This press release includes “forward-looking statements”, including forecasts, estimates, expectations and objectives for future operations that are subject to a number of assumptions, risks and uncertainties, many of which are beyond the control of Azincourt. Investors are cautioned that any such statements are not guarantees of future performance and that actual results or developments may differ materially from those projected in the forward-looking statements. Such forward-looking information represents management’s best judgment based on information currently available. No forward-looking statement can be guaranteed, and actual future results may vary materially.
For further information please contact:
Alex Klenman, President & CEO
Tel: 604-638-8063
info@azincourtenergy.com
Azincourt Energy Corp.
1430 – 800 West Pender Street
Vancouver, BC V6C 2V6
www.azincourtenergy.com
Does the March share price for Paladin Energy Limited (ASX:PDN) reflect what it's really worth? Today, we will estimate the stock's intrinsic value by taking the expected future cash flows and discounting them to their present value. Our analysis will employ the Discounted Cash Flow (DCF) model. Models like these may appear beyond the comprehension of a lay person, but they're fairly easy to follow.
We generally believe that a company's value is the present value of all of the cash it will generate in the future. However, a DCF is just one valuation metric among many, and it is not without flaws. Anyone interested in learning a bit more about intrinsic value should have a read of the Simply Wall St analysis model.
View our latest analysis for Paladin Energy
Crunching the numbers
We are going to use a two-stage DCF model, which, as the name states, takes into account two stages of growth. The first stage is generally a higher growth period which levels off heading towards the terminal value, captured in the second 'steady growth' period. To begin with, we have to get estimates of the next ten years of cash flows. Where possible we use analyst estimates, but when these aren't available we extrapolate the previous free cash flow (FCF) from the last estimate or reported value. We assume companies with shrinking free cash flow will slow their rate of shrinkage, and that companies with growing free cash flow will see their growth rate slow, over this period. We do this to reflect that growth tends to slow more in the early years than it does in later years.
Generally we assume that a dollar today is more valuable than a dollar in the future, so we need to discount the sum of these future cash flows to arrive at a present value estimate:
10-year free cash flow (FCF) forecast
|
2021 |
2022 |
2023 |
2024 |
2025 |
2026 |
2027 |
2028 |
2029 |
2030 |
|
|
Levered FCF ($, Millions) |
-US$34.0m |
-US$65.0m |
US$92.0m |
US$129.0m |
US$134.0m |
US$138.1m |
US$141.9m |
US$145.5m |
US$148.9m |
US$152.3m |
|
Growth Rate Estimate Source |
Analyst x1 |
Analyst x1 |
Analyst x1 |
Analyst x1 |
Analyst x1 |
Est @ 3.05% |
Est @ 2.74% |
Est @ 2.52% |
Est @ 2.37% |
Est @ 2.26% |
|
Present Value ($, Millions) Discounted @ 9.3% |
-US$31.1 |
-US$54.4 |
US$70.4 |
US$90.3 |
US$85.8 |
US$80.9 |
US$76.1 |
US$71.3 |
US$66.8 |
US$62.5 |
("Est" = FCF growth rate estimated by Simply Wall St)
Present Value of 10-year Cash Flow (PVCF) = US$518m
After calculating the present value of future cash flows in the initial 10-year period, we need to calculate the Terminal Value, which accounts for all future cash flows beyond the first stage. For a number of reasons a very conservative growth rate is used that cannot exceed that of a country's GDP growth. In this case we have used the 5-year average of the 10-year government bond yield (2.0%) to estimate future growth. In the same way as with the 10-year 'growth' period, we discount future cash flows to today's value, using a cost of equity of 9.3%.
Terminal Value (TV)= FCF2030 × (1 + g) ÷ (r – g) = US$152m× (1 + 2.0%) ÷ (9.3%– 2.0%) = US$2.1b
Present Value of Terminal Value (PVTV)= TV / (1 + r)10= US$2.1b÷ ( 1 + 9.3%)10= US$873m
The total value is the sum of cash flows for the next ten years plus the discounted terminal value, which results in the Total Equity Value, which in this case is US$1.4b. In the final step we divide the equity value by the number of shares outstanding. Relative to the current share price of AU$0.5, the company appears quite good value at a 47% discount to where the stock price trades currently. Valuations are imprecise instruments though, rather like a telescope – move a few degrees and end up in a different galaxy. Do keep this in mind.

The assumptions
Now the most important inputs to a discounted cash flow are the discount rate, and of course, the actual cash flows. Part of investing is coming up with your own evaluation of a company's future performance, so try the calculation yourself and check your own assumptions. The DCF also does not consider the possible cyclicality of an industry, or a company's future capital requirements, so it does not give a full picture of a company's potential performance. Given that we are looking at Paladin Energy as potential shareholders, the cost of equity is used as the discount rate, rather than the cost of capital (or weighted average cost of capital, WACC) which accounts for debt. In this calculation we've used 9.3%, which is based on a levered beta of 1.397. Beta is a measure of a stock's volatility, compared to the market as a whole. We get our beta from the industry average beta of globally comparable companies, with an imposed limit between 0.8 and 2.0, which is a reasonable range for a stable business.
Moving On:
Valuation is only one side of the coin in terms of building your investment thesis, and it shouldn't be the only metric you look at when researching a company. It's not possible to obtain a foolproof valuation with a DCF model. Rather it should be seen as a guide to "what assumptions need to be true for this stock to be under/overvalued?" For example, changes in the company's cost of equity or the risk free rate can significantly impact the valuation. Why is the intrinsic value higher than the current share price? For Paladin Energy, we've compiled three additional factors you should explore:
-
Risks: As an example, we've found 3 warning signs for Paladin Energy (2 shouldn't be ignored!) that you need to consider before investing here.
-
Future Earnings: How does PDN's growth rate compare to its peers and the wider market? Dig deeper into the analyst consensus number for the upcoming years by interacting with our free analyst growth expectation chart.
-
Other High Quality Alternatives: Do you like a good all-rounder? Explore our interactive list of high quality stocks to get an idea of what else is out there you may be missing!
PS. Simply Wall St updates its DCF calculation for every Australian stock every day, so if you want to find the intrinsic value of any other stock just search here.
This article by Simply Wall St is general in nature. It does not constitute a recommendation to buy or sell any stock, and does not take account of your objectives, or your financial situation. We aim to bring you long-term focused analysis driven by fundamental data. Note that our analysis may not factor in the latest price-sensitive company announcements or qualitative material. Simply Wall St has no position in any stocks mentioned.
Have feedback on this article? Concerned about the content? Get in touch with us directly. Alternatively, email editorial-team (at) simplywallst.com.
Toronto, Ontario–(Newsfile Corp. – February 26, 2021) – Xtierra Inc. (TSXV: XAG) ("Xtierra" or the "Company") is pleased to announce further positive and consistent drill results on another two drill holes of a five-hole program totaling 1800 meters into a previously identified structure (Victor vein) with high-grade silver mineralization located adjacent to and west of the main Bilbao Silver-Lead-Zinc deposit.
The objective of the third hole, X6B, was to test the continuity between the two best drill hole results from the 2010-2013 exploration work in which X26 intersected 6.0 meters of 847 Ag/t at 381 meters depth and X40-1 with 2.45 meters of 1623 Ag/t at 424 meters depth. Drill hole X6B was 459.05 meters in length with 97% core recovery and intersected six different levels of silver/base metal mineralization but exhibiting weaker mineralization southwest of X26, as follows:
|
Drill Hole |
From |
To |
Interval |
True Width (m) |
Ag g/t |
Pb% |
Zn% |
Cu% |
Pb + Zn% |
AgEq |
|
X6B |
227.35 |
228.50 |
1.15 |
1.148 |
108 |
0.31 |
0.08 |
0.03 |
0.39 |
120 |
|
282.00 |
284.00 |
2.00 |
1.97 |
16 |
0.41 |
0.15 |
0.13 |
0.56 |
42 |
|
|
285.25 |
286.35 |
1.10 |
1.09 |
10 |
0.49 |
0.08 |
0.01 |
0.57 |
25 |
|
|
289.00 |
291.55 |
2.55 |
2.52 |
11 |
0.79 |
0.69 |
0.01 |
1.48 |
52 |
|
|
391.25 |
392.30 |
1.05 |
18 |
0.02 |
0.11 |
0.00 |
0.13 |
22 |
||
|
393.45 |
394.30 |
0.85 |
32 |
0.03 |
0.21 |
0.00 |
0.24 |
39 |
The objective of the fourth hole, X7B was to test the continuity between X5B at the northern end of the Victor vein structure and X6B. Drill hole X7B with a total depth of 308.7 meters a core recovery of 93% also intersected Silver and Lead, Zinc, Copper mineralization at two levels of elevation, as follows:
|
Drill Hole |
From |
To |
Interval |
True Width (m) |
Ag g/t |
Pb% |
Zn% |
Cu% |
Pb + Zn% |
AgEq |
|
X7B |
139.20 |
140.05 |
0.85 |
0.76 |
56 |
0.05 |
0.09 |
0.01 |
0.14 |
60 |
|
265.85 |
278.85 |
13.00 |
9.37 |
61 |
5.50 |
4.41 |
0.08 |
9.91 |
336 |
|
|
including |
265.85 |
266.70 |
0.85 |
0.61 |
82 |
6.79 |
6.98 |
0.29 |
13.77 |
486 |
|
268.90 |
269.40 |
0.50 |
0.36 |
63 |
5.99 |
6.43 |
0.08 |
12.42 |
412 |
|
|
270.13 |
271.10 |
0.97 |
0.70 |
119 |
13.60 |
11.40 |
0.01 |
25.00 |
795 |
|
|
277.05 |
277.75 |
0.70 |
0.50 |
107 |
8.23 |
6.91 |
0.54 |
15.14 |
566 |
It is important to compare these drill results to the average grades of the resource estimate used in the preliminary economic assessment (PEA) of the main Bilbao deposit by Runge Pincock Minarco (Canada) Limited ("RPM") dated April 28, 2014. This independent Technical Report in accordance with NI 43-101 reported a resource estimate on the Bilbao Project with average grades of 2.1% zinc, 1.4% lead and 63.96 g/t silver, based on 3 year trailing average metal prices of: Zinc US$0.94/lb, Lead US$1.01/lb and Silver US$30.24/ounce. The mine plan incorporated in the PEA targeted the extraction of only the lower, unoxidized, sulphide zone based on a production rate of 2,000 tonnes per day, or 720,000 tonnes per year for a total of 5.2 million tonnes with over a mine life of approximately 8 years. Compared with the main Bilbao deposit, the current targeted mineralization is associated with a relatively narrow vein structure, possibly with skarn overtones.
Commenting on the results, Tim Gallagher, Company President said, "The drill results on the first four holes are consistent with our expectations and demonstrating the continuity of the mineralization within the Victor vein which should improve the economics of the Bilbao deposit, especially with the much-improved outlook for silver prices, approaching the US$30 per ounce level. We are waiting on analytical results on the fifth and final drill hole, X8B, which was drilled just north of the southernmost previous drill hole X100 which intersected 1 meter of 810 g/t Ag to test the extension of the Victor vein where it intersects a manto stockwork area, before determining next steps."
Drill core samples were sent to an SGS laboratory in Durango using the GE_ICP14B analytical method. Historically, samples from half-core were prepared at the Stewart Group laboratory in Zacatecas and analyzed for multi-element content using ICP-MS by Stewart Group in Kamloops, British Columbia. Standards and blanks were used regularly for quality control. Significant mineralized intervals are reported in the table as core lengths and estimated true thickness (70 to 95 per cent of core length).
Qualified Person
Scientific and technical information disclosed in this press release was prepared by or under the supervision of and approved by Gerry J. Gauthier, P. Eng., a Director and former President of the Company and a 'Qualified Person' within the meaning of NI 43-101.
* * * * * *
About Xtierra Inc.
Xtierra is a natural resource company with precious and base metal mineral properties in the Central Silver Belt of Mexico in the State of Zacatecas and is pursuing new opportunities including identifying and evaluating new potential royalty acquisitions.
Xtierra holds a 100% interest, subject to a 1.5% net smelter royalty repurchased in July 2019, on the Bilbao project silver-lead-zinc-copper project located in the southeastern part of the State of Zacatecas.
Xtierra owns 88% of the outstanding shares of Minera Portree de Zacatecas, S.A. de C.V ("Minera Portree") which holds various legal or royalty interests in certain mineral properties in Mexico, including the Company's Bilbao property, and an asserted claim to a 2% net smelter royalty on six mining concessions located adjacent to the Cozamin Mine operated by Capstone Mining Corp., which claim is challenged by Capstone.
For further information contact Xtierra Inc. at info@xtierra.ca
John F. Kearney
Chairman
(416) 362-6686
Tim Gallagher
President & Director
(416) 925‐0090
Neither the TSX Venture Exchange nor its Regulation Service Provider (as that term is defined in the policies of the TSX Venture Exchange) accepts responsibility for the adequacy or accuracy of this release.

To view the source version of this press release, please visit https://www.newsfilecorp.com/release/75583
BAODING, China, Feb. 24, 2021 /PRNewswire/ — IT Tech Packaging, Inc. (NYSE MKT: ITP) ("IT Tech Packaging" or "the Company"), a leading manufacturer and distributor of diversified paper products in North China, announced today the pricing of an underwritten offering of 26,666,666 shares of its common stock and warrants to purchase up to an aggregate of 13,333,333 shares of its common stock. Each share of common stock is being sold together with a warrant to purchase one half share of common stock at a combined price to the public of $0.75. Gross proceeds before underwriting discounts and commissions and estimated offering expenses, are expected to be $20.0 million.
The warrants will be immediately exercisable at a price of $0.75 per share of common stock and will expire five years from the date of issuance. The shares of common stock and the accompanying warrants can only be purchased together in the offering but will be issued separately and will be immediately separable upon issuance. The offering is expected to close on or about March 1, 2021, subject to customary closing conditions.
Maxim Group LLC is acting as the sole book-running manager for the offering.
The Company also has granted to the underwriter a 45-day option to purchase up to an additional 2,611,200 shares of common stock and/or warrants to purchase up to 1,305,600 shares of common stock, at the public offering price less discounts and commissions.
The securities described above are being offered by IT Tech Packaging pursuant to a registration statement (File No. 333-223160) that was filed with the U.S. Securities and Exchange Commission (SEC) on February 22, 2018 and declared effective on June 19, 2018 and a registration statement (File No. 333-.253476) that was filed on February 24, 2021 and became effective upon filing with the SEC. The securities are being offered by means of a prospectus supplement and accompanying prospectus, forming part of the registration statement. A preliminary prospectus supplement and accompanying prospectus relating to this offering have been filed with the SEC. Electronic copies of the preliminary prospectus supplement and the accompanying prospectus relating to this offering may be obtained from Maxim Group LLC, 405 Lexington Avenue, 2nd Floor, New York, NY 10174, at 212-895-3745. Electronic copies of the preliminary prospectus supplement and accompanying prospectus are also available on the website of the SEC at www.sec.gov.
This press release shall not constitute an offer to sell or the solicitation of an offer to buy, nor shall there be any sale of these securities in any state or jurisdiction in which such offer, solicitation or sale would be unlawful prior to the registration or qualification under the securities laws of any such state or jurisdiction.
About IT Tech Packaging, Inc.
Founded in 1996, IT Tech Packaging, Inc. is a leading manufacturer and distributor of diversified paper products in North China. Using recycled paper as its primary raw material (with the exception of its tissue paper products), ITP produces and distributes three categories of paper products: corrugating medium paper, offset printing paper and tissue paper products. With production based in Baoding and Xingtai in North China's Hebei Province, ITP is located strategically close to the Beijing and Tianjin region, home to a growing base of industrial and manufacturing activities and one of the largest markets for paper products consumption in the country. ITP has been listed on the NYSE MKT since December 2009.
Safe Harbor Statement
This press release may contain forward-looking statements. These forward-looking statements involve inherent risks and uncertainties that could cause actual results to differ materially from those projected or anticipated, including risks outlined in the Company's public filings with the Securities and Exchange Commission, including the Company's latest annual report on Form 10-K. All information provided in this press release speaks as of the date hereof. Except as otherwise required by law, the Company undertakes no obligation to update or revise its forward-looking statements.
For further information, please contact:
At the Company
Email: ir@itpackaging.cn
Tel: +86-312-8698215
Investor Relations:
Janice Wang
+86-138-1176-8559
EverGreen Consulting Inc.
Email: ir@changqingconsulting.com

View original content:http://www.prnewswire.com/news-releases/it-tech-packaging-inc-announces-pricing-of-approximately-20-0-million-offering-of-common-stock-and-warrants-301235209.html
SOURCE IT Tech Packaging, Inc.
PHILADELPHIA, PA, Feb. 25, 2021 (GLOBE NEWSWIRE) — FTAC Athena Acquisition Corp. (NASDAQ:FTAAU) (the “Company”), a blank-check company formed for the purpose of acquiring or merging with one or more technology and financial services technology companies, today announced the completion of its initial public offering of 25,000,000 units at a price of $10.00 per unit, which includes 3,000,000 units issued pursuant to the exercise of the underwriters’ over-allotment option, for gross proceeds to the Company of $250,000,000. The Company's units began trading on the Nasdaq Capital Market under the symbol "FTAAU" on February 23, 2021. Each unit issued in the offering consists of one Class A ordinary share of the Company and one-fourth of one warrant, each whole warrant exercisable for one Class A ordinary share at an exercise price of $11.50 per share. Once the securities comprising the units begin separate trading, the Class A ordinary shares and warrants are expected to be listed on NASDAQ under the symbols “FTAA” and “FTAAW,” respectively. No fractional warrants will be issued upon separation of the units and only whole warrants will trade.
Cantor Fitzgerald & Co. served as the sole book-running manager for the offering.
A registration statement relating to the units and the underlying securities was declared effective by the Securities and Exchange Commission on February 22, 2021. This press release shall not constitute an offer to sell or the solicitation of an offer to buy, nor shall there be any sale of, these securities in any state or jurisdiction in which such offer, solicitation, or sale would be unlawful prior to registration or qualification under the securities laws of any such state or jurisdiction.
The offering is being made only by means of a prospectus, copies of which may be obtained by contacting Cantor Fitzgerald & Co., Attention: Capital Markets, 499 Park Avenue, 5th Floor, New York, New York 10022, email: prospectus@cantor.com. Copies of the registration statement can be accessed for free through the SEC's website at www.sec.gov.
This press release contains statements that constitute “forward-looking statements,” including with respect to the initial public offering. Forward-looking statements are subject to numerous conditions, many of which are beyond the control of the Company, including those set forth in the Risk Factors section of the Company's registration statement and prospectus for the offering filed with the Securities and Exchange Commission. The Company undertakes no obligation to update these statements for revisions or changes after the date of this press release, except as required by law.
Contact Information:
Amanda Abrams
amanda@ftspac.com
(215) 701-9693
We often see insiders buying up shares in companies that perform well over the long term. The flip side of that is that there are more than a few examples of insiders dumping stock prior to a period of weak performance. So we'll take a look at whether insiders have been buying or selling shares in Rockhaven Resources Ltd. (CVE:RK).
What Is Insider Selling?
Most investors know that it is quite permissible for company leaders, such as directors of the board, to buy and sell stock in the company. However, such insiders must disclose their trading activities, and not trade on inside information.
Insider transactions are not the most important thing when it comes to long-term investing. But logic dictates you should pay some attention to whether insiders are buying or selling shares. For example, a Columbia University study found that 'insiders are more likely to engage in open market purchases of their own company’s stock when the firm is about to reveal new agreements with customers and suppliers'.
View our latest analysis for Rockhaven Resources
Rockhaven Resources Insider Transactions Over The Last Year
In the last twelve months, the biggest single purchase by an insider was when Chief Financial Officer Larry Donaldson bought CA$100k worth of shares at a price of CA$0.28 per share. That means that an insider was happy to buy shares at above the current price of CA$0.15. While their view may have changed since the purchase was made, this does at least suggest they have had confidence in the company's future. We always take careful note of the price insiders pay when purchasing shares. As a general rule, we feel more positive about a stock if insiders have bought shares at above current prices, because that suggests they viewed the stock as good value, even at a higher price.
Rockhaven Resources insiders may have bought shares in the last year, but they didn't sell any. You can see the insider transactions (by companies and individuals) over the last year depicted in the chart below. If you want to know exactly who sold, for how much, and when, simply click on the graph below!

Rockhaven Resources is not the only stock insiders are buying. So take a peek at this free list of growing companies with insider buying.
Insider Ownership
Many investors like to check how much of a company is owned by insiders. Usually, the higher the insider ownership, the more likely it is that insiders will be incentivised to build the company for the long term. From our data, it seems that Rockhaven Resources insiders own 8.6% of the company, worth about CA$3.1m. Overall, this level of ownership isn't that impressive, but it's certainly better than nothing!
So What Does This Data Suggest About Rockhaven Resources Insiders?
The fact that there have been no Rockhaven Resources insider transactions recently certainly doesn't bother us. On a brighter note, the transactions over the last year are encouraging. While we have no worries about the insider transactions, we'd be more comfortable if they owned more Rockhaven Resources stock. So while it's helpful to know what insiders are doing in terms of buying or selling, it's also helpful to know the risks that a particular company is facing. At Simply Wall St, we found 2 warning signs for Rockhaven Resources that deserve your attention before buying any shares.
Of course, you might find a fantastic investment by looking elsewhere. So take a peek at this free list of interesting companies.
For the purposes of this article, insiders are those individuals who report their transactions to the relevant regulatory body. We currently account for open market transactions and private dispositions, but not derivative transactions.
This article by Simply Wall St is general in nature. It does not constitute a recommendation to buy or sell any stock, and does not take account of your objectives, or your financial situation. We aim to bring you long-term focused analysis driven by fundamental data. Note that our analysis may not factor in the latest price-sensitive company announcements or qualitative material. Simply Wall St has no position in any stocks mentioned.
Have feedback on this article? Concerned about the content? Get in touch with us directly. Alternatively, email editorial-team (at) simplywallst.com.
Does the February share price for Hillgrove Resources Limited (ASX:HGO) reflect what it's really worth? Today, we will estimate the stock's intrinsic value by projecting its future cash flows and then discounting them to today's value. The Discounted Cash Flow (DCF) model is the tool we will apply to do this. It may sound complicated, but actually it is quite simple!
Remember though, that there are many ways to estimate a company's value, and a DCF is just one method. If you want to learn more about discounted cash flow, the rationale behind this calculation can be read in detail in the Simply Wall St analysis model.
Check out our latest analysis for Hillgrove Resources
The method
As Hillgrove Resources operates in the metals and mining sector, we need to calculate the intrinsic value slightly differently. In this approach dividends per share (DPS) are used, as free cash flow is difficult to estimate and often not reported by analysts. Unless a company pays out the majority of its FCF as a dividend, this method will typically underestimate the value of the stock. We use the Gordon Growth Model, which assumes dividend will grow into perpetuity at a rate that can be sustained. For a number of reasons a very conservative growth rate is used that cannot exceed that of a company's Gross Domestic Product (GDP). In this case we used the 5-year average of the 10-year government bond yield (2.0%). The expected dividend per share is then discounted to today's value at a cost of equity of 9.0%. Relative to the current share price of AU$0.05, the company appears about fair value at a 13% discount to where the stock price trades currently. Remember though, that this is just an approximate valuation, and like any complex formula – garbage in, garbage out.
Value Per Share = Expected Dividend Per Share / (Discount Rate – Perpetual Growth Rate)
= AU$0.01 / (9.0% – 2.0%)
= AU$0.06

Important assumptions
We would point out that the most important inputs to a discounted cash flow are the discount rate and of course the actual cash flows. If you don't agree with these result, have a go at the calculation yourself and play with the assumptions. The DCF also does not consider the possible cyclicality of an industry, or a company's future capital requirements, so it does not give a full picture of a company's potential performance. Given that we are looking at Hillgrove Resources as potential shareholders, the cost of equity is used as the discount rate, rather than the cost of capital (or weighted average cost of capital, WACC) which accounts for debt. In this calculation we've used 9.0%, which is based on a levered beta of 1.327. Beta is a measure of a stock's volatility, compared to the market as a whole. We get our beta from the industry average beta of globally comparable companies, with an imposed limit between 0.8 and 2.0, which is a reasonable range for a stable business.
Looking Ahead:
Whilst important, the DCF calculation ideally won't be the sole piece of analysis you scrutinize for a company. It's not possible to obtain a foolproof valuation with a DCF model. Instead the best use for a DCF model is to test certain assumptions and theories to see if they would lead to the company being undervalued or overvalued. For example, changes in the company's cost of equity or the risk free rate can significantly impact the valuation. For Hillgrove Resources, we've put together three additional aspects you should explore:
-
Risks: Every company has them, and we've spotted 4 warning signs for Hillgrove Resources (of which 1 shouldn't be ignored!) you should know about.
-
Management:Have insiders been ramping up their shares to take advantage of the market's sentiment for HGO's future outlook? Check out our management and board analysis with insights on CEO compensation and governance factors.
-
Other High Quality Alternatives: Do you like a good all-rounder? Explore our interactive list of high quality stocks to get an idea of what else is out there you may be missing!
PS. The Simply Wall St app conducts a discounted cash flow valuation for every stock on the ASX every day. If you want to find the calculation for other stocks just search here.
This article by Simply Wall St is general in nature. It does not constitute a recommendation to buy or sell any stock, and does not take account of your objectives, or your financial situation. We aim to bring you long-term focused analysis driven by fundamental data. Note that our analysis may not factor in the latest price-sensitive company announcements or qualitative material. Simply Wall St has no position in any stocks mentioned.
Have feedback on this article? Concerned about the content? Get in touch with us directly. Alternatively, email editorial-team (at) simplywallst.com.
Vancouver, British Columbia–(Newsfile Corp. – February 23, 2021) – Marifil Mines Limited (TSXV: MFM) ("Marifil" or the "Company") is pleased to announce its intention to undertake a non-brokered private placement for gross proceeds of up to $2,000,000 through the issuance of up to 40,000,000 units (each, a "Unit") at a price of $0.05 per Unit (the "Offering").
Each Unit will consist of one common share of the Company (each, a "Share") and one common share purchase warrant (each, a "Warrant"), with each Warrant entitling the holder to purchase one Share at a price of $0.05 per Share for a period of three years following the closing of the Offering (the "Closing"). Finder's fees may be payable in connection with the Offering in accordance with the policies of the TSX Venture Exchange (the "Exchange").
The proceeds of the Offering will be used for general working capital.
All securities issued in connection with the Offering will be subject to a statutory hold period expiring four months and one day after closing of the Offering. Completion of the Offering is subject to a number of conditions, including, without limitation, receipt of all regulatory approvals, including approval of the Exchange.
None of the securities to be issued in connection with the Offering will be or have been registered under the United States Securities Act of 1933, as amended (the "1933 Act"), and none may be offered or sold in the United States absent registration or an applicable exemption from the registration requirements of the 1933 Act. This press release is being issued pursuant to Rule 135c of the 1933 Act and shall not constitute an offer to sell or a solicitation of an offer to buy, nor shall there be any sale of the securities, in any state where such offer, solicitation or sale would be unlawful.
ON BEHALF OF MARIFIL MINES LIMITED
"Rob Abenante"
Robert Abenante, President & CEO
Contact Information:
Email: info@marifilmines.com
Website: http://www.marifilmines.com
For further information regarding Marifil Mines Limited, please refer to the Company's filings available on SEDAR (http://www.sedar.com) or at Marifil's Website (http://www.marifilmines.com).
Neither the TSX Venture Exchange nor its Regulation Services Provider (as that term is defined in the policies of the TSX Venture Exchange) accepts responsibility for the adequacy or accuracy of this release.
NOT FOR DISTRIBUTION TO UNITED STATES NEWS WIRE SERVICES OR FOR DISSEMINATION IN THE UNITED STATES
To view the source version of this press release, please visit https://www.newsfilecorp.com/release/75179
Vancouver, British Columbia–(Newsfile Corp. – February 23, 2021) – TNR Gold Corp. (TSXV: TNR) ("TNR", "TNR Gold" or the "Company") is pleased to provide a corporate update from Kirill Klip, Chairman of TNR Gold.
"I'm a strong believer in personal interest," stated Mr. Klip. "It's very encouraging when it's aligned with that of the shareholders. To that end, I'm pleased that other insiders of the Company have joined me in our recent private placements. While I am the largest individual shareholder of TNR Gold, it's crucial for me that all of us at the TNR Gold Team are personally motivated to succeed. It's because of this that shareholders can trust us to advance the Company forward with great passion. Our recent private placement was oversubscribed and we are well-positioned now to develop further our portfolio of strategic assets in gold and Energy rEVolution metals.
Kirill Klip continued, "Our forward-thinking approach is allowing us to integrate our strategic portfolio with the international capital markets, while maintaining efforts to minimize dilution for all our shareholders. During these favourable macro-economic conditions for gold and green energy metals, we have been enjoying an entirely new level of attention and participation from certain financial institutions. This will allow us to accelerate the development of the Shotgun Gold Project as well as continue to advance our royalty portfolio within the next chapter of business: Green Energy Metals. We maintain the potential of adding to our core royalty holdings on the Los Azules Copper Project with McEwen Mining and the Mariana Lithium Project under the management of Ganfeng Lithium."
TNR Gold holds NSR royalties on projects containing copper, gold, silver and lithium metals. TNR Gold does not have to contribute any capital for the development of Los Azules Copper Project and Mariana Lithium Project. Neither does our NSR Royalty depend on the size of International Lithium's potentially diluted ownership in the Mariana Lithium Project. The essence of our business model is to have industry leaders like McEwen Mining and Ganfeng Lithium as operators on the projects that will potentially generate royalty cashflows to contribute significant value for our shareholders.
The Company's strategy with the Shotgun Gold Project is to attract a partnership with one of the major gold mining companies. TNR Gold has successfully consolidated and updated its mining claims in Alaska and is actively introducing the project to interested parties. Kirill Klip added, "There is a clear path on how to move this project forward using the geological and geophysical research currently available to target drilling to expand the resource and form the basis of a preliminary economic analysis. The next step is to acquire a partner that shares our vision and recognizes the growth potential and value to be added to the Shotgun Project over time.
I would like to thank all our shareholders for your support and on your behalf, I would like to thank our very talented TNR Gold Team that is building The Green Energy Metals Royalty and Gold Company."
ABOUT TNR GOLD CORP.
TNR Gold Corp. is working to become the green energy metals royalty and gold company.
Over the past twenty-five years, TNR, through its lead generator business model, has been successful in generating high-quality exploration projects around the globe. With the Company's expertise, resources and industry network, it identified the potential of the Los Azules Copper Project in Argentina and now holds a 0.36% NSR Royalty on the entire project, which is being developed by McEwen Mining Inc.
In 2009, TNR founded International Lithium Corp. ("ILC"), a green energy metals company that was made public through the spin-out of TNR's energy metals portfolio in 2011. ILC holds interests in lithium projects in Argentina, Ireland and Canada.
TNR retains a 1.8% NSR Royalty on the Mariana Lithium Project in Argentina. ILC has a right to repurchase 1.0% of the NSR Royalty on the Mariana Lithium Project, of which 0.9% relates to the Company's NSR Royalty interest. The Company would receive $900,000 on the completion of the repurchase. The project is currently being advanced in a joint venture between ILC and Ganfeng Lithium International Co. Ltd.
TNR provides significant exposure to gold through its 90% holding in the Shotgun Gold porphyry project in Alaska. The project is located in Southwestern Alaska near the Donlin Gold project, which is being developed by Barrick Gold and Novagold Resources Inc.
The Company's strategy with Shotgun Gold Project is to attract a joint venture partnership with one of the gold major mining companies. The Company is actively introducing the project to interested parties.
At its core, TNR provides significant exposure to gold, copper, silver and lithium through its holdings in Alaska (the Shotgun Gold porphyry project) and Argentina (the Los Azules Copper and the Mariana Lithium projects) and is committed to the continued generation of in-demand projects, while diversifying its markets and building shareholder value.
On behalf of the Board of Directors,
Kirill Klip
Executive Chairman
For further information concerning this news release please contact +1 604-229-8129
Neither TSX Venture Exchange nor its Regulation Services Provider (as that term is defined in the policies of the TSX Venture Exchange) accepts responsibility for the adequacy or accuracy of this release.
Cautionary Statement Regarding Forward-Looking Information
Except for statements of historical fact, this news release contains certain "forward-looking information" within the meaning of applicable securities law. Forward-looking information is frequently characterized by words such as "plan", "expect", "project", "intend", "believe", "anticipate", "estimate", "will", "could" and other similar words, or statements that certain events or conditions "may" or "could" occur, although not all forward-looking statements contain these identifying words. Specifically, forward-looking statements in this news release include, but are not limited to, statements made in relation to: TNR's corporate objectives, changes in share capital, market conditions for energy commodities, the results of McEwen Mining's and ILC's PEAs, and improvements in the financial performance of the Company. Such forward-looking information is based on a number of assumptions and subject to a variety of risks and uncertainties, including but not limited to those discussed in the sections entitled "Risks" and "Forward-Looking Statements" in the Company's interim and annual Management's Discussion and Analysis which are available under the Company's profile on www.sedar.com. While management believes that the assumptions made and reflected in this news release are reasonable, should one or more of the risks, uncertainties or other factors materialize, or should underlying assumptions prove incorrect, actual results may vary materially from those described in forward-looking information. In particular, there can be no assurance that: TNR will be able to repay its loans or complete any further royalty acquisitions or sales; debt or other financing will be available to TNR; or that TNR will be able to achieve any of its corporate objectives. TNR relies on the confirmation of its ownership for mining claims from the appropriate government agencies when paying rental payments for such mining claims requested by these agencies. There could be a risk in the future of the changing internal policies of such government agencies or risk related to the third parties challenging in the future the ownership of such mining claims. Given these uncertainties, readers are cautioned that forward-looking statements included herein are not guarantees of future performance, and such forward-looking statements should not be unduly relied on.
In formulating the forward-looking statements contained herein, management has assumed that business and economic conditions affecting TNR and its royalty partners, McEwen Mining Inc. and International Lithium Corp. will continue substantially in the ordinary course, including without limitation with respect to general industry conditions, general levels of economic activity and regulations. These assumptions, although considered reasonable by management at the time of preparation, may prove to be incorrect.
Forward-looking information herein and all subsequent written and oral forward-looking information are based on estimates and opinions of management on the dates they are made and are expressly qualified in their entirety by this cautionary statement. Except as required by law, the Company assumes no obligation to update forward-looking information should circumstances or management's estimates or opinions change.
To view the source version of this press release, please visit https://www.newsfilecorp.com/release/75174
Total airport management market to reach $1.20 billion by 2030
SANTA CLARA, Calif., Feb. 23, 2021 /CNW/ — Frost & Sullivan's recent analysis, Data Integration to Drive Global Total Airport Management (TAM) Market Growth, 2030, finds that total airport management (TAM) aims to address multiple challenges faced by airports across various operational categories, including passenger processing, airside operations, safety and security, facilities management, and landside operations. TAM supports data-driven decision-making, holistic KPI (key performance indicator) management, and integration of various operations by interlinking processes and systems across the airport. Despite being a niche concept, the TAM market is expected to more than double and reach $1.20 billion by 2030 from $576.4 million in 2020. TAM will be especially attractive to Tier I airports at large metros and international hub airports as they have extremely high passenger and baggage throughput.

For further information on this analysis, please visit: http://frost.ly/59t
"The growing need to increase passenger and baggage throughput coupled with airports constantly working toward offering an enhanced passenger experience makes it imperative for airports to embrace TAM," said Shantanu Gangakhedkar, Aerospace & Defense Consultant at Frost & Sullivan. "TAM enhances airport operations management by integrating processes across the value chain of the airport while increasing the accountability of stakeholders and providing real-time visibility into processes, leading to increased efficiency and effectiveness across the airport.
Gangakhedkar added: "Upgradation activities undertaken by airports, the growing need for safety and security, the rising demand for reduced turnaround time, and airports' desire to offer an enhanced passenger experience to improve aero and non-aero revenues will propel airports' decisions to deploy TAM. The increased use of contactless biometrics, connected infrastructure, Big Data, artificial intelligence (AI), 5G, and automation will be the core technologies to take TAM concept forward."
For further growth opportunities, market participants should leverage the following trends in the digital transformation of airports:
-
Acceptance of collaboration platforms: These platforms offer real-time information exchanges and promote collaboration among stakeholders while also reducing silos.
-
Penetration of AI and Big Data: These new technologies can predict issues and bottlenecks; delays can be avoided through proactive planning.
-
Optimization of Airside Operations: Resource allocation can be optimized by using location-based services and other tracking and monitoring tools, including RFID (radio frequency identification) personal handheld devices.
-
Increase in Biometrics Usage: Airports worldwide, especially Tier I airports, are increasingly looking at biometrics deployment to enhance passenger flow and reduce human intervention.
-
Focus on Non-aero Revenue: Airports aim to create more avenues to earn higher non-aero revenue while offering a better passenger experience that will lead to augmented spending.
Data Integration to Drive Global Total Airport Management (TAM) Market Growth, 2030 is part of Frost & Sullivan's Global Aerospace & Defense Growth Partnership Service program.
About Frost & Sullivan
For six decades, Frost & Sullivan has been world-renowned for its role in helping investors, corporate leaders and governments navigate economic changes and identify disruptive technologies, Mega Trends, new business models, and companies to action, resulting in a continuous flow of growth opportunities to drive future success. Contact us: Start the discussion
Data Integration to Drive Global Total Airport Management (TAM) Market Growth, 2030
K52A-22
Contact:
Srihari Daivanayagam, Corporate Communications
M: +91 9742676194; P: +91 44 6681 4412
E: srihari.daivanayagam@frost.com
http://ww2.frost.com

View original content to download multimedia:http://www.prnewswire.com/news-releases/total-airport-management-to-enhance-airport-operations-across-the-value-chain-frost–sullivan-301233498.html
SOURCE Frost & Sullivan


View original content to download multimedia: http://www.newswire.ca/en/releases/archive/February2021/23/c6817.html
Individual and institutional investors as well as advisors are invited to log-on to VirtualInvestorConferences.com to view presentations
NEW YORK, Feb. 22, 2021 /CNW/ – Virtual Investor Conferences, the leading proprietary investor conference series and co-sponsor Amvest Capital, today announced that the presentations from the February Metals & Mining Virtual lnvestor Conference are now available for on-demand viewing.
REGISTER OR LOGIN NOW TO VIEW THE PRESENTATIONS: https://bit.ly/3siwpUf
The company presentations will be available 24/7 for 90 days. Investors, advisors and analysts may download shareholder materials from the "virtual trade booth" for the next three weeks.
Participating Companies:
|
Presentation |
Ticker(s) |
|
Keynote Presentations: Why Gold Should be Considered an ESG Compliant Asset Terry Heymann, CFO, World Gold Council Introduction to the Silver Institute and Silver's Role in Green Technologies Michael DiRienzo, Executive Director, The Silver Institute Implications of Global Climate Policy Announcements within the TechMetals Complex in 2021 Daniel Mamadou, Partner at Welsbach Holdings |
|
|
Pan African Resources PLC |
OTCQX: PAFRF| AIM: PAF | JSE: PAN |
|
Battle North Gold Corp. |
OTCQX: BNAUF | TSX: BNAU |
|
Golden Valley Mines Ltd. |
OTCQX: GLVMF | TSX-V: GZZ |
|
Newcore Gold Ltd. |
OTCQX: NCAUF | TSX-V: NCAU |
|
First Vanadium Corp. |
OTCQX: FVANF | TSX-V: FVAN |
|
Arizona Gold Corp. |
OTCQB: AGAUF | TSX: AZG |
|
Gold Terra Resource Corp. |
OTCQX: YGTFF | TSX-V: YGT |
|
Skeena Resources Ltd. |
OTCQX: SKREF | TSX: SKE |
|
Cassiar Gold Corp. |
OTCQB: CGLCF | TSX-V: GLDC |
|
Josemaria Resources Inc. |
OTCQB: JOSMF | TSX: JOSE |
|
Amex Exploration Inc. |
OTCQX: AMXEF |TSX-V: AMX |
|
O3 Mining Inc. |
OTCQX: OIIIF | TSX-V: OIII |
|
Orezone Gold Corp. |
OTCQX: ORZCF | TSX-V: ORE |
|
Minera Alamos, Inc. |
OTCQX: MAIFF | TSX-V: MAI |
|
Anaconda Mining Inc. |
OTCQX: ANXGF | TSX: ANX |
|
Reyna Silver Corp. |
OTCQB: RSNVF | TSX-V: RSLV |
|
Starcore International Mines Ltd. |
OTCQB: SHVLF | TSX: SAM |
|
Aftermath Silver Ltd. |
OTCQB: AAGFF | TSX-V: AAG |
|
Outcrop Gold Corp. |
Pink: MRDD.F | TSX-V: OCG |
|
Fabled Silver Gold Corp. |
Pink: FBSGF | TSX-V: FCO |
|
Silver One Resources Inc. |
OTCQX: SLVRF | TSX-V: SVE |
|
Southern Silver Exploration Corp. |
OTCQB: SSVFF | TSX-V: SSV |
|
Apollo Gold & Silver Corp. |
OTCQB: APGOF | TSX V: APGO |
|
Ascot Resources Ltd. |
OTCQX: AOTVF | TSX: AOT |
|
Metallic Minerals Ltd. |
OTCQB: MMNGF | TSX-V: MMG |
|
Blackrock Gold Corp. |
OTCQB: BKRRF | TSX-V: BRC |
|
Avidian Gold Corp. |
OTCQB: AVGDF | TSX-V: AVG |
|
Canagold Resources Ltd. |
OTCQB: CRCUF | TSX: CCM |
|
Blue Thunder Mining Inc. |
OTCQB: BLTMF | TSX-V: BLUE |
|
Peninsula Energy Ltd. |
OTCQB: PENMF | ASX: PEN |
|
Canada Nickel Co Inc |
OTCQB: CNIKF | TSX-V: CNC |
|
Arizona Metals Corp. |
OTCQX: AZMCF | TSX-V: AMC |
|
Vimy Resources Ltd. |
OTCQB: VMRSF | ASX: VMY |
|
Ion Energy Ltd. |
OTCQB: IONGF | TSX-V: ION |
|
Aurania Resources Ltd. |
OTCQB: AUIAF | TSX-V: ARU |
|
UEX Corp. |
OTCQB: UEXCF | TSX: UEX |
|
Ceylon Graphite Corp. |
OTCQB: CYLYF | TSX-V: CYL |
|
Lake Resources N.L. |
OTCQB: LLKKF | ASX: LKE |
|
South Star Mining Corp. |
OTCQB: STSBF | TSX-V: STS |
|
Frontier Lithium Inc. |
OTCQB: LITOF | TSX-V: FL |
|
Medallion Resources Ltd. |
OTCQB: MLLOF | TSX-V: MDL |
|
Blackstone Minerals Ltd. |
OTCQX: BLSTF | ASX: BSX |
To facilitate investor relations scheduling, for more information about the program and to view a complete calendar of Virtual Investor Conferences, please visit www.virtualinvestorconferences.com.
About Virtual Investor Conferences®
Virtual Investor Conferences (VIC) is the leading proprietary investor conference series that provides an interactive forum for publicly-traded companies to meet and present directly with investors. A real-time solution for investor engagement, Virtual Investor Conferences is part of OTC Market Group's suite of investor relations services specifically designed for more efficient Investor Access. Replicating the look and feel of on-site investor conferences, Virtual Investor Conferences combine leading-edge conferencing and investor communications capabilities with a comprehensive global investor audience network.
SOURCE VirtualInvestorConferences.com


View original content: http://www.newswire.ca/en/releases/archive/February2021/22/c7069.html
We can readily understand why investors are attracted to unprofitable companies. For example, biotech and mining exploration companies often lose money for years before finding success with a new treatment or mineral discovery. But the harsh reality is that very many loss making companies burn through all their cash and go bankrupt.
Given this risk, we thought we'd take a look at whether Mincor Resources (ASX:MCR) shareholders should be worried about its cash burn. For the purposes of this article, cash burn is the annual rate at which an unprofitable company spends cash to fund its growth; its negative free cash flow. We'll start by comparing its cash burn with its cash reserves in order to calculate its cash runway.
See our latest analysis for Mincor Resources
Does Mincor Resources Have A Long Cash Runway?
A cash runway is defined as the length of time it would take a company to run out of money if it kept spending at its current rate of cash burn. As at December 2020, Mincor Resources had cash of AU$92m and no debt. In the last year, its cash burn was AU$22m. That means it had a cash runway of about 4.2 years as of December 2020. Notably, however, analysts think that Mincor Resources will break even (at a free cash flow level) before then. In that case, it may never reach the end of its cash runway. Depicted below, you can see how its cash holdings have changed over time.

How Is Mincor Resources' Cash Burn Changing Over Time?
Whilst it's great to see that Mincor Resources has already begun generating revenue from operations, last year it only produced AU$139k, so we don't think it is generating significant revenue, at this point. Therefore, for the purposes of this analysis we'll focus on how the cash burn is tracking. During the last twelve months, its cash burn actually ramped up 93%. While this spending increase is no doubt intended to drive growth, if the trend continues the company's cash runway will shrink very quickly. Clearly, however, the crucial factor is whether the company will grow its business going forward. So you might want to take a peek at how much the company is expected to grow in the next few years.
Can Mincor Resources Raise More Cash Easily?
Given its cash burn trajectory, Mincor Resources shareholders may wish to consider how easily it could raise more cash, despite its solid cash runway. Generally speaking, a listed business can raise new cash through issuing shares or taking on debt. Commonly, a business will sell new shares in itself to raise cash and drive growth. By comparing a company's annual cash burn to its total market capitalisation, we can estimate roughly how many shares it would have to issue in order to run the company for another year (at the same burn rate).
Mincor Resources has a market capitalisation of AU$445m and burnt through AU$22m last year, which is 5.0% of the company's market value. Given that is a rather small percentage, it would probably be really easy for the company to fund another year's growth by issuing some new shares to investors, or even by taking out a loan.
Is Mincor Resources' Cash Burn A Worry?
It may already be apparent to you that we're relatively comfortable with the way Mincor Resources is burning through its cash. In particular, we think its cash runway stands out as evidence that the company is well on top of its spending. Although we do find its increasing cash burn to be a bit of a negative, once we consider the other metrics mentioned in this article together, the overall picture is one we are comfortable with. It's clearly very positive to see that analysts are forecasting the company will break even fairly soon. After considering a range of factors in this article, we're pretty relaxed about its cash burn, since the company seems to be in a good position to continue to fund its growth. Taking a deeper dive, we've spotted 2 warning signs for Mincor Resources you should be aware of, and 1 of them doesn't sit too well with us.
Of course Mincor Resources may not be the best stock to buy. So you may wish to see this free collection of companies boasting high return on equity, or this list of stocks that insiders are buying.
This article by Simply Wall St is general in nature. It does not constitute a recommendation to buy or sell any stock, and does not take account of your objectives, or your financial situation. We aim to bring you long-term focused analysis driven by fundamental data. Note that our analysis may not factor in the latest price-sensitive company announcements or qualitative material. Simply Wall St has no position in any stocks mentioned.
Have feedback on this article? Concerned about the content? Get in touch with us directly. Alternatively, email editorial-team (at) simplywallst.com.
VANCOUVER, BC / ACCESSWIRE / February 22, 2021 / GGL Resources Corp. (TSXV:GGL) ("GGL" or the "Company") is pleased to announce that it has commenced a 3,000 m reverse circulation drill program at its past-producing Gold Point mesothermal gold/silver project, located in the Walker Lane Trend, southwestern Nevada.
The current exploration program will include 3,000 m of reverse circulation drilling in up to 18 holes, excavator trenching, soil and tailings sampling, mapping, and prospecting. The drill holes are primarily designed to test near historical production in the Great Western Mine and along strike of the known vein system, as well as to evaluate potential for other mineralized structures that parallel the known veins. Sampling of the existing Great Western Mine underground workings was completed in December 2020. The Company will release results of this sampling program once they have been received and reviewed.
Four drill holes will test adjacent to mineralization known to exist on the 200' level and 500' level where historical sampling done in the 1980s reportedly returned assays of 1.449 opt (49.68 g/t) gold and 0.906 opt (31.06 g/t) gold. The remaining 14 drill holes will systematically step out to the east and west of the known mineralization, in areas that have not been tested by historical underground drifting.
GGL has not found any record of historical drilling from surface at Gold Point, indicating most of the area is yet unevaluated.
Tailings
During GGL's 2020 surface exploration program, samples were collected from historical tailings storage facilities to determine if potentially economical gold and silver remain. Samples collected from the main tailings storage area returned 0.286 g/t gold to 3.62 g/t gold (averaging 1.04 g/t gold), with samples collected from the secondary storage area ranging from 1.645 g/t gold to 27.4 g/t gold (averaging 2.62 g/t gold excluding the highest grade sample). Preliminary cyanidation tests suggest that much of the gold is potentially recoverable by this technique.
Records indicate the tailings storage facilities were established in the 1930s or earlier. They cover an area of approximately 23,000 m2 and range from 0.4 m to 2.0 m in thickness.
Systematic auger sampling of the tailings will be conducted during the current exploration program. Samples will be collected from top to bottom of holes in all parts of the tailings storage facility. This sampling will be used to better characterize the overall tonnage and grade of the tailings, so that the total metal content and potential recovery can be determined.
About Gold Point
The Gold Point project is accessible via highway 774 and serviced by electricity. It hosts a camp-scale precious metal system that consists of numerous gold and silver rich quartz veins. These high-grade veins are typically 1 to 2 m in width and locally up to 7 m wide. Two veins (Orleans and Great Western) were intermittently mined from the 1880s through to the early 1960s. Existing underground workings are mostly open and are dry to approximately 275 m below surface on the Orleans Vein (1020 ft level) and 240 m on the Great Western Vein, (960 ft level). Historical records indicate that the mines had high cut-off grades (about 10 g/t gold), suggesting that well mineralized areas likely remain in un-mined portions of the developed workings. This assumption is further supported by a report that describes 35 historical samples collected post-mining across the Orleans Vein from the 960 ft to 1020 ft levels, which averaged 0.389 opt (13.3 g/t) gold including a vein on the 1000 ft level that returned 7.97 opt (273.2 g/t) gold over 0.5 m. Additionally, 21 samples from the 600 ft to 1020 ft levels reportedly averaged 0.314 opt (10.77 g/t) gold. Historical records indicate that approximately 74,000 ounces were produced from the Orleans and Great Western Mines, with recoveries of 92% to 98% for gold through cyanidation.
All of GGL's analyses were performed by ALS Minerals in Reno, Nevada. All samples were routinely analyzed for gold by a 50 g fire assay followed by atomic absorption (Au-AA24 or Au-AA26) and 48 elements by inductively coupled plasma-mass spectrometry (ME-MS61).
Technical information in this news release has been reviewed and approved by Matthew R. Dumala, P.Eng., a geological engineer with Archer, Cathro & Associates (1981) Limited and a qualified person for the purposes of National Instrument 43-101.
About GGL Resources Corp.
GGL is a seasoned, Canadian-based junior exploration company, focused on the exploration and advancement of under evaluated mineral assets in politically stable, mining friendly jurisdictions. The Company has recently acquired an option on the Gold Point project in the prolific Walker Lane Trend, Nevada, which consolidated several gold-silver veins, two of which were past producing high-grade mines. The Company also holds the McConnell gold-copper project located 22 kilometers southeast of the Kemess Mine in north-central BC, and promising diamond exploration projects in Nunavut and the Lac de Gras diamond district of the Northwest Territories. Lac de Gras is home to Canada's first two diamond mines, the world class Diavik and Ekati mines discovered in the 1990s. GGL also holds diamond royalties on mineral leases in close proximity to the Gahcho Kué diamond mine in the Northwest Territories.
ON BEHALF OF THE BOARD
"David Kelsch"
David Kelsch
President, COO and Director
For further information concerning GGL Resources Corp. or its various exploration projects please visit our website at www.gglresourcescorp.com or contact:
|
Investor Inquiries |
Corporate Information |
Neither the TSX Venture Exchange nor its Regulation Services Provider (as that term is defined in the policies of the TSX Venture Exchange) accepts responsibility for the adequacy or accuracy of this release.
This news release may contain forward looking statements based on assumptions and judgments of management regarding future events or results that may prove to be inaccurate as a result of exploration and other risk factors beyond its control, and actual results may differ materially from the expected results.
SOURCE: GGL Resources Corp.
View source version on accesswire.com:
https://www.accesswire.com/630816/GGL-Resources-Corp-Commences-Drilling-at-Gold-Point-Nevada
PHILADELPHIA, PA, Feb. 22, 2021 (GLOBE NEWSWIRE) — FTAC Athena Acquisition Corp. (NASDAQ:FTAAU) (the “Company”), a blank-check company formed for the purpose of acquiring or merging with one or more technology and financial services technology companies, today announced the pricing of its initial public offering of 22,000,000 units at a price of $10.00 per unit, for gross proceeds to the Company of $220,000,000. The Company's units will be listed on the Nasdaq Capital Market under the symbol "FTAAU" and will begin trading on February 23, 2021. Each unit issued in the offering consists of one Class A ordinary share of the Company and one-fourth of one warrant, each whole warrant exercisable for one Class A ordinary share at an exercise price of $11.50 per share. Once the securities comprising the units begin separate trading, the Class A ordinary shares and warrants are expected to be listed on NASDAQ under the symbols “FTAA” and “FTAAW,” respectively. No fractional warrants will be issued upon separation of the units and only whole warrants will trade. The closing of the offering is anticipated to take place on or about February 25, 2021, subject to customary closing conditions.
Cantor Fitzgerald & Co. is serving as the sole book-running manager for the offering. The Company has granted the underwriters a 45-day option to purchase up to an additional 3,300,000 units at the initial public offering price to cover over-allotments, if any.
A registration statement relating to the units and the underlying securities was declared effective by the Securities and Exchange Commission on February 22, 2021. This press release shall not constitute an offer to sell or the solicitation of an offer to buy, nor shall there be any sale of, these securities in any state or jurisdiction in which such offer, solicitation, or sale would be unlawful prior to registration or qualification under the securities laws of any such state or jurisdiction.
The offering is being made only by means of a prospectus, copies of which may be obtained by contacting Cantor Fitzgerald & Co., Attention: Capital Markets, 499 Park Avenue, 5th Floor, New York, New York 10022, email: prospectus@cantor.com. Copies of the registration statement can be accessed for free through the SEC's website at www.sec.gov.
This press release contains statements that constitute “forward-looking statements,” including with respect to the initial public offering. No assurance can be given that such offering will be completed on the terms described, or at all. Forward-looking statements are subject to numerous conditions, many of which are beyond the control of the Company, including those set forth in the Risk Factors section of the Company's registration statement and preliminary prospectus for the offering filed with the Securities and Exchange Commission. The Company undertakes no obligation to update these statements for revisions or changes after the date of this press release, except as required by law.
Contact Information:
Amanda Abrams
amanda@ftspac.com
(215) 701-9693
Novo Integrated Sciences, Inc. (OTCQB: NVOSD) (OTCQB: NVOS) ("Novo Integrated Sciences" or the "Company"), a U.S.-based provider of multi-dimensional primary care services in Canada, announced today that the Company has completed all necessary regulatory steps and been approved to uplist to The Nasdaq Capital Market. The ticker symbol will remain unchanged, as "NVOS," and the stock will begin trading on The Nasdaq Capital Market on February 23, 2021.
Robert Mattacchione, the Company’s CEO and Board Chairman, stated, "I am pleased to announce that the Company has been approved to commence trading on The Nasdaq Capital Market. This represents an important milestone for Novo Integrated Sciences. I want to thank our employees for their hard work and perseverance in support of this great accomplishment, and concurrently, our shareholders for their patience and interest regarding the Company. The uplist to The Nasdaq Capital Market creates the opportunity for the Company to have more visibility from a much broader pool of investors and, in turn, increased liquidity. Accordingly, we are now even more enthusiastic about Novo Integrated Sciences’ significant future growth potential. At the same time, we recognize that this growth potential will only be realized by continued adherence to our core values and successfully implementing our strategic plan through unwavering persistence, passion, and discipline."
Maxim Group LLC and Anthony L.G., PLLC are acting as financial advisor and legal counsel, respectively, to Novo Integrated Sciences in connection with the uplist to The Nasdaq Capital Market.
About Novo Integrated Sciences, Inc.
Novo Integrated Sciences, Inc. is a U.S. based corporation which owns Canadian and U.S. subsidiaries that deliver, or intend to deliver, multidisciplinary primary care related services and products through the integration of medical technology, advanced therapeutics and rehabilitative science.
Currently, the Company’s revenue is generated solely through its wholly owned Canadian subsidiary, Novo Healthnet Limited ("NHL"), which provides services and products through both clinic and eldercare related operations.
NHL’s team of multidisciplinary primary health care clinicians and practitioners provide assessment, diagnosis, treatment, pain management, rehabilitation, education and primary prevention for a wide array of orthopedic, musculoskeletal, sports injury, and neurological conditions across various demographics including pediatric, adult, and geriatric populations through NHL’s corporate-owned clinics, a contracted network of affiliate clinics, and eldercare related long-term care homes, retirement homes, and community-based locations in Canada.
Additionally, we continue to expand our patient care philosophy of maintaining an on-going continuous connection with our patient community, beyond the traditional confines of brick-and-mortar facilities, by extending oversight of patient diagnosis, care and monitoring, directly through various Medical Technology Platforms, either in-use or under development.
For more information concerning Novo Integrated Sciences, please visit www.novointegrated.com. For more information on NHL, please visit www.novohealthnet.com.
Forward-Looking Statements
This press release contains forward-looking statements within the meaning of Section 27A of the Securities Act of 1933, as amended, and Section 21E of the Securities Exchange Act of 1934, as amended. All statements other than statements of historical facts included in this press release are forward-looking statements. In some cases, forward-looking statements can be identified by words such as "believe," "expect," "anticipate," "plan," "potential," "continue" or similar expressions. Such forward-looking statements include risks and uncertainties, and there are important factors that could cause actual results to differ materially from those expressed or implied by such forward-looking statements. These factors, risks and uncertainties are discussed in Novo Integrated Sciences’ filings with the Securities and Exchange Commission. Investors should not place any undue reliance on forward-looking statements since they involve known and unknown, uncertainties and other factors which are, in some cases, beyond Novo Integrated Sciences’ control which could, and likely will, materially affect actual results, levels of activity, performance or achievements. Any forward-looking statement reflects Novo Integrated Sciences’ current views with respect to future events and is subject to these and other risks, uncertainties and assumptions relating to operations, results of operations, growth strategy and liquidity. Novo Integrated Sciences assumes no obligation to publicly update or revise these forward-looking statements for any reason, or to update the reasons actual results could differ materially from those anticipated in these forward-looking statements, even if new information becomes available in the future. The contents of any website referenced in this press release are not incorporated by reference herein.
View source version on businesswire.com: https://www.businesswire.com/news/home/20210222005782/en/
Contacts
Chris David, President
Novo Integrated Sciences, Inc.
chris.david@novointegrated.com
(206) 617-9797
What trends should we look for it we want to identify stocks that can multiply in value over the long term? One common approach is to try and find a company with returns on capital employed (ROCE) that are increasing, in conjunction with a growing amount of capital employed. Basically this means that a company has profitable initiatives that it can continue to reinvest in, which is a trait of a compounding machine. So on that note, Archon Minerals (CVE:ACS) looks quite promising in regards to its trends of return on capital.
What is Return On Capital Employed (ROCE)?
For those who don't know, ROCE is a measure of a company's yearly pre-tax profit (its return), relative to the capital employed in the business. The formula for this calculation on Archon Minerals is:
Return on Capital Employed = Earnings Before Interest and Tax (EBIT) ÷ (Total Assets – Current Liabilities)
0.00063 = CA$35k ÷ (CA$65m – CA$11m) (Based on the trailing twelve months to November 2020).
Therefore, Archon Minerals has an ROCE of 0.06%. Even though it's in line with the industry average of 0.4%, it's still a low return by itself.
View our latest analysis for Archon Minerals

While the past is not representative of the future, it can be helpful to know how a company has performed historically, which is why we have this chart above. If you'd like to look at how Archon Minerals has performed in the past in other metrics, you can view this free graph of past earnings, revenue and cash flow.
What Does the ROCE Trend For Archon Minerals Tell Us?
It's great to see that Archon Minerals has started to generate some pre-tax earnings from prior investments. Historically the company was generating losses but as we can see from the latest figures referenced above, they're now earning 0.06% on their capital employed. Additionally, the business is utilizing 26% less capital than it was five years ago, and taken at face value, that can mean the company needs less funds at work to get a return. Archon Minerals could be selling under-performing assets since the ROCE is improving.
For the record though, there was a noticeable increase in the company's current liabilities over the period, so we would attribute some of the ROCE growth to that. Effectively this means that suppliers or short-term creditors are now funding 16% of the business, which is more than it was five years ago. It's worth keeping an eye on this because as the percentage of current liabilities to total assets increases, some aspects of risk also increase.
The Bottom Line On Archon Minerals' ROCE
From what we've seen above, Archon Minerals has managed to increase it's returns on capital all the while reducing it's capital base. And since the stock has dived 85% over the last five years, there may be other factors affecting the company's prospects. Regardless, we think the underlying fundamentals warrant this stock for further investigation.
If you want to know some of the risks facing Archon Minerals we've found 4 warning signs (3 shouldn't be ignored!) that you should be aware of before investing here.
For those who like to invest in solid companies, check out this free list of companies with solid balance sheets and high returns on equity.
This article by Simply Wall St is general in nature. It does not constitute a recommendation to buy or sell any stock, and does not take account of your objectives, or your financial situation. We aim to bring you long-term focused analysis driven by fundamental data. Note that our analysis may not factor in the latest price-sensitive company announcements or qualitative material. Simply Wall St has no position in any stocks mentioned.
Have feedback on this article? Concerned about the content? Get in touch with us directly. Alternatively, email editorial-team (at) simplywallst.com.
There's no doubt that money can be made by owning shares of unprofitable businesses. For example, biotech and mining exploration companies often lose money for years before finding success with a new treatment or mineral discovery. But while the successes are well known, investors should not ignore the very many unprofitable companies that simply burn through all their cash and collapse.
So, the natural question for AuMake (ASX:AUK) shareholders is whether they should be concerned by its rate of cash burn. In this report, we will consider the company's annual negative free cash flow, henceforth referring to it as the 'cash burn'. First, we'll determine its cash runway by comparing its cash burn with its cash reserves.
See our latest analysis for AuMake
How Long Is AuMake's Cash Runway?
You can calculate a company's cash runway by dividing the amount of cash it has by the rate at which it is spending that cash. As at December 2020, AuMake had cash of AU$9.0m and such minimal debt that we can ignore it for the purposes of this analysis. Importantly, its cash burn was AU$13m over the trailing twelve months. So it had a cash runway of approximately 9 months from December 2020. That's quite a short cash runway, indicating the company must either reduce its annual cash burn or replenish its cash. The image below shows how its cash balance has been changing over the last few years.

Is AuMake's Revenue Growing?
We're hesitant to extrapolate on the recent trend to assess its cash burn, because AuMake actually had positive free cash flow last year, so operating revenue growth is probably our best bet to measure, right now. The harsh truth is that operating revenue dropped 67% in the last year, which is quite problematic for a cash burning company. Of course, we've only taken a quick look at the stock's growth metrics, here. You can take a look at how AuMake has developed its business over time by checking this visualization of its revenue and earnings history.
How Easily Can AuMake Raise Cash?
Given its problematic fall in revenue, AuMake shareholders should consider how the company could fund its growth, if it turns out it needs more cash. Generally speaking, a listed business can raise new cash through issuing shares or taking on debt. Commonly, a business will sell new shares in itself to raise cash and drive growth. By comparing a company's annual cash burn to its total market capitalisation, we can estimate roughly how many shares it would have to issue in order to run the company for another year (at the same burn rate).
Since it has a market capitalisation of AU$26m, AuMake's AU$13m in cash burn equates to about 48% of its market value. From this perspective, it seems that the company spent a huge amount relative to its market value, and we'd be very wary of a painful capital raising.
How Risky Is AuMake's Cash Burn Situation?
We must admit that we don't think AuMake is in a very strong position, when it comes to its cash burn. While its cash runway wasn't too bad, its falling revenue does leave us rather nervous. After considering the data discussed in this article, we don't have a lot of confidence that its cash burn rate is prudent, as it seems like it might need more cash soon. Taking a deeper dive, we've spotted 5 warning signs for AuMake you should be aware of, and 2 of them are a bit unpleasant.
Of course AuMake may not be the best stock to buy. So you may wish to see this free collection of companies boasting high return on equity, or this list of stocks that insiders are buying.
This article by Simply Wall St is general in nature. It does not constitute a recommendation to buy or sell any stock, and does not take account of your objectives, or your financial situation. We aim to bring you long-term focused analysis driven by fundamental data. Note that our analysis may not factor in the latest price-sensitive company announcements or qualitative material. Simply Wall St has no position in any stocks mentioned.
Have feedback on this article? Concerned about the content? Get in touch with us directly. Alternatively, email editorial-team (at) simplywallst.com.
Some investors rely on dividends for growing their wealth, and if you're one of those dividend sleuths, you might be intrigued to know that Hargreaves Services Plc (LON:HSP) is about to go ex-dividend in just three days. You can purchase shares before the 25th of February in order to receive the dividend, which the company will pay on the 6th of April.
Hargreaves Services's upcoming dividend is UK£0.027 a share, following on from the last 12 months, when the company distributed a total of UK£0.054 per share to shareholders. Based on the last year's worth of payments, Hargreaves Services has a trailing yield of 1.7% on the current stock price of £3.18. Dividends are an important source of income to many shareholders, but the health of the business is crucial to maintaining those dividends. We need to see whether the dividend is covered by earnings and if it's growing.
View our latest analysis for Hargreaves Services
If a company pays out more in dividends than it earned, then the dividend might become unsustainable – hardly an ideal situation. Last year, Hargreaves Services paid out 223% of its profit to shareholders in the form of dividends. This is not sustainable behaviour and requires a closer look on behalf of the purchaser. A useful secondary check can be to evaluate whether Hargreaves Services generated enough free cash flow to afford its dividend. It paid out 10% of its free cash flow as dividends last year, which is conservatively low.
It's good to see that while Hargreaves Services's dividends were not covered by profits, at least they are affordable from a cash perspective. If executives were to continue paying more in dividends than the company reported in profits, we'd view this as a warning sign. Extraordinarily few companies are capable of persistently paying a dividend that is greater than their profits.
Click here to see the company's payout ratio, plus analyst estimates of its future dividends.

Have Earnings And Dividends Been Growing?
Companies with falling earnings are riskier for dividend shareholders. If earnings decline and the company is forced to cut its dividend, investors could watch the value of their investment go up in smoke. Hargreaves Services's earnings per share have plummeted approximately 45% a year over the previous five years.
Another key way to measure a company's dividend prospects is by measuring its historical rate of dividend growth. Hargreaves Services's dividend payments per share have declined at 8.8% per year on average over the past 10 years, which is uninspiring. While it's not great that earnings and dividends per share have fallen in recent years, we're encouraged by the fact that management has trimmed the dividend rather than risk over-committing the company in a risky attempt to maintain yields to shareholders.
Final Takeaway
Should investors buy Hargreaves Services for the upcoming dividend? It's not a great combination to see a company with earnings in decline and paying out 223% of its profits, which could imply the dividend may be at risk of being cut in the future. However, the cash payout ratio was much lower – good news from a dividend perspective – which makes us wonder why there is such a mis-match between income and cashflow. It's not that we think Hargreaves Services is a bad company, but these characteristics don't generally lead to outstanding dividend performance.
So if you're still interested in Hargreaves Services despite it's poor dividend qualities, you should be well informed on some of the risks facing this stock. Every company has risks, and we've spotted 3 warning signs for Hargreaves Services you should know about.
A common investment mistake is buying the first interesting stock you see. Here you can find a list of promising dividend stocks with a greater than 2% yield and an upcoming dividend.
This article by Simply Wall St is general in nature. It does not constitute a recommendation to buy or sell any stock, and does not take account of your objectives, or your financial situation. We aim to bring you long-term focused analysis driven by fundamental data. Note that our analysis may not factor in the latest price-sensitive company announcements or qualitative material. Simply Wall St has no position in any stocks mentioned.
Have feedback on this article? Concerned about the content? Get in touch with us directly. Alternatively, email editorial-team (at) simplywallst.com.
Investors in Petra Diamonds Limited (LON:PDL) had a good week, as its shares rose 5.9% to close at UK£0.018 following the release of its interim results. Although revenues of US$178m were in line with analyst expectations, Petra Diamonds surprised on the earnings front, with an unexpected (statutory) profit of US$0.063 per share a nice improvement on the losses that the analystsforecast. This is an important time for investors, as they can track a company's performance in its report, look at what experts are forecasting for next year, and see if there has been any change to expectations for the business. So we collected the latest post-earnings statutory consensus estimates to see what could be in store for next year.
View our latest analysis for Petra Diamonds

Taking into account the latest results, the consensus forecast from Petra Diamonds' six analysts is for revenues of US$410.0m in 2021, which would reflect a huge 46% improvement in sales compared to the last 12 months. The loss per share is expected to greatly reduce in the near future, narrowing 73% to US$0.04. Yet prior to the latest earnings, the analysts had been forecasting revenues of US$410.0m and losses of US$0.04 per share in 2021.
The average price target fell 6.0% to US$0.048, with the ongoing losses seemingly a concern for the analysts, despite the lack of real change to the earnings forecasts. The consensus price target is just an average of individual analyst targets, so – it could be handy to see how wide the range of underlying estimates is. There are some variant perceptions on Petra Diamonds, with the most bullish analyst valuing it at US$0.098 and the most bearish at US$0.0093 per share. So we wouldn't be assigning too much credibility to analyst price targets in this case, because there are clearly some widely different views on what kind of performance this business can generate. As a result it might not be a great idea to make decisions based on the consensus price target, which is after all just an average of this wide range of estimates.
These estimates are interesting, but it can be useful to paint some more broad strokes when seeing how forecasts compare, both to the Petra Diamonds' past performance and to peers in the same industry. One thing stands out from these estimates, which is that Petra Diamonds is forecast to grow faster in the future than it has in the past, with revenues expected to grow 46%. If achieved, this would be a much better result than the 3.8% annual decline over the past five years. Compare this against analyst estimates for the wider industry, which suggest that (in aggregate) industry revenues are expected to grow 2.7% next year. So it looks like Petra Diamonds is expected to grow faster than its competitors, at least for a while.
The Bottom Line
The most important thing to take away is that the analysts reconfirmed their loss per share estimates for next year. Happily, there were no major changes to revenue forecasts, with the business still expected to grow faster than the wider industry. We note an upgrade to the price target, suggesting that the analysts believes the intrinsic value of the business is likely to improve over time.
Following on from that line of thought, we think that the long-term prospects of the business are much more relevant than next year's earnings. We have estimates – from multiple Petra Diamonds analysts – going out to 2024, and you can see them free on our platform here.
We don't want to rain on the parade too much, but we did also find 2 warning signs for Petra Diamonds that you need to be mindful of.
This article by Simply Wall St is general in nature. It does not constitute a recommendation to buy or sell any stock, and does not take account of your objectives, or your financial situation. We aim to bring you long-term focused analysis driven by fundamental data. Note that our analysis may not factor in the latest price-sensitive company announcements or qualitative material. Simply Wall St has no position in any stocks mentioned.
Have feedback on this article? Concerned about the content? Get in touch with us directly. Alternatively, email editorial-team (at) simplywallst.com.
Stewart, British Columbia–(Newsfile Corp. – February 18, 2021) – Decade Resources Ltd (TSXV: DEC) ("Decade" or the Company) announces that it has received check assays for the first 2 drill holes on the Del Norte property. Results were first announced in a February 11 2021 press release based on ICP results. Results for silver from the re-check fire assaying show appreciable enhancement of values versus the initial ICP results. Based on the enhanced silver results, the Company is re-issuing the results from the intersections. For DDH DN20-01 check assays indicate an increase from 386 g/t Ag eq to 1078 g/t Ag eq in the Kosciuszko zone. Results of check assays for DDH DN20-02 confirm the initial results. A table showing the check assay results are shown as follows:
|
DDH # |
From |
To(m) |
Width |
Au g/t |
Ag g/t |
Ag g/t |
|
DN20-01 |
162.69 |
164.69 |
1.8 |
4.50 |
754.0 |
1078.0* |
|
DN20-02 |
167.72 |
171.45 |
4.34 |
0.78 |
42.68 |
98.9* |
Analytical values have been rounded.
*Silver-equivalent values for gold and silver only (no base metals), calculated assuming 100% metal recovery. Assumptions: US$25/oz silver, US$1800/oz gold: 1:72 ratio.
The Company is presently check assaying any enhanced ICP silver values using fire assay methods. Once check results are obtained, the Company will report them.
A map showing the various silver rich zones in the central portion of the Del Norte property has been included. The objective of the past years exploration program was to confirm past results, expand the area of mineralization and follow up on some previous geological interpretations.
Ed Kruchkowski, President of the Company comments, "The Company was very successful in not only confirming previous results but outlining numerous silver rich areas for further exploration. The property has numerous different mineralization styles and the Company focused on the silver bearing veins and breccias. At the start of the program there were 2 main silver bearing trends outlined and at the conclusion of 2020 exploration, the Company had defined 6 different systems. The zones show great continuity and grades over long distances. At the start of this year's exploration, historic drilling had indicated a possible wide zone of mineralization based on the Company's interpretation, that was named the Argo zone. It does not outcrop and is at depth just to the west of the LG vein. Shallow holes did not intersect this zone but the deeper holes were successful in confirming the zone as well as indicating the presence of appreciable mineralization. Work in 2021 will aim at expanding the area of this deeper mineralization as well as testing new zones."
Analysis were performed by Activation Laboratories Ltd in Kamloops BC.
Ed Kruchkowski, P. Geo., a qualified person under National Instrument 43-101 is responsible for the contents of this release. E. Kruchkowski is not independent of Decade as he is the president of the Company.
Decade Resources Ltd. is a Canadian based mineral exploration company actively seeking opportunities in the resource sector. Decade holds numerous properties at various stages of development and exploration from basic grass roots to advanced ones. Its properties and projects are all located in the "Golden Triangle" area of northern British Columbia. For a complete listing of the Company assets and developments, visit the Company website at www.decaderesources.ca which is presently being updated. For investor information please call 250-636-2264 or Gary Assaly at 604-377-7969.
ON BEHALF OF THE BOARD OF DECADE RESOURCES LTD.
"Ed Kruchkowski"
Ed Kruchkowski, President
"Neither the TSX Venture Exchange nor its Regulation Services Provider (as that term is defined in the policies of the TSX Venture Exchange) accepts responsibility for the adequacy or accuracy of this release."
"This news release may contain forward-looking statements. Forward-looking statements address future events and conditions and therefore involve inherent risks and uncertainties. Actual results may differ materially from those currently anticipated in such statements."

Del Norte Project
To view an enhanced version of this map, please visit:
https://orders.newsfilecorp.com/files/3615/74811_decadefigure1.jpg

To view the source version of this press release, please visit https://www.newsfilecorp.com/release/74811
With the business potentially at an important milestone, we thought we'd take a closer look at Petra Diamonds Limited's (LON:PDL) future prospects. Petra Diamonds Limited engages in the mining, exploration, processing, sorting, and sale of rough diamonds in South Africa and Tanzania. The UK£15m market-cap company posted a loss in its most recent financial year of US$190m and a latest trailing-twelve-month loss of US$127m shrinking the gap between loss and breakeven. The most pressing concern for investors is Petra Diamonds' path to profitability – when will it breakeven? Below we will provide a high-level summary of the industry analysts’ expectations for the company.
View our latest analysis for Petra Diamonds
According to the 6 industry analysts covering Petra Diamonds, the consensus is that breakeven is near. They anticipate the company to incur a final loss in 2022, before generating positive profits of US$33m in 2023. Therefore, the company is expected to breakeven roughly 2 years from now. What rate will the company have to grow year-on-year in order to breakeven on this date? Using a line of best fit, we calculated an average annual growth rate of 77%, which signals high confidence from analysts. Should the business grow at a slower rate, it will become profitable at a later date than expected.

Underlying developments driving Petra Diamonds' growth isn’t the focus of this broad overview, but, take into account that generally a metal and mining business has lumpy cash flows which are contingent on the natural resource mined and stage at which the company is operating. This means that a high growth rate is not unusual, especially if the company is currently in an investment period.
One thing we would like to bring into light with Petra Diamonds is its debt-to-equity ratio of over 2x. Typically, debt shouldn’t exceed 40% of your equity, and the company has considerably exceeded this. A higher level of debt requires more stringent capital management which increases the risk in investing in the loss-making company.
Next Steps:
There are key fundamentals of Petra Diamonds which are not covered in this article, but we must stress again that this is merely a basic overview. For a more comprehensive look at Petra Diamonds, take a look at Petra Diamonds' company page on Simply Wall St. We've also compiled a list of key aspects you should look at:
-
Valuation: What is Petra Diamonds worth today? Has the future growth potential already been factored into the price? The intrinsic value infographic in our free research report helps visualize whether Petra Diamonds is currently mispriced by the market.
-
Management Team: An experienced management team on the helm increases our confidence in the business – take a look at who sits on Petra Diamonds’s board and the CEO’s background.
-
Other High-Performing Stocks: Are there other stocks that provide better prospects with proven track records? Explore our free list of these great stocks here.
This article by Simply Wall St is general in nature. It does not constitute a recommendation to buy or sell any stock, and does not take account of your objectives, or your financial situation. We aim to bring you long-term focused analysis driven by fundamental data. Note that our analysis may not factor in the latest price-sensitive company announcements or qualitative material. Simply Wall St has no position in any stocks mentioned.
Have feedback on this article? Concerned about the content? Get in touch with us directly. Alternatively, email editorial-team (at) simplywallst.com.
If you would like to receive our free newsletter via email, simply enter your email address below & click subscribe.
 Follow us on Twitter
 Become our facebook fan
CONNECT WITH US
Tweets
Tweet with hash tag #miningfeeds or @miningfeeds and your tweets will be displayed across this site.
MOST ACTIVE MINING STOCKS
Daily Gainers
 CMC Metals Ltd. CMC Metals Ltd. |
CMB.V | +900.00% |
 Eden Energy Ltd Eden Energy Ltd |
EDE.AX | +200.00% |
| GoviEx Uranium Inc. |
GXU.V | +42.86% |
| Eagle Nickel Ltd. |
ENL.AX | +41.67% |
| Citigold Corp. Limited |
CTO.AX | +33.33% |
| Mount Burgess Mining NL |
MTB.AX | +33.33% |
| Exalt Resources Limited |
ERD.AX | +31.94% |
| Casa Minerals Inc. |
CASA.V | +30.00% |
| Cariboo Rose Resources Ltd |
CRB.V | +28.57% |
| Belmont Resources Inc. |
BEA.V | +28.57% |