Virtual Investor Conferences
Company Executives Share Vision and Answer Questions Live at VirtualInvestorConferences.com
NEW YORK, Nov. 18, 2025 (GLOBE NEWSWIRE) — Virtual Investor Conferences, the leading proprietary investor conference series, announced the agenda for the Australian Rare Earths & Critical Minerals Virtual Investor Conference to be held on November 19th. This event is co-sponsored by Viriathus Capital.
Individual investors, institutional investors, advisors, and analysts are invited to attend.REGISTER HERE
It is recommended that investors pre-register and run the online system check to expedite participation and receive event updates. There is no cost to log-in, attend live presentations, or schedule 1×1 meetings with management.
Presentations are available for replay for 90 days.
Please Schedule 1×1 Meetings Here
“We are delighted to host the Australian Rare Earths and Critical Minerals Virtual Investor Conference on November 19th,” said Jason Paltrowitz, Executive Vice President of Corporate Services at OTC Markets Group. “The event provides a unique platform for issuers to engage a broader investor base and share their vision with the market. We value the collaboration with our co-sponsor Viriathus and look forward to an insightful discussion featuring Lynas Rare Earths Limited and Viriathus Capital.”
November 19th
|
US EasternTime (ET) |
Presentation |
Ticker(s) |
|
9:15 AM ET |
Lynas Rare Earths Limited |
|
|
10:30 AM ET |
Tungsten Mining NL |
|
|
11:00 AM ET |
Resolution Minerals Ltd. |
|
|
11:30 AM ET |
Lockley Resources Limited |
|
|
12:00 PM ET |
American Rare Earth Limited |
|
|
12:30 PM ET |
Red Mountain Mining Limited |
|
|
1:00 PM ET |
Ionic Rare Earths Limited |
|
|
1:30 PM ET |
Graphene Manufacturing Group Limited |
|
|
2:00 PM ET |
Talga Group Limited |
|
|
2:30 PM ET |
CuFe Limited |
|
|
3:00 PM ET |
Brazilian Rare Earths Limited |
|
|
3:30 PM ET |
Dateline Resources Limited |
|
|
4:00 PM ET |
Latrobe Magnesium Limited |
To facilitate investor relations scheduling and to view a complete calendar of Virtual Investor Conferences, please visit www.virtualinvestorconferences.com.
About Virtual Investor Conferences®
Virtual Investor Conferences (VIC) is the leading proprietary investor conference series that provides an interactive forum for publicly traded companies to seamlessly present directly to investors.
Providing a real-time investor engagement solution, VIC is specifically designed to offer companies more efficient investor access. Replicating the components of an on-site investor conference, VIC offers companies enhanced capabilities to connect with investors, schedule targeted one-on-one meetings and enhance their presentations with dynamic video content. Accelerating the next level of investor engagement, Virtual Investor Conferences delivers leading investor communications to a global network of retail and institutional investors.
Media Contact: OTC Markets Group Inc. +1 (212) 896-4428, media@otcmarkets.com
Virtual Investor Conferences Contact:Stephen Shipley VP, Client Relationship and Business Development Manager (APAC)OTC Markets Group (212) 896-4455sshipley@otcmarkets.com
Brisbane, Queensland, Australia–(Newsfile Corp. – August 21, 2025) – Graphene Manufacturing Group Ltd. (TSXV: GMG) (OTCQX: GMGMF) ("GMG" or the "Company") is pleased to announce that as a result of strong investor demand, the Company has increased the size of its previously announced "bought deal" public offering (the "Underwritten Offering") from gross proceeds of approximately C$5,000,000 to gross proceeds of approximately C$6,000,000. Pursuant to the upsized Underwritten Offering, Red Cloud Securities Inc. ("Red Cloud"), as sole underwriter and bookrunner, has agreed to purchase for resale 6,666,667 units of the Company (each, a "Unit") at a price of C$0.90 per Unit (the "Offering Price").
Each Unit will consist of one common share of the Company (each, a "Unit Share") and one common share purchase warrant (each, a "Warrant"). Each Warrant shall entitle the holder to purchase one common share of the Company (each, a "Warrant Share") at a price of C$1.35 at any time on or before that date which is 36 months after the Closing Date (as herein defined).
The Company has granted to the Underwriter an option (the "Over-Allotment Option", and together with the Underwritten Offering, the "Offering"), exercisable, in whole or in part, at any time for a period of up to 30 days after and including the Closing Date, to purchase for resale the number of additional Units equal to up to 15% of the number of Units sold pursuant to the Underwritten Offering at the Offering Price to cover over allotments, if any, and for market stabilization purposes.
The net proceeds from the Offering will be used by the Company to fund ongoing operations including, but not limited to, commercial development, product development and working capital.In connection with the Offering, the Company intends to file a prospectus supplement (the "Supplement") to the Company's final short form base shelf prospectus dated March 7, 2025 (the "Shelf Prospectus"), with the securities regulatory authorities in each of the provinces and territories of Canada, except Quebec. The Units may also be sold in the United States on a private placement basis pursuant to one or more exemptions from the registration requirements of the United States Securities Act of 1933, as amended (the "U.S. Securities Act") and in such other jurisdictions outside of Canada and the United States, in each case in accordance with all applicable laws provided that no prospectus, registration statement or similar document is required to be filed in such jurisdiction, and provided the issuance of the Units (including the underlying securities) is permitted under laws applicable to the Company (including the Australian Corporations Act 2001 (Cth).
Copies of the Shelf Prospectus and the Supplement to be filed in connection with the Offering, can be found on SEDAR+ at www.sedarplus.ca. The Shelf Prospectus contains, and the Supplement will contain, important detailed information about the Company and the Offering. Prospective investors should read the Supplement, the Shelf Prospectus and the other documents the Company has filed on SEDAR+ at www.sedarplus.ca before making an investment decision.
The Offering is expected to close on or about September 3, 2025 (the "Closing Date"), or on such date as agreed upon between the Company and Red Cloud. The closing of the Offering is subject to the Company receiving all necessary regulatory approvals, including the approval of the TSX Venture Exchange to list, on the Closing Date, the common shares of the Company issuable from the sale of Units as well as upon the exercise of the Warrants.
This press release is not an offer to sell or the solicitation of an offer to buy the securities in the United States or in any jurisdiction in which such offer, solicitation or sale would be unlawful prior to qualification or registration under the securities laws of such jurisdiction. The securities being offered have not been, nor will they be, registered under the U.S. Securities Act, and such securities may not be offered or sold within the United States or to, or for the account or benefit of, U.S. persons absent registration or an applicable exemption from U.S. registration requirements and applicable U.S. state securities laws.
About GMG
GMG is an Australian-based clean-technology company, which develops, makes and sells energy saving and energy storage solutions, enabled by graphene manufactured via in-house production process. GMG uses its own proprietary production process to decompose natural gas (i.e. methane) into its natural elements, carbon (as graphene), hydrogen and some residual hydrocarbon gases. This process produces high quality, low-cost, scalable, 'tuneable' and low/no contaminant graphene suitable for use in clean technology and other applications.
The Company's present focus is to de-risk and develop commercial scale-up capabilities, and secure market applications. In the energy savings segment, GMG has initially focused on graphene enhanced heating, ventilation and air conditioning ("HVAC-R") coating (or energy saving coating), which is now being marketed into other applications, including electronic heat sinks, industrial process plants and data centres. Another product GMG has developed is the graphene lubricant additive focused on saving liquid fuels initially for diesel engines.
In the energy storage segment, GMG and the University of Queensland are working collaboratively with financial support from the Australian Government to progress R&D and commercialization of graphene aluminium-ion batteries ("G+AI Batteries"). GMG has also developed a graphene additive slurry that is aimed to improve the performance of lithium ion batteries.
GMG's 4 critical business objectives are:
Produce Graphene and Improve/Scale Cell Production Processes
Build Revenue from Energy Savings Products
Develop Next-Generation Battery
Develop Supply Chain, Partners & Project Execution Capability
For further information please contact:
-
Craig Nicol, Chief Executive Officer & Managing Director of the Company at craig.nicol@graphenemg.com, +61 415 445 223
-
Leo Karabelas at Focus Communications Investor Relations, leo@fcir.ca, +1 647 689 6041
Neither the TSX Venture Exchange nor its Regulation Services Provider (as that term is defined in the policies of the TSX Venture Exchange) accept responsibility for the adequacy or accuracy of this news release.
Cautionary Note Regarding Forward-Looking Statements
This news release includes certain statements and information that may constitute forward-looking information within the meaning of applicable Canadian securities laws. Forward-looking statements relate to future events or future performance and reflect the expectations or beliefs of management of the Company regarding future events. Generally, forward-looking statements and information can be identified by the use of forward-looking terminology such as "intends", "expects" or "anticipates", or variations of such words and phrases or statements that certain actions, events or results "may", "could", "should", "would" or will "potentially" or "likely" occur. This information and these statements, referred to herein as "forward‐looking statements", are not historical facts, are made as of the date of this news release and include without limitation, statements regarding the expected size and terms of the Offering, the anticipated timing of closing the Offering, the ability of the Company to satisfy all conditions to closing the Offering, and the expected use of proceeds from the Offering.
Such forward-looking statements are based on a number of assumptions of management, including, without limitation, expectations and assumptions concerning the business objectives of the Company; the Company's ability to carry out current planned capital projects, research and development, manufacturing, production, sales and marketing programs for its graphene and graphene-enhanced products and solutions; that the Company will receive the necessary regulatory approvals for the Offering; use the proceeds from the Offering as anticipated; the Company's performance and general business and economic conditions.
Additionally, forward-looking information involves a variety of known and unknown risks, uncertainties and other factors which may cause the actual plans, intentions, activities, results, performance or achievements of GMG to be materially different from any future plans, intentions, activities, results, performance or achievements expressed or implied by such forward-looking statements. Such risks include, without limitation: the risk that the Company is not able to use the proceeds from the Offering as anticipated by management; the risk that the Company does not receive the requisite regulatory approvals for the Offering; overall economic conditions; technical de-risking and market acceptance for the Company's products and solutions; the introduction of competing technologies or products; stock market volatility; environmental and regulatory requirements; competitive pressures; change in market conditions and other factors that may cause the actual results, performance or achievements of the Company to differ materially from those expressed or implied in these forward-looking statements; the volatility of global capital markets; political instability; the failure of the Company to obtain regulatory approvals, attract and retain skilled personnel; unexpected development and production challenges; unanticipated costs and the risk factors set out under the heading "Risk Factors" in the Company's annual information form dated October 3, 2024 available for review on the Company's profile at www.sedarplus.ca.
Although management of the Company has attempted to identify important factors that could cause actual results to differ materially from those contained in forward-looking statements or forward-looking information, there may be other factors that cause results not to be as anticipated, estimated or intended. There can be no assurance that such statements will prove to be accurate, as actual results and future events could differ materially from those anticipated in such statements. Accordingly, readers should not place undue reliance on forward-looking statements and forward-looking information. Readers are cautioned that reliance on such information may not be appropriate for other purposes. The Company does not undertake to update any forward-looking statement, forward-looking information or financial outlook that are incorporated by reference herein, except in accordance with applicable securities laws.
NOT FOR DISTRIBUTION TO THE U.S. NEWSWIRE OR FOR DISSEMINATION IN THE UNITED STATES
To view the source version of this press release, please visit https://www.newsfilecorp.com/release/263313
Brisbane, Queensland, Australia–(Newsfile Corp. – August 20, 2025) – Graphene Manufacturing Group Ltd. (TSXV: GMG) (OTCQX: GMGMF) ("GMG" or the "Company") is pleased to announce that it has entered into an agreement with Red Cloud Securities Inc. ("Red Cloud"), as sole underwriter and bookrunner, pursuant to which Red Cloud has agreed to purchase for resale 5,555,556 units of the Company (each, a "Unit") at a price of C$0.90 per Unit (the "Offering Price") on a "bought deal" basis in a public offering for gross proceeds of approximately C$5,000,000 (the "Underwritten Offering").
Each Unit will consist of one common share of the Company (each, a "Unit Share") and one common share purchase warrant (each, a "Warrant"). Each Warrant shall entitle the holder to purchase one common share of the Company (each, a "Warrant Share") at a price of C$1.35 at any time on or before that date which is 36 months after the Closing Date (as herein defined).
The Company has granted to the Underwriter an option (the "Over-Allotment Option", and together with the Underwritten Offering, the "Offering"), exercisable, in whole or in part, at any time for a period of up to 30 days after and including the Closing Date, to purchase for resale the number of additional Units equal to up to 15% of the number of Units sold pursuant to the Underwritten Offering at the Offering Price to cover over allotments, if any, and for market stabilization purposes.
The net proceeds from the Offering will be used by the Company to fund ongoing operations including, but not limited to, commercial development, product development and working capital.
In connection with the Offering, the Company intends to file a prospectus supplement (the "Supplement") to the Company's final short form base shelf prospectus dated March 7, 2025 (the "Shelf Prospectus"), with the securities regulatory authorities in each of the provinces and territories of Canada, except Quebec. The Units may also be sold in the United States on a private placement basis pursuant to one or more exemptions from the registration requirements of the United States Securities Act of 1933, as amended (the "U.S. Securities Act") and in such other jurisdictions outside of Canada and the United States, in each case in accordance with all applicable laws provided that no prospectus, registration statement or similar document is required to be filed in such jurisdiction, and provided the issuance of the Units (including the underlying securities) is permitted under laws applicable to the Company (including the Australian Corporations Act 2001 (Cth).
Copies of the Shelf Prospectus and the Supplement to be filed in connection with the Offering can be found on SEDAR+ at www.sedarplus.ca. The Shelf Prospectus contains, and the Supplement will contain, important detailed information about the Company and the Offering. Prospective investors should read the Supplement, the Shelf Prospectus and the other documents the Company has filed on SEDAR+ at www.sedarplus.ca before making an investment decision.
The Offering is expected to close on or about September 3rd, 2025 (the "Closing Date"), or on such date as agreed upon between the Company and Red Cloud. The closing of the Offering is subject to the Company receiving all necessary regulatory approvals, including the approval of the TSX Venture Exchange to list, on the Closing Date, the common shares of the Company issuable from the sale of Units as well as upon the exercise of the Warrants.
This press release is not an offer to sell or the solicitation of an offer to buy the securities in the United States or in any jurisdiction in which such offer, solicitation or sale would be unlawful prior to qualification or registration under the securities laws of such jurisdiction. The securities being offered have not been, nor will they be, registered under the U.S. Securities Act, and such securities may not be offered or sold within the United States or to, or for the account or benefit of, U.S. persons absent registration or an applicable exemption from U.S. registration requirements and applicable U.S. state securities laws.
About GMG
GMG is an Australian-based clean-technology company, which develops, makes and sells energy saving and energy storage solutions, enabled by graphene manufactured via in-house production process. GMG uses its own proprietary production process to decompose natural gas (i.e. methane) into its natural elements, carbon (as graphene), hydrogen and some residual hydrocarbon gases. This process produces high quality, low-cost, scalable, 'tuneable' and low/no contaminant graphene suitable for use in clean technology and other applications.
The Company's present focus is to de-risk and develop commercial scale-up capabilities, and secure market applications. In the energy savings segment, GMG has initially focused on graphene enhanced heating, ventilation and air conditioning ("HVAC-R") coating (or energy saving coating), which is now being marketed into other applications, including electronic heat sinks, industrial process plants and data centres. Another product GMG has developed is the graphene lubricant additive focused on saving liquid fuels initially for diesel engines.
In the energy storage segment, GMG and the University of Queensland are working collaboratively with financial support from the Australian Government to progress R&D and commercialization of graphene aluminium-ion batteries ("G+AI Batteries"). GMG has also developed a graphene additive slurry that is aimed to improve the performance of lithium ion batteries.
GMG's 4 critical business objectives are:
Produce Graphene and Improve/Scale Cell Production Processes
Build Revenue from Energy Savings Products
Develop Next-Generation Battery
Develop Supply Chain, Partners & Project Execution Capability
For further information please contact:
-
Craig Nicol, Chief Executive Officer & Managing Director of the Company at craig.nicol@graphenemg.com, +61 415 445 223
-
Leo Karabelas at Focus Communications Investor Relations, leo@fcir.ca, +1 647 689 6041
Neither the TSX Venture Exchange nor its Regulation Services Provider (as that term is defined in the policies of the TSX Venture Exchange) accept responsibility for the adequacy or accuracy of this news release.
Cautionary Note Regarding Forward-Looking Statements
This news release includes certain statements and information that may constitute forward-looking information within the meaning of applicable Canadian securities laws. Forward-looking statements relate to future events or future performance and reflect the expectations or beliefs of management of the Company regarding future events. Generally, forward-looking statements and information can be identified by the use of forward-looking terminology such as "intends", "expects" or "anticipates", or variations of such words and phrases or statements that certain actions, events or results "may", "could", "should", "would" or will "potentially" or "likely" occur. This information and these statements, referred to herein as "forward‐looking statements", are not historical facts, are made as of the date of this news release and include without limitation, statements regarding the expected size and terms of the Offering, the anticipated timing of closing the Offering, the ability of the Company to satisfy all conditions to closing the Offering, and the expected use of proceeds from the Offering.
Such forward-looking statements are based on a number of assumptions of management, including, without limitation, expectations and assumptions concerning the business objectives of the Company; the Company's ability to carry out current planned capital projects, research and development, manufacturing, production, sales and marketing programs for its graphene and graphene-enhanced products and solutions; that the Company will receive the necessary regulatory approvals for the Offering; use the proceeds from the Offering as anticipated; the Company's performance and general business and economic conditions.
Additionally, forward-looking information involves a variety of known and unknown risks, uncertainties and other factors which may cause the actual plans, intentions, activities, results, performance or achievements of GMG to be materially different from any future plans, intentions, activities, results, performance or achievements expressed or implied by such forward-looking statements. Such risks include, without limitation: the risk that the Company is not able to use the proceeds from the Offering as anticipated by management; the risk that the Company does not receive the requisite regulatory approvals for the Offering; overall economic conditions; technical de-risking and market acceptance for the Company's products and solutions; the introduction of competing technologies or products; stock market volatility; environmental and regulatory requirements; competitive pressures; change in market conditions and other factors that may cause the actual results, performance or achievements of the Company to differ materially from those expressed or implied in these forward looking statements; the volatility of global capital markets; political instability; the failure of the Company to obtain regulatory approvals, attract and retain skilled personnel; unexpected development and production challenges; unanticipated costs and the risk factors set out under the heading "Risk Factors" in the Company's annual information form dated October 3, 2024 available for review on the Company's profile at www.sedarplus.ca.
Although management of the Company has attempted to identify important factors that could cause actual results to differ materially from those contained in forward-looking statements or forward-looking information, there may be other factors that cause results not to be as anticipated, estimated or intended. There can be no assurance that such statements will prove to be accurate, as actual results and future events could differ materially from those anticipated in such statements. Accordingly, readers should not place undue reliance on forward-looking statements and forward-looking information. Readers are cautioned that reliance on such information may not be appropriate for other purposes. The Company does not undertake to update any forward-looking statement, forward-looking information or financial outlook that are incorporated by reference herein, except in accordance with applicable securities laws.
NOT FOR DISTRIBUTION TO THE U.S. NEWSWIRE OR FOR DISSEMINATION IN THE UNITED STATES
To view the source version of this press release, please visit https://www.newsfilecorp.com/release/263207
It doesn't matter your age or experience: taking full advantage of the stock market and investing with confidence are common goals for all investors.
Achieving those goals is made easier with the Zacks Style Scores, a unique set of guidelines that rates stocks based on popular investing methodologies, namely value, growth, and momentum. The Style Scores can help you narrow down which stocks are better for your portfolio and which ones can beat the market over the long-term.
Why Investors Should Pay Attention to This Value Stock
Value investors love finding good stocks at good prices, especially before the broader market catches on to a stock's true value. Utilizing ratios like P/E, PEG, Price/Sales, and Price/Cash Flow, the Value Style Score identifies the most attractive and most discounted stocks.
Freeport-McMoRan (FCX)
Based in Phoenix, AZ, Freeport-McMoRan Inc., formerly Freeport-McMoRan Copper & Gold Inc., is engaged in mineral exploration and development; mining and milling of copper, gold, molybdenum and silver; as well as the smelting and refining of copper concentrates. The company conducts its operations primarily through its principal operating subsidiaries, PT Freeport Indonesia (PT-FI), Freeport Minerals Corporation and Atlantic Copper. PT Freeport Indonesia’s principal asset is Papua, Indonesia-based Grasberg mine, which contains the world’s largest copper and gold reserves.
FCX sits at a Zacks Rank #3 (Hold), holds a Value Style Score of B, and has a VGM Score of A. Compared to the Mining – Non Ferrous industry's P/E of 20.4X, shares of Freeport-McMoRan are trading at a forward P/E of 22.8X. FCX also has a PEG Ratio of 0.7, a Price/Cash Flow ratio of 12.5X, and a Price/Sales ratio of 2.2X.
Many value investors pay close attention to a company's earnings as well. For FCX, four analysts revised their earnings estimate upwards in the last 60 days, and the Zacks Consensus Estimate has increased $0.02 to $1.67 per share for 2025. Per share FCX boasts an average earnings surprise of 10.5%.
With strong valuation and earnings metrics, a good Zacks Rank, and top-tier Value and VGM Style Scores, investors should strongly think about adding FCX to their portfolios.
Want the latest recommendations from Zacks Investment Research? Today, you can download 7 Best Stocks for the Next 30 Days. Click to get this free report
Freeport-McMoRan Inc. (FCX) : Free Stock Analysis Report
This article originally published on Zacks Investment Research (zacks.com).
Brisbane, Queensland, Australia–(Newsfile Corp. – May 21, 2025) – Graphene Manufacturing Group Limited (TSXV: GMG) ("GMG" or the "Company") is pleased to announce that the board of directors of GMG have approved the investment of AU$900k for the early works of an expected 10 tonne per annum Gen 2.0 Graphene Manufacturing Technology plant (the "Gen 2.0 Plant") for an estimated AU$2.3 million total capital cost. This expenditure was largely included in the proposed use of proceeds for the March 2025 Bought Deal Financing of C$5,796,000.
The Gen 2.0 Plant will be built at the existing natural gas to graphene production plant at its manufacturing facility in Richlands, Queensland, Australia. The early works include the procurement of long lead items and commencement of engineering and design works.
The Gen 2.0 Plant is expected to be online by end of June 2026, with production limited to 1 tonne per annum until further work is completed on upgrading packaging systems expected shortly thereafter. The final project is expected to be largely self-powered from standalone energy generation from renewable sources, energy storage system and hydrogen enriched natural gas tail gas power generation. The final project is also expected to include a semi-autonomous bulk graphene packaging system.
Figure 1: GMG Headquarters Layout
To view an enhanced version of this graphic, please visit:https://images.newsfilecorp.com/files/8082/252902_graphene1en.jpg
The Gen 2.0 Plant is based on the GMG plasma technology, Figure 2, with which the Company has been making graphene for over seven years. However, the Gen 2.0 Plant will utilize newly iterated technology which is expected to produce up to 20 times more production per unit than the previous technology. This new technology is expected to deliver:
-
a substantial reduction in capital cost per tonne of production capacity
-
a substantial reduction in cost of goods per kilogram produced
-
an increase in quality of the graphene materials produced
Figure 2: Artistic Image of Natural Gas to Graphene Plasma
To view an enhanced version of this graphic, please visit:https://images.newsfilecorp.com/files/8082/252902_f96ceb0e94ebf96d_017full.jpg
The details of the proposed Gen 2.0 Plant are as follows:
-
Technology is based on ongoing development of GMG's plasma technology which splits natural gas into graphene and hydrogen gas and captures the graphene nanoplatelets.
-
Automation is expected to allow for repeatable graphene quality, high plant reliability and lower requirement for operator activities.
-
The graphene production technology is expected to be able to make the different graphene required for GMG's end products – including THERMAL-XR®, G® LUBRICANT, SUPA G® and the Graphene Aluminium Ion Battery.
-
This type of new technology production plant can be built in various locations around the world, for example in North America where natural gas cost is low and abundantly available, significantly reducing the cost of the graphene. At scale the GMG graphene production process will produce large amounts of hydrogen as well.
GMG's Managing Director and CEO, Craig Nicol, commented: "We are very excited to move ahead with our next generation technology for graphene production – it is a significant milestone for the company. We expect to see better quality graphene at even lower costs and much higher production rates."
GMG's Chairman and Director, Jack Perkowski, commented: "This is the next exciting step before we look to expand to likely North American based expansion plants – where "cookie-cutter" projects can be rolled out with only minor changes for production expansion with lower cost gas and other benefits being in the North American market."
About GMG:
GMG is an Australian based clean-technology company which develops, makes and sells energy saving and energy storage solutions, enabled by graphene manufactured via in house production process. GMG uses its own proprietary production process to decompose natural gas (i.e. methane) into its natural elements, carbon (as graphene), hydrogen and some residual hydrocarbon gases. This process produces high quality, low cost, scalable, 'tuneable' and low/no contaminant graphene suitable for use in clean-technology and other applications.
The Company's present focus is to de-risk and develop commercial scale-up capabilities, and secure market applications. In the energy savings segment, GMG has initially focused on graphene enhanced heating, ventilation and air conditioning ("HVAC-R") coating (or energy-saving coating) which is now being marketed into other applications including electronic heat sinks, industrial process plants and data centres. Another product GMG has developed is the graphene lubricant additive focused on saving liquid fuels initially for diesel engines.
In the energy storage segment, GMG and the University of Queensland are working collaboratively with financial support from the Australian Government to progress R&D and commercialization of graphene aluminium-ion batteries ("G+AI Batteries"). GMG has also developed a graphene additive slurry that is aimed to improve the performance of lithium-ion batteries.
GMG's 4 critical business objectives are:
Produce Graphene and improve/scale cell production processes
Build Revenue from Energy Savings Products
Develop Next-Generation Battery
Develop Supply Chain, Partners & Project Execution Capability
For further information please contact:
-
Craig Nicol, Chief Executive Officer & Managing Director of the Company at craig.nicol@graphenemg.com, +61 415 445 223
-
Leo Karabelas at Focus Communications Investor Relations, leo@fcir.ca, +1 647 689 6041
Neither the TSX Venture Exchange nor its Regulation Services Provider (as that term is defined in the policies of the TSX Venture Exchange) accept responsibility for the adequacy or accuracy of this news release.
Cautionary Note Regarding Forward-Looking Statements
This news release includes certain statements and information that may constitute forward-looking information within the meaning of applicable Canadian securities laws. Forward-looking statements relate to future events or future performance and reflect the expectations or beliefs of management of the Company regarding future events. Generally, forward-looking statements and information can be identified by the use of forward-looking terminology such as "intends", "expects" or "anticipates", or variations of such words and phrases or statements that certain actions, events or results "may", "could", "should", "would" or will "potentially" or "likely" occur. This information and these statements, referred to herein as "forward‐looking statements", are not historical facts, are made as of the date of this news release and include without limitation, expectations for the graphene production capacity and timing of construction of the Gen 2.0 Plant, temporary production volumes pending upgrading packaging systems, the use and benefits of the new technology to be deployed at the Gen 2.0 Plant, including on production efficiency and end products, largely self-powered from standalone energy generation, the implications of automation at the Gen 2.0 Plant, the semi-autonomous bulk graphene packaging system, the mobility of this type of production plant and the ability to benefit from geographic natural gas price variability and expectations for better quality graphene, lower costs and higher production at the Gen 2.0 Plant.
Such forward-looking statements are based on a number of assumptions of management, including, without limitation that G Lubricant has the potential to optimize efficiency and power for stationary or mobile engines, that G Lubricant has the potential to reshape the future of the global liquid fuels industry, that GMG will commercialize and market G Lubricant, that the Company's patent applications will progress as anticipated, and that the potential market and revenue available for G Lubricant will be as currently forecasted. Additionally, forward-looking information involves a variety of known and unknown risks, uncertainties and other factors which may cause the actual plans, intentions, activities, results, performance or achievements of GMG to be materially different from any future plans, intentions, activities, results, performance or achievements expressed or implied by such forward-looking statements. Such risks include, without limitation: that G Lubricant will not offer an innovative solution that optimizes efficiency and power for stationary or mobile engines, that G Lubricant will not reshape the future of the global liquid fuels industry, that GMG will commercialize and market G Lubricant as anticipated, that the Company's patent applications will not progress as currently anticipated, that the potential market and revenue available for the G Lubricant product is not as currently calculated, risks relating to the extent and duration of the conflict in Eastern Europe and its impact on global markets, the volatility of global capital markets, political instability, the failure of the Company to obtain regulatory approvals, attract and retain skilled personnel, unexpected development and production challenges, unanticipated costs and the risk factors set out under the heading "Risk Factors" in the Company's annual information form dated October 3, 2024 available for review on the Company's profile at www.sedarplus.ca.
Although management of the Company has attempted to identify important factors that could cause actual results to differ materially from those contained in forward-looking statements or forward-looking information, there may be other factors that cause results not to be as anticipated, estimated or intended. There can be no assurance that such statements will prove to be accurate, as actual results and future events could differ materially from those anticipated in such statements. Accordingly, readers should not place undue reliance on forward-looking statements and forward-looking information. Readers are cautioned that reliance on such information may not be appropriate for other purposes. The Company does not undertake to update any forward-looking statement, forward-looking information or financial out-look that are incorporated by reference herein, except in accordance with applicable securities laws. We seek safe harbor.
To view the source version of this press release, please visit https://www.newsfilecorp.com/release/252902
Brisbane, Queensland, Australia–(Newsfile Corp. – May 20, 2025) – Graphene Manufacturing Group Ltd. (TSXV: GMG) (OTCQX: GMGMF) ("GMG" or the "Company") is pleased to announce the launch of website www.g-lubricant.com to facilitate direct sale of its energy saving graphene liquid concentrate G® Lubricant, that enhances the performance of diesel and gasoline (petrol) engines. The launch of the website is with a new animation video promoting the ease and benefits of G-Lubricant (Figure 1).
Figure 1: www.G-Lubricant.com launch animation videoTo view an enhanced version of this graphic, please visit:https://images.newsfilecorp.com/files/8082/252715_gmg4!.jpg
Unleashing the Power of Graphene
G® Lubricant is a graphene liquid concentrate that can be added to any mineral or synthetic oil used in an internal combustion engine. The amount of graphene in the final lubricant once G® Lubricant is added in is only ~ 1:10,000, with the balance of the concentrate consisting of lubricating base oil. As a result, G® Lubricant can be used safely in any internal combustion engine. Over the past four years, GMG has conducted environmentally controlled testing of G® Lubricant in internal combustion engines monitored and verified by The University of Queensland. In those tests, G® Lubricant has been shown to increase fuel efficiency by up to 8.4% in those diesel engines tested. GMG's test results have been corroborated by similar savings realized by customers over a number of years of field testing in diesel and gasoline/petrol engines.
G® Lubricant is currently sold by GMG in different pack sizes on the direct marketing website including a 500 ml litre pack and 8 x 50 ml packs, which can be used to dose 50 litres of engine oil and 8 x 5 liters of engine oil, respectively, to provide improved engine performance. GMG intends to direct market the product to its targeted markets through various pack sizes for direct and bulk use to create awareness of the product and its benefits.
In addition, the Company is discussing global sales with potential distributors in different geographic areas and different original equipment manufacturers.
Further G® Lubricant Performance Tests
GMG carried out further G® Lubricant testing in mid May 2025 – this time in its Company van which was recently professionally serviced – a Mercedes Vito on a third party dyno testing facility (Figure 4) with diesel engine exhaust emissions testing as well (Figure 5).
The performance testing showed demonstrated that the diesel engine van running at approximately 2500 rpm, 100 km/hr with approximately 400 Nm torque, the G® Lubricant provided approximately 13% of fuel savings (Figure 2) and a reduction of harmful NOx exhaust emissions of 27% (Figure 3) compared to testing under similar conditions without the use of any G® Lubricant.
A second dose of G® Lubricant was added to achieve these results due to the age and condition of the engine which has over 360,000 km of use – hence the total amount of graphene per engine oil was 0.02% (2 in 10,000) by weight – there was a total of 160 ml (2 x 80 ml) of G Lubricant added to the 8 litres of engine oil.
Figure 2: Fuel Efficiency Performance Increase from G-LubricantTo view an enhanced version of this graphic, please visit:https://images.newsfilecorp.com/files/8082/252715_gmg1!.jpg
Figure 3: NOx Emissions Performance Increase from G-LubricantTo view an enhanced version of this graphic, please visit:https://images.newsfilecorp.com/files/8082/252715_gmg2.jpg
Figure 4: GMG Company Van in Performance Testing with G-LubricantTo view an enhanced version of this graphic, please visit:https://images.newsfilecorp.com/files/8082/252715_b0364e8ec47ab84d_011full.jpg
Figure 5: Dyno Testing Equipment with Emissions TestingTo view an enhanced version of this graphic, please visit:https://images.newsfilecorp.com/files/8082/252715_gmg3.jpg
About GMG:
GMG is an Australian based clean-technology company which develops, makes and sells energy saving and energy storage solutions, enabled by graphene manufactured via in house production process. GMG uses its own proprietary production process to decompose natural gas (i.e. methane) into its natural elements, carbon (as graphene), hydrogen and some residual hydrocarbon gases. This process produces high quality, low cost, scalable, 'tuneable' and low/no contaminant graphene suitable for use in clean-technology and other applications.
The Company's present focus is to de-risk and develop commercial scale-up capabilities, and secure market applications. In the energy savings segment, GMG has initially focused on graphene enhanced heating, ventilation and air conditioning ("HVAC-R") coating (or energy-saving coating) which is now being marketed into other applications including electronic heat sinks, industrial process plants and data centres. Another product GMG has developed is the graphene lubricant additive focused on saving liquid fuels initially for diesel engines.
In the energy storage segment, GMG and the University of Queensland are working collaboratively with financial support from the Australian Government to progress R&D and commercialization of graphene aluminium-ion batteries ("G+AI Batteries"). GMG has also developed a graphene additive slurry that is aimed to improve the performance of lithium-ion batteries.
GMG's 4 critical business objectives are:
Produce Graphene and improve/scale cell production processes
Build Revenue from Energy Savings Products
Develop Next-Generation Battery
Develop Supply Chain, Partners & Project Execution Capability
For further information please contact:
-
Craig Nicol, Chief Executive Officer & Managing Director of the Company at craig.nicol@graphenemg.com, +61 415 445 223
-
Leo Karabelas at Focus Communications Investor Relations, leo@fcir.ca, +1 647 689 6041
Neither the TSX Venture Exchange nor its Regulation Services Provider (as that term is defined in the policies of the TSX Venture Exchange) accept responsibility for the adequacy or accuracy of this news release.
Cautionary Note Regarding Forward-Looking Statements
This news release includes certain statements and information that may constitute forward-looking information within the meaning of applicable Canadian securities laws. Forward-looking statements relate to future events or future performance and reflect the expectations or beliefs of management of the Company regarding future events. Generally, forward-looking statements and information can be identified by the use of forward-looking terminology such as "intends", "expects" or "anticipates", or variations of such words and phrases or statements that certain actions, events or results "may", "could", "should", "would" or will "potentially" or "likely" occur. This information and these statements, referred to herein as "forward‐looking statements", are not historical facts, are made as of the date of this news release and include without limitation, the ability of G® Lubricant to enhance the performance of diesel and gasoline engines, the amount of G® Lubricant necessary to achieve performance improvements, the safety of G® Lubricant and GMG's intentions to direct market and use new distributors for global sales of G® Lubricant.
Such forward-looking statements are based on a number of assumptions of management, including, without limitation that G® Lubricant has the potential to optimize efficiency and power for stationary or mobile engines, that G® Lubricant has the potential to reshape the future of the global liquid fuels industry, that GMG will commercialize and market G® Lubricant, that the Company's patent applications will progress as anticipated, and that the potential market and revenue available for G® Lubricant will be as currently forecasted. Additionally, forward-looking information involves a variety of known and unknown risks, uncertainties and other factors which may cause the actual plans, intentions, activities, results, performance or achievements of GMG to be materially different from any future plans, intentions, activities, results, performance or achievements expressed or implied by such forward-looking statements. Such risks include, without limitation: that G® Lubricant will not offer an innovative solution that optimizes efficiency and power for stationary or mobile engines, that G® Lubricant will not reshape the future of the global liquid fuels industry, that GMG will commercialize and market G® Lubricant as anticipated, that the Company's patent applications will not progress as currently anticipated, that the potential market and revenue available for the G® Lubricant product is not as currently calculated, risks relating to the extent and duration of the conflict in Eastern Europe and its impact on global markets, the volatility of global capital markets, political instability, the failure of the Company to obtain regulatory approvals, attract and retain skilled personnel, unexpected development and production challenges, unanticipated costs and the risk factors set out under the heading "Risk Factors" in the Company's annual information form dated October 3, 2024 available for review on the Company's profile at www.sedarplus.ca.
Although management of the Company has attempted to identify important factors that could cause actual results to differ materially from those contained in forward-looking statements or forward-looking information, there may be other factors that cause results not to be as anticipated, estimated or intended. There can be no assurance that such statements will prove to be accurate, as actual results and future events could differ materially from those anticipated in such statements. Accordingly, readers should not place undue reliance on forward-looking statements and forward-looking information. Readers are cautioned that reliance on such information may not be appropriate for other purposes. The Company does not undertake to update any forward-looking statement, forward-looking information or financial out-look that are incorporated by reference herein, except in accordance with applicable securities laws. We seek safe harbor.
To view the source version of this press release, please visit https://www.newsfilecorp.com/release/252715
Brisbane, Queensland, Australia–(Newsfile Corp. – April 25, 2025) – Graphene Manufacturing Group Limited (TSXV: GMG) ("GMG" or the "Company") provides a quarterly update with respect to the Company's previously announced "at-the-market" equity program (the "ATM Program") launched on June 13, 2024. The ATM Program allows the Company to issue and sell, from time to time, up to C$20,000,000 of its ordinary shares ("Ordinary Shares") from treasury to the public, at the Company's discretion, pursuant to an equity distribution agreement between the Company and Cantor Fitzgerald Canada Corporation (the "Agent").
During the quarterly period ended March 31, 2025, the Company issued a total of 866,500 Ordinary Shares on the TSX Venture Exchange (the "TSXV") at an average price of C$0.7965 per share under the ATM Program, providing gross proceeds of C$690,196.80. Commissions of C$20,705.90 were paid to the Agent in relation to these distributions, resulting in net proceeds to the Company of C$669,490.90.
For further details on the ATM Program, see the Company's news release dated June 14, 2024.
About GMG www.graphenemg.com
GMG is a clean-technology company which seeks to offer energy saving and energy storage solutions, enabled by graphene, including that manufactured in-house via a proprietary production process.
GMG has developed a proprietary production process to decompose natural gas (i.e. methane) into its elements, carbon (as graphene), hydrogen and some residual hydrocarbon gases. This process produces high quality, low cost, scalable, 'tuneable' and low/no contaminant graphene suitable for use in clean-technology and other applications. The Company's present focus is to de-risk and develop commercial scale-up capabilities, and secure market applications.
In the energy savings segment, GMG has focused on graphene enhanced heating, ventilation and air conditioning ("HVAC-R") coating (or energy-saving paint), lubricants and fluids. In the energy storage segment, GMG and the University of Queensland are working collaboratively with financial support from the Australian Government to progress R&D and commercialization of G+AI Batteries.
For further information please contact:
-
Craig Nicol, Chief Executive Officer & Managing Director of the Company at craig.nicol@graphenemg.com, +61 415 445 223
-
Leo Karabelas at Focus Communications Investor Relations, leo@fcir.ca, +1 647 689 6041
Neither the TSX Venture Exchange nor its Regulation Services Provider (as that term is defined in the policies of the TSX Venture Exchange) accept responsibility for the adequacy or accuracy of this news release.
To view the source version of this press release, please visit https://www.newsfilecorp.com/release/249768
Bhagwan Marine (ASX:BWN) First Half 2025 ResultsKey Financial Results
-
Revenue: AU$154.1m (up 41% from 1H 2024).
-
Net income: AU$8.82m (up 102% from 1H 2024).
-
Profit margin: 5.7% (up from 4.0% in 1H 2024). The increase in margin was driven by higher revenue.
-
EPS: AU$0.034 (up from AU$0.03 in 1H 2024).
ASX:BWN Earnings and Revenue History March 5th 2025
All figures shown in the chart above are for the trailing 12 month (TTM) period
Bhagwan Marine shares are down 11% from a week ago.
Risk Analysis
Before we wrap up, we've discovered 2 warning signs for Bhagwan Marine that you should be aware of.
Have feedback on this article? Concerned about the content? Get in touch with us directly. Alternatively, email editorial-team (at) simplywallst.com.This article by Simply Wall St is general in nature. We provide commentary based on historical data and analyst forecasts only using an unbiased methodology and our articles are not intended to be financial advice. It does not constitute a recommendation to buy or sell any stock, and does not take account of your objectives, or your financial situation. We aim to bring you long-term focused analysis driven by fundamental data. Note that our analysis may not factor in the latest price-sensitive company announcements or qualitative material. Simply Wall St has no position in any stocks mentioned.
Brisbane, Queensland, Australia–(Newsfile Corp. – March 3, 2025) – Graphene Manufacturing Group Ltd. (TSXV: GMG) (OTCQX: GMGMF) ("GMG" or the "Company") is pleased to provide the latest progress update on the Graphene Aluminium-Ion Battery technology ("G+AI Battery") being developed by GMG and the University of Queensland ("UQ") under a Joint Development Agreement with Rio Tinto, one of the world's largest metals and mining groups.
Notably, this update includes information about GMG's G+AI Battery regarding:
-
Scaling with the Battery Innovation Center of Indiana, United States.
-
Electrochemistry Optimisation
-
1000 mAh Battery Cell Capacity Reached (Previously)
-
Battery Technology Readiness Level
-
Next Steps Toward Commercialisation and Market Applications
-
Next Generation Battery Performance
-
Important Milestones for GMG's Graphene Aluminium-Ion Battery Development
Scaling with the Battery Innovation Center of Indiana, United States.
GMG is pleased to announce that it has signed a service contract with the Battery Innovation Center of Indiana ("BIC") in the United States of America to support the next phase of development of the Graphene Aluminium-Ion Battery.
Image 1To view an enhanced version of this graphic, please visit:https://images.newsfilecorp.com/files/8082/243059_e0db247a7453eaf3_001full.jpg
BIC is a collaborative initiative designed to incorporate leadership from renowned universities, government agencies, and commercial enterprises. BIC is a public-private partnership and a not-for-profit organization focusing on the rapid development, testing and commercialization of safe, reliable and lightweight energy storage systems for defense and commercial customers. BIC is a unique organization that has been leading battery cell development for world leading battery companies for over 10 years and has carried out over 500 battery development projects.
Image 2: BIC building in Indiana, USATo view an enhanced version of this graphic, please visit:https://images.newsfilecorp.com/files/8082/243059_e0db247a7453eaf3_002full.jpg
BIC's mission is to accelerate innovation in the field of battery technology by providing access to the entire spectrum of R&D to commercialization, including low volume production, in a single 40,000 square foot facility, located in Newberry, an hour south of Bloomington, Indiana. Under one roof and with virtual connections to the research and manufacturing facilities of its partners, BIC has capabilities in all aspects of the battery life cycle.
Image 3: One of the BIC dry rooms including electrode coating equipment
To view an enhanced version of this graphic, please visit:https://images.newsfilecorp.com/files/8082/243059_e0db247a7453eaf3_003full.jpg
By collaborating with BIC, GMG can take advantage of BIC's technological capabilities and manufacturing facilities and avoid the capital cost of building a pilot plant, that can cost more than AU$10 million dollars, to produce sample cells in advance of mass production. Under its service agreement with BIC, GMG will pay for services rendered and retain all intellectual property of the development work. The service agreement with BIC will enable GMG to optimize BIC's cell design and battery manufacturing equipment during its scale up of battery production, thereby delaying capital expenditures for manufacturing capacity until battery development is further derisked.
GMG is very pleased to work with BIC on this next phase in the development of GMG's next generation battery.
Electrochemistry Optimisation
The Company is currently optimising the G+AI Battery pouch cell electrochemistry – which is a standard battery development process step (please see Battery Technology Readiness Level section below).
The Company has developed significant knowledge regarding the electrochemistry of the pouch cells since achieving the targeted 1 Ah cell capacity in February 2024.
The challenges faced by the G+AI Battery during this phase of its maturation are very similar to other battery chemistries that have been developed into mass production – including Lithium-Ion batteries.
The performance of the pouch cells will be communicated upon successfully producing a repeatable and 3rd party tested 1000 mAh+ battery pouch cell.
The Company is confident it can meet its overall timeline on the battery cell roadmap as seen in Figure 1 and as previously communicated.
Figure 1: Battery Cell Roadmap
To view an enhanced version of this graphic, please visit:https://images.newsfilecorp.com/files/8082/243059_e0db247a7453eaf3_004full.jpg
There are five steps in this optimisation process which the Company completes once per week in what it calls a "Sprint" as seen in Figure 2.
Figure 2: Optimisation Weekly Sprint Process
To view an enhanced version of this graphic, please visit:https://images.newsfilecorp.com/files/8082/243059_gmg_figure2.jpg
Make CellThe major components of the G+AI Battery are seen below in Figure 3:Cathode: Graphene, binder and solvent (water or another solution) layered on a metal foil cathode substrate.Anode: Aluminium foilElectrolyte: Aluminium Chloride and ionic fluid (Urea or another solution)Separator: Separator
Figure 3: Graphene Aluminium Ion Battery Components
To view an enhanced version of this graphic, please visit:https://images.newsfilecorp.com/files/8082/243059_e0db247a7453eaf3_006full.jpg
These are assembled in a standard step by step process – which is documented in the Company's operation manual of procedures for the Battery Development Process.
There are many different variations that can be trialled in a cell design which can include, but are not limited to, the following as seen in Figure 4:
-
Anode foil types and thicknesses
-
Improving cycle life
-
Cell assembly processes
-
Processing of the graphene for the Cathode Slurry
-
Coating of the Cathode Slurry
-
Variations in the Electrolyte
-
Charging and Discharging algorithms
-
Optimise nominal voltage and capacity
-
Types of Separators (different materials, suppliers and thicknesses)
-
Optimising of the weight of the materials
Figure 4: Cell Optimisation Variables
To view an enhanced version of this graphic, please visit:https://images.newsfilecorp.com/files/8082/243059_gmg_figure4_550.jpg
Typically, 5 of each battery design is made which ensures a statistical depth to the testing.
A total of 250 individual scientific experiments in pouch cells and near 1000 individual pouch cells were made from 2023 till the present date. The basic modelling of the battery is complete and the Company is now working on dynamic modelling of the battery to support multi variant optimization analysis.
Test Cell PerformanceOnce the Cell Performance is measured (on the charging/discharging stacks) there are certain performance parameters that are observed which include, but are not limited to, the following:- Capacity (mAh)- Nominal Voltage (Volts)- Number of Charging and Discharging Cycles (number)- Physical expansion or contraction of the cell- Physical changes to the cell
This data is then recorded and linked to the cell design and assembly process used to make the cell.
Compare Cell PerformanceThe objective of this step is to understand what design and cell assembly parameters, in an isolated test, have a repeatable causal change in cell performance.
Each Sprint usually focuses on a single variable in design or cell assembly – an example of a 3-week Sprint program is seen in Figure 5.
Figure 5: Sprint Program Example
To view an enhanced version of this graphic, please visit:https://images.newsfilecorp.com/files/8082/243059_gmg_figure5.jpg
Review Optimisation OptionsUpon reviewing optimisation options for the next Sprint, there are many parameters to consider. Often one design parameter of the cell or assembly process will positively improve one cell performance outcome but have a negative impact on another. As the Company optimises various performance outcomes of the battery cell – some of which are shown in Figure 6 – the Company needs to consider the various potential trade-offs on other performance outcomes.
Figure 6: Battery Optimisation Process
To view an enhanced version of this graphic, please visit:https://images.newsfilecorp.com/files/8082/243059_gmg_figure6.jpg
Propose Next Cell Design (repeat Step 1 again)Once the Company has selected the design of the Cell parameters, it needs to test for optimisation. This involves repeating step 1 until a final design or variable is chosen.
1000 mAh Battery Cell Capacity Reached
The Company previously announced on the 6th of February 2024 it produced multiple battery pouch cells with over 1000 mAh (1 Ah) capacity, as seen in Figure 7. This was a major milestone achieved to demonstrate scalability from coin cells to pouch cells, and represented the next milestone in the battery's development, following the announcement of 500 mAh capacity in September 2023.
Figure 7: Typical G+AI Pouch Cell Prototype
To view an enhanced version of this graphic, please visit:https://images.newsfilecorp.com/files/8082/243059_e0db247a7453eaf3_015full.jpg
Following the successful cells made at the BIC and successful customer trials, GMG expects to pursue large scale commercial production, as seen in Figure 8.
Figure 8: Pouch Cell Scale Up Process
To view an enhanced version of this graphic, please visit:https://images.newsfilecorp.com/files/8082/243059_e0db247a7453eaf3_016full.jpg
Battery Technology Readiness Level
The battery technology readiness level ("BTRL") of the Graphene Aluminium-Ion technology remains at Level 4 (see Figure 9). GMG is currently optimizing electrochemical behaviour for pouch cells via ongoing laboratory experimentation. Through collaboration with the BIC it is anticipated that the battery technology readiness will progress to BTRL 7 and 8 since the equipment and process needed to make the Graphene Aluminium-Ion batteries is the same as those employed to make Lithium-Ion Batteries.
Figure 9: Battery Technology Readiness LevelSource: "The Battery Component Readiness Level (BC-RL) Framework: A technology-specific development framework", Matthew Greenwood et al
To view an enhanced version of this graphic, please visit:https://images.newsfilecorp.com/files/8082/243059_e0db247a7453eaf3_017full.jpg
Next Steps Toward Commercialisation & Market Applications
The Company continues to see a broad range of applications for a completed GMG Graphene Aluminium-Ion Battery – utilising its ultra-high power-density and nominal energy density characteristics. Along with Rio Tinto, a range of global companies have confidentially expressed their interest in working with GMG in the following vertical sectors:
Figure 10
To view an enhanced version of this graphic, please visit:https://images.newsfilecorp.com/files/8082/243059_e0db247a7453eaf3_018full.jpg
Next Generation Battery Performance
GMG's next generation Graphene Aluminium-Ion Battery performance data (as tested and calculated on coin cells), as compared to the most commonly available lithium-ion batteries, is shown below in Figure 11, with a list of its beneficial characteristics.
The performance of the pouch cells will be communicated upon successfully producing a repeatable and fully 3rd party tested 1000 mAh+ battery pouch cell.
Pouch cell performance data could be significantly different and will be published once 1000 mAh+ capacity pouch cells are developed and tested.
Source:*University of Queensland validated GMG testing data based on industry standard estimate methodology from coin cells using a reducing factor of 2.3.#CATL 3.7V 65Ah NCM Lithium Battery Cell – LiFePO4 Battery (lifepo4-battery.com) on 29/09/22 7$ CATL 3.2V 150Ah LiFePO4 Battery Cell – LiFePO4 Battery (lifepo4-battery.com) on 29/09/22
Figure 11: Graphene Aluminium-Ion Battery Comparative Performance Data (for coin cells)
To view an enhanced version of this graphic, please visit:https://images.newsfilecorp.com/files/8082/243059_gmg_figure11.jpg
Important Milestones for the Battery's Development:
Important milestones for GMG's Graphene Aluminium-Ion Battery Development:
RSU Grants
The Company is also pleased to announce that following the annual remuneration review, its Board of Directors have approved the grant of an aggregate of 2,021,848 Restricted Share Units ("RSU's") to employees and directors of the Company pursuant to its Restricted Share and Performance Share Plan and the Stock Option Plan.
When vested, each RSU entitles the holder thereof to receive one Share upon exercise in accordance with the Plan . The holder at their own discretion, and separately to the Company, may action those shares accordingly for their personal use.
About GMG
GMG is an Australian based clean-technology company which develops, makes and sells energy saving and energy storage solutions, enabled by graphene manufactured via in house production process. GMG uses its own proprietary production process to decompose natural gas (i.e. methane) into its natural elements, carbon (as graphene), hydrogen and some residual hydrocarbon gases. This process produces high quality, low cost, scalable, 'tuneable' and low/no contaminant graphene suitable for use in clean-technology and other applications.
The Company's present focus is to de-risk and develop commercial scale-up capabilities, and secure market applications. In the energy savings segment, GMG has initially focused on graphene enhanced heating, ventilation and air conditioning ("HVAC-R") coating (or energy-saving coating) which is now being marketed into other applications including electronic heat sinks, industrial process plants and data centres. Another product GMG has developed is the graphene lubricant additive focused on saving liquid fuels initially for diesel engines.
In the energy storage segment, GMG and the University of Queensland are working collaboratively with financial support from the Australian Government to progress R&D and commercialization of graphene aluminium-ion batteries ("G+AI Batteries"). GMG has also developed a graphene additive slurry that is aimed to improve the performance of lithium ion batteries.
GMG's 4 critical business objectives are:
Produce Graphene and improve/scale cell production processes
Build Revenue from Energy Savings Products
Develop Next-Generation Battery
Develop Supply Chain, Partners & Project Execution Capability
For further information please contact:
-
Craig Nicol, Chief Executive Officer & Managing Director of the Company at craig.nicol@graphenemg.com, +61 415 445 223
-
Leo Karabelas at Focus Communications Investor Relations, leo@fcir.ca, +1 647 689 6041
Neither the TSX Venture Exchange nor its Regulation Services Provider (as that term is defined in the policies of the TSX Venture Exchange) accept responsibility for the adequacy or accuracy of this news release.
Cautionary Note Regarding Forward-Looking Statements
This news release includes certain statements and information that may constitute forward-looking information within the meaning of applicable Canadian securities laws. Forward-looking statements relate to future events or future performance and reflect the expectations or beliefs of management of the Company regarding future events. Generally, forward-looking statements and information can be identified by the use of forward-looking terminology such as "intends", "expects" or "anticipates", or variations of such words and phrases or statements that certain actions, events or results "may", "could", "should", "would" or will "potentially" or "likely" occur. This information and these statements, referred to herein as "forward‐looking statements", are not historical facts, are made as of the date of this news release and include without limitation, statements regarding the development of the Company's pouch cell battery, that the Company will obtain repeatable third party testing of a 1000 mAh+ battery pouch cell, the timing of gathering third party laboratory battery testing data, that the Company will review the investment decision to procure and install an automated pouch cell battery pilot plant in its Richlands Australia facility and the potential to pursue large scale commercial production if the pilot plant and customer trials are successful, the timing of customer testing for an 1000 mAh pouch cell, that the Company will optimize electrochemical behaviour for pouch cells via ongoing laboratory experimentation, the ability of a pilot plant to help progress the Graphene Aluminium-Ion technology along the BTRL, the Company's ability to meet its overall timeline on the battery cell roadmap, that the service agreement with the BIC will enable the Company to optimize its cell design and battery manufacturing equipment, and the potential applications for the G+AI Battery.
Such forward-looking statements are based on a number of assumptions of management, including, without limitation, assumptions that the Company will obtain repeatable third party testing of a 1000 mAh+ battery pouch cell, that the Company will review the investment decision to procure and install an automated pouch cell battery pilot plant in its Richlands Australia facility, that the Company may move to large scale commercial production if the pilot plant and customer trials are successful, that the Company will be able to optimize the electrochemical behaviour of the pouch cell through laboratory experimentation, that a pilot plant will assist in progressing its Graphene Aluminium-Ion technology along the BTRL, that the service agreement with the BIC will enable the Company to optimize its cell design and battery manufacturing equipment, and that the Company will be able to meet its overall timeline on the battery cell roadmap. Additionally, forward-looking information involves a variety of known and unknown risks, uncertainties and other factors which may cause the actual plans, intentions, activities, results, performance or achievements of GMG to be materially different from any future plans, intentions, activities, results, performance or achievements expressed or implied by such forward-looking statements. Such risks include, without limitation: that the Company will not be able to obtain repeatable third party testing of a 1000 mAh+ battery pouch cell, that the Company will choose not to proceed with a pilot plant, that the Company will not proceed to customer testing and laboratory testing on the expected timeline or at all, that the Company will not pursue large scale commercial production even if the pilot plant and customer trials are successful, that the construction of a pilot plant will not help advance the Graphene Aluminium-Ion technology along the BTRL, that the Company will not be able to optimize the electrochemical behaviour of the pouch cell through laboratory experimentation or at all, that the Company will not be able to meet its overall timeline on the battery cell roadmap, that the service agreement with the BIC will not enable the Company to optimize its cell design and battery manufacturing equipment, risks relating to the extent and duration of the conflict in Eastern Europe and its impact on global markets, the volatility of global capital markets, political instability, the failure of the Company to obtain regulatory approvals, attract and retain skilled personnel, unexpected development and production challenges, unanticipated costs and the risk factors set out under the heading "Risk Factors" in the Company's annual information form dated October 12, 2023 available for review on the Company's profile at www.sedarplus.ca.
Although management of the Company has attempted to identify important factors that could cause actual results to differ materially from those contained in forward-looking statements or forward-looking information, there may be other factors that cause results not to be as anticipated, estimated or intended. There can be no assurance that such statements will prove to be accurate, as actual results and future events could differ materially from those anticipated in such statements. Accordingly, readers should not place undue reliance on forward-looking statements and forward-looking information. Readers are cautioned that reliance on such information may not be appropriate for other purposes. The Company does not undertake to update any forward-looking statement, forward-looking information or financial out-look that are incorporated by reference herein, except in accordance with applicable securities laws. We seek safe harbor.
To view the source version of this press release, please visit https://www.newsfilecorp.com/release/243059
Graphene Manufacturing Group (CVE:GMG) Second Quarter 2025 ResultsKey Financial Results
-
Net loss: AU$2.22m (loss narrowed by 23% from 2Q 2024).
-
AU$0.023 loss per share (improved from AU$0.034 loss in 2Q 2024).
TSXV:GMG Earnings and Revenue History March 1st 2025
All figures shown in the chart above are for the trailing 12 month (TTM) period
Graphene Manufacturing Group shares are down 7.8% from a week ago.
Risk Analysis
It is worth noting though that we have found 6 warning signs for Graphene Manufacturing Group (3 don't sit too well with us!) that you need to take into consideration.
Have feedback on this article? Concerned about the content? Get in touch with us directly. Alternatively, email editorial-team (at) simplywallst.com.This article by Simply Wall St is general in nature. We provide commentary based on historical data and analyst forecasts only using an unbiased methodology and our articles are not intended to be financial advice. It does not constitute a recommendation to buy or sell any stock, and does not take account of your objectives, or your financial situation. We aim to bring you long-term focused analysis driven by fundamental data. Note that our analysis may not factor in the latest price-sensitive company announcements or qualitative material. Simply Wall St has no position in any stocks mentioned.
Brisbane, Queensland, Australia–(Newsfile Corp. – February 24, 2025) – Graphene Manufacturing Group Ltd. (TSXV: GMG) (OTCQX: GMGMF) ("GMG" or the "Company") is pleased to announce the results of the multi-year performance testing of G® Lubricant, a transformative graphene liquid concentrate additive designed to enhance the performance of diesel and gasoline (petrol) engines. This product has the potential to reshape the future of the global liquid fuels industry and offers an innovative solution that optimizes efficiency and power for stationary or mobile engines.
To view an enhanced version of this graphic, please visit:https://images.newsfilecorp.com/files/8082/242057_gmg1.jpg
GMG is in the process of preparing packaging and marketing materials for G® Lubricant, and expects to begin a direct marketing campaign, targeting fleet owners and initially commencing in Australia and then expanding into other markets from April 2025 onwards.
Click here to order a G® Lubricant sample for your own engine testing.
Unleashing the Power of Graphene
G® Lubricant, a graphene liquid concentrate that can be added to any mineral or synthetic oil used in an internal combustion engine, has been shown to increase fuel efficiency by up to 8.4% in a diesel engine. The amount of graphene in the final lubricant once G® Lubricant is mixed in is only ~ 1:10,000, with the balance of the concentrate consisting of lubricating base oil. As a result, G® Lubricant can be used safely in any internal combustion engine. Over the past four years, GMG has conducted environmentally controlled testing of G® Lubricant in internal combustion engines monitored and verified by The University of Queensland. GMG's test results have been corroborated by similar savings realized by customers over a number of years of field testing.
Figure 1 below shows the high level fuel efficiency improvement provided by the G® Lubricant additive, while Figure 8 provides the detailed fuel testing parameters.
Figure 1: Diesel Engine Fuel Efficiency Improvement provided by G Lubricant
To view an enhanced version of this graphic, please visit:https://images.newsfilecorp.com/files/8082/242057_gmg2en.jpg
The data shows a clear increase in fuel efficiency performance from G® Lubricant when the load is increased on the engine. High loads for truck diesel engines are usually seen when the truck starts to move, and then at high speeds when encountering wind resistance. Usually stationary diesel engines for power generation operate at high load.
Figure 2 shows the potential savings for the main types of diesel engine commercial vehicles in use in Australia – with average vehicle data sourced from the Australian Bureau of Statistics[1] (ABS).
Figure 2: Potential Cost Savings per Vehicle Type provided by G Lubricant
To view an enhanced version of this graphic, please visit:https://images.newsfilecorp.com/files/8082/242057_gmg3en.jpg
Exceptional Performance Confirmed by University of Queensland
GMG's Managing Director and CEO, Craig Nicol, commented: "G® Lubricant has taken over 4 years of advanced product testing and is transformational for energy efficiency and emissions reduction for the liquid fuels industry – it is the culmination of decades of lubricants, engines, energy markets and graphene knowledge which is inherent in the GMG business. The next challenge to commercialise this product awaits – which we are eagerly preparing for."
GMG's Chairman and Director, Jack Perkowski, commented: "G® Lubricant's performance, which demonstrates an 8.4% improvement in fuel efficiency using only a very small amount of graphene in an easy to use graphene concentrate, is a 'Category Creator' that has the potential to redefine the multi trillion dollar liquid fuels market. The fact that only 1% of G® Lubricant is needed to achieve such savings provides a very attractive value proposition for fleet owners."
Click here to order a G® Lubricant sample for your own engine testing.
US$ 1.4 Trillion Global Diesel Industry
Whilst G® Lubricant can be used to reduce fuel consumption in both diesel and gasoline/petrol engines GMG intends to focus on the diesel market initially, which is largely B2B focused, and therefore, more targeted as far as fuel cost savings and performance. GMG calculates that global diesel fuel sales totalled US$1.4 Trillion per annum[2] including taxes and duties on approximately 28 million barrels of diesel per day as detailed by the EIA2. Figure 3 shows the top 34 countries in the world with diesel fuel sales greater than US$10 Billion per annum.
Figure 3: Total Diesel Fuel Sales US$ Billion
To view an enhanced version of this graphic, please visit:https://images.newsfilecorp.com/files/8082/242057_gmg4en.jpg
Estimated US$ 1.2 Billion Per Annum Global Diesel Market For G® Lubricant
Assuming an average fuel savings of 8.4%, GMG believes that a conservative estimate of the potential market for G® Lubricant is 10% of the fuel savings realized by users annually. Assuming G® Lubricant pricing equal to 10% of the savings realized, GMG estimates that the potential global revenue for G® Lubricant is US$ 1.2 Billion sales per annum. Figure 4 shows GMG's estimates of potential annual sales of G® Lubricant by country.
Figure 4: Total G® Lubricant Sales Opportunity
To view an enhanced version of this graphic, please visit:https://images.newsfilecorp.com/files/8082/242057_gmg5en.jpg
Detailed Equipment and Process for Testing G® Lubricant
The following describes the equipment used and the process followed by the Company in demonstrating the fuel saving demonstration of the G® Lubricant in the diesel engine generator:
-
A 30kVA (24 kW) Cummins diesel engine generator (with 14,784 hours of run time) as seen in Figure 5 and described in Figure 6 was purchased and setup in the GMG Richlands warehouse.
-
The generator was connected to a 40 kW power load bank which consumed the energy produced by the generator and created the load and a 500 litre self-contained fuel tank.
-
Two calibrated flow sensors were connected (inflow and return/outflow) to the fuel lines and to a data logger which recorded the fuel consumption.
-
An Energy Analyzer was used to log and track energy produced by the generator.
-
Tests were conducted on loads of 40%, 60% and 80% loads of the 40 kW power load bank – 12, 18, 24 kw respectively.
-
A baseline to record diesel fuel consumption under normal engine oil and operating conditions was completed with newly changed recommended premium diesel engine oil and a new oil filter. This oil change was carried out by a professional engine maintenance service company.
-
The engine was run at the different loads (40%, 60% and 80%) and the baseline and G® Lubricant data set used for the analytics is when the maximum ambient temperature for the day was less than 33 degrees Celsius and relative humidity was between 50% and 80% with no rain. Fuel consumption for diesel engines changes when operating in rain or very high humidity or temperatures, so the fuel consumption data baseline and G® Lubricant engine oil additive performance testing were excluded for these times.
-
Only steady state data was used and so any variance or anomalous data seen in either baseline or G® Lubricant datasets were removed from the analytics. Data sets were grouped into minute blocks.
-
Once the baseline fuel tests were completed, the engine oil was drained and the oil filters were replaced. G-Lubricant with approximately 1:100 concentration was mixed at approximately 1% ratio by weight with a new batch of the same premium recommended engine oil and added to the generator engine. The end ratio of GMG's Graphene to the diesel engine oil was approximately 1:10,000 by weight. The oil change was carried out by the same professional engine maintenance service company.
G® Lubricant Packaging
G® Lubricant is currently sold by GMG in different small pack sizes, a 500 ml pack is shown in Figure 5 which can be diluted into 50 litres of engine oil to provide improved engine performance. GMG intends to direct market the product to its targeted markets through various pack sizes for direct and bulk use.
Figure 5: G® Lubricant 500 ml pack (which can be used to dose 50 litres of engine oil)
To view an enhanced version of this graphic, please visit:https://images.newsfilecorp.com/files/8082/242057_gmg7en.jpg
Click here to order a G® Lubricant sample for your own engine testing.
Figure 6: Diesel Engine Generator Equipment
To view an enhanced version of this graphic, please visit:https://images.newsfilecorp.com/files/8082/242057_7719c67484409aad_011full.jpg
Figure 7: Diesel Engine Generator Equipment Parameters.
To view an enhanced version of this graphic, please visit:https://images.newsfilecorp.com/files/8082/242057_gmg8en.jpg
The detailed data for this fuel test is shown below in Figure 8
|
Load |
Engine Oil Used |
No of Data Points |
Fuel Used (litre per hour) |
Power Output (kWh) |
Fuel Efficiency (kWh per litre) |
% Fuel Efficiency Increase from G® Lubricant |
||
|
40% Load |
Premium Diesel Engine Oil (PDEO) |
1073 |
70 |
Mean: |
211.95 |
Average: |
3.03 |
|
|
StandardDeviation: |
0.60 |
StandardDeviation: |
0.01 |
|||||
|
Min: |
210.31 |
Min: |
3.00 |
|||||
|
Max: |
214.49 |
Max: |
3.06 |
|||||
|
PDEO + G® Lubricant |
1367 |
66.7 |
Average: |
211.84 |
Average: |
3.18 |
4.9% |
|
|
StandardDeviation: |
0.68 |
StandardDeviation: |
0.24 |
|||||
|
Min: |
209.89 |
Min: |
2.64 |
|||||
|
Max: |
213.45 |
Max: |
3.56 |
|||||
|
60% Load |
Premium Diesel Engine Oil (PDEO) |
418 |
90 |
Average: |
297.13 |
Average: |
3.30 |
|
|
StandardDeviation: |
0.65 |
StandardDeviation: |
0.01 |
|||||
|
Min: |
295.06 |
Min: |
3.28 |
|||||
|
Max: |
298.42 |
Max: |
3.32 |
|||||
|
PDEO + G® Lubricant |
1486 |
84.9 |
Average: |
301.31 |
Average: |
3.55 |
7.5% |
|
|
StandardDeviation: |
7.62 |
StandardDeviation: |
0.20 |
|||||
|
Min: |
294.13 |
Min: |
3.27 |
|||||
|
Max: |
313.85 |
Max: |
4.22 |
|||||
|
80% Load |
Premium Diesel Engine Oil (PDEO) |
811 |
120 |
Average: |
404.52 |
Average: |
3.37 |
|
|
StandardDeviation: |
0.79 |
StandardDeviation: |
0.01 |
|||||
|
Min: |
402.62 |
Min: |
3.36 |
|||||
|
Max: |
406.20 |
Max: |
3.38 |
|||||
|
PDEO + G® Lubricant |
1756 |
110.6 |
Average: |
404.21 |
Average: |
3.65 |
8.4% |
|
|
StandardDeviation: |
1.26 |
StandardDeviation: |
0.13 |
|||||
|
Min: |
401.30 |
Min: |
3.34 |
|||||
|
Max: |
407.37 |
Max: |
4.49 |
|||||
Figure 8: Detailed Diesel Engine Generator Performance Data.
Basis for Performance Improvement
As seen in Figure 9, G® Lubricant GMG improves fuel efficiency by creating less friction in the boundary layer lubrication of the pistons inside the cylinder block of the engine. It is widely accepted that approximately 30% of the fuel is used in an engine to overcome internal friction, and that approximately 60% of the engine friction is in the piston area. Graphene has also been seen to prevent wear and also fill in wear scars of an engine, helping to improve piston sealing.
Figure 9: G® Lubricant is believed to reduce friction in the engine pistons.
To view an enhanced version of this graphic, please visit:https://images.newsfilecorp.com/files/8082/242057_gmg9.jpg
Patent Progress of G® Lubricant
GMG submitted a patent application on the G® Lubricant product as soon as it was possible, and this is progressing through the usual process to be approved for the main target markets.
About GMG:
GMG is an Australian based clean-technology company which develops, makes and sells energy saving and energy storage solutions, enabled by graphene manufactured via in house production process. GMG uses its own proprietary production process to decompose natural gas (i.e. methane) into its natural elements, carbon (as graphene), hydrogen and some residual hydrocarbon gases. This process produces high quality, low cost, scalable, 'tuneable' and low/no contaminant graphene suitable for use in clean-technology and other applications.
The Company's present focus is to de-risk and develop commercial scale-up capabilities, and secure market applications. In the energy savings segment, GMG has initially focused on graphene enhanced heating, ventilation and air conditioning ("HVAC-R") coating (or energy-saving coating) which is now being marketed into other applications including electronic heat sinks, industrial process plants and data centres. Another product GMG has developed is the graphene lubricant additive focused on saving liquid fuels initially for diesel engines.
In the energy storage segment, GMG and the University of Queensland are working collaboratively with financial support from the Australian Government to progress R&D and commercialization of graphene aluminium-ion batteries ("G+AI Batteries"). GMG has also developed a graphene additive slurry that is aimed to improve the performance of lithium-ion batteries.
GMG's 4 critical business objectives are:
Produce Graphene and improve/scale cell production processes
Build Revenue from Energy Savings Products
Develop Next-Generation Battery
Develop Supply Chain, Partners & Project Execution Capability
For further information please contact:
-
Craig Nicol, Chief Executive Officer & Managing Director of the Company at craig.nicol@graphenemg.com, +61 415 445 223
-
Leo Karabelas at Focus Communications Investor Relations, leo@fcir.ca, +1 647 689 6041
Neither the TSX Venture Exchange nor its Regulation Services Provider (as that term is defined in the policies of the TSX Venture Exchange) accept responsibility for the adequacy or accuracy of this news release.
Cautionary Note Regarding Forward-Looking Statements
This news release includes certain statements and information that may constitute forward-looking information within the meaning of applicable Canadian securities laws. Forward-looking statements relate to future events or future performance and reflect the expectations or beliefs of management of the Company regarding future events. Generally, forward-looking statements and information can be identified by the use of forward-looking terminology such as "intends", "expects" or "anticipates", or variations of such words and phrases or statements that certain actions, events or results "may", "could", "should", "would" or will "potentially" or "likely" occur. This information and these statements, referred to herein as "forward‐looking statements", are not historical facts, are made as of the date of this news release and include without limitation, the potential of G Lubricant to optimize efficiency and power for stationary or mobile engines, the potential of G Lubricant to reshape the future of the global liquid fuels industry, GMG's intention to commercialise and market G Lubricant, the progress of the Company's patent applications, the potential market for G Lubricant and the potential revenue available for G Lubricant.
Such forward-looking statements are based on a number of assumptions of management, including, without limitation that G Lubricant has the potential to optimize efficiency and power for stationary or mobile engines, that G Lubricant has the potential to reshape the future of the global liquid fuels industry, that GMG will commercialize and market G Lubricant, that the Company's patent applications will progress as anticipated, and that the potential market and revenue available for G Lubricant will be as currently forecasted. Additionally, forward-looking information involves a variety of known and unknown risks, uncertainties and other factors which may cause the actual plans, intentions, activities, results, performance or achievements of GMG to be materially different from any future plans, intentions, activities, results, performance or achievements expressed or implied by such forward-looking statements. Such risks include, without limitation: that G Lubricant will not offer an innovative solution that optimizes efficiency and power for stationary or mobile engines, that G Lubricant will not reshape the future of the global liquid fuels industry, that GMG will commercialize and market G Lubricant as anticipated, that the Company's patent applications will not progress as currently anticipated, that the potential market and revenue available for the G Lubricant product is not as currently calculated, risks relating to the extent and duration of the conflict in Eastern Europe and its impact on global markets, the volatility of global capital markets, political instability, the failure of the Company to obtain regulatory approvals, attract and retain skilled personnel, unexpected development and production challenges, unanticipated costs and the risk factors set out under the heading "Risk Factors" in the Company's annual information form dated October 3, 2024 available for review on the Company's profile at www.sedarplus.ca.
Although management of the Company has attempted to identify important factors that could cause actual results to differ materially from those contained in forward-looking statements or forward-looking information, there may be other factors that cause results not to be as anticipated, estimated or intended. There can be no assurance that such statements will prove to be accurate, as actual results and future events could differ materially from those anticipated in such statements. Accordingly, readers should not place undue reliance on forward-looking statements and forward-looking information. Readers are cautioned that reliance on such information may not be appropriate for other purposes. The Company does not undertake to update any forward-looking statement, forward-looking information or financial out-look that are incorporated by reference herein, except in accordance with applicable securities laws. We seek safe harbor.
[1] ABS Source: https://www.abs.gov.au/statistics/industry/tourism-and-transport/survey-motor-vehicle-use-australia/latest-release
[2] Using EIA diesel volumes for 2023 and www.globalpetrolprices.com diesel prices per country as of January 15th 2025
To view the source version of this press release, please visit https://www.newsfilecorp.com/release/242057
VANCOUVER, BC, Jan. 31, 2025 /CNW/ – (TSX: LUN) (Nasdaq Stockholm: LUMI) Lundin Mining Corporation ("Lundin Mining" or the "Company") reports the following updated share capital and voting rights, in accordance with the Swedish Financial Instruments Trading Act:
The number of issued and outstanding shares of the Company has increased by 93,674,455 to 867,777,426 common shares with voting rights as of January 31, 2025. The increase in the number of issued and outstanding shares from January 1, 2025 to date is the result of shares issued in connection with the Filo Corp. acquisition (see press release dated January 15, 2025 entitled "Lundin Mining Completes Joint Acquisition of Filo with BHP and 50% Sale of Josemaria to Form Vicuña Corp."), and the exercise of employee stock options or the vesting of employee share units, offset by any share buy backs completed under the normal course issuer bid.
About Lundin Mining
Lundin Mining is a diversified Canadian base metals mining company with operations or projects in Argentina, Brazil, Chile, and the United States of America, primarily producing copper, gold and nickel. In December 2024 the Company announced the sale of its European assets to Boliden. The transaction is expected to close in mid-2025 subject to customary conditions and regulatory approvals.
The information in this release is subject to the disclosure requirements of Lundin Mining under the Swedish Financial Instruments Trading Act. The information was submitted for publication, through the agency of the contact persons set out below on January 31, 2025 at 14:30 Pacific Time.
Lundin Mining Announces Updated Share Capital and Voting Rights (CNW Group/Lundin Mining Corporation)
SOURCE Lundin Mining Corporation
Cision
View original content to download multimedia: http://www.newswire.ca/en/releases/archive/January2025/31/c8898.html
Brisbane, Queensland, Australia–(Newsfile Corp. – December 11, 2024) – Graphene Manufacturing Group Ltd. (TSXV: GMG) (OTCQX: GMGMF) ("GMG" or the "Company") is pleased to provide a business update on the commercialisation progress of THERMAL-XR® Powered by GMG Graphene.
CUSTOMER ENGAGEMENT UPDATE
GMG continues to make progress in testing with companies in multiple industries for the use of THERMAL-XR® in their products, including on heat sinks for electronics. Figure 1 shows an aluminium heat sink that is commonly used in electronics for removing heat from printed circuit boards, electrical circuits and processing silicon chips, and that has been coated with THERMAL-XR®.
Figure 1: THERMAL-XR® Coated Electronics Heat Sink
To view an enhanced version of this graphic, please visit:https://images.newsfilecorp.com/files/8082/233324_9491c90934ed3928_001full.jpg
HEAT SINK MINIATURISATION:
Third-party verified modelling demonstrates that applying THERMAL-XR® to a heat sink could reduce its size by up to 39%, while maintaining equivalent thermal performance, offering the potential for weight and material cost savings. Figure 2 shows that the maximum temperature reached by a heat sink coated with THERMAL-XR® is 62 degrees centigrade, 23% lower than the maximum temperature of 80 degrees Celsius reached by a heat sink of equal size that has not been coated with THERMAL-XR®. Figure 3 shows that a heat sink coated with THERMAL-XR® that is 39% smaller in terms of width achieves the same performance as a heat sink that has not been coated with THERMAL-XR®.
To view an enhanced version of this graphic, please visit:https://images.newsfilecorp.com/files/8082/233324_9491c90934ed3928_002full.jpg
|
Material |
Ambient Temp. (˚C) |
Power (W) |
Emissivity |
Convection Type |
Heat Sink Dimensions (mm) |
Max Temp. (˚C) |
Temperature Difference Between Aluminium and THERMAL-XR® |
|||
|
Width |
Length |
Height |
ΔT(˚C) |
ΔT% |
||||||
|
Aluminium |
25 |
80 |
0.11 |
Natural Convection |
62 |
58 |
38 |
80 |
-18 |
23% |
|
THERMAL-XR® |
0.95 |
62 |
||||||||
Figure 2: Modelling of an Electronic Heat Sink with THERMAL-XR® coated on all sides, excluding the base, shows a 23% reduction in maximum temperature reached.
To view an enhanced version of this graphic, please visit:https://images.newsfilecorp.com/files/8082/233324_9491c90934ed3928_003full.jpg
|
Material |
Ambient Temp. (˚C) |
Power (W) |
Emissivity |
Convection Type |
No. of Fins |
Heat Sink Size (mm) |
Temperature (˚C) |
||||
|
Width |
Length |
Height |
ΔW% |
Max |
Min |
||||||
|
Aluminium |
25 |
80 |
0.11 |
Natural Convection |
8 |
62 |
58 |
38 |
– |
80 |
76.7 |
|
THERMAL-XR® |
0.95 |
5 |
38 |
58 |
38 |
-39% |
80 |
75 |
|||
Figure 3: A heat sink coated with THERMAL-XR® on all sides, excluding the base, that is 39% smaller achieves the same results and temperature as the bare aluminium heat sink depicted in Figure 1.
Global Printed Circuit Board (PCB) production is projected[1] to reach 530 million square meters annually by the year 2030, or about 5.3 trillion printed circuit boards. As PCB density increases, higher current loads lead to more heat, with 5.2 billion units expected to require heat sinks for cooling. THERMAL-XR® coated on the heat sinks, enhances the heat sink efficiency, enabling smaller heat sinks and more compact PCB assemblies. The total amount of THERMAL-XR® that could be used for this application to improve performance is 26.5 million litres per annum by 2030, assuming 0.1% will use the coating.
GMG's Managing Director and CEO, Craig Nicol, commented: "Heat sinks are a critical component of modern electronics, but they come with various challenges, especially as devices become smaller, faster, and more powerful. GMG's THERMAL-XR® offers a potential solution in heat sink miniaturization, enabling up to 39% size reduction while maintaining thermal performance. This has the potential to not only cut material costs but also unlock new opportunities for compact and efficient electronics designs, addressing the rising thermal management demands of the global printed circuit board market."
About THERMAL-XR® powered by GMG Graphene:
THERMAL-XR® COATING SYSTEM is a unique method of improving the thermal heat transfer of heat exchange surfaces. The process coats and protects heat exchange surfaces while increasing the heat transfer rate by leveraging the physics of GMG Graphene, resulting in an efficiency improvement and a potential power reduction.
THERMAL-XR® is powered by GMG Graphene. PATENT PENDING
About GMG www.graphenemg.com
GMG is a clean-technology company which seeks to offer energy saving and energy storage solutions, enabled by graphene, including that manufactured in-house via a proprietary production process. GMG has developed a proprietary production process to decompose natural gas (i.e. methane) into its elements, carbon (as graphene), hydrogen and some residual hydrocarbon gases. This process produces high quality, low cost, scalable, 'tuneable' and low/no contaminant graphene suitable for use in clean-technology and other applications.
The Company's present focus is to de-risk and develop commercial scale-up capabilities, and secure market applications. In the energy savings segment, GMG has focused on graphene enhanced heating, ventilation and air conditioning ("HVAC-R") coating (or energy-saving coating), lubricants and fluids.
In the energy storage segment, GMG and the University of Queensland are working collaboratively with financial support from the Australian Government to progress R&D and commercialization of graphene aluminium-ion batteries ("G+AI Batteries").
GMG's 4 critical business objectives are:
Produce Graphene and improve/scale cell production processes
Build Revenue from Energy Savings Products
Develop Next-Generation Battery
Develop Supply Chain, Partners & Project Execution Capability
For further information please contact:
-
Craig Nicol, Chief Executive Officer & Managing Director of the Company at craig.nicol@graphenemg.com, +61 415 445 223
-
Leo Karabelas at Focus Communications Investor Relations, leo@fcir.ca, +1 647 689 6041
Neither the TSX Venture Exchange nor its Regulation Services Provider (as that term is defined in the policies of the TSX Venture Exchange) accept responsibility for the adequacy or accuracy of this news release.
Cautionary Note Regarding Forward-Looking Statements
This news release includes certain statements and information that may constitute forward-looking information within the meaning of applicable Canadian securities laws. Forward-looking statements relate to future events or future performance and reflect the expectations or beliefs of management of the Company regarding future events. Generally, forward-looking statements and information can be identified by the use of forward-looking terminology such as "intends", "expects" or "anticipates", or variations of such words and phrases or statements that certain actions, events or results "may", "could", "should", "would" or will "potentially" or "likely" occur. This information and these statements, referred to herein as "forward‐looking statements", are not historical facts, are made as of the date of this news release and include without limitation, the progression of testing and sales of THERMAL-XR® in multiple industries, the benefits of using THERMAL-XR® on heat sinks, the projected growth of PCB production, and the number of PCBs which will require heat sinks in the future.
Such forward-looking statements are based on a number of assumptions of management, including, without limitation, that the Company will continue to receive interest in testing and buying THERMAL-XR® from multiple industries, that the use of THERMAL-XR® on heat sinks will result in the benefits expected by management, that the use of THERMAL-XR® will allow heat sinks to be smaller while delivering equivalent thermal performance, that PCB production will grow as currently projected, and that the number of PCBs requiring heat sinks in the future will align with current estimates. Additionally, forward-looking information involves a variety of known and unknown risks, uncertainties and other factors which may cause the actual plans, intentions, activities, results, performance or achievements of GMG to be materially different from any future plans, intentions, activities, results, performance or achievements expressed or implied by such forward-looking statements. Such risks include, without limitation: that the Company will not continue to receive interest in testing and purchasing THERMAL-XR® from multiple industries, that THERMAL-XR® will not have the expected benefits when applied to heat sinks, that the size of heat sinks will not be reduced, that PCB production will not grow as expected, that PCBs will not require heat sinks in the future, that THERMAL-XR® coated heat sinks will not enable more compact printed circuit board assemblies, that there will not be demand for THERMAL-XR® in the heat sink market, risks relating to the extent and duration of the conflict in Eastern Europe and its impact on global markets, the volatility of global capital markets, political instability, the failure of the Company to obtain regulatory approvals, attract and retain skilled personnel, unexpected development and production challenges, unanticipated costs and the risk factors set out under the heading "Risk Factors" in the Company's annual information form dated October 3, 2024 available for review on the Company's profile at www.sedarplus.ca.
Although management of the Company has attempted to identify important factors that could cause actual results to differ materially from those contained in forward-looking statements or forward-looking information, there may be other factors that cause results not to be as anticipated, estimated or intended. There can be no assurance that such statements will prove to be accurate, as actual results and future events could differ materially from those anticipated in such statements. Accordingly, readers should not place undue reliance on forward-looking statements and forward-looking information. Readers are cautioned that reliance on such information may not be appropriate for other purposes. The Company does not undertake to update any forward-looking statement, forward-looking information or financial out-look that are incorporated by reference herein, except in accordance with applicable securities laws. We seek safe harbor.
[1] Areas of PCB production projected from the source, Prismark Printed Circuit Board Market Report 2021, page 13
To view the source version of this press release, please visit https://www.newsfilecorp.com/release/233324
Brisbane, Queensland, Australia–(Newsfile Corp. – November 26, 2024) – Graphene Manufacturing Group Ltd. (TSXV:GMG) (OTCQX: GMGMF) ("GMG" or the "Company") is pleased to announce that in connection with the annual general meeting of the company's shareholders (the "Meeting"), that was held both virtually and in person on November 25th, 2024, the following voting results were obtained.
A total of 40,947,619 common shares representing 42.31% of the Company's issued and outstanding common shares were voted in connection with the Meeting. At the Meeting, shareholders re-elected four current directors: Craig Nicol, Jack Perkowski, Bob Galyen and Andrew Small. Shareholders also voted in favour of the other items of business considered at the Meeting, which included the renumeration and appointment of BDO Audit Proprietary LTD. and the approval of the Company's 10% stock option plan.
During the annual general meeting, Jack Perkowski, Chairman of GMG, and Craig Nicol, Managing Director and CEO, delivered a corporate update for shareholders in attendance. For a replay of the presentation, please click the link provided below.
GMG 2024 AGM Presentation: https://youtu.be/fuUaQaKZROE?si=GNpL35BALI3H8a2D
About GMG
GMG is an Australian based clean-tech company listed on the TSX Venture Exchange (TSXV: GMG) that produces graphene and hydrogen by cracking methane (natural gas) instead of mining graphite. By using the company's proprietary process, GMG can produce high quality, low cost, scalable, 'tuneable' and no/low contaminant graphene – enabling demonstrated cost and environmental improvements in a number of world-scale planet-friendly/clean-tech applications. Using this and other sources of low input cost graphene, the Company is developing value-added products that target the massive energy efficiency and energy storage markets.
The Company is pursuing opportunities for GMG graphene enhanced products, including developing next-generation batteries, collaborating with world-leading universities in Australia, and investigating the opportunity to enhance the performance and energy efficiency of engine oils, biodiesel and diesel fuels.
For further information, please contact:Craig Nicol, Chief Executive Officer and Managing Director of the Company at craig.nicol@graphenemg.com, +61 415 445 223Leo Karabelas at Focus Communications, info@fcir.ca , +1 647 689 6041
Neither the TSX Venture Exchange nor its Regulation Services Provider (as that term is defined in the policies of the TSX Venture Exchange) accept responsibility for the adequacy or accuracy of this news release.
To view the source version of this press release, please visit https://www.newsfilecorp.com/release/231548
Brisbane, Queensland, Australia–(Newsfile Corp. – November 21, 2024) – Graphene Manufacturing Group Ltd. (TSXV: GMG) (OTCQX: GMGMF) ("GMG" or the "Company") is pleased to announce the launch of SUPER G®, a graphene slurry which can be used to enhance the performance of lithium-ion batteries. This breakthrough product has the potential to reshape the future of energy storage, offering battery manufacturers an innovative solution that optimizes efficiency, power, and longevity.
Figure 1
To view an enhanced version of this graphic, please visit:https://images.newsfilecorp.com/files/8082/230859_gmg_figure_1.jpg
Unleashing the Power of Graphene
SUPER G® is a graphene slurry which has been developed by GMG over the last 3 years for GMG's own Graphene Aluminium-Ion Battery which has unique properties of high electrical conductivity, low charge transfer resistance and high density compared to other carbon battery additives and materials used in lithium-ion batteries.
The Graphene comes from GMG's self-developed graphene production system and is then processed through a number of steps in the co-located pilot plant and finally into a liquid graphene product which we believe will be able to be added into or coated onto either a customer's lithium-ion battery cathode or anode production with a 0.5-2% dosage by weight.
GMG is currently engaged in confidential discussions with multiple battery manufacturers and industry players to explore the potential testing and supply of SUPER G®. These discussions underscore the growing demand for high-performance materials that can push the boundaries of energy storage technology.
Exceptional Performance Confirmed by Oxford University
A recent study conducted by Oxford University has confirmed the exceptional performance of GMG's SUPER G®. Key findings include:
SUPER G® demonstrates 2.5 times lower mean ionic resistivity compared to standard graphite, as shown in Figure 2. Lower pore ionic resistivity will improve battery efficiency, charge and discharge rates.
Figure 2: Ionic Resistivity of Graphite vs. GMG SUPER G® (100 µm thick, 30% porous vs. 125 µm thick)
To view an enhanced version of this graphic, please visit:https://images.newsfilecorp.com/files/8082/230859_gmg_figure2.jpg
SUPER G® features multimodal particle distribution (~20 µm large particles + sub-1 µm particles), which increases energy density for more powerful, longer lasting batteries.
Figure 3: Cross-Section of SUPER G® with Wide-Beam Ar+ Ion PolishingTo view an enhanced version of this graphic, please visit:https://images.newsfilecorp.com/files/8082/230859_gmg_figure3.jpg
Unlike conventional materials, SUPER G® maintains its integrity during calendaring (compression onto battery foil), ensuring no significant damage to the binder layer. This is crucial for maintaining battery longevity and performance.
Figure 4: Nyquist Plot of EIS Response – Calendared vs. Uncalendared SUPER G®
To view an enhanced version of this graphic, please visit:https://images.newsfilecorp.com/files/8082/230859_gmg_figure4.jpg
Table 1 shows SUPER G® in comparison with the commonly used conductivity carbon additives used in lithium-ion battery industry- it shows many attractive attributes for SUPER G® including 2-3 times higher bulk density and 3 times greater surface area than the industry standard carbon additive.
|
Property |
Standard Industry Lithium-Ion Battery Carbon Additive |
GMG SUPER G® |
|
Bulk Density |
0.12-0.25 g/cm³ |
0.3-0.4 g/cm³ |
|
Surface Area |
~60 m²/g |
250 m²/g |
|
Typical Loading in Electrode |
2-5 wt% |
0.5-2 wt % |
|
High-Rate Performance |
Standard application |
Excellent for very high-rate applications |
Table 1: Performance Comparison of GMG SUPER G® and Commonly used Conductivity Additive
GMG's Graphene has been found to increase rate tolerance of lithium-ion batteries – which is a desirable quality that allows the battery to be charged and discharged at various rates (faster and slower) with less negative impact on the capacity of the battery.
About GMG:
GMG is a clean-technology company which seeks to offer energy saving and energy storage solutions, enabled by graphene, including that manufactured in-house via a proprietary production process. GMG has developed a proprietary production process to decompose natural gas (i.e. methane) into its elements, carbon (as graphene), hydrogen and some residual hydrocarbon gases. This process produces high quality, low cost, scalable, 'tuneable' and low/no contaminant graphene suitable for use in clean-technology and other applications.
The Company's present focus is to de-risk and develop commercial scale-up capabilities, and secure market applications. In the energy savings segment, GMG has focused on graphene enhanced heating, ventilation and air conditioning ("HVAC-R") coating (or energy-saving coating), lubricants and fluids.
In the energy storage segment, GMG and the University of Queensland are working collaboratively with financial support from the Australian Government to progress R&D and commercialization of graphene aluminium-ion batteries ("G+AI Batteries").
GMG's 4 critical business objectives are:
Produce Graphene and improve/scale cell production processes
Build Revenue from Energy Savings Products
Develop Next-Generation Battery
Develop Supply Chain, Partners & Project Execution Capability
For further information please contact:
-
Craig Nicol, Chief Executive Officer & Managing Director of the Company at craig.nicol@graphenemg.com, +61 415 445 223
-
Leo Karabelas at Focus Communications Investor Relations, leo@fcir.ca, +1 647 689 6041
Neither the TSX Venture Exchange nor its Regulation Services Provider (as that term is defined in the policies of the TSX Venture Exchange) accept responsibility for the adequacy or accuracy of this news release.
Cautionary Note Regarding Forward-Looking Statements
This news release includes certain statements and information that may constitute forward-looking information within the meaning of applicable Canadian securities laws. Forward-looking statements relate to future events or future performance and reflect the expectations or beliefs of management of the Company regarding future events. Generally, forward-looking statements and information can be identified by the use of forward-looking terminology such as "intends", "expects" or "anticipates", or variations of such words and phrases or statements that certain actions, events or results "may", "could", "should", "would" or will "potentially" or "likely" occur. This information and these statements, referred to herein as "forward‐looking statements", are not historical facts, are made as of the date of this news release and include without limitation, the potential of SUPER G® to be an additive to improve Lithium-Ion Batteries.
Such forward-looking statements are based on a number of assumptions of management, including, without limitation the potential of SUPER G® to be an additive to improve Lithium-Ion Batteries. Additionally, forward-looking information involves a variety of known and unknown risks, uncertainties and other factors which may cause the actual plans, intentions, activities, results, performance or achievements of GMG to be materially different from any future plans, intentions, activities, results, performance or achievements expressed or implied by such forward-looking statements. Such risks include, without limitation: the potential of SUPER G® to be an additive to improve Lithium-Ion Batteries, or at all, risks relating to the extent and duration of the conflict in Eastern Europe and its impact on global markets, the volatility of global capital markets, political instability, the failure of the Company to obtain regulatory approvals, attract and retain skilled personnel, unexpected development and production challenges, unanticipated costs and the risk factors set out under the heading "Risk Factors" in the Company's annual information form dated October 3, 2024 available for review on the Company's profile at www.sedarplus.ca.
Although management of the Company has attempted to identify important factors that could cause actual results to differ materially from those contained in forward-looking statements or forward-looking information, there may be other factors that cause results not to be as anticipated, estimated or intended. There can be no assurance that such statements will prove to be accurate, as actual results and future events could differ materially from those anticipated in such statements. Accordingly, readers should not place undue reliance on forward-looking statements and forward-looking information. Readers are cautioned that reliance on such information may not be appropriate for other purposes. The Company does not undertake to update any forward-looking statement, forward-looking information or financial out-look that are incorporated by reference herein, except in accordance with applicable securities laws. We seek safe harbor.
To view the source version of this press release, please visit https://www.newsfilecorp.com/release/230859
Brisbane, Queensland, Australia–(Newsfile Corp. – November 19, 2024) – Graphene Manufacturing Group Ltd. (TSXV: GMG) (OTCQX: GMGMF) ("GMG" or the "Company") is pleased to provide a business update on the commercialisation progress of THERMAL-XR® Powered by GMG Graphene.
SINGAPORE GREEN BUILDING COUNCIL PRODUCT APPROVALThe Singapore Green Building Council has approved THERMAL-XR to be certified as a Singapore Green Building Product (SGBP) under the category of Mechanical – ACMV – Coil Coating. It is the first thermal air conditioning coating to be approved as a SGBP – please see the attached link: https://web.sgbc.online/public/product/certificate/5/46/495/8867/2978.
The SGBP Certification Scheme is one of the key standards and benchmarks for green building products in the building and construction industry. Products and materials certified as a SGBP are highly recognised under the Green Mark Certification Scheme, Singapore's national green building rating tool administered by the Building and Construction Authority (BCA), which allows certified products to accrue points that count towards a project's Green Mark rating. The more highly rated a product is under the SGBP Certification Scheme (i.e., the more ticks it has achieved), the more points are awarded towards the Green Mark rating.
The SGBP Certification Scheme is also widely accepted by regional green building rating tools for its coverage of products' sustainability performance. Examples include GreenRE, a rating tool set up by the Real Estate & Housing Developments' Association (REHDA) of Malaysia, and LOTUS, Vietnam Green Building Council's rating tool. The SGBP Certification Scheme complies with many of the requirements in ISO 14024 Environmental labels and declarations – Type I environmental labelling.
Figure 1
To view an enhanced version of this graphic, please visit:https://images.newsfilecorp.com/files/8082/230564_97152fedf493f854_001full.jpg
The benefits of SGBP Certification include:
-
FOR PRODUCT SUPPLIERS:
-
Analysis of your product's sustainability performance by experts and certification by a credible source
-
Opportunity and insight into how to further develop your products to be more sustainable
-
Greater awareness of your product for use in our current and future buildings
-
-
FOR DESIGNERS/ SPECIFIERS:
-
An overview of products that are certified sustainable
-
An understanding of how a product stacks up against others in terms of their sustainability performance
-
Easier decision-making when choosing more sustainable products
-
-
FOR BUILDERS/ OWNERS:
-
An overview of products that are certified sustainable
-
Data around the environmental properties of the products you use
-
A unique selling point for your building projects
-
-
FOR TENANTS/ OCCUPANTS:
-
An understanding of how sustainable the spaces you live and work in are
-
Health benefits of living/working in a greener building
-
Once a product is certified, SGBC will issue the product a certificate. Only certified products will be listed on the SGBP Certification Directory, which is maintained on the Singapore Green Building Council's website. This Interactive Directory is actively used by building industry professionals such as consultants, contractors, building developers and owners. Stakeholders can demand that products/ materials used for a building are SGBP certified. Certified products can gain credits under various green building rating tools.
USA EPA PRE-MANUFACTURE NOTICE SUBMISSION MADE
GMG and Nu Calgon have submitted a Pre-Manufacture Notice ("PMN") in conjunction with its USA Environmental Protection Agency's ("EPA") application to import and sell THERMAL-XR® in the USA. The PMN application is expected to be approved in less than 12 months. The PMN application covers the use of the coating in various application methods in various industrial applications.
GMG's Managing Director and CEO, Craig Nicol, commented: "The SGBP Certification is highly welcomed and comes after many years of working with our coating and carrying out many demonstration projects in Singapore with our distribution and coating partners. We also welcome the progress on the EPA submission with our Nu Calgon distribution partner."
GMG's Chairman and Director, Jack Perkowski, commented: "THERMAL-XR® being recognised as a Singapore Green Building Product is a very good sign of all the hard work GMG has done there over the years. The USA HVAC after market for coatings is a substantial opportunity for GMG and so it is good to see the progress on the EPA submission as well."
About THERMAL-XR® powered by GMG Graphene:
THERMAL-XR® COATING SYSTEM is a unique method of improving the conductivity of corroded heat exchange surfaces and improving and maintaining the performance of new units at peak levels. The process coats and protects heat exchange surfaces while improving and rebuilding the lost corroded thermal conductivity and increasing the heat transfer rate by leveraging the physics of GMG Graphene, resulting in an efficiency improvement and a potential power reduction.
THERMAL-XR RESTORE® is powered by GMG Graphene. PATENT PENDING
About GMG www.graphenemg.com
GMG is a clean-technology company which seeks to offer energy saving and energy storage solutions, enabled by graphene, including that manufactured in-house via a proprietary production process. GMG has developed a proprietary production process to decompose natural gas (i.e. methane) into its elements, carbon (as graphene), hydrogen and some residual hydrocarbon gases. This process produces high quality, low cost, scalable, 'tuneable' and low/no contaminant graphene suitable for use in clean-technology and other applications.
The Company's present focus is to de-risk and develop commercial scale-up capabilities, and secure market applications. In the energy savings segment, GMG has focused on graphene enhanced heating, ventilation and air conditioning ("HVAC-R") coating (or energy-saving coating), lubricants and fluids.
In the energy storage segment, GMG and the University of Queensland are working collaboratively with financial support from the Australian Government to progress R&D and commercialization of graphene aluminium-ion batteries ("G+AI Batteries").
GMG's 4 critical business objectives are:
Produce Graphene and improve/scale cell production processes
Build Revenue from Energy Savings Products
Develop Next-Generation Battery
Develop Supply Chain, Partners & Project Execution Capability
For further information please contact:
-
Craig Nicol, Chief Executive Officer & Managing Director of the Company at craig.nicol@graphenemg.com, +61 415 445 223
-
Leo Karabelas at Focus Communications Investor Relations, leo@fcir.ca, +1 647 689 6041
Neither the TSX Venture Exchange nor its Regulation Services Provider (as that term is defined in the policies of the TSX Venture Exchange) accept responsibility for the adequacy or accuracy of this news release.
Cautionary Note Regarding Forward-Looking Statements
This news release includes certain statements and information that may constitute forward-looking information within the meaning of applicable Canadian securities laws. Forward-looking statements relate to future events or future performance and reflect the expectations or beliefs of management of the Company regarding future events. Generally, forward-looking statements and information can be identified by the use of forward-looking terminology such as "intends", "expects" or "anticipates", or variations of such words and phrases or statements that certain actions, events or results "may", "could", "should", "would" or will "potentially" or "likely" occur. This information and these statements, referred to herein as "forward‐looking statements", are not historical facts, are made as of the date of this news release and include without limitation, the receipt, timing and nature of approval by the EPA of the PMN application and the opportunity represented by the USA HVAC after market for coatings.
Such forward-looking statements are based on a number of assumptions of management, including, without limitation, assumptions regarding that the EPA will approve the PMN application and on the timing anticipated, that the content of the EPA's approval will be as anticipated, and that the USA HVAC after market for coatings is a substantial opportunity for the Company. Additionally, forward-looking information involves a variety of known and unknown risks, uncertainties and other factors which may cause the actual plans, intentions, activities, results, performance or achievements of GMG to be materially different from any future plans, intentions, activities, results, performance or achievements expressed or implied by such forward-looking statements. Such risks include, without limitation: that the EPA will not approve the PMN application on the timing anticipated or at all, that the content of the EPA's approval will not be as anticipated, that the USA HVAC after market for coatings is not a substantial opportunity for the Company, risks relating to the extent and duration of the conflict in Eastern Europe and its impact on global markets, the volatility of global capital markets, political instability, the failure of the Company to obtain regulatory approvals, attract and retain skilled personnel, unexpected development and production challenges, unanticipated costs and the risk factors set out under the heading "Risk Factors" in the Company's annual information form dated October 3, 2024 available for review on the Company's profile at www.sedarplus.ca.
Although management of the Company has attempted to identify important factors that could cause actual results to differ materially from those contained in forward-looking statements or forward-looking information, there may be other factors that cause results not to be as anticipated, estimated or intended. There can be no assurance that such statements will prove to be accurate, as actual results and future events could differ materially from those anticipated in such statements. Accordingly, readers should not place undue reliance on forward-looking statements and forward-looking information. Readers are cautioned that reliance on such information may not be appropriate for other purposes. The Company does not undertake to update any forward-looking statement, forward-looking information or financial out-look that are incorporated by reference herein, except in accordance with applicable securities laws. We seek safe harbor.
To view the source version of this press release, please visit https://www.newsfilecorp.com/release/230564
Brisbane, Queensland, Australia–(Newsfile Corp. – November 14, 2024) – Graphene Manufacturing Group Ltd. (TSXV: GMG) ("GMG" or the "Company") is pleased to provide a business update on its working capital position and the implementation of cost reductions targets that were communicated on March 11, 2024.
Each year the Company submits a Research and Development (R&D) application to the Australian Taxation Office to recover 43.5% of eligible R&D expenditures under the Australian Government's Research and Development Tax Incentive scheme. On October 29, 2024, A$2.85m, the amount requested in this year's R&D application, was deposited in full into the Company's bank account. As at November 1, 2024, the Company's cash balance was A$5.56m, with no debt or loan facilities in place. The continued funding from AusIndustry's R&D Tax incentive scheme has played a vital role in supporting GMG's ongoing research and development.
The Company successfully implemented an organisational restructure by merging the Projects and Operations teams and streamlining its Graphene Manufacturing Plant and Thermal XR® Blending Plant. The new operating model to deliver Projects of scale will rely on trusted third-party providers who have a strong working relationship with GMG and a track record of delivery. Through careful organisational restructuring and active cost management, the Company has reduced its monthly operating cost base by almost 45% since September 2023. The Company will continue to look for ways to continue this trend while maintaining a delivery mind set.
GMG's CEO Craig Nicol stated, "The timely receipt of the Research and Development rebate from the Australian Federal Government continues to provide significant working capital support while the Company has continued to focus on improving its cost base through streamlining of Operations and Projects teams while maintaining focus and pace on delivering its four critical business objectives."
GMG's Chairman and Non-Executive Director, Jack Perkowski, commented: "The implementation of targeted costs savings together with the Research & Development rebate, allows the Company to remain focused on growing the sales of its Energy Savings products."
About GMG www.graphenemg.com
GMG is a clean-technology company which seeks to offer energy saving and energy storage solutions, enabled by graphene, including that manufactured in-house via a proprietary production process. GMG has developed a proprietary production process to decompose natural gas (i.e. methane) into its elements, carbon (as graphene), hydrogen and some residual hydrocarbon gases. This process produces high quality, low cost, scalable, 'tuneable' and low/no contaminant graphene suitable for use in clean-technology and other applications.
The Company's present focus is to de-risk and develop commercial scale-up capabilities, and secure market applications. In the energy savings segment, GMG has focused on graphene enhanced heating, ventilation and air conditioning ("HVAC-R") coating (or energy-saving coating), lubricants and fluids.
In the energy storage segment, GMG and the University of Queensland are working collaboratively with financial support from the Australian Government to progress R&D and commercialization of graphene aluminium-ion batteries ("G+AI Batteries").
GMG's 4 critical business objectives are:
Produce Graphene and improve/scale cell production processes
Build Revenue from Energy Savings Products
Develop Next-Generation Battery
Develop Supply Chain, Partners & Project Execution Capability
For further information please contact:
-
Craig Nicol, Chief Executive Officer & Managing Director of the Company at craig.nicol@graphenemg.com, +61 415 445 223
-
Leo Karabelas at Focus Communications Investor Relations, leo@fcir.ca, +1 647 689 6041
Neither the TSX Venture Exchange nor its Regulation Services Provider (as that term is defined in the policies of the TSX Venture Exchange) accept responsibility for the adequacy or accuracy of this news release.
Cautionary Note Regarding Forward-Looking Statements
This news release includes certain statements and information that may constitute forward-looking information within the meaning of applicable Canadian securities laws. Forward-looking statements relate to future events or future performance and reflect the expectations or beliefs of management of the Company regarding future events. Generally, forward-looking statements and information can be identified by the use of forward-looking terminology such as "intends", "expects" or "anticipates", or variations of such words and phrases or statements that certain actions, events or results "may", "could", "should", "would" or will "potentially" or "likely" occur. This information and these statements, referred to herein as "forward‐looking statements", are not historical facts, are made as of the date of this news release and include without limitation, statements regarding the Company's new operating model, future cost reductions, and the Company's focus on the sale of its energy saving products.
Such forward-looking statements are based on a number of assumptions of management, including, without limitation, that the new operating model to deliver Projects of scale will rely on trusted third-party providers who have a strong working relationship with GMG and a track record of delivery, that the Company will continue to look for ways to reduce costs while maintaining a delivery mind set, and that the Company's focus will remain on growing the sales of its energy saving products.
Additionally, forward-looking information involves a variety of known and unknown risks, uncertainties and other factors which may cause the actual plans, intentions, activities, results, performance or achievements of GMG to be materially different from any future plans, intentions, activities, results, performance or achievements expressed or implied by such forward-looking statements. Such risks include, without limitation: that the Australian Federal Government will not continue its Research and Development Tax Incentive scheme, or that the Company will not continue to benefit from the tax incentive, that the new operating model to deliver projects of scale will not rely on trusted third-party providers who have a strong working relationship with GMG and a track record of delivery, that the Company will be unable to reduce costs further while maintaining a delivery mind set, that the Company will not remain focused on growing the sales of its energy saving products, risks relating to the extent and duration of the conflict in Eastern Europe and its impact on global markets, the volatility of global capital markets, political instability, the failure of the Company to obtain regulatory approvals, attract and retain skilled personnel, unexpected development and production challenges, unanticipated costs and the risk factors set out under the heading "Risk Factors" in the Company's annual information form dated October 3, 2024 available for review on the Company's profile at www.sedarplus.ca.
Although management of the Company has attempted to identify important factors that could cause actual results to differ materially from those contained in forward-looking statements or forward-looking information, there may be other factors that cause results not to be as anticipated, estimated or intended. There can be no assurance that such statements will prove to be accurate, as actual results and future events could differ materially from those anticipated in such statements. Accordingly, readers should not place undue reliance on forward-looking statements and forward-looking information. Readers are cautioned that reliance on such information may not be appropriate for other purposes. The Company does not undertake to update any forward-looking statement, forward-looking information or financial out-look that are incorporated by reference herein, except in accordance with applicable securities laws. We seek safe harbor.
To view the source version of this press release, please visit https://www.newsfilecorp.com/release/229939
Brisbane, Queensland, Australia–(Newsfile Corp. – October 31, 2024) – Graphene Manufacturing Group Ltd. (TSXV: GMG) ("GMG" or the "Company") is providing details of its upcoming Annual Meeting of shareholders ("AGM") to be held virtually on November 26, 2024, at 8:00 a.m. Brisbane Australian Eastern Standard Time (being November 25, 2024 at 2:00 p.m. (Canadian Pacific Standard Time). The AGM will be held in a virtual format, allowing shareholders to have an equal opportunity to participate at the AGM online regardless of their geographic location.
|
DOCUMENT AVAILABILITY |
||
|
Online: |
Meeting Materials are available at GMG's profile on SEDAR+ at www.sedarplus.ca as well as in the Investors Section of GMG's website at https://graphenemg.com/agm-materials/ |
|
|
Registered Shareholders: |
Those shareholders who hold shares in their name, can expect to receive the Meeting Materials from Computershare. As a Registered Shareholder, if you have not received your Meeting Materials by November 5, 2024, please contact Computershare directly. |
|
|
Non-Registered Shareholders: |
Those shareholders who have their shares held by a brokerage firm or other intermediary, can expect to receive the Meeting Materials from their brokerage firm. As a Non-Registered Shareholder, if you have not received your Meeting Materials by November 5, 2024, please contact your broker directly. |
|
|
ADVANCED VOTING |
||
|
Voting Options: |
Online: www.investorvote.com |
|
|
Telephone: 1-866-732-VOTE (8683) |
||
|
Mail: 8th Floor, 100 University Avenue, Toronto ON M5J 1V6 |
||
|
Deadline: |
Voting instructions must be received by Computershare no later than 8:00 a.m. Brisbane Australian Eastern Standard Time on November 22, 2024, being 2:00 pm (Canadian Pacific Standard Time) on November 21, 2024. |
|
|
ATTENDANCE |
||
|
Online Platform: |
Login online at https://meetings.lumiconnect.com/400-254-940-067 Meeting ID: 400-25-940-067, Password: graphene2024 (case sensitive) It is recommended to login 15 minutes prior to the start time of the AGM. |
|
|
Third Party Appointments: |
Third party appointments MUST be registered at www.computershare.com/graphene prior to the proxy cut-off date of November 22, 2024 in Australia and November 21, 2024 in North America. Failure to do so will result in the appointee not receiving login credentials. |
|
|
Registered Shareholders: |
Will be provided a 15 digit control number provided on your form of proxy provided by Computershare. |
|
|
Appointed Proxyholders: |
Once registered (as set out above), will be provided a username from Computershare via email. |
|
|
Guests: |
Attendees who do not enter the 15-digit control number or the username provided by Computershare will only be allowed to register for the AGM as a "Guest". |
|
|
VOTING AND QUESTIONS AT THE VIRTUAL AGM |
||
|
Advanced Questions: |
All shareholders wishing to have a question addressed at the virtual AGM can avoid the registration requirements set out in the Meeting Materials by submitting them in advance to AGM24@graphenemg.com. Questions will be collected, organized by theme and posed to management at the AGM. GMG is committed to addressing all appropriate questions submitted by shareholders either live during the AGM or in advance, as timing and circumstances permit. |
|
|
Registered and Appointed Proxyholders: |
Full details have been provided in the Meeting Materials. Shareholders are reminded that if you vote in advance of the Meeting, you are not required to vote again on the day of the Meeting. |
|
|
Guests: |
Attendees who have registered for the AGM as a "Guest" will not have the ability to vote at the AGM or ask questions. |
|
|
QUESTIONS REGARDING THE VIRTUAL AGM |
||
|
Still Have Questions? |
Shareholders who have questions on how to vote their proxy in advance of the AGM, or on how to register to vote at the AGM, can contact AGM24@graphenemg.com. |
|
About GMG
GMG is a disruptive Australian-based clean-tech company listed on the TSXV (TSXV: GMG) that produces graphene and hydrogen by cracking methane (natural gas) instead of mining graphite. By using the company's proprietary process, GMG can produce high quality, low cost, scalable, 'tuneable' and no/low contaminant graphene – enabling demonstrated cost and environmental improvements in a number of world-scale planet-friendly/clean-tech applications. Using this low input cost source of graphene, the Company is developing value-added products that target the massive energy efficiency and energy storage markets. The Company is pursuing additional opportunities for GMG Graphene, including developing next-generation batteries, collaborating with world-leading universities in Australia, and investigating the opportunity to enhance the performance of lubricant oil and performance enhanced HVAC-R coating system.
For further information, please contact:
– Craig Nicol, Chief Executive Officer, and Managing Director of GMGcraig.nicol@graphenemg.com+61 415 445 223
– Leo Karabelas at Focus Communications Investor Relations (FCIR)leo@fcir.ca+1 647 689 6041
Neither the TSX Venture Exchange nor its Regulation Services Provider (as that term is defined in the policies of the TSX Venture Exchange) accept responsibility for the adequacy or accuracy of this news release.
To view the source version of this press release, please visit https://www.newsfilecorp.com/release/228548
Brisbane, Queensland, Australia–(Newsfile Corp. – October 23, 2024) – Graphene Manufacturing Group Ltd. (TSXV: GMG) ("GMG" or the "Company") is pleased to provide a technical update on the commercialisation progress of THERMAL-XR® Powered by GMG Graphene.
PRODUCT TECHNICAL UPDATETHERMAL-XR® has now successfully passed 15,000 hours for corrosion protection under a salt sea spray industry standard test (ASTM B117) in a third-party laboratory in the US as seen in Figure 1. The Company believes that THERMAL-XR® is one of the longest lasting corrosion protection coatings available on the market. The testing will continue, and further reports will be updated by the Company.
Figure 1: THERMAL-XR® Coating Corrosion Test Results After 15,000 Salt Sea Spray Hours (ATM B117)
To view an enhanced version of this graphic, please visit:https://images.newsfilecorp.com/files/8082/227525_ecd3ffa9c41478c4_001full.jpg
GMG can now accurately model and calculate the heat transfer rate expected from THERMAL-XR®, as compared to bare (uncoated) Aluminium, within 1% of actual results. This was reviewed and verified by the University of Queensland.
Figure 2 shows the simulation model used to calculate the heat transfer coefficients of bare aluminium, versus THERMAL-XR® coated aluminium, on the test rig that GMG built and operated to obtain the experimental data. The test was conducted at a temperature of approximately 100 degree Celsius.
Figure 2: Estimation of Heat Transfer of THERMAL-XR® coated aluminium versus bare aluminium
To view an enhanced version of this graphic, please visit:https://images.newsfilecorp.com/files/8082/227525_gmg_figure2.jpg
Through this work, as shown in Figure 3, the Company has demonstrated that THERMAL-XR® provides approximately 8.6 times more radiative heat transfer than bare aluminium, due to its thermal radiation (passing of heat in wave forms) capabilities. THERMAL-XR® has been calculated to provide 8.15 W/m2K (Watts per metre squared Kelvin degrees), or approximately 1.44 Btu/hr ft2 F (British thermal units per hour foot squared Fahrenheit degrees), of heat transfer when applied properly on top of bare aluminium, as compared to 0.95 W/m2K or 0.17 Btu/hr ft2 for bare aluminium.
Figure 3: Thermal Radiation calculations of THERMAL-XR® coated aluminium versus bare aluminium
To view an enhanced version of this graphic, please visit:https://images.newsfilecorp.com/files/8082/227525_ecd3ffa9c41478c4_004full.jpg
Figure 4 shows THERMAL-XR® increases the overall heat transfer coefficient by 2.2 times more than bare aluminium, from 6.0 W/m2K up to 13.2 W/m2K because of the increase in the thermal radiation from the THERMAL-XR® coating. This was conducted at a temperature of approximately 100 degree Celsius for a 100mm diameter flat plate.
|
Thermal Coefficient (W/m2K) |
Bare Aluminium |
THERMAL-XR® Coated Aluminium |
|
Thermal Radiation |
0.95 |
8.15 |
|
Natural Convection (Air Cooling) |
5.08 |
5.08 |
|
Total Heat Transfer |
6.0 |
13.2(2.2 Times) |
Figure 4: NATURAL Convection Overall Thermal Coefficient of THERMAL-XR® versus bare aluminium
Figure 5 shows that THERMAL-XR® provides approximately 27% more heat transfer when including FORCED convection (fan air cooling) over bare aluminium from 26.6 W/m2K up to 33.8 W/m2K because of the increase in the thermal radiation from the THERMAL-XR® coating. This was conducted at a temperature of approximately 100 degree Celsius and with modelling of the air speed at an approximate 5 metres/second.
|
Thermal Coefficient (W/m2K) |
Bare Aluminium |
THERMAL-XR® Coated Aluminium |
|
Thermal Radiation |
0.95 |
8.15 |
|
Forced Convection (Fan Air Cooling) |
25.71 |
25.71 |
|
Total Heat Transfer |
26.6 |
33.8(27% Increase) |
Figure 5: FORCED Convection Cooling Overall Thermal Coefficient of THERMAL-XR® versus bare aluminium
GMG's Managing Director and CEO, Craig Nicol, commented: "GMG continues to make good progress in testing THERMAL-XR® for corrosion protection and heat transfer – our increased understanding of the heat rejection rate of the product allows us to better recognise how it can be of potential value for various types of products in various applications and markets."
GMG's Chairman and Director, Jack Perkowski, commented: "THERMAL-XR® testing in corrosion protection and heat transfer is highly translatable into so many industries – so it is great to see the progress."
About THERMAL-XR® powered by GMG Graphene:
THERMAL-XR® COATING SYSTEM is a unique method of improving the heat conductivity of corroded heat exchange surfaces and improving and maintaining the performance of new units at peak levels. The process coats and protects heat exchange surfaces increasing service life, while improving and rebuilding the lost corroded thermal conductivity and increasing the heat transfer rate by leveraging the physics of GMG Graphene, resulting in an efficiency improvement and a potential power reduction.
THERMAL-XR RESTORE® is powered by GMG Graphene. PATENT PENDING
About GMG www.graphenemg.com
GMG is a clean-technology company which seeks to offer energy saving and energy storage solutions, enabled by graphene, including that manufactured in-house via a proprietary production process. GMG has developed a proprietary production process to decompose natural gas (i.e. methane) into its elements, carbon (as graphene), hydrogen and some residual hydrocarbon gases. This process produces high quality, low cost, scalable, 'tuneable' and low/no contaminant graphene suitable for use in clean-technology and other applications.
The Company's present focus is to de-risk and develop commercial scale-up capabilities, and secure market applications. In the energy savings segment, GMG has focused on graphene enhanced heating, ventilation and air conditioning ("HVAC-R") coating (or energy-saving coating), lubricants and fluids.
In the energy storage segment, GMG and the University of Queensland are working collaboratively with financial support from the Australian Government to progress R&D and commercialization of graphene aluminium-ion batteries ("G+AI Batteries").
GMG's 4 critical business objectives are:
Produce Graphene and improve/scale cell production processes
Build Revenue from Energy Savings Products
Develop Next-Generation Battery
Develop Supply Chain, Partners & Project Execution Capability
For further information please contact:
-
Craig Nicol, Chief Executive Officer & Managing Director of the Company at craig.nicol@graphenemg.com, +61 415 445 223
-
Leo Karabelas at Focus Communications Investor Relations, leo@fcir.ca, +1 647 689 6041
Neither the TSX Venture Exchange nor its Regulation Services Provider (as that term is defined in the policies of the TSX Venture Exchange) accept responsibility for the adequacy or accuracy of this news release.
Cautionary Note Regarding Forward-Looking Statements
This news release includes certain statements and information that may constitute forward-looking information within the meaning of applicable Canadian securities laws. Forward-looking statements relate to future events or future performance and reflect the expectations or beliefs of management of the Company regarding future events. Generally, forward-looking statements and information can be identified by the use of forward-looking terminology such as "intends", "expects" or "anticipates", or variations of such words and phrases or statements that certain actions, events or results "may", "could", "should", "would" or will "potentially" or "likely" occur. This information and these statements, referred to herein as "forward‐looking statements", are not historical facts, are made as of the date of this news release and include without limitation, that the Company will continue testing THERMAL-XR® and provide further updates, that increased understanding of THERMAL-XR® will allow the Company to better recognize how it can add value in various types of products in various applications and markets, and that THERMAL-XR® testing in corrosion protection and heat transfer is highly translatable into many industries.
Such forward-looking statements are based on a number of assumptions of management, including, without limitation, that the Company will continue to test THERMAL-XR® and provide updates, that an increased understanding of THERMAL-XR® will enable the Company to better identify how THERMAL-XR® can add value for various products in various applications and markets, and that THERMAL-XR® testing in corrosion protection and heat transfer is highly translatable into many industries. Additionally, forward-looking information involves a variety of known and unknown risks, uncertainties and other factors which may cause the actual plans, intentions, activities, results, performance or achievements of GMG to be materially different from any future plans, intentions, activities, results, performance or achievements expressed or implied by such forward-looking statements. Such risks include, without limitation: that the Company will not continue testing THERMAL-XR®, that the Company will not provide further updates regarding THERMAL-XR®, that a better understanding of THERMAL-XR® will not allow the Company to better recognize how it can add value in various types of products in various applications and markets, that THERMAL-XR® testing in corrosion protection and heat transfer will not be highly translatable into many industries, risks relating to the extent and duration of the conflict in Eastern Europe and its impact on global markets, the volatility of global capital markets, political instability, the failure of the Company to obtain regulatory approvals, attract and retain skilled personnel, unexpected development and production challenges, unanticipated costs and the risk factors set out under the heading "Risk Factors" in the Company's annual information form dated October 3, 2024 available for review on the Company's profile at www.sedarplus.ca.
Although management of the Company has attempted to identify important factors that could cause actual results to differ materially from those contained in forward-looking statements or forward-looking information, there may be other factors that cause results not to be as anticipated, estimated or intended. There can be no assurance that such statements will prove to be accurate, as actual results and future events could differ materially from those anticipated in such statements. Accordingly, readers should not place undue reliance on forward-looking statements and forward-looking information. Readers are cautioned that reliance on such information may not be appropriate for other purposes. The Company does not undertake to update any forward-looking statement, forward-looking information or financial out-look that are incorporated by reference herein, except in accordance with applicable securities laws. We seek safe harbor.
To view the source version of this press release, please visit https://www.newsfilecorp.com/release/227525
Brisbane, Queensland, Australia–(Newsfile Corp. – October 21, 2024) – Graphene Manufacturing Group Ltd. (TSXV: GMG) ("GMG" or the "Company") is pleased to provide a business update on the government engagement progress for the Company.
GMG continues to engage with various members of Australian Federal Government including a recent visit to the Australian Parliament in Canberra, Australia's capital city, to see the Honourable Senator Tim Ayres, Assistant Minister for Trade and Assistant Minister for a Future Made In Australia, as seen in Figure 1, to discuss GMG's battery manufacturing progress and how a number of Federal Government policies including the Future Made in Australia Battery Breakthrough could potentially support GMG.
Figure 1: GMG CEO and CFCO meet with Honourable Senator Tim Ayres
To view an enhanced version of this graphic, please visit:https://images.newsfilecorp.com/files/8082/227262_df55675e24530a0b_001full.jpg
GMG also met the Speaker of the House of Representatives the Honourable Milton Dick, as seen in Figure 2, to share GMG's progress since his visit to GMG's Facilities in Richlands Queensland in 2023 when Milton formally opened the Graphene coating blend plant.
Figure 2: GMG CEO and CFCO meet with Speaker of the House of Representatives Honourable Milton Dick
To view an enhanced version of this graphic, please visit:https://images.newsfilecorp.com/files/8082/227262_df55675e24530a0b_002full.jpg
GMG also met Queensland Senator the Honourable Anthony Chisholm, as seen in Figure 3, to share GMG's progress since his visit to GMG's Facilities in Richlands Queensland in 2022.
Figure 3: GMG CEO and CFCO meet with Senator the Honourable Anthony Chisholm
To view an enhanced version of this graphic, please visit:https://images.newsfilecorp.com/files/8082/227262_df55675e24530a0b_003full.jpg
GMG's Managing Director and CEO, Craig Nicol, commented: "GMG continues to engage Government at all levels, including local, state and federal government, with the aim to help ensure its leading energy saving and energy storage products align with government policy to support the energy transition."
GMG's Chairman and Director, Jack Perkowski, commented: "We believe that Engagement with Government is important in the very dynamic markets GMG is focused on selling its product into, and we plan to continue engaging with Government as policies are rolled out in various key markets around the world."
About THERMAL-XR® powered by GMG Graphene:
THERMAL-XR® COATING SYSTEM is a unique method of improving the conductivity of corroded heat exchange surfaces and improving and maintaining the performance of new units at peak levels. The process coats and protects heat exchange surfaces while improving and rebuilding the lost corroded thermal conductivity and increasing the heat transfer rate by leveraging the physics of GMG Graphene, resulting in an efficiency improvement and a potential power reduction.
THERMAL-XR RESTORE® is powered by GMG Graphene. PATENT PENDING
About GMG www.graphenemg.com
GMG is a clean-technology company which seeks to offer energy saving and energy storage solutions, enabled by graphene, including that manufactured in-house via a proprietary production process. GMG has developed a proprietary production process to decompose natural gas (i.e. methane) into its elements, carbon (as graphene), hydrogen and some residual hydrocarbon gases. This process produces high quality, low cost, scalable, 'tuneable' and low/no contaminant graphene suitable for use in clean-technology and other applications.
The Company's present focus is to de-risk and develop commercial scale-up capabilities, and secure market applications. In the energy savings segment, GMG has focused on graphene enhanced heating, ventilation and air conditioning ("HVAC-R") coating (or energy-saving coating), lubricants and fluids.
In the energy storage segment, GMG and the University of Queensland are working collaboratively with financial support from the Australian Government to progress R&D and commercialization of graphene aluminium-ion batteries ("G+AI Batteries").
GMG's 4 critical business objectives are:
Produce Graphene and improve/scale cell production processes
Build Revenue from Energy Savings Products
Develop Next-Generation Battery
Develop Supply Chain, Partners & Project Execution Capability
For further information please contact:
-
Craig Nicol, Chief Executive Officer & Managing Director of the Company at craig.nicol@graphenemg.com, +61 415 445 223
-
Leo Karabelas at Focus Communications Investor Relations, leo@fcir.ca, +1 647 689 6041
Neither the TSX Venture Exchange nor its Regulation Services Provider (as that term is defined in the policies of the TSX Venture Exchange) accept responsibility for the adequacy or accuracy of this news release.
Cautionary Note Regarding Forward-Looking Statements
This news release includes certain statements and information that may constitute forward-looking information within the meaning of applicable Canadian securities laws. Forward-looking statements relate to future events or future performance and reflect the expectations or beliefs of management of the Company regarding future events. Generally, forward-looking statements and information can be identified by the use of forward-looking terminology such as "intends", "expects" or "anticipates", or variations of such words and phrases or statements that certain actions, events or results "may", "could", "should", "would" or will "potentially" or "likely" occur. This information and these statements, referred to herein as "forward‐looking statements", are not historical facts, are made as of the date of this news release and include without limitation, the potential for Federal Government policies to support GMG, the Company's belief that Engagement with Government could support GMG and help ensure its products align with government policy to support the energy transition, the potential for THERMAL-XR® to enable energy producers to produce additional energy more efficiently, the Company's goal of achieving optimal production line performance for THERMAL-XR® and the entering of full production.
Such forward-looking statements are based on a number of assumptions of management, including, without limitation, assumptions that Federal Government policies could support GMG, that Engagement with Government could help support GMG and help ensure its products align with government policy to support the energy transition, assumptions regarding the development of extensions and enhancements to the THERMAL-XR® portfolio into a wider range of applications, that energy producers will be able to derive the expected benefits from the Company's products, and that the Company will be able to achieve optimal production line performance for THERMAL-XR® and enter full production. Additionally, forward-looking information involves a variety of known and unknown risks, uncertainties and other factors which may cause the actual plans, intentions, activities, results, performance or achievements of GMG to be materially different from any future plans, intentions, activities, results, performance or achievements expressed or implied by such forward-looking statements. Such risks include, without limitation: that Federal Government policies do not support GMG to the extend expected or at all, that Engagement with Government does not support GMG and/or does not ensure its products align with government policy to support the energy transition to the extend expected or at all, that there will be no developments of extensions or enhancements to the THERMAL-XR® portfolio into a wider range of applications, that energy producers will not derive the expected benefits from the Company's products, that the Company will be unable to achieve optimal production line performance for THERMAL-XR® or enter full production, risks relating to the extent and duration of the conflict in Eastern Europe and its impact on global markets, the volatility of global capital markets, political instability, the failure of the Company to obtain regulatory approvals, attract and retain skilled personnel, unexpected development and production challenges, unanticipated costs and the risk factors set out under the heading "Risk Factors" in the Company's annual information form dated October 3, 2024 available for review on the Company's profile at www.sedarplus.ca.
Although management of the Company has attempted to identify important factors that could cause actual results to differ materially from those contained in forward-looking statements or forward-looking information, there may be other factors that cause results not to be as anticipated, estimated or intended. There can be no assurance that such statements will prove to be accurate, as actual results and future events could differ materially from those anticipated in such statements. Accordingly, readers should not place undue reliance on forward-looking statements and forward-looking information. Readers are cautioned that reliance on such information may not be appropriate for other purposes. The Company does not undertake to update any forward-looking statement, forward-looking information or financial out-look that are incorporated by reference herein, except in accordance with applicable securities laws. We seek safe harbor.
To view the source version of this press release, please visit https://www.newsfilecorp.com/release/227262
Just because a business does not make any money, does not mean that the stock will go down. For example, although software-as-a-service business Salesforce.com lost money for years while it grew recurring revenue, if you held shares since 2005, you'd have done very well indeed. But the harsh reality is that very many loss making companies burn through all their cash and go bankrupt.
So should Graphene Manufacturing Group (CVE:GMG) shareholders be worried about its cash burn? In this report, we will consider the company's annual negative free cash flow, henceforth referring to it as the 'cash burn'. The first step is to compare its cash burn with its cash reserves, to give us its 'cash runway'.
View our latest analysis for Graphene Manufacturing Group
Does Graphene Manufacturing Group Have A Long Cash Runway?
A cash runway is defined as the length of time it would take a company to run out of money if it kept spending at its current rate of cash burn. As at June 2024, Graphene Manufacturing Group had cash of AU$4.0m and such minimal debt that we can ignore it for the purposes of this analysis. Looking at the last year, the company burnt through AU$7.7m. Therefore, from June 2024 it had roughly 6 months of cash runway. To be frank, this kind of short runway puts us on edge, as it indicates the company must reduce its cash burn significantly, or else raise cash imminently. Depicted below, you can see how its cash holdings have changed over time.
debt-equity-history-analysisHow Is Graphene Manufacturing Group's Cash Burn Changing Over Time?
Although Graphene Manufacturing Group had revenue of AU$6.2m in the last twelve months, its operating revenue was only AU$295k in that time period. Given how low that operating leverage is, we think it's too early to put much weight on the revenue growth, so we'll focus on how the cash burn is changing, instead. Given the length of the cash runway, we'd interpret the 45% reduction in cash burn, in twelve months, as prudent if not necessary for capital preservation. Clearly, however, the crucial factor is whether the company will grow its business going forward. So you might want to take a peek at how much the company is expected to grow in the next few years.
How Easily Can Graphene Manufacturing Group Raise Cash?
While Graphene Manufacturing Group is showing a solid reduction in its cash burn, it's still worth considering how easily it could raise more cash, even just to fuel faster growth. Issuing new shares, or taking on debt, are the most common ways for a listed company to raise more money for its business. Many companies end up issuing new shares to fund future growth. By comparing a company's annual cash burn to its total market capitalisation, we can estimate roughly how many shares it would have to issue in order to run the company for another year (at the same burn rate).
Since it has a market capitalisation of AU$68m, Graphene Manufacturing Group's AU$7.7m in cash burn equates to about 11% of its market value. As a result, we'd venture that the company could raise more cash for growth without much trouble, albeit at the cost of some dilution.
So, Should We Worry About Graphene Manufacturing Group's Cash Burn?
Even though its cash runway makes us a little nervous, we are compelled to mention that we thought Graphene Manufacturing Group's cash burn reduction was relatively promising. Summing up, we think the Graphene Manufacturing Group's cash burn is a risk, based on the factors we mentioned in this article. Taking a deeper dive, we've spotted 5 warning signs for Graphene Manufacturing Group you should be aware of, and 2 of them are concerning.
Of course, you might find a fantastic investment by looking elsewhere. So take a peek at this free list of companies with significant insider holdings, and this list of stocks growth stocks (according to analyst forecasts)
Have feedback on this article? Concerned about the content? Get in touch with us directly. Alternatively, email editorial-team (at) simplywallst.com.This article by Simply Wall St is general in nature. We provide commentary based on historical data and analyst forecasts only using an unbiased methodology and our articles are not intended to be financial advice. It does not constitute a recommendation to buy or sell any stock, and does not take account of your objectives, or your financial situation. We aim to bring you long-term focused analysis driven by fundamental data. Note that our analysis may not factor in the latest price-sensitive company announcements or qualitative material. Simply Wall St has no position in any stocks mentioned.
Brisbane, Queensland, Australia–(Newsfile Corp. – September 3, 2024) – Graphene Manufacturing Group Limited (TSXV: GMG) ("GMG" or the "Company") is pleased to announce this business update on its recently commissioned Modular Graphene Production Plant at Richlands, Australia.
Figure 1: Graphene Production Plant Project Team
To view an enhanced version of this graphic, please visit:https://images.newsfilecorp.com/files/8082/221932_ac9be57c04a1b96c_001full.jpg
The newly commissioned Graphene Production Plant as seen in Figure 1 has been operating and producing Graphene since its commissioning date in December 2023.
The performance of the production unit has exceeded the Company's expectations in both graphene production rate and graphene quality. The Company continues to perform minor optimisations with this new production plant which have both increased production yield and quality of the graphene.
The Company has also authorised a total of AU$250k of capital expenditure for new equipment for quality assurance and quality control purposes of the Company's graphene for its Graphene Aluminium Ion Battery and its liquid graphene products, THERMAL-XR® and G® Lubricant. The equipment being procured by the Company includes: a Raman Spectrometer and a Particle Size Analyzer amongst others. These are sophisticated analytical and characterisation laboratory equipment which will be operated by GMG scientists and technicians. To date the Company has been fortunate to work with various Universities to obtain this analysis. Once the equipment is procured, delivered, commissioned and operational the Company will largely be self-sufficient on testing of its nano materials.
GMG's Managing Director and CEO, Craig Nicol, commented: "We are very excited to see the new modular plant exceed expectations in terms of graphene production and quality. The expansion of our graphene characterisation equipment will also reduce learning loop times for optimisation projects where we no longer have to wait for University equipment access. The graphene production system uses GMG's self developed innovative plasma technology which creates the high quality graphene GMG's end products need to deliver their notable benefits."
GMG's Chairman and Director, Jack Perkowski, commented: "It is great to see the Company's production technology maturing to this point as this is GMG's fundamental core competency. Ongoing graphene production and characterisation developments will only support the Company's ability to develop and provide its useful liquid graphene products and Graphene Aluminium Ion Battery."
About GMG www.graphenemg.com
GMG is a clean-technology company which seeks to offer energy saving and energy storage solutions, enabled by graphene, including that manufactured in-house via a proprietary production process.
GMG has developed a proprietary production process to decompose natural gas (i.e. methane) into its elements, carbon (as graphene), hydrogen and some residual hydrocarbon gases. This process produces high quality, low cost, scalable, 'tuneable' and low/no contaminant graphene suitable for use in clean-technology and other applications. The Company's present focus is to de-risk and develop commercial scale-up capabilities, and secure market applications.
In the energy savings segment, GMG has focused on graphene enhanced heating, ventilation and air conditioning ("HVAC-R") coating (or energy-saving paint), lubricants and fluids. In the energy storage segment, GMG and the University of Queensland are working collaboratively with financial support from the Australian Government to progress R&D and commercialization of G+AI Batteries.
For further information please contact:
-
Craig Nicol, Chief Executive Officer & Managing Director of the Company at craig.nicol@graphenemg.com, +61 415 445 223
-
Leo Karabelas at Focus Communications Investor Relations, leo@fcir.ca, +1 647 689 6041
Neither the TSX Venture Exchange nor its Regulation Services Provider (as that term is defined in the policies of the TSX Venture Exchange) accept responsibility for the adequacy or accuracy of this news release.
Cautionary Note Regarding Forward-Looking Statements
This news release includes certain statements and information that may constitute forward-looking information within the meaning of applicable Canadian securities laws. Forward-looking statements relate to future events or future performance and reflect the expectations or beliefs of management of the Company regarding future events. Generally, forward-looking statements and information can be identified by the use of forward-looking terminology such as "intends", "expects" or "anticipates", or variations of such words and phrases or statements that certain actions, events or results "may", "could", "should", "would" or will "potentially" or "likely" occur. This information and these statements, referred to herein as "forward‐looking statements", are not historical facts, are made as of the date of this news release and include without limitation: statements relating to the type of equipment being procured by the Company and the operators of such equipment; and the expected benefits of the analytical and characterisation laboratory equipment.
Such forward-looking statements are based on a number of assumptions of management, including, without limitation: assumptions relating to the type of equipment that will be procured by the Company; that the equipment will be operated by the Company's scientists and technicians; that once the equipment is procured the Company will be able to perform its own testing of nano materials; that the expansion of GMG's characterisation equipment will reduce learning loop times for optimisation projects as the Company will no longer have to wait for University equipment access; and that ongoing graphene production and characterisation developments will support the Company's ability to develop and provide its products.
Additionally, forward-looking information involves a variety of known and unknown risks, uncertainties and other factors which may cause the actual plans, intentions, activities, results, performance or achievements of GMG to be materially different from any future plans, intentions, activities, results, performance or achievements expressed or implied by such forward-looking statements. Such risks include, without limitation: that the Company will be unable to procure the expected equipment; that the Company's scientists and technicians will be unable to operate the new equipment; that even if the expected equipment is procured, that Company will not become self-sufficient in testing its own nano materials; that the expansion of the Company's graphene characterisation equipment will not reduce learning loop times for optimisation projects; that ongoing graphene production and characterisation developments will not support the Company's ability to develop and provide its products; risks relating to the extent and duration of the conflict in Eastern Europe and its impact on global markets; the volatility of global capital markets; political instability; the failure of the Company to obtain regulatory approvals, attract and retain skilled personnel; unexpected development and production challenges; unanticipated costs; and the risk factors set out under the heading "Risk Factors" in the Company's annual information form dated October 12, 2023 available for review on the Company's profile at www.sedarplus.ca.
Although management of the Company has attempted to identify important factors that could cause actual results to differ materially from those contained in forward-looking statements or forward-looking information, there may be other factors that cause results not to be as anticipated, estimated or intended. There can be no assurance that such statements will prove to be accurate, as actual results and future events could differ materially from those anticipated in such statements. Accordingly, readers should not place undue reliance on forward-looking statements and forward-looking information. Readers are cautioned that reliance on such information may not be appropriate for other purposes. The Company does not undertake to update any forward-looking statement, forward-looking information or financial out-look that are incorporated by reference herein, except in accordance with applicable securities laws. We seek safe harbor.
To view the source version of this press release, please visit https://www.newsfilecorp.com/release/221932
Brisbane, Australia–(Newsfile Corp. – August 6, 2024) – Graphene Manufacturing Group (TSXV: GMG) ("GMG" or the "Company") is pleased to announce that it has entered into a service agreement with Proactive Investors North America Inc. ("Proactive"), a company existing under the federal laws of Canada and an arm's length party to the Company, dated August 3, 2024 (the "Proactive Agreement") to increase the Company's investor relations outreach. Pursuant to the Proactive Agreement, Proactive will provide media services, including research reports and analyst videos, to GMG for a twelve-month term, unless earlier terminated in accordance with the terms of the Proactive Agreement. The Company will pay Proactive a fee of US$25,000 in consideration for such services.
Proactive's place of business is 300 Vesey Street, 12th Floor, New York New York 10282 United States. Proactive does not have any interest, directly or indirectly, in the Company or its securities, or any right or intent to acquire such an interest. The Proactive Agreement remains subject to the approval of the TSX Venture Exchange (the "TSXV").
The Company also announces that it will be continuing its investor relations agreement with Focus Communications Investor Relations Inc. ("Focus"), a company existing under the laws of Ontario, dated July 1, 2023 which will continue for a further two years until July 1, 2026. For further details regarding the arrangement with Focus, please refer to the Company's news releases dated July 18, 2023 and February 19, 2024.
The Company further announces that it will be continuing its issuer trading services agreement with Independent Trading Group ("ITG"), a company existing under the laws of Ontario, dated June 1, 2023. The ITG Agreement automatically renews for one-month terms unless terminated by the parties. For further details regarding the arrangement with ITG, please refer to the Company's news release dated July 18, 2023.
About GMG www.graphenemg.com
GMG is a clean-technology company which seeks to offer energy saving and energy storage solutions, enabled by graphene, including that manufactured in-house via a proprietary production process. GMG has developed a proprietary production process to decompose natural gas (i.e. methane) into its elements, carbon (as graphene), hydrogen and some residual hydrocarbon gases. This process produces high quality, low cost, scalable, 'tuneable' and low/no contaminant graphene suitable for use in clean-technology and other applications.
The Company's present focus is to de-risk and develop commercial scale-up capabilities, and secure market applications. In the energy savings segment, GMG has focused on graphene enhanced heating, ventilation and air conditioning ("HVAC-R") coating (or energy-saving coating), lubricants and fluids.
In the energy storage segment, GMG and the University of Queensland are working collaboratively with financial support from the Australian Government to progress R&D and commercialization of graphene aluminium-ion batteries ("G+AI Batteries").
GMG's 4 critical business objectives are:
Produce Graphene and improve/scale cell production processes
Build Revenue from Energy Savings Products
Develop Next-Generation Battery
Develop Supply Chain, Partners & Project Execution Capability
For further information please contact:
– Craig Nicol, Chief Executive Officer and Managing Director of the Company at craig.nicol@graphenemg.com, +61 415 445 223- Leo Karabelas at Focus Communications, leo@fcir.ca, +1 647 689 6041
Neither the TSX Venture Exchange nor its Regulation Services Provider (as that term is defined in the policies of the TSX Venture Exchange) accepts responsibility for the adequacy or accuracy of this news release.
Cautionary Note Regarding Forward-Looking Statements
This press release contains "forward-looking information" and "forward-looking statements" within the meaning of applicable securities legislation. The forward-looking statements herein are made as of the date of this press release only, and the Company does not assume any obligation to update or revise them to reflect new information, estimates or opinions, future events or results or otherwise, except as required by applicable law. Often, but not always, forward-looking statements can be identified by the use of words such as "plans", "expects", "is expected", "budgets", "scheduled", "estimates", "forecasts", "predicts", "projects", "intends", "targets", "aims", "anticipates" or "believes" or variations (including negative variations) of such words and phrases or may be identified by statements to the effect that certain actions "may", "could", "should", "would", "might" or "will" be taken, occur or be achieved. Forward-looking information in this press release includes, but is not limited to, statements regarding the expected services to be provided to the Company pursuant to the investor relations agreements described in this news release (the "IR Agreements") and approval of the Proactive Agreement by the TSXV.
These forward-looking statements involve numerous risks and uncertainties and actual results might differ materially from results suggested in any forward-looking statements. These risks and uncertainties include, among other things, risks related to the services provided pursuant to the IR Agreements differing from management's current expectations and the risk that the TSXV may not approve the Proactive Agreement.
In making the forward-looking statements in this news release, the Company has applied several material assumptions, including without limitation, assumptions regarding the services provided pursuant to the IR Agreements, and the potential benefits provided to the Company by entering into the IR Agreements.
Although management of the Company has attempted to identify important factors that could cause actual results to differ materially from those contained in forward-looking statements or forward-looking information, there may be other factors that cause results not to be as anticipated, estimated or intended. There can be no assurance that such statements will prove to be accurate, as actual results and future events could differ materially from those anticipated in such statements. Accordingly, readers should not place undue reliance on forward-looking statements and forward-looking information. Readers are cautioned that reliance on such information may not be appropriate for other purposes. The Company does not undertake to update any forward-looking statement, forward-looking information or financial out-look that are incorporated by reference herein, except in accordance with applicable securities laws. We seek safe harbor.
To view the source version of this press release, please visit https://www.newsfilecorp.com/release/219081
Brisbane, Queensland, Australia–(Newsfile Corp. – August 6, 2024) – Graphene Manufacturing Group Ltd. (TSXV: GMG) ("GMG" or the "Company") is pleased to provide the latest progress update on its Graphene Aluminium-Ion Battery technology ("G+AI Battery") being developed by GMG and the University of Queensland ("UQ").
Notably, this update includes information about GMG's G+AI Battery regarding:
-
Electrochemistry Optimisation
-
1000 mAh Battery Cell Capacity Reached (Previously)
-
Battery Technology Readiness Level
-
Next Steps Toward Commercialisation and Market Applications
-
Next Generation Battery Performance
-
Important Milestones for GMG's Graphene Aluminium Ion Battery Development
Electrochemistry Optimisation
The Company is currently optimising the G+AI Battery pouch cell electrochemistry – which is a standard battery development process step (please see Battery Technology Readiness Level section below).
The Company has developed significant knowledge regarding the electrochemistry of the pouch cells since achieving the targeted 1 Ah cell capacity in February 2024.
The challenges that the G+AI Battery are showing through this phase of its maturation are very similar to other battery chemistries that have been developed into mass production – including Lithium-Ion batteries.
The performance of the pouch cells will be communicated upon successfully producing a repeatable and 3rd party tested 1000 mAh+ battery pouch cell.
The Company is confident it can meet its overall timeline on the battery cell roadmap as seen in Figure 1 as previously communicated.
Figure 1: Battery Cell Roadmap
To view an enhanced version of this graphic, please visit:https://images.newsfilecorp.com/files/8082/218986_934e5a6e74c4b803_001full.jpg
There are five steps in this optimisation process which the Company completes once per week in what it calls a "Sprint" as seen in Figure 2.
Figure 2: Optimisation Weekly Sprint Process
To view an enhanced version of this graphic, please visit:https://images.newsfilecorp.com/files/8082/218986_gmg1.jpg
Make Cell
The major components of the G+AI Battery are:Cathode: Graphene, binder and solvent (water or another solution) layered on a metal foil cathode substrate.Anode: Aluminium foilElectrolyte: Aluminium Chloride and ionic fluid (Urea or another solution)Separator: Separator
These are assembled in a standard step by step process – which is documented in the Company's operation manual of procedures for the Battery Development Process.
There are many different variations that can be trialed in a cell design which can include, but are not limited to, the following:
– Processing of the graphene- Type of Cathode Solvent- Type of Cathode Binder- Cathode thickness- Various Ionic Fluids in the Electrolyte- Various mixes of Electrolyte components- Types of Separators (different materials, suppliers and thicknesses)- Various Cathode preparation variations- Various Cell Assembly process variations- Charging and Discharging algorithms (including charging voltage, current and time)- Formation Processes
Typically, 5 of each battery design is made which ensures a statistical depth to the testing.
Test Cell Performance
Once the Cell Performance is measured (on the charging/discharging stacks) there are certain performance parameters that are observed which include, but are not limited to, the following:
– Capacity (mAh)- Nominal Voltage (Volts)- Number of Charging and Discharging Cycles (number)- Physical expansion or contraction of the cell- Physical changes to the cell
This data is then recorded and linked to the cell design and assembly process used to make the cell.
Compare Cell Performance
The objective of this step is to understand what design and cell assembly parameters, in an isolated test, have a repeatable causal change in cell performance.
Each Sprint usually focuses on a single variable in design or cell assembly – an example of a 3-week Sprint program is seen in Figure 3.
Figure 3: Sprint Program Example
To view an enhanced version of this graphic, please visit:https://images.newsfilecorp.com/files/8082/218986_gmg2.jpg
Review Optimisation Options
Upon reviewing optimisation options for the next Sprint, there are many parameters to consider. Often one design parameter of the cell or assembly process will positively improve one cell performance outcome but have a negative impact on another. As the Company optimises various performance outcomes of the battery cell – some of which are shown in Figure 4 – the Company needs to consider the various potential trade-offs on other performance outcomes.
Figure 4: Battery Optimisation Process
To view an enhanced version of this graphic, please visit:https://images.newsfilecorp.com/files/8082/218986_gmg3.jpg
Propose Next Cell Design (repeat Step 1 again)
Once the Company has selected the design of the Cell parameters, it needs to test for optimisation. This involves repeating step 1 until a final design or variable is chosen.
1000 mAh Battery Cell Capacity Reached
The Company previously announced on the 6th February 2024 it produced multiple battery pouch cells with over 1000 mAh (1 Ah) capacity, as seen in Figure 5. This was a major milestone achieved to demonstrate scalability from coin cells to pouch cells, and represented the next milestone in the battery's development, following the announcement of 500 mAh capacity in September 2023.
Figure 5: Typical G+AI Pouch Cell Prototype
To view an enhanced version of this graphic, please visit:https://images.newsfilecorp.com/files/8082/218986_934e5a6e74c4b803_009full.jpg
Please see typical charging and discharging curve of the GMG's Graphene Aluminium-Ion Battery 1000 mAh cell in Figure 6 showing a nominal voltage of 1.7 volts.
Figure 6: Typical Charging and Discharging Curves
To view an enhanced version of this graphic, please visit:https://images.newsfilecorp.com/files/8082/218986_934e5a6e74c4b803_010full.jpg
At the same time, GMG is reviewing a potential investment for the procurement and installation of an automated pouch cell battery pilot plant in its Richlands Australia Facility. The Pilot Plant will enable the Company to produce pouch cells for potential customers to test in battery packs for different applications. Following the successful start-up of the Pilot Plant and successful customer trials, GMG expects to pursue large scale commercial production, as seen in Figure 7.
Figure 7: Pouch Cell Scale Up Process
To view an enhanced version of this graphic, please visit:https://images.newsfilecorp.com/files/8082/218986_934e5a6e74c4b803_011full.jpg
Battery Technology Readiness Level
The battery technology readiness level ("BTRL") of the Graphene Aluminium-Ion technology remains at Level 4 (see Figure 8). GMG is currently optimizing electrochemical behaviour for pouch cells via ongoing laboratory experimentation. If GMG invests, constructs and commissions a Pilot Plant it is anticipated that the battery technology will progress to BTRL 7 and 8 since the equipment and process needed to make the Graphene Aluminium-Ion batteries is the same as those employed to make Lithium Ion Batteries.
Figure 8: Battery Technology Readiness Level
Source: "The Battery Component Readiness Level (BC-RL) Framework: A technology-specific development framework", Matthew Greenwood et al
To view an enhanced version of this graphic, please visit:https://images.newsfilecorp.com/files/8082/218986_934e5a6e74c4b803_012full.jpg
Next Steps Toward Commercialisation & Market Applications
The Company continues to see a broad range of applications for a completed GMG Graphene Aluminium Ion Battery – utilising its ultra-high power-density and nominal energy density characteristics. Along with Rio Tinto, a range of global companies have confidentially expressed their interest in working with GMG in the following vertical sectors:
To view an enhanced version of this graphic, please visit:https://images.newsfilecorp.com/files/8082/218986_934e5a6e74c4b803_013full.jpg
Next Generation Battery Performance
GMG's next generation Graphene Aluminium-Ion Battery performance data (as tested and calculated on coin cells), as compared to the most commonly available lithium-ion batteries, is shown below in Figure 9, with a list of its beneficial characteristics.
The performance of the pouch cells will be communicated upon successfully producing a repeatable and fully 3rd party tested 1000 mAh+ battery pouch cell.
Figure 9: Graphene Aluminium Ion Battery Comparative Performance Data (for coin cells)
Pouch cell performance data could be significantly different and will be published once 1000 mAh+ capacity pouch cells are developed and tested.
Source:*University of Queensland validated GMG testing data based on industry standard estimate methodology from coin cells using a reducing factor of 2.3.#CATL 3.7V 65Ah NCM Lithium Battery Cell – LiFePO4 Battery (lifepo4-battery.com) on 29/09/22 7$ CATL 3.2V 150Ah LiFePO4 Battery Cell – LiFePO4 Battery (lifepo4-battery.com) on 29/09/22
To view an enhanced version of this graphic, please visit:https://images.newsfilecorp.com/files/8082/218986_934e5a6e74c4b803_014full.jpg
Important Milestones for the Battery's Development:
Important milestones for GMG's Graphene Aluminium Ion Battery Development:
About GMG
GMG is a clean-technology company which seeks to offer energy saving and energy storage solutions, enabled by graphene, including that manufactured in-house via a proprietary production process.
GMG has developed a proprietary production process to decompose natural gas (i.e. methane) into its elements, carbon (as graphene), hydrogen and some residual hydrocarbon gases. This process produces high quality, low cost, scalable, 'tuneable' and low/no contaminant graphene suitable for use in clean-technology and other applications. The Company's present focus is to de-risk and develop commercial scale-up capabilities, and secure market applications.
In the energy savings segment, GMG has focused on graphene enhanced heating, ventilation and air conditioning ("HVAC-R") coating (or energy-saving paint), lubricants and fluids. In the energy storage segment, GMG and the University of Queensland are working collaboratively with financial support from the Australian Government to progress R&D and commercialization of graphene aluminium-ion batteries ("G+AI Batteries").
GMG's 4 critical business objectives are:
Produce Graphene and improve/scale cell production processes
Build Revenue from Energy Savings Products
Develop Next-Generation Battery
Develop Supply Chain, Partners & Project Execution Capability
For further information please contact:
-
Craig Nicol, Chief Executive Officer & Managing Director of the Company at craig.nicol@graphenemg.com, +61 415 445 223
-
Leo Karabelas at Focus Communications Investor Relations, leo@fcir.ca, +1 647 689 6041
Neither the TSX Venture Exchange nor its Regulation Services Provider (as that term is defined in the policies of the TSX Venture Exchange) accept responsibility for the adequacy or accuracy of this news release.
Cautionary Note Regarding Forward-Looking Statements
This news release includes certain statements and information that may constitute forward-looking information within the meaning of applicable Canadian securities laws. Forward-looking statements relate to future events or future performance and reflect the expectations or beliefs of management of the Company regarding future events. Generally, forward-looking statements and information can be identified by the use of forward-looking terminology such as "intends", "expects" or "anticipates", or variations of such words and phrases or statements that certain actions, events or results "may", "could", "should", "would" or will "potentially" or "likely" occur. This information and these statements, referred to herein as "forward‐looking statements", are not historical facts, are made as of the date of this news release and include without limitation, statements regarding the development of the Company's pouch cell battery, that the Company will obtain repeatable third party testing of a 1000 mAh+ battery pouch cell, the timing of gathering third party laboratory battery testing data, that the Company will review the investment decision to procure and install an automated pouch cell battery pilot plant in its Richlands Australia facility and the potential to pursue large scale commercial production if the pilot plant and customer trials are successful, the timing of customer testing for an 1000 mAh pouch cell, that the Company will optimize electrochemical behaviour for pouch cells via ongoing laboratory experimentation, the ability of a pilot plant to help progress the Graphene Aluminium-Ion technology along the BTRL, the Company's ability to meet its overall timeline on the battery cell roadmap, and the potential applications for the G+AI Battery.
Such forward-looking statements are based on a number of assumptions of management, including, without limitation, assumptions that the Company will obtain repeatable third party testing of a 1000 mAh+ battery pouch cell, that the Company will review the investment decision to procure and install an automated pouch cell battery pilot plant in its Richlands Australia facility, that the Company may move to large scale commercial production if the pilot plant and customer trials are successful, that the Company will be able to optimize the electrochemical behaviour of the pouch cell through laboratory experimentation, that a pilot plant will assist in progressing its Graphene Aluminium-Ion technology along the BTRL, and that the Company will be able to meet its overall timeline on the battery cell roadmap. Additionally, forward-looking information involves a variety of known and unknown risks, uncertainties and other factors which may cause the actual plans, intentions, activities, results, performance or achievements of GMG to be materially different from any future plans, intentions, activities, results, performance or achievements expressed or implied by such forward-looking statements. Such risks include, without limitation: that the Company will not be able to obtain repeatable third party testing of a 1000 mAh+ battery pouch cell, that the Company will choose not to proceed with a pilot plant, that the Company will not proceed to customer testing and laboratory testing on the expected timeline or at all, that the Company will not pursue large scale commercial production even if the pilot plant and customer trials are successful, that the construction of a pilot plant will not help advance the Graphene Aluminium-Ion technology along the BTRL, that the Company will not be able to optimize the electrochemical behaviour of the pouch cell through laboratory experimentation or at all, the Company will not be able to meet its overall timeline on the battery cell roadmap, risks relating to the extent and duration of the conflict in Eastern Europe and its impact on global markets, the volatility of global capital markets, political instability, the failure of the Company to obtain regulatory approvals, attract and retain skilled personnel, unexpected development and production challenges, unanticipated costs and the risk factors set out under the heading "Risk Factors" in the Company's annual information form dated October 12, 2023 available for review on the Company's profile at www.sedarplus.ca.
Although management of the Company has attempted to identify important factors that could cause actual results to differ materially from those contained in forward-looking statements or forward-looking information, there may be other factors that cause results not to be as anticipated, estimated or intended. There can be no assurance that such statements will prove to be accurate, as actual results and future events could differ materially from those anticipated in such statements. Accordingly, readers should not place undue reliance on forward-looking statements and forward-looking information. Readers are cautioned that reliance on such information may not be appropriate for other purposes. The Company does not undertake to update any forward-looking statement, forward-looking information or financial out-look that are incorporated by reference herein, except in accordance with applicable securities laws. We seek safe harbor.
To view the source version of this press release, please visit https://www.newsfilecorp.com/release/218986
Wallbridge Mining Company Limited
TORONTO, June 27, 2024 (GLOBE NEWSWIRE) — Wallbridge Mining Company Limited (TSX:WM, OTCQB:WLBMF) (“Wallbridge” or the “Company”) held its Annual Meeting of Shareholders (the “Meeting”) on June 26, 2024.
A total of 375,770,677 shares or 36.98% of the outstanding shares of the Company were represented at the Meeting. All of the matters submitted to the shareholders for approval as set out in the Company's notice of meeting and management information circular dated May 17, 2024 (“MIC”) were approved by the requisite majority of votes cast at the Meeting.
Voting on the following matters, as described in the MIC, were as follows:
To Set the Number of Directors at Seven (7)
|
Votes For |
Votes Against |
||
|
Number |
Percent |
Number |
Percent |
|
327,860,364 |
87.25% |
47,910,313 |
12.75% |
Election of Directors for the Ensuing Year
The following directors were elected until the next annual meeting of shareholders or until their successors are otherwise duly elected or appointed: Brian Penny, Janet Wilkinson, Michael Pesner, Anthony Makuch, Jeffery Snow, Danielle Giovenazzo and Brian Christie.
|
|
Votes For |
Votes Withheld |
||
|
|
Number |
Percent |
Number |
Percent |
|
Brian Penny |
307,933,143 |
87.647% |
43,398,663 |
12.353% |
|
Janet Wilkinson |
325,213,100 |
92.566% |
26,118,706 |
7.434% |
|
Michael Pesner |
289,152,398 |
82.302% |
62,179,408 |
17.698% |
|
Anthony Makuch |
343,276,508 |
97.707% |
8,055,298 |
2.293% |
|
Jeffery Snow |
345,531,527 |
98.349% |
5,800,279 |
1.651% |
|
Danielle Giovenazzo |
289,089,828 |
82.284% |
62,241,978 |
17.716% |
|
Brian Christie |
344,870,421 |
98.161% |
6,461,385 |
1.839% |
Appointment of KPMG LLP as Auditor of the Corporation for the ensuing year and authorizing the Directors to fix their remuneration
|
Votes For |
Votes Withheld |
||
|
Number |
Percent |
Number |
Percent |
|
373,296,489 |
99.342% |
2,474,188 |
0.658% |
About Wallbridge Mining
Wallbridge is focused on creating value through the exploration and sustainable development of gold projects along the Detour-Fenelon Gold Trend in Québec’s Northern Abitibi region while respecting the environment and communities where it operates.
Wallbridge’s most advanced projects, Fenelon Gold (“Fenelon”) and Martiniere Gold (“Martiniere”) incorporate a combined 3.05 million ounces of indicated gold resources and 2.35 million ounces of inferred gold resources. Fenelon and Martiniere are located within an 830 square kilometre exploration land package controlled by Wallbridge.
Wallbridge has reported a positive Preliminary Economic Assessment (“PEA”) at Fenelon that estimates average annual gold production of 212,000 ounces over 12 years.
Wallbridge also holds a 15.79% interest in the common shares of NorthX Nickel Corp. (formerly “Archer Exploration”) as a result of the sale of the Company’s portfolio of nickel assets in Ontario and Québec. For further information please visit the Company’s website at https://wallbridgemining.com/ or contact:
Wallbridge Mining Company Limited
|
Brian Penny, CPA, CMAChief Executive OfficerEmail: bpenny@wallbridgemining.comM: +1 416 716 8346 |
Victoria Vargas, B.Sc. (Hon.) Economics, MBACapital Markets AdvisorEmail: vvargas@wallbridgemining.comM: +1 289 242 3599 |
Cautionary Note Regarding Forward-Looking InformationThe information in this document may contain forward-looking statements or information (collectively, “FLI”) within the meaning of applicable Canadian securities legislation. FLI is based on expectations, estimates, projections and interpretations as at the date of this document.
All statements, other than statements of historical fact, included herein are FLI that involve various risks, assumptions, estimates and uncertainties. Generally, FLI can be identified by the use of statements that include, but are not limited to, words such as “seeks”, “believes”, “anticipates”, “plans”, “continues”, “budget”, “scheduled”, “estimates”, “expects”, “forecasts”, “intends”, “projects”, “predicts”, “proposes”, "potential", “targets” and variations of such words and phrases, or by statements that certain actions, events or results “may”, “will”, “could”, “would”, “should” or “might”, “be taken”, “occur” or “be achieved.”
FLI in this document may include, but is not limited to: statements regarding the results of the PEA; the potential future performance of the Common Shares; future drill results; the Company’s ability to convert inferred resources into measured and indicated resources; environmental matters; stakeholder engagement and relationships; parameters and methods used to estimate the MRE’s at Fenelon and Martiniere (collectively the “Deposits”); the prospects, if any, of the Deposits; future drilling at the Deposits; and the significance of historic exploration activities and results.
FLI is designed to help you understand management’s current views of its near- and longer-term prospects, and it may not be appropriate for other purposes. FLI by their nature are based on assumptions and involve known and unknown risks, uncertainties and other factors which may cause the actual results, performance, or achievements of the Company to be materially different from any future results, performance or achievements expressed or implied by such FLI. Although the FLI contained in this document is based upon what management believes, or believed at the time, to be reasonable assumptions, the Company cannot assure shareholders and prospective purchasers of securities of the Company that actual results will be consistent with such FLI, as there may be other factors that cause results not to be as anticipated, estimated or intended, and neither the Company nor any other person assumes responsibility for the accuracy and completeness of any such FLI. Except as required by law, the Company does not undertake, and assumes no obligation, to update or revise any such FLI contained in this document to reflect new events or circumstances. Unless otherwise noted, this document has been prepared based on information available as of the date of this document. Accordingly, you should not place undue reliance on the FLI, or information contained herein.
Furthermore, should one or more of the risks, uncertainties or other factors materialize, or should underlying assumptions prove incorrect, actual results may vary materially from those described in FLI.
Assumptions upon which FLI is based, without limitation, include: the results of exploration activities, the Company’s financial position and general economic conditions; the ability of exploration activities to accurately predict mineralization; the accuracy of geological modelling; the ability of the Company to complete further exploration activities; the legitimacy of title and property interests in the Deposits; the accuracy of key assumptions, parameters or methods used to estimate the MREs and in the PEA; the ability of the Company to obtain required approvals; geological, mining and exploration technical problems; failure of equipment or processes to operate as anticipated; the evolution of the global economic climate; metal prices; foreign exchange rates; environmental expectations; community and non-governmental actions; and, the Company’s ability to secure required funding. Risks and uncertainties about Wallbridge's business are discussed in the disclosure materials filed with the securities regulatory authorities in Canada, which are available at www.sedarplus.ca.
Cautionary Notes to United States InvestorsWallbridge prepares its disclosure in accordance with NI 43-101 which differs from the requirements of the U.S. Securities and Exchange Commission (the "SEC"). Terms relating to mineral properties, mineralization and estimates of mineral reserves and mineral resources and economic studies used herein are defined in accordance with NI 43-101 under the guidelines set out in CIM Definition Standards on Mineral Resources and Mineral Reserves, adopted by the Canadian Institute of Mining, Metallurgy and Petroleum Council on May 19, 2014, as amended. NI 43-101 differs significantly from the disclosure requirements of the SEC generally applicable to US companies. As such, the information presented herein concerning mineral properties, mineralization and estimates of mineral reserves and mineral resources may not be comparable to similar information made public by U.S. companies subject to the reporting and disclosure requirements under the U.S. federal securities laws and the rules and regulations thereunder.
Brisbane, Queensland, Australia–(Newsfile Corp. – June 13, 2024) – Graphene Manufacturing Group Ltd. (TSXV: GMG) (OTCQX: GMGMF) ("GMG" or the "Company") is pleased to announce that it has entered into an equity distribution agreement dated June 13, 2024 (the "Distribution Agreement") with Cantor Fitzgerald Canada Corporation (the "Agent"). Pursuant to the Distribution Agreement, the Company will be entitled, at its discretion and from time-to-time during the term of the Distribution Agreement, to sell, through the Agent, such number of ordinary shares of the Company (the "Ordinary Shares") that would result in aggregate gross proceeds to the Company of up to C$20 million (the "Offering" or "ATM Facility"). Sales of the Ordinary Shares, if any, will be made in "at the market distributions", as defined in National Instrument 44-102 – Shelf Distributions, directly on the TSX Venture Exchange (the "TSXV") or on any other existing trading market in Canada. No offers or sales of Ordinary Shares will be made on any exchange or quotation system outside of Canada.
Net proceeds from the ATM Facility, if any, will be used to fund ongoing operations including, but not limited to, commercial development, product development and working capital. The ATM Facility will be effective until the earlier of (i) the issuance and sale of an aggregate amount of C$20,000,000 of Ordinary Shares through the Agent; and (ii) February 10, 2025, unless earlier terminated prior to such date by the Company or the Agent.
The Offering will be made by way of a prospectus supplement dated June 13, 2024 (the "Prospectus Supplement") to the Company's amended and restated short form base shelf prospectus dated January 5, 2024 (amending and restating the short form base shelf prospectus dated January 9, 2023 as amended and restated by the amended and restated short form prospectus dated August 2, 2023) for the provinces of British Columbia, Alberta, Saskatchewan and Ontario; and the final short form base shelf prospectus dated January 5, 2024 for the provinces and territories of Manitoba, Quebec, New Brunswick, Nova Scotia, Prince Edward Island, Newfoundland and Labrador, Yukon, Northwest Territories and Nunavut (together with the Prospectus Supplement, the "Offering Documents"). The Prospectus Supplement will be filed with each of the provincial securities commissions in Canada. The Offering Documents will contain important detailed information about the securities being offered. Before you invest, you should read the Offering Documents and the documents incorporated therein for more complete information about the Company and the Offering. Copies of the Distribution Agreement and the Offering Documents will be available for free by visiting the Company's profile on SEDAR+ at www.sedarplus.ca.
This news release does not constitute an offer to sell or the solicitation of an offer to buy securities, nor shall there be any sale of securities in the United States, or in any other jurisdiction in which such offer, solicitation or sale would be unlawful. The securities described in this news release have not been and will not be registered under the United States Securities Act of 1933, as amended (the "U.S. Securities Act"), or under any U.S. state securities laws, and may not be offered, sold, directly or indirectly, or delivered within the "United States" or to, or for the account or benefit of, persons in the "United States" or "U.S. persons" (as such terms are defined in Regulation S under the U.S. Securities Act) except in certain transactions exempt from the registration requirements of the U.S. Securities Act and all applicable U.S. state securities laws.
About GMG www.graphenemg.com
GMG is a clean-technology company which seeks to offer energy saving and energy storage solutions, enabled by graphene, including that manufactured in-house via a proprietary production process. GMG has developed a proprietary production process to decompose natural gas (i.e. methane) into its elements, carbon (as graphene), hydrogen and some residual hydrocarbon gases. This process produces high quality, low cost, scalable, 'tuneable' and low/no contaminant graphene suitable for use in clean-technology and other applications.
The Company's present focus is to de-risk and develop commercial scale-up capabilities, and secure market applications. In the energy savings segment, GMG has focused on graphene enhanced heating, ventilation and air conditioning ("HVAC-R") coating (or energy-saving coating), lubricants and fluids.
In the energy storage segment, GMG and the University of Queensland are working collaboratively with financial support from the Australian Government to progress R&D and commercialization of graphene aluminium-ion batteries ("G+AI Batteries").
GMG's 4 critical business objectives are:
Produce Graphene and improve/scale cell production processes
Build Revenue from Energy Savings Products
Develop Next-Generation Battery
Develop Supply Chain, Partners & Project Execution Capability
For further information please contact:
-
Craig Nicol, Chief Executive Officer & Managing Director of the Company at craig.nicol@graphenemg.com, +61 415 445 223
-
Leo Karabelas at Focus Communications Investor Relations, leo@fcir.ca, +1 647 689 6041
Neither the TSX Venture Exchange nor its Regulation Services Provider (as that term is defined in the policies of the TSX Venture Exchange) accept responsibility for the adequacy or accuracy of this news release.
Cautionary Note Regarding Forward-Looking Statements
This news release includes certain statements and information that may constitute forward-looking information within the meaning of applicable Canadian securities laws. Forward-looking statements relate to future events or future performance and reflect the expectations or beliefs of management of the Company regarding future events. Generally, forward-looking statements and information can be identified by the use of forward-looking terminology such as "intends", "expects" or "anticipates", or variations of such words and phrases or statements that certain actions, events or results "may", "could", "should", "would" or will "potentially" or "likely" occur. This information and these statements, referred to herein as "forward‐looking statements", are not historical facts, are made as of the date of this news release and include without limitation, statements regarding the Company's proposed business plans, expectations regarding the sale of Ordinary Shares under the ATM Facility, the proceeds from the ATM Facility, and the Company's proposed use of the proceeds from the ATM Facility.
Such forward-looking statements are based on a number of assumptions of management, including, without limitation, assumptions that the Company will receive the necessary regulatory approvals for the ATM Facility and that the Company will be able to use the proceeds from the ATM Facility as anticipated.
Additionally, forward-looking information involves a variety of known and unknown risks, uncertainties and other factors which may cause the actual plans, intentions, activities, results, performance or achievements of GMG to be materially different from any future plans, intentions, activities, results, performance or achievements expressed or implied by such forward-looking statements. Such risks include, without limitation: the risk that the Company is not able to use the proceeds from the ATM Facility as anticipated by management, the risk that the Company does not receive the requisite regulatory approvals for the ATM Facility, risks relating to the extent and duration of the conflict in Eastern Europe and its impact on global markets, the volatility of global capital markets, political instability, the failure of the Company to obtain regulatory approvals, attract and retain skilled personnel, unexpected development and production challenges, unanticipated costs and the risk factors set out under the heading "Risk Factors" in the Company's annual information form dated October 12, 2023 available for review on the Company's profile at www.sedarplus.ca.
Although management of the Company has attempted to identify important factors that could cause actual results to differ materially from those contained in forward-looking statements or forward-looking information, there may be other factors that cause results not to be as anticipated, estimated or intended. There can be no assurance that such statements will prove to be accurate, as actual results and future events could differ materially from those anticipated in such statements. Accordingly, readers should not place undue reliance on forward-looking statements and forward-looking information. Readers are cautioned that reliance on such information may not be appropriate for other purposes. The Company does not undertake to update any forward-looking statement, forward-looking information or financial out-look that are incorporated by reference herein, except in accordance with applicable securities laws. We seek safe harbor.
NOT FOR DISTRIBUTION TO U.S. NEWSWIRE SERVICES OR DISSEMINATION IN THE UNITED STATES
To view the source version of this press release, please visit https://www.newsfilecorp.com/release/212955
Brisbane, Queensland, Australia–(Newsfile Corp. – October 30, 2023) – Graphene Manufacturing Group Limited (TSXV: GMG) ("GMG" or the "Company") is pleased to provide a business update on the commercialisation progress of THERMAL-XR® powered by GMG Graphene.
GMG has now received forward orders of over AU$400k for THERMAL-XR® from various distributors and customers worldwide. Most of the value of these orders is conditional on the in-country approval for the THERMAL-XR® to be imported from Australia and sold into that country for the product's initial launch.
The Company also continues to progress negotiations with a wide range of distributor and direct industrial end-use customers for a range of applications and hopes to make further announcements soon.
Preparations for the early 2024 product launch in the USA by Nu-Calgon are advanced with marketing, sales and customer engagement activities well progressed supported by continuing demonstrations of successful energy savings results. A recent demonstration project in Texas achieved an estimated 36% energy savings result, as per Figure 1. The air conditioner serviced was a 30-ton Aaon packaged rooftop air-conditioning system, as per Figure 2.
Figure 1.0 Energy Consumption Reduction from Thermal-XR® Service
To view an enhanced version of this graphic, please visit:https://images.newsfilecorp.com/files/8082/185596_gmg1en.jpg
Figure 2.0 Air Conditioning Equipment for Texas Demonstration Project
To view an enhanced version of this graphic, please visit:https://images.newsfilecorp.com/files/8082/185596_gmg2en.jpg
THERMAL-XR® is progressing through the USA Environmental Protection Agency's (EPA) approval process to import and sell in the USA. All the required documentation has been submitted, and the EPA has assigned a case number as part of the thorough evaluation of the product's safety and environmental impact. The Company believes the potential approval will be received in Q4'23.
To support distributors, and advance the adoption and ease of explanation for THERMAL-XR® GMG has developed an online virtual tour of the THERMAL-XR® Demonstration Centre on its website:www.graphenemg.com/graphene-products/thermal-xr/virtual-tour/
GMG has also successfully passed Stage One (Gap Analysis) of the ISO 9001 accreditation process and is on track to complete the final stages and receive full accreditation for ISO9001, for Quality Management, in H1 2024. GMG sees ISO 9001 accreditation as an important table stake to become a commercial manufacturing operation for our energy saving and energy storage products while also providing a structured basis for continuous improvement for our company's operations and customer satisfaction.
GMG's Managing Director and CEO, Craig Nicol, commented: "The progress GMG is making is exciting. End customers and distributors are now starting to generate notable revenue for the Company, and our THERMAL-XR® product is now starting to be recognised as being an energy-savings solution for Heating, Ventilation, Air-Conditioning, Cooling and Refrigeration (HVAC-R) equipment as well as a range of industrial applications. We continue to build capabilities to support these expected increased sales by upgrading our production facilities including our quality management systems."
GMG's 4 critical business objectives remain to:
Produce Graphene and improve/scale the production process
Build Revenue from Energy Savings Products
Develop Next-Generation Battery
Develop Supply Chain, Partners & Project Execution Capability
About THERMAL-XR® powered by GMG Graphene:
THERMAL-XR® COATING SYSTEM is a unique method of improving the conductivity of corroded heat exchange surfaces and improving and maintaining the performance of new units at peak levels. The process coats and protects heat exchange surfaces while improving and rebuilding the lost corroded thermal conductivity and increasing the heat transfer rate by leveraging the physics of GMG Graphene, resulting in an efficiency improvement and a potential power reduction.
THERMAL-XR RESTORE® is powered by GMG Graphene. PATENT PENDING
About GMG www.graphenemg.com
GMG is a clean-technology company which seeks to offer energy saving and energy storage solutions, enabled by graphene, including that manufactured in-house via a proprietary production process.
GMG has developed a proprietary production process to decompose natural gas (i.e. methane) into its elements, carbon (as graphene), hydrogen and some residual hydrocarbon gases. This process produces high quality, low cost, scalable, 'tuneable' and low/no contaminant graphene suitable for use in clean-technology and other applications. The Company's present focus is to de-risk and develop commercial scale-up capabilities, and secure market applications.
In the energy savings segment, GMG has focused on graphene enhanced heating, ventilation and air conditioning ("HVAC-R") coating (or energy-saving paint), lubricants and fluids. In the energy storage segment, GMG and the University of Queensland are working collaboratively with financial support from the Australian Government to progress R&D and commercialization of graphene aluminium-ion batteries ("G+AI Batteries").
For further information please contact:
-
Craig Nicol, Chief Executive Officer & Managing Director of the Company at craig.nicol@graphenemg.com, +61 415 445 223
-
Leo Karabelas at Focus Communications Investor Relations, leo@fcir.ca, +1 647 689 6041
Neither the TSX Venture Exchange nor its Regulation Services Provider (as that term is defined in the policies of the TSX Venture Exchange) accept responsibility for the adequacy or accuracy of this news release.
Cautionary Note Regarding Forward-Looking Statements
This news release includes certain statements and information that may constitute forward-looking information within the meaning of applicable Canadian securities laws. Forward-looking statements relate to future events or future performance and reflect the expectations or beliefs of management of the Company regarding future events. Generally, forward-looking statements and information can be identified by the use of forward-looking terminology such as "intends", "expects" or "anticipates", or variations of such words and phrases or statements that certain actions, events or results "may", "could", "should", "would" or will "potentially" or "likely" occur. This information and these statements, referred to herein as "forward‐looking statements", are not historical facts, are made as of the date of this news release and include without limitation, statements regarding the progression of end-user engagement in the United States, the official NuCalgon launch and the timing thereof, the impact of case studies on establishing the North American user experience with THERMAL-XR®, the advancement of GMG's ISO 9001 accreditation and the timing and benefits therefrom, the progression of THERMAL-XR® through the Environmental Protection Agency's approval process, and the recognition of THERMAL-XR® as an energy savings alternative for HVAC-R equipment.
Such forward-looking statements are based on a number of assumptions of management, including, without limitation, assumptions relating to the timing and benefits of the expected official NuCalgon launch, the impact of case studies on establishing the North American user experience with THERMAL-XR®, that positive energy savings results will drive user engagement in the United States, that GMG will obtain its ISO 9001 accreditation on the expected timeline and derive the expected benefits therefrom, that THERMAL-XR® will progress through the Environmental Protection Agency's approval process on the expected timeline, and that recognition of THERMAL-XR® as an energy savings alternative in the HVAC-R market is increasing. Additionally, forward-looking information involves a variety of known and unknown risks, uncertainties and other factors which may cause the actual plans, intentions, activities, results, performance or achievements of GMG to be materially different from any future plans, intentions, activities, results, performance or achievements expressed or implied by such forward-looking statements. Such risks include, without limitation: that the expected official NuCalgon launch will not occur in early 2024 or at all, that the Company's case study will not help establish a North American user experience with THERMAL-XR®, that THERMAL-XR®'s energy saving results will not drive user engagement as currently expected by management, that GMG will not obtain its ISO 9001 accreditation in H1 2024 or at all, that THERMAL-XR® will not be approved by the Environmental Protection Agency by Q4 2023 or at all, that THERMAL-XR® will not be seen as an energy savings alternative in the HVAC-R market, risks relating to the extent and duration of the conflict in Eastern Europe and its impact on global markets, the volatility of global capital markets, political instability, the failure of the Company to obtain regulatory approvals, attract and retain skilled personnel, unexpected development and production challenges, unanticipated costs and the risk factors set out under the heading "Risk Factors" in the Company's annual information form dated October 18, 2022 available for review on the Company's profile at www.sedarplus.ca.
Although management of the Company has attempted to identify important factors that could cause actual results to differ materially from those contained in forward-looking statements or forward-looking information, there may be other factors that cause results not to be as anticipated, estimated or intended. There can be no assurance that such statements will prove to be accurate, as actual results and future events could differ materially from those anticipated in such statements. Accordingly, readers should not place undue reliance on forward-looking statements and forward-looking information. Readers are cautioned that reliance on such information may not be appropriate for other purposes. The Company does not undertake to update any forward-looking statement, forward-looking information or financial out-look that are incorporated by reference herein, except in accordance with applicable securities laws. We seek safe harbor.
To view the source version of this press release, please visit https://www.newsfilecorp.com/release/185596
Graphene Manufacturing Group (CVE:GMG) Full Year 2023 ResultsKey Financial Results
-
Net loss: AU$9.32m (loss narrowed by 21% from FY 2022).
-
AU$0.12 loss per share (improved from AU$0.15 loss in FY 2022).
All figures shown in the chart above are for the trailing 12 month (TTM) period
Graphene Manufacturing Group Earnings Insights
Looking ahead, revenue is forecast to grow 69% p.a. on average during the next 3 years, compared to a 32% growth forecast for the Electrical industry in Canada.
Performance of the Canadian Electrical industry.
The company's shares are down 3.3% from a week ago.
Risk Analysis
What about risks? Every company has them, and we've spotted 4 warning signs for Graphene Manufacturing Group (of which 1 is concerning!) you should know about.
Have feedback on this article? Concerned about the content? Get in touch with us directly. Alternatively, email editorial-team (at) simplywallst.com.This article by Simply Wall St is general in nature. We provide commentary based on historical data and analyst forecasts only using an unbiased methodology and our articles are not intended to be financial advice. It does not constitute a recommendation to buy or sell any stock, and does not take account of your objectives, or your financial situation. We aim to bring you long-term focused analysis driven by fundamental data. Note that our analysis may not factor in the latest price-sensitive company announcements or qualitative material. Simply Wall St has no position in any stocks mentioned.
Brisbane, Queensland, Australia–(Newsfile Corp. – September 11, 2023) – Graphene Manufacturing Group Ltd. (TSXV: GMG) ("GMG" or the "Company") is pleased to provide a progress update on its Graphene Aluminium-Ion Battery technology ("G+AI Battery") being developed by GMG and the University of Queensland ("UQ"), and on the transition from coin cells to pouch cell format.
The Company has now made initial G+AI Battery prototype pouch cells (see Figure 1), which have a storage capacity of over 500 mAh, with a nominal voltage of ~ 2 volts. This is a significant development as it shows the Company has matured the battery electro-chemistry and assembly techniques of producing pouch cells with over 10 layers of graphene coated cathode and aluminium foil anode.
Figure 1: Typical G+AI Battery Pouch Cell Prototype
To view an enhanced version of this graphic, please visit:https://images.newsfilecorp.com/files/8082/180189_gmg1_550.jpg
The next step for the Company is to optimise the assembly techniques of the pouch cell prototypes. This is to achieve repeatable storage capacity of over 500 mAh cells in order to conduct a variety of standard testing conditions for comparative purposes. The Company then intends to pursue producing cells with over 20 double-layers to get a storage capacity of 1000 mAh by using an automatic coating machine, cathode laser cutting equipment, and a semi-automatic stacker, to achieve reproduceable cells for validation trials.
The aforementioned reproduceable cells is to meet an objective for the Rio Tinto Joint Development Agreement. This target is to achieve a repeatable capacity of 1000 mAh by H1 2024 and then produce this pouch cell at scale by H1 2025.
Figure 2: GMG Pouch Cell Prototype Development Process
To view an enhanced version of this graphic, please visit:https://images.newsfilecorp.com/files/8082/180189_gmg2.png
Battery Technology Readiness Level
The battery technology readiness level ("BTRL") of the Graphene Aluminium-Ion technology has progressed to Level 4 (see Figure 3). GMG is currently optimizing electrochemical behaviour for pouch cells via ongoing laboratory experimentation.
Figure 3: Battery Technology Readiness Level
Source: “The Battery Component Readiness Level (BC-RL) Framework: A technology-specific development framework”, Matthew Greenwood et al
To view an enhanced version of this graphic, please visit:https://images.newsfilecorp.com/files/8082/180189_gmg3.png
Next Steps Toward Commercialisation & Market Applications
The Company continues to see a broad range of applications for a completed GMG Graphene Aluminium Ion Battery – utilising its ultra-high power-density and nominal energy density characteristics. A range of global companies have confidentially expressed their interest in working with GMG in the following vertical sectors:
– Diesel engine replacement (high load and power requirements)
– Energy storage (in front of, or behind the meter)
– Personal electronics (fast charging and long life)
– Aviation (including vertical take-off and landing)
– Electric vehicles
– Other applications
Next Generation Battery Performance
GMG's next generation Graphene Aluminium Ion Battery performance data (as tested and calculated on coin cells), as compared to the most commonly available lithium-ion batteries, is shown below in Figure 4, with a list of its beneficial characteristics.
Performance results for the pouch cells could be significantly different and will be communicated upon successfully producing a 1000 mAh+ battery pouch cell, and testing has been completed.
Figure 4: Graphene Aluminium Ion Battery Comparative Performance Data (for coin cells)
To view an enhanced version of this graphic, please visit:https://images.newsfilecorp.com/files/8082/180189_787c8634f4c2f806_005full.jpg
GMG's 4 critical business objectives are:
Produce Graphene and improve/scale cell production processes
Build Revenue from Energy Savings Products
Develop Next-Generation Battery
Develop Supply Chain, Partners & Project Execution Capability
About GMG
GMG is a clean-technology company which seeks to offer energy saving and energy storage solutions, enabled by graphene, including that manufactured in-house via a proprietary production process.
GMG has developed a proprietary production process to decompose natural gas (i.e. methane) into its elements, carbon (as graphene), hydrogen and some residual hydrocarbon gases. This process produces high quality, low cost, scalable, 'tuneable' and low/no contaminant graphene suitable for use in clean-technology and other applications. The Company's present focus is to de-risk and develop commercial scale-up capabilities, and secure market applications.
In the energy savings segment, GMG has focused on graphene enhanced heating, ventilation and air conditioning ("HVAC-R") coating (or energy-saving paint), lubricants and fluids. In the energy storage segment, GMG and the University of Queensland are working collaboratively with financial support from the Australian Government to progress R&D and commercialization of graphene aluminium-ion batteries ("G+AI Batteries").
For further information please contact:
-
Craig Nicol, Chief Executive Officer & Managing Director of the Company at craig.nicol@graphenemg.com, +61 415 445 223
-
Leo Karabelas at Focus Communications Investor Relations, leo@fcir.ca, +1 647 689 6041
Neither the TSX Venture Exchange nor its Regulation Services Provider (as that term is defined in the policies of the TSX Venture Exchange) accept responsibility for the adequacy or accuracy of this news release.
Cautionary Note Regarding Forward-Looking Statements
This press release contains "forward-looking information" and "forward-looking statements" within the meaning of applicable securities legislation. The forward-looking statements herein are made as of the date of this press release only, and the Company does not assume any obligation to update or revise them to reflect new information, estimates or opinions, future events or results or otherwise, except as required by applicable law. Often, but not always, forward-looking statements can be identified by the use of words such as "plans", "expects", "is expected", "budgets", "scheduled", "estimates", "forecasts", "predicts", "projects", "intends", "targets", "aims", "anticipates" or "believes" or variations (including negative variations) of such words and phrases or may be identified by statements to the effect that certain actions "may", "could", "should", "would", "might" or "will" be taken, occur or be achieved. Forward-looking information in this press release includes, but is not limited to, statements relating to the testing and validation of the graphene quality produced in the Company's production process, the economical sustainability of scaling the graphene and battery production processes, the ongoing improvement of graphene quality from the GMG graphene production process and the G+AI Battery performance, the engineering and development of the coin cell and pouch cell with respect to the current battery performance estimates and calculations, the timing and considerations of potential FIDs, anticipated timelines for commercial production, anticipated next steps for the further development of the Company's products, the development and viability of GMG's production facilities, and the location of GMG's production facilities. Forward-looking statements and information are subject to various known and unknown risks and uncertainties, including, but not limited to, the deployment of the Company's resources, that the Company will not be able to test or validate the battery grade quality of graphene needed for its products, that it will not be economically sustainable to scale the graphene or battery manufacturing processes, that the quality of the graphene manufactured by GMG and the performance of the G+AI Battery will not set out to be as estimated, calculated or improve, that the Company will not be able to further develop the coin cell and pouch cell technologies, and the timing or results of any FID. Such risk factors may cause the Company's actual results, performance or achievements to be materially different from those expressed or implied thereby, and are developed based on assumptions about such risks, uncertainties and other factors set out herein, including, assumptions regarding the Company's ability to research, develop and test its products within anticipated timelines, and that results of testing and development data will be consistent with anticipated results and estimates, and the market demand for the Company's products. Such forward-looking information represents management's best judgment based on information currently available. No forward-looking statement can be guaranteed and actual future results may vary materially. Accordingly, readers are advised not to place undue reliance on forward-looking statements or information.
To view the source version of this press release, please visit https://www.newsfilecorp.com/release/180189
Brisbane, Queensland, Australia–(Newsfile Corp. – August 28, 2023) – Graphene Manufacturing Group Ltd. (TSXV: GMG) ("GMG" or the "Company") is pleased to outline important commercialisation progress and sales development of THERMAL-XR® powered by GMG Graphene.
THERMAL-XR® powered by GMG Graphene
To view an enhanced version of this graphic, please visit:https://images.newsfilecorp.com/files/8082/178644_57b4434074bb08bd_001full.jpg
THERMAL-XR ® Coating Blending Project | Initial Production & Capabilities
The Company is pleased to announce that it has commissioned its graphene enhanced coating blending plant and it is now operational after making its first 1000 litre blend. This blending plant is expected to have the capacity to produce up to 500,000 litres of THERMAL-XR® RESTORE® coating per annum, subject to graphene production, when operating two blends per eight hour shift, 250 days per year. This capacity enables future service growth well into the future.
GMG Projects & Operations Staff involved in commissioning the first 1000 litre of THERMAL-XR® RESTORE
To view an enhanced version of this graphic, please visit:https://images.newsfilecorp.com/files/8082/178644_graphenefig2.jpg
GMG has also installed laboratory facilities for quality and control requirements and progressing research and development, to extend and enhance the THERMAL-XR® portfolio into additional industries and applications.
GMG's Managing Director and CEO, Craig Nicol, commented: "We are very excited to commission our own blend plant and to have manufactured 1000 litres of THERMAL-XR® RESTORE as part of our distributor's initial orders, which are subject to in-country regulatory approvals. This is an important step to becoming a globally recognised manufacturer and marketer of energy-saving products."
Since the February 2023 Australian Government approval for GMG to produce and sell TXR at scale, the Company has intensified sales activities that have resulted in distribution agreements in North America, Singapore, Thailand, Indonesia, and South Korea to the Heating, Ventilation and Air-Conditioning-Refrigeration (HVAC-R) market. Furthermore, wider potential industries are being assessed including energy savings applications in Data Centres and for Energy Producers e.g. Liquified Natural Gas Plants, where THERMAL-XR® has the potential to increase production capacity and energy efficiency.
Important initial and forward sales orders have been received from HVAC-R distributors and these are being reviewed against their market introduction timelines and their local country approvals. The application to the USA’s Environmental Protection Agency (EPA) for approval of THERMAL-XR® with all the supporting scientific testing is to be submitted shortly with a statutory 30-day review period. Given the number of approved graphene material products, the Company is confident of an approval.
Total forward sales orders received to date will be communicated to the market in a forth coming update.
The Company has received and is assessing requests by various parties to be Distributors around the world – especially in Europe and Asia for the HVAC-R market. The Company is also working with various large companies on the potential use of THERMAL-XR® in vehicle radiators, solar cells and industrial applications. The Company believes the LNG industry remains a highly attractive opportunity for the use of THERMAL-XR® given the large potential economic and environmental benefit it could provide for LNG plants. A testing program with LNG producers is in the process of being developed and implemented.
About THERMAL-XR® powered by GMG Graphene:
THERMAL-XR® COATING SYSTEM is a unique method of improving the conductivity of corroded heat exchange surfaces and improving and maintaining the performance of new units at peak levels. The process coats and protects heat exchange surfaces while improving and rebuilding the lost corroded thermal conductivity and increasing the heat transfer rate by leveraging the physics of GMG Graphene, resulting in an efficiency improvement and a potential power reduction.
THERMAL-XR RESTORE® is powered by GMG Graphene. PATENT PENDING
About GMG www.graphenemg.com
GMG is a clean-technology company which seeks to offer energy saving and energy storage solutions, enabled by graphene, including that manufactured in-house via a proprietary production process.
GMG has developed a proprietary production process to decompose natural gas (i.e. methane) into its elements, carbon (as graphene), hydrogen and some residual hydrocarbon gases. This process produces high quality, low cost, scalable, 'tuneable' and low/no contaminant graphene suitable for use in clean-technology and other applications. The Company's present focus is to de-risk and develop commercial scale-up capabilities, and secure market applications.
In the energy savings segment, GMG has focused on graphene enhanced heating, ventilation and air conditioning ("HVAC-R") coating (or energy-saving paint), lubricants and fluids. In the energy storage segment, GMG and the University of Queensland are working collaboratively with financial support from the Australian Government to progress R&D and commercialization of graphene aluminium-ion batteries ("G+AI Batteries").
For further information please contact:
-
Craig Nicol, Chief Executive Officer & Managing Director of the Company at craig.nicol@graphenemg.com, +61 415 445 223
-
Leo Karabelas at Focus Communications Investor Relations, leo@fcir.ca, +1 647 689 6041
Neither the TSX Venture Exchange nor its Regulation Services Provider (as that term is defined in the policies of the TSX Venture Exchange) accept responsibility for the adequacy or accuracy of this news release.
Cautionary Note Regarding Forward-Looking Statements
This news release includes certain statements and information that may constitute forward-looking information within the meaning of applicable Canadian securities laws. Forward-looking statements relate to future events or future performance and reflect the expectations or beliefs of management of the Company regarding future events. Generally, forward-looking statements and information can be identified by the use of forward-looking terminology such as "intends", "expects" or "anticipates", or variations of such words and phrases or statements that certain actions, events or results "may", "could", "should", "would" or will "potentially" or "likely" occur. This information and these statements, referred to herein as "forward‐looking statements", are not historical facts, are made as of the date of this news release and include without limitation, the expected benefits and capabilities of the blending plant, including its ability to produce up to 500,000 litres of THERMAL-XR® RESTORE® per annum and that it will service growth well into the future, the developments of extensions and enhancements to the THERMAL-XR® portfolio into a wider range of applications, the potential for THERMAL-XR® to enable energy producers to produce additional energy more efficiently, the continuous requests of parties to be Distributors around the world, the large comparative benefit the use of Thermal XR® could provide for LNG plants, and the timing and communication of forward sales orders to the market.
Such forward-looking statements are based on a number of assumptions of management, including, without limitation, assumptions regarding the ability of the blending plant to produce up to 500,000 litres of THERMAL-XR® RESTORE® per annum and service growth well into the future, the development of extensions and enhancements to the THERMAL-XR® portfolio into a wider range of applications, that energy producers will be able to derive the expected benefits from the Company's products, parties continuing to request to be Distributors around the world, the expected benefits that Thermal XR® could provide for LNG plants, and that the Company will communicate its forward sales orders to the market shortly. Additionally, forward-looking information involves a variety of known and unknown risks, uncertainties and other factors which may cause the actual plans, intentions, activities, results, performance or achievements of GMG to be materially different from any future plans, intentions, activities, results, performance or achievements expressed or implied by such forward-looking statements. Such risks include, without limitation: that the blending plant will not have the capacity to produce up to 500,000 litres of THERMAL-XR® RESTORE® per annum or be able to service growth well into the future, that there will be no developments of extensions or enhancements to the THERMAL-XR® portfolio into a wider range of applications, that parties will not continue to request to be Distributors, that Thermal XR® will not provide comparative benefits for LNG plants, that the Company will not communicate its forward sales orders on the expected timeline, if at all, that energy producers will not derive the expected benefits from the Company's products, risks relating to the extent and duration of the conflict in Eastern Europe and its impact on global markets, the volatility of global capital markets, political instability, the failure of the Company to obtain regulatory approvals, attract and retain skilled personnel, unexpected development and production challenges, unanticipated costs and the risk factors set out under the heading "Risk Factors" in the Company's annual information form dated October 18, 2022 available for review on the Company's profile at www.sedarplus.ca.
Although management of the Company has attempted to identify important factors that could cause actual results to differ materially from those contained in forward-looking statements or forward-looking information, there may be other factors that cause results not to be as anticipated, estimated or intended. There can be no assurance that such statements will prove to be accurate, as actual results and future events could differ materially from those anticipated in such statements. Accordingly, readers should not place undue reliance on forward-looking statements and forward-looking information. Readers are cautioned that reliance on such information may not be appropriate for other purposes. The Company does not undertake to update any forward-looking statement, forward-looking information or financial out-look that are incorporated by reference herein, except in accordance with applicable securities laws. We seek safe harbor.
To view the source version of this press release, please visit https://www.newsfilecorp.com/release/178644
If you would like to receive our free newsletter via email, simply enter your email address below & click subscribe.
 Follow us on Twitter
 Become our facebook fan
CONNECT WITH US
Tweets
Tweet with hash tag #miningfeeds or @miningfeeds and your tweets will be displayed across this site.
MOST ACTIVE MINING STOCKS
Daily Gainers
 CMC Metals Ltd. CMC Metals Ltd. |
CMB.V | +900.00% |
 Eden Energy Ltd Eden Energy Ltd |
EDE.AX | +200.00% |
| GoviEx Uranium Inc. |
GXU.V | +42.86% |
| Eagle Nickel Ltd. |
ENL.AX | +41.67% |
| Citigold Corp. Limited |
CTO.AX | +33.33% |
| Mount Burgess Mining NL |
MTB.AX | +33.33% |
| Exalt Resources Limited |
ERD.AX | +31.94% |
| Casa Minerals Inc. |
CASA.V | +30.00% |
| Cariboo Rose Resources Ltd |
CRB.V | +28.57% |
| Belmont Resources Inc. |
BEA.V | +28.57% |


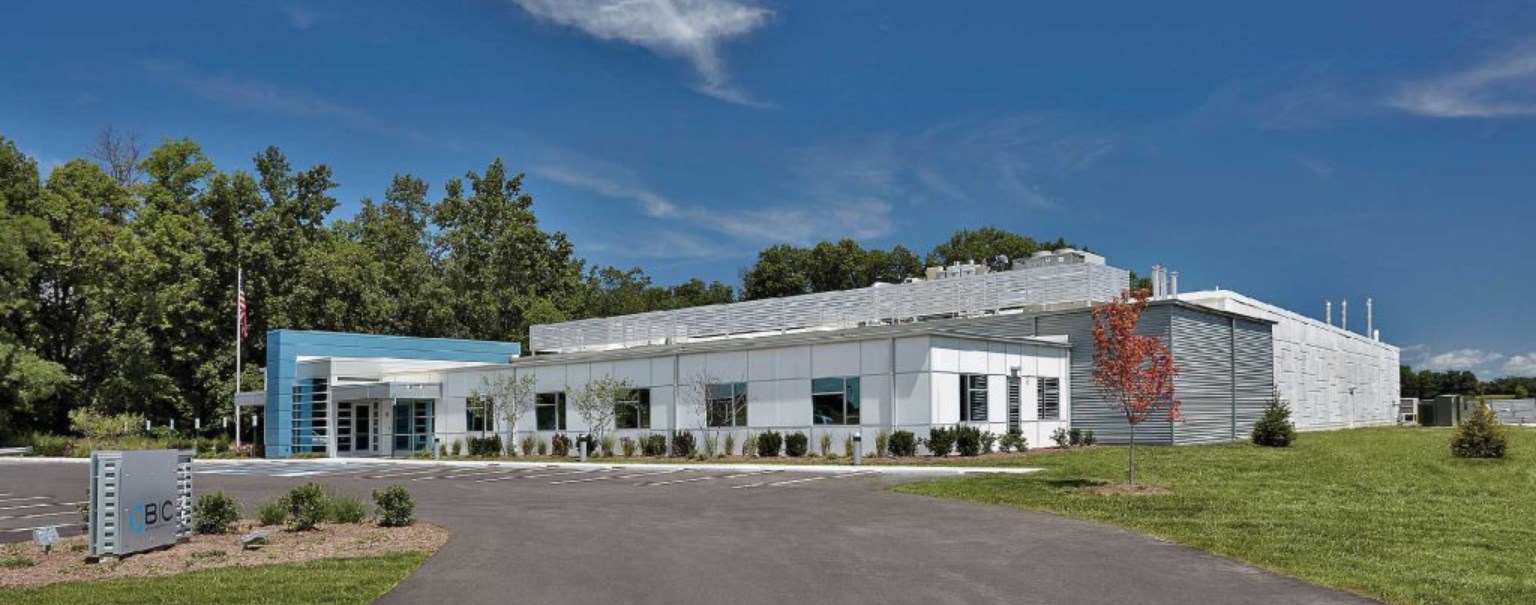