It is not uncommon to see companies perform well in the years after insiders buy shares. On the other hand, we'd be remiss not to mention that insider sales have been known to precede tough periods for a business. So before you buy or sell Oklo Resources Limited (ASX:OKU), you may well want to know whether insiders have been buying or selling.
What Is Insider Buying?
It's quite normal to see company insiders, such as board members, trading in company stock, from time to time. However, such insiders must disclose their trading activities, and not trade on inside information.
Insider transactions are not the most important thing when it comes to long-term investing. But it is perfectly logical to keep tabs on what insiders are doing. As Peter Lynch said, 'insiders might sell their shares for any number of reasons, but they buy them for only one: they think the price will rise'.
View our latest analysis for Oklo Resources
The Last 12 Months Of Insider Transactions At Oklo Resources
The MD, CEO & Director Simon Taylor made the biggest insider purchase in the last 12 months. That single transaction was for AU$103k worth of shares at a price of AU$0.26 each. So it's clear an insider wanted to buy, even at a higher price than the current share price (being AU$0.17). Their view may have changed since then, but at least it shows they felt optimistic at the time. To us, it's very important to consider the price insiders pay for shares. It is encouraging to see an insider paid above the current price for shares, as it suggests they saw value, even at higher levels. Simon Taylor was the only individual insider to buy during the last year.
Simon Taylor bought a total of 800.00k shares over the year at an average price of AU$0.23. The chart below shows insider transactions (by companies and individuals) over the last year. If you want to know exactly who sold, for how much, and when, simply click on the graph below!

There are always plenty of stocks that insiders are buying. So if that suits your style you could check each stock one by one or you could take a look at this free list of companies. (Hint: insiders have been buying them).
Does Oklo Resources Boast High Insider Ownership?
Many investors like to check how much of a company is owned by insiders. Usually, the higher the insider ownership, the more likely it is that insiders will be incentivised to build the company for the long term. From our data, it seems that Oklo Resources insiders own 10% of the company, worth about AU$8.9m. However, it's possible that insiders might have an indirect interest through a more complex structure. Overall, this level of ownership isn't that impressive, but it's certainly better than nothing!
So What Does This Data Suggest About Oklo Resources Insiders?
It is good to see the recent insider purchase. And the longer term insider transactions also give us confidence. However, we note that the company didn't make a profit over the last twelve months, which makes us cautious. While the overall levels of insider ownership are below what we'd like to see, the history of transactions imply that Oklo Resources insiders are reasonably well aligned, and optimistic for the future. In addition to knowing about insider transactions going on, it's beneficial to identify the risks facing Oklo Resources. Every company has risks, and we've spotted 5 warning signs for Oklo Resources (of which 2 are a bit unpleasant!) you should know about.
If you would prefer to check out another company — one with potentially superior financials — then do not miss this free list of interesting companies, that have HIGH return on equity and low debt.
For the purposes of this article, insiders are those individuals who report their transactions to the relevant regulatory body. We currently account for open market transactions and private dispositions, but not derivative transactions.
This article by Simply Wall St is general in nature. It does not constitute a recommendation to buy or sell any stock, and does not take account of your objectives, or your financial situation. We aim to bring you long-term focused analysis driven by fundamental data. Note that our analysis may not factor in the latest price-sensitive company announcements or qualitative material. Simply Wall St has no position in any stocks mentioned.
Have feedback on this article? Concerned about the content? Get in touch with us directly. Alternatively, email editorial-team (at) simplywallst.com.
Natural Resource Partners L.P. (NYSE: NRP) announced today that the 2020 tax packages for unitholders, including the individual K-1 tax information, are available on its website www.taxpackagesupport.com/naturalresource. The K-1 tax information will also be mailed commencing today, Monday, March 15, 2021. For additional K-1 tax information and unitholder support, unitholders may call toll free (888) 334-7102.
Company Profile
Natural Resource Partners L.P., a master limited partnership headquartered in Houston, TX, is a natural resource company that owns, manages and leases a diversified portfolio of mineral properties in the United States, including interests in coal, industrial minerals and other natural resources, and owns an equity investment in Ciner Wyoming, a trona/soda ash operation.
Further information regarding Natural Resource Partners may be found on the website at www.nrplp.com.
View source version on businesswire.com: https://www.businesswire.com/news/home/20210315005797/en/
Contacts
Tiffany Sammis
713-751-7515
tsammis@nrplp.com
Even when a business is losing money, it's possible for shareholders to make money if they buy a good business at the right price. For example, biotech and mining exploration companies often lose money for years before finding success with a new treatment or mineral discovery. But while history lauds those rare successes, those that fail are often forgotten; who remembers Pets.com?
Given this risk, we thought we'd take a look at whether Energy Metals (ASX:EME) shareholders should be worried about its cash burn. In this article, we define cash burn as its annual (negative) free cash flow, which is the amount of money a company spends each year to fund its growth. Let's start with an examination of the business' cash, relative to its cash burn.
View our latest analysis for Energy Metals
How Long Is Energy Metals' Cash Runway?
You can calculate a company's cash runway by dividing the amount of cash it has by the rate at which it is spending that cash. In December 2020, Energy Metals had AU$16m in cash, and was debt-free. Looking at the last year, the company burnt through AU$908k. So it had a very long cash runway of many years from December 2020. Even though this is but one measure of the company's cash burn, the thought of such a long cash runway warms our bellies in a comforting way. The image below shows how its cash balance has been changing over the last few years.

How Is Energy Metals' Cash Burn Changing Over Time?
While Energy Metals did record statutory revenue of AU$7.3k over the last year, it didn't have any revenue from operations. That means we consider it a pre-revenue business, and we will focus our growth analysis on cash burn, for now. With the cash burn rate up 9.7% in the last year, it seems that the company is ratcheting up investment in the business over time. However, the company's true cash runway will therefore be shorter than suggested above, if spending continues to increase. Energy Metals makes us a little nervous due to its lack of substantial operating revenue. So we'd generally prefer stocks from this list of stocks that have analysts forecasting growth.
How Hard Would It Be For Energy Metals To Raise More Cash For Growth?
Since its cash burn is increasing (albeit only slightly), Energy Metals shareholders should still be mindful of the possibility it will require more cash in the future. Companies can raise capital through either debt or equity. One of the main advantages held by publicly listed companies is that they can sell shares to investors to raise cash and fund growth. We can compare a company's cash burn to its market capitalisation to get a sense for how many new shares a company would have to issue to fund one year's operations.
Energy Metals' cash burn of AU$908k is about 3.3% of its AU$27m market capitalisation. That's a low proportion, so we figure the company would be able to raise more cash to fund growth, with a little dilution, or even to simply borrow some money.
So, Should We Worry About Energy Metals' Cash Burn?
It may already be apparent to you that we're relatively comfortable with the way Energy Metals is burning through its cash. In particular, we think its cash runway stands out as evidence that the company is well on top of its spending. While its increasing cash burn wasn't great, the other factors mentioned in this article more than make up for weakness on that measure. After taking into account the various metrics mentioned in this report, we're pretty comfortable with how the company is spending its cash, as it seems on track to meet its needs over the medium term. On another note, we conducted an in-depth investigation of the company, and identified 3 warning signs for Energy Metals (1 makes us a bit uncomfortable!) that you should be aware of before investing here.
Of course Energy Metals may not be the best stock to buy. So you may wish to see this free collection of companies boasting high return on equity, or this list of stocks that insiders are buying.
This article by Simply Wall St is general in nature. It does not constitute a recommendation to buy or sell any stock, and does not take account of your objectives, or your financial situation. We aim to bring you long-term focused analysis driven by fundamental data. Note that our analysis may not factor in the latest price-sensitive company announcements or qualitative material. Simply Wall St has no position in any stocks mentioned.
Have feedback on this article? Concerned about the content? Get in touch with us directly. Alternatively, email editorial-team (at) simplywallst.com.
GATINEAU, QC, March 15, 2021 /CNW/ – Today, the Competition Bureau warned businesses to watch out for four pervasive scams. Fraudsters see the current global health crisis as an opportunity to target businesses with creative and convincing frauds.
The annual Fraud Prevention Month campaign, which launched on March 1st, 2021, raises awareness about scams and deceptive practices.
Members of the media are invited to contact the Competition Bureau to speak with the Commissioner of Competition, Matthew Boswell, and other Bureau spokespersons about scams targeting businesses and the 2021 Fraud Prevention Month campaign.
|
Date: |
March 15-19, 2021 |
|
Time: |
By appointment via ic.media-cb-bc.ic@canada.ca |
Associated Links
The Competition Bureau, as an independent law enforcement agency, ensures that Canadian businesses and consumers prosper in a competitive and innovative marketplace.
SOURCE Competition Bureau


View original content: http://www.newswire.ca/en/releases/archive/March2021/15/c4786.html
KELOWNA, BC, March 15, 2021 /CNW/ – Metalex Ventures Ltd. (TSXV: MTX) (the "Company") is pleased to announce that it has identified ilmenite to be the source of the highly anomalous scandium on its 100% owned claims 100km southeast of Chibougmau, Quebec, which are close to highway 167.
Metalex collected 8,698 heavy mineral samples covering an area of over 250,000km2. As was recently announced (December 3, 2020) the heavy, non-magnetic concentrate with the highest scandium as measured in both micrograms and ppm was detected on a wholly owned Metalex claim block along with strongly anomalous gold.
A split of the weakly magnetic concentrates from the same sample was subsequently analyzed by neutron activation analysis at Actlabs in Ancaster, Ontario and was found to contain seven to eight times higher amounts of scandium than the original non-magnetic concentrates.
The balance of the weakly magnetic concentrate was separated at CF Mineral Research Ltd. ("CFM") into a conductive concentrate. A total of 784 ilmenite grains were selected from the conductive concentrate using a binocular microscope. 91 of these selected grains were then analyzed using a Cameca SXFive Field Emission microprobe and were found to contain between 2.7 and 372ppm scandium with an average of 26.3ppm. The complete microprobe analyses of ilmenites with the six highest scandium results are presented in Table 1.
Table 1. Scandium-rich ilmenite compositions.
|
Grain |
SiO2 |
TiO2 |
Al2O3 |
Cr2O3 |
Fe2O3 |
FeO |
MgO |
CaO |
MnO |
NiO |
ZnO |
Nb2O5 |
Sc |
Total |
|
% |
% |
% |
% |
% |
% |
% |
% |
% |
% |
% |
% |
ppm |
% |
|
|
409 |
0.03 |
46.63 |
0.02 |
0.02 |
11.66 |
35.51 |
0.42 |
0.00 |
5.63 |
0.01 |
0.00 |
0.00 |
372 |
99.92 |
|
506 |
0.02 |
47.98 |
0.01 |
0.00 |
7.76 |
37.82 |
0.10 |
0.00 |
5.20 |
0.00 |
0.05 |
0.14 |
271 |
99.08 |
|
304 |
0.03 |
48.13 |
0.01 |
0.01 |
7.75 |
34.25 |
0.41 |
0.00 |
7.95 |
0.02 |
0.49 |
0.16 |
176 |
99.20 |
|
314 |
0.03 |
47.67 |
0.00 |
0.01 |
9.16 |
37.54 |
0.35 |
0.01 |
4.68 |
0.00 |
0.03 |
0.02 |
98 |
99.50 |
|
101 |
0.02 |
43.37 |
0.02 |
0.00 |
17.63 |
37.22 |
0.09 |
0.00 |
1.64 |
0.00 |
0.07 |
0.08 |
51 |
100.14 |
|
806 |
0.05 |
47.35 |
0.01 |
0.00 |
8.57 |
39.26 |
0.18 |
0.00 |
3.00 |
0.01 |
0.05 |
0.03 |
50 |
98.52 |
Adding scandium to aluminum produces alloys that are far stronger and 30 to 40% lighter than steel. Consequently, scandium-aluminum alloys are very valuable and in demand in the aerospace, automotive, military and 3D printing industries.
Most of the world's scandium is produced in China. However, Rio Tinto has announced that they are building the first scandium-oxide plant in North America with an initial capacity to supply approximately 20% of the global market. The plant will be situated near Montreal, Quebec at the Rio Tinto Fer et Titane metallurgical complex. The plant will be recovering scandium oxide from ilmenite tailings after high quality titanium dioxide feed stock, pig iron, steel and metal powders are extracted. The ilmenite ore is sourced from Rio Tinto's mine at Lac Tio, near Allard Lake, Quebec where it is railed 42km to a port and then shipped almost 900km along the Gulf of St. Lawrence to the plant.
According to Alexandsandrovsky et al., Ores and Metals Publishers, Moscow, 2004, about 2 million tons per year of ilmenite containing 10 to 20ppm scandium yields about 20 to 40 tons of scandium oxide. The Metalex directors are most encouraged that scandium-rich ilmenites have been found in samples within our claims. These ilmenites, on average, contain greater than the 10-20ppm scandium in ilmenite that are commonly used to recover scandium oxide. The 91 ilmenites analyzed from the conductive concentrate had an average of 26.3ppm scandium with values of up to 372ppm scandium.
The same conductive concentrates have been produced at CFM from 23 additional heavy mineral samples collected from the claims and have been sent to Actlabs to be analyzed for gold, scandium and 32 other elements. These results will be reported when received.
Metalex has contracted Geotech Ltd. to fly a combined airborne magnetic and electromagnetic survey over the claims with the intent to identify drill targets for massive ilmenite horizons similar to the Lac Tio deposits being mined by Rio Tinto.
The technical information and results reported here have been reviewed by Mr. Chad Ulansky P.Geol., a Qualified Person under National Instrument 43-101, who is responsible for the technical content of this release.
Signed,
Charles Fipke
Charles Fipke
Chairman
Forward Looking Statements
Some of the statements contained herein may be forward-looking statements which involve known and unknown risks and uncertainties. Without limitation, statements regarding potential mineralization and resources, exploration and financing results, and future plans and objectives of the Company are forward looking statements that involve various risks. The following are important factors that could cause the Company's actual results to differ materially from those expressed or implied by such forward looking statements: changes in the world wide price of mineral commodities, general market conditions, risks inherent in mineral exploration, risks associated with development, construction and mining operations, the uncertainty of future profitability and the uncertainty of access to additional capital. There can be no assurance that forward-looking statements will prove to be accurate as actual results and future events may differ materially from those anticipated in such statements. Metalex undertakes no obligation to update such forward-looking statements if circumstances or management's estimates or opinions should change. The reader is cautioned not to place undue reliance on such forward-looking statements.
Neither TSX Venture Exchange nor its Regulation Services Provider (as that term is defined in the policies of the TSX Venture Exchange) accepts responsibility for the adequacy or accuracy of this release.
SOURCE Metalex Ventures Ltd.


View original content: http://www.newswire.ca/en/releases/archive/March2021/15/c2419.html
VANCOUVER, British Columbia, March 15, 2021 (GLOBE NEWSWIRE) — HUDSON RESOURCES INC. (“Hudson” or the “Company”) (TSX Venture Exchange “HUD”; OTC “HUDRF”) is pleased to announce that metallurgical testwork has commenced on samples from the Nukittooq niobium – tantalum project (“Nukittooq project”) in Greenland. The testwork is being undertaken at SGS Lakefield, Canada, on high-grade niobium tantalum grab samples collected in 2020, under the supervision of Hudson’s consulting Metallurgist, John Goode.
The Nukittooq project occurs within the 100% owned exploration license that covers the Sarfartoq Carbonatite Complex in southeast Greenland. This exploration license also hosts the Company’s ST1 rare earth element (REE) project where Hudson has completed a NI 43-101 Technical Report which outlined a resource of 24 million kg of neodymium oxide and 8 million kg of praseodymium oxide, the two key components in permanent magnets which are driving the green economy. Neodymium oxide is currently trading at over US$100/kg. The carbonatite complex remains largely unexplored.
Hudson assayed 35 grab samples from the Nukittooq project (announced December 14, 2020) with an average grade of 19.35% Nb2O5, 0.27% Ta2O5, 0.38% U3O8 over 112 meters, including 12 grab samples over a 30-meter section with an average grade of 32.35% Nb2O5. Hudson has to date identified several high-grade niobium occurrences within a one-kilometer square zone. This zone will be further evaluated during the Company’s 2021 field program with the objective of outlining drilling targets.
Mineralogical work, which included ore microscopy and QEMSCAN, was recently completed by SGS on grab samples from the Nukittooq project. This work provided very encouraging results with respect to liberation characteristics of the niobium – tantalum minerals and the potential for coarser grinding versus fine grinding for optimum mineral separation which may benefit project economics.
Metallurgical testwork currently underway at SGS includes:
-
Stage-grinding and de-sliming
-
Low-intensity magnetic separation (to reject iron minerals)
-
Gravity separation
-
Magnetic separation
-
Batch flotation testing
Previous license holders of the Nukittooq project completed a significant amount of metallurgical testwork which resulted in a feasibility study completed at Curtin University, Australia. Hudson will be building on this extensive work utilizing the most recent technologies with the objective of producing a high-grade niobium – tantalum concentrate in Greenland for export.
Jim Cambon, President commented: “I am pleased to have commenced the metallurgical program on this high-grade niobium – tantalum target at our 100% owned Nukittooq project. The results of this work will allow us to start to define how we can make a cost-effective niobium – tantalum concentrate in Greenland. The mineralogical work and further geological work will help us understand the origins of the high-grade niobium – tantalum mineralization which will be important in targeting a significant resource at Nukittooq.”
Niobium and tantalum are vital to a wide range of products in the energy, infrastructure, transportation, medical and defense sectors. The United States and European Union have designated niobium and tantalum as critical to their security and wellbeing. The niobium price has averaged US$42/kg over the past five years with expected demand growth of 8%/annum. Tantalum currently trades at US$150/kg.
The Company is also advancing its 100% owned Sarfartoq REE project and is currently selecting a laboratory to undertake additional metallurgical flow sheet testwork. The testwork objectives are to further improve rare earth concentrate grades and recoveries and will take advantage of recent advances in metallurgy and hydrometallurgy as well as new developments in reagents and technology. Previous metallurgical testwork utilizing acid baking and leach tests confirmed 94% recovery of rare earths and the ability to make a 45% REO carbonate product.
Hudson also holds a 31.1% interest in Hudson Greenland A/S which owns the White Mountain Anorthosite mine in Greenland, where the Company provides operational, marketing and sales support.
The White Mountain mine has recommenced operations with the commissioning of the rotary drum dryer completed. This allows for year-round operations and is expected to improve production parameters. The mine is currently operating on a 12-hour shift with a crew of 15 people. Covid-19 restrictions are still in place with only minor impacts on the operations to date.
J.R. Goode, P. Eng., is a Qualified Person, as defined by National Instrument 43-101, and reviewed the preparation of the metallurgical and technical information in this press release.
ON BEHALF OF THE BOARD OF DIRECTORS
“Jim Cambon”
President and Director
For further information:
Ph: 604-628-5002
Forward-Looking Statements
CAUTIONARY STATEMENT REGARDING FORWARD-LOOKING INFORMATION: This News Release includes certain "forward-looking statements" which are not comprised of historical facts. Forward looking statements include estimates and statements that describe the Company’s future plans, objectives or goals, including words to the effect that the Company or management expects a stated condition or result to occur. Forward-looking statements may be identified by such terms as “believes”, “anticipates”, “expects”, “estimates”, “may”, “could”, “would”, “will”, or “plan”. Since forward-looking statements are based on assumptions and address future events and conditions, by their very nature they involve inherent risks and uncertainties. Although these statements are based on information currently available to the Company, the Company provides no assurance that actual results will meet management’s expectations. Risks, uncertainties and other factors involved with forward-looking information could cause actual events, results, performance, prospects and opportunities to differ materially from those expressed or implied by such forward-looking information. Forward looking information in this news release includes, but is not limited to, the Company’s objectives, goals or future plans, statements, exploration results, potential mineralization, the estimation of mineral resources, exploration and mine development plans, timing of the commencement of operations and estimates of market conditions. Factors that could cause actual results to differ materially from such forward-looking information include, but are not limited to failure to identify mineral resources, failure to convert estimated mineral resources to reserves, the inability to complete a feasibility study which recommends a production decision, the preliminary nature of metallurgical test results, delays in obtaining or failures to obtain required governmental, environmental or other project approvals, political risks, inability to fulfill the duty to accommodate indigenous peoples, uncertainties relating to the availability and costs of financing needed in the future, changes in equity markets, inflation, changes in exchange rates, fluctuations in commodity prices, delays in the development of projects, capital and operating costs varying significantly from estimates and the other risks involved in the mineral exploration and development industry, an inability to complete the Offering on the terms or on the timeline as announced or at all, an inability to predict and counteract the effects of COVID-19 on the business of the Company, including but not limited to the effects of COVID-19 on the price of commodities, capital market conditions, restriction on labour and international travel and supply chains, and those risks set out in the Company’s public documents filed on SEDAR. Although the Company believes that the assumptions and factors used in preparing the forward-looking information in this news release are reasonable, undue reliance should not be placed on such information, which only applies as of the date of this news release, and no assurance can be given that such events will occur in the disclosed time frames or at all. The Company disclaims any intention or obligation to update or revise any forward-looking information, whether as a result of new information, future events or otherwise, other than as required by law.
Neither the TSX Venture Exchange nor its Regulation Services Provider (as that term is defined in the policies of the TSX Venture Exchange) accepts responsibility for the adequacy or accuracy of this release.
THIS NEWS RLEASE IS NOT FOR DISTRIBUTION IN THE UNITED STATES OR TO U.S. NEWS AGENCIES
VANCOUVER, British Columbia, March 15, 2021 (GLOBE NEWSWIRE) — Planet Ventures Inc. (TSX-V: PXI; FSE: P6U) (“Planet” or the “Company”) is pleased to announce that it is reviewing and planning a spin-out transaction (the “Spin-Out Transaction”) whereby the shares of its wholly owned subsidiary 1261489 B.C. Ltd., to be renamed 1st Eleven Esports Limited (“1st Eleven”), will be distributed pro-rata to the shareholders of Planet, by way of a dividend-in-kind. The Spin-Out Transaction is expected to complete during the second quarter of 2021 and will be subject to approval of the listing of the 1st Eleven common shares on the Canadian Securities Exchange.
The Spin-Out Transaction will create 1st Eleven as an independent public company. 1st Eleven will initially be focused on Esports and eGaming.
About 1st11
1st11’s focus is to maximise on the exciting opportunities and capitalise on the increasing demand for live content in Esports, by offering live events with a unique athlete experience and gamer programming.
1st11’s unique business model combines the passion for football (soccer) and Esports with innovative gamer technology and provides exclusive access to international athletes and football stars. 1st11 will be the first sports media company to produce and manage Esports teams made up entirely of professional athletes and football players, who will play against, participate and engage with football fans and gamers as part of a unique and exciting gaming experience.
1st11’s proprietary online platform will ultimately provide subscribers with a gamer hub, dedicated to gamers and sports fans who want a new, live, and competitive Esports experience. 1st11 will provide professional events, news, gamer programs, and live media partner information. 1st11’s game platform offers players multiple game options, via syndicated and collective peer-to-peer group play.
Brazil alone boasts a significant and substantial gamer base, having in excess of 75.7 million gamers, the third largest Esports fan base in the world and 7.6 million Brazilians watching professional content more than once per month (source: Newzoo). It is estimated that the Esports market could reach $1.8 billion to as high as $3.2 billion in revenue by 2022 (source: Newzoo).
“This is a monumental step towards giving Planet shareholders the value they deserve,” says Zula Kropivnitski, CFO of Planet Ventures Inc. “With both the Esports and eGaming industries raising billions of dollars over the last year, we felt that the best way to unlock the true value of 1st11 is to have it as a stand-alone company. Since our acquisition of 1st11, Peter Glancy, Flavio Maria and their team have consistently exceeded our expectations and have paved the way for 1st11 to become one of the top eGaming platforms in the world. Through several accretive acquisitions and investments, 1st11 is quickly becoming a well-known Esports platform and brand in the UK and South America and we are extremely excited to continue to support their efforts as we work to unlock its true value.”
The Spin-Out Transaction distribution of 1st Eleven shares to Planet shareholders will be qualified by a prospectus to be filed by 1st Eleven with Canadian securities regulators.
The number of shares of 1st Eleven to be distributed to the shareholders of Planet in the Spin-Out Transaction will be dependent upon the ratio of: (i) the aggregate number of shares of 1st Eleven that Planet ultimately determines to spin-out to shareholders, divided by (ii) the aggregate number of issued and outstanding common shares of Planet. The aggregate number of shares of 1st Eleven to be spun-out by Planet will be determined in part by reference to the initial listing requirements, including the requirement that 1st Eleven have adequate public distribution upon completion of the Spin-out Transaction. The Company will provide further details with respect to the Spin-Out Transaction in a subsequent news release.
Private Placement
The company also announces that it will offer up to four million units by way of non-brokered private placement at a price of 22.5 cents per unit for gross proceeds of up to $900,000. Each unit will consist of one common share of the company and one share purchase warrant exercisable at a price of 30 cents for a period of 36 months.
In connection with the placement, the company may pay finders' fees to eligible parties who have introduced subscribers. All securities issued in connection with the private placement will be subject to a four-month-and-one-day statutory hold period in accordance with applicable securities laws.
Completion of the placement remains subject applicable regulatory approvals.
About Planet
Planet Ventures Inc. is an investment issuer listed on the TSX Venture Exchange, that is focused on investing in disruptive companies and industries that have high growth potential. Planet’s unique portfolio driven investment policies provide investors with access to emerging and high-growth opportunities while shielding them from any formidable downside.
For more information, please visit: https://planetventuresinc.com/
ON BEHALF OF THE BOARD
“Zula Kropivnitski”
Zula Kropivnitski
Chief Financial Officer and Director
INVESTOR RELATIONS CONTACT
PLANET VENTURES INC.
Tel: (604) 681-0084
Fax: (604) 681-0094
Email: info@planetventuresinc.com
CAUTIONARY STATEMENT ON FORWARD-LOOKING INFORMATION
This news release includes certain statements that may be deemed "forward-looking statements". All statements in this news release, other than statements of historical facts, that address events or developments that the Company expects to occur, are forward-looking statements. Forward-looking statements are statements that are not historical facts and are generally, but not always, identified by the words "expects", "plans", "anticipates", "believes", "intends", "estimates", "projects", "potential" and similar expressions, or that events or conditions "will", "would", "may", "could" or "should" occur. These statements include, but are not limited to, the expectation that Spin-Out Transaction may be effected. Although the Company believes the expectations expressed in such forward-looking statements are based on reasonable assumptions, such statements are not guarantees of future performance and actual results may differ materially from those in the forward-looking statements. Factors that could cause the actual results to differ materially from those in forward-looking statements include market prices, continued availability of capital and financing, and general economic, market or business conditions. Investors are cautioned that any such statements are not guarantees of future performance and actual results or developments may differ materially from those projected in the forward-looking statements. Forward-looking statements are based on the beliefs, estimates and opinions of the Company's management on the date the statements are made. Except as required by applicable securities laws, the Company undertakes no obligation to update these forward-looking statements in the event that management's beliefs, estimates, opinions, or other factors, should change.
Neither TSX Venture Exchange nor its Regulations Services Provider (as that term is defined in the policies of the TSX Venture Exchange) accepts responsibility for the adequacy or accuracy of this news release.
Vancouver, British Columbia–(Newsfile Corp. – March 12, 2021) – Comstock Metals Ltd. (TSXV: CSL) ("Comstock" or the "Company") is pleased to announce that it is undertaking a non-brokered private placement for an aggregate of up to $1,500,000 comprising up to 5,750,000 units ("Units") and up to 11,500,000 flow-through units ("FT Units").
Each Unit will be priced at $0.09 and will consist of one common share in the capital of the Company (a "Share") and one common share purchase warrant (a "Warrant"). Each Warrant will entitle the holder thereof to purchase one additional common share of the Company (a " Share") at an exercise price of $0.15 per Share for a period of 24 months from the Closing Date. Each FT Unit will be priced at $0.11 and consist of one flow-through common share in the capital of the Company (a "FT Share") and one common share purchase warrant (a "FT Warrant"). Each FT Warrant will entitle the holder thereof to purchase one additional non flow-through common share of the Company (a " Share") at an exercise price of $0.15 per Share for a period of 24 months from the Closing Date. It is anticipated that the closing of the offerings will occur later this month.
Comstock intends to use the majority proceeds of the private placement to complete additional diamond drilling up to a planned 2,500 meters at the high-grade Preview North gold zone.
At Preview North multiple shallow zones of quartz-carbonate vein gold mineralization, including multiple drill intercepts containing visible gold, have been defined by diamond drilling along a strike length of 200 m, 60 m width, and vertical depth of 170 m (Map 1). Significant potential remains to expand the Preview North zone with additional drilling. Selected drill intercepts from the Preview North zone include[1]:
-
4.20 m averaging 9.66 g/t gold in PR17-175 starting at 20.50 m down hole and 3.25 m averaging 87.16 g/t gold starting at 41.15 m down hole[2]
-
16.70 m averaging 5.08 g/t gold in PR17-176 starting at 23.3 m down hole and including 4.20 m averaging 17.40 g/t gold starting at 28.00 m down hole; and 5.00 m averaging 16.19 g/t gold starting at 51.00 m down hole
-
5.20 m averaging 5.30 g/t gold in PR18-183 starting at 113.80 m down hole and including 3.30 m averaging 8.04 g/t gold starting at 115.70 m down hole[3]
-
21.50 m averaging 2.87 g/t gold in PR18-185 starting at 23.00 m down hole and including 3.25 m averaging 10.35 g/t gold starting at 36.75 m down hole
-
8.00 m averaging 7.47 g/t gold in PR18-187 starting at 31.00 m down hole and 23.6 m averaging 3.60 g/t gold in PR18-187 starting at 50.40 m down hole and including 2.10 m averaging 13.85 g/t gold starting at 64.40 m down hole

To view an enhanced version of this graphic, please visit:
https://orders.newsfilecorp.com/files/7078/76990_7deaa56c34bceb78_001full.jpg
Private Placement Details
The Company will use the gross proceeds of the offering of FT Units for eligible exploration expenditures, which will constitute "Canadian Exploration Expenses" ("CEE") that are "Flow-Through mining expenditures", as defined in the Income Tax Act (Canada) which can be renounced to purchasers of the FT Units for the 2021 taxation year in the aggregate amount of not less than the total amount of the gross proceeds raised from the flow-through offering. The CEE shall be incurred no later than December 31, 2022.
The proceeds from the offering of Units will be used to fund exploration on the Company's Preview SW gold deposit (with a focus on Comstock's Preview North zone) located in Saskatchewan, Canada and for general working capital.
The offerings are being offered on a non-brokered private placement basis in the Provinces of Alberta, British Columbia, Ontario and such other jurisdictions as the Company may determine in its sole discretion and will be subject to a statutory hold period of four (4) months and a day from the Closing Date of the offerings. The Company may pay finder's fees in accordance with the rules and policies of the TSX Venture Exchange. The offerings remains subject to the approval of the TSX Venture Exchange. The securities to be issued under the offerings have not been, and will not be, registered under the U.S. Securities Act or any U.S. state securities laws, and may not be offered or sold in the United States or to, or for the account or benefit of, U.S. persons absent registration or any applicable exemption from the registration requirements of the U.S. Securities Act and applicable U.S. state securities laws.
Pursuant to the proposed offering, insiders within the Company (including the Company's CEO Steven Goldman as well as the Company's Chairman Arnold Tenney, or parties related to the CEO and Chairman) will be participating. As such, the Company will be issuing securities to purchasers that are considered "related parties" (within the meaning of Multilateral Instrument 61-101 – Protection of Minority Security Holders in Special Transactions ("MI 61-101")), making the applicable offering a "related party transaction" (within the meaning of MI 61-101) (the "Related Party Subscriptions"). If such sales are completed the Company will be exempt from obtaining a formal valuation for, and minority approval of, the Related Party Subscriptions pursuant to Section 5.5(b) and 5.7(1)(a) of MI 61-101, respectively.
This press release shall not constitute an offer to sell or the solicitation of an offer to buy nor shall there be any sale of the securities in any state in which such offer, solicitation or sale would be unlawful. The securities being offered have not been, nor will they be, registered under the United States Securities Act of 1933, as amended (the "1933 Act") and may not be offered or sold to, or for the account or benefit of, persons in the United States or "U.S. persons" (as such term is defined in Regulation S under the 1933 Act) absent registration or an applicable exemption from the registration requirements of the 1933 Act any application state securities laws.
About Comstock Metals Ltd.
Comstock Metals advancing the Preview SW Gold Project, a resource-stage gold project in the La Ronge district of Saskatchewan. The Preview SW deposit hosts indicated mineral resources containing 158,300 ounces of gold (2.61 million tonnes grading 1.89 g/t Au) and inferred mineral resources containing 270,800 ounces of gold (5.70 million tonnes grading 1.48 g/t Au), both based on a 0.50 g/t Au cut-off grade[4]. During 2017 and 2018, Comstock completed diamond drilling campaigns targeting the Preview North zone and the Preview SW deposit comprising 24 holes totaling 4,700 metres. Several additional, relatively untested targets remain on the Property, including the A, B, C, and Clearwater zones (Map 2).

Map 2. Preview SW Property Map Showing Drilled Gold Zones
To view an enhanced version of this graphic, please visit:
https://orders.newsfilecorp.com/files/7078/76990_7deaa56c34bceb78_002full.jpg
For further details, see the Company's website at www.comstock-metals.com
Qualified Persons
Kristopher Raffle P.Geo., Principal and Consultant of APEX Geoscience Ltd., and Christopher Livingstone, P.Geo., Project Geologist of APEX Geoscience Ltd., Qualified Persons as defined by National Instrument 43-101, supervised the exploration work and diamond drilling program at the Preview SW project and reviewed, verified (including sampling, analytical and test data) and compiled the data reported herein. Mr. Raffle has reviewed and approved the scientific and technical disclosure in this news release as it relates to the Preview SW Gold Project.
Forward Looking Statements
This news release includes forward-looking information and statements, which may include, but are not limited to, information and statements regarding or inferring the future business, operations, financial performance, prospects, and other plans, intentions, expectations, estimates, and beliefs of the Company. Such statements include statements regarding the anticipated closing of the proposed financing and the use of proceeds resulting therefrom. Forward-looking information and statements involve and are subject to assumptions and known and unknown risks, uncertainties, and other factors which may cause actual events, results, performance, or achievements of the Company to be materially different from future events, results, performance, and achievements expressed or implied by forward-looking information and statements herein. The assumptions on which the forward looking statements contained herein rely include the ability to complete the proposed financing and receipt of regulatory approval. Although the Company believes that any forward-looking information and statements herein are reasonable, in light of the use of assumptions and the significant risks and uncertainties inherent in such information and statements, there can be no assurance that any such forward-looking information and statements will prove to be accurate, and accordingly readers are advised to rely on their own evaluation of such risks and uncertainties and should not place undue reliance upon such forward-looking information and statements. Any forward-looking information and statements herein are made as of the date hereof, and except as required by applicable laws, the Company assumes no obligation and disclaims any intention to update or revise any forward-looking information and statements herein or to update the reasons that actual events or results could or do differ from those projected in any forward looking information and statements herein, whether as a result of new information, future events or results, or otherwise, except as required by applicable laws.
For more information about Comstock Metals Ltd., please refer to Comstock Metals' website at www.comstock-metals.com or contact:
Steven H. Goldman
President, CEO and Director
COMSTOCK METALS LTD.
Cell Phone: (416) 917-1533
Email: s.goldman@goldmanhine.com
Neither TSX Venture Exchange nor its Regulation Services Provider (as that term is defined in the policies of the TSX Venture Exchange) accepts responsibility for the adequacy or accuracy of this Release.
[1] True thickness is interpreted to be approximately 60-80% of drilled width
[2] See Comstock Metals News Release dated September 28, 2017
[3] See Comstock Metals News Release dated January 31, 2019
[4] The Company has filed on SEDAR the 43-101 Technical Report, Preview SW Gold Project, La Ronge, Saskatchewan, prepared for Comstock Metals Ltd. by Ronald G. Simpson, P.Geo., Geosim Services Inc. Effective date September 27, 2016.
NOT FOR DISTRIBUTION IN THE UNITED STATES OR TO U.S. NEWSWIRE SERVICES

To view the source version of this press release, please visit https://www.newsfilecorp.com/release/76990
VANCOUVER, British Columbia, March 12, 2021 (GLOBE NEWSWIRE) — Aben Resources Ltd. (TSX-V: ABN) (OTCQB: ABNAF) (Frankfurt: E2L2) (“Aben” or “the Company”) announces that it has granted 3,398,384 incentive stock options (the "Options") to its directors, officers, employees and consultants. The Options are exercisable at $0.065 per share for a period of two years from the date of grant. The Options have been granted under and are governed by the terms of the Company's incentive stock option plan.
About Aben Resources:
Aben Resources is a Canadian gold exploration company developing gold-focused projects in British Columbia and the Yukon Territory. Aben is a well-funded junior exploration company.
Forrest Kerr Gold Project, Golden Triangle, BC claims map:
https://abenresources.com/site/assets/files/4087/abn_forrest_kerr_project_map.pdf
For further information on Aben Resources Ltd. (TSX-V: ABN), visit our Company’s web site at www.abenresources.com.
ABEN RESOURCES LTD.
“Jim Pettit”
______________________
JAMES G. PETTIT
President & CEO
For further information contact:
Aben Resources Ltd.
Telephone: 604-687-3376
Toll Free: 800-567-8181
Facsimile: 604-687-3119
Email: info@abenresources.com
Neither TSX Venture Exchange nor its Regulation Services Provider (as that term is defined in the policies of the TSX Venture Exchange) accepts responsibility for the adequacy or accuracy of this release.
This release includes certain statements that may be deemed to be "forward-looking statements". All statements in this release, other than statements of historical facts, that address events or developments that management of the Company expects, are forward-looking statements. Although management believes the expectations expressed in such forward-looking statements are based on reasonable assumptions, such statements are not guarantees of future performance, and actual results or developments may differ materially from those in the forward-looking statements. The Company undertakes no obligation to update these forward-looking statements if management's beliefs, estimates or opinions, or other factors, should change. Factors that could cause actual results to differ materially from those in forward-looking statements, include market prices, exploration and development successes, continued availability of capital and financing, and general economic, market or business conditions. Please see the public filings of the Company at www.sedar.com for further information.
Just because a business does not make any money, does not mean that the stock will go down. For example, Greatland Gold (LON:GGP) shareholders have done very well over the last year, with the share price soaring by 411%. Having said that, unprofitable companies are risky because they could potentially burn through all their cash and become distressed.
In light of its strong share price run, we think now is a good time to investigate how risky Greatland Gold's cash burn is. For the purposes of this article, cash burn is the annual rate at which an unprofitable company spends cash to fund its growth; its negative free cash flow. First, we'll determine its cash runway by comparing its cash burn with its cash reserves.
Check out our latest analysis for Greatland Gold
Does Greatland Gold Have A Long Cash Runway?
You can calculate a company's cash runway by dividing the amount of cash it has by the rate at which it is spending that cash. Greatland Gold has such a small amount of debt that we'll set it aside, and focus on the UK£5.9m in cash it held at December 2020. Importantly, its cash burn was UK£3.7m over the trailing twelve months. Therefore, from December 2020 it had roughly 19 months of cash runway. That's not too bad, but it's fair to say the end of the cash runway is in sight, unless cash burn reduces drastically. You can see how its cash balance has changed over time in the image below.

How Is Greatland Gold's Cash Burn Changing Over Time?
Because Greatland Gold isn't currently generating revenue, we consider it an early-stage business. Nonetheless, we can still examine its cash burn trajectory as part of our assessment of its cash burn situation. As it happens, the company's cash burn reduced by 16% over the last year, which suggests that management are maintaining a fairly steady rate of business development, albeit with a slight decrease in spending. Clearly, however, the crucial factor is whether the company will grow its business going forward. For that reason, it makes a lot of sense to take a look at our analyst forecasts for the company.
Can Greatland Gold Raise More Cash Easily?
Even though it has reduced its cash burn recently, shareholders should still consider how easy it would be for Greatland Gold to raise more cash in the future. Companies can raise capital through either debt or equity. Commonly, a business will sell new shares in itself to raise cash and drive growth. By comparing a company's annual cash burn to its total market capitalisation, we can estimate roughly how many shares it would have to issue in order to run the company for another year (at the same burn rate).
Greatland Gold has a market capitalisation of UK£862m and burnt through UK£3.7m last year, which is 0.4% of the company's market value. So it could almost certainly just borrow a little to fund another year's growth, or else easily raise the cash by issuing a few shares.
So, Should We Worry About Greatland Gold's Cash Burn?
It may already be apparent to you that we're relatively comfortable with the way Greatland Gold is burning through its cash. For example, we think its cash burn relative to its market cap suggests that the company is on a good path. Its weak point is its cash burn reduction, but even that wasn't too bad! Considering all the factors discussed in this article, we're not overly concerned about the company's cash burn, although we do think shareholders should keep an eye on how it develops. On another note, Greatland Gold has 4 warning signs (and 1 which is significant) we think you should know about.
Of course, you might find a fantastic investment by looking elsewhere. So take a peek at this free list of companies insiders are buying, and this list of stocks growth stocks (according to analyst forecasts)
This article by Simply Wall St is general in nature. It does not constitute a recommendation to buy or sell any stock, and does not take account of your objectives, or your financial situation. We aim to bring you long-term focused analysis driven by fundamental data. Note that our analysis may not factor in the latest price-sensitive company announcements or qualitative material. Simply Wall St has no position in any stocks mentioned.
Have feedback on this article? Concerned about the content? Get in touch with us directly. Alternatively, email editorial-team (at) simplywallst.com.
Stewart, British Columbia–(Newsfile Corp. – March 11, 2021) – Decade Resources Ltd. (TSXV: DEC) ("Decade" or the Company) announces that it has received most of the assays and check assays for a further 20 drill holes from the 2020 program on the Del Norte property, located 34 km east of Stewart in BC's "Golden Triangle". It was optioned from Teuton Resource Corp. in January of 2020 with terms allowing the Company to earn up to a 55% interest in the property by spending $4 million over a five year period. The Company can an earn an additional 20% interest by carrying the property to commercial production.
This portion of the 2020 drill program was designed to test a number of targets generated by a comprehensive review of past work on the property and augmented by prospecting discoveries made early in the field season (such as the Eagle's Nest). The greatest success came in the realization that the Argo zone is a separate mineral system carrying appreciable gold-silver values with robust widths up to 30-50m. It does not appear to outcrop within the project area. The deformation corridor, is composed of argillites and lapilli tuffs, brecciated and sheared with quartz-carbonate-sulphide cemented breccias, replacement zones and veins. Breccia fragments, composed mostly of argillite are very angular ranging in size from less than 1 cm to 10 cm across. Mineralized zones host sulphides including pyrite, sphalerite, galena and tetrahedrite mineralization along with sections mineralized by fine acicular arsenopyrite. It is near the volcanic – sediment contact in rocks analogous to those hosting the Eskay Creek mineralization.
Ed Kruchkowski, President of the Company comments; "The Company was very successful in outlining numerous silver rich areas for further exploration. Our drilling was restricted to available rock islands but with the recession of glacial ice, these will have become bigger for this year's program. The newly identified Argo zone will be the focus of exploration in 2021. At the start of the past season's program there were 2 main silver bearing trends outlined and at the conclusion of 2020 exploration, the Company had defined 6 different systems. The zones show great continuity and grades over long distances. At the start of the 2020 field season exploration, new interpretations had indicated a possible wide zone of mineralization, that was named the Argo zone. It does not outcrop and is at depth just to the west of the LG vein. The shallow 2020 holes did not intersect this zone but the deeper holes were successful in confirming the zone as well as indicating the presence of appreciable mineralization. Work in 2021 will aim at expanding the area of this deeper mineralization with much closer spaced holes as well as testing new zones. Recommendations from the Company consultants include a program costing 2 million dollars"
Highlights of drilling into the Argo zone include:
-
1049.64 g/t Ag eq over 6.03 m in DDH DN20-18, included within an interval grading 119.95 g/t Ag Eq over 58.37m
-
2128.48 g/t Ag eq over 2.46m in DDH DN20-20, included within an interval grading 221.03 g/t Ag eq over 34.09m
Both DDH DN20-18 and 20 were the deepest intersections on the Argo zone and as they were collared 500m from each other indicate excellent potential for establishing tonnage with continued drilling in 2021. Further drilling on close spaced intervals will expand on the new zone.
The 2020 drilling was also designed to establish the relationship of the LG vein to the Kosciuszko zone and to test any new mineralization such as the Eagle's Nest that was found during the program. Drilling in 2020 took place from 5 different rock islands (nunataks) located in the South Nelson glacier area. Drilling was west of the LG vein area which received testing in 2003-2006 drill programs. DDH DN20-3 to 9 was from Pad #2 and DDH DN20-10 to 15 was from Pad #3. The area tested was roughly 600m N-S and 400m E-W.
Because of the reconnaissance nature of the drilling testing multiple targets and also partially because of the limited opportunities to site a drill pad, not every hole intersected mineralization. The holes with significant assay results are shown below:
|
DDH # |
Zone |
From (m) |
To(m) |
Width (m) |
Au g/t |
Ag g/t |
Ag g/t eq |
|
DN20-10 |
Eagle's Nest |
90.68 |
96.93 |
6.2 |
5.3 |
35.88 |
433.38 |
|
DN20-11 |
Eagle's Nest |
21.87 |
22.25 |
0.38 |
2.39 |
79.0 |
258.25 |
|
and |
132.74 |
135.64 |
2.9 |
0.085 |
77.20 |
83.575 |
|
|
DN20-15 |
Eagle's Nest |
26.21 |
29.26 |
3.05 |
0.94 |
108.04 |
178.54 |
|
DN20-18 |
Argo |
192.18 |
250.55 |
58.37 |
0.86 |
55.45 |
119.95 |
|
Incl |
227.91 |
231.65 |
4.95 |
6.03 |
597.39 |
1049.64 |
|
|
DN20-19 |
Argo |
154.84 |
161.85 |
7.01 |
5.3 |
86.39 |
483.89 |
|
DN20-20 |
Argo |
109.2 |
143.1 |
34.09 |
2.02 |
69.53 |
221.03 |
|
Incl |
109.2 |
111.48 |
2.46 |
17.5 |
815.98 |
2128.48 |
|
|
Incl |
139.67 |
143.1 |
3.43 |
4.14 |
38.6 |
349.1 |
|
|
DN20-21 |
Argo |
150.30 |
151.22 |
0.91 |
3.52 |
50.2 |
314.2 |
|
and |
177.59 |
179.88 |
2.29 |
1.51 |
99.8 |
213.05 |
Analytical values have been rounded. True widths are unknown at this time.
*Silver-equivalent values for gold and silver only (no base metals), calculated assuming 100% metal recovery. Assumptions: US$25/oz silver, US$1800/oz gold: 1:72 ratio.
Analysis were performed by Activation Laboratories Ltd in Kamloops BC.
Ed Kruchkowski, P. Geo., a qualified person under National Instrument 43-101 is responsible for the contents of this release. E. Kruchkowski is not independent of Decade as he is the president of the Company.
Decade Resources Ltd. is a Canadian based mineral exploration company actively seeking opportunities in the resource sector. Decade holds numerous properties at various stages of development and exploration from basic grass roots to advanced ones. Its properties and projects are all located in the "Golden Triangle" area of northern British Columbia. For a complete listing of the Company assets and developments, visit the Company website at www.decaderesources.ca which is presently being updated. For investor information please call 250-636-2264 or Gary Assaly at 604-377-7969.
ON BEHALF OF THE BOARD OF DECADE RESOURCES LTD.
"Ed Kruchkowski"
Ed Kruchkowski, President
"Neither the TSX Venture Exchange nor its Regulation Services Provider (as that term is defined in the policies of the TSX Venture Exchange) accepts responsibility for the adequacy or accuracy of this release."
"This news release may contain forward-looking statements. Forward-looking statements address future events and conditions and therefore involve inherent risks and uncertainties. Actual results may differ materially from those currently anticipated in such statements."

To view the source version of this press release, please visit https://www.newsfilecorp.com/release/76827
VANCOUVER, BC / ACCESSWIRE / March 11, 2021 / Infinite Ore Corp. (the "Company") (TSXV:ILI)(OTCQB:ARXRF) is pleased to announce that further to its news release of February 17th, it has begun its 2,500 meter drill program on the Confederation North property within its Eastern Vision Project. The project is located south-east of Red Lake Ontario and east of the high-grade gold discovery of Great Bear Resources Ltd. The program will test gold, copper, and silver anomalies from its recent Spaciotemporal Geochemical Hydrocarbon ("SGH") survey conducted on portions of the Confederation North property (see Figure 1).
J.C. St-Amour, President of Infinite Ore commented, "We are excited to see the drills turning on the Confederation North property and are anxious to see the results. Access to the property and logistics are very good and so I anticipate an efficient drilling program."
Figure 1: Map of SGH anomalies and planned drill holes of the Confederation North property, Eastern Vision Project.

The Company is earning into the Eastern Vision Project which consists of the Fredart, Garnet Lake, Confederation North, and Confederation South properties. Past exploration has focused on VMS targets within the Confederation Lake assemblage near Red Lake, Ontario. The Garnet Lake properties hold 43-101-compliant inferred mineral resources of 2.1 million tonnes grading 5.78% Zn, 0.72% Cu, 19.5 g/t Ag, and 0.6 g/t Au. The Fredart property contains an historical resource of 386,200 tonnes grading 1.56% Cu and 33.6 g/t Ag*.
Qualified Person
The technical content of this news release was approved by Michel Boily, PhD, P.Geo, an Independent Qualified Person as defined by the National Instrument 43-101.
* The estimates presented above are treated as historic information and have not been verified or relied upon for economic evaluation by the Company. These historical mineral resources do not refer to any category of sections 1.2 and 1.3 of the NI-43-101 Instrument such as mineral resources or mineral reserves as stated in the 2010 CIM Definition Standards on Mineral Resources and Mineral Reserves. The explanation lies in the inability by the Company to verify the data acquired by the various historical drilling campaigns. The Company has not done sufficient work yet to classify the historical estimates as current mineral resources or mineral reserves.
About Infinite Ore Corp.
Infinite Ore is a junior mining exploration company focused on seeking and acquiring world-class mineral projects. The company is earning into a large land package with the potential for VMS and gold mineralization in the Confederation Lake assemblage belt near Red Lake, Ont. The company also holds the Jackpot lithium property located near Nipigon, Ont.
ON BEHALF OF THE BOARD
"J.C. St-Amour"
J.C. St-Amour, President
FOR FURTHER INFORMATION, PLEASE CONTACT:
Telephone: 1-604-683-3995
Toll Free: 1-888-945-4770
Neither the TSX Venture Exchange nor its Regulation Services Provider (as that term is defined in the policies of the TSX Venture Exchange) accepts responsibility for the adequacy or accuracy of this release.
FORWARD LOOKING STATEMENTS: This news release contains forward-looking statements, which relate to future events or future performance and reflect management's current expectations and assumptions. Such forward-looking statements reflect management's current beliefs and are based on assumptions made by and information currently available to the Company. Investors are cautioned that these forward-looking statements are neither promises nor guarantees and are subject to risks and uncertainties that may cause future results to differ materially from those expected. These forward -looking statements are made as of the date hereof and, except as required under applicable securities legislation, the Company does not assume any obligation to update or revise them to reflect new events or circumstances. All the forward-looking statements made in this press release are qualified by these cautionary statements and by those made in our filings with SEDAR in Canada (available at WWW.SEDAR.COM).
SOURCE: Infinite Ore Corp.
View source version on accesswire.com:
https://www.accesswire.com/634877/Infinite-Ore-Begins-Drilling-on-Eastern-Vision-Project
WHITE ROCK, BC / ACCESSWIRE / March 11, 2021 / AZARGA URANIUM CORP. (TSX:AZZ)(OTCQB:AZZUF)(FRA:P8AA) ("Azarga Uranium" or the "Company") is pleased to announce that AK Jensen Investment Management Ltd through its Tees River Uranium Fund and Tees River Critical Resources Fund has increased its ownership of the Company to 10.94% of the issued and outstanding common shares on a non-diluted basis and 12.58% on a fully diluted basis.
Blake Steele, Azarga Uranium President and CEO stated: "we are very pleased that a strategic, institutional investor continues to see solid value in our shares and has increased their ownership interest in Azarga Uranium as we advance our portfolio of high quality uranium assets in the United States. Our flagship asset, the low-cost Dewey Burdock Project, is one of the preeminent undeveloped in-situ recovery uranium projects in the USA, boasting robust project economics, and we are aggressively moving towards construction."
Sean Benson, Chief Investment Officer of the Tees River Uranium and Critical Resources Funds, stated: "as the sentiments towards nuclear power improve among policy makers and investors, we continue to see substantial upside in the uranium sector. Companies such as Azarga Uranium, with low-cost, advanced stage projects are well positioned to significantly benefit from the structural uranium deficit and we are happy to be a long-term supportive shareholder."
About Azarga Uranium Corp.
Azarga Uranium is an integrated uranium exploration and development company that controls ten uranium projects and prospects in the United States of America ("USA") (South Dakota, Wyoming, Utah and Colorado), with a primary focus of developing in-situ recovery uranium projects. The Dewey Burdock in-situ recovery uranium project in South Dakota, USA (the "Dewey Burdock Project"), which is the Company's initial development priority, has been issued its Nuclear Regulatory Commission License and final Class III and Class V Underground Injection Control ("UIC") permits from the Environmental Protection Agency (the "EPA") and the Company is in the process of completing regulatory permit approvals necessary for the construction of the Dewey Burdock Project.
For more information please visit www.azargauranium.com.
Follow us on Twitter at @AzargaUranium.
For further information, please contact:
Blake Steele, President and CEO
+1 303 790-7528
E-mail: info@azargauranium.com
Disclaimer for Forward-Looking Information
Certain information and statements in this news release may be considered forward-looking information or forward-looking statements for purposes of applicable securities laws (collectively, "forward-looking statements"), which reflect the expectations of management regarding its disclosure and amendments thereto. Forward-looking statements consist of information or statements that are not purely historical, including any information or statements regarding beliefs, plans, expectations or intentions regarding the future. Such information or statements may include, but are not limited to, statements with respect to the Company aggressively moving towards construction, seeing substantial upside in the uranium sector, companies such as Azarga Uranium being well positioned to significantly benefit from the structural uranium deficit and the Company being in the process of completing regulatory permit approvals necessary for the construction of the Dewey Burdock Project. Such statements are subject to risks and uncertainties that may cause actual results, performance or developments to differ materially from those contained in the statements. No assurance can be given that any of the events anticipated by the forward-looking statements will occur or, if they do occur, what benefits Azarga Uranium will obtain from them. These forward-looking statements reflect management's current views and are based on certain expectations, estimates and assumptions, which may prove to be incorrect. A number of risks and uncertainties could cause actual results to differ materially from those expressed or implied by the forward-looking statements, including without limitation: the risk that the Company does not aggressively move towards construction or at all, the risk that substantial upside in the uranium sector does not exist, the risk that companies such as Azarga Uranium are not well positioned to significantly benefit from the structural uranium deficit, and the Company does not complete regulatory permit approvals necessary for the construction of the Dewey Burdock Project, the risk that such statements may prove to be inaccurate and other factors beyond the Company's control. These forward-looking statements are made as of the date of this news release and, except as required by applicable securities laws, Azarga Uranium assumes no obligation to update these forward-looking statements, or to update the reasons why actual results differed from those projected in the forward-looking statements. Additional information about these and other assumptions, risks and uncertainties are set out in the "Risks and Uncertainties" section in the most recent AIF filed with Canadian security regulators.
The TSX has not reviewed and does not accept responsibility for the adequacy or accuracy of the content of this News Release.
SOURCE: Azarga Uranium Corp.
View source version on accesswire.com:
https://www.accesswire.com/634881/Tees-River-Uranium-Fund-Tees-River-Critical-Resources-Fund-Increases-Stake-In-Azarga-Uranium-to-109
If you want to know who really controls APN Convenience Retail REIT (ASX:AQR), then you'll have to look at the makeup of its share registry. Institutions often own shares in more established companies, while it's not unusual to see insiders own a fair bit of smaller companies. We also tend to see lower insider ownership in companies that were previously publicly owned.
APN Convenience Retail REIT is not a large company by global standards. It has a market capitalization of AU$431m, which means it wouldn't have the attention of many institutional investors. In the chart below, we can see that institutions own shares in the company. Let's delve deeper into each type of owner, to discover more about APN Convenience Retail REIT.
View our latest analysis for APN Convenience Retail REIT

What Does The Institutional Ownership Tell Us About APN Convenience Retail REIT?
Institutions typically measure themselves against a benchmark when reporting to their own investors, so they often become more enthusiastic about a stock once it's included in a major index. We would expect most companies to have some institutions on the register, especially if they are growing.
We can see that APN Convenience Retail REIT does have institutional investors; and they hold a good portion of the company's stock. This can indicate that the company has a certain degree of credibility in the investment community. However, it is best to be wary of relying on the supposed validation that comes with institutional investors. They too, get it wrong sometimes. If multiple institutions change their view on a stock at the same time, you could see the share price drop fast. It's therefore worth looking at APN Convenience Retail REIT's earnings history below. Of course, the future is what really matters.

We note that hedge funds don't have a meaningful investment in APN Convenience Retail REIT. Our data shows that APN Property Group Limited is the largest shareholder with 8.3% of shares outstanding. With 7.7% and 6.8% of the shares outstanding respectively, APN Funds Management Ltd. and Moelis Australia Asset Management Ltd are the second and third largest shareholders.
Our studies suggest that the top 25 shareholders collectively control less than half of the company's shares, meaning that the company's shares are widely disseminated and there is no dominant shareholder.
While it makes sense to study institutional ownership data for a company, it also makes sense to study analyst sentiments to know which way the wind is blowing. There are a reasonable number of analysts covering the stock, so it might be useful to find out their aggregate view on the future.
Insider Ownership Of APN Convenience Retail REIT
While the precise definition of an insider can be subjective, almost everyone considers board members to be insiders. Company management run the business, but the CEO will answer to the board, even if he or she is a member of it.
Most consider insider ownership a positive because it can indicate the board is well aligned with other shareholders. However, on some occasions too much power is concentrated within this group.
Our most recent data indicates that insiders own some shares in APN Convenience Retail REIT. It has a market capitalization of just AU$431m, and insiders have AU$18m worth of shares, in their own names. It is good to see some investment by insiders, but it might be worth checking if those insiders have been buying.
General Public Ownership
The general public, who are mostly retail investors, collectively hold 53% of APN Convenience Retail REIT shares. This level of ownership gives retail investors the power to sway key policy decisions such as board composition, executive compensation, and the dividend payout ratio.
Private Company Ownership
We can see that Private Companies own 7.2%, of the shares on issue. It might be worth looking deeper into this. If related parties, such as insiders, have an interest in one of these private companies, that should be disclosed in the annual report. Private companies may also have a strategic interest in the company.
Next Steps:
While it is well worth considering the different groups that own a company, there are other factors that are even more important. For instance, we've identified 3 warning signs for APN Convenience Retail REIT that you should be aware of.
Ultimately the future is most important. You can access this free report on analyst forecasts for the company.
NB: Figures in this article are calculated using data from the last twelve months, which refer to the 12-month period ending on the last date of the month the financial statement is dated. This may not be consistent with full year annual report figures.
This article by Simply Wall St is general in nature. It does not constitute a recommendation to buy or sell any stock, and does not take account of your objectives, or your financial situation. We aim to bring you long-term focused analysis driven by fundamental data. Note that our analysis may not factor in the latest price-sensitive company announcements or qualitative material. Simply Wall St has no position in any stocks mentioned.
Have feedback on this article? Concerned about the content? Get in touch with us directly. Alternatively, email editorial-team (at) simplywallst.com.
We can readily understand why investors are attracted to unprofitable companies. For example, biotech and mining exploration companies often lose money for years before finding success with a new treatment or mineral discovery. Nonetheless, only a fool would ignore the risk that a loss making company burns through its cash too quickly.
So, the natural question for Sandfire Resources America (CVE:SFR) shareholders is whether they should be concerned by its rate of cash burn. In this article, we define cash burn as its annual (negative) free cash flow, which is the amount of money a company spends each year to fund its growth. First, we'll determine its cash runway by comparing its cash burn with its cash reserves.
See our latest analysis for Sandfire Resources America
How Long Is Sandfire Resources America's Cash Runway?
A cash runway is defined as the length of time it would take a company to run out of money if it kept spending at its current rate of cash burn. As at December 2020, Sandfire Resources America had cash of CA$12m and no debt. Importantly, its cash burn was CA$16m over the trailing twelve months. That means it had a cash runway of around 9 months as of December 2020. To be frank, this kind of short runway puts us on edge, as it indicates the company must reduce its cash burn significantly, or else raise cash imminently. You can see how its cash balance has changed over time in the image below.

How Is Sandfire Resources America's Cash Burn Changing Over Time?
Sandfire Resources America didn't record any revenue over the last year, indicating that it's an early stage company still developing its business. Nonetheless, we can still examine its cash burn trajectory as part of our assessment of its cash burn situation. It seems likely that the business is content with its current spending, as the cash burn rate stayed steady over the last twelve months. Admittedly, we're a bit cautious of Sandfire Resources America due to its lack of significant operating revenues. So we'd generally prefer stocks from this list of stocks that have analysts forecasting growth.
Can Sandfire Resources America Raise More Cash Easily?
While its cash burn is only increasing slightly, Sandfire Resources America shareholders should still consider the potential need for further cash, down the track. Generally speaking, a listed business can raise new cash through issuing shares or taking on debt. Many companies end up issuing new shares to fund future growth. By comparing a company's annual cash burn to its total market capitalisation, we can estimate roughly how many shares it would have to issue in order to run the company for another year (at the same burn rate).
Since it has a market capitalisation of CA$251m, Sandfire Resources America's CA$16m in cash burn equates to about 6.4% of its market value. Given that is a rather small percentage, it would probably be really easy for the company to fund another year's growth by issuing some new shares to investors, or even by taking out a loan.
How Risky Is Sandfire Resources America's Cash Burn Situation?
Even though its cash runway makes us a little nervous, we are compelled to mention that we thought Sandfire Resources America's cash burn relative to its market cap was relatively promising. We don't think its cash burn is particularly problematic, but after considering the range of factors in this article, we do think shareholders should be monitoring how it changes over time. Taking a deeper dive, we've spotted 3 warning signs for Sandfire Resources America you should be aware of, and 2 of them are a bit unpleasant.
Of course, you might find a fantastic investment by looking elsewhere. So take a peek at this free list of interesting companies, and this list of stocks growth stocks (according to analyst forecasts)
This article by Simply Wall St is general in nature. It does not constitute a recommendation to buy or sell any stock, and does not take account of your objectives, or your financial situation. We aim to bring you long-term focused analysis driven by fundamental data. Note that our analysis may not factor in the latest price-sensitive company announcements or qualitative material. Simply Wall St has no position in any stocks mentioned.
Have feedback on this article? Concerned about the content? Get in touch with us directly. Alternatively, email editorial-team (at) simplywallst.com.
VANCOUVER, BC, March 9, 2021 /CNW/ – Trading resumes in:
Company: Teuton Resources Corp.
TSX-Venture Symbol: TUO
All Issues: Yes
Resumption (ET): 12:30 PM
IIROC can make a decision to impose a temporary suspension (halt) of trading in a security of a publicly-listed company. Trading halts are implemented to ensure a fair and orderly market. IIROC is the national self-regulatory organization which oversees all investment dealers and trading activity on debt and equity marketplaces in Canada.
SOURCE Investment Industry Regulatory Organization of Canada (IIROC) – Halts/Resumptions


View original content: http://www.newswire.ca/en/releases/archive/March2021/09/c6301.html
There's no doubt that money can be made by owning shares of unprofitable businesses. For example, although Amazon.com made losses for many years after listing, if you had bought and held the shares since 1999, you would have made a fortune. But while history lauds those rare successes, those that fail are often forgotten; who remembers Pets.com?
So, the natural question for Marmota (ASX:MEU) shareholders is whether they should be concerned by its rate of cash burn. For the purpose of this article, we'll define cash burn as the amount of cash the company is spending each year to fund its growth (also called its negative free cash flow). The first step is to compare its cash burn with its cash reserves, to give us its 'cash runway'.
See our latest analysis for Marmota
How Long Is Marmota's Cash Runway?
A cash runway is defined as the length of time it would take a company to run out of money if it kept spending at its current rate of cash burn. In December 2020, Marmota had AU$7.2m in cash, and was debt-free. Importantly, its cash burn was AU$2.0m over the trailing twelve months. That means it had a cash runway of about 3.7 years as of December 2020. A runway of this length affords the company the time and space it needs to develop the business. The image below shows how its cash balance has been changing over the last few years.

How Is Marmota's Cash Burn Changing Over Time?
Although Marmota reported revenue of AU$50k last year, it didn't actually have any revenue from operations. To us, that makes it a pre-revenue company, so we'll look to its cash burn trajectory as an assessment of its cash burn situation. With the cash burn rate up 49% in the last year, it seems that the company is ratcheting up investment in the business over time. That's not necessarily a bad thing, but investors should be mindful of the fact that will shorten the cash runway. Marmota makes us a little nervous due to its lack of substantial operating revenue. So we'd generally prefer stocks from this list of stocks that have analysts forecasting growth.
Can Marmota Raise More Cash Easily?
While Marmota does have a solid cash runway, its cash burn trajectory may have some shareholders thinking ahead to when the company may need to raise more cash. Issuing new shares, or taking on debt, are the most common ways for a listed company to raise more money for its business. Commonly, a business will sell new shares in itself to raise cash and drive growth. We can compare a company's cash burn to its market capitalisation to get a sense for how many new shares a company would have to issue to fund one year's operations.
Since it has a market capitalisation of AU$43m, Marmota's AU$2.0m in cash burn equates to about 4.6% of its market value. Given that is a rather small percentage, it would probably be really easy for the company to fund another year's growth by issuing some new shares to investors, or even by taking out a loan.
Is Marmota's Cash Burn A Worry?
It may already be apparent to you that we're relatively comfortable with the way Marmota is burning through its cash. In particular, we think its cash runway stands out as evidence that the company is well on top of its spending. While its increasing cash burn wasn't great, the other factors mentioned in this article more than make up for weakness on that measure. Looking at all the measures in this article, together, we're not worried about its rate of cash burn; the company seems well on top of its medium-term spending needs. On another note, Marmota has 4 warning signs (and 2 which are significant) we think you should know about.
Of course, you might find a fantastic investment by looking elsewhere. So take a peek at this free list of interesting companies, and this list of stocks growth stocks (according to analyst forecasts)
This article by Simply Wall St is general in nature. It does not constitute a recommendation to buy or sell any stock, and does not take account of your objectives, or your financial situation. We aim to bring you long-term focused analysis driven by fundamental data. Note that our analysis may not factor in the latest price-sensitive company announcements or qualitative material. Simply Wall St has no position in any stocks mentioned.
Have feedback on this article? Concerned about the content? Get in touch with us directly. Alternatively, email editorial-team (at) simplywallst.com.
VANCOUVER, British Columbia, March 09, 2021 (GLOBE NEWSWIRE) — Medallion Resources Ltd. (TSX-V: MDL; OTCQB: MLLOF; Frankfurt: MRDN) – (“Medallion” or the “Company”), reports that since January 1, 2021 the Company has received funds for the exercise of 4,249,014 warrants and options for gross proceeds of approximately $792,000. The warrants and options were priced between $0.09 and $0.40 with an average exercise price of $0.19 per share. Medallion is in a strong position with over $2,000,000 of working capital, with research and engineering programs underway on both the extraction and separation of rare-earth elements (REE).
“We are very pleased and thankful to receive the continuing support of shareholders with the exercise of almost $800,000 in warrants and options,” said Mark Saxon, CEO and President. “With a strong cash position, we can now make commitments to longer term research and corporate development.”
Rare-Earth Element Separation Technology Acquisition – Update
In addition to Medallion’s long-term investment in a proprietary process for the sustainable extraction of REEs from mineral sand monazite, the Company recently acquired an exclusive license to a portfolio of technology, patents, and knowhow for ligand-assisted displacement (LAD) chromatography from Purdue University. The license enables Medallion to deploy the LAD technology in the separation and purification of rare-earth elements for all minerals, mineral processing by-products and mining waste feedstock, excluding coal-sourced materials. Medallion has begun discussions with third parties to sub-license the LAD technology and provide much sought-after and low-environmental impact REE separation.
The LAD system, developed by Linda Wang, PhD, the Purdue Maxine Spencer Nichols Professor of Chemical Engineering, was selected for investment by Medallion following extensive review of the REE separation industry. The green engineering and design principles applied by Dr Wang were recognized through the publication of her research in the Journal Green Chemistry in 2020. LAD chromatography is an aqueous (water based) process that does not depend upon petrochemical industry solvents to function. The technology is built upon a platform that is widely used in the pharmaceuticals industry and provides an environmentally sound method for REE separation with low technology risk and holds tremendous promise.
About Medallion Resources
Medallion Resources has developed a proprietary process and related business model to achieve low-cost, near-term, rare-earth element (REE) production by exploiting monazite. Monazite is a rare-earth phosphate mineral that is widely available as a by-product from mineral sand mining operations. REEs are critical inputs to electric and hybrid vehicles, electronics, imaging systems, wind turbines and strategic defense systems. Medallion is committed to following best practices and accepted international standards in all aspects of mineral transportation, processing and the safe management of waste materials. More about Medallion (TSX-V: MDL; OTCQB: MLLOF; Frankfurt: MRDN) can be found at medallionresources.com.
Contact(s):
Mark Saxon, President & CEO
Donald Lay, Director & VP, Corporate Development
+1.604.681.9558 or info@medallionresources.com
Neither TSX Venture Exchange nor its Regulation Services Provider (as that term is defined in the policies of the TSX Venture Exchange) accepts responsibility for the adequacy or accuracy of this release.
Medallion management takes full responsibility for content and has prepared this news release. Some of the statements contained in this release are forward-looking statements, such as statements that describe Medallion’s plans with respect to the completion of additional tranche(s) of the Offering and the intended use of the proceeds. Since forward-looking statements address future events and conditions, by their very nature, they involve inherent risks and uncertainties, including the risks related to market conditions and regulatory approval and other risks outlined in the Company’s management discussions and analysis of financial results. Actual results in each case could differ materially from those currently anticipated in these statements. Also, in order to proceed with Medallion’s plans, additional funding will be necessary and, depending on market conditions, this funding may not be forthcoming on a schedule or on terms that facilitate Medallion’s plans. These forward-looking statements are made as of the date of this press release, and, other than as required by applicable securities laws, Medallion disclaims any intent or obligation to update publicly any forward-looking statements, whether as a result of new information, future events or results or otherwise.
There's no doubt that money can be made by owning shares of unprofitable businesses. For example, although software-as-a-service business Salesforce.com lost money for years while it grew recurring revenue, if you held shares since 2005, you'd have done very well indeed. Nonetheless, only a fool would ignore the risk that a loss making company burns through its cash too quickly.
So should Aspire Mining (ASX:AKM) shareholders be worried about its cash burn? In this report, we will consider the company's annual negative free cash flow, henceforth referring to it as the 'cash burn'. Let's start with an examination of the business' cash, relative to its cash burn.
See our latest analysis for Aspire Mining
How Long Is Aspire Mining's Cash Runway?
A cash runway is defined as the length of time it would take a company to run out of money if it kept spending at its current rate of cash burn. As at June 2020, Aspire Mining had cash of AU$41m and such minimal debt that we can ignore it for the purposes of this analysis. Looking at the last year, the company burnt through AU$5.1m. Therefore, from June 2020 it had 8.0 years of cash runway. Even though this is but one measure of the company's cash burn, the thought of such a long cash runway warms our bellies in a comforting way. You can see how its cash balance has changed over time in the image below.

How Is Aspire Mining's Cash Burn Changing Over Time?
Aspire Mining didn't record any revenue over the last year, indicating that it's an early stage company still developing its business. Nonetheless, we can still examine its cash burn trajectory as part of our assessment of its cash burn situation. Even though it doesn't get us excited, the 36% reduction in cash burn year on year does suggest the company can continue operating for quite some time. Admittedly, we're a bit cautious of Aspire Mining due to its lack of significant operating revenues. We prefer most of the stocks on this list of stocks that analysts expect to grow.
How Easily Can Aspire Mining Raise Cash?
Even though it has reduced its cash burn recently, shareholders should still consider how easy it would be for Aspire Mining to raise more cash in the future. Issuing new shares, or taking on debt, are the most common ways for a listed company to raise more money for its business. Commonly, a business will sell new shares in itself to raise cash and drive growth. We can compare a company's cash burn to its market capitalisation to get a sense for how many new shares a company would have to issue to fund one year's operations.
Aspire Mining's cash burn of AU$5.1m is about 10% of its AU$49m market capitalisation. Given that situation, it's fair to say the company wouldn't have much trouble raising more cash for growth, but shareholders would be somewhat diluted.
How Risky Is Aspire Mining's Cash Burn Situation?
It may already be apparent to you that we're relatively comfortable with the way Aspire Mining is burning through its cash. In particular, we think its cash runway stands out as evidence that the company is well on top of its spending. Its cash burn reduction wasn't quite as good, but was still rather encouraging! Looking at all the measures in this article, together, we're not worried about its rate of cash burn; the company seems well on top of its medium-term spending needs. Readers need to have a sound understanding of business risks before investing in a stock, and we've spotted 2 warning signs for Aspire Mining that potential shareholders should take into account before putting money into a stock.
Of course Aspire Mining may not be the best stock to buy. So you may wish to see this free collection of companies boasting high return on equity, or this list of stocks that insiders are buying.
This article by Simply Wall St is general in nature. It does not constitute a recommendation to buy or sell any stock, and does not take account of your objectives, or your financial situation. We aim to bring you long-term focused analysis driven by fundamental data. Note that our analysis may not factor in the latest price-sensitive company announcements or qualitative material. Simply Wall St has no position in any stocks mentioned.
Have feedback on this article? Concerned about the content? Get in touch with us directly. Alternatively, email editorial-team (at) simplywallst.com.
There's no doubt that money can be made by owning shares of unprofitable businesses. For example, biotech and mining exploration companies often lose money for years before finding success with a new treatment or mineral discovery. But while history lauds those rare successes, those that fail are often forgotten; who remembers Pets.com?
So should Native Mineral Resources Holdings (ASX:NMR) shareholders be worried about its cash burn? In this report, we will consider the company's annual negative free cash flow, henceforth referring to it as the 'cash burn'. First, we'll determine its cash runway by comparing its cash burn with its cash reserves.
Check out our latest analysis for Native Mineral Resources Holdings
Does Native Mineral Resources Holdings Have A Long Cash Runway?
A company's cash runway is calculated by dividing its cash hoard by its cash burn. As at December 2020, Native Mineral Resources Holdings had cash of AU$3.3m and no debt. Importantly, its cash burn was AU$1.9m over the trailing twelve months. Therefore, from December 2020 it had roughly 22 months of cash runway. While that cash runway isn't too concerning, sensible holders would be peering into the distance, and considering what happens if the company runs out of cash. Depicted below, you can see how its cash holdings have changed over time.

How Is Native Mineral Resources Holdings' Cash Burn Changing Over Time?
Because Native Mineral Resources Holdings isn't currently generating revenue, we consider it an early-stage business. Nonetheless, we can still examine its cash burn trajectory as part of our assessment of its cash burn situation. Remarkably, it actually increased its cash burn by 289% in the last year. Given that sharp increase in spending, the company's cash runway will shrink rapidly as it depletes its cash reserves. Native Mineral Resources Holdings makes us a little nervous due to its lack of substantial operating revenue. So we'd generally prefer stocks from this list of stocks that have analysts forecasting growth.
How Hard Would It Be For Native Mineral Resources Holdings To Raise More Cash For Growth?
While Native Mineral Resources Holdings does have a solid cash runway, its cash burn trajectory may have some shareholders thinking ahead to when the company may need to raise more cash. Companies can raise capital through either debt or equity. Many companies end up issuing new shares to fund future growth. By looking at a company's cash burn relative to its market capitalisation, we gain insight on how much shareholders would be diluted if the company needed to raise enough cash to cover another year's cash burn.
Since it has a market capitalisation of AU$27m, Native Mineral Resources Holdings' AU$1.9m in cash burn equates to about 6.8% of its market value. That's a low proportion, so we figure the company would be able to raise more cash to fund growth, with a little dilution, or even to simply borrow some money.
Is Native Mineral Resources Holdings' Cash Burn A Worry?
On this analysis of Native Mineral Resources Holdings' cash burn, we think its cash burn relative to its market cap was reassuring, while its increasing cash burn has us a bit worried. Cash burning companies are always on the riskier side of things, but after considering all of the factors discussed in this short piece, we're not too worried about its rate of cash burn. Its important for readers to be cognizant of the risks that can affect the company's operations, and we've picked out 2 warning signs for Native Mineral Resources Holdings that investors should know when investing in the stock.
Of course, you might find a fantastic investment by looking elsewhere. So take a peek at this free list of companies insiders are buying, and this list of stocks growth stocks (according to analyst forecasts)
This article by Simply Wall St is general in nature. It does not constitute a recommendation to buy or sell any stock, and does not take account of your objectives, or your financial situation. We aim to bring you long-term focused analysis driven by fundamental data. Note that our analysis may not factor in the latest price-sensitive company announcements or qualitative material. Simply Wall St has no position in any stocks mentioned.
Have feedback on this article? Concerned about the content? Get in touch with us directly. Alternatively, email editorial-team (at) simplywallst.com.
If you're looking for a multi-bagger, there's a few things to keep an eye out for. One common approach is to try and find a company with returns on capital employed (ROCE) that are increasing, in conjunction with a growing amount of capital employed. Ultimately, this demonstrates that it's a business that is reinvesting profits at increasing rates of return. And in light of that, the trends we're seeing at Zimplats Holdings' (ASX:ZIM) look very promising so lets take a look.
Return On Capital Employed (ROCE): What is it?
For those who don't know, ROCE is a measure of a company's yearly pre-tax profit (its return), relative to the capital employed in the business. The formula for this calculation on Zimplats Holdings is:
Return on Capital Employed = Earnings Before Interest and Tax (EBIT) ÷ (Total Assets – Current Liabilities)
0.35 = US$619m ÷ (US$2.0b – US$199m) (Based on the trailing twelve months to December 2020).
Thus, Zimplats Holdings has an ROCE of 35%. In absolute terms that's a great return and it's even better than the Metals and Mining industry average of 11%.
View our latest analysis for Zimplats Holdings

While the past is not representative of the future, it can be helpful to know how a company has performed historically, which is why we have this chart above. If you want to delve into the historical earnings, revenue and cash flow of Zimplats Holdings, check out these free graphs here.
How Are Returns Trending?
Zimplats Holdings has recently broken into profitability so their prior investments seem to be paying off. About five years ago the company was generating losses but things have turned around because it's now earning 35% on its capital. Not only that, but the company is utilizing 50% more capital than before, but that's to be expected from a company trying to break into profitability. This can tell us that the company has plenty of reinvestment opportunities that are able to generate higher returns.
What We Can Learn From Zimplats Holdings' ROCE
In summary, it's great to see that Zimplats Holdings has managed to break into profitability and is continuing to reinvest in its business. Since the stock has returned a staggering 590% to shareholders over the last five years, it looks like investors are recognizing these changes. Therefore, we think it would be worth your time to check if these trends are going to continue.
Zimplats Holdings does have some risks though, and we've spotted 2 warning signs for Zimplats Holdings that you might be interested in.
If you'd like to see other companies earning high returns, check out our free list of companies earning high returns with solid balance sheets here.
This article by Simply Wall St is general in nature. It does not constitute a recommendation to buy or sell any stock, and does not take account of your objectives, or your financial situation. We aim to bring you long-term focused analysis driven by fundamental data. Note that our analysis may not factor in the latest price-sensitive company announcements or qualitative material. Simply Wall St has no position in any stocks mentioned.
Have feedback on this article? Concerned about the content? Get in touch with us directly. Alternatively, email editorial-team (at) simplywallst.com.
Toronto, Ontario–(Newsfile Corp. – March 8, 2021) – ATEX Resources Inc. (TSXV: ATX) ("ATEX") is pleased to announce the metallurgical test results from 13 bottle roll leach tests from the Valeriano Oxide Gold Deposit. Table 1 provides details from the metallurgical program.
Highlights from the metallurgical testing include:
-
average gold recoveries of 70.8%;
-
significant amounts of exposed gold at coarse sizes were visible; and
-
average NaCN consumption of 0.29 kg/t and average lime consumption of 7.0 kg/t (see "Discussion").
"The positive results from the preliminary metallurgical program represent a significant step forward towards the potential development of the Valeranio Oxide Gold Deposit by demonstrating that the oxide gold mineralization at Valeriano is amenable to heap leach processing", said Raymond Jannas, CEO of ATEX. "While the main goal of the ongoing 3,000 metre drill program is to expand the existing near surface oxide gold resource and convert a portion of inferred gold resource to the measured and indicated categories, the drill program will also provide addition samples for further detailed metallurgical test work with results available during the second half of 2021."
Table 1 – Metallurgical Test Results, Valeriano Oxide Gold Deposit
|
Composite Sample |
Crush Size |
Head Grade |
Gold Recovery |
NaCN Consumption |
Ca(OH)2 |
Sample Location |
|
(P80 – mm) |
(g/t Au) |
(%) |
(kg/t) |
(kg/t) |
(drill hole #) |
|
|
172488 |
2.68 |
0.695 |
77 |
0.30 |
1.04 |
VALDD12-009 |
|
172498 |
2.61 |
0.504 |
67 |
0.18 |
0.82 |
VALDD12-009 |
|
172499 |
2.58 |
0.600 |
78 |
0.20 |
2.77 |
VALDD12-009 |
|
172505 |
2.57 |
0.891 |
89 |
0.29 |
0.78 |
VALDD12-009 |
|
172528 |
2.79 |
0.727 |
69 |
0.39 |
0.71 |
VALDD12-009 |
|
173035 |
2.57 |
0.270 |
66 |
0.33 |
13.78 |
VALDD12-010 |
|
173036 |
2.80 |
0.540 |
76 |
0.47 |
25.74 |
VALDD12-010 |
|
173043 |
2.66 |
0.346 |
59 |
0.54 |
21.47 |
VALDD12-010 |
|
173048 |
2.80 |
0.328 |
63 |
0.45 |
6.31 |
VALDD12-010 |
|
173072 |
2.60 |
0.412 |
52 |
0.24 |
12.55 |
VALDD12-010 |
|
184069 |
2.27 |
0.550 |
75 |
0.19 |
2.13 |
VALDD12-011 |
|
184830 |
3.19 |
0.409 |
60 |
0.03 |
2.22 |
VALDD12-012 |
|
185536 |
2.77 |
0.200 |
87 |
0.18 |
1.16 |
VALDD13-013 |
Discussion
Ca(OH)2, (lime) consumption average 7.0 kilograms per tonne, however, this figure was impacted by elevated consumption associated with samples collected from drill hole VALDD012-010 which occurs adjacent to but outside the 0.275 g/t Au resource envelope. Removing the results from VALDD012-010 from the study decreases lime consumption to 1.45 kg/t while gold recoveries increase to 75.3%. Core from VALDD012-010 will be examined to determine the cause of the elevated lime consumption.
NaCN consumption averaged 0.29 kilograms per tonne. While bottle roll tests are not particularly useful in predicting actual NaCN consumption, the results are indicative of potential issues. No issues were noted during the test work.
While the samples were being prepared, Advanced Mineral Technology Laboratory Ltd. ("AMTEL") noted that significant amounts of exposed gold at coarse sizes were visible. Studies are being undertaken to characterize the nature of gold mineralization.
Summary of Metallurgical Test Protocols
Thirteen metallurgical test samples, varying from 4 to 6 kilograms, were collected from diamond drill core sample rejects from Hochschild Mining's 2012-2013 drill program. The availability of diamond drill holes which cut the Valeriano Gold Oxide deposit was limited. The samples were shipped to the AMTEL laboratory located in London, Canada. AMTEL was responsible for all aspects of the metallurgical test work.
Samples were crushed to a target size of P80 2 mm and split to 1,000 gram charges for testing. The bottle roll leach tests were performed at 60% solids : 40% liquids, under intensive leach conditions of 5 g/L NaCN for a period of 24 hours. The samples were split into representative aliquots for study and assay. Duplicate fire assays were performed on head samples, and single assays were performed on 'coarse', CIL and pulverized CN residues. Fire assay were checked by internal AMTEL QA-QC samples.
Valeriano Oxide Gold Resource Estimate
The Valeriano epithermal oxide gold deposit contains 0.585 million ounces of gold and 2.65 million ounces of silver for 0.623 million gold equivalent ounces in the inferred category hosted in 34.4 million tonnes at a grade of 0.528 grams per tonne ('g/t") gold and 2.4 g/t silver for a gold equivalent grade of 0.561 g/t at a 0.275 g/t gold cut-off grade.
The mineral resource is not confined by economic or mining parameters. Equivalent grades are calculated based upon a gold price of $1,800 per ounce and a silver price of $25.00 per ounce. The formula for the equivalent grade calculations are as follows: Aueq g/t =Augt + (Ag g/t*Agprice / Auprice). All prices are in US$.For further details on the Valeriano resource estimates, see ATEX's "NI 43-101 Technical Report Valeriano Project Inferred Resources Estimates" dated November 13, 2020 filed at www.sedar.com.
NI 43-101 Disclosure
David Hopper, a geological consultant and resident of El Arrayán, Santiago, Chile, is the qualified person ("QP"), as defined by National Instrument 43-101 Standards for Disclosure for Mineral Projects, for the Valeriano Project. Mr. Hopper is a Chartered Geologist of the Geological Society of London, Fellow No. 1030584. The Valeriano Project resource estimates were undertaken by SRK Consulting (Chile) SpA. Joled Nur, Civil Mining Engineer, SRK Consulting (Chile) SpA, a member of the Public Register of Competent Persons in Mining Resources and Reserves of Chile, No. 181, was the independent QP who prepared the resource estimates.
About ATEX Resources Inc.
ATEX is a mineral exploration company focused on the acquisition, development and monetization of projects throughout the Americas. ATEX's flagship Valeriano Project is located in Chile's prolific El Indio Mineral Belt.
On behalf of ATEX Resources Inc.
Dr. Raymond Jannas, CEO
For additional information, please email rjannas@atexresources.com or call 1-647-287-3778
CAUTIONARY NOTE REGARDING FORWARD-LOOKING STATEMENTS:
This news release contains forward-looking statements, including predictions, projections and forecasts. Forward-looking statements include, but are not limited to: plans for the evaluation of the Valeriano property; the success of evaluation plans; the success of exploration activities; mine development prospects; and, potential for future metals production. Often, but not always, forward-looking statements can be identified by the use of words such as "plans", "planning", "expects" or "does not expect", "continues", "scheduled", "estimates", "forecasts", "intends", "potential", "anticipates", "does not anticipate", or describes a "goal", or variation of such words and phrases or state that certain actions, events or results "may", "could", "would", "might" or "will" be taken, occur or be achieved.
Forward-looking statements involve known and unknown risks, future events, conditions, uncertainties and other factors which may cause the actual results, performance or achievements to be materially different from any future results, prediction, projection, forecast, performance or achievements expressed or implied by the forward-looking statements. Such factors include, among others, changes in economic parameters and assumptions, the interpretation and actual results of current exploration activities; changes in project parameters as plans continue to be refined; the conversion of inferred resources to the measured and indicated category; the timing of metallurgical test results; the results of regulatory and permitting processes; future metals price; possible variations in grade or recovery rates; failure of equipment or processes to operate as anticipated; labour disputes and other risks of the mining industry; the results of economic and technical studies, delays in obtaining governmental approvals or financing or in the completion of exploration, as well as those factors disclosed in ATEX's publicly filed documents.
Although ATEX has attempted to identify important factors that could cause actual actions, events or results to differ materially from those described in forward-looking statements, there may be other factors that cause actions, events or results not to be as anticipated, estimated or intended. There can be no assurance that forward-looking statements will prove to be accurate, as actual results and future events could differ materially from those anticipated in such statements. Accordingly, readers should not place undue reliance on forward-looking statements.
Neither TSX Venture Exchange nor its Regulation Services Provider (as that term is defined in the policies of the TSX Venture Exchange) accepts responsibility for the adequacy or accuracy of this press release.

To view the source version of this press release, please visit https://www.newsfilecorp.com/release/76470
VANCOUVER, BC, March 8, 2021 /CNW/ – The following issues have been halted by IIROC:
Company: Sonora Gold & Silver Corp.
TSX-Venture Symbol: SOC
All Issues: No
Reason: At the Request of the Company Pending News
Halt Time (ET): 10:53 AM
IIROC can make a decision to impose a temporary suspension (halt) of trading in a security of a publicly-listed company. Trading halts are implemented to ensure a fair and orderly market. IIROC is the national self-regulatory organization which oversees all investment dealers and trading activity on debt and equity marketplaces in Canada.
SOURCE Investment Industry Regulatory Organization of Canada (IIROC) – Halts/Resumptions


View original content: http://www.newswire.ca/en/releases/archive/March2021/08/c3093.html
Venturex Resources Limited (ASX:VXR) is possibly approaching a major achievement in its business, so we would like to shine some light on the company. Venturex Resources Limited, together with its subsidiaries, engages in the exploration and development of mineral resources in Australia. The AU$141m market-cap company announced a latest loss of AU$3.9m on 30 June 2020 for its most recent financial year result. As path to profitability is the topic on Venturex Resources' investors mind, we've decided to gauge market sentiment. In this article, we will touch on the expectations for the company's growth and when analysts expect it to become profitable.
Check out our latest analysis for Venturex Resources
Expectations from some of the Australian Metals and Mining analysts is that Venturex Resources is on the verge of breakeven. They anticipate the company to incur a final loss in 2022, before generating positive profits of AU$19m in 2023. The company is therefore projected to breakeven around 2 years from today. What rate will the company have to grow year-on-year in order to breakeven on this date? Using a line of best fit, we calculated an average annual growth rate of 110%, which is rather optimistic! Should the business grow at a slower rate, it will become profitable at a later date than expected.

Underlying developments driving Venturex Resources' growth isn’t the focus of this broad overview, though, keep in mind that generally metals and mining companies, depending on the stage of operation and metals mined, have irregular periods of cash flow. This means, large upcoming growth rates are not abnormal as the company is beginning to reap the benefits of earlier investments.
One thing we’d like to point out is that The company has managed its capital judiciously, with debt making up 9.2% of equity. This means that it has predominantly funded its operations from equity capital, and its low debt obligation reduces the risk around investing in the loss-making company.
Next Steps:
This article is not intended to be a comprehensive analysis on Venturex Resources, so if you are interested in understanding the company at a deeper level, take a look at Venturex Resources' company page on Simply Wall St. We've also put together a list of important aspects you should further research:
-
Historical Track Record: What has Venturex Resources' performance been like over the past? Go into more detail in the past track record analysis and take a look at the free visual representations of our analysis for more clarity.
-
Management Team: An experienced management team on the helm increases our confidence in the business – take a look at who sits on Venturex Resources' board and the CEO’s background.
-
Other High-Performing Stocks: Are there other stocks that provide better prospects with proven track records? Explore our free list of these great stocks here.
This article by Simply Wall St is general in nature. It does not constitute a recommendation to buy or sell any stock, and does not take account of your objectives, or your financial situation. We aim to bring you long-term focused analysis driven by fundamental data. Note that our analysis may not factor in the latest price-sensitive company announcements or qualitative material. Simply Wall St has no position in any stocks mentioned.
Have feedback on this article? Concerned about the content? Get in touch with us directly. Alternatively, email editorial-team (at) simplywallst.com.
With its stock down 16% over the past three months, it is easy to disregard Red River Resources (ASX:RVR). However, a closer look at its sound financials might cause you to think again. Given that fundamentals usually drive long-term market outcomes, the company is worth looking at. Specifically, we decided to study Red River Resources' ROE in this article.
Return on equity or ROE is a key measure used to assess how efficiently a company's management is utilizing the company's capital. Simply put, it is used to assess the profitability of a company in relation to its equity capital.
Check out our latest analysis for Red River Resources
How To Calculate Return On Equity?
The formula for ROE is:
Return on Equity = Net Profit (from continuing operations) ÷ Shareholders' Equity
So, based on the above formula, the ROE for Red River Resources is:
14% = AU$9.4m ÷ AU$65m (Based on the trailing twelve months to December 2020).
The 'return' is the profit over the last twelve months. That means that for every A$1 worth of shareholders' equity, the company generated A$0.14 in profit.
What Has ROE Got To Do With Earnings Growth?
So far, we've learned that ROE is a measure of a company's profitability. We now need to evaluate how much profit the company reinvests or "retains" for future growth which then gives us an idea about the growth potential of the company. Generally speaking, other things being equal, firms with a high return on equity and profit retention, have a higher growth rate than firms that don’t share these attributes.
Red River Resources' Earnings Growth And 14% ROE
To start with, Red River Resources' ROE looks acceptable. Further, the company's ROE is similar to the industry average of 13%. This probably goes some way in explaining Red River Resources' moderate 19% growth over the past five years amongst other factors.
As a next step, we compared Red River Resources' net income growth with the industry and were disappointed to see that the company's growth is lower than the industry average growth of 33% in the same period.

Earnings growth is an important metric to consider when valuing a stock. What investors need to determine next is if the expected earnings growth, or the lack of it, is already built into the share price. By doing so, they will have an idea if the stock is headed into clear blue waters or if swampy waters await. One good indicator of expected earnings growth is the P/E ratio which determines the price the market is willing to pay for a stock based on its earnings prospects. So, you may want to check if Red River Resources is trading on a high P/E or a low P/E, relative to its industry.
Is Red River Resources Efficiently Re-investing Its Profits?
Summary
On the whole, we feel that Red River Resources' performance has been quite good. In particular, it's great to see that the company is investing heavily into its business and along with a high rate of return, that has resulted in a respectable growth in its earnings. That being so, the latest analyst forecasts show that the company will continue to see an expansion in its earnings. To know more about the company's future earnings growth forecasts take a look at this free report on analyst forecasts for the company to find out more.
This article by Simply Wall St is general in nature. It does not constitute a recommendation to buy or sell any stock, and does not take account of your objectives, or your financial situation. We aim to bring you long-term focused analysis driven by fundamental data. Note that our analysis may not factor in the latest price-sensitive company announcements or qualitative material. Simply Wall St has no position in any stocks mentioned.
Have feedback on this article? Concerned about the content? Get in touch with us directly. Alternatively, email editorial-team (at) simplywallst.com.
Every investor in Hastings Technology Metals Limited (ASX:HAS) should be aware of the most powerful shareholder groups. Institutions will often hold stock in bigger companies, and we expect to see insiders owning a noticeable percentage of the smaller ones. Warren Buffett said that he likes "a business with enduring competitive advantages that is run by able and owner-oriented people." So it's nice to see some insider ownership, because it may suggest that management is owner-oriented.
Hastings Technology Metals is not a large company by global standards. It has a market capitalization of AU$279m, which means it wouldn't have the attention of many institutional investors. Our analysis of the ownership of the company, below, shows that institutions don't own many shares in the company. We can zoom in on the different ownership groups, to learn more about Hastings Technology Metals.
View our latest analysis for Hastings Technology Metals

What Does The Institutional Ownership Tell Us About Hastings Technology Metals?
Institutional investors commonly compare their own returns to the returns of a commonly followed index. So they generally do consider buying larger companies that are included in the relevant benchmark index.
Institutions have a very small stake in Hastings Technology Metals. That indicates that the company is on the radar of some funds, but it isn't particularly popular with professional investors at the moment. So if the company itself can improve over time, we may well see more institutional buyers in the future. When multiple institutional investors want to buy shares, we often see a rising share price. The past revenue trajectory (shown below) can be an indication of future growth, but there are no guarantees.

Hastings Technology Metals is not owned by hedge funds. From our data, we infer that the largest shareholder is Foon Lew (who also holds the title of Top Key Executive) with 10% of shares outstanding. Its usually considered a good sign when insiders own a significant number of shares in the company, and in this case, we're glad to see a company insider play the role of a key stakeholder. Meanwhile, the second and third largest shareholders, hold 6.6% and 3.2%, of the shares outstanding, respectively.
A deeper look at our ownership data shows that the top 16 shareholders collectively hold less than half of the register, suggesting a large group of small holders where no single shareholder has a majority.
While studying institutional ownership for a company can add value to your research, it is also a good practice to research analyst recommendations to get a deeper understand of a stock's expected performance. There is a little analyst coverage of the stock, but not much. So there is room for it to gain more coverage.
Insider Ownership Of Hastings Technology Metals
The definition of an insider can differ slightly between different countries, but members of the board of directors always count. Management ultimately answers to the board. However, it is not uncommon for managers to be executive board members, especially if they are a founder or the CEO.
Insider ownership is positive when it signals leadership are thinking like the true owners of the company. However, high insider ownership can also give immense power to a small group within the company. This can be negative in some circumstances.
Our most recent data indicates that insiders own a reasonable proportion of Hastings Technology Metals Limited. It has a market capitalization of just AU$279m, and insiders have AU$50m worth of shares in their own names. It is great to see insiders so invested in the business. It might be worth checking if those insiders have been buying recently.
General Public Ownership
The general public, mostly retail investors, hold a substantial 58% stake in Hastings Technology Metals, suggesting it is a fairly popular stock. This level of ownership gives retail investors the power to sway key policy decisions such as board composition, executive compensation, and the dividend payout ratio.
Next Steps:
While it is well worth considering the different groups that own a company, there are other factors that are even more important. Take risks for example – Hastings Technology Metals has 3 warning signs (and 1 which is a bit concerning) we think you should know about.
If you are like me, you may want to think about whether this company will grow or shrink. Luckily, you can check this free report showing analyst forecasts for its future.
NB: Figures in this article are calculated using data from the last twelve months, which refer to the 12-month period ending on the last date of the month the financial statement is dated. This may not be consistent with full year annual report figures.
This article by Simply Wall St is general in nature. It does not constitute a recommendation to buy or sell any stock, and does not take account of your objectives, or your financial situation. We aim to bring you long-term focused analysis driven by fundamental data. Note that our analysis may not factor in the latest price-sensitive company announcements or qualitative material. Simply Wall St has no position in any stocks mentioned.
Have feedback on this article? Concerned about the content? Get in touch with us directly. Alternatively, email editorial-team (at) simplywallst.com.
VANCOUVER, BC, March 5, 2021 /CNW/ – Callinex Mines Inc. (the "Company" or "Callinex") (TSXV: CNX) (OTC: CLLXF) announces that it has granted 160,000 stock options to its directors, officers and consultants. The options are exercisable at $5.00 per share, subject to certain vesting requirements and expire five years from the date of grant.

About Callinex Mines Inc.
Callinex Mines Inc. (TSXV: CNX) (OTC: CLLXF) is advancing its portfolio of base and precious metals rich deposits located in established Canadian mining jurisdictions. The portfolio is highlighted by its Nash Creek and Superjack deposits in the Bathurst Mining District of New Brunswick. A 2018 PEA outlined a mine plan that generates a strong economic return with a pre-tax IRR of 34.1% (25.2% post-tax) and NPV8% of $230 million ($128 million post-tax). The projects have significant exploration upside over a district-scale land package that encompasses several high-grade mineral occurrences along a 20km trend. Click here to view a video overview of the Nash Creek Project.
Callinex has a project portfolio that also includes projects within the Flin Flon Mining District of Manitoba that are located 25km to an operating processing facility that requires additional ore.
Neither the TSX Venture Exchange nor its Regulation Services Provider (as that term is defined in the policies of the TSX Venture Exchange) accepts responsibility for the adequacy or accuracy of this release.
Some statements in this news release contain forward-looking information. These statements include, but are not limited to, statements with respect to future expenditures. These statements address future events and conditions and, as such, involve known and unknown risks, uncertainties and other factors which may cause the actual results, performance or achievements to be materially different from any future results, performance or achievements expressed or implied by the statements. Such factors include, among others, the ability to complete the proposed drill program and the timing and amount of expenditures. Except as required under applicable securities laws, Callinex does not assume the obligation to update any forward-looking statement.

View original content to download multimedia:http://www.prnewswire.com/news-releases/callinex-grants-stock-options-301241193.html
SOURCE Callinex Mines Inc.


View original content to download multimedia: http://www.newswire.ca/en/releases/archive/March2021/05/c1616.html
Toronto, Ontario–(Newsfile Corp. – March 4, 2021) – Monarca Minerals, Inc. (TSXV: MMN) ("Monarca" or the "Company") is pleased to announce that it continues to advance the permitting process for its upcoming drilling program on the San Jose Silver Project ("San Jose") located near the USA border in Chihuahua, Mexico.
Surface lands for the San Jose project area are partially covered by "Ejido" lands and "Colonia" lands (community or communal lands), therefore the Company is required to sign a surface rights agreement with both the Ejido and Colonia authorities to advance its environmental permit to proceed with its planned drilling program.
On February 21, 2021, Colonia elected its new authorities and plans to sign an agreement with Monarca Mining (Mexican subsidiary of Monarca Minerals) to change the use of land and temporary occupation allowing the Company to complete its drilling program at San Jose.
An environmental assessment report for the planned drilling area, which is a requirement to obtain a drilling permit, has been completed and will be submitted to the Mexican authorities as soon as a surface rights agreement with Colonia has been signed and ratified by a Mexican Public Notary. The Company expects this agreement to be signed by next week.
The Company has also received three drilling contractor proposals for the San Jose drilling program and will be making a final decision on a drilling contract soon. The initial drilling program at San Jose includes ten targets and approximately 5,000 metres of drilling. Eight targets are located on Colonia lands and two targets on Ejido lands. Prospecting and field mapping has already been completed.
Two drill holes (SJ1 and SJ2) are planned in the area of the Guadalupana mine at the southern end of the geophysical survey area (refer to the Company's December 15, 2020 news release). These drilling targets are located over strong IP anomalies, adjacent to the southeast margin of a large magnetic anomaly, which is interpreted as a buried mineralized intrusive body. Drill hole SJ1 is designed to intercept the Guadalupana vein, which historically has returned high precious and base metal grades and is interpreted from the IP survey as "leakage" from a larger area of buried mineralization (refer to geophysical cross section and sampling photo below).
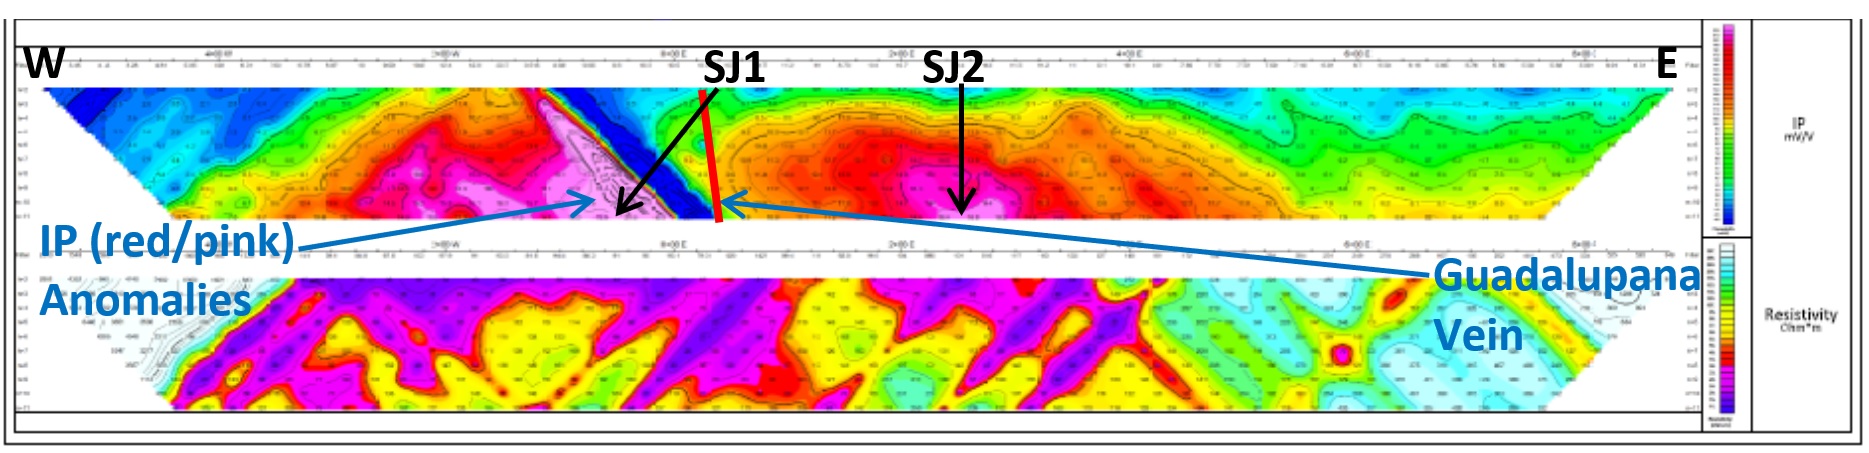
GEOPHYSICAL CROSS SECTION LOOKING NORTH – DRILL HOLES SJ1 AND SJ2 TARGETING IP ANOMALIES
To view an enhanced version of this graphic, please visit:
https://orders.newsfilecorp.com/files/2584/76043_fig1.jpg

SAMPLING PHOTO – GUADALUPANA MINE CHANNEL SAMPLE: SJ0007
To view an enhanced version of this graphic, please visit:
https://orders.newsfilecorp.com/files/2584/76043_fig2.jpg
Quality Assurance and Quality Control Statement
Procedures have been implemented by Monarca to assure Quality Assurance Quality Control (QAQC) of all assaying completed at ALS Global, which is an ISO Accredited laboratory and independent of Monarca. All grab samples taken in the field were placed in plastic bags closed with zip ties and stored in a secure location until shipment by Monarca personnel to the ALS sample preparation facility in Chihuahua, Mexico. A sterile blank sample (unmineralized rhyolite) and a mineralized reference standard (used by Monarca since 2009) were alternately placed in the sample sequence every 15th sample. The assays received for the QAQC samples were reviewed for acceptable values by Monarca's Qualified Person, who determined in all cases that results were satisfactory, resulting in a high level of confidence in the assays reported for the San Jose Project. The sterile (blank) QAQC samples all reported low or nil values for the metals of interest. The mineralized reference standard samples all reported gold assays within 2 standard deviations of the accepted value (1.15ppm) and the silver assays reported within 3 standard deviations of the accepted value (83.9ppm).
Qualified Person Statement
Michael R. Smith is the Qualified Person (QP) who has prepared and approved the scientific and technical information disclosed in this news release. Mr. Smith is a Registered Member (#04167376 – Geology) of the Society for Mining, Metallurgy & Exploration (SME) and the Executive Vice President, Exploration for Monarca Minerals Inc.
About Monarca Minerals Inc.
Monarca is a Canadian mining company listed on the TSX Venture Exchange (TSXV: MMN) and focused on the exploration and development of silver projects along a highly productive mineralized belt in Mexico. The Company has a portfolio of silver projects including an Inferred Mineral Resource of 19.8 million tonnes at 45.0 g/t Ag (28.7 million ounces of contained silver) at its Tejamen deposit in Durango, Mexico.
For further information, please contact:
Carlos Espinosa
President, CEO & Director
Monarca Minerals Inc.
E: cespinosa@slgmexico.com
Cautionary Note Regarding Forward-Looking Statements Forward-Looking Statements:
The above contains forward-looking statements that are subject to a number of known and unknown risks, uncertainties and other factors that may cause actual results to differ materially from those anticipated in our forward-looking statements. Factors that could cause such differences include: changes in world commodity markets, equity markets, costs and supply of materials relevant to the mining industry, change in government and changes to regulations affecting the mining industry. Forward-looking statements in this release include statements regarding future exploration programs, operation plans, geological interpretations, mineral tenure issues and mineral recovery processes. Although we believe the expectations reflected in our forward-looking statements are reasonable, results may vary, and we cannot guarantee future results, levels of activity, performance or achievements.
Neither the TSX Venture Exchange nor its Regulation Service Provider (as that term is defined in the policies of the TSX Venture Exchange) accepts responsibility for the adequacy or accuracy of this release.
/NOT FOR DISTRIBUTION TO UNITED STATES WIRE SERVICES OR DISSEMINATION IN THE UNITED STATES/

To view the source version of this press release, please visit https://www.newsfilecorp.com/release/76043
NOT FOR DISTRIBUTION TO U.S. NEWS WIRE SERVICES OR DISSEMINATION IN THE UNITED STATES
VANCOUVER British Columbia, March 03, 2021 (GLOBE NEWSWIRE) — AZINCOURT ENERGY CORP. (“Azincourt” or the “Company”) (TSX.V: AAZ), is pleased to announce that it has completed the final tranche of its non-brokered private placement and has issued 65,080,000 non-flow-through units (each, an “NFT Unit”) at a price of $0.05 per NFT Unit for gross proceeds of $3,254,000. The gross proceeds to the Company of both Tranche 1 and Tranche 2 totaled $4,241,500. A single institutional investor accounted for $1,850,000 (37,000,000 units) of the final tranche. In addition, the Company has issued 2,000,000 flow-through units (each, a “FT Unit”) at a price of $0.05 per FT Unit for an additional $100,000.
Each NFT Unit and FT Unit consists of one common share of the Company and one common share purchase warrant (each, a “Warrant”). Each warrant entitles the holder to acquire an additional common share at a price of $0.07 until March 3, 2026.
The proceeds from the private placement will be applied to the Company's exploration projects, and for general working capital purposes. The gross proceeds from the FT Units will be used to finance Canadian exploration expenses (within the meaning of the Income Tax Act (Canada)) which shall qualify as flow-through mining expenditures, for the purposes of the Income Tax Act (Canada). It is anticipated that expenditures will largely be focused on continuation of the Company's continuing diamond drilling program at the East Preston uranium project, located in the western Athabasca basin, Saskatchewan, Canada.
All securities issued in connection with the private placement are subject to a statutory hold period in accordance with applicable securities laws until July 4, 2021. In connection with completion of the final tranche of the private placement, the Company has paid $80,800 and issued 4,796,000 Warrants and 3,180,000 finder’s shares to certain arms-length third-parties who assisted in introducing subscribers to the Company.
About Azincourt Energy Corp.
Azincourt Energy is a Canadian-based resource company specializing in the strategic acquisition, exploration, and development of alternative energy/fuel projects, including uranium, lithium, and other critical clean energy elements. The Company is currently active at its joint venture East Preston uranium project in the Athabasca Basin, Saskatchewan, Canada, and the Escalera Group uranium-lithium project located on the Picotani Plateau in southeastern Peru.
ON BEHALF OF THE BOARD OF AZINCOURT ENERGY CORP.
“Alex Klenman”
Alex Klenman, President & CEO
Neither the TSX Venture Exchange nor its regulation services provider (as that term is defined in the policies of the TSX Venture Exchange) accepts responsibility for the adequacy or accuracy of this release.
This press release includes “forward-looking statements”, including forecasts, estimates, expectations and objectives for future operations that are subject to a number of assumptions, risks and uncertainties, many of which are beyond the control of Azincourt. Investors are cautioned that any such statements are not guarantees of future performance and that actual results or developments may differ materially from those projected in the forward-looking statements. Such forward-looking information represents management’s best judgment based on information currently available. No forward-looking statement can be guaranteed, and actual future results may vary materially.
For further information please contact:
Alex Klenman, President & CEO
Tel: 604-638-8063
info@azincourtenergy.com
Azincourt Energy Corp.
1430 – 800 West Pender Street
Vancouver, BC V6C 2V6
www.azincourtenergy.com
Does the March share price for Paladin Energy Limited (ASX:PDN) reflect what it's really worth? Today, we will estimate the stock's intrinsic value by taking the expected future cash flows and discounting them to their present value. Our analysis will employ the Discounted Cash Flow (DCF) model. Models like these may appear beyond the comprehension of a lay person, but they're fairly easy to follow.
We generally believe that a company's value is the present value of all of the cash it will generate in the future. However, a DCF is just one valuation metric among many, and it is not without flaws. Anyone interested in learning a bit more about intrinsic value should have a read of the Simply Wall St analysis model.
View our latest analysis for Paladin Energy
Crunching the numbers
We are going to use a two-stage DCF model, which, as the name states, takes into account two stages of growth. The first stage is generally a higher growth period which levels off heading towards the terminal value, captured in the second 'steady growth' period. To begin with, we have to get estimates of the next ten years of cash flows. Where possible we use analyst estimates, but when these aren't available we extrapolate the previous free cash flow (FCF) from the last estimate or reported value. We assume companies with shrinking free cash flow will slow their rate of shrinkage, and that companies with growing free cash flow will see their growth rate slow, over this period. We do this to reflect that growth tends to slow more in the early years than it does in later years.
Generally we assume that a dollar today is more valuable than a dollar in the future, so we need to discount the sum of these future cash flows to arrive at a present value estimate:
10-year free cash flow (FCF) forecast
|
2021 |
2022 |
2023 |
2024 |
2025 |
2026 |
2027 |
2028 |
2029 |
2030 |
|
|
Levered FCF ($, Millions) |
-US$34.0m |
-US$65.0m |
US$92.0m |
US$129.0m |
US$134.0m |
US$138.1m |
US$141.9m |
US$145.5m |
US$148.9m |
US$152.3m |
|
Growth Rate Estimate Source |
Analyst x1 |
Analyst x1 |
Analyst x1 |
Analyst x1 |
Analyst x1 |
Est @ 3.05% |
Est @ 2.74% |
Est @ 2.52% |
Est @ 2.37% |
Est @ 2.26% |
|
Present Value ($, Millions) Discounted @ 9.3% |
-US$31.1 |
-US$54.4 |
US$70.4 |
US$90.3 |
US$85.8 |
US$80.9 |
US$76.1 |
US$71.3 |
US$66.8 |
US$62.5 |
("Est" = FCF growth rate estimated by Simply Wall St)
Present Value of 10-year Cash Flow (PVCF) = US$518m
After calculating the present value of future cash flows in the initial 10-year period, we need to calculate the Terminal Value, which accounts for all future cash flows beyond the first stage. For a number of reasons a very conservative growth rate is used that cannot exceed that of a country's GDP growth. In this case we have used the 5-year average of the 10-year government bond yield (2.0%) to estimate future growth. In the same way as with the 10-year 'growth' period, we discount future cash flows to today's value, using a cost of equity of 9.3%.
Terminal Value (TV)= FCF2030 × (1 + g) ÷ (r – g) = US$152m× (1 + 2.0%) ÷ (9.3%– 2.0%) = US$2.1b
Present Value of Terminal Value (PVTV)= TV / (1 + r)10= US$2.1b÷ ( 1 + 9.3%)10= US$873m
The total value is the sum of cash flows for the next ten years plus the discounted terminal value, which results in the Total Equity Value, which in this case is US$1.4b. In the final step we divide the equity value by the number of shares outstanding. Relative to the current share price of AU$0.5, the company appears quite good value at a 47% discount to where the stock price trades currently. Valuations are imprecise instruments though, rather like a telescope – move a few degrees and end up in a different galaxy. Do keep this in mind.

The assumptions
Now the most important inputs to a discounted cash flow are the discount rate, and of course, the actual cash flows. Part of investing is coming up with your own evaluation of a company's future performance, so try the calculation yourself and check your own assumptions. The DCF also does not consider the possible cyclicality of an industry, or a company's future capital requirements, so it does not give a full picture of a company's potential performance. Given that we are looking at Paladin Energy as potential shareholders, the cost of equity is used as the discount rate, rather than the cost of capital (or weighted average cost of capital, WACC) which accounts for debt. In this calculation we've used 9.3%, which is based on a levered beta of 1.397. Beta is a measure of a stock's volatility, compared to the market as a whole. We get our beta from the industry average beta of globally comparable companies, with an imposed limit between 0.8 and 2.0, which is a reasonable range for a stable business.
Moving On:
Valuation is only one side of the coin in terms of building your investment thesis, and it shouldn't be the only metric you look at when researching a company. It's not possible to obtain a foolproof valuation with a DCF model. Rather it should be seen as a guide to "what assumptions need to be true for this stock to be under/overvalued?" For example, changes in the company's cost of equity or the risk free rate can significantly impact the valuation. Why is the intrinsic value higher than the current share price? For Paladin Energy, we've compiled three additional factors you should explore:
-
Risks: As an example, we've found 3 warning signs for Paladin Energy (2 shouldn't be ignored!) that you need to consider before investing here.
-
Future Earnings: How does PDN's growth rate compare to its peers and the wider market? Dig deeper into the analyst consensus number for the upcoming years by interacting with our free analyst growth expectation chart.
-
Other High Quality Alternatives: Do you like a good all-rounder? Explore our interactive list of high quality stocks to get an idea of what else is out there you may be missing!
PS. Simply Wall St updates its DCF calculation for every Australian stock every day, so if you want to find the intrinsic value of any other stock just search here.
This article by Simply Wall St is general in nature. It does not constitute a recommendation to buy or sell any stock, and does not take account of your objectives, or your financial situation. We aim to bring you long-term focused analysis driven by fundamental data. Note that our analysis may not factor in the latest price-sensitive company announcements or qualitative material. Simply Wall St has no position in any stocks mentioned.
Have feedback on this article? Concerned about the content? Get in touch with us directly. Alternatively, email editorial-team (at) simplywallst.com.
If you would like to receive our free newsletter via email, simply enter your email address below & click subscribe.
 Follow us on Twitter
 Become our facebook fan
CONNECT WITH US
Tweets
Tweet with hash tag #miningfeeds or @miningfeeds and your tweets will be displayed across this site.
MOST ACTIVE MINING STOCKS
Daily Gainers
 CMC Metals Ltd. CMC Metals Ltd. |
CMB.V | +900.00% |
 Eden Energy Ltd Eden Energy Ltd |
EDE.AX | +200.00% |
| GoviEx Uranium Inc. |
GXU.V | +42.86% |
| Eagle Nickel Ltd. |
ENL.AX | +41.67% |
| Citigold Corp. Limited |
CTO.AX | +33.33% |
| Mount Burgess Mining NL |
MTB.AX | +33.33% |
| Exalt Resources Limited |
ERD.AX | +31.94% |
| Casa Minerals Inc. |
CASA.V | +30.00% |
| Cariboo Rose Resources Ltd |
CRB.V | +28.57% |
| Belmont Resources Inc. |
BEA.V | +28.57% |