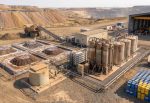
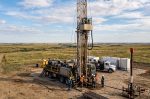
We often see insiders buying up shares in companies that perform well over the long term. On the other hand, we'd be remiss not to mention that insider sales have been known to precede tough periods for a business. So shareholders might well want to know whether insiders have been buying or selling shares in Great Northern Minerals Limited (ASX:GPP).
What Is Insider Buying?
It is perfectly legal for company insiders, including board members, to buy and sell stock in a company. However, rules govern insider transactions, and certain disclosures are required.
We would never suggest that investors should base their decisions solely on what the directors of a company have been doing. But logic dictates you should pay some attention to whether insiders are buying or selling shares. As Peter Lynch said, 'insiders might sell their shares for any number of reasons, but they buy them for only one: they think the price will rise'.
See our latest analysis for Great Northern Minerals
Great Northern Minerals Insider Transactions Over The Last Year
Over the last year, we can see that the biggest insider purchase was by insider Ernst Kohler for AU$162k worth of shares, at about AU$0.0079 per share. Even though the purchase was made at a significantly lower price than the recent price (AU$0.02), we still think insider buying is a positive. Because the shares were purchased at a lower price, this particular buy doesn't tell us much about how insiders feel about the current share price.
In the last twelve months insiders purchased 28.34m shares for AU$230k. On the other hand they divested 1.55m shares, for AU$9.3k. In total, Great Northern Minerals insiders bought more than they sold over the last year. You can see the insider transactions (by companies and individuals) over the last year depicted in the chart below. By clicking on the graph below, you can see the precise details of each insider transaction!

There are plenty of other companies that have insiders buying up shares. You probably do not want to miss this free list of growing companies that insiders are buying.
Insider Ownership
I like to look at how many shares insiders own in a company, to help inform my view of how aligned they are with insiders. Usually, the higher the insider ownership, the more likely it is that insiders will be incentivised to build the company for the long term. Insiders own 16% of Great Northern Minerals shares, worth about AU$2.9m. We've certainly seen higher levels of insider ownership elsewhere, but these holdings are enough to suggest alignment between insiders and the other shareholders.
What Might The Insider Transactions At Great Northern Minerals Tell Us?
It doesn't really mean much that no insider has traded Great Northern Minerals shares in the last quarter. On a brighter note, the transactions over the last year are encouraging. Insiders do have a stake in Great Northern Minerals and their transactions don't cause us concern. So these insider transactions can help us build a thesis about the stock, but it's also worthwhile knowing the risks facing this company. For instance, we've identified 6 warning signs for Great Northern Minerals (4 are concerning) you should be aware of.
But note: Great Northern Minerals may not be the best stock to buy. So take a peek at this free list of interesting companies with high ROE and low debt.
For the purposes of this article, insiders are those individuals who report their transactions to the relevant regulatory body. We currently account for open market transactions and private dispositions, but not derivative transactions.
This article by Simply Wall St is general in nature. It does not constitute a recommendation to buy or sell any stock, and does not take account of your objectives, or your financial situation. We aim to bring you long-term focused analysis driven by fundamental data. Note that our analysis may not factor in the latest price-sensitive company announcements or qualitative material. Simply Wall St has no position in any stocks mentioned.
Have feedback on this article? Concerned about the content? Get in touch with us directly. Alternatively, email editorial-team@simplywallst.com.

Even when a business is losing money, it's possible for shareholders to make money if they buy a good business at the right price. For example, although Amazon.com made losses for many years after listing, if you had bought and held the shares since 1999, you would have made a fortune. But while the successes are well known, investors should not ignore the very many unprofitable companies that simply burn through all their cash and collapse.
Given this risk, we thought we'd take a look at whether Prairie Mining (ASX:PDZ) shareholders should be worried about its cash burn. In this article, we define cash burn as its annual (negative) free cash flow, which is the amount of money a company spends each year to fund its growth. We'll start by comparing its cash burn with its cash reserves in order to calculate its cash runway.
Check out our latest analysis for Prairie Mining
Does Prairie Mining Have A Long Cash Runway?
You can calculate a company's cash runway by dividing the amount of cash it has by the rate at which it is spending that cash. In June 2020, Prairie Mining had AU$2.6m in cash, and was debt-free. Importantly, its cash burn was AU$3.8m over the trailing twelve months. That means it had a cash runway of around 8 months as of June 2020. To be frank, this kind of short runway puts us on edge, as it indicates the company must reduce its cash burn significantly, or else raise cash imminently. Depicted below, you can see how its cash holdings have changed over time.

How Is Prairie Mining's Cash Burn Changing Over Time?
Whilst it's great to see that Prairie Mining has already begun generating revenue from operations, last year it only produced AU$457k, so we don't think it is generating significant revenue, at this point. Therefore, for the purposes of this analysis we'll focus on how the cash burn is tracking. It's possible that the 13% reduction in cash burn over the last year is evidence of management tightening their belts as cash reserves deplete. Admittedly, we're a bit cautious of Prairie Mining due to its lack of significant operating revenues. We prefer most of the stocks on this list of stocks that analysts expect to grow.
How Easily Can Prairie Mining Raise Cash?
While Prairie Mining is showing a solid reduction in its cash burn, it's still worth considering how easily it could raise more cash, even just to fuel faster growth. Generally speaking, a listed business can raise new cash through issuing shares or taking on debt. One of the main advantages held by publicly listed companies is that they can sell shares to investors to raise cash and fund growth. By looking at a company's cash burn relative to its market capitalisation, we gain insight on how much shareholders would be diluted if the company needed to raise enough cash to cover another year's cash burn.
Since it has a market capitalisation of AU$53m, Prairie Mining's AU$3.8m in cash burn equates to about 7.2% of its market value. That's a low proportion, so we figure the company would be able to raise more cash to fund growth, with a little dilution, or even to simply borrow some money.
How Risky Is Prairie Mining's Cash Burn Situation?
Even though its cash runway makes us a little nervous, we are compelled to mention that we thought Prairie Mining's cash burn relative to its market cap was relatively promising. Even though we don't think it has a problem with its cash burn, the analysis we've done in this article does suggest that shareholders should give some careful thought to the potential cost of raising more money in the future. On another note, Prairie Mining has 5 warning signs (and 2 which don't sit too well with us) we think you should know about.
Of course, you might find a fantastic investment by looking elsewhere. So take a peek at this free list of interesting companies, and this list of stocks growth stocks (according to analyst forecasts)
This article by Simply Wall St is general in nature. It does not constitute a recommendation to buy or sell any stock, and does not take account of your objectives, or your financial situation. We aim to bring you long-term focused analysis driven by fundamental data. Note that our analysis may not factor in the latest price-sensitive company announcements or qualitative material. Simply Wall St has no position in any stocks mentioned.
Have feedback on this article? Concerned about the content? Get in touch with us directly. Alternatively, email editorial-team@simplywallst.com.
Rebecca Holland-Kennedy has been the CEO of PepinNini Minerals Limited (ASX:PNN) since 2013, and this article will examine the executive's compensation with respect to the overall performance of the company. This analysis will also assess whether PepinNini Minerals pays its CEO appropriately, considering recent earnings growth and total shareholder returns.
Check out our latest analysis for PepinNini Minerals
How Does Total Compensation For Rebecca Holland-Kennedy Compare With Other Companies In The Industry?
According to our data, PepinNini Minerals Limited has a market capitalization of AU$2.9m, and paid its CEO total annual compensation worth AU$196k over the year to June 2020. This means that the compensation hasn't changed much from last year. In particular, the salary of AU$174.8k, makes up a huge portion of the total compensation being paid to the CEO.
For comparison, other companies in the industry with market capitalizations below AU$277m, reported a median total CEO compensation of AU$309k. This suggests that Rebecca Holland-Kennedy is paid below the industry median. Furthermore, Rebecca Holland-Kennedy directly owns AU$317k worth of shares in the company.
|
Component |
2020 |
2019 |
Proportion (2020) |
|
Salary |
AU$175k |
AU$179k |
89% |
|
Other |
AU$21k |
AU$17k |
11% |
|
Total Compensation |
AU$196k |
AU$196k |
100% |
On an industry level, around 70% of total compensation represents salary and 30% is other remuneration. PepinNini Minerals pays out 89% of remuneration in the form of a salary, significantly higher than the industry average. If total compensation veers towards salary, it suggests that the variable portion – which is generally tied to performance, is lower.

PepinNini Minerals Limited's Growth
PepinNini Minerals Limited's earnings per share (EPS) grew 40% per year over the last three years. In the last year, its revenue is up 39%.
Overall this is a positive result for shareholders, showing that the company has improved in recent years. Most shareholders would be pleased to see strong revenue growth combined with EPS growth. This combo suggests a fast growing business. We don't have analyst forecasts, but you could get a better understanding of its growth by checking out this more detailed historical graph of earnings, revenue and cash flow.
Has PepinNini Minerals Limited Been A Good Investment?
Since shareholders would have lost about 87% over three years, some PepinNini Minerals Limited investors would surely be feeling negative emotions. So shareholders would probably want the company to be lessto generous with CEO compensation.
In Summary…
As previously discussed, Rebecca is compensated less than what is normal for CEOs of companies of similar size, and which belong to the same industry. However, the EPS growth over three years is certainly impressive. Considering EPS are on the up, we would say Rebecca is compensated fairly. But we believe shareholders would want to see healthier returns before the CEO gets a raise.
CEO pay is simply one of the many factors that need to be considered while examining business performance. We did our research and identified 4 warning signs (and 2 which don't sit too well with us) in PepinNini Minerals we think you should know about.
Of course, you might find a fantastic investment by looking at a different set of stocks. So take a peek at this free list of interesting companies.
This article by Simply Wall St is general in nature. It does not constitute a recommendation to buy or sell any stock, and does not take account of your objectives, or your financial situation. We aim to bring you long-term focused analysis driven by fundamental data. Note that our analysis may not factor in the latest price-sensitive company announcements or qualitative material. Simply Wall St has no position in any stocks mentioned.
Have feedback on this article? Concerned about the content? Get in touch with us directly. Alternatively, email editorial-team@simplywallst.com.

Buying shares in the best businesses can build meaningful wealth for you and your family. And we've seen some truly amazing gains over the years. Don't believe it? Then look at the Abcourt Mines Inc. (CVE:ABI) share price. It's 529% higher than it was five years ago. If that doesn't get you thinking about long term investing, we don't know what will. On top of that, the share price is up 132% in about a quarter.
It really delights us to see such great share price performance for investors.
See our latest analysis for Abcourt Mines
Abcourt Mines wasn't profitable in the last twelve months, it is unlikely we'll see a strong correlation between its share price and its earnings per share (EPS). Arguably revenue is our next best option. Generally speaking, companies without profits are expected to grow revenue every year, and at a good clip. As you can imagine, fast revenue growth, when maintained, often leads to fast profit growth.
In the last 5 years Abcourt Mines saw its revenue grow at 34% per year. Even measured against other revenue-focussed companies, that's a good result. Arguably, this is well and truly reflected in the strong share price gain of 44%(per year) over the same period. Despite the strong run, top performers like Abcourt Mines have been known to go on winning for decades. On the face of it, this looks lke a good opportunity, although we note sentiment seems very positive already.
The company's revenue and earnings (over time) are depicted in the image below (click to see the exact numbers).

Balance sheet strength is crucial. It might be well worthwhile taking a look at our free report on how its financial position has changed over time.
A Different Perspective
It's good to see that Abcourt Mines has rewarded shareholders with a total shareholder return of 175% in the last twelve months. Since the one-year TSR is better than the five-year TSR (the latter coming in at 44% per year), it would seem that the stock's performance has improved in recent times. Someone with an optimistic perspective could view the recent improvement in TSR as indicating that the business itself is getting better with time. I find it very interesting to look at share price over the long term as a proxy for business performance. But to truly gain insight, we need to consider other information, too. Take risks, for example – Abcourt Mines has 2 warning signs we think you should be aware of.
If you are like me, then you will not want to miss this free list of growing companies that insiders are buying.
Please note, the market returns quoted in this article reflect the market weighted average returns of stocks that currently trade on CA exchanges.
This article by Simply Wall St is general in nature. It does not constitute a recommendation to buy or sell any stock, and does not take account of your objectives, or your financial situation. We aim to bring you long-term focused analysis driven by fundamental data. Note that our analysis may not factor in the latest price-sensitive company announcements or qualitative material. Simply Wall St has no position in any stocks mentioned.
Have feedback on this article? Concerned about the content? Get in touch with us directly. Alternatively, email editorial-team@simplywallst.com.
If you would like to receive our free newsletter via email, simply enter your email address below & click subscribe.
 Follow us on Twitter
 Become our facebook fan
CONNECT WITH US
Tweets
Tweet with hash tag #miningfeeds or @miningfeeds and your tweets will be displayed across this site.
MOST ACTIVE MINING STOCKS
Daily Gainers
 Midlands Minerals Corp. Midlands Minerals Corp. |
MEX.V | +66.88% |
| GoviEx Uranium Inc. |
GXU.V | +42.86% |
 Mount Burgess Mining NL Mount Burgess Mining NL |
MTB.AX | +33.33% |
| Casa Minerals Inc. |
CASA.V | +30.00% |
| International Lithium Corp. |
ILC.V | +25.00% |
| Poseidon Nickel Limited |
POS.AX | +25.00% |
| Richmond Minerals Inc. |
RMD.V | +23.53% |
| Encounter Resources Ltd. |
ENR.AX | +20.00% |
| Aruma Resources Limited |
AAJ.AX | +20.00% |
| Avalon Rare Metals Inc. |
AVL.TO | +19.85% |