Toronto, Ontario–(Newsfile Corp. – December 8, 2025) – Olive Resource Capital Inc. (TSXV: OC) ("Olive" or the "Company") is pleased to provide investors an update on its investments for the period ending November 30, 2025.
Table 1: Olive's Investment Portfolio
| Name | Ticker | Sector | Category | (Audited)Value Dec 31, 2024 | (Unaudited)Value Sep 30, 2025(1) | (Unaudited)Value Nov 30, 2025(1) |
| Omai Gold Mines Corp.(2) | OMG.v | Precious Metals | Public Equity | $456,720 | $3,379,050 | $3,253,900 |
| Black Sheep Ventures Inc. | Private | Real Estate | Private Equity & Conv. Debenture | $1,265,936 | $1,265,936 | $1,265,936 |
| Sterling Metals Corp. (inc. Warrants) | SAG.c | Base Metals | Public Equity | $85,906 | $1,625,864 | $1,252,706 |
| Arizona Sonoran Copper Co. | ASCU | Base Metals | Public Equity | $255,780 | $581,400 | $748,600 |
| Troilus Gold Corporation (inc. Warrants) | TLG | Precious Metals | Public Equity | $190,800 | $610,680 | $738,840 |
| Bravo Mining Corp. | BRVO.v | Precious Metals | Public Equity | $169,100 | $477,500 | $530,400 |
| Aurion Resources Ltd. | AU.v | Precious Metals | Public Equity | $222,075 | $458,280 | $446,220 |
| Sailfish Royalty Corp. | FISH.v | Precious Metals | Public Equity | $166,888 | $435,402 | $408,358 |
| Aquitaine Metals Corp. | Private | Precious Metals | Private Equity | – | $323,190 | $324,536 |
| Public Equity Liquid Investments and Working Capital (3) | $1,417,143 | $2,755,927 | $2,473,384 | |||
| Other Public Equity Fundamental Investments Incl. Warrants (4) | $1,378,797 | $1,691,263 | $2,161,914 | |||
| Other Private Equity, Loans, & Convertible Debenture Investments | $809,979 | $747,795 | $929,548 | |||
| Total Value | $6,419,124 | $14,352,286(5) | $14,534,343(5) | |||
Samuel Pelaez, the Company's President, CEO, CIO, and Director stated: "November was a strong month for the commodity complex. Gold and copper rose strongly, with the equities outperforming the commodity. In oil, despite negative sentiment for the commodity, the equities posted strong positive performance. With strong global liquidity continuing, and the weak seasonal Fall period coming to an end, at Olive we were net buyer of equities for the month. We are looking ahead to the first months of the new year, which are historically associated with strong performance for the commodity complex."
Derek Macpherson, the Company's Executive Chairman stated: "With copper and gold rallying, Olive's portfolio rallied, erasing the small losses from October and moving Olive's investment performance into positive territory for Q4 2025 despite a challenging October. Olive is now up 126% on its investments in 2025."
Normal Course Issuer Bid ("NCIB")
As of the date of this release, the Company holds 1,000,000 common shares in treasury pending cancellation.
As of the date of this release Olive Resource Capital Inc. has 106,144,709 common shares outstanding.
About Olive Resource Capital Inc.:
Olive is a resource-focused merchant bank and investment company with a portfolio of publicly listed and private securities. The Company's assets consist primarily of investments in natural resource companies in all stages of development.
For further information, please contact:
Derek Macpherson, Executive Chairman at derek@olive-resource.com or by phone at (416)294-6713 or Samuel Pelaez, President, CEO & CIO at sam@olive-resource.com or by phone at (202)677-8513. Olive's website is located at www.olive-resource.com.
Neither the TSX Venture Exchange Inc. nor its Regulation Services Provider (as that term is defined in the policies of the TSX Venture Exchange Inc.) accepts responsibility for the adequacy or accuracy of this release. The TSX Venture Exchange Inc. has in no way approved nor disapproved the information contained herein.
Cautionary Note Regarding Forward-Looking Statements: This press release contains "forward-looking information" within the meaning of applicable Canadian securities laws. Any statements that express or involve discussions with respect to predictions, expectations, beliefs, plans, projections, objectives, assumptions or future events or performance (often, but not always, identified by words or phrases such as "believes", "anticipates", "expects", "is expected", "scheduled", "estimates", "pending", "intends", "plans", "forecasts", "targets", or "hopes", or variations of such words and phrases or statements that certain actions, events or results "may", "could", "would", "will", "should", "might", "will be taken", or "occur" and similar expressions) are not statements of historical fact and may be forward-looking statements.
This news release includes forward-looking statements that are subject to risks and uncertainties. Forward-looking statements involve known and unknown risks, uncertainties, and other factors that could cause the actual results of Olive to be materially different from the historical results or from any future results expressed or implied by such forward-looking statements. All statements contained in this news release, other than statements of historical fact, are to be considered forward-looking, including, without limitation, statements concerning Olive's intended future disclosure practices. Although Olive believes the expectations expressed in such forward-looking statements are based on reasonable assumptions, such statements are not guarantees of future performance and actual results or developments may differ materially from those in the forward-looking statements. Factors that could cause actual results to differ materially from such forward-looking information include, but are not limited to: past success or achievement does not guarantee future success; negative investment performance; downward market fluctuations; downward fluctuations in commodity prices and changes in the prices of commodities in general; uncertainties relating to the availability and costs of financing needed in the future; interest rate and exchange rate fluctuations; changes in economic and political conditions that could negatively affect certain commodity prices; and those risks set out in the Company's public documents filed on SEDAR+. Accordingly, readers should not place undue reliance on forward-looking information. Olive does not undertake to update any forward-looking information except in accordance with applicable securities laws.
This commentary is provided for general informational purposes only and does not constitute financial, investment, tax, legal or accounting advice nor does it constitute an offer or solicitation to buy or sell any securities referred to. The information provided in this recording has been obtained from sources believed to be reliable and is believed to be accurate at the time of publishing but we do not represent that it is accurate or complete and it should not be relied upon as such.
To view the source version of this press release, please visit https://www.newsfilecorp.com/release/277259
The Australian market has experienced a week of fluctuating fortunes, with early gains often retracting by afternoon as investors react to broader economic signals and specific corporate developments. In such a dynamic environment, identifying stocks with strong fundamentals and unique growth prospects can be particularly rewarding; this article highlights three lesser-known Australian companies that may offer promising opportunities for discerning investors.
Top 10 Undiscovered Gems With Strong Fundamentals In Australia
| Name | Debt To Equity | Revenue Growth | Earnings Growth | Health Rating |
|---|---|---|---|---|
| Fiducian Group | NA | 10.00% | 9.57% | ★★★★★★ |
| Joyce | NA | 9.93% | 17.54% | ★★★★★★ |
| Hearts and Minds Investments | NA | 56.27% | 59.19% | ★★★★★★ |
| Spheria Emerging Companies | NA | -1.31% | 0.28% | ★★★★★★ |
| Euroz Hartleys Group | NA | 1.82% | -25.32% | ★★★★★★ |
| Focus Minerals | NA | 75.35% | 51.34% | ★★★★★★ |
| Energy World | NA | -47.50% | -44.86% | ★★★★★☆ |
| Zimplats Holdings | 5.44% | -9.79% | -42.03% | ★★★★★☆ |
| Australian United Investment | 1.90% | 5.23% | 4.56% | ★★★★☆☆ |
| Reef Casino Trust | 19.84% | 6.96% | 10.88% | ★★★★☆☆ |
Here’s a peek at a few of the choices from the screener.
Simply Wall St Value Rating: ★★★★★★
Overview: Australian Ethical Investment Ltd is a publicly owned investment manager with a market cap of A$586.38 million, focusing on ethical and sustainable investment strategies.
Operations: Australian Ethical Investment generates revenue primarily from its funds management segment, which amounted to A$119.38 million.
Australian Ethical Investment, a notable player in the ethical investment space, has shown impressive growth with earnings surging 75% over the past year. This performance surpasses the Capital Markets industry average of 12.7%, highlighting its robust position. The company is debt-free, maintaining this status for five years, which underscores financial prudence and stability. Free cash flow remains positive at A$26 million as of June 2025, indicating strong operational efficiency. Looking ahead, earnings are projected to increase by 18% annually, suggesting continued momentum in an industry increasingly focused on sustainable investing practices.
ASX:AEF Earnings and Revenue Growth as at Dec 2025Cedar Woods Properties
Simply Wall St Value Rating: ★★★★★★
Overview: Cedar Woods Properties Limited is an Australian company engaged in property development and investment, with a market cap of A$689.11 million.
Operations: Cedar Woods Properties generates revenue primarily from its property development and investment activities, amounting to A$465.94 million. The company’s financial performance is significantly influenced by its operational costs and the efficiency of its projects, impacting its overall profitability.
Cedar Woods Properties, a dynamic player in the Australian property market, is making waves with its diverse offerings and strategic initiatives. With a price-to-earnings ratio of 14.3x, it trades below the national average of 21.7x, suggesting good value relative to peers. Over the past five years, earnings have grown at an impressive 12.1% annually while reducing its debt-to-equity ratio from 38.6% to 27.6%. The company has high-quality earnings and well-covered interest payments with EBIT covering them by 7.2 times, indicating financial strength despite recent insider selling activity that might raise eyebrows among investors.
ASX:CWP Earnings and Revenue Growth as at Dec 2025IVE Group
Simply Wall St Value Rating: ★★★★★☆
Overview: IVE Group Limited, along with its subsidiaries, operates in the marketing sector across Australia and has a market capitalization of A$441.09 million.
Operations: IVE Group generates revenue primarily from its advertising segment, amounting to A$959.25 million.
IVE Group, a notable player in the Australian print and marketing sector, has shown robust financial health with earnings growing by 69% over the past year, significantly outperforming the media industry. The company’s debt to equity ratio improved from 105% to 75% over five years, reflecting better financial management. Trading at a substantial discount of 74% below its estimated fair value suggests potential for investors seeking undervalued opportunities. Despite high net debt to equity at 52%, interest payments are well covered by EBIT at 5.1 times coverage, indicating strong operational efficiency and potential for continued profitability.
- Click to explore a detailed breakdown of our findings in IVE Group’s health report.
-
Review our historical performance report to gain insights into IVE Group’s’s past performance.
ASX:IGL Earnings and Revenue Growth as at Dec 2025Seize The Opportunity
- Embark on your investment journey to our 58 ASX Undiscovered Gems With Strong Fundamentals selection here.
- Invested in any of these stocks? Simplify your portfolio management with Simply Wall St and stay ahead with our alerts for any critical updates on your stocks.
- Elevate your portfolio with Simply Wall St, the ultimate app for investors seeking global market coverage.
Seeking Other Investments?
- Explore high-performing small cap companies that haven’t yet garnered significant analyst attention.
- Fuel your portfolio with companies showing strong growth potential, backed by optimistic outlooks both from analysts and management.
- Find companies with promising cash flow potential yet trading below their fair value.
This article by Simply Wall St is general in nature. We provide commentary based on historical data
and analyst forecasts only using an unbiased methodology and our articles are not intended to be financial advice. It does not constitute a recommendation to buy or sell any stock, and does not take account of your objectives, or your
financial situation. We aim to bring you long-term focused analysis driven by fundamental data.
Note that our analysis may not factor in the latest price-sensitive company announcements or qualitative material.
Simply Wall St has no position in any stocks mentioned.
Companies discussed in this article include ASX:AEF ASX:CWP and ASX:IGL.
Have feedback on this article? Concerned about the content? Get in touch with us directly. Alternatively, email editorial-team@simplywallst.com
We came across a bullish thesis on FMC Corporation on DeepValue Capital’s Substack. In this article, we will summarize the bulls’ thesis on FMC. FMC Corporation's share was trading at $13.84 as of December 1st. FMC’s trailing and forward P/E were 30.22 and 5.92 respectively according to Yahoo Finance.
hedgehog94/Shutterstock.com
FMC Corporation (NYSE: FMC) is a global agricultural chemical company specializing in herbicides, fungicides, and insecticides, known for its strong research pipeline and deep intellectual property moat. Following a 75% stock decline from 2022 highs amid a destocking cycle and weaker pricing, the company now trades at historically low valuation levels, presenting a potential turnaround story. FMC’s destocking headwinds appear to be easing as product use on farms has surpassed distributor sales in recent quarters, signaling inventory normalization.
Its innovation-led model—anchored by patented molecules such as Rynaxypyr® and Cyazypyr®—and new products like Fluindapyr, Isoflex™, and Dodhylex™ support a path toward renewed growth, especially as markets like Brazil and Latin America expand. The company is also divesting its low-margin India commercial business to reallocate capital toward higher-return opportunities while establishing a direct-to-grower sales model in Brazil. With biologicals growing over 20% annually and favorable industry tailwinds tied to global food demand, FMC is well-positioned for a cyclical rebound.
Financially, FMC maintains a strong balance sheet with manageable maturities beginning only in 2029 and ample liquidity. Management aims to reduce leverage while sustaining a 7%+ dividend yield. Historical returns on capital have been robust, with a median ROIC near 17%. Risks remain tied to commodity cycles, competitive pressures, and execution of new initiatives, but the destocking recovery, new product launches, and balance sheet strength underpin the upside case. Based on management’s 2027 targets and normalized free cash flow assumptions, fair value estimates suggest potential appreciation toward $75–$80 per share—implying nearly 2.5x upside from current levels.
Previously we covered a bullish thesis on Corteva, Inc. (CTVA) by Business Model Mastery in May 2025, which highlighted the company’s strong patent portfolio, digital ecosystem, and margin-rich biologicals. The company’s stock price has appreciated approximately by 7.66% since our coverage. This is because the thesis played out amid resilient IP-driven growth. The thesis still stands as agricultural innovation remains durable. DeepValue Capital shares a similar view but emphasizes FMC’s turnaround from destocking and innovation-led recovery.
FMC Corporation is not on our list of the 30 Most Popular Stocks Among Hedge Funds. As per our database, 43 hedge fund portfolios held FMC at the end of the second quarter which was 38 in the previous quarter. While we acknowledge the potential of FMC as an investment, we believe certain AI stocks offer greater upside potential and carry less downside risk. If you're looking for an extremely undervalued AI stock that also stands to benefit significantly from Trump-era tariffs and the onshoring trend, see our free report on the best short-term AI stock.
READ NEXT: 30 Stocks That Should Double in 3 Years and 11 Hidden AI Stocks to Buy NOW
Disclosure: None.
Vancouver, British Columbia–(Newsfile Corp. – December 5, 2025) – Sego Resources Inc. (TSXV: SGZ) ("Sego" or "the Company") is pleased to announce that the drilling in the South Gold Zone has been completed. The drill holes are those recommended by SRK Consulting Canada, Figure 1.
Alkalic Porphyry Copper-Gold mineralization that occurs at Miner Mountain encompasses near-surface, disseminated gold mineralization in the South Gold Zone and deeper porphyry structural controlled copper-gold mineralization in the Cuba Zone.
The drill core is now being logged and sampled with first samples ready to ship to the lab.
The South Gold Zone diamond drill holes are now being logged and sampled with first samples ready to ship to AGAT Laboratories Calgary, Alberta
To view an enhanced version of this graphic, please visit:https://images.newsfilecorp.com/files/1056/277056_image1.jpg
Figure 1. Proposed drill holes (green) at the South Gold Zone, gold grade (Au) and intervals of diamond drill holes, the boundary of mineralization (red) and on a geological base map.
To view an enhanced version of this graphic, please visit:https://images.newsfilecorp.com/files/1056/277056_28b8a22df4ae9905_001full.jpg
Copper-Gold Cuba Zone deep hole drilling is now underway. Figure 2
Figure 2. North-northeast long section of the Cuba Zone mineralization; distance between horizontal lines is 150 m.
To view an enhanced version of this graphic, please visit:https://images.newsfilecorp.com/files/1056/277056_6f86bf5004aabbe3_001full.jpg
J Paul Stevenson, CEO, Director
For further information please contact: J. Paul Stevenson, CEO (604) 682-2933 ceo@segoresources.com
About the Project
Sego is 100% owner of the Miner Mountain Project, an alkalic copper-gold porphyry and gold exploration project located near Princeton, British Columbia. The property is 2,056 hectares in size and is 15 km north of the Copper Mountain Mine operated by Hudbay Minerals Inc. Sego has a Memorandum of Understanding with the Upper Similkameen Indian Band on whose Traditional Territory the Miner Mountain Project is situated. Sego has received an Award of Excellence for its reclamation work on the Miner Mountain Project.
Neither the TSX Venture Exchange nor its Regulation Services Provider (as that term is defined in the policies of the TSX Venture Exchange) accepts responsibility for the adequacy or accuracy of this release. No regulatory authority has approved or disapproved the information contained in this news release.
This release includes certain statements that may be deemed "forward-looking statements". All statements in this release, other than statement of historical facts that address future production, reserve potential, exploration drilling, exploitation activities and events or developments that the Company expects re forward-looking statements. Although the Company believes the expectations expressed in such forward-looking statements are based on reasonable assumptions, statements are not guarantees of future performance and actual results or developments may differ materially from the forward-looking statements. Factors that could cause actual results to differ materially from those in forward-looking statements include market prices, exploitation and exploration successes, continued availability of capital and financing, general economic, market or business conditions. Investors are cautioned that any such statements are not guarantees of future performance and those actual results or developments may differ materially from those projected in the forward-looking statements.
To view the source version of this press release, please visit https://www.newsfilecorp.com/release/277056
Let's talk about the popular Sociedad Química y Minera de Chile S.A. (NYSE:SQM). The company's shares received a lot of attention from a substantial price increase on the NYSE over the last few months. The company is now trading at yearly-high levels following the recent surge in its share price. As a large-cap stock with high coverage by analysts, you could assume any recent changes in the company’s outlook is already priced into the stock. However, could the stock still be trading at a relatively cheap price? Let’s take a look at Sociedad Química y Minera de Chile’s outlook and value based on the most recent financial data to see if the opportunity still exists.
What Is Sociedad Química y Minera de Chile Worth?
The stock seems fairly valued at the moment according to our valuation model. It’s trading around 7.1% below our intrinsic value, which means if you buy Sociedad Química y Minera de Chile today, you’d be paying a reasonable price for it. And if you believe the company’s true value is $67.85, then there’s not much of an upside to gain from mispricing. Although, there may be an opportunity to buy in the future. This is because Sociedad Química y Minera de Chile’s beta (a measure of share price volatility) is high, meaning its price movements will be exaggerated relative to the rest of the market. If the market is bearish, the company’s shares will likely fall by more than the rest of the market, providing a prime buying opportunity.
View our latest analysis for Sociedad Química y Minera de Chile
What kind of growth will Sociedad Química y Minera de Chile generate?NYSE:SQM Earnings and Revenue Growth December 4th 2025
Investors looking for growth in their portfolio may want to consider the prospects of a company before buying its shares. Buying a great company with a robust outlook at a cheap price is always a good investment, so let’s also take a look at the company's future expectations. With profit expected to more than double over the next couple of years, the future seems bright for Sociedad Química y Minera de Chile. It looks like higher cash flow is on the cards for the stock, which should feed into a higher share valuation.
What This Means For You
Are you a shareholder? SQM’s optimistic future growth appears to have been factored into the current share price, with shares trading around its fair value. However, there are also other important factors which we haven’t considered today, such as the track record of its management team. Have these factors changed since the last time you looked at the stock? Will you have enough confidence to invest in the company should the price drop below its fair value?
Are you a potential investor? If you’ve been keeping an eye on SQM, now may not be the most advantageous time to buy, given it is trading around its fair value. However, the optimistic prospect is encouraging for the company, which means it’s worth diving deeper into other factors such as the strength of its balance sheet, in order to take advantage of the next price drop.
If you'd like to know more about Sociedad Química y Minera de Chile as a business, it's important to be aware of any risks it's facing. Every company has risks, and we've spotted 2 warning signs for Sociedad Química y Minera de Chile (of which 1 doesn't sit too well with us!) you should know about.
If you are no longer interested in Sociedad Química y Minera de Chile, you can use our free platform to see our list of over 50 other stocks with a high growth potential.
Have feedback on this article? Concerned about the content? Get in touch with us directly. Alternatively, email editorial-team (at) simplywallst.com.This article by Simply Wall St is general in nature. We provide commentary based on historical data and analyst forecasts only using an unbiased methodology and our articles are not intended to be financial advice. It does not constitute a recommendation to buy or sell any stock, and does not take account of your objectives, or your financial situation. We aim to bring you long-term focused analysis driven by fundamental data. Note that our analysis may not factor in the latest price-sensitive company announcements or qualitative material. Simply Wall St has no position in any stocks mentioned.
It has been about a month since the last earnings report for Archer Daniels Midland (ADM). Shares have added about 6.2% in that time frame, outperforming the S&P 500.
Will the recent positive trend continue leading up to its next earnings release, or is ADM due for a pullback? Well, first let's take a quick look at the latest earnings report in order to get a better handle on the recent drivers for Archer Daniels Midland Company before we dive into how investors and analysts have reacted as of late.
ADM Q3 Earnings Beat Estimates, Revenues Increase 2.2% Y/Y
Archer Daniels Midland posted third-quarter 2025 results, wherein the top line fell short of the Zacks Consensus Estimate but increased year over year. Meanwhile, earnings surpassed the Zacks Consensus Estimate but declined from the same period last year.Adjusted earnings of 92 cents per share surpassed the Zacks Consensus Estimate of 89 cents. However, the figure decreased from adjusted earnings of $1.09 per share in the year-ago quarter. On a reported basis, Archer Daniels’ third-quarter earnings were 22 cents per share, up from 4 cents in the year-ago quarter.Revenues gained 2.2% year over year to $20.4 billion, but missed the consensus estimate of $20.7 billion. Segment-wise, revenues for Ag Services & Oilseeds increased 3.5% year over year to $15.6 billion, while Carbohydrate Solutions’ revenues decreased 5.9% year over year to $2.7 billion. Nutrition’s revenues rose 4.6% year over year to $1.92 billion. The Zacks Consensus Estimate for the segments’ revenues was pegged at $15.7 billion, $2.9 billion and $1.9 billion, respectively. Revenues from Other Business are flat at $109 million compared with the figure in the prior-year period.The gross profit decreased 7% year over year to $1.3 billion, while the gross margin stood at 6.2%. Selling, general and administrative expenses declined to $873 million from $905 million in the year-ago quarter.Archer Daniels reported adjusted segmental operating profit of $845 million, down 19% from the year-ago quarter. The company has a trailing four-quarter return on invested capital of 6.7% on an adjusted basis.
ADM’s Segmental Operating Profit
Adjusted operating profit for Ag Services & Oilseeds dropped 21% year over year to $379 million. The Ag Services subsegment’s operating profit rose 78%, driven by higher export activity in North America and improved results in South America. This quarter included $4 million in net positive mark-to-market (MTM) impacts, versus $50 million in net negative impacts a year earlier.The Crushing subsegment’s operating profit plunged 93% year over year on lower margins resulting from muted demand tied to the deferral of U.S. biofuel policy and international trade challenges. There were about $41 million of net positive mark-to-market timing impacts in the quarter against zero of net negative impacts in the year-ago quarter.Refined Products and Other operating profit was down 3% from the prior year, as biodiesel and refining margins were affected by the delayed biofuel policy, weighing on North American demand. The quarter included $8 million in net negative MTM impacts, versus $20 million in the prior-year period. Equity earnings from the company’s investment in Wilmar decreased by approximately 10% from the prior-year quarter.The Carbohydrate Solutions segment posted an operating profit of $336 million in the third quarter of 2025, reflecting a 26% decline from the year-ago period. Operating profit in the Starches & Sweeteners subsegment also fell 36% due to lower global S&S demand, which pressured both volumes and margins. The subsegment also continued to face higher corn costs in EMEA stemming from corn quality issues, further weighing on profitability.Global wheat milling performance remained relatively stable versus the prior-year quarter, though last year’s results had benefited from $47 million in insurance proceeds, amplifying the year-over-year comparison. Vantage Corn Processors posted a $46 million increase in operating profit, supported by strong export flows and elevated pricing amid lower industry inventory levels caused by plant downtime from maintenance programs.The Nutrition segment reported an operating profit of $130 million in the third quarter of 2025, marking a 24% increase from the same period last year. Operating profit in the Human Nutrition subsegment gained 12% year over year. Within this segment, Flavors saw profit growth, driven by higher margins, particularly in North America. The Health & Wellness category also contributed to the increase, benefiting from stronger biotics demand.Meanwhile, the Animal Nutrition subsegment posted an operating profit of $34 million, marking a 79% year-over-year upsurge, fueled by margin expansion from a strategic focus on higher-value product lines and continued portfolio streamlining and cost optimization initiatives.
Archer Daniels’ Other Financials
The company ended the quarter with cash and cash equivalents of $1.24 billion, long-term debt, including current maturities, of $7.6 billion, and shareholders’ equity of $22.5 billion. As of Sept. 30, 2025, ADM generated $5.77 billion in cash from operating activities. It paid out dividends of $743 million during the nine months of 2025. For 2025, based on performance over the first nine months of the year and current expectations regarding the timing of anticipated benefits from favorable biofuel policy developments and the evolution of global trade dynamics, the company has revised its full-year adjusted EPS guidance. Adjusted earnings are now expected to be in the range of $3.25 to $3.50 per share, compared to the previous guidance of approximately $4.00.
How Have Estimates Been Moving Since Then?
In the past month, investors have witnessed a downward trend in estimates revision.
The consensus estimate has shifted -13.16% due to these changes.
VGM Scores
At this time, ADM has a great Growth Score of A, though it is lagging a lot on the Momentum Score front with a D. However, the stock was allocated a score of A on the value side, putting it in the top quintile for value investors.
Overall, the stock has an aggregate VGM Score of A. If you aren't focused on one strategy, this score is the one you should be interested in.
Outlook
Estimates have been broadly trending downward for the stock, and the magnitude of these revisions indicates a downward shift. It's no surprise ADM has a Zacks Rank #4 (Sell). We expect a below average return from the stock in the next few months.
Performance of an Industry Player
ADM belongs to the Zacks Agriculture – Operations industry. Another stock from the same industry, FMC (FMC), has gained 1.8% over the past month. More than a month has passed since the company reported results for the quarter ended September 2025.
FMC reported revenues of $961.3 million in the last reported quarter, representing a year-over-year change of -9.8%. EPS of $0.89 for the same period compares with $0.69 a year ago.
For the current quarter, FMC is expected to post earnings of $1.26 per share, indicating a change of -29.6% from the year-ago quarter. The Zacks Consensus Estimate has changed +2% over the last 30 days.
The overall direction and magnitude of estimate revisions translate into a Zacks Rank #5 (Strong Sell) for FMC. Also, the stock has a VGM Score of D.
Want the latest recommendations from Zacks Investment Research? Today, you can download 7 Best Stocks for the Next 30 Days. Click to get this free report
Archer Daniels Midland Company (ADM) : Free Stock Analysis Report
FMC Corporation (FMC) : Free Stock Analysis Report
This article originally published on Zacks Investment Research (zacks.com).
TORONTO, Dec. 3, 2025 /CNW/ – Bravo Mining Corp. (TSXV: BRVO) (OTCQX: BRVMF), ("Bravo" or the "Company") announces that it has renewed its preliminary short form base shelf prospectus (the "Preliminary Shelf Prospectus") with the securities commissions in each of the provinces of Canada (other than Québec) in order to provide the Company with greater financial flexibility going forward but has not entered into any agreements or arrangements to authorize or offer any Securities (as defined below) at this time.
When made final or effective, the final short form base shelf prospectus (the "Final Shelf Prospectus") would allow Bravo to undertake offerings of common shares, warrants, subscription receipts and units (collectively, the "Securities"), or any combination thereof, up to an aggregate total of CAD$300,000,000 from time to time during the 25-month period that the Final Shelf Prospectus remains effective. The Securities may be offered in amounts, at prices and on terms to be determined at the time of sale and, subject to applicable regulations, may include "at-the-market" transactions, public offerings or strategic investments. The specific terms of any offering of Securities, including the use of proceeds from any offering, will be set forth in one or more shelf prospectus supplement(s) to be filed with applicable securities regulators.
In connection with the Preliminary Shelf Prospectus filing, the Company has filed an independent technical report titled "NI 43-101 Preliminary Economic Assessment, Luanga Project, Pará, Brazil" dated effective July 7, 2025, issued on August 20, 2025 and revised on November 28, 2025 (the "PEA Technical Report"), which report was prepared by Porfirio Cabaleiro Rodriguez (B.Sc Mining Engineering, FAIG), Bernardo Viana (BSc Geology, FAIG), Paulo Roberto Bergmann Moreira (B.Sc Mine Eng, FAusIMM) and Juliano Lima (B.Sc Geology Eng, MAIG) of GE21 Consultoria Mineral Ltda.
The PEA Technical Report replaces the previous technical report with the same title, dated July 7, 2025, issued on August 20, 2025 and filed on SEDAR+ on August 21, 2025 following questions identified during an Ontario Securities Commission staff review in order to clarify that (a) the qualified persons responsible for the PEA Technical Report are Mr. Porfirio Cabaleiro Rodriguez, Mr. Bernardo Viana, Mr. Paulo Roberto Bergmann Moreira and Mr. Juliano Felix de Lima; and (b) Mr. Eduardo Dequech de Carvalho, who is a mining engineer and a MAusIMM, with 7 years of experience in mineral reserve estimation and mine planning, supported Mr. Porfirio Cabaleiro Rodriguez with the preparation of information regarding mining methods, infrastructure, market studies and contracts, and economic analysis.
About Bravo Mining Corp.
Bravo is a Canadian and Brazil-based mineral exploration and development company focused on advancing its PGM+Au+Ni Luanga Project, as well as our copper-gold exploration opportunities in the world-class Carajás Mineral Province, Para State, Brazil.
Bravo is one of the most active explorers in Carajás. The team, comprising of local and international geologists and engineers, has a proven track record of PGM, nickel, and copper discoveries in the region and elsewhere. The individuals in the team have successfully taken a past iron oxide copper gold (IOCG) greenfield project from discovery to development and production in the Carajás.
The Luanga Project is situated on mature freehold farming land and benefits from being located close to operating mines and a mining-experienced workforce, with excellent access and proximity to existing infrastructure, including road, rail, ports, and hydroelectric grid power. Bravo's current Environmental, Social and Governance activities include planting and donating more than 42,000 high-value trees in and around the project area in the past 30 months, while hiring personnel and contracting services locally.
Forward-Looking Statements
Certain statements ("forward-looking statements") in this news release contain forward-looking information concerning the Preliminary Shelf Prospectus and Final Shelf Prospectus filings, the Securities which may become issuable thereunder and the anticipated benefits thereof. Forward-looking statements are subject to a variety of known and unknown risks, uncertainties and other factors which could cause actual events or results to differ from those expressed or implied by the forward-looking statements. Such factors include, but are not limited to, continued capitalization and commercial viability; global economic conditions; competition; and delays in obtaining requisite regulatory and other approvals for the filing of the Final Shelf Prsopectus. Forward-looking statements are based on certain assumptions that management believes are reasonable at the time they are made. In making the forward-looking statements included in this news release, Bravo has applied several material assumptions, including, but not limited to, the assumption that Bravo will be able to raise additional capital as necessary, that the proposed exploration and development activities will proceed as planned, that market fundamentals will result in sustained demand and prices for platinum group metals, gold, copper and nickel and that all requisite regulatory approvals will be obtained in a timely manner. There can be no assurance that forward-looking statements will prove to be accurate and actual results and future events could differ materially from those anticipated in such statements. Bravo expressly disclaims any intention or obligation to update or revise any forward-looking statements whether as a result of new information, future events or otherwise, except as otherwise required by applicable securities legislation.
Neither the TSXV nor its Regulation Services Provider (as that term is defined in the policies of the TSXV) accepts responsibility for the adequacy or accuracy of this Press release.
View original content to download multimedia: http://www.newswire.ca/en/releases/archive/December2025/03/c7123.html
Toronto, Ontario–(Newsfile Corp. – December 3, 2025) – Minnova Corp. (TSXV: MCI) ("Minnova" or the "Company"), is pleased to announce the closing of its previously announced "best efforts" private placement (the "Offering") for aggregate gross proceeds of C$4,820,154 from the sale of (i) 12,900,000 units of the Company (each, a "Unit") at a price of C$0.20 per Unit (the "Unit Price"), and (ii) 9,739,800 flow-through units of the Company (each, a "FT Unit") at a price of C$0.23 per FT Unit. Red Cloud Securities Inc. ("Red Cloud") acted as sole agent and bookrunner under the Offering.
Each Unit consists of one common share of the Company (a "Unit Share") and one common share purchase warrant (each, a "Warrant"). Each FT Unit consists of one common share of the Company (each, a "FT Share") and one Warrant each issued as a "flow-through share" within the meaning of subsection 66(15) of the Income Tax Act (Canada). Each Warrant entitles the holder to purchase one common share of the Company at a price of C$0.30 at any time on or before December 3, 2028.
The Company intends to use the net proceeds from the Offering for the exploration and advancement of the Company's PL Gold Mine Project located in Manitoba as well as for working capital and general corporate purposes, as is more fully described in the Amended Offering Document (as herein defined).
The gross proceeds from the sale of FT Shares will be used by the Company to incur eligible "Canadian exploration expenses" that qualify as "flow-through mining expenditures" as both terms are defined in the Income Tax Act (Canada) (the "Qualifying Expenditures") related to the Company's PL Gold Mine Project on or before December 31, 2026. All Qualifying Expenditures will be renounced in favour of the purchasers of the FT Units effective December 31, 2025.
In accordance with National Instrument 45-106 – Prospectus Exemptions ("NI 45-106"), the Units were sold to Canadian purchasers pursuant to the listed issuer financing exemption under Part 5A of NI 45-106, as amended by Coordinated Blanket Order 45-935 – Exemptions from Certain Conditions of the Listed Issuer Financing Exemption (the "Listed Issuer Financing Exemption"). The securities issuable from the sale of the Units are immediately freely tradeable in accordance with applicable Canadian securities legislation for Units sold to purchasers resident in Canada.
The FT Units were sold by way of the "accredited investor" and "minimum amount investment" exemptions under NI 45-106. All securities issuable from the sale of FT Units are subject to a hold period in accordance with applicable Canadian securities law, expiring four months and one day following the issue date, being April 4, 2026.
As consideration for their services in the Offering, Red Cloud received aggregate cash fees of C$256,809.24 and 1,196,388 non-transferable common share purchase warrants (the "Broker Warrants"). Each Broker Warrant is exercisable into one common share of the Company (each, a "Broker Warrant Share") at the Unit Price at any time on or before December 3, 2028. The Broker Warrants and Broker Warrant Shares are subject to a hold period in accordance with applicable Canadian securities law, expiring four months and one day following the issue date, being April 4, 2026.
There is an amended and restated offering document (the "Amended Offering Document") related to the Offering that can be accessed under the Company's profile at www.sedarplus.ca and on the Company's website at: www.minnovacorp.ca.
The closing of the Offering remains subject to the final approval of the TSX Venture Exchange (the "TSXV").
The securities to be offered pursuant to the Offering have not been, and will not be, registered under the United States Securities Act of 1933, as amended (the "U.S. Securities Act") or any U.S. state securities laws, and may not be offered or sold in the United States or to, or for the account or benefit of, United States persons absent registration or any applicable exemption from the registration requirements of the U.S. Securities Act and applicable U.S. state securities laws. This news release shall not constitute an offer to sell or the solicitation of an offer to buy securities in the United States, nor shall there be any sale of these securities in any jurisdiction in which such offer, solicitation or sale would be unlawful.
About Minnova Corp.
Minnova Corp. is a near term gold producer focused on the restart and expansion of its 100%-owned PL Gold Mine in the prolific Flin Flon Greenstone Belt of Central Manitoba. The project is situated on a past-producing mine site and benefits from significant existing infrastructure, including a 1,000 tpd processing plant and valid underground mining permit (Environment Act License 1207E).
A positive 2018 Feasibility Study, based on an underground development plan and a gold price of US$1,250 per ounce, outlined a robust 5-year mine life with an annual production rate of 46,493 ounces. Considering current high gold price Minnova is revising the mine development plan to prioritize lower-cost open pit mining methods for the initial years of production before transitioning to underground methods. The new mine plan leverages the full 1,000 tpd mill capacity and targets reduced operating costs compared to the previous underground-only model. The revised mine development plan is underway and will be the subject of a Preliminary Economic Assessment and Feasibility Study to be completed in 2026.
The current global gold resource remains open to expansion, as does the reserve. The Mineral Resource Estimate will be revised in 2026, using current consensus gold price assumption and will incorporate all drilling conducted after the 2018 Feasibility Study, including the upcoming 15,000-meter drill program scheduled for 2025 and 2026.
Minnova Corp.
Gorden GlennPresident & Chief Executive Officer
For further information, please contact Investor Relations: info@minnovacorp.caVisit our website at www.minnovacorp.ca
Forward Looking Statements
Neither the TSXV nor its Regulation Services Provider (as that term is defined in the policies of the TSXV) accepts responsibility for the adequacy or accuracy of this release. This news release contains certain "forward-looking information" within the meaning of applicable securities laws. Forward looking information is frequently characterized by words such as "plan", "expect", "project", "intend", "believe", "anticipate", "estimate", "may", "will", "would", "potential", "proposed" and other similar words, or statements that certain events or conditions "may" or "will" occur. Forward-looking statements herein includes, but is not limited to, statements that address activities, events or developments that Minnova expects or anticipates will or may occur in the future including statements regarding the intended use of proceeds of the Offering, the tax treatment of the FT Shares and the final approval of the Offering by the TSXV. These statements are only predictions. Forward-looking information is based on the opinions and estimates of management at the date the information is provided, and is subject to a variety of risks and uncertainties and other factors that could cause actual events or results to differ materially from those projected in the forward-looking information.
For a description of the risks and uncertainties facing the Company and its business and affairs, readers should refer to the Company's Management's Discussion and Analysis. The Company undertakes no obligation to update forward-looking information if circumstances or management's estimates or opinions should change, unless required by law. The reader is cautioned not to place undue reliance on forward-looking information.
NOT FOR DISTRIBUTION TO UNITED STATES NEWS WIRE SERVICES OR FOR DISSEMINATION IN THE UNITED STATES
To view the source version of this press release, please visit https://www.newsfilecorp.com/release/276798
As the Australian market navigates through December, recent disruptions like the ASX announcements outage have highlighted some of the operational challenges facing investors, while fluctuations in sectors such as energy and materials reflect broader economic dynamics. In this environment, identifying promising small-cap stocks requires a keen eye for companies that can demonstrate resilience and growth potential amidst market volatility.
Top 10 Undiscovered Gems With Strong Fundamentals In Australia
|
Name |
Debt To Equity |
Revenue Growth |
Earnings Growth |
Health Rating |
|---|---|---|---|---|
|
Fiducian Group |
NA |
10.00% |
9.57% |
★★★★★★ |
|
Joyce |
NA |
9.93% |
17.54% |
★★★★★★ |
|
Hearts and Minds Investments |
NA |
56.27% |
59.19% |
★★★★★★ |
|
Spheria Emerging Companies |
NA |
-1.31% |
0.28% |
★★★★★★ |
|
Euroz Hartleys Group |
NA |
1.82% |
-25.32% |
★★★★★★ |
|
Focus Minerals |
NA |
75.35% |
51.34% |
★★★★★★ |
|
Energy World |
NA |
-47.50% |
-44.86% |
★★★★★☆ |
|
Zimplats Holdings |
5.44% |
-9.79% |
-42.03% |
★★★★★☆ |
|
Australian United Investment |
1.90% |
5.23% |
4.56% |
★★★★☆☆ |
|
Reef Casino Trust |
19.84% |
6.96% |
10.88% |
★★★★☆☆ |
We’ll examine a selection from our screener results.
Simply Wall St Value Rating: ★★★★★★
Overview: Cogstate Limited is a neuroscience solutions company focused on developing, validating, and commercializing digital brain health assessments globally with a market cap of A$418.76 million.
Operations: Cogstate generates revenue primarily from its Clinical Trials segment, which accounts for $50.58 million, while the Healthcare segment contributes $2.51 million.
Cogstate, a neuroscience tech firm known for digital brain health assessments, is carving out growth through its Medidata partnership and AI-driven products. This collaboration is set to broaden Cogstate’s reach into new CNS indications and geographies, potentially boosting its contract pipeline. The company’s earnings grew 86% last year, surpassing the Healthcare Services industry’s 18.5%, with a P/E ratio of 27x below the industry average of 36.2x. Despite being debt-free now compared to a 16.4% debt-to-equity ratio five years ago, it faces challenges like regulatory hurdles and competitive pressures from larger digital health players.
ASX:CGS Debt to Equity as at Dec 2025GenusPlus Group
Simply Wall St Value Rating: ★★★★★★
Overview: GenusPlus Group Ltd specializes in the installation, construction, and maintenance of power and communication systems in Australia with a market cap of A$1.15 billion.
Operations: GenusPlus Group Ltd generates revenue primarily from three segments: Infrastructure (A$405.10 million), Energy & Engineering (A$224.06 million), and Services (A$122.11 million).
GenusPlus Group, a nimble player in Australia’s energy sector, is poised for growth with its strategic focus on renewable energy and grid upgrades. The company boasts a robust pipeline of diverse projects, reducing geographic risk while venturing into high-margin areas like battery storage systems. Over the past year, earnings surged by 83.6%, outpacing the construction industry’s 6.5% growth rate. With more cash than total debt and positive free cash flow reaching A$69 million recently, GenusPlus seems financially sound. The recent addition of Tony Narvaez as a director brings valuable industry expertise to navigate future challenges and opportunities effectively.
ASX:GNP Earnings and Revenue Growth as at Dec 2025Omni Bridgeway
Simply Wall St Value Rating: ★★★★★☆
Overview: Omni Bridgeway Limited, along with its subsidiaries, offers dispute and litigation finance services across multiple regions including Australia, the United States, Canada, Latin America, Asia, New Zealand, Europe, the Middle East, and Africa with a market capitalization of A$451.20 million.
Operations: Omni Bridgeway generates revenue primarily from funding and providing services related to legal dispute resolution, amounting to A$87.77 million.
Omni Bridgeway, a notable player in the financial litigation space, has recently turned profitable, boasting a debt to equity ratio reduction from 18.7% to 2.3% over five years. Its price-to-earnings ratio stands at an attractive 1.3x compared to the Australian market’s 22x, indicating potential value for investors. Despite earnings forecasted to decline by an average of 148% annually over the next three years, revenue is expected to grow by approximately 24%. The company enjoys high-quality non-cash earnings and more cash than total debt, suggesting financial stability amidst industry challenges.
-
Click here to discover the nuances of Omni Bridgeway with our detailed analytical health report.
-
Gain insights into Omni Bridgeway’s historical performance by reviewing our past performance report.
ASX:OBL Earnings and Revenue Growth as at Dec 2025Summing It All Up
-
Unlock our comprehensive list of 57 ASX Undiscovered Gems With Strong Fundamentals by clicking here.
-
Got skin in the game with these stocks? Elevate how you manage them by using Simply Wall St’s portfolio, where intuitive tools await to help optimize your investment outcomes.
-
Join a community of smart investors by using Simply Wall St. It’s free and delivers expert-level analysis on worldwide markets.
Seeking Other Investments?
-
Explore high-performing small cap companies that haven’t yet garnered significant analyst attention.
-
Fuel your portfolio with companies showing strong growth potential, backed by optimistic outlooks both from analysts and management.
-
Find companies with promising cash flow potential yet trading below their fair value.
This article by Simply Wall St is general in nature. We provide commentary based on historical data and analyst forecasts only using an unbiased methodology and our articles are not intended to be financial advice. It does not constitute a recommendation to buy or sell any stock, and does not take account of your objectives, or your financial situation. We aim to bring you long-term focused analysis driven by fundamental data. Note that our analysis may not factor in the latest price-sensitive company announcements or qualitative material. Simply Wall St has no position in any stocks mentioned.
Companies discussed in this article include ASX:CGS ASX:GNP and ASX:OBL.
Have feedback on this article? Concerned about the content? Get in touch with us directly. Alternatively, email editorial-team@simplywallst.com
As the Australian market navigates a cautious landscape, influenced by mixed performances on Wall Street and concerns over recent economic indicators like the hotter-than-expected CPI read, investors are keeping a close eye on small-cap opportunities. In such an environment, identifying promising stocks often involves looking for companies with strong fundamentals and growth potential that can weather broader market uncertainties.
Top 10 Undiscovered Gems With Strong Fundamentals In Australia
| Name | Debt To Equity | Revenue Growth | Earnings Growth | Health Rating |
|---|---|---|---|---|
| Fiducian Group | NA | 10.00% | 9.57% | ★★★★★★ |
| Joyce | NA | 9.93% | 17.54% | ★★★★★★ |
| Hearts and Minds Investments | NA | 56.27% | 59.19% | ★★★★★★ |
| Spheria Emerging Companies | NA | -1.31% | 0.28% | ★★★★★★ |
| Euroz Hartleys Group | NA | 1.82% | -25.32% | ★★★★★★ |
| Djerriwarrh Investments | 2.39% | 8.18% | 7.91% | ★★★★★★ |
| Focus Minerals | NA | 75.35% | 51.34% | ★★★★★★ |
| Energy World | NA | -47.50% | -44.86% | ★★★★★☆ |
| Zimplats Holdings | 5.44% | -9.79% | -42.03% | ★★★★★☆ |
| Australian United Investment | 1.90% | 5.23% | 4.56% | ★★★★☆☆ |
Let’s uncover some gems from our specialized screener.
Simply Wall St Value Rating: ★★★★☆☆
Overview: Australian United Investment Company Limited is a publicly owned investment manager with a market cap of A$1.37 billion.
Operations: The company generates revenue primarily from its investment segment, amounting to A$57 million. It has a market cap of approximately A$1.37 billion.
Australian United Investment, a small player in the capital markets, showcases a solid financial footing with its debt to equity ratio dropping from 9.1% to 1.9% over five years. The company enjoys high-quality earnings and maintains satisfactory net debt levels at 1.5%. While earnings growth of 4.6% annually over the past five years is steady, it lags behind industry peers who posted a robust 12.7% last year. Free cash flow remains positive, and interest payments are comfortably covered by EBIT at 22.8 times, suggesting strong operational efficiency despite slower recent growth compared to the broader market.
- Delve into the full analysis health report here for a deeper understanding of Australian United Investment.
-
Understand Australian United Investment’s track record by examining our Past report.
ASX:AUI Debt to Equity as at Nov 2025Tasmea
Simply Wall St Value Rating: ★★★★★☆
Overview: Tasmea Limited offers shutdown, maintenance, emergency breakdown, and capital upgrade services in Australia with a market capitalization of A$1.22 billion.
Operations: Tasmea Limited generates revenue primarily from its Electrical Services (A$212.71 million), Civil Services (A$103.07 million), Mechanical Services (A$144.87 million), and Water & Fluid segments (A$87.06 million).
Tasmea, a promising player in the Australian market, has seen its debt to equity ratio improve significantly from 110.9% to 70.8% over five years, indicating better financial health. Its earnings soared by 74.9% last year, outpacing the Construction industry’s growth of 6.5%, showcasing robust performance and potential for future expansion with expected annual earnings growth of 16.82%. Despite high net debt to equity at 59.8%, interest payments are well-covered by EBIT at a multiple of 10.5x, reflecting strong operational efficiency and financial resilience amidst recent strategic moves like acquisitions and equity offerings totaling A$70 million this year alone.
- Click here to discover the nuances of Tasmea with our detailed analytical health report.
-
Gain insights into Tasmea’s historical performance by reviewing our past performance report.
ASX:TEA Debt to Equity as at Nov 2025Zimplats Holdings
Simply Wall St Value Rating: ★★★★★☆
Overview: Zimplats Holdings Limited is involved in the production and sales of platinum group and associated metals in Zimbabwe, with a market capitalization of approximately A$1.86 billion.
Operations: Zimplats Holdings generates revenue primarily from the metals and mining sector, specifically gold and other precious metals, amounting to $826.59 million. The company’s financial performance is significantly influenced by its net profit margin trends over time.
Zimplats Holdings, a player in the metals and mining sector, has seen its earnings skyrocket by 393% over the past year, outpacing industry growth of 10%. Despite this impressive performance, its earnings have decreased by 42% annually over the last five years. The company’s net debt to equity ratio stands at a satisfactory 0.01%, indicating prudent financial management. Furthermore, Zimplats’ interest payments are comfortably covered with an EBIT coverage of 12 times. However, free cash flow remains negative and capital expenditures have been significant at A$439 million recently. These factors paint a mixed picture for potential investors considering future prospects.
- Navigate through the intricacies of Zimplats Holdings with our comprehensive health report here.
-
Examine Zimplats Holdings’ past performance report to understand how it has performed in the past.
ASX:ZIM Debt to Equity as at Nov 2025Make It Happen
- Explore the 57 names from our ASX Undiscovered Gems With Strong Fundamentals screener here.
- Already own these companies? Link your portfolio to Simply Wall St and get alerts on any new warning signs to your stocks.
- Streamline your investment strategy with Simply Wall St’s app for free and benefit from extensive research on stocks across all corners of the world.
Seeking Other Investments?
- Explore high-performing small cap companies that haven’t yet garnered significant analyst attention.
- Fuel your portfolio with companies showing strong growth potential, backed by optimistic outlooks both from analysts and management.
- Find companies with promising cash flow potential yet trading below their fair value.
This article by Simply Wall St is general in nature. We provide commentary based on historical data
and analyst forecasts only using an unbiased methodology and our articles are not intended to be financial advice. It does not constitute a recommendation to buy or sell any stock, and does not take account of your objectives, or your
financial situation. We aim to bring you long-term focused analysis driven by fundamental data.
Note that our analysis may not factor in the latest price-sensitive company announcements or qualitative material.
Simply Wall St has no position in any stocks mentioned.
Companies discussed in this article include ASX:AUI ASX:TEA and ASX:ZIM.
Have feedback on this article? Concerned about the content? Get in touch with us directly. Alternatively, email editorial-team@simplywallst.com
A bulk freighter was carrying more than a load of fluorspar when it pushed out of the St. Lawrence, Nfld., harbour in August, since it also signalled Canada Fluorspar Inc. had become North America’s only producer of a key mineral at a time when industries in Canada and the United States are scrambling for non-Chinese supply.
Chief executive and chair Willem Jacobs said restarting the company’s open pit mine could produce enough ore and jobs to last 30 years.
“It’s very seldom that you find industrial minerals with a mine life this long,” he said while on his way to the project site in southeast Newfoundland from South Africa this week. “The mineralogy is pretty consistent. There are other mines (worldwide) with higher grades, but they have other problems.”
The only other fluorspar mine owner in North America is Ares Strategic Mining Inc., which is in the process of restarting its Sheep Mine in Utah. Most producers shut down years ago as buyers switched to importing the mineral used to make everything from aluminum to lithium-ion batteries.
The project produces acid-grade fluorspar (acidspar), a high-purity form of the mineral. So far this year, Canada Fluorspar has processed and shipped about 8,500 tonnes to an unnamed, but well-known U.S. client.
Acidspar is an essential material for technology, industrial and defence supply chains. Global supply is tight, with China accounting for about 80 per cent of production, but it has cut exports in the past year, prompting countries such as Canada and the United States to seek domestic supplies.
Fluorspar was among 12 minerals added to the federal government’s list of critical minerals in this year’s budget, which also set aside $2 billion for a critical minerals sovereign fund to support Canadian projects. It provides equity investments, loan guarantees and offtake agreements to help develop domestic mining and processing capacity.
Jacobs said he’s looking into the supports, but so far does not believe his company qualifies. Meanwhile, he’s trying to raise $100 million.
“It will probably be a primary investor and a co-investor,” he said, adding he’d also like the government to be on board. “The reaction is slow, but I’m confident we can work something out. Government moves more slowly than the private sector, but that’s the correct approach because they don’t want to replace private money.”
The St. Lawrence mine went into receivership in 2022, leaving a trail of unpaid bills. Jacobs bought the assets in 2023, some 30-plus years after the former Barrick Mining Corp. chief operating officer became interested in fluorspar back, reviewing global supplies in South Africa, China and elsewhere.
In June that year, the court approved the $25‑million sale of the company’s assets to Fluorspar Holdings Pte. Ltd., a subsidiary of South African-based African Minerals Exploration & Development Funds Sicar SCA. Jacobs is now the majority owner.
He said there are now about 270 people employed on the project, but there is significant work to be done before production can reach full scale.
“We’re busy mining and there’s a lot of waste that has to be removed,” he said. “The previous owners mined themselves into a corner.”
The old owners took shortcuts to get the best ore out quickly, leaving less valuable material that must be cleaned before proper mining can be resumed, Jacobs said, adding the mine’s geology is “world class.”
Canada Fluorspar is spending about $4 million a month to get enough ore ready for its plant. The plan is to reach full production of about 180,000 tonnes of acidspar concentrate in 2027. He’s projecting production of more than 100,000 tonnes in 2026.
The U.S. is expected to be the primary market for the company’s fluorspar given its proximity, he said. Other potential markets include Europe, India and Japan.
Jacobs has more than 30 years of experience in global mining and industrial minerals. Before Barrick, he held leadership roles at Randgold Resources Ltd. and Imerys SA, and has led large-scale operations across Africa and the Middle East, overseeing complex projects involving exploration, mine development and operational restructuring.
But his job now is to manage and revive the St. Lawrence mine, and he believes his vast experience and technical know-how are things the previous owner lacked.
“Your on-site technical capabilities have to be very substantial. To process fluorspar, you need to get all of your recovery; otherwise, you’re not going to make money,” he said. “If you want to look at where things went wrong, it was the absolute lack of technical knowledge. It’s atrocious the technical decisions that were made.”
Upgrades have been made so that all ships will be loaded at the site’s port rather than being trucked to another port. Jacobs said he hopes to add an underground mine in a few years.
The fluorspar mine is hugely important for St. Lawrence since it once employed around 250 people. Jacobs hopes there will be jobs for 300.
“I can tell you now it’s going to be the basis of a global industry,” he said. “First of all, it’s important for Newfoundland and this town. Ninety per cent of the employees come from the town and the Burin Peninsula.”
As far as he’s concerned, there are only two industries that can turn countries around, and that’s mining and oil and gas.
“They build hospitals, they built roads, they have enormous economic engines,” he said.
-
Newfoundland and Labrador sees gold and mining boom amid exploration surge
-
These 12 critical minerals just got a tax credit boost that could spark a new wave of exploration
• Email: arankin@postmedia.com
Albemarle Corporation ALB remains committed to driving shareholder value by leveraging solid liquidity and healthy cash flows. At the end of the third quarter of 2025, ALB had liquidity of around $3.5 billion, including cash and cash equivalents of around $1.9 billion. Its operating cash flow was roughly $893.8 million for the first nine months of 2025, up 29% from the prior-year period. ALB expects free cash flow of $300-$400 million in 2025, driven by strong cash conversion, lower capital spending and productivity measures. Its ability to convert improving operating performance into free cash is likely to result in incremental returns to shareholders. The company remains focused on maintaining its dividend payout. It has raised its quarterly dividend for the 30th straight year and offers a dividend yield of 1.3% at the current stock price. Backed by healthy cash flows and sound financial health, ALB's dividend is perceived to be safe and reliable.Among its peers, Sociedad Quimica y Minera de Chile S.A. SQM exited the third quarter with strong liquidity, cash and cash equivalents being around $1.5 billion. Sociedad Quimica’s solid cash position supports its capital investment in growth projects and shareholder-friendly actions. Sociedad Quimica projects total capital expenditure of $2.7 billion for the 2025–2027 period, which includes the expansion of lithium carbonate and lithium hydroxide capacity in Chile, the expansion of the Mt. Holland project and investments to develop the Andover project, both in Australia. ICL Group Ltd.’s ICL cash resources totaled roughly $1.55 billion as of Sept. 30, 2025. ICL Group’s operating cash flow was $308 million in the third quarter and $742 million for the first nine months of this year. In terms of shareholder returns, ICL Group declared a quarterly dividend of roughly $62 million, equating to 50% of its third-quarter adjusted net income.
ALB’s Price Performance, Valuation & Estimates
Albemarle has gained 47.6% year to date compared with the Zacks Chemical – Diversified industry’s decline of 25.6%.
Image Source: Zacks Investment Research
ALB is currently trading at a forward price-to-sales ratio of 2.95, well above the industry. It carries a Value Score of D.
Image Source: Zacks Investment Research
The Zacks Consensus Estimate for ALB’s 2025 earnings implies a year-over-year rise of 48.3%. The EPS estimates for 2025 have been trending higher over the past 60 days.
Image Source: Zacks Investment Research
ALB stock currently carries a Zacks Rank #3 (Hold). You can see the complete list of today’s Zacks #1 Rank (Strong Buy) stocks here.
Want the latest recommendations from Zacks Investment Research? Today, you can download 7 Best Stocks for the Next 30 Days. Click to get this free report
Albemarle Corporation (ALB) : Free Stock Analysis Report
Sociedad Quimica y Minera S.A. (SQM) : Free Stock Analysis Report
ICL Group Ltd. (ICL) : Free Stock Analysis Report
This article originally published on Zacks Investment Research (zacks.com).
A month has gone by since the last earnings report for FMC (FMC). Shares have lost about 10.2% in that time frame, underperforming the S&P 500.
But investors have to be wondering, will the recent negative trend continue leading up to its next earnings release, or is FMC due for a breakout? Before we dive into how investors and analysts have reacted as of late, let's take a quick look at its most recent earnings report in order to get a better handle on the important drivers.
FMC’s Q3 Earnings Increase, Sales Decline on Lower Prices
FMC reported a loss of $4.52 per share for third-quarter 2025. This compares unfavorably to earnings of 52 cents in the year-ago quarter.Barring one-time items, adjusted earnings per share were 89 cents, up from 69 cents reported a year ago.Revenues were $542 million in the quarter, down around 49% from the year-ago quarter’s levels. Excluding India, revenues were $961 million, down 10%.Third-quarter revenues decreased primarily due to one-time commercial actions taken in India to position the business for sale. Excluding that, third-quarter revenues still witnessed a decline of 10% from the prior-year quarter due to a 6% decrease in price from the decline linked to price reductions in specific "cost-plus" contracts with certain diamide partners, reflecting lower manufacturing costs and the other half stemmed from competitive pressure. The volumes in the core portfolio also decreased due to increased competition.
Regional Sales Performance
In North America, sales increased 4% year over year to $244 million in the quarter. Sales in North America increased as a result of price gains in branded products and higher volume, including Adastrio fungicide based on fluindapyr. It topped the consensus estimate of $225 million.
Latin American sales saw an 8% year-over-year decrease to $463 million in the reported quarter. Sales in Latin America suffered from increased pressure from generics, leading to lower volume and price decline of branded products. It missed the consensus estimate of $516 million.In Asia, excluding India, revenues declined 47% from the previous year to $99 million. Sales declined due to lower pricing, the removal of India and reduced volumes. It missed the consensus estimate of $153 million.EMEA experienced an 11% year-over-year sales increase to $155 million in the reported quarter. The growth was fueled by significant volume increases, especially in the growth portfolio from branded Cyazypyr offerings. The successful launch of Isoflex in Great Britain also drove sales. It lagged the consensus estimate of $158 million.
Financials
The company had cash and cash equivalents of $497.7 million at the end of the quarter. Long-term debt was roughly $3.27 billion.
Q4 Guidance
FMC expects fourth-quarter revenues (excluding India) to range between $1.12 billion and $1.22 billion, implying a 4% decline at the midpoint compared to 2024. Adjusted EBITDA is forecasted between $265 million and $305 million, indicating a 16% decline at the midpoint. Adjusted earnings per share are projected to be $1.14 to $1.36, indicating a 30% year-over-year decrease at the midpoint.
How Have Estimates Been Moving Since Then?
Since the earnings release, investors have witnessed a downward trend in estimates review.
The consensus estimate has shifted -27.57% due to these changes.
VGM Scores
At this time, FMC has a poor Growth Score of F, however its Momentum Score is doing a bit better with a D. Charting a somewhat similar path, the stock has a score of C on the value side, putting it in the middle 20% for value investors.
Overall, the stock has an aggregate VGM Score of F. If you aren't focused on one strategy, this score is the one you should be interested in.
Outlook
Estimates have been broadly trending downward for the stock, and the magnitude of these revisions indicates a downward shift. It's no surprise FMC has a Zacks Rank #5 (Strong Sell). We expect a below average return from the stock in the next few months.
Want the latest recommendations from Zacks Investment Research? Today, you can download 7 Best Stocks for the Next 30 Days. Click to get this free report
FMC Corporation (FMC) : Free Stock Analysis Report
This article originally published on Zacks Investment Research (zacks.com).
As the U.S. stock market experiences a notable upswing, with major indexes like the S&P 500 and Nasdaq on track for their best week since June, investors are turning their attention to small-cap stocks, which often offer unique opportunities during periods of broader market optimism. In this environment, identifying small-cap companies with strong fundamentals and insider activity can be particularly appealing as these factors may indicate potential for growth amid favorable economic conditions.
Top 10 Undervalued Small Caps With Insider Buying In The United States
| Name | PE | PS | Discount to Fair Value | Value Rating |
|---|---|---|---|---|
| Merchants Bancorp | 7.5x | 2.5x | 49.65% | ★★★★★★ |
| Shore Bancshares | 10.4x | 2.8x | 41.27% | ★★★★★☆ |
| Business First Bancshares | 10.2x | 2.6x | 49.56% | ★★★★★☆ |
| OneSpan | 8.0x | 1.9x | 44.37% | ★★★★★☆ |
| First United | 9.9x | 3.0x | 45.32% | ★★★★★☆ |
| Peoples Bancorp | 10.3x | 1.9x | 45.15% | ★★★★★☆ |
| S&T Bancorp | 11.3x | 3.9x | 37.94% | ★★★★☆☆ |
| Farmland Partners | 6.4x | 7.9x | -86.24% | ★★★★☆☆ |
| CNB Financial | 17.8x | 3.4x | 46.42% | ★★★☆☆☆ |
| Omega Flex | 17.0x | 2.7x | 7.78% | ★★★☆☆☆ |
We’re going to check out a few of the best picks from our screener tool.
Simply Wall St Value Rating: ★★★★★☆
Overview: FMC is a global agricultural sciences company that provides innovative solutions for crop protection, with a market cap of approximately $13.50 billion.
Operations: FMC’s revenue is primarily derived from its Innovative Solutions segment, with recent figures showing a gross profit margin of 38.15%. The company has experienced fluctuations in net income margin, which reached -13.80% in the latest period ending September 2025. Operating expenses and non-operating expenses have been significant cost components affecting profitability over time.
PE: -3.5x
FMC, a smaller player in the U.S. market, recently reported a challenging third quarter with sales dropping to US$542.2 million from last year’s US$1.07 billion and a net loss of US$569.3 million compared to prior profits. Despite these setbacks, insider confidence is evident as key figures have been purchasing shares throughout 2025, signaling potential optimism for future growth prospects amid expected earnings growth of 66% annually. However, funding remains risky due to reliance on external borrowing, and dividend reductions reflect ongoing financial adjustments.
- Click to explore a detailed breakdown of our findings in FMC’s valuation report.
-
Assess FMC’s past performance with our detailed historical performance reports.
FMC Share price vs Value as at Nov 2025Herbalife
Simply Wall St Value Rating: ★★★★★☆
Overview: Herbalife is a global nutrition company that develops and sells dietary supplements, weight management products, and personal care items, with a market capitalization of $1.46 billion.
Operations: Herbalife generates revenue across several key markets, including India and the United States, with significant contributions from other regions as well. The company experienced fluctuations in its gross profit margin, which was 50.51% in late 2014 and shifted to 45.28% by mid-2025. Operating expenses primarily consist of general and administrative costs, consistently forming a substantial part of the company’s expenditures over time.
PE: 4.3x
Herbalife, a company with a strong presence in the nutrition industry, is navigating challenges amidst its small cap status. Recent insider confidence was evident as they increased their shareholdings over the past quarter, signaling potential optimism about future prospects. Despite earnings forecasted to decline by 2.5% annually over three years and interest payments not well covered by earnings, Herbalife’s Liftoff product line continues to thrive in the growing US$41.4 billion energy drink market projected for 2033. The company’s recent expansion into new flavors and its investment of US$7 million in a new research facility highlight ongoing efforts to innovate and maintain quality standards. However, external borrowing remains their primary funding source, which carries higher risk compared to customer deposits.
- Get an in-depth perspective on Herbalife’s performance by reading our valuation report here.
-
Examine Herbalife’s past performance report to understand how it has performed in the past.
HLF Share price vs Value as at Nov 2025Sally Beauty Holdings
Simply Wall St Value Rating: ★★★★★☆
Overview: Sally Beauty Holdings operates as a specialty retailer and distributor of professional beauty supplies with two main segments, Sally Beauty Supply and Beauty Systems Group, and has a market capitalization of approximately $1.39 billion.
Operations: SBS and BSG are the primary revenue streams, contributing to a total revenue of $3.7 billion. The gross profit margin shows a notable trend, reaching 51.62% by September 2025. Operating expenses remain significant, with general and administrative costs being a major component at $1.54 billion as of the latest period.
PE: 8.2x
Sally Beauty Holdings, a smaller company in the beauty sector, recently reported annual sales of US$3.70 billion, slightly down from last year. However, net income rose to US$195.88 million from US$153.41 million, indicating improved profitability with earnings per share increasing to US$1.95 from US$1.48. The company repurchased 1.68 million shares for $20.45 million between July and September 2025 as part of a long-term buyback program totaling 36.72 million shares since August 2017, reflecting insider confidence in its future prospects despite high debt levels and reliance on external borrowing for funding needs.
- Dive into the specifics of Sally Beauty Holdings here with our thorough valuation report.
-
Gain insights into Sally Beauty Holdings’ past trends and performance with our Past report.
SBH Share price vs Value as at Nov 2025Turning Ideas Into Actions
- Take a closer look at our Undervalued US Small Caps With Insider Buying list of 77 companies by clicking here.
- Are any of these part of your asset mix? Tap into the analytical power of Simply Wall St’s portfolio to get a 360-degree view on how they’re shaping up.
- Elevate your portfolio with Simply Wall St, the ultimate app for investors seeking global market coverage.
Looking For Alternative Opportunities?
- Explore high-performing small cap companies that haven’t yet garnered significant analyst attention.
- Fuel your portfolio with companies showing strong growth potential, backed by optimistic outlooks both from analysts and management.
- Find companies with promising cash flow potential yet trading below their fair value.
This article by Simply Wall St is general in nature. We provide commentary based on historical data
and analyst forecasts only using an unbiased methodology and our articles are not intended to be financial advice. It does not constitute a recommendation to buy or sell any stock, and does not take account of your objectives, or your
financial situation. We aim to bring you long-term focused analysis driven by fundamental data.
Note that our analysis may not factor in the latest price-sensitive company announcements or qualitative material.
Simply Wall St has no position in any stocks mentioned.
Companies discussed in this article include FMC HLF and SBH.
Have feedback on this article? Concerned about the content? Get in touch with us directly. Alternatively, email editorial-team@simplywallst.com
– Unique opportunity offers potential to accelerate mineralization models, drill targeting, scale & grade knowledge base
VANCOUVER, BC / ACCESS Newswire / November 24, 2025 / Apex Critical Metals Corp. (CSE:APXC)(FSE:KL9)(OTCQX:APXCF) ("Apex" or the "Company"), a Canadian mineral exploration company focused on the identification and development of critical and strategic metals, is pleased to announce that it has commenced an extensive 2025 re-sampling and re-logging program of historical drill core from the Rift Rare Earth Project, located near Elk Creek, Nebraska, USA.
The historical drill programs were completed during the 1970s and 1980s by Molycorp Inc., and a substantial portion of the drill core, and sample material have been preserved and are available for modern analysis.
The Company has retained Dahrouge Geological Consulting Ltd. to oversee the program. Dahrouge previously completed similar verification and re-sampling work for Quantum Rare Earth Developments Corp. in 2010-2011, which supported the first modern NI 43-101 Technical Reports for the Elk Creek district. Apex's 2025 work will include re-logging of drillholes and the selection of samples for multi-element analysis. All samples will be analyzed by Actlabs using modern Fusion ICP-MS, ICP-OES and XRF. Initial results are expected during the first quarter of 2026.
Apex CEO, Sean Charland, states: "We are grateful to the Conservation and Survey Division, School of Natural Resources, University of Nebraska-Lincoln for ensuring the preservation of the historical Molycorp material. Having access to this material is a tremendous resource to draw from and our 2025 re-logging and re-sampling program initiative at Rift will provide a modern analytical foundation for understanding the scale and grade potential of the system."
The results of this work will support Apex's ongoing geological interpretation and modelling of the Rift carbonatite system, which is host to significant rare earth element ("REE") and niobium mineralization. The Rift Project covers a series of carbonatite and related intrusive rocks which form part of the broader Elk Creek district, a region known to contain high-grade REE and niobium mineralization at depth.
Historical drilling by Molycorp identified multiple zones of REE- and niobium-bearing carbonatite within the boundaries of Apex's current holdings at Elk Creek though these results pre-date NI 43-101 and are therefore non-compliant with current reporting standards. Apex is not treating the historical results or estimates as current mineral resources or reserves.
Qualified Person
The technical content of this news release has been reviewed and approved by Nathan Schmidt, P. Geo., Geologist for Dahrouge Geological Consulting Ltd. and a Qualified Person under NI 43-101 on standards of disclosure for mineral projects.
The results discussed in this document are considered historical. An Apex Critical Metals Corp. qualified person has not performed sufficient work or data verification to validate these historical results in accordance with NI 43-101, and therefore results should not be relied upon until such time that the Company has carried out its own sampling, drilling and modern analysis.
About Apex Critical Metals Corp. (CSE: APXC) (OTCQX: APXCF) (FWB: KL9)
Apex Critical Metals Corp. is a Canadian exploration company focused on advancing rare earth element (REE) and niobium projects that support the growing demand for critical and strategic metals across the United States and Canada. The Company's flagship Rift Project, located within the highly prospective Elk Creek Carbonatite Complex in Nebraska, U.S.A., hosts extensive rare earth rights surrounding one of North America's most advanced niobium-REE deposits. Historical drilling across the complex has reported broad intervals of high-grade REE mineralization, including intercepts such as 155.5 m of 2.70% REO and 68.2 m of 3.32% REO.
In Canada, Apex continues to advance its 100%-owned Cap Project, located 85 kilometres northeast of Prince George, British Columbia. The 2025 drill program confirmed a significant niobium discovery with 0.59% Nb₂O₅ over 36 metres, including 1.08% Nb₂O₅ over 10 metres, within a 1.8-kilometre-long niobium trend. The Cap Project continues to demonstrate strong potential for niobium mineralization within a large and previously unrecognized carbonatite system.
With a growing portfolio of critical mineral projects in both Canada and the United States, Apex Critical Metals is strategically positioned to help strengthen domestic supply chains for the minerals essential to advanced technologies, clean energy, and national security. Apex is publicly listed in Canada on the Canadian Securities Exchange (CSE) under the symbol APXC and quoted on the OTCQX market in the United States under the symbol APXCF, and in Germany on the Borse Frankfurt under the symbol KL9 and/or WKN: A40CCQ. Find out more at www.apexcriticalmetals.com and to sign up for free news alerts please go to https://apexcriticalmetals.com/news/news-alerts/, or follow us on X (formerly Twitter), Facebook or LinkedIn.
On Behalf of the Board of Directors
APEX CRITICAL METALS CORP.,
Sean CharlandChief Executive OfficerTel: 604.681.1568Email: info@apexcriticalmetals.com
Neither the Canadian Securities Exchange nor its Regulation Services Provider (as that term is defined in the policies of the CSE) accepts responsibility for the adequacy or accuracy of this release.
CAUTIONARY STATEMENT REGARDING FORWARD-LOOKING INFORMATION:
This news release may contain "forward-looking statements" under applicable Canadian securities legislation. Forward-looking statements consist of statements that are not purely historical, including any statements regarding beliefs, plans, expectations or intentions regarding the future. Forward-looking statements in this news release include (without limitation) statements with respect to the planned re-logging and re-sampling of certain historical drill cores and when the Company expects to receive results from such activities, , the potential benefits of undertaking a re-analysis of the historical drill cores, and statements regarding the Company's Canadian and US-based prospective assets more particularly described above.. Forward-looking statements are subject to various known and unknown risks and uncertainties that may cause actual results, performance or developments to differ materially from those contained in the statements. Risks that could change or prevent these events, activities or developments from coming to fruition include: the Company's properties are at an early stage of development and no current mineral resources or reserves have been identified by the Company thereof, that we may not be able to fully finance any additional exploration on the Company's properties; that even if we are able to raise capital, costs for exploration activities may increase such that we may not have sufficient funds to pay for such exploration or processing activities; the timing and content of any future work programs; geological interpretations based on drilling that may change with more detailed information; potential process methods and mineral recoveries assumptions based on limited test work and by comparison to what are considered analogous deposits that, with further test work, may not be comparable; testing of our process may not prove successful or samples derived from our properties may not yield positive results, and even if such tests are successful or initial sample results are positive, the economic and other outcomes may not be as expected; the anticipated market demand for REE and other minerals may not be as expected; the availability of labour and equipment to undertake future exploration work and testing activities; geopolitical risks which may result in market and economic instability. There can be no assurance that such statements will prove to be accurate, as actual results and future events could differ materially from those anticipated in such statements. Accordingly, readers should not place undue reliance on forward-looking statements. The forward-looking statements herein are made as of the date hereof, and the Company disclaims any intention or obligation to update or revise any forward-looking statements, whether as a result of new information, future events or otherwise, except as required by law.
SOURCE: Apex Critical Metals Corp.
View the original press release on ACCESS Newswire
MILAN, September 09, 2025–(BUSINESS WIRE)–Nikkiso Clean Energy & Industrial Gases Group (Nikkiso CE&IG) has announced at the Gastech Conference today that it has launched a next-generation submerged ammonia pump designed to be the safest and most reliable in the industry.
Ammonia is already a key component in fertilizers and increasingly being used as a clean hydrogen carrier. As demand for handling ammonia has also grown in sectors like power generation, chemical plants, shipping fleets and export terminals, Nikkiso CE&IG has responded with a first-of-its-kind solution designed to eliminate common maintenance burdens for operators thanks to its seal-less, maintenance-friendly, copper-free construction and integrated motor-pump system.
The pump is capable of delivering more than 2,500m3 per hour and has an industry-leading maintenance record – specifically-designed parts mean the pump lasts significantly longer before any maintenance requirements, with a mean time between outages topping 16,000 hours.
Emile Bado, President of Nikkiso CE&IG’s Pumps division, said: "Demand for ammonia across a range of applications is growing thanks to its importance as an alternative clean fuel, its role in agriculture and as a carrier for hydrogen. In response to customer demand, we are delighted to launch a pump which addresses the most common issues operators face.
"We have a proud record of innovation at Nikkiso CE&IG, and the work that has gone into producing this pump is no different – as a result, it leads the industry in safety, reliability, maintenance and performance."
The launch of the pump builds on a track record of expertise and innovation both at Nikkiso CE&IG and its parent company, Nikkiso Co, in serving the ammonia market across a range of applications. Nikkiso CE&IG has four decades of experience in building submersible motor pumps for ammonia service and recently secured approval in principle for a new ammonia fuel supply system, alongside its existing and proven range of purpose-built ambient and electric heat exchangers for ammonia. Nikkiso Co’s Industrial division has also built more than 7,000 canned motor pumps for use in ammonia handling, and plans to launch a liquid ammonia pump for thermal power generation next year.
Notes to Editors
Eric Sensat, Product Manager – Submerged Motor Pumps at Nikkiso CE&IG, will be presenting the new submerged ammonia pump at Nikkiso CE&IG’s booth (J14) at 10.30am and 1.30pm on Wednesday, September 10, 2025.
About Nikkiso Clean Energy & Industrial Gases Group
The Nikkiso Clean Energy & Industrial Gases Group is a leading provider of cryogenic equipment and solutions around the world, meeting the changing market demand for lower-carbon energy and industrial gases with innovative products and collaborative solutions. We fuel the future of the energy, transportation, marine, aerospace and industrial gas markets.
The Group employs more than 1,800 people in 12 countries and is headed by Cryogenic Industries, Inc., which is a wholly owned subsidiary of Nikkiso Co., Ltd. (TSE: 6376).
To learn more about Nikkiso CE&IG Group visit NikkisoCEIG.com.
View source version on businesswire.com: https://www.businesswire.com/news/home/20250908128086/en/
Contacts
Media Ross DavidsonDirector of External Communications+44 (0)7946 930741Ross.davidson@nikkisoceig.com pr@nikkisoceig.com
BHP Group Limited
MELBOURNE, Australia, Sept. 09, 2025 (GLOBE NEWSWIRE) — BHP Xplor, the nine-month accelerator program aimed at transforming the discovery of critical minerals, has officially opened applications for the 2026 cohort.
Following the success of the 2023, 2024, and 2025 cohorts, BHP Xplor invites early-stage explorers to apply for its next intake. The program is looking for ambitious teams and individuals dedicated to uncovering new sources of critical minerals essential for a sustainable future.
The BHP Xplor program is designed to accelerate participants' exploration opportunities while fostering long-term connections with BHP. Participants benefit from up to USD $500,000 in equity-free funding, expert mentorship, and access to BHP’s global network of suppliers and service providers.
Tim O’Connor, BHP’s Group Exploration Officer, said: “Xplor has quickly become a recognised pathway for early-stage explorers who want to scale faster and think more boldly. The program provides not only capital, but access to the knowledge, networks, and technical depth that can fundamentally change the trajectory of a company. As the world’s demand for critical minerals intensifies, building strong partnerships between majors and juniors will be essential. Xplor is about more than accelerating exploration projects, it’s about shaping a new way of working together to unlock the resources needed for the future.”
Additionally, the 2026 cohort will join BHP Xplor’s growing alumni network, now spanning 21 companies, to continue sharing insights and learnings as they progress on their journey.
Elena Clarici, CEO of Electrum Discovery and current BHP Xplor participant, said: “Being part of BHP Xplor has been invaluable. The program has given us access to expertise and resources that have helped sharpen our strategy and move our projects forward more quickly. It has also opened doors to networks and opportunities that would have been much harder to access on our own. Xplor is already making a real difference in how we grow as a company.”
For BHP, Xplor provides an opportunity to engage with a diverse pipeline of exploration projects across new geographies and geological concepts, supporting the company’s long-term growth ambitions.
Applications for the BHP Xplor 2026 cohort are open from 8 September to 15 October 2025.
For more information: https://www.bhp.com/xplor
Georgina Gabelich: Media.relations@bhp.com
Toronto, Ontario–(Newsfile Corp. – September 8, 2025) – Avalon Advanced Materials Inc. (TSX: AVL) (OTCQB: AVLNF) ("Avalon" or the "Company") reports that a forest fire occurred last week in the vicinity of the Company's Nechalacho property, located at Thor Lake in the Northwest Territories, Canada. Avalon is working closely with local partners to monitor conditions and investigate the situation. The Company is coordinating with Vital Metals on situational updates. The Company will provide a market update if there is any material impact to timelines or costs once a full risk assessment has been conducted.
"The safety of our people and communities is our first priority," said Scott Monteith, President and CEO. "We will provide further updates as our assessment advances and material information becomes available."
About Avalon Advanced Materials Inc.
Avalon Advanced Materials Inc. is a Canadian critical minerals company advancing the supply of materials essential for Canada's future. The Company is focused on developing strategic assets that support secure, domestic supply chains and long-term economic growth. Avalon is focused on vertically integrating the Ontario lithium supply chain through the development of Lake Superior Lithium Inc., Ontario's first midstream lithium hydroxide processing facility, located in Thunder Bay. This facility will serve as a vital link between northern Ontario's lithium resources and the growing EV battery manufacturing base in southern Ontario and North America. Through a joint venture with SCR-Sibelco NV, Avalon is advancing the Separation Rapids Lithium Project near Kenora, Ontario, as well as continuing exploration at its Snowbank lithium and Lilypad lithium-cesium deposits. The Company is also advancing the Nechalacho Rare Earths and Zirconium Project in the Northwest Territories. This deposit contains all light and heavy rare earth elements, as well as yttrium, zirconium, tantalum, and niobium-critical minerals used in advanced technologies across the communications, defense, clean tech, and energy sectors.
For further information regarding Avalon Advanced Materials Inc., please visit www.avalonadvancedmaterials.com, email ir@avalonam.com, or call 416-364-4938.
Cautionary Statement Regarding Forward-Looking Information
This news release contains "forward-looking information" within the meaning of applicable Canadian securities legislation. Generally, forward-looking information can be identified by the use of forward-looking terminology such as "add" or "additional", "advancing", "anticipates" or "does not anticipate", "appears", "believes", "can be", "conceptual", "confidence", "continue", "convert" or "conversion", "deliver", "demonstrating", "estimates", "encouraging", "expand" or "expanding" or "expansion", "expect" or "expectations", "forecasts", "forward", "goal", "improves", "increase", "intends", "justification", "plans", "potential" or "potentially", "promise", "prospective", "prioritize", "reflects", "robust", "scheduled", "suggesting", "support", "top-tier", "updating", "upside", "will be" or "will consider", "work towards", or variations of such words and phrases or state that certain actions, events or results "may", "could", "would", "might", or "will be taken", "occur", or "be achieved".
Forward-looking information is subject to known and unknown risks, uncertainties and other factors that may cause the actual results, level of activity, performance or achievements of the Company to be materially different from those expressed or implied by such forward-looking information, including risks associated with mineral exploration and development operations such as: environmental hazards and economic factors as they affect the cost and success of the Company's capital expenditures, the ability of the Company to obtain required permits and approvals, the ability of the Company to obtain financing, uncertainty in the estimation of mineral resources, uncertainty with respect to the ability to successfully construct and develop the Company's lithium processing facility, the price of lithium, no operating history, no operating revenue and negative cash flow, land title risk, the market price of the Company's securities, the economic feasibility of the Company's mineral resources and the Company's commercial viability, inflation and uncertain global economic conditions, uncertain geo-political shifts and risks, successful collaboration with indigenous communities, changes in technology and advancements in innovation may impact the development of the Company's technology innovation centre and its lithium hydroxide processing facility, future pandemics and other health crises, dependence on management and other highly skilled personnel, title to the Company's mineral properties, the ongoing war in Ukraine and Israel, extensive government and environmental regulation, reliance on artificial intelligence technology to influence mining operations, volatility in the financial markets, uninsured risks, climate change, threat of legal proceedings, as well as those risk factors discussed or referred to in the annual information form of the Company dated November 28, 2024 (the "AIF") under the heading "Description of the Business – Risk Factors". Forward-looking information is based on the reasonable assumptions, estimates, analysis and opinions of management made in light of its experience and perception of trends, current conditions and expected developments, as well as other factors that management believes to be relevant and reasonable in the circumstances at the date that such statements are made, but which may prove to be incorrect. Although the Company believes that the assumptions and expectations reflected in such forward-looking information are reasonable, undue reliance should not be placed on forward-looking information because the Company can give no assurance that such expectations will prove to be correct. In addition to other factors and assumptions identified in the AIF, assumptions have been made regarding, among other things: management of certain of the Company's assets by other companies or joint venture partners, the Company's ability to carry on its exploration and development activities without undue delays or unbudgeted costs, the ability of the Company to obtain sufficient qualified personnel, equipment and services in a timely and cost effective manner, the ability of the Company to operate in a safe, efficient and effective manner, the ability of the Company to obtain all necessary financing on acceptable terms and when needed, the accuracy of the Company's resource estimates and geological, operational and price assumptions on which these are based and the continuance of the regulatory framework regarding environmental manners. Readers are cautioned that the foregoing list is not exhaustive of all factors and assumptions that may have been used. Although the Company has attempted to identify important factors that could cause actual results to differ materially from those contained in forward-looking information, there may be other factors that cause results not to be as anticipated, estimated or intended. There can be no assurance that such information will prove to be accurate, as actual results and future events could differ materially from those anticipated in such information. Accordingly, readers should not place undue reliance on forward-looking information. The Company does not undertake to update any forward-looking information, except in accordance with applicable securities laws.
To view the source version of this press release, please visit https://www.newsfilecorp.com/release/265472
DENVER, CO / ACCESS Newswire / September 4, 2025 / Solitario Resources Corp. ("Solitario") (NYSE American:XPL)(TSX:SLR) is pleased to report CEO Chris Herald will provide a live presentation at the 27th Annual Global HC Wainwright conference on Tuesday, September 9, 2025, at 2:00 pm Eastern Time. In addition to a strategic overview of Solitario, Mr. Herald plans to give a more detailed overview of the company's drilling program at its Golden Crest gold project in South Dakota. Mr. Herald will be available for one-on-one investor meetings at the conference.
For more information on the conference, please click HC Wainwright.
About Solitario
Solitario is a natural resource exploration company focused on high-quality Tier-1 gold and zinc projects. Solitario's 100%-owned Golden Crest properties in South Dakota constitute strategic land holdings along the western and southwestern extensions of the Homestake-Wharf mining district that has produced approximately 52 million ounces of gold. The project area is located in a safe jurisdiction with highly developed infrastructure, an unbroken 150-year record of continuous gold mining, a skilled mining workforce, and a history of high-grade, underground mineable gold deposits.
The Company is traded on the NYSE American ("XPL") and on the Toronto Stock Exchange ("SLR"). In addition to its South Dakota property holdings, Solitario holds a 50% joint venture interest (Teck Resources 50%) in the high-grade Lik zinc deposit in Alaska and a 39% joint venture interest (Nexa Resources holds the remaining 61% interest) on the high-grade Florida Canyon zinc project in Peru. Solitario is carried to production through its joint venture arrangement with Nexa. Solitario's Management and Directors hold approximately 8.4% (excluding options) and Newmont Corporation owns 9.4% of the Company's 90.3 million shares outstanding. Solitario's cash balance and marketable securities stand at approximately US$8.0 million. Additional information about Solitario is available online at www.solitarioresources.com.
For More Information Please Contact:
Chris Herald, President & CEO: 303-534-1030; ext. 1
SOURCE: Solitario Resources Corp.
View the original press release on ACCESS Newswire
The Australian market has shown resilience, with the index climbing back over 8,800 points amid positive sentiment from tech investors and robust consumer spending data. While financials and IT sectors lead the charge, energy lags behind; this dynamic environment presents an opportunity to explore promising small-cap stocks that may thrive under these conditions. Identifying a good stock often involves looking for companies with strong growth potential or unique advantages in their sector, especially as market sentiment shifts and economic indicators fluctuate.
Top 10 Undiscovered Gems With Strong Fundamentals In Australia
|
Name |
Debt To Equity |
Revenue Growth |
Earnings Growth |
Health Rating |
|---|---|---|---|---|
|
Sugar Terminals |
NA |
3.78% |
4.30% |
★★★★★★ |
|
Fiducian Group |
NA |
10.00% |
9.57% |
★★★★★★ |
|
Joyce |
NA |
9.93% |
17.54% |
★★★★★★ |
|
Spheria Emerging Companies |
NA |
-1.31% |
0.28% |
★★★★★★ |
|
Hearts and Minds Investments |
NA |
56.27% |
59.19% |
★★★★★★ |
|
Red Hill Minerals |
NA |
95.16% |
40.06% |
★★★★★★ |
|
Djerriwarrh Investments |
2.39% |
8.18% |
7.91% |
★★★★★★ |
|
Zimplats Holdings |
5.44% |
-9.79% |
-42.03% |
★★★★★☆ |
|
Peet |
53.46% |
12.70% |
31.21% |
★★★★☆☆ |
|
Australian United Investment |
1.90% |
5.23% |
4.56% |
★★★★☆☆ |
Let’s uncover some gems from our specialized screener.
Simply Wall St Value Rating: ★★★★★★
Overview: Australian Ethical Investment Ltd is a publicly owned investment manager with a market cap of A$807.55 million, focusing on ethical and sustainable investment strategies.
Operations: Australian Ethical Investment generates revenue primarily through its funds management segment, reporting A$119.38 million in revenue.
Australian Ethical Investment, a notable player in the ethical investment space, has demonstrated impressive growth. Over the past year, earnings soared by 75%, significantly outpacing the Capital Markets industry average of 5.8%. The company reported net income of A$20.2 million for the fiscal year ending June 2025, up from A$11.53 million previously. With no debt on its books and positive free cash flow standing at A$24 million as of September 2024, it appears well-positioned financially. Despite a recent dividend increase to A$0.09 per share, potential risks include integration challenges and increased operating expenses impacting future margins.
ASX:AEF Debt to Equity as at Sep 2025Helia Group
Simply Wall St Value Rating: ★★★★★☆
Overview: Helia Group Limited operates in the loan mortgage insurance industry primarily in Australia and has a market cap of A$1.56 billion.
Operations: Helia Group Limited generates revenue of A$559.63 million from its loan mortgage insurance business in Australia.
Helia Group, a notable player in the Australian financial landscape, faces headwinds with significant client losses and policy shifts. The exit of major clients like Commonwealth Bank signals potential revenue volatility, while the government’s Home Guarantee Scheme could limit premium growth. Despite these challenges, Helia’s earnings grew 19% last year, outpacing the industry’s -3%. However, its debt to equity ratio rose from 14% to 19% over five years. Recent executive changes include CFO Michael Cant stepping in as interim CEO. With a share price at A$5.93 against a target of A$3.87, market sentiment remains cautious amid forecasted revenue declines.
ASX:HLI Debt to Equity as at Sep 2025Ricegrowers
Simply Wall St Value Rating: ★★★★★☆
Overview: Ricegrowers Limited is a rice food company with operations spanning Australia, New Zealand, the Pacific Islands, Europe, the Middle East, Africa, Asia, and North America; it has a market capitalization of approximately A$1.01 billion.
Operations: Ricegrowers Limited generates revenue primarily from its International Rice segment, contributing A$860.96 million, and the Rice Pool segment with A$481.87 million. The Cop Rice and Riviana segments add A$250.64 million and A$231.14 million, respectively, while the Rice Food segment brings in A$132.53 million.
Ricegrowers, a dynamic player in the food industry, is leveraging its position through strategic international expansions and product diversification. With earnings growing at 23% annually over five years and trading 47% below estimated fair value, the company seems undervalued. Its net debt to equity ratio of 31% is satisfactory, ensuring financial stability while covering interest payments effectively with a 6.8x EBIT coverage. Despite facing competition and operational hurdles like yield fluctuations and cost inflation, Ricegrowers’ focus on agritech investments aims to boost efficiency and quality. The stock’s current trading price of A$14.16 aligns closely with analysts’ target of A$14.00.
ASX:SGLLV Earnings and Revenue Growth as at Sep 2025Where To Now?
-
Navigate through the entire inventory of 54 ASX Undiscovered Gems With Strong Fundamentals here.
-
Are these companies part of your investment strategy? Use Simply Wall St to consolidate your holdings into a portfolio and gain insights with our comprehensive analysis tools.
-
Enhance your investing ability with the Simply Wall St app and enjoy free access to essential market intelligence spanning every continent.
Contemplating Other Strategies?
-
Explore high-performing small cap companies that haven’t yet garnered significant analyst attention.
-
Fuel your portfolio with companies showing strong growth potential, backed by optimistic outlooks both from analysts and management.
-
Find companies with promising cash flow potential yet trading below their fair value.
This article by Simply Wall St is general in nature. We provide commentary based on historical data and analyst forecasts only using an unbiased methodology and our articles are not intended to be financial advice. It does not constitute a recommendation to buy or sell any stock, and does not take account of your objectives, or your financial situation. We aim to bring you long-term focused analysis driven by fundamental data. Note that our analysis may not factor in the latest price-sensitive company announcements or qualitative material. Simply Wall St has no position in any stocks mentioned.
Companies discussed in this article include ASX:AEF ASX:HLI and ASX:SGLLV.
Have feedback on this article? Concerned about the content? Get in touch with us directly. Alternatively, email editorial-team@simplywallst.com
Following the solid earnings report from Impala Platinum Holdings Limited (JSE:IMP), the market responded by bidding up the stock price. While the profit numbers were good, our analysis has found some concerning factors that shareholders should be aware of.
JSE:IMP Earnings and Revenue History September 4th 2025The Impact Of Unusual Items On Profit
To properly understand Impala Platinum Holdings' profit results, we need to consider the R219m gain attributed to unusual items. While we like to see profit increases, we tend to be a little more cautious when unusual items have made a big contribution. We ran the numbers on most publicly listed companies worldwide, and it's very common for unusual items to be once-off in nature. And, after all, that's exactly what the accounting terminology implies. Assuming those unusual items don't show up again in the current year, we'd thus expect profit to be weaker next year (in the absence of business growth, that is).
That might leave you wondering what analysts are forecasting in terms of future profitability. Luckily, you can click here to see an interactive graph depicting future profitability, based on their estimates.
Our Take On Impala Platinum Holdings' Profit Performance
We'd posit that Impala Platinum Holdings' statutory earnings aren't a clean read on ongoing productivity, due to the large unusual item. Therefore, it seems possible to us that Impala Platinum Holdings' true underlying earnings power is actually less than its statutory profit. The good news is that it earned a profit in the last twelve months, despite its previous loss. Of course, we've only just scratched the surface when it comes to analysing its earnings; one could also consider margins, forecast growth, and return on investment, among other factors. So while earnings quality is important, it's equally important to consider the risks facing Impala Platinum Holdings at this point in time. For example – Impala Platinum Holdings has 1 warning sign we think you should be aware of.
Today we've zoomed in on a single data point to better understand the nature of Impala Platinum Holdings' profit. But there are plenty of other ways to inform your opinion of a company. For example, many people consider a high return on equity as an indication of favorable business economics, while others like to 'follow the money' and search out stocks that insiders are buying. So you may wish to see this free collection of companies boasting high return on equity, or this list of stocks with high insider ownership.
Have feedback on this article? Concerned about the content? Get in touch with us directly. Alternatively, email editorial-team (at) simplywallst.com.This article by Simply Wall St is general in nature. We provide commentary based on historical data and analyst forecasts only using an unbiased methodology and our articles are not intended to be financial advice. It does not constitute a recommendation to buy or sell any stock, and does not take account of your objectives, or your financial situation. We aim to bring you long-term focused analysis driven by fundamental data. Note that our analysis may not factor in the latest price-sensitive company announcements or qualitative material. Simply Wall St has no position in any stocks mentioned.
As the Canadian economy navigates a period of contraction, with GDP shrinking by 1.6% in the second quarter, market participants are closely watching for potential easing from the Bank of Canada. In this context, penny stocks—though often seen as relics from past market eras—remain relevant due to their affordability and growth potential, especially when backed by strong financials. For investors seeking opportunities in smaller or newer companies, these stocks can offer a unique combination of value and growth that larger firms may not always provide.
Top 10 Penny Stocks In Canada
|
Name |
Share Price |
Market Cap |
Financial Health Rating |
|
Westbridge Renewable Energy (TSXV:WEB) |
CA$2.20 |
CA$55.63M |
★★★★★★ |
|
Canso Select Opportunities (TSXV:CSOC.A) |
CA$4.80 |
CA$22.05M |
★★★★★★ |
|
Montero Mining and Exploration (TSXV:MON) |
CA$0.29 |
CA$2.34M |
★★★★★★ |
|
CEMATRIX (TSX:CEMX) |
CA$0.295 |
CA$45.81M |
★★★★★★ |
|
Thor Explorations (TSXV:THX) |
CA$1.20 |
CA$765.09M |
★★★★★★ |
|
Automotive Finco (TSXV:AFCC.H) |
CA$1.01 |
CA$20.02M |
★★★★★★ |
|
Amerigo Resources (TSX:ARG) |
CA$2.26 |
CA$361.74M |
★★★★★☆ |
|
Pulse Seismic (TSX:PSD) |
CA$4.05 |
CA$207.08M |
★★★★★★ |
|
Hemisphere Energy (TSXV:HME) |
CA$1.95 |
CA$187.48M |
★★★★★★ |
|
Matachewan Consolidated Mines (TSXV:MCM.A) |
CA$0.455 |
CA$5.35M |
★★★★★★ |
Click here to see the full list of 408 stocks from our TSX Penny Stocks screener.
Below we spotlight a couple of our favorites from our exclusive screener.
Simply Wall St Financial Health Rating: ★★★★★★
Overview: Pulse Seismic Inc. acquires, markets, and licenses 2D and 3D seismic data for the energy sector in Canada, with a market cap of CA$207.08 million.
Operations: The company generates revenue from its Oil Well Equipment & Services segment, amounting to CA$49.38 million.
Market Cap: CA$207.08M
Pulse Seismic Inc. has demonstrated significant financial growth, with earnings increasing by 75.4% over the past year, surpassing its five-year average of 33.3%. The company is debt-free and boasts a strong return on equity at 76.5%, highlighting operational efficiency. Its net profit margins have improved to 45.2%, reflecting high-quality earnings. Despite an unstable dividend history, recent announcements include a regular quarterly and special dividend totaling CA$11 million, signaling shareholder returns focus. Furthermore, Pulse’s management and board are experienced, contributing to its strategic stability in the volatile energy sector market landscape.
TSX:PSD Financial Position Analysis as at Sep 2025Commerce Resources
Simply Wall St Financial Health Rating: ★★★★★☆
Overview: Commerce Resources Corp. focuses on acquiring, exploring, developing, and evaluating mineral resource properties in Canada with a market cap of CA$20.14 million.
Operations: Commerce Resources Corp. does not report any specific revenue segments.
Market Cap: CA$20.14M
Commerce Resources Corp. is a pre-revenue company with a market cap of CA$20.14 million, focusing on mineral resource properties in Canada. The company has experienced leadership changes, appointing Nicholas Holthouse as CEO and Joel Ives as CFO to strengthen its strategic direction amidst ongoing losses, which increased to CA$1.17 million for the recent quarter compared to the previous year. Despite having no debt and relocating its head office to Montreal for better project development, Commerce faces challenges with short-term liabilities exceeding assets and limited cash runway, though it recently raised additional capital for operational needs.
-
Take a closer look at Commerce Resources’ potential here in our financial health report.
-
Gain insights into Commerce Resources’ historical outcomes by reviewing our past performance report.
TSXV:CCE Financial Position Analysis as at Sep 2025Pivotree
Simply Wall St Financial Health Rating: ★★★★★★
Overview: Pivotree Inc. designs, integrates, deploys, and manages digital platforms in commerce, data management, and supply chain for retail and branded manufacturers worldwide, with a market cap of CA$47.53 million.
Operations: Pivotree’s revenue is primarily derived from Professional Services, which account for CA$42.16 million, and Managed & IP Solutions (MIPS) & Legacy Managed Services (LMS), contributing CA$31.33 million.
Market Cap: CA$47.53M
Pivotree Inc., with a market cap of CA$47.53 million, showcases a mixed financial picture typical of many penny stocks. Despite being unprofitable, it maintains a strong cash runway exceeding three years and is debt-free, which provides some stability. The company’s revenue streams from Professional Services (CA$42.16 million) and Managed & IP Solutions (CA$31.33 million) are noteworthy, though recent earnings reports indicate declining sales but improved net income compared to the previous year. Additionally, Pivotree has initiated a share buyback program funded by its working capital to potentially enhance shareholder value amidst volatile market conditions.
-
Click here to discover the nuances of Pivotree with our detailed analytical financial health report.
-
Assess Pivotree’s future earnings estimates with our detailed growth reports.
TSXV:PVT Revenue & Expenses Breakdown as at Sep 2025Make It Happen
-
Click here to access our complete index of 408 TSX Penny Stocks.
-
Ready For A Different Approach? Diversify your portfolio with solid dividend payers offering reliable income streams to weather potential market turbulence.
This article by Simply Wall St is general in nature. We provide commentary based on historical data and analyst forecasts only using an unbiased methodology and our articles are not intended to be financial advice. It does not constitute a recommendation to buy or sell any stock, and does not take account of your objectives, or your financial situation. We aim to bring you long-term focused analysis driven by fundamental data. Note that our analysis may not factor in the latest price-sensitive company announcements or qualitative material. Simply Wall St has no position in any stocks mentioned.
Companies discussed in this article include TSX:PSD TSXV:CCE and TSXV:PVT.
This article was originally published by Simply Wall St.
Have feedback on this article? Concerned about the content? Get in touch with us directly. Alternatively, email editorial-team@simplywallst.com
As the Australian market takes a breather following a year of record highs, investors are navigating a landscape marked by mixed sector performances and cautious sentiment. In this environment, identifying stocks with strong potential often involves looking beyond immediate market trends to find companies that demonstrate resilience and innovation, such as Carlton Investments and two other promising small-cap contenders.
Top 10 Undiscovered Gems With Strong Fundamentals In Australia
|
Name |
Debt To Equity |
Revenue Growth |
Earnings Growth |
Health Rating |
|---|---|---|---|---|
|
Sugar Terminals |
NA |
3.78% |
4.30% |
★★★★★★ |
|
Fiducian Group |
NA |
10.00% |
9.57% |
★★★★★★ |
|
Joyce |
NA |
9.93% |
17.54% |
★★★★★★ |
|
Spheria Emerging Companies |
NA |
-1.31% |
0.28% |
★★★★★★ |
|
Hearts and Minds Investments |
NA |
56.27% |
59.19% |
★★★★★★ |
|
Red Hill Minerals |
NA |
95.16% |
40.06% |
★★★★★★ |
|
Djerriwarrh Investments |
2.39% |
8.18% |
7.91% |
★★★★★★ |
|
Zimplats Holdings |
5.44% |
-9.79% |
-42.03% |
★★★★★☆ |
|
Peet |
53.46% |
12.70% |
31.21% |
★★★★☆☆ |
|
Australian United Investment |
1.90% |
5.23% |
4.56% |
★★★★☆☆ |
Here we highlight a subset of our preferred stocks from the screener.
Simply Wall St Value Rating: ★★★★★☆
Overview: Carlton Investments Limited is a publicly owned asset management holding company with a market capitalization of A$947.27 million.
Operations: Carlton Investments generates revenue primarily from the acquisition and long-term holding of shares and units, amounting to A$41.60 million. The company’s net profit margin is a key financial metric to consider in evaluating its profitability.
Carlton Investments, a smaller player in the Australian market, showcases a solid financial standing with earnings growing at 8.7% annually over the past five years. The company boasts high-quality earnings and minimal debt concerns, as its debt-to-equity ratio has improved from 0.03% to 0.02%. Recent announcements reveal steady revenue of A$41.6 million and net income of A$38.81 million for the year ending June 2025, with basic EPS slightly up at A$1.468 from last year’s A$1.465. Additionally, Carlton’s interest payments are well-covered by EBIT at an impressive coverage ratio of 3390x.
-
Take a closer look at Carlton Investments’ potential here in our health report.
-
Gain insights into Carlton Investments’ past trends and performance with our Past report.
ASX:CIN Debt to Equity as at Sep 2025GenusPlus Group
Simply Wall St Value Rating: ★★★★★★
Overview: GenusPlus Group Ltd specializes in the installation, construction, and maintenance of power and communication systems in Australia with a market capitalization of A$918.05 million.
Operations: GenusPlus Group Ltd generates revenue through three primary segments: Services (A$122.11 million), Infrastructure (A$405.10 million), and Energy & Engineering (A$224.06 million). The Infrastructure segment contributes the largest portion to the company’s revenue stream.
GenusPlus Group, a dynamic player in Australia’s power and communication systems sector, showcases promising growth potential through strategic acquisitions like CommTel. Recent financials reveal sales of A$751.27 million for the year ending June 2025, up from A$551.19 million previously, with net income climbing to A$35.37 million from A$19.26 million last year. Earnings per share improved to A$0.1975 from A$0.1084, indicating robust performance amidst expansion efforts and a focus on high-margin services integration. While challenges such as resource management and acquisition costs loom, analysts forecast continued revenue growth at 20% annually over the next few years.
ASX:GNP Debt to Equity as at Sep 2025United Overseas Australia
Simply Wall St Value Rating: ★★★★★☆
Overview: United Overseas Australia Ltd, along with its subsidiaries, focuses on the development and resale of land and buildings across Malaysia, Singapore, Vietnam, and Australia with a market capitalization of A$1.07 billion.
Operations: United Overseas Australia’s primary revenue stream is derived from land development and resale, generating A$438.18 million, while its investment segment contributes A$257.51 million.
United Overseas Australia, a notable player in the real estate sector, showcases a P/E ratio of 10.5x, which is favorable compared to the broader Australian market’s 20x. The company has reported net income of A$44.61 million for the half-year ending June 2025, up from A$33.92 million previously, reflecting solid earnings growth of 1.7% annually over five years. Despite a debt-to-equity increase from 5.5% to 8.8%, UOS maintains more cash than its total debt and continues to generate positive free cash flow at A$99.63 million as of June 2025, indicating robust financial health and potential for future stability amidst industry challenges.
ASX:UOS Earnings and Revenue Growth as at Sep 2025Seize The Opportunity
-
Investigate our full lineup of 53 ASX Undiscovered Gems With Strong Fundamentals right here.
-
Are you invested in these stocks already? Keep abreast of every twist and turn by setting up a portfolio with Simply Wall St, where we make it simple for investors like you to stay informed and proactive.
-
Discover a world of investment opportunities with Simply Wall St’s free app and access unparalleled stock analysis across all markets.
Looking For Alternative Opportunities?
-
Explore high-performing small cap companies that haven’t yet garnered significant analyst attention.
-
Fuel your portfolio with companies showing strong growth potential, backed by optimistic outlooks both from analysts and management.
-
Find companies with promising cash flow potential yet trading below their fair value.
This article by Simply Wall St is general in nature. We provide commentary based on historical data and analyst forecasts only using an unbiased methodology and our articles are not intended to be financial advice. It does not constitute a recommendation to buy or sell any stock, and does not take account of your objectives, or your financial situation. We aim to bring you long-term focused analysis driven by fundamental data. Note that our analysis may not factor in the latest price-sensitive company announcements or qualitative material. Simply Wall St has no position in any stocks mentioned.
Companies discussed in this article include ASX:CIN ASX:GNP and ASX:UOS.
Have feedback on this article? Concerned about the content? Get in touch with us directly. Alternatively, email editorial-team@simplywallst.com
As the Australian market navigates a sea of mixed signals, with futures looking uncertain amidst a backdrop of robust U.S. economic growth and fluctuating commodity prices, investors are keenly evaluating the latest earnings reports to gauge potential opportunities. In this dynamic environment, identifying promising small-cap stocks requires a focus on companies with strong fundamentals that can adapt to both local and global economic shifts.
Top 10 Undiscovered Gems With Strong Fundamentals In Australia
|
Name |
Debt To Equity |
Revenue Growth |
Earnings Growth |
Health Rating |
|---|---|---|---|---|
|
Sugar Terminals |
NA |
3.78% |
4.30% |
★★★★★★ |
|
Fiducian Group |
NA |
10.00% |
9.57% |
★★★★★★ |
|
Spheria Emerging Companies |
NA |
-1.31% |
0.28% |
★★★★★★ |
|
Euroz Hartleys Group |
NA |
1.82% |
-25.32% |
★★★★★★ |
|
Hearts and Minds Investments |
NA |
56.27% |
59.19% |
★★★★★★ |
|
Red Hill Minerals |
NA |
95.16% |
40.06% |
★★★★★★ |
|
Djerriwarrh Investments |
2.39% |
8.18% |
7.91% |
★★★★★★ |
|
Zimplats Holdings |
5.44% |
-9.79% |
-42.03% |
★★★★★☆ |
|
Peet |
53.46% |
12.70% |
31.21% |
★★★★☆☆ |
|
Australian United Investment |
1.90% |
5.23% |
4.56% |
★★★★☆☆ |
Here we highlight a subset of our preferred stocks from the screener.
Simply Wall St Value Rating: ★★★★★★
Overview: Djerriwarrh Investments Limited is a publicly owned investment manager with a market cap of A$828.26 million.
Operations: Djerriwarrh Investments generates revenue primarily through its portfolio of investments, amounting to A$53.07 million.
Djerriwarrh Investments, a notable player in Australia’s financial landscape, showcases robust fundamentals. Over the past five years, its earnings have grown by 7.9% annually, supported by a reduced debt-to-equity ratio from 12.3% to 2.4%. The company has high-quality earnings and maintains a price-to-earnings ratio of 21.1x, undercutting the industry average of 22.5x. Recent financials reveal net income at A$39.18 million for fiscal year ending June 2025 with basic EPS slightly up at A$0.1487 from A$0.1485 last year, reflecting stability amidst modest revenue changes to A$53 million from A$53.38 million prior year.
-
Click to explore a detailed breakdown of our findings in Djerriwarrh Investments’ health report.
-
Gain insights into Djerriwarrh Investments’ past trends and performance with our Past report.
ASX:DJW Debt to Equity as at Aug 2025Lycopodium
Simply Wall St Value Rating: ★★★★★☆
Overview: Lycopodium Limited is an Australian company offering engineering and project delivery services across the resources, rail infrastructure, and industrial processes sectors, with a market capitalization of A$462.32 million.
Operations: Lycopodium’s primary revenue stream is from the resources sector, generating A$342.76 million, with additional contributions from rail infrastructure and process industries at A$11.03 million and A$10.08 million respectively.
Lycopodium, a nimble player in the engineering sector, trades at 60.7% below its estimated fair value, hinting at potential upside. Despite high-quality earnings and positive free cash flow of A$30.77 million as of September 2024, recent performance saw a dip with net income dropping to A$42.22 million from A$50.71 million the previous year. The debt-to-equity ratio has risen to 1% over five years but remains manageable given their cash position surpasses total debt levels. While revenue is forecasted to grow by 8.12% annually, significant insider selling recently might raise some eyebrows among investors considering its future prospects.
-
Dive into the specifics of Lycopodium here with our thorough health report.
-
Review our historical performance report to gain insights into Lycopodium’s’s past performance.
ASX:LYL Debt to Equity as at Aug 2025Omni Bridgeway
Simply Wall St Value Rating: ★★★★★☆
Overview: Omni Bridgeway Limited, along with its subsidiaries, offers dispute and litigation finance services across various global regions including Australia, the United States, Canada, Latin America, Asia, New Zealand, Europe, the Middle East, and Africa; it has a market capitalization of A$465.82 million.
Operations: Omni Bridgeway generates revenue primarily from funding and providing services related to legal dispute resolution, amounting to A$770.40 million. The company’s net profit margin is a key financial metric to consider when analyzing its profitability.
Omni Bridgeway, a notable player in the financial sector, has shown impressive growth with net income soaring to A$349.8 million from a loss of A$87.52 million last year. Its revenue jumped significantly to A$651.22 million from A$184.59 million, highlighting robust performance despite sales dropping to A$54.99 million from A$71.05 million previously. The company has reduced its debt-to-equity ratio dramatically over five years, now standing at 2.3% compared to 18.7%. With a price-to-earnings ratio of 1.3x against the market’s 19.6x and more cash than total debt, Omni Bridgeway appears well-positioned in its industry despite forecasts suggesting earnings might decline by an average of 148% annually over the next three years while revenue is expected to grow by nearly 24% per year.
ASX:OBL Earnings and Revenue Growth as at Aug 2025Next Steps
-
Click this link to deep-dive into the 53 companies within our ASX Undiscovered Gems With Strong Fundamentals screener.
-
Are these companies part of your investment strategy? Use Simply Wall St to consolidate your holdings into a portfolio and gain insights with our comprehensive analysis tools.
-
Join a community of smart investors by using Simply Wall St. It’s free and delivers expert-level analysis on worldwide markets.
Ready For A Different Approach?
-
Explore high-performing small cap companies that haven’t yet garnered significant analyst attention.
-
Fuel your portfolio with companies showing strong growth potential, backed by optimistic outlooks both from analysts and management.
-
Find companies with promising cash flow potential yet trading below their fair value.
This article by Simply Wall St is general in nature. We provide commentary based on historical data and analyst forecasts only using an unbiased methodology and our articles are not intended to be financial advice. It does not constitute a recommendation to buy or sell any stock, and does not take account of your objectives, or your financial situation. We aim to bring you long-term focused analysis driven by fundamental data. Note that our analysis may not factor in the latest price-sensitive company announcements or qualitative material. Simply Wall St has no position in any stocks mentioned.
Companies discussed in this article include ASX:DJW ASX:LYL and ASX:OBL.
Have feedback on this article? Concerned about the content? Get in touch with us directly. Alternatively, email editorial-team@simplywallst.com
A month has gone by since the last earnings report for FMC (FMC). Shares have added about 0.7% in that time frame, underperforming the S&P 500.
But investors have to be wondering, will the recent positive trend continue leading up to its next earnings release, or is FMC due for a pullback? Well, first let's take a quick look at its latest earnings report in order to get a better handle on the recent drivers for FMC Corporation before we dive into how investors and analysts have reacted as of late.
FMC's Earnings Surpass Estimates in Q2 on Higher Volumes
FMC reported earnings of 53 cents per share for second-quarter 2025, down from $2.35 in the year-ago quarter.Barring one-time items, adjusted earnings per share were 69 cents, beating the Zacks Consensus Estimate of 59 cents.Revenues were roughly $1.05 billion in the quarter, up around 1.2% from the year-ago quarter’s levels. The top line surpassed the Zacks Consensus Estimate of $965.4 million.Second-quarter revenues increased primarily due to a 6% rise in volume, as customers in most countries seemed to have reached their desired inventory levels for FMC products. Prices fell 3%, with more than half of the decline linked to price reductions in specific "cost-plus" contracts with certain diamide partners, reflecting lower manufacturing costs. Foreign exchange rates negatively impacted results by 1%. Sales from the company’s growth portfolio rose by a high single-digit percentage, while sales from the core portfolio remained largely unchanged.
Regional Sales Performance
In North America, sales declined 5% year over year to $321 million in the quarter. Sales in North America decreased, as strong growth in branded products in the United States was outweighed by reduced volumes in Canada due to anticipated inventory destocking. It topped the consensus estimate of $294.1 million.Latin American sales saw a 1% year-over-year increase to $310 million in the reported quarter. Sales in Latin America benefited from the strong growth of the new active ingredients, fluindapyr and Isoflex active. It beat the consensus estimate of $296.1 million.In Asia, revenues declined 17% from the previous year to $159 million. Sales in Asia declined due to lower pricing as well as reduced volume driven by ongoing destocking activity in India. It missed the consensus estimate of $163.7 million.EMEA experienced a 29% year-over-year sales increase to $260 million in the reported quarter. The growth was fueled by significant volume increases, especially in herbicides, products from diamide partners and branded Cyazypyr offerings. The Plant Health segment also expanded, supported by growth in biological products. It beat the consensus estimate of $223.6 million.
Financials
The company had cash and cash equivalents of $438.2 million at the end of the quarter. Long-term debt was roughly $3.27 billion.
Guidance
FMC expects full-year revenues (excluding India) to range between $4.08 billion and $4.28 billion, implying a 2% decline at the midpoint compared to 2024. Adjusted EBITDA is forecasted between $870 million and $950 million, indicating 1% growth at the midpoint. Adjusted earnings per share (EPS) are projected to be $3.26 to $3.70, indicating a year-over-year no change at the midpoint.
How Have Estimates Been Moving Since Then?
In the past month, investors have witnessed a upward trend in fresh estimates.
VGM Scores
Currently, FMC has a nice Growth Score of B, though it is lagging a bit on the Momentum Score front with a C. Charting a somewhat similar path, the stock has a grade of B on the value side, putting it in the top 40% for value investors.
Overall, the stock has an aggregate VGM Score of A. If you aren't focused on one strategy, this score is the one you should be interested in.
Outlook
Estimates have been trending upward for the stock, and the magnitude of these revisions looks promising. Interestingly, FMC has a Zacks Rank #3 (Hold). We expect an in-line return from the stock in the next few months.
Want the latest recommendations from Zacks Investment Research? Today, you can download 7 Best Stocks for the Next 30 Days. Click to get this free report
FMC Corporation (FMC) : Free Stock Analysis Report
This article originally published on Zacks Investment Research (zacks.com).
TORONTO, Aug. 29, 2025 /CNW/ – Bravo Mining Corp. (TSXV: BRVO) (OTCQX: BRVMF), ("Bravo" or the "Company") announces that it is restating its consolidated financial statements for the year ended December 31, 2024 and 2023 (the "Restated FS"), along with a corresponding restated management's discussion and analysis (the "Restated MD&A"), to reflect non-cash accounting adjustments identified during the preparation of its second-quarter 2025 financial review and after questions identified during an Ontario Securities Commission staff review. All amounts are in United States Dollars (USD) unless stated otherwise.
The Company identified that Bravo Mineração Ltda.'s ("Bravo Mineração") (which has a functional currency of Brazilian Reals (BRL)) non-monetary assets in Brazil were not correctly translated from Bravo Mineração's functional currency to the Company's presentation currency (USD) at the closing rate as of the date of the respective consolidated financial statements, as required by IAS 21, "The effects of changes in foreign exchange rates". The correction of the translation differences resulted in corrections to the exploration and evaluation assets; property, plant and equipment; and accumulated other comprehensive income (loss) (and associated subtotals and totals) on the consolidated statements of financial position and exchange differences on translating foreign operations and comprehensive loss for the year on the consolidated statements of loss and comprehensive loss. These differences did not impact the Company's monetary assets and liabilities, net loss for the year, net loss per share or the consolidated statements of cash flows.
The restatement reflects a technical correction with no effect on the Corporation's financial health or performance.
Impact on 2024 Financial Results:
The following table summarizes the line items impacted in the Consolidated Statement of Financial position and Consolidated Statements of Loss and Comprehensive Loss:
|
Consolidated Statement of Financial position |
December 31,2024 |
December 31,2023 |
||||
|
Previously reported |
Adjustments |
AsRestated |
Previously reported |
Adjustments |
AsRestated |
|
|
Exploration and evaluation assets |
$ 31,536,483 |
(4,552,522) |
26,983,961 |
22,786,359 |
882,998 |
23,669,357 |
|
Property, plant and equipment |
1,728,555 |
(338,938) |
1,389,617 |
1,465,376 |
34,219 |
1,499,595 |
|
Total assets |
57,355,502 |
(4,891,460) |
52,464,042 |
56,847,470 |
917,217 |
57,764,687 |
|
Accumulated other comprehensive loss |
(16,647) |
(4,891,460) |
(4,908,107) |
(25,433) |
917,217 |
891,784 |
|
Total shareholders' equity |
56,205,560 |
(4,891,460) |
51,314,100 |
55,201,607 |
917,217 |
56,118,824 |
|
Total liabilities and shareholders' equity |
$ 57,355,502 |
(4,891,460) |
52,464,042 |
56,847,470 |
917,217 |
57,764,687 |
|
Consolidated Statements of Loss and Comprehensive Loss |
Year endedDecember 31,2024 |
Year endedDecember 31,2023 |
||||
|
Previously reported |
Adjustments |
AsRestated |
Previously reported |
Adjustments |
AsRestated |
|
|
Exchange differences on translating foreign operations |
$ 8,786 |
(5,808,677) |
(5,799,891) |
(14,565) |
917,217 |
902,652 |
|
Comprehensive loss for the year |
$ (2,298,665) |
(5,808,677) |
(8,107,342) |
(2,719,296) |
917,217 |
(1,802,079) |
|
Consolidated Statements of Changes in Shareholders' Equity |
Year endedDecember 31,2024 |
Year endedDecember 31,2023 |
||||
|
Previously reported |
Adjustments |
AsRestated |
Previously reported |
Adjustments |
AsRestated |
|
|
Comprehensive loss for the year |
$ 8,786 |
(5,808,677) |
(5,799,891) |
(14,565) |
917,217 |
902,652 |
|
Balance, December 31, |
(16,647) |
(4,891,460) |
(4,908,107) |
(25,433) |
917,217 |
891,784 |
|
Total Shareholders' Equity |
$ 56,205,560 |
(4,891,460) |
51,314,100 |
55,201,607 |
917,217 |
56,118,824 |
Restatement and Disclosure
In accordance with IAS 8, "Accounting Policies, Changes in Accounting Estimates and Errors", Bravo filed the Restated FS and Restated MD&A under the Company's profile on SEDAR+ immediately prior to the filing of its Q2 2025 results. The Company notes that, given its more recent filing of its Q2 2025 results, it has elected not to restate the consolidated financial statements and management's discussion and analysis for the three months ended March 31, 2025 (the "Q1 2025 Results") at this time. The Q1 2025 Results were impacted by the same non-cash foreign exchange accounting issue, and accordingly should not be relied upon.
About Bravo Mining Corp.
Bravo is a Canadian and Brazil-based mineral exploration and development company focused on advancing its Luanga palladium + platinum + rhodium + gold + nickel deposit ("Luanga PGM+Au+Ni deposit"), as well as our Cu-Au exploration opportunities in the world-class Carajás Mineral Province, Para State, Brazil.
Neither the TSX Venture Exchange nor its Regulation Services Provider (as that term is defined in the policies of the TSX Venture Exchange) accepts responsibility for the adequacy or accuracy of this press release.
SOURCE Bravo Mining Corp.
Cision
View original content to download multimedia: http://www.newswire.ca/en/releases/archive/August2025/29/c4363.html
Most readers would already be aware that Impala Platinum Holdings' (JSE:IMP) stock increased significantly by 22% over the past three months. However, we decided to pay attention to the company's fundamentals which don't appear to give a clear sign about the company's financial health. Particularly, we will be paying attention to Impala Platinum Holdings' ROE today.
Return on equity or ROE is a key measure used to assess how efficiently a company's management is utilizing the company's capital. In short, ROE shows the profit each dollar generates with respect to its shareholder investments.
How Do You Calculate Return On Equity?
ROE can be calculated by using the formula:
Return on Equity = Net Profit (from continuing operations) ÷ Shareholders' Equity
So, based on the above formula, the ROE for Impala Platinum Holdings is:
0.7% = R707m ÷ R97b (Based on the trailing twelve months to June 2025).
The 'return' is the yearly profit. So, this means that for every ZAR1 of its shareholder's investments, the company generates a profit of ZAR0.01.
Check out our latest analysis for Impala Platinum Holdings
Why Is ROE Important For Earnings Growth?
So far, we've learned that ROE is a measure of a company's profitability. We now need to evaluate how much profit the company reinvests or "retains" for future growth which then gives us an idea about the growth potential of the company. Assuming all else is equal, companies that have both a higher return on equity and higher profit retention are usually the ones that have a higher growth rate when compared to companies that don't have the same features.
Impala Platinum Holdings' Earnings Growth And 0.7% ROE
It is quite clear that Impala Platinum Holdings' ROE is rather low. Even when compared to the industry average of 6.4%, the ROE figure is pretty disappointing. Given the circumstances, the significant decline in net income by 53% seen by Impala Platinum Holdings over the last five years is not surprising. We believe that there also might be other aspects that are negatively influencing the company's earnings prospects. For instance, the company has a very high payout ratio, or is faced with competitive pressures.
However, when we compared Impala Platinum Holdings' growth with the industry we found that while the company's earnings have been shrinking, the industry has seen an earnings growth of 4.5% in the same period. This is quite worrisome.
JSE:IMP Past Earnings Growth August 29th 2025
Earnings growth is an important metric to consider when valuing a stock. The investor should try to establish if the expected growth or decline in earnings, whichever the case may be, is priced in. Doing so will help them establish if the stock's future looks promising or ominous. What is IMP worth today? The intrinsic value infographic in our free research report helps visualize whether IMP is currently mispriced by the market.
Is Impala Platinum Holdings Efficiently Re-investing Its Profits?
While the company did payout a portion of its dividend in the past, it currently doesn't pay a regular dividend. This implies that potentially all of its profits are being reinvested in the business.
Summary
Overall, we have mixed feelings about Impala Platinum Holdings. Even though it appears to be retaining most of its profits, given the low ROE, investors may not be benefitting from all that reinvestment after all. The low earnings growth suggests our theory correct. Having said that, looking at current analyst estimates, we found that the company's earnings growth rate is expected to see a huge improvement. To know more about the latest analysts predictions for the company, check out this visualization of analyst forecasts for the company.
Have feedback on this article? Concerned about the content? Get in touch with us directly. Alternatively, email editorial-team (at) simplywallst.com.This article by Simply Wall St is general in nature. We provide commentary based on historical data and analyst forecasts only using an unbiased methodology and our articles are not intended to be financial advice. It does not constitute a recommendation to buy or sell any stock, and does not take account of your objectives, or your financial situation. We aim to bring you long-term focused analysis driven by fundamental data. Note that our analysis may not factor in the latest price-sensitive company announcements or qualitative material. Simply Wall St has no position in any stocks mentioned.
Toronto, Ontario–(Newsfile Corp. – August 28, 2025) – Minnova Corp. (TSXV: MCI) (OTC Pink: AGRDF) ("Minnova" or the "Company") announces that the proposed amendments to the Company's Omnibus Long-Term Incentive Plan (the "Plan") were approved by shareholders at the annual meeting of shareholders held on January 22, 2025, and which amendments were set out in the Company's management information circular for the meeting. Certain additional housekeeping and clerical amendments are currently being incorporated into the Plan, subject to approval from TSX Venture Exchange (the "Exchange"). Upon receipt of Exchange approval, a copy of the further amended Plan will be available on SEDAR+ under the Company's profile at www.sedarplus.ca.
PL Gold Mine: Poised for Advancement
The PL Gold Mine is an advanced-stage development project with significant existing infrastructure, including a 1,000 tonnes-per-day (tpd) processing plant, over 7,000 meters of underground ramp development, and a valid underground mining permit.
Planning for technical programs at the PL Gold Mine continues to advance with a focus on a revised mine development plan based on the full 1,000 tpd mill capacity, which prioritizes lower-cost open pit mining methods in the initial years of operation. In addition to surface exploration and infill drilling, the Company believes updated metallurgical test work to include ore sorting and gravity recovery studies could have a positive impact on the project by potentially increasing grades, improving recovery, and lowering processing costs.
The work programs planned for 2025 and 2026 will help to advance the PL Gold Mine and inform a future feasibility study to be completed in 2026. Key development activities will include:
-
Diamond drilling to expand resources and upgrade reserves.
-
An updated Mineral Resource Estimate.
-
A revised mine development plan prioritizing open pit mining.
-
Updated metallurgical test work.
-
An updated, comprehensive Feasibility Study.
A&B Global Mining Scope of Work
ABGM will initially manage the project's technical advancement in two distinct stages:
Stage 1: Mining Concept Development
This initial stage will establish the foundational data and models required for advanced engineering and economic studies. Key deliverables include:
-
An audited and signed-off drilling database.
-
Updated geological and resource models.
-
A NI 43-101 compliant Mineral Resource Estimate.
-
A comprehensive internal mining concept study report.
-
A detailed roadmap for Stage 2.
Stage 2: Class 3 Feasibility Study
Following the successful completion of Stage 1, ABGM will undertake a full Feasibility Study to Class 3 engineering standards. This stage will provide the detailed engineering and financial analysis required for a financial analysis and a future production decision. Key deliverables include:
-
Detailed mining design and layout (open pit and underground).
-
A 3D mine plan and schedule.
-
Mine engineering and infrastructure layout.
-
Basic engineering.
-
A NI 43-101 compliant Mineral Reserves Estímate.
-
Detailed capital and operating cost estimates and financial models.
-
A final NI 43-101 Technical Report and Feasibility Study.
Mr. Glenn concluded, "The structured, two-stage approach being executed by ABGM is precisely what is needed to move the PL Gold Mine forward. ABGM will ensure highest QA/QC standards in data collection and analysis and will provide a high-quality, independent technical validation of the PL Gold Mine project required to secure development funding and execute on our vision of restarting the mine. We look forward to working closely with the ABGM team and updating our shareholders as we achieve key milestones."
About Minnova Corp.
Minnova Corp. is focused on the restart of its PL Gold Mine and completed a positive Feasibility Study in 2018, based on a gold price of US$1,250 per ounce. The study concluded the restart of the PL Gold Mine, at an average annual production rate of 46,493 ounces over a minimum 5-year mine life, was economically robust. Importantly the global resource remains open to expansion, as does the reserve. The PL Gold Mine benefits from a short pre-production timeline forecast at 15 months, a valid underground mining permit (Environment Act 1207E), an existing 1,000 tpd processing plant, over 7,000 meters of developed underground ramp to -135 metres depth.
About A&B Global Mining
A&B Global Mining Pty. (Ltd.) (ABGM) is a premier mining consultancy with deep expertise across the mining life cycle. With a track record of success on projects around the globe, ABGM provides integrated, innovative, and practical solutions in geology, mine engineering, and project management to help clients maximize the value of their mineral assets.
ABGM welcomes the opportunity to collaborate with Minnova and believes that their organisation is well-positioned to add significant value to this initiative. Their team comprises highly skilled professionals with extensive experience in exploration, resource estimation, technical reporting, and project implementation across multiple commodities and jurisdictions, including Africa. We are confident in our ability to deliver high-quality outputs in line with Minnova's strategic objectives.
ABGM has a proven track record of delivering high-quality technical support to international clients, including the successful design of exploration programmes, validation of resource models and the preparation of technical documentation that has underpinned both internal investment decisions and external market disclosures.
Qualified Person
Mr. Chris Buchanan, M. Sc., P. Geo., a consultant of the Company and a "Qualified Person" under National Instrument 43-101, has reviewed and approved the scientific and technical information in this press release.
For more information, please contact:
Minnova Corp.Gorden Glenn President & Chief Executive OfficerTel: (647) 985-2785
For further information, please contact Investor Relations: info@minnovacorp.ca.
Visit our website at www.minnovacorp.ca.
Forward-Looking Statements
Neither the TSX Venture Exchange nor its Regulation Services Provider (as that term is defined in the policies of the TSX Venture Exchange) accepts responsibility for the adequacy or accuracy of this release.
This news release contains certain "forward-looking information" within the meaning of applicable securities laws. Forward-looking information is frequently characterized by words such as "plan", "expect", "project", "intend", "believe", "anticipate", "estimate", "may", "will", "would", "potential", "proposed" and other similar words, or statements that certain events or conditions "may" or "will" occur. These statements are only predictions. Forward-looking information is based on the opinions and estimates of management at the date the information is provided, and is subject to a variety of risks and uncertainties and other factors that could cause actual events or results to differ materially from those projected in the forward-looking information. For a description of the risks and uncertainties facing the Company and its business and affairs, readers should refer to the Company's Management's Discussion and Analysis. The Company undertakes no obligation to update forward-looking information if circumstances or management's estimates or opinions should change, unless required by law. The reader is cautioned not to place undue reliance on forward-looking information.
Not for distribution to U.S. Newswire Services or for dissemination in the United States. Any failure to comply with this restriction may constitute a violation of U.S. Securities laws.
To view the source version of this press release, please visit https://www.newsfilecorp.com/release/264359
As the ASX200 remains steady, with Real Estate, Financials, and Industrials leading the charge while Energy and Health Care lag behind, investors are keenly observing how economic shifts impact small-cap companies. In this dynamic environment, identifying undiscovered gems requires a focus on resilience and growth potential amidst sector fluctuations.
Top 10 Undiscovered Gems With Strong Fundamentals In Australia
|
Name |
Debt To Equity |
Revenue Growth |
Earnings Growth |
Health Rating |
|---|---|---|---|---|
|
Sugar Terminals |
NA |
3.78% |
4.30% |
★★★★★★ |
|
Fiducian Group |
NA |
10.00% |
9.57% |
★★★★★★ |
|
Tribune Resources |
NA |
-10.33% |
-48.18% |
★★★★★★ |
|
Hearts and Minds Investments |
NA |
47.09% |
49.82% |
★★★★★★ |
|
Spheria Emerging Companies |
NA |
-1.31% |
0.28% |
★★★★★★ |
|
Red Hill Minerals |
NA |
95.16% |
40.06% |
★★★★★★ |
|
Djerriwarrh Investments |
2.39% |
8.18% |
7.91% |
★★★★★★ |
|
Zimplats Holdings |
5.44% |
-9.79% |
-42.03% |
★★★★★☆ |
|
Peet |
53.46% |
12.70% |
31.21% |
★★★★☆☆ |
|
Australian United Investment |
1.90% |
5.23% |
4.56% |
★★★★☆☆ |
We’ll examine a selection from our screener results.
Simply Wall St Value Rating: ★★★★★☆
Overview: Generation Development Group Limited focuses on the marketing and management of life insurance and life investment products and services in Australia, with a market cap of A$2.70 billion.
Operations: GDG generates revenue through its life insurance and life investment products and services in Australia. The company’s market cap stands at approximately A$2.70 billion.
Generation Development Group, a nimble player in the Australian life insurance and investment sector, reported a substantial leap in net income to A$38.25 million for the year ending June 2025, up from A$5.84 million previously. Earnings per share also rose to A$0.1163 from A$0.0301, reflecting strong performance despite recent shareholder dilution concerns. With no debt on its books and positive free cash flow of approximately A$8 million as of June 2025, GDG is poised for growth with strategic acquisitions like Evidentia enhancing its market position amid demographic shifts favoring annuity products. However, integration risks and potential policy changes present challenges ahead.
ASX:GDG Debt to Equity as at Aug 2025Kina Securities
Simply Wall St Value Rating: ★★★★☆☆
Overview: Kina Securities Limited operates as a provider of commercial banking, financial services, fund administration, investment management, and share brokerage in Papua New Guinea with a market capitalization of A$401.43 million.
Operations: Kina Securities generates revenue primarily from its Banking & Finance segment, which contributed PGK 441.25 million, and Wealth Management, adding PGK 50.19 million. The company reported a net profit margin of 26%, indicating efficient cost management relative to its revenue streams.
Kina Securities, a financial entity with PGK5.4 billion in assets and PGK680.3 million in equity, offers an intriguing mix of potential growth and challenges. With 95% of its liabilities from low-risk customer deposits, the company has a solid funding base despite high bad loans at 7.7%. Its price-to-earnings ratio of 9.4x is attractive compared to the market average of 19x, indicating good value for investors seeking opportunities in smaller companies. However, a low allowance for bad loans at 27% could pose risks amidst rising operational costs and volatile revenue streams from multinational clients impacting profitability stability.
ASX:KSL Earnings and Revenue Growth as at Aug 2025Zimplats Holdings
Simply Wall St Value Rating: ★★★★★☆
Overview: Zimplats Holdings Limited is involved in the production of platinum and associated metals in Zimbabwe, with a market capitalization of A$1.74 billion.
Operations: Zimplats Holdings generates revenue primarily from its metals and mining segment, specifically gold and other precious metals, totaling $826.59 million. The company’s financial performance is influenced by its ability to manage costs associated with the production of these metals.
Zimplats Holdings, a notable player in the mining sector, has shown impressive growth with earnings surging by 393% over the past year, significantly outpacing the industry average of 14%. Despite a challenging five-year period where earnings declined by 42% annually, recent results reflect resilience with net income climbing to US$40.5 million from US$8.22 million last year. The company boasts high-quality earnings and maintains a satisfactory net debt to equity ratio of 0.01%, indicating prudent financial management. While free cash flow remains negative, Zimplats’ profitability ensures that cash runway isn’t an immediate concern for future operations.
-
Delve into the full analysis health report here for a deeper understanding of Zimplats Holdings.
-
Gain insights into Zimplats Holdings’ past trends and performance with our Past report.
ASX:ZIM Debt to Equity as at Aug 2025Summing It All Up
-
Explore the 51 names from our ASX Undiscovered Gems With Strong Fundamentals screener here.
-
Are any of these part of your asset mix? Tap into the analytical power of Simply Wall St’s portfolio to get a 360-degree view on how they’re shaping up.
-
Enhance your investing ability with the Simply Wall St app and enjoy free access to essential market intelligence spanning every continent.
Ready For A Different Approach?
-
Explore high-performing small cap companies that haven’t yet garnered significant analyst attention.
-
Fuel your portfolio with companies showing strong growth potential, backed by optimistic outlooks both from analysts and management.
-
Find companies with promising cash flow potential yet trading below their fair value.
This article by Simply Wall St is general in nature. We provide commentary based on historical data and analyst forecasts only using an unbiased methodology and our articles are not intended to be financial advice. It does not constitute a recommendation to buy or sell any stock, and does not take account of your objectives, or your financial situation. We aim to bring you long-term focused analysis driven by fundamental data. Note that our analysis may not factor in the latest price-sensitive company announcements or qualitative material. Simply Wall St has no position in any stocks mentioned.
Companies discussed in this article include ASX:GDG ASX:KSL and ASX:ZIM.
Have feedback on this article? Concerned about the content? Get in touch with us directly. Alternatively, email editorial-team@simplywallst.com
FMC Corporation (NYSE:FMC) ranks among the best mid-cap materials stocks to buy now. On August 13, Barclays reiterated its Overweight rating on FMC Corporation (NYSE:FMC) with a price target of $48, down from $49. The firm’s forecast for FMC’s fiscal year 2025 revenues remains essentially unchanged, estimating flat sales year over year (down 1%), or around $4.2 billion.
SUWIT NGAOKAEW/Shutterstock.com
Barclays stated that FMC’s second-quarter performance crossed expectations by almost 20%, leading it to modestly increase its adjusted earnings per share projection to $3.45.
The investment bank is keeping an eye on FMC’s new go-to-market strategy, credit, and inventory levels as the company reports its second-half earnings.
Founded in 1883 as an insecticide factory, FMC Corporation (NYSE:FMC) is an American chemical manufacturing company that has since branched out into other industries, including lithium.
While we acknowledge the potential of FMC as an investment, we believe certain AI stocks offer greater upside potential and carry less downside risk. If you're looking for an extremely undervalued AI stock that also stands to benefit significantly from Trump-era tariffs and the onshoring trend, see our free report on the best short-term AI stock.
READ NEXT: 10 Best Magic Formula Stocks for 2025 and 10 Best Retirement Stocks to Buy According to Hedge Funds.
Disclosure: None. This article is originally published at Insider Monkey.
If you would like to receive our free newsletter via email, simply enter your email address below & click subscribe.
 Follow us on Twitter
 Become our facebook fan
CONNECT WITH US
Tweets
Tweet with hash tag #miningfeeds or @miningfeeds and your tweets will be displayed across this site.
MOST ACTIVE MINING STOCKS
Daily Gainers
 CMC Metals Ltd. CMC Metals Ltd. |
CMB.V | +900.00% |
 Eden Energy Ltd Eden Energy Ltd |
EDE.AX | +200.00% |
| GoviEx Uranium Inc. |
GXU.V | +42.86% |
| Eagle Nickel Ltd. |
ENL.AX | +41.67% |
| Citigold Corp. Limited |
CTO.AX | +33.33% |
| Mount Burgess Mining NL |
MTB.AX | +33.33% |
| Exalt Resources Limited |
ERD.AX | +31.94% |
| Casa Minerals Inc. |
CASA.V | +30.00% |
| Cariboo Rose Resources Ltd |
CRB.V | +28.57% |
| Belmont Resources Inc. |
BEA.V | +28.57% |

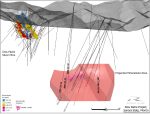


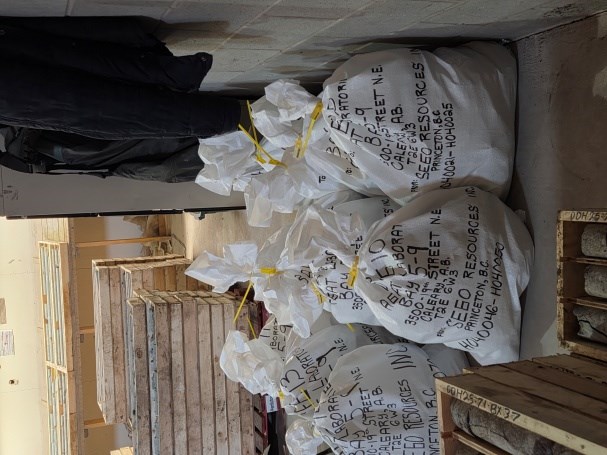
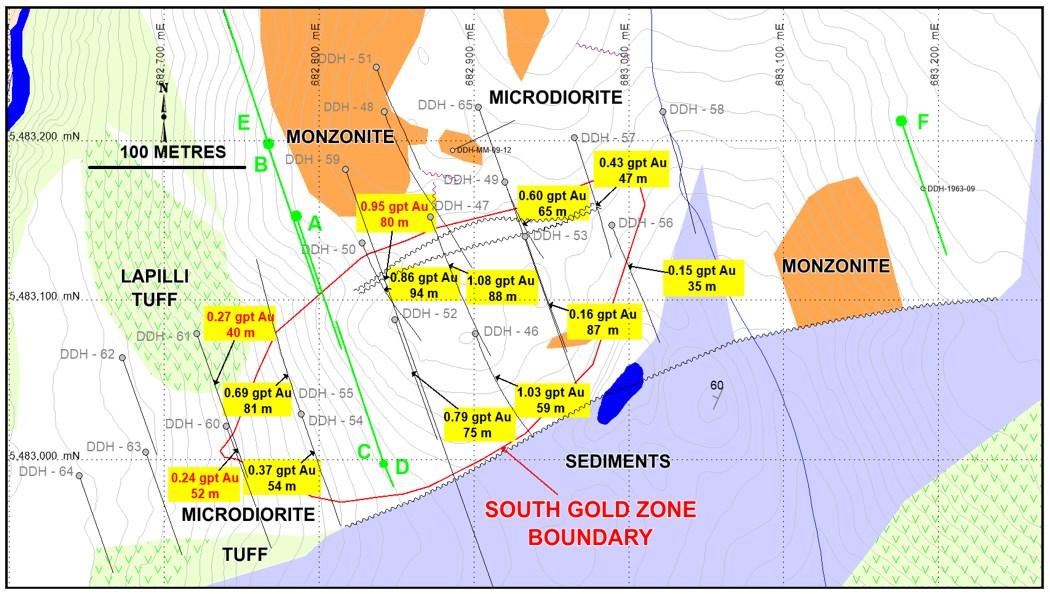
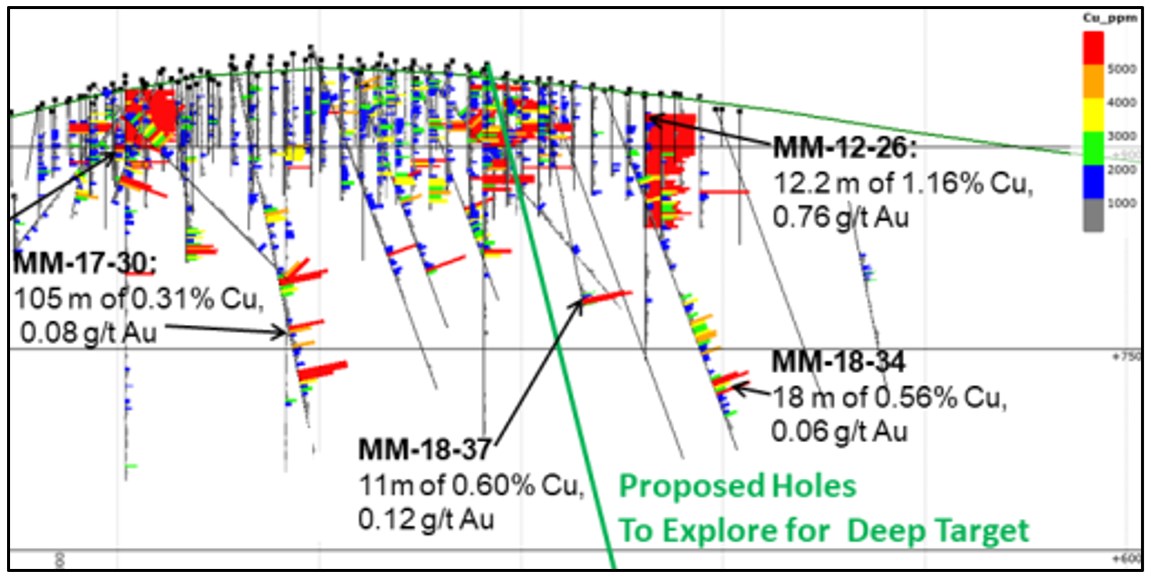