NOT FOR DISTRIBUTION TO U.S. NEWSWIRE SERVICES OR DISSEMINATION IN THE UNITED STATES
VANCOUVER, British Columbia, May 18, 2026 (GLOBE NEWSWIRE) — Apex Critical Metals Corp. (CSE: APXC) (OTCQX: APXCF) (FWB: KL9) (“Apex” or the “Company”), a Canadian mineral exploration company focused on the identification and development of critical and strategic metals, announces that it has entered into an agreement with Canaccord Genuity Corp. to act as lead agent and sole bookrunner along with a syndicate of agents to be formed (the “Agents”) in connection with a “best efforts” private placement of up to 5,264,000 units of the Company (each, a “Unit”, and, collectively, the “Units”) at a price of C$1.90 per Unit (the “Offering Price”) for aggregate gross proceeds of up to C$10,001,600 (the “Offering”) under the Listed Issuer Financing Exemption (as defined below).
Each Unit will consist of one common share of the Company (each, a “Common Share” and, collectively, the “Common Shares”) and one Common Share purchase warrant of the Company (each, a “Warrant” and, collectively, the “Warrants”). Each Warrant will be exercisable to acquire one Common Share (each, a “Warrant Share”, and, collectively, the “Warrant Shares”) at a price of C$2.60 per Warrant Share for a period of 24 months from the Closing Date (as defined below). The Warrants to be issued pursuant to the Offering will not be listed for trading on any stock exchange. The Offering is expected to close on or about June 2, 2026 (the “Closing Date”), or such other date as determined by the Company and the Agents, such date being no later than 45 days from the date hereof.
The Company will grant the Agents an option (the “Agents’ Option”) to sell up to 789,600 additional Units at the Offering Price for additional gross proceeds of up to $1,500,240. The Agents’ Option shall be exercisable at any time up to 48 hours prior to the Closing Date.
Subject to compliance with applicable regulatory requirements and in accordance with National Instrument 45-106 – Prospectus Exemptions (“NI 45-106”), the Offering is being made to purchasers resident in all provinces and territories of Canada, except Québec, pursuant to the listed issuer financing exemption under Part 5A of NI 45-106 (the “Listed Issuer Financing Exemption”). The Units to be offered under the Listed Issuer Financing Exemption will not be subject to a hold period in Canada in accordance with applicable Canadian securities laws.
The Units will also be offered to investors outside of Canada pursuant to BC Instrument 72-503 – Distributions of Securities outside British Columbia, provided it is understood that no prospectus filing or comparable obligation arises in such other jurisdiction. Any sale of Units to persons in the United States will be made to “Accredited Investors” pursuant to Rule 506(b) of Regulation D (including “Qualified Institutional Buyers” as defined in Rule 144A who are also “Accredited Investors”) adopted by the United States Securities and Exchange Commission under the United States Securities Act of 1933, as amended (the “U.S. Securities Act”).
As consideration for their services in connection with the Offering, the Agents will receive a cash commission equal to 6% of the gross proceeds of the Offering and compensation warrants equal to 3% of the aggregate number of Units sold under the Offering (the “Compensation Warrants”), with each Compensation Warrant exercisable to purchase one Common Share at C$1.90 for a period of 24 months from the Closing Date. In each case, the consideration will be reduced to 3% in the case of President’s List investors.
The gross proceeds of the Offering will be used to fund exploration of the Company’s Rift Project, the CAP Project, and the Lac Le Moyne Project, and for general working capital purposes as further set out in the Offering Document (as defined below).
There is an offering document (the “Offering Document”) related to the Offering that can be accessed under the Company’s issuer profile on SEDAR+ at www.sedarplus.ca and on the Company’s website at: www.apexcriticalmetals.com. Prospective investors should read this Offering Document before making an investment decision.
This news release does not constitute an offer to sell or a solicitation of an offer to buy securities in the United States, nor will there be any sale of the securities in any jurisdiction in which such offer, solicitation, or sale would be unlawful. The securities offered have not been and will not be registered under the U.S. Securities Act or any state securities laws and may not be offered or sold in the United States or to U.S. Persons unless registered under the U.S. Securities Act and applicable state securities laws or an exemption from such registration is available.
About Apex Critical Metals Corp. (CSE: APXC) (OTCQX: APXCF) (FWB: KL9)Apex Critical Metals Corp. is a Canadian exploration company focused on advancing rare earth element (REE) and niobium projects that support the growing demand for critical and strategic metals across the United States and Canada.
With a growing portfolio of critical mineral projects in both Canada and the United States, Apex Critical Metals is strategically positioned to help strengthen domestic supply chains for the minerals essential to advanced technologies, clean energy, and national security. Apex is publicly listed in Canada on the Canadian Securities Exchange (CSE) under the symbol APXC and quoted on the OTCQX market in the United States under the symbol APXCF, and in Germany on the Borse Frankfurt under the symbol KL9 and/or WKN: A40CCQ. Find out more at www.apexcriticalmetals.com and watch our videos at https://apexcriticalmetals.com/media/ and make sure to stay in touch by signing up for free news alerts at https://apexcriticalmetals.com/news/news-alerts/, or by following us on X (formerly Twitter), Facebook or LinkedIn.
On Behalf of the Board of Directors
APEX CRITICAL METALS CORP.,
Sean Charland
Chief Executive Officer
Tel: 604.681.1568
Email: info@apexcriticalmetals.com
Neither the Canadian Securities Exchange nor its Regulation Services Provider (as that term is defined in the policies of the CSE) accepts responsibility for the adequacy or accuracy of this release.
Cautionary Note Regarding Forward-Looking Statements
This news release contains forward-looking statements and other statements that are not historical facts. Forward-looking statements are often identified by terms such as “will”, “may”, “should”, “anticipate”, “expects” and similar expressions. All statements other than statements of historical fact, included in this news release are forward-looking statements that involve risks and uncertainties. Forward-looking statements in this press release include, but are not limited to, statements regarding the Company’s exploration and development plans with respect to its projects, statements regarding the Offering including, without limitation, statements regarding the completion or the expected Closing Date, the completion of all required regulatory filings, the use of gross proceeds, and the Company’s anticipated business and operational activities. There can be no assurance that such statements will prove to be accurate and actual results and future events could differ materially from those anticipated in such statements. Important factors that could cause actual results to differ materially from the Company’s expectations include, but are not limited to, delay or failure to receive regulatory approvals, investor demand, inability to complete the Offering, delay or failure to close the Offering, the inherently unpredictable nature of resource exploration, market conditions and the risks detailed from time to time in the filings made by the Company with securities regulators. The reader is cautioned that assumptions used in the preparation of any forward-looking information may prove to be incorrect. Events or circumstances may cause actual results to differ materially from those predicted, as a result of numerous known and unknown risks, uncertainties, and other factors, many of which are beyond the control of the Company. The reader is cautioned not to place undue reliance on any forward-looking information. Such information, although considered reasonable by management at the time of preparation, may prove to be incorrect, and actual results may differ materially from those anticipated.
Forward-looking statements contained in this news release are expressly qualified by this cautionary statement. The forward-looking statements contained in this news release are made as of the date of this news release and the Company will update or revise publicly any of the included forward- looking statements as expressly required by applicable law.
Highlights:
-
RIFT26-005A, a ~180 m western step-out from RIFT26-003 (80.0 m at 2.29% REO, including 23.7 m at 4.02% REO – See News Release Dated April 28, 2026) expanding the upper high-grade REO horizon (herein termed "Trinity Zone")
-
137.2 m at 2.01% REO(1) from 252.6 m depth
-
Including 80.0 m at 2.51%, or 23.1 m at 3.47%, or 11.0 m at 4.39% REO
-
-
Numerous samples within the 137.2 m interval grading >4.00% REO, to a maximum of 6.59% REO m (See Image 1)
-
-
RIFT26-006
-
43.8 m of 2.75% REO including 34.1 m of 3.05% REO within a broader mineralized envelope (210.0 m at 1.33% REO)
-
-
Trinity Zone is interpreted to dip shallowly to the west and remains strongly associated with hematite alteration observed within the carbonatite
-
Trinity Zone is now defined over an approximate 300 m strike length and ~180 m down-dip. Successive step-out drillholes continue to demonstrate strong continuity of high-grade REO mineralization, with RIFT26-005A returning the strongest width x grade intercept of the 2026 program to date.
-
The high-grade Trinity Zone remains open in all directions.
-
Sean Charland, CEO of Apex Critical Metals, commented: "The results from these three step-out drillholes, including our best grade x width results to-date, continues to demonstrate the extension and expansion potential of the upper high-grade REO horizon (Trinity Zone). The growing mineralized footprint and consistency observed from assay results to-date increases confidence in the shallow west-dipping Trinity Zone and future targeting, with mineralization remaining open in all directions. With a significant volume of assays still pending and two rigs still actively turning, we are well positioned to delineate mineralization well beyond the early successes from our 2026 drill campaign."
VANCOUVER, BC / ACCESS Newswire / May 15, 2026 / Apex Critical Metals Corp. (CSE:APXC)(OTCQX:APXCF)(FWB:KL9) ("Apex" or the "Company"), a mineral exploration company focused on advancing its strategic 100%-controlled Rift Rare Earth Project within the Elk Creek Carbonatite Complex in southeastern Nebraska, U.S.A., is pleased to report the assay results from drillholes RIFT26-004, RIFT26-005A and partial results from RIFT26-006 (162.2 to 500.8 m).
Key Observations and Takeaways
Assay results from RIFT26-004, RIFT26-005A and RIFT26-006 confirm continuity of the upper high-grade REO horizon at depth, herein termed the Trinity Zone. The Trinity Zone is now interpreted to dip shallowly to the west and remains strongly associated with hematite alteration within the host carbonatite, consistent with observations across all previously reported drillholes (See News Releases Dated April 7, 2026 and April 28, 2026).
RIFT26-005A was designed as an approximately 180 m western step-out of RIFT26-003, which returned 80.0 m at 2.29% REO including 23.7 m at 4.02% REO in the Trinity Zone See News Release Dated April 28, 2026). Drillhole RIFT26-005A successfully intersected the Trinity Zone at depth returning an even broader interval at >2% REO (137.2 m at 2.01% REO from 252.6 m depth), including 23.1 m at 3.47% REO from 290.5 m or 11.8 m at 4.23% REO from 301.7 m (see Table 2 and Figure 2).
RIFT26-004 and RIFT26-006 were drilled from the same drill pad at different orientations, targeting the western extension of the Trinity Zone previously intersected in RIFT26-001A (45.0 m at 2.07% REO, including 24.9 m at 2.40% REO (See News Release Dated April 28, 2026) and historical drillhole NEC11-004 (See News Release Dated October 1, 2025). RIFT26-006 intersected a broad, continuous interval of 210.0 m at 1.33% REO from 191.8 m depth, with two distinct higher-grade zones of 43.2 m at 1.61% REO and 43.8 m at 2.75% REO including34.1 m at 3.05% REO (Table 2). RIFT26-004 intersected the Trinity Zone over two discrete intervals: 15.6 m at 2.10% REO from 216.5 m, and a second interval of 18.8 m at 2.01% REO from 320.6 m depth (Table 2).
Results from these three drillholes, together with historical and previously reported results from RIFT26-002 (81.6 m at 2.02% REO including 50.9 m at 2.40% REO – See News Release Dated April 7, 2026), RIFT26-001A and RIFT26-003, demonstrate that the Trinity Zone maintains grade and continuity over an approximate 300 m strike length within the greater 700 m mineralized corridor. Coupled with the elevated NdPr(2) distributions previously reported from the underlying Neo Zone (See News Release Dated May 6, 2026), these results reinforce the potential for a significant multi-horizon rare earth mineralized system at the Rift Project.
Figure 1. 2026 Phase I drill plan at the Rift Project showing the location and assay results of drillhole RIFT26-004, RIFT26-005A and partial assay results for RIFT26-006 (reported herein), along with active and completed drillholes, selected planned drillholes, and historical drillhole locations.
Figure 2. RIFT26-005A & RIFT26-003 assay results at the Rift Project highlighting the Trinity Zone
Table 1: Drillhole Location and Attritbutes
|
Hole ID |
Depth (m) |
Azimuth(b) (°) |
Dip(b) (°) |
Easting (a) |
Northing (a) |
Elevation |
|
RIFT26-004 |
710.16 |
80 |
-60 |
741888 |
4460786.8 |
332.22 |
|
RIFT26-005A |
806.23 |
80 |
-60 |
741877 |
4460557.9 |
333.14 |
|
RIFT26-006 |
870 |
80 |
-70 |
741888 |
4460786.8 |
332.22 |
|
(a)Coordinates are presented in NAD83 UTMZ14 (b) Azimuth and Dip are planned and may vary downhole |
||||||
Table 2: RIFT26-004, RIFT26-005A and RIFT26-006 (partial) Assay Summary
(a) All reported intervals are downhole core lengths, and do not represent true widths, which remain unknown until further confirmation assay results are received and interpreted.
Image 1. RIFT26-005A interval of 3.25 m from 309.5 m to 312.75 m (red box) averaging 4.61% REO, including samples RIFT005A-207 (4.46% REO over 0.98 m), RIFT005A-208 (6.59% REO over 0.52 m), RIFT005A-209 (3.26% REO over 0.96 m) and RIFT005A-211 (5.12% REO over 0.79 m)
Program Status and Next Steps
The Company has completed additional drillholes designed to further test the extent of mineralization along strike and at depth with assay results pending. Ongoing refinement of the 3D geological model, including integration of assay results as received, will support improved understanding of the mineralized system and help prioritize future drill targeting. The 2026 drill program remains ongoing, with a total of fifteen (15) drillholes completed to date for approximately 11,000 m, with assays currently pending for nine (9) drillholes.
Quality Assurance / Quality Control
All drilling was completed using one truck and one track mounted diamond drill rigs with HQ size core and all drill core samples have been or will be shipped to Activation Laboratories Ltd. (Actlabs) preparation facility in Ancaster, Ontario, for standard sample preparation (code RX1) which includes drying, crush (< 7 kg) up to 80% passing 2 mm, riffle split (250 g) and pulverize (mild steel) to 95% passing 105 µm. The samples were subsequently analyzed using Code 8 by XRF Nb₂O₅, ZrO2 and Ta2O5 (0.003%), Code 8 – REE Assay (lithium metaborate/tetraborate fusion with subsequent analysis by ICP and ICP/MS). Drill core was saw-cut with half-core sent for geochemical analysis and half-core remaining in the box onsite.
A Quality Assurance/Quality Control protocol was incorporated into the program and included the insertion of certified reference material and silica blanks at a rate of approximately 5% and 5%, respectively. Additional analysis of pulp-split and reject-split sample duplicates was also completed at a rate of approximately 5% and 2.5%, respectively, to assess analytical precision at different stages. Actlabs Canada is independent of the Company.
Management cautions that the interception of carbonatite and associated hematite alteration is not necessarily indicative of mineralization. Assay results are required to confirm the presence, grade, and significance of any mineralization.All intercepts reported in this news release represent core length (apparent width). True widths have not yet been determined.
(1) REO (Rare Earth Oxide) is defined as the sum of Ce2O3, La2O3, Pr2O3, Nd2O3, Eu2O3, Sm2O3, Gd2O3, Tb2O3, Dy2O3, Ho2O3, Er2O3, Tm2O3, Yb2O3, Lu2O3, and Y2O3.
(2) NdPr distribution calculated as (Nd2O3 + Pr2O3) / REO x 100
Qualified Person
The technical content of this news release has been reviewed and approved by Nathan Schmidt, P. Geo., a Qualified Person under NI 43-101 on standards of disclosure for mineral projects. Mr. Schmidt is a Geologist with Dahrouge Geological Consulting Ltd., the consulting firm engaged by Apex Critical Metals Corp. to conduct and oversee all of the Company's exploration work, including the 2026 drill program.
Mr. Schmidt has verified all scientific and technical data disclosed in this news release including the sampling and QA/QC results, and certified analytical data underlying the technical information disclosed. Mr. Schmidt noted no errors or omissions during the data verification process. The Company and Mr. Schmidt do not recognize any factors of sampling or recovery that could materially affect the accuracy or reliability of the assay data disclosed in this news release.
About Apex Critical Metals Corp. (CSE:APXC) (OTCQX:APXCF) (FWB:KL9)
Apex Critical Metals Corp. is a Canadian exploration company focused on advancing rare earth element (REE) and niobium projects that support the growing demand for critical and strategic metals across the United States and Canada. The Company's flagship Rift Project, located within the highly prospective Elk Creek Carbonatite Complex in Nebraska, U.S.A., hosts extensive rare earth rights surrounding one of North America's most advanced niobium-REE deposits. Historical drilling across the complex has reported broad intervals of high-grade REE mineralization, including intercepts such as 155.5 m of 2.70% REO and 68.2 m of 3.32% REO. Phase I step out drill holes at Rift have expanded the footprint of the high-grade mineralization over approximately 275.0 m from the historical drill holes with 23.7 m of 4.02% REO and multiple broad intervals of >2.00% REO. Additionally, Phase I drilling has delineated a new zone of strongly elevated NdPr beneath the high-grade material that extends for approximately 390 m with 13.5 m of 1.08% REO at 31.7 % NdPr and 10.9m of 0.99% REO and 30.1 % NdPr within a broader zone of 22.7 m of 0.79% REO at 32.8% NdPr.
In Canada, Apex continues to advance its 100%-owned Cap Project, located 85 kilometres northeast of Prince George, British Columbia. The 2025 drill program confirmed a significant niobium discovery with 0.59% Nb₂O₅ over 36 metres, including 1.08% Nb₂O₅ over 10 metres, within a 1.8-kilometre-long niobium trend. The Cap Project continues to demonstrate strong potential for niobium mineralization within a large and previously unrecognized carbonatite system.
With a growing portfolio of critical mineral projects in both Canada and the United States, Apex Critical Metals is strategically positioned to help strengthen domestic supply chains for the minerals essential to advanced technologies, clean energy, and national security. Apex is publicly listed in Canada on the Canadian Securities Exchange (CSE) under the symbol APXC and quoted on the OTCQX market in the United States under the symbol APXCF, and in Germany on the Borse Frankfurt under the symbol KL9 and/or WKN: A40CCQ. Find out more at www.apexcriticalmetals.com and watch our videos at https://apexcriticalmetals.com/apex-critical-metals-corporate-video/ and make sure to stay in touch by signing up for free news alerts at https://apexcriticalmetals.com/news/news-alerts/, or by following us on X (formerly Twitter), Facebook or LinkedIn.
On Behalf of the Board of Directors
APEX CRITICAL METALS CORP.,
Sean CharlandChief Executive OfficerTel: 604.681.1568Email: info@apexcriticalmetals.comNeither the Canadian Securities Exchange nor its Regulation Services Provider (as that term is defined in the policies of the CSE) accepts responsibility for the adequacy or accuracy of this release.
CAUTIONARY STATEMENT REGARDING FORWARD-LOOKING INFORMATION:
This news release may contain "forward-looking statements" under applicable Canadian securities legislation. Forward-looking statements consist of statements that are not purely historical, including any statements regarding beliefs, plans, expectations or intentions regarding the future. Forward-looking statements in this news release include (without limitation) statements regarding the Company's planned Phase I drill program and any subsequent drill programs and statements regarding the Company's US-based prospective assets (more particularly described above), including the potential for additional acquisitions and the potential for exploration, and statements regarding the potential for future exploration and drilling to confirm the source of magnetic anomalies. Forward-looking statements are subject to various known and unknown risks and uncertainties that may cause actual results, performance or developments to differ materially from those contained in the statements. Risks that could change or prevent these events, activities or developments from coming to fruition include: the Company's properties are at an early stage of development and no current mineral resources or reserves have been identified by the Company thereof, that we may not be able to fully finance any additional exploration on the Company's properties; that even if we are able to raise capital, costs for exploration activities may increase such that we may not have sufficient funds to pay for such exploration or processing activities; the timing and content of any future work programs; geological interpretations based on drilling that may change with more detailed information; potential process methods and mineral recoveries assumptions based on limited test work and by comparison to what are considered analogous deposits that, with further test work, may not be comparable; testing of our process may not prove successful or samples derived from our properties may not yield positive results, and even if such tests are successful or initial sample results are positive, the economic and other outcomes may not be as expected; the anticipated market demand for REE and other minerals may not be as expected; the availability of labour and equipment to undertake future exploration work and testing activities; geopolitical risks which may result in market and economic instability. There can be no assurance that such statements will prove to be accurate, as actual results and future events could differ materially from those anticipated in such statements. Accordingly, readers should not place undue reliance on forward-looking statements. The forward-looking statements herein are made as of the date hereof, and the Company disclaims any intention or obligation to update or revise any forward-looking statements, whether as a result of new information, future events or otherwise, except as required by law.
SOURCE: Apex Critical Metals Corp.
View the original press release on ACCESS Newswire
VANCOUVER, BC, May 14, 2026 /CNW/ – Eastern Platinum Limited (TSX: ELR)(JSE: EPS) ("Eastplats" or the "Company") is pleased to report that it has filed its condensed interim consolidated financial statements for the three months ended March 31, 2026 and the corresponding management's discussion and analysis ("MD&A"). Below is a summary of the Company's financial results for the first quarter of 2026 ("Q1 2026") in comparison to the same respective period in 2025 ("Q1 2025") (all amounts in USD unless specified):
- Revenue for Q1 2026 decreased to $13.8 million (Q1 2025 – $14.8 million), representing a $1.0 million or -6.8% decrease.
- Mine operating income increased by $5.4 million to $0.7 million in Q1 2026 (Q1 2025 – mine operating loss of $4.7 million) while gross margin increased from -31.6% in Q1 2025 to 4.8% in Q1 2026. The improvement was mainly due to an increase in platinum-group-metal ("PGM") sales and the completion of shifting processing feed from the tailings storage facility ("TSF") in Q1 2025 to run-of-mine ("ROM") UG2 ore from the Zandfontein underground section of the Crocodile River Mine ("CRM") in the first half of 2025.
- Operating loss was $3.0 million in Q1 2026 compared to $8.1 million in Q1 2025, primarily due to lower production costs incurred during the period.
- Net loss attributable to equity shareholders was $4.1 million ($0.02 loss per share) in Q1 2026 versus net loss attributable to equity shareholders of $6.9 million ($0.03 loss per share) in Q1 2025. The decrease in net loss was largely attributable due to the decrease in overall production costs incurred at the CRM.
- The Company had a working capital deficit (current assets less current liabilities) of $58.4 million as at March 31, 2026 (December 31, 2025 – working capital deficit of $56.9 million) and short-term cash resources of $73,000 (consisting of cash and cash equivalents) (December 31, 2025 – $177,000).
Wanjin Yang, Chief Executive Officer and President of Eastplats commented, "We had a challenging first quarter as monthly run-of-mine processing tonnages at the Crocodile River Mine were lower than targeted. That said, we are encouraged by the positive mine operating income and continue to focus on operational efficiencies to improve PGM and chrome production."
Operations
The Company derived revenue from the processing of PGM and chrome concentrates at the CRM. Eastplats' majority of revenue (81% for Q1 2026; 28% in Q1 2025) is from PGM concentrate sales to Impala Platinum Limited under related offtake agreements. This is in line with the Company's expectations as it continues to ramp up production at the CRM.
The Company started processing ROM UG2 ore from the Zandfontein underground section at the CRM during the third quarter of 2024, at higher grades of chrome and PGM recovery, respectively.
Summary of chrome production from underground operations for the three months ended March 31, 2026 and 2025:
|
Q1 2026 |
Q1 2025 |
|
|
Total ROM Feed (tons) |
55,638 |
44,947 |
|
Average grade Cr concentrate |
40.62 % |
40.63 % |
|
Tons of Cr concentrate |
16,757 |
9,761 |
Summary of PGM production for the three months ended March 31, 2026 and 2025:
|
Q1 2026 |
Q1 2025 |
|
|
Average 6E grade (grams per ton)* |
145 |
147 |
|
Tons of PGM concentrate |
1,016 |
671 |
|
PGM ounces produced (6E)* |
4,751 |
3,175 |
*PGM 6E grades and ounces are estimates until final exchanges and umpire results have been concluded, which can take up to three months.
The retreatment project at the CRM ceased operations as of March 17, 2025, as the original CRM tailings from the TSF were fully processed. Summary of chrome production from the Retreatment Project at the CRM for the three months ended March 31, 2026 and 2025:
|
Q1 2026 |
Q1 2025 |
|
|
Total Tailings Feed (tons) |
– |
109,919 |
|
Average grade Cr concentrate |
– |
36.54 % |
|
Tons of Cr concentrate |
– |
14,690 |
The Company has filed the following documents, under the Company's profile on SEDAR+ at www.sedarplus.ca:
- Condensed interim consolidated financial statements for the three months ended March 31, 2026; and
- Management's discussion and analysis for the three months ended March 31, 2026.
The condensed interim consolidated financial statements for the three months ended March 31, 2026 are available for download at https://www.eastplats.com/investors/quarterly-reports/F2026/ and are also available on the JSE's website at:
https://senspdf.jse.co.za/documents/2026/JSE/ISSE/EPS/Q126.pdf.
The Company has a primary listing on the Toronto Stock Exchange and a secondary listing on the JSE Limited.
About Eastern Platinum Limited
Eastplats owns directly and indirectly a number of PGM and chrome assets in the Republic of South Africa. All of the Company's properties are situated on the western limb (Crocodile River Mine) and eastern limb (Kennedy's Vale, Spitzkop, Mareesburg) of the Bushveld Complex, the geological environment that hosts approximately 80% of the world's PGM-bearing ore.
Operations at the Crocodile River Mine currently include mining and processing ore from the Zandfontein underground section to both produce PGM and chrome concentrates, respectively.
Cautionary Statement Regarding Forward-Looking Information
This news release contains "forward-looking statements" or "forward-looking information" (collectively referred to herein as "forward-looking statements") within the meaning of applicable securities legislation. Such forward-looking statements include, without limitation, forecasts, estimates, expectations and objectives for future operations that are subject to a number of assumptions, risks and uncertainties, many of which are beyond the control of the Company. Forward-looking statements are statements that are not historical facts and are generally, but not always, identified by the words "will," "plan," "intends," "may," "could," "expects," "anticipates" and similar expressions. Further disclosure of the risks and uncertainties facing the Company and other forward-looking statements are discussed in the Company's most recent Annual Information Form available under the Company's profile on www.sedarplus.ca.
In particular, this press release contains, without limitation, forward-looking statements pertaining to: improvement of PGM and chrome production results. These forward-looking statements are based on assumptions made by and information currently available to the Company. Although management considers these assumptions to be reasonable based on information currently available to it, they may prove to be incorrect. By their very nature, forward-looking statements involve inherent risks and uncertainties and readers are cautioned not to place undue reliance on these statements as a number of factors could cause actual results to differ materially from the beliefs, plans, objectives, expectations, estimates and intentions expressed in such forward-looking statements. These factors include, but are not limited to, unanticipated problems that may arise in the Company's production processes, commodity prices, lower than expected grades and quantities of resources, need for additional funding and availability of such additional funding on acceptable terms, economic conditions, currency fluctuations, competition and regulations, legal proceedings and risks related to operations in foreign countries.
All forward-looking statements in this news release are expressly qualified in their entirety by this cautionary statement, the "Cautionary Statement on Forward-Looking Information" section contained in the Company's most recent Management's Discussion and Analysis available under the Company's profile on www.sedarplus.ca. The forward-looking statements in this news release are made as of the date they are given and, except as required by applicable securities laws, the Company disclaims any intention or obligation, and does not undertake, to update or revise any forward-looking statements, whether as a result of new information, future events or otherwise.
No stock exchange, securities commission or other regulatory authority has approved or disapproved the information contained herein.
View original content to download multimedia: http://www.newswire.ca/en/releases/archive/May2026/14/c7157.html
The Australian share market has been experiencing a challenging period, with recent budget announcements and global economic concerns, such as rising U.S. inflation and fluctuating oil prices, impacting investor sentiment. In this environment, identifying promising small-cap stocks can be crucial for portfolio enhancement, as these undiscovered gems often possess growth potential that aligns well with the dynamic market landscape.
Top 10 Undiscovered Gems With Strong Fundamentals In Australia
| Name | Debt To Equity | Revenue Growth | Earnings Growth | Health Rating |
|---|---|---|---|---|
| Fiducian Group | NA | 9.85% | 10.78% | ★★★★★★ |
| Joyce | NA | 7.70% | 7.34% | ★★★★★★ |
| Bailador Technology Investments | NA | -6.04% | -6.00% | ★★★★★★ |
| Euroz Hartleys Group | NA | -2.67% | -37.02% | ★★★★★★ |
| Focus Minerals | NA | 75.66% | 75.61% | ★★★★★★ |
| WAM Strategic Value | NA | -9.74% | 30.51% | ★★★★★★ |
| SDI | 14.65% | 8.06% | 12.66% | ★★★★★☆ |
| Zimplats Holdings | 3.35% | -10.45% | -46.73% | ★★★★★☆ |
| AMCIL | NA | 2.99% | 1.18% | ★★★★★☆ |
| Australian United Investment | 6.80% | 2.27% | 1.31% | ★★★★☆☆ |
Let’s uncover some gems from our specialized screener.
Simply Wall St Value Rating: ★★★★☆☆
Overview: Kina Securities Limited operates as a provider of commercial banking, financial services, fund administration, investment management, and share brokerage in Papua New Guinea with a market capitalization of A$382.63 million.
Operations: Kina Securities generates revenue primarily through commercial banking and financial services, as well as fund administration, investment management, and share brokerage. The company’s market capitalization stands at A$382.63 million.
Kina Securities, a dynamic player in the financial sector, has shown robust performance with earnings growing 14% over the past year. It boasts total assets of PGK5.5 billion and equity of PGK717.9 million, supported by deposits totaling PGK4.6 billion against loans of PGK3.3 billion. The bank’s allowance for bad loans stands at a low 30%, though it faces high non-performing loans at 8.7%. Recent leadership changes aim to bolster its governance and financial strategy as it navigates market challenges and opportunities, underscoring its commitment to strategic growth and strong capital management practices in an evolving landscape.
- Click here and access our complete health analysis report to understand the dynamics of Kina Securities.
-
Gain insights into Kina Securities’ historical performance by reviewing our past performance report.
ASX:KSL Earnings and Revenue Growth as at May 2026Mayfield Group Holdings
Simply Wall St Value Rating: ★★★★★★
Overview: Mayfield Group Holdings Limited, with a market cap of A$349.76 million, operates in Australia offering electrical and telecommunications infrastructure products and services through its subsidiaries.
Operations: Mayfield generates revenue of A$145.64 million from its electrical and telecommunications infrastructure segment. The company’s net profit margin stands at 7.5%.
Mayfield Group Holdings, a dynamic player in the electrical industry, has seen its earnings surge by 115.8% over the past year, outpacing the industry’s 11.8% growth rate. This impressive performance is bolstered by a significant reduction in its debt-to-equity ratio from 5.5 to just 0.03 over five years, reflecting prudent financial management and more cash than total debt on hand. Recent strategic moves include Mayfield’s addition to both the S&P/ASX All Ordinaries and Emerging Companies Indexes, alongside key leadership appointments like Andrew Naffin as COO to drive operational excellence and strategic transformation across its operations.
- Navigate through the intricacies of Mayfield Group Holdings with our comprehensive health report here.
-
Explore historical data to track Mayfield Group Holdings’ performance over time in our Past section.
ASX:MYG Debt to Equity as at May 2026United Overseas Australia
Simply Wall St Value Rating: ★★★★★★
Overview: United Overseas Australia Ltd, along with its subsidiaries, is involved in property investment and development across Malaysia, Singapore, Vietnam, and Australia, with a market cap of A$1.21 billion.
Operations: The company generates revenue primarily through property investment and development activities in Malaysia, Singapore, Vietnam, and Australia. It has a market capitalization of A$1.21 billion.
United Overseas Australia, a small-cap player, has shown impressive growth with earnings jumping 60.4% over the past year, outpacing the Real Estate industry’s 40%. The company’s debt to equity ratio improved from 10.9% to 8.4% in five years, reflecting prudent financial management. A notable one-off gain of A$70.4 million impacted recent results, highlighting potential volatility in earnings quality. Trading at nearly 39% below estimated fair value suggests an attractive valuation for investors seeking opportunities in underappreciated stocks. Recent executive changes and a dividend declaration of A$0.02 per share further underscore its dynamic strategic direction and shareholder commitment.
ASX:UOS Debt to Equity as at May 2026Key Takeaways
- Dive into all 61 of the ASX Undiscovered Gems With Strong Fundamentals we have identified here.
- Invested in any of these stocks? Simplify your portfolio management with Simply Wall St and stay ahead with our alerts for any critical updates on your stocks.
- Elevate your portfolio with Simply Wall St, the ultimate app for investors seeking global market coverage.
Looking For Alternative Opportunities?
- Explore high-performing small cap companies that haven’t yet garnered significant analyst attention.
- Fuel your portfolio with companies showing strong growth potential, backed by optimistic outlooks both from analysts and management.
- Find companies with promising cash flow potential yet trading below their fair value.
This article by Simply Wall St is general in nature. We provide commentary based on historical data
and analyst forecasts only using an unbiased methodology and our articles are not intended to be financial advice. It does not constitute a recommendation to buy or sell any stock, and does not take account of your objectives, or your
financial situation. We aim to bring you long-term focused analysis driven by fundamental data.
Note that our analysis may not factor in the latest price-sensitive company announcements or qualitative material.
Simply Wall St has no position in any stocks mentioned.
Companies discussed in this article include ASX:KSL ASX:MYG and ASX:UOS.
Have feedback on this article? Concerned about the content? Get in touch with us directly. Alternatively, email editorial-team@simplywallst.com
Solitario Resources Corp. (NYSE American:XPL and SLR.TO) announced Wednesday the purchase and sale of 305,195 shares in company common stock, at a price of $0.77 per share for total gross proceeds of US$235,000.
A statement noted the Sale was made under the terms of the Amended and Restated Investor Rights Agreement dated June 11, 2025 between Solitario and a wholly owned subsidiary of Newmont Corporation. It noted Newmont chose to exercise a right to acquire the shares as permitted by the IRA at the average price of shares sold through Solitario's at-the-market program sales from Nov. 13, 2025, through April 6, 2026.
Upon the issuance of the shares, Newmont will hold 8,759,162 shares of Solitario common stock or approximately 9.4% of the outstanding shares, maintaining Newmont's interest prior to the current period's at-the-money program, the statement said.
Chris Herald, President and CEO of Solitario, said: "We are delighted that Newmont elected to exercise its right to maintain its ownership stake in Solitario and its equity ownership in Solitario."
Shares in SLR edged up $0.01 to $1.19 on the TSX yesterday. It was at last look down 1.9% in US premarket, having risen 2.3% in regular trade there yesterday.
DENVER, CO / ACCESS Newswire / May 13, 2026 / Solitario Resources Corp. ("Solitario" or the "Company") (NYSE American:XPL)( TSX:SLR) is pleased to announce the purchase and sale of 305,195 shares (the "Shares") of Company common stock, at a price of $0.77 per share for total gross proceeds of US$235,000 (the "Sale"). The Sale was made under the terms of the Amended and Restated Investor Rights Agreement dated June 11, 2025 (the "IRA") between Solitario and Newmont Overseas Exploration Ltd. ("Newmont"), a wholly owned subsidiary of Newmont Corporation. Newmont chose to exercise a right to acquire the Shares as permitted by the IRA at the average price of shares sold through Solitario's at-the-market program sales from Nov. 13, 2025, through April 6, 2026.
Upon the issuance of the Shares, Newmont will hold 8,759,162 shares of Solitario common stock or approximately 9.4% of the outstanding shares, maintaining Newmont's interest prior to the current period's at-the-money program.
Chris Herald, President and CEO of Solitario, stated: "We are delighted that Newmont elected to exercise its right to maintain its ownership stake in Solitario and its equity ownership in Solitario."
The Company did not engage an underwriter or registered placement agent for the Sale, and there were no underwriter discounts or commissions or placement agent fees. The net proceeds of the Sale will be used to advance the Company's exploration activities at its core projects and for general corporate purposes. Additional information regarding the Sale will be included in one or more reports to be filed by the Company with the Securities and Exchange Commission and United States and Canadian regulatory agencies, and this press release is subject to the further detail provided in such reports.
About Solitario
Solitario is a natural resource exploration company focused on potential high-quality Tier-1 gold, zinc, copper, and critical metals projects. The Company's common stock is traded on the NYSE American ("XPL") and on the Toronto Stock Exchange ("SLR"). Solitario owns a 100% interest in the 31,500-acre Golden Crest gold project in South Dakota. Solitario's Management and Directors hold approximately 7.8% (excluding options) of the Company's 93.1 million shares outstanding. Solitario's cash balance stands at approximately US$8.6 million. Additional information about Solitario is available online at www.solitarioresources.com.
For More Information Please Contact:
Christopher Herald, President and CEO, 303-534-1030, Ext. 1
Cautionary Statement Regarding Forward-Looking Information
This press release contains forward-looking statements within the meaning of the U.S. Securities Act of 1933 and the U.S. Securities Exchange Act of 1934, and as defined in the United States Private Securities Litigation Reform Act of 1995 (and the equivalent under Canadian securities laws), that are intended to be covered by the safe harbor created by such sections. Forward-looking statements are statements that are not historical facts. They are based on the beliefs, estimates and opinions of the Company's management on the date the statements are made and address activities, events or developments that Solitario expects or anticipates will or may occur in the future, and are based on current expectations and assumptions. Forward-looking statements involve numerous risks and uncertainties. Consequently, there can be no assurances that such statements will prove to be accurate and actual results and future events could differ materially from those anticipated in such statements. Such forward-looking statements include, without limitation, statements regarding the Company's expectation of the projected timing and outcome of engineering studies; expectations regarding the receipt of all necessary permits and approvals to implement a mining plan, if any, at any of its mineral properties. Important factors that could cause actual results to differ materially from those in the forward-looking statements include, among others, risks relating to risks that Solitario's and its joint venture partners' exploration and property advancement efforts will not be successful; risks relating to fluctuations in the price of zinc, gold, lead and silver; the inherently hazardous nature of mining-related activities; uncertainties concerning reserve and resource estimates; availability of outside contractors, and other activities; uncertainties relating to obtaining approvals and permits from governmental regulatory authorities; the possibility that environmental laws and regulations will change over time and become even more restrictive; and availability and timing of capital for financing the Company's exploration and development activities, including uncertainty of being able to raise capital on favorable terms or at all; as well as those factors discussed in Solitario's filings and reports with the U.S. Securities and Exchange Commission (the "SEC"), including Solitario's latest Annual Report on Form 10-K and its other SEC filings (and Canadian filings) including, without limitation, its latest Quarterly Report on Form 10-Q. The Company does not intend to publicly update any forward-looking statements, whether as a result of new information, future events, or otherwise, except as may be required under applicable securities laws.
SOURCE: Solitario Resources Corp.
View the original press release on ACCESS Newswire
VANCOUVER, B.C. – May 13, 2026 (NEWMEDIAWIRE) – Ares Strategic Mining Inc. (CSE: ARS) (OTCQX: ARSMF) (FRA: N8I1) is pleased to announce the successful completion of two of the most critical infrastructure components at its Lost Sheep Fluorspar Processing Facility in Utah: the installation of the plant's conveyor belt system and the completion of the facility's electrical and Motor Control Center ("MCC") systems.
Critical Systems Now Installed
The newly completed infrastructure includes:
-
Full installation of the plant's primary material handling and conveyor belt systems
-
Completion of the facility-wide electrical distribution network
-
Installation and integration of the plant's Motor Control Center (MCC) systems
-
Energization-ready infrastructure to support crushers, screens, flotation circuits, pumps, and processing equipment
The conveyor network forms the operational backbone of the processing facility, enabling the continuous and automated movement of ore between crushing, sorting, and processing stages. Meanwhile, the MCC and electrical systems provide centralized power distribution, process control, equipment protection, and operational automation throughout the plant.
MCC / Electrical Control Systems
James Walker, President and CEO of Ares Strategic Mining, commented: "The completion of the conveyor and MCC systems is one of the most important construction milestones we have achieved to date. These are not cosmetic additions – they are the central nervous system of the processing facility. Without these systems, industrial-scale processing cannot occur. Their completion marks a huge leap toward operational readiness and future production."
A Transformational Milestone Toward Production
The completion of these systems substantially de-risks the project and positions Ares to accelerate final mechanical installations and commissioning activities.
The MCC infrastructure is particularly significant because it:
-
Controls and distributes power across the entire plant
-
Enables synchronized operation of processing equipment
-
Supports future automation and scalability
-
Provides industrial-grade operational reliability and safety
Likewise, the conveyor system enables:
-
Continuous ore flow throughout the facility
-
Efficient material handling and throughput
-
Reduced operating downtime and labor requirements
-
Consistent feed rates for optimized processing performance
"You cannot operate a modern processing facility without these systems," Walker added. "This is foundational infrastructure – the kind of progress that transforms a construction project into an operating industrial facility."
Plant Construction Progress Overview
Building America's Domestic Fluorspar Supply Chain
Ares continues advancing toward becoming the leading domestic supplier of acidspar in the United States. Fluorspar is designated a critical mineral by the U.S. government and is essential for:
-
Semiconductor manufacturing
-
Fluorochemicals
-
Nuclear fuel processing
-
Steel and aluminum production
-
Defense and aerospace applications
With mining operations underway, ore stockpiling ongoing, and plant infrastructure nearing completion, the Company is rapidly positioning itself for initial processing and future deliveries into domestic and international markets.
About Ares Strategic Mining
Ares Strategic Mining Inc. is a mining company focused on the development of its fluorspar projects in the U.S. The Company aims to become a significant supplier of high-grade fluorspar to North American markets, supporting industries vital to modern technology and infrastructure.
Lost Sheep Fluorspar Project – Delta, Utah
100% owned – 5,982 acres – 353 Claims
Located in the Spor Mountain area, Juab County, Utah, approximately 214 km south-west of Salt Lake City.
Fully Permitted – including mining permits.
NI 43-101 Technical Report identified extensive high-grade fluorspar with low levels of impurities.
Mining plan approved by BLM
First approved by Rex Rowley – Area Manager, Bureau of Land Management – 24th August 1992.
Renewed by Paul B. Baker – Minerals Program Manager, Bureau of Land Management – 12th December 2016.
ON BEHALF OF THE BOARD OF DIRECTORS OF ARES STRATEGIC MINING INC.James WalkerChief Executive Officer and PresidentFor further information, please contact James Walker by email at info@aresmining.com
DISCLOSURE AND FORWARD-LOOKING STATEMENTS:
Companies typically rely on comprehensive feasibility reports on mineral reserve estimates to reduce the risks and uncertainties associated with a production decision. Historically, situations where the issuer decides to put a mineral project into production without first establishing mineral reserves supported by a technical report and completing a feasibility study have a higher risk of economic or technical failure, though some industrial mineral ventures are relatively simple operations with low levels of investment and risk, where the operating entity has determined that a formal prefeasibility or feasibility study in conformance with NI 43-101 and 43-101 CP is not required for a production decision. Based on historical engineering work, geological reports, historical production data and current engineering work completed or in the process by Ares, the Company intends to move forward with the development of its Utah asset.
Certain information in this news release may contain forward-looking statements that involve substantial known and unknown risks and uncertainties. Forward-looking statements are often identified by terms such as "will", "may", "should", "anticipate", "expects" and similar expressions. All statements other than statements of historical fact included in this news release are forward-looking statements that involve risks and uncertainties. There can be no assurance that such statements will prove to be accurate and actual results and future events could differ materially from those anticipated in such statements. Important factors that could cause actual results to differ materially from the Company's expectations include the failure to satisfy the conditions of the relevant securities exchange(s) and other risks detailed from time to time in the filings made by the Company with securities regulations. The reader is cautioned that assumptions used in the preparation of any forward-looking information may prove to be incorrect. Events or circumstances may cause actual results to differ materially from those predicted, as a result of numerous known and unknown risks, uncertainties, and other factors, many of which are beyond the control of the Company. The reader is cautioned not to place undue reliance on any forward-looking information. Such information, although considered reasonable by management at the time of preparation, may prove to be incorrect and actual results may differ materially from those anticipated. Forward-looking statements contained in this news release are expressly qualified by this cautionary statement. The forward-looking statements contained in this news release are made as of the date of this news release and the Company disclaims any intention or obligation to update or revise such information, except as required by applicable law.
View the original release on www.newmediawire.com
OTTAWA, ON, May 13, 2026 /CNW/ – Northern Shield Resources Inc. ("Northern Shield" or the "Company") (TSXV: NRN) is pleased to provide updates on exploration at Root & Cellar and CSM properties in the Avalon Terrane of Eastern Newfoundland. The Company's flagship Root & Cellar Property ("Root & Cellar"), on the Burin Peninsula in southeastern Newfoundland, is being explored for porphyry copper +/- molybdenum, gold and tellurium and epithermal gold-silver-tellurium. The CSM Property ("CSM"), located on the Avalon Peninsula about 100 km to the east of Root & Cellar, is being explored for magmatic Ni-Cu-Co and porphyry copper style mineralization.
At the Root & Cellar, line-cutting has been completed on the grid over the Creston Copper Zone ("Creston") with a 3D-IP geophysical survey estimated to commence by mid-May. Creston is defined by a 2 km diameter copper soil and rock sample anomaly and represents one of the largest copper footprints on the Burin Peninsula. A diatreme breccia pipe complex, measuring approximately 1,600 × 800 metres occupies the centre of the target. Three phases of copper mineralization are noted in the diatreme breccia, along with lead and zinc mineralization, believed to have precipitated from a vapour phase, which is interpreted as evidence of an underlying magmatic-hydrothermal system. A 2,000 to 3,000 m drilling program is planned to test targets defined by the 3D-IP survey.
CSM, further to the east in the Avalon Terrane, was originally acquired for its porphyry copper potential. The Company believes that the east-west rift system where Root & Cellar is located, continues across Placentia Bay to the south end of the Avalon Peninsula where it intersects a north-trending rift system. The southern portion of CSM covers a distinct cluster of till samples anomalous in copper, nickel and cobalt in an area of limited bedrock exposure. However, government geology maps show multiple gabbroic sills with strike lengths exceeding 10 km, hosted in sedimentary carbonate and shale sequences. A high resolution airborne magnetic survey totalling 3,200 line-kilometers has been completed over CSM by Prospectair Surveys at 50 m line-spacing. Processing and modelling of the data is underway with an initial review of the unprocessed data supporting the existence of multiple thin sills and highlighting unmapped dikes that coincide with the tend of the east-west rift. Based on these results and regional gravity data which suggests the prospective geology continues at depth to the north of the original claim block, CSM has been expanded from 135 km2 to 292 km2. Further updates will be provided once the data is processed and modelled.
"The past few months we have been focussing on gathering information at Creston and growing our understanding of the copper porphyry target, and in the process, the entire Root & Cellar camp. We now eagerly look forward to the start of the 3D-IP survey and then drilling. At CSM, we were not expecting to be exploring for magmatic Ni-Cu-Co in the Avalon Terrane, however the till geochemical signature is quite clear, but on stepping back to look at the bigger geological picture, including a large fertile gabbroic sill-dike complex, intruding carbonates and pyritic shales at a rift-rift intersection, it is hard to ignore."
– Ian Bliss, President and CEO, Northern Shield
The technical information in this news release has been reviewed and approved by Mike Muggridge, P. Geo., a "Qualified Person" within the meaning of National Instrument 43-101 – Standards of Disclosure for Mineral Projects.
About Northern Shield Resources
Northern Shield Resources Inc. is a Canadian-based company, a leader in generating high-quality exploration targets, that views greenfield exploration as an opportunity to find a mineable, near surface deposit at relatively low cost. We implement a model driven exploration approach to reduce the risk associated with early-stage projects for ourselves, our shareholders, and the environment. This approach led us to option the Root & Cellar Property from a Newfoundland prospector, who discovered the copper mineralization, and then to its advancement to the large gold-silver-tellurium and porphyry copper system that it has become.
Forward-Looking Statements AdvisoryThis news release contains statements concerning the exploration plans, results and potential for porphyry copper, epithermal gold, nickel-copper-cobalt and other mineralization at the Company's Root & Cellar and CSM Properties, geological, geophysical and geometrical analyses of the properties and comparisons of the properties to known epithermal gold deposits and other expectations, plans, goals, objectives, assumptions, information or statements about future, conditions, results of exploration or performance that may constitute forward-looking statements or information under applicable securities legislation. Such forward-looking statements or information are based on a number of assumptions, which may prove to be incorrect.
Although Northern Shield believes that the expectations reflected in such forward-looking statements or information are reasonable, undue reliance should not be placed on forward looking statements because Northern Shield can give no assurance that such expectations will prove to be correct. Forward-looking statements or information are based on current expectations, estimates and projections that involve a number of risks and uncertainties which could cause actual results to differ materially from those anticipated by Northern Shield and described in the forward looking statements or information. These risks and uncertainties include, but are not limited to, risks associated with geological, geometrical and geophysical interpretation and analysis, the ability of Northern Shield to obtain financing, equipment, supplies and qualified personnel necessary to carry on exploration and the general risks and uncertainties involved in mineral exploration and analysis.
The forward-looking statements or information contained in this news release are made as of the date hereof and Northern Shield undertakes no obligation to update publicly or revise any forward looking statements or information, whether as a result of new information, future events or otherwise, unless so required by applicable securities laws.
Neither TSX Venture Exchange nor its Regulation Services Provider (as that term is defined in policies of the TSX Venture Exchange) accepts responsibility for the adequacy or acracy of this release.
View original content: http://www.newswire.ca/en/releases/archive/May2026/13/c4956.html
Make better investment decisions with Simply Wall St’s easy, visual tools that give you a competitive edge.
- Sociedad Química y Minera de Chile (NYSE:SQM) has proposed raising the 2025 final dividend payout from 30% to 50% of net income.
- The change would materially increase the share of earnings returned directly to shareholders.
- The company has also finalized a joint venture with Codelco focused on lithium operations.
- Both decisions point to a shift in how SQM balances shareholder distributions with growth investments.
For investors tracking NYSE:SQM, these moves come after a period of strong share price performance, with the stock at $94.63 and up 15.2% over the past 30 days, 35.7% year to date, and 165.7% over the past year. The proposed dividend policy change and the Codelco joint venture now sit alongside those returns as key elements in how the company is positioning itself.
Looking ahead, the higher proposed payout ratio and the new joint venture give you two clear levers to watch: cash returns and lithium project development. How SQM executes on this partnership and manages future capital allocation decisions will shape the balance between income and reinvestment for shareholders.
Stay updated on the most important news stories for Sociedad Química y Minera de Chile by adding it to your watchlist or portfolio. Alternatively, explore our Community to discover new perspectives on Sociedad Química y Minera de Chile.
NYSE:SQM Earnings & Revenue Growth as at May 2026
Quick Assessment
- ❌ Price vs Analyst Target: At $94.63, the stock is about 20% above the $78.99 analyst price target.
- ✅ Simply Wall St Valuation: Shares are trading about 20.2% below the platform’s estimate of fair value.
- ✅ Recent Momentum: The 30 day return of 15.2% shows strong recent momentum into this news.
There is only one way to know the right time to buy, sell or hold Sociedad Química y Minera de Chile. Head to Simply Wall St’s
company report for the latest analysis of Sociedad Química y Minera de Chile’s fair value.
Key Considerations
- 📊 A higher payout ratio and the Codelco joint venture link a larger share of earnings to shareholders while committing capital and attention to lithium growth projects.
- 📊 Watch how free cash flow, dividend coverage and joint venture project milestones evolve against the current P/E of 45.96 and the forward P/E of 16.68.
- ⚠️ The existing flag around dividend sustainability makes it important to see whether higher payouts are matched by consistent profits and cash generation.
Dig Deeper
For the full picture including more risks and rewards, check out the
complete Sociedad Química y Minera de Chile analysis. Alternatively, you can visit the
community page for Sociedad Química y Minera de Chile to see how other investors believe this latest news will impact the company’s narrative.
This article by Simply Wall St is general in nature. We provide commentary based on historical data
and analyst forecasts only using an unbiased methodology and our articles are not intended to be financial advice. It does not constitute a recommendation to buy or sell any stock, and does not take account of your objectives, or your
financial situation. We aim to bring you long-term focused analysis driven by fundamental data.
Note that our analysis may not factor in the latest price-sensitive company announcements or qualitative material.
Simply Wall St has no position in any stocks mentioned.
Companies discussed in this article include SQM.
Have feedback on this article? Concerned about the content? Get in touch with us directly. Alternatively, email editorial-team@simplywallst.com
Albemarle Corporation’s ALB shares have popped 26.4% in the past three months, courtesy of the company’s solid earnings performance, backed by the strength in its Energy Storage segment, cost-reduction initiatives and an uptick in lithium prices. ALB has outperformed the Zacks Chemical – Diversified industry’s rise of 8.7% and the S&P 500’s increase of 9.4%.
ALB’s 3-month Price Performance
Image Source: Zacks Investment Research
ALB stock broke above its 50-day simple moving average (SMA) on March 24, 2026. It is also currently trading above its 200-day SMA, suggesting a long-term uptrend. Following a golden crossover on Sept. 3, 2025, the 50-day SMA is reading higher than the 200-day SMA, indicating a bullish trend.
Albemarle Trades Above 50-Day SMA
Image Source: Zacks Investment Research
Let’s take a look at ALB’s fundamentals to analyze the stock better.
ALB Gains on Project Expansion, Productivity & Higher Prices
Albemarle is well-placed to gain from long-term growth in the battery-grade lithium market. The market for lithium batteries and energy storage remains strong, especially for electric vehicles (EVs), offering significant opportunities for the company to develop innovative products and expand capacity. Lithium demand is expected to grow on the back of significant global EV penetration. ALB expects lithium demand to witness a compound annual growth rate (CAGR) of 10-20% from 2025 to 2030. Stationary storage is expected to be a significant driver for lithium demand along with EVs. Albemarle expects demand to grow roughly 15-40% this year. Demand indicators stayed constructive in the first quarter of 2026, with global Energy Storage Systems production rising 117% year over year.The company is strategically executing its projects aimed at boosting its global lithium conversion capacity. It remains focused on investing in high-return projects to drive productivity. Healthy customer demand, capacity expansion and plant productivity improvements are supporting its volumes. ALB saw higher sales volumes (up 14% year over year) in its Energy Storage unit in the first quarter on the strength of its integrated conversion facilities. The Salar yield improvement project in Chile has achieved a 50% operating rate, and the ramp-up continues to deliver encouraging outcomes. ALB has started the environmental permitting process for a commercial direct lithium extraction project at Salar de Atacama. The ramp-up at the Meishan lithium conversion facility in China is also progressing ahead of schedule. The CGP3 expansion at the Greenbushes spodumene mine in Australia has also been expedited, expected to reach full production later this year, and add to capacity. Albemarle is also taking aggressive cost-saving and productivity actions. The company delivered roughly $450 million in cost and productivity improvements for full-year 2025, having surpassed its initial target of $300-$400 million. It expects additional cost and productivity improvements of $100-$150 million in 2026, with $40 million already delivered this year. ALB is taking actions to maintain its competitive position, including the initiation of a comprehensive review of cost and operating structure, optimization of the conversion network and reduction of capital expenditure. Its capital expenditures of $590 million for 2025 decreased 65% year over year. ALB, in February 2026, announced that it will idle Train 1, the remaining operating train at its Kemerton lithium hydroxide processing plant in Western Australia, and place it into care and maintenance effective immediately. This move follows earlier actions in 2024 to idle Train 2 for care and maintenance and stop expansion plans for Trains 3 and 4. The Kemerton facility processes spodumene from the Greenbushes mine, one of the world’s best deposits. The move is a result of the ongoing efforts over the past two and a half years to reduce operating costs. The company expects higher flexibility and optionality to benefit adjusted EBITDA starting in the second quarter of 2026.Higher lithium prices, driven by strong demand from EVs and energy storage systems, along with supply disruptions due to recent supply reductions in China, should also aid ALB’s performance. Lithium prices have rebounded from the trough levels seen in 2025, supported by tightening supply and strong demand in China and globally.
ALB’s Capital Allocation Backed by Strong Financial Health
Albemarle remains committed to driving shareholder value by leveraging healthy cash flows and strong liquidity. Its operating cash flow was around $1.3 billion in 2025, up roughly 86% from the prior-year period. At the end of the first quarter, ALB had liquidity of around $2.7 billion, including cash and cash equivalents of around $1.1 billion. ALB generated an operating cash flow of $346 million and free cash flow of $248 million in the quarter. The company paid down $1.3 billion of outstanding debt in March 2026, reducing annual interest expense by roughly $60 million. This followed the successful divestments of the controlling stake in Ketjen and its 50% interest in the Eurecat joint venture, which together generated $670 million in pre-tax proceeds. The company remains focused on maintaining its dividend payout. It has raised its quarterly dividend for the 30th straight year. ALB offers a dividend yield of 0.8% at the current stock price. Its peers, Sociedad Quimica y Minera de Chile S.A. SQM and Rio Tinto Group RIO, have a dividend yield of 2.9% and 4.8%, respectively.
ALB’s Estimates Reflect Positive Sentiment
The Zacks Consensus Estimate for 2026 for ALB has been revised upward over the past 60 days. The consensus estimate for second-quarter 2026 has been going up over the same time frame. The Zacks Consensus Estimate for 2026 earnings is currently pegged at $8.72, suggesting a year-over-year rise of 1,203.8%. Earnings are expected to increase roughly 1,909.1% in the second quarter.
Image Source: Zacks Investment Research
ALB: An Expensive Stock
ALB is currently trading at a forward price-to-sales ratio of 4.11, well above the industry. It is trading at a premium to Sociedad Quimica and Rio Tinto. Albemarle currently has a Value Score of D. Rio Tinto and Sociedad Quimica have a Value Score of A and C, respectively.
ALB’s P/S F12M Vs. Industry, SQM and RIO
Image Source: Zacks Investment Research
Conclusion: Buy ALB Shares
Albemarle is benefiting from higher lithium volumes driven by project ramp-ups, as well as initiatives to expand global lithium conversion capacity and enhance productivity. The company is well-positioned to capitalize on the substantial growth opportunity in the battery-grade lithium market, supported by the global transition toward EVs. Higher lithium prices amid robust demand and tight supply conditions also act as a tailwind.Rising earnings estimates and a strong growth outlook are some other positives. While ALB trades at a premium, the valuation is well-supported by its strong fundamentals and earnings potential. We advise investors to bet on this Zacks Rank #1 (Strong Buy) stock now, as it has solid growth prospects. You can see the complete list of today’s Zacks #1 Rank stocks here.
Want the latest recommendations from Zacks Investment Research? Today, you can download 7 Best Stocks for the Next 30 Days. Click to get this free report
Rio Tinto PLC (RIO) : Free Stock Analysis Report
Albemarle Corporation (ALB) : Free Stock Analysis Report
Sociedad Quimica y Minera S.A. (SQM) : Free Stock Analysis Report
This article originally published on Zacks Investment Research (zacks.com).
Century Aluminum Company CENX reported earnings of $3.23 per share for the first quarter of 2026. It compares favorably with the prior-year quarter’s earnings of 29 cents.
Barring one-time items, adjusted earnings came in at $1.06 per share. The bottom line missed the Zacks Consensus Estimate of $1.16.
Adjusted EBITDA was $231.4 million, up from $78 million in the prior-year quarter.
Century Aluminum Company Price, Consensus and EPS Surprise
Century Aluminum Company price-consensus-eps-surprise-chart | Century Aluminum Company Quote
CENX’s Revenues and Shipments
The company reported net sales of $649.2 million, up 2.4% year over year. However, the figure missed the Zacks Consensus Estimate of $652.2 million.
The increase in sales was driven by higher aluminum prices, which more than offset lower shipment volumes.
Primary aluminum shipments were 122,865 tons, down around 27% year over year and around 12% sequentially.
CENX’s Financials
At the end of the quarter, the company had cash and cash equivalents of $244.1 million, up 81.9% from the previous quarter.
CENX’s Q2 Outlook
The company forecasts second-quarter 2026 adjusted EBITDA to be in the range of $315 million to $335 million, supported by higher realized LME and regional premiums, energy benefits and favorable volume/mix, partly offset by raw material costs and OPEX/other items.
CENX Stock’s Price Performance
Shares of Century Aluminum have risen 250.3% in the past year compared with the industry’s 55.8% growth.
Image Source: Zacks Investment Research
CENX’s Zacks Rank & Other Key Picks
CENX currently sports a Zacks Rank #1 (Strong Buy).
Other top-ranked stocks worth a look in the basic materials space are Sociedad Quimica y Minera de Chile S.A. SQM, Idaho Strategic Resources, Inc. IDR and Hawkins, Inc. HWKN.
Sociedad is slated to report first-quarter 2026 results on May 26. The Zacks Consensus Estimate for loss is pegged at $1.78 per share, indicating 270.8% year-over-year growth. SQM has a Zacks Rank #2 (Buy) at present.
Idaho is expected to report first-quarter 2026 results on May 14. The Zacks Consensus Estimate for earnings is pegged at 43 cents per share, indicating 258.3% year-over-year growth. IDR sports a Zacks Rank #1 at present. You can see the complete list of today’s Zacks #1 Rank stocks here.
Hawkins is scheduled to report fiscal fourth-quarter results on May 13. The Zacks Consensus Estimate for HWKN’s fourth-quarter earnings is pegged at 76 cents per share. HWKN currently has a Zacks Rank #2.
Want the latest recommendations from Zacks Investment Research? Today, you can download 7 Best Stocks for the Next 30 Days. Click to get this free report
Sociedad Quimica y Minera S.A. (SQM) : Free Stock Analysis Report
Century Aluminum Company (CENX) : Free Stock Analysis Report
Hawkins, Inc. (HWKN) : Free Stock Analysis Report
Idaho Strategic Resources, Inc. (IDR) : Free Stock Analysis Report
This article originally published on Zacks Investment Research (zacks.com).
Barrick Mining Corporation B recorded profits (on a reported basis) of $1,602 million or 96 cents per share for first-quarter 2026, up from $474 million or 27 cents per share in the year-ago quarter.
Barring one-time items, adjusted earnings per share were 98 cents. The figure beat the Zacks Consensus Estimate of 74 cents.
Barrick recorded total sales of $5,218 million, up 67% year over year. The metric surpassed the Zacks Consensus Estimate of $4,533.5 million.
Barrick Mining Corporation Price, Consensus and EPS Surprise
Barrick Mining Corporation price-consensus-eps-surprise-chart | Barrick Mining Corporation Quote
B’s Operational Highlights
Total gold production was 719,000 ounces in the reported quarter, down around 5.1% year over year. The figure beat the Zacks Consensus Estimate of 655,000 ounces. The average realized price of gold was $4,823 per ounce in the quarter, up around 66.4%.
The cost of sales increased around 18% year over year to $1,922 per ounce. All-in-sustaining costs (AISC) moved down 4% to $1,708 per ounce in the quarter.
B’s Financial Position
At the end of the quarter, Barrick had cash and cash equivalents of $7,131 million, up 74% from the prior-year quarter. The company’s total debt was $4,726 million at the end of the quarter, essentially flat year over year.
The operating cash flow was $2.55 billion for the quarter, whereas the free cash flow was $1.58 billion.
B’s Guidance
For 2026, Barrick anticipates attributable gold production to be in the range of 2.9-3.25 million ounces. For the second quarter of 2026, gold production is expected to be in the range of 730,000-770,000 ounces.
AISC is projected at $1,760-$1,950 per ounce for 2026. Cash costs per ounce are forecast to be $1,330-$1,470. The company also expects to see a cost of sales of $1,870-$2,070 per ounce.
Barrick expects copper production of 190,000-220,000 tons at AISC of $3.45-$3.75 per pound, C1 cash costs of $2.20-$2.45 per pound and cost of sales of $3.05-$3.35 per pound for 2026.
Barrick’s Price Performance
B’s shares have gained 158.8% in the past year compared with the industry’s 93.3% rise.
Image Source: Zacks Investment Research
B’s Zacks Rank & Stocks to Consider
B currently carries a Zacks Rank #3 (Hold).
Some better-ranked stocks worth a look in the basic materials space are Sociedad Quimica y Minera de Chile S.A. SQM, Idaho Strategic Resources, Inc. IDR and Hawkins, Inc. HWKN.
Sociedad is slated to report first-quarter 2026 results on May 26. The Zacks Consensus Estimate for loss is pegged at $1.78 per share, indicating 270.8% year-over-year growth. SQM has a Zacks Rank #2 (Buy) at present.
Idaho is expected to report first-quarter 2026 results on May 14. The Zacks Consensus Estimate for earnings is pegged at 43 cents per share, indicating 258.3% year-over-year growth. IDR sports a Zacks Rank #1 (Strong Buy) at present. You can see the complete list of today’s Zacks #1 Rank stocks here.
Hawkins is scheduled to report fiscal fourth-quarter results on May 13. The Zacks Consensus Estimate for HWKN’s fourth-quarter earnings is pegged at 76 cents per share. HWKN currently has a Zacks Rank #2.
Want the latest recommendations from Zacks Investment Research? Today, you can download 7 Best Stocks for the Next 30 Days. Click to get this free report
Sociedad Quimica y Minera S.A. (SQM) : Free Stock Analysis Report
Barrick Mining Corporation (B) : Free Stock Analysis Report
Hawkins, Inc. (HWKN) : Free Stock Analysis Report
Idaho Strategic Resources, Inc. (IDR) : Free Stock Analysis Report
This article originally published on Zacks Investment Research (zacks.com).
Found to evaluate resin-free electrochemical Direct Feedstock Extraction technology at the only currently permitted fluorspar mine in the United States
BOSTON and JUAB COUNTY, Utah, May 12, 2026 /PRNewswire/ — Found Industries, through its Found Metals division, and ARES Strategic Mining Inc. (CSE: ARS) (OTC: ARSMF) (FRA: N8I1) today announced the signing of a Memorandum of Understanding to evaluate the recovery of gallium, germanium and other strategic critical materials from ARES-owned or controlled feedstocks associated with the Lost Sheep Mine in Utah.
The collaboration brings together a uniquely strategic U.S. mineral asset and an emerging domestic critical metals processing platform at a moment when secure North American supply chains for semiconductors, defense systems, energy technologies and advanced manufacturing have become an urgent industrial priority.
ARES' Lost Sheep Mine is the only currently permitted fluorspar mine in the United States, comprising 353 mining claims across approximately 5,982 acres. The asset's strategic relevance has recently been further underscored by ARES when it announced the award of a five-year Indefinite Delivery/Indefinite Quantity contract by the U.S. Department of Defense through the Defense Logistics Agency, with an estimated initial award value of approximately $168.9 million and a total contract ceiling of up to $250 million, subject to future task orders. In addition to fluorspar, recent surveys cited in the MOU have identified significant concentrations of gallium and germanium within the deposit, including reported gallium grades in the hundreds of parts per million. Subject to technical, economic, regulatory and commercial validation, preliminary assessments indicate the Lost Sheep operations could ultimately support gallium production at industrial scales at full development, alongside potential recovery of associated critical metals.
Under the MOU, Found Metals will evaluate opportunities to apply Found's proprietary Direct Feedstock Extraction technology to support the recovery of critical metals from ARES-controlled feedstocks. The initial phase is expected to focus on technical evaluation, feedstock assessment, process integration concepts, and preliminary analysis to determine the potential pathway for future piloting, scale-up, and joint commercialization. Early work related to the collaboration is also being supported in part by the Commonwealth of Massachusetts through its InnovateMass program, reflecting the state's interest in advancing domestic critical materials innovation.
"ARES controls one of the unique domestic assets with the right combination of permitting position, critical mineral relevance and multi-metal upside," said Peter Godart, President and CEO of Found Industries. "Found Metals was built to turn complex feedstocks into domestic critical metal production. This collaboration gives us a pathway to demonstrate how next-generation electrochemical refining can help transform a strategic U.S. mine into a scalable, multi-metal critical materials platform."
"Found brings the kind of processing innovation that can materially expand the strategic value of Lost Sheep," said James Walker, CEO of ARES Strategic Mining Inc. "Fluorspar is already a critical mineral. The opportunity to evaluate gallium, germanium and other high-value critical materials from the same broader resource base could make Lost Sheep even more important to North American supply chains."
Gallium and germanium are among the most strategically important and highest growth technology metals in the modern economy. Gallium is central to high-performance semiconductor supply chains, while germanium is used in fiber optics, semiconductors and night vision applications. Both are overwhelmingly controlled by Chinese production at present. Fluorspar is essential to industries including synthetic materials, iron and steel, ceramics, glass and refining. The ability to evaluate all three within a single domestic resource base creates a compelling opportunity for investors, policymakers and industrial partners seeking exposure to resilient U.S. critical mineral supply.
For Mining Equipment, Technology and Services (METS) investors and mining-sector strategics, the Found–ARES MOU points to a broader shift: critical metals recovery is becoming a processing technology race as much as a mining race. Domestic resources, tailings, leachates and byproduct streams that were historically treated as secondary opportunities can become strategic production platforms when paired with selective, scalable extraction technology.
"Found Metals is prioritizing partners who can move quickly, share representative feedstocks, define financeable projects and help bring new domestic critical metal capacity online," added Godart. "The market is rewarding speed, differentiated process economics and strategic supply relevance. We believe this collaboration with ARES has all three ingredients."
About Found Industries
Found Industries is building advanced technologies for domestic energy and critical materials resilience. Through its Found Metals division, the company is developing a vertically integrated critical metals platform that spans foundational R&D, process development, electrochemical system design, engineering, pilot deployment, and commercial project development. Found Metals is focused on converting complex and dilute feedstocks into strategically important metals using its proprietary resin-free Direct Feedstock Extraction platform, creating a pathway from lab-scale innovation to domestic production of gallium, germanium and other high-value critical materials while reducing reliance on legacy reagent-intensive recovery methods.
About ARES Strategic Mining Inc.
ARES Strategic Mining Inc. owns and operates the Lost Sheep Mine in western Utah, the only currently permitted fluorspar mine in the United States. ARES is focused on developing strategic mineral resources that can support secure North American supply chains, including fluorspar and the potential recovery of associated critical materials such as gallium and germanium.
Forward-Looking Statements
This press release contains forward-looking statements, including statements regarding potential mineral recovery, production volumes, pilot development, commercialization pathways, non-dilutive funding opportunities, future joint development or joint venture structures, and the strategic value of gallium, germanium, fluorspar and associated materials. These statements are based on preliminary assessments and current expectations and are subject to technical, economic, regulatory, financing and commercial risks. No assurance can be given that any pilot, commercial project, production target, funding award, joint venture, offtake arrangement or definitive agreement will result from the MOU. References to mineral concentrations, recoveries, production volumes or potential output are illustrative, preliminary and subject to independent validation.
View original content to download multimedia:https://www.prnewswire.com/news-releases/found-industries-and-ares-strategic-mining-sign-mou-to-advance-domestic-gallium-germanium-and-fluorspar-recovery-from-utahs-lost-sheep-mine-302769066.html
Just because a business does not make any money, does not mean that the stock will go down. For example, although Amazon.com made losses for many years after listing, if you had bought and held the shares since 1999, you would have made a fortune. But the harsh reality is that very many loss making companies burn through all their cash and go bankrupt.
Given this risk, we thought we'd take a look at whether Stillwater Critical Minerals (CVE:PGE) shareholders should be worried about its cash burn. In this report, we will consider the company's annual negative free cash flow, henceforth referring to it as the 'cash burn'. The first step is to compare its cash burn with its cash reserves, to give us its 'cash runway'.
When Might Stillwater Critical Minerals Run Out Of Money?
You can calculate a company's cash runway by dividing the amount of cash it has by the rate at which it is spending that cash. When Stillwater Critical Minerals last reported its December 2025 balance sheet in March 2026, it had zero debt and cash worth CA$17m. Importantly, its cash burn was CA$8.4m over the trailing twelve months. Therefore, from December 2025 it had 2.0 years of cash runway. That's decent, giving the company a couple years to develop its business. Depicted below, you can see how its cash holdings have changed over time.
TSXV:PGE Debt to Equity History May 12th 2026
See our latest analysis for Stillwater Critical Minerals
How Is Stillwater Critical Minerals' Cash Burn Changing Over Time?
Stillwater Critical Minerals didn't record any revenue over the last year, indicating that it's an early stage company still developing its business. So while we can't look to sales to understand growth, we can look at how the cash burn is changing to understand how expenditure is trending over time. In fact, it ramped its spending strongly over the last year, increasing cash burn by 106%. It's fair to say that sort of rate of increase cannot be maintained for very long, without putting pressure on the balance sheet. Stillwater Critical Minerals makes us a little nervous due to its lack of substantial operating revenue. We prefer most of the stocks on this list of stocks that analysts expect to grow.
How Hard Would It Be For Stillwater Critical Minerals To Raise More Cash For Growth?
Given its cash burn trajectory, Stillwater Critical Minerals shareholders may wish to consider how easily it could raise more cash, despite its solid cash runway. Generally speaking, a listed business can raise new cash through issuing shares or taking on debt. One of the main advantages held by publicly listed companies is that they can sell shares to investors to raise cash and fund growth. By comparing a company's annual cash burn to its total market capitalisation, we can estimate roughly how many shares it would have to issue in order to run the company for another year (at the same burn rate).
Since it has a market capitalisation of CA$110m, Stillwater Critical Minerals' CA$8.4m in cash burn equates to about 7.6% of its market value. Given that is a rather small percentage, it would probably be really easy for the company to fund another year's growth by issuing some new shares to investors, or even by taking out a loan.
So, Should We Worry About Stillwater Critical Minerals' Cash Burn?
On this analysis of Stillwater Critical Minerals' cash burn, we think its cash burn relative to its market cap was reassuring, while its increasing cash burn has us a bit worried. Cash burning companies are always on the riskier side of things, but after considering all of the factors discussed in this short piece, we're not too worried about its rate of cash burn. Separately, we looked at different risks affecting the company and spotted 4 warning signs for Stillwater Critical Minerals (of which 2 are significant!) you should know about.
Of course, you might find a fantastic investment by looking elsewhere. So take a peek at this free list of companies with significant insider holdings, and this list of stocks growth stocks (according to analyst forecasts)
Have feedback on this article? Concerned about the content? Get in touch with us directly. Alternatively, email editorial-team (at) simplywallst.com.This article by Simply Wall St is general in nature. We provide commentary based on historical data and analyst forecasts only using an unbiased methodology and our articles are not intended to be financial advice. It does not constitute a recommendation to buy or sell any stock, and does not take account of your objectives, or your financial situation. We aim to bring you long-term focused analysis driven by fundamental data. Note that our analysis may not factor in the latest price-sensitive company announcements or qualitative material. Simply Wall St has no position in any stocks mentioned.
ArcelorMittal S.A. MT recorded first-quarter 2026 net income of $575 million or 75 cents per share. This compares unfavorably with net income of $805 million or $1.04 per share in the year-ago quarter.
Barring one-time items, the company recorded adjusted earnings of 76 cents per share. The bottom line beat the Zacks Consensus Estimate of 72 cents.
Total sales were up around 4% year over year to $15,457 million In the quarter. The figure missed the consensus estimate of $15,670.9 million.
Total steel shipments fell around 6% year over year to 12.8 million metric tons in the reported quarter.
ArcelorMittal Price, Consensus and EPS Surprise
ArcelorMittal price-consensus-eps-surprise-chart | ArcelorMittal Quote
MT’s Segment Highlights
North America: Sales were up around 15% year over year to $3,297 million in the reported quarter. The figure missed the consensus estimate of $3,406 million. Crude steel production fell around 5% to 2,134 million metric tons. Steel shipments were down around 1% year over year to 2,624 million metric tons, lagging the consensus estimate of 2,671 million metric tons. The average steel selling price rose around 21% to $1,089 per ton.
Brazil: Sales were up around 6% year over year to $2,809 million, surpassing the consensus estimate of $2,533 million. Crude steel production declined around 2% to 3,514 million metric tons. Shipments increased around 9% year over year to 3,432 million metric tons, surpassing???the consensus estimate of 3,220 million metric tons. Average steel selling prices fell around 5% to $739 per ton.
Europe: Sales rose around 3% year over year to $7,446 million. The figure missed the consensus mark of $7,652 million. Crude steel production declined around 14% to 6,832 million metric tons in the reported quarter. Shipments declined around 6% year over year to 7,108 million metric tons, missing the consensus mark of 7,259 million metric tons. The average steel selling price increased around 12% year over year to $931 per ton.
Mining: Sales rose around 25% year over year to $917 million, surpassing the consensus estimate of $851 million. Iron ore production totaled 9.7 million metric tons, up around 15% from the year-ago quarter’s levels. Iron ore shipments were up 25% year over year to 10 million metric tons.
MT’s Financials
At the end of the reported quarter, cash and cash equivalents were $4,359 million compared with $5,476 million at the end of the prior quarter. The company’s net debt was around $9.3 billion. Free cash flow was a negative $1.3 billion in the quarter, reflecting a seasonal working capital investment.
MT’s Outlook
Per MT, the company remains confident in its prospects for the balance of 2026, supported by expected favorable impacts from new policy measures, including a materially improved pricing and volume environment. CBAM and the new tariff rate quota mechanism are expected to reset the European steel market by limiting imports and requiring imports to bear a carbon cost.
The company expects to benefit from strategic growth projects and has maintained its 2026 capex guidance of $4.5-$5 billion, including $1.7-$2 billion of capex on high-return projects. These investments are expected to support higher EBITDA and returns over time.
MT’s Price Performance
ArcelorMittal’s shares have gained 98.9% in the past year against the industry’s 76.5% rise.
Image Source: Zacks Investment Research
MT’s Zacks Rank & Key Picks
MT currently carries a Zacks Rank #3 (Hold).
Some better-ranked stocks worth a look in the basic materials space are Sociedad Quimica y Minera de Chile S.A. SQM, Idaho Strategic Resources, Inc. IDR and Hawkins, Inc. HWKN.
Sociedad is slated to report first-quarter 2026 results on May 26. The Zacks Consensus Estimate for loss is pegged at $1.78 per share, indicating 270.8% year-over-year growth. SQM has a Zacks Rank #2 (Buy) at present.
Idaho is expected to report first-quarter 2026 results on May 14. The Zacks Consensus Estimate for earnings is pegged at 43 cents per share, indicating 258.3% year-over-year growth. IDR sports a Zacks Rank #1 (Strong Buy) at present. You can see the complete list of today’s Zacks #1 Rank stocks here.
Hawkins is scheduled to report fiscal fourth-quarter results on May 13. The Zacks Consensus Estimate for HWKN’s fourth-quarter earnings is pegged at 76 cents per share. HWKN currently has a Zacks Rank #2.
Want the latest recommendations from Zacks Investment Research? Today, you can download 7 Best Stocks for the Next 30 Days. Click to get this free report
ArcelorMittal (MT) : Free Stock Analysis Report
Sociedad Quimica y Minera S.A. (SQM) : Free Stock Analysis Report
Hawkins, Inc. (HWKN) : Free Stock Analysis Report
Idaho Strategic Resources, Inc. (IDR) : Free Stock Analysis Report
This article originally published on Zacks Investment Research (zacks.com).
PHILADELPHIA, May 11, 2026 /PRNewswire/ —
FMC Corporation (NYSE: FMC) today announced that Pierre Brondeau, FMC chairman, chief executive officer and president, and Andrew Sandifer, FMC executive vice president and chief financial officer, will speak at the BMO Global Farm to Market Chemicals Conference on May 14, 2026, at 1:15 p.m. Eastern Time. A live webcast will be available at www.fmc.com/investors.
About FMC
FMC Corporation is a global agricultural sciences company dedicated to helping growers produce food, feed, fiber and fuel for an expanding world population while adapting to a changing environment. FMC's innovative crop protection solutions – including biologicals, crop nutrition, digital and precision agriculture – enable growers and crop advisers to address their toughest challenges economically while protecting the environment. FMC is committed to discovering new herbicide, insecticide and fungicide active ingredients, product formulations and pioneering technologies that are consistently better for the planet. Visit fmc.com to learn more and follow us on LinkedIn®.
View original content to download multimedia:https://www.prnewswire.com/news-releases/fmc-corporation-ceo-pierre-brondeau-and-cfo-andrew-sandifer-to-speak-at-bmo-global-farm-to-market-chemicals-conference-302767246.html
Lindian Resources expands operational bench as Kangankunde rare earths project advances Proactive uses images sourced from Shutterstock
Lindian Resources Ltd (ASX:LIN, OTC:LINIF) has strengthened its executive and operational leadership team with seven new appointments across legal, sustainability, supply chain, health and safety, technology, finance and investor relations as the company pushes towards first production at its Kangankunde Rare Earths Project in Malawi.
The appointments come as Lindian transitions from project developer to future producer, with construction at Kangankunde well advanced and first production from both the Malawi upstream operation and the company’s planned SARECO hydrometallurgical facility in Kazakhstan targeted for Q4 2026.
The company said four of the new hires have already commenced, with the remaining appointees due to join during May, including incoming general counsel and company secretary Anastasia Gotjamanos, who starts on May 25.
Executive chairman Robert Martin said the expanded team reflected the scale and complexity of Lindian’s next phase of growth.
“These appointments mark our continued transition from developer to producer,” he said. “We have deliberately assembled a team with the operational depth and experience to deliver — people who have built and run mines, managed billion-dollar supply chains, navigated multi-jurisdictional legal environments and embedded world-class safety cultures at some of the largest resource companies in Australia and globally.
“With construction well advanced at Kangankunde, first production on track for Q4 2026 and our SARECO MREC facility initiatives progressing ahead of schedule, having the right team on the ground is critical.”
Mining and legal experience added
Leading the appointments is Gotjamanos, who joins from Westgold Resources Ltd, where she served as chief legal officer from 2023 to 2026. Her background also includes more than five years as group general counsel at the Byrnecut Group, overseeing legal matters across underground mining operations in Australia, Africa, Europe and the Americas.
Lindian said her appointment would strengthen governance, regulatory compliance and commercial oversight as the company advances multi-jurisdictional operations across Malawi and Kazakhstan.
The company has also appointed Geoffrey Taylor as HSE manager, bringing experience from senior safety leadership roles at BHP, Rio Tinto and Fortescue.
Taylor most recently worked with a Moroccan mining company on fatality prevention and behavioural safety programs and will oversee HSE systems across construction and future operations at Kangankunde.
Meanwhile, Ben Ludik joins as supply manager after senior procurement and logistics roles spanning Gold Fields, Accenture and Capital Drilling & Mining Services. Lindian said his experience managing large-scale procurement across multiple jurisdictions would support the build-out of integrated supply chains for both Malawi and Kazakhstan.
ESG, technology and investor focus
The company has also strengthened its sustainability and technology capabilities as it prepares for future production and strategic partner engagement.
David O’Coileain joins as ESG and sustainability manager from Woodside Energy, where he worked on sustainability and social performance initiatives tied to international investments. His previous roles also include positions with Minderoo Foundation and Lendlease.
Lindian said O’Coileain would help oversee ESG compliance, sustainability reporting and alignment with international frameworks including Equator Principles and IFC Performance Standards.
Cristiano Soares has been appointed IT/OT manager, bringing operational technology and network infrastructure experience from BHP and Mineral Resources. He will oversee communications systems, cybersecurity and operational technology infrastructure across Lindian’s operations.
The company also added finance and investor relations capability with the appointments of senior accountant Jasmine Wang, formerly of Lotus Resources, and investor relations coordinator Ashley Tjioe, who joins from GT Communications.
Kangankunde build gathers momentum
The appointments follow a period of rapid development for Lindian as it advances Kangankunde towards production.
Recent updates have highlighted ongoing construction activity and the company’s long-term strategic partnership with Iluka Resources, alongside a series of capital raisings that have left Lindian fully funded for Stage 1 development.
Kangankunde is regarded as one of the world’s largest undeveloped rare earths deposits and is expected to produce a high-grade monazite concentrate with low forecast operating costs.
In parallel with Stage 1 construction, Lindian is also progressing a Stage 2 definitive feasibility study aimed at expanding production capacity and strengthening its position within global rare earth supply chains.
Track your investments for FREE with Simply Wall St, the portfolio command center trusted by over 7 million individual investors worldwide.
Recent construction updates at the Kangankunde Rare Earths Project have put Lindian Resources (ASX:LIN) in focus, as the fully funded development secures in country acid supply and reaches key milestones toward initial rare earths production.
See our latest analysis for Lindian Resources.
These construction and funding milestones come after a very large 1 year total shareholder return and a 90.36% year to date share price return, although the 30 day share price return of 13.19% suggests some recent momentum cooling from A$0.79.
If you are looking beyond a single project developer in rare earths, this could be a good moment to scan 33 best rare earth metal stocks
With the Kangankunde project fully funded, construction on track and the stock now a touch below its analyst price target of A$0.75, investors may be asking whether Lindian is undervalued at this level or whether the market is already pricing in future growth.
Price to Book of 9.7x: Is it justified?
Lindian trades on a P/B of 9.7x, which is high compared to many resource developers, and investors are clearly paying up relative to current fundamentals.
The P/B ratio compares the company’s market value to its book value, so a higher figure usually reflects strong expectations for future projects or assets that are not yet generating meaningful earnings.
For Lindian, this 9.7x multiple sits against an unprofitable position today, A$0 in reported revenue and a loss of A$11.27m. This means the market is focusing heavily on future potential from projects like Kangankunde rather than present financial results.
Against peers, Lindian’s 9.7x P/B is described as expensive compared to the Australian Metals and Mining industry average of 2x. However, it is labelled good value versus a peer average of 13.5x, suggesting investors are pricing it well above the broad sector while still below some closer rare earth and exploration comparables.
See what the numbers say about this price — find out in our valuation breakdown.
Result: Price-to-book of 9.7x (OVERVALUED).
However, you also need to weigh project execution and funding risks, as well as any shift in sentiment toward high P/B, zero revenue resource developers.
Find out about the key risks to this Lindian Resources narrative.
Next Steps
If you feel the story so far is finely balanced between excitement and concern, you can take a closer look at the data now and decide where you land by checking the 1 key reward and 4 important warning signs
Looking for more investment ideas?
If Lindian has caught your attention, do not stop here. Fresh opportunities across other stocks could suit your approach just as well or even better.
- Spot underappreciated opportunities early by scanning companies in the screener containing 14 high quality undiscovered gems.
- Prioritise resilience by reviewing stocks highlighted in the 6 resilient stocks with low risk scores.
- Focus on income potential and stability by assessing the companies in the 6 dividend fortresses.
This article by Simply Wall St is general in nature. We provide commentary based on historical data
and analyst forecasts only using an unbiased methodology and our articles are not intended to be financial advice. It does not constitute a recommendation to buy or sell any stock, and does not take account of your objectives, or your
financial situation. We aim to bring you long-term focused analysis driven by fundamental data.
Note that our analysis may not factor in the latest price-sensitive company announcements or qualitative material.
Simply Wall St has no position in any stocks mentioned.
Companies discussed in this article include LIN.AX.
Have feedback on this article? Concerned about the content? Get in touch with us directly. Alternatively, email editorial-team@simplywallst.com
As the Australian market experiences a dynamic phase, marked by fluctuations in key indices and external geopolitical tensions, investors are keenly observing how these factors impact small-cap stocks. In this environment, identifying promising opportunities requires looking for companies with strong fundamentals and innovative potential that can navigate current uncertainties effectively.
Top 10 Undiscovered Gems With Strong Fundamentals In Australia
| Name | Debt To Equity | Revenue Growth | Earnings Growth | Health Rating |
|---|---|---|---|---|
| Fiducian Group | NA | 9.85% | 10.78% | ★★★★★★ |
| Joyce | NA | 7.70% | 7.34% | ★★★★★★ |
| Euroz Hartleys Group | NA | -2.67% | -37.02% | ★★★★★★ |
| Rand Mining | NA | 4.28% | -2.11% | ★★★★★★ |
| Focus Minerals | NA | 75.66% | 75.61% | ★★★★★★ |
| WAM Strategic Value | NA | -9.74% | 30.51% | ★★★★★★ |
| SDI | 14.65% | 8.06% | 12.66% | ★★★★★☆ |
| Zimplats Holdings | 3.35% | -10.45% | -46.73% | ★★★★★☆ |
| AMCIL | NA | 2.99% | 1.18% | ★★★★★☆ |
| Australian United Investment | 6.80% | 2.27% | 1.31% | ★★★★☆☆ |
Let’s dive into some prime choices out of from the screener.
Simply Wall St Value Rating: ★★★★★★
Overview: Cogstate Limited is a neuroscience solutions company that focuses on developing and commercializing digital brain health assessments globally, with a market cap of A$404.81 million.
Operations: Cogstate Limited generates revenue primarily from its Clinical Trials segment, which contributes $53.59 million, while the Healthcare segment adds $2.48 million.
Cogstate, a nimble player in the neuroscience tech space, is making waves with its focus on digital brain health assessments. Recently, the company reported half-yearly sales of US$25.78 million and net income of US$4.53 million, showcasing robust growth compared to last year’s figures. With no debt and trading at 53% below estimated fair value, Cogstate seems well-positioned financially. The recent Medidata partnership and AI product launch are poised to broaden its reach in CNS markets while enhancing operational efficiency. However, significant insider selling over the past three months could signal caution amidst these promising developments.
ASX:CGS Earnings and Revenue Growth as at May 2026Focus Minerals
Simply Wall St Value Rating: ★★★★★★
Overview: Focus Minerals Limited is involved in the exploration and development of gold properties in Western Australia, with a market capitalization of A$687.74 million.
Operations: Focus Minerals generates revenue primarily from its Coolgardie segment, amounting to A$301.51 million, with an additional contribution of A$2.29 million from corporate activities.
Focus Minerals, a nimble player in the mining sector, has been making waves with its impressive earnings growth of 1612% over the past year, outpacing the broader industry growth of 59.9%. The company reported sales of A$301.26 million for 2025, a significant leap from A$115.14 million in the previous year. With no debt on its books now compared to five years ago when it had a debt-to-equity ratio of 25%, Focus Minerals stands on solid financial ground. Its recent addition to the S&P/ASX All Ordinaries Index underscores its growing prominence in Australia’s mining landscape.
- Unlock comprehensive insights into our analysis of Focus Minerals stock in this health report.
-
Assess Focus Minerals’ past performance with our detailed historical performance reports.
ASX:FML Earnings and Revenue Growth as at May 2026Symal Group
Simply Wall St Value Rating: ★★★★★☆
Overview: Symal Group Limited operates in the civil construction industry in Australia, offering services such as construction contracting, equipment hire, material sales, recycling, and remediation with a market capitalization of A$569.16 million.
Operations: Symal Group’s primary revenue streams are derived from contracting services, generating A$801.43 million, and plant and equipment hire, contributing A$187.79 million.
Symal Group has been making waves with a notable earnings increase of 90.4% over the past year, surpassing the Construction industry’s growth of 12.2%. The company reported a net income of A$19.29 million for the half-year ending December 2025, up from A$5.74 million in the previous year, reflecting its high-quality earnings and strong operational performance. Symal’s debt is well-managed with interest payments covered 32.9 times by EBIT, indicating robust financial health. Trading at 55.9% below estimated fair value, it presents an attractive opportunity in comparison to industry peers and is gearing up for future growth under new CFO Scott McQueen’s leadership.
- Click to explore a detailed breakdown of our findings in Symal Group’s health report.
-
Examine Symal Group’s past performance report to understand how it has performed in the past.
ASX:SYL Earnings and Revenue Growth as at May 2026Taking Advantage
- Navigate through the entire inventory of 63 ASX Undiscovered Gems With Strong Fundamentals here.
- Hold shares in these firms? Setup your portfolio in Simply Wall St to seamlessly track your investments and receive personalized updates on your portfolio’s performance.
- Enhance your investing ability with the Simply Wall St app and enjoy free access to essential market intelligence spanning every continent.
Searching for a Fresh Perspective?
- Explore high-performing small cap companies that haven’t yet garnered significant analyst attention.
- Fuel your portfolio with companies showing strong growth potential, backed by optimistic outlooks both from analysts and management.
- Find companies with promising cash flow potential yet trading below their fair value.
This article by Simply Wall St is general in nature. We provide commentary based on historical data
and analyst forecasts only using an unbiased methodology and our articles are not intended to be financial advice. It does not constitute a recommendation to buy or sell any stock, and does not take account of your objectives, or your
financial situation. We aim to bring you long-term focused analysis driven by fundamental data.
Note that our analysis may not factor in the latest price-sensitive company announcements or qualitative material.
Simply Wall St has no position in any stocks mentioned.
Companies discussed in this article include ASX:CGS ASX:FML and ASX:SYL.
Have feedback on this article? Concerned about the content? Get in touch with us directly. Alternatively, email editorial-team@simplywallst.com
Make better investment decisions with Simply Wall St’s easy, visual tools that give you a competitive edge.
Recent performance snapshot
Sociedad Química y Minera de Chile (NYSE:SQM) has drawn attention after a 16.7% gain over the past month and a 28.1% increase over the past 3 months, contrasting with a 1.9% decline over the last day.
See our latest analysis for Sociedad Química y Minera de Chile.
At a share price of US$91.60, SQM has recently seen solid positive momentum, with a 30 day share price return of 16.7% and a 90 day share price return of 28.2%. The 1 year total shareholder return of 169.3% points to a much stronger longer term payoff than the short term moves alone might suggest.
If SQM’s run has you thinking about where else strong themes could show up next, it may be worth scanning the field using our screener of 33 best rare earth metal stocks
With SQM trading around US$91.60 and an estimated intrinsic value implying roughly a 23% gap, yet sitting above the average analyst target, you have to ask: is there still a buying opportunity here, or is the market already pricing in future growth?
Most Popular Narrative: 21.6% Overvalued
Against the last close at $91.60, the most followed narrative points to a fair value of about $75.33, putting its estimate below the current share price while still backing a growth story built around lithium and specialty chemicals.
Expansion of lithium and specialty chemical production capacity positions the company for sustained revenue and margin growth, supported by strong demand and tight global supply. Operational efficiency, diverse product streams, and rising barriers to entry protect the company’s competitive strength and earnings resilience against market volatility.
Curious what earnings profile and margin path could justify that valuation gap over the next few years? The narrative leans on rising profitability, richer cash flows and a future earnings multiple that assumes this expansion phase delivers.
Result: Fair Value of $75.33 (OVERVALUED)
Have a read of the narrative in full and understand what’s behind the forecasts.
However, there are clear swing factors to watch, including lithium price volatility and evolving Chilean regulations that could affect project timing, margins, and overall earnings visibility.
Find out about the key risks to this Sociedad Química y Minera de Chile narrative.
Another way to look at SQM’s value
The narrative highlights SQM as 21.6% overvalued at a fair value of about $75.33, but the SWS DCF model points in the other direction, with a future cash flow value of $118.58 per share and the stock trading 22.8% below that. Which perspective do you think better reflects SQM’s value?
Look into how the SWS DCF model arrives at its fair value.
SQM Discounted Cash Flow as at May 2026
Simply Wall St performs a discounted cash flow (DCF) on every stock in the world every day (check out Sociedad Química y Minera de Chile for example). We show the entire calculation in full. You can track the result in your watchlist or portfolio and be alerted when this changes, or use our stock screener to discover 51 high quality undervalued stocks. If you save a screener we even alert you when new companies match – so you never miss a potential opportunity.
Next Steps
With mixed signals on valuation and sentiment, now is a good time to look through the underlying data yourself and decide what feels reasonable. To weigh up the potential upside against the downside risks, start with a clear overview of the 3 key rewards and 1 important warning sign.
Looking for more investment ideas?
Do not stop with just one stock story. Use focused stock lists to spot new ideas that fit your style before the crowd pays attention.
- Target reliable cash generators with staying power by scanning companies in the solid balance sheet and fundamentals stocks screener (44 results).
- Hunt for potential value opportunities that combine quality and pricing appeal using the 51 high quality undervalued stocks.
- Lock in potential income streams by reviewing stocks highlighted in the 12 dividend fortresses.
This article by Simply Wall St is general in nature. We provide commentary based on historical data
and analyst forecasts only using an unbiased methodology and our articles are not intended to be financial advice. It does not constitute a recommendation to buy or sell any stock, and does not take account of your objectives, or your
financial situation. We aim to bring you long-term focused analysis driven by fundamental data.
Note that our analysis may not factor in the latest price-sensitive company announcements or qualitative material.
Simply Wall St has no position in any stocks mentioned.
Companies discussed in this article include SQM.
Have feedback on this article? Concerned about the content? Get in touch with us directly. Alternatively, email editorial-team@simplywallst.com
Huntsman Corporation’s HUN first-quarter 2026 loss (as reported) was 31 cents per share, wider than a loss of 3 cents in the year-ago quarter.
Barring one-time items, adjusted loss per share was 20 cents compared with a loss of 11 cents in the year-ago quarter. It was narrower than the Zacks Consensus Estimate of a loss of 23 cents.
Revenues were $1,420 million, up around 1% year over year. The top line beat the Zacks Consensus Estimate of $1,374.2 million. HUN saw volume growth in Polyurethanes and strength in Advanced Materials, partly offset by lower selling prices and weakness in Performance Products.
Huntsman Corporation Price, Consensus and EPS Surprise
Huntsman Corporation price-consensus-eps-surprise-chart | Huntsman Corporation Quote
HUN’s Q1 Segment Highlights
Polyurethanes: Revenues from the segment rose 1% year over year to $923 million. The figure beat our estimate of $903 million. The upside was driven by higher sales volumes, mainly in the Americas and Europe, partly offset by lower average selling prices. MDI selling prices fell due to less favorable supply-demand dynamics, partly masked by favorable currency movements.
Performance Products: Revenues moved down 11% year over year to $228 million, missing our estimate of $242 million. The decrease was mainly caused by lower sales volumes and lower average selling prices. Volumes were hurt by the closure of the Moers, Germany maleic anhydride facility and lower demand, while pricing was adversely impacted by competitive pressures.
Advanced Materials: Revenues from the unit increased 12% year over year to $279 million and beat our estimate of $252 million. The increase was primarily due to higher average selling prices and higher sales volumes. Pricing benefited from a favorable sales mix and currency movements, while volumes improved across aerospace, power and automotive markets.
HUN’s Financials
Free cash flow from continuing operations was a use of $91 million compared with a use of $107 million in the prior-year quarter. The company had around $0.9 billion in combined cash and unused borrowing capacity as of March 31, 2026. Huntsman spent $38 million on capital expenditures compared with $36 million in the prior-year quarter. Net cash used in operating activities from continuing operations was $53 million in the reported quarter.
HUN’s Outlook
For the second quarter of 2026, Huntsman expects sequential improvement, especially in Polyurethanes. The company expects margin improvement across regions from its pricing initiatives. It anticipates second-quarter adjusted EBITDA of $60-$75 million for Polyurethanes, $30-$40 million for Performance Products and $50-$55 million for Advanced Materials.
Huntsman expects Performance Products to benefit from price increases implemented to offset higher feedstock costs, additional savings from cost-reduction programs and contributions from recently completed growth capital investments. In Advanced Materials, the company expects continued strength from aerospace demand, sustained investment in power generation and grid infrastructure, and disciplined pricing to offset higher costs. The company also expects to manage capital expenditures at a level similar to 2025, with critical maintenance, cybersecurity risk mitigation and mandatory safety and environmental spending of around $150 million. Depreciation and amortization are expected to be roughly $290 million in 2026.
HUN’s Stock Price Performance
Shares of Huntsman have gained 22.3% in the past year compared with the Zacks Chemicals Diversified industry’s 18.9% rise.
Image Source: Zacks Investment Research
HUN’s Zacks Rank & Key Picks
HUN currently carries a Zacks Rank #3 (Hold).
Some better-ranked stocks worth a look in the basic materials space are Sociedad Quimica y Minera de Chile S.A. SQM, Idaho Strategic Resources, Inc. IDR and Hawkins, Inc. HWKN.
Sociedad is slated to report first-quarter 2026 results on May 26. The Zacks Consensus Estimate for loss is pegged at $1.58 per share, indicating 229.2% year-over-year growth. SQM has a Zacks Rank #2 (Buy) at present.
Idaho is expected to report first-quarter 2026 results on May 14. The Zacks Consensus Estimate for earnings is pegged at 43 cents per share, indicating 258.3% year-over-year growth. IDR sports a Zacks Rank #1 (Strong Buy) at present. You can see the complete list of today’s Zacks #1 Rank stocks here.
Hawkins is scheduled to report fiscal fourth-quarter results on May 13. The Zacks Consensus Estimate for HWKN’s fourth-quarter earnings is pegged at 77 cents per share. HWKN currently has a Zacks Rank #2.
Want the latest recommendations from Zacks Investment Research? Today, you can download 7 Best Stocks for the Next 30 Days. Click to get this free report
Sociedad Quimica y Minera S.A. (SQM) : Free Stock Analysis Report
Huntsman Corporation (HUN) : Free Stock Analysis Report
Hawkins, Inc. (HWKN) : Free Stock Analysis Report
Idaho Strategic Resources, Inc. (IDR) : Free Stock Analysis Report
This article originally published on Zacks Investment Research (zacks.com).
Momentum investing revolves around the idea of following a stock's recent trend in either direction. In "long context," investors will be essentially be "buying high, but hoping to sell even higher." With this methodology, taking advantage of trends in a stock's price is key; once a stock establishes a course, it is more than likely to continue moving that way. The goal is that once a stock heads down a fixed path, it will lead to timely and profitable trades.
While many investors like to look for momentum in stocks, this can be very tough to define. There is a lot of debate surrounding which metrics are the best to focus on and which are poor quality indicators of future performance. The Zacks Momentum Style Score, part of the Zacks Style Scores, helps address this issue for us.
Below, we take a look at SQM (SQM), a company that currently holds a Momentum Style Score of A. We also talk about price change and earnings estimate revisions, two of the main aspects of the Momentum Style Score.
It's also important to note that Style Scores work as a complement to the Zacks Rank, our stock rating system that has an impressive track record of outperformance. SQM currently has a Zacks Rank of #2 (Buy). Our research shows that stocks rated Zacks Rank #1 (Strong Buy) and #2 (Buy) and Style Scores of "A or B" outperform the market over the following one-month period.
You can see the current list of Zacks #1 Rank Stocks here >>>
Set to Beat the Market?
In order to see if SQM is a promising momentum pick, let's examine some Momentum Style elements to see if this chemicals company holds up.
Looking at a stock's short-term price activity is a great way to gauge if it has momentum, since this can reflect both the current interest in a stock and if buyers or sellers have the upper hand at the moment. It's also helpful to compare a security to its industry; this can show investors the best companies in a particular area.
For SQM, shares are up 4.38% over the past week while the Zacks Chemical – Specialty industry is flat over the same time period. Shares are looking quite well from a longer time frame too, as the monthly price change of 13.31% compares favorably with the industry's 1.26% performance as well.
While any stock can see a spike in price, it takes a real winner to consistently outperform the market. Over the past quarter, shares of SQM have risen 24.22%, and are up 178.4% in the last year. On the other hand, the S&P 500 has only moved 6.55% and 32.75%, respectively.
Investors should also pay attention to SQM's average 20-day trading volume. Volume is a useful item in many ways, and the 20-day average establishes a good price-to-volume baseline; a rising stock with above average volume is generally a bullish sign, whereas a declining stock on above average volume is typically bearish. SQM is currently averaging 1,369,309 shares for the last 20 days.
Earnings Outlook
The Zacks Momentum Style Score also takes into account trends in estimate revisions, in addition to price changes. Please note that estimate revision trends remain at the core of Zacks Rank as well. A nice path here can help show promise, and we have recently been seeing that with SQM.
Over the past two months, 2 earnings estimates moved higher compared to none lower for the full year. These revisions helped boost SQM's consensus estimate, increasing from $6.24 to $7.18 in the past 60 days. Looking at the next fiscal year, 1 estimate has moved upwards while there have been no downward revisions in the same time period.
Bottom Line
Given these factors, it shouldn't be surprising that SQM is a #2 (Buy) stock and boasts a Momentum Score of A. If you're looking for a fresh pick that's set to soar in the near-term, make sure to keep SQM on your short list.
Want the latest recommendations from Zacks Investment Research? Today, you can download 7 Best Stocks for the Next 30 Days. Click to get this free report
Sociedad Quimica y Minera S.A. (SQM) : Free Stock Analysis Report
This article originally published on Zacks Investment Research (zacks.com).
The Chemours Company CC reported a net loss of $29 million or 19 cents per share for the first quarter of 2026. This compares unfavorably with the year-ago quarter’s net loss of $5 million or 3 cents per share.
Barring one-time items, earnings were 5 cents per share, which topped the Zacks Consensus Estimate of a loss of 5 cents.
The company reported first-quarter net sales of $1,381 million, reflecting a 1% increase from the previous-year quarter. However, the figure missed the Zacks Consensus Estimate of $1,402.6 million. Net sales were primarily aided by a 2% increase in price and a 3% favorable currency impact, partly offset by a 4% decrease in volumes.
Adjusted EBITDA rose 2% year over year to $169 million for the quarter. The increase was driven by higher pricing, favorable currency and other income, which more than offset higher costs and lower sales volumes in the Advanced Performance Materials and Titanium Technologies segments.
The Chemours Company Price, Consensus and EPS Surprise
The Chemours Company price-consensus-eps-surprise-chart | The Chemours Company Quote
CC’s Segment Highlights
The Titanium Technologies division recorded revenues of $559 million in the first quarter, marking a 6% decrease from the previous year. The figure beat our estimate of $543.3 million. This downside was primarily due to a 7% decline in volumes globally and a 2% decrease in pricing, partly offset by a 3% favorable currency impact.
In the Thermal & Specialized Solutions segment, revenues saw a 22% year-over-year increase, reaching $568 million in the reported quarter. The figure was almost in line with our estimate of $568.3 million. Net sales growth was mainly driven by an 11% increase in price and a 9% rise in volume, with a 2% currency tailwind. Increased pricing was primarily driven by automotive Freon Refrigerant sales in North America.
Volume growth was supported by the continued transition to Opteon Refrigerants as well as automotive Freon Refrigerant sales in North America.
Revenues in the Advanced Performance Materials unit amounted to $243 million, which declined 17% year over year. The figure missed our estimate of $256.5 million. The downside was mainly caused by a 19% decrease in volume and a 1% decline in price, partly offset by a 3% favorable currency impact. The volume decline was primarily due to sales constraints from the Washington Works plant outage in the first quarter and the closure of the Advanced Materials SPS Capstone line, completed in the third quarter of 2025.
CC’s Financials
Operating cash usage in the first quarter was $44 million compared with $112 million in the year-ago quarter, reflecting improvements in net working capital performance. Capital expenditures were $49 million compared with $84 million in the prior-year quarter. Free cash flow reflected a usage of $93 million compared with $196 million in the first quarter of 2025.
As of March 31, 2026, Chemours had consolidated gross debt of $4.2 billion. Debt, net of $563 million in unrestricted cash and cash equivalents, was $3.6 billion. Total liquidity was $1.5 billion.
CC’s Q2 & 2026 Outlook
For the second quarter, the company expects consolidated net sales to increase in the range of 15-20% sequentially, driven by favorable seasonal trends. Consolidated adjusted EBITDA is expected to be in the range of $220-$250 million. Corporate expenses are expected to be roughly $45-$50 million. The company also expects capital expenditures of around $50 million and free cash flow of at least $100 million.
CC expects Thermal & Specialized Solutions’ net sales to increase sequentially in the low-to-mid-teens percentage range in the second quarter. Adjusted EBITDA is projected to be between $210 million and $225 million.
Titanium Technologies’ net sales are expected to increase sequentially in the mid-to-high-teens percentage range, driven by seasonal volume strength and a favorable mix for TiO2 pigment. Adjusted EBITDA is expected to be in the range of $40-$50 million.
Advanced Performance Materials’ net sales are expected to rise sequentially in the low-to-high-thirties percentage range, driven by a return to normal operating levels at the Washington Works facility. Adjusted EBITDA for APM is expected to be between $12 million and $18 million.
For 2026, Chemours continues to expect net sales to grow in the range of 3-5% year over year. Adjusted EBITDA is projected in the range of $800-$900 million. Capital expenditures are expected in the range of $275-$325 million, with free cash flow conversion above 20%.
CC’s Price Performance
CC shares have surged 117.1% in the past year compared with an 25.1% rise in the industry.
Image Source: Zacks Investment Research
CC’s Zacks Rank & Key Picks
CC currently carries a Zacks Rank #3 (Hold).
Some better-ranked stocks worth a look in the basic materials space are Sociedad Quimica y Minera de Chile S.A. SQM, Idaho Strategic Resources, Inc. IDR and Hawkins, Inc. HWKN.
Sociedad is slated to report first-quarter 2026 results on May 26. The Zacks Consensus Estimate for loss is pegged at $1.36 per share, indicating 183.3% year-over-year growth. SQM carries a Zacks Rank #2 (Buy) at present.
Idaho is expected to report first-quarter 2026 results on May 14. The Zacks Consensus Estimate for earnings is pegged at 43 cents per share, indicating 258.3% year-over-year growth. IDR sports a Zacks Rank #1 (Strong Buy) at present. You can see the complete list of today’s Zacks #1 Rank stocks here.
Hawkins is scheduled to report fiscal fourth-quarter results on May 13. The Zacks Consensus Estimate for HWKN’s fourth-quarter earnings is pegged at 77 cents per share. HWKN currently has a Zacks Rank #2.
Want the latest recommendations from Zacks Investment Research? Today, you can download 7 Best Stocks for the Next 30 Days. Click to get this free report
Sociedad Quimica y Minera S.A. (SQM) : Free Stock Analysis Report
The Chemours Company (CC) : Free Stock Analysis Report
Hawkins, Inc. (HWKN) : Free Stock Analysis Report
Idaho Strategic Resources, Inc. (IDR) : Free Stock Analysis Report
This article originally published on Zacks Investment Research (zacks.com).
PHILADELPHIA, May 7, 2026 /PRNewswire/ — FMC Corporation (NYSE:FMC), a leading global agricultural sciences company, announced today it has signed a definitive agreement to sell FMC India Private Limited (FMC India) to Crystal Crop Protection Limited, a crop solutions company in India, for consideration of $252 million USD, subject to customary adjustments for cash, debt and working capital. FMC will continue to receive all cash generated from the ongoing operation of the India business until closing, primarily through monetization of working capital.
In July 2025, FMC announced its decision to divest the company's crop protection commercial business in India, enabling FMC to participate in the Indian market through a new go-to-market approach while deploying resources to its highest-growth opportunities globally. The transaction is expected to close by year-end 2026, subject to regulatory approval and other customary closing conditions. FMC intends to allocate all proceeds from the sale to debt reduction.
"Crystal Crop Protection Limited is well-positioned to serve Indian farmers with FMC's portfolio of innovative technologies, and we look forward to supporting their growth through our supply agreement," said Pierre Brondeau, FMC chairman, chief executive officer and president. "FMC remains committed to India and will continue to conduct global R&D activities and maintain global manufacturing operations in the country."
Through this transaction, Crystal Crop Protection Limited will acquire FMC India's commercial operations in the crop protection field, including a license to FMC's brands sold in India. Crystal Crop Protection Limited will also receive a preferred supply agreement for certain FMC active ingredients and formulated products, as well as preferred access to FMC's pipeline of active ingredients in India for the crop protection field.
"We are excited on signing this definitive agreement to acquire this business of FMC in India," said Ankur Aggarwal, chairman and managing director, Crystal Crop Protection Limited. "We look forward to welcoming a talented workforce into the Crystal group and aim at accelerating innovation across both chemical and biological domains of crop protection. FMC's innovative portfolio, blockbuster brands and future pipeline give us an opportunity to provide Indian farmers access to innovative products. We look forward to further enhancing and building on our relationship with FMC."
BofA Securities acted as exclusive financial adviser while Davis Polk & Wardwell LLP served as U.S. legal adviser and Khaitan & Co assisted as legal adviser for FMC on this transaction. EY acted as exclusive buy side M&A adviser to Crystal Crop Protection Limited and Shardul Amarchand Mangaldas & Co served as legal adviser. Further terms and conditions of the agreement were not disclosed.
About FMC
FMC Corporation is a global agricultural sciences company dedicated to helping growers produce food, feed, fiber and fuel for an expanding world population while adapting to a changing environment. FMC's innovative crop protection solutions – including biologicals, crop nutrition, digital and precision agriculture – enable growers and crop advisers to address their toughest challenges economically while protecting the environment. FMC is committed to discovering new herbicide, insecticide and fungicide active ingredients, product formulations and pioneering technologies that are consistently better for the planet. Visit fmc.com to learn more and follow us on LinkedIn®.
About Crystal Crop Protection LimitedEstablished in 1994, Crystal Crop Protection Limited is a crop solutions company with agrochemicals and seeds at the core of its offerings. It operates on a fully integrated model, that integrates robust synthesis research and development in crop protection products and natural crop solutions as well as robust seeds breeding program, with backward-integrated technology enabled manufacturing and pan-India distribution, with a farmer-centric approach. To learn more, visit www.crystalcropprotection.com
Statement under the Safe Harbor Provisions of the Private Securities Litigation Reform Act of 1995: FMC and its representatives may from time to time make written or oral statements that are "forward-looking" and provide other than historical information, including statements contained in this press release, in FMC's other filings with the SEC, and in presentations, reports or letters to FMC stockholders.
In some cases, FMC has identified these forward-looking statements by such words or phrases as "outlook", "will likely result," "is confident that," "expect," "expects," "should," "could," "may," "will continue to," "believe," "believes," "anticipates," "predicts," "forecasts," "estimates," "projects," "potential," "intends" or similar expressions identifying "forward-looking statements" within the meaning of the Private Securities Litigation Reform Act of 1995, including the negative of those words or phrases. Such forward-looking statements are based on our current views and assumptions regarding future events, future business conditions and the outlook for the company based on currently available information. The forward-looking statements involve known and unknown risks, uncertainties and other factors that may cause actual results to be materially different from any results, levels of activity, performance or achievements expressed or implied by any forward-looking statement. These statements are qualified by reference to the risk factors included in Part I, Item 1A of our Annual Report on Form 10-K for the year ended December 31, 2025 (the "2025 Form 10-K"), the section captioned "Forward-Looking Information" in Part II of the 2025 Form 10-K and to similar risk factors and cautionary statements in all other reports and forms filed with the Securities and Exchange Commission ("SEC"). We wish to caution readers not to place undue reliance on any such forward-looking statements, which speak only as of the date made. Forward-looking statements are qualified in their entirety by the above cautionary statement.
We specifically decline to undertake any obligation, and specifically disclaim any duty, to publicly update or revise any forward-looking statements that have been made to reflect events or circumstances after the date of such statements or to reflect the occurrence of anticipated or unanticipated events, except as may be required by law.
View original content to download multimedia:https://www.prnewswire.com/news-releases/fmc-corporation-announces-agreement-to-divest-india-commercial-business-to-crystal-crop-protection-limited-302765506.html
Lindian Resources advances Kangankunde construction with first production in sight for Q4 2026 Proactive uses images sourced from Shutterstock
Lindian Resources Ltd (ASX:LIN, OTC:LINIF) has reported steady progress across construction, infrastructure and mining activities at its Kangankunde Rare Earths Project in Malawi, with the project on track for first production in Q4 2026.
Construction is advancing across all major work fronts, while commissioning remains targeted for October 2026 and practical completion expected in mid-November.
"Kangankunde continues to demonstrate strong execution momentum, with construction progressing across all major work fronts and the project remaining on schedule for first production in 2026," Lindian Resources executive director Zac Komur said.
"The commencement of process plant civil works, continued progress on the haul road and ROM pad, and the advancement of the electrical programme are important milestones as we move closer to commissioning. The team remains focused on safe delivery, disciplined execution and ensuring the project is operationally ready ahead of commissioning."
First production timeline and funding locked in
Kangankunde remains fully funded through to first production following a A$100 million institutional placement, with no reliance on external debt.
Stage 1 is designed for 20,000 tonnes per annum of rare earths concentrate, with approximately 10,000 tonnes expected during the first half-year of operations.
Mining is set to begin ahead of plant completion, with first ore scheduled for delivery to the run-of-mine (ROM) pad in June 2026. This early start is designed to build stockpiles and support a smoother ramp-up once processing begins.
Construction and infrastructure gathering momentum
Construction activities have accelerated across process and non-process infrastructure, with key milestones already achieved.
Process plant civil works are now underway, including shaking table base pours, product shed preparation and SAG mill excavation. Tailings storage facility (TSF) clearing is nearing completion at about 98%, with topsoil removal progressing.
Topsoil removal at TSF.
The electrical programme is also advancing, with the 23km 33kV overhead line on schedule and final commissioning targeted for late September 2026, supporting plant commissioning the following month.
On the ground, accommodation, administration and medical facilities are operational, supporting workforce expansion as construction ramps up. Additional infrastructure including workshops, fuel storage and perimeter fencing is scheduled for completion through mid to late 2026.
Aerial view of the fully operational administration office and medical clinic.
Mining development supports early-stage readiness
Mining-related works are progressing in parallel with construction, positioning the project for a transition into operations.
Haul road development is advancing, with the first blast planned for late June 2026. ROM pad and skyway construction is also progressing, enabling initial ore delivery and stockpiling ahead of commissioning.
The strategy to start mining ahead of plant completion is aimed at reducing ramp-up risk and ensuring consistent feed once processing begins.
Operational readiness and procurement progress
Lindian has started its operational readiness program, covering systems, workforce and processes to support the shift from construction to production.
Key long-lead equipment has been procured, with fabrication, delivery and mobilisation progressing in line with the project schedule.
At the same time, regulatory milestones have been secured, including water access and waste management approvals, removing key development dependencies.
Next steps toward commissioning
Looking ahead, near-term milestones include:
- First ore to ROM pad in June 2026
- First blast and expanded mining activity in late June
- Completion of key infrastructure including fuel farm and workshops by Q3 2026
- Electrical infrastructure commissioning by September 2026
- Front-end commissioning in October 2026
With construction, mining and infrastructure development advancing in parallel, Kangankunde is moving toward a fully integrated operation ahead of its targeted first production in Q4 2026.
As the Australian market shows signs of recovery, with the ASX 200 forecasted to rise by 1.2% following record highs on Wall Street, investors are keenly observing small-cap stocks that might benefit from broader economic trends and shifts in global geopolitics. In this environment, identifying promising companies involves looking for those with strong fundamentals and potential to thrive amidst both local financial challenges and international developments like fluctuating oil prices and strategic maritime operations.
Top 10 Undiscovered Gems With Strong Fundamentals In Australia
| Name | Debt To Equity | Revenue Growth | Earnings Growth | Health Rating |
|---|---|---|---|---|
| Fiducian Group | NA | 9.85% | 10.78% | ★★★★★★ |
| Joyce | NA | 7.70% | 7.34% | ★★★★★★ |
| Bailador Technology Investments | NA | -6.04% | -6.00% | ★★★★★★ |
| Euroz Hartleys Group | NA | -2.67% | -37.02% | ★★★★★★ |
| Focus Minerals | NA | 75.66% | 75.61% | ★★★★★★ |
| WAM Strategic Value | NA | -9.74% | 30.51% | ★★★★★★ |
| SDI | 14.65% | 8.06% | 12.66% | ★★★★★☆ |
| Zimplats Holdings | 3.35% | -10.45% | -46.73% | ★★★★★☆ |
| AMCIL | NA | 2.99% | 1.18% | ★★★★★☆ |
| Australian United Investment | 6.80% | 2.27% | 1.31% | ★★★★☆☆ |
We’ll examine a selection from our screener results.
Simply Wall St Value Rating: ★★★★★☆
Overview: Bell Financial Group Limited provides full-service and online broking, corporate finance, and financial advisory services to private, institutional, and corporate clients both in Australia and internationally, with a market cap of approximately A$441.02 million.
Operations: The company’s revenue is primarily derived from broking services at A$183.16 million, followed by products and services contributing A$54.62 million, and technology and platforms generating A$35.91 million.
Bell Financial Group, a notable player in Australia’s financial sector, has showcased impressive strides over the past year. The company reported earnings growth of 17.1%, outpacing the Capital Markets industry average of 9.5%. With a debt-to-equity ratio reduced from 17.4% to 10.8% over five years, BFG demonstrates prudent financial management and maintains more cash than its total debt obligations. Its price-to-earnings ratio stands at a competitive 12.2x against the market’s 17.3x, suggesting potential value for investors seeking opportunities in smaller companies with high-quality earnings and positive free cash flow dynamics.
- Navigate through the intricacies of Bell Financial Group with our comprehensive health report here.
-
Evaluate Bell Financial Group’s historical performance by accessing our past performance report.
ASX:BFG Earnings and Revenue Growth as at May 2026Cedar Woods Properties
Simply Wall St Value Rating: ★★★★★★
Overview: Cedar Woods Properties Limited is an Australian company focused on property development and investment, with a market capitalization of A$626.16 million.
Operations: Cedar Woods Properties generates revenue primarily from its property development and investment activities, amounting to A$544.87 million. The company’s net profit margin reflects its profitability after accounting for all expenses.
Cedar Woods Properties, a player in the Australian property scene, offers an attractive value proposition with its price-to-earnings ratio at 8.6x compared to the market’s 17.3x. Over five years, earnings have grown impressively by 15.7% annually, supported by strong revenue growth and high-quality earnings. The company’s net debt to equity ratio stands at a satisfactory 16.1%, reflecting prudent financial management while maintaining positive free cash flow and covering interest payments with EBIT at 9.8x coverage. Despite these strengths, Cedar Woods faces challenges from potential economic fluctuations and rising construction costs that could pressure profit margins in the future.
ASX:CWP Debt to Equity as at May 2026Lycopodium
Simply Wall St Value Rating: ★★★★★☆
Overview: Lycopodium Limited offers engineering and project delivery services across the resources, rail infrastructure, and industrial processes sectors in Australia, with a market cap of A$514.99 million.
Operations: Lycopodium Limited generates revenue through its engineering and project delivery services in the resources, rail infrastructure, and industrial processes sectors. The company reported segment adjustments of A$375.36 million.
Lycopodium, a nimble player in the engineering sector, recently reported half-year sales of A$173.83 million, up from A$165.88 million the previous year. However, net income dipped to A$18.26 million from A$25.25 million, reflecting challenges in earnings growth with a 23% negative shift over the past year compared to industry averages. Despite this setback, Lycopodium is trading at an attractive 46% below its estimated fair value and maintains high-quality earnings with interest coverage not being an issue due to more cash than total debt on hand. Future revenue growth is projected at 7%, indicating potential upside as market conditions improve and projects like Tulu Kapi Gold Project progress smoothly towards their milestones by 2028.
- Get an in-depth perspective on Lycopodium’s performance by reading our health report here.
-
Explore historical data to track Lycopodium’s performance over time in our Past section.
ASX:LYL Debt to Equity as at May 2026Key Takeaways
- Investigate our full lineup of 62 ASX Undiscovered Gems With Strong Fundamentals right here.
- Got skin in the game with these stocks? Elevate how you manage them by using Simply Wall St’s portfolio, where intuitive tools await to help optimize your investment outcomes.
- Simply Wall St is a revolutionary app designed for long-term stock investors, it’s free and covers every market in the world.
Searching for a Fresh Perspective?
- Explore high-performing small cap companies that haven’t yet garnered significant analyst attention.
- Fuel your portfolio with companies showing strong growth potential, backed by optimistic outlooks both from analysts and management.
- Find companies with promising cash flow potential yet trading below their fair value.
This article by Simply Wall St is general in nature. We provide commentary based on historical data
and analyst forecasts only using an unbiased methodology and our articles are not intended to be financial advice. It does not constitute a recommendation to buy or sell any stock, and does not take account of your objectives, or your
financial situation. We aim to bring you long-term focused analysis driven by fundamental data.
Note that our analysis may not factor in the latest price-sensitive company announcements or qualitative material.
Simply Wall St has no position in any stocks mentioned.
Companies discussed in this article include ASX:BFG ASX:CWP and ASX:LYL.
Have feedback on this article? Concerned about the content? Get in touch with us directly. Alternatively, email editorial-team@simplywallst.com
Bravo Mining (BRVO.V) reported Tuesday assays from eight drill holes in the Central sector and newly tested Crescent zone at the Luanga palladium-platinum-rhodium-gold-nickel deposit in Brazil.
Highlights include 70 meters at 1.9 grams per tonne platinum group metals and gold (PGM+Au) plus 0.28% nickel, including 20 m at 3.6 g/t PGM+Au plus 0.40% nickel, as well as 19 m at 3.2 g/t PGM+Au, and 8 m at 1.94% copper plus 0.6 g/t PGM+Au.
The results continue to demonstrate potential to expand and upgrade Luanga's mineral resource, Bravo said, adding it has completed 400 drill holes to date, with results reported for 355 drill holes to date. Assays are pending for 37 holes.
"Infill drilling is consistently intercepting thicknesses and grades often comparable to, or exceeding results from, earlier drilling. Drill sections in this news release also demonstrate that grades continue to be consistent, with excellent continuity from hole to hole and section to section," said Luis Azevedo, Chairman and CEO. "We are also encouraged with positive results from the new Crescent Zone, a regional target outside Luanga's three main PGM sectors. The Crescent Zone was delineated through reinterpretation and relogging triggered by the completion of the 2025 geophysical surveys. We've also intercepted another encouraging copper occurrence (DDH26LU307) at the eastern end of the Crescent Zone that warrants further investigation."
Shares in BRVO were up 1.4% in Canada at last look.
Highlights include 70m at 1.9 g/t PGM+Au (plus 0.28% Ni), including 20m at 3.6 g/t PGM+Au (plus 0.40% Ni), as well as 19m at 3.2 g/t PGM+Au, and 8m at 1.94% Cu (plus 0.6 g/t PGM+Au)
TORONTO, May 5, 2026 /CNW/ – Bravo Mining Corp. (TSXV: BRVO) (OTCQX: BRVMF), ("Bravo" or the "Company") is pleased to report drill assay results from eight drill holes in the Central Sector and newly tested Crescent Zone at its 100% owned Luanga palladium + platinum + rhodium + gold + nickel deposit ("Luanga deposit" or "Luanga PGM+Au+Ni deposit"), located in the Carajás Mineral Province, Pará State, Brazil.
"Initial results from infill and extensional drilling in the Central Sector at our Luanga PGM+Au+Ni deposit continue to demonstrate potential to expand and upgrade Luanga's mineral resource. Infill drilling is consistently intercepting thicknesses and grades often comparable to, or exceeding results from, earlier drilling. Drill sections in this news release also demonstrate that grades continue to be consistent, with excellent continuity from hole to hole and section to section," said Luis Azevedo, Chairman and CEO. "We are also encouraged with positive results from the new Crescent Zone, a regional target outside Luanga's three main PGM sectors. The Crescent Zone was delineated through reinterpretation and relogging triggered by the completion of the 2025 geophysical surveys. We've also intercepted another encouraging copper occurrence (DDH26LU307) at the eastern end of the Crescent Zone that warrants further investigation."
Highlights Include:
- The 2026 infill and extensional drill program is well underway, with results received from the Central Sector supporting the objectives of expanding mineralization and upgrading the confidence of existing Mineral Resource Estimate ("MRE") from Inferred to Indicated categories.
- Results to date continue to demonstrate comparable or improved grades and mineralized thicknesses relative to previous drilling on the same or surrounding sections. Mineralization remains open at depth.
- Exploration at the new Crescent Zone (see Figure 4), located outside Luanga's three main PGM sectors, suggests repetition of the mafic/ultramafic Luanga stratigraphic sequence, supporting the possibility of multiple PGM+Au mineralized horizons associated with the prospective orthopyroxenite unit. Further drilling is required to test this potential.
- At the Crescent Zone, 7.95m of high-grade copper oxide mineralization (1.94% Cu), with associated PGM+Au, was intercepted. Additional follow-up work required.
|
HOLE-ID |
From (m) |
To (m) |
Thickness (m) |
Au (g/t) |
Pt (g/t) |
Pd (g/t) |
Rh (g/t) |
Ni (%) Sulphide* |
Cu (%) |
PGM+Au (g/t) |
TYPE |
|
DDH26LU302 |
137.00 |
181.00 |
44.00 |
0.01 |
0.43 |
1.32 |
0.067 |
0.24 |
0.01 |
1.83 |
FR |
|
DDH26LU305 |
163.90 |
234.70 |
70.80 |
0.03 |
0.41 |
1.35 |
0.064 |
0.28 |
0.03 |
1.86 |
FR |
|
Including |
212.70 |
232.70 |
20.00 |
0.01 |
0.80 |
2.63 |
0.115 |
0.40 |
0.02 |
3.56 |
FR |
|
DDH26LU306 |
199.00 |
218.00 |
19.00 |
0.04 |
1.28 |
1.66 |
0.224 |
0.19 |
0.01 |
3.20 |
FR |
|
DDH26LU307 |
34.25 |
42.20 |
7.95 |
0.05 |
0.35 |
0.18 |
0.004 |
NA |
1.94 |
0.58 |
Ox |
|
DDH26LU308 |
218.75 |
265.75 |
47.00 |
0.01 |
0.42 |
1.34 |
0.056 |
0.28 |
0.01 |
1.83 |
FR |
|
Including |
254.75 |
264.75 |
10.00 |
0.01 |
0.75 |
2.47 |
0.116 |
0.46 |
0.02 |
3.36 |
FR |
|
Notes: |
All 'From', 'To' depths, and 'Thicknesses' are downhole. 'NA' Not applicable for Oxide material.Given the orientation of drilling and mineralization, intercepts are estimated at 106% to 125% of true thickness in the Central Sector, and 103% to 105% of true thickness in the Crescent Zone.Type: Ox = Oxide. FR = Fresh Rock. Recovery methods and results will differ based on the type of mineralization.* Bravo's nickel grades are sulphide nickel, and do not include non-recoverable silicate nickel. |
Luanga Drilling Update
Results from eight diamond drill holes have been received; four from the Central Sector and four from the new Crescent Zone of the Luanga PGM+Au+Ni deposit. All drill holes reported herein are angled holes (-60 degrees), towards an azimuth of 330°. Together, this set of drill holes comprise a total of 1,953 metres of diamond drilling.
Section 1 (Figure 1) in the Central Sector shows results from the first of the infill sections at the Central Sector, where the Main Sulphide Zone mineralization is now defined to approximately 250m below surface on these new sections. The objective of this work is to upgrade the confidence levels of existing resources in the Mineral Resource Estimate ("MRE") from inferred to indicated resources. DDH26LU302, 305 and 308 all exhibit similar thicknesses of mineralization seen in previously reported drill hole DDH24LU289 and in sections along strike. PGM+Au grades appear slightly better in the new drilling, while Ni sulphide grades appear to increase marginally with depth. Mineralization remains open at depth.
Section 2 (Figure 2) shows exploration drilling at the newly named Crescent Zone. Historical drilling previously identified PGM+Au mineralization at this location, albeit with a limited understanding of its orientation or potential. Recent reinterpretation and relogging by Bravo, following newly collected ground geophysics (micro-gravity and magnetics) that was completed in late 2025, suggest repetition through potential folding (which may also introduce overturning with repetition) of the mafic/ultramafic Luanga stratigraphic sequence. This creates the possibility of intercepting PGM+Au mineralization associated with the prospective orthopyroxenite stratigraphic unit where it is repeated.
Section 2 shows the stratigraphy in the Crescent Zone to be a repeat of the known mineralized Luanga stratigraphy in the Central Sector to the east, encompassing at least three mineralized lenses. However, in this case, the stratigraphy is "right-way-up" (mafic rocks at the top, ultramafic rocks below), whereas in the Central Sector stratigraphy is overturned, with ultramafic rocks above the mafic sequence. Furthermore, relogged historic drill hole FD0079 shows the apparent reappearance, at depth, of the mafic (norite) upper part of the Luanga stratigraphic sequence. Further drilling is required to better understand and test this potential.
Further to the east in the Crescent Zone, drill hole DDH26LU307 (Figure 3) intersected 7.95m at 1.94% Cu (plus 0.6 g/t PGM+Au), in oxide from a depth of 34m. Mineralization is composed of a mixture of oxide Cu minerals and what appears to be PGM+Au mineralization that is more typical of the Luanga PGM+Au+Ni deposit. Copper mineralization is composed mostly of malachite, iron hydroxides (from sulphides) and chalcocite (a Cu supergene mineral, likely from the supergene alteration of chalcopyrite). Chalcocite occurs as fine-grained aggregates or coatings on remnants of chalcopyrite. Malachite is likely derived from subsequent alteration of chalcocite. The host rock is a brecciated talc-schist, highly altered and locally with mylonitic foliation. Further work is required to determine the source and style of this mineralization.
Drill Results Status Update
In total, 400 drill holes have been completed by Bravo to date, for 85,074 metres, including 8 metallurgical holes (not subject to routine assaying). Results have been reported for 355 Bravo drill holes to date. Assay results for 37 holes are currently outstanding (excluding the metallurgical holes), which mostly relate to exploration drilling outside the Luanga PGM+Au+Ni resource area. In total, 58 trenches have been completed to date (for 10,901 metres), with results from 6 trenches currently pending.
Complete Table of Recent Intercepts.
|
HOLE-ID |
From (m) |
To (m) |
Thickness (m) |
Au (g/t) |
Pt (g/t) |
Pd (g/t) |
Rh (g/t) |
Ni (%) Sulphide* |
Cu (%) |
PGM+Au (g/t) |
TYPE |
|
DDH26LU302 |
73.05 |
75.05 |
2.00 |
0.03 |
0.01 |
0.01 |
0.001 |
0.41 |
0.10 |
0.04 |
FR |
|
And |
89.05 |
90.05 |
1.00 |
2.01 |
0.03 |
0.05 |
0.007 |
0.03 |
<0.01 |
2.09 |
FR |
|
And |
137.00 |
181.00 |
44.00 |
0.01 |
0.43 |
1.32 |
0.067 |
0.24 |
0.01 |
1.83 |
FR |
|
And |
256.85 |
261.90 |
5.05 |
0.00 |
0.82 |
0.23 |
0.220 |
0.01 |
<0.01 |
1.29 |
FR |
|
DDH26LU303 |
95.33 |
103.50 |
8.17 |
0.00 |
0.69 |
0.39 |
0.003 |
0.02 |
0.01 |
1.09 |
FR |
|
And |
203.75 |
205.54 |
1.79 |
0.00 |
1.10 |
0.20 |
0.015 |
0.04 |
<0.01 |
1.31 |
FR |
|
DDH26LU304 |
16.00 |
27.30 |
11.30 |
0.00 |
0.53 |
0.42 |
0.004 |
NA |
0.01 |
0.95 |
Ox |
|
And |
116.50 |
118.55 |
2.05 |
0.01 |
1.22 |
0.29 |
0.013 |
0.08 |
0.01 |
1.53 |
FR |
|
DDH26LU305 |
163.90 |
234.70 |
70.80 |
0.03 |
0.41 |
1.35 |
0.064 |
0.28 |
0.03 |
1.86 |
FR |
|
Including |
212.70 |
232.70 |
20.00 |
0.01 |
0.80 |
2.63 |
0.115 |
0.40 |
0.02 |
3.56 |
FR |
|
And |
241.70 |
244.70 |
3.00 |
0.03 |
3.21 |
3.45 |
0.063 |
0.21 |
0.01 |
6.75 |
FR |
|
DDH26LU306 |
114.00 |
118.00 |
4.00 |
0.03 |
0.27 |
0.40 |
0.007 |
0.08 |
0.03 |
0.71 |
FR |
|
And |
135.95 |
140.15 |
4.20 |
0.16 |
0.30 |
0.81 |
0.072 |
0.43 |
0.10 |
1.34 |
FR |
|
And |
147.15 |
149.15 |
2.00 |
0.06 |
0.48 |
1.09 |
0.089 |
0.34 |
0.07 |
1.72 |
FR |
|
And |
199.00 |
218.00 |
19.00 |
0.04 |
1.28 |
1.66 |
0.224 |
0.19 |
0.01 |
3.20 |
FR |
|
And |
237.00 |
241.00 |
4.00 |
0.02 |
0.35 |
0.79 |
0.039 |
0.05 |
0.01 |
1.19 |
FR |
|
DDH26LU307 |
11.00 |
15.00 |
4.00 |
0.01 |
0.29 |
0.15 |
0.003 |
NA |
<0.01 |
0.45 |
Ox |
|
And |
34.25 |
42.20 |
7.95 |
0.05 |
0.35 |
0.18 |
0.004 |
NA |
1.94 |
0.58 |
Ox |
|
And |
46.20 |
58.20 |
12.00 |
0.01 |
0.30 |
0.19 |
0.004 |
NA |
0.02 |
0.51 |
Ox |
|
And |
137.20 |
140.20 |
3.00 |
0.01 |
1.02 |
0.19 |
0.015 |
0.05 |
0.01 |
1.23 |
FR |
|
DDH26LU308 |
25.35 |
27.35 |
2.00 |
0.17 |
0.54 |
1.29 |
0.003 |
0.27 |
0.01 |
2.00 |
FR |
|
And |
35.35 |
37.35 |
2.00 |
0.12 |
0.15 |
0.39 |
0.003 |
0.10 |
0.01 |
0.67 |
FR |
|
And |
164.00 |
164.75 |
0.75 |
0.01 |
0.00 |
0.00 |
0.000 |
1.00 |
0.28 |
0.01 |
FR |
|
And |
218.75 |
265.75 |
47.00 |
0.01 |
0.42 |
1.34 |
0.056 |
0.28 |
0.01 |
1.83 |
FR |
|
Including |
254.75 |
264.75 |
10.00 |
0.01 |
0.75 |
2.47 |
0.116 |
0.46 |
0.02 |
3.36 |
FR |
|
And |
284.75 |
310.75 |
26.00 |
0.01 |
0.25 |
0.36 |
0.004 |
0.05 |
0.01 |
0.61 |
FR |
|
Including |
286.75 |
289.75 |
3.00 |
0.02 |
0.81 |
0.99 |
0.018 |
0.07 |
0.01 |
1.84 |
FR |
|
DDH26LU309 |
17.00 |
18.00 |
1.00 |
0.02 |
0.79 |
0.32 |
0.014 |
NA |
0.01 |
1.13 |
Ox |
|
And |
86.15 |
88.15 |
2.00 |
0.00 |
0.57 |
0.17 |
0.001 |
0.03 |
0.01 |
0.74 |
FR |
|
And |
111.60 |
114.60 |
3.00 |
0.00 |
0.65 |
0.36 |
0.002 |
0.04 |
0.01 |
1.02 |
FR |
|
And |
149.60 |
155.40 |
5.80 |
0.00 |
0.40 |
0.12 |
0.004 |
0.02 |
0.01 |
0.53 |
FR |
|
Notes: |
All 'From', 'To' depths, and 'Thicknesses' are downhole. 'NA' Not applicable for Oxide material.Given the orientation of drilling and mineralization, intercepts are estimated at 106% to 125% of true thickness in the Central Sector, and 103% to 105% of true thickness in the Crescent Zone.Type: Ox = Oxide. FR = Fresh Rock. Recovery methods and results will differ based on the type of mineralization.* Bravo's nickel grades are sulphide nickel, and do not include non-recoverable silicate nickel. |
About Bravo Mining Corp.
Bravo is a Canadian and Brazil-based mineral exploration and development company focused on advancing its PGM and copper-gold Luanga Project in the Carajás Mineral Province, Pará State, Brazil. Bravo is one of the most active explorers in Carajás.
The team, comprising of local and international geologists, has a proven track record of PGM, nickel, and copper discoveries in the region. They have successfully taken a past IOCG greenfield project from discovery to development and production in the Carajás.
The Luanga Project is situated on mature freehold farming land and benefits from being located close to operating mines and a mining-experienced workforce, with excellent access and proximity to existing infrastructure, including road, rail, and hydroelectric grid power. Bravo's current Environmental, Social and Governance activities include planting more than 55,000 high-value trees in and around the project area and hiring and contracting locally.
Technical Disclosure
Technical information in this news release has been reviewed and approved by Simon Mottram, F.AusIMM (Fellow Australian Institute of Mining and Metallurgy), President of Bravo Mining Corp. who serves as the Company's "qualified person" as defined in National Instrument 43-101 Standards of Disclosure for Mineral Projects ("NI 43-101"). Mr. Mottram has verified the technical data and opinions contained in this news release.
Neither TSX Venture Exchange nor its Regulation Services Provider (as that term is defined in policies of the TSX Venture Exchange) accepts responsibility for the adequacy or accuracy of this release.
Forward Looking Statements
This news release contains forward-looking information which is not comprised of historical facts. Forward-looking information is characterized by words such as "expand", "upgrade", "consistently", "exceed", "robust", "continuous", "encourage", "improve", "potential", "high-grade", "better", "increase", "advance", "most active", "benefit", " significant", "consistent", "frequent", "comparable", "possibility", "prospective", "remains open", ""objective", "appear", "define", "similar", variants of these words and other similar words, phrases, or statements that certain events or conditions "may" or "will" occur. This news release contains forward-looking information pertaining to the Company's 2026 drill program and the results thereof; comparisons to historical and/or prior Bravo drilling; the potential for extensions to mineralization at depth; the potential for greater thicknesses and/or higher grades at depth; the potential for fold repetitions of favourable stratigraphy and mineralized horizons; the potential of the recently identified Crescent Zone, including the copper oxide-PGM mineralization and whether a mineral resource can be defined at Crescent; whether the Crescent Zone is a fold repetition of the current mineralized stratigraphy and whether there is potential for additional such repetitions; whether or not the infill drilling will confirm the continuity of the mineralization in the current mineral resource estimate; whether or not infill drilling will upgrade mineral resources from the inferred category to the indicated category; the impact of current and future drilling on future mineral resource estimates, after taking into account other modifying factors; whether or not the mineralization is amenable to open pit mining and, if so, to what extent; potential economic outcomes, including strip ratios, in future economic studies; and the Company's plans in respect thereof. Forward-looking information involves risks, uncertainties and other factors that could cause actual events, results, and opportunities to differ materially from those expressed or implied by such forward-looking information. Factors that could cause actual results to differ materially from such forward-looking information include, but are not limited to, unexpected results from exploration programs, changes in the state of equity and debt markets, fluctuations in commodity prices, delays in obtaining required regulatory or governmental approvals, environmental risks, limitations on insurance coverage; and other risks and uncertainties involved in the mineral exploration and development industry. Forward-looking information in this news release is based on the opinions and assumptions of management considered reasonable as of the date hereof, including, but not limited to, the assumption that the assay results confirm that the interpreted mineralization contains significant values of nickel, PGMs and Au; that the mineralization remains open to depth, that PGM and/or Ni grades and mineralized thicknesses are improving to depth; that final drill and assay results will be in line with management's expectations; that activities will not be adversely disrupted or impeded by regulatory, political, community, economic, environmental and/or healthy and safety risks; that the Luanga Project will not be materially affected by potential supply chain disruptions; and general business and economic conditions will not change in a materially adverse manner. Although the Company believes that the assumptions and factors used in preparing the forward-looking information in this news release are reasonable, undue reliance should not be placed on such information. The Company disclaims any intention or obligation to update or revise any forward-looking information, other than as required by applicable securities laws.
Schedule 1: Drill Hole Collar Details
|
HOLE-ID |
Company |
East (m) |
North (m) |
RL (m) |
Datum |
Depth (m) |
Azimuth |
Dip |
Sector |
|
DDH26LU302 |
Bravo |
658323.20 |
9340430.22 |
273.380 |
SIRGAS2000_UTM_22S |
270.40 |
330.00 |
-60.00 |
Central |
|
DDH26LU303 |
Bravo |
658915.18 |
9341302.67 |
217.620 |
SIRGAS2000_UTM_22S |
250.70 |
330.00 |
-60.00 |
Crescent |
|
DDH26LU304 |
Bravo |
658865.55 |
9341388.48 |
208.750 |
SIRGAS2000_UTM_22S |
150.00 |
330.00 |
-60.00 |
Crescent |
|
DDH26LU305 |
Bravo |
658346.26 |
9340390.55 |
265.450 |
SIRGAS2000_UTM_22S |
310.40 |
330.00 |
-60.00 |
Central |
|
DDH26LU306 |
Bravo |
659385.87 |
9341087.39 |
221.820 |
SIRGAS2000_UTM_22S |
270.45 |
330.00 |
-60.00 |
Central |
|
DDH26LU307 |
Bravo |
658952.31 |
9341438.17 |
209.690 |
SIRGAS2000_UTM_22S |
150.40 |
330.00 |
-60.00 |
Crescent |
|
DDH26LU308 |
Bravo |
658369.87 |
9340350.06 |
256.840 |
SIRGAS2000_UTM_22S |
350.75 |
330.00 |
-60.00 |
Central |
|
DDH26LU309 |
Bravo |
658977.22 |
9341395.15 |
218.480 |
SIRGAS2000_UTM_22S |
200.25 |
330.00 |
-60.00 |
Crescent |
Schedule 2: Assay Methodologies and QAQC
Samples follow a chain of custody between collection, processing, and delivery to the SGS Geosol laboratory in Parauapebas, state of Pará, Brazil. The drill core is delivered to the core shack at Bravo's Luanga site facilities and processed by geologists who insert certified reference materials, blanks, and duplicates into the sampling sequence. Drill core is half cut and placed in secured polyurethane bags, then in security-sealed sacks before being delivered directly from the Luanga site facilities to the Parauapebas SGS Geosol laboratory by Bravo staff. Additional information about the methodology can be found on the SGS Geosol website (SGS) in their analytical guides. Information regarding preparation and analysis of historic drill core is also presented in the table below, where the information is known.
Quality Assurance and Quality Control ("QAQC") is maintained internally at the lab through rigorous use of internal certified reference materials, blanks, and duplicates. An additional QAQC program is administered by Bravo using certified reference materials, duplicate samples and blank samples that are blindly inserted into the sample batch. If a QAQC sample returns an unacceptable value an investigation into the results is triggered and when deemed necessary, the samples that were tested in the batch with the failed QAQC sample are re-tested.
|
Bravo SGS Geosol |
||||
|
Preparation |
Method |
Method |
Method |
Method |
|
For All Elements |
Pt, Pd, Au |
Rh |
Sulphide Ni, Cu |
Trace Elements |
|
PRPCLI (85% at 200#) |
FAI515 |
FAI30V |
AA04B |
ICP40B |
View original content to download multimedia: http://www.newswire.ca/en/releases/archive/May2026/05/c5834.html
Toronto, Ontario–(Newsfile Corp. – May 4, 2026) – Olive Resource Capital Inc. (TSXV: OC) ("Olive" or the "Company") is pleased to provide investors an update on its investments for the period ending April 30, 2026.
Table 1: Olive's Investment Portfolio
| Name | Ticker | Sector | Category | (Audited) Value | (Unaudited) Value | (Unaudited) Value |
| Dec 31, 2025(1) | Mar 31, 2026(1) | Apr 30, 2026(1) | ||||
| Omai Gold Mines Corp.(2) | OMG.v | Precious Metals | Public Equity | $3,504,200 | $4,255,100 | $5,806,960 |
| Black Sheep Ventures Inc. | Private | Real Estate | Private Equity & Conv. Debenture | $1,527,912 | $1,537,776 | $1,541,063 |
| Arizona Sonoran Copper Co. | ASCU | Base Metals | Public Equity | $908,200 | $1,400,000 | $1,059,800 |
| Goldsky Resources Corp. (inc. Warrants) | GSKR.v | Precious Metals | Public Equity | $296,829 | $631,485 | $789,245 |
| Sun Valley Minerals Inc.(2) | Private | Precious Metals | Private Equity | $375,000 | $562,500 | $562,500 |
| West Point Gold Corp.(2) | WPG.v | Precious Metals | Public Equity | $515,551 | $508,133 | $537,805 |
| Bravo Mining Corp. | BRVO.v | Precious Metals | Public Equity | $601,250 | $488,312 | $504,064 |
| GeoPark Ltd. | GPRK | Oil & Gas | Public Equity | $203,123 | $436,580 | $461,581 |
| Freehold Royalties Ltd. | FRU | Royalty | Public Equity | $240,002 | $326,556 | $410,172 |
| Troilus Gold Corp (inc. Warrants) | TLG | Precious Metals | Public Equity | $482,000 | $312,500 | $327,500 |
| Other Public Equity Liquid Investments and Cash Equivalents (3) | $2,405,764 | $2,379,528 | $4,126,123 | |||
| Other Public Equity Fundamental Investments Incl. Warrants (4) | $4,326,677 | $3,600,680 | $2,424,490 | |||
| Other Private Equity, Loans, & Convertible Debenture Investments | $1,087,181 | $972,179 | $1,180,367 | |||
| Total | $16,473,208(5) | $17,410,848(5) | $19,731,191(5) | |||
Samuel Pelaez, the Company's President, CEO, CIO, and Director stated: "Commodities advanced broadly during April, with the U.S. dollar index giving up the year's advance. Seasonal patterns remain influential even as the news flow continues to be dominated by the conflict in Iran. Commodity equities underperformed their respective commodity references. At Olive, we have reduced our gross exposure to commodity equities as the global situation remains unstable, while the major seasonal tailwinds begin to wind down."
Derek Macpherson, the Company's Executive Chairman stated: "As a result of significant outperformance of Olive's portfolio versus resource indices, the portfolio has been able to recover the majority of losses from the month of March. Of note, outperformance from Aurion Resources, which is the process of being acquired for cash by Agnico Eagle and Omai Gold Mines, where regional M&A activity and an updated resource pushed the stock higher, drove the portfolio. Notably, as the result of ongoing normal course issuer bid in March, on a per share basis, Olive has recovered to its end of February value."
Normal Course Issuer Bid ("NCIB")
As of the date of this release, the Company holds 4,076,500 common shares in treasury pending cancellation.
As of the date of this release Olive Resource Capital Inc. has 106,744,709 common shares outstanding inclusive of the shares in treasury pending cancellation.
About Olive Resource Capital Inc.:
Olive is a resource-focused merchant bank and investment company with a portfolio of publicly listed and private securities. The Company's assets consist primarily of investments in natural resource companies in all stages of development.
For further information, please contact:
Derek Macpherson, Executive Chairman at derek@olive-resource.com or by phone at (416)294-6713 or Samuel Pelaez, President, CEO & CIO at sam@olive-resource.com. Olive's website is located at www.olive-resource.com.
Neither the TSX Venture Exchange Inc. nor its Regulation Services Provider (as that term is defined in the policies of the TSX Venture Exchange Inc.) accepts responsibility for the adequacy or accuracy of this release. The TSX Venture Exchange Inc. has in no way approved nor disapproved the information contained herein.
Cautionary Note Regarding Forward-Looking Statements: This press release contains "forward-looking information" within the meaning of applicable Canadian securities laws. Any statements that express or involve discussions with respect to predictions, expectations, beliefs, plans, projections, objectives, assumptions or future events or performance (often, but not always, identified by words or phrases such as "believes", "anticipates", "expects", "is expected", "scheduled", "estimates", "pending", "intends", "plans", "forecasts", "targets", or "hopes", or variations of such words and phrases or statements that certain actions, events or results "may", "could", "would", "will", "should", "might", "will be taken", or "occur" and similar expressions) are not statements of historical fact and may be forward-looking statements.
This news release includes forward-looking statements that are subject to risks and uncertainties. Forward-looking statements involve known and unknown risks, uncertainties, and other factors that could cause the actual results of Olive to be materially different from the historical results or from any future results expressed or implied by such forward-looking statements. All statements contained in this news release, other than statements of historical fact, are to be considered forward-looking, including, without limitation, statements concerning Olive's intended future disclosure practices. Although Olive believes the expectations expressed in such forward-looking statements are based on reasonable assumptions, such statements are not guarantees of future performance and actual results or developments may differ materially from those in the forward-looking statements. Factors that could cause actual results to differ materially from such forward-looking information include, but are not limited to: past success or achievement does not guarantee future success; negative investment performance; downward market fluctuations; downward fluctuations in commodity prices and changes in the prices of commodities in general; uncertainties relating to the availability and costs of financing needed in the future; interest rate and exchange rate fluctuations; changes in economic and political conditions that could negatively affect certain commodity prices; and those risks set out in the Company's public documents filed on SEDAR+. Accordingly, readers should not place undue reliance on forward-looking information. Olive does not undertake to update any forward-looking information except in accordance with applicable securities laws.
This commentary is provided for general informational purposes only and does not constitute financial, investment, tax, legal or accounting advice nor does it constitute an offer or solicitation to buy or sell any securities referred to. The information provided in this recording has been obtained from sources believed to be reliable and is believed to be accurate at the time of publishing but we do not represent that it is accurate or complete and it should not be relied upon as such.
To view the source version of this press release, please visit https://www.newsfilecorp.com/release/295740
In the last week, the United States market has stayed flat, but it has shown a robust 29% rise over the past 12 months with earnings forecasted to grow by 16% annually. In this environment, identifying small-cap stocks that are potentially undervalued and exhibit insider buying can offer intriguing opportunities for investors looking to capitalize on growth prospects.
Top 10 Undervalued Small Caps With Insider Buying In The United States
| Name | PE | PS | Discount to Fair Value | Value Rating |
|---|---|---|---|---|
| Financial Institutions | 8.7x | 2.8x | 49.61% | ★★★★★☆ |
| Ferroglobe | NA | 0.6x | 45.31% | ★★★★★☆ |
| 1st Source | 11.1x | 4.2x | 42.00% | ★★★★☆☆ |
| Aldeyra Therapeutics | NA | NA | 49.64% | ★★★★☆☆ |
| Metropolitan Bank Holding | 12.7x | 3.6x | 42.32% | ★★★☆☆☆ |
| Tennant | 34.1x | 1.2x | 38.10% | ★★★☆☆☆ |
| German American Bancorp | 12.0x | 4.4x | 46.07% | ★★★☆☆☆ |
| Eagle Financial Services | 10.6x | 2.5x | 32.40% | ★★★☆☆☆ |
| Union Bankshares | 10.3x | 2.1x | 22.81% | ★★★☆☆☆ |
| New Peoples Bankshares | 9.4x | 2.2x | 25.73% | ★★★☆☆☆ |
We’ll examine a selection from our screener results.
Simply Wall St Value Rating: ★★★☆☆☆
Overview: TriMas is a diversified manufacturer of engineered products serving various industries, with a market capitalization of approximately $1.25 billion.
Operations: TriMas generates revenue primarily through its sales, with recent quarterly figures showing revenue of $973.84 million and $1.01 billion. The company’s cost structure includes significant expenses such as the cost of goods sold (COGS), which was $753.85 million in one quarter, and operating expenses, including general and administrative costs that reached up to $138.95 million in another period. Gross profit margin has shown variation over time, with a recent figure reported at 23.10%. Net income has fluctuated significantly, reflecting various non-operating expenses impacting profitability across different periods.
PE: 19.3x
TriMas, a smaller company in the U.S., has shown mixed financial signals. Recent Q1 2026 earnings reported sales of US$168.28 million, up from US$152.46 million last year, yet net income soared to US$800.83 million due to significant one-off items impacting results. The company’s confidence is evident with insider purchases and a completed share repurchase plan totaling 22.81% of shares for US$285.69 million by end-2025, signaling potential value recognition despite high-risk external borrowing reliance for funding needs.
- Unlock comprehensive insights into our analysis of TriMas stock in this valuation report.
-
Review our historical performance report to gain insights into TriMas”s past performance.
TRS Share price vs Value as at May 2026Arbor Realty Trust
Simply Wall St Value Rating: ★★★☆☆☆
Overview: Arbor Realty Trust is a real estate investment trust that specializes in originating and servicing loans for multifamily, single-family rental, and commercial real estate markets with a market cap of approximately $2.56 billion.
Operations: The company’s revenue is primarily derived from its Agency Business and Structured Business segments. The gross profit margin has shown a notable trend, reaching 92.28% in September 2023. Operating expenses, including general and administrative costs, significantly impact the overall financial performance, with recent figures showing an increase to $257.50 million by September 2025.
PE: 14.1x
Arbor Realty Trust, a small US real estate investment trust, showcases potential value with insider confidence evident from recent share purchases. Despite a dip in net income to US$148.8 million for 2025 from the previous year and impairment charges of US$20.5 million, Arbor’s strategic moves like a US$762.6 million securitization aim to bolster its financial footing. The appointment of experienced executives further strengthens its operational capabilities, hinting at promising future growth in the commercial real estate sector.
- Get an in-depth perspective on Arbor Realty Trust’s performance by reading our valuation report here.
-
Evaluate Arbor Realty Trust’s historical performance by accessing our past performance report.
ABR Share price vs Value as at May 2026FMC
Simply Wall St Value Rating: ★★★☆☆☆
Overview: FMC is a global agricultural sciences company that provides innovative solutions for crop protection, plant health, and professional pest control, with a market cap of approximately $12.60 billion.
Operations: FMC’s revenue is primarily derived from its sales, with recent figures showing a decline to $3.43 billion as of March 2026. The company’s cost structure includes significant expenses such as COGS, which was $2.33 billion in the same period, and operating expenses totaling $942.2 million. Notably, FMC’s net income margin has experienced volatility, reaching -71.52% by March 2026 due to substantial non-operating expenses amounting to $2.62 billion during this timeframe.
PE: -0.8x
FMC, a company in the specialty chemicals industry, recently faced financial challenges with a net loss of US$281 million for Q1 2026. Despite this, insider confidence is evident as Independent Director Michael Barry purchased shares worth approximately US$250,000 in February 2026. This move suggests potential value recognition amidst ongoing strategic initiatives like debt restructuring and product innovation. With regulatory approval for Isoflex active in the EU and plans for further launches by 2027, FMC aims to enhance its growth trajectory while exploring strategic options to bolster shareholder value.
- Take a closer look at FMC’s potential here in our valuation report.
-
Examine FMC’s past performance report to understand how it has performed in the past.
FMC Ownership Breakdown as at May 2026Turning Ideas Into Actions
- Unlock more gems! Our Undervalued US Small Caps With Insider Buying screener has unearthed 56 more companies for you to explore.Click here to unveil our expertly curated list of 59 Undervalued US Small Caps With Insider Buying.
- Got skin in the game with these stocks? Elevate how you manage them by using Simply Wall St’s portfolio, where intuitive tools await to help optimize your investment outcomes.
- Discover a world of investment opportunities with Simply Wall St’s free app and access unparalleled stock analysis across all markets.
Interested In Other Possibilities?
- Explore high-performing small cap companies that haven’t yet garnered significant analyst attention.
- Fuel your portfolio with companies showing strong growth potential, backed by optimistic outlooks both from analysts and management.
- Find companies with promising cash flow potential yet trading below their fair value.
This article by Simply Wall St is general in nature. We provide commentary based on historical data
and analyst forecasts only using an unbiased methodology and our articles are not intended to be financial advice. It does not constitute a recommendation to buy or sell any stock, and does not take account of your objectives, or your
financial situation. We aim to bring you long-term focused analysis driven by fundamental data.
Note that our analysis may not factor in the latest price-sensitive company announcements or qualitative material.
Simply Wall St has no position in any stocks mentioned.
Companies discussed in this article include TRS ABR and FMC.
Have feedback on this article? Concerned about the content? Get in touch with us directly. Alternatively, email editorial-team@simplywallst.com
If you would like to receive our free newsletter via email, simply enter your email address below & click subscribe.
 Follow us on Twitter
 Become our facebook fan
CONNECT WITH US
Tweets
Tweet with hash tag #miningfeeds or @miningfeeds and your tweets will be displayed across this site.
MOST ACTIVE MINING STOCKS
Daily Gainers
 CMC Metals Ltd. CMC Metals Ltd. |
CMB.V | +900.00% |
 Eden Energy Ltd Eden Energy Ltd |
EDE.AX | +200.00% |
| GoviEx Uranium Inc. |
GXU.V | +42.86% |
| Eagle Nickel Ltd. |
ENL.AX | +41.67% |
| Citigold Corp. Limited |
CTO.AX | +33.33% |
| Mount Burgess Mining NL |
MTB.AX | +33.33% |
| Exalt Resources Limited |
ERD.AX | +31.94% |
| Casa Minerals Inc. |
CASA.V | +30.00% |
| Cariboo Rose Resources Ltd |
CRB.V | +28.57% |
| Belmont Resources Inc. |
BEA.V | +28.57% |


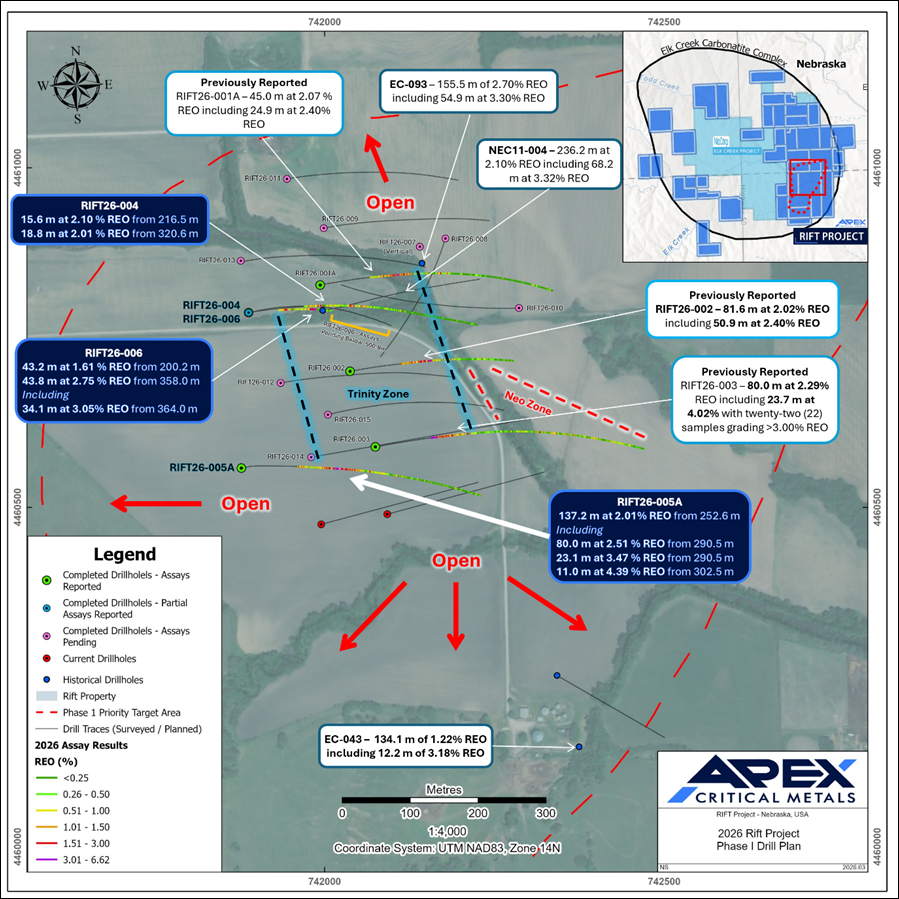
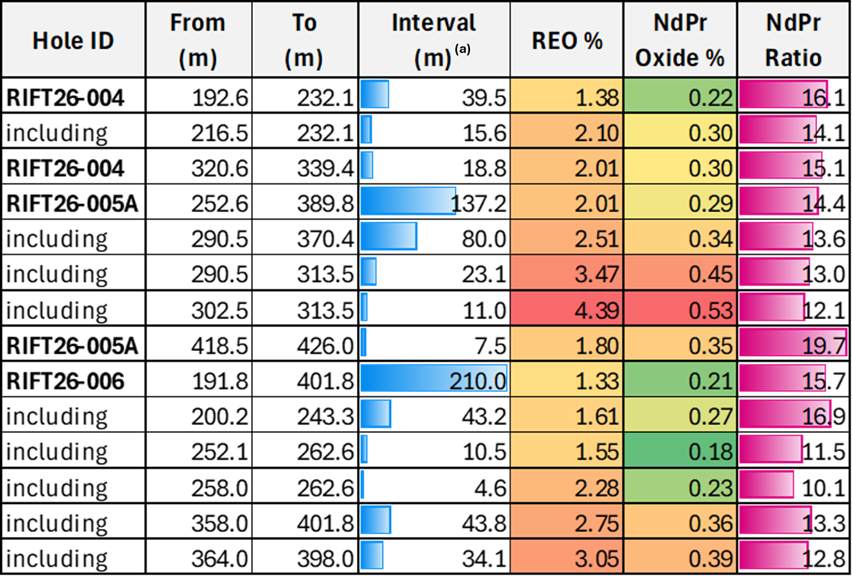
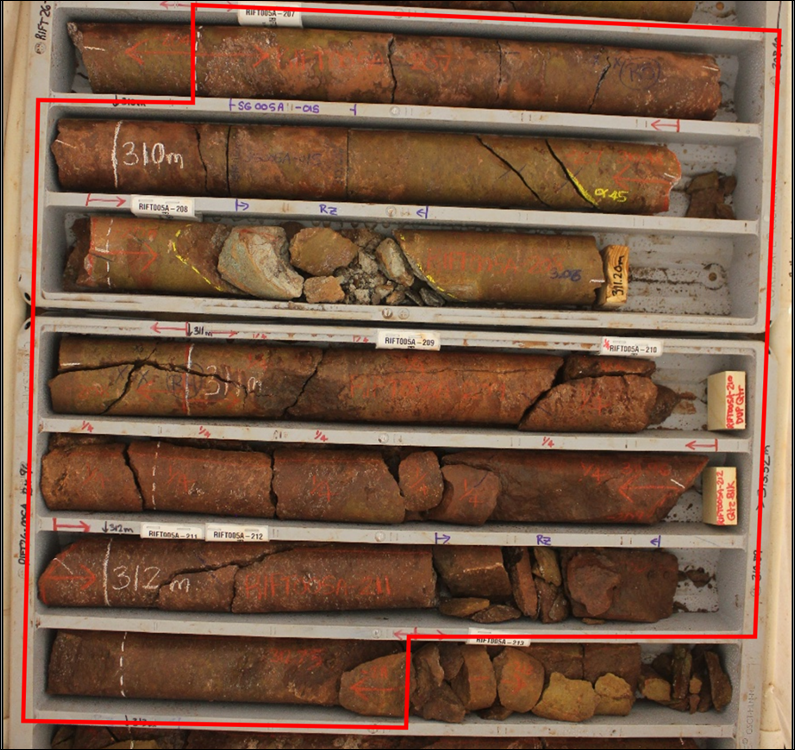