FMC Corporation FMC reported a first-quarter 2026 adjusted loss per share of 23 cents. This compares unfavorably to the year-ago quarter’s adjusted earnings per share of 18 cents. The result was narrower than the Zacks Consensus Estimate of a loss of 39 cents.
Quarterly revenues of $759 million declined 4% year over year but topped the consensus estimate of $721.8 million by 5.2%. Performance reflected favorable currency and stronger demand in select markets, partly offset by pricing pressure and partner-related volume headwinds. New active ingredient sales doubled year over year.
Profitability also declined as lower pricing and higher costs more than offset benefits from volume and currency. Tariffs and unfavorable raw material costs were the key cost headwinds, while lower R&D expenses provided some relief. The decline was also driven by tax charges related to higher valuation allowances, along with lower sales, higher restructuring costs and higher interest expense.
FMC Corporation Price, Consensus and EPS Surprise
FMC Corporation price-consensus-eps-surprise-chart | FMC Corporation Quote
FMC’s Regional Sales Performance
North America sales increased 6% year over year to $198 million. FMC attributed the gain to high-teens sales growth for branded products led by herbicides, alongside solid growth in Plant Health and strong Cyazypyr performance. Sales topped the consensus estimate of $185.1 million.
EMEA revenues rose 13% to $307 million on solid branded volume growth led by herbicides and Cyazypyr. Branded pricing was similar to the year-ago quarter, while registration losses were in line with expectations and represented an estimated 5% headwind. It outpaced the consensus estimate of $282.4 million.
Latin America revenues fell 14% to $177 million. FMC cited lower branded volumes mainly for core portfolio products and a competitive market for core products that pressured branded pricing, though higher growth-portfolio sales led by Cyazypyr and new actives provided a partial offset. It missed the consensus estimate of $178.7 million.
Asia revenues, excluding India, declined 36% year over year to $81 million. The company pointed to lower branded pricing in line with expectations and weaker insecticide volumes amid challenged grower economics tied to geopolitical uncertainty, partially offset by strong Cyazypyr growth. It beat the consensus estimate of $72.4 million.
FMC’s Financials
The company had cash and cash equivalents of $390.9 million at the end of the quarter. Long-term debt was $2,770.6 million.
FMC’s FY2026 and Q2 Outlook
FMC reaffirmed its full-year 2026 outlook, calling for revenue excluding India of $3.60 billion to $3.80 billion and adjusted EBITDA of $670 million to $730 million. Adjusted earnings per diluted share are still expected in the $1.63-$1.89 range, while free cash flow is projected between negative $65 million and positive $65 million.
The company’s full-year framework assumes interest expense of $255-$275 million and an adjusted tax rate of 16-18%, with depreciation and amortization of $160-$170 million. Capital additions and other investing activities are projected at $90-$110 million. FMC also expects the India contribution loss in 2026 to be roughly $90 million of revenue and $0 million of EBITDA.
For the second quarter, FMC expects revenue excluding India of $850 million to $900 million, with adjusted EBITDA of $130 million to $150 million and adjusted earnings per diluted share of 16-26 cents. The company expects year-over-year pressure to be driven largely by reduced orders from diamide partners and the removal of India from the reported base period.
FMC’s Price Performance
Shares of FMC have lost 61.9% in the past year compared with the industry’s 21.7% rise.
Image Source: Zacks Investment Research
FMC’s Zacks Rank & Key Picks
FMC currently carries a Zacks Rank #3 (Hold).
Some better-ranked stocks in the basic materials space are CF Industries Holdings, Inc. CF, Compass Minerals International, Inc. CMP and Aris Mining Corporation ARIS.
CF Industries is slated to report first-quarter 2026 results on May 6. The Zacks Consensus Estimate for earnings is pegged at $2.35 per share, indicating 27.03% year-over-year growth. CF sports a Zacks Rank #1 (Strong Buy) at present. You can see the complete list of today’s Zacks #1 Rank stocks here.
Compass Mineral is slated to report second-quarter fiscal 2026 results on May 6. The consensus estimate for CMP’s earnings per share is pegged at 66 cents. CMP presently carries a Zacks Rank #1.
Aris is scheduled to report first-quarter 2026 results on May 6. The Zacks Consensus Estimate for ARIS’s first-quarter earnings per share is pegged at 77 cents, indicating 381.25% year-over-year growth. ARIS carries a Zacks Rank #2 (Buy) at present.
Want the latest recommendations from Zacks Investment Research? Today, you can download 7 Best Stocks for the Next 30 Days. Click to get this free report
CF Industries Holdings, Inc. (CF) : Free Stock Analysis Report
FMC Corporation (FMC) : Free Stock Analysis Report
Compass Minerals International, Inc. (CMP) : Free Stock Analysis Report
Aris Mining Corporation (ARIS) : Free Stock Analysis Report
This article originally published on Zacks Investment Research (zacks.com).
Toronto, ON, Canada, April 29, 2026 (GLOBE NEWSWIRE) — Canada Carbon Inc. (the "Company") (TSX-V : CCB) (OTC: BRUZF) (Frankfurt: U7N1) announces that it has granted options (each, an “Option”) to purchase an aggregate of up to 1,650,000 common shares in the capital of the Company (each, a “Common Share”) to certain officers of the Company. Each Option is exercisable into one Common Share at $0.05 per share for a period of five years from the date of grant. The Options vest immediately and are granted in accordance with the Company’s equity incentive plan.
CANADA CARBON INC.“Arran Thorpe”Chief Executive Officer and Director
For further information please contact:CANADA CARBON INC.E-mail inquiries: info@canadacarbon.com
“Neither TSX Venture Exchange nor its Regulation Services Provider (as that term is defined in the policies of the TSX Venture Exchange) accepts responsibility for the adequacy or accuracy of this release.”
FORWARD LOOKING STATEMENTS: This news release contains forward-looking statements, which relate to future events or future performance and reflect management’s current expectations and assumptions. Such forward-looking statements reflect management’s current beliefs and are based on assumptions made by and information currently available to the Company. Investors are cautioned that these forward looking statements are neither promises nor guarantees, and are subject to risks and uncertainties that may cause future results to differ materially from those expected. These forward-looking statements are made as of the date hereof and, except as required under applicable securities legislation, the Company does not assume any obligation to update or revise them to reflect new events or circumstances. All of the forward-looking statements made in this press release are qualified by these cautionary statements and by those made in our filings with SEDAR in Canada (available at www.sedar.com).
FMC (FMC) came out with a quarterly loss of $0.23 per share versus the Zacks Consensus Estimate of a loss of $0.39. This compares to earnings of $0.18 per share a year ago. These figures are adjusted for non-recurring items.
This quarterly report represents an earnings surprise of +40.72%. A quarter ago, it was expected that this chemical producer would post earnings of $1.21 per share when it actually produced earnings of $1.2, delivering a surprise of -0.83%.
Over the last four quarters, the company has surpassed consensus EPS estimates three times.
FMC, which belongs to the Zacks Agriculture – Operations industry, posted revenues of $758.6 million for the quarter ended March 2026, surpassing the Zacks Consensus Estimate by 5.10%. This compares to year-ago revenues of $791.4 million. The company has topped consensus revenue estimates two times over the last four quarters.
The sustainability of the stock's immediate price movement based on the recently-released numbers and future earnings expectations will mostly depend on management's commentary on the earnings call.
FMC shares have added about 10% since the beginning of the year versus the S&P 500's gain of 4.3%.
What's Next for FMC?
While FMC has outperformed the market so far this year, the question that comes to investors' minds is: what's next for the stock?
There are no easy answers to this key question, but one reliable measure that can help investors address this is the company's earnings outlook. Not only does this include current consensus earnings expectations for the coming quarter(s), but also how these expectations have changed lately.
Empirical research shows a strong correlation between near-term stock movements and trends in earnings estimate revisions. Investors can track such revisions by themselves or rely on a tried-and-tested rating tool like the Zacks Rank, which has an impressive track record of harnessing the power of earnings estimate revisions.
Ahead of this earnings release, the estimate revisions trend for FMC was mixed. While the magnitude and direction of estimate revisions could change following the company's just-released earnings report, the current status translates into a Zacks Rank #3 (Hold) for the stock. So, the shares are expected to perform in line with the market in the near future. You can see the complete list of today's Zacks #1 Rank (Strong Buy) stocks here.
It will be interesting to see how estimates for the coming quarters and the current fiscal year change in the days ahead. The current consensus EPS estimate is $0.40 on $968.24 million in revenues for the coming quarter and $1.70 on $3.67 billion in revenues for the current fiscal year.
Investors should be mindful of the fact that the outlook for the industry can have a material impact on the performance of the stock as well. In terms of the Zacks Industry Rank, Agriculture – Operations is currently in the top 26% of the 250 plus Zacks industries. Our research shows that the top 50% of the Zacks-ranked industries outperform the bottom 50% by a factor of more than 2 to 1.
One other stock from the same industry, Archer Daniels Midland (ADM), is yet to report results for the quarter ended March 2026. The results are expected to be released on May 5.
This agribusiness giant is expected to post quarterly earnings of $0.66 per share in its upcoming report, which represents a year-over-year change of -5.7%. The consensus EPS estimate for the quarter has been revised 2% higher over the last 30 days to the current level.
Archer Daniels Midland's revenues are expected to be $21.11 billion, up 4.6% from the year-ago quarter.
Want the latest recommendations from Zacks Investment Research? Today, you can download 7 Best Stocks for the Next 30 Days. Click to get this free report
FMC Corporation (FMC) : Free Stock Analysis Report
Archer Daniels Midland Company (ADM) : Free Stock Analysis Report
This article originally published on Zacks Investment Research (zacks.com).
Company continues to advance operational priorities and explore strategic options in parallel
First Quarter 2026 Highlights
- Revenue of $759 million, down 4 percent versus Q1 2025
- Revenue excluding India1 of $762 million, down 4 percent versus Q1 2025 (which included India)
- Organic revenue2 for the period declined 9 percent
- Consolidated GAAP net loss of $281 million, a decline of $266 million versus Q1 2025
- Adjusted EBITDA of $72 million, down 40 percent versus Q1 2025
- Consolidated GAAP loss of $2.25 per diluted share, down $2.13 versus Q1 2025
- Adjusted loss per diluted share of $0.23, down 41 cents versus Q1 2025
Maintains 2026 Full-Year Outlook1
- Revenue excluding India of $3.60 billion to $3.80 billion, a decline of 5 percent at the midpoint versus 2025
- Excluding 2025 India contributions, the 2026 outlook represents a decline at the midpoint of 3 percent
- Adjusted EBITDA of $670 million to $730 million, a decline of 17 percent at the midpoint
- Adjusted earnings per diluted share of $1.63 to $1.89, a decline of 41 percent at the midpoint
- Free cash flow of negative $65 million to $65 million, an improvement of $165 million at the midpoint
PHILADELPHIA, April 29, 2026 /PRNewswire/ — FMC Corporation (NYSE:FMC) today reported first quarter 2026 revenue of $759 million, down 4 percent versus first quarter 2025. First quarter 2026 revenue, excluding India, was $762 million, down 4 percent versus first quarter 2025, which included India. On a GAAP basis, the company reported a loss of $2.25 per diluted share in the first quarter, a decrease of $2.13 versus first quarter 2025. First quarter adjusted loss per diluted share of $0.23 was down 41 cents versus first quarter 2025.
|
FMC Revenue |
Q1 2026 |
|
Total Revenue Change (GAAP) |
(4) % |
|
Total Revenue Change (ex-India) (Non-GAAP) |
(4) % |
|
Less: 2025 revenue for India held for sale business |
(5) % |
|
Like-for-Like Revenue Change (Non-GAAP) |
1 % |
First quarter sales of $762 million, excluding India, were above the midpoint of guidance and 4 percent lower than the prior year. The removal of India represented a 5 percent sales headwind. Price declined 6 percent, in line with expectations, driven by lower pricing to diamide partners, pricing actions on branded Rynaxypyr® products and a competitive market for legacy core products – particularly in Latin America. Foreign currency was a tailwind of 5 percent. Volume improved 2 percent, driven by strong growth in EMEA and North America. New active ingredient sales doubled year-over-year. Plant Health grew 6 percent.
|
FMC Regional Revenue ($M) |
Q1 2026 |
Q1 2025 |
|
North America |
$198 |
$186 |
|
Latin America |
$177 |
$207 |
|
EMEA |
$307 |
$273 |
|
Asia (excluding 2026 India)1 |
$81 |
$125 |
|
2026 India1 |
$(4) |
— |
|
Total Revenue (GAAP) |
$759 |
$791 |
|
Note: Regional results ex. India sum to $763M due to rounding |
GAAP net loss in the first quarter declined $266 million primarily due to tax charges related to an increase in valuation allowances. Lower sales, higher restructuring costs and higher interest expense also contributed to the loss during the first quarter. FMC first quarter Adjusted EBITDA was $72 million, a decrease of 40 percent from the prior-year period, driven by lower pricing and unfavorable costs. The cost increase was driven by tariffs as well as unfavorable raw material costs.
On a GAAP basis, cash from operations was negative $601 million, a decline of $56 million versus 2025, primarily driven by lower Adjusted EBITDA. Free cash flow was negative $628 million, a decline of $32 million versus Q1 2025 primarily due to lower cash from operations, partially offset by lower capital expenditures.
Strategy Update
FMC is making strong progress on its 2026 operational priorities, which are strengthening the balance sheet through targeted debt reduction of approximately $1 billion, improving the competitiveness of its core portfolio, managing the post-patent transition for Rynaxypyr® active, and driving growth of new active ingredients including Isoflex® active, fluindapyr and Dodhylex® active. In parallel, the Board-authorized evaluation of strategic alternatives announced in February 2026 is progressing, and multiple options are being evaluated. There can be no assurance that the process will result in any transaction. The company does not intend to comment further at this time, except as it may do so in the ordinary course in connection with its upcoming earnings call, or if it determines that further disclosure is appropriate or necessary.
Full Year Outlook1
The company reaffirms its full-year 2026 revenue, Adjusted EBITDA, Adjusted EPS and free cash flow guidance ranges. Full year 2026 revenue guidance1 is $3.60 billion to $3.80 billion, a decline of 5 percent at the midpoint versus prior year1. Price is expected to be lower by mid-single digits mainly due to Rynaxypyr® active, which is consistent with the company's post-patent strategy. Excluding India, volume is expected to be up modestly as increases in branded Rynaxypyr® active and new active ingredients are largely offset by reduced diamide partner orders and declines in the legacy core portfolio. India represents a 2 percent headwind1. FX is expected to be neutral. Sales of new active ingredients are expected to be between $300 million and $400 million, representing growth of over 75 percent at the midpoint versus prior year.
Adjusted EBITDA is expected to be $670 million to $730 million, a decline of 17 percent versus prior year as lower price and an FX headwind are partially offset by volume growth and favorable costs. EPS is expected to be $1.63 to $1.89, a decrease of 41 percent versus prior year, primarily due to lower Adjusted EBITDA and, to a lesser extent, increased interest expense. Free cash flow is expected to be negative $65 million to $65 million.
Second Quarter and H2 Outlook1
Second quarter revenue is expected to be in the range of $850 million to $900 million, a decline of 17 percent at the midpoint compared to second quarter 2025, primarily due to lower volume to diamide partners and the removal of India. The India inclusion in prior year represents a 5 percent headwind. Price is expected to decline mid-single digits due to competitive pressure and planned pricing actions for Rynaxypyr® in line with the post-patent strategy. FX is expected to be a low-single digit tailwind. Adjusted EBITDA is forecasted to be in the range of $130 million to $150 million, a decline of 32 percent versus the prior year as lower sales are partially offset by favorable costs. FMC expects Adjusted EPS to be in the range of $0.16 to $0.26 in the second quarter, which represents a 70 percent decrease at the midpoint versus second quarter 2025, due to lower Adjusted EBITDA as well as higher interest expense to a lesser degree.
The midpoint of first-half guidance implies a second-half sales increase of 1 percent versus prior year. Price is expected to be a mid-single digit headwind, driven by competitive market conditions for core portfolio products and pricing actions to support the branded Rynaxypyr® active strategy. Lower price and a minor FX headwind are expected to be more than offset by volume growth, driven primarily by increased sales of products with new active ingredients.
Second-half Adjusted EBITDA is expected to decrease 6 percent as lower price and a minor FX headwind are partially offset by higher volume and favorable costs. Second-half Adjusted EPS is expected to decline 15 percent compared to second half 2025, due to lower Adjusted EBITDA, higher tax, and higher interest expense.
|
Full-Year 2026 Outlook1 |
Q2 2025Outlook1 |
First-Half Outlook1 |
Second-Half Outlook1 |
|
|
Revenue Excl. India |
$3.60 billion to $3.80 billion |
$850 million to $900 million |
$1.61 billion to $1.66 billion |
$1.99 billion to $2.14 billion |
|
Growth at midpoint vs. 2025* |
(5) % |
(17) % |
(11) % |
1 % |
|
Adjusted EBITDA |
$670 million to $730 million |
$130 million to $150 million |
$202 million to $222 million |
$468 million to $508 million |
|
Growth at midpoint vs. 2025* |
(17) % |
(32) % |
(35) % |
(6) % |
|
Adjusted EPS^ |
$1.63 to $1.89 |
$0.16 to $0.26 |
$(0.07) to $0.03 |
$1.70 to $1.86 |
|
Growth at midpoint vs. 2025* |
(41) % |
(70) % |
(102) % |
(15) % |
|
^ EPS estimates assume 125.9 million diluted shares for full year, Q2 and H2; 125.3 million diluted shares for H1. |
|
*Percentages are calculated using whole numbers. Minor differences may exist due to rounding. India excluded from 2026 guidance and H2 2025 actuals. Variances are calculated versus 2025 results, which include India in the first half of the year. |
Supplemental Information
The company will post supplemental information on the web at https://investors.fmc.com, including its webcast slides for tomorrow's earnings call, definitions of non-GAAP terms and reconciliations of non-GAAP figures to the nearest available GAAP term.
Always read and follow all label directions, restrictions and precautions for use. Products listed here may not be registered for sale or use in all states, countries or jurisdictions. FMC and the FMC logo are trademarks of FMC Corporation or an affiliate.
About FMC
FMC Corporation is a global agricultural sciences company dedicated to helping growers produce food, feed, fiber and fuel for an expanding world population while adapting to a changing environment. FMC's innovative crop protection solutions – including biologicals, crop nutrition, digital and precision agriculture – enable growers and crop advisers to address their toughest challenges economically while protecting the environment. FMC is committed to discovering new herbicide, insecticide and fungicide active ingredients, product formulations and pioneering technologies that are consistently better for the planet. Visit fmc.com to learn more and follow us on LinkedIn®.
Statement under the Safe Harbor Provisions of the Private Securities Litigation Reform Act of 1995: FMC and its representatives may from time to time make written or oral statements that are "forward-looking" and provide other than historical information, including statements contained in this press release, in FMC's other filings with the SEC, and in presentations, reports or letters to FMC stockholders.
In some cases, FMC has identified these forward-looking statements by such words or phrases as "outlook", "will likely result," "is confident that," "expect," "expects," "should," "could," "may," "will continue to," "believe," "believes," "anticipates," "predicts," "forecasts," "estimates," "projects," "potential," "intends" or similar expressions identifying "forward-looking statements" within the meaning of the Private Securities Litigation Reform Act of 1995, including the negative of those words or phrases. Such forward-looking statements are based on our current views and assumptions regarding future events, future business conditions and the outlook for the company based on currently available information. The forward-looking statements involve known and unknown risks, uncertainties and other factors that may cause actual results to be materially different from any results, levels of activity, performance or achievements expressed or implied by any forward-looking statement. These statements are qualified by reference to the risk factors included in Part I, Item 1A of our Annual Report on Form 10-K for the year ended December 31, 2025 (the "2025 Form 10-K"), the section captioned "Forward-Looking Information" in Part II of the 2025 Form 10-K and to similar risk factors and cautionary statements in all other reports and forms filed with the Securities and Exchange Commission ("SEC"). We wish to caution readers not to place undue reliance on any such forward-looking statements, which speak only as of the date made. Forward-looking statements are qualified in their entirety by the above cautionary statement.
We specifically decline to undertake any obligation, and specifically disclaim any duty, to publicly update or revise any forward-looking statements that have been made to reflect events or circumstances after the date of such statements or to reflect the occurrence of anticipated or unanticipated events, except as may be required by law.
This press release contains certain "non-GAAP financial terms" which are defined on our website www.fmc.com/investors. Such terms include Adjusted EBITDA, Adjusted earnings, free cash flow and organic revenue growth. In addition, we have also provided on our website reconciliations of non-GAAP terms to the most directly comparable GAAP terms.
|
FMC CORPORATION |
|||
|
CONSOLIDATED STATEMENTS OF INCOME (LOSS) |
|||
|
(Unaudited) |
|||
|
Three Months Ended March 31, |
|||
|
(In millions, except per share amounts) |
2026 |
2025 |
|
|
Revenue |
$ 758.6 |
$ 791.4 |
|
|
Costs of sales and services |
512.0 |
474.7 |
|
|
Gross margin |
$ 246.6 |
$ 316.7 |
|
|
Selling, general and administrative expenses |
185.1 |
172.0 |
|
|
Research and development expenses |
65.5 |
68.7 |
|
|
Restructuring and other charges (income) |
77.0 |
17.8 |
|
|
Total costs and expenses |
$ 839.6 |
$ 733.2 |
|
|
Income from continuing operations before non-operating pension, postretirement, and other charges (income), interest expense, net and income taxes |
$ (81.0) |
$ 58.2 |
|
|
Non-operating pension, postretirement, and other charges (income) |
3.4 |
3.2 |
|
|
Interest expense, net |
64.8 |
50.1 |
|
|
Income (loss) from continuing operations before income taxes |
$ (149.2) |
$ 4.9 |
|
|
Provision (benefit) for income taxes |
112.1 |
13.5 |
|
|
Income (loss) from continuing operations |
$ (261.3) |
$ (8.6) |
|
|
Discontinued operations, net of income taxes |
(19.9) |
(7.0) |
|
|
Net income (loss) |
$ (281.2) |
$ (15.6) |
|
|
Less: Net income (loss) attributable to noncontrolling interests |
0.1 |
(0.1) |
|
|
Net income (loss) attributable to FMC stockholders |
$ (281.3) |
$ (15.5) |
|
|
Amounts attributable to FMC stockholders: |
|||
|
Income (loss) from continuing operations, net of tax |
$ (261.4) |
$ (8.5) |
|
|
Discontinued operations, net of tax |
(19.9) |
(7.0) |
|
|
Net income (loss) |
$ (281.3) |
$ (15.5) |
|
|
Basic earnings (loss) per common share attributable to FMC stockholders: |
|||
|
Continuing operations |
$ (2.09) |
$ (0.06) |
|
|
Discontinued operations |
(0.16) |
(0.06) |
|
|
Basic earnings per common share |
$ (2.25) |
$ (0.12) |
|
|
Average number of shares outstanding used in basic earnings per share computations |
125.3 |
125.1 |
|
|
Diluted earnings (loss) per common share attributable to FMC stockholders: |
|||
|
Continuing operations |
$ (2.09) |
$ (0.06) |
|
|
Discontinued operations |
(0.16) |
(0.06) |
|
|
Diluted earnings per common share |
$ (2.25) |
$ (0.12) |
|
|
Average number of shares outstanding used in diluted earnings per share computations |
125.3 |
125.1 |
|
|
Other Data: |
|||
|
Capital additions and other investing activities |
$ 15.8 |
$ 37.4 |
|
|
Depreciation and amortization expense |
$ 42.0 |
$ 43.7 |
|
|
FMC CORPORATION |
|||
|
RECONCILIATION OF NON-GAAP FINANCIAL MEASURES |
|||
|
RECONCILIATION OF NET INCOME (LOSS) ATTRIBUTABLE TO FMC STOCKHOLDERS (GAAP) TO ADJUSTED AFTER-TAX EARNINGS FROM CONTINUING OPERATIONS, ATTRIBUTABLE TO FMC STOCKHOLDERS (NON-GAAP) (1) |
|||
|
(Unaudited) |
|||
|
Three Months Ended March 31, |
|||
|
(In millions, except per share amounts) |
2026 |
2025 |
|
|
Net income (loss) attributable to FMC stockholders (GAAP) |
$ (281.3) |
$ (15.5) |
|
|
Corporate special charges (income): |
|||
|
Restructuring and other charges (income) (a) |
94.7 |
17.8 |
|
|
Non-operating pension, postretirement, and other charges (income) (b) |
3.4 |
3.2 |
|
|
India held for sale business (c) |
16.4 |
— |
|
|
Income tax expense (benefit) on Corporate special charges (income) (d) |
(18.3) |
(4.4) |
|
|
Discontinued operations attributable to FMC stockholders, net of income taxes (e) |
19.9 |
7.0 |
|
|
Tax adjustment (f) |
136.3 |
14.3 |
|
|
Adjusted after-tax earnings (loss) from continuing operations attributable to FMC stockholders (non-GAAP) (1) |
$ (28.9) |
$ 22.4 |
|
|
Diluted earnings (loss) per common share (GAAP) |
$ (2.25) |
$ (0.12) |
|
|
Corporate special charges (income) per diluted share, before tax: |
|||
|
Restructuring and other charges (income) |
0.76 |
0.14 |
|
|
Non-operating pension, postretirement, and other charges (income) |
0.03 |
0.03 |
|
|
India held for sale business |
0.13 |
— |
|
|
Income tax expense (benefit) on Corporate special charges (income), per diluted share |
(0.15) |
(0.04) |
|
|
Discontinued operations attributable to FMC stockholders, net of income taxes per diluted share |
0.16 |
0.06 |
|
|
Tax adjustments per diluted share |
1.09 |
0.11 |
|
|
Diluted adjusted after-tax earnings (loss) from continuing operations per share, attributable to FMC stockholders (non-GAAP) |
$ (0.23) |
$ 0.18 |
|
|
Average number of shares outstanding used in diluted adjusted after-tax earnings (loss) from continuing operations per share computations |
125.3 |
125.5 |
|
|
(1) |
Referred to as Adjusted earnings. The Company believes that Adjusted earnings, a non-GAAP financial measure, and its presentation on a per share basis provides useful information about the Company's operating results to management, investors, and securities analysts. Adjusted earnings excludes the effects of corporate special charges, the India held for sale business, tax-related adjustments and the results of our discontinued operations. The Company also believes that excluding the effects of these items from operating results allows management and investors to compare more easily the financial performance of its underlying business from period to period. |
||||
|
(a) |
Three Months Ended March 31, 2026: |
||||
|
Restructuring and other charges (income) includes restructuring charges of $94.5 million primarily comprised of $90.1 million in charges related to Project Foundation, which is management's comprehensive plan to further optimize FMC's cost structure and organizational operations. The charges for Project Foundation include non-cash asset write-off and accelerated depreciation costs of $64.7 million primarily associated with the planned exit of certain production activities; severance and employee separation costs of $6.2 million; and, other miscellaneous charges of $19.2 million, which include contract exit costs and professional service provider costs. During the three months ended March 31, 2026, we also recorded Project Focus-related costs of $4.3 million, primarily related to miscellaneous charges associated with previously implemented activities. Other charges (income) included $3.9 million of charges associated with our environmental sites and $3.7 million of other miscellaneous income. |
|||||
|
Three Months Ended March 31, 2025: |
|||||
|
Restructuring and other charges (income) includes restructuring charges of $13.6 million primarily related Project Focus, which included $6.6 million of professional service provider costs and other miscellaneous charges, $4.2 million of severance and employee separation costs, and accelerated depreciation of $3.1 million on assets identified for disposal in connection with the restructuring initiative. Other charges (income) of $4.2 million is comprised of $3.5 million of charges associated with our environmental sites and $0.7 million of other miscellaneous charges. |
|||||
|
(b) |
Our non-operating pension, postretirement and other charges (income) includes those costs (benefits) related to interest, expected return on plan assets, amortized actuarial gains and losses and the impacts of any plan curtailments or settlements. These are excluded from our Adjusted earnings and are primarily related to changes in pension plan assets and liabilities which are tied to financial market performance and we consider these costs to be outside our operational performance. We continue to include the service cost and amortization of prior service cost in our Adjusted earnings results noted above. These elements reflect the current year operating costs to our businesses for the employment benefits provided to active employees. |
||||
|
(c) |
In July 2025, the Board of Directors approved a plan to divest the Company's commercial business in India in response to ongoing challenges in the country. The sale process is underway and is expected to conclude during 2026; and, therefore, the assets related to this business have been classified as held for sale since the third quarter of 2025. The business does not qualify for recognition as discontinued operations and will continue to be presented in the Company's reported GAAP results until a transaction is completed. Beginning with the third quarter of 2025, we have excluded the impact of various activities associated with the anticipated sale from our operating results for non-GAAP purposes. Refer to the table below for the adjustments related to the India held for sale business for the three months ended March 31, 2026. |
||||
|
Three Months Ended March 31, |
Affected Line Item in the Consolidated Statements of Income (Loss) |
|||
|
(In millions) |
2026 |
2025 |
||
|
Operating results |
$ 34.1 |
$ — |
Revenue, Cost of sales and services, and Selling, general and administrative expenses |
|
|
Asset impairment |
(20.4) |
— |
Restructuring and other charges (income) |
|
|
Third party provider costs |
2.7 |
— |
Restructuring and other charges (income) |
|
|
India held for sale business |
$ 16.4 |
$ — |
||
|
(d) |
The income tax expense (benefit) on Corporate special charges (income) is determined using the applicable rates in the taxing jurisdictions in which the corporate special charge or income occurred and includes both current and deferred income tax expense (benefit) based on the nature of the non-GAAP performance measure. |
|
(e) |
Discontinued operations includes provisions, net of recoveries, for environmental liabilities and legal reserves and expenses related to previously discontinued operations and retained liabilities. |
|
(f) |
We exclude the GAAP tax provision, including discrete items, from the non-GAAP measure of income, and include a non-GAAP tax provision based upon the projected annual non-GAAP effective tax rate. The GAAP tax provision includes certain discrete tax items including, but are not limited to: income tax expenses or benefits that are not related to continuing operating results in the current year; tax adjustments associated with fluctuations in foreign currency remeasurement of certain foreign operations; certain changes in estimates of tax matters related to prior fiscal years; certain changes in the realizability of deferred tax assets and related interim accounting impacts; and changes in tax law. In 2024 and 2023, we recorded significant deferred tax assets due to various tax incentives granted to the Company's Swiss subsidiaries (the "Swiss Tax Incentives"). The initial recognition of these Swiss Tax Incentives did not impact our adjusted non-GAAP effective tax rate but will be considered annually as we realize the benefits. Management believes excluding these discrete tax items, as well as the impacts of the Swiss Tax Incentives annually as the related benefits are realized, assists investors and securities analysts in understanding the tax provision and the effective tax rate related to continuing operating results thereby providing investors with useful supplemental information about FMC's operational performance. |
|
Three Months Ended March 31, |
|||
|
(In millions) |
2026 |
2025 |
|
|
Tax adjustments: |
|||
|
Revisions to valuation allowances of historical deferred tax assets (i) |
$ 124.7 |
$ (1.2) |
|
|
Net impact of Switzerland tax incentives |
(5.5) |
2.8 |
|
|
Foreign currency remeasurement and other discrete items |
17.1 |
12.7 |
|
|
Total non-GAAP tax adjustments |
$ 136.3 |
$ 14.3 |
|
|
(i) |
As a result of changes in global earnings mix and ongoing tax planning implemented in March 2026, we reevaluated the realizability of our historical deferred tax assets and recorded an increase to our valuation allowance in Switzerland of approximately $123 million during the three months ended March 31, 2026. |
||||
|
RECONCILIATION OF NET INCOME (LOSS) (GAAP) TO ADJUSTED EARNINGS FROM CONTINUING OPERATIONS, BEFORE INTEREST, INCOME TAXES, DEPRECIATION AND AMORTIZATION, AND NONCONTROLLING INTERESTS (NON-GAAP) (3) |
|||
|
(Unaudited) |
|||
|
Three Months Ended March 31, |
|||
|
(In millions) |
2026 |
2025 |
|
|
Net income (loss) (GAAP) |
$ (281.2) |
$ (15.6) |
|
|
Restructuring and other charges (income) (1) |
94.7 |
17.8 |
|
|
Non-operating pension, postretirement, and other charges (income) |
3.4 |
3.2 |
|
|
India held for sale business (2) |
16.4 |
— |
|
|
Discontinued operations, net of income taxes |
19.9 |
7.0 |
|
|
Interest expense, net |
64.8 |
50.1 |
|
|
Depreciation and amortization |
42.0 |
43.7 |
|
|
Provision (benefit) for income taxes |
112.1 |
13.5 |
|
|
Adjusted earnings from continuing operations, before interest, income taxes, depreciation and amortization, and noncontrolling interests (non-GAAP) (3) |
$ 72.1 |
$ 119.7 |
|
|
(1) |
In the reconciliation above, favorable adjustments recorded in connection with the India held for sale business of $17.7 million for the three ended March 31, 2026 are presented in the India held for sale business line, as described in the reconciliation in note (c) above. On the consolidated statements of income (loss), these adjustments are recorded to "Restructuring and other charges (income)." |
||||
|
(2) |
Beginning with the third quarter of 2025, we excluded the operating results of the India commercial business during the held for sale period for non-GAAP purposes. For further details on the charges and write-downs recorded in connection with the India held for sale business, refer to note (c) in the reconciliation above. |
||||
|
(3) |
Referred to as Adjusted EBITDA. Defined as operating profit excluding restructuring and other charges (income), depreciation and amortization expense, and the India held for sale business. |
||||
|
RECONCILIATION OF CASH PROVIDED (REQUIRED) BY OPERATING ACTIVITIES OF CONTINUING OPERATIONS (GAAP) TO FREE CASH FLOW (NON-GAAP) (2) |
|||
|
(Unaudited) |
|||
|
Three Months Ended March 31, |
|||
|
(In millions) |
2026 |
2025 |
|
|
Cash provided (required) by operating activities of continuing operations (GAAP) (1) |
$ (600.9) |
$ (545.0) |
|
|
Capital expenditures |
(16.6) |
(31.6) |
|
|
Other investing activities |
0.8 |
(5.8) |
|
|
Capital additions and other investing activities |
$ (15.8) |
$ (37.4) |
|
|
Cash provided (required) by operating activities of discontinued operations |
(15.7) |
(13.3) |
|
|
Divestiture transaction costs (2) |
4.3 |
— |
|
|
Free cash flow (non-GAAP) (3) |
$ (628.1) |
$ (595.7) |
|
|
(1) |
The three months ended March 31, 2026 includes cash payments of $66.4 million primarily for restructuring activities related to the Project Focus transformation program as well as Project Foundation. The three months ended March 31, 2025 includes cash payments of $55.7 million for Project Focus. |
||||
|
(2) |
Represents third party provider costs associated with the expected sale of our India commercial business. Proceeds from the sale of our India commercial business anticipated in 2026 will be excluded from free cash flow when received. Therefore, we have also excluded the related transaction costs from free cash flow. |
||||
|
(3) |
Free cash flow is defined as cash provided (required) by operating activities of continuing operations (GAAP) adjusted for spending for capital additions and other investing activities as well as cash provided (required) by discontinued operations and divestiture transaction costs associated with the sale of our GSS business. We believe that this non-GAAP financial measure provides a useful basis for investors and securities analysts to evaluate the cash generated by routine business operations, including to assess our ability to repay debt, fund acquisitions and return capital to shareholders through share repurchases and dividends. Our use of free cash flow has limitations as an analytical tool and should not be considered in isolation or as a substitute for an analysis of our results under U.S. GAAP. |
||||
|
RECONCILIATION OF REVENUE (GAAP) |
|||
|
TO REVENUE EXCLUDING INDIA (NON-GAAP) (2) |
|||
|
(Unaudited) |
|||
|
Three Months Ended March 31, |
|||
|
(In millions) |
2026 |
2025 |
|
|
Revenue (GAAP) |
$ 758.6 |
$ 791.4 |
|
|
Less: Revenue from India commercial business (1) |
(3.8) |
— |
|
|
Revenue excluding India (non-GAAP) (2) |
$ 762.4 |
$ 791.4 |
|
|
(1) |
Beginning with the third quarter of 2025, revenue from the India commercial business is excluded from our adjusted results during the held for sale period for non-GAAP purposes. Refer to note (c) above for further details. |
||||
|
(2) |
Although the India held for sale business does not qualify for recognition as discontinued operations, we believe Revenue excluding India (non-GAAP) provides management and investors with useful supplemental information regarding our ongoing revenue performance. |
||||
|
RECONCILIATION OF REVENUE CHANGE (GAAP) TO ORGANIC REVENUE CHANGE (NON-GAAP) (1) |
|
|
(Unaudited) |
|
|
Three Months Ended March 31, 2026 vs. 2025 |
|
|
Total revenue (GAAP) change |
(4) % |
|
Less: Revenue for India held for sale business for the three months ended March 31, 2026 |
— % |
|
Revenue excluding India (non-GAAP) change (1) |
(4) % |
|
Less: Foreign currency impact |
5 % |
|
Organic revenue (non-GAAP) change (2) |
(9) % |
|
(1) |
Beginning with the third quarter of 2025, revenue from the India commercial business is excluded from our adjusted results during the held for sale period for non-GAAP purposes. Refer to note (c) above for further details. |
||||
|
(2) |
We believe organic revenue growth (non-GAAP) provides management and investors with useful supplemental information regarding our ongoing revenue performance and trends by presenting revenue growth excluding the impact of fluctuations in foreign exchange rates and the India held for sale business. |
||||
|
RECONCILIATION OF NET INCOME (LOSS) ATTRIBUTABLE TO |
|||
|
FMC STOCKHOLDERS (GAAP) TO RETURN ON INVESTED CAPITAL ("ROIC") |
|||
|
NUMERATOR (NON-GAAP) AND ADJUSTED ROIC (USING NON-GAAP NUMERATOR) (1) |
|||
|
(Unaudited) |
|||
|
Twelve Months Ended |
|||
|
(In millions, except percentages) |
March 31, 2026 |
||
|
Net income (loss) attributable to FMC stockholders (GAAP) |
$ (2,504.7) |
||
|
Interest expense, net, net of income taxes |
218.7 |
||
|
Corporate special charges (income) |
1,871.5 |
||
|
India held for sale business |
538.1 |
||
|
Income tax expense (benefit) on Corporate special charges (income) |
(172.0) |
||
|
Discontinued operations attributable to FMC stockholders, net of income taxes |
49.5 |
||
|
Tax adjustments |
538.3 |
||
|
ROIC numerator (non-GAAP) |
$ 539.4 |
||
|
March 31, 2026 |
March 31, 2025 |
||
|
Total debt |
$ 4,533.6 |
$ 4,003.5 |
|
|
Total FMC stockholders' equity |
1,822.1 |
4,382.0 |
|
|
Total debt and FMC stockholders' equity (GAAP) |
$ 6,355.7 |
$ 8,385.5 |
|
|
ROIC denominator (2 yr average total debt and FMC stockholders' equity) |
$ 7,370.6 |
||
|
ROIC (using Net income (loss) attributable to FMC stockholders (GAAP) as numerator) |
(33.98) % |
||
|
Adjusted ROIC (using non-GAAP numerator) (1) |
7.32 % |
||
|
(1) |
We believe Adjusted ROIC (non-GAAP) provides management and investors with useful supplemental information regarding our utilization of capital provided by both equity and debt as well as our working capital and free cash flow management. Additionally, vesting of certain restricted stock awards granted to officers is connected to Adjusted ROIC as a performance metric. |
||||
|
FMC CORPORATION |
|||
|
CONDENSED CONSOLIDATED BALANCE SHEETS |
|||
|
(Unaudited) |
|||
|
(In millions) |
March 31, 2026 |
December 31, 2025 |
|
|
Cash and cash equivalents |
$ 390.9 |
$ 584.5 |
|
|
Trade receivables, net of allowance of $42.5 in 2026 and $43.3 in 2025 |
2,244.8 |
2,062.0 |
|
|
Inventories |
1,242.6 |
1,219.6 |
|
|
Prepaid and other current assets |
533.7 |
481.2 |
|
|
Assets held for sale (1) |
492.9 |
611.7 |
|
|
Total current assets |
$ 4,904.9 |
$ 4,959.0 |
|
|
Property, plant and equipment, net |
627.5 |
707.4 |
|
|
Other intangibles, net |
2,333.5 |
2,361.8 |
|
|
Deferred income taxes |
1,096.0 |
1,215.6 |
|
|
Other long-term assets |
457.6 |
443.4 |
|
|
Total assets |
$ 9,419.5 |
$ 9,687.2 |
|
|
Short-term debt and current portion of long-term debt |
$ 1,763.0 |
$ 1,305.1 |
|
|
Accounts payable, trade and other |
634.1 |
771.0 |
|
|
Advanced payments from customers |
196.3 |
453.1 |
|
|
Accrued and other liabilities |
625.5 |
574.0 |
|
|
Accrued customer rebates |
480.0 |
417.4 |
|
|
Guarantees of vendor financing |
37.0 |
45.7 |
|
|
Accrued pensions and other postretirement benefits, current |
3.3 |
3.3 |
|
|
Income taxes |
26.6 |
24.0 |
|
|
Liabilities held for sale (1) |
47.5 |
161.7 |
|
|
Total current liabilities |
$ 3,813.3 |
$ 3,755.3 |
|
|
Long-term debt, less current portion |
$ 2,770.6 |
$ 2,769.8 |
|
|
Long-term liabilities |
985.7 |
1,063.2 |
|
|
Equity |
1,849.9 |
2,098.9 |
|
|
Total liabilities and equity |
$ 9,419.5 |
$ 9,687.2 |
|
|
(1) |
The carrying value of the India held for sale business decreased from $450 million as of December 31, 2025 to $425.0 million as of March 31, 2026 primarily due to receivable collections during the period. The carrying value of the held for sale business is comprised of $445.4 million of net assets held for sale as presented on the consolidated balance sheet and a gain of 20.4 million related to foreign currency translation in connection with the assets identified for disposal. The foreign currency translation gains are recorded in "Accumulated other comprehensive income (loss)" on the consolidated balance sheet and will be reclassified to the consolidated statement of income (loss) upon close of the sale. |
||||
|
FMC CORPORATION |
|||
|
CONDENSED CONSOLIDATED STATEMENTS OF CASH FLOWS |
|||
|
(Unaudited) |
|||
|
Three Months Ended March 31, |
|||
|
(In millions) |
2026 |
2025 |
|
|
Cash provided (required) by operating activities of continuing operations |
$ (600.9) |
$ (545.0) |
|
|
Cash provided (required) by operating activities of discontinued operations |
(15.7) |
(13.3) |
|
|
Cash provided (required) by investing activities of continuing operations |
(16.2) |
(38.0) |
|
|
Cash provided (required) by financing activities of continuing operations |
442.3 |
552.1 |
|
|
Effect of exchange rate changes on cash |
(3.1) |
2.2 |
|
|
Increase (decrease) in cash and cash equivalents |
$ (193.6) |
$ (42.0) |
|
|
Cash and cash equivalents, beginning of period |
$ 584.5 |
$ 357.3 |
|
|
Cash and cash equivalents, end of period |
$ 390.9 |
$ 315.3 |
|
View original content to download multimedia:https://www.prnewswire.com/news-releases/fmc-corporation-reports-first-quarter-2026-results-above-guidance-with-adjusted-ebitda-above-high-end-of-range-reaffirms-full-year-outlook-302757928.html
- Company Files Preliminary Short Form Base Shelf Prospectus and AIF and continues to advance NASDAQ Dual Listing via MJDS Process
- Final Base Shelf Prospectus, if receipted, will be valid for 25 months and is intended to provide the Company with capital markets flexibility
TORONTO, April 24, 2026 /CNW/ – Rock Tech Lithium Inc. (TSXV: RCK) (OTCQX: RCKTF) (FWB: RJIB) (WKN: A1XF0V) (the "Company" or "Rock Tech") is pleased to announce that it has filed a preliminary short form base shelf prospectus ("Base Shelf Prospectus") and Annual Information Form ("AIF") with the securities regulators in each of the provinces and territories of Canada. These filings represent a significant and deliberate step in the Company's strategic roadmap — which the Company expects may be used, subject to receipt and regulatory approvals, in connection with a potential NASDAQ dual‑listing through the Multi-Jurisdictional Disclosure System ("MJDS"), the established bilateral framework between Canadian and U.S. capital markets regulators.
NASDAQ Dual-Listing Readiness via MJDSUnder the MJDS framework, eligible Canadian issuers may file a U.S. registration statement with the U.S. Securities and Exchange Commission ("SEC") on Form F‑10, which is primarily based on Canadian disclosure documents, including the Company's base shelf prospectus. This bilateral system substantially reduces regulatory duplication, cost, and processing time, which may streamline the disclosure process for a NASDAQ cross‑listing, subject to SEC effectiveness and NASDAQ approval. Rock Tech's existing TSX Venture Exchange (the "TSXV") listing, combined with its 12-month-plus Canadian reporting history and qualifying public float, positions the Company as MJDS-eligible. The NASDAQ filing remains subject to NASDAQ approval.
25-Month Capital Flexibility WindowThe final Base Shelf Prospectus, if receipted, will be valid for a period of 25 months from the date of receipt. During this window, Rock Tech retains the option to access capital markets from time to time and in tranches aligned with project milestones — without requiring a full regulatory review for each potential future offering. This significantly reduces execution risk and cost in time-sensitive financing situations.
Institutional Credibility and Market ProfileA filed Base Shelf Prospectus is commonly used by more established TSXV‑listed issuers and is intended to support corporate governance practices, capital markets readiness, and financing flexibility. It is standard practice among established TSXV-listed resource and technology companies operating at Rock Tech's scale. The filing reinforces Rock Tech's positioning as a strategic, investment-ready critical minerals platform.
"This filing is about building institutional-grade capital markets infrastructure for tomorrow. Filing our Shelf Prospectus is an important step in preparing for a potential NASDAQ dual‑listing via the MJDS process. A NASDAQ listing, if achieved, is a transformative re-rating event for Rock Tech. It opens our story to the full depth of the North American institutional investor base at exactly the moment our project pipeline — Guben, Red Rock, Georgia Lake — is entering its most consequential phase," says Rock Tech's CEO, Mirco Wojnarowicz.
Rock Tech is advancing toward a NASDAQ dual-listing as a cornerstone of its institutional investor strategy. With the Guben Converter holding EU CRMA Strategic Project status and a full permit and engineering package, the Red Rock Converter project in Ontario, Canada carrying a CAD $2.3 billion NPV and a committed capital structure under the GP/LP framework, and the Georgia Lake Mine in Ontario positioned to create North America's first fully integrated mine-to-battery-grade lithium supply chain, Rock Tech believes the NASDAQ listing, if completed, could serve as a significant re-rating catalyst — expanding visibility, research coverage, and shareholder liquidity across the world's deepest capital market.
On behalf of the ManagementMirco WojnarowiczCEO, Rock Tech Lithium Inc.
ABOUT ROCK TECH LITHIUM
Rock Tech is enabling the battery age by making the battery industries in Europe and North America more independent and competitive. The Company's goal is to ensure the supply of high-quality, locally produced lithium — supporting a resilient, sustainable, and transparent value chain from mine to battery-grade material.
Rock Tech relies on responsible sourcing, state-of-the-art and proven technologies, and a clear focus on circular economy principles. The Company's lithium converter projects in Guben, Germany (24,000 tonnes LHM per year) and Ontario, Canada (up to 32,000 tonnes LCE per year) form the foundation for a stable and regional supply to the battery and automotive industries. The Guben converter has been recognized as a Strategic Project under the EU Critical Raw Materials Act.
The raw materials for Rock Tech's converter projects are sourced exclusively from verifiably ESG-compliant suppliers. In Canada, Rock Tech relies, among other sources, on its wholly-owned Georgia Lake Project, which ensures a stable and sustainable supply for the North American market and is being developed in close partnership with local Indigenous communities. By integrating recycled materials, the company aims to close the local battery loop.
With its facilities, Rock Tech makes a central contribution to battery-grade material sovereignty and the achievement of climate targets. The company works in partnership with industry, policymakers, and community groups, and is committed to open communication and the highest environmental standards.
CAUTIONARY NOTE CONCERNING FORWARD-LOOKING INFORMATIONCertain statements contained in this news release constitute "forward-looking information" under applicable securities laws and are referred to herein as "forward-looking statements". All statements, other than statements of historical fact, which address events, results, outcomes or developments that the Company expects to occur are forward-looking statements. When used in this news release, words such as "expects", "anticipates", "plans", "predicts", "believes", "estimates", "intends", "targets", "projects", "forecasts", "may", "will", "should", "would", "could" or negative versions thereof and other similar expressions are intended to identify forward-looking statements. In particular, this news release contains forward-looking information relating to, among other things: the Company's intentions to pursue a potential dual‑listing of its securities on the Nasdaq Stock Market; the Company's eligibility to utilize the MJDS; the anticipated use of a U.S. registration statement on Form F‑10 in connection with any such potential listing; the receipt of a final receipt for the Base Shelf Prospectus; the validity period and potential use of the Base Shelf Prospectus; the Company's ability to access the capital markets from time to time; the expected benefits of a potential Nasdaq listing, including enhanced visibility, liquidity and institutional investor participation; the advancement, development and timing of the Company's projects; and the Company's overall business strategy, plans, objectives and outlook.
Forward‑looking information is based on management's reasonable assumptions, estimates, expectations and opinions as of the date of this news release. Such assumptions include, without limitation: the Company's ability to obtain a final receipt for the Base Shelf Prospectus within a timeframe anticipated by management, or at all; the Base Shelf Prospectus becoming effective and remaining in effect for its full statutory period; the accuracy and completeness of the Company's disclosure provided to securities regulators; the Company's continued satisfaction of eligibility requirements under the MJDS; the ability of the Company to file and have declared effective a registration statement on Form F‑10; the receipt of all required regulatory and stock exchange approvals, including approvals from the SEC and Nasdaq; the absence of material adverse regulatory, legal or market developments; continued access to the capital markets on reasonable terms; and the Company's ability to advance its projects and business strategy in accordance with current plans and expectations.
Forward-looking information is subject to known and unknown risks, uncertainties, and other factors that may cause actual results to differ materially from those expressed or implied by such statements, including but not limited to the risk that the Company may not obtain a final receipt for the Base Shelf Prospectus on the terms or timeline currently expected, or at all the Company may not obtain the required regulatory or exchange approvals to complete a Nasdaq listing; delays in regulatory review processes; changes in applicable securities laws or stock exchange requirements; market conditions and volatility; liquidity and financing risks; commodity price fluctuations; operational and development risks associated with the Company's projects; and general economic and business conditions. Additional risk factors are discussed in the Company's public disclosure documents available under its profile on SEDAR+. Except as may be required by law, Rock Tech undertakes no obligation and expressly disclaims any responsibility, obligation or undertaking to update or to revise any forward-looking information, whether as a result of new information, future events or otherwise, to reflect any change in Rock Tech's expectations or any change in events, conditions or circumstances on which any such information is based. The forward-looking information contained herein is presented for the purposes of assisting readers in understanding Rock Tech's plans, objectives and goals and is not appropriate for any other purposes.
NEITHER THE TSX VENTURE EXCHANGE NOR ITS REGULATION SERVICES PROVIDER (AS THAT TERM IS DEFINED IN POLICIES OF THE TSX VENTURE EXCHANGE) ACCEPTS RESPONSIBILITY FOR THE ADEQUACY OR ACCURACY OF THIS RELEASE.
View original content to download multimedia:https://www.prnewswire.com/news-releases/rock-tech-lithium-announces-plans-to-dual-list-on-nasdaq-and-filing-of-short-form-base-shelf-prospectus-302753430.html
View original content to download multimedia: http://www.newswire.ca/en/releases/archive/April2026/24/c3057.html
As the Australian market navigates a complex global landscape, with fluctuating indices and geopolitical tensions impacting investor sentiment, small-cap stocks are drawing attention for their potential resilience and growth opportunities. In this environment, identifying promising companies like EQT Holdings alongside emerging small caps requires a keen eye for those that demonstrate strong fundamentals and adaptability to shifting economic conditions.
Top 10 Undiscovered Gems With Strong Fundamentals In Australia
| Name | Debt To Equity | Revenue Growth | Earnings Growth | Health Rating |
|---|---|---|---|---|
| Peet | 43.28% | 13.82% | 20.62% | ★★★★★★ |
| Fiducian Group | NA | 9.85% | 10.78% | ★★★★★★ |
| Joyce | NA | 7.70% | 7.34% | ★★★★★★ |
| Euroz Hartleys Group | NA | -2.67% | -37.02% | ★★★★★★ |
| Focus Minerals | NA | 75.66% | 75.61% | ★★★★★★ |
| WAM Strategic Value | NA | -9.74% | 30.51% | ★★★★★★ |
| SDI | 14.65% | 8.06% | 12.66% | ★★★★★☆ |
| Zimplats Holdings | 3.35% | -10.45% | -46.73% | ★★★★★☆ |
| AMCIL | NA | 2.99% | 1.18% | ★★★★★☆ |
| Australian United Investment | 6.80% | 2.27% | 1.31% | ★★★★☆☆ |
Let’s explore several standout options from the results in the screener.
Simply Wall St Value Rating: ★★★★★☆
Overview: EQT Holdings Limited, with a market cap of A$550.22 million, operates in Australia offering philanthropic, trustee, and investment services through its subsidiaries.
Operations: EQT Holdings generates revenue primarily from its Trustee & Wealth Services segment, contributing A$107.17 million, followed by Corporate & Superannuation Trustee Services at A$85.76 million.
EQT Holdings, a notable player in Australia’s financial services sector, is gaining traction with its robust earnings growth of 58.7% over the past year, outpacing the industry average of 9.5%. The company’s debt to equity ratio increased from 14.5% to 37.9% over five years, yet it maintains more cash than total debt and has interest payments well covered by EBIT at a strong 10.4x coverage. With a price-to-earnings ratio of 13.2x below the market average, EQT appears undervalued while leveraging technology upgrades for efficiency gains and margin improvements amidst rising regulatory demands and trustee service needs in Australia.
ASX:EQT Earnings and Revenue Growth as at Apr 2026European Lithium
Simply Wall St Value Rating: ★★★★☆☆
Overview: European Lithium Limited focuses on the exploration and development of lithium deposits in Australia and Austria, with a market capitalization of approximately A$480.79 million.
Operations: European Lithium Limited generates revenue primarily from its mineral exploration activities, reporting A$0.95 million in this segment.
European Lithium, a small player in the mining sector, has recently turned profitable with a net income of A$1.15 million for the half-year ending December 2025, contrasting sharply with a net loss of A$19.38 million in the previous year. The company’s P/E ratio stands at an impressive 0.4x, significantly below the Australian market average of 17.7x, suggesting it might be undervalued compared to peers. Despite having more cash than debt and reducing its debt-to-equity ratio from 2.7 to 0.2 over five years, its earnings are forecasted to decline by an average of 159% annually over the next three years.
ASX:EUR Debt to Equity as at Apr 2026Helia Group
Simply Wall St Value Rating: ★★★★★★
Overview: Helia Group Limited operates in the loan mortgage insurance sector primarily in Australia and has a market capitalization of approximately A$1.45 billion.
Operations: Helia Group generates revenue primarily through its loan mortgage insurance business, with reported revenues of A$478.70 million. The company has a market capitalization of approximately A$1.45 billion.
Helia Group, a financial entity in Australia, is navigating a challenging landscape with significant headwinds. The loss of key lender clients and government policy changes are expected to shrink its core market, impacting future revenue growth. Analysts predict an 18.8% annual revenue decline over three years and profit margins dropping from 51.2% to 42.5%. Despite these challenges, Helia’s strong capital management and dominant market position offer some resilience against volatility. Recently, the company declared a special dividend of A$0.67 per share and reported net income of A$244.9 million for 2025, up from A$231.5 million the previous year.
ASX:HLI Debt to Equity as at Apr 2026Summing It All Up
- Investigate our full lineup of 65 ASX Undiscovered Gems With Strong Fundamentals right here.
- Have you diversified into these companies? Leverage the power of Simply Wall St’s portfolio to keep a close eye on market movements affecting your investments.
- Elevate your portfolio with Simply Wall St, the ultimate app for investors seeking global market coverage.
Ready To Venture Into Other Investment Styles?
- Explore high-performing small cap companies that haven’t yet garnered significant analyst attention.
- Fuel your portfolio with companies showing strong growth potential, backed by optimistic outlooks both from analysts and management.
- Find companies with promising cash flow potential yet trading below their fair value.
This article by Simply Wall St is general in nature. We provide commentary based on historical data
and analyst forecasts only using an unbiased methodology and our articles are not intended to be financial advice. It does not constitute a recommendation to buy or sell any stock, and does not take account of your objectives, or your
financial situation. We aim to bring you long-term focused analysis driven by fundamental data.
Note that our analysis may not factor in the latest price-sensitive company announcements or qualitative material.
Simply Wall St has no position in any stocks mentioned.
Companies discussed in this article include ASX:EQT ASX:EUR and ASX:HLI.
Have feedback on this article? Concerned about the content? Get in touch with us directly. Alternatively, email editorial-team@simplywallst.com
Lindian locks in fuel pricing as Kangankunde tracks toward first production Proactive uses images sourced from Shutterstock
Lindian Resources Ltd (ASX:LIN, OTC:LINIF) has secured fixed-price diesel supply for its Kangankunde Rare Earths Project in Malawi, removing exposure to fuel price volatility as the company advances toward first production.
The company has locked in 500,000 litres of diesel at US$2.83 per litre under a 12-month agreement, covering construction, mining start-up and commissioning activities.
The agreement, struck with Malawian supplier Petroda, is structured in two 250,000-litre tranches, with initial deliveries already made to site to ensure continuous supply without requiring significant on-site storage.
“This agreement removes a key input cost risk during construction and mining start up and reinforces Kangankunde’s structural cost advantage. Locking in fuel pricing ahead of volatility provides certainty as we move toward first production and reflects the team’s disciplined approach to cost control and execution,” Lindian executive director Zac Komur said.
Cost certainty underpins pathway to production
The fixed-price arrangement provides cost certainty through a critical phase of development, insulating the project from fluctuations in fuel markets and local pricing adjustments. This is complemented by existing on-site fuel inventory, ensuring uninterrupted supply through construction and commissioning.
Kangankunde’s relatively low power demand of around 3MW is expected to be met through Malawi’s existing grid infrastructure, supported by hydropower and regional interconnection, removing the need for on-site generation and further reducing fuel reliance.
Lindian recently completed a A$100 million institutional placement, providing a debt-free funding pathway into stage 1 mining and processing and supporting a broader development pipeline, including downstream processing initiatives.
Construction activities at Kangankunde remain on schedule, with fuel supply and power infrastructure now in place to support the remaining build and commissioning phases, with no anticipated impact to first production timing.
VANCOUVER, BC / ACCESS Newswire / April 17, 2026 / Apex Critical Metals Corp. ("Apex" or the "Company") (CSE:APXC)(OTCQX:APXCF)(FWB:KL9) a mineral exploration company focused on advancing its strategic Rift Rare Earth Project within the Elk Creek Carbonatite Complex in Nebraska, USA, is pleased to announce that it has been included in the recently launched the Sprott Rare Earths Ex-China ETF. This new ETF is focused on companies engaged in the exploration, development, mining, separation, refining, and production of rare earth elements outside of China.
Apex has been included alongside a range of established rare earth sector participants, including Lynas Rare Earths Ltd., MP Materials Corp., USA Rare Earth Inc., Arafura Rare Earths Ltd., and NioCorp Developments Ltd.
"We are pleased to see Apex included in a rare earths-focused ex-China ETF at a time when Western governments, industry participants, and investors are increasingly focused on securing strategic rare earth supply chains outside of China," said Sean Charland, CEO of Apex Critical Metals. "We believe this inclusion reflects growing recognition of the potential of our Rift Rare Earth Project in Nebraska, where we have 2 drills actively turning and additional assays pending."
The Company believes inclusion in a rare earths-focused ETF may help broaden investor awareness, support trading liquidity, and increase exposure to institutional and retail investors seeking targeted participation in the rapidly evolving rare earths sector.
About Apex Critical Metals Corp. (CSE:APXC)(OTCQX:APXCF)(FWB:KL9)
Apex Critical Metals Corp. is a Canadian exploration company focused on advancing rare earth element (REE) and niobium projects that support the growing demand for critical and strategic metals across the United States and Canada. The Company's flagship Rift Project, located within the highly prospective Elk Creek Carbonatite Complex in Nebraska, U.S.A., hosts extensive rare earth rights surrounding one of North America's most advanced niobium-REE deposits. Historical drilling across the complex has reported broad intervals of high-grade REE mineralization, including intercepts such as 155.5 m of 2.70% REO and 68.2 m of 3.32% REO.
In Canada, Apex continues to advance its 100%-owned Cap Project, located 85 kilometres northeast of Prince George, British Columbia. The 2025 drill program confirmed a significant niobium discovery with 0.59% Nb₂O₅ over 36 metres, including 1.08% Nb₂O₅ over 10 metres, within a 1.8-kilometre-long niobium trend. The Cap Project continues to demonstrate strong potential for niobium mineralization within a large and previously unrecognized carbonatite system.
With a growing portfolio of critical mineral projects in both Canada and the United States, Apex Critical Metals is strategically positioned to help strengthen domestic supply chains for the minerals essential to advanced technologies, clean energy, and national security. Apex is publicly listed in Canada on the Canadian Securities Exchange (CSE) under the symbol APXC and quoted on the OTCQX market in the United States under the symbol APXCF, and in Germany on the Borse Frankfurt under the symbol KL9 and/or WKN: A40CCQ. Find out more at www.apexcriticalmetals.com and watch our videos at https://apexcriticalmetals.com/apex-critical-metals-corporate-video/ and make sure to stay in touch by signing up for free news alerts at https://apexcriticalmetals.com/news/news-alerts/, or by following us on X (formerly Twitter), Facebook or LinkedIn.
On Behalf of the Board of Directors
APEX CRITICAL METALS CORP.,
Sean CharlandChief Executive OfficerTel: 604.681.1568Email: info@apexcriticalmetals.com
Neither the Canadian Securities Exchange (CSE) nor its Market Regulator (as that term is defined in the policies of the CSE) accepts responsibility for the adequacy or accuracy of this release.
CAUTIONARY STATEMENT REGARDING FORWARD-LOOKING INFORMATION:
This news release may contain "forward-looking statements" under applicable Canadian securities legislation. Forward-looking statements consist of statements that are not purely historical, including any statements regarding beliefs, plans, expectations or intentions regarding the future. Forward-looking statements in this news release include (without limitation) statements regarding the Company's US-based prospective assets (more particularly described above), including the potential for additional acquisitions and the potential for exploration, statements regarding the potential for future exploration and drilling to confirm the source of magnetic anomalies, and statements regarding potential opportunities for the Company to engage with prospective strategic and institutional partners and any anticipated benefits thereof. Forward-looking statements are subject to various known and unknown risks and uncertainties that may cause actual results, performance or developments to differ materially from those contained in the statements. Risks that could change or prevent these events, activities or developments from coming to fruition include: the Company's properties are at an early stage of development and no current mineral resources or reserves have been identified by the Company thereof, that we may not be able to fully finance any additional exploration on the Company's properties; that even if we are able to raise capital, costs for exploration activities may increase such that we may not have sufficient funds to pay for such exploration or processing activities; the timing and content of any future work programs; geological interpretations based on drilling that may change with more detailed information; potential process methods and mineral recoveries assumptions based on limited test work and by comparison to what are considered analogous deposits that, with further test work, may not be comparable; testing of our process may not prove successful or samples derived from our properties may not yield positive results, and even if such tests are successful or initial sample results are positive, the economic and other outcomes may not be as expected; the anticipated market demand for REE and other minerals may not be as expected; the availability of labour and equipment to undertake future exploration work and testing activities; geopolitical risks which may result in market and economic instability. There can be no assurance that such statements will prove to be accurate, as actual results and future events could differ materially from those anticipated in such statements. Accordingly, readers should not place undue reliance on forward-looking statements. The forward-looking statements herein are made as of the date hereof, and the Company disclaims any intention or obligation to update or revise any forward-looking statements, whether as a result of new information, future events or otherwise, except as required by law.
SOURCE: Apex Critical Metals Corp.
View the original press release on ACCESS Newswire
As Australian shares continue to rise, buoyed by positive movements in global markets despite geopolitical tensions and economic uncertainties, investors are keeping a keen eye on the potential impacts of fuel shortages and inflationary pressures. In this environment, identifying promising small-cap stocks can be crucial for investors looking to capitalize on market opportunities; these undiscovered gems often offer growth potential that aligns well with current market dynamics.
Top 10 Undiscovered Gems With Strong Fundamentals In Australia
| Name | Debt To Equity | Revenue Growth | Earnings Growth | Health Rating |
|---|---|---|---|---|
| Fiducian Group | NA | 9.85% | 10.78% | ★★★★★★ |
| Joyce | NA | 7.70% | 7.34% | ★★★★★★ |
| Bailador Technology Investments | NA | -6.04% | -6.00% | ★★★★★★ |
| Euroz Hartleys Group | NA | -2.67% | -37.02% | ★★★★★★ |
| Focus Minerals | NA | 75.66% | 75.61% | ★★★★★★ |
| WAM Strategic Value | NA | -9.74% | 30.51% | ★★★★★★ |
| SDI | 14.65% | 8.06% | 12.66% | ★★★★★☆ |
| Zimplats Holdings | 3.35% | -10.45% | -46.73% | ★★★★★☆ |
| AMCIL | NA | 2.99% | 1.18% | ★★★★★☆ |
| Australian United Investment | 6.80% | 2.27% | 1.31% | ★★★★☆☆ |
Here’s a peek at a few of the choices from the screener.
Simply Wall St Value Rating: ★★★★★★
Overview: Aeris Resources Limited is an Australian company involved in the exploration, production, and sale of precious metals with a market capitalization of A$460.91 million.
Operations: Aeris Resources generates revenue primarily from its Cracow and Tritton segments, contributing A$210.35 million and A$366.72 million respectively.
Aeris Resources, a dynamic player in Australia’s mining sector, is making strategic moves to bolster its financial health and operational efficiency. The company reported a notable rise in net income to A$47.91 million for the half-year ending December 2025, up from A$29.58 million the previous year. Earnings per share also improved, with basic EPS at A$0.047 compared to A$0.031 last year. Aeris’s earnings growth of 163% outpaced the industry average of 60%. Despite high capital expenditures impacting cash flow negatively at -A$93.86 million as of September 2023, Aeris remains committed to enhancing its core operations while divesting non-core assets for better returns.
ASX:AIS Debt to Equity as at Apr 2026Kina Securities
Simply Wall St Value Rating: ★★★★☆☆
Overview: Kina Securities Limited operates in Papua New Guinea offering commercial banking, financial services, fund administration, investment management, and share brokerage with a market capitalization of A$358.88 million.
Operations: Kina Securities generates revenue through its diverse offerings in commercial banking, financial services, fund administration, investment management, and share brokerage. The company’s net profit margin has shown notable variation over recent periods.
Kina Securities, a financial entity with total assets of PGK5.5 billion and equity at PGK717.9 million, showcases a robust position in the market. Despite having high bad loans at 8.7%, it maintains low-risk funding as 95% of its liabilities stem from customer deposits. The company reported net income of PGK120.73 million for 2025, up from PGK100.3 million the previous year, reflecting earnings growth that outpaces the banking industry average by a significant margin (14.3% vs -1%). Trading at nearly 19% below fair value estimates and offering dividends with an increased payout ratio highlights its potential appeal to investors seeking value opportunities in Australia’s financial sector landscape.
- Get an in-depth perspective on Kina Securities’ performance by reading our health report here.
-
Explore historical data to track Kina Securities’ performance over time in our Past section.
ASX:KSL Debt to Equity as at Apr 2026Vysarn
Simply Wall St Value Rating: ★★★★★★
Overview: Vysarn Limited offers water services across sectors such as resources, urban development, government, and utilities in Australia with a market cap of A$379.76 million.
Operations: Vysarn Limited generates revenue primarily from its Industrial and Advisory segments, with A$72.44 million and A$30.46 million respectively.
Vysarn has shown a robust performance, with earnings growth of 93.7% over the past year, outpacing the Metals and Mining industry. The company’s debt to equity ratio impressively decreased from 34.8% to just 0.2% in five years, indicating a strong balance sheet position with more cash than total debt. Trading at approximately 29% below its estimated fair value suggests potential undervaluation in the market. Recent financials reveal sales climbed to A$66.81 million for the half-year ending December 2025, up from A$41.02 million previously, while net income rose to A$7.25 million from A$3.56 million year-on-year, reflecting solid operational efficiency and profitability improvements despite significant insider selling recently observed.
- Click here and access our complete health analysis report to understand the dynamics of Vysarn.
-
Assess Vysarn’s past performance with our detailed historical performance reports.
ASX:VYS Debt to Equity as at Apr 2026Next Steps
- Access the full spectrum of 65 ASX Undiscovered Gems With Strong Fundamentals by clicking on this link.
- Are you invested in these stocks already? Keep abreast of every twist and turn by setting up a portfolio with Simply Wall St, where we make it simple for investors like you to stay informed and proactive.
- Maximize your investment potential with Simply Wall St, the comprehensive app that offers global market insights for free.
Searching for a Fresh Perspective?
- Explore high-performing small cap companies that haven’t yet garnered significant analyst attention.
- Fuel your portfolio with companies showing strong growth potential, backed by optimistic outlooks both from analysts and management.
- Find companies with promising cash flow potential yet trading below their fair value.
This article by Simply Wall St is general in nature. We provide commentary based on historical data
and analyst forecasts only using an unbiased methodology and our articles are not intended to be financial advice. It does not constitute a recommendation to buy or sell any stock, and does not take account of your objectives, or your
financial situation. We aim to bring you long-term focused analysis driven by fundamental data.
Note that our analysis may not factor in the latest price-sensitive company announcements or qualitative material.
Simply Wall St has no position in any stocks mentioned.
Companies discussed in this article include ASX:AIS ASX:KSL and ASX:VYS.
Have feedback on this article? Concerned about the content? Get in touch with us directly. Alternatively, email editorial-team@simplywallst.com
The United States market has shown robust performance, rising 3.1% over the last week and 27% over the past year, with earnings projected to grow by 16% annually. In such a thriving environment, identifying stocks that are potentially undervalued can offer opportunities for investors seeking to capitalize on discrepancies between current stock prices and their intrinsic values.
Top 10 Undervalued Stocks Based On Cash Flows In The United States
| Name | Current Price | Fair Value (Est) | Discount (Est) |
| Zscaler (ZS) | $118.05 | $233.04 | 49.3% |
| WesBanco (WSBC) | $36.06 | $70.67 | 49% |
| Uranium Energy (UEC) | $13.53 | $26.41 | 48.8% |
| Tutor Perini (TPC) | $83.35 | $163.84 | 49.1% |
| National Bank Holdings (NBHC) | $41.74 | $81.90 | 49% |
| Ferroglobe (GSM) | $4.25 | $8.45 | 49.7% |
| FB Financial (FBK) | $54.90 | $108.31 | 49.3% |
| DNOW (DNOW) | $12.21 | $23.84 | 48.8% |
| Coastal Financial (CCB) | $82.10 | $161.95 | 49.3% |
| Ategrity Specialty Insurance Company Holdings (ASIC) | $20.58 | $40.96 | 49.8% |
Here we highlight a subset of our preferred stocks from the screener.
Overview: Ichor Holdings, Ltd. designs, engineers, and manufactures fluid delivery subsystems and components for semiconductor capital equipment globally, with a market cap of approximately $1.99 billion.
Operations: The company’s revenue is primarily derived from its Semiconductor Equipment and Services segment, totaling $947.65 million.
Estimated Discount To Fair Value: 19%
Ichor Holdings is trading at US$57.5, below its estimated future cash flow value of US$70.99, indicating potential undervaluation based on cash flows. Despite this, the company has experienced significant insider selling and a volatile share price recently. While earnings are expected to grow 78.4% annually, recent financials show a net loss of US$52.78 million for 2025 with revenue guidance between $240-260 million for Q1 2026, pointing to mixed prospects ahead.
- Our expertly prepared growth report on Ichor Holdings implies its future financial outlook may be stronger than recent results.
- Unlock comprehensive insights into our analysis of Ichor Holdings stock in this financial health report.
ICHR Discounted Cash Flow as at Apr 2026Dana
Overview: Dana Incorporated offers power-conveyance and energy-management solutions for on-highway vehicles across North America, Europe, South America, and the Asia Pacific, with a market cap of approximately $3.99 billion.
Operations: The company’s revenue segments include $5.35 billion from Light Vehicle and $2.36 billion from Commercial Vehicle solutions.
Estimated Discount To Fair Value: 26.8%
Dana Incorporated is trading at $36.46, significantly below its estimated future cash flow value of $49.83, highlighting potential undervaluation based on cash flows. Despite interest payments not being well covered by earnings, Dana’s forecasted annual profit growth of 35.63% and a recent shift to profitability with a net income of $85 million in 2025 improve its financial outlook. The company’s ongoing share buyback plan further supports shareholder value enhancement efforts.
- Our earnings growth report unveils the potential for significant increases in Dana’s future results.
- Get an in-depth perspective on Dana’s balance sheet by reading our health report here.
DAN Discounted Cash Flow as at Apr 2026Sociedad Química y Minera de Chile
Overview: Sociedad Química y Minera de Chile S.A. is involved in the production and sale of specialty plant nutrients, as well as iodine and its derivatives on a global scale, with a market cap of approximately $23.46 billion.
Operations: The company’s revenue is primarily derived from its Lithium and Derivatives segment at $2.29 billion, followed by Iodine and Derivatives at $1.04 billion, Specialty Plant Nutrition at $982.40 million, Potassium at $155.51 million, and Industrial Chemicals at $75.40 million.
Estimated Discount To Fair Value: 27.7%
Sociedad Química y Minera de Chile is trading at $82.12, considerably below its estimated future cash flow value of $113.58, indicating potential undervaluation. Despite an unstable dividend track record, the company’s earnings are forecast to grow annually by 19.2%, outpacing the US market’s growth rate of 15.7%. Recent strategic alliances for copper exploration in Chile and a proposed increase in dividend payout further underline its growth prospects and shareholder value initiatives.
- The growth report we’ve compiled suggests that Sociedad Química y Minera de Chile’s future prospects could be on the up.
- Delve into the full analysis health report here for a deeper understanding of Sociedad Química y Minera de Chile.
SQM Discounted Cash Flow as at Apr 2026Make It Happen
- Embark on your investment journey to our 147 Undervalued US Stocks Based On Cash Flows selection here.
- Already own these companies? Bring clarity to your investment decisions by linking up your portfolio with Simply Wall St, where you can monitor all the vital signs of your stocks effortlessly.
- Take control of your financial future using Simply Wall St, offering free, in-depth knowledge of international markets to every investor.
Looking For Alternative Opportunities?
- Explore high-performing small cap companies that haven’t yet garnered significant analyst attention.
- Diversify your portfolio with solid dividend payers offering reliable income streams to weather potential market turbulence.
- Fuel your portfolio with companies showing strong growth potential, backed by optimistic outlooks both from analysts and management.
This article by Simply Wall St is general in nature. We provide commentary based on historical data
and analyst forecasts only using an unbiased methodology and our articles are not intended to be financial advice.
It does not constitute a recommendation to buy or sell any stock, and does not take account of your objectives, or your
financial situation. We aim to bring you long-term focused analysis driven by fundamental data.
Note that our analysis may not factor in the latest price-sensitive company announcements or qualitative material.
Simply Wall St has no position in any stocks mentioned.
Companies discussed in this article include ICHR DAN and SQM.
This article was originally published by Simply Wall St.
Have feedback on this article? Concerned about the content? Get in touch with us directly. Alternatively, email editorial-team@simplywallst.com
Vancouver, British Columbia–(Newsfile Corp. – April 13, 2026) – Sego Resources Inc. (TSXV: SGZ) ("Sego" or "the Company") is delighted to announce results from four drill holes in the Southern Gold Zone and one hole in the Cuba Zone area of the Miner Mountain Porphyry Copper-Gold project near Princeton, BC (Table 1). The Southern Gold Zone is an intrusion hosted disseminated gold zone.
Table 1. 2025 Drill Results Sample intervals are from core lengths, true widths are unknown.
| DDH ID and Dip | From (m) | To (m) | Interval (m) | Au g/t |
| DDH25-66 -50 | 3.83 | 51.04 | 47.21 | 0.520 |
| DDH25-67 -50 | 3.37 | 81.69 | *NSR | |
| DDH25-68 -50 | 3.78 | 167.03 | NSR | |
| DDH25-69 50 | 41.60 | 141.96 | 100.36 | 0.626 |
| Including | 41.60 | 65.97 | 24.37 | 0.958 |
| Including | 75.87 | 94.96 | 19.09 | 0.850 |
| Including | 106.07 | 123.32 | 12.75 | 0.970 |
| DDH25-70 | Abandoned | |||
| DDH25-71 -50 | 6.25 | 588.44 | NSR |
*NSR – No Significant Results
Table 2. Significant 2021 and 2022 DDH Intersections in the Southern Gold Zone see News Release November 22, 2022.
| DDH ID and Dip | From (m) | To (m) | Interval (m) | Au (g/t) |
| DDH 46 -50 | 3.04 | 62.15 | 59.10 | 1.03 |
| DDH 47 -50 | 12.19 | 100.30 | 88.10 | 1.08 |
| DDH 48 -50 | 139.50 | 152.23 | 12.70 | 0.18 |
| DDH 49 -50 | 19.00 | 84.12 | 65.10 | 0.60 |
| DDH 50 -50 | 11.28 | 105.48 | 94.20 | 0.86 |
| DDH 52 -50 | 3.00 | 77.52 | 74.50 | 0.79 |
| DDH 53 -50 | 3.10 | 86.00 | 86.50 | 0.16 |
| DDH 54 -50 | 3.47 | 57.54 | 54.10 | 0.37 |
| DDH 55 -50 | 4.40 | 84.90 | 80.50 | 0.69 |
| DDH 56 -50 | 3.50 | 38.45 | 34.90 | 0.15 |
| DDH 56 -50 | 48.80 | 59.20 | 10.40 | 0.17 |
| DDH 57 -50 | 56.50 | 103.90 | 57.40 | 0.43 |
| DDH 59 -50 | 63.12 | 143.12 | 80.00 | 0.95 |
| DDH 60 -50 | 9.14 | 60.80 | 51.66 | 0.24 |
| DDH-61 -50 | 9.14 | 48.77 | 39.63 | 0.27 |
Samples were shipped to AGAT Laboratories, in Calgary Alberta, an independent laboratory, with ISO/IEC 17025:2017 accreditation. The samples were tested by ICP utilizing Aqua Regia Digest – Metals Package, ICP-OES/ICP, Gold was also fire assayed with a 30g sample weight. The samples were across a 1 metre core length.
Please see the map below for drill hole locations and directions DDH 68 was located north of the Southern Gold Zone without reaching it at depth and Diamond Drill Hole 67 was collared to locate the southern boundary of gold mineralization which was intersected at about 20 metres with gold grades up to 0.299 gpt over 1.86 metres.
Figure below can be viewed at www.segoresources.com with the full news release. Drill results of holes 66 and 69 are highlighted in red.
To view an enhanced version of this graphic, please visit:https://images.newsfilecorp.com/files/1056/292169_9d3704ebe4b53b98_002full.jpg
The Southern Gold Zone is primarily hosted by a fine-grained biotite diorite pervasively altered to variable amounts of calcite, chlorite, sericite, albite and K feldspar. Disseminated very fine-grained pyrite, hematite and relatively minor chalcopyrite are common and also noted in microfractures and lesser calcite-chlorite veinlets. Gold intervals >0.10 gpt are spatially associated with variable strengths of alteration assemblages and of pyrite-hematite and chalcopyrite. Very fine-grained (> 5 microns) gold is difficult to recognize in some samples and to confirm would require scanning electron microscopy of polished thin sections.
A preliminary metallurgical bench scale test from a drill core sample reported in News Release August 11, 2021 concluded that "9.8% of the gold reports to gravity concentration and 59.3% recovered in 1 hour and 72.6% after 3 hours using a cyanide leaching process. An impressive 95.8% of the gold recovered from the core sample with no additional testing."
Sego plans to submit the data for the preparation of an inferred resource calculation on the Southern Gold Zone.
Diamond Drill hole 71 was drilled from the south of the Cuba Zone and encountered extensive alteration which carried weak Cu and Au values. Unfortunately this hole was lost at 580 metres.
An IP survey is planned to define and extend a known deep chargeability anomaly located north of the Southern Gold Zone and results will support deep exploration for porphyry copper-gold mineralization.
Diamond Drilling is scheduled to commence on April 22nd 2026.
Quality Assurance/Quality ControlControl samples comprising certified reference samples, duplicates, and blank samples were systematically inserted into the sample stream and analyzed as part of the Company's quality assurance/quality control protocol. Drill core is HQ in all results. Samples are ½ core with the exception of duplicates which are ¼ core. The Company will also be sending check assays to another laboratory as part of the quality assurance and quality control protocol.
This news release was reviewed and approved by Tor Bruland, P.Geo., who is a Qualified Person under the definitions established by NI 43-101, and is an Independent Consulting Geologist commissioned by Sego Resources Inc.
About the Project:Sego is 100% owner of the Miner Mountain project, an alkalic copper-gold porphyry exploration project near Princeton, British Columbia. The Miner Mountain Project combines alkalic porphyry copper-gold mineralization in the Cuba and other zones and the unusual gold mineralization in the Southern Gold Zone which may be distal to an alkalic copper-gold porphyry. The property is 2,056 hectares in size and is located 15 kilometres north of the Copper Mountain Mine operated by Hudbay Minerals Inc. Sego has a Memorandum of Understanding with the Upper Similkameen Indian Band on whose Traditional Territory the Miner Mountain project is situated. Sego has received an Award of Excellence for its reclamation work at Miner Mountain.
For further information please contact:
J. Paul Stevenson, CEO (604) 682-2933ceo@segoresources.com
Neither the TSX Venture Exchange nor its Regulation Services Provider (as that term is defined in the policies of the TSX Venture Exchange) accepts responsibility for the adequacy or accuracy of this release. No regulatory authority has approved or disapproved the information contained in this news release.
This release includes certain statements that may be deemed "forward-looking statements". All statements in this release, other than statement of historical facts that address future production, reserve potential, exploration drilling, exploitation activities and events or developments that the Company expects re forward-looking statements. Although the Company believes the expectations expressed in such forward-looking statements are based on reasonable assumptions, statements are not guarantees of future performance and actual results or developments may differ materially from the forward-looking statements. Factors that could cause actual results to differ materially from those in forward-looking statements include market prices, exploitation and exploration successes, continued availability of capital and financing, general economic, market or business conditions. Investors are cautioned that any such statements are not guarantees of future performance and those actual results or developments may differ materially from those projected in the forward-looking statements.
To view the source version of this press release, please visit https://www.newsfilecorp.com/release/292169
DENVER, CO / ACCESS Newswire / April 13, 2026 / Solitario Resources Corp. ("Solitario") (NYSE American:XPL)(TSX:SLR) is pleased to announce that President and CEO, Chris Herald, will provide a live webcast presentation at the 23rd Annual Mining Forum Europe 2026 gold conference. The webcast is scheduled for Wednesday, April 15, at 3:40 pm Zurich Time or 9:40 am Eastern Time. To access the live presentation, please click Mining Forum Americas 2026. Additionally, Mr. Herald will be hosting one-on-one meetings with individual attendees.
Mr. Herald's presentation will focus on the details of Solitario's recently permitted Ponderosa drilling program within the Golden Crest gold project. Exceptional surface gold has been delineated over an area 2.0 x 1.5 kilometers. This drilling campaign represents the most aggressive drilling program in Solitario's history. Details of the upcoming Cat Creek molybdenum/rhenium drilling program, and exploration and permitting activities associated with its newly acquired Bright Angel gold-copper project, will also be presented. Finally, Mr. Herald will present planned activities on its advanced high-grade zinc projects, Florida Canyon and Lik, joint ventured with Nexa and Teck Resources, respectively. The presentation will be available on the Company's website post conference.
About Solitario
Solitario is a natural resource exploration company focused on potential high-quality Tier-1 gold, copper, zinc, silver and critical metals projects. The Company is traded on the NYSE American ("XPL") and on the Toronto Stock Exchange ("SLR"). Solitario's Management and Directors hold approximately 8.2% (excluding options) and Newmont Corporation owns 9.2% of the Company's 92.8 million shares outstanding. Solitario's cash balance and marketable securities stand at approximately US$8.8 million. Additional information about Solitario is available online at www.solitarioresources.com.
For More Information Please Contact:
Chris Herald, President & CEO: 303-534-1030; ext. 1
SOURCE: Solitario Resources Corp.
View the original press release on ACCESS Newswire
Toronto, Ontario–(Newsfile Corp. – April 13, 2026) – Olive Resource Capital Inc. (TSXV: OC) is pleased to provide investors an update on its investments for the period ending March 31, 2026.
Table 1: Olive's Investment Portfolio
| Name | Ticker | Sector | Category | (Audited) Value | (Unaudited) Value | (Unaudited) Value |
| Dec 31, 2024 | Dec 31, 2025(1) | Mar 31, 2026(1) | ||||
| Omai Gold Mines Corp.(2) | OMG.v | Precious Metals | Public Equity | $456,720 | $3,504,200 | $4,255,100 |
| Arizona Sonoran Copper Co. | ASCU | Base Metals | Public Equity | $255,780 | $908,200 | $1,400,000 |
| Black Sheep Ventures Inc. | Private | Real Estate | Private Equity & Conv. Debenture | $1,265,936 | $1,276,128 | $1,285,991 |
| Aurion Resources Ltd. | AU.v | Precious Metals | Public Equity | $222,075 | $542,700 | $743,700 |
| Goldsky Resources Corp. (inc. Warrants) | GSKR.v | Precious Metals | Public Equity | $120,450 | $296,829 | $631,485 |
| Sun Valley Minerals Inc.(2) | Private | Precious Metals | Private Equity | $150,000 | $375,000 | $562,500 |
| West Point Gold Corp.(2) | WPG.v | Precious Metals | Public Equity | $118,688 | $515,551 | $508,133 |
| Bravo Mining Corp. | BRVO.v | Precious Metals | Public Equity | $169,100 | $601,250 | $488,312 |
| GeoPark Ltd. | GPRK | Oil & Gas | Public Equity | – | $203,123 | $436,580 |
| Sterling Metals Corp. (inc. Warrants) | SAG.c | Base Metals | Public Equity | $85,906 | $1,074,043 | $381,405 |
| Other Public Equity Liquid Investments and Cash Equivalents (3) | $1,417,143 | $2,578,643 | $2,705,603 | |||
| Other Public Equity Fundamental Investments Incl. Warrants (4) | $1,471,672 | $3,041,883 | $2,788,076 | |||
| Other Private Equity, Loans, & Convertible Debenture Investments | $685,654 | $1,237,667 | $972,179 | |||
| Total | $6,419,124 | $16,155,216 | $17,159,063(5) | |||
Samuel Pelaez, the Company's President, CEO, CIO, and Director, stated: "The conflict in Iran was the defining factor for commodity and equity performance during the month. Market volatility, as measured by the VIX Index rose to the highest since the U.S. tariff announcement in April 2025. The U.S. dollar rose, and major commodities declined, with the notable exception of oil and gas, which rose sharply. Commodity equities followed their respective reference commodity but underperformed. At Olive, we cautiously deployed a portion of the cash we had raised the previous month in anticipation of volatile events. The Company remains well deployed into the first half of the new year, which is historically associated with strong seasonal performance for the entire commodity complex."
Derek Macpherson, the Company's Executive Chairman, stated: "March was a challenging month for commodities and the associated equities, resulting in a decline in investment value; however, we remain up year-to-date and repositioned our portfolio in March to reflect the new reality caused by the conflict in Iran. We continue to believe that we are in the early days of an extended bull market in commodities, and while March represented a meaningful drawdown, it appears to us that the longer-term trend remains intact."
Normal Course Issuer Bid ("NCIB")
Pursuant to the NCIB, the Company repurchased 2,000,000 shares during the month of March 2026. As of the date of this release, the Company holds 4,116,500 common shares in treasury pending cancellation.
As of the date of this release Olive Resource Capital Inc. has 106,744,709 common shares outstanding.
About Olive Resource Capital Inc.:
Olive is a resource-focused merchant bank and investment company with a portfolio of publicly listed and private securities. The Company's assets consist primarily of investments in natural resource companies in all stages of development.
For further information, please contact:
Derek Macpherson, Executive Chairman at derek@olive-resource.com or by phone at (416)294-6713 or Samuel Pelaez, President, CEO & CIO at sam@olive-resource.com. Olive's website is located at www.olive-resource.com.
Neither the TSX Venture Exchange Inc. nor its Regulation Services Provider (as that term is defined in the policies of the TSX Venture Exchange Inc.) accepts responsibility for the adequacy or accuracy of this release. The TSX Venture Exchange Inc. has in no way approved nor disapproved the information contained herein.
Cautionary Note Regarding Forward-Looking Statements: This press release contains "forward-looking information" within the meaning of applicable Canadian securities laws. Any statements that express or involve discussions with respect to predictions, expectations, beliefs, plans, projections, objectives, assumptions or future events or performance (often, but not always, identified by words or phrases such as "believes", "anticipates", "expects", "is expected", "scheduled", "estimates", "pending", "intends", "plans", "forecasts", "targets", or "hopes", or variations of such words and phrases or statements that certain actions, events or results "may", "could", "would", "will", "should", "might", "will be taken", or "occur" and similar expressions) are not statements of historical fact and may be forward-looking statements.
This news release includes forward-looking statements that are subject to risks and uncertainties. Forward-looking statements involve known and unknown risks, uncertainties, and other factors that could cause the actual results of Olive to be materially different from the historical results or from any future results expressed or implied by such forward-looking statements. All statements contained in this news release, other than statements of historical fact, are to be considered forward-looking, including, without limitation, statements concerning Olive's intended future disclosure practices. Although Olive believes the expectations expressed in such forward-looking statements are based on reasonable assumptions, such statements are not guarantees of future performance and actual results or developments may differ materially from those in the forward-looking statements. Factors that could cause actual results to differ materially from such forward-looking information include, but are not limited to: past success or achievement does not guarantee future success; negative investment performance; downward market fluctuations; downward fluctuations in commodity prices and changes in the prices of commodities in general; uncertainties relating to the availability and costs of financing needed in the future; interest rate and exchange rate fluctuations; changes in economic and political conditions that could negatively affect certain commodity prices; and those risks set out in the Company's public documents filed on SEDAR+. Accordingly, readers should not place undue reliance on forward-looking information. Olive does not undertake to update any forward-looking information except in accordance with applicable securities laws.
This commentary is provided for general informational purposes only and does not constitute financial, investment, tax, legal or accounting advice nor does it constitute an offer or solicitation to buy or sell any securities referred to. The information provided in this recording has been obtained from sources believed to be reliable and is believed to be accurate at the time of publishing but we do not represent that it is accurate or complete and it should not be relied upon as such.
To view the source version of this press release, please visit https://www.newsfilecorp.com/release/292149
Albemarle Corporation’s ALB shares have gained roughly 21.9% year to date. The upside has been driven by the company’s solid earnings performance, supported by strong growth in the Energy Storage segment, cost-reduction initiatives and a rebound in lithium prices amid strengthening demand and tighter supply conditions. ALB has underperformed the Zacks Chemical – Diversified industry’s rise of around 32.9%.
ALB’s YTD Price Performance
Image Source: Zacks Investment Research
ALB stock broke above its 50-day simple moving average (SMA) on March 24, 2026. It is also currently trading above its 200-day SMA, suggesting a long-term uptrend.
Albemarle Trades Above 50-Day SMA
Image Source: Zacks Investment Research
Let’s take a look at ALB’s fundamentals to analyze the stock better.
Lithium Project Expansion & Productivity Aid Albemarle
Albemarle is well-placed to gain from long-term growth in the battery-grade lithium market. The market for lithium batteries and energy storage remains strong, especially for EVs, offering significant opportunities for the company to develop innovative products and expand capacity. Lithium demand is expected to grow on the back of significant global EV penetration. ALB expects lithium demand to witness a compound annual growth rate (CAGR) of 10-20% from 2025 to 2030. Stationary storage is expected to be a significant driver for lithium demand along with EVs. Lithium demand increased more than 30% year over year, and the company expects demand to grow roughly 15-40% this year. The company is strategically executing its projects aimed at boosting its global lithium conversion capacity. It remains focused on investing in high-return projects to drive productivity. Healthy customer demand, capacity expansion and plant productivity improvements are supporting its volumes. ALB saw higher sales volumes in its Energy Storage unit in the fourth quarter of 2025 on strong production from its integrated conversion facilities. The Salar yield improvement project in Chile has achieved a 50% operating rate, and the ramp-up continues to deliver encouraging outcomes. The ramp-up at the Meishan lithium conversion facility in China is also progressing ahead of schedule.Albemarle is taking aggressive cost-saving and productivity actions in the wake of tumbling lithium prices. The company delivered roughly $450 million in cost and productivity improvements for full-year 2025, having surpassed its initial target of $300-$400 million. It expects additional cost and productivity improvements of $100-$150 million in 2026. ALB is taking actions to maintain its competitive position, including the initiation of a comprehensive review of cost and operating structure, optimization of the conversion network and reduction of capital expenditure. Its capital expenditures of $590 million for 2025 decreased 65% year over year. ALB, in February 2026, announced that it will idle Train 1, the remaining operating train at its Kemerton lithium hydroxide processing plant in Western Australia, and place it into care and maintenance effective immediately. This move follows earlier actions in 2024 to idle Train 2 for care and maintenance and stop expansion plans for Trains 3 and 4. The Kemerton facility processes spodumene from the Greenbushes mine, one of the world’s best deposits. The move is a result of the ongoing efforts over the past two and a half years to reduce operating costs. The company expects higher flexibility and optionality to benefit adjusted EBITDA starting in the second quarter of 2026.Higher lithium prices, driven by strong demand from EVs and energy storage systems, along with supply disruptions due to recent supply reductions in China, should also aid ALB’s performance. Lithium prices have rebounded lately from trough levels, supported by tightening supply and strong demand in China and globally.
Robust Financial Health Supports ALB’s Capital Allocation
Albemarle remains committed to driving shareholder value by leveraging healthy cash flows and strong liquidity. At the end of 2025, ALB had liquidity of around $3.2 billion, including cash and cash equivalents of around $1.6 billion. Its operating cash flow was around $1.3 billion in 2025, up roughly 86% from the prior-year period. ALB expects generated free cash flow of $692 million for full-year 2025, driven by strong cash conversion, lower capital spending and productivity measures. The company remains focused on maintaining its dividend payout. It has raised its quarterly dividend for the 30th straight year. ALB offers a dividend yield of 0.9% at the current stock price. Its peers, Sociedad Quimica y Minera de Chile S.A. SQM and Rio Tinto Group RIO have a dividend yield of 0.2% and 5.2%, respectively.
Volume & Demand Headwinds Ail ALB
While the Energy Storage unit is expected to benefit from higher lithium prices in 2026, it faces volume pressure, which may affect the segment’s sales. The company expects energy storage sales volumes to be roughly flat in 2026, following inventory drawdowns in 2025. The normalization of inventories is likely to impact volumes in 2026.The Specialties unit also faces challenges from softness in building and construction. High interest rates continue to curb spending in residential construction. Weaker demand in oil and gas applications is also expected to weigh on the segment’s sales and margins.
ALB’s Estimates Reflect Positive Sentiment
The Zacks Consensus Estimate for 2026 for ALB has been revised upward over the past 60 days. The consensus estimate for 2027 has been going up over the same time frame. The Zacks Consensus Estimate for 2026 earnings is currently pegged at $8.15, suggesting a year-over-year rise of 1,131.7%. Earnings are expected to increase roughly 17.7% in 2027.
Image Source: Zacks Investment Research
ALB: An Expensive Stock
ALB is currently trading at a forward price-to-sales ratio of 3.54, well above the industry. It is trading at a premium to Sociedad Quimica and Rio Tinto. Albemarle and Sociedad Quimica currently have a Value Score of D, while Rio Tinto has a Value Score of A.
ALB’s P/S F12M Vs. Industry, SQM and RIO
Image Source: Zacks Investment Research
Conclusion: Hold Onto ALB Stock for Now
Albemarle is benefiting from its initiatives to expand global lithium conversion capacity and enhance productivity. The company is well-positioned to capitalize on the substantial growth opportunity in the battery-grade lithium market, supported by the global transition toward EVs. Higher lithium prices amid robust demand and tight supply conditions also provide a tailwind.Rising earnings estimates and a strong growth outlook are other positives. However, volume pressures in Energy Storage and demand headwinds in Specialties could dampen its prospects. Its stretched valuation also might not offer an attractive entry point at this time. Considering these factors, holding onto this Zacks Rank #3 (Hold) stock will be prudent for investors who already own it. You can see the complete list of today’s Zacks #1 Rank (Strong Buy) stocks here.
Want the latest recommendations from Zacks Investment Research? Today, you can download 7 Best Stocks for the Next 30 Days. Click to get this free report
Rio Tinto PLC (RIO) : Free Stock Analysis Report
Albemarle Corporation (ALB) : Free Stock Analysis Report
Sociedad Quimica y Minera S.A. (SQM) : Free Stock Analysis Report
This article originally published on Zacks Investment Research (zacks.com).
FMC Corporation (NYSE:FMC) is one of the 11 Biggest Agriculture Stocks to Buy in 2026.
On March 24, 2026, Citi analyst Patrick Cunningham increased FMC Corporation (NYSE:FMC)’s price objective to $15 from $14 while keeping a Neutral rating. Citi reported higher fertilizer and energy prices as a result of the Middle East crisis, but noted that near-term agriculture cycle implications are manageable, with planting decisions only marginally influenced.
FMC Corporation (NYSE:FMC) reported 2025 earnings and outlined 2026 targets, announcing a strategic evaluation that includes a potential company sale, as well as a goal of improving the balance sheet by $1 billion in debt reduction. The firm’s CEO, Pierre Brondeau, said that the company will focus on improving its core portfolio, managing the post-patent transition of Rynaxypyr®, and developing new active ingredients. The corporation forecasted 2026 sales of $3.60 billion to $3.80 billion and adjusted EBITDA of $670 million to $730 million, citing pricing pressure, with first-quarter EBITDA of $45 million to $55 million due to tariff and cost headwinds.
FMC Corporation (NYSE:FMC) is an agricultural sciences company that provides producers with solutions and develops pipelines for crop protection, plant health, agriculture, pest control, and turf management.
While we acknowledge the potential of FMC as an investment, we believe certain AI stocks offer greater upside potential and carry less downside risk. If you're looking for an extremely undervalued AI stock that also stands to benefit significantly from Trump-era tariffs and the onshoring trend, see our free report on the best short-term AI stock.
READ NEXT: 33 Stocks That Should Double in 3 Years and Cathie Wood 2026 Portfolio: 10 Best Stocks to Buy.
Disclosure: None. Follow Insider Monkey on Google News.
- In late March 2026, analysts at major banks revised their outlook on Sociedad Química y Minera de Chile after a very large lithium price rally driven by supply curtailments and improving demand.
- While earnings forecasts were lifted on the back of higher assumed lithium pricing, several analysts cautioned that current valuations may already embed much of this optimism.
- Next, we’ll explore how analyst upgrades tied to sharply higher lithium prices interact with SQM’s existing investment narrative and risk profile.
Uncover the next big thing with 32 elite penny stocks that balance risk and reward.
Sociedad Química y Minera de Chile Investment Narrative Recap
To own SQM, you need to believe in sustained value creation from lithium and specialty chemicals despite price swings, regulatory complexity in Chile and heavy growth capex. The recent analyst target hikes largely sharpen the near term catalyst of higher earnings from the lithium price spike, but they also highlight that valuation is already demanding, which reinforces the key risk that any reversal in lithium pricing or sentiment could hit returns hard.
Against this backdrop, the board’s proposal to lift the 2025 final dividend payout to 50% of net income is particularly relevant. It shows SQM using its return to profitability and stronger recent results to return more cash to shareholders at a time when lithium driven earnings are in focus and analysts have lifted EBITDA expectations on higher price assumptions, even as some warn that the current share price already prices in a lot of good news.
Yet for investors, the bigger question is what happens if environmental rules in Chile tighten further and limit SQM’s ability to grow output and margins…
Read the full narrative on Sociedad Química y Minera de Chile (it's free!)
Sociedad Química y Minera de Chile's narrative projects $6.5 billion revenue and $1.9 billion earnings by 2028.
Uncover how Sociedad Química y Minera de Chile's forecasts yield a $75.33 fair value, a 9% downside to its current price.
Exploring Other PerspectivesSQM 1-Year Stock Price Chart
Some of the most optimistic analysts already saw SQM reaching about US$7.6 billion in revenue and US$2.2 billion in earnings, and they tie that upbeat view to the idea that traditional brine based lithium extraction could remain highly profitable despite emerging technologies. The latest lithium price surge and cautious analyst comments show how far apart views can be, and why you may want to compare these more aggressive assumptions with alternative scenarios before deciding how comfortable you are with SQM’s risk and reward.
Explore 9 other fair value estimates on Sociedad Química y Minera de Chile – why the stock might be worth as much as 21% more than the current price!
Reach Your Own Conclusion
Disagree with existing narratives? Extraordinary investment returns rarely come from following the herd, so go with your instincts.
- A great starting point for your Sociedad Química y Minera de Chile research is our analysis highlighting 2 key rewards and 1 important warning sign that could impact your investment decision.
- Our free Sociedad Química y Minera de Chile research report provides a comprehensive fundamental analysis summarized in a single visual – the Snowflake – making it easy to evaluate Sociedad Química y Minera de Chile's overall financial health at a glance.
Curious About Other Options?
Opportunities like this don't last. These are today's most promising picks. Check them out now:
- Invest in the nuclear renaissance through our list of 93 elite nuclear energy infrastructure plays powering the global AI revolution.
- Rare earth metals are the new gold rush. Find out which 28 stocks are leading the charge.
- This technology could replace computers: discover 23 stocks that are working to make quantum computing a reality.
This article by Simply Wall St is general in nature. We provide commentary based on historical data
and analyst forecasts only using an unbiased methodology and our articles are not intended to be financial advice. It does not constitute a recommendation to buy or sell any stock, and does not take account of your objectives, or your
financial situation. We aim to bring you long-term focused analysis driven by fundamental data.
Note that our analysis may not factor in the latest price-sensitive company announcements or qualitative material.
Simply Wall St has no position in any stocks mentioned.
Companies discussed in this article include SQM.
Have feedback on this article? Concerned about the content? Get in touch with us directly. Alternatively, email editorial-team@simplywallst.com
Never miss an important update on your stock portfolio and cut through the noise. Over 7 million investors trust Simply Wall St to stay informed where it matters for FREE.
- Wondering if FMC at US$17.84 is a bargain or a value trap? This article breaks down what the current price really implies about the stock.
- The shares have returned 4.0% over the last 7 days and 26.3% over the last 30 days, yet the 1 year return sits at a 50.1% decline and the 3 and 5 year returns are 83.6% and 81.2% declines.
- Recent coverage has focused on FMC’s sharp long term share price pullback alongside its more recent short term rebound. This has put the stock back on the radar for investors reassessing risk and potential reward. Commentators have also highlighted how these moves have shifted attention toward whether the current price reflects the underlying business or mainly changing sentiment.
- FMC currently has a valuation score of 5 out of 6. The rest of this article will break down what that means across different valuation methods, while also pointing you to an even better way to think about the stock’s value at the end.
Find out why FMC’s -50.1% return over the last year is lagging behind its peers.
Approach 1: FMC Discounted Cash Flow (DCF) Analysis
A Discounted Cash Flow, or DCF, model takes forecasts of a company’s future cash flows and discounts them back to today using a required rate of return, aiming to estimate what the business is worth right now.
For FMC, the model uses a 2 Stage Free Cash Flow to Equity approach based on cash flow projections in US$. The latest twelve month free cash flow is a loss of $161.40 million, so the model assumes conditions change over time. Analyst estimates feed into the nearer term, with projected free cash flow of $177.45 million in 2028. Beyond the explicit analyst horizon, Simply Wall St extrapolates free cash flows out to 2035, keeping the growth pattern grounded in those earlier inputs.
Putting these projected cash flows together and discounting them back to today gives an estimated intrinsic value of about $23.70 per share. Versus the current share price of $17.84, this implies FMC trades at roughly a 24.7% discount, which points to the shares looking undervalued under this DCF framework.
Result: UNDERVALUED
Our Discounted Cash Flow (DCF) analysis suggests FMC is undervalued by 24.7%. Track this in your watchlist or portfolio, or discover 64 more high quality undervalued stocks.
FMC Discounted Cash Flow as at Apr 2026
Approach 2: FMC Price vs Sales
For many established, profitable companies, price based multiples are a practical way to gauge what the market is willing to pay for each unit of business performance. When earnings are volatile, P/S can be especially useful because sales tend to be less affected by short term swings in profitability.
What counts as a normal or fair P/S ratio depends on how investors see a company’s growth potential and risk. Higher expected growth or lower perceived risk can support a higher P/S, while lower growth or higher risk usually justifies a lower multiple.
FMC currently trades on a P/S of 0.64x. This is below the Chemicals industry average of 1.13x and below the peer group average of 1.25x. Simply Wall St’s Fair Ratio for FMC is 1.88x, which is its proprietary estimate of what the P/S might be given factors such as earnings growth, profit margins, industry, market cap and company specific risks.
Because the Fair Ratio adjusts for those company specific drivers, it offers a more tailored benchmark than simply comparing FMC to peers or the wider industry. Comparing the current 0.64x P/S to the 1.88x Fair Ratio suggests the shares trade at a discount on this measure.
Result: UNDERVALUED
NYSE:FMC P/S Ratio as at Apr 2026
P/S ratios tell one story, but what if the real opportunity lies elsewhere? Start investing in legacies, not executives. Discover our 19 top founder-led companies.
Upgrade Your Decision Making: Choose your FMC Narrative
Earlier it was mentioned that there is an even better way to think about valuation. That is where Narratives come in, letting you attach a clear story about FMC, your own view on its future revenue, earnings and margins, to a forecast and a Fair Value that you can compare directly with today’s price on Simply Wall St’s Community page. You might side with a more cautious FMC view that lines up with a Fair Value of about US$13.00 or a more optimistic view closer to US$74.11. As new news or earnings arrive, those Narratives update automatically so your buy or sell decisions stay tied to the latest information rather than a static model.
For FMC, however, we will make it really easy for you with previews of two leading FMC Narratives:
Start with the bullish view if you think the market is underappreciating the repair story and the value of FMC’s portfolio and balance sheet actions, or the bear view if you think regulatory change and slowing demand still have more work to do on the share price.
Fair Value in this bullish narrative: US$18.12 per share.
Implied discount to this Fair Value at US$17.84: about 1.5% undervalued.
Analyst revenue growth assumption used: about 5.47% a year.
- Analysts in this camp expect demand for proprietary products and biologicals, along with growth in regions like Brazil and EMEA, to support higher revenue and better margins over time.
- They see cost restructuring, manufacturing efficiencies and portfolio shifts improving free cash flow and helping debt reduction, which supports the balance sheet.
- The fair value of about US$18.12 reflects these expectations, but it still factors in execution risks around regulation, generic competition and leverage.
Fair Value in this bearish narrative: US$13.00 per share.
Implied premium to this Fair Value at US$17.84: about 37.2% overvalued.
Analyst revenue growth assumption used: about 2.07% a year.
- Analysts behind this view focus on regulatory bans, shifts toward organic and regenerative farming, and higher approval hurdles as long term headwinds for FMC’s conventional crop protection portfolio.
- They highlight reliance on a concentrated set of specialty actives, rising generic competition and pressure on pricing as constraints on future earnings power.
- The fair value of US$13.00 builds in only modest revenue growth and margin recovery, and assumes that sector and regulatory pressures continue to weigh on the share price over time.
If you want to see how your own expectations compare with either outcome, the full Narratives on Simply Wall St set out the detailed numbers behind each case along with the assumptions that drive those fair values.
See what the community is saying about FMC
Do you think there’s more to the story for FMC? Head over to our Community to see what others are saying!
NYSE:FMC 1-Year Stock Price Chart
This article by Simply Wall St is general in nature. We provide commentary based on historical data
and analyst forecasts only using an unbiased methodology and our articles are not intended to be financial advice. It does not constitute a recommendation to buy or sell any stock, and does not take account of your objectives, or your
financial situation. We aim to bring you long-term focused analysis driven by fundamental data.
Note that our analysis may not factor in the latest price-sensitive company announcements or qualitative material.
Simply Wall St has no position in any stocks mentioned.
Companies discussed in this article include FMC.
Have feedback on this article? Concerned about the content? Get in touch with us directly. Alternatively, email editorial-team@simplywallst.com
Never miss an important update on your stock portfolio and cut through the noise. Over 7 million investors trust Simply Wall St to stay informed where it matters for FREE.
- Lindian Resources (ASX:LIN) has appointed a new Chief Financial Officer.
- The CFO appointment comes as the Kangankunde Rare Earths project moves toward production.
- Recent funding supports expansion plans and progress on downstream processing and integration.
Lindian Resources, listed on the ASX under the ticker LIN, is focused on the Kangankunde Rare Earths project, which is advancing toward production. The new CFO arrives as the company reports funding and work on downstream integration, which together shape how capital is allocated and how project execution is overseen.
For investors following the rare earths space, this leadership change occurs at a point in Lindian Resources’ transition from project development to potential operations. Strengthening finance leadership and the broader corporate structure may influence how the company manages costs, funding options, and potential future expansion as it aims to build an integrated rare earths business.
Stay updated on the most important news stories for Lindian Resources by adding it to your watchlist or portfolio. Alternatively, explore our Community to discover new perspectives on Lindian Resources.
ASX:LIN 1-Year Stock Price Chart
The CFO appointment comes shortly after Lindian Resources raised about A$100.0m through a follow on equity offering at A$0.75 per share, with 133,333,334 new shares issued at a discount of A$0.045. For you as an investor, this links leadership and capital structure in a clear way. A finance chief now has the mandate to oversee how this new equity is deployed across Kangankunde construction, project expansion, and downstream initiatives such as SARECO. The move also places more focus on financial discipline, cost tracking, and project controls as Lindian shifts from exploration and early development toward potential production.
The Risks and Rewards Investors Should Consider
- ⚠️ Lindian currently generates less than US$1m in revenue, so the business is still pre scale while taking on a large development and processing program.
- ⚠️ Shareholders have been substantially diluted over the past year, including the recent follow on equity offering of A$100.0m, which increases the share count and can weigh on each investor's ownership percentage.
- 🎁 A dedicated CFO can improve planning, reporting, and financing decisions as Kangankunde advances, helping align funding uses with project milestones and downstream integration goals.
- 🎁 Clearer financial leadership may give the market a better read on cash runway, project spending, and future funding choices when comparing Lindian with other rare earths names such as Lynas Rare Earths or Iluka Resources.
What To Watch Going Forward
From here, keep an eye on how the new CFO sets out spending priorities for the A$100.0m raised, the transparency of project related reporting, and any updates to timelines or budgets at Kangankunde and SARECO. Investors may also want to track further capital raises, debt options, or offtake related funding and how those decisions affect dilution and financial risk. Comparing Lindian's progress and disclosures with peers in the rare earths sector can help you judge whether the finance function is supporting disciplined project execution or if cost and schedule pressures start to build.
To ensure you're always in the loop on how the latest news impacts the investment narrative for Lindian Resources, head to the
community page for Lindian Resources to never miss an update on the top community narratives.
This article by Simply Wall St is general in nature. We provide commentary based on historical data
and analyst forecasts only using an unbiased methodology and our articles are not intended to be financial advice. It does not constitute a recommendation to buy or sell any stock, and does not take account of your objectives, or your
financial situation. We aim to bring you long-term focused analysis driven by fundamental data.
Note that our analysis may not factor in the latest price-sensitive company announcements or qualitative material.
Simply Wall St has no position in any stocks mentioned.
Companies discussed in this article include LIN.AX.
Have feedback on this article? Concerned about the content? Get in touch with us directly. Alternatively, email editorial-team@simplywallst.com
Bravo Mining (BRVO.V) on Thursday provided further details for its its copper-gold (Cu-Au) exploration program at its Luanga Project in Brazil.
The company said exploration focused on targets adjacent to, and beyond the limits of the Luanga palladium + platinum + rhodium + gold + nickel deposit.
Among highlights, the company said a comprehensive Phase 1 exploration program is planned for this year, including target refinement, advanced geophysics and drilling to systematically evaluate and prioritize Cu-Au opportunities across the Luanga property.
Initial target refinement will include detailed geological mapping and expanded geochemical sampling (soil and rock). It added that a 50 line-km of deep-Induced Polarization (deep-IP) survey coverage is planned across multiple priority targets.
An initial 8,000-meter drill program is planned for the second half of 2026 to test and prioritize the most prospective targets identified through earlier phases. It added that the program is to be extended based on results and interpretations.
"With Fabio Masotti joining to lead our Copper-Gold Exploration Division, we are taking a disciplined and structured approach to advancing the broader mineral potential of our Luanga property," said chief executive Luis Azevedo. "The 2026 program is designed to progressively refine targets through detailed geological mapping and expanded geochemical sampling and then test priority areas through integrated geophysics and drilling, while also assessing the potential for additional discoveries and extensions of known mineralization. Together, these efforts position us to unlock further value at Luanga across what we increasingly view as a multi-commodity opportunity."
The company's shares were last seen down $0.05 to $3.28 on the TSX Venture Exchange.
TORONTO, April 9, 2026 /CNW/ – Following the appointment of Mr. Fabio Masotti as Head of the new Copper-Gold Exploration Division, Bravo Mining Corp. (TSXV: BRVO) (OTCQX: BRVMF), ("Bravo" or the "Company") is pleased to provide further assessment and details for its copper-gold ("Cu-Au") exploration program at its 100% owned Luanga Project. This exploration focused on targets adjacent to, and beyond the limits of the Luanga palladium + platinum + rhodium + gold + nickel deposit ("Luanga deposit" or "Luanga PGM+Au+Ni deposit"), located in the Carajás Mineral Province, Pará State, Brazil.
Highlights:
- 2026 Cu–Au Exploration Program Overview
- A comprehensive Phase 1 exploration program is planned for 2026, integrating target refinement, advanced geophysics and drilling to systematically evaluate and prioritize Cu–Au opportunities across the Luanga property, while also assessing potential for deeper extensions of known mineralization.
- Target Refinement & Early-Stage Work
- Initial target refinement will include detailed geological mapping and expanded geochemical sampling (soil and rock).
- Geophysics Programs
- 50 line-km of deep-Induced Polarization ("deep-IP") survey coverage is planned across multiple priority targets.
- IP is an established method for targeting disseminated and stockwork sulfide mineralization, which constitutes the bulk of mineralization in IOCG/ISCG (as defined below) deposits, and has proven effective in the Carajás region.
- The survey is designed to investigate to depths exceeding 300m, beyond that of traditional IP methods.
- Deep-IP is also planned to cover portions of the Luanga deposit to evaluate potential for deep extensions, additional PGM+Au+Ni mineralization, and potential ISCG/IOCG mineralization.
- Additional geophysics, such as Time-Domain electromagnetic ("TEM") surveying, will be performed on targets with known mineralization such as T5 and T16 to seek potential continuations along strike or at depth of the high-grade mineralized shoots identified to date.
- Drilling Program
- An initial 8,000m drill program is planned for the second half of 2026 to test and prioritize the most prospective targets identified through earlier phases.
- Program to be extended based on results and interpretations.
- North Sector Cu–Au Follow-up
- Follow-up on previously reported Cu–Au anomalism (see press release dated March 25, 2026) identified through trenching in the North Sector of the PGM+Au+Ni deposit near the North–Central inflection zone and proximal to the Babylon target at the Luanga Deposit.
- Cu-Au exploration efforts will continue to focus on determining the relationship of the growing number of Cu-Au-related mineralized occurrences in close proximity to the Luanga Deposit to a possible later Cu-Au mineralizing event, or overprint, and its potential.
- In parallel with the Cu-Au exploration, infill drilling is advancing as part of the ongoing work toward the completion of a Pre-Feasibility Study ("PFS").
- Copper-Gold Growth Opportunities in Regional Carajás
- Ongoing evaluation of potential acquisition opportunities of Cu–Au projects.
"With Fabio Masotti joining to lead our Copper-Gold Exploration Division, we are taking a disciplined and structured approach to advancing the broader mineral potential of our Luanga property," said Luís Azevedo, Chairman and CEO of Bravo. "The 2026 program is designed to progressively refine targets through detailed geological mapping and expanded geochemical sampling and then test priority areas through integrated geophysics and drilling, while also assessing the potential for additional discoveries and extensions of known mineralization. Together, these efforts position us to unlock further value at Luanga across what we increasingly view as a multi-commodity opportunity.
Following the successful closing of our public offering and private placement, Bravo is now fully funded to advance both our core PGM+Au+Ni development plans and a comprehensive copper-gold exploration strategy in parallel. This positions us to systematically build a pipeline of copper-gold opportunities alongside our flagship project, including the evaluation of selective acquisition opportunities outside of Luanga, while maintaining a disciplined focus on capital allocation and long-term value creation."
Copper-Gold Exploration & Geological Background
Follow-up exploration of conductivity anomalies defined by an airborne helicopter Time-Domain electromagnetic ("TEM") and magnetic survey in 2023 has successfully identified several targets with Cu-Au potential within the Luanga tenement.
Testing of these targets resulted in the discovery of high-grade Cu-Au +/- Ni mineralization in massive to brecciated sulfides in the T5 and T16 targets. In addition to T5 and T16, several other Cu-Au targets were defined and advanced with encouraging results to date (please refer to news release dated 09 August 2025).
These targets had been initially interpreted by Bravo as belonging to the iron oxide copper-gold ("IOCG") deposit type, which is characteristic of Cu-Au mineralization in the Carajás Mineral Province.
However, a recent review of the geological characteristics of the Luanga property indicates that the Cu-Au mineralization outside the Luanga deposit can be classified as belonging to the Iron Sulphide Copper Gold ("ISCG") deposit type, which is closely related deposit type to IOCGs and part of the broader CGI (Copper–Gold–Iron) mineral system. ISCG and IOCG deposits share similar geochemistry, alteration, and paragenetic sequences, and commonly occur within the same geological provinces.
A key distinction in ISCG systems is the absence of Fe oxides (magnetite or hematite), which are replaced by Fe sulfides, notably pyrrhotite and pyrite. ISGCs have also been described as containing more abundant quartz, which is a feature observed at several targets in the Luanga Property.
At T5 and T16, for example, quartz occurs as clasts in hydrothermal breccias that predate the main sulfide mineralization, which occurs in the matrix of the breccias in conjunction with altered rock fragments and other alteration minerals, but lacking magnetite.
Similar quartz-sulfide breccias have been observed at other ISCG targets at Luanga, including Orion, Taurus, Lizard, and Gemini. The absence of magnetite in ISCG systems limits the effectiveness of magnetic methods for deposit identification, which are typically used in IOCG exploration.
A notable ISCG analogue deposit in the Carajás Mineral Province is the Antas Norte deposit, located approximately 40 km southwest of the Luanga tenement, which was discovered and mined by Avanco Resources.
The Luanga project also demonstrates potential for more traditional IOCG mineralization. This potential includes areas adjacent to the Luanga deposit. Examples include the Babylon target, where massive sulfide mineralization occurs near the top of a deeper hydrothermal alteration zone related to Fe–Ca–K metasomatism, as well as in the North Sector, where trenching has returned elevated gold grades with associated copper, adjacent to metasomatized rocks (see news release dated March 25, 2026).
2026 Exploration Program
A Phase 1 exploration program has been designed to further define and test Cu–Au targets in 2026 (Figure 1). The program includes initial target refinement through geological mapping and additional geochemical sampling of soils and rock chips, followed by geophysical surveys and drilling.
A total of approximately 50 line-km of deep-Induced Polarization ("deep-IP") surveying is planned across multiple targets.
IP is a well-established method for targeting disseminated and stockwork sulfide mineralization, which constitutes the bulk of mineralization in IOCG/ISCG systems and has proven effective in the Carajás region.
The deep-IP survey is designed to investigate to depths of greater than 300m from surface, beyond the limit of conventional IP methods Deep-IP will also cover portions of the Luanga deposit to assess the potential for deep extensions and additional occurrences of PGM+Au+Ni and ISCG/IOCG mineralization.
Additional geophysical surveys, including TEM, as well as structural work, will be performed on targets of known mineralization such as T5 and T16 to identify continuations along strike and at depth of the high-grade mineralized shoots identified to date.
An approximately 8,000 m drill program is planned for the second half of 2026 to test the most prospective targets generated from the aforementioned exploration work.
Copper-Gold Division Strategy
The Copper-Gold Exploration Division will operate within a dedicated budget and team.
The Copper Exploration Division's mandate includes growth and acquisition opportunities focused on the Carajás Mineral Province, aimed at expanding Bravo's copper optionality and long-term value creation alongside the core Luanga PGM+Au+Ni project.
With that objective, the team has initiated the review of selected opportunities and believes the Carajás Mineral Province presents numerous opportunities for the development of Cu-Au deposits that may support a dedicated mine development or a hub and spoke scenario inclusive of Luanga's copper areas.
Bravo's management team has a unique combined experience of successful exploration, property negotiation, project development and operations in the Carajás Mineral Province, supporting its ability to execute on this strategy.
About Bravo Mining Corp.
Bravo is a Canadian and Brazil-based mineral exploration and development company focused on advancing its PGM and copper-gold Luanga Project in the Carajás Mineral Province, Pará State, Brazil. Bravo is one of the most active explorers in Carajás.
The team, comprising of local and international geologists, has a proven track record of PGM, nickel, and copper discoveries in the region. They have successfully taken a past IOCG greenfield project from discovery to development and production in the Carajás.
The Luanga Project is situated on mature freehold farming land and benefits from being located close to operating mines and a mining-experienced workforce, with excellent access and proximity to existing infrastructure, including road, rail, and hydroelectric grid power. Bravo's current Environmental, Social and Governance activities include planting more than 50,000 high-value trees in and around the project area and hiring and contracting locally.
Technical Disclosure
Technical information in this news release has been reviewed and approved by Simon Mottram, F.AusIMM (Fellow Australian Institute of Mining and Metallurgy), President of Bravo Mining Corp. who serves as the Company's "qualified person" as defined in National Instrument 43-101 Standards of Disclosure for Mineral Projects ("NI 43-101"). Mr. Mottram has verified the technical data and opinions contained in this news release.
Neither TSX Venture Exchange nor its Regulation Services Provider (as that term is defined in policies of the TSX Venture Exchange) accepts responsibility for the adequacy or accuracy of this release.
Forward Looking Statements
This news release contains forward-looking information which is not comprised of historical facts. Forward-looking information is characterized by words such as "successful", "high-grade", "encouraging", "potential", "grow", "abundant", "expand", "opportunity", variants of these words and other similar words, phrases, or statements that certain events or conditions "may", "should" or "will" occur. This news release contains forward-looking information pertaining to the Company's Cu exploration program, including the Phase 1 exploration program and the results thereof; the interpretation of the results of data generated, including that mineralization exists and its style/type; the potential future economics of such mineralization; the timing and results of the Pre-feasibility study on the Luanga PGM+Au+Ni deposit; whether or not deeper extensions to the known PGM+Au+Ni mineralization exists and the potential economics of any deeper mineralization identified; and the Company's plans in respect thereof. Forward-looking information involves risks, uncertainties and other factors that could cause actual events, results, and opportunities to differ materially from those expressed or implied by such forward-looking information. Factors that could cause actual results to differ materially from such forward-looking information include, but are not limited to, unexpected results from exploration programs, changes in the state of equity and debt markets, fluctuations in commodity prices, delays in obtaining required regulatory or governmental approvals, environmental risks, limitations on insurance coverage; and other risks and uncertainties involved in the mineral exploration and development industry. Forward-looking information in this news release is based on the opinions and assumptions of management considered reasonable as of the date hereof, including, but not limited to results from trenching reasonably reflect consistent zones of oxide mineralization and that future results from additional trenching will continue to see similar broad distribution of oxides with higher grades that the current MRE; that activities will not be adversely disrupted or impeded by regulatory, political, community, economic, environmental and/or healthy and safety risks; that the Luanga Project will not be materially affected by potential supply chain disruptions; and general business and economic conditions will not change in a materially adverse manner. Although the Company believes that the assumptions and factors used in preparing the forward-looking information in this news release are reasonable, undue reliance should not be placed on such information. The Company disclaims any intention or obligation to update or revise any forward-looking information, other than as required by applicable securities laws.
View original content to download multimedia: http://www.newswire.ca/en/releases/archive/April2026/09/c5231.html
FMC Corporation FMC has secured the European Union’s (“EU”) approval for its Isoflex active herbicide, marking a major regulatory and strategic milestone as it prepares to enter a constrained European crop protection market.
The approval enables FMC to target more than 55 million planted hectares of key crops, such as cereals, corn, oilseed rape and potatoes in the EU, with commercial launches of products with Isoflex active expected from 2027, pending regulatory decisions. This development is particularly significant as it addresses a critical gap in Europe, where growers have lost access to more than 20 herbicide active ingredients since 2019. It left farmers with limited options amid rising herbicide resistance.
Isoflex active, classified as a Group 13 herbicide by the Herbicide Resistance Action Committee, offers a novel mode of action along with broad-spectrum weed control, residual activity and flexible application timing, making it a valuable tool for resistance management and sustainable farming practices.
The product has already been deployed in multiple global markets, including Latin America, Asia and Australia. The EU approval strengthens FMC’s innovation-driven growth strategy, positioning Isoflex as a potential long-term revenue driver and reinforcing the company’s presence in high-value agricultural markets.
Shares of FMC are down 52.7% over the past year against the industry’s 33.5% growth.
Image Source: Zacks Investment Research
FMC’s Zacks Rank & Key Picks
FMC currently carries a Zacks Rank #3 (Hold).
Some better-ranked stocks in the Consumer Staples space are Archer Daniels Midland Company ADM, Adecoagro S.A. AGRO and Corteva, Inc. CTVA. ADM sports a Zacks Rank of #1 (Strong Buy), while AGRO and CTVA have a Zacks Rank of #2 (Buy). You can see the complete list of today’s Zacks #1 Rank stocks here.
The Zacks Consensus Estimate for ADM’s current-year earnings stands at $4.32 per share, implying a 25.9% year-over-year increase. Its earnings beat the Zacks Consensus Estimate in each of the trailing four quarters, with the average surprise being 3.8%.
The Zacks Consensus Estimate for AGRO’s current-year earnings is pegged at $1.39 per share, indicating a 872.2% year-over-year increase. Shares of AGRO have risen 38.9% over the past year.
The Zacks Consensus Estimate for CTVA’s current-year earnings is pegged at $3.63 per share, indicating a 8.7% year-over-year increase. Its earnings beat the Zacks Consensus Estimate in each of the trailing four quarters, with the average surprise being 26%.
Want the latest recommendations from Zacks Investment Research? Today, you can download 7 Best Stocks for the Next 30 Days. Click to get this free report
Archer Daniels Midland Company (ADM) : Free Stock Analysis Report
FMC Corporation (FMC) : Free Stock Analysis Report
Adecoagro S.A. (AGRO) : Free Stock Analysis Report
Corteva, Inc. (CTVA) : Free Stock Analysis Report
This article originally published on Zacks Investment Research (zacks.com).
Lindian raises ~$6M from options exercise and underwriting following $100M placement Proactive uses images sourced from Shutterstock
Lindian Resources Ltd (ASX:LIN, OTC:LINIF) has raised about A$6 million through the exercise and underwriting of 17.3 million unlisted options that expired on April 3, 2026, leaving the company with no options on issue following their conversion.
About 14.42 million options were exercised by holders, while Petra Capital Pty Ltd underwrote the remaining 2.88 million options, contributing about A$1 million in gross proceeds at an exercise price of A$0.35 each.
The underwriting agreement is on standard commercial terms and includes customary termination events, including a 10% fall in the S&P/ASX 300 Index.
The options expired at 5pm WST on April 3, 2026, with settlement of shares under the underwriting agreement expected on April 14, 2026, and issue of those shares expected on or around the same date.
The proceeds from the options, together with cash at bank and its recent A$100 million institutional placement, will further strengthen the balance sheet.
The company plans to use the funds to complete Stage 1 of the Kangankunde Rare Earths Project and move it to first concentrate production and cash flow, while also supporting Stage 2 expansion and the SARECO MREC facility.
Lindian appoints Derek Bideshi CFO as Kangankunde development advances
With money in the bank, Lindian has strengthened its executive team with the appointment of mining finance executive Derek Bideshi as chief financial officer, as the company advances toward production at its flagship Kangankunde rare earths project in Malawi.
The appointment comes at a key stage for Lindian, with construction underway at Kangankunde and work progressing in parallel on its downstream processing strategy through SARECO as it builds toward becoming an integrated rare earths producer.
Bideshi is set to formally join the company on July 6 and brings more than 18 years of international experience across the mining and resources sector, including senior roles with Iluka Resources, South32 and BHP.
Lindian moves on Kazakhstan MREC plant deal to advance downstream strategy
Meanwhile, Lindian is seeking to secure downstream processing capability after signing a binding term sheet to acquire a controlling interest in an operating mixed rare earth carbonate (MREC) facility in Kazakhstan, an asset the company says could support commercial MREC production by Q4 2026.
Under the proposed structure, an incorporated joint venture would be established between Lindian, which would hold 51%, and local partner RA Group, with 49%, before acquiring 100% of the SARECO hydrometallurgical plant in Stepnogorsk.
The facility has previously operated under a joint venture between Sumitomo Corporation and Kazatomprom, giving it an established operating history.
The agreed acquisition price is US$15 million, with Lindian to contribute US$7.65 million and RA Group US$7.35 million.
TORONTO, April 06, 2026 (GLOBE NEWSWIRE) — McChip Resources Inc. (the “Company”) (TSX-V:MCS-X) today announced that the Board of Directors of the Company (the “Board”) has declared a special one-time distribution of cash (the “Cash Distribution”) and a special one-time distribution of common shares of Taranis Resources Inc. (“Taranis Shares”) that are held by the Company (the “Share Distribution”, and, collectively with the Cash Distribution, the “Distributions”) to its shareholders (the “Shareholders”) of record at the close of business on April 10, 2026 (the “Record Date”). The Distributions will be made on April 21, 2026 (the “Distribution Date”).
After careful consideration of the potential alternatives, the Board determined that it is in the best interest of the Company for it to make the Distributions.
Each of the Cash Dividend and the Share Distribution is designated as an “eligible dividend” for Canadian income tax purposes.
Cash Distribution
The Company will distribute an aggregate of $6,556,105.60 pursuant to the Cash Distribution which will amount to $1.10 per common share of the Company (a “Company Share”) held. A portion of the Cash Distribution in the amount of $5,185,283.52 (or $0.87 per Common Share) will constitute a return of capital to the Shareholders, with the remainder in the amount of $1,370,822.08 (or $0.23 per Common Share) (the “Cash Dividend”) to be treated as a dividend. On October 1, 2025, the Shareholders approved a special resolution authorizing a reduction of the stated capital account maintained in respect of the Company Shares by an amount equal to $5,200,000 to allow the Company to make such return of capital in cash to the Shareholders.
Taranis Resources Inc. Share Distribution
The Company will distribute an aggregate of 17,377,244 Taranis Shares to the Shareholders pursuant to the Share Distribution, which will amount to approximately 2.9156 Taranis Shares per Company Share held.
The Share Distribution will be effected by way of a dividend-in-kind.
“Due Bill” Trading
The Distributions will be completed in accordance with the applicable “due bill” trading procedures of the TSX Venture Exchange. The Company Shares will be traded in accordance with the “due bill” procedures from the Record Date, being April 10, 2026 (inclusive), until the close of trading on the Distribution Date, being April 21, 2026 (inclusive) (the “Due Bills Period”). Any trades executed on the TSX Venture Exchange during the Due Bills Period will be identified to ensure that purchasers of Company Shares receive entitlement to the Distributions, whereby the sellers of the Company Shares during the Due Bills Period will also sell their entitlement to the Distributions to the respective purchasers of such Company Shares. The Company Shares will commence trading on an “ex-distribution” basis without an attached “Due Bill” entitlement to the Distributions from the opening of trading on the day following the Distribution Date, being April 22, 2026, which is the applicable redemption date for the “Due Bills”.
For further information contact: Edward G. DumondCorporate Secretary 289-231-4765McChip Resources Inc.
Neither the TSX Venture Exchange nor its Regulation Services Provider (as that term is defined in the policies of the TSX Venture Exchange) accepts responsibility for the adequacy or accuracy of this news release.
Certain statements in this news release constitute “forward-looking information” within the meaning of applicable Canadian securities legislation. Forward-looking information contained in forward-looking statements can be identified by the use of words such as “are expected”, “is forecast”, “is targeted”, “approximately”, “plans”, “anticipates”, “projects”, “continue”, “estimate”, “believe” or variations of such words and phrases or statements that certain actions, events or results “may”, “could”, “would”, “might” or “will” be taken, occur or be achieved. This news release contains forward-looking information regarding the effects of such transactions or the ability of the Company to successfully achieve business objectives, including the effects of unexpected costs, liabilities or delays and whether the Distributions are completed. Forward-looking information involves a number of known and unknown risks and uncertainties, which, if incorrect, may cause actual results to differ materially from those anticipated by the Company. Although the Company believes that the expectations reflected in such forward-looking statements are based upon reasonable assumptions, and that information obtained from third party sources is reliable, the Company can give no assurance that those expectations will prove to have been correct. Accordingly, readers should not place undue reliance on forward-looking information.
For additional information with respect to these and other factors and assumptions underlying the forward-looking information made in this news release, see the Company’s most recent management's discussion and analysis, as well as other public disclosure documents that can be accessed under the issuer profile of “McChip Resources Inc.” on SEDAR+ at www.sedarplus.com. The forward-looking information set forth herein reflects the Company’s reasonable expectations as at the date of this news release and is subject to change after such date. The Company disclaims any intention or obligation to update or revise any forward-looking information, whether as a result of new information, future events or otherwise, other than as required by law. The forward-looking information contained in this news release is expressly qualified by this cautionary statement.
Want the latest recommendations from Zacks Investment Research? Today, you can download 7 Best Stocks for the Next 30 Days. Click to get this free report
Pan American Silver Corp. (PAAS) : Free Stock Analysis Report
Sociedad Quimica y Minera S.A. (SQM) : Free Stock Analysis Report
This article originally published on Zacks Investment Research (zacks.com).
PHILADELPHIA, April 6, 2026 /PRNewswire/ — FMC Corporation (NYSE: FMC), a leading global agricultural sciences company, today announced that Isoflex® active, the trade name for bixlozone, has received regulatory approval in the European Union (EU). This approval is a critical milestone in FMC's commercialization process, paving the way for the introduction of formulated products across more than 55 million planted hectares of cereals, corn, oilseed rape and potato in the EU. Product dossiers have been submitted for these crops, and pending regulatory decisions, FMC anticipates launching products powered by Isoflex® active beginning in 2027.
"The approval of Isoflex® active addresses a critical gap in agriculture in the European Union," said Sebastià Pons, vice president, president FMC EMEA. "Since the last herbicide approval in 2019, growers have lost access to more than 20 herbicide active ingredients. This approval reinforces our ability to develop and register advanced crop protection solutions that solve grower challenges and help strengthen Europe's agricultural economy."
Isoflex® active is classified by the Herbicide Resistance Action Committee (HRAC) as a Group 13 herbicide. The molecule provides lasting control of key grass weeds and a wide range of broadleaf weeds, offering growers a new mode of action in cereals, enabling them to effectively manage resistant weed populations and protect economically important crops across the EU.
The European launches will build on FMC's successful global rollout of products powered by Isoflex® active, which have already been registered and commercialized in Argentina, Australia, Brazil, Chile, China, Great Britain, Pakistan, Uruguay and India. Products containing Isoflex® active have exhibited pre-plant, pre-emergence and early post-emergence selectivity in major crops across the globe, including cereals, cotton, oilseed rape, rice and pulses. Research and development on the use of Isoflex® active in additional crops and segments is ongoing.
For more information about Isoflex® active, visit FMC.com/isoflexactive.
About FMC
FMC Corporation is a global agricultural sciences company dedicated to helping growers produce food, feed, fiber and fuel for an expanding world population while adapting to a changing environment. FMC's innovative crop protection solutions – including biologicals, crop nutrition, digital and precision agriculture – enable growers and crop advisers to address their toughest challenges economically while protecting the environment. FMC is committed to discovering new herbicide, insecticide and fungicide active ingredients, product formulations and pioneering technologies that are consistently better for the planet. Visit fmc.com to learn more and follow us on LinkedIn®.
FMC and Isoflex are trademarks of FMC Corporation and/or an affiliate. Always read and follow all label directions, restrictions and precautions for use. Products listed here may not be registered for sale or use in all states, countries or jurisdictions.
Statement under the Safe Harbor Provisions of the Private Securities Litigation Reform Act of 1995: FMC and its representatives may from time to time make written or oral statements that are "forward-looking" and provide other than historical information, including statements contained in this press release, in FMC's other filings with the SEC, and in presentations, reports or letters to FMC stockholders.
In some cases, FMC has identified these forward-looking statements by such words or phrases as "outlook", "will likely result," "is confident that," "expect," "expects," "should," "could," "may," "will continue to," "believe," "believes," "anticipates," "predicts," "forecasts," "estimates," "projects," "potential," "intends" or similar expressions identifying "forward-looking statements" within the meaning of the Private Securities Litigation Reform Act of 1995, including the negative of those words or phrases. Such forward-looking statements are based on our current views and assumptions regarding future events, future business conditions and the outlook for the company based on currently available information. The forward-looking statements involve known and unknown risks, uncertainties and other factors that may cause actual results to be materially different from any results, levels of activity, performance or achievements expressed or implied by any forward-looking statement. These statements are qualified by reference to the risk factors included in Part I, Item 1A of our Annual Report on Form 10-K for the year ended December 31, 2025 (the "2025 Form 10-K"), the section captioned "Forward-Looking Information" in Part II of the 2025 Form 10-K and to similar risk factors and cautionary statements in all other reports and forms filed with the Securities and Exchange Commission ("SEC"). We wish to caution readers not to place undue reliance on any such forward-looking statements, which speak only as of the date made. Forward-looking statements are qualified in their entirety by the above cautionary statement.
We specifically decline to undertake any obligation, and specifically disclaims any duty, to publicly update or revise any forward-looking statements that have been made to reflect events or circumstances after the date of such statements or to reflect the occurrence of anticipated or unanticipated events, except as may be required by law.
View original content to download multimedia:https://www.prnewswire.com/news-releases/fmc-secures-approval-for-isoflex-active-in-the-european-union-addressing-a-critical-gap-in-the-european-herbicide-market-302734929.html
Small Cap watch: Lindian's new CFO, Far East Gold retains 51% Woyla interest; 'Spectacular' drill results for St George Proactive uses images sourced from Shutterstock
The S&P/ASX Small Ordinaries Index (ASX: XSO) closed at 3,331.30, down 85.60 points or 2.51% on Thursday as we launched into the Easter weekend, while remaining up 27.00 points or 0.82% over the past 5 trading days.
As the market fluctuates, small-cap companies continue to update the market. Today, so far, we've seen executive appointments, project ownership and exploration progress. You can read about the following and more throughout the day.
Lindian bolsters finance leadership
Lindian Resources Ltd (ASX:LIN, OTC:LINIF) has announced the appointment of Derek Bideshi as chief financial officer, effective 6 July 2026. The company said the appointment strengthens its executive capability at a critical phase as it advances the Kangankunde Rare Earths Project through mining, construction and downstream processing initiatives at SARECO. Lindian also announced the promotion of Rajesh Agrawal to general manager, finance, reinforcing depth within the finance function as it transitions to a multi-jurisdictional operating business.
Far East Gold retains 51% Woyla interest
Far East Gold Ltd (ASX:FEG) has provided an update on its interest in the Woyla Project in Aceh, Indonesia. Under the Conditional Share Purchase Agreement, the company had a pathway to increase its ownership stake in the project to 80%, subject to completion of a feasibility study. It had also been working with the vendor on a possible direct pathway to increase its economic interest to 100% without the need for a feasibility study, but said final terms could not be agreed at this stage. FEG will therefore continue to hold a 51% interest in the Woyla Project. No feasibility study has commenced and no further exploration activities will be undertaken at the project for now.
St George reports more Araxá drill results
St George Mining Ltd (ASX:SGQ, FRA:S0G, OTC:SGQMF) has reported further assay results from ongoing diamond drilling at its wholly owned Araxá Rare Earths and Niobium Project in Minas Gerais, Brazil. The company said its around-the-clock drill campaign has been underway for more than six months and is designed to further define and expand the Mineral Resource Estimate. Assay results continue to be received, supporting what St George described as the project’s resource potential and its positioning as a significant rare earths and niobium development opportunity.
Lindian strengthens finance leadership as Kangankunde build gathers pace Proactive uses images sourced from Shutterstock
Lindian Resources Ltd (ASX:LIN, OTC:LINIF) has bolstered its executive team with the appointment of experienced mining finance leader Derek Bideshi as chief financial officer, as the company moves closer to production at its flagship Kangankunde rare earths project in Malawi.
The appointment comes at a pivotal stage for Lindian, with construction under way at Kangankunde and parallel efforts advancing its downstream processing strategy through SARECO, positioning the company as an emerging integrated rare earths producer.
Bideshi will formally join the company on July 6, bringing more than 18 years of international experience across mining and resources, including senior roles at Iluka Resources, South32 and BHP.
Experienced finance leader joins at critical phase
At Iluka, Bideshi served as general manager of finance, overseeing group-wide functions spanning treasury, tax, procurement and financial strategy. He played a central role in refinancing more than US$500 million in corporate debt and establishing funding structures to support multi-jurisdictional operations.
His background in capital management, project financing and governance is closely aligned with Lindian’s current priorities as it transitions from development into production and scales its operations across Malawi and Kazakhstan.
As CFO, Bideshi will lead the company’s global finance function, supporting capital allocation, funding strategy and commercial execution, including offtake arrangements and broader growth initiatives.
Non-executive director Teck Lim said the appointment strengthens Lindian’s leadership at an “important juncture” as it advances Kangankunde towards first production and builds out its downstream ambitions.
“Derek brings a disciplined and commercially grounded approach to financial management, with strong board engagement and capital markets experience,” Lim said. “This will be critical as we continue to scale the business and deliver on our strategy.”
Internal promotion reinforces depth
Alongside the new CFO appointment, Lindian has promoted Rajesh Agrawal to general manager of finance, recognising his role in building the company’s financial systems and supporting its transition into the development phase.
Agrawal joined Lindian in 2024 as financial controller and brings more than three decades of experience across mining and multinational organisations, including roles with Rio Tinto and Aditya Birla Group.
The dual appointments reflect a broader push to strengthen internal capability as the company evolves into a multi-jurisdictional operating business, with finance and supply chain teams already established across Malawi and Kazakhstan.
Lindian is also upgrading its enterprise resource planning systems and implementing enhanced audit and risk frameworks to support operational scale and reporting discipline as it approaches production.
Building momentum at Kangankunde
The leadership update follows a series of recent milestones as Lindian accelerates development at Kangankunde, one of the world’s largest undeveloped rare earths deposits.
The company recently secured A$100 million in funding to fast-track project expansion and downstream initiatives, while also strengthening its board and project team as construction activity ramps up.
Kangankunde is expected to produce a high-grade monazite concentrate, with strong project economics supported by low operating costs and favourable infrastructure access. The company has also recently highlighted progress at the Tipume camp, marking another step towards first production.
With funding in place, early construction under way and now an expanded finance leadership team, Lindian appears increasingly focused on execution — moving from project development into production while laying the groundwork for a vertically integrated rare earths business.
Sociedad Química y Minera de Chile S.A. (NYSE:SQM) is among the Lithium Stocks List: 9 Biggest Lithium Stocks.
On March 25, BofA raised the firm’s price target on Sociedad Química y Minera de Chile S.A. (NYSE:SQM) to $53 from $49 while maintaining an Underperform rating, noting that lithium prices have surged approximately 150% since last June due to supply curtailments and improving demand dynamics. The firm increased its 2026 EBITDA estimate for the company by 41% to $3.6 billion, which stands about 17% above consensus expectations, driven by higher assumed lithium pricing. However, BofA cautions that the current valuation premium appears stretched, as it anticipates lithium prices to peak in 2026, with any subsequent correction likely to be more moderate than in prior cycles.
On February 23, Berenberg also raised its price target on Sociedad Química y Minera de Chile S.A. (NYSE:SQM) to $53 from $47 while maintaining a Hold rating, highlighting that the rebound in lithium prices has more than doubled the share prices of lithium producers from their mid-2025 lows. Despite this recovery, the firm believes that both SQM and its peers are trading above intrinsic value, reflecting elevated expectations embedded in current pricing.
Sociedad Química y Minera de Chile S.A. (NYSE:SQM) is a Chilean chemical company and a global supplier of lithium, iodine, plant nutrients, and industrial chemicals.
READ NEXT: 13 Best Strong Buy AI Stocks to Invest In Now and 10 Most Undervalued Tech Stocks to Buy According to Analysts.
Disclosure: None. Follow Insider Monkey on Google News.
Toronto, Ontario, Canada, April 01, 2026 (GLOBE NEWSWIRE) — Canada Carbon Inc. (the "Company" or "Canada Carbon") (TSX-V:CCB) (FF:U7N1) is pleased to announce the appointment of Gordon Zind as Chief Financial Officer, effective March 31, 2026. subject to the prior acceptance of the TSX Venture Exchange. In connection with this appointment, Arran Thorpe has resigned as Interim Chief Financial Officer of the Company.
“I am pleased to join Canada Carbon at this important stage and look forward to working with the management team and board to support the Company’s financial reporting, governance and strategic objectives,” said Mr. Zind.
The Company welcomes Mr. Zind and thanks Mr. Thorpe for his service as Interim Chief Financial Officer.
In addition, the Company announces that it has extended the exclusivity period under its memorandum of understanding dated October 5, 2022, as amended on October 10, 2025 (the “MOU”), with Irondequoit Carbon Co., LLC (“Irondequoit”) to April 6, 2027. Pursuant to the MOU, Irondequoit has been granted exclusive rights, subject to further extension, to pursue binding offtake agreements for a minimum of 25% of graphite production from the Company’s Miller project, targeted at end‑use applications including aerospace, defence and high‑performance lithium battery energy storage. The extension of the exclusivity period reflects the parties’ continued engagement with respect to potential strategic offtake arrangements.
ABOUT CANADA CARBON INC.
Canada Carbon Inc. is a Canadian exploration and development company focused on high-purity graphite deposits, primarily the Miller and Asbury projects in Quebec. The Company is positioned to supply premium graphite materials for advanced industrial applications.
CANADA CARBON INC.
“Arran Thorpe”Interim Chief Executive Officer and Director Contact Information E-mail inquiries: info@canadacarbon.com P: (905) 407-1212
FORWARD LOOKING INFORMATION
This press release contains statements that constitute “forward-looking information” (“forward-looking information”) within the meaning of the applicable Canadian securities legislation. All statements, other than statements of historical fact, are forward-looking information and are based on expectations, estimates and projections as at the date of this press release. Any statement that discusses predictions, expectations, beliefs, plans, projections, objectives, assumptions, future events or performance (often but not always using phrases such as “expects”, or “does not expect”, “is expected”, “anticipates” or “does not anticipate”, “plans”, “budget”, “scheduled”, “forecasts”, “estimates”, “believes” or “intends” or variations of such words and phrases or stating that certain actions, events or results “may” or “could”, “would”, “might” or “will” be taken to occur or be achieved) are not statements of historical fact and may be forward-looking information. Forward-looking information in this press release includes statements regarding, among other things, the MOU and other matters related thereto. In disclosing the forward-looking information contained in this press release, the Company has made certain assumptions. Although the Company believes that the expectations reflected in such forward-looking information are reasonable, it can give no assurance that the expectations of any forward-looking information will prove to be correct. Known and unknown risks, uncertainties, and other factors which may cause the actual results and future events to differ materially from those expressed or implied by such forward-looking information. Such factors include but are not limited to: compliance with extensive government regulations; financial abilities; the ability to develop the Miller deposit; domestic and foreign laws and regulations adversely affecting the Company’s business and results of operations; and general business, economic, competitive, political, and social uncertainties. Accordingly, readers should not place undue reliance on the forward-looking information contained in this press release. Except as required by law, the Company disclaims any intention and assumes no obligation to update or revise any forward-looking information to reflect actual results, whether as a result of new information, future events, changes in assumptions, changes in factors affecting such forward-looking information or otherwise.
Neither TSX Venture Exchange nor its Regulation Services Provider (as that term is defined in the policies of the TSX Venture Exchange) accepts responsibility for the adequacy or accuracy of this release.
As the Australian market navigates a challenging period marked by geopolitical tensions and natural disruptions, such as Tropical Cyclone Narelle impacting key sectors like energy, investors are keenly observing how these dynamics influence small-cap stocks on the ASX. In this environment, identifying promising opportunities involves looking for companies that demonstrate resilience and potential for growth despite broader market uncertainties.
Top 10 Undiscovered Gems With Strong Fundamentals In Australia
| Name | Debt To Equity | Revenue Growth | Earnings Growth | Health Rating |
|---|---|---|---|---|
| Fiducian Group | NA | 9.85% | 10.78% | ★★★★★★ |
| Joyce | NA | 7.70% | 7.34% | ★★★★★★ |
| Euroz Hartleys Group | NA | -2.67% | -37.02% | ★★★★★★ |
| Plato Income Maximiser | NA | 24.97% | 22.43% | ★★★★★★ |
| WAM Strategic Value | NA | -9.74% | 30.51% | ★★★★★★ |
| Focus Minerals | NA | 75.35% | 51.34% | ★★★★★★ |
| SDI | 14.65% | 8.06% | 12.66% | ★★★★★☆ |
| Zimplats Holdings | 3.35% | -10.45% | -46.73% | ★★★★★☆ |
| AMCIL | NA | 2.99% | 1.18% | ★★★★★☆ |
| Australian United Investment | 6.80% | 2.27% | 1.31% | ★★★★☆☆ |
We’re going to check out a few of the best picks from our screener tool.
Simply Wall St Value Rating: ★★★★★★
Overview: Australian Ethical Investment Ltd is a publicly owned investment manager with a market capitalization of A$515.65 million.
Operations: Australian Ethical Investment Ltd generates revenue primarily from its funds management segment, which amounts to A$126.41 million. The company’s market capitalization stands at A$515.65 million.
Australian Ethical Investment, a nimble player in the ethical investment space, has shown impressive growth with earnings surging 62% over the past year, outpacing its industry peers. The company remains debt-free for five years, underscoring its robust financial health. Recent board changes include appointing Karen Orvad as an independent director, enhancing governance expertise. Financially solid with high-quality earnings and positive free cash flow of A$21.27 million as of June 2024, it declared an interim dividend increase to A$9.11 million for December 2025. This strategic positioning suggests promising growth potential in ethical investing markets.
ASX:AEF Earnings and Revenue Growth as at Mar 2026MFF Capital Investments
Simply Wall St Value Rating: ★★★★★☆
Overview: MFF Capital Investments Limited is an investment firm manager with a market capitalization of approximately A$2.70 billion.
Operations: MFF Capital Investments generates revenue primarily from equity investments, amounting to A$374.08 million. The firm has a market capitalization of approximately A$2.70 billion.
MFF Capital Investments, a relatively small player in the Australian market, has been navigating some choppy waters lately. Over the past year, earnings growth was negative at -61.9%, contrasting sharply with the industry average of 8.2%. Despite this setback, MFF trades at a significant discount—70% below its estimated fair value—offering potential appeal for bargain hunters. The company’s debt to equity ratio rose from 0% to 0.2% over five years but remains manageable with interest payments well covered by EBIT at 94x coverage. Recent announcements revealed net income of A$209.72 million for H1 2026 and an upcoming dividend increase to A$0.11 per share for June-end period, reflecting ongoing shareholder returns amidst financial challenges.
ASX:MFF Debt to Equity as at Mar 2026Omni Bridgeway
Simply Wall St Value Rating: ★★★★★☆
Overview: Omni Bridgeway Limited, with a market cap of A$455.54 million, operates by offering dispute and litigation finance services across various regions including Australia, the United States, Canada, Latin America, Asia, New Zealand, Europe, the Middle East, and Africa.
Operations: Omni Bridgeway generates revenue primarily from funding and providing services related to legal dispute resolution, amounting to A$200.52 million. The company’s net profit margin is a key indicator of its profitability in this niche market.
Omni Bridgeway, a notable player in the legal finance sector, showcases robust financial health with its debt to equity ratio dropping from 22.2% to 3.4% over the past five years, and a substantial A$5.5 billion in assets under management. The company recently reported impressive half-year results with net income reaching A$83.91 million compared to a loss of A$32.61 million previously, highlighting significant growth despite earnings forecasts suggesting an average decline of 169.9% annually over the next three years. Its price-to-earnings ratio stands at just 1x, well below the Australian market average of 17.1x, indicating potential undervaluation relative to peers and industry standards.
- Delve into the full analysis health report here for a deeper understanding of Omni Bridgeway.
-
Gain insights into Omni Bridgeway’s past trends and performance with our Past report.
ASX:OBL Debt to Equity as at Mar 2026Summing It All Up
- Navigate through the entire inventory of 60 ASX Undiscovered Gems With Strong Fundamentals here.
- Have a stake in these businesses? Integrate your holdings into Simply Wall St’s portfolio for notifications and detailed stock reports.
- Invest smarter with the free Simply Wall St app providing detailed insights into every stock market around the globe.
Searching for a Fresh Perspective?
- Explore high-performing small cap companies that haven’t yet garnered significant analyst attention.
- Fuel your portfolio with companies showing strong growth potential, backed by optimistic outlooks both from analysts and management.
- Find companies with promising cash flow potential yet trading below their fair value.
This article by Simply Wall St is general in nature. We provide commentary based on historical data
and analyst forecasts only using an unbiased methodology and our articles are not intended to be financial advice. It does not constitute a recommendation to buy or sell any stock, and does not take account of your objectives, or your
financial situation. We aim to bring you long-term focused analysis driven by fundamental data.
Note that our analysis may not factor in the latest price-sensitive company announcements or qualitative material.
Simply Wall St has no position in any stocks mentioned.
Companies discussed in this article include ASX:AEF ASX:MFF and ASX:OBL.
Have feedback on this article? Concerned about the content? Get in touch with us directly. Alternatively, email editorial-team@simplywallst.com
If you would like to receive our free newsletter via email, simply enter your email address below & click subscribe.
 Follow us on Twitter
 Become our facebook fan
CONNECT WITH US
Tweets
Tweet with hash tag #miningfeeds or @miningfeeds and your tweets will be displayed across this site.
MOST ACTIVE MINING STOCKS
Daily Gainers
 CMC Metals Ltd. CMC Metals Ltd. |
CMB.V | +900.00% |
 Eden Energy Ltd Eden Energy Ltd |
EDE.AX | +200.00% |
| GoviEx Uranium Inc. |
GXU.V | +42.86% |
| Eagle Nickel Ltd. |
ENL.AX | +41.67% |
| Citigold Corp. Limited |
CTO.AX | +33.33% |
| Mount Burgess Mining NL |
MTB.AX | +33.33% |
| Exalt Resources Limited |
ERD.AX | +31.94% |
| Casa Minerals Inc. |
CASA.V | +30.00% |
| Cariboo Rose Resources Ltd |
CRB.V | +28.57% |
| Belmont Resources Inc. |
BEA.V | +28.57% |


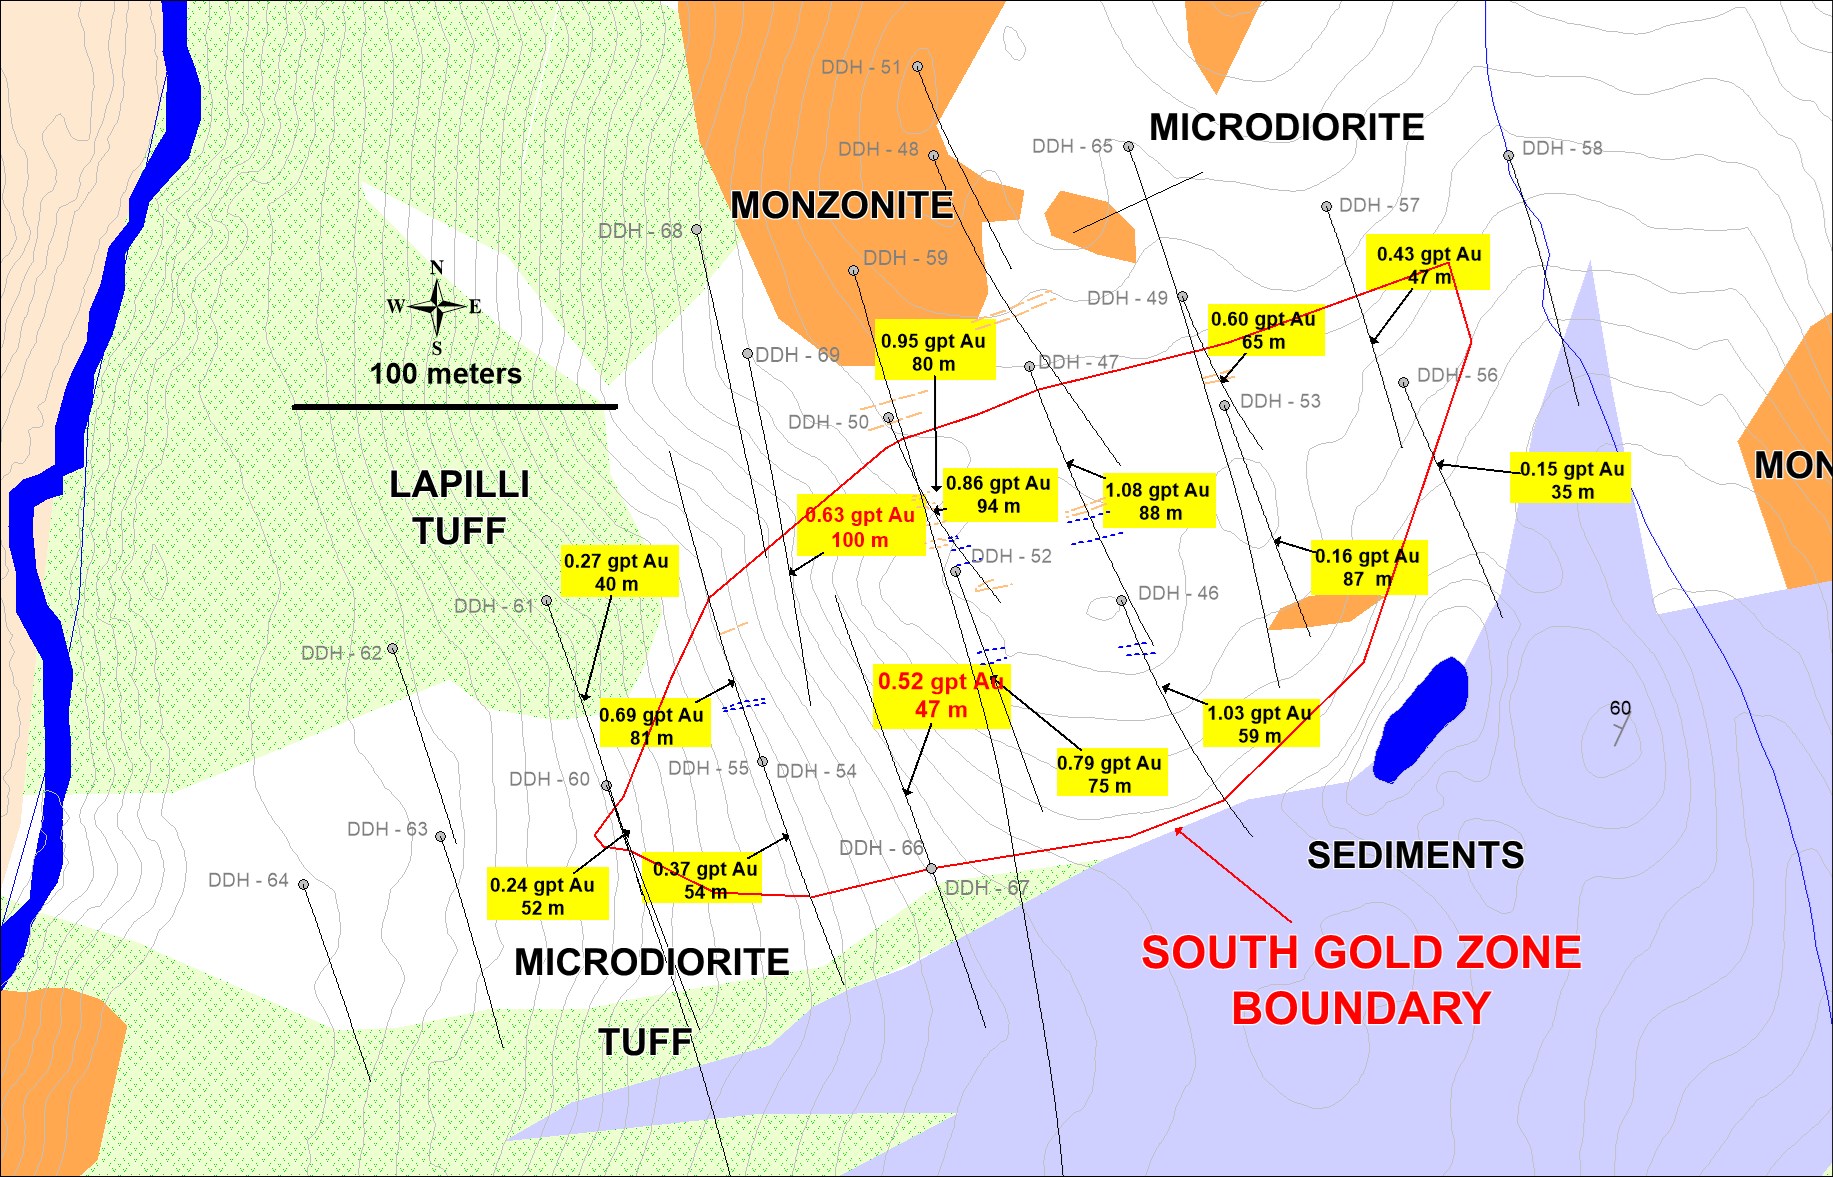