QUEBEC CITY, Nov. 26, 2020 (GLOBE NEWSWIRE) — Robex Resources Inc. (“Robex” or “the Company”) (TSXV: RBX/FWB: RB4) is pleased to report its financial results for the quarter ending September 30, 2020.
All amounts presented are in Canadian dollars (CAD).
Highlights of the third quarter of 2020:
-
GOLD SALES INCREASED BY 80%
Over the third quarter of 2020, 18,121 ounces of gold have been sold for a total of CAD 45.9 M, including all 7,831 ounces of the gold ingot stocks from June 30 for a total of CAD 19.5 M, compared to the 13,276 ounces of gold that were sold for CAD 25.5 M in the same period in 2019, thus an 80% increase.
As a reminder, the difference between the number of ounces of gold sold and the number of ounces of gold produced during the periods is due to the timing of shipments, and to the Company’s liquidity management.
-
224% INCREASE FOR NAMPALA’S OPERATING INCOME
The mine generated an operating income of CAD 28 M for the third quarter of 2020, compared to CAD 8.6 M for the same period in 2019, including CAD 3.5 M in the amortization of fixed assets for this 2020 quarter and CAD 7.4 M for the same period in 2019. Last October, the Company filed a NI 43-101 technical report containing the mineral resources and reserve estimates for the Nampala mine as at July 31, 2020, which has extended the Nampala mine’s life to over eight years, thereby slowing the amortization rate.
-
PRODUCTION COSTS
For the third quarter of 2020, there was a temporary 29% decrease in production, which reached 10,706 ounces compared to 15,175 ounces for the same period in 2019.
-
The rainy season was extremely long and heavy this year, making the ore from the bottom of the main pit inaccessible. Normally, each spring, a higher-grade ore is deposited on the ROM pad to maintain production levels in anticipation of the rainy season, a period when pit excavation is more difficult. However, the restriction on the number of people on the mine site during the lockdown in the second quarter of 2020 has limited pit excavation and therefore prevented us from doing so. In the third quarter of 2020, we had to process lower-grade ore (0.86 g/t compared to 1.05 g/t for the same period in 2019).
-
Also, the opening of the east pit led us to process surface ore which, as has previously been the case in the main pit, is of a lower grade than the core of the mineralized zone.
-
Consequently:
The all-in sustaining cost per ounce sold1 is of CAD 1,072 for the third quarter of 2020, compared to CAD 893 per ounce sold for the same period in 2019. The increase is primarily explained by the lower grade, which has resulted in fewer ounces being produced from the same tonnage of processed ore.
Rather than smoothing this one-time situation, it was decided to execute the mining plan at its economic optimum, even if it meant having a quarter with an apparent production underperformance. However, this did not prevent us from achieving an overall production for the first nine months of 2020 equivalent to the same period in 2019. It is important to note that since the beginning of the fourth quarter, the Nampala mine has recovered a richer ore grade and therefore production is more consistent with that obtained before the rainy season.
Production costs capitalized as stripping costs were of CAD 4.7 M in the third quarter of 2020, stemming from the fact that operating new pits around the main pit in 2020 has temporarily involved stripping work and, consequently, the removal of larger amounts of waste rock to reach the ore.
-
CASH FLOWS FROM OPERATING ACTIVITIES2 REPRESENTING 202% OF THOSE FOR THE SAME PERIOD IN 2019
The Company’s operating activities have generated cash flows of CAD 28.1 M (CAD 0.047 per share1), which corresponds to 61% of the turnover, compared to CAD 13.9 M (CAD 0,024 per share1) for the same period in 2019.
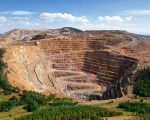
Mining Operation: Nampala, Mali
|
Third quarters |
Nine-month periods |
|||||||
|
2020 |
2019 |
2020 |
2019 |
|||||
|
Operating Data |
||||||||
|
Ore mined (tonnes) |
406,005 |
477,676 |
1,364,376 |
1,378,787 |
||||
|
Ore processed (tonnes) |
438,367 |
512,377 |
1,398,547 |
1,370,536 |
||||
|
Waste mined (tonnes) |
1,559,460 |
645,784 |
3,924,692 |
2,309,402 |
||||
|
Operational stripping ratio |
3.8 |
1.4 |
2.9 |
1.7 |
||||
|
Head grade (gpt) |
0.86 |
1.05 |
0.99 |
1.01 |
||||
|
Recovery (%) |
88.2 |
% |
87.7 |
% |
89.1 |
% |
86.5 |
% |
|
Gold ounces produced |
10,706 |
15,175 |
39,545 |
38,324 |
||||
|
Gold ounces sold |
18,121 |
13,276 |
39,267 |
35,971 |
||||
|
Financial Data |
||||||||
|
(rounded off to the nearest thousand dollars) |
||||||||
|
Revenue – Gold sales |
45,864,000 |
25,478,000 |
92,442,000 |
64,789,000 |
||||
|
Mining operation expenses |
11,194,000 |
7,489,000 |
22,357,000 |
22,027,000 |
||||
|
Mining royalties |
1,085,000 |
681,000 |
2,226,000 |
1,891,000 |
||||
|
Administrative expenses |
2,095,000 |
1,284,000 |
6,295,000 |
4,626,000 |
||||
|
Depreciation of property, plant and equipment and |
3,488,000 |
7,384,000 |
17,635,000 |
23,193,000 |
||||
|
Segment operating income |
28,002,000 |
8,640,000 |
43,929,000 |
13,052,000 |
||||
|
Statistics |
||||||||
|
(in dollars) |
||||||||
|
Average realized selling price (per ounce) |
2,531 |
1,919 |
2,354 |
1,801 |
||||
|
Cash operating cost (per tonne processed)1 |
20 |
16 |
17 |
17 |
||||
|
Total cash cost (per ounce sold)1 |
678 |
615 |
626 |
665 |
||||
|
All-in sustaining cost (per ounce sold) 1 |
1,072 |
893 |
1,064 |
988 |
||||
|
Administrative expenses (per ounce sold) |
116 |
97 |
160 |
129 |
||||
|
Depreciation of property, plant and equipment |
192 |
556 |
449 |
645 |
||||
Robex’s MD&A and the condensed interim consolidated financial statements (unaudited) are available on the Company's website in the Investors section at robexgold.com. These reports and other documents produced by the Company are also available at sedar.com.
Continuous improvement
The Nampala mine remains focused on improving safe production performances:
-
In early November, a new discharge line was installed, increasing the diameter from 315 to 450 mm, to increase production while reducing pump speed;
-
A cone crusher is scheduled to be installed–equipment is currently being delivered;
-
A new mechanical workshop is being completed. It is bigger and much closer to the plant, and it will speed up the work;
-
A 500 m3 diesel tank is being installed to increase diesel reserves and better secure production.
To improve site security, 9 members of the National Guard are now permanently posted on the Nampala site to support the police team and our own security service.
A word from the President, Mr. Georges Cohen:
Performance is extremely satisfactory despite a slight cost increase resulting from an unusually challenging rainy season and the impacts of the pandemic.
Initiatives are continually underway to optimize performances at the Nampala mine.
Our prospecting campaign is still very promising; the work and financial efforts will, I hope, make it possible to increase annual production.
For information:
Robex Resources Inc.
Benjamin Cohen, CEO
Augustin Rousselet, CFO/COO
Head office: (581) 741-7421
info@robexgold.com
This news release contains statements that may be considered “forecast information” or “forecast statements” in terms of security rights. These forecasts are subject to uncertainties and risks, some of which are beyond the control of Robex. Achievements and final results may differ significantly from forecasts made implicitly or explicitly. These differences can be attributed to many factors, including market volatility, the impact of the exchange rate and interest rate fluctuations, mispricing, the environment (hardening of regulations), unforeseen geological situations, unfavourable operating conditions, political risks inherent in mining in developing countries, changes in government policies or regulations (laws and policies), an inability to obtain necessary permits and approvals from government agencies, or any other risk associated with mining and development. There can be no assurance that the circumstances set out in these forecasts will occur, or even benefit Robex, if any. The forecasts are based on the estimates and opinions of the Robex management team at the time of publication. Robex makes no commitment to make any updates or changes to these publicly available forecasts based on new information or events, or for any other reason, except as required by applicable security laws. The TSX Venture Exchange or the Regulation Services Provider (as defined in the policies of the TSX Venture Exchange) assumes no responsibility for the authenticity or accuracy of this news release.
1 Cash operating cost, total cash cost, all-in sustaining cost and cash flows from operating activities per share are non-IFRS financial performance measures with no standard definition under IFRS. See the "Non-IFRS Financial Performance Measures" section of the MD&A.
2 Cash flows from operating activities exclude the net variation of non-cash working capital elements.
MONTRÉAL, Nov. 25, 2020 (GLOBE NEWSWIRE) — Nemaska Lithium Inc. (“Nemaska Lithium” or the “Corporation”) announces today that it has completed the previously announced exchange of its common shares, on a one-for-one basis, for common shares of NMX Residual Liabilities Inc. (“Residual Nemaska Lithium”), resulting in Residual Nemaska Lithium having become a successor reporting issuer under applicable Canadian securities laws (the “Exchange”). All issued and outstanding options, warrants and other securities of the Corporation (including securities convertible, exchangeable or exercisable for shares of the Corporation) have also been cancelled for no consideration. The Exchange was effected and completed in accordance with and pursuant to the approval and vesting order of the Superior Court of Québec (Commercial Division) issued on October 15, 2020 (the “Court Order”) in connection with the proceedings under the Companies’ Creditors Arrangement Act relating to the Corporation and the other subsidiary applicants thereto (the “CCAA Proceedings”).
As contemplated by the Court Order with respect to the Exchange, each share certificate (or other evidence of ownership of shares of the Corporation) representing shares of the Corporation are deemed to represent for all purposes the same number of common shares of Residual Nemaska Lithium. Accordingly, shareholders are not required to surrender their share certificates representing shares of the Corporation and no action is required from shareholders to complete the Exchange. In the context of the previously announced transactions structured, in the context of the CCAA Proceedings, as a credit bid from a group that includes the Corporation’s largest secured creditor (the “Transaction”), there is no residual value for shareholders of Residual Nemaska Lithium resulting from the Transaction and the Exchange.
Tax Considerations of the Exchange
The following section provides a general summary of certain Canadian federal tax considerations to beneficial owners of common shares of the Corporation (the “Shares”) who, for the purposes of the Income Tax Act (Canada) (the “Tax Act”) and at all relevant times, are or are deemed to be resident in Canada hold their shares as capital property, deals at arm’s length and are not affiliated with Residual Nemaska Lithium (“Canadian Holders”).
For purposes of the Tax Act, the Exchange will generally not result, pursuant to subsection 85.1(1) of the Tax Act, in a Canadian Holder realizing a capital loss. A Canadian Holder may, however, elect to realize a capital loss upon the Exchange by including in its return of income for the taxation year in which the Exchange occurred the capital loss, as otherwise determined, resulting from the Exchange.
This summary does not discuss all of the tax considerations potentially applicable to Canadian Holders or to other holders of shares and all holders should consult their own tax advisors as to the federal, provincial and foreign tax considerations applicable to them having regard to their own circumstances. All non-residents of Canada should determine with their own tax advisors if any tax filings are required related to the disposition having regards to their own circumstances.
Questions and Answers About the Exchange
The following are some questions that you, as a shareholder, may have relating to the CCAA proceedings and proposed Transaction and answers to those questions. These questions and answers are of general nature and do not provide all of the information relating to the CCAA proceedings and the Transaction or the matters to be considered in connection thereto and are qualified in their entirety by the more detailed information contained elsewhere in this press release, the proceedings in front of the Superior Court of Québec (Commercial Division) (the “Court”) pursuant to the Companies’ Creditors Arrangement Act (“CCAA”) and related documentation, all of which are important and should be reviewed carefully.
Q: As a shareholder, will I receive any payment or distribution in connection with the CCAA proceedings?
A: No. Unfortunately, there is no residual value for shareholders of Residual Nemaska Lithium. Shareholders will not receive any payments for, or distributions on, their shares in connection with the CCAA proceedings.
Q: Why are my shares of Nemaska Lithium being exchanged?
A: Your shares are being exchanged (on a one-for-one basis for common shares of Residual Nemaska Lithium) as part of a reorganization of the Corporation and its affiliates. However, as indicated above, unfortunately there is no residual value for shareholders of Residual Nemaska Lithium in connection with the CCAA proceedings.
Q: Do I need to do anything to complete the exchange of my shares or contact my broker?
A: No. The context of the transaction provides an automatic exchange of shares and no action is required from shareholders to complete the Exchange. Following the Exchange, each share certificate (or other evidence of ownership of shares of the Corporation) representing shares of the Corporation shall be deemed to represent for all purposes the same number of common shares of Residual Nemaska Lithium. Accordingly, shareholders will not be required to surrender their share certificates representing shares of the Corporation.
Q: Will the common shares of Residual Nemaska Lithium, which I will receive as a result of the Exchange, have any value?
A: The common shares of Residual Nemaska Lithium will not be of any value. The Exchange is only made for reorganization purposes, and Residual Nemaska Lithium will not conduct any business activities.
Q: How can I claim my tax losses?
A: Generally, a shareholder may elect to realize a capital loss upon the Exchange by including in its income tax return for the taxation year in which the Exchange occurred the capital loss resulting from the Exchange. It is important to understand that the automatic exchange of shares upon the proposed transaction results in the deferral of the capital loss to the shareholder on his or her shares unless the shareholder elects to include any portion of the capital loss otherwise determined, in computing its income for the relevant taxation year. For this purpose, no tax form, tax slips or other similar documentation will be provided to any such shareholder. It is the shareholder’s sole responsibility to elect to realize the capital loss otherwise determined.
In any cases, shareholders should consult their own tax advisors as to the possibility of realizing a capital loss upon the Exchange as well as to obtain assistance and advice in determining the capital loss otherwise realized upon the Exchange.
Q: If I am a non-resident of Canada, what do I need to do?
A: The Corporation makes available on www.sedar.com and on the website of PricewaterhouseCoopers Inc. (the “Monitor”) certain tax documentation and forms that may be required to be completed and filed, within 10 days following the Exchange, by certain shareholders, option holders or warrant holders, as applicable, which are non-resident of Canada. All non-residents of Canada should determine with their own tax advisors if any tax filings are required related to the disposition having regards to their own circumstances.
Q: Who can I call if I have any questions?
A: You may call 514-205-5698, a number set up by the Monitor, for any questions or additional information. You should also consult with your own tax advisors as to the tax considerations resulting from the Exchange.
Next Steps in the CCAA Restructuring
The Exchange is completed four business days before the closing date of the Transaction. The Corporation will confirm by press release once the closing of the Transaction occurs.
As mentioned above, the Court also approved procedures under the CCAA in order for Residual Nemaska Lithium and its subsidiary, NMX Residual Assets Inc. to file and submit, following closing of the Transaction, a plan of compromise or arrangement to its creditors in respect of certain excluded cash of the Corporation on hand at closing, subject to certain adjustments and certain excluded assets.
More information regarding the Corporation’s situation, decisions or actions will continue to be provided on an ongoing basis, as required by applicable law or as may be determined by the Corporation or the Court. For more information, visit www.nemaskalithium.com. You can also refer to the Monitor’s website for more information regarding the CCAA procedures at https://www.pwc.com/ca/en/services/insolvency-assignments/nemaska-lithium-inc.html.
Cautionary Statement on Forward-Looking Information
All statements, other than statements of historical fact, contained in this press release including, but not limited to, those relating to the CCAA proceedings, the Transaction and the Corporation’s activities and its ability to meet its obligations, constitute “forward-looking information” and “forward-looking statements” within the meaning of certain securities laws and are based on expectations and projections as of the date of this press release. Certain important assumptions by the Corporation in making forward-looking statements include, but are not limited to, satisfaction of all closing conditions under the Transaction during the fourth quarter of 2020.
Forward-looking statements contained in this press release include, without limitation, those related to the ability of the Corporation to close the Transaction and the timing of closing, the emergence from the CCAA proceedings, and the presentation of a plan of compromise or arrangement to the creditors of Residual Nemaska Lithium and NMX Residual Assets Inc. and calling of a meeting of creditors. Forward-looking statements are based on expectations, estimates and projections as of the time of this press release. Forward-looking statements are necessarily based upon a number of estimates and assumptions that, while considered reasonable by the Corporation as of the time of such statements, are inherently subject to significant business, economic and competitive uncertainties and contingencies. These estimates and assumptions may prove to be incorrect.
Many of these uncertainties and contingencies can directly or indirectly affect, and could cause, actual results to differ materially from those expressed or implied in any forward-looking statements. In addition, there can be no assurance that the CCAA proceedings will result in the maximization of the return in respect of the Corporation’s assets and those of its subsidiaries.
By their very nature, forward-looking statements involve inherent risks and uncertainties, both general and specific, and risks exist that estimates, forecasts, projections and other forward-looking statements will not be achieved or that assumptions do not reflect future experience. Forward-looking statements are provided for the purpose of providing information about management’s expectations and plans relating to the future. Readers are cautioned not to place undue reliance on these forward-looking statements as a number of important risk factors and future events could cause the actual outcomes to differ materially from the beliefs, plans, objectives, expectations, anticipations, estimates, assumptions and intentions expressed in such forward-looking statements. All of the forward-looking statements made in this press release are qualified by these cautionary statements and those made in our other filings with the securities regulators of Canada including, but not limited to, the cautionary statements made in the “Risk Factors” section of the Corporation’s Annual Information Form dated September 30, 2019, and the “Risk Exposure and Management” section of the Corporation’s quarterly Management Discussion & Analysis. The Corporation cautions that the foregoing list of factors that may affect future results is not exhaustive, and new, unforeseeable risks may arise from time to time. The Corporation disclaims any intention or obligation to update or revise any forward-looking statements or to explain any material difference between subsequent actual events and such forward-looking statements, except to the extent required by applicable law.
Further information regarding Nemaska Lithium is available in the SEDAR database (www.sedar.com) and on the Corporation’s website at: www.nemaskalithium.com.
SOURCE:
Nemaska Lithium Inc.
MEDIA:
Gabrielle Tellier
Media Relations
514 348-0466
gabrielle.tellier@nemaskalithium.com
David Richards became the CEO of Liontown Resources Limited (ASX:LTR) in 2010, and we think it's a good time to look at the executive's compensation against the backdrop of overall company performance. This analysis will also look to assess whether the CEO is appropriately paid, considering recent earnings growth and investor returns for Liontown Resources.
Check out our latest analysis for Liontown Resources
How Does Total Compensation For David Richards Compare With Other Companies In The Industry?
Our data indicates that Liontown Resources Limited has a market capitalization of AU$485m, and total annual CEO compensation was reported as AU$556k for the year to June 2020. Notably, that's an increase of 42% over the year before. We think total compensation is more important but our data shows that the CEO salary is lower, at AU$243k.
In comparison with other companies in the industry with market capitalizations ranging from AU$272m to AU$1.1b, the reported median CEO total compensation was AU$955k. Accordingly, Liontown Resources pays its CEO under the industry median. What's more, David Richards holds AU$5.4m worth of shares in the company in their own name, indicating that they have a lot of skin in the game.
|
Component |
2020 |
2019 |
Proportion (2020) |
|
Salary |
AU$243k |
AU$263k |
44% |
|
Other |
AU$312k |
AU$127k |
56% |
|
Total Compensation |
AU$556k |
AU$390k |
100% |
Speaking on an industry level, nearly 70% of total compensation represents salary, while the remainder of 30% is other remuneration. Liontown Resources sets aside a smaller share of compensation for salary, in comparison to the overall industry. It's important to note that a slant towards non-salary compensation suggests that total pay is tied to the company's performance.

Liontown Resources Limited's Growth
Over the last three years, Liontown Resources Limited has shrunk its earnings per share by 54% per year. It saw its revenue drop 63% over the last year.
The decline in EPS is a bit concerning. This is compounded by the fact revenue is actually down on last year. So given this relatively weak performance, shareholders would probably not want to see high compensation for the CEO. Although we don't have analyst forecasts, you might want to assess this data-rich visualization of earnings, revenue and cash flow.
Has Liontown Resources Limited Been A Good Investment?
Boasting a total shareholder return of 890% over three years, Liontown Resources Limited has done well by shareholders. So they may not be at all concerned if the CEO were to be paid more than is normal for companies around the same size.
To Conclude…
As previously discussed, David is compensated less than what is normal for CEOs of companies of similar size, and which belong to the same industry. And although the company is suffering from declining EPS growth over the past three years, shareholder returns remain strong. Although we'd like to see positive EPS growth, we'd argue the remuneration is modest, based on our observations.
It is always advisable to analyse CEO pay, along with performing a thorough analysis of the company's key performance areas. In our study, we found 4 warning signs for Liontown Resources you should be aware of, and 2 of them can't be ignored.
Arguably, business quality is much more important than CEO compensation levels. So check out this free list of interesting companies that have HIGH return on equity and low debt.
This article by Simply Wall St is general in nature. It does not constitute a recommendation to buy or sell any stock, and does not take account of your objectives, or your financial situation. We aim to bring you long-term focused analysis driven by fundamental data. Note that our analysis may not factor in the latest price-sensitive company announcements or qualitative material. Simply Wall St has no position in any stocks mentioned.
Have feedback on this article? Concerned about the content? Get in touch with us directly. Alternatively, email editorial-team@simplywallst.com.
CHIBOUGAMEAU, QC, Nov. 24, 2020 /CNW/ – Quebecers know that high-speed Internet access is no longer a luxury; it is essential for everyone, including those living in rural and remote regions.
The current crisis has highlighted how much we all rely on high-speed Internet, and this need is sure to be even greater in the future. Now more than ever, it is essential that people have access to reliable, affordable high-speed Internet in their homes so they can work, learn, and communicate with loved ones.
Today, Will Amos, Parliamentary Secretary to the Minister of Innovation, Science and Industry (Science), along with Quebec representatives Gilles Bélanger, Member of the National Assembly for Orford and Parliamentary Assistant to the Minister of Economy and Innovation (economy and high-speed Internet), and Denis Lamothe, Member of the National Assembly for Ungava and Parliamentary Assistant to the Minister Responsible for Indigenous Affairs and Parliamentary Assistant to the Minister of Forests, Wildlife and Parks (wildlife and parks), announced an investment of over $16.5 million in the Eeyou Communications Network, a not-for-profit telecommunications corporation that provides broadband carrier services for the Cree communities of Eeyou Istchee and municipalities of the James Bay region.
This project will deliver a backbone network of optical fibre technology that will provide reliable, high-speed broadband to 16 communities, as well as a last-mile network using optical fibre technology to reach underserved households in three of these communities in the Nord-du-Québec and Mauricie regions. Moreover, the last-mile networks will improve broadband capacity for 6,176 underserved households in these regions.
Thanks to work that was recently completed in Matagami, Chapais, Lebel-sur-Quévillon and Chibougamau, the project in the Nord-du-Québec region can now serve 5,826 additional households and 252 additional businesses.
Funding is being provided as follows:
-
$5 million through the Government of Canada's Connect to Innovate program
-
$3.3 million from the Connected Quebec program
-
$6.7 million from the Plan Nord Corporation
-
$1.2 million from the James Bay Regional Authority
-
$324,494 from Indigenous Services Canada
Quotes
"High-speed Internet service is key to the success of residents in rural regions of Quebec. The COVID-19 crisis has shown us how important it is to be able to access the digital world—now more than ever. By investing in this new project through the Connect to Innovate program, we are continuing to bridge the digital divide so Canadians in Quebec's rural regions can also benefit from all the advantages the digital world has to offer. To date, the Government of Canada has invested over $213 million in 54 projects, which will connect up to 250,293 households in Quebec."
– Will Amos, Parliamentary Secretary to the Minister of Innovation, Science and Industry (Science)
"We are committed to ensuring that all Quebecers have access to high-speed Internet, and we are more determined than ever to achieve our goal. The pandemic has disrupted the way people work and buy online, and so it is imperative that everyone can benefit from this essential service. The successful work of the Eeyou Communications Network has resulted in significant improvements to the network offered in the James Bay region."
– Gilles Bélanger, Member for Orford and Parliamentary Assistant to the Quebec Minister of Economy and Innovation (economy and high-speed Internet)
"In the pursuit of our goal of providing Internet access to all, every new business and home served by reliable broadband Internet service is a victory. I am very pleased to see these investments finally taking shape for communities in the Nord-du-Québec region. For our government, it is essential to ensure effective access to communication networks in remote areas. This news will have a direct influence on the daily lives of many of our fellow citizens."
– Pierre Dufour, Quebec Minister of Forests, Wildlife and Parks and Minister responsible for the Abitibi-Témiscamingue region and the Nord-du-Québec region
"This project proceeded smoothly through exemplary collaboration with the Eeyou Communications Network, a non-profit organization that brings together the region's Cree and non-Aboriginal communities. The secure and sustainable network infrastructure will make it possible to provide better high-speed Internet access to communities of the James Bay region. I am convinced that this development will contribute to the vitality of our communities and to the growth of the economy of the Nord-du-Québec region."
– Denis Lamothe, Member for Ungava, Parliamentary Assistant to Quebec's Minister Responsible for Indigenous Affairs and Parliamentary Assistant to the Minister of Forests, Wildlife and Parks (wildlife and parks)
"The implementation of a powerful Internet network is a real challenge in northern Quebec because of the remoteness of the major centres and the size of the territory. However, access to digital technologies is essential to the development and vitality of northern communities. That is why the Plan Nord Corporation was involved in the financing of this major project. We thank the Eeyou Communications Network which has, once again, been able to carry out this initiative."
– Jonatan Julien, Quebec Minister of Energy and Natural Resources and Minister responsible for the Côte-Nord Region
Quick facts
-
On November 9, the Government of Canada launched the Universal Broadband Fund (UBF). This investment of $1.75 billion will help connect the regions of Quebec to high-speed Internet, faster.
-
Through UBF investment, the federal government has taken immediate action by launching a $150 million Rapid Response Stream to fund shovel-ready projects that can bring high-speed Internet to communities within the next 12 months.
-
The Government of Canada has also entered into a $600 million agreement to secure high-speed Internet access for Canada's most remote areas—including the Far North—through Telesat's low Earth orbit satellite constellation.
-
The Connect to Innovate program aims to improve high-speed Internet service in rural and remote communities across Canada.
-
The Québec broadband program was launched in 2019. It has three streams:
Associated links
Stay connected
Follow Innovation, Science and Economic Development Canada on Twitter: @ISED_CA
Follow Canada Economic Development for Quebec Regions on Twitter: @CanEconDev
Follow the Ministry of Economy and Innovation on social media:
Twitter: twitter.com/economie_quebec
Facebook: www.facebook.com/EconomieQc
LinkedIn: www.linkedin.com/company/économie-québec
YouTube: www.youtube.com/user/MDEIEQuebec
SOURCE Innovation, Science and Economic Development Canada


View original content: http://www.newswire.ca/en/releases/archive/November2020/24/c1915.html
VANCOUVER, British Columbia, Nov. 24, 2020 (GLOBE NEWSWIRE) — Aben Resources Ltd. (TSX-V: ABN) (OTCQB: ABNAF) (Frankfurt: E2L2) (“Aben” or “the Company”) announces that the Company’s Board of Directors has approved the amendment of certain common share purchase warrants (the “Warrants”), that were issued by way of private placement, by extending the expiry date one additional year.
The Warrants affected are 8,560,000 share purchase warrants issued on June 29, 2017 with an expiry date of December 29, 2020 and exercisable at $0.15 per common share. The new expiry date will be December 29, 2021 and the exercise price shall remain the same. The Company will not be sending out new warrant certificates unless requested by the holder. The warrant amendment remains subject to the approval of the TSX Venture Exchange.
Aben also announced the appointment of Simon Dyakowski as a director of the company. Mr. Dyakowski is currently CEO of Aztec Minerals Corp. and GSP Resource Corp., both TSXV-listed mineral exploration companies.
About Aben Resources:
Aben Resources is a Canadian gold exploration company developing gold-focused projects in British Columbia and the Yukon Territory. Aben is a well-funded junior exploration company.
Forrest Kerr Gold Project, Golden Triangle, BC claims map:
https://abenresources.com/site/assets/files/4087/abn_forrest_kerr_project_map.pdf
For further information on Aben Resources Ltd. (TSX-V: ABN), visit our Company’s web site at www.abenresources.com.
ABEN RESOURCES LTD.
“Jim Pettit”
______________________
JAMES G. PETTIT
President & CEO
For further information contact:
Aben Resources Ltd.
Telephone: 604-687-3376
Toll Free: 800-567-8181
Facsimile: 604-687-3119
Email: info@abenresources.com
Neither TSX Venture Exchange nor its Regulation Services Provider (as that term is defined in the policies of the TSX Venture Exchange) accepts responsibility for the adequacy or accuracy of this release.
This release includes certain statements that may be deemed to be "forward-looking statements". All statements in this release, other than statements of historical facts, that address events or developments that management of the Company expects, are forward-looking statements. Although management believes the expectations expressed in such forward-looking statements are based on reasonable assumptions, such statements are not guarantees of future performance, and actual results or developments may differ materially from those in the forward-looking statements. The Company undertakes no obligation to update these forward-looking statements if management's beliefs, estimates or opinions, or other factors, should change. Factors that could cause actual results to differ materially from those in forward-looking statements, include market prices, exploration and development successes, continued availability of capital and financing, and general economic, market or business conditions. Please see the public filings of the Company at www.sedar.com for further information.
Long term investing can be life changing when you buy and hold the truly great businesses. While the best companies are hard to find, but they can generate massive returns over long periods. Don't believe it? Then look at the Mincor Resources NL (ASX:MCR) share price. It's 318% higher than it was five years ago. If that doesn't get you thinking about long term investing, we don't know what will. On top of that, the share price is up 36% in about a quarter.
Check out our latest analysis for Mincor Resources
Because Mincor Resources made a loss in the last twelve months, we think the market is probably more focussed on revenue and revenue growth, at least for now. Shareholders of unprofitable companies usually expect strong revenue growth. As you can imagine, fast revenue growth, when maintained, often leads to fast profit growth.
In the last 5 years Mincor Resources saw its revenue shrink by 11% per year. This is in stark contrast to the strong share price growth of 33%, compound, per year. Obviously, whatever the market is excited about, it's not a track record of revenue growth. At the risk of upsetting holders, this does suggest that hope for a better future is playing a significant role in the share price action.
The graphic below depicts how earnings and revenue have changed over time (unveil the exact values by clicking on the image).

It's probably worth noting we've seen significant insider buying in the last quarter, which we consider a positive. That said, we think earnings and revenue growth trends are even more important factors to consider. So it makes a lot of sense to check out what analysts think Mincor Resources will earn in the future (free profit forecasts).
A Different Perspective
It's nice to see that Mincor Resources shareholders have received a total shareholder return of 65% over the last year. That's better than the annualised return of 33% over half a decade, implying that the company is doing better recently. Someone with an optimistic perspective could view the recent improvement in TSR as indicating that the business itself is getting better with time. I find it very interesting to look at share price over the long term as a proxy for business performance. But to truly gain insight, we need to consider other information, too. Like risks, for instance. Every company has them, and we've spotted 2 warning signs for Mincor Resources (of which 1 shouldn't be ignored!) you should know about.
Mincor Resources is not the only stock that insiders are buying. For those who like to find winning investments this free list of growing companies with recent insider purchasing, could be just the ticket.
Please note, the market returns quoted in this article reflect the market weighted average returns of stocks that currently trade on AU exchanges.
This article by Simply Wall St is general in nature. It does not constitute a recommendation to buy or sell any stock, and does not take account of your objectives, or your financial situation. We aim to bring you long-term focused analysis driven by fundamental data. Note that our analysis may not factor in the latest price-sensitive company announcements or qualitative material. Simply Wall St has no position in any stocks mentioned.
Have feedback on this article? Concerned about the content? Get in touch with us directly. Alternatively, email editorial-team@simplywallst.com.
THUNDER BAY, Ontario, Nov. 20, 2020 (GLOBE NEWSWIRE) — MetalCorp Limited (“MetalCorp”) (TSXV – MTC) is pleased to announce that it has entered into an earn-in agreement (the “Earn-In Agreement”) with Barrick Gold Inc. (“Barrick”), a wholly-owned subsidiary of Barrick Gold Corporation, relating to MetalCorp’s Hemlo East gold property (the “Hemlo East Property”) located about 350 kilometers east of Thunder Bay, Ontario. Barrick is currently operating the Williams and David Bell Gold Mines which are adjacent to the Hemlo East Property. Over 21 million ounces of gold have been produced to date from the Hemlo gold deposits. The Earn-In Agreement is subject to acceptance by the TSX Venture Exchange.
“We are pleased to enter into this agreement with Barrick and look forward to our joint venture with them,” commented Donald Sheldon, the Chief Executive Officer of MetalCorp. “Our shareholders recognize the value of the Hemlo East property and we have always believed in the potential it represents for creating value for their investment. We believe that in Barrick we have secured the right joint venture party to move this project forward.”
The Earn-In Agreement provides that Barrick has the right and option to earn an 80% interest in the Hemlo East Property upon satisfaction of the following conditions:
|
(a) |
Barrick paying Cdn$3,000,000 (the “Initial Payment”) to MetalCorp on or before the third business day following TSX Venture Exchange acceptance of the Earn-In Agreement (the date of such payment being the “Initial Payment Date”); |
|
(b) |
Barrick funding expenditures on the Hemlo East Property as follows: (A) at least Cdn$700,000 (the “Guaranteed Amount”) on or before the first anniversary of the Initial Payment Date; and (B) at least Cdn$4,500,000 (including the Guaranteed Amount) on or before the third anniversary of the Initial Payment Date; and |
|
(c) |
Barrick delivering a National Instrument 43-101 technical report in respect of the Hemlo East Property on or before the third anniversary of the Initial Payment Date. |
During the earn-in period, Barrick will be the operator of the Hemlo East Property and will manage and execute all exploration programs and spending on the Hemlo East Property.
Barrick may withdraw from the earn-in at any time, provided it has paid to MetalCorp the Cdn$3,000,000 Initial Payment and fulfilled its obligation to fund the Cdn$700,000 Guaranteed Amount of expenditures on the Hemlo East Property.
After completion of the earn-in, Barrick and MetalCorp will form a joint venture company (“JVCo”), to hold the Hemlo East Property, to be owned 80% by Barrick and 20% by MetalCorp with funding on a pro-rata basis. Dilution of a shareholder’s interest below 10% will result in the conversion of the interest to a 2% Net Smelter Return royalty. The party holding a majority of shares will be the operator of the JVCo.
METALCORP
MetalCorp is a mineral exploration company based in Thunder Bay, Ontario, with gold, PGE and base metal projects in the Canadian Shield of Northern Ontario, Canada, one of the most prolific mineral districts in the world. To find out more about MetalCorp visit its website at www.metalcorp.ca.
|
For further information, please contact: |
|
|
Pierre Gagné, Director |
|
|
Phone: (807) 626-3621 |
|
Caution Regarding Forward-Looking Information
Except for statements of historical fact contained herein, information in this press release may constitute "forward-looking information" within the meaning of Canadian securities laws. Other than statements of historical fact, all statements herein that involve various known and unknown risks, uncertainties and other factors are "forward-looking information" (such forward-looking information includes, without limitation, statements regarding TSX Venture Exchange acceptance of the Earn-In Agreement and completion of the earn-in and formation of JVCo). There can be no assurance that such statements will prove accurate. Results and future events could differ materially from those anticipated in such statements. Factors that could cause actual results or events to differ materially from current expectations include, among other things, failure to obtain TSX Venture Exchange acceptance of the Earn-In Agreement. Readers of this news release are cautioned not to place undue reliance on these "forward-looking statements". Except as otherwise required by applicable securities statutes or regulation, MetalCorp expressly disclaims any intention or obligation to update publicly any forward-looking information, whether as a result of new information, future events or otherwise.
Neither TSX Venture Exchange nor its Regulation Services Provider (as that term is defined in policies of the TSX Venture Exchange) accepts responsibility for the adequacy, accuracy or contents of this news release.
VANCOUVER, BC / ACCESSWIRE / November 19, 2020 / Belmont Resources Ltd. (TSXV:BEA)(FRA:L3L2)is pleased to announce that results from the recently completed Volterra 3D-IP survey on the company's A-J gold property have been received and interpreted. These results have identified several strong anomalies that are slated for drill testing.

A-J Mines & Mineralized Trends
During 2020, the company acquired the A-J project, compiled historic data, and carried out systematic exploration to advance the project to its current drill-ready stage. A Lidar survey was flown, as well as a drone-based magnetic survey, before conducting the recent 3DIP survey. The IP survey consisted of 100 m spaced lines ranging from 600 – 900 m in length which straddled the zones of known mineralization on the property. The results from detailed geological mapping on the property and the recently completed drone magnetic survey and Lidar data have been used to interpret the 3DIP results and to identify and prioritize targets for drilling in late 2020 or early 2021.
The important 1 km long by 200 m wide zone of listwanite, which hosts all of the known zones of gold mineralization on the property, is defined by a strong resistivity anomaly. The resistivity high anomaly is interpreted as representing silica altered rock which includes quartz veining and listwanite.

A-J Trend 3DIP Resistivity Cross Section
The resistivity anomaly is underlain at depth by a strong chargeability anomaly, measuring 800 x 1000 m and lies approximately 300m below the A-J mineralized trend and Athelstan and Jackpot mines which collectively produced 7,000 ozs Au & 9,000 ozs Ag (Minfile 082ESE047). The A-J Mine Group was one of the most productive gold mines in the area.

A-J Trend Chargeability Cross Section
On surface, disseminated sulfides occur within dykes and tongues of altered porphyritic intrusive that both cut and underlie the north-dipping band of listwanite. The large chargeability anomaly may reflect important mineralization within a large intrusive body and could be the causative source of mineralization at surface.
Historic diamond drilling on the A-J property (1981, 1987, 1991) were primarily very shallow holes. The chargeability anomaly is untested by previous drilling on the property, as are the high-priority portions of the resistivity anomaly.
Consulting Geologist Linda Caron, M.Sc., P.Eng, commented "I am so pleased with the systematic exploration work that Belmont is conducting on the A-J property and how this new information is aiding in our interpretation of gold mineralization on the project. There are many historic exploration pits and workings exposed on surface, but historical exploration on the property has failed to trace this mineralization to depth. Belmont's IP survey has now identified a strong chargeability anomaly, at depth below the surface mineralization. This area has not been previously drilled, and may indicate the larger source body of mineralization that we're searching for."
Consulting Geophysicist Sergio Espinosa, Ph.D., P.Geo, commented "What is notable are the coinciding and relatively high anomalous values of both resistivity and chargeability. These anomalies appear to be related to favourable geological conditions making them very compelling drill targets for an upcoming drill program."
George Sookochoff, President & CEO commented "2020 has been a very busy year for the Belmont team. I am extremely pleased with the amount work we have accomplished in a very short period of time. With each exploration program we have gained more confidence that our upcoming drill program will be successful in delineating the source of the extensive gold mineralization at surface".
The Company is awaiting approval of a 5-year area-based drill permit application.
Listwanite
Known gold mineralization on the property is primarily hosted within listwanite. High-grade, coarse native lode gold in the North American Cordillera is characteristically found in quartz veins hosted by listwanite-altered, igneous ophiolitic crustal rocks in proximity to listwanite-altered ultramafic rocks.
Listwanite is directly associated with several multi-million ounce gold deposits in Atlin, Bralorne and Barkerville districts of British Columbia as well as the Motherlode Gold District in California.
About Belmont Resources Inc.
Belmont Resources is a junior mining company engaged in the business of acquiring past producing gold-copper mineral properties located in the highly prospective Greenwood-Republic mining camps. Belmont is utilizing new exploration technology as well as new geological modelling to identify gold-copper mineralized feeder systems to the relatively shallow historic mines.
The Company's project portfolio includes:
– Athelstan & Jackpot Gold mines (Athelstan-Jackpot property – 100%)
– Bertha & Pathfinder Gold-Silver mines (Pathfinder property – 100%).
– Betts Copper-Gold mine (Come By Chance property – 100%)
– Lone Star Copper-Gold mine (Lone Star Property – LOI)

Qualified Person
Linda Caron, M.Sc., P.Eng. is the qualified person under National Instrument 43-101 who as reviewed and approved the technical content of this news release.
ON BEHALF OF THE BOARD OF DIRECTORS
"George Sookochoff"
George Sookochoff, CEO/President
Neither the TSX Venture Exchange nor its Regulation Services Provider (as the term is defined in the policies of the TSX Venture Exchange) accepts responsibility for the adequacy or accuracy of this news release.
This Press Release may contain forward-looking statements that may involve a number of risks and uncertainties, based on assumptions and judgments of management regarding future events or results that may prove to be inaccurate as a result of exploration and other risk factors beyond its control. Forward looking statements in this news release include statements about the possible raising of capital and exploration of our properties. Actual events or results could differ materially from the Companies forward-looking statements and expectations. These risks and uncertainties include, among other things, that we may not be able to obtain regulatory approval; that we may not be able to raise funds required, that conditions to closing may not be fulfilled and we may not be able to organize and carry out an exploration program in 2020, and other risks associated with being a mineral exploration and development company. These forward-looking statements are made as of the date of this news release and, except as required by applicable laws, the Company assumes no obligation to update these forward-looking statements, or to update the reasons why actual results differed from those projected in the forward-looking statements.
SOURCE: Belmont Resources Inc.
View source version on accesswire.com:
https://www.accesswire.com/617511/Belmont-3DIP-Survey-Identifies-Strong-Chargeability-Resistivity-Anomalies-Beneath-Athelstan-and-Jackpot-Gold-Mines
We've lost count of how many times insiders have accumulated shares in a company that goes on to improve markedly. On the other hand, we'd be remiss not to mention that insider sales have been known to precede tough periods for a business. So before you buy or sell Silver City Minerals Limited (ASX:SCI), you may well want to know whether insiders have been buying or selling.
What Is Insider Selling?
It's quite normal to see company insiders, such as board members, trading in company stock, from time to time. However, such insiders must disclose their trading activities, and not trade on inside information.
We would never suggest that investors should base their decisions solely on what the directors of a company have been doing. But logic dictates you should pay some attention to whether insiders are buying or selling shares. For example, a Columbia University study found that 'insiders are more likely to engage in open market purchases of their own company’s stock when the firm is about to reveal new agreements with customers and suppliers'.
Check out our latest analysis for Silver City Minerals
Silver City Minerals Insider Transactions Over The Last Year
In the last twelve months, the biggest single purchase by an insider was when insider John Gaffney bought AU$486k worth of shares at a price of AU$0.016 per share. So it's clear an insider wanted to buy, at around the current price, which is AU$0.018. While their view may have changed since the purchase was made, this does at least suggest they have had confidence in the company's future. We do always like to see insider buying, but it is worth noting if those purchases were made at well below today's share price, as the discount to value may have narrowed with the rising price. The good news for Silver City Minerals share holders is that insiders were buying at near the current price.
Silver City Minerals insiders may have bought shares in the last year, but they didn't sell any. Their average price was about AU$0.013. To my mind it is good that insiders have invested their own money in the company. However, you should keep in mind that they bought when the share price was meaningfully below today's levels. You can see a visual depiction of insider transactions (by companies and individuals) over the last 12 months, below. If you click on the chart, you can see all the individual transactions, including the share price, individual, and the date!

There are plenty of other companies that have insiders buying up shares. You probably do not want to miss this free list of growing companies that insiders are buying.
Insider Ownership
Another way to test the alignment between the leaders of a company and other shareholders is to look at how many shares they own. Usually, the higher the insider ownership, the more likely it is that insiders will be incentivised to build the company for the long term. Insiders own 25% of Silver City Minerals shares, worth about AU$2.1m. While this is a strong but not outstanding level of insider ownership, it's enough to indicate some alignment between management and smaller shareholders.
So What Does This Data Suggest About Silver City Minerals Insiders?
There haven't been any insider transactions in the last three months — that doesn't mean much. However, our analysis of transactions over the last year is heartening. Insiders own shares in Silver City Minerals and we see no evidence to suggest they are worried about the future. So while it's helpful to know what insiders are doing in terms of buying or selling, it's also helpful to know the risks that a particular company is facing. To assist with this, we've discovered 3 warning signs that you should run your eye over to get a better picture of Silver City Minerals.
But note: Silver City Minerals may not be the best stock to buy. So take a peek at this free list of interesting companies with high ROE and low debt.
For the purposes of this article, insiders are those individuals who report their transactions to the relevant regulatory body. We currently account for open market transactions and private dispositions, but not derivative transactions.
This article by Simply Wall St is general in nature. It does not constitute a recommendation to buy or sell any stock, and does not take account of your objectives, or your financial situation. We aim to bring you long-term focused analysis driven by fundamental data. Note that our analysis may not factor in the latest price-sensitive company announcements or qualitative material. Simply Wall St has no position in any stocks mentioned.
Have feedback on this article? Concerned about the content? Get in touch with us directly. Alternatively, email editorial-team@simplywallst.com.
James Earle became the CEO of Nagambie Resources Limited (ASX:NAG) in 2016, and we think it's a good time to look at the executive's compensation against the backdrop of overall company performance. This analysis will also assess whether Nagambie Resources pays its CEO appropriately, considering recent earnings growth and total shareholder returns.
See our latest analysis for Nagambie Resources
Comparing Nagambie Resources Limited's CEO Compensation With the industry
According to our data, Nagambie Resources Limited has a market capitalization of AU$25m, and paid its CEO total annual compensation worth AU$276k over the year to June 2020. We note that's a decrease of 19% compared to last year. Notably, the salary which is AU$200.0k, represents most of the total compensation being paid.
On comparing similar-sized companies in the industry with market capitalizations below AU$276m, we found that the median total CEO compensation was AU$311k. So it looks like Nagambie Resources compensates James Earle in line with the median for the industry.
|
Component |
2020 |
2019 |
Proportion (2020) |
|
Salary |
AU$200k |
AU$172k |
72% |
|
Other |
AU$76k |
AU$170k |
28% |
|
Total Compensation |
AU$276k |
AU$342k |
100% |
Talking in terms of the industry, salary represented approximately 70% of total compensation out of all the companies we analyzed, while other remuneration made up 30% of the pie. Although there is a difference in how total compensation is set, Nagambie Resources more or less reflects the market in terms of setting the salary. If total compensation veers towards salary, it suggests that the variable portion – which is generally tied to performance, is lower.

Nagambie Resources Limited's Growth
Over the past three years, Nagambie Resources Limited has seen its earnings per share (EPS) grow by 26% per year. Its revenue is down 6.8% over the previous year.
Overall this is a positive result for shareholders, showing that the company has improved in recent years. While it would be good to see revenue growth, profits matter more in the end. We don't have analyst forecasts, but you could get a better understanding of its growth by checking out this more detailed historical graph of earnings, revenue and cash flow.
Has Nagambie Resources Limited Been A Good Investment?
Since shareholders would have lost about 12% over three years, some Nagambie Resources Limited investors would surely be feeling negative emotions. So shareholders would probably want the company to be lessto generous with CEO compensation.
In Summary…
As we touched on above, Nagambie Resources Limited is currently paying a compensation that's close to the median pay for CEOs of companies belonging to the same industry and with similar market capitalizations. At the same time, the company has logged negative shareholder returns over the last three years. But EPS growth is moving in a favorable direction, certainly a positive sign. Overall, we wouldn't say James is paid an unjustified compensation, but shareholders might not favor a raise before shareholder returns show a positive trend.
It is always advisable to analyse CEO pay, along with performing a thorough analysis of the company's key performance areas. We identified 5 warning signs for Nagambie Resources (2 make us uncomfortable!) that you should be aware of before investing here.
Arguably, business quality is much more important than CEO compensation levels. So check out this free list of interesting companies that have HIGH return on equity and low debt.
This article by Simply Wall St is general in nature. It does not constitute a recommendation to buy or sell any stock, and does not take account of your objectives, or your financial situation. We aim to bring you long-term focused analysis driven by fundamental data. Note that our analysis may not factor in the latest price-sensitive company announcements or qualitative material. Simply Wall St has no position in any stocks mentioned.
Have feedback on this article? Concerned about the content? Get in touch with us directly. Alternatively, email editorial-team@simplywallst.com.

This article will reflect on the compensation paid to Mick Clifford who has served as CEO of Zenith Minerals Limited (ASX:ZNC) since 2014. This analysis will also look to assess whether the CEO is appropriately paid, considering recent earnings growth and investor returns for Zenith Minerals.
See our latest analysis for Zenith Minerals
How Does Total Compensation For Mick Clifford Compare With Other Companies In The Industry?
Our data indicates that Zenith Minerals Limited has a market capitalization of AU$44m, and total annual CEO compensation was reported as AU$265k for the year to June 2020. We note that's a decrease of 10% compared to last year. Notably, the salary which is AU$211.7k, represents most of the total compensation being paid.
In comparison with other companies in the industry with market capitalizations under AU$275m, the reported median total CEO compensation was AU$311k. So it looks like Zenith Minerals compensates Mick Clifford in line with the median for the industry. What's more, Mick Clifford holds AU$91k worth of shares in the company in their own name.
|
Component |
2020 |
2019 |
Proportion (2020) |
|
Salary |
AU$212k |
AU$233k |
80% |
|
Other |
AU$53k |
AU$63k |
20% |
|
Total Compensation |
AU$265k |
AU$296k |
100% |
On an industry level, around 70% of total compensation represents salary and 30% is other remuneration. It's interesting to note that Zenith Minerals pays out a greater portion of remuneration through salary, compared to the industry. If salary is the major component in total compensation, it suggests that the CEO receives a higher fixed proportion of the total compensation, regardless of performance.

A Look at Zenith Minerals Limited's Growth Numbers
Over the past three years, Zenith Minerals Limited has seen its earnings per share (EPS) grow by 26% per year. It achieved revenue growth of 27% over the last year.
Overall this is a positive result for shareholders, showing that the company has improved in recent years. It's great to see that revenue growth is strong, too. These metrics suggest the business is growing strongly. While we don't have analyst forecasts for the company, shareholders might want to examine this detailed historical graph of earnings, revenue and cash flow.
Has Zenith Minerals Limited Been A Good Investment?
With a total shareholder return of 15% over three years, Zenith Minerals Limited shareholders would, in general, be reasonably content. But they would probably prefer not to see CEO compensation far in excess of the median.
To Conclude…
As previously discussed, Mick is compensated close to the median for companies of its size, and which belong to the same industry. But EPS growth for the company has been strong over the last three years, though shareholder returns in comparison haven't been as impressive. So considering these factors, we think the compensation is probably quite reasonable, but investor returns need a boost moving forward.
We can learn a lot about a company by studying its CEO compensation trends, along with looking at other aspects of the business. That's why we did our research, and identified 4 warning signs for Zenith Minerals (of which 1 shouldn't be ignored!) that you should know about in order to have a holistic understanding of the stock.
Of course, you might find a fantastic investment by looking at a different set of stocks. So take a peek at this free list of interesting companies.
This article by Simply Wall St is general in nature. It does not constitute a recommendation to buy or sell any stock, and does not take account of your objectives, or your financial situation. We aim to bring you long-term focused analysis driven by fundamental data. Note that our analysis may not factor in the latest price-sensitive company announcements or qualitative material. Simply Wall St has no position in any stocks mentioned.
Have feedback on this article? Concerned about the content? Get in touch with us directly. Alternatively, email editorial-team@simplywallst.com.
Aurora Geosciences retained to prepare more detailed interpretation report with drill targets
Fortune Minerals Limited (TSX: FT) (OTCQB: FTMDF) ("Fortune" or the "Company") (www.fortuneminerals.com) is pleased to report that Aurora Geosciences Ltd. ("Aurora") has completed the previously announced induced polarization ("I.P.") and ground magnetometer geophysical surveys along the projected east extension of the NICO Gold-Cobalt-Bismuth-Copper Deposit ("NICO Deposit") in Canada’s Northwest Territories. The surveys were successful in outlining several large areas of coincident chargeability and magnetic high response with low electrical resistivity indicative of near-surface magnetic and conductive sources. Fortune has retained Aurora to complete a more detailed interpretation of the survey results with three-dimensional ("3-D") modelling of the combined anomalies based on the property geology and the Company’s historical geophysical and LiDar databases. The report deliverables will include recommendations for drill testing of the identified anomalies with specified collar locations and targeting information.
This press release features multimedia. View the full release here: https://www.businesswire.com/news/home/20201112005579/en/

Fortune Minerals Limited Apparent Resistivity Map (Photo: Business Wire)
Like our news? Click-to-Tweet.
Aurora completed the ground magnetometer and I.P. surveys on the NICO property in late September and a field report was delivered at the end of October. The results include a kilometer-long area of coincident magnetic, chargeability and resistivity anomalies extending southeast from the presently defined east end of the NICO Deposit. This is an area where there are block faults with vertical and horizontal displacement of the geology. Only limited drilling was carried out in this in this area, but a hole completed in 1997 intersected 3 metres, grading 1.1 grams of per tonne ("g/t") gold. The geophysics and drill-hole data indicate the east end of the NICO Deposit may be open for possible expansion.
The previously disclosed Peanut Lake anomaly (see Fortune news release, dated September 2, 2020) was also delineated by Aurora with partly overlapping magnetic, chargeability and resistivity anomalies ranging from 400 to 600 metres wide. These anomalies coincide with gravity and magnetic anomalies identified in earlier geophysical surveys for Fortune as well as 3-D inversion modelling of a combined magnetic, gravity and magnetotelluric anomaly by the Geological Survey of Canada. Three holes drilled in this area in 1997 also intersected mineralization similar to the NICO Deposit with grades of 1.11 g/t gold and 0.355% cobalt, 1.16 g/t gold and 0.06% cobalt, 1.52 g/t gold and 0.05% cobalt – each over 3 metre core lengths. The Peanut Lake anomaly aligns with the southeast fault projected extension of the NICO Deposit stratigraphy. The geophysical results and the aforesaid drill intersections, located 800 metres southeast of the currently defined east terminus of the deposit, indicate that the deposit may continue in this direction.
The Aurora geophysical surveys also identified a new area of previously unrecognized combined magnetic and chargeability high anomalies with corresponding low resistivity located approximately 200 metres northeast of the east end of the NICO Deposit. The anomalies extend 700 metres east to NICO Lake where they remain open for possible expansion beneath the water. Additional smaller anomalies were also discovered in the surveys.
The NICO Deposit is an IOCG-type ore deposit with age and geological features common to very large global analogues, including the ‘super giant’ Olympic Dam mine in South Australia, and support the blue-sky exploration potential. NICO is uniquely positioned as one of the few advanced cobalt development assets globally with Proven and Probable Open Pit and Underground Mineral Reserves totaling 33 million tonnes containing 1.1 million ounces of gold, 82.3 million pounds of cobalt, 102.1 million pounds of bismuth, and 27.2 million pounds of copper. The expansion potential is important as leading western economies work to diversify their sources of critical minerals. Cobalt and bismuth are both identified by the U.S. and European Union as Critical Minerals. Critical Minerals have essential use in important manufacturing and defense industries, cannot be easily substituted by other minerals, and their supply chains are threatened by geographic concentration of production and/or geopolitical risks with the current sources of supply. Canada and the U.S. have announced a joint action plan on Critical Mineral supply to help develop more North American production of these raw materials needed to support the growth of new technologies. The NICO Deposit also stands out among other Critical Mineral and cobalt development projects with a million ounce in-situ gold co-product.
For more detailed information about the NICO Mineral Reserves and certain technical information in this news release, please refer to the Technical Report on the NICO Project, entitled "Technical Report on the Feasibility Study for the NICO-Gold-Cobalt-Bismuth-Copper Project, Northwest Territories, Canada", dated April 2, 2014 and prepared by Micon International Limited which has been filed on SEDAR and is available under the Company's profile at www.sedar.com. The disclosure of scientific and technical information contained in this news release has been approved by Robin Goad, M.Sc., P.Geo., President and Chief Executive Officer of Fortune who is a "Qualified Person" under National Instrument 43-101.
About Fortune Minerals:
Fortune is a Canadian mining company focused on developing the NICO Gold-Cobalt-Bismuth-Copper Project in the Northwest Territories. The Company has an option to purchase lands in Saskatchewan where it may build the hydrometallurgical plant to process NICO metal concentrates. Fortune also owns the satellite Sue-Dianne Copper-Silver-Gold Deposit located 25 km north of the NICO Project, which is a potential future source of incremental mill feed to extend the life of the NICO Project mill.
Follow Fortune Minerals:
Click here to subscribe to Fortune’s email list.
Click here to follow Fortune on LinkedIn.
@FortuneMineral on Twitter.
This press release contains forward-looking information and forward-looking statements within the meaning of applicable securities legislation. This forward-looking information includes statements with respect to, among other things, the potential for expansion of the NICO Deposit, the Company’s plans to develop the NICO Project and the potential for the Sue-Dianne property to provide incremental mill feed to the NICO Project. Forward-looking information is based on the opinions and estimates of management as well as certain assumptions at the date the information is given (including, in respect of the forward-looking information contained in this press release, assumptions regarding: the Company’s ability to secure a site in southern Canada for the construction of a NICO Project refinery; the Company’s ability to arrange the necessary financing to continue operations and develop the NICO Project; the receipt of all necessary regulatory approvals for the construction and operation of the NICO Project and the related hydrometallurgical refinery and the timing thereof; growth in the demand for cobalt; the time required to construct the NICO Project; and the economic environment in which the Company will operate in the future, including the price of gold, cobalt and other by-product metals, anticipated costs and the volumes of metals to be produced at the NICO Project). However, such forward-looking information is subject to a variety of risks and uncertainties and other factors that could cause actual events or results to differ materially from those projected in the forward-looking information. These factors include the risks that further exploration of the Peanut Lake anomaly may not result in a meaningful expansion of the NICO Deposit, the NICO Project may not receive the benefit of any financing under the published initiatives of the United States and European Union with respect to critical minerals or any other benefits therefrom, the Company may not be able to secure a site for the construction of a refinery, the Company may not be able to finance and develop NICO on favourable terms or at all, uncertainties with respect to the receipt or timing of required permits, approvals and agreements for the development of the NICO Project, including the related hydrometallurgical refinery, the construction of the NICO Project may take longer than anticipated, the Company may not be able to secure offtake agreements for the metals to be produced at the NICO Project, the Sue-Dianne Property may not be developed to the point where it can provide mill feed to the NICO Project, the inherent risks involved in the exploration and development of mineral properties and in the mining industry in general, the market for products that use cobalt or bismuth may not grow to the extent anticipated, the future supply of cobalt and bismuth may not be as limited as anticipated, the risk of decreases in the market prices of cobalt, bismuth and other metals to be produced by the NICO Project, discrepancies between actual and estimated Mineral Resources or between actual and estimated metallurgical recoveries, uncertainties associated with estimating Mineral Resources and Reserves and the risk that even if such Mineral Resources prove accurate the risk that such Mineral Resources may not be converted into Mineral Reserves once economic conditions are applied, the Company’s production of cobalt, bismuth and other metals may be less than anticipated and other operational and development risks, market risks and regulatory risks. Readers are cautioned to not place undue reliance on forward-looking information because it is possible that predictions, forecasts, projections and other forms of forward-looking information will not be achieved by the Company. The forward-looking information contained herein is made as of the date hereof and the Company assumes no responsibility to update or revise it to reflect new events or circumstances, except as required by law.
View source version on businesswire.com: https://www.businesswire.com/news/home/20201112005579/en/
Contacts
For further information please contact:
Fortune Minerals Limited
Troy Nazarewicz
Investor Relations Manager
info@fortuneminerals.com
Tel.: (519) 858-8188
www.fortuneminerals.com
VANCOUVER, BC / ACCESSWIRE / November 12, 2020 / Belmont Resources Ltd. (TSXV:BEA)(FRA:L3L2) is pleased to report that it has received results from SJ Geophysic's 3DIP survey on the Athelstan-Jackpot (A-J) gold project in the prolific Greenwood mining district of southern British Columbia.
The 3DIP data is currently being reviewed by Belmont's consulting geophysicist Sergio Espenoza, PhD. along with consulting geologist Linda Caron, M.Sc., P.Eng.
The IP results are being correlated with detailed geological mapping on the property and the recently completed drone magnetic survey and will identify and prioritize drill targets. Belmont is currently awaiting approval of a 5 year work program permit application which will enable it to proceed with drilling scheduled for year-end or early 2021.
3DIP results are expected to be announced early next week.
The 3DIP survey covered primarily two mineralized gold zones.
East-West A-J Mineralized Gold Trend

A-J IP Survey Grid over Geology
This mineralized trend includes the two past producing Athelstan and Jackpot gold mines which collectively produced 7,000 ozs Au & 9,000 ozs Ag (Minfile 082ESE047). The two mines and at least 9 known gold mineralized zones extending over an approximate area of 240 by 1,000 metres are associated with listwanite. The A-J Group was one of the most productive gold mines in the area.
North-South Contact Mineralized Gold Trend
Listwanite-hosted gold-bearing massive sulfide mineralization occurs at the J-34 zone, 50 m east of a granodiorite intrusive contact which is interpreted to underlie the shallow north-dipping band of listwanite that hosts the near surface mineralization in this area.
In 2003, trenching was completed at the J-34 zone by a previous operator, with historic chip samples returning grades of 6.6 g/t Au over a 3.7 m true thickness in one area, and 1.9 g/t Au over 6.8 m true thickness in a second area.1
Listwanite
Known gold mineralization on the property is primarily hosted within listwanite. High-grade, coarse native lode gold in the North American Cordillera is characteristically found in quartz veins hosted by listwanite-altered, igneous ophiolitic crustal rocks in proximity to listwanite-altered ultramafic rocks.
Listwanite is directly associated with several multi-million ounce gold deposits in Atlin, Bralorne and Barkerville districts of British Columbia as well as the Motherlode District in California.
About Belmont Resources Inc.
Belmont Resources is engaged in acquiring and re-developing past producing gold-silver-copper mines located in the highly prospective Greenwood-Republic mining camps.
The Company's project portfolio includes:
-
Athelstan & Jackpot Gold mines (Athelstan-Jackpot property – 100%)
-
Bertha & Pathfinder Gold-Silver mines (Pathfinder property – 100%).
-
Betts Copper-Gold mine (Come By Chance property – 100%)
-
Lone Star Copper-Gold mine (Lone Star Property – LOI)
Qualified Person
Linda Caron, M.Sc., P.Eng. is the qualified person under National Instrument 43-101 who as reviewed and approved the technical content of this news release.

ON BEHALF OF THE BOARD OF DIRECTORS
"George Sookochoff"
George Sookochoff, CEO/President
Ph: 604-683-6648
Email: george@belmontresources.com
Website: www.BelmontResources.com
Neither the TSX Venture Exchange nor its Regulation Services Provider (as the term is defined in the policies of the TSX Venture Exchange) accepts responsibility for the adequacy or accuracy of this news release.
This Press Release may contain forward-looking statements that may involve a number of risks and uncertainties, based on assumptions and judgments of management regarding future events or results that may prove to be inaccurate as a result of exploration and other risk factors beyond its control. Forward looking statements in this news release include statements about the possible raising of capital and exploration of our properties. Actual events or results could differ materially from the Companies forward-looking statements and expectations. These risks and uncertainties include, among other things, that we may not be able to obtain regulatory approval; that we may not be able to raise funds required, that conditions to closing may not be fulfilled and we may not be able to organize and carry out an exploration program in 2020, and other risks associated with being a mineral exploration and development company. These forward-looking statements are made as of the date of this news release and, except as required by applicable laws, the Company assumes no obligation to update these forward-looking statements, or to update the reasons why actual results differed from those projected in the forward-looking statements.
1 Caron, L., 2003. Assessment Report on the Athelstan-Jackpot Property, Trenching and Rock Sampling, for M. Hallauer and T. Hallauer. BC MEMPR Assessment Report 27302.
SOURCE: Belmont Resources Ltd.
View source version on accesswire.com:
https://www.accesswire.com/616514/Belmont-Receives-3DIP-Survey-Results-on-A-J-Lode-Gold-Project-Greenwood-Mining-Camp-Southern-British-Columbia
VANCOUVER, British Columbia, Nov. 11, 2020 (GLOBE NEWSWIRE) — Great Quest Fertilizer Ltd. (TSXV:GQ) (“the Company”) reports that it has terminated its efforts to close the acquisition of Ivoirienne de Noix de Cajou SARL.
As consideration for the termination, the Company will repurchase 5,443,300 of its common shares for a nominal $1 and receive a full and final release from the outstanding remaining convertible debt and any and all other amounts owing to the transaction counterparties.
The Company’s board of directors undertook reasonable investigations and reviewed the alternatives in considering and applying their judgment to approve this transaction. As part of these deliberations, the directors determined that proceeding is fair and reasonable and in the best interests of the Company.
The Company will focus its efforts on its Sanoukou gold properties in Mali and seek strategic alternatives for the Tilemsi Phosphate project.
About Great Quest
Great Quest Fertilizer Ltd. is a Canadian agribusiness company focused on the development of African agricultural mineral projects for local production of farm ready fertilizers. The Company’s flagship asset is the Tilemsi Phosphate Project, encompassing 1,206 km² in northeastern Mali, containing high quality phosphate resources amenable to use as direct application fertilizer. Great Quest is listed on the TSX Venture Exchange under the symbol GQ, and the Frankfurt Stock Exchange under the symbol GQM.
ON BEHALF OF THE BOARD OF DIRECTORS OF GREAT QUEST FERTILIZER LTD.
“Jed Richardson”
President, Chief Executive Officer and Director
Neither the TSX Venture Exchange nor its Regulation Services Provider accepts responsibility for the adequacy or accuracy of this release.
This news release may contain forward-looking statements. These statements include statements regarding the Private Placement, the expected use of proceeds of the Private Placement, the Company’s ability to complete the COB, the resumption of trading of the Company’s shares and the Company’s future plans and objectives. These statements are based on current expectations and assumptions that are subject to risks and uncertainties. Actual results could differ materially because of factors discussed in the management discussion and analysis section of our interim and most recent annual financial statements or other reports and filings with the TSX Venture Exchange and applicable Canadian securities regulations. We do not assume any obligation to update any forward-looking statements, except as required by applicable laws.
This news release does not constitute an offer to sell or a solicitation of an offer to buy any of the securities in the United States. The securities have not been and will not be registered under the United States Securities Act of 1933, as amended (the "U.S. Securities Act") or any state securities laws and may not be offered or sold within the United States or to U.S. Persons unless registered under the U.S. Securities Act and applicable state securities laws or an exemption from such registration is available.
CONTACT: For more information: Please call Jed Richardson at 1-877-325-3838 or email info@greatquest.com
There's no doubt that money can be made by owning shares of unprofitable businesses. For example, although Amazon.com made losses for many years after listing, if you had bought and held the shares since 1999, you would have made a fortune. But while history lauds those rare successes, those that fail are often forgotten; who remembers Pets.com?
So should VRX Silica (ASX:VRX) shareholders be worried about its cash burn? For the purpose of this article, we'll define cash burn as the amount of cash the company is spending each year to fund its growth (also called its negative free cash flow). First, we'll determine its cash runway by comparing its cash burn with its cash reserves.
Check out our latest analysis for VRX Silica
When Might VRX Silica Run Out Of Money?
You can calculate a company's cash runway by dividing the amount of cash it has by the rate at which it is spending that cash. In June 2020, VRX Silica had AU$2.6m in cash, and was debt-free. Looking at the last year, the company burnt through AU$2.8m. That means it had a cash runway of around 11 months as of June 2020. That's quite a short cash runway, indicating the company must either reduce its annual cash burn or replenish its cash. The image below shows how its cash balance has been changing over the last few years.

How Is VRX Silica's Cash Burn Changing Over Time?
Whilst it's great to see that VRX Silica has already begun generating revenue from operations, last year it only produced AU$74k, so we don't think it is generating significant revenue, at this point. As a result, we think it's a bit early to focus on the revenue growth, so we'll limit ourselves to looking at how the cash burn is changing over time. As it happens, the company's cash burn reduced by 13% over the last year, which suggests that management may be mindful of the risks of their depleting cash reserves. Admittedly, we're a bit cautious of VRX Silica due to its lack of significant operating revenues. We prefer most of the stocks on this list of stocks that analysts expect to grow.
How Hard Would It Be For VRX Silica To Raise More Cash For Growth?
Even though it has reduced its cash burn recently, shareholders should still consider how easy it would be for VRX Silica to raise more cash in the future. Issuing new shares, or taking on debt, are the most common ways for a listed company to raise more money for its business. One of the main advantages held by publicly listed companies is that they can sell shares to investors to raise cash and fund growth. We can compare a company's cash burn to its market capitalisation to get a sense for how many new shares a company would have to issue to fund one year's operations.
VRX Silica's cash burn of AU$2.8m is about 3.6% of its AU$78m market capitalisation. That's a low proportion, so we figure the company would be able to raise more cash to fund growth, with a little dilution, or even to simply borrow some money.
So, Should We Worry About VRX Silica's Cash Burn?
Even though its cash runway makes us a little nervous, we are compelled to mention that we thought VRX Silica's cash burn relative to its market cap was relatively promising. While we're the kind of investors who are always a bit concerned about the risks involved with cash burning companies, the metrics we have discussed in this article leave us relatively comfortable about VRX Silica's situation. On another note, VRX Silica has 5 warning signs (and 2 which don't sit too well with us) we think you should know about.
Of course, you might find a fantastic investment by looking elsewhere. So take a peek at this free list of interesting companies, and this list of stocks growth stocks (according to analyst forecasts)
This article by Simply Wall St is general in nature. It does not constitute a recommendation to buy or sell any stock, and does not take account of your objectives, or your financial situation. We aim to bring you long-term focused analysis driven by fundamental data. Note that our analysis may not factor in the latest price-sensitive company announcements or qualitative material. Simply Wall St has no position in any stocks mentioned.
Have feedback on this article? Concerned about the content? Get in touch with us directly. Alternatively, email editorial-team@simplywallst.com.
Vancouver, British Columbia–(Newsfile Corp. – November 6, 2020) – Comstock Metals Ltd. (TSXV: CSL) ("CSL" or the "Company") announces that the shareholders and the board of directors of the Company (the "Board") have approved the previously announced distribution of an aggregate of 1,000,000 common shares of E3 Metals Corp. (TSXV: ETMC) and 1,387,210 common shares of White Gold Corp. (TSXV: WGO) (the "Distribution Shares") to shareholders of the Company. The distribution of the Distribution Shares will be effected as a reduction in the stated capital of the common shares of the Company (the "Return of Capital"). The Return of Capital was approved by shareholders of the Company at the annual general and special meeting held on October 19, 2020 (the "Meeting").
The Return of Capital will be distributed to shareholders pursuant to the TSX Venture Exchange's due bill trading policy. Pursuant to such policy:
-
The record date (the "Record Date") to determine shareholders of CSL entitled to the Return of Capital is November 13, 2020.
-
The due bill trading period will commence on November 12, 2020 (one trading day prior to the Record Date, so that trades settling after the Record Date have due bills attached) and conclude at the close of the Payment Date (as defined below);
-
The payment or distribution date (the "Payment Date") will be November 25, 2020;
-
The ex-distribution date will be November 26, 2020 (the next trading day following the Payment Date, so that trades on and after that date will not have due bills attached); and
-
The due bill redemption date will be November 27, 2020 (the trading day following the ex-distribution date, when all trades with due bills attached have settled).
For clarification, "due bills" will represent the Return of Capital that CSL's shareholders will be entitled to receive. The due bills will be deemed to be attached to CSL's common shares ("Shares") one trading day prior to the Record Date, and will continue to be attached to CSL's Shares until the end of the Payment Date. Accordingly, CSL's Shares will trade on a "due bill" basis from November 12, 2020 until close of trading on November 25, 2020 (the "Due Bill Period"). This means that persons who sell their Shares during the Due Bill Period shall also sell their entitlement to the Return of Capital to the purchasers of such Shares. CSL's Shares will commence trading on an ex-distribution basis (i.e. without an attached "due bill" entitlement to the distribution) from the opening of trading on November 26, 2020 (i.e. the next trading day after the Payment Date). The due bills will be redeemed on November 27, 2020 once all trades with attached due bills entered during the Due Bill Period have settled.
Based on the current issued and outstanding common shares of the Company, shareholders are expected to receive approximately 0.03947 of an E3 Metals Corp. share and 0.05476 of a White Gold Corp. share for each common share of the Company held as of the Record Date. No fractional interests in Distribution Shares will be distributed in connection with the Return of Capital, and any such interests will be rounded down to the nearest whole Distribution Share.
The Distribution Shares have not, and will not, be registered under the United States Securities Act of 1933, as amended. Shareholders do not need to take any action. Computershare Investor Services Inc., the Company's transfer agent, will send to registered shareholders the Distribution Shares representing the return of capital and beneficial shareholders will have their brokerage accounts automatically updated to reflect the Return of Capital.
Eligible shareholders are strongly cautioned to consult with their financial, broker, legal, tax and/or investment advisors regarding any matters pertaining to the Return of Capital and the tax consequences associated therewith.
About Comstock Metals Ltd.
Comstock Metals Ltd. is a diversified mineral exploration company advancing its wholly owned projects located in North America and holds several equity positions in companies with large mineral resources.
-
100% owned Preview SW Gold Project in Saskatchewan (43-101 Resource Stage)
-
Joint Venture and equity investment with E3 Metals Corp. (TSXV: ETMC), a petro-lithium company developing lithium extraction technology in Alberta. (43-101 Resource Stage)
-
Equity investment in White Gold Corp. (TSXV: WGO) developing its portfolio of properties located in the White Gold District of the Yukon (43-101 Resource Stage)
For more information about Comstock Metals Ltd., please visit www.comstock-metals.com or contact:
Steven H. Goldman
President, CEO and Director
COMSTOCK METALS LTD.
Phone: (416) 917-1533
Email: s.goldman@goldmanhine.com
Forward-Looking Statements
Certain statements contained in this press release constitute forward-looking information. These statements relate to future events or future performance. The use of any of the words "could", "intend", "expect", "believe", "will", "projected", "estimated" and similar expressions and statements relating to matters that are not historical facts are intended to identify forward-looking information and are based on the Company's current belief or assumptions as to the outcome and timing of such future events. Actual future results may differ materially. In particular, this release contains forward-looking information relating to, among other things, the record date for the Return of Capital, and completion of the distribution of the Distribution Shares. Various assumptions or factors are typically applied in drawing conclusions or making the forecasts or projections set out in forward-looking information. Those assumptions and factors are based on information currently available to the Company. Although such statements are based on reasonable assumptions of management, there can be no assurance that any conclusions or forecasts will prove to be accurate.
The forward-looking information contained in this release is made as of the date hereof, and the Company is not obligated to update or revise any forward-looking information, whether as a result of new information, future events or otherwise, except as required by applicable securities laws. Because of the risks, uncertainties and assumptions contained herein, investors should not place undue reliance on forward-looking information. The foregoing statements expressly qualify any forward-looking information contained herein.
Neither TSX Venture Exchange nor its Regulation Services Provider (as that term is defined in the policies of the TSX Venture Exchange) accepts responsibility for the adequacy or accuracy of this Release.

To view the source version of this press release, please visit https://www.newsfilecorp.com/release/67605

Peter Williams became the CEO of Aus Tin Mining Limited (ASX:ANW) in 2013, and we think it's a good time to look at the executive's compensation against the backdrop of overall company performance. This analysis will also evaluate the appropriateness of CEO compensation when taking into account the earnings and shareholder returns of the company.
View our latest analysis for Aus Tin Mining
Comparing Aus Tin Mining Limited's CEO Compensation With the industry
Our data indicates that Aus Tin Mining Limited has a market capitalization of AU$3.7m, and total annual CEO compensation was reported as AU$268k for the year to June 2020. We note that's a small decrease of 7.7% on last year. We note that the salary portion, which stands at AU$250.6k constitutes the majority of total compensation received by the CEO.
In comparison with other companies in the industry with market capitalizations under AU$279m, the reported median total CEO compensation was AU$313k. From this we gather that Peter Williams is paid around the median for CEOs in the industry.
|
Component |
2020 |
2019 |
Proportion (2020) |
|
Salary |
AU$251k |
AU$272k |
93% |
|
Other |
AU$18k |
AU$19k |
7% |
|
Total Compensation |
AU$268k |
AU$291k |
100% |
On an industry level, roughly 70% of total compensation represents salary and 30% is other remuneration. Aus Tin Mining pays out 93% of remuneration in the form of a salary, significantly higher than the industry average. If salary dominates total compensation, it suggests that CEO compensation is leaning less towards the variable component, which is usually linked with performance.

Aus Tin Mining Limited's Growth
Aus Tin Mining Limited has reduced its earnings per share by 6.4% a year over the last three years. In the last year, its revenue is up 357%.
The reduction in EPS, over three years, is arguably concerning. On the other hand, the strong revenue growth suggests the business is growing. These two metrics are moving in different directions, so while it's hard to be confident judging performance, we think the stock is worth watching. While we don't have analyst forecasts for the company, shareholders might want to examine this detailed historical graph of earnings, revenue and cash flow.
Has Aus Tin Mining Limited Been A Good Investment?
With a three year total loss of 89% for the shareholders, Aus Tin Mining Limited would certainly have some dissatisfied shareholders. So shareholders would probably want the company to be lessto generous with CEO compensation.
In Summary…
As previously discussed, Peter is compensated close to the median for companies of its size, and which belong to the same industry. But revenue growth seems to be inching northward, a heartening sign for the company. Contrarily, shareholder returns are in the red over the same stretch. EPS growth is also negative, adding insult to injury. We'd say CEO compensation isn't unfair, but shareholders may be wary of a bump in pay before the company substantially improves overall performance.
CEO pay is simply one of the many factors that need to be considered while examining business performance. We did our research and identified 7 warning signs (and 4 which are a bit concerning) in Aus Tin Mining we think you should know about.
Important note: Aus Tin Mining is an exciting stock, but we understand investors may be looking for an unencumbered balance sheet and blockbuster returns. You might find something better in this list of interesting companies with high ROE and low debt.
This article by Simply Wall St is general in nature. It does not constitute a recommendation to buy or sell any stock, and does not take account of your objectives, or your financial situation. We aim to bring you long-term focused analysis driven by fundamental data. Note that our analysis may not factor in the latest price-sensitive company announcements or qualitative material. Simply Wall St has no position in any stocks mentioned.
Have feedback on this article? Concerned about the content? Get in touch with us directly. Alternatively, email editorial-team@simplywallst.com.
NOT FOR DISTRIBUTION TO UNITED STATES NEWS WIRE SERVICES OR FOR DISSEMINATION IN THE UNITED STATES
TORONTO, Nov. 02, 2020 (GLOBE NEWSWIRE) — Melior Resources Inc. (TSXV: “MLR”) (“Melior” or the “Company”) announces that the previously announced brokered private placement (“Concurrent Financing”) of subscription receipts (each, a “Subscription Receipt”) of Ranchero Gold Corp. (“Ranchero”) to be completed in connection with the Company’s previously announced reverse takeover transaction with Ranchero is anticipated to be completed at a purchase price of C$0.55 per Subscription Receipt. No change is anticipated to the gross proceeds or any other terms of the Concurrent Financing as described in the Company’s press release dated November 2, 2020.
For further information, please contact:
Martyn Buttenshaw
Interim Chief Executive Officer
+41 41 560 9070
info@meliorresources.com
This news release does not constitute an offer to sell and is not a solicitation of an offer to buy any securities in the United States. The securities of the Company and Ranchero have not been and will not be registered under the United States Securities Act of 1933, as amended (the “U.S. Securities Act”) or any state securities laws and may not be offered or sold within the United States or to U.S. Persons unless registered under the U.S. Securities Act and applicable state securities laws unless pursuant to an exemption from such registration.
The TSXV has neither approved nor disapproved the contents of this news release.
Neither the TSX Venture Exchange nor its Regulation Services Provider (as that term is defined in the policies of the TSX Venture Exchange) accepts responsibility for the adequacy or accuracy of this release.
Cautionary Note Regarding Forward Looking Statements
This news release contains certain forward-looking statements. Any statements that express or involve discussions with respect to predictions, expectations, beliefs, plans, projections, objectives, assumptions or future events or performance (often, but not always, using words or phrases such as “expects” or does not expect”, “is expected”, anticipates” or “does not anticipate” “plans”, “estimates” or “intends” or stating that certain actions, events or results “ may”, “could”, “would”, “might” or “will” be taken, occur or be achieved) are not statements of historical fact and may be “forward-looking statements”. Forward-looking statements contained in this news release may include, but are not limited to, the terms and completion of the Concurrent Financing.
Forward-looking statements are subject to a variety of risks and uncertainties which could cause actual events or results to materially differ from those reflected in the forward-looking statements. These risks and uncertainties include, but are not limited to: liabilities inherent in mine development and production; geological risks, risks associated with the effects of the COVID-19 virus, the financial markets generally, the results of the due diligence investigations to be conducted by the Company and Ranchero and the ability of Ranchero to complete the Concurrent Financing. There can be no assurance that forward-looking statement will prove to be accurate, and actual results and future events could differ materially from those anticipate in such statements. The Company undertakes no obligation to update forward-looking statements if circumstances or management’s estimates or opinions should change except as required by applicable securities laws. The reader is cautioned not to place undue reliance on forward-looking statements.

Jess Oram became the CEO of Cauldron Energy Limited (ASX:CXU) in 2018, and we think it's a good time to look at the executive's compensation against the backdrop of overall company performance. This analysis will also evaluate the appropriateness of CEO compensation when taking into account the earnings and shareholder returns of the company.
See our latest analysis for Cauldron Energy
How Does Total Compensation For Jess Oram Compare With Other Companies In The Industry?
At the time of writing, our data shows that Cauldron Energy Limited has a market capitalization of AU$20m, and reported total annual CEO compensation of AU$255k for the year to June 2020. That is, the compensation was roughly the same as last year. Notably, the salary which is AU$229.4k, represents most of the total compensation being paid.
For comparison, other companies in the industry with market capitalizations below AU$284m, reported a median total CEO compensation of AU$361k. From this we gather that Jess Oram is paid around the median for CEOs in the industry.
|
Component |
2020 |
2019 |
Proportion (2020) |
|
Salary |
AU$229k |
AU$226k |
90% |
|
Other |
AU$26k |
AU$25k |
10% |
|
Total Compensation |
AU$255k |
AU$251k |
100% |
Speaking on an industry level, nearly 73% of total compensation represents salary, while the remainder of 27% is other remuneration. Cauldron Energy is paying a higher share of its remuneration through a salary in comparison to the overall industry. If salary is the major component in total compensation, it suggests that the CEO receives a higher fixed proportion of the total compensation, regardless of performance.

Cauldron Energy Limited's Growth
Cauldron Energy Limited has seen its earnings per share (EPS) increase by 66% a year over the past three years. It achieved revenue growth of 443% over the last year.
Overall this is a positive result for shareholders, showing that the company has improved in recent years. Most shareholders would be pleased to see strong revenue growth combined with EPS growth. This combo suggests a fast growing business. While we don't have analyst forecasts for the company, shareholders might want to examine this detailed historical graph of earnings, revenue and cash flow.
Has Cauldron Energy Limited Been A Good Investment?
We think that the total shareholder return of 59%, over three years, would leave most Cauldron Energy Limited shareholders smiling. So they may not be at all concerned if the CEO were to be paid more than is normal for companies around the same size.
To Conclude…
As we touched on above, Cauldron Energy Limited is currently paying a compensation that's close to the median pay for CEOs of companies belonging to the same industry and with similar market capitalizations. Investors would surely be happy to see that returns have been great, and that EPS is up. Indeed, many might consider that Jess is compensated rather modestly, given the solid company performance! Stockholders might even be okay with a bump in pay, seeing as how investor returns have been so strong.
CEO pay is simply one of the many factors that need to be considered while examining business performance. We did our research and identified 5 warning signs (and 2 which are significant) in Cauldron Energy we think you should know about.
Of course, you might find a fantastic investment by looking at a different set of stocks. So take a peek at this free list of interesting companies.
This article by Simply Wall St is general in nature. It does not constitute a recommendation to buy or sell any stock, and does not take account of your objectives, or your financial situation. We aim to bring you long-term focused analysis driven by fundamental data. Note that our analysis may not factor in the latest price-sensitive company announcements or qualitative material. Simply Wall St has no position in any stocks mentioned.
Have feedback on this article? Concerned about the content? Get in touch with us directly. Alternatively, email editorial-team@simplywallst.com.
VANCOUVER, British Columbia, Oct. 30, 2020 (GLOBE NEWSWIRE) — Aben Resources Ltd. (TSX-V: ABN) (OTCQB: ABNAF) (Frankfurt: E2L2) (the “Aben” or the “Company”) announces the results of the recently completed drill program from the Forrest Kerr Gold Project. The Company completed two holes for a total of 990.0 meters. The 2020 drill program tested for the mineralized extension of high-grade polymetallic mineralization on the west side of the Nelson Creek Fault Zone. Both holes were collared on the scree-covered west bank of the Boundary Valley, several hundred meters outboard from the main mineralized zone at North Boundary.
Boundary Zone and Exploration & Potential Drill Target maps:
https://abenresources.com/site/assets/files/4087/2020-10-29-abn_slide_for_website.pdf
Hole FK20-71 encountered multiple horizons of polymetallic mineralization (Au-Ag-Cu-Zn) with the most uniform zone returning an average gold grade of 0.46 g/t Au (grams/tonne) over 37.0 meters (highest 1.0m value of 3.45 g/t Au). This horizon directly correlates with a drilled intercept from hole FK19-53 that averaged 1.2 g/t Au over 19m (located 70 meters above) and several surface samples (180m above) that returned gold values between 1.0 to 43.3 g/t Au. With limited drilling, this zone shows uniform gold grade mineralization over 180 m of vertical extent with a minimum surficial mineralized footprint exceeding 300 meters along strike. Notably, this mineralization is located west of the Nelson Creek fault zone, a structure that was previously thought to cut-off polymetallic mineralization west of the North Boundary high-grade mineralized zone.
FK20-72 tested for the potential of precious metal mineralization at the intersection of the NE-SW directed Blind Fault and the N-S oriented Nelson Creek Fault Zone. This hole encountered sporadic polymetallic mineralization adjacent to a strongly-altered fault-derived (mylonitic) rock package, but failed to encounter the structurally offset high-grade mineralization present at the North Boundary main zone (180m NE). A 19.0 m intercept with consistent low-tenor gold grades averaged 0.25 g/t Au between 453.0-472.0m downhole depth, roughly 350m below the surface of the North Boundary mineralized corridor.
The west-side mineralization is hosted within a volcanic to sub-volcanic Hazelton rock package with variably strong Quartz-Sericite-Pyrite (QSP) alteration, abundant quartz veins and a significant potassic component indicative of high-temperature fluids sourced from a proximal mineralizing heat source.
Both drillholes encountered highly fractured rock below approximately 55.0 meters of glacier-derived debris within and adjacent to the Forrest Kerr Fault Zone, a major crustal feature that provided structural pathways for mineralized fluids. Adverse weather in July, August and into September also affected the efficiency of drilling, which prompted Aben to suspend drilling after 990m of a planned 1500m.
The Forrest Kerr Property consists of 4 separate claim blocks comprised of 56 mineral claims (23,397 ha) and is owned 100% by Aben Resources. Numerous areas of interest have been identified since Aben began systematic exploration in 2016, with a total of 72 drill holes (22,958m/75,302’) completed. The Boundary Valley (3.5 km x 1.0 km) hosts significant surface gold mineralization and complex structural intersections, both of which are important indicators of the potential for discovery of more sub-surface high-grade gold mineralization.
Aben CEO Jim Pettit states, “Despite the challenges the Company faced this season at the Forrest Kerr Project, we managed to identify a new mineralized zone that shows uniform gold values over significant intervals along strike and to depth. This is significant as the Nelson Creek Fault was previously thought to cut off polymetallic mineralization west of the North Boundary High Grade Zone. This definitely opens up the west side of the Boundary Valley for further exploration.”
About Aben Resources:
Aben Resources is a Canadian gold exploration company developing gold-focused projects in British Columbia and the Yukon Territory. Aben is a well-funded junior exploration company.
Forrest Kerr Gold Project, Golden Triangle, BC claims map:
https://abenresources.com/site/assets/files/4087/abn_forrest_kerr_project_map.pdf
For further information on Aben Resources Ltd. (TSX-V: ABN), visit our Company’s web site at www.abenresources.com.
Cornell McDowell, P.Geo., V.P. of Exploration for Aben Resources, has reviewed and approved the technical aspects of this news release and is the Qualified Person as defined by National Instrument 43-101.
ABEN RESOURCES LTD.
“Jim Pettit”
______________________
JAMES G. PETTIT
President & CEO
For further information contact:
Aben Resources Ltd.
Telephone: 604-687-3376
Toll Free: 800-567-8181
Facsimile: 604-687-3119
Email: info@abenresources.com
Neither TSX Venture Exchange nor its Regulation Services Provider (as that term is defined in the policies of the TSX Venture Exchange) accepts responsibility for the adequacy or accuracy of this release.
This release includes certain statements that may be deemed to be "forward-looking statements". All statements in this release, other than statements of historical facts, that address events or developments that management of the Company expects, are forward-looking statements. Although management believes the expectations expressed in such forward-looking statements are based on reasonable assumptions, such statements are not guarantees of future performance, and actual results or developments may differ materially from those in the forward-looking statements. The Company undertakes no obligation to update these forward-looking statements if management's beliefs, estimates or opinions, or other factors, should change. Factors that could cause actual results to differ materially from those in forward-looking statements, include market prices, exploration and development successes, continued availability of capital and financing, and general economic, market or business conditions. Please see the public filings of the Company at www.sedar.com for further information.

Anthony McClure has been the CEO of Silver Mines Limited (ASX:SVL) since 2016, and this article will examine the executive's compensation with respect to the overall performance of the company. This analysis will also assess whether Silver Mines pays its CEO appropriately, considering recent earnings growth and total shareholder returns.
View our latest analysis for Silver Mines
How Does Total Compensation For Anthony McClure Compare With Other Companies In The Industry?
Our data indicates that Silver Mines Limited has a market capitalization of AU$210m, and total annual CEO compensation was reported as AU$338k for the year to June 2020. This means that the compensation hasn't changed much from last year. We note that the salary portion, which stands at AU$308.2k constitutes the majority of total compensation received by the CEO.
For comparison, other companies in the industry with market capitalizations below AU$283m, reported a median total CEO compensation of AU$318k. So it looks like Silver Mines compensates Anthony McClure in line with the median for the industry. What's more, Anthony McClure holds AU$6.1m worth of shares in the company in their own name, indicating that they have a lot of skin in the game.
|
Component |
2020 |
2019 |
Proportion (2020) |
|
Salary |
AU$308k |
AU$317k |
91% |
|
Other |
AU$29k |
AU$30k |
9% |
|
Total Compensation |
AU$338k |
AU$347k |
100% |
On an industry level, around 70% of total compensation represents salary and 30% is other remuneration. Silver Mines is paying a higher share of its remuneration through a salary in comparison to the overall industry. If total compensation veers towards salary, it suggests that the variable portion – which is generally tied to performance, is lower.

Silver Mines Limited's Growth
Silver Mines Limited's earnings per share (EPS) grew 21% per year over the last three years. Its revenue is down 7.5% over the previous year.
Shareholders would be glad to know that the company has improved itself over the last few years. It's always a tough situation when revenues are not growing, but ultimately profits are more important. Although we don't have analyst forecasts, you might want to assess this data-rich visualization of earnings, revenue and cash flow.
Has Silver Mines Limited Been A Good Investment?
Boasting a total shareholder return of 138% over three years, Silver Mines Limited has done well by shareholders. As a result, some may believe the CEO should be paid more than is normal for companies of similar size.
To Conclude…
As we noted earlier, Silver Mines pays its CEO in line with similar-sized companies belonging to the same industry. Investors would surely be happy to see that returns have been great, and that EPS is up. So one could argue that CEO compensation is quite modest, if you consider company performance! In fact, shareholders might even think the CEO deserves a raise as a reward due to the fantastic returns generated.
It is always advisable to analyse CEO pay, along with performing a thorough analysis of the company's key performance areas. We did our research and identified 3 warning signs (and 1 which is significant) in Silver Mines we think you should know about.
Important note: Silver Mines is an exciting stock, but we understand investors may be looking for an unencumbered balance sheet and blockbuster returns. You might find something better in this list of interesting companies with high ROE and low debt.
This article by Simply Wall St is general in nature. It does not constitute a recommendation to buy or sell any stock, and does not take account of your objectives, or your financial situation. We aim to bring you long-term focused analysis driven by fundamental data. Note that our analysis may not factor in the latest price-sensitive company announcements or qualitative material. Simply Wall St has no position in any stocks mentioned.
Have feedback on this article? Concerned about the content? Get in touch with us directly. Alternatively, email editorial-team@simplywallst.com.
Andrew Radonjic has been the CEO of Venture Minerals Limited (ASX:VMS) since 2017, and this article will examine the executive's compensation with respect to the overall performance of the company. This analysis will also evaluate the appropriateness of CEO compensation when taking into account the earnings and shareholder returns of the company.
Check out our latest analysis for Venture Minerals
How Does Total Compensation For Andrew Radonjic Compare With Other Companies In The Industry?
At the time of writing, our data shows that Venture Minerals Limited has a market capitalization of AU$34m, and reported total annual CEO compensation of AU$270k for the year to June 2020. We note that's a small decrease of 6.0% on last year. In particular, the salary of AU$214.8k, makes up a huge portion of the total compensation being paid to the CEO.
In comparison with other companies in the industry with market capitalizations under AU$283m, the reported median total CEO compensation was AU$312k. So it looks like Venture Minerals compensates Andrew Radonjic in line with the median for the industry. What's more, Andrew Radonjic holds AU$389k worth of shares in the company in their own name.
|
Component |
2020 |
2019 |
Proportion (2020) |
|
Salary |
AU$215k |
AU$210k |
79% |
|
Other |
AU$56k |
AU$78k |
21% |
|
Total Compensation |
AU$270k |
AU$288k |
100% |
Speaking on an industry level, nearly 70% of total compensation represents salary, while the remainder of 30% is other remuneration. Venture Minerals pays out 79% of remuneration in the form of a salary, significantly higher than the industry average. If total compensation veers towards salary, it suggests that the variable portion – which is generally tied to performance, is lower.

A Look at Venture Minerals Limited's Growth Numbers
Venture Minerals Limited has seen its earnings per share (EPS) increase by 12% a year over the past three years. It achieved revenue growth of 8.4% over the last year.
Overall this is a positive result for shareholders, showing that the company has improved in recent years. It's nice to see revenue heading northwards, as this is consistent with healthy business conditions. While we don't have analyst forecasts for the company, shareholders might want to examine this detailed historical graph of earnings, revenue and cash flow.
Has Venture Minerals Limited Been A Good Investment?
We think that the total shareholder return of 44%, over three years, would leave most Venture Minerals Limited shareholders smiling. This strong performance might mean some shareholders don't mind if the CEO were to be paid more than is normal for a company of its size.
In Summary…
As we touched on above, Venture Minerals Limited is currently paying a compensation that's close to the median pay for CEOs of companies belonging to the same industry and with similar market capitalizations. The company is growing EPS and total shareholder returns have been pleasing. Indeed, many might consider that Andrew is compensated rather modestly, given the solid company performance! Also, such solid returns might lead to shareholders warming to the idea of a bump in pay.
It is always advisable to analyse CEO pay, along with performing a thorough analysis of the company's key performance areas. We did our research and identified 4 warning signs (and 2 which are a bit unpleasant) in Venture Minerals we think you should know about.
Of course, you might find a fantastic investment by looking at a different set of stocks. So take a peek at this free list of interesting companies.
This article by Simply Wall St is general in nature. It does not constitute a recommendation to buy or sell any stock, and does not take account of your objectives, or your financial situation. We aim to bring you long-term focused analysis driven by fundamental data. Note that our analysis may not factor in the latest price-sensitive company announcements or qualitative material. Simply Wall St has no position in any stocks mentioned.
Have feedback on this article? Concerned about the content? Get in touch with us directly. Alternatively, email editorial-team@simplywallst.com.
In this article we are going to estimate the intrinsic value of Metals Exploration plc (LON:MTL) by estimating the company's future cash flows and discounting them to their present value. This will be done using the Discounted Cash Flow (DCF) model. It may sound complicated, but actually it is quite simple!
Companies can be valued in a lot of ways, so we would point out that a DCF is not perfect for every situation. For those who are keen learners of equity analysis, the Simply Wall St analysis model here may be something of interest to you.
View our latest analysis for Metals Exploration
The calculation
We are going to use a two-stage DCF model, which, as the name states, takes into account two stages of growth. The first stage is generally a higher growth period which levels off heading towards the terminal value, captured in the second 'steady growth' period. To begin with, we have to get estimates of the next ten years of cash flows. Seeing as no analyst estimates of free cash flow are available to us, we have extrapolate the previous free cash flow (FCF) from the company's last reported value. We assume companies with shrinking free cash flow will slow their rate of shrinkage, and that companies with growing free cash flow will see their growth rate slow, over this period. We do this to reflect that growth tends to slow more in the early years than it does in later years.
A DCF is all about the idea that a dollar in the future is less valuable than a dollar today, so we need to discount the sum of these future cash flows to arrive at a present value estimate:
10-year free cash flow (FCF) forecast
|
2021 |
2022 |
2023 |
2024 |
2025 |
2026 |
2027 |
2028 |
2029 |
2030 |
|
|
Levered FCF ($, Millions) |
US$5.30m |
US$7.48m |
US$9.65m |
US$11.7m |
US$13.4m |
US$14.8m |
US$16.0m |
US$17.0m |
US$17.7m |
US$18.3m |
|
Growth Rate Estimate Source |
Est @ 58.16% |
Est @ 41.08% |
Est @ 29.12% |
Est @ 20.75% |
Est @ 14.89% |
Est @ 10.79% |
Est @ 7.92% |
Est @ 5.91% |
Est @ 4.5% |
Est @ 3.52% |
|
Present Value ($, Millions) Discounted @ 14% |
US$4.7 |
US$5.8 |
US$6.6 |
US$7.0 |
US$7.1 |
US$6.9 |
US$6.6 |
US$6.1 |
US$5.6 |
US$5.1 |
("Est" = FCF growth rate estimated by Simply Wall St)
Present Value of 10-year Cash Flow (PVCF) = US$61m
The second stage is also known as Terminal Value, this is the business's cash flow after the first stage. The Gordon Growth formula is used to calculate Terminal Value at a future annual growth rate equal to the 5-year average of the 10-year government bond yield of 1.2%. We discount the terminal cash flows to today's value at a cost of equity of 14%.
Terminal Value (TV)= FCF2030 × (1 + g) ÷ (r – g) = US$18m× (1 + 1.2%) ÷ (14%– 1.2%) = US$150m
Present Value of Terminal Value (PVTV)= TV / (1 + r)10= US$150m÷ ( 1 + 14%)10= US$42m
The total value, or equity value, is then the sum of the present value of the future cash flows, which in this case is US$103m. The last step is to then divide the equity value by the number of shares outstanding. Compared to the current share price of UK£0.03, the company appears about fair value at a 19% discount to where the stock price trades currently. Remember though, that this is just an approximate valuation, and like any complex formula – garbage in, garbage out.

Important assumptions
The calculation above is very dependent on two assumptions. The first is the discount rate and the other is the cash flows. You don't have to agree with these inputs, I recommend redoing the calculations yourself and playing with them. The DCF also does not consider the possible cyclicality of an industry, or a company's future capital requirements, so it does not give a full picture of a company's potential performance. Given that we are looking at Metals Exploration as potential shareholders, the cost of equity is used as the discount rate, rather than the cost of capital (or weighted average cost of capital, WACC) which accounts for debt. In this calculation we've used 14%, which is based on a levered beta of 1.787. Beta is a measure of a stock's volatility, compared to the market as a whole. We get our beta from the industry average beta of globally comparable companies, with an imposed limit between 0.8 and 2.0, which is a reasonable range for a stable business.
Next Steps:
Whilst important, the DCF calculation ideally won't be the sole piece of analysis you scrutinize for a company. It's not possible to obtain a foolproof valuation with a DCF model. Preferably you'd apply different cases and assumptions and see how they would impact the company's valuation. If a company grows at a different rate, or if its cost of equity or risk free rate changes sharply, the output can look very different. For Metals Exploration, we've compiled three pertinent factors you should further research:
-
Risks: To that end, you should learn about the 4 warning signs we've spotted with Metals Exploration (including 2 which are concerning) .
-
Other Solid Businesses: Low debt, high returns on equity and good past performance are fundamental to a strong business. Why not explore our interactive list of stocks with solid business fundamentals to see if there are other companies you may not have considered!
-
Other Top Analyst Picks: Interested to see what the analysts are thinking? Take a look at our interactive list of analysts' top stock picks to find out what they feel might have an attractive future outlook!
PS. The Simply Wall St app conducts a discounted cash flow valuation for every stock on the AIM every day. If you want to find the calculation for other stocks just search here.
This article by Simply Wall St is general in nature. It does not constitute a recommendation to buy or sell any stock, and does not take account of your objectives, or your financial situation. We aim to bring you long-term focused analysis driven by fundamental data. Note that our analysis may not factor in the latest price-sensitive company announcements or qualitative material. Simply Wall St has no position in any stocks mentioned.
Have feedback on this article? Concerned about the content? Get in touch with us directly. Alternatively, email editorial-team@simplywallst.com.

We've lost count of how many times insiders have accumulated shares in a company that goes on to improve markedly. Unfortunately, there are also plenty of examples of share prices declining precipitously after insiders have sold shares. So we'll take a look at whether insiders have been buying or selling shares in Reward Minerals Limited (ASX:RWD).
What Is Insider Buying?
Most investors know that it is quite permissible for company leaders, such as directors of the board, to buy and sell stock in the company. However, most countries require that the company discloses such transactions to the market.
Insider transactions are not the most important thing when it comes to long-term investing. But logic dictates you should pay some attention to whether insiders are buying or selling shares. For example, a Columbia University study found that 'insiders are more likely to engage in open market purchases of their own company’s stock when the firm is about to reveal new agreements with customers and suppliers'.
View our latest analysis for Reward Minerals
The Last 12 Months Of Insider Transactions At Reward Minerals
Notably, that recent purchase by Michael Ruane is the biggest insider purchase of Reward Minerals shares that we've seen in the last year. So it's clear an insider wanted to buy, even at a higher price than the current share price (being AU$0.14). It's very possible they regret the purchase, but it's more likely they are bullish about the company. In our view, the price an insider pays for shares is very important. Generally speaking, it catches our eye when insiders have purchased shares at above current prices, as it suggests they believed the shares were worth buying, even at a higher price. We note that Michael Ruane was also the biggest seller.
In the last twelve months insiders purchased 3.16m shares for AU$451k. But insiders sold 3.06m shares worth AU$430k. Overall, Reward Minerals insiders were net buyers during the last year. You can see the insider transactions (by companies and individuals) over the last year depicted in the chart below. By clicking on the graph below, you can see the precise details of each insider transaction!

There are plenty of other companies that have insiders buying up shares. You probably do not want to miss this free list of growing companies that insiders are buying.
Are Reward Minerals Insiders Buying Or Selling?
Over the last three months, we've seen a bit of insider buying at Reward Minerals. They bought AU$442k worth in that time. However, Executive Director Michael Ruane netted AU$430k for sales. While it's good to see the insider buying, the net amount bought isn't enough for us to gain much confidence from it.
Insider Ownership of Reward Minerals
I like to look at how many shares insiders own in a company, to help inform my view of how aligned they are with insiders. I reckon it's a good sign if insiders own a significant number of shares in the company. Reward Minerals insiders own about AU$7.5m worth of shares. That equates to 28% of the company. We've certainly seen higher levels of insider ownership elsewhere, but these holdings are enough to suggest alignment between insiders and the other shareholders.
So What Does This Data Suggest About Reward Minerals Insiders?
Insider purchases may have been minimal, in the last three months, but there was no selling at all. The net investment is not enough to encourage us much. But insiders have shown more of an appetite for the stock, over the last year. Overall we don't see anything to make us think Reward Minerals insiders are doubting the company, and they do own shares. So these insider transactions can help us build a thesis about the stock, but it's also worthwhile knowing the risks facing this company. Be aware that Reward Minerals is showing 5 warning signs in our investment analysis, and 2 of those are concerning…
But note: Reward Minerals may not be the best stock to buy. So take a peek at this free list of interesting companies with high ROE and low debt.
For the purposes of this article, insiders are those individuals who report their transactions to the relevant regulatory body. We currently account for open market transactions and private dispositions, but not derivative transactions.
This article by Simply Wall St is general in nature. It does not constitute a recommendation to buy or sell any stock, and does not take account of your objectives, or your financial situation. We aim to bring you long-term focused analysis driven by fundamental data. Note that our analysis may not factor in the latest price-sensitive company announcements or qualitative material. Simply Wall St has no position in any stocks mentioned.
Have feedback on this article? Concerned about the content? Get in touch with us directly. Alternatively, email editorial-team@simplywallst.com.
We've lost count of how many times insiders have accumulated shares in a company that goes on to improve markedly. On the other hand, we'd be remiss not to mention that insider sales have been known to precede tough periods for a business. So shareholders might well want to know whether insiders have been buying or selling shares in Jindalee Resources Limited (ASX:JRL).
What Is Insider Selling?
It's quite normal to see company insiders, such as board members, trading in company stock, from time to time. However, such insiders must disclose their trading activities, and not trade on inside information.
We would never suggest that investors should base their decisions solely on what the directors of a company have been doing. But equally, we would consider it foolish to ignore insider transactions altogether. For example, a Columbia University study found that 'insiders are more likely to engage in open market purchases of their own company’s stock when the firm is about to reveal new agreements with customers and suppliers'.
View our latest analysis for Jindalee Resources
Jindalee Resources Insider Transactions Over The Last Year
There wasn't any very large single transaction over the last year, but we can still observe some trading.
While Jindalee Resources insiders bought shares during the last year, they didn't sell. You can see the insider transactions (by companies and individuals) over the last year depicted in the chart below. If you click on the chart, you can see all the individual transactions, including the share price, individual, and the date!

There are always plenty of stocks that insiders are buying. So if that suits your style you could check each stock one by one or you could take a look at this free list of companies. (Hint: insiders have been buying them).
Insider Ownership
For a common shareholder, it is worth checking how many shares are held by company insiders. A high insider ownership often makes company leadership more mindful of shareholder interests. It appears that Jindalee Resources insiders own 33% of the company, worth about AU$9.6m. This level of insider ownership is good but just short of being particularly stand-out. It certainly does suggest a reasonable degree of alignment.
What Might The Insider Transactions At Jindalee Resources Tell Us?
There haven't been any insider transactions in the last three months — that doesn't mean much. However, our analysis of transactions over the last year is heartening. Insiders do have a stake in Jindalee Resources and their transactions don't cause us concern. In addition to knowing about insider transactions going on, it's beneficial to identify the risks facing Jindalee Resources. Be aware that Jindalee Resources is showing 6 warning signs in our investment analysis, and 2 of those are significant…
Of course, you might find a fantastic investment by looking elsewhere. So take a peek at this free list of interesting companies.
For the purposes of this article, insiders are those individuals who report their transactions to the relevant regulatory body. We currently account for open market transactions and private dispositions, but not derivative transactions.
This article by Simply Wall St is general in nature. It does not constitute a recommendation to buy or sell any stock, and does not take account of your objectives, or your financial situation. We aim to bring you long-term focused analysis driven by fundamental data. Note that our analysis may not factor in the latest price-sensitive company announcements or qualitative material. Simply Wall St has no position in any stocks mentioned.
Have feedback on this article? Concerned about the content? Get in touch with us directly. Alternatively, email editorial-team@simplywallst.com.
VANCOUVER, British Columbia, Oct. 23, 2020 (GLOBE NEWSWIRE) — NORTEC MINERALS CORP. (the “Company” or “Nortec”) (TSXV: NVT) (FSE: WMQ) (OTC-PK: NMNZF): – Nortec is pleased to announce that all of the resolutions that shareholders were asked to consider at its annual general meetings held in Vancouver, British Columbia were approved.
The number of directors of the Company was set at seven, and Mohan R. Vulimiri, Peter F. Tegart, Derrick Weyrauch, Carlos Fernando Jaramillo Munoz, Michael Malana, Jeffrey Selder, and Jason Birmingham were elected to serve on the board of directors of the Company (the “Board”).
The Company is pleased to welcome Mr. Derrick Weyrauch to the Board. Mr. Weyrauch is a Chartered Professional Accountant, Chartered Accountant with over 29 years of corporate experience. Most recently the President and Chief Executive Officer of Palladium One Mining Inc. (TSXV: PDM) and an independent director of Cabral Gold Inc, (TSXV: CBR) he is also the founder and a director of Magna Mining Corp., a private mining company. Previously Mr. Weyrauch has held directorships and executive management roles with a number of public companies including exploration, development and operating mining companies. His broad range of experience will be an asset as Nortec advances both its current and additional projects in the future.
The Company is also pleased to appoint Mr. Michael Malana, Nortec’s Chief Financial Officer and Corporate Secretary to the Board. Mr. Malana is a Certified Professional Accountant, Certified Management Accountant. Nortec appreciates his assistance in administration, accounting and reporting for Nortec since 2017. He has extensive experience serving in the management of several public companies.
Mr. Harvey Stark did not stand for re-election to the Board. The Board and management wish to thank Mr. Stark for his valuable services and contributions to the Company.
About Nortec Minerals Corp.
Nortec is a mineral exploration and development company based in Vancouver, British Columbia. Nortec has a 17% interest in the Tammela Gold & Lithium Project in Southwest Finland. The Company has incurred over CDN$2.9 million in exploration, diamond drilling and support costs to earn a 51% interest in the Tomboko Gold Project, Northeast Guinea, West Africa. The Company is also evaluating advanced properties in Ecuador. Detailed information on these projects are posted on the Company’s website www.nortecminerals.com.
On behalf of the Board of Directors,
NORTEC MINERALS CORP.
“Mohan R. Vulimiri”
Mohan R. Vulimiri, Director
Forward-looking Statements
Certain statements contained herein constitute "forward-looking information" under applicable Canadian securities laws ("forward-looking statements"). Forward looking statements look into the future and provide an opinion as to the effect of certain events and trends on the business. Forward-looking statements may include words such as "shall", "will", and similar expressions. These forward-looking statements are based on current expectations and entail various risks and uncertainties. Actual results may materially differ from expectations if known and unknown risks or uncertainties affect our business or if our estimates or assumptions prove inaccurate. Factors that could cause results or events to differ materially from current expectations expressed or implied by the forward-looking statements, include, but are not limited to, risks more fully described in the Company's continuous disclosure documents, which are available on SEDAR at www.sedar.com.
Readers are cautioned not to place undue reliance on the forward-looking statements contained in this press release. Except as required by law, the Company assumes no obligation to update or revise any forward-looking statement, whether as a result of new information, future events or any other reason. Unless otherwise indicated, forward-looking statements in this press release describe the Company's expectations as of the date hereof.
Neither TSX Venture Exchange nor its Regulation Services Provider (as that term is defined in policies of the TSX Venture Exchange) accepts responsibility for the adequacy or accuracy of this release.
NORTEC MINERALS CORP.
Phone: +1 604-717-6426

This article will reflect on the compensation paid to Murray Hill who has served as CEO of Marenica Energy Limited (ASX:MEY) since 2012. This analysis will also evaluate the appropriateness of CEO compensation when taking into account the earnings and shareholder returns of the company.
View our latest analysis for Marenica Energy
Comparing Marenica Energy Limited's CEO Compensation With the industry
According to our data, Marenica Energy Limited has a market capitalization of AU$14m, and paid its CEO total annual compensation worth AU$365k over the year to June 2020. That's mostly flat as compared to the prior year's compensation. Notably, the salary which is AU$260.0k, represents most of the total compensation being paid.
In comparison with other companies in the industry with market capitalizations under AU$282m, the reported median total CEO compensation was AU$358k. This suggests that Marenica Energy remunerates its CEO largely in line with the industry average. Furthermore, Murray Hill directly owns AU$392k worth of shares in the company.
|
Component |
2020 |
2019 |
Proportion (2020) |
|
Salary |
AU$260k |
AU$260k |
71% |
|
Other |
AU$105k |
AU$108k |
29% |
|
Total Compensation |
AU$365k |
AU$368k |
100% |
Speaking on an industry level, nearly 76% of total compensation represents salary, while the remainder of 24% is other remuneration. Although there is a difference in how total compensation is set, Marenica Energy more or less reflects the market in terms of setting the salary. If salary dominates total compensation, it suggests that CEO compensation is leaning less towards the variable component, which is usually linked with performance.

A Look at Marenica Energy Limited's Growth Numbers
Over the past three years, Marenica Energy Limited has seen its earnings per share (EPS) grow by 42% per year. Its revenue is up 20% over the last year.
Overall this is a positive result for shareholders, showing that the company has improved in recent years. It's also good to see decent revenue growth in the last year, suggesting the business is healthy and growing. Although we don't have analyst forecasts, you might want to assess this data-rich visualization of earnings, revenue and cash flow.
Has Marenica Energy Limited Been A Good Investment?
Since shareholders would have lost about 1.0% over three years, some Marenica Energy Limited investors would surely be feeling negative emotions. Therefore, it might be upsetting for shareholders if the CEO were paid generously.
To Conclude…
As previously discussed, Murray is compensated close to the median for companies of its size, and which belong to the same industry. Meanwhile, shareholder returns paint a sorry picture for the company, finishing in the red over the last three years. But on the bright side, EPS growth is positive over the same period. It's tough for us to say CEO compensation is too generous when EPS growth is positive, but negative investor returns will irk shareholders and reduce any chances of a raise.
CEO pay is simply one of the many factors that need to be considered while examining business performance. We identified 6 warning signs for Marenica Energy (4 can't be ignored!) that you should be aware of before investing here.
Of course, you might find a fantastic investment by looking at a different set of stocks. So take a peek at this free list of interesting companies.
This article by Simply Wall St is general in nature. It does not constitute a recommendation to buy or sell any stock, and does not take account of your objectives, or your financial situation. We aim to bring you long-term focused analysis driven by fundamental data. Note that our analysis may not factor in the latest price-sensitive company announcements or qualitative material. Simply Wall St has no position in any stocks mentioned.
Have feedback on this article? Concerned about the content? Get in touch with us directly. Alternatively, email editorial-team@simplywallst.com.
Company invites individual and institutional investors, as well as advisors and analysts, to attend real-time, interactive presentations on VirtualInvestorConferences.com
PERTH, Australia, Oct. 19, 2020 /PRNewswire/ — Bannerman Resources (OTCQB:BNNLF, ASX:BMN), based in Perth, Australia focused on the Etango uranium project today announced that Brandon Munro, Chief Executive Officer, will present live at VirtualInvestorConferences.com on October 22nd.

DATE: Thursday, October 22nd
TIME: 10:30 AM ET
LINK: https://bit.ly/3lAKeK3
This will be a live, interactive online event where investors are invited to ask the company questions in real-time. If attendees are not able to join the event live on the day of the conference, an archived webcast will also be made available after the event.
It is recommended that investors pre-register and run the online system check to expedite participation and receive event updates.
Learn more about the event at www.virtualinvestorconferences.com.
About Bannerman Resources Limited
Bannerman Resources Limited is an Australian listed uranium development company. Its flagship asset is the world-class Etango Uranium Project located in the Erongo Region of Namibia.
Etango has benefited from extensive exploration and feasibility activity over the past 15 years. The Etango tenements possess a globally large-scale uranium mineral resource* of 271 Mlbs U3O8 (14.4 Mlbs Measured, 150.2 Mlbs Indicated and 106.1 Mlbs Inferred) inclusive of the Ondjamba and Hyena satellite deposits. A 20Mtpa development at Etango was the subject of a Definitive Feasibility Study (DFS) completed in 2012 and a DFS Optimisation Study completed in 2015. Bannerman has also constructed and operated a Heap Leach Demonstration Plant at Etango, which has heavily de-risked the acid leach process to be utilised on the Etango material.
In July 2020, Bannerman completed a Scoping Study on an 8Mtpa development of Etango (Etango-8 Project). The Scoping Study has demonstrated that this accelerated, streamlined project is strongly amenable to development – both technically and economically. A Pre-Feasibility Study on the Etango-8 Project is underway with targeted completion in mid 2021.
* For full details of the Mineral Resources estimate, please refer to Bannerman ASX release dated 11 November 2015, Outstanding DFS Optimisation Study Results. Bannerman confirms that it is not aware of any new information or data that materially affects the information included in that release. All material assumptions and technical parameters underpinning the estimates in that ASX release continue to apply and have not materially changed.
About Virtual Investor Conferences®
Virtual Investor Conferences (VIC) is the leading proprietary investor conference series that provides an interactive forum for publicly-traded companies to meet and present directly with investors.
A real-time solution for investor engagement, Virtual Investor Conferences is part of OTC Market Group's suite of investor relations services specifically designed for more efficient Investor Access. Replicating the look and feel of on-site investor conferences, Virtual Investor Conferences combine leading-edge conferencing and investor communications capabilities with a comprehensive global investor audience network.

View original content to download multimedia:http://www.prnewswire.com/news-releases/bannerman-resources-to-webcast-live-at-virtualinvestorconferencescom-october-22nd-301154588.html
SOURCE VirtualInvestorConferences.com
We often see insiders buying up shares in companies that perform well over the long term. On the other hand, we'd be remiss not to mention that insider sales have been known to precede tough periods for a business. So shareholders might well want to know whether insiders have been buying or selling shares in Great Northern Minerals Limited (ASX:GPP).
What Is Insider Buying?
It is perfectly legal for company insiders, including board members, to buy and sell stock in a company. However, rules govern insider transactions, and certain disclosures are required.
We would never suggest that investors should base their decisions solely on what the directors of a company have been doing. But logic dictates you should pay some attention to whether insiders are buying or selling shares. As Peter Lynch said, 'insiders might sell their shares for any number of reasons, but they buy them for only one: they think the price will rise'.
See our latest analysis for Great Northern Minerals
Great Northern Minerals Insider Transactions Over The Last Year
Over the last year, we can see that the biggest insider purchase was by insider Ernst Kohler for AU$162k worth of shares, at about AU$0.0079 per share. Even though the purchase was made at a significantly lower price than the recent price (AU$0.02), we still think insider buying is a positive. Because the shares were purchased at a lower price, this particular buy doesn't tell us much about how insiders feel about the current share price.
In the last twelve months insiders purchased 28.34m shares for AU$230k. On the other hand they divested 1.55m shares, for AU$9.3k. In total, Great Northern Minerals insiders bought more than they sold over the last year. You can see the insider transactions (by companies and individuals) over the last year depicted in the chart below. By clicking on the graph below, you can see the precise details of each insider transaction!

There are plenty of other companies that have insiders buying up shares. You probably do not want to miss this free list of growing companies that insiders are buying.
Insider Ownership
I like to look at how many shares insiders own in a company, to help inform my view of how aligned they are with insiders. Usually, the higher the insider ownership, the more likely it is that insiders will be incentivised to build the company for the long term. Insiders own 16% of Great Northern Minerals shares, worth about AU$2.9m. We've certainly seen higher levels of insider ownership elsewhere, but these holdings are enough to suggest alignment between insiders and the other shareholders.
What Might The Insider Transactions At Great Northern Minerals Tell Us?
It doesn't really mean much that no insider has traded Great Northern Minerals shares in the last quarter. On a brighter note, the transactions over the last year are encouraging. Insiders do have a stake in Great Northern Minerals and their transactions don't cause us concern. So these insider transactions can help us build a thesis about the stock, but it's also worthwhile knowing the risks facing this company. For instance, we've identified 6 warning signs for Great Northern Minerals (4 are concerning) you should be aware of.
But note: Great Northern Minerals may not be the best stock to buy. So take a peek at this free list of interesting companies with high ROE and low debt.
For the purposes of this article, insiders are those individuals who report their transactions to the relevant regulatory body. We currently account for open market transactions and private dispositions, but not derivative transactions.
This article by Simply Wall St is general in nature. It does not constitute a recommendation to buy or sell any stock, and does not take account of your objectives, or your financial situation. We aim to bring you long-term focused analysis driven by fundamental data. Note that our analysis may not factor in the latest price-sensitive company announcements or qualitative material. Simply Wall St has no position in any stocks mentioned.
Have feedback on this article? Concerned about the content? Get in touch with us directly. Alternatively, email editorial-team@simplywallst.com.

Even when a business is losing money, it's possible for shareholders to make money if they buy a good business at the right price. For example, although Amazon.com made losses for many years after listing, if you had bought and held the shares since 1999, you would have made a fortune. But while the successes are well known, investors should not ignore the very many unprofitable companies that simply burn through all their cash and collapse.
Given this risk, we thought we'd take a look at whether Prairie Mining (ASX:PDZ) shareholders should be worried about its cash burn. In this article, we define cash burn as its annual (negative) free cash flow, which is the amount of money a company spends each year to fund its growth. We'll start by comparing its cash burn with its cash reserves in order to calculate its cash runway.
Check out our latest analysis for Prairie Mining
Does Prairie Mining Have A Long Cash Runway?
You can calculate a company's cash runway by dividing the amount of cash it has by the rate at which it is spending that cash. In June 2020, Prairie Mining had AU$2.6m in cash, and was debt-free. Importantly, its cash burn was AU$3.8m over the trailing twelve months. That means it had a cash runway of around 8 months as of June 2020. To be frank, this kind of short runway puts us on edge, as it indicates the company must reduce its cash burn significantly, or else raise cash imminently. Depicted below, you can see how its cash holdings have changed over time.

How Is Prairie Mining's Cash Burn Changing Over Time?
Whilst it's great to see that Prairie Mining has already begun generating revenue from operations, last year it only produced AU$457k, so we don't think it is generating significant revenue, at this point. Therefore, for the purposes of this analysis we'll focus on how the cash burn is tracking. It's possible that the 13% reduction in cash burn over the last year is evidence of management tightening their belts as cash reserves deplete. Admittedly, we're a bit cautious of Prairie Mining due to its lack of significant operating revenues. We prefer most of the stocks on this list of stocks that analysts expect to grow.
How Easily Can Prairie Mining Raise Cash?
While Prairie Mining is showing a solid reduction in its cash burn, it's still worth considering how easily it could raise more cash, even just to fuel faster growth. Generally speaking, a listed business can raise new cash through issuing shares or taking on debt. One of the main advantages held by publicly listed companies is that they can sell shares to investors to raise cash and fund growth. By looking at a company's cash burn relative to its market capitalisation, we gain insight on how much shareholders would be diluted if the company needed to raise enough cash to cover another year's cash burn.
Since it has a market capitalisation of AU$53m, Prairie Mining's AU$3.8m in cash burn equates to about 7.2% of its market value. That's a low proportion, so we figure the company would be able to raise more cash to fund growth, with a little dilution, or even to simply borrow some money.
How Risky Is Prairie Mining's Cash Burn Situation?
Even though its cash runway makes us a little nervous, we are compelled to mention that we thought Prairie Mining's cash burn relative to its market cap was relatively promising. Even though we don't think it has a problem with its cash burn, the analysis we've done in this article does suggest that shareholders should give some careful thought to the potential cost of raising more money in the future. On another note, Prairie Mining has 5 warning signs (and 2 which don't sit too well with us) we think you should know about.
Of course, you might find a fantastic investment by looking elsewhere. So take a peek at this free list of interesting companies, and this list of stocks growth stocks (according to analyst forecasts)
This article by Simply Wall St is general in nature. It does not constitute a recommendation to buy or sell any stock, and does not take account of your objectives, or your financial situation. We aim to bring you long-term focused analysis driven by fundamental data. Note that our analysis may not factor in the latest price-sensitive company announcements or qualitative material. Simply Wall St has no position in any stocks mentioned.
Have feedback on this article? Concerned about the content? Get in touch with us directly. Alternatively, email editorial-team@simplywallst.com.
If you would like to receive our free newsletter via email, simply enter your email address below & click subscribe.
 Follow us on Twitter
 Become our facebook fan
CONNECT WITH US
Tweets
Tweet with hash tag #miningfeeds or @miningfeeds and your tweets will be displayed across this site.
MOST ACTIVE MINING STOCKS
Daily Gainers
 CMC Metals Ltd. CMC Metals Ltd. |
CMB.V | +900.00% |
 Eden Energy Ltd Eden Energy Ltd |
EDE.AX | +200.00% |
| GoviEx Uranium Inc. |
GXU.V | +42.86% |
| Eagle Nickel Ltd. |
ENL.AX | +41.67% |
| Citigold Corp. Limited |
CTO.AX | +33.33% |
| Mount Burgess Mining NL |
MTB.AX | +33.33% |
| Exalt Resources Limited |
ERD.AX | +31.94% |
| Casa Minerals Inc. |
CASA.V | +30.00% |
| Cariboo Rose Resources Ltd |
CRB.V | +28.57% |
| Belmont Resources Inc. |
BEA.V | +28.57% |