
The world’s two biggest gold miners both announced mega-mergers over the past 5 months or so. These huge deals briefly garnered some interest in the usually-forgotten gold-stock sector, and fleeting praise from Wall Street analysts. But gold-stock mega-mergers are bad news for gold-miner shareholders on all sides. They reveal the serious struggles of major gold miners, and really retard future upside in their stocks.
For decades the largest gold miners in the world have been Newmont Mining (NEM) and Barrick Gold (ABX). These behemoths have long dwarfed all their peers in operational scope. While the gold miners are in the process of reporting Q4’18 results now, their latest complete set remains Q3’18’s. As after every quarterly earnings season, I analyzed them in depth for the major gold miners of GDX back in mid-November.
The GDX VanEck Vectors Gold Miners ETF is the world’s leading and dominant gold-stock investment vehicle. In Q3 alone NEM and ABX mined a staggering 1286k and 1149k ounces of gold! To put this in perspective, the average of the next 8 largest gold miners rounding out the top 10 was just 508k ounces. Newmont and Barrick have long been in a league of their own, with commensurate market capitalizations.
In mid-November NEM and ABX were worth $17.1b and $14.9b, granting them massive 11.0% and 9.5% weightings within GDX. These two gold giants alone accounted for over 1/5th of GDX! That gives them outsized influence in not only that ETF, but in the entire gold-stock sector. GDX is the sector benchmark of choice for gold stocks these days, so the fortunes of NEM and ABX stocks really affect overall performance.
Gold-mining stocks are generally divided into three tiers based on their production. Anything over 1000k ounces annually is considered a major, which works out to 250k per quarter. NEM and ABX produced so much gold in Q3 they exceeded this threshold by a colossal 5.1x and 4.6x! They are really super-majors. Mid-tier gold miners produce between 300k to 1000k ounces every year, while juniors are under 300k.
Back on September 24th, 2018, Barrick Gold shocked the gold-stock world. It announced it was merging with Randgold (GOLD), which was really an all-stock acquisition of GOLD by ABX worth $6.5b. Barrick shareholders would own 2/3rds of the new combined company, while Randgold’s would own the rest. To avoid confusion, this essay uses the classic ABX and GOLD stock symbols to represent Barrick and Randgold.
ABX had been Barrick’s ticker for decades, but was just recently abandoned on January 2nd. With this mega-merger finished, the new company took over the excellent GOLD symbol going forward. That is a wise decision, as anyone who types “gold” into any brokerage account will see Barrick Gold. Years ago before Randgold got that coveted symbol, another major miner had it and really seemed to benefit from it.
In Q3 Randgold was the 10th-largest gold miner in the world producing 309k ounces. Added on top of Barrick’s 1149k, the new combined 1458k would take back the top-gold-miner crown from Newmont which produced 1286k that quarter. Apparently size matters a lot when you’re a gold-mining executive. But with both ABX and GOLD suffering chronic declining production, that mega-merger reeked of desperation.
Newmont’s leadership wasn’t happy with losing the pole position among global gold miners. So it soon got to work on looking for a mega-merger of its own. On January 14th, NEM announced it was acquiring major miner Goldcorp (GG) in an all-stock deal worth $10.0b! That looked like one-upmanship taking it to Barrick. NEM and GG shareholders would own about 2/3rds and 1/3rd of the new combined colossus.
Goldcorp was the world’s 7th-largest gold miner in Q3’18, producing 503k ounces of gold. Added on to Newmont’s 1286k, that creates a new monster running at an unprecedented 1789k-ounce quarterly rate! If bigger is better, these new combined super-major gold miners ought to be the best seen in history. But unfortunately in gold mining that isn’t true, and these new giants will likely fare worse than if they hadn’t merged.
In their merger announcements, the CEOs of all 4 of these major gold miners tried hard to sell their deals as wonderful news for shareholders. They argued that synergies and cost savings would make these new combined titans more effective at producing superior returns for their shareholders going forward. And as always with any large merger, Wall Street analysts universally applauded these mega-mergers as good.
Sadly the opposite is likely true, these deals are bad news for all the owners of Newmont and Barrick as well as former owners of Goldcorp and Randgold. These new giant super-majors are even bad news for the gold-mining sector as a whole. The odds are really high that their stocks will really underperform the smaller major, mid-tier, and junior gold miners in coming years. That will hurt this entire sector on multiple fronts.
Contrary to their CEOs’ marketing propaganda, none of these four major gold miners approached these deals from positions of strength. They’ve all been struggling with weakening production and rising costs. Gold mines are wasting assets that are constantly depleting, and it is increasingly challenging to find new gold to mine economically at the scale and pace the majors need. These mergers didn’t solve that core problem!
This table looks at the quarterly production, its year-over-year change, and all-in sustaining costs per ounce mined of Barrick, Randgold, Newmont, and Goldcorp during today’s secular gold bull. It started in late Q4’15 out of deep 6.1-year secular lows in gold. Barrick deleted Randgold’s old website, so there is no Q4’15 GOLD data. And as of Wednesday afternoon NEM and GG hadn’t yet reported full Q4’18 results.
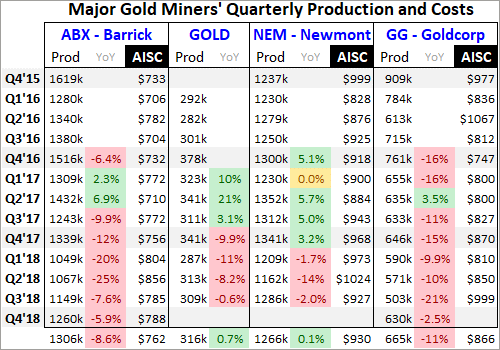
Barrick and Newmont didn’t just effectively dilute their shareholders by 50% for some relatively-meager cost-saving synergies, but because they can’t grow their production internally. ABX’s gold mined each quarter has been falling sharply on balance for years! It has seen brutal YoY drops as high as 25.5%, which ought to be impossible for a world-class gold major. 7 of the last 9 quarters have seen big declines.
Barrick’s average quarterly production since Q4’16 plunged an astounding 8.6% YoY. The reason Barrick’s management blew $6.5b in stock buying Randgold is they desperately needed more production to mask the precipitous drop in their own. Barrick’s total 2018 production of 4525k ounces was 18.0% below the 5516k it mined only a couple years earlier in 2016. At best adding Randgold just regains those losses.
And GOLD has been suffering the same production struggles as ABX. Over its past 4 reported quarters, Randgold’s gold mined has fallen an average of 7.4% YoY. Can bringing two rapidly-depleting major gold miners together magically make a stronger one? I doubt it. Barrick’s reported production will enjoy a big temporary boost for its first four quarters as a merged company, and then waning production will again be unmasked.
While the new giant Barrick will have more capital to develop new gold mines and expand existing ones, it seems unlikely that will be enough to turn this super-major around. Barrick and Randgold operated about 12 and 4 gold mines respectively pre-merger. So bringing another few online in coming years might not move the needle enough to outpace depletion. And it takes over a decade to permit and build new mines.
The entire gold-mining industry has been greatly starved of capital largely since 2013, with 2016 being a modest exception. Thus the big investments necessary to find new large-scale gold deposits and slowly advance them to mine builds have been severely lacking. So this whole industry’s pipeline of new gold to mine has been crippled, all but pinched shut. Declining miners merging does little to solve this problem.
Newmont has fared way better than Barrick in recent years, actually enjoying strong production growth on balance from Q4’16 to Q4’17. But this past year even mighty NEM has started to suffer from waning gold production. It averaged 5.9% YoY declines in the first three quarters of 2018. I suspect NEM is just a little behind ABX in rolling over into depletion outpacing mining growth. ABX’s merger forced NEM to act.
While Goldcorp was long celebrated as the world’s best major gold miner, it has been struggling for years with slowing production. Over the last 9 quarters GG only saw one modest production gain, with its gold mined dropping a colossal 11.0% YoY each quarter on average! So although GG produces about twice as much gold as Randgold, it might be a worse acquisition target due to its faster pace of shrinking production.
Like ABX and GOLD, it’s hard to imagine combining two more weakening majors NEM and GG will yield a way to stop and reverse their falling production. Again for their first four quarters together this new giant Newmont will appear to see big annual production growth. But once that post-merger comparison rolls past, the declining gold across all its mines will again be revealed. Mega-mergers can’t negate mine depletion.
Randgold didn’t even bother reporting industry-standard all-in sustaining costs, which is why they’re not included above. But its cash costs were often on the high side, so it’s likely the new combined company will drag overall mining costs higher. Barrick’s major-leading low AISCs aren’t likely to last with GOLD’s mines thrown in the mix, which means higher costs and lower overall profitability for Barrick going forward.
Newmont should benefit more from Goldcorp’s lower cost structure. NEM averaged $975 AISCs in the first three quarters of 2018, way higher than the $877 average in Q3’18 among the GDX gold miners. GG’s AISCs averaged $886 over that 9-month span, so the new combined Newmont should benefit from lower costs. But that may not last long, as weakening production eventually pushes per-ounce costs higher.
Gold-mining costs are largely fixed quarter after quarter, with actual mining requiring the same levels of infrastructure, equipment, and employees. So slowing production yields fewer ounces to spread mining’s big fixed costs across. If these new super-major gold behemoths can’t arrest their depleting production, their costs will inevitably rise in the future hurting profitability. Again these mega-mergers didn’t solve that problem.
So it looks like the managements of Barrick and Newmont just issued $6.5b and $10.0b of new stock so they could report big merger-driven production surges for a single year! Once those pre- and post-merger year-over-year comparisons pass, the vexing waning-production problems at all four of these predecessor gold miners will again become apparent. But that’s not even the biggest reason these mergers are bad news!
Even before these mergers as apparent in mid-November when I analyzed Q3’18 results, both Newmont and Barrick already had very-large market capitalizations of $17.1b and $14.9b. That again granted them massive 11.0% and 9.5% weightings in GDX. Like most stock indexes and ETFs, GDX’s components are weighted by market cap. Goldcorp and Randgold ranked 6th and 7th then in market cap and weightings.
Adding NEM and GG together as of mid-November would catapult their market cap and GDX weighting to $25.1b and 16.0%. Adding ABX and GOLD together yields a similar $22.3b market cap and 14.5% total GDX weighting. So these two super-majors alone could account for a crazy 30.5% of GDX’s weighting! That is almost scarily concentrated, although we don’t yet know how GDX’s managers will deal with this.
As of this week the new combined Barrick only has an 11.1% GDX weighting, while Newmont is at 8.2% since its mega-merger is not yet consummated. It will be interesting to see whether the new companies’ weightings going forward are kept in market-cap proportion or somehow limited. I hope it’s the latter, as many of the other gold miners in GDX have far-better growth prospects than these new super-majors.
ETF weightings aside, higher market caps create plenty of problems of their own. I’ve written essays in the past on picking great gold stocks, and surprisingly market capitalization is the single most important factor for future gains. The gold stocks with the largest market caps usually significantly underperform their smaller peers. These new super-majors are so darned big that they really compound this problem.
In mid-November when I analyzed the GDX miners’ Q3’18 results, the average market cap of its top 34 component stocks was $4.3b. Excluding NEM and ABX, that fell to $3.5b. It takes proportionally more capital inflows, investors buying shares, to push a larger stock higher than a smaller one. If the super-majors are worth $24b, it takes 6x as much buying of their stocks to drive the same gains as on a $4b company!
Imagine the different forces involved turning a supertanker versus a tugboat. The bigger any stock in the stock markets, the more inertia it has and thus the more capital is needed to overcome that and move the stock. And market-cap issues are not just a size thing in gold stocks. Smaller major, mid-tier, and junior gold miners have way fewer gold mines and much-lower production, which makes it far easier to grow output.
While Newmont is a temporary exception since it was bucking the major trend and growing production in 2017, Barrick, Randgold, and Goldcorp all really underperformed their sector in recent years. This chart looks at the indexed performance in ABX, GOLD, NEM, and GG stocks compared to the leading sector ETFs of GDX and the smaller GDXJ which largely tracks mid-tier gold miners under 1m ounces annually.
Both GDX and GDXJ fell to all-time lows back in mid-January 2016 when this gold-stock bull was born. So all 6 stocks are indexed to 100 as of that day, revealing their relative performance since. Despite their heavy weighting in GDX, the major gold miners generally lag their key sector benchmarks. ABX, GOLD, and GG have really struggled in recent years as their managers failed to stem big production declines.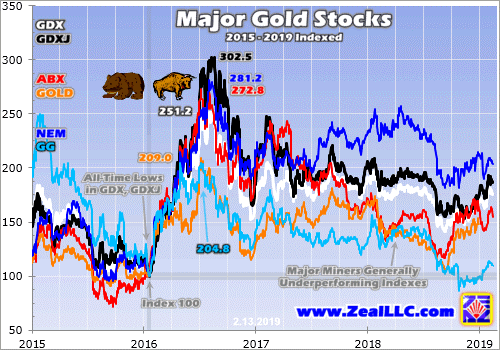
This chart is pretty damning, showing why the managers of Barrick and Newmont are desperate to show rising production even if only for a year after their wildly-expensive mega-mergers. ABX and GOLD have both been really underperforming their peers, scaring investors away while putting serious pressure on managements to turn things around. NEM resisted that, but its production started to decline too in 2018.
And GG has been a basket case, actually managing to fall below its deep secular lows of early 2016 in recent months! That’s a sad fate for what was the world’s best major gold miner for many years. NEM buying this dog is likely to drag down NEM’s stock performance to some midpoint between what it has done and how GG has fared. For the most part the largest gold miners haven’t been good investments.
The much-larger market caps coming from combining struggling majors into super-majors is highly likely to exacerbate this underperformance trend. The new Newmont and Barrick are way bigger and far more ponderous, and will require a lot more share buying to move their stock prices materially higher. But why will most investors even bother to buy these titans when many smaller mid-tier gold miners are thriving?
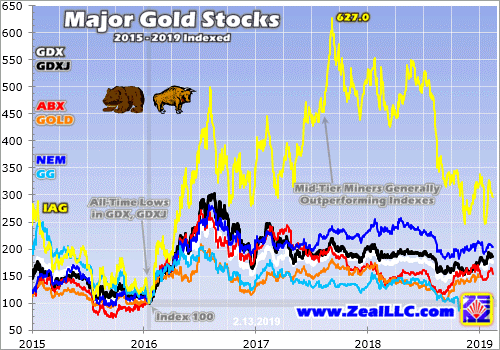
This next chart adds a single additional mid-tier gold miner to illustrate their outperformance. I chose IAMGOLD (IAG) for this example for a couple reasons. It produced 882k ounces in all of 2018, which makes it a larger mid-tier gold miner nearing that 1000k+ major threshold. And IAG is unremarkable fundamentally. It mined the same 882k ounces in 2017, so there was no production growth at all last year.
And its 2018 all-in sustaining costs are expected to come in on the high side near $1070 per ounce, which is worse than most of the majors. So there’s really nothing special about IAG operationally suggesting it should far outperform. If I wanted to cherry pick, there are other mid-tier miners that have trounced what IAG has done in recent years. Yet even IAG wildly outperformed the majors and sector ETFs during this gold bull.
If Newmont and Barrick were the only gold-mining stocks, they’d certainly be worth owning during a secular gold bull. But why own these massive supertanker-like gold miners when smaller major, mid-tier, and junior gold miners’ stocks are performing way better? The smaller miners not only have lower market caps easier to bid higher with much-smaller capital inflows, but plenty also have superior fundamentals.
They tend to have just a few or less gold mines, making it much easier to grow production by expanding existing mines or building new ones. Those expansion events act as major psychological catalysts to get investors interested in those stocks, fueling disproportionally-large buying to catapult them higher. There is really no reason to deploy capital in large majors when mid-tiers are easily running circles around them.
Even if like me you don’t own Newmont or Barrick and have no intention of investing in them, they could cause problems for the entire gold-stock sector. Their hefty GDX weightings mean their stocks have way-outsized influence in how that leading ETF fares. If these super-majors’ giant stocks lag, they are going to retard GDX’s upside which in turn will leave traders less optimistic and more skeptical on gold miners’ outlook.
So mega-market-cap gold miners could significantly slow the overall sentiment shift from bearish back to bullish which is necessary to attract in buying. If capital inflows diminish because of the perception this sector isn’t rallying enough, the bull-market uplegs will unfold slower and maybe end smaller. Even more problematic, the super-majors’ high weightings in GDX suck ETF capital away from more-deserving miners.
Most investors prefer sector ETFs over individual stocks, so lots of capital will flow into GDX as investors get interested in gold stocks again. GDX’s managers have to allocate any differential buying pressure into its underlying component companies in proportion to their weightings. The newly-merged Barrick and Newmont will likely command much-bigger weightings, starving smaller component miners of capital inflows.
But despite these mega-mergers being bad for everyone except the managers of those companies paying themselves huge compensation, all is not gloom and doom. If the new Newmont and Barrick continue to suffer waning production after their initial merger-boost year, investors will shift capital out of them into the other gold miners. That will gradually throttle their market caps and thus weightings in GDX, mitigating damage.
And if these super-majors taint the performance or expected upside in GDX enough, GDXJ may very well usurp it as the gold-stock sector benchmark of choice! While falsely billed as a Junior Gold Miners ETF, GDXJ has really become a mid-tier gold miners’ ETF. It has been increasingly outperforming GDX, and that trend could accelerate since GDXJ will hopefully never include the larger majors led by NEM and ABX.
With so many fundamentally-superior smaller gold miners to pick from, investors have no need to own the larger majors. Plenty of mid-tier miners are still growing their production organically, by expanding their existing mines or building new ones. Their upside as gold continues marching higher in its bull market is enormous, dwarfing what is possible in the giant majors struggling with waning production. Avoid the latter!
One of my important missions at Zeal is relentlessly studying the gold-stock world to uncover the stocks with the greatest upside potential. The trading books in both our weekly and monthly newsletters are currently full of these better gold and silver miners. Most of these trades are relatively new, added in recent months as gold stocks recovered from deep lows. So it’s not too late to get deployed ahead of big gains!
To multiply your wealth in stocks you have to do some homework and stay abreast, which our popular newsletters really help. They explain what’s going on in the markets, why, and how to trade them with specific stocks. Walking the contrarian walk is very profitable. As of Q4, we’ve recommended and realized 1076 newsletter stock trades since 2001. Their average annualized realized gain including all losers is +16.1%! That’s nearly double the long-term stock-market average. Subscribe today for just $12 per issue!
The bottom line is gold-stock mega-mergers are bad news for everyone in this sector. Combining major gold miners already struggling with slowing production doesn’t solve the problem, but only masks it for a single year. The resulting super-majors’ massive market capitalizations saddle their share prices with big inertia. They are going to require much-larger capital inflows to rally materially, really retarding their upside.
Their higher weightings within sector ETFs will lead to worse perceived sector performance, delaying the necessary sentiment shift from bearish back to bullish. And the super-majors will suck up more of the capital allocated to gold-stock ETFs, starving smaller and more-worthy gold miners of buying. Thankfully some of these problems can be avoided by shunning Newmont and Barrick, and sticking with great mid-tier miners.
Adam Hamilton, CPA
February 19, 2019
Copyright 2000 – 2019 Zeal LLC (www.ZealLLC.com)
Gold stocks’ young upleg is gathering steam, marching steadily to higher lows and higher highs. These bullish technicals are gradually improving sentiment, fueling mounting interest in this contrarian sector. That’s helping the gold stocks regain lost ground relative to gold, the driver of their profits. Fundamentals are growing more favorable as gold itself powers higher. All this portends much-bigger gold-stock gains coming.
Despite a strong rebound upleg in recent months, the gold miners’ stocks are still flying under the radars of most speculators and investors. They aren’t aware the gold stocks are running again, and likely don’t realize how massive gold-stock uplegs can grow. That’s unfortunate, because the biggest gains are won early in young uplegs before they are universally recognized. Buying low early on is the key to multiplying wealth.
The most-popular gold-stock benchmark these days is the GDX VanEck Vectors Gold Miners ETF. It was launched way back in May 2006, giving it a first-mover advantage that has grown into an insurmountable lead. This week GDX’s net assets of $10.5b were a colossal 52.4x larger than the next-biggest 1x-long major-gold-miners-ETF competitor! GDX is the lens through which most traders now view gold-stock fortunes.
And they’ve been excellent in recent months, with GDX boasting performance well outpacing gold as well as the general stock markets. This first chart looks at this sector ETF’s price action over the last several years or so. That’s technically been a gold-stock bull, because gold itself remained in a bull market over that span. Since gold overwhelmingly drives gold-stock performance, it defines gold-stock bull-bear cycles.
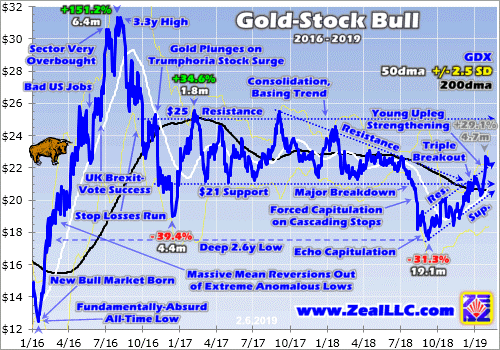
In mid-September GDX shares plunged to a deep 2.6-year secular low. That was fueled by an extreme forced capitulation in gold-stock shares, the result of stop losses being sequentially triggered in cascading fashion. The GDX price action of recent years setting the stage for this latest low and subsequent upleg is important to understand, and I’ve written recent essays explaining it. Today’s focus is the young upleg since.
It’s actually been quite impressive, and more traders will soon take notice. After bottoming at $17.57 on September 11th, GDX started powering higher in the tight well-defined uptrend bracketed above. Despite the incredibly-bearish sentiment you’d expect after a capitulation plunge leading to major lows, the gold stocks started marching higher on balance. Their young upleg has gathered steam and achieved much since.
GDX has carved a textbook-perfect series of higher lows and higher highs. That inexorably pushed it to a major triple breakout in late December and early January. GDX clawed back above three major overhead resistance lines. The first was the longstanding $21 support of GDX’s prior consolidation basing trend, which had persisted for 21.5 months before early August. Following a major breakdown, it became resistance.
The second was the downward-sloping resistance of a bearish descending-triangle technical pattern that had formed since GDX crested in early September 2017. And the third and most important was GDX’s 200-day moving average, shown in black in this chart. Seeing GDX overcome all three of these major overhead resistance zones in short order was a very bullish sign implying gold stocks were off to the races.
At best so far their young upleg per GDX has powered 29.1% higher in 4.7 months! That’s impressive by any standard. For comparison the S&P 500 broad-market stock index actually fell 6.4% during that span. And gold only rallied 10.3% in its own parallel upleg, so the major gold stocks have enjoyed good 2.8x upside leverage to the metal which drives their profits. That’s on the high side of the typical 2x to 3x range.
GDX has pulled back modestly since hitting its latest upleg high on January 31st, which was a breakout above its uptrend channel. Mid-upleg retreats within trend are perfectly normal and expected. They keep uplegs healthy and extend their longevity by periodically bleeding off excess greed. Without pullbacks, it would flare bright enough to suck in enough near-future buying for the upleg to prematurely exhaust itself.
And just this week this young gold-stock upleg reached another major technical milestone. On Tuesday GDX flashed a Golden Cross buy signal as its 50dma climbed back above its 200dma. Golden Crosses following deep oversold lows are incredibly bullish, signaling major new uplegs or entire bull markets! So they are one of the most-widely-followed and heeded buying signals among technically-oriented traders.
The initial major upleg of this gold-stock bull soared in essentially the first half of 2016, when GDX skyrocketed 151.2% higher in just 6.4 months! Nearly 2/3rds of those entire gains happened after the last Golden Cross following super-oversold lows flashed in early March 2016. These powerful buy signals aren’t just hard technical confirmation that a major upleg is underway, but they occur fairly early in upleg lifespans.
Today’s young gold-stock upleg is the most-consistent, longest-lived, and technically-sound one seen since that H1’16 monster! In general the more gradually uplegs rally, the stronger their technical and sentimental foundations and the longer they are likely to last. Slow-and-steady gains help prevent trader psychology from getting too unbalanced and extreme, granting more time for capital inflows to push prices higher.
GDX did enjoy a larger 34.6% surge over just 1.8 months leading into early February 2017. But that was so sharp it soon burned itself out and failed. Today’s young upleg is far more solid with a lot more staying power. And it remains on the small side by gold-stock standards, implying the lion’s share of its gains are still coming. While GDX’s massive 151.2% blast higher in H1’16 was unusual, gold-stock uplegs tend to get big.
The last secular gold-stock bull ran from November 2000 to September 2011. Just over half of that was in the pre-gold-stock-ETF era before GDX’s launch, so a different benchmark was used to measure it. During that long 10.8-year span, the classic HUI NYSE Arca Gold Bugs Index skyrocketed an astounding 1664.4% higher! Today’s hated gold stocks were the best-performing stock-market sector of that decade.
That life-changing secular gold-stock bull consisted of 12 separate uplegs. Excluding a giant anomalous one soaring after 2008’s first stock panic in a century, the 11 normal ones averaged gains of 80.7% over 7.9 months! Large uplegs are par for the course in the small and volatile gold-stock sector. So the 29.1% GDX gains we’ve seen so far in today’s young upleg are nothing. It’s likely to grow much larger in coming months.
Technically GDX should easily rally to $25 fairly soon, which was the old upper-resistance line of its long consolidation basing trend. That would extend this upleg’s gains over 42%. At that point GDX’s upside momentum would likely drive an upside breakout. And seeing GDX climbing to new multi-year highs over $25 would certainly catch traders’ attention, leading to a surge in capital inflows to chase gold stocks’ upside.
GDX’s bull-to-date peak was $31.32 in early August 2016, which wasn’t lofty as a mere 3.3-year high. It wouldn’t surprise me at all to see GDX challenge those levels before this young upleg matures then gives up its ghost. Rather interestingly that would grow this upleg to 78% gains, which is right in line with the previous secular bull’s average. The gold stocks still have lots of room to power much higher from here.
Their coming gains are inexorably intertwined with gold like usual. Gold-stock uplegs are directly driven by parallel gold uplegs. Rising gold prices boost gold stocks both sentimentally and fundamentally. They motivate speculators and investors to redeploy capital in the gold miners, and buying begets buying. The longer and higher gold stocks rally, the more traders want to buy them. Gold gains fuel this virtuous circle.
But more importantly higher gold prices directly drive higher earnings at the gold miners, fundamentally justifying higher gold-stock prices. This critical relationship is approximated by the ratio between gold-stock and gold price levels. It also portends big gold-stock gains coming. This next chart looks at the GDX/GLD Ratio during recent years’ gold-stock bull. GLD SPDR Gold Shares is the world’s leading gold ETF.
When this GGR is rising it means gold stocks are outperforming gold. That’s normally what happens in gold-stock uplegs. Like GDX itself, its ratio to gold is also climbing in a strong uptrend since those deep mid-September gold-stock lows. But the GGR remains on the low side of today’s gold bull, and has vast room to mean revert higher to pre-bull averages. I explained all this in depth back in a mid-October essay.
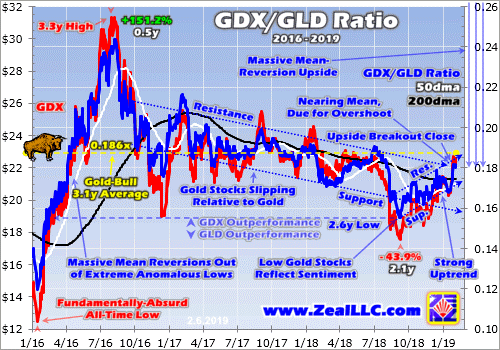
In mid-September as gold stocks’ forced capitulation decimated sentiment, the GGR collapsed to merely 0.155x. A single share of GDX was worth less than 1/6th of a single share of GLD. That also happened to be a 2.6-year secular low in the ratio of gold-stock price levels to gold prices. That simply reflected the seriously-bearish psychology that invariably accompanies major lows. But the GGR has recovered since.
By that latest interim GDX high on January 31st, the GGR had mean reverted back up to 0.182x. That is actually still below this bull market’s average of 0.186x over the past several years or so. But the climbing GGR proves gold stocks are making a major recovery relative to gold. Note above today’s young upleg is seeing the longest, strongest, and solidest GGR rally since H1’16! This upleg is the real deal, no flash in the pan.
After the GGR is forced to major lows or highs well off its averages, it tends to not only mean revert but overshoot proportionally. Since this key fundamental metric of gold stocks fell 0.030x below its bull mean at worst in mid-September, it ought to power a similar amount back above it before this upleg matures. That implies a 0.216x GGR is likely as gold stocks get more popular the longer their upleg rallies higher.
This week GLD traded near $124, so GDX regaining 0.216x means its price would rally to $26.78. That would make for a 52% upleg at today’s gold prices, and would drive that major breakout over GDX’s old $25 resistance line. And of course higher gold prices would lead to proportionally-higher GDX targets at any given GDX/GLD Ratio. Looking at today’s gold-stock levels compared to past means shows huge upside.
Back in mid-October when GDX was still only trading in the $18s and few believed a new gold-stock upleg had been born, I explored the GGR. This small contrarian sector was the last cheap one in wildly-expensive stock markets. I looked at some past GGR levels from the last secular gold-stock bull to point out how far gold stocks could soar. Consider the couple-year spans surrounding 2008’s wild stock panic.
In the 2 years after that extreme anomaly, 2009 and 2010, the GGR averaged 0.422x. And in the 2 years before that fear superstorm, it averaged 0.591x. Those are not high levels at major gold-stock toppings when euphoria reigned, but mere means. GDX ought to be able to regain those well-established levels later on in this bull market. At today’s gold prices, the post-panic average would catapult GDX to $52.33.
That would make for 198% gains from the recent secular low, a tripling in major gold miners’ stock prices! And that still wouldn’t be close to GDX’s $66.63 record hit at the end of gold stocks’ last secular bull back in September 2011. At the pre-panic 2-year-average GGR, this week’s gold levels would support an all-time GDX high of $73.28. That’s 317% higher than recent lows, more than a quadrupling in gold-stock price levels!
And all this assumes flat gold in the low $1300s, which is very unlikely. Gold is enjoying its own young upleg powering higher, which was sparked by the serious stock-market selloff in Q4. At $1350, $1400, or $1450 gold, the gold-stock price levels implied by GGR mean reversions are much higher. And that doesn’t account for the typical proportional overshoot towards the opposite extreme after deep GGR lows are hit.
The key takeaway here is gold stocks’ upside potential remains very large despite the progress so far in this young upleg. The big majority of this particular gold-stock upleg almost certainly remains ahead, so it’s not too late to get deployed before everyone else figures it out. Once gold stocks start surging faster than gold, the resulting bullish psychology becomes self-feeding enticing in more capital fueling bigger gains.
Big gold-stock uplegs are fully justified fundamentally by higher gold prices. Consider an example. The gold miners are now reporting their Q4 results, but the last complete set was Q3’s. Then the major gold miners of GDX reported average all-in-sustaining costs of $877 per ounce. These generally don’t change much regardless of prevailing gold prices. Mining costs are largely fixed when mines are being planned.
That’s when engineers and geologists decide which ore to mine, how to dig to it, and how to process it to recover the gold. So higher gold prices directly amplify gold miners’ bottom lines. While I’ll wade through the gold miners’ Q4 results once they are all released and write a new essay on them, AISCs are highly likely to remain near Q3 levels. Let’s call it $875 per ounce. In Q4 gold’s price averaged $1228 despite the rally.
That means the major gold miners were collectively earning about $353 per ounce mined. Meanwhile so far in Q1 gold is averaging $1296, which is a hefty 5.5% higher quarter-on-quarter. Assuming AISCs are flat across this industry, that implies gold miners are now earning $421 per ounce. That’s a massive 19.3% QoQ jump in profits on a 5.5% higher gold price, making for strong 3.5x upside leverage to gold.
The higher prevailing gold prices thanks to its own upleg are fueling fatter earnings for the gold miners. That provides the critical fundamental underpinning supporting major gold-stock uplegs. They are not just psychological phenomena driven by shifting sentiment, but actually reflect better operating conditions. I doubt historical gold-stock uplegs could’ve averaged such big gains without real fundamental foundations.
The unfortunate thing about major gold-stock uplegs is most speculators and investors ignore them until way too late. Traders love buying high and chasing momentum, but hate buying low before those big gains happen. So sadly the great majority of traders miss the great majority of major gold-stock uplegs. They don’t start deploying capital until after most of the gains are already won, which usually leads to later losses.
While today’s young upleg is gathering steam, we’ve likely only seen the first third or so. Thus there is still time to buy gold stocks relatively low before others start chasing their momentum in coming months after they are much higher. Why buy high later when you can still buy low now? And the best gains won’t be won in big ETFs like GDX, but in the stocks of fundamentally-superior smaller mid-tier and junior gold miners.
The major gold miners dominating GDX are really struggling to grow their gold production. Depletion is outpacing mine growth leading to higher costs and lower profits. That really retards their and thus GDX’s upside potential. But plenty of smaller gold miners are growing their output through new mine builds and expansions, which also lowers their costs. Their stocks’ upside potential utterly trounces the GDX majors.
The earlier you get deployed, the greater your gains will be. That’s why the trading books in our popular weekly and monthly newsletters are currently full of better gold and silver miners mostly added in recent months. The gains we won in 2016 were amazing the last time American stock investors returned to gold. Our newsletter stock trades that year averaged +111.0% and +89.7% annualized realized gains respectively!
The gold-stock gains should be similarly huge as today’s young gold and gold-stock uplegs grow. The gold miners are the last undervalued sector in these still-expensive stock markets, and rally with gold during stock-market bears unlike anything else. To multiply your wealth in the stock markets you have to do your homework and stay abreast, which our newsletters really help. They explain what’s going on in the markets, why, and how to trade them with specific stocks. You can subscribe today for just $12 per issue!
The bottom line is this young gold-stock upleg is really gathering steam. Technically it has rallied higher on balance for months now in a strong uptrend, carving higher lows and higher highs. GDX has broken out above three major resistance lines, and just flashed a key Golden Cross buy signal! All this has really started to shift sentiment back to bullish, which will attract in lots more capital to chase the momentum.
And these mounting gold-stock gains are fundamentally justified by gold’s own growing upleg. Gold-stock earnings amplify underlying gains in gold, making big stock-price surges righteous. Now is the time to get deployed relatively low, before most traders figure this out and start piling in. The evidence suggests a major gold-stock upleg is underway and mounting, and they tend to average gains far bigger than today’s.
Adam Hamilton, CPA
February 11, 2019
Copyright 2000 – 2019 Zeal LLC (www.ZealLLC.com)
Silver recently started outperforming gold again, a watershed event. For long years this white metal has mostly lagged the yellow one, relentlessly battering silver sentiment. But gold surging into year-end 2018 finally sparked some life into moribund silver. This is a bullish sign, as silver has soared in the past once rising prices reach critical mass in attracting new investment capital. Silver looks to be nearing that point again.
Despite a good finish, 2018 was a rough year for silver. Its price slumped 8.6%, way worse than gold’s -1.6% performance. And that still masks miserable intra-year action. At worst in mid-November, silver had plunged 17.3% year-to-date. That was 2.2x gold’s comparable loss, and at $13.99 silver languished at a major 2.8-year low. A soul-crushing 96% of its early-2016 bull market had been reversed and lost!
Back in December 2015 silver had bottomed a few days before gold at a deep 6.4-year secular low. Over the next 7.6 months silver soared 50.2% higher, outpacing gold’s parallel new-bull upleg by 1.7x. That promising start didn’t pan out though, silver crumbed once gold’s advance stalled and failed. Ever since its August 2016 peak of $20.56, silver mostly ground sideways sandwiched between two major downlegs.
It was the latter one that finally bottomed in mid-November 2018, with hope lost and silver bearishness universal and suffocating. Silver’s fortunes are heavily dependent on gold, and silver effectively acts like a gold sentiment gauge. The weak silver prices reflected the lack of enthusiasm for gold, which wasn’t far above its own 19.3-month low of mid-August. Gold had slumped to $1200, and threatened to break below.
For better or worse, gold drives silver. Traders usually ignore the tiny silver market until gold has rallied long enough and high enough to convince them its upside momentum is sustainable. So when gold itself is down in the dumps, silver doesn’t have a prayer. But gold bottomed that day and started clawing back higher, so silver joined along in the bounce. That gradually grew into a new silver upleg over the next 8 weeks.
By early January, silver had rallied 12.4% on a 7.7% gold rally. That made for 1.6x upside leverage to gold, which is still on the low side historically. But it was a welcome change after silver spent much of last year sliding considerably. A sub-span of that advance really caught my attention. Between the hawkish FOMC meeting on December 19th to the young new year on January 3rd, silver surged 7.9% in 9 trading days.
That was 1.9x gold’s 4.2% advance, and silver’s best outperformance relative to gold since that major upleg in H1’16! Something was changing in the left-for-dead silver market, with capital starting to return after more than a couple years of self-imposed exile. Over this past week silver enjoyed another solid stretch of outperformance, offering further confirmation. It started last Friday when gold itself soared 1.7%.
Gold ignited after a Wall Street Journal article claiming the Fed was considering ending its quantitative tightening early! That dovishness hit the U.S. dollar and catapulted gold higher. Over the next 4 trading day’s silver surged 4.8% on gold’s 3.0%, for 1.6x leverage. If that buying can push silver high enough to reach a psychological critical mass and become self-feeding, it portends major silver upside in coming months.
The more silver rallies, the more speculators and investors will want to buy it. The more capital they push into silver, the faster it will ascend. Buying begets buying in silver just like almost everywhere else in the markets. While upside momentum in itself is bullish anytime, silver’s upside potential is far greater than usual because it has been so darned undervalued. That’s made room for massive mean-reversion gains.
Silver’s “valuation” can be inferred relative to gold, its dominant driver. While the global silver and gold supply-and-demand profiles are independent with little direct linkage, these precious metals are joined at the hip psychologically. Silver rarely rallies materially unless gold leads the way. Silver traders look to gold for cues, which makes silver amplify gold’s moves. Silver’s technical relationship to gold is ironclad.
All this makes the Silver/Gold Ratio the most-important fundamental measure of silver-price levels. It is technically calculated by dividing daily silver closes by daily gold closes. But that yields tiny decimals that are hard to parse mentally, like the mid-week SGR of 0.012x. It is far more brain-friendly to consider this ratio from the opposite direction, via the Gold/Silver Ratio. This week it ran at an easier-to-comprehend 82.2x.
Mathematically the SGR is identical to an inverted GSR. So charting the GSR with an upside-down scale yields the same line as the SGR, but with way-more-intelligible numbers. Here this inverted-GSR SGR proxy in blue is superimposed over the silver price in red. Silver has rarely been lower relative to gold than it was in recent months. That portends monster upside as silver mean reverts higher leveraging gold.
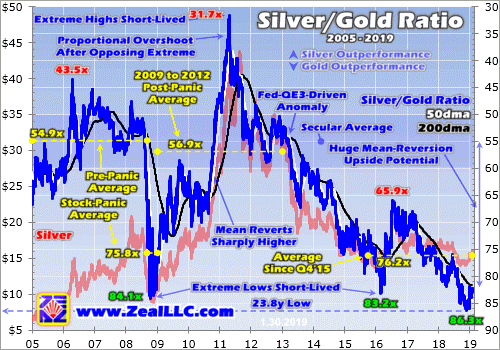
At that latest secular silver low in mid-November, the SGR fell to 85.9x. In other words, it took nearly 86 ounces of silver to equal the value of one ounce of gold. While silver started recovering, it initially lagged gold enough to force the SGR lower still. At the end of November it slumped as low as 86.3x on close, an astounding level. That was actually an extreme 23.8-year secular low in the SGR, nearly a quarter-century!
Silver hadn’t been lower relative to gold since early March 1995, practically a lifetime ago considering all that’s happened in the financial markets since. Even during the greatest market fear event in our lifetimes the SGR wasn’t lower. During late 2008’s first-in-a-century stock panic, the SGR just briefly hit 84.1x in mid-October. Being highly-speculative and super-sensitive to sentiment, silver had plummeted leading into it.
That stock-panic episode of extreme SGR lows shows what’s probable after silver inevitably reverses and mean reverts higher. Over the 3.7 years since 2005 leading into that panic, the SGR averaged 54.9x. That was right in line with the mid-50s that had been normal for decades. Silver had generally oscillated around 1/55th the price of gold, so miners had long used 55x as the proxy for calculating silver-equivalent ounces.
With silver so radically out of whack relative to gold, those extreme SGR panic lows weren’t sustainable. Like a beachball pushed too far under water, silver was ready to explode higher to reestablish its normal relationship with gold. That indeed happened during the post-panic years. After plummeting as low as $8.92 in late-November 2008, silver more than doubled by early December 2009 with a 115.4% gain.
While silver was really outperforming gold after its anomalous lows, at best in that initial post-panic rally the SGR only regained 58.6x. That was still below the 55x secular average. So silver continued slowly grinding higher on balance into late 2010. Then gold started surging again, creating the right sentiment conditions to unleash self-feeding silver buying. Silver skyrocketed from there, surging far faster than gold!
The faster silver soared into early 2011, the more traders wanted to own it and the more capital they poured into it. This psychological phenomenon of higher prices being more attractive runs through nearly all markets. The crazy bitcoin mania in late 2017 was a recent example. Silver’s virtuous circle of surging and new capital inflows finally climaxed in late April 2011 at $48.43 per ounce. That was one heck of a bull.
Starting from those extreme stock-panic lows radically undervalued relative to gold, silver had rocketed 442.9% higher in 2.4 years! And that massive run didn’t simply stop at a 55x SGR, but instead the huge buying momentum drove a proportional upside overshoot. The SGR peaked at 31.7x, which was 4/5ths as far above that long-term 55x mean as the SGR was below it at stock-panic lows. This principle is crucial.
After longstanding price relationships driven by some kind of inexorable fundamental or psychological links are forced to extremes, they don’t just mean revert. That reversion momentum blasts them right through their average to overshoot proportionally towards the opposing extreme! This behavior is very pendulum-like. The farther the SGR is pulled one way, the stronger its swing towards the other side of the arc.
Interestingly that massive mean-reversion-overshoot bull following 2008’s stock panic ultimately dragged the SGR high enough to average 56.9x in those post-panic years between 2009 to 2012. Despite great volatility in this ratio, it continued to gravitate towards that 55x secular mean. That persisted until early 2013 when the Fed’s unprecedented open-ended third quantitative-easing campaign greatly distorted markets.
That year alone the Fed conjured $1020b of QE capital out of thin air to inject into the markets! That forced the flagship US S&P 500 broad-market stock index 29.6% higher that year. Such blistering gains made investors forget about gold and silver, so they fell precipitously. That shattered fragile sentiment leading to multi-year bear markets in the precious metals. Silver leveraged gold’s downside like usual.
Thus the SGR slowly collapsed between early 2013 to early 2016 as gold and silver languished in Fed-driven bear markets. That was a very-challenging time psychologically, scaring away the great majority of contrarian speculators and investors. Ultimately silver plunged so far that the SGR fell to 83.2x at worst in late February 2016. That was an extreme low rivaling the 2008 stock panic’s, which truly defies all reason.
Again such SGR extremes weren’t sustainable, so silver blasted higher with gold and amplified its gains in roughly the first half of 2016. Unfortunately that new-bull upleg was cut short, capping silver at mere 50.2% gains and the SGR at 65.9x. Silver’s typical mean reversion out of extreme SGR lows was indeed underway, but unfortunately it was short-circuited by Trump’s stunning surprise election victory that November.
The stock markets started surging on hopes for big tax cuts soon with Republicans controlling the House, Senate, and presidency. So stock traders dumped gold-ETF shares which hammered the gold price and sucked silver down with it. Silver continued underperforming gold on balance until late November 2018 and that latest extreme 86.3x SGR low. Silver both fell faster than gold and rallied slower than it over this span.
Again that crazy nearly-quarter-century low in silver prices relative to gold prices was more extreme than both during late 2008’s stock panic and after late 2015’s secular low. Shockingly the SGR average since Q4’15 is now running 76.2x, which is actually worse than the 75.8x in the four months in late 2008 hosting that stock panic! Silver has languished far too low relative to gold in recent years, an unsustainable anomaly.
That guarantees a massive mean reversion higher for silver as gold’s young upleg continues to unfold. Seeing gold power higher on balance will motivate speculators and investors to redeploy into silver, which will fuel outsized gains in the white metal. That process is already underway, as proven by silver’s sharp gains relative to gold straddling the dawn of this new year. Silver is starting to outperform gold and mean revert!
Let’s assume the worst-case scenario, a silver upleg that fizzles prematurely due to an exogenous shock like Trump’s election win was back in late 2016. If the SGR merely revisits 65x, at $1250 gold that would mean silver near $19.25. While that’s only a 38% upleg from the mid-November lows, it is still well worth riding. At $1300 and $1350 gold, that very-low 65x SGR would yield silver prices near $20.00 and $20.75.
But with the stock markets almost certainly rolling over into a major new bear, it’s unlikely gold’s upleg will be truncated small again. As long as stocks generally weaken, gold investment demand will remain high driving up gold prices. That will keep traders excited about silver, chasing its gains and bidding it ever higher. It’s hard to imagine the SGR not at least mean reverting to its 55x secular average in this scenario.
At 55x and $1250, $1300, and $1350 gold, silver would power up near $22.75, $23.75, and $24.50. Such levels would make for a total silver upleg of 63%, 70%, and 75% from those deep mid-November lows. So even without a proportional overshoot, silver’s upside potential is big after being hammered to such deep lows relative to gold. Some magnitude of mean reversion higher is certain after such extreme SGR lows.
It would take a major gold upleg running for a couple years to fuel an SGR overshoot. In essentially the first half of 2016, this gold bull’s first upleg powered about 30% higher. That is actually on the small side by historical gold-upleg standards. Apply it to gold’s deep mid-August lows driven by record short selling in gold futures, and that yields an upleg target near $1525. That would work wonders for silver sentiment.
Once gold breaks decisively above its bull-to-date peak of $1365 from July 2016, excitement will explode driving outsized self-feeding investment demand. That should fuel a proportional mean-reversion overshoot in silver. Silver far outperforming gold as capital flooded in could even push the SGR up near 35x briefly. While such an upside extreme wouldn’t last any longer than downside ones, silver would soar.
At $1400, $1450, and $1500 gold, a mean-reversion-overshoot SGR of 35x would catapult silver way up near $40.00, $41.50, and $42.75 per ounce! That implies silver upleg gains ranging from 186% to 206% from mid-November’s low. The key takeaway here is after extreme SGR lows, silver’s resulting mean-reversion gains can grow massive. Silver far outperforms gold for a long time after underperforming for years.
That inevitable outperformance already started through late December and early January, when the SGR recovered sharply from 86.3x to 82.0x. That rapid rebound in silver prices is a strong indication that a major mean reversion is now underway. And history proves that once silver starts moving, it tends to rally fast as momentum builds. Buying begets buying, with higher silver prices fueling larger capital inflows.
As always the biggest gains will be won by the fearless contrarians who buy in early before everyone else figures this out. Investors and speculators alike can play silver’s big coming upside in physical bullion, its leading SLV iShares Silver Trust silver ETF, and the silver miners’ stocks. But only the latter will leverage silver’s gains, making them exceptionally attractive. Consider their example from that last major silver upleg.
Again in 7.6 months in mostly the first half of 2016, silver powered 50.2% higher before Trump’s surprise election win short-circuited that rally. The leading SIL Global X Silver Miners ETF rocketed an immense 247.8% higher in essentially that same span! That made for huge 4.9x upside leverage to silver’s gains, which is pretty awesome. The major silver miners’ stocks will amplify silver’s upside in its next big upleg too.
At Zeal we recognized the extreme anomalous lows in the SGR in late 2015 and early 2016 and deployed aggressively in both gold and silver stocks. The resulting gains were outstanding, with the stock trades in our popular weekly and monthly newsletters averaging +111.0% and +89.7% annualized realized gains in 2016! We’ve filled our trading books again in recent months in anticipation of the next big gold and silver uplegs.
To multiply your wealth in the stock markets, you have to do your homework and stay informed. That’s where our newsletters really help. They draw on my decades of experience, knowledge, wisdom, and ongoing research to explain what’s going on in the markets, why, and how to trade them with specific stocks. I study the markets all day everyday so you don’t have to. Subscribe today and enjoy the fruits of our hard work for just $12 per issue!
The bottom line is silver has started outperforming gold again. After getting pummeled near a quarter-century low relative to gold, silver started surging late last year. Following past extreme SGR lows, silver powered higher in major-to-massive mean-reversion uplegs and bull markets. Their advents have been signaled by silver beginning to rally faster than gold after suffering long periods of underperformance.
That’s now happening again, which is a super-bullish omen for silver. Capital inflows are accelerating as gold’s gains restore more-favorable sentiment. As long as gold continues meandering higher on balance, silver buying will beget more silver buying. That portends big gains coming in silver and especially the stocks of its miners. Silver mean reversions higher out of extreme lows relative to gold can run for years.
Adam Hamilton, CPA
February 4, 2019
Copyright 2000 – 2019 Zeal LLC (www.ZealLLC.com)
The gold miners’ stocks have slumped in January, tilting sentiment back to bearish. This sector’s strong December upward momentum was checked by gold’s own upleg stalling out. Gold investment demand growth slowed on the blistering stock-market rally. But uplegs always flow and ebb, and this young gold-stock upleg merely paused. The gold miners’ gains will likely resume soon, rekindling bullish psychology.
Most investors and analysts track the gold-mining sector with its leading ETF, the GDX VanEck Vectors Gold Miners ETF. GDX was this sector’s pioneering ETF birthed in May 2006, creating a huge first-mover advantage that is insurmountable. This week GDX’s net assets of $9.9b were an incredible 56.7x larger than the next-biggest 1x-long major-gold-miners ETF! GDX dominates this space with little competition.
Back in early September, the gold stocks plunged to a major 2.6-year secular low per GDX. This sector suffered a brutal forced capitulation on cascading stop-loss selling, devastating sentiment. The triggering catalyst was gold getting pounded to its own major lows in mid-August on record futures short selling. At worst GDX fell to $17.57 on close, which was down an ugly 24.4% year-to-date. Most traders fled in disgust.
But major new uplegs are born in peak despair, and that was it. The gold stocks started recovering out of those fundamentally-absurd levels, gradually carving a solid upleg. By early January GDX had rallied 22.3% higher in 3.7 months, fueling more-optimistic sector sentiment. Plenty of speculators and investors including me were comparing 2019’s setup for gold stocks to the first half of 2016, a wildly-lucrative stretch.
That was just after today’s gold bull ignited, and its maiden upleg surged 29.9% higher in just 6.7 months. Such gold strength ignited a flood of capital into the gold miners, catapulting GDX an enormous 151.2% higher in essentially that same span! This year when GDX’s latest closing upleg high of $21.48 was achieved on January 3rd, traders were salivating at the prospects of another mighty H1’16-like gold-stock upleg.
But instead of powering higher, the gold stocks stalled and started drifting lower. By last Friday the 18th, GDX had slumped 5.4% over a couple of weeks or so to $20.31. That really discouraged the gold-stock traders, torpedoing the nascent bullishness driven by GDX’s powerful 10.5% December rally. I’ve been getting lots of e-mails from discouraged traders moping, and often convinced this gold-stock upleg fizzled.
Sentiment has really deteriorated in recent weeks as gold-stock prices retreated. One manifestation of this resurgent bearishness is apparent in how individual gold miners’ stocks are reacting to company-specific news. Early in new quarters, many gold miners report their prior quarter’s production. And early in new years, plenty also give guidance for new full-year production. Traders are selling hard on this news.
Even though these production reports and outlooks have generally been flat to good, they are being used as excuses to sell. When traders wax bearish, all news is considered bad. So when pessimism reigns early in new quarters, it’s not unusual to see traders flee. Conversely when gold stocks are rallying nicely early in new quarters, this news is typically bought. Gold stocks’ reaction to news is a sentiment indicator.
Interestingly selling on full-year production guidance is usually a poor decision. Gold-miner managers try to maximize their compensation which is heavily driven by their stock’s price. So they tend to lowball their production estimates early in new years, leaving room to beat them later in those years. Then when they exceed their own expectations, their stocks catch strong bids into year-ends maximizing their personal earnings.
Plenty of traders have written me worrying that January 2019 is nothing like January 2016, arguing that a major new gold-stock upleg isn’t underway. They are dead wrong, everyone forgets the gold stocks also fell in much of that pivotal month. In the first couple weeks of January 2016, GDX actually dropped 9.1% despite a parallel 2.5% gold surge! Then like now, emotional gold-stock traders were irrationally scared.
That monster H1’16 gold-stock upleg didn’t start until January 20th that year, which was that month’s 12th trading day. That was after most of the post-quarter and new-year news releases. This year’s slump is actually better, not worse. GDX was only down 3.7% month-to-date on this month’s 13th trading day, on gold’s slight 0.1% drift lower over that span. Early-year weakness doesn’t preclude major uplegs brewing!
While most traders want to assume otherwise, gold stocks’ young upleg remains very much alive and well. This chart is updated from my essay several weeks ago heralding GDX’s major upside triple breakout, a super-bullish technical event. While GDX did slump in recent weeks after achieving that, its upleg is still rock-solid. All uplegs meander higher in fits and starts, taking two steps forward before one step back.

I’m not going to rehash this chart after analyzing it in depth just a few weeks ago. But scared gold-stock traders can take solace in some brief observations. First note the early-January-2019 pullback in GDX is far less severe than the early-January-2016 one. While that month birthed a monster upleg, it wasn’t all rainbows and unicorns until the very end. Weak-handed excitable traders had to be shaken out before the surge.
Second look at GDX’s solid upleg since early September 2018, which again rallied 22.3% at best over 3.7 months as of January 3rd. Uplegs are simply series of higher lows and higher highs often unfolding in a defined uptrend channel. All that still perfectly applies to GDX, its technicals remain very bullish. Both its upleg lows and highs are gradually marching higher, revealing zero technical strain on this young upleg.
Once again this upleg was born at GDX’s deep 2.6-year low of $17.57 on September 11th. Over the next few weeks into early October, GDX surged 8.4% to $19.05. Then it quickly pulled back to $18.39, which was still 4.7% above upleg-start levels. From there GDX powered up another 9.3% over the next couple weeks to $20.10 in late October. Then it suffered a bigger retreat to $18.42 by mid-November, still a higher low.
GDX rebounded strongly from there, surging another 16.6% to $21.48 by early January. And after such a strong run it slumped again to $20.31 last Friday. While it remains to be seen if that proves the latest upleg low, the higher lows so far have run $18.39, $18.42, and $20.31. And the higher highs clocked in at $19.05, $20.10, and $21.48. This is a textbook-perfect gold-stock upleg so far, offering nothing to worry about.
These higher lows and higher highs have formed an excellent uptrend channel for this upleg. Connecting these lows and highs creates parallel lower-support and upper-resistance lines. I didn’t draw them in this chart because they’d be difficult to see at this scale, but they are really well-defined. As of this week the support line extends near $19.50. So even if GDX slumped that low, its uptrend channel would remain intact.
Resistance now projects near $21.75, which would be another new upleg high. Odds are GDX will head back up there to challenge it in the coming few weeks or so. GDX may have started bouncing from last Friday’s level a bit under its 200-day moving average, which is now running $20.65. It could head a little lower first to its 50dma which is down near $20.14. And maybe it will even drop to $19.50 lower support.
It’s important to realize that as long as GDX remains above that uptrend-channel support line, its upleg is just fine. Any action over that is merely upleg noise that isn’t worth worrying about technically. It is normal for pullbacks within uplegs to bleed away bullishness and rekindle bearishness. That’s actually essential for uplegs’ health and longevity, keeping sentiment balanced so uplegs don’t prematurely burn out.
All the upside triple-breakout analysis and bullishness I discussed in early January remains valid and in force today. This gold-stock upleg has just paused, which is par for the course. All uplegs flow and ebb, gradually meandering higher on balance. None shoot up in straight lines, not even that monster one in H1’16. That was riddled with multiple strong selloffs, with one even hitting support below GDX’s 50dma.
The reason this young gold-stock upleg paused in recent weeks was gold’s own upleg stalled out. Gold miners’ stocks are ultimately just leveraged plays on gold. Their profits really amplify changes in gold’s price, which lets major gold miners’ stocks leverage gold’s underlying moves by 2x to 3x. Gold’s own young upleg that is driving gold stocks’ one hit its latest high near $1294 in early January the same day as GDX.
At that point gold had rallied 10.2% upleg-to-date, which GDX’s 22.3% upleg leveraged by a normal 2.2x in a similar span. Gold had bottomed a few weeks before the gold stocks, in mid-August instead of early September. Gold stocks’ performance relative to gold in this upleg has been normal. That leverage is often on the low side of its range early in young uplegs, then climbs to the high side later as momentum mounts.
At worst since its own January 3rd high, gold had slumped 1.0% to $1280 on last Friday. It is certainly no coincidence that is the exact span of gold stocks’ latest pullback. GDX’s young upleg will resume as soon as gold catches a bid again. That is dependent on gold investment demand resuming. It was strong in Q4, but faded significantly in January. This next chart looks at the leading proxy for gold investment demand.
That is the physical bullion holdings the dominant GLD SPDR Gold Shares gold ETF holds in trust for its shareholders. They are reported daily, a far-higher-resolution read than the quarterly supply-and-demand data from the World Gold Council. In last week’s essay I explained this chart in depth, analyzing why the capital flows into and out of GLD alone by American stock investors overwhelmingly drive the global gold price.
It superimposes GLD’s bullion holdings in blue over the gold price in red. Rising GLD holdings show that American stock-market capital is moving into gold via the conduit of this leading gold ETF. In Q4 and especially December gold surged higher on heavy differential buying of GLD shares. But in January that GLD buying has moderated. That’s why gold’s advance stalled out, which in turn drove gold stocks’ pause.
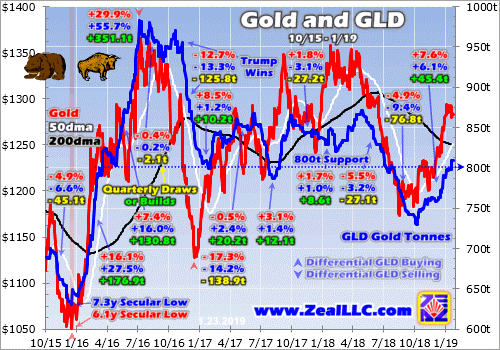
Again I discussed this chart just last week, so there’s no need for more comprehensive analysis. For our purposes today, note how GLD’s holdings climbed modestly in October and November after they had fallen to a deep 2.6-year secular low of their own in early October. GLD had suffered 5 consecutive monthly draws of 24.2 metric tons, 28.0t, 18.8t, 45.0t, and 12.9t between May and September, an ugly streak.
But that trend of American stock-market investors selling gold via GLD shares ended in early October. GLD enjoyed its first big build the very day the US stock markets suffered their first sharp plunge! That snowballed into an 11.8t build in October and 7.7t in November. That investment buying fueled modest gold rallies of 2.1% and 0.5% those months. Then in December that GLD-share buying really accelerated.
Last month enjoyed a sizable 25.9t build in GLD’s holdings, the biggest since September 2017. Those capital inflows fueled a much-larger 4.9% gold rally in December. When investment capital is flowing into gold, its price naturally climbs. And that in turn drives the gold miners’ stocks higher. Gold’s 2.1%, 0.5%, and 4.9% gains in the last several months drove parallel 2.2%, 0.8%, and 10.5% monthly rallies in GDX.
On the surface January has looked good too, with GLD’s holdings surging another 22.1t month-to-date as of the middle of this week. But nearly 9/10ths of that build came on only 2 trading days, January 2nd and 18th. Out of 15 trading days so far, January has seen 4 GLD-holdings build days, 3 draw days, and fully 8 unchanged. American stock investors’ differential GLD-share buying hasn’t been consistent this month.
That’s enabled gold-futures speculators to push gold modestly lower. Unfortunately we can’t know how much selling they’ve done, or whether it was exiting longs or adding new shorts, because of the federal-government partial shutdown. The weekly Commitments of Traders reports usually published by the CFTC haven’t been released since mid-December, so there is no data on gold-futures speculators’ trading.
But gold drifting lower this month despite a solid GLD build on balance proves they have to be selling. A sharp bounce in the US Dollar Index is a major factor driving those gold-futures sales. But the main one is the surging US stock markets. They are really retarding gold investment demand, making investors forget the wisdom of prudently diversifying their stock-heavy portfolios with gold. That has paused gold stocks.
The flagship U.S. S&P 500 broad-market stock index (SPX) plunged 19.8% over 3.1 months between late September and late December, a severe correction nearly entering bear-market territory. It was that SPX drop that reignited gold investment demand and fueled gold’s latest young upleg. Last week’s essay dug into this critical relationship between the SPX and gold. The SPX’s sharp rebound since weighed on gold demand.
Between the SPX’s Christmas Eve near-bear low and last Friday, this leading index rocketed up 13.6% in just several weeks! That violent bounce that looked and felt exactly like a bear-market rally nearly erased 4/7ths of the preceding correction. That has reignited widespread greed and complacency in the stock markets, the exact mission of bear rallies which are the biggest and fastest seen in all of stock-market history.
Gold stalled out in January because the SPX is surging so fiercely, retarding the impetus to diversify with gold. And the gold-stock upleg paused because gold stopped advancing. So this probable bear rally in the stock markets is to blame for gold stocks’ early-year weakness. But once these overbought U.S. stock markets roll over decisively again, gold psychology will flip back to favorable and big investment buying will resume.
When gold starts powering higher again, gold stocks will be off to the races. That portends big gains still coming in GDX, and even larger ones in its little brother GDXJ. It is effectively a mid-tier gold miners ETF these days, and its upleg gains during recent years’ bull market have outpaced GDX’s by about 1.4x on average. GDXJ simply has a better mix of gold miners than GDX, with fewer problems expanding production.
Yet the best gains by far won’t be won in the ETFs, but in the smaller mid-tier and junior gold miners with superior fundamentals. GDXJ still has deadweight in its top holdings, miners struggling with declining production and rising costs. The better gold miners are growing their output through new mine builds and expansions, generating greater gains. Finding and owning these better gold-mining stocks is essential.
The earlier you get deployed, the greater your gains will be. That’s why the trading books in our popular weekly and monthly newsletters are currently full of better gold and silver miners mostly added in recent months. The gains we won in 2016 were amazing the last time American stock investors returned to gold. Our newsletter stock trades that year averaged +111.0% and +89.7% annualized realized gains respectively!
The gold-stock gains should be similarly huge in this next major gold upleg. The gold miners are the last undervalued sector in these still-very-expensive stock markets, and rally with gold during stock-market bears unlike anything else. To multiply your wealth in the stock markets you have to do your homework and stay abreast, which our newsletters really help. They explain what’s going on in the markets, why, and how to trade them with specific stocks. You can subscribe today for just $12 per issue!
The bottom line is this young gold-stock upleg is just paused. The current technicals certainly don’t justify increasingly-bearish sentiment. This sector’s leading benchmark GDX is carving higher lows and higher highs, climbing on balance in a well-defined uptrend channel. Uplegs don’t shoot higher in straight lines, pullbacks within them are normal and expected. They serve to rebalance sentiment keeping uplegs healthy.
Gold stocks’ pullback this month was driven by gold’s own young upleg stalling. Strong gold investment demand fueled by recent months’ serious stock-market selloff moderated after stocks screamed higher in a violent bear-market-rally-like bounce. The resulting rekindled bullish psychology overshadowed gold again. But once stock-market selling resumes, so will the young uplegs in gold and its miners’ stocks.
Adam Hamilton, CPA
January 29, 2019
Copyright 2000 – 2019 Zeal LLC (www.ZealLLC.com)
Gold investment demand reversed sharply higher in recent months, fueling a strong gold rally. The big stock-market selloff rekindled interest in prudently diversifying stock-heavy portfolios with counter-moving gold. These mounting investment-capital inflows into gold are likely to persist and intensify. Both weaker stock markets and higher gold prices will continue to drive more investment demand, growing gold’s upleg.
Early in Q4’18, gold reached a major inflection point. It languished during the first three quarters of 2018, down 8.5% year-to-date by the end of Q3. Investors wanted nothing to do with alternative investments with the stock markets powering to new record highs. The flagship S&P 500 broad-market stock index (SPX) had rallied 9.0% in the first 3/4ths of last year. That left gold deeply out of favor heading into Q4.
But a critical psychological switch was flipped as the SPX started sliding last quarter. After long years with little material downside, stock traders had been lulled into overpowering complacency. They were shocked awake as the SPX plunged 14.0% in Q4, its worst quarter since Q3’11. They poured back into gold as stocks burned, driving it a strong 7.6% higher in Q4! Rekindled investment demand was the driver.
Unfortunately gold investment demand is rather murky. Gold is bought and sold every day all over the world, in countless venues ranging from major exchanges to tiny third-world merchants. Tracking even the majority of this in real-time is impossible. The best-available data on global gold investment comes from the World Gold Council. But it is only published once per quarter, about a month after quarter-ends.
I can’t wait to see the WGC’s new Q4’18 Gold Demand Trends report due out in early February. These quarterly GDTs are very well done and essential reading for all investors. But while detailed and informative, their resolution is really low only being released 4 times per year. Investors need alternative data sources to understand and game what’s going on with gold investment demand between the GDTs, like now.
Thankfully there’s an excellent proxy of investors’ capital flows into and out of gold published daily, a high-resolution read. It is the physical gold bullion held in trust for the shareholders of the world’s dominant gold exchange-traded fund. That of course is the American GLD SPDR Gold Shares. GLD was created and launched by the World Gold Council way back in November 2004, and has grown into a gold juggernaut.
As part of the WGC’s GDT work each quarter, it tracks the world’s top 10 physically-backed gold ETFs. At the end of Q3’18 when you could hardly give away gold to American investors, GLD’s holdings still accounted for nearly 32% of the world’s top-10 gold-ETF total. Add in the 2nd-largest ETF which is also American, the IAU iShares Gold Trust, and these two leading ETFs control over 3/7ths of the global top-10 total.
The primary constituency for American gold ETFs is American stock investors. So what they are doing in terms of capital flows through GLD especially is exceedingly important for gold. In recent years most of the major quarterly moves in gold prices are nearly fully explainable by GLD’s holdings alone! They must be watched daily, as changes in them have proven the key to gold’s fortunes. It’s important to understand why.
The American stock markets are the biggest in the world, and American investors’ capital is vast beyond compare. At the end of Q3’18, the collective market capitalization of the 500 elite SPX stocks alone was a staggering $26,141.4b. By comparison, GLD’s total physical-gold-bullion holdings of 742.2 metric tons were only worth $28.4b. That’s less than 1/9th of a single percent, which for all intents and purposes is zero.
Thus if even the tiniest fraction of U.S. stock-market capital migrates into or out of GLD shares, gold itself moves big. This dominant gold ETF effectively acts as a conduit between stock-market capital and gold. But as these colossal pools of capital slosh into and out of GLD, it is always at risk of failing its mission of tracking the gold price. The supply and demand of GLD shares and gold are independent of each other.
So differential buying or selling of GLD shares by American stock investors must be directly equalized into the underlying global gold market. This mechanism is simple in concept. When GLD shares are being bought faster than gold itself, this ETF’s price threatens to decouple from gold’s price to the upside. To prevent this, GLD’s managers need to shunt that excess GLD-share demand directly into gold in real-time.
They issue enough new GLD shares to offset that excess demand, and then use the proceeds to buy physical gold bullion held in trust for GLD’s shareholders. So when GLD’s daily holdings are rising, that reveals American stock-market capital is flowing into gold. This GLD capital pipeline into gold also works similarly on the downside, when American stock investors dump GLD shares faster than gold is being sold.
GLD’s share price will soon disconnect from gold’s price to the downside. This ETF’s managers avoid that by buying back GLD shares to sop up the excess supply. They raise the capital to do this by selling some of GLD’s physical-gold-bullion holdings. So when GLD’s daily holdings are falling, American stock-market capital is being pulled back out of gold. These holdings closely mirror world gold-investment trends.
My chart this week compares GLD’s daily gold holdings in metric tons with the gold price over the past several years or so. After falling to a major 6.1-year secular low in December 2015, gold started powering higher in a new bull market. Since gold hasn’t retreated 20%+ from its bull-to-date peak in July 2016, this bull remains alive and well. It has been overwhelmingly driven by American stock-market capital flows via GLD.

Let’s start in the middle of 2018, when GLD’s holdings were stable above 800t which has proven major support for this bull market. In much of the first half of last year, the stock markets were largely grinding sideways after the SPX suffered a sharp-yet-shallow-and-short correction in early February. The SPX finally started climbing decisively again in early Q3, ultimately achieving 5 new all-time record highs in that quarter.
That stoked incredible euphoria, convincing investors these amazing stock markets could rally indefinitely. By late September the SPX had skyrocketed 333.2% higher over 9.5 years, making for the 2nd-largest and 1st-longest stock bull in U.S. history! With general stocks looking invincible, there was little incentive to prudently diversify stock-heavy portfolios with gold. American stock investors were actually fleeing it.
In Q3 they sold GLD shares so aggressively that it forced a serious 76.8t or 9.4% draw in GLD’s holdings! All that selling pressure pushed world gold prices 4.9% lower that quarter. And GLD alone was mostly responsible. The WGC’s Q3 GDT showed total global gold demand actually grew a slight 0.6% year-over-year that quarter to 964.3t. Every major demand category grew considerably with a lone exception.
Global investment demand plunged 20.8% YoY to 194.9t. The WGC breaks it out into two major sub-categories, physical bar-and-coin demand and gold-ETF demand. The former was very strong, surging 28.0% YoY to 298.1t. But the latter plummeted from +13.2t in Q3’17 to -103.2t in Q3’18! Gold would’ve rallied nicely that quarter if not for GLD, which accounted for a commanding 2/3rds of that total world ETF drop.
When American stock investors are sustaining selling GLD shares faster than gold is being sold, it forces the world gold price lower. That serious Q3’18 GLD-holdings draw was the worst by far since back in Q4’16. That was when Trump’s surprise election victory with Republicans controlling both chambers of Congress ignited a major stock-market rally on hopes for big tax cuts soon. The resulting euphoria hammered gold.
While the SPX only climbed 3.3% in Q4’16, 8 new all-time record highs were achieved. American stock investors jettisoned gold with reckless abandon, both to chase that stock surge and out of relief that the political uncertainty didn’t trigger a stock selloff as feared. The differential GLD-share selling proved so intense that this ETF suffered a colossal 125.8t or 13.3% holdings draw, which crushed gold 12.7% lower!
Total world gold demand per the latest WGC GDT dropped 103.4t or 9.0% YoY that quarter. That huge GLD draw alone was 122% of that! Overall global gold-ETF demand fell 107.0t from -66.4t in Q4’15 to -173.4t in Q4’16. GLD’s draw was 118% of that. So literally the only reason gold plunged in Trump’s election quarter was American stock investors pulling big capital out of GLD forcing it to sell physical gold bullion.
Compared to that extreme dump, gold was relatively resilient in Q3’18. While GLD’s draw ran 61% of that Q4’16 episode, gold only declined 39% as much. There were hints the stock markets were ready to roll over into a long-overdue new bear. On Q3’s final trading day with the SPX just under its recent record peak, I published an essay explaining why Q4’s first-ever full-speed Fed QT was this stock bull’s death knell.
Indeed within a week of Fed QT ramping up to $50b per month of monetary destruction, the SPX started to falter. Its first serious down day erupted on October 10th when this leading stock-market benchmark plunged 3.3%. That triggered a major sentiment shift in gold. GLD enjoyed a large 1.2% holdings build that day on heavy differential GLD-share buying. Those were its first capital inflows at all since late July.
That very day American stock investors’ faith in perpetually-levitating stock markets started to crack, they started remembering gold. As Q4 wore on and that SPX selloff snowballed into a 4%+ pullback, a 10%+ correction, and narrowly missed new-bear-market territory at -19.8% on Christmas Eve, gold investment demand continued growing. Tending to rally when stocks fall, gold is essential for wisely diversifying portfolios.
By the time the dust settled on Q4, American stock-market capital sloshing back into gold via that GLD conduit had fueled a 45.4t or 6.1% holdings build. That was the biggest by far since way back in Q2’16 soon after this latest gold bull was born. All that differential GLD-share buying forced gold 7.6% higher in Q4 as the SPX plunged 14.0%. The WGC’s coming Q4’18 GDT will likely prove GLD largely drove gold’s gains.
The last time American stock investors started returning to gold after stock-market corrections spooked them was in the first half of 2016. Remember gold had just slumped to a major 6.1-year secular low, so it was deeply out of favor suffering incredibly-bearish sentiment. Yet in Q1’16 GLD’s holdings skyrocketed an epic 176.9t of 27.5% higher, which catapulted gold up 16.1%. Nothing else mattered per the WGC.
Overall world gold demand soared 188.1t or 17.1% YoY that quarter. GLD’s enormous build driven by American stock investors returning to gold accounted for an amazing 94% of that! If their vast pools of capital hadn’t sloshed back into gold via GLD that quarter, this bull never would’ve been born. And that utter dominance of American stock-market-capital inflows through GLD persisted in the subsequent quarter.
In Q2’16 gold surged another 7.4% higher on a 130.8t or 16.0% GLD-holdings build. The WGC reports that total world gold demand climbed 123.5t or 13.2% YoY that quarter. GLD’s huge build alone was responsible for 106% of that. So again without American stock-market capital moving into gold through that leading GLD conduit, that initial gold-bull upleg wouldn’t even exist. GLD dominates the gold world.
There have been 13 quarters since Q4’15 when today’s gold bull was born. 8 of them have seen major gold moves higher or lower. In all but one of these cases, GLD’s builds or draws accounted for the vast majority of the overall yearly change in total world gold demand. In the remaining 5 quarters where gold ground sideways or moved comparatively modestly, GLD’s holdings didn’t change very much either.
So there’s no doubt GLD’s strong build in Q4’18 ignited and fueled by this new SPX selloff is an important omen for gold. Once American stock investors start buying gold again via GLD shares in a big way, the resulting major gold uplegs tend to become self-feeding. Investors love chasing performance. The higher gold rallies, the more stock investors want to own GLD. And the more GLD they buy, the faster gold climbs.
And while correction-grade 10%+ stock-market selloffs are the catalysts that trigger renewed investment demand for gold, it usually persists well after the SPX bottoms and bounces. In essentially the first half of 2016, gold blasted 29.9% higher in just 6.7 months. That was totally fueled by an epic 351.1t or 55.7% build in GLD’s holdings as American stock investors rushed back into gold. That upleg peaked in early July.
But the 13.3% SPX correction that spawned it actually bottomed in mid-February. Over the following 4.9 months leading into gold’s top, the SPX blasted 16.4% higher! Nearly 3/4ths of gold’s upleg duration came after the stock selloff that ignited it, and just over 3/4ths of GLD’s upleg build also happened after the SPX had bottomed. Major gold uplegs take on a life of their own after being triggered by stock selloffs.
So even if today’s stock selloff ended at a severe correction on Christmas Eve and this record bull still has farther to run, gold investment demand should remain strong on upside momentum. But far more likely the long-overdue young new stock bear is being born. The SPX’s enormous and violent surge since that deep Christmas Eve low looks exactly like a classic bear-market rally technically, an ominous sign.
Bear-market rallies are the biggest and fastest ever witnessed in all of stock-market history. They soar out of major lows in sharp V-bounces on frantic short covering, then gradually run out of momentum over a couple to few weeks. If the stock markets are indeed rolling over into a new bear, far more weakness is guaranteed over the next couple years or so. That will fuel sustained gold-investment-demand growth.
Bear markets in stocks following major bulls are nothing to be trifled with. The last couple bears in the early and late 2000s saw the SPX fall 49.1% over 2.6 years and 56.8% over 1.4 years! 50% bears are common and expected after large bulls. And if we are early in the next bear, gold will likely be the top-performing asset class while it runs its course. American stock investors buying GLD shares will lead the way.
So far in January 2019, this huge apparent bear-market rally in the SPX has stalled investment demand for gold. Like many bear rallies, it has rekindled great greed and complacency. So GLD hasn’t experienced many significant builds yet in this young new year. But those capital inflows will return with a vengeance once the SPX starts rolling over and weakening again, likely driving gold sharply higher like in early 2016.
Again that sustained investment demand in H1’16 catapulted the yellow metal 29.9% higher pretty much exclusively on differential GLD-share buying. A mere 20% upleg off gold’s recent mid-August low driven by record gold-futures short selling would catapult it back up over $1400. Anything above the bull-to-date peak of $1365 in July 2016 is going to unleash a flood of new investor excitement in gold and big demand.
So this gold bull is likely to grow a lot larger in coming quarters. The greatest beneficiaries will be the gold miners’ stocks, as their profits leverage gold’s gains. Roughly during that mostly-H1’16 major gold upleg, the leading GDX and GDXJ gold-stock ETFs rocketed 151.2% and 202.5% higher! The better gold stocks with good fundamentals are going to soar again during gold’s next upleg, which is already well underway.
The earlier you get deployed, the greater your gains will be. That’s why the trading books in our popular weekly and monthly newsletters are currently full of better gold and silver miners mostly added in recent months. The gains we won in 2016 were amazing the last time American stock investors returned to gold. Our newsletter stock trades that year averaged +111.0% and +89.7% annualized realized gains respectively!
The gold-stock gains should be similarly huge in this next major gold upleg. The gold miners are the last undervalued sector in these still-very-expensive stock markets, and rally with gold during stock-market bears unlike anything else. To multiply your wealth in the stock markets you have to do your homework and stay abreast, which our newsletters really help. They explain what’s going on in the markets, why, and how to trade them with specific stocks. You can subscribe today for just $12 per issue!
The bottom line is gold investment demand began surging again in Q4, ignited by that major stock-market selloff. American stock investors started remembering gold, returning to GLD to diversify their portfolios which drove gold sharply higher. Once gold begins returning to favor after such major inflection points, its uplegs tend to grow large. Investment buying is self-feeding, with higher gold prices enticing in ever more capital.
Gold buying begets gold buying long after stock markets bounce, as investors love chasing performance. But odds are these lofty stock markets are now rolling over into a major new bear, portending much more weakness to come. Gold investment demand will thrive for years in that scenario, catapulting both gold and the stocks of its miners far higher. There’s no better place to multiply wealth during bear markets.
Adam Hamilton, CPA
January 21, 2019
Copyright 2000 – 2019 Zeal LLC (www.ZealLLC.com)
Gold miners’ exchange-traded funds are surging with gold powering higher. These mounting gains are naturally fueling growing interest in the leading gold-stock investment vehicles. Traders looking to deploy capital are wondering which major gold-stock ETF is superior, offering the best balance between upside potential, component fundamentals, and risks. GDXJ takes the crown, besting its larger big brother GDX.
By my count, there are currently 14 gold miners ETFs trading in U.S. markets. But that’s not authoritative, as the broader ETF industry is constantly in flux. These gold-stock ETFs collectively held $17.5b in net assets as of the middle of this week. And two major ETFs utterly dominated, commanding fully 85.1% of all those gold-stock investments! They are of course GDX and GDXJ, which dwarf everything else in this sector.
The GDX VanEck Vectors Gold Miners ETF and GDXJ VanEck Vectors Junior Gold Miners ETF hold net assets of $10.6b and $4.4b, or 60.2% and 24.9% of American gold-stock ETFs’ total. They have a huge and likely-insurmountable first movers’ advantage, being birthed way back in May 2006 and November 2009 respectively. They’ve gradually built great brand recognition, even being viewed as primary sector indexes.
When hedge funds report their equity holdings every quarter, if they have any gold-stock exposure GDX or GDXJ often top those lists. When gold miners are discussed on CNBC, GDX and to a lesser extent GDXJ are used in charts as sector benchmarks. VanEck’s popular pair of leading gold-miners ETFs are well-known to investors and speculators interested in this sector. They are effectively the only game in town.
With one company managing both GDX and GDXJ, and actively marketing them as a “Gold Miners ETF” and a “Junior Gold Miners ETF”, you’d think they are as different as their names imply. But unfortunately that’s not really the case. GDX and GDXJ hold many of the same component gold miners, with massive overlap in their holdings. And GDXJ’s definitely aren’t junior gold stocks, but actually larger mid-tier gold miners.
I’ve researched and written extensively on this. Every quarter I wade through the latest results from the top 34 component stocks of both GDX and GDXJ. The latest-available data is still Q3’18’s, as the full-year reports including Q4 aren’t due until 60 to 75 days after year-end depending on companies’ market capitalizations. As the recent Q3 earnings season wrapped up, GDXJ’s components were a subset of GDX’s.
GDXJ’s top 34 stocks accounted for 82.9% of its total weighting. And fully 31 of these components were also GDX components. These common gold miners across both ETFs weighed in at a massive 79.2% of GDXJ’s total weighting, and 31.7% of GDX’s. So nearly 4/5ths of this “Junior Gold Miners ETF” is made up by nearly 1/3rd of the major “Gold Miners ETF”. GDXJ is now a mid-tier gold miners ETF, not a junior one!
It wasn’t always this way, with GDXJ staying true to its advertised mission in its early years. But GDXJ became a victim of its own success in the first half of 2016. A young gold bull fueled skyrocketing gold-stock prices as traders flooded in to chase their rallies. GDXJ quickly grew so large that it risked running afoul of Canadian securities laws, where most of the world’s smaller gold miners’ and explorers’ stocks trade.
In the Canadian stock exchanges which are the centre of the junior-gold universe, an antiquated rule severely hobbles ETFs. Once any investor including ETFs acquires a 20%+ stake in any Canadian stock, it is legally deemed a takeover offer that must be extended to all shareholders! American stock-market capital flooding into GDXJ in early 2016 pushed many of its Canadian-junior ownership percentages near 20%.
Obviously hundreds of thousands of investors buying ETF shares have no intention of taking over gold-mining companies, no matter how big their collective stakes. That’s a totally-different scenario than a single corporate investor buying 20%+. Instead of lobbying Canadian regulators to exempt ETFs, GDXJ’s managers chose to unilaterally redefine what junior gold miners are. Stakes in Canadian juniors were slashed.
For decades juniors were often considered to be gold miners producing less than 200k ounces annually. To give GDXJ the benefit of the doubt, I conservatively expand that to 300k. That works out to 75k per quarter. In Q3’18, only 3 of the top 34 GDXJ component stocks were primary gold miners that met this junior threshold! The rest were mid-tier miners between 300k to 1m ounces per year, and even 1m+ majors.
GDXJ made these mission changes stealthily, knowing they would be controversial. It took me quarters to piece this all together, and I was an outspoken critic of the “Junior Gold Miners ETF” no longer being what it was billed as. But if you ignore the deceptive title, GDXJ has grown into an amazing mid-tier gold-miners ETF. It owns lots of the world’s best gold miners, which are given much-higher weightings than in GDX.
The mid-tier gold miners producing between 300k to 1m ounces per year are in the sweet spot for stock-price upside. Unlike the majors over 1m which are struggling with production declines, the mid-tiers are expanding existing mines and building new ones to boost their output and earnings. The mid-tier gold miners have smaller market caps too, making it much easier for capital inflows to bid up their stock prices.
Production is the lifeblood of the gold-mining industry, so traders often prize growth there above anything else when picking gold stocks. In Q3’18, the top 34 GDX gold miners including all the majors saw their total production decline 2.9% year-over-year to 9.5m ounces! That was stunning compared to the World Gold Council’s read on overall global gold mined that quarter, which actually grew a healthy 1.9% YoY.
GDX is heavily burdened by giant gold miners with shrinking production and high market caps, retarding its upside potential. GDXJ has some similar problems but to a lesser extent. Inexplicably GDXJ includes the major South African gold miners which are the worst in this industry for falling production and high mining costs. In Q3 four of them weighing in at 13.1% of GDXJ’s weighting suffered sizable production declines.
Excluding them and a fast-growing mid-tier gold miner that was oddly removed from GDXJ over the past year, the rest of the top 34 GDXJ gold miners achieved strong 3.4% YoY production growth in Q3! All the growth in the gold-mining industry is now coming from the mid-tier miners. GDXJ not only holds the best mid-tiers, but they have much-higher weightings than in the major-dominated GDX. GDXJ is the place to be.
In addition to the mid-tier gold miners’ growing production and lower market capitalizations, their mining costs are in line with the majors. In Q3 the top 34 GDX gold miners averaged all-in sustaining costs of $877 per ounce. The difference between that and prevailing gold prices shows industry profitability. The top 34 GDXJ gold miners had similar $911 AISCs in Q3. Without those South African majors, it was $877 too.
So if you can get past the fact GDXJ certainly isn’t a “Junior Gold Miners” ETF, it is superior to GDX in every way. The top 34 GDX stocks averaged 288.8k ounces mined in Q3, while GDXJ’s top 34 came in 43% lower at 163.3k. That’s still far above the 75k conservative junior threshold, but this mid-tier gold-miner range is where the vast majority of world production growth is happening. GDXJ action reflects this.
I’ve been writing about GDXJ outperforming GDX in my quarterly-results essays and newsletters for the better part of several years now. But until this week I hadn’t done the work to formally quantify GDXJ’s superior upside. I’ve been curious about it for some time, and have received more questions on it with gold stocks powering higher again. So I dug into this gold-stock bull’s GDXJ and GDX performances so far.
Since gold miners’ stocks are exceedingly volatile, bulls and bears in them are often delineated instead by gold itself. Today’s gold bull was born in December 2015 before surging in a powerful upleg in the first half of 2016. While gold has suffered a couple of serious corrections since, it never crossed that -20% new-bear threshold. So with gold in a continuous bull market for 3.1 years now, so too are the gold stocks.
They are effectively leveraged plays on gold since gold-mining profits directly amplify underlying moves in gold. The major gold stocks of GDX generally leverage gold uplegs and corrections by 2x to 3x. So if gold rallies 10%, GDX usually climbs 20% to 30%. Since GDX has become the leading benchmark for this entire sector, GDXJ’s performance is best considered relative to GDX’s. This chart summarizes it all.
GDX and GDXJ were both hammered to fundamentally-absurd all-time lows back in mid-January 2016 soon after gold’s own 6.1-year secular low. Ever since gold stocks have meandered in a series of bull-market uplegs and corrections. The performances of GDXJ and GDX in these recent years are rendered in blue and red below. Key stats are shown for each major gold ETF’s uplegs and corrections during that span.
The vertical light-blue lines divide up GDXJ’s uplegs and corrections, which generally match GDX’s but sometimes see major lows or highs out of sync. Each GDXJ upleg or correction shows GDXJ’s total gain or loss, the time that move took in months, GDX’s corresponding move over that identical span, and GDXJ’s leverage to GDX in yellow. The actual full GDX uplegs and corrections are also shown below in red.
Even in today’s young, delayed, mostly-unpopular, and weak gold-stock bull, GDXJ has outperformed GDX by a wide margin. And that’s despite GDXJ morphing from being a true junior-gold-miner ETF in the first half of 2016 to a mid-tier gold-miner ETF over the subsequent year. Even holding bigger gold miners, their superior fundamentals to the struggling majors have enabled GDXJ to keep the performance crown.
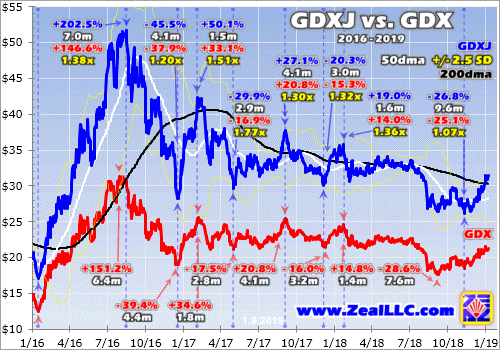
In just 6.4 months in largely the first half of 2016, gold stocks as measured by GDX skyrocketed 151.2% higher on a 29.9% gold upleg. GDXJ well-outperformed GDX in roughly that same span, blasting 202.5% higher in 7.0 months! GDX actually rallied 146.6% within GDXJ’s exact upleg, showing the mid-tier gold-stock ETF leveraged the major gold-stock ETF’s massive upleg by a solid 1.38x. GDXJ’s upside bested GDX’s.
Gold’s powerful initial upleg was followed by a massive correction in the second half of 2016, where it plunged 17.3% after Trump’s surprise election victory unleashed a huge stock-market surge on hopes for big tax cuts soon. The gold-stock carnage as gold plunged was great, with GDXJ plummeting 45.5% in just 4.1 months. Interestingly that leveraged GDX’s downside by 1.20x, much less than in the preceding upleg.
Ever since, the gold stocks have been mostly stuck in a big consolidation trading range. Enthusiasm for this sector waned to nothing as general stocks kept powering higher in recent years which relegated gold to drift sideways as well. While this extraordinary gold-stock-bull disruption was highly unusual, it was the result of record U.S. corporate tax cuts levitating the stock markets. That one-off event finally passed in 2018.
If you go through all this gold-stock bull’s uplegs, GDXJ’s gains outpaced GDX’s by an average of 1.39x! Ranging from 1.30x on the low side to 1.51x on the high side, there was not a single gold-stock upleg in recent years where GDXJ didn’t majorly outperform GDX. Taking GDX’s usual 2x to 3x leverage to gold and adding another 39% of marginal GDXJ gains on top of that is impressive. What trader wouldn’t want that?
GDXJ’s much-superior upside in this young bull is also accompanied by outsized downside relative to GDX during gold-stock corrections. That’s logical, as bigger mid-tier gold-stock gains in preceding uplegs leave more room to sell off in subsequent corrections. Interestingly though, GDXJ’s downside leverage averaging 1.34x is a bit lower than its upside leverage in uplegs. That is skewed to the high side as well.
It ranged from a low of 1.07x in the latest gold-stock selloff last summer and autumn to a staggering 1.77x in spring 2017. That outlier was the result of GDXJ’s gold miners surging far faster than GDX’s in early 2017. Without that anomaly, GDXJ’s downside leverage to GDX during corrections averages only 1.20x. That is merely about half its upside leverage, so GDXJ’s added risks are disproportionally smaller than its better upside.
Given all this, there is really no reason to bother with GDX at all if you are deploying capital in major gold-stock ETFs. GDXJ has better mid-tier gold miners growing their production while trading at lower market caps than the struggling majors. GDXJ has demonstrated much-better upside during gold-stock uplegs throughout this young bull, yet its downside during corrections isn’t proportional. GDXJ is far superior.
That being said, investors and speculators are much better off avoiding these major gold ETFs entirely! While GDXJ is nowhere near as bad as GDX, both are still burdened by major gold miners with declining production and rising costs. It doesn’t make any sense to own such laggards when they can be avoided entirely in favor of mid-tiers and true juniors with great fundamentals like growing production and stable costs.
The best strategy for riding this reaccelerating gold bull to wealth-multiplying gains in gold stocks is to carefully handpick the best mid-tier gold miners mostly included in GDXJ. Every quarter I break out this ETF’s top 34 and look at their production, costs, operating cash flows, earnings, and sales trends among others. That exercise helps separate the gold miners with better fundamentals from the lagging weaker ones.
So instead of just settling and owning GDXJ, even-better gains are highly probable by sticking to mid-tiers and juniors with superior fundamentals. They rank lower in GDXJ’s weightings and are usually growing their production organically or through new mine builds that recently came online or will soon be live. With plenty of great gold miners in this sector, there’s simply no need to hold the laggards retarding even GDXJ.
With gold stocks now enjoying a major upside breakout, massive new investment buying is coming. And the best gains by far will be won in smaller mid-tier and junior gold miners with superior fundamentals. While GDXJ itself will power dramatically higher despite some deadweight in its holdings, the better gold miners will generate much-greater wealth creation. Finding and owning these better gold-mining stocks is essential.
That’s one of my important missions at Zeal, relentlessly studying the gold-stock world to uncover the stocks with the greatest upside potential. The trading books in both our weekly and monthly newsletters are currently full of these better gold and silver miners. Most of these trades are relatively new, added in recent months as gold stocks recovered from deep lows. So it’s not too late to get deployed ahead of big gains!
To multiply your wealth in stocks you have to do some homework and stay abreast, which our popular newsletters really help. They explain what’s going on in the markets, why, and how to trade them with specific stocks. Walking the contrarian walk is very profitable. As of Q3, we’ve recommended and realized 1045 newsletter stock trades since 2001. Their average annualized realized gain including all losers is +17.7%! That’s double the long-term stock-market average. Subscribe today for just $12 per issue!
The bottom line is GDXJ’s upside easily bests GDX’s. While GDXJ is now really a mid-tier gold miners ETF instead of the junior one advertised, it holds some of the world’s best gold miners. Unlike struggling majors which dominate GDX, plenty of mid-tiers are still growing their production. They enjoy superior fundamentals and are weighted much more heavily in GDXJ than GDX, giving it much-better potential gains.
Throughout this entire young gold bull of recent years, GDXJ has well-outperformed GDX during gold-stock uplegs. While that has also led to bigger downside during corrections, it is disproportionally small compared to the upleg gains. GDXJ simply offers superior gold-stock sector exposure than GDX. But both these major gold-stock ETFs are still burdened with laggards dragging down their overall performances.
Adam Hamilton, CPA
January 14, 2019
Copyright 2000 – 2019 Zeal LLC (www.ZealLLC.com)
The gold stocks’ young upleg is really growing, on a trajectory to become major. This contrarian sector is breaking out to the upside on multiple fronts technically, which is really improving sentiment. Traders’ extreme bearishness of late summer has mostly abated, with bullish shoots taking root. Fundamentals certainly justify the mounting gold-stock buying, with earnings set to surge on higher gold prices in coming quarters.
This baby new year should prove far happier for gold stocks than 2018. This sector’s performance is measured by the share price of the flagship gold-stock investment vehicle, which is the GDX VanEck Vectors Gold Miners ETF. This week it held shares worth $10.5b in 46 major and mid-tier gold and silver miners from around the world. GDX is now 60.1x larger than the next-biggest 1x-long major-gold-miners ETF!
2018 was rough for the gold miners, with GDX slumping 9.3%. Weaker gold prices were to blame, as gold is the dominant driver of gold-mining earnings. While the yellow metal recovered to a mere 1.6% loss last year, it slumped much lower in late summer. By mid-August extreme record gold-futures short selling had pummeled it down 9.9% year-to-date. That eviscerated gold-stock psychology, scaring traders out.
The major gold miners’ stocks suffered a brutal forced capitulation in that gold low’s wake as stop losses were triggered leading to cascading selling. So by mid-September, GDX had cratered 24.4% YTD. This bloodbath really turned traders off from this small contrarian sector. But as I warned just days later back in mid-September near the lows, that extreme selling heralded the birth of a major new gold-stock upleg.
GDX has indeed powered higher on balance ever since, rallying 20.0% in 3.4 months by Christmas Eve. That was fueled by the roughly-parallel young gold upleg that climbed 9.3% by the middle of this week. Things are really looking up for the gold stocks. Investors and speculators alike are starting to remember the big upside this small sector enjoys in major uplegs. Key breakouts are confirming one is underway.
Several weeks ago I wrote an essay analyzing the imminent upside triple breakout in GDX. Closing at $20.12 that day, GDX was on the verge of surging back over $21. That is an exceedingly-important level for the major gold miners technically. This updated chart shows why, and reveals the gold stocks are now enjoying their longest and best-foundationed upleg in years. And it is going to grow a lot larger as gold rallies.
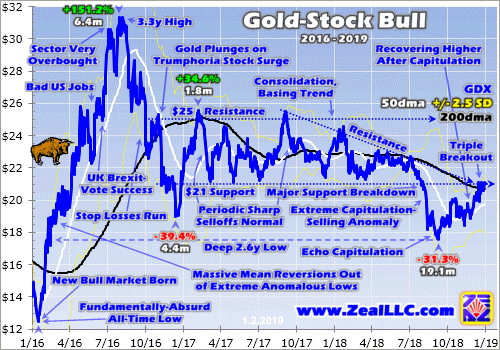
Three major upper resistance zones have converged at GDX $21. This was strong lower support for the gold miners’ stocks in a major consolidation basing trend that lasted for 21.5 months. It only failed in early August when gold was pounded by that extreme record futures short selling. Once they break, old support levels often become new resistance zones. Traders are wary to buy aggressively before they are overcome.
GDX $21 is also where the downward-sloping upper resistance line from gold stocks’ descending-triangle technical pattern has ended up. That connected the lower GDX highs that have vexed this sector since September 2017. The final and most-important resistance zone near GDX $21 is its key 200-day moving average. This essential line is usually the most-widely-watched by all the technically-oriented traders.
Market history has long shown 200dmas often prove the key dividing line between bull and bear markets. When prices surge back above their 200dmas after long periods underneath them, traders usually flood back in driving exploding upside momentum. 200dma upside breakouts often herald new bull markets or powerful uplegs within existing bulls. So GDX powering back over its 200dma is a major gold-stock buy signal.
While GDX has been meandering around $21 since Christmas Eve, that 200dma breakout has already happened! Since this leading gold-stock ETF’s 200dma is falling, the last time it was actually at $21 was in mid-November. This week the black 200dma line above has slumped to $20.72. A decisive breakout is 1% over that level. GDX achieved this milestone on December 18th, and has mostly maintained it since.
But with that 200dma still rounding to GDX $21, that is still the triple-resistance zone traders need to see left decisively behind. That critical upside breakout is happening before our very eyes! With GDX closing near $21.50, investors and speculators alike are going to consider the gold stocks off to the races. They will rush to buy and chase the upward momentum, accelerating it. This fuels major gold-stock uplegs.
The more capital traders deploy in gold stocks, the faster their share prices rise. The bigger their gains, the more traders want to buy. This virtuous circle of capital inflows has propelled past gold-stock uplegs to monstrous proportions. The last example of gold stocks powering higher out of major secular lows happened in largely the first half of 2016. The setup for that huge gold-stock upleg was very similar to today’s.
After being pummeled to a major secular low in mid-January 2016, selling was exhausted and buyers started to return. GDX began powering higher, spurred on by a parallel young gold upleg. GDX blasted up through its 200dma and capital flooded in. By the time that major buying ran its course, GDX soared an amazing 151.2% higher in just 6.4 months! Those kinds of returns are what give gold stocks their allure.
The necessary psychology to maintain that gold-stock momentum resulted from a relatively-minor 29.9% gold upleg in roughly the same span. The major gold miners of GDX leveraged and amplified gold’s gains by 5.1x! That was far better than the usual 2x to 3x because the gold stocks were so beaten down, trading at fundamentally-absurd levels when that upleg was born. Yet those huge gains still weren’t too exceptional.
Despite GDX’s mounting popularity as the leading gold-stock benchmark, this ETF is relatively new with a May 2006 birth. The previous secular gold-stock bull ran for 10.8 years, extending from November 2000 to September 2011. During that long span the classic HUI NYSE Arca Gold BUGS Index skyrocketed an astounding 1664.4% higher! The world’s most-hated sector today multiplied investors’ wealth by nearly 18x.
That was driven by a parallel 638.2% secular gold bull, which the major gold stocks of the HUI leveraged by 2.6x. The individual upleg cycles within that mammoth gold-stock bull show uplegs in this sector tend to be very large. Excluding the epic mean-reversion rebound out of late 2008’s first-in-a-century stock-market panic, the HUI enjoyed 11 normal uplegs. Their average gain was a staggering 80.7% over 7.9 months!
That last secular gold-stock bull offered traders 11 separate opportunities over 11 years to almost double their capital! So while GDX’s monster 151% upleg in H1’16 was definitely on the huge side, the last bull’s 81% average uplegs weren’t tremendously behind. When investment capital returns to gold stocks in a material way, their upside is massive. Today’s young GDX upleg could easily grow to 80%+ later this year.
Even a full-on doubling is fairly conservative considering how low gold stocks were hammered in early September’s cascading forced capitulation. GDX bottomed at $17.57 on September 11th, which was a deep 2.6-year low. A 100% gain from there would merely carry it to $35.14. That would be a new high for this gold-stock bull, as GDX last peaked at $31.32 in early August 2016. But GDX $35 is still relatively low.
Back in September 2011 as that last secular gold-stock bull crested, GDX peaked at $66.63 on close. It averaged $52.61 in the three full calendar years of 2010, 2011, and 2012. Gold-stock levels have been much higher on balance in the past. So seeing GDX double from its recent lows in this young upleg isn’t a stretch at all. And major gold-stock uplegs aren’t just a technical-buying-fueling-bullish-sentiment thing.
They are also supported by fundamentals. Gold-mining costs are essentially fixed during mine-planning stages. That’s when geologists and engineers decide which gold ore to mine, how to dig to it, and how to process that ore to extract the gold. Once hundreds of millions of dollars are spent to build the mines and mills, the mining costs generally don’t fluctuate much. Real-world data abundantly confirms this truth.
Every quarter I wade through the latest financial and operational reports of the top 34 GDX gold miners. They finished reporting their latest Q3’18 results in mid-November, which I painstakingly analyzed in an essay as usual. The top 34 GDX gold miners accounted for nearly 94% of this ETF’s total weighting. And their average all-in sustaining costs for producing each ounce of gold ran $877. That was right in line.
The previous four quarters’ top 34 GDX gold miners’ average AISCs came in at $868, $858, $884, and $856 averaging $867. So the major gold miners’ costs for producing gold don’t change much regardless of what the gold price is doing. Thus higher gold prices feed directly through to bottom lines in amplified fashion. Gold stocks’ earnings surge during gold uplegs, fundamentally justifying monster gold-stock gains.
In Q3’18 plenty of major gold miners actually reported that they expected AISCs to retreat in Q4’18 as production recovered out of various temporary setbacks. So I expect to see lower average AISCs among the top 34 GDX gold miners in their upcoming Q4 results. But let’s conservatively assume that Q3’18’s $877 average AISCs hold into Q4. Higher prevailing gold prices in Q4 portend bigger gold-mining profits.
The average gold price climbed 1.4% quarter-on-quarter in Q4 near $1228. That implies the major gold miners of GDX were earning $351 per ounce at $877 average AISCs. In Q3 the lower average $1211 gold price drove profits of $334 per ounce. So gold-mining earnings are likely to climb by at least 5.1% QoQ in Q4’18 results. That is 3.6x upside leverage to gold, so outsized gold-stock gains are righteous.
No one knows what gold will average in Q1’19, but I bet it’s going to be much higher than Q4’s $1228. Gold thrives during stock-market selloffs as investors remember diversifying their stock-heavy portfolios with alternative investments. And with burning stock markets rolling over into a young bear driven by full-speed Fed quantitative tightening, gold investment demand is likely to push gold higher for a long time to come.
But let’s assume gold does nothing on balance in Q1, and merely averages $1280 when the dust settles. That is still 4.3% higher sequentially from Q4. At $1280 gold prices and $877 AISCs, gold-mining profits in Q1 would run $403 per ounce. That is another 14.8% higher than Q4’s projected level, implying 3.4x earnings leverage to gold. As long as gold gradually climbs on balance, the gold stocks deserve to soar.
Because their profits surge much faster than gold, so do gold-stock prices. Gold stocks again tend to outperform gold by 2x to 3x during major uplegs. So if gold rallies 30%, GDX will usually power up 60% to 90%. The major gold miners’ stocks remain wildly undervalued relative to prevailing gold prices. Back in mid-October when GDX was just clawing back out of the $18s, I made that fundamental case in depth.
But while GDX is a fine sector investment vehicle with a lot to like, it’s not without its problems. In Q3’18 for example, the top 34 GDX gold miners saw their overall gold production retreat 2.9% year-over-year. The world’s 4 largest gold miners Newmont, Barrick, AngloGold, and Kinross suffered annual production drops of 2.0%, 7.6%, 14.6%, and 10.4% in Q3. Goldcorp’s plunged an anomalously-extreme 20.5% YoY!
These 5 major gold miners alone accounted for over 30% of GDX’s total weighting. Other gold miners among its top components are also struggling with production. While GDX has to own the biggest and best gold miners no matter how they are faring, their underperformance really drags down GDX’s upside. The biggest and fastest gold-stock price gains accrue in smaller mid-tier gold miners growing their production.
So instead of buying GDX, far better gains are highly probable from handpicking fundamentally-superior GDX-component stocks to own. These include mid-tier gold miners lower in GDX’s rankings that are still growing their production organically, or through new mine builds that recently came online or will soon be live. With plenty of great gold miners in this sector, investors and speculators have no need to hold laggards.
With GDX now enjoying a major upside breakout, massive new investment buying is coming. And the best gains by far will be won in smaller mid-tier and junior gold miners with superior fundamentals. While GDX itself will power dramatically higher despite the deadweight in its holdings, the better gold miners will generate much-greater wealth creation. Finding and owning these better gold-mining stocks is essential.
That’s one of my important missions at Zeal, relentlessly studying the gold-stock world to uncover the stocks with the greatest upside potential. The trading books in both our weekly and monthly newsletters are currently full of these better gold and silver miners. Most of these trades are relatively new, added in recent months as gold stocks recovered from deep lows. So it’s not too late to get deployed ahead of big gains!
To multiply your wealth in stocks you have to do some homework and stay abreast, which our popular newsletters really help. They explain what’s going on in the markets, why, and how to trade them with specific stocks. Walking the contrarian walk is very profitable. As of Q3, we’ve recommended and realized 1045 newsletter stock trades since 2001. Their average annualized realized gain including all losers is +17.7%! That’s double the long-term stock-market average. Subscribe today for just $12 per issue!
The bottom line is this young gold-stock upleg is growing. It is now surging in a major upside breakout that should unleash a flood of new buying. With gold climbing on balance too, everything is in place to fuel a major gold-stock upleg. That could easily portend a doubling in the major gold miners’ stocks from their recent deep lows. This sector’s technicals, sentiment, and fundamentals all support massive gains from here.
The higher gold stocks are driven, the more traders want to buy them to chase their outperformance. The more gold stocks rally, the more bullish sentiment becomes leading to mounting capital inflows. Higher gold prices justify all that fundamentally, as gold-mining profits leverage and amplify gold’s gains. This is the best gold-stock setup seen since early 2016, which led to GDX soaring 151% in just over a half-year.
Adam Hamilton, CPA
January 7, 2019
Copyright 2000 – 2019 Zeal LLC (www.ZealLLC.com)
Stock markets are forever cyclical, an endless series of alternating bulls and bears. And after one of the greatest bulls in U.S. history, odds are a young bear is now gathering steam. It is being fueled by record Fed tightening, bubble valuations, trade wars, and mounting political turmoil. Bears are dangerous events driving catastrophic losses for buy-and-hold investors. Different strategies are necessary to thrive in them.
This major inflection shift from exceptional secular bull to likely young bear is new. By late September, the flagship US S&P 500 broad-market stock index (SPX) had soared 333.2% higher over 9.54 years in a mighty bull. That ranked as the 2nd-largest and 1st-longest in U.S. stock-market history! At those recent all-time record highs, investors were ecstatic. They euphorically assumed that bull run would persist for years.
We humans naturally extrapolate present conditions lasting way out into the indefinite future. But long centuries of stock-market history have painfully proven that no bull lasts forever. Eventually they all lead to inherently-unsustainable fundamental, technical, and sentimental excesses. These can only be bled away and ultimately normalized by bear markets. So bull markets have always been followed by bears.
Bulls and bears are easily defined technically, 20%+ SPX moves uninterrupted by opposing 20%+ moves. The greatest stock bull in US history was the SPX’s 417.0% run over 9.46 years between October 1990 to March 2000. That climaxed in the tech-stock bubble, when wild optimism about stock-market fortunes reigned. Yet that soon gave way to tears as the subsequent bear mauled the SPX 49.1% lower in 2.6 years!
Stock investors suffering their wealth getting cut in half is typical in major bears. But the losses extend well beyond capital into far-more-scarce time. After that turn-of-the-century secular-bull peak, the SPX wouldn’t power decisively above those levels again until 12.9 years later in early 2013! That’s nearly a third of the 40 years average investors have between the ages of 25 to 65 to generate wealth to finance retirement.
If you can’t afford to lose half your stock-market wealth, and you don’t have time to wait for well over a decade for stock prices to fully recover, you better take this quarter’s market developments very seriously. Something snapped in the U.S. stock markets in early Q4’18, and the price action and volatility since reeks of a young new bear. While that diagnosis can’t be certain until the SPX falls 20%+, the signs are ominous.
As Q4’18 dawned, the U.S. Federal Reserve ramped its quantitative-tightening campaign to full speed. QT is necessary to start unwinding 6.7 years of quantitative easing ending in October 2014, during which the Fed conjured $3625b out of thin air to monetize bonds! QE was considered necessary to stimulate the economy after the Fed forced interest rates to zero in December 2008 during the first stock panic in a century.
Those trillions of dollars of QE capital injected by the Fed directly levitated the stock markets, artificially inflating an already-mature bull market to monstrous proportions. All those bonds accumulated on the Fed’s balance sheet, which skyrocketed 427% higher over that relatively-short QE span! The Fed can’t maintain $3.6t of bonds on its books forever, so it finally started letting them gradually roll off at maturity in Q4’17.
That unprecedented QT capital destruction started small, but was ratcheted up each quarter until Q4’18 when it reached its terminal velocity of $50b per month. The SPX achieved its latest all-time record high in late September, and then October was the first month ever of full-speed QT. The QE-levitated stock markets wilted under this QT onslaught, which was inevitable sooner or later. I warned about all this in advance.
Just a week after the SPX peaked in late September, I published one of my most-important essays ever. I unambiguously titled it “Fed QT is Bull’s Death Knell”, and it explained the stock-market impact of Fed QE in depth and why full-speed QT was certain to slay this bull. With the SPX just 0.6% under its recent record high on that final day of Q3’18, that warning fell on deaf ears. Maybe investors will pay attention now.
Fed QT is no flash in the pan, it is a long-term persistent threat to these lofty stock markets. In order to merely unwind half of that unfathomable $3.6t of Fed QE, full-speed QT at $50b per month will have to run for 30 months starting in Q4’18. Heading into 2019 the stock markets face another 27 months of this! And the Fed is loath to slow or stop its QT now underway on autopilot, as that could unleash panic-grade selling.
The Fed has long asserted the reason it is undertaking QT and has hiked rates 9 times since December 2015 is the US economy is strong. It wants to rebuild easing-ammunition stores to use in the inevitable coming recession. If the Fed caves on QT before its balance sheet shrinks much lower, traders will assume the Fed fears the US economy is in serious trouble. So they would flee stocks pummeling them far lower.
The die is cast on Fed QT, guaranteeing the long-overdue next stock bear. And the losses seen so far are just a small vanguard of what’s to come. This first chart superimposes the mighty SPX bull of the past decade on its so-called fear gauge, the VIX S&P 500 implied-volatility index. The recent Q4 trading action in both is unlike anything yet seen in this entire bull. It is looking far-more bear-market-like in character.
Major stock-market selloffs are defined based on size. Anything under 4% isn’t worth classifying, it is just normal market noise. Then from 4% to 10%, selloffs become pullbacks. In the 10%-to-20% range they grow into corrections. And of course beyond that at 20%+ they are in formal bear-market territory. This selloff snowballed darned close to beardom on Christmas Eve, the SPX plunging to a 19.8% loss over 3.1 months!
Just 4 trading days earlier before the latest FOMC decision, it was only down 13.1%. While that latest Fed rate hike was expected, the future-rate-hike outlook among top Fed officials wasn’t dovish enough for stock traders. Despite all the market carnage since the previous dot plot, their effective forecast for future rate hikes was merely lowered from 4 more to 3. So the SPX plunged 7.7% over the next 4 trading days!
Even before that this selloff hasn’t behaved like a normal bull-market correction. Their purpose is to vent excessively-bullish sentiment, rapidly bleeding off greed. Sharp selloffs are necessary to do that. Traders don’t get worried until stocks fall fast enough and far enough to shatter their complacency. So normal bull-market corrections are usually front-loaded with sharp selloffs that trigger soaring levels of fear.
Prevailing fear levels are inferred by the VIX, which technically measures the implied volatility in 1-month SPX options. Before last peaking in late September, the SPX suffered 5 bull-market corrections within its epic secular bull. Heading into July 2010 the SPX fell 16.0% in 2.3 months. That spawned some real fear, as evident in the VIX soaring to a 45.8 peak. The effective fear ceiling outside of panics and crashes is a 50 VIX.
The next SPX correction cascaded 19.4% lower over 5.2 months ending in October 2011. Despite its long span, the VIX skyrocketed as high as 47.5 in its midst. That was real fear, the kind necessary to slay exuberant greed and rebalance sentiment to keep an ongoing stock bull healthy. After that the SPX went a near-record 3.6 years without a single correction-grade selloff in an extraordinary levitation driven by the Fed.
That’s when its unique open-ended third quantitative-easing campaign was in full swing. QE3’s peak year was 2013 which saw the Fed monetize a staggering $1020b of bonds! The SPX soared 29.6% higher that year on such vast liquidity injections. But 2014 saw QE bond buying collapse to $450b as the Fed tapered QE3. The SPX only rallied 11.4% that year, its gains shrinking 62% in proportion with QE3’s 56% decline.
The QE3-goosed stock markets wouldn’t correct again until well after QE3 ended, the SPX sliding 12.4% over 3.2 months into August 2015. Again the VIX surged to 40.1, which is up in the very-high fear zone. The next debatable correction followed right after. The SPX didn’t achieve new highs after the previous one, so it was technically one compound correction instead of two separate ones. Analysts render it both ways.
That second correction or second part of the longer one saw the SPX fall 13.3% over 3.3 months into February 2016. That was the only bull-market exception that didn’t see a high VIX, it merely climbed to 28.1 at best. But since the VIX had just recently surged over 40 in a fear climax, another one apparently wasn’t necessary. That rolling-over SPX action into early 2016 actually looked more bear-like than bull-like.
Provocatively it took fully 13.7 months after that May 2015 topping for the SPX to finally hit new highs confirming its bull was alive. The thing that short-circuited what felt like a young bear was hopes for more European Central Bank easing after the UK’s surprise Brexit vote in late June 2016. Then the SPX again exploded higher in November 2016 after Trump’s surprise presidential victory with Republicans controlling Congress.
Optimism and greed exploded on hopes for big tax cuts soon, fueling a powerful stock-market surge into early 2018. The SPX then corrected sharply into early February with a 10.2% plunge in just 0.4 months. The VIX shot up to 38.8 on that, showing real fear. All bull-market corrections with the lone exception of the second part of that compound one exhibited telltale fear spikes averaging VIX peaks way up at 43.1.
But the recent SPX selloff of Q4’18 coinciding with the first-ever full-speed Fed QT looks way different. It has been mostly an orderly, gradual selloff generating modest fear. The highest VIX close between late September and pre-FOMC in mid-December was merely 25.8! Even on Christmas Eve it only hit 35.8. These are too low for normal sharp bull-market corrections, this fear profile is looking more like a bear downleg.
While bull-market corrections are supposed to shock and scare, bear-market downlegs start more subtlety. Instead of plunging fast then stabilizing, bear selloffs start slow then gather steam later. Bears begin in stealth mode, only gradually rolling over to prevent fear from spiking. Without big fear to wake them up and scare them out, investors complacently stay deployed as their losses slowly and inexorably mount.
Like the proverbial frog slowly being boiled alive, investors don’t realize the peril their capital is in during bear markets until way too late. The lack of normal bull-market-correction fear spike during this latest correction-grade selloff disturbingly suggests a new bear has awoken. And coming after such a massive and largely-artificial QE-inflated stock bull, the fearsome bear QT has to spawn should be proportionally large.
On Christmas Eve the SPX was forced close to a 20% bear-cub loss at 2345. That level was first seen in February 2017, and represents nearly 3/4ths of the post-Trump-election taxphoria rally being wiped out. 30% would drag the SPX back down to 2052, which were November 2014 levels right after the QE3 bond monetizations ended. 40% would crush the SPX to 1758, back to October 2013 levels killing 4.9 years of gains.
But after one of the biggest and longest stock bulls in U.S. history, it would be shocking if the subsequent bear didn’t lop off at least 50%. Especially given this bull’s artificial QE-inflated nature in an era where QE-conjured capital is being destroyed by QT. A 50% SPX loss from late-September’s peak would leave it at 1465. Those levels were first seen in this bull all the way back in September 2012, 6.0 years earlier.
While a 50%+ bear warning may sound sensational or overly dramatic, it’s actually fairly conservative. The SPX already suffered two bear markets since the tech-stock bubble peaked in March 2000. The first one ending in October 2002 mauled the SPX 49.1% lower over 2.6 years. The second one climaxing in the first stock panic in a century drove a far-worse 56.8% SPX decline in just 1.4 years ending in March 2009.
50% bears are totally normal after large bulls, even when they don’t have the amplifying dynamics of the first-ever colossal-scale Fed QE and QT. This overdue next bear has a great chance of growing bigger than normal after such a monstrously-grotesque bull. Most investors won’t figure this out until too late. Unlike bull-market corrections, high-fear VIX spikes soaring into the 40-to-50 range don’t ignite until later in bears.
While the extreme Fed tightening under this unprecedented full-speed QT campaign could easily drive a major stock bear alone, so could excessive valuations. When the SPX peaked in late September, its 500 elite stocks were collectively trading at literal bubble valuations! Extreme valuations are what usually cause stock bears, which exist to force stock prices back into line with corporations’ underlying earnings.
The classic honest way to measure valuations is through trailing-twelve-month price-to-earnings ratios. These take companies’ last four quarters of actual hard GAAP earnings, add them up, and divide them by companies’ prevailing stock prices. Unlike fictional forward earnings, real past results aren’t mere guesses about the future. Over the past century and a quarter or so, the U.S. stock markets averaged a 14x TTM P/E.
That’s long-term historical fair value, which is logical and reasonable. The reciprocal yield of 14x is 7.1%, an interest rate that is mutually beneficial to both pay and be paid for investment capital. Twice that at 28x earnings is the formal bubble threshold. As of the end of September just after the SPX peaked, its elite companies averaged a TTM P/E well into bubble territory at 31.4x earnings. They were dangerously overvalued.
This next chart looks at average SPX valuations in TTM P/E terms over the past couple decades or so. The 500 SPX components’ simple-average P/E is rendered in light blue. The dark-blue line shows it instead weighted by companies’ market capitalizations. The SPX is superimposed over the top in red, while a hypothetical fair-value SPX at 14x earnings is shown in white. This valuation picture is ominously damning.
The bubble valuations around the SPX’s late-September peak were nothing new. They had been above that 28x threshold continuously for 14 months since July 2017. Stocks were already expensive before Republicans swept the November 2016 elections kindling those exuberant big-tax-cuts-soon hopes. But they got a lot more expensive after that as stock prices soared way faster than corporate earnings since.
Again excessive valuations are what normally spawn stock bears. Stock prices get bid up too fast during bull markets for underlying earnings to justify. So bears follow bulls to drag stocks lower or just sideways for long enough for corporate profits to catch up with prevailing stock prices. These mean reversions after large bulls usually see valuations overshoot towards the opposite extreme before bears give up their ghosts.
So odds are this young stock bear won’t head back into hibernation until the stock markets’ average TTM P/E ratio per the elite SPX components actually falls under 14x. Major bears usually bottom with the SPX P/E in the 7x-to-10x earnings range, the former being half fair value when stocks are very cheap and screaming buys. Late in the last stock bear climaxing in March 2009, the SPX’s TTM P/E slumped to 12.6x.
But let’s be conservative and just assume this next bear, even with Fed QT, merely mauls stocks long enough to force a fair-value 14x P/E with no overshoot. Assuming corporate earnings don’t grow much which is a real possibility during a serious stock bear, that implies 51% downside from the SPX’s late-November levels. That was the latest month-end valuation data available when this essay was published.
Historical fair value sans earnings growth implies a bear-market bottom near SPX 1356, or 53.7% under late September’s peak! That’s right in line with historical major bear markets, nothing unusual. As bears generally last a couple years or so, modest underlying corporate-profits growth could lift that valuation-based bottoming target maybe 10% or so. That still implies a 49.1% total bear which isn’t to be trifled with.
The combination of wildly-unprecedented full-speed Fed QT slamming QE-inflated stock markets trading at bubble valuations is incredibly menacing. Seeing bear-market-like rolling-over selling behavior without big fear spikes in recent months strongly argues the overdue bear has awoken. But since all that selling has been concentrated fully within a single quarter, odds are most investors don’t realize how bad things are.
The biggest group of investors with the most capital are casual retirement investors who don’t closely follow the markets. They avoid much work and stress by paying other people to manage their money. These investors get statements showing their portfolios’ fortunes after every calendar quarter. At the end of Q3’18, everything still looked awesome with the SPX just 0.6% under its all-time high of a week earlier.
So the Q4’18 statements due out in January could prove shocking, spawning fear and galvanizing bearish psychology. The most-widely-held stocks in investment funds are the biggest and best ones led by the market-darling mega techs. While they were radically overvalued at the end of Q3, no one cared at that point. Everyone owned the largest US stocks including Apple, Amazon, Microsoft, Alphabet, and Facebook.
Add in the last FANG Netflix, and these 6 stocks alone commanded over 1/6th of the entire market cap of the SPX just before the Q4 selling started! Their average TTM P/E was a scary 80.2x earnings, 2.6x the entire SPX’s. Yet these beloved companies were believed to have such amazing businesses that they should be immune to economic slowdowns or stock-market selloffs. That myth was obliterated in Q4.
This SPX selloff first hit 10%+ correction territory on Black Friday with a 10.2% loss from its peak. On that same day, mighty Apple, Amazon, Microsoft, Alphabet, Facebook, and Netflix had collapsed 25.8%, 26.4%, 10.8%, 19.9%, 39.4%, and 38.2% from their recent all-time highs! They averaged 26.8% losses, or 2.6x the SPX’s. Many if not most investors’ Q4’18 portfolio results are going to look even worse than the SPX.
Will they start fleeing and adding to the selling pressure when these gaping holes in their precious capital are revealed? And while record Fed tightening and a mean reversion lower out of bubble valuations are the primary bear-market risks, they aren’t the only ones. The trade wars between the US and China and other countries are intensifying, and U.S. political turmoil will soar next year with Democrats controlling the House.
The epic corporate stock buybacks that helped levitate the stock markets in recent years will wane as the Fed forces interest rates higher. Trillions of dollars of these buybacks were debt-financed over the past decade. And as stock markets fall, Americans will feel poorer and spend less. This negative wealth effect will really weigh on record corporate profits, potentially driving them lower forcing valuations even higher.
The Fed’s QT isn’t the only howling central-bank headwind stock markets face. The European Central Bank is also halting its own massive QE bond monetizations starting in January! That will suck even more capital out of the system. Many of these bearish factors for stocks feed on each other too, with all combined wreaking more havoc on sentiment and stock prices than individual ones ever could in isolation.
Investors really need to lighten up on their stock-heavy portfolios, or put stop losses in place, to protect themselves from this young bear market. It’s only just beginning, with sub-20% SPX losses at worst a far cry from 50%+. Cash is king in bear markets, since its buying power grows. Investors who hold cash during a 50% bear market can double their stock holdings at the bottom by buying back their stocks at half-price.
Put options on the leading SPY S&P 500 ETF which perfectly mirrors the SPX can also be used to hedge downside risks. But options trading is risky, with 100% losses possible if the timing doesn’t work out. And cash doesn’t appreciate in value. So the best bear-market investment is gold, which tends to rally on surging investment demand as stock markets weaken. Gold investment grows wealth during stock bears.
Gold surged 30% higher in essentially the first half of 2016 in a new bull initially sparked by those late-2015 and early-2016 SPX corrections. Investors fled burning stocks and flocked to gold. And the gold miners’ stocks really leveraged those gains, rocketing 151% higher in that same timeframe. The gold stocks are not only wildly undervalued, but just breaking out technically which should accelerate their upside.
Absolutely essential in bear markets is cultivating excellent contrarian intelligence sources. That’s our specialty at Zeal. After decades studying the markets and trading, we really walk the contrarian walk. We buy low when few others will, so we can later sell high when few others can. While Wall Street will deny the growing stock-market bear all the way down, we will help you both understand it and prosper during it.
We’ve long published weekly and monthly newsletters for speculators and investors. They draw on my vast experience, knowledge, wisdom, and ongoing research to explain what’s going on in the markets, why, and how to trade them with specific stocks. As of Q3, we’ve recommended and realized 1045 newsletter stock trades since 2001. Their average annualized realized gain is +17.7%! That’s double the long-term stock-market average. For just $12 per issue, you can learn to think, trade, and thrive like contrarians. Subscribe today!
The bottom line is a young stock bear sure looks to be awakening. Q4’s rolling-over stock-market selling without big fear spikes is ominously classic bear-market behavior. And after such a monster bull, the next bear is long overdue. Unprecedented full-speed Fed QT colliding with bubble-valued U.S. stock markets artificially inflated by long years and trillions of dollars of Fed QE can’t end well. The reckoning is upon us.
Major bear markets follow major bull markets, often cutting stock prices in half over a couple years or so. And these inexorable bull-bear cycles are very unforgiving, as it can take over a decade for stock markets to regain bull highs once a bear starts ravaging. Gold is the refuge of choice, seeing investment demand surge as stock markets swoon. Prudent investors deploying in gold can grow their wealth during stock bears.
Adam Hamilton, CPA
December 31, 2018
Copyright 2000 – 2018 Zeal LLC (www.ZealLLC.com)
The dovish Federal Reserve lit a fire under gold and its miners’ stocks this week. As universally expected the FOMC hiked rates for the 9th time in this cycle. But it also lowered its 2019 rate-hike outlook bowing to the stock-market selloff. Traders dumped gold initially thinking that wasn’t dovish enough. But market reactions to the FOMC formed over a couple days, and gold surged overnight. Its post-Fed rally has great potential.
Gold-futures speculators dominate gold’s short-term trading action. They punch way above their weight in capital terms thanks to the extreme leverage inherent in gold futures. This week, the minimum margin for trading each 100-ounce contract controlling $125,000 worth of gold at $1250 was just $3400! These traders can run crazy maximum leverage as high as 36.8x, compared to the stock markets’ legal limit of 2x.
At 10x, 20x, or 30x leverage, every dollar of capital deployed in gold futures has 10x, 20x, or 30x more price impact on gold than a dollar invested outright. Further compounding speculators’ hegemony over gold prices, gold’s world reference price derives directly from US gold-futures trading. Naturally extreme leverage means extreme risk. At 37x a mere 2.7% gold move against positions wipes out 100% of capital risked!
In order to survive, gold-futures traders are forced to have an ultra-short-term focus. Their time horizons are measured in hours, days, and maybe weeks instead of months and years. And there is nothing that motivates them to trade aggressively like meetings of the Fed’s Federal Open Market Committee. Gold volatility often surges in their wakes, as speculators watch the U.S. dollar’s reaction and do the opposite in gold.
Gold-futures speculators are convinced Fed rate hikes are bearish for gold because they are bullish for the US dollar. They logically reason that the higher prevailing US interest rates, the more attractive the US dollar becomes relative to other currencies. And a stronger dollar usually means weaker gold since they are competing currencies. That all sounds rational, but the big problem is history doesn’t bear this out.
The FOMC started today’s rate-hike cycle way back in mid-December 2015, raising the federal-funds rate for the first time in 9.5 years. Gold-futures speculators fled leading into that, ultimately crushing gold to a deep 6.1-year secular low of $1051 the day after. But that oversold extreme marked the birth of a new bull market that would catapult gold 29.9% higher over the next 6.7 months! That same bull persists today.
In the 3.0 years since which includes this week’s 9th Fed rate hike of this cycle, gold is still up 18.1% and the US Dollar Index is down 2.1%. That’s no anomaly either. This is actually the Fed’s 12th rate-hike cycle since the early 1970s. During the exact spans of the prior 11, gold averaged strong gains of 26.9%! That was an order of magnitude higher than the stock markets’ 2.8% average gains per the flagship S&P 500.
Gold-futures speculators either don’t know market history or their extreme leverage forces them to run as a herd no matter how irrational that stampede is. They can’t afford to be wrong for long or risk suffering catastrophic losses. This week they apparently expected the FOMC to prove even more dovish on future rate hikes than it was. That led to volatile gold action surrounding this latest critical Fed decision on rates.
The FOMC meets 8 times per year, about every 6 weeks. But up until now, only every other meeting was accompanied by a Summary of Economic Projections and followed by the Fed chairman holding a press conference. That meant the Fed was only “live”, likely to hike rates, once a quarter at that every-other meeting. Incidentally Jerome Powell will start holding press conferences after every meeting starting in January.
That decision was made in mid-June, it had nothing to do with the recent stock-market volatility. Since the Fed doesn’t want to spook traders and ignite selloffs, rate hikes are well-telegraphed in advance. 3 weeks after each FOMC meeting, its full minutes are released. They are long and detailed, offering all kinds of clues about whether top Fed officials are thinking about hiking rates at the next FOMC meeting.
Market-implied Fed-rate-hike odds are always available through federal-funds futures trading. The big wildcard at each live FOMC meeting is a part of the SEP known as the “dot plot”. It collates where each individual top Fed official personally expects the federal funds rate to be in each of the next several years and beyond. It’s literally a bunch of dots plotted on a table, hence the name. It can really move gold futures.
Though Powell and other FOMC members stress the dot plot is not an official rate-hike forecast or outlook by the Fed, traders universally use it as such. A hawkish dot plot implies more future rate hikes than the previous one, and dovish less. Gold, currency, and stock-index futures speculators trade aggressively based on the quarterly changes in the dot plot. FOMC statements and press conferences also play roles.
At the FOMC’s previous meeting accompanied by a dot plot in late September, those forecasts implied top Fed officials expected this week’s rate hike, another 3 in 2019, and 1 final one in 2020. But market conditions were way different then. That decision came just 4 trading days after all-time record highs in the lofty euphoria-drenched U.S. stock markets. Top Fed officials are boldly hawkish when stocks look awesome.
In early October Powell doubled down on this hawkishness, saying in an evening speech that the federal-funds rate was “a long way from neutral at this point, probably” and that “We may go past neutral.” The very next day the stock markets started sliding and haven’t looked back since. By this Monday that selloff had gradually mushroomed into a moderate 13.1% correction in the S&P 500. Many blame it on Fed hawkishness.
Facing withering criticism led by president Trump himself, Powell tried to walk back his own many-more-rate-hikes-to-come outlook in late November after the S&P 500 had passed the 10% correction threshold. Powell said “Interest rates are still low by historical standards, and they remain just below the broad range of estimates of the level that would be neutral for the economy…” Stock selling was softening the Fed.
While traders fully expected the rate hike of this cycle Wednesday, they were sure the dot-plot outlook of future rate hikes would be far more dovish than late September’s 5 including this week’s. Gold rallied nicely in anticipation, climbing from $1214 before Powell’s second speech to $1249 the day before this latest FOMC meeting. In the hours before this new dot plot’s release, gold was bid to a new upleg high of $1261.
Market expectations were for just 1 rate hike in 2019 compared to the previous 3 implied, followed by an actual rate cut in 2020! That seemed excessive, so I figured top Fed officials would kill one of the hikes next year leaving 2 in 2019 and remove 2020’s lone hike as well. While this latest dot plot was indeed dovish as expected, it wasn’t dovish enough. 2019’s outlook shrunk to 2 more hikes, and 2020’s kept that final one.
So instead of going from 4 future hikes down to 1 or 2 as hoped, the dot plot only retreated from 4 to 3. Both dollar-futures and gold-futures speculators expected more dovishness, leading to moderate gold selling after the dot plot. Gold fell from $1251 just before its release to $1242 a couple hours later, and closed 0.6% lower on the day. Stock markets fared worse, the S&P 500 falling 1.5% to a new correction low!
But the impact of FOMC decisions usually takes a day or two to settle out. They are released at 2pm New York time when Asian and European markets are closed. So until foreign traders get their chances to react to the Fed, the market outcome isn’t known. Even American traders have to get past their initial kneejerk reactions, so the next trading day following the FOMC is crucial as actual implications sink in.
Gold was slowly bid heading into Thursday in Asian markets, heading back up near $1248 by the time Europe was opening. And then gold quickly surged to $1256, a new closing upleg high. In U.S. afternoon trading the day after this FOMC decision, gold surged as high as $1266! Top Fed officials’ future rate-hike outlook falling from 4 to 3 might not have been dovish enough, but it was still certainly dovish absolutely.
Seeing the Fed waver on future rate hikes in response to the mounting stock-market selloff this quarter is super-bullish for gold and its miners’ stocks going forward. Both gold-futures speculators and normal investors remain way under-deployed in gold, with vast room to buy. Odds are this week’s dovish FOMC will accelerate major gold and gold-stock uplegs. That’s happened after past Fed rate hikes in this cycle too.
This first chart superimposes gold prices over the total gold-futures long and short contracts speculators hold, which are rendered in green and red respectively. All 9 Fed rate hikes of this cycle are highlighted in blue. Gold has often surged strongly on gold-futures buying in recent years following FOMC rate-hiking decisions, or more precisely dot-plot changes in the future rate-hike outlook. Gold is set up to surge again.
Again, this entire gold bull was born the day after the Fed’s first rate hike of this cycle, resulting in that big initial 29.9% gold upleg over 6.7 months in essentially H1’16. That left gold overbought so it started to correct like normal. But that was greatly exacerbated by Trump’s surprise election victory which ignited a monster stock-market rally on hopes for big tax cuts soon. Investors aggressively fled gold to chase stocks.
But gold bottomed in mid-December 2016 the day after this cycle’s second rate hike, and soon started surging sharply higher. Yet gold-futures speculators didn’t learn their lesson, and continued to dump gold heading into FOMC decisions with expected rate hikes. Gold rallied strongly immediately out of the 3rd, 5th, and 6th hikes of this cycle, and soon after the 4th and 8th. Rate hikes have definitely proven bullish for gold!
The 7th rate hike in mid-June 2018 was a major exception. Gold fell sharply in subsequent days as gold-futures speculators lapsed into a stunning extreme record orgy of short selling. Initially sparked by a U.S. dollar rally, that epic gold-futures shorting soon took on a life of its own driving total short contracts to their highest levels ever by far! That ultimately blasted gold to a deep and unsustainable 19.3-month low in mid-August.
Most of that shorting spree has been covered since, fueling most of gold’s young upleg since. But the long-side gold-futures speculators who control much more capital than short-side guys have barely started to buy. Short covering is legally mandated to repay the debts incurred by borrowing to short sell. But long buying is totally voluntary, speculators have to believe gold is heading higher to make leveraged bets on it.
At the end of November the day before Powell’s about-face on how far rates were from neutral, the total gold-futures longs held by speculators had crumbled to just 204.9k contracts. That was a serious 2.9-year low, levels last seen in late January 2016 just as this gold bull was starting to march higher. So gold-futures speculators are nearly as under-deployed in gold as they were near the end of its last secular bear!
That leaves vast room for them to buy to reestablish normal positions. Back in essentially the first half of 2016, speculators added 249.2k longs while covering 82.8k shorts to help catapult gold 30% higher. It’s amazing to see similar long-buying potential today, with speculators’ total longs running just 7% up into their past year’s trading range. We’re nearing the tipping point where short covering ignites far-bigger long buying.
Gold bull uplegs have 3 distinct stages that trigger and unfold in telescoping fashion. They all start out of major lows with that mandatory gold-futures short covering, the first stage. That eventually pushes gold high enough for long enough to entice long-side gold-futures speculators to return, the second stage. I suspect this week’s dovish FOMC meeting could prove the catalyst that ignites big stage-two gold buying.
This latest dot plot may not have been dovish enough for traders, but Fed dovishness will snowball with stock-market weakness. The lower the stock markets slide, whether or not Fed hawkishness is really to blame, the more pressure on the FOMC to slow or even stop its future-rate-hike tempo. Gold-futures speculators will crowd into gold to chase its upside momentum with their feared rate-hike boogeyman fading.
But all the stage-one and stage-two gold-futures buying that fuels young gold uplegs is just the prelude to far-larger stage-three investment buying. After gold’s upleg grows large enough and lasts long enough to spawn investor interest, their capital inflows soon dwarf anything the gold-futures speculators could ever manage. There’s also precedent in this cycle for Fed rate hikes soon leading to surging gold investment demand.
A great high-resolution proxy for gold investment-demand trends is the amount of physical gold bullion held in trust by the dominant GLD SPDR Gold Shares gold ETF. It effectively acts as a conduit for the vast pools of American stock-market capital to slosh into and out of gold. Just a couple weeks ago I wrote an essay on how GLD works and why it is critically important to gold prices, especially during stock selloffs.
This next chart looks at GLD’s holdings superimposed over the gold price, with all 9 Fed rate hikes of this cycle highlighted. While gold-futures trading usually dominates gold prices, it is still easily overpowered by material flows of American stock-market capital into or out of gold via GLD. Investors have started to return to gold again on the stock-market selloff, and this prudent reallocation should accelerate on Fed dovishness.
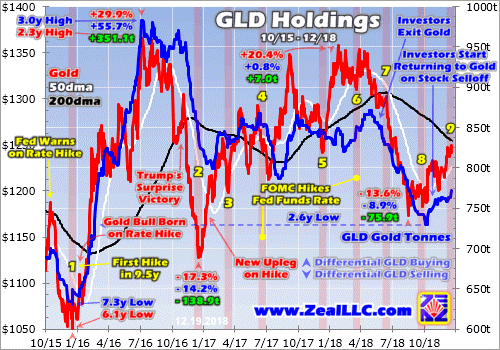
The last time American stock investors were worried enough about stock-market selloffs to redeploy into gold for refuge was that first half of 2016. Since gold is a rare counter-moving asset that tends to rally as stock markets weaken, investment demand soars when the S&P 500 slides long enough to ignite serious concerns. We’re certainly getting to that point again, as worries are mounting about this latest major selloff.
Gold went from being left for dead in mid-December 2015 to surging 29.9% higher in just 6.7 months solely on American stock investors returning! This is no generalization, the hard numbers prove it without a doubt. The world’s best gold fundamental supply-and-demand data comes from the venerable World Gold Council. It releases fantastic quarterly reports detailing the global buying and selling happening in gold.
Gold blasted higher on stock weakness in Q1’16 and Q2’16. According to the latest data from the WGC, total world gold demand climbed 188.1 and 123.5 metric tons year-over-year in those key quarters. That was up 17.1% and 13.2% YoY respectively! But the real stunner is exactly where those major demand boosts came from. It wasn’t from jewelry buying, central-bank buying, or even physical bar-and-coin investment.
In Q1’16 and Q2’16, GLD’s holdings alone soared 176.9t and 130.8t higher on American stock investors redeploying into gold after back-to-back S&P 500 corrections. Incredibly this one leading gold ETF accounted for a staggering 94% of overall global gold demand growth in Q1’16 and 106% in Q2’16! So there’s no doubt without American stock investors fleeing into gold via GLD this gold bull never would’ve been born.
Gold was holding those sharp gains throughout 2016 until Trump’s surprise presidential victory unleashed a monster stock-market run on hopes for big tax cuts soon. Gold was pummeled in Q4’16 as American stock investors pulled capital back out to chase the newly-soaring S&P 500. That quarter total global gold demand per the WGC fell 103.4t YoY or 9.0%. GLD’s 125.8t Q4’16 holdings draw accounted for 122% of that!
Fast-forward to summer 2018, and investors again started shifting out of gold to chase euphoric U.S. stock markets nearing new record highs. That forced GLD’s holdings to a deep 2.6-year low, investors hadn’t been so underinvested in gold since early in this bull market when they started flooding back in helping to catapult gold sharply higher. That gives them massive room to buy back in since their allocations are so low.
This mass exodus of American stock-market capital out of gold via GLD ended in mid-October the exact day the S&P 500 started plunging in what’s grown into this newest correction-grade selloff! Ever since GLD’s holdings have continued recovering on more capital inflows, helping to drive gold higher. This trend should only accelerate as stage-two gold-futures long buying on Fed dovishness further lifts gold prices.
Investors are often as momentum-driven as futures speculators, but over much-longer time horizons. So as this young gold upleg grows, gold is going to look much more attractive to them. Their desire to chase its upside performance is really intensified by material stock-market weakness. That makes gold stand out as not just a safe-haven capital-preservation hedge, but a way to grow wealth while everything else burns.
And as goes gold, so go the stocks of its miners. Last week I wrote a whole essay detailing the imminent major upside triple breakout in gold stocks likely to be triggered by a dovish FOMC. That indeed started to happen this week before the Fed, as this updated GDX chart shows! The GDX VanEck Vectors Gold Miners ETF is the leading gold-stock investment vehicle and benchmark, and remains poised for massive gains.
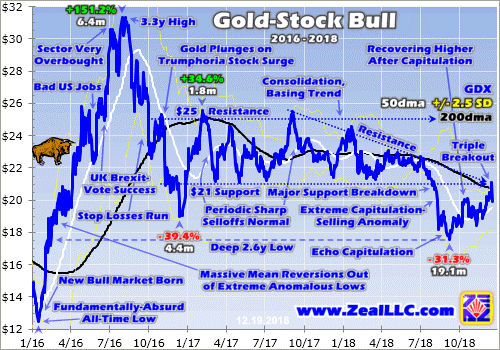
Three major resistance zones have converged at GDX $21. They include its 200-day moving average, past-year descending-triangle overhead resistance, and the old consolidation basing trend’s support. In anticipation of a gold rally on a dovish Fed, GDX closed above $21 on Tuesday. And in the hours before that FOMC decision Wednesday, it hit $21.47 intraday which was very-bullish decisive-breakout territory.
But when futures speculators bid the U.S. dollar higher and pushed gold lower on this latest dot-plot rate-hike outlook not being dovish enough, the gold stocks reversed hard. GDX plummeted a staggering 7.3% intraday across that FOMC decision! It closed 5.4% lower, making for absurd 9.0x downside leverage to gold’s small 0.6% Fed Day loss. That was a wildly-irrational downside anomaly that never should’ve happened.
In trying to figure out why after Wednesday’s close, I waded through dozens of gold stocks to see if there was some adverse news besides a not-dovish-enough FOMC. There was nothing. But provocatively in after-hours trading soon after the U.S. stock-market close, many if not most of the gold stocks had already regained 2/3rds to 3/4ths of that day’s crazy losses! So traders realized that kneejerk selloff wasn’t righteous.
Indeed right out of the gates Thursday GDX surged 4.1% higher erasing over 7/10ths of the extreme Fed Day losses. Remember market reactions to FOMC decisions usually aren’t fully apparent until the entire next trading day, after the implications have sunk in and overseas traders have reacted. Gold stocks’ major-upside-breakout thesis portending a powerful new upleg remains intact, the Fed likely accelerated it.
The beaten-down gold miners’ stocks remain the last cheap sector in the entire stock markets, a coiled spring ready to soar as gold returns to favor. The more shorts covered and longs bought by gold-futures speculators, and the more capital investors allocate back into gold, the greater the upside the gold miners’ stocks have as gold powers higher. Their potential gains are enormous, dwarfing anything else in 2019.
Again the last time major stock-market weakness rekindled gold investment demand was essentially the first half of 2016, when gold powered 29.9% higher. That drove a parallel monster 151.2% gold-stock upleg per GDX, making for huge 5.1x upside leverage. The gains in major gold stocks generally amplify gold upside by 2x to 3x, and smaller mid-tier miners with superior fundamentals tend to do much better than that.
The key to riding any gold-stock bull to multiplying your fortune is staying informed, both about broader markets and individual stocks. That’s long been our specialty at Zeal. My decades of experience both intensely studying the markets and actively trading them as a contrarian is priceless and impossible to replicate. I share my vast experience, knowledge, wisdom, and ongoing research through our popular newsletters.
Published weekly and monthly, they explain what’s going on in the markets, why, and how to trade them with specific stocks. They are a great way to stay abreast, easy to read and affordable. Walking the contrarian walk is very profitable. As of Q3, we’ve recommended and realized 1045 newsletter stock trades since 2001. Their average annualized realized gains including all losers is +17.7%! That’s double the long-term stock-market average. Subscribe today and take advantage of our 20%-off holidays sale!
The bottom line is this week’s FOMC decision is very bullish for gold and its miners’ stocks going forward. While only seeing 1 of 3 projected 2019 rate hikes axed wasn’t considered dovish enough, it still showed the Fed’s hawkish resolve is cracking. That dovishness will mount the longer stock markets remain weak, further shortening and shrinking this rate-hike cycle. That green lights capital returning to gold in a big way.
There is massive room to buy back in, with both speculators’ gold-futures longs and stock investors’ gold held via GLD just modestly above major multi-year lows. Dovish Fedspeak, weaker stock markets, and higher gold prices will really motivate them to reestablish normal gold positions and portfolio allocations. The gold miners’ stocks will be the major beneficiaries of higher gold prices, nicely leveraging gold’s gains.
Adam Hamilton, CPA
December 21, 2018
Copyright 2000 – 2018 Zeal LLC (www.ZealLLC.com)
If we want to know where Gold is going we should follow Gold. Right?
How about following gold stocks? At times, they lead Gold.
What about the U.S. Dollar? Wrong!
In 2019, one market more than any other will impact Gold.
That is the stock market.
History argues (within the current context) that when the Federal Reserve ends its rate hikes, Gold’s downtrend will be over and when the Fed cuts rates, the bull market shall begin.
Fed policy is dictated by economic data and financial conditions which of course can be reflected by the stock market, which is also a reflection of corporate profits.
Extended weakness in the stock market should bring the Fed that much closer to rate cuts. However, if the stock market is able to mount a decent counter trend rally in 2019, it could raise the possibility of another hike. Right now, the market expects no hikes in 2019 and even half of a quarter point cut in 2020.
Other than the cyclical bull market of 1985 through 1987, Gold has never enjoyed a real bull market without outperforming the stock market.
Below we plot Gold and Gold against the broad stock market (NYSE). Gold is still trading below a confluence of resistance ($1260-$1270) and the Gold to stock market ratio, while trading above its 200-day moving average has not broken out of its downtrend yet.
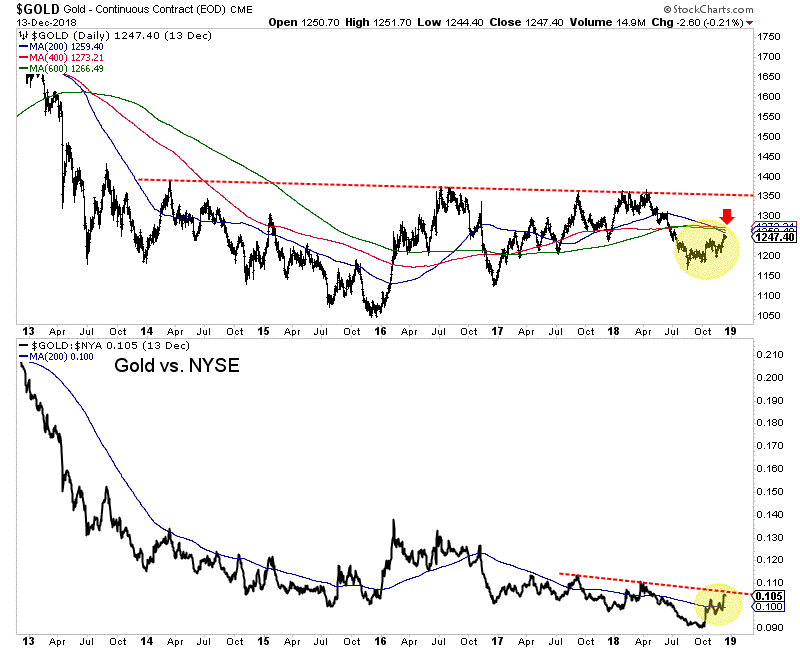
As we pen this, the stock market is breaking lower but Gold is also down and remains below a confluence of resistance at $1260-$1270/oz.
Is our thesis wrong?
The current weakness in equities has not completely changed Fed policy yet. Sure, the weakness in the equity market definitely could cause the Fed to pause its rate hikes and the market has already discounted that for 2019.
However, for the bull market in Gold to be ignited the Fed needs to move from a pause to the start of rate cuts. The current talk is about a pause, not rate cuts.
Hence, Gold is catching a bid and starting to perform better in real terms but has not reached bull market status yet.
Until Gold proves its in a bull market (and the market begins pricing in a rate cut) it would not be wise to chase strength. There will be plenty of time to get into cheap juniors that can triple and quadruple once things really get going. To prepare yourself for an epic buying opportunity in junior gold and silver stocks in 2019, consider learning more about our premium service.
The beleaguered gold stocks are recovering from their late-summer capitulation, enjoying a solid young upleg as investors gradually return. Their buying has pushed the leading gold-stock ETF near a major triple breakout technically. That event should really boost capital inflows into this sector, accelerating the rally. A major gold and gold-stock buying catalyst is likely imminent too, a more-dovish Fed this week.
The gold miners’ stocks have always been a small contrarian sector, a little-watched corner of the stock markets. But they’ve been even more unpopular than usual in recent months. That pessimistic sentiment is driven by price action, which has mostly proven poor in 2018. That’s really evident in the performance of the flagship gold-stock investment vehicle, the GDX VanEck Vectors Gold Miners ETF which is struggling.
As of the middle of this week, GDX was down 12.0% year-to-date. That leveraged gold’s YTD decline of 4.4% by 2.7x, which is perfectly normal. Because gold-stock earnings are heavily dependent on prevailing gold levels, gold-stock prices tend to amplify gold’s moves by 2x to 3x. That’s a double-edged sword, really profitable when gold rallies but cutting deeply when it retreats. The drawdowns are challenging to weather.
But gold stocks’ inherent leverage to gold is starting to work again on the upside, portending big gains ahead. This first chart looks at the major gold stocks’ technicals through the lens of GDX over the past several years. This sector soared in a new bull market, plunged with gold after Trump’s surprise election win goosed the stock markets, consolidated sideways to base, and then suffered an extreme capitulation selloff.

Investors and speculators often forget how explosive gold-stock upside is when gold is powering higher in an upleg. In largely the first half of 2016, GDX skyrocketed 151.2% higher in just 6.4 months! Capital just flooded back into the gold miners driven by a new gold bull’s parallel 29.9% upleg. That catapulted GDX to very-overbought levels and a 3.3-year high in mid-2016. So a normal correction got underway soon after.
GDX found support at its critical 200-day moving average, which is often the strongest support zone seen in ongoing bull markets. But that failed in November 2016 after an anomalous surprise. Trump defied the polling and odds to win the presidency while Republicans controlled both chambers of Congress. So the stock markets soared in that election’s wake on euphoric hopes for big tax cuts soon. Gold wilted on that rally.
So the gold stocks naturally followed it lower, again mirroring and amplifying its price action. After it had enjoyed stellar 5.1x upside leverage to gold in its powerful H1’16 upleg, GDX dropped 39.4% over the next 4.4 months. That leveraged gold’s own correction by 2.3x, relatively low in that usual 2x-to-3x range. GDX soon bounced sharply with gold and established a new consolidation trading range between $21 to $25.
The major gold stocks mostly meandered within that GDX range for 21.5 months. While it was vexing at times to see upside-breakout attempts fail, basing consolidations are very bullish. They provide time for bullish newer investors to acquire shares from bearish exiting ones, establishing new price norms well above previous bear-market lows. And the $23 midpoint of that GDX trading range proved relatively high.
This gold-stock bull was born out of fundamentally-absurd lows of GDX $12.47 in mid-January 2016. It peaked at $31.32 in early August that year. Oscillating around $23 on balance, GDX was basing 4/7ths up into its young bull’s entire range. The major gold stocks GDX holds were biding their time waiting for another major gold upleg to catapult them higher. They nearly broke out above $25 in early-September 2017.
But that attempt’s failure damaged psychology so traders gradually sold, this small contrarian sector left for dead. The subsequent lower highs over the next 10.4 months into mid-July 2018 formed a downward-sloping resistance line. Gold-stock prices were being compressed into a bearish descending triangle, as lower highs slumped ever closer to that major $21 support. This sector really needed a major gold rally.
Unfortunately the opposite happened this past summer, gold got hammered crushing the weakened gold stocks. The US stock markets were powering higher trying to regain record highs in July and August 2018, heavily retarding gold investment demand. On top of that the U.S. Dollar Index was surging too, both on expectations for more Fed rate hikes and an emerging-markets currency crisis led by the Turkish lira.
So gold-futures speculators started short selling gold at extreme record levels, blasting their aggregate downside bets far up into anomalous territory never before witnessed. Gold fell sharply on that record gold-futures shorting spree, dragging the struggling gold stocks down with it. So in early August GDX plunged and knifed through its longstanding $21 support. That major breakdown spawned self-feeding selling.
Gold stocks are an exceptionally-volatile sector not for the faint of heart. So it is essential to run loose trailing stop losses on gold-stock positions. While these protect investors from excessive losses, they greatly exacerbate selloffs. The lower gold stocks fell this past summer, the more stop losses were hit. These mechanical automatic sell orders then add to the downside pressure, pushing gold stocks lower still.
That vicious circle of selling begetting selling snowballed into an extreme capitulation in gold stocks, as GDX plummeted in August and early September. In just 5 weeks GDX collapsed 17.0%, far worse than gold stocks should’ve performed with gold merely slipping 1.4% lower in that span. That devastated already-shaky sentiment, leaving most investors and speculators to throw up their hands in disgust and flee.
But with GDX being pummeled to a deep 2.6-year low, the major gold stocks were wildly oversold. I explained all this in depth in an essay on gold stocks’ forced capitulation in mid-September. They were due to mean revert dramatically higher after that extreme selling anomaly. And that process has indeed been underway ever since. The gold stocks have been recovering, clawing their way out of those deep lows.
As usual gold stocks’ dominant primary driver has been gold, which has been grinding higher in its own young upleg as speculators cover their record gold-futures shorts. Investors started returning too when the lofty US stock markets began rolling over hard in mid-October. As of the middle of this week, GDX just hit a new upleg high of $20.45 on close. That extended gains since the capitulation low to 16.4% in 3.0 months.
Although considerable, the gold stocks’ rally still hasn’t grown large enough to return to the radars of contrarian investors. That could be about to change though as a rare triple breakout looks imminent! GDX, the leading gold-stock investment vehicle, is on the verge of simultaneous upside breakouts from its 3 major upper-resistance zones. That will likely unleash big gold-stock buying from technically-oriented traders.
These major resistance levels have all converged near $21. The first and most important is GDX’s key 200-day moving average, which was $20.78 this week. 200dmas are seen as the dividing line between bull and bear markets. When prices surge back above 200dmas after long periods underneath them, the upside momentum often explodes. Traders love chasing gains and 200dma breakouts portend big ones.
The past few years have several examples of gold stocks surging dramatically after 200dma breakouts. The main one was in early February 2016, when GDX rocketing back over its 200dma after deep lows confirmed a new bull market was underway. The great majority of its initial massive 151.2% upleg came after that 200dma upside breakout. Another upleg surged after a 200dma breakout in mid-August 2017.
The latest one came in late December 2017, although that was truncated early by gold stalling out. Realize that no technical line is more important to traders than 200dmas. When they see major gold stocks power decisively back over their 200dma as measured by GDX, they are likely to rush to buy in to ride the momentum. Like selling, buying begets buying. The more gold stocks rally, the more traders want them.
That imminent 200dma breakout will be all the more potent as a new-upleg signal because 2 other major resistance lines have converged there. That downward-sloping resistance line of the descending triangle has also extended right on $21. So once GDX powers decisively above it, this past year’s vexing trend of lower highs will end. Traders will see that as evidence the major gold-stock trend is reversing to higher.
The final resistance line of that triple breakout is the major $21 support of GDX’s consolidating basing range that held rock solid for over a year-and-a-half. When prices fall, old support zones often become new overhead resistance. Traders tend to want to sell again when those old support levels near. So when GDX decisively breaks back out above $21, technical fears of that former support level will vanish.
Once back over $21, GDX will return to its multi-year consolidation basing trend between $21 to $25. So the triple breakout above that old support line, downward-sloping resistance line, and 200dma would set the stage for a sharp surge back towards the top of that old trading range. While GDX $25 isn’t very high in absolute terms, it’s still another 22.2% above this week’s levels. Such a rally would spark some excitement.
Because historical gold-stock uplegs have been so enormous, generating life-changing wealth, there is always latent gold-stock interest lurking. Contrarian investors and speculators alike sour on gold stocks when they are weak, but quickly return when they show technical signs of life. A GDX triple breakout sure qualifies as that! And much-higher gold-stock prices are certainly justified fundamentally, long overdue.
Gold miners’ earnings and thus ultimately stock prices are largely a function of gold levels. Mining costs are essentially fixed during mine-planning stages. So higher gold prices flow directly through to bottom lines in amplified fashion. This is easy to understand with an example. A month ago I waded through the Q3’18 results of GDX’s major gold miners. Their average all-in sustaining costs weighed in at $877 per ounce.
That is what it costs them to produce and replenish gold, and $877 was right in line with their previous 4 quarters’ average of $867. Those collective costs will remain stable even as gold’s upleg accelerates. At gold’s own extreme-futures-short-selling-driven bottom of $1174 in mid-August, the major gold miners of GDX were still earning about $297 per ounce. Such solid levels prove that capitulation wasn’t righteous.
Last Friday gold hit a new upleg high of $1248, up 6.3% from its anomalous late-summer lows. Imagine this young upleg grows to 30% like the H1’16 one, which is quite small by historical standards. That would leave gold near $1525. At those $877 average GDX AISCs, the major gold miners’ profits would rocket to $648 per ounce. That’s 118% higher on a 30% gold upleg! Big gold-stock upside is fundamentally justified.
The ratio between the closing prices of GDX and the dominant GLD SPDR Gold Shares gold ETF is an easy approximation of the critical fundamental relationship between gold-stock prices and gold levels. This last chart is updated from a mid-October essay where I explained why gold stocks are the last cheap sector in all the stock markets. The GDX/GLD Ratio shows gold stocks have vast room to mean revert higher.
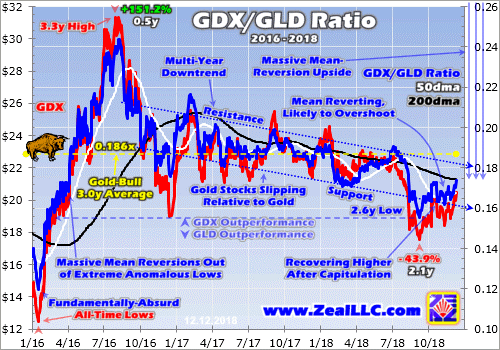
This GGR construct has averaged 0.186x during the 3.0 years of this current gold bull so far. This week the GGR clawed back to 0.174x, hitting its own 200dma. But at the gold stocks’ deep capitulation low in mid-September, the GGR plunged all the way down to 0.155x. That’s 0.031x below normal for this bull. After GGR extremes in either direction, this key ratio tends to mean revert the other way and overshoot proportionally.
That argues GDX is easily likely to surge far enough leveraging gold’s gains to regain a 0.217x GGR. That’s certainly not a high level even in the modest context of this gold bull. At this week’s $1245 gold levels which translated near $118 in GLD terms, GDX would have to surge to $25.56 to accomplish that normal mean-reversion overshoot. That’s another 25.0% higher, which would make for a solid upleg well worth riding.
And that GGR target is still incredibly low in longer secular context. In the 2 years before 2008’s first stock panic in a century, the GGR averaged 0.591x. Though gold stocks plummeted in the extreme fear that panic spawned, the GGR rebounded to average 0.422x in the 2 years after that epic anomaly. Over a longer 4-year post-panic span, it averaged 0.381x. So seeing it regain 0.217x is nothing, it should go far higher.
The bigger gold’s own upleg, the more the gold stocks will outperform by the usual 2x to 3x and force the GGR higher. At $1525 gold after a relatively-small 30% upleg, that 2009-to-2012 post-panic-average GGR of 0.381x would yield a GDX upside target around $55 per share. That’s 169% higher from this week’s levels, even without an overshoot! Gold-stock profits growth from higher gold prices justifies huge gains.
And rather conveniently on the verge of that GDX triple breakout, a major gold-buying catalyst is likely this week. On Wednesday December 19th, the Fed’s FOMC meets to decide on whether or not to hike rates for the 9th time in this cycle. That rate hike has been universally expected for months now, it is fully baked in. But the thing gold-futures and dollar-futures traders are really watching is the rate-hike forecast.
While the FOMC meets 8 times per year, at every other meeting it releases something called the dot plot. That summarizes where top Fed officials making the decisions think the federal-funds rate should be in coming years. The last dot plot was published on September 26th when the S&P 500 remained just 0.8% under its all-time record high from a week earlier. Fed officials are boldly hawkish when stocks are high.
But the stock markets soon fell apart in Q4’18, the first in history seeing full-speed quantitative-tightening monetary destruction by the Fed! Various Fed officials including the chairman have waxed more dovish since stocks started sliding. Fearing a negative wealth effect adversely impacting the US economy, their resolve to hike rates withers. So there’s a good chance this week’s dot plot will be more dovish than the last one.
Late September’s had effectively forecast 5 more Fed rate hikes including at next week’s meeting. So if this new dot plot shows less than 4 total rate hikes forecast in 2019 and 2020, dollar-futures speculators will likely sell motivating gold-futures speculators to buy aggressively. Fewer expected rate hikes are very bullish for gold, as proven in past dot plots. A great example was the 5th hike of this cycle in December 2017.
A year ago this week the FOMC hiked, but its dot-plot rate-hike forecast was dovish. Instead of upping it to 4 rate hikes in 2018 as traders expected, Fed officials left it at 3. So over the next 6 weeks, gold shot up 9.2% to $1358 on heavy gold-futures buying by speculators. A similar rally after next week’s meeting if the dot plot forecasts fewer rate hikes than the last one would drive gold right back up near $1360 again.
That’s on the verge of a major bull-market breakout which would likely unleash massive new investment buying. And any material gold rally will light a big fire under the gold stocks, rapidly driving them higher. That would put GDX’s triple breakout in the bag with haste. Nothing drives big capital inflows into the gold stocks faster than seeing them decisively rally. They are perfectly set up for major gains in coming months!
A big mean-reversion rebound higher is inevitable and likely imminent. While traders can play it in GDX, that’s mostly a bet on the largest gold miners with slowing production. The best gains by far will be won in smaller mid-tier and junior gold miners with superior fundamentals. A carefully-handpicked portfolio of elite gold and silver miners will generate much-greater wealth creation than ETFs dominated by underperformers.
The key to riding any gold-stock bull to multiplying your fortune is staying informed, both about broader markets and individual stocks. That’s long been our specialty at Zeal. My decades of experience both intensely studying the markets and actively trading them as a contrarian is priceless and impossible to replicate. I share my vast experience, knowledge, wisdom, and ongoing research through our popular newsletters.
Published weekly and monthly, they explain what’s going on in the markets, why, and how to trade them with specific stocks. They are a great way to stay abreast, easy to read and affordable. Walking the contrarian walk is very profitable. As of Q3, we’ve recommended and realized 1045 newsletter stock trades since 2001. Their average annualized realized gains including all losers is +17.7%! That’s double the long-term stock-market average. Subscribe today and take advantage of our 20%-off holidays sale!
The bottom line is the gold stocks are nearing a rare triple breakout. Three major GDX resistance zones have converged just above current levels. Once the gold stocks surge decisively over, the technically-oriented traders will take notice. They will likely start chasing the momentum accelerating the gains, with buying begetting buying. And gold stocks are so undervalued big gains are totally justified fundamentally.
This bullish outlook should be really bolstered by this week’s FOMC meeting. Worried about the recent stock-market selloff and surging volatility, top Fed officials are likely to dial back their rate-hike forecasts for next year. That will almost certainly hit the US dollar and goose gold. If gold surges again on a dovish dot plot like it has after other rate hikes in this cycle, the gold stocks will blast higher achieving that triple breakout.
Adam Hamilton, CPA
December 17, 2018
Copyright 2000 – 2018 Zeal LLC (www.ZealLLC.com)
The recent stock-market selloff is persisting, fueling mounting worries among investors. The intensifying volatility and lack of a quick rebound higher is strangling euphoric sentiment, spawning self-reinforcing selling pressure. Scoffed at a few months ago, the notions that a young bear market is underway and a recession looms are gaining traction. The great beneficiary of this ominous stock-market downturn will be gold.
Gold has always been an essential asset class for prudently diversifying investment portfolios. Uniquely it tends to rally when stock markets weaken, offsetting some of the losses in typical stock-heavy portfolios. Gold acts like portfolio insurance, usually soaring when stock markets plunge on unforeseen news. All throughout history, wise investors have recommended everyone have 5% to 10% of their portfolios in gold.
But like insurance in general, the important role gold plays in portfolios is gradually forgotten when it isn’t needed. Just a few months ago, the U.S. stock markets seemed invincible. The flagship S&P 500 broad-market stock index (SPX) had powered 333.2% higher over 9.5 years by late September. That made for the 2nd-largest and 1st-longest stock bull in U.S. history! Investors were convinced that would last indefinitely.
The SPX had surged 9.6% year-to-date by that latest peak, while gold had slumped 7.3%. Thus investors felt no need to allocate virtually any capital to gold, they were and are radically underinvested in it. This is especially true of American stock investors, who were wildly optimistic after long years of big stock-market gains. Their effective portfolio exposure to gold was vanishingly small back in late September.
The 500 elite stocks of the SPX had an extreme collective market capitalization way up at $26,141.4b as that topping month waned. It is interesting contrasting that with the physical gold bullion holdings of the world’s dominant gold exchange-traded fund, the American GLD SPDR Gold Shares. GLD has long been the go-to destination for American stock investors looking to allocate capital for gold exposure in their portfolios.
At the end of September as stock euphoria peaked, GLD’s total holdings were merely worth $28.4b. That implies American stock investors were running trivial gold allocations around 0.11%! That’s on the order of only 1/50th the minimum 5% that’s been universally advised for centuries if not millennia. So it’s not much of a stretch to argue American stock investors had zero gold exposure, they were effectively all-out.
The sharp stock-market selloff in the few months since those halcyon all-time record highs has surprised most, but it shouldn’t have. As Q4’18 dawned, something ominous happened that was unprecedented in stock-market history. The US Federal Reserve upped its quantitative-tightening campaign necessary to start unwinding its $3625b of quantitative-easing money creation over 6.7 years to its terminal velocity.
October 2018 would be the first month ever to see the Fed’s monetary destruction ramp to a staggering $50b-per-month pace. And even to unwind just half of the Fed’s radical QE, QT would have to keep on destroying $50b per month of QE-conjured money for 30 months! At the end of September when the SPX was just 0.6% off its all-time record high, I explained all this in depth warning it was this bull’s death knell.
And indeed within a week of Fed QT going full-throttle, the SPX started to slide. There was no way QE-levitated stock markets could ignore QT obliterating that QE money. Every daily selloff since had its own unique story and specific drivers, which I discussed and analyzed in our subscription newsletters. These all added up to enough selling to spawn an ongoing stock-market correction, an SPX selloff exceeding 10%.
Blame it on Fed QT, stock-market bubble valuations, mounting US-China trade-war threats, Republicans losing the House, or whatever you want, but by Black Friday the SPX had fallen 10.2% over 2.1 months since that euphoric record peak. The stock markets staged some sharp rallies within that span, but they quickly fizzled proving to be dead-cat bounces. This recent action is ominously looking very bear-market like.
We can’t know for sure whether the long-overdue new bear market driven by epic record Fed tightening is indeed upon us until the SPX falls 20%+ on a closing basis. This recent correction would still have to double to hit that bear-market threshold. But gold has certainly been the main beneficiary of the recent stock-market weakness. Investors are starting to remember the ages-old wisdom of diversifying into gold.
This week’s chart looks at the US-dollar gold price superimposed over the SPX during the past 4 years or so. Despite gold being forgotten in recent years as the stock markets surged ever higher, it remains in a young bull market. And that was spawned by the last set of back-to-back corrections in the SPX, which catapulted gold sharply higher. We’re likely on the verge of another stock-selloff-driven major gold upleg!
GLD’s physical-gold-bullion holdings held in trust for its shareholders reveal how American stock investors feel about gold. This past spring they started slumping as gold was sold to move even more capital into the lofty US stock markets. For 5 months in a row ending in September, GLD’s holdings retreated as investors dumped GLD shares faster than gold was falling. By early October GLD’s holdings hit a 2.6-year low.
I penned a whole essay on this stock-euphoria-driven gold exodus in late September, explaining why it was happening and why it was likely to soon reverse. And that shift in gold-investment sentiment began the very day the SPX started plunging in mid-October! Up until October 9th the stock markets looked totally normal, the SPX had only drifted a trivial 1.7% lower from its peak. Everyone remained wildly bullish.
But something snapped on October 10th, that fateful day the SPX plunged 3.3% out of the blue on no catalyst at all. Heavy technically-motivated selling accelerated led by the market-darling mega tech stocks. For years investors had believed them bulletproof, their businesses so good they could weather any stock selloff or economic slowdown. Fears surged on the worst SPX down day since back in early February.
That very day American stock investors started returning to gold. They poured capital into GLD shares so aggressively they forced a major 1.2% holdings build. GLD’s mission is to track the gold price, but it has its own supply-and-demand profile independent from gold’s. So when GLD shares are being purchased faster than gold is bought, GLD’s share price threatens to decouple to the upside on that excess demand.
So GLD’s managers must vent that differential buying pressure directly into the physical gold market in order to equalize it and maintain tracking. They do this by issuing enough new GLD shares to satisfy all the excess demand, and then plow the cash proceeds into gold bullion. Thus rising GLD holdings show American stock-market capital is flowing into gold. That proved to be GLD’s biggest build in 6.7 months.
That fateful day proved a major inflection point for both near-record US stock markets and the extremely-unpopular gold. As the SPX continued to weaken over the next couple months, GLD continued to enjoy modest builds on investment gold buying. By late November GLD’s holdings had climbed a considerable 4.5% over 6 weeks. That has helped push gold 5.5% higher since its mid-August lows, a solid young upleg.
Odds are that gold buying via GLD by American stock investors is only beginning. The longer this stock-market weakness persists, the deeper their worries will grow. And the more their stock-heavy portfolios bleed, the quicker they will remember they should’ve allocated 5% to 10% to gold. Once gold investment demand is kindled by falling stock markets, it tends to balloon dramatically and take on a life of its own.
Gold’s young bull market today that was forgotten this summer began as 2016 dawned. Much like this year, in the first half of 2015 the US stock markets were powering to dazzling new record highs. Since it seemed like stocks could do nothing but rally indefinitely, gold was forgotten and shunned. It slumped to a brutal 6.1-year secular low by mid-December 2015, with investors really wanting nothing to do with it.
But their ironclad euphoria started to crack soon after the stock markets corrected. In mid-2015 the SPX finally suffered its first correction in an incredibly-extreme 3.6 years after being levitated by relentless Fed money creation from its third quantitative-easing campaign. Gold caught a bid on that 12.4% SPX selloff over 3.2 months, but then faded again into the expected first Fed rate hike in 9.5 years in mid-December.
Then the SPX fell into another 13.3% correction over 3.3 months into early 2016. Seeing menacing back-to-back corrections after long years without one really deflated gold-suppressing stock-market euphoria. So in early 2016 American stock investors began prudently rediversifying their stock-dominated portfolios into gold. That birthed today’s gold bull, and the gold-buying momentum fed on itself to drive a powerful upleg.
Gold went from being left for dead in mid-December 2015 to surging 29.9% higher in just 6.7 months solely on American stock investors returning! This is no generalization, the hard numbers prove it without a doubt. The world’s best gold fundamental supply-and-demand data comes from the venerable World Gold Council. It releases fantastic quarterly reports detailing the global buying and selling happening in gold.
Gold blasted higher on SPX weakness in Q1’16 and Q2’16. According to the latest data from the WGC, total world gold demand climbed 188.1 and 123.5 metric tons year-over-year in those key quarters. That was up 17.1% and 13.2% YoY respectively! But the real stunner is exactly where those major demand boosts came from. It wasn’t from jewelry buying, central-bank buying, or even physical bar-and-coin investment.
In Q1’16 and Q2’16, GLD’s holdings alone soared 176.9t and 130.8t higher on American stock investors redeploying into gold after back-to-back SPX corrections. Incredibly this one leading gold ETF accounted for a staggering 94% of overall global gold demand growth in Q1’16 and 106% in Q2’16! So there’s no doubt without American stock investors fleeing into gold via GLD this gold bull never would’ve been born.
Gold was holding those sharp gains throughout 2016 until Trump’s surprise presidential victory unleashed a monster stock-market run on hopes for big tax cuts soon. Gold was pummeled in Q4’16 as American stock investors pulled capital back out to chase the newly-soaring SPX. That quarter total global gold demand per the WGC fell 103.4t YoY or 9.0%. GLD’s 125.8t Q4’16 holdings draw accounted for 122% of that!
Gold’s fortunes are being driven by American stock investors’ collective buying and selling of GLD shares. And nothing motivates them to redeploy capital into gold to diversify their stock-heavy portfolios like major SPX selloffs. Recent months’ one has already proven serious enough to rekindle differential GLD-share buying. And as H1’16 proved, once investors start driving gold higher its rallies tend to become self-feeding.
The more physical gold bullion American stock investors buy via GLD shares, the more gold climbs. The higher gold rallies, the more investors want to buy it to ride the momentum and chase its gains. So buying begets buying, driving gold higher fairly rapidly. And when stock markets are sliding, gold is often the only asset class rallying. That makes it even more attractive to investors getting pounded by sliding stocks.
This latest SPX correction is even more damaging to sentiment because it is 2018’s second one. Back in early February the SPX plunged 10.2% in 0.4 months, which started to crack sentiment. Back when this gold bull was born it was the second of back-to-back SPX corrections that proved the coup de grâce in hurting stock-market sentiment enough to unleash a reallocation into gold. This scenario is playing out again.
Provocatively seeing the three major US stock indexes suffer two 10%+ corrections within any single calendar year is itself a super-bearish omen. 2018 joined 1973, 1974, 1987, 2000, 2001, 2002, and 2008 as the SPX’s only other dual-correction years. Those coincided with a 48.2% SPX bear, a 20.5% single-day SPX crash, another 49.1% SPX bear, and a third 56.8% SPX bear! All three bears triggered recessions.
This stock-market weakness isn’t only likely to persist, but the odds really favor it snowballing into another major SPX bear market. Gold investment demand will naturally surge as stocks burn, fueling a strong bull market. Gold’s 29.9% gain over 6.7 months at best so far in this bull is nothing. Gold’s last secular bull from April 2001 to August 2011 saw it soar 638.2% higher! Gold’s gains as the SPX rolls over should be massive.
With a trivial 0.1% portfolio allocation to gold, what happens to gold prices if American stock investors just return to a still-immaterial 1.0%? That’s still way under the 5% to 10% recommended in normal times, and plenty of great investors believe 20% gold allocations are necessary during stock bears. Gold’s upside from here with virtually-zero US-stock-market capital allocated to it is vast. And it could accelerate rather fast.
The timing of this current SPX correction is likely to magnify bearish psychology. It has occurred entirely within Q4’18. The SPX exited Q3’18 just 0.6% off its record peak from a week earlier. So I suspect a lot of American retirement investors have no idea just how much carnage their precious capital has suffered. When they get their quarterly statements from their money managers in January, they could really freak out.
Even worse, far too much of this retirement capital was allocated to the market-darling mega techs which were the biggest holdings across most funds. Their losses have far outpaced the SPX’s. As of that latest correction low on Black Friday when the SPX was down 10.2%, Apple, Amazon, Microsoft, Alphabet, Facebook, and Netflix had collapsed 25.8%, 26.4%, 10.8%, 19.9%, 39.4%, and 38.2% from their all-time highs!
The mega techs that nearly single-handedly pushed the SPX higher for years averaged 26.8% losses, or 2.6x the SPX’s! When investors who don’t closely follow the stock markets figure that out next month, the investment demand for rallying gold ought to explode. The first half of 2019 has a setup much like H1’16, where gold essentially powered 30% higher. A similar upleg from mid-August’s lows isn’t a stretch at all.
Another 30% run from $1174 would leave gold at $1525. And once gold climbs decisively back over its bull-to-date high of $1365 from early-July 2016, investment interest and demand will soar. Just like the mega tech stocks, the higher gold prices the more investors want to buy it. A mere 16% gold upleg off August’s lows, or another 10% higher from this week’s levels, would near that psychologically-huge bull breakout!
All investors should always have 5% to 10% of their investable capital allocated to gold. But almost none do today as a long-overdue bear market fueled by epic record Fed QT looms. If you don’t have that core gold allocation, you need to get it in place before stocks fall much farther and gold surges much higher. The gold miners’ stocks will greatly leverage gold’s gains too, their leading index soared 182.2% largely in H1’16!
Absolutely essential in bear markets is cultivating excellent contrarian intelligence sources. That’s our specialty at Zeal. After decades studying the markets and trading, we really walk the contrarian walk. We buy low when few others will, so we can later sell high when few others can. While Wall Street will deny the coming stock-market bear all the way down, we will help you both understand it and prosper during it.
We’ve long published acclaimed weekly and monthly newsletters for speculators and investors. They draw on my vast experience, knowledge, wisdom, and ongoing research to explain what’s going on in the markets, why, and how to trade them with specific stocks. As of Q3, we’ve recommended and realized 1045 newsletter stock trades since 2001. Their average annualized realized gain is +17.7%! That’s double the long-term stock-market average. Subscribe today and take advantage of our 20%-off holidays sale!
The bottom line is this stock selloff is boosting gold. Flagging gold investment demand turned on a dime when the stock markets started plunging in mid-October. Gold has rallied on balance since as American stock investors start redeploying capital. Their buying alone via GLD shares was fully responsible for gold’s sharp 30% upleg in 2016’s first half. That followed the last back-to-back corrections in US stock markets.
And between record Fed tightening running full-throttle, continuing dangerous bubble valuations, and the mounting trade wars, this recent stock selling is likely to persist on balance. So gold investment will look far more attractive. Coming from virtually-zero gold portfolio allocations, investors have massive buying to do. The higher they push gold, the more other investors will chase it. Especially as US stock markets weaken.
Adam Hamilton, CPA
Copyright 2000 – 2018 Zeal LLC (www.ZealLLC.com)
December 3, 2018
The junior gold miners’ stocks have spent recent months mostly languishing near major multi-year lows. That spawned a sentiment wasteland riddled by bearishness and bereft of bids. But these companies’ battered stock prices aren’t fundamentally righteous, as proven yet again by their latest earnings season. Faring far better in a challenging third quarter than stock prices imply, they need to mean revert way higher.
Four times a year publicly-traded companies release treasure troves of valuable information in the form of quarterly reports. Companies trading in the States are required to file 10-Qs with the U.S. Securities and Exchange Commission by 40 calendar days after quarter-ends. Canadian companies have similar requirements at 45 days. In other countries with half-year reporting, many companies still partially report quarterly.
The definitive list of elite “junior” gold stocks to analyze comes from the world’s most-popular junior-gold-stock investment vehicle. Mid-month the GDXJ VanEck Vectors Junior Gold Miners ETF reported $4.1b in net assets. Among all gold-stock ETFs, that was second only to GDX’s $9.0b. That is GDXJ’s big-brother ETF that includes larger major gold miners. GDXJ’s popularity testifies to the great allure of juniors.
Unfortunately this fame created serious problems for GDXJ a couple years ago, resulting in a stealthy major mission change. This ETF is quite literally the victim of its own success. GDXJ grew so large in the first half of 2016 as gold stocks soared in a massive upleg that it risked running afoul of Canadian securities laws. And most of the world’s smaller gold miners and explorers trade on Canadian stock exchanges.
Since Canada is the centre of the junior-gold universe, any ETF seeking to own this sector will have to be heavily invested there. But once any investor including an ETF buys up a 20%+ stake in any Canadian stock, it is legally deemed to be a takeover offer that must be extended to all shareholders! As capital flooded into GDXJ in 2016 to gain junior-gold exposure, its ownership in smaller components soared near 20%.
Obviously hundreds of thousands of investors buying shares in an ETF have no intention of taking over gold-mining companies, no matter how big their collective stakes. That’s a totally-different scenario than a single corporate investor buying 20%+. GDXJ’s managers should’ve lobbied Canadian regulators and lawmakers to exempt ETFs from that 20% takeover rule. But instead they chose an inferior, easier fix.
Since GDXJ’s issuer controls the junior-gold-stock index underlying its ETF, it simply chose to unilaterally redefine what junior gold miners are. It rejiggered its index to fill GDXJ’s ranks with larger mid-tier gold miners, while greatly demoting true smaller junior gold miners in terms of their ETF weightings. This controversial move defying long decades of convention was done quietly behind the scenes to avoid backlash.
There’s no formal definition of a junior gold miner, which gives cover to GDXJ’s managers pushing the limits. Major gold miners are generally those that produce over 1m ounces of gold annually. For decades juniors were considered to be sub-200k-ounce producers. So 300k ounces per year is a very-generous threshold. Anything between 300k to 1m ounces annually is in the mid-tier realm, where GDXJ now traffics.
That high 300k-ounce-per-year junior cutoff translates into 75k ounces per quarter. Following the end of the gold miners’ Q3’18 earnings season in mid-November, I dug into the top 34 GDXJ components’ results. That’s simply an arbitrary number that fits neatly into the tables below. Although GDXJ included a staggering 70 component stocks mid-month, the top 34 accounted for a commanding 82.9% of its total weighting.
Out of these top 34 GDXJ companies, only 3 primary gold miners met that sub-75k-ounce-per-quarter qualification to be a junior gold miner! Their quarterly production is rendered in blue below, and they collectively accounted for just 3.8% of this ETF’s total weighting. GDXJ is inarguably now a pure mid-tier gold-miner ETF, not a junior one. But its holdings include the world’s best gold miners with huge upside potential.
I’ve been doing these deep quarterly dives into GDXJ’s top components for years now. In Q3 2018, fully 31 of the top 34 GDXJ components were also GDX components! These are separate and distinct ETFs, a “Gold Miners ETF” and a “Junior Gold Miners ETF”. So they shouldn’t have to own many of the same companies. In the tables below I highlighted the symbols of rare GDXJ components not also in GDX in yellow.
These 31 GDX components accounted for 79.2% of GDXJ’s total weighting, not just its top 34. They also represented 31.7% of GDX’s total weighting. Thus nearly 4/5ths of this “Junior Gold Miners ETF” is made up by nearly 1/3rd of the major “Gold Miners ETF”! These GDXJ components also in GDX are clustered from the 11th- to 30th-highest weightings in that latter larger ETF. GDXJ is mostly smaller GDX stocks.
In a welcome change from GDXJ’s vast component turmoil of recent years, only 4 of its top 34 stocks are new since Q3 2017. Their symbols are highlighted in light blue below. Thus the top GDXJ components’ collective results are finally getting comparable again in year-over-year terms. Analyzing ETFs is much easier if their larger components aren’t constantly in flux. Hopefully changes going forward are relatively minor.
Despite all this, GDXJ remains the leading “junior-gold” benchmark. So every quarter I wade through tons of data from its top components’ latest results, and dump it into a big spreadsheet for analysis. The highlights make it into these tables. Most of these top 34 GDXJ gold miners trade in the US and Canada, where comprehensive quarterly reporting is required by regulators. But others trade in Australia and the UK.
In these countries and most of the rest of the world, regulators only mandate that companies report their results in half-year increments. Most do still issue quarterly production reports, but don’t release financial statements. There are wide variations in reporting styles, data presented, and release timing. So blank fields in these tables mean a company hadn’t reported that particular data for Q3 2018 as of mid-November.
The first couple columns of these tables show each GDXJ component’s symbol and weighting within this ETF as of mid-November. While just over half of these stocks trade on US exchanges, the other symbols are listings from companies’ primary foreign stock exchanges. That’s followed by each gold miner’s Q3’18 production in ounces, which is mostly in pure-gold terms excluding byproduct metals often found in gold ore.
Those are usually silver and base metals like copper, which are valuable. They are sold to offset some of the considerable costs of gold mining, lowering per-ounce costs and thus raising overall profitability. In cases where companies didn’t separate out gold and lumped all production into gold-equivalent ounces, those GEOs are included instead. Then production’s absolute year-over-year change from Q3’17 is shown.
Next comes gold miners’ most-important fundamental data for investors, cash costs and all-in sustaining costs per ounce mined. The latter directly drives profitability which ultimately determines stock prices. These key costs are also followed by YoY changes. Last but not least the annual changes are shown in operating cash flows generated, hard GAAP earnings, sales, and cash on hand with a couple exceptions.
Percentage changes aren’t relevant or meaningful if data shifted from positive to negative or vice versa, or if derived from two negative numbers. So in those cases I included raw underlying data rather than weird or misleading percentage changes. This whole dataset together offers a fantastic high-level read on how the mid-tier gold miners as an industry are faring fundamentally. They actually did relatively well in Q3.
While this new mid-tier GDXJ is generally excellent, some decisions by its managers are utterly baffling. Out of all the world’s gold miners they could’ve added over this past year, they inexplicably decided on the giant largely-African AngloGold Ashanti. It produced an enormous 851k ounces of gold last quarter, the largest in GDXJ by far. It and the rest of the South African majors definitely don’t belong in GDXJ!
Remember that major-gold-miner threshold has long been 1m+ ounces per year. AU’s production is annualizing to well over 3x that, making this company the world’s 3rd-largest gold miner last quarter. Why on earth would managers running a “Junior Gold Miners ETF” even consider AngloGold Ashanti? It is as far from junior-dom as gold miners get. The same is true with the rest of the troubled South African gold miners.
AU, Gold Fields, Harmony Gold, and Sibanye-Stillwater mined 851k, 533k, 379k, and 309k ounces in Q3’18, all are majors. Yet they accounted for 13.1% of GDXJ’s total weighting. They are riddled with all kinds of problems too, from shrinking production to high costs to increasing stealth expropriations from South Africa’s openly-Marxist anti-white-investor government. Their inclusion heavily skews and taints GDXJ.
These South African majors’ Q3 production of 2.1m ounces was a whopping 41% of the GDXJ top 34’s total! And it still fell 7.0% YoY due to South Africa’s tragic death spiral. Excluding them and the amazing Kirkland Lake Gold which has grown so fast it was moved exclusively into GDX over this past year, the rest of the GDXJ top 34 grew production 3.4% YoY in Q3. The South African majors’ cost impact is even worse.
Mining in that country is very expensive thanks to very-old very-deep mines and endless new government interference via stifling regulations. In Q3 the South African majors’ cash and all-in sustaining costs came in really high averaging $925 and $1088 per ounce. The rest of GDXJ’s top 34 averaged $629 and $877, a massive 32.0% and 19.4% lower! The South African majors are really retarding GDXJ’s performance.
As struggling majors far larger than mid-tiers and juniors, they need to get kicked out of GDXJ posthaste. They can be left in GDX where they belong. AU effectively took KL’s place, which makes no sense at all fundamentally. Kirkland Lake produced 180k ounces of gold in Q3 at $351 cash costs and $645 AISCs. So unlike AU, KL remains solidly in the mid-tier realm and has been performing incredibly well operationally.
While GDXJ’s managers really dropped the ball including those South African majors, they deserve big praise for upping the weighting of the outstanding Australian miners. They are Northern Star Resources, Evolution Mining, Regis Resources, St Barbara, and Saracen Mineral. Their collective weighting in GDXJ grew to 21.7% at the end of Q3’s earnings season, nearly 2/3rds higher from their 13.3% a year earlier.
Unlike AU’s dumbfounding inclusion, the Australians’ rise is well-deserved. Their production surged 8.9% YoY to 686k ounces, or 23% of the GDXJ top 34’s total excluding those South African majors. And the Australian miners are masters at developing great gold deposits and controlling costs, as their cash costs and AISCs in Q3 averaged just $586 and $724! It’s fantastic GDXJ offers American investors this Aussie exposure.
GDXJ’s component list and weightings are a work in progress, and are gradually getting better. For years I’ve pointed out things like the South African majors that weren’t right, and GDXJ’s managers eventually seem to come around and change things for the better. Greatly helping that process is investors buying the better individual stocks like KL and shunning laggards like AU, readjusting their relative market capitalizations.
GDXJ and GDX are essentially market-cap weighted, with larger companies rightfully commanding larger weightings. These leading gold-stock ETFs’ managers can override this by deciding which gold miners to include in each ETF. So they can easily purge GDXJ of the deteriorating South African majors and add real mid-tier gold miners. But the true core problem is having so many of the same stocks in GDX and GDXJ.
Such massive overlap between these two ETFs is a huge lost opportunity for VanEck. It owns and manages GDX, GDXJ, and even the MVIS indexing company that decides exactly which gold stocks are included in each. With one company in total control, there’s no need for any overlap in the underlying companies of what should be two very-different gold-stock ETFs. Inclusion ought to be mutually-exclusive.
VanEck could greatly increase the utility of its gold-stock ETFs and thus their ultimate success by starting with one big combined list of the world’s better gold miners. Then it could take the top 20 or 25 in terms of annual gold production and assign them to GDX. Based on Q3’18 production, that would run down near 139k or 93k ounces per quarter. Then the next-largest 40 or 50 gold miners could be assigned to GDXJ.
Getting smaller gold miners back into GDXJ would be a huge boon for the junior-gold-mining industry. Most investors naturally assume this “Junior Gold Miners ETF” owns junior gold miners, which is where they are trying to allocate their capital. But since most of GDXJ’s funds are instead diverted into much-larger mid-tiers and even some majors, the juniors are effectively being starved of capital intended for them.
That’s one of the big reasons smaller gold miners’ stock prices are so darned low. They aren’t getting enough capital inflows from gold-stock-ETF investing. So their share prices aren’t bid higher. They rely on issuing shares to finance their exploration projects and mine builds. But when their stock prices are down in the dumps, that is heavily dilutive. So GDXJ is strangling the very industry its investors want to own!
Back to these mid-tier gold miners’ Q3’18 results, production is the best place to start since that is the lifeblood of the entire gold-mining industry. These top 34 GDXJ gold miners that had specifically reported Q3 production as of mid-November produced 5063k ounces. That surged by a massive 18.8% YoY, implying these miners are thriving. But that is heavily distorted by that huge 851k-ounce boost from AU’s addition.
Without the world’s 3rd-largest gold miner, the rest of the GDXJ top 34 saw their production slip 1.2% YoY to 4212k ounces. That reflected the peak-gold challenges the gold-mining industry is facing, as I discussed a couple weeks ago while reviewing the GDX majors’ Q3’18 results. The GDXJ top 34 are still outperforming the GDX top 34, which saw their gold production retreat 2.9% YoY in Q3 bucking historical trends.
Sequentially quarter-on-quarter from Q2’18 the GDXJ top 34’s production surged a dramatic 13.3%! And AU was already one of GDXJ’s top components then. That partially came from new mines ramping up at the world’s best mid-tier gold miners. It is far easier for them to grow production off lower bases than it is for the majors off high bases. That’s a key reason why the mid-tiers’ upside potential trounces that of the majors.
For all GDXJ’s faults, it does still offer investors exposure to much-smaller gold miners. The average quarterly production of all the top 34 GDXJ miners reporting it in Q3 was 163.3k ounces. That is 43% smaller than the 288.8k averaged by the top 34 GDX miners last quarter. And again AU’s crazy inclusion really skews this. Ex-AU, the GDXJ average falls to 140.4k. Without all the South African majors, it is 110.8k.
These annualize to 562k and 443k, both solidly in the mid-tier realm. Analyzing GDXJ’s production and costs requires breaking out those heavily-distorting South African majors that have no place in a mid-tier gold-miner ETF. Again their production fell 7.0% YoY in Q3, while the rest of the GDXJ top 34’s ex-KL grew 3.4%! Production and costs tend to be proportionally inversely related because of how mining works.
Gold-mining costs are largely fixed quarter after quarter, with actual mining requiring the same levels of infrastructure, equipment, and employees. The tonnage throughputs of the mills that process the gold-bearing ore are also fixed. So gold produced varies with ore grades each quarter. The more gold that is recovered, the more ounces to spread gold mining’s big fixed costs across. That lowers per-ounce costs.
There are two major ways to measure gold-mining costs, classic cash costs per ounce and the superior all-in sustaining costs per ounce. Both are useful metrics. Cash costs are the acid test of gold-miner survivability in lower-gold-price environments, revealing the worst-case gold levels necessary to keep the mines running. All-in sustaining costs show where gold needs to trade to maintain current mining tempos indefinitely.
Cash costs naturally encompass all cash expenses necessary to produce each ounce of gold, including all direct production costs, mine-level administration, smelting, refining, transport, regulatory, royalty, and tax expenses. In Q3’18, the overall cash costs of the GDXJ top 34 surged 8.4% higher YoY to $663 per ounce. That was still largely in line with the past four quarters’ $612, $618, $692, and $631 averaging $638.
But that sharp jump was mostly the result of the South African majors’ deepening troubles. Again their average cash costs last quarter were a whopping $925! Without them, the rest of the GDXJ top 34 averaged $629 per ounce which was only up 2.8% YoY and below the rolling-four-quarter mean. So the mid-tier gold miners of GDXJ are holding the line on cash costs, a sign their operations are fundamentally sound.
Way more important than cash costs are the far-superior all-in sustaining costs. They were introduced by the World Gold Council in June 2013 to give investors a much-better understanding of what it really costs to maintain gold mines as ongoing concerns. AISCs include all direct cash costs, but then add on everything else that is necessary to maintain and replenish operations at current gold-production levels.
These additional expenses include exploration for new gold to mine to replace depleting deposits, mine-development and construction expenses, remediation, and mine reclamation. They also include the corporate-level administration expenses necessary to oversee gold mines. All-in sustaining costs are the most-important gold-mining cost metric by far for investors, revealing gold miners’ true operating profitability.
The GDXJ top 34 reported average AISCs of $911 in Q3, up 3.8% YoY. But like cash costs, this was roughly in line with the $877, $855, $923, and $886 seen in the past four quarters. But again that was skewed quite a bit higher by those wrongly-included South African majors, which reported $1088 average AISCs in Q3. The rest of the top 34 averaged $877, which is actually better than the $885 four-quarter average.
So the South African majors are really tainting GDXJ’s collective operational performance, with lower production and higher costs dragging down this entire ETF. Those giant struggling gold producers are an albatross around the neck of the many great mid-tier gold miners in GDXJ! If you are a GDXJ investor, contact VanEck and urge them to boot the South African majors out of GDXJ to help it thrive going forward.
Gold-mining earnings are simply the difference between prevailing gold prices and all-in sustaining costs. And both sides of this equation moved the wrong way in Q3, squeezing the mid-tier gold miners’ profits. Q3’18’s average gold price of $1211 was 5.3% lower than Q3’17’s. And with overall GDXJ top 34 AISCs 3.8% higher at $911, that really cut into margins. These gold miners were collectively earning $300 per ounce.
That implied solid 25% profit margins absolutely, which aren’t bad. But they still plunged 25.4% YoY from Q3’17’s $402 per ounce, which amplified gold’s decline by 4.8x. But gold-mining profits leverage to gold is exactly why the gold stocks make such compelling investments. Gold stocks were weak in Q3 because gold was pounded to a deep 19.3-month low in mid-August on extreme all-time-record gold-futures short selling.
Left for dead and neglected, the gold miners’ stocks are the last cheap sector in these lofty bubble-valued stock markets. Their fundamental upside as gold mean reverts higher on speculators’ gold-futures buying and new investment demand as stock markets roll over is enormous. This is easy to understand with a simple example. In the last four quarters including Q3’18, the top 34 GDXJ gold miners’ AISCs averaged $894.
During gold’s last major upleg in essentially the first half of 2016, it powered about 30% higher driven by surging investment demand after stock markets suffered back-to-back corrections. That was even small by historical gold-bull-upleg standards. If we merely get another 30% gold advance from its recent mid-August low of $1174, we’re looking at $1525 gold. That would work wonders for gold-mining profits and stock prices.
At $1525 gold and $894 AISCs, the mid-tier gold miners would be earning $631 per ounce. That’s 110% higher than Q3’18’s $300! If gold-mining profits double, gold-stock prices will soar. Indeed during that last 30% gold bull in the first half of 2016, GDXJ rocketed 203% higher! So the gold-stock outlook is wildly bullish with gold itself due to power higher as the stock markets roll over on the Fed’s record tightening.
The rest of the top 34 GDXJ gold miners’ fundamentals were mixed last quarter. Cash flows generated from operations totaled $1.3b in Q3, down 21.2% YoY. That’s reasonable given average gold’s 5.3% YoY retreat and their leverage to it. Cash on hand remained high at $5.4b, down just 5.3% YoY. So these mid-tier gold miners have plenty of capital to build and buy new mines to continue growing their production.
Revenues only slipped 0.4% YoY to $4.1b, which means the softer gold prices were largely offset by higher production. But GAAP profits looked like a disaster, with the GDXJ top 34’s plummeting to a $379m loss in Q3’18 from being $212m in the black in Q3’17! That was far worse than the lower gold prices warranted, but thankfully it was mostly the result of big non-cash charges flushed through income statements.
Tahoe Resources reported a massive $170m impairment charge on its suspended Escobal silver mine that is being held hostage by the corrupt Guatemalan government. Yamana Gold wrote off $89m after selling a mine in Argentina. Explorer NOVAGOLD reported an $81m loss from discontinued operations on the sale of one of its projects. These three unusual items alone wiped out $340m of profits from GDXJ’s ranks.
Without them, the top 34 GDXJ gold miners’ earnings would’ve fallen to -$39m from +$212m. That isn’t great, but it doesn’t reveal any serious issues a rising gold price won’t quickly solve. Interestingly if KL was still included instead of AU, that would’ve added another $56m in Q3’18 profits. The mid-tiers’ overall earnings should dramatically leverage and outpace gold in coming quarters as it inexorably mean reverts higher.
While GDXJ should certainly no longer be advertised as a “Junior Gold Miners ETF”, it offers exposure to some of the best mid-tier gold miners on the planet. It’s really growing on me, I like this new GDXJ way better than GDX. That being said, GDXJ is still burdened by overdiversification and way too many gold miners that shouldn’t be in there. They are either too large, are saddled with inferior fundamentals, or both.
So the best way to play the gold miners’ coming massive mean-reversion bull is in individual stocks with superior fundamentals. Their gains will ultimately trounce the major ETFs like GDXJ and GDX. There’s no doubt carefully-handpicked portfolios of elite gold and silver miners will generate much-greater wealth creation. GDXJ’s component list is a great starting point, but pruning it way down offers far-bigger upside.
The key to riding any gold-stock bull to multiplying your fortune is staying informed, both about broader markets and individual stocks. That’s long been our specialty at Zeal. My decades of experience both intensely studying the markets and actively trading them as a contrarian is priceless and impossible to replicate. I share my vast experience, knowledge, wisdom, and ongoing research through our popular newsletters.
Published weekly and monthly, they explain what’s going on in the markets, why, and how to trade them with specific stocks. They are a great way to stay abreast, easy to read and affordable. Walking the contrarian walk is very profitable. As of Q3, we’ve recommended and realized 1045 newsletter stock trades since 2001. Their average annualized realized gains including all losers is +17.7%! That’s double the long-term stock-market average. Subscribe today and take advantage of our 20%-off holidays sale!
The bottom line is the mid-tier gold miners reported solid fundamentals despite a challenging third quarter for gold prices. Excluding the South African majors, they were able to grow their production nicely while holding the line on costs. That portends dramatic operating-cash-flow and earnings growth in the coming quarters as gold mean reverts higher on big investment buying. The mid-tier gold miners’ stocks will soar on that.
Gold stocks are not only unloved and dirt-cheap today, but they are a rare sector that rallies strongly with gold as general stock markets weaken. While virtually no one was interested in these leveraged plays on gold upside in recent months, that will change fast as these lofty stock markets roll over. And the mid-tier gold miners’ recent Q3 earnings season proved they remain ready to fundamentally amplify gold’s gains.
Adam Hamilton, CPA
Copyright 2000 – 2018 Zeal LLC (www.ZealLLC.com)
The major silver miners’ stocks have been largely abandoned this year, spiraling to brutal multi-year lows. Such miserable technicals have exacerbated the extreme bearishness plaguing this tiny contrarian sector. While profitable silver mining is challenging at today’s exceedingly-low silver prices, these miners are chugging along. Their recently-reported Q3’18 results show their earnings are ready to soar as silver recovers.
Four times a year publicly-traded companies release treasure troves of valuable information in the form of quarterly reports. Companies trading in the States are required to file 10-Qs with the US Securities and Exchange Commission by 40 calendar days after quarter-ends. Canadian companies have similar requirements at 45 days. In other countries with half-year reporting, many companies still partially report quarterly.
Unfortunately the universe of major silver miners to analyze and invest in is pretty small. Silver mining is a tough business both geologically and economically. Primary silver deposits, those with enough silver to generate over half their revenues when mined, are quite rare. Most of the world’s silver ore formed alongside base metals or gold. Their value usually well outweighs silver’s, relegating it to byproduct status.
The Silver Institute has long been the authority on world silver supply-and-demand trends. It published its latest annual World Silver Survey covering 2017 in mid-April. Last year only 28% of the silver mined around the globe came from primary silver mines! 36% came from primary lead/zinc mines, 23% copper, and 12% gold. That’s nothing new, the silver miners have long produced less than a third of world mined supply.
It’s very challenging to find and develop the scarce silver-heavy deposits supporting primary silver mines. And it’s even harder forging them into primary-silver-mining businesses. Since silver isn’t very valuable, most silver miners need multiple mines in order to generate sufficient cash flows. Traditional major silver miners are increasingly diversifying into gold production at silver’s expense, chasing its superior economics.
So there aren’t many major silver miners left out there, and their purity is shrinking. The definitive list of these companies to analyze comes from the most-popular silver-stock investment vehicle, the SIL Global X Silver Miners ETF. In mid-November at the end of Q3’s earnings season, SIL’s net assets were running 6.6x greater than its next-largest competitor’s. So SIL continues to dominate this tiny niche contrarian sector.
While SIL has its flaws, it’s the closest thing we have to a silver-stock index. As ETF investing continues to eclipse individual-stock picking, SIL inclusion is very important for silver miners. It grants them better access to the vast pools of stock-market capital. Differential SIL-share buying by investors requires this ETF’s managers to buy more shares in its underlying component companies, bidding their stock prices higher.
In mid-November as the silver miners were finishing reporting their Q3’18 results, SIL included 23 “Silver Miners”. Unfortunately the great majority aren’t primary silver miners, most generate well under half their revenues from silver. That’s not necessarily an indictment against SIL’s stock picking, but a reflection of the state of this industry. There aren’t enough significant primary silver miners left to fully flesh out an ETF.
This disappointing reality makes SIL somewhat problematic. The only reason investors would buy SIL is they want silver-stock exposure. But if SIL’s underlying component companies generate just over a third of their sales from silver mining, they aren’t going to be very responsive to silver price moves. And most of that ETF capital intended to go into primary silver miners is instead diverted into byproduct silver miners.
So silver-mining ETFs sucking in capital investors thought they were allocating to real primary silver miners effectively starves them. Their stock prices aren’t bid high enough to attract in more investors, so they can’t issue sufficient new shares to finance big silver-mining expansions. This is exacerbating the silver-as-a-byproduct trend. Only sustained much-higher silver prices for years to come could reverse this.
Silver miners’ woes are really exacerbated by silver’s worst performance in decades. In mid-November silver sunk to a 2.8-year low of $13.99. That naturally dragged down SIL to a similar 2.7-year low. But relative to gold which usually drives it, silver was faring far worse. The Silver/Gold Ratio sunk to 85.9x in mid-November, meaning it took almost 86 ounces of silver to equal the value of a single ounce of gold.
The SGR hadn’t been lower, or silver hadn’t been more undervalued relative to gold, since all the way back in March 1995! That’s pretty much forever from a markets perspective. With silver languishing at an exceedingly-extreme 23.7-year low relative to gold, it’s hard to imagine it doing much worse. So the silver miners are weathering one of the toughest environments they’ve ever seen, which we have to keep in mind.
Every quarter I dig into the latest results from the major silver miners of SIL to get a better understanding of how they and this industry are faring fundamentally. I feed a bunch of data into a big spreadsheet, some of which made it into the table below. It includes key data for the top 17 SIL component companies, an arbitrary number that fits in this table. That’s a commanding sample at 96.9% of SIL’s total weighting!
While most of these top 17 SIL components had reported on Q3’18 by mid-November, not all had. Some of these major silver miners trade in the UK or Mexico, where financial results are only required in half-year increments. If a field is left blank in this table, it means that data wasn’t available by the end of Q3’s earnings season. Some of SIL’s components also report in gold-centric terms, excluding silver-specific data.
The first couple columns of this table show each SIL component’s symbol and weighting within this ETF as of mid-November. While most of these stocks trade on US exchanges, some symbols are listings from companies’ primary foreign stock exchanges. That’s followed by each miner’s Q3’18 silver production in ounces, along with its absolute year-over-year change. Next comes this same quarter’s gold production.
Nearly all the major silver miners in SIL also produce significant-to-large amounts of gold! That’s truly a double-edged sword. While gold really stabilizes and boosts silver miners’ cash flows, it also retards their stocks’ sensitivity to silver itself. So the next column reveals how pure these elite silver miners are, approximating their percentages of Q3’18 revenues actually derived from silver. This is calculated two ways.
The large majority of these top SIL silver miners reported total Q3 revenues. Quarterly silver production multiplied by silver’s average price in Q3 can be divided by these sales to yield an accurate relative-purity gauge. When Q3 sales weren’t reported, I estimated them by adding silver sales to gold sales based on their production and average quarterly prices. But that’s less optimal, as it ignores any base-metals byproducts.
Next comes the major silver miners’ most-important fundamental data for investors, cash costs and all-in sustaining costs per ounce mined. The latter directly drives profitability which ultimately determines stock prices. These key costs are also followed by YoY changes. Last but not least the annual changes are shown in operating cash flows generated and hard GAAP earnings, with a couple exceptions necessary.
Percentage changes aren’t relevant or meaningful if data shifted from positive to negative or vice versa, or if derived from two negative numbers. So in those cases I included raw underlying data rather than weird or misleading percentage changes. This whole dataset together offers a fantastic high-level read on how the major silver miners are faring fundamentally as an industry. They are hanging in there quite well.
Production is naturally the lifeblood of the silver-mining sector. The more silver and increasingly gold that these elite miners can wrest from the bowels of the earth, the stronger their fundamental positions and outlooks. These top 17 SIL miners’ overall silver production slipped 2.2% YoY to 75.5m ounces in Q3’18. But their shift into more-profitable gold mining continued, with aggregate production up 1.6% YoY to 1.4m ounces.
According to the Silver Institute’s latest WSS, total world silver mine production averaged 213.0m ounces per quarter in 2017. So at 75.5m in Q3, these top 17 SIL components were responsible for 35.4% of that rate. There is one unusual situation that slightly skewed this result. SSR Mining, which used to be known as Silver Standard Resources, saw its silver production plummet 57% YoY as its lone silver mine is depleting.
The winding down of SSRM’s old Pirquitas silver mine is proceeding as forecast and has been going on for some time. This once major silver miner is morphing into a primary gold miner, which accounted for a record 94% of its revenue in Q3. Excluding SSRM, the rest of these top SIL silver miners saw their silver production retreat an immaterial 1.3% YoY. That’s pretty impressive given this year’s collapse in silver prices.
Q3’s average silver price was just $14.96, down a major 11.2% YoY. That was far-worse performance than gold, with its quarterly average merely sliding 5.3% lower between Q3’17 to Q3’18. Considering how miserable this silver-price environment is with the worst relative performance to gold in decades, the major silver miners are doing well on production. They continue to hold out for silver mean reverting higher.
Silver is likely so down in the dumps because it effectively acts like a gold sentiment gauge. Generally big silver uplegs only happen after gold has rallied long enough and high enough to convince traders its gains are sustainable. Then the way-smaller silver market tends to start leveraging and amplifying gold’s moves by 2x to 3x. But gold sentiment was so insipid over this past year that no excitement was sparked for silver.
Unfortunately at these bombed-out silver prices the economics of silver mining are way inferior to gold mining. The traditional major silver miners are painfully aware of this, and have spent years actively diversifying into gold. In Q3’18, the average percentage of revenues that these top 17 SIL miners derived from silver was just 36.9%. That’s right in line with the prior 4 quarters’ 39.3%, 35.3%, 36.8%, and 36.3%.
Silver mining is every bit as capital-intensive as gold mining, requiring similar large expenses for planning, permitting, and constructing mines and mills. It needs similar heavy excavators and haul trucks to dig and move the silver-bearing ore. Similar levels of employees are necessary to run these mines. But silver generates much lower cash flows due to its lower price. Consider hypothetical mid-sized silver and gold mines.
They might produce 10m and 300k ounces annually. At last quarter’s average prices, these silver and gold mines would yield $150m and $363m of yearly sales. Thus regrettably it is far easier to pay the bills mining gold these days. So primary silver miners are increasingly becoming a dying breed, which is sad. The traditional major silver miners are adapting by ramping their gold production often at silver’s expense.
With major silver miners so rare, SIL’s managers are really struggling to find components for their leading ETF. So in Q3’17 they added Korea Zinc, which is now SIL’s largest component at over 1/7th of its total weighting. In my decades of studying and trading this tiny sector, I’d never heard of it. So I looked into Korea Zinc and found it was merely a smelter, not even a miner. It really needs to be kicked out of SIL.
Every quarter since I’ve tried to dig up information on Korea Zinc, but its English-language disclosures are literally the worst I’ve ever seen for any company. Its homepage gives an idea of what to expect, declaring “We are Korea Zinc, the world’s one of the best smelting company”. I’ve looked and looked and the latest production data I can find in English remains 2015’s. I can’t find it from third-party sources either.
That year Korea Zinc “produced” 63.3m ozs of silver, which averages to 15.8m quarterly. That is largely a byproduct from its main businesses of smelting zinc, lead, copper, and gold. Korea Zinc certainly isn’t a major silver miner, and has no place in a “Silver Miners ETF”. No silver-stock investor wants to own a base-metals smelter! Korea Zinc should be removed, its overweighting reallocated to the rest of SIL’s holdings.
SIL investors ought to contact Global X to ask them to stop tainting their ETF’s utility and desirability with Korea Zinc. If they want it to be successful and grow, they need to stick with their mission of owning the major silver miners exclusively. Silver-stock exposure is the only reason investors would buy SIL. There is another situation investors need to be aware of with Tahoe Resources and its held-hostage Escobal mine.
Tahoe was originally spun off by Goldcorp to develop the incredible high-grade Escobal silver mine in Guatemala, which went live in Q4’13. Everything went well for its first few years. By Q1’17, Escobal was a well-oiled machine producing 5700k ounces of silver. That provided 1000+ great high-paying jobs to locals and contributed big taxes to Guatemala’s economy. Escobal was a great economic boon for this country.
But a radical group of anti-mining activists managed to spoil everything, cruelly casting their fellow countrymen out of work. They filed a frivolous and baseless lawsuit against Guatemala’s Ministry of Energy and Mines, Tahoe wasn’t even the target! It alleged this regulator hadn’t sufficiently consulted with the indigenous Xinca people before granting Escobal’s permits. They don’t even live around this mine site.
Only in a third-world country plagued with rampant government corruption would a regulator apparently not holding enough meetings be a company’s problem. Instead of resolving this, a high Guatemalan court inexplicably actually suspended Escobal’s mining license in early Q3’17! Tahoe was forced to temporarily mothball its crown-jewel silver mine, and thus eventually lay off its Guatemalan employees.
That license was technically reinstated a couple months later, but the activists appealed to a higher court. It required the regulator to study the indigenous people in surrounding areas and report back, and then needs to make a decision. The government also needs to clear out an illegal roadblock to the mine site by violent anti-mine militants, who have blockaded Escobal supplies and physically attacked trucks and drivers!
So Escobal has been dead in the water with zero production for 5 quarters now, an unthinkable outcome. This whole thing is a farce, a gross miscarriage of justice. I hope this isn’t a stealth expropriation, that Guatemalan bureaucrats will get their useless paperwork done sooner or later and let Escobal come back online. Within a year, Escobal’s silver production should return to pre-fiasco levels of 5700k ounces a quarter.
At that rate, Escobal would retake the throne of being the world’s largest primary silver mine! It would boost overall SIL-top-17 production by a massive 7.6%. Last year no one expected this unprecedented Escobal debacle to last very long, as the economic damage to Guatemala was too great. But as it drags on and on, TAHO stock has been decimated. It slumped to a brutal all-time record low in mid-November.
Sadly for long-suffering TAHO shareholders, management capitulated. In mid-November they agreed to sell the company to Pan American Silver at rock-bottom prices despite a 55% premium over that all-time low. That’s devastating for TAHO investors but a steal for PAAS, which is SIL’s 4th-largest component at 11.9% of its total weighting. That keeps Escobal’s huge production in SIL if PAAS can finesse its reopening.
Unfortunately SIL’s mid-November composition was such that there wasn’t a lot of Q3 cost data reported by its top component miners. A half-dozen of these top SIL companies trade in South Korea, the UK, Mexico, and Peru, where reporting only comes in half-year increments. There are also primary gold miners that don’t report silver costs, and a silver explorer with no production. So silver cost data remains scarce.
Nevertheless it’s always useful to look at what we have. Industrywide silver-mining costs are one of the most-critical fundamental data points for silver-stock investors. As long as the miners can produce silver for well under prevailing silver prices, they remain fundamentally sound. Cost knowledge helps traders weather this sector’s left-for-dead unpopularity without succumbing to selling low like the rest of the herd.
There are two major ways to measure silver-mining costs, classic cash costs per ounce and the superior all-in sustaining costs. Both are useful metrics. Cash costs are the acid test of silver-miner survivability in lower-silver-price environments, revealing the worst-case silver levels necessary to keep the mines running. All-in sustaining costs show where silver needs to trade to maintain current mining tempos indefinitely.
Cash costs naturally encompass all cash expenses necessary to produce each ounce of silver, including all direct production costs, mine-level administration, smelting, refining, transport, regulatory, royalty, and tax expenses. In Q3’18, these top 17 SIL-component silver miners that reported cash costs averaged $6.58 per ounce. While that surged 35.3% YoY, it still remains far below today’s anomalously-low silver prices.
There are a couple of extreme cash-cost outliers that are skewing this average, but offsetting each other. SSRM’s depleting silver mine is producing less with each passing quarter, forcing fewer ounces to bear the fixed costs of mining. Its crazy-high $17.41 per ounce in Q3 isn’t normal. But on the other side of this is Silvercorp Metals, which produces silver in Chinese mines yielding enormous base-metals byproducts.
Selling those and crediting their value across the silver ounces mined dragged down SVM’s cash costs to an unbelievable negative $3.37 in Q3! Excluding these extreme outliers, the rest of the SIL top 17 saw average cash costs of $6.40. That’s not too far above the past 4 quarters’ $4.86, $4.66, $5.05, and $3.95. As long as silver prices remain over those low levels, the silver miners can keep the lights on at their mines.
Way more important than cash costs are the far-superior all-in sustaining costs. They were introduced by the World Gold Council in June 2013 to give investors a much-better understanding of what it really costs to maintain silver mines as ongoing concerns. AISCs include all direct cash costs, but then add on everything else that is necessary to maintain and replenish operations at current silver-production levels.
These additional expenses include exploration for new silver to mine to replace depleting deposits, mine-development and construction expenses, remediation, and mine reclamation. They also include the corporate-level administration expenses necessary to oversee silver mines. All-in sustaining costs are the most-important silver-mining cost metric by far for investors, revealing silver miners’ true operating profitability.
In Q3’18 these top 17 SIL miners reporting AISCs averaged $13.53 per ounce, which also surged 39.0% YoY. Again that was skewed in both directions by SSRM’s extremely-high $22.39 on Pirquitas’ depletion and SVM’s exceedingly-low $2.54 on those huge base-metals byproducts. Without them, the rest of the top 17 averaged $13.96 AISCs. That was much higher than the past 4 quarters’ $9.73, $10.16, $10.92, and $10.93.
The lower production was definitely a factor, which is inversely proportional to per-ounce costs. Silver-mining costs are largely fixed quarter after quarter, with actual mining requiring roughly the same levels of infrastructure, equipment, and employees. So the lower production, the fewer ounces to spread mining’s big fixed costs across. The major silver miners also reported lower ore grades, exacerbating the decline.
Nevertheless, the top 17 SIL miners’ AISCs both with and without the outliers still remained under silver’s weak average $14.96 price in Q3. So even with silver faring its worst relative to gold in decades thanks to devastated sentiment, the silver mines were profitable. And interestingly the closer AISCs crowd the prevailing silver prices, the more profits leverage the miners have to silver mean reverting much higher.
In mid-November silver and SIL slumped to their lowest levels since back in January and March 2016. That was early in a new silver bull which emerged from conditions like today’s where silver was despised. Over 7.6 months between December 2015 and August 2016, silver soared 50.2% higher as gold surged in its own new bull. And with silver moving again, investors eagerly started returning to the battered silver stocks.
Thanks to that silver-bull upleg, SIL skyrocketed 247.8% higher in just 6.9 months in essentially that first half of 2016! That ought to give embattled silver-stock investors some hope. All it will take to turn silver stocks around is a typical gold-driven silver upleg, and then they will soar again. The reason that silver miners’ stocks blast dramatically higher with silver is their high inherent profits leverage to silver prices.
Assume another 50% silver upleg, which is pathetically small by historical standards, from silver’s recent secular low in mid-November. That would catapult silver back up to $21 per ounce for the first time since July 2014. At Q3’18’s top-17-SIL-stock average AISCs of $13.53, profits were just $0.47 per ounce at $14 silver. But at $21 assuming stable AISCs, they would soar an astounding 1489% higher to $7.47 per ounce!
You better believe silver-stock prices would skyrocket with that kind of earnings growth. The higher their AISCs, the greater their upside profits leverage. Now consider this same 50% silver upleg using the rolling-past-4-quarter top-17-SIL-stock average AISCs of $10.43 per ounce. That implies the $3.57 profit seen at $14 silver would only balloon 196% to $10.57 per ounce at $21 silver. So higher costs aren’t necessarily bad.
As long as AISCs are below prevailing silver prices, the major silver miners can weather anything. The closer their AISCs creep to silver, the greater their earnings growth when silver mean reverts higher. So the major silver miners’ upside from here is truly explosive as silver recovers, just like back in early 2016. And silver will power much higher soon as the record silver-futures shorts of early September continue to be covered.
While all-in sustaining costs are the single-most-important fundamental measure that investors need to keep an eye on, other metrics offer peripheral reads on the major silver miners’ fundamental health. The more important ones include cash flows generated from operations, GAAP accounting profits, revenues, and cash on hand. As you’d expect given the miserably-low silver prices, they were on the weak side in Q3.
Operating cash flows among these SIL top 17 reporting them fell 23.0% YoY to $830m, which is totally reasonable given the 2.2%-lower silver production and 11.2%-lower average silver prices. Sales fell 9.5% YoY to $2717m, with some of the silver-side weakness offset by the 1.6%-higher gold production. And cash on hand fell 9.8% YoY to a still-hefty $2419m, giving these silver miners plenty of capital to weather this storm.
The hard GAAP accounting profits looked pretty ugly though, plunging to a $243m loss from being $88m in the black in Q3’17. But most of those losses didn’t reflect operations. TAHO alone wrote off a massive $170m for the impairment of Escobal, which reflected an estimated restart date of the end of 2019. Coeur Mining reported a smaller $19m writedown for one of its mines. These two non-cash charges alone were $189m.
Without them GAAP profits would’ve sunk from $88m in Q3’17 to a milder $54m loss in Q3’18. That’s still poor, but not unexpected given the lowest silver prices seen in almost several years. Again silver-mining earnings will soar if not skyrocket as silver inevitably mean reverts higher from here. All it takes for silver to surge in major bull-market uplegs is for gold itself to power higher, and huge gold upleg fuel abounds now.
The silver-mining stocks are doing way better fundamentally than they’ve been given credit for. Their higher Q3’18 mining costs still remained below the recent deep silver lows. And the compressed gap between their AISCs and low prevailing silver prices guarantees epic profits upside as silver recovers and mean reverts higher. That will attract back investors fast, catapulting silver stocks up sharply like in early 2016.
While traders can play that in SIL, this ETF has problems. Its largest component is now a base-metals smelter of all things! And the great majority of its stocks are primary gold miners with byproduct silver production. The best gains by far will be won in smaller purer mid-tier and junior silver miners with superior fundamentals. A carefully-handpicked portfolio of these miners will generate much-greater wealth creation.
The key to riding any silver-stock bull to multiplying your fortune is staying informed, both about broader markets and individual stocks. That’s long been our specialty at Zeal. My decades of experience both intensely studying the markets and actively trading them as a contrarian is priceless and impossible to replicate. I share my vast experience, knowledge, wisdom, and ongoing research through our popular newsletters.
Published weekly and monthly, they explain what’s going on in the markets, why, and how to trade them with specific stocks. They are a great way to stay abreast, easy to read and affordable. Walking the contrarian walk is very profitable. As of Q3, we’ve recommended and realized 1045 newsletter stock trades since 2001. Their average annualized realized gains including all losers is +17.7%! That’s double the long-term stock-market average. Subscribe today and take advantage of our 20%-off holidays sale!
The bottom line is the major silver miners’ fundamentals remain solid based on their recently-reported Q3’18 results. They continue to mine silver at all-in sustaining costs below even mid-November’s deep silver lows. Their profits will multiply dramatically as silver rebounds higher driven by gold’s own upleg and record silver-futures short covering. Investment capital will flood back in, catapulting silver stocks up violently.
So traders need to look through the recent forsaken herd sentiment to understand the silver miners’ hard fundamentals. These left-for-dead stocks are seriously undervalued even at today’s low silver prices, let alone where silver heads during the next major gold upleg. Silver can’t languish at extreme anomalous multi-decade lows relative to gold for long. And once it catches a bid, silver stocks will really amplify its upside.
Adam Hamilton, CPA
November 23, 2018
Copyright 2000 – 2018 Zeal LLC (www.ZealLLC.com)
The major gold miners’ stocks remain mired in universal bearishness, largely left for dead. They are just wrapping up their third-quarter earnings season, which proved challenging. Lower gold prices cut deeply into cash flows and profits, and production-growth struggles persisted. But these elite companies did hold the line on costs, portending soaring earnings as gold recovers. Their absurdly-cheap stock prices aren’t justified. Four times a year publicly-traded companies release treasure troves of valuable information in the form of quarterly reports. Companies trading in the States are required to file 10-Qs with the U.S. Securities and Exchange Commission by 40 calendar days after quarter-ends. Canadian companies have similar requirements at 45 days. In other countries with half-year reporting, many companies still partially report quarterly.
These quarterlies offer the best fundamental data available for individual major gold miners, showing how their operations are really faring. That helps dispel the thick obscuring fogs of sentiment that billow up the rest of the time. While I always eagerly anticipate perusing these key reports, I worried what this Q3’18 earnings season would reveal. Lower gold prices, flagging production, and weak sentiment are a witches’ brew.
The definitive list of major gold-mining stocks to analyze comes from the world’s most-popular gold-stock investment vehicle, the GDX VanEck Vectors Gold Miners ETF. Its composition and performance are similar to the benchmark HUI gold-stock index. GDX utterly dominates this sector, with no meaningful competition. This week GDX’s net assets are 50.5x larger than the next-biggest 1x-long major-gold-miners ETF!
GDX is effectively the gold-mining industry’s blue-chip index, including the biggest and best publicly-traded gold miners from around the globe. GDX inclusion is not only prestigious, but grants gold miners better access to the vast pools of stock-market capital. As ETF investing continues to rise, capital inflows into leading sector ETFs require their managers to buy more shares in underlying component companies.
My earnings-season trepidation soared on October 25th. The gold stocks were doing fairly well then, with GDX rallying 14.4% out of mid-September’s deep forced-capitulation lows . Sentiment was slowly improving. But that day GDX plunged 4.4% out of the blue, and the flat gold price at upleg highs certainly wasn’t the driver. The most-loved major gold miner had plummeted after reporting shockingly-bad Q3 results. Goldcorp has always been one of GDX’s top components. It reported mining just 503k ounces of gold last quarter, which plunged 11.9% sequentially quarter-on-quarter and 20.5% year-over-year! That forced its all-in sustaining costs a proportional 20.8% higher YoY to $999 per ounce. Investors panicked and fled, hammering GG stock 18.7% lower. That was the worst down day in the 24.6-year history of this company.
That left it at an extreme 16.2-year low! GG hadn’t been lower since August 2002 when gold was still in the low $300s, it was apocalyptic. That really torpedoed still-fragile sentiment in this sector, even though GG’s woes looked short-lived. It was bringing a new expansion online at one of its big mines, which was what caused the shortfall. Now in Q4’18 Goldcorp expects production to rebound to 620k ounces at $750 AISCs.
After GG’s Q3 disaster, I worried frayed investors would dump other gold stocks on any hints of less-than-optimal quarterly results. But GDX has ground sideways on balance since that GG shock, weathering this risky earnings season with sentiment so fragile. Ever since I’ve been anxious to analyze the collective Q3 results of the major gold miners as a whole, to see if GG’s travails were unique to it or more systemic.
GDX’s component list this week ran 48 “Gold Miners” long. While the great majority of GDX stocks do fit that bill, it also contains gold-royalty companies and major silver miners. All the world’s big primary gold miners publicly traded in major markets are included. Every quarter I look into the latest operating and financial results of the top 34 GDX companies, which is just an arbitrary number fitting neatly into these tables.
That’s a commanding sample, as GDX’s 34 largest components now account for a whopping 93.5% of its total weighting! These elite miners that reported Q3’18 results produced 296.4 metric tons of gold, which accounts for fully 33.9% of last quarter’s total global gold production. That ran 875.3t per the recently-released Q3’18 Gold Demand Trends report from the World Gold Council. I’ll discuss production more below.
Most of these top 34 GDX gold miners trade in the U.S. and Canada where comprehensive quarterly reporting is required by regulators. But some trade in Australia and the U.K., where companies just need to report in half-year increments. Fortunately those gold miners do still tend to issue production reports without financial statements each quarter. There are still wide variations in reporting styles and data offered.
Every quarter I wade through a ton of data from these major gold miners’ latest results and dump it into a big spreadsheet for analysis. The highlights make it into these tables. Blank fields mean a company had not reported that data for Q3’18 as of this Wednesday. Looking at the major gold miners’ latest results in aggregate offers valuable insights on this industry’s current fundamental health unrivaled anywhere else.
The first couple columns of these tables show each GDX component’s symbol and weighting within this ETF as of this week. While most of these stocks trade on US exchanges, some symbols are listings from companies’ primary foreign stock exchanges. That’s followed by each gold miner’s Q3’18 production in ounces, which is mostly in pure-gold terms. That excludes byproduct metals often present in gold ore. Those are usually silver and base metals like copper, which are valuable. They are sold to offset some of the considerable costs of gold mining, lowering per- ounce costs and thus raising overall profitability. In cases where companies didn’t separate out gold and lumped all production into gold-equivalent ounces, those GEOs are included instead. Then production’s absolute year-over-year change from Q3’17 is shown.
Next comes gold miners’ most-important fundamental data for investors, cash costs and all-in sustaining costs per ounce mined. The latter directly drives profitability which ultimately determines stock prices. These key costs are also followed by YoY changes. Last but not least the annual changes are shown in operating cash flows generated, hard GAAP earnings, revenues, and cash on hand with a couple exceptions. Percentage changes aren’t relevant or meaningful if data shifted from positive to negative or vice versa, or if derived from two negative numbers. So in those cases I included raw underlying data rather than weird or misleading percentage changes. This whole dataset together offers a fantastic high-level read on how the major gold miners are faring fundamentally as an industry. Was Goldcorp’s disaster systemic?
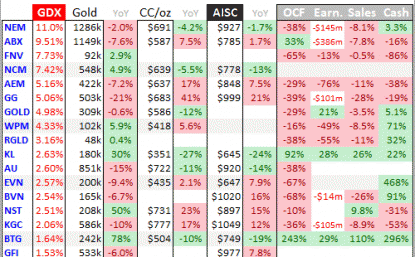
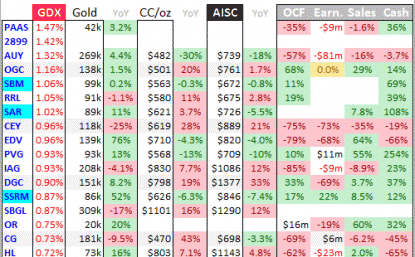

The major gold miners’ stocks are still largely grinding sideways, mired in a bearish sentiment wasteland. Traders tend to assume low stock prices must be righteous, reflecting weak fundamentals rather than poor psychology. But once a quarter earnings seasons’ bright fundamental sunlight parts the obscuring fogs of popular sentiment. The gold miners’ just-reported Q1’18 results prove they remain deeply undervalued.
Four times a year publicly-traded companies release treasure troves of valuable information in the form of quarterly reports. Companies trading in the States are required to file 10-Qs with the US Securities and Exchange Commission by 45 calendar days after quarter-ends. Canadian companies have similar requirements. In other countries with half-year reporting, many companies still partially report quarterly.
The definitive list of major gold-mining stocks to analyze comes from the world’s most-popular gold-stock investment vehicle, the GDX VanEck Vectors Gold Miners ETF. Its composition and performance are similar to the benchmark HUI gold-stock index. GDX utterly dominates this sector, with no meaningful competition. This week GDX’s net assets are 25.7x larger than the next-biggest 1x-long major-gold-miners ETF!
GDX is effectively the gold-mining industry’s blue-chip index, including the biggest and best publicly-traded gold miners from around the globe. GDX inclusion is not only prestigious, but grants gold miners better access to the vast pools of stock-market capital. As ETF investing continues to rise, capital inflows into leading sector ETFs require their managers to buy more shares in underlying component companies.
GDX’s component list this week ran 49 “Gold Miners” long. While the great majority of GDX stocks do fit that bill, it also contains gold-royalty companies and major silver miners. All the world’s big primary gold miners publicly traded in major markets are included. Every quarter I look into the latest operating and financial results of the top 34 GDX companies, which is just an arbitrary number fitting neatly into these tables.
That’s a commanding sample, as GDX’s 34 largest components now account for a whopping 92.1% of its total weighting! These elite miners dominate world gold mine production, which ran 770.0 metric tons in Q1’18 according to the World Gold Council’s recently-released Q1 Gold Demand Trends report. The top 34 GDX gold miners reported collectively mining 286.5t of gold last quarter, nearly 3/8ths of the world’s total!
Most of these top 34 GDX gold miners trade in the US and Canada where comprehensive quarterly reporting is required by regulators. But some trade in Australia and the UK, where companies just need to report in half-year increments. Fortunately those gold miners do still tend to issue production reports without financial statements each quarter. There are still wide variations in reporting styles and data offered.
Every quarter I wade through a ton of data from these elite gold miners’ latest results and dump it into a big spreadsheet for analysis. The highlights make it into these tables. Blank fields mean a company had not reported that data for Q1’18 as of this Wednesday. Looking at the major gold miners’ latest results in aggregate offers valuable insights on this industry’s current fundamental health unrivaled anywhere else.
The first couple columns of these tables show each GDX component’s symbol and weighting within this ETF as of this week. While most of these stocks trade on US exchanges, some symbols are listings from companies’ primary foreign stock exchanges. That’s followed by each gold miner’s Q1’18 production in ounces, which is mostly in pure-gold terms. That excludes byproduct metals often present in gold ore.
These are mostly silver and base metals like copper, which are valuable. They are sold to offset some of the considerable costs of gold mining, lowering per-ounce costs and thus raising overall profitability. In cases where companies didn’t separate out gold and lumped all production into gold-equivalent ounces, these GEOs are included instead. Then production’s absolute year-over-year change from Q1’17 is shown.
Next comes gold miners’ most-important fundamental data for investors, cash costs and all-in sustaining costs per ounce mined. The latter directly drives profitability which ultimately determines stock prices. These key costs are also followed by YoY changes. Last but not least the annual changes are shown in operating cash flows generated, hard GAAP earnings, sales, and cash on hand with a couple exceptions.
Percentage changes aren’t relevant or meaningful if data shifted from positive to negative or vice versa, or if derived from two negative numbers. So in those cases I included raw underlying data rather than weird or misleading percentage changes. This whole dataset together offers a fantastic high-level read on how the major gold miners are faring fundamentally as an industry. And that was really well in Q1’18!
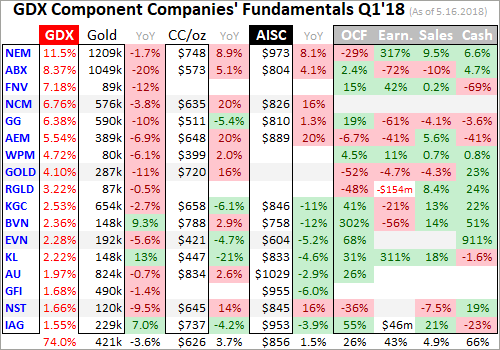
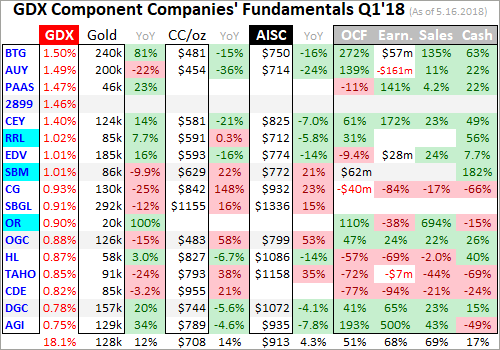 As I waded through all these gold miners’ new 10-Qs or their foreign equivalents this week, the biggest surprise was production. The whole business of gold mining is digging up and selling gold, so naturally production is the mothers’ milk of this industry. Companies are always striving to grow their production, which boosts their cash generation and thus expansion opportunities available by finding or buying other mines.
These elite gold miners certainly had every incentive to boost their production in Q1, since its average gold price surged 8.9% YoY to $1329. Investors are always looking for rising production too, seeing it as signs of good management and strong fundamental health. Since gold stocks suffering flagging production are often punished with selling, the major gold miners really hate reporting it. Yet Q1’18 was stuffed with declines!
This wasn’t readily apparent to casual observers, as the major gold miners carefully tailor their quarterly-results press releases to accentuate the positive and intentionally mask the negative. Yet if you look at the YoY changes in gold production above, fully 21 of the 33 top GDX companies reporting it suffered steep average declines of 9.6%! This lower production was so universal and widespread it looks to be systemic.
Overall these top 34 GDX companies mined 9.2m ounces of gold in Q1’18, which was down a sharp 4.6% YoY. This was actually contrary to the industry trend too. The World Gold Council’s new read on Q1’s fundamentals showed global gold mine production actually rising 1.4% YoY! Yet the top 10 GDX stocks commanding 60.3% of this ETF’s total weighting all saw gold declines averaging a major 7.4% YoY.
Most of these top gold miners had explanations, which were often excluded from press releases. I found them deep in quarterly regulatory filings most investors will never bother looking into. Mine sequencing leading to lower ore grades, individual-mine technical challenges, and slowing production at older mines were mostly to blame. This wasn’t a one-off dip though, as Q4’17’s GDX-top-34 production also fell 2.0% YoY.
Investors choosing to buy GDX instead of individual gold stocks with superior fundamentals must realize the lion’s share of their investments are flowing into giant gold miners with slowing production. As long as this proves true, their stocks have far-less appreciation potential than their smaller peers still able to grow production. What the top major gold miners are experiencing is increasingly validating peak-gold theses.
Gold deposits economically viable to mine are very rare in the natural world, and the low-hanging fruit has largely been harvested. It is growing ever more expensive to explore for gold, in far-less-hospitable places. Then even after new deposits are discovered, it takes up to a decade to jump through all the Draconian regulatory hoops necessary to secure permitting. And only then can mine construction finally start.
That takes additional years and hundreds of millions if not billions of dollars per gold mine. But because gold-mining stocks have been deeply out of favor most of the time since 2013, capital has been heavily constrained. When banks are bearish on gold prices, they aren’t willing to lend to gold miners except with onerous terms. And when investors aren’t buying gold stocks, issuing new shares low is heavily dilutive.
The large gold miners used to rely greatly on the smaller junior gold miners to explore and replenish the gold-production pipeline. But juniors have been devastated since 2013, starved of capital. Not only were investors completely uninterested with general stock markets levitating, but the rise of ETFs has funneled most investment inflows into a handful of larger-market-cap juniors while the rest see little meaningful buying.
So even the world’s biggest and best gold miners are struggling to grow production. While that isn’t good for those individual miners, it’s super-bullish for gold. The less gold mined, the more gold supply will fail to keep pace with demand. That will result in higher gold prices, making gold mining more profitable in the future. Some analysts even think peak gold has been reached, that world mine production will decline indefinitely.
There are strong fundamental arguments in favor of peak-gold theories. But regardless of where overall global gold production heads in coming years, the major gold miners able to grow their own production will fare the best. They’ll attract in relatively-more investor capital, bidding their stocks to premium prices compared to peers that can’t grow production. Stock picking is more important than ever in this ETF world!
With major gold miners’ production sharply lower, their costs of mining should be proportionally higher. Gold-mining costs are largely fixed during mine-planning stages, when engineers and geologists decide which ore to mine, how to dig to it, and how to process it. The actual mining generally requires the same levels of infrastructure, equipment, and employees quarter after quarter. Little changes in throughput terms.
The mills processing the gold-bearing ore and inevitable accompanying waste rock have hard limits to tonnages they can chew through. When richer ore is processed, more ounces of gold are produced to spread the big fixed costs across. But when mine managers have to dig through lower-grade ore, either on the way to higher-grade stuff later or in depleting mines, fewer ounces of gold must bear the full cost burden.
But interestingly this often-ironclad inverse relationship between gold production and per-ounce costs did not really play out in Q1’18. Costs rose, but nowhere near as much as the lower gold production implied they would. The major gold miners are getting more efficient. They could’ve also chosen to sequence lower-grade ore into their mills because higher prevailing gold prices would offset some of the production declines.
There are two major ways to measure gold-mining costs, classic cash costs per ounce and the superior all-in sustaining costs per ounce. Both are useful metrics. Cash costs are the acid test of gold-miner survivability in lower-gold-price environments, revealing the worst-case gold levels necessary to keep the mines running. All-in sustaining costs show where gold needs to trade to maintain current mining tempos indefinitely.
Cash costs naturally encompass all cash expenses necessary to produce each ounce of gold, including all direct production costs, mine-level administration, smelting, refining, transport, regulatory, royalty, and tax expenses. In Q1’18, these top 34 GDX-component gold miners that reported cash costs averaged $667 per ounce. They indeed surged a sharp 7.1% YoY, the result of fixed costs spread across lower production.
These industry-wide cash costs are the gold-price pain point where miners’ viability and survivability is in jeopardy. Seeing gold anywhere near those levels again is exceedingly unlikely. The last time gold hit $667 was 10.7 years ago in August 2007, before trillions of dollars of central-bank money printing after 2008’s stock panic. Provocatively the HUI gold-stock index was near 320 then, 80% higher than today’s levels!
Way more important than cash costs are the far-superior all-in sustaining costs. They were introduced by the World Gold Council in June 2013 to give investors a much-better understanding of what it really costs to maintain gold mines as ongoing concerns. AISCs include all direct cash costs, but then add on everything else that is necessary to maintain and replenish operations at current gold-production levels.
These additional expenses include exploration for new gold to mine to replace depleting deposits, mine-development and construction expenses, remediation, and mine reclamation. They also include the corporate-level administration expenses necessary to oversee gold mines. All-in sustaining costs are the most-important gold-mining cost metric by far for investors, revealing gold miners’ true operating profitability.
With the top 34 GDX gold miners’ production down 4.6% YoY in Q1, I would’ve bet their AISCs would’ve risen a proportional 4% to 5%. Yet their cost control was outstanding, as these elite gold miners reported average AISCs up just 0.7% YoY to $884 per ounce! That’s roughly in line with the quarterly trend from 2017 seeing $878, $867, $868, and $858 averages running from Q1 to Q4. Costs are really being contained.
The major gold miners have to manage costs exceptionally well to maintain AISCs while production is also slowing. This argues against the popular complaint that gold miners’ managements are doing poor jobs. Because gold-stock prices are so darned low, traders again assume the miners must be plagued with serious fundamental problems. But it’s relentlessly-bearish herd sentiment suppressing gold-stock prices.
Flat AISCs combined with sharply-higher gold prices led to exploding operating profitability among the major gold miners last quarter! That certainly isn’t being reflected in their stock prices. In Q1’17, gold averaged just $1220 against $878 average AISCs. That yielded per-ounce profits of $342. But this past year saw gold surge 8.9% to that $1329 quarterly average in Q1’18 while AISCs only climbed 0.7% to $884.
That drove fat operating margins of $445 per ounce, exploding 30.2% higher YoY! That works out to excellent 3.4x upside profits leverage to gold! In any other stock-market sector such massive earnings growth would be crowed about from the rooftops and capital would flood in. But that wasn’t enough to blow away the darkening bearish pall over gold stocks. GDX’s average share price still fell 3.0% YoY in Q1’18!
Gold-stock profits as measured by the difference between average gold prices and average AISCs even surged 6.3% quarter-on-quarter from Q4’17. There is a vast fundamental disconnect between the left-for-dead gold-stock prices and gold miners’ strong operational performances. This bearish-sentiment-driven anomaly is very extreme and won’t last forever. Investors will rush back in when they discover the value.
The major gold miners’ fundamental health is reflected in their operating-cash-flow generation. These top 34 GDX gold miners reporting OCFs for last quarter collectively produced $3355m. That’s up 3.9% YoY despite their 4.6% lower gold production, mostly due to that sizable 8.9% average-gold-price rally. Most of these elite gold miners saw big annual growth in cash generated from operations, a very-bullish sign.
As long as OCFs remain massively positive, the gold mines are generating much more cash than they cost to run. That gives the gold miners the capital necessary to expand existing operations and buy new deposits and mines. Given how ridiculously low gold-stock prices are today, you’d think the gold miners are hemorrhaging cash like crazy. But the opposite is true, showing how silly this bearish herd sentiment is.
These top GDX gold miners’ actual GAAP profits didn’t look as good, plunging 48.5% YoY to $855m in Q1. While that was a huge improvement over Q4’17’s $266m loss, it still seems incongruent with those flat all-in sustaining costs and growing operating cash flows. Of the 25 of these top GDX components reporting earnings in Q1, just 3 had losses. The only big ones came from Royal Gold and Yamana Gold.
Royal Gold’s $154m loss was the result of a gigantic $239m impairment charge in its interests in gold royalties. That came from Barrick Gold’s big Pascua-Lama project, which straddles the border between Chile and Argentina. In Q1 Barrick decided the current economic and geopolitical environment made the Chilean side of this project not worthy of further investment. Chile’s government is harassing Barrick on it.
Yamana Gold’s $161m loss was largely from a $103m impairment of a majority investment it made in a smaller gold company. When a third company agreed to acquire all the shares of that smaller miner in Q1, Yamana had to write off its loss. These two impairments alone battered overall GDX GAAP profits $342m lower! Without them, the top 34 GDX gold miners’ earnings would’ve slid a much-smaller 27.9% YoY.
It doesn’t take many of these non-cash charges to greatly alter the collective GAAP earnings of the elite gold miners. And there’s a third huge one to consider. Back in Q1’17, Barrick Gold recorded a colossal $1125m non-cash gain reversing previous impairment charges on a gold project after Goldcorp agreed to buy a quarter of it. That really inflated overall GDX GAAP profits in the comparable quarter a year ago.
Just excluding that huge Q1’17 impairment reversal and that pair of Q1’18 impairment charges radically changes the profits picture. Again those were non-cash and had nothing to do with operations. That yields Q1’18 GAAP profits of $1197m for these top 34 GDX gold miners, a staggering $123% higher than Q1’17’s if its Barrick impairment-reversal gain hadn’t happened! The major gold miners are faring really well.
These surging accounting earnings are evident in the classic trailing-twelve-month price-to-earnings ratios of these top gold miners as well. They aren’t included in these tables, but averaged 37.3x in Q1’18 for the 24 of these companies that had net earnings over the past year. While that’s not an accurate reflection of true valuations due to non-cash things flushed through income statements, it was still 28% lower.
On the sales front these top 34 GDX gold miners’ revenues climbed 1.5% YoY to $10.6b in Q1’18. That reflects the combination of higher gold selling prices with lower gold production. Actual sales growth was probably better, as 26 top-34 GDX companies reported sales in Q1’18 compared to 28 in Q1’17. GDX saw three new companies climb into the ranks of its top 34 over this past year, highlighted in light blue above.
Two of these are the great low-cost Australian gold miners Regis Resources and St Barbara Limited. They report in half-year increments, and gave no revenues data for Q1 which was an interim quarter for both. The companies they knocked out of the top 34 had reported sales a year earlier. So the sales growth in the elite major gold miners was really good considering their sharply-lower gold production.
Finally these top 34 GDX gold miners’ cash on their balance sheets fell 4.2% YoY to $12.7b. That’s a big number for this small contrarian sector, meaning these companies have lots of capital firepower available to expand existing operations or buy gold mines from other companies. The more cash on hand the gold miners have, the more flexibility and resilience they have to grow their businesses and weather challenges.
So overall the major gold miners’ fundamentals looked really strong in Q1’18, a stark contrast to the miserable sentiment plaguing this sector. Gold stocks’ vexing consolidation since early 2017 isn’t the result of operational struggles, but purely bearish psychology. That will soon shift as stock markets inevitably roll over and gold surges, making the beaten-down gold stocks a coiled spring overdue to soar dramatically.
While investors and speculators alike can certainly play gold stocks’ coming powerful uplegs with the major ETFs like GDX, the best gains by far will be won in individual gold stocks with superior fundamentals. Their upside will far exceed the ETFs, which are burdened by over-diversification and underperforming stocks. A carefully-handpicked portfolio of elite gold and silver miners will generate much-greater wealth creation.
At Zeal we’ve literally spent tens of thousands of hours researching individual gold stocks and markets, so we can better decide what to trade and when. As of the end of Q4, this has resulted in 983 stock trades recommended in real-time to our newsletter subscribers since 2001. Fighting the crowd to buy low and sell high is very profitable, as all these trades averaged stellar annualized realized gains of +20.2%!
The key to this success is staying informed and being contrarian. That means buying low before others figure it out, before undervalued gold stocks soar much higher. An easy way to keep abreast is through our acclaimed weekly and monthly newsletters. They draw on my vast experience, knowledge, wisdom, and ongoing research to explain what’s going on in the markets, why, and how to trade them with specific stocks. For only $12 per issue, you can learn to think, trade, and thrive like contrarians. Subscribe today, and get deployed in the great gold and silver stocks in our full trading books!
The bottom line is the major gold miners’ fundamentals are really strong based on their recently-reported Q1’18 results. While production declined fairly sharply, the miners still held the line on all-in sustaining costs. That fueled fat operating profits and strong cash flows. And many of the elite gold miners have forecast improving production throughout 2018 on higher-grade ores, which will push profits even higher.
Yet gold stocks are priced today as if gold was half or less of current levels, which is truly fundamentally-absurd! They are the last super-undervalued sector in these euphoric, overvalued stock markets. When gold investment demand resumes on weakening stock markets and pushes gold higher, capital will flood back into the forgotten gold miners. That buying will catapult them back to far-higher fundamentally-righteous prices.
Adam Hamilton, CPA
May 18, 2018
Copyright 2000 – 2018 Zeal LLC (www.ZealLLC.com)
Gold was enjoying a solid spring rally until a couple weeks ago, nearing major upside breakouts. But its nice advance has crumbled since, really weighing on sentiment. Gold fell victim to a rare major short squeeze in US Dollar Index futures. The surging USDX motivated gold-futures speculators to flee rather aggressively. But this will likely prove a short-lived anomaly, after which gold’s assault on highs will recommence.
Gold’s seasonally-atypical weakness over the past couple weeks is very important for speculators and investors to understand. It had nothing at all to do with fundamentals, but was completely driven by the hyper-leveraged gold-futures traders. These guys have long been fixated on the US dollar’s fortunes, looking to its benchmark US Dollar Index for trading cues. That can slave gold’s price to the dollar at times.
Six weeks ago, gold slumped to a major seasonal low of $1310 the day before the universally-expected 6th Fed rate hike of this cycle. The gold-futures traders fervently believe Fed rate hikes are very bearish for gold, so they usually sell leading into FOMC meetings with potential hikes. This has happened before every Fed rate hike of this cycle. The theory is higher US rates boost foreign investment demand for US dollars.
The ironic thing is modern history proves the opposite! Fed-rate-hike cycles are bearish for the US dollar and bullish for gold. The last cycle ran from June 2004 to June 2006, where the Fed hiked 17 times in a row for 425 basis points. Despite those aggressive and relentless rate hikes, the USDX still slipped 3.8% lower over that exact span while gold rocketed 49.6% higher! Clearly futures specs’ theory is sorely lacking.
The Fed’s current rate-hike cycle out of extreme zero-interest-rate-policy lows got launched in December 2015. Gold was hammered to a 6.1-year secular low leading into it, as futures specs were absolutely certain higher rates were bearish for gold and bullish for the USDX. Yet again they were proven dead wrong, wrong, wrong! As of the middle of this week, gold is up 23.0% since then while the USDX fell 5.5%.
You’d think after some market thesis fails to work over and over again for decades, traders would try something else. But not futures speculators, they are a stubborn lot. So leading into every likely Fed rate hike, they bid up the USDX and dump gold. Then immediately after those rate hikes the dollar fails to surge and gold doesn’t plunge, so they reverse those excessive trades driving the dollar down and gold up.
So like clockwork after the Fed’s latest rate hike in late March, gold started rallying as gold-futures specs bought back in. Gold enjoys a strong seasonal spring rally in April and May, which I discussed in depth last week. By mid-April, that propelled gold within spitting distance of a major bull-market breakout. Gold regained its $1365 bull-to-date high from July 2016 on an intraday basis on April 11th, but failed to push through.
Ironically futures speculators’ irrational obsession with the Fed was again to blame. That day the FOMC released the minutes from its March 21st rate-hiking meeting. Traders interpreted them as hawkish, so the USDX was bought and gold was sold. For 24 trading days in row between mid-March to mid-April, gold simply did the opposite of whatever the USDX did on every single day but one. The dollar ruled gold.
Gold managed to hover near $1350 multi-year-horizontal-resistance breakout territory for another week after those Fed minutes. But that started changing on April 19th. That day the USDX rallied 0.3%, which was actually its biggest up day in a couple weeks. USDX-futures speculators were excited because the yields on benchmark US 10-year Treasury notes crested 2.9%. Higher yields are great for the dollar, right?
For decades I’ve closely followed speculators’ collective gold-futures positions every week in the famous Commitments of Traders reports published by the CFTC. I discuss them and their implications for gold’s near-term price action in every weekly newsletter. But I haven’t had the time to dig deeply into USDX futures. The analysts who traffic in that realm said USDX short positions were the largest seen in several years.
The leverage inherent in currency speculation is extreme beyond belief. Since major currencies tend to move slowly, the margin requirements equate to maximum leverage of 50x, 100x, or even 200x! That compares to the decades-old legal limit in the stock markets of 2x. At 50x, 100x, or 200x, mere 2.0%, 1.0%, or 0.5% currency moves against traders’ positions would wipe out 100% of their capital risked. It’s crazy!
So when currency speculators are wrong, they have to exit positions fast or risk getting obliterated. The traders short USDX futures had no choice but to buy. The more long USDX futures they bought to offset and close their shorts, the faster the dollar rallied. That forced still more traders to buy to cover even if they were running more-conservative leverage. This self-reinforcing dynamic feeds on itself, fueling short squeezes.
As the USDX buying mounted, the dollar’s rally accelerated in subsequent days. Traders continued to use 10-year Treasury yields as a fundamental excuse for their purely technical trading, as within a week they crossed the psychologically-heavy 3% threshold to 3.03%. That was the highest seen since the very end of 2013! The USDX rallied 0.3%, 0.5%, and 0.7% in the initial few trading days of that buying to cover.
It had already become the biggest dollar short squeeze since soon after Trump won the election in late 2016. That heavy futures buying forced the USDX to surge 1.5% in those first 3 trading days. Although that sounds trivial, at 50x, 100x, or 200x leverage it hammers speculators to catastrophic 75%, 150%, or 300% losses! I wonder how these guys can sleep at night bearing such ridiculous and unforgiving levels of risk.
Gold-futures speculators run extreme leverage too, but much less than currency traders. This week a single gold-futures contract controlling 100 troy ounces of gold worth $130,500 only required speculators to keep $3100 cash margins in their accounts. That equates to 42.1x maximum leverage! For traders running at the edge, every 1% adverse move in gold would wipe out an insane 42% of their capital risked.
So these guys nervously watch gold on a minute-by-minute basis. And in a fascinating confirmation that gold is indeed a currency, they look to the US dollar for their trading cues. They started selling their gold-futures positions as the dollar started rallying. That drove gold 0.2%, 0.7%, and 0.9% lower in the first 3 trading days of that USDX short squeeze that ignited on April 19th, forcing gold down 1.9% overall to $1324.
Our lone chart this week looks at gold during this current Fed-rate-hike cycle superimposed on the long and short positions large and small speculators hold in gold futures. Again these are published once a week in those Commitments of Traders reports. All 6 Fed rate hikes of this cycle are also highlighted, to show how gold is bludgeoned lower leading into them which spawns strong rebound buying in their wakes.
While the weekly CoTs are current to each Tuesday, they are released late Friday afternoons. Thus the newest-available CoT when this essay was published covers the week ending April 24th. That includes those initial few trading days of that USDX-futures short squeeze. And it’s very illuminating, showing why gold was pummeled back down from major-breakout levels and its strong spring rally was short-circuited.
For pre-dollar-rally baselines, on Tuesday April 17th speculators held 284.2k long and 98.9k short gold-futures contracts. These were running 27% and 15% up into their own past-year trading ranges. Thus these traders had the capital firepower and room to still do about 3/4ths and 6/7ths of their near-term long buying and short selling. Of course buying gold-futures longs is bullish for gold, while shorting is bearish.
When gold-futures shorts are low, there’s always the risk speculators will aggressively sell on the right catalyst coming along. That forces gold’s price lower. And this unlikely dollar short squeeze erupting out of the blue proved that triggering event. On seeing the USDX surge, the gold-futures specs were quick to start jettisoning longs and ramping shorts. Thus gold fell 1.2% on the 1.4% USDX rally over that CoT week.
The magnitude of this initial gold-futures selling became evident in the next CoT report current to April 24th. During that CoT week, specs sold 7.9k gold-futures long contracts while adding another 15.6k on the short side. That made for big total CoT-week selling equivalent to 73.0 metric tons of gold. That is simply far too much for normal buying to absorb. Thus the only possible outcome was a lower gold price.
Just this week, the World Gold Council released its latest Gold Demand Trends report for Q1’18. That’s the definitive source for world gold fundamental supply-and-demand data. In Q1, global gold investment demand averaged 22.1t per week. So heavy gold-futures selling easily overwhelms that. Gold always falls when the futures specs get on a selling kick. They flood the market with too much short-term supply.
That dollar-short-squeeze reaction left specs’ collective long and short gold-futures positions running up 22% and 30% into their past-year trading ranges. So these traders still had room to do about 4/5ths of their likely near-term long buying, but expended a significant chunk of their shorting firepower. That left total spec shorts at a 12-CoT-week high of 114.5k contracts. The higher spec shorts, the more bullish gold gets.
Short positions in futures are bullish because they necessitate proportional near-term buying. In selling short, speculators essentially borrow futures from other traders to sell. The specs are legally obligated to buy back those contracts relatively soon to close out those trades and repay those effective debts. So futures shorts are guaranteed near-future buying, whether they are in the USDX, gold, or anything else.
This essay was penned and proofed Thursday, and then published Friday morning. The newest CoT data current to this Tuesday May 1st won’t come out until late Friday afternoon about 4 hours after this essay went live. So while I can’t wait to see the latest CoT, I can only speculate about it at this point. During this latest CoT week, the USDX-futures short squeeze continued which drove more spec gold-futures selling.
The dollar rally actually accelerated in this newest CoT week ending Tuesday, as shown by the sharp 1.9% rally in the USDX. Thus gold’s CoT-week selloff also grew to 2.0%. That was 2/3rds larger than the prior CoT week’s 1.2%. So odds are the gold-futures selling ballooned significantly in this latest CoT week. That implies another 35k to 40k gold-futures contracts were dumped, with the majority likely on the short side.
Assuming the prior week’s spec gold-futures-selling mix of 1/3rd long and 2/3rds short holds, total spec longs could’ve dropped another 12.9k contracts while shorts could’ve soared 25.8k. If that proves true, total spec longs and shorts could have been running near 14% and 54% up into their past-year trading ranges as of this Tuesday. That would mean the majority of the likely gold-futures shorting is already done!
While I don’t have the USDX-futures data and background to analyze in depth, odds are the USDX is in a similar opposite place. I suspect the majority of the dollar short covering has already run its course. That paves the way for this sharp dollar rally to at least peter out and probably reverse. Trade-war fears are going to flare again soon as the distraction of stocks’ Q1 earnings season passes, which is bearish for the dollar.
If you look at the chart above, the green line shows specs’ total gold-futures long contracts. Note even a CoT week ago that was trading below bull-market support. There is big room for these traders to flood into gold on the long side when the USDX inevitably stalls or reverses. They likely now have the capital firepower to do about 6/7ths of their potential near-term buying! That portends big gold upside in coming weeks.
While gold’s strong seasonal spring rally was interrupted by this surprise USDX-futures short squeeze, I doubt it was killed. Gold was driven to a new seasonal low of $1304 this week, under its previous $1310 of mid-March. Thus all the usual spring-rally buying in April and May will likely be compressed into this month alone! That means gold could enjoy a major mean-reversion bounce rally in the coming weeks.
During the 10 trading days as of the middle of this week since the dollar’s sharp rally started, gold has moved inversely proportionally to the USDX on every trading day but one. 8 of these trading days of the past couple weeks saw the dollar rally, and gold’s biggest losses of 0.9% both occurred on the dollar’s best up days of 0.7%. Gold’s down days were all about the same size as the dollar’s up days, mirror images.
But in the 2 trading days of the past couple weeks when the USDX retreated modestly, gold surged way out of proportion to the dollar’s weakness. These trivial 0.2% and 0.1% USDX slides allowed gold to rally a relatively-outsized 0.6% and 0.5%! Gold wants to rally, and will likely quickly surge back up near major-breakout levels soon after this dollar-rally pressure abates. And that’s likely going to prove very soon.
The mounting US/China trade war has been pushed out of the financial-media spotlight by Q1 corporate earnings, which have soared on the big corporate tax cut. But earnings season is winding down just as major trade-war deadlines are looming for the US to implement recent tariff announcements. The dollar looks far less attractive to foreign investors if tariff threats become reality, their capital will seek refuge elsewhere.
And though the extreme leverage inherent in gold futures enables their speculators to wield outsized influence on short-term price action, investors’ capital massively dwarfs the speculators’. So when investors’ vast funds start bidding on gold again, likely on the next major stock-market selloff driving demand for prudent portfolio diversification, gold-futures specs’ influence will be overwhelmed and drowned out.
Add in strong spring seasonals to all this, and gold has a fantastic foundation for a strong rebound rally. Speculators’ low gold-futures longs are very bullish, as they will rush to buy back in to ride any upside momentum in gold. Speculators’ mounting gold-futures shorts are increasingly bullish, as these will have to be covered and closed by buying offsetting longs. And investors’ super-low gold allocations are wildly-bullish.
So odds are gold’s atypical counter-seasonal drop in the last couple weeks driven by the surprise USDX short squeeze will soon reverse hard. It won’t take much buying to drive gold back up near those major bull breakout levels around $1365. And gold powering higher again will quickly turn sentiment around, with buying begetting more buying. The dollar depressing gold prices leaves this metal more bullish, not less so.
While investors can ride gold’s coming mean-reversion rebound in physical bullion itself or shares in the leading GLD SPDR Gold Shares gold ETF, far-better gains will be won in the stocks of its leading miners. They are already radically undervalued at today’s prevailing gold prices, and their profits tend to amplify underlying gold gains by 2x to 3x. This small contrarian sector’s upside is vast, dwarfing everything else.
With gold still so near a major bull-market breakout, it’s ironic gold stocks remain so deeply out of favor. Between our weekly and monthly newsletters, we have 30 open gold-stock and silver-stock trades added in the past year. As of this week near gold’s lows, fully 25 had average unrealized gains of 18%. One gold miner added in late November is already up 95%! The 5 other trades had average unrealized losses of just 5%.
When gold inevitably rebounds, these unrealized gains are going to explode higher. Buying low first is necessary before selling high later to multiply wealth. That means adding gold stocks when you least want to, when they’re hated. That’s what we do at Zeal. We spend all our time relentlessly studying the markets so you don’t have to, and share our acclaimed research through our popular financial newsletters.
They draw on my vast experience, knowledge, wisdom, and ongoing research to explain what’s going on in the markets, why, and how to trade them with specific stocks. As of the end of Q4, we’ve recommended 983 stock trades in real-time to our newsletter subscribers since 2001. They’ve averaged big annualized realized gains of +20.2%, well over double stock markets’ long-term average! For only $12 per issue, you can learn to think, trade, and thrive like contrarians. Subscribe today and get deployed!
The bottom line is gold’s recent weakness is the result of a rare major short squeeze in US Dollar Index futures. The resulting dollar rally spooked gold-futures speculators, who rushed to sell to avoid getting slaughtered by their extreme leverage. While that short-circuited gold’s spring rally, this anomaly won’t last. Gold-futures speculators and gold investors are far too bearish and under-allocated, with big room to buy.
The USDX short covering is likely running out of steam, which will clear the way for gold’s big seasonal spring rally to resume. All that delayed buying will likely be compressed into May, and drive gold back up near recent major-bull-breakout levels. Any dollar/gold reversals will force gold-futures specs to quickly buy to cover their ballooning shorts. The resulting rally will entice in long-side traders, then gold is off to the races.
Adam Hamilton, CPA
May 4, 2018
Copyright 2000 – 2018 Zeal LLC (www.ZealLLC.com)
The gold miners’ stocks have mostly been consolidating low this year, exacerbating bearish sentiment. Even with gold grinding higher in a solid uptrend and nearing a major upside breakout, the gold stocks just can’t get any love. But that may be about to change, with gold and its miners’ stocks in the midst of their spring rally. Strong seasonal tailwinds make May one of the best months of the year in gold-stock bulls.
Gold-stock performance is highly seasonal, which certainly sounds odd. The gold miners produce and sell their metal at relatively-constant rates year-round, so the temporal journey through calendar months should be irrelevant. Based on these miners’ revenues, there’s little reason investors should favor them more at certain times of the year than others. Yet history proves that’s exactly what happens in this sector.
Seasonality is the tendency for prices to exhibit recurring patterns at certain times during the calendar year. While seasonality doesn’t drive price action, it quantifies annually-repeating behavior driven by sentiment, technicals, and fundamentals. We humans are creatures of habit and herd, which naturally colors our trading decisions. The calendar year’s passage affects the timing and intensity of buying and selling.
Gold stocks exhibit strong seasonality because their price action mirrors that of their dominant primary driver, gold. Gold’s seasonality generally isn’t driven by supply fluctuations like grown commodities experience, as its mined supply remains fairly steady all year long. Instead gold’s major seasonality is demand-driven, with global investment demand varying dramatically depending on the time within the calendar year.
This gold-demand seasonality is well-known and heavily studied. The seasonal gold year starts in late July as Asian farmers begin reaping their harvests. They plow some of their surplus income into gold. That’s followed by the famous Indian wedding season in autumn, with its heavy gold buying for brides’ dowries. That culture believes festival-season weddings have greater odds of yielding long, successful marriages.
After that comes the Western holiday season, where gold jewelry demand surges for Christmas gifts for wives, girlfriends, daughters, and mothers. Following year-end, Western investment demand balloons after bonuses and tax calculations as investors figure out how much surplus income the prior year generated for investment. Then Chinese New Year gold buying flares up after that heading into February.
These understandable cultural factors drive surges of outsized gold demand between summer and late winter. But interestingly there is one more gold-demand spike in spring. Over the years I’ve seen a variety of theses explaining this April-and-May seasonal gold rally, but nothing definitive like for the rest of the year’s gold seasonality. As silly as it sounds, I suspect spring itself is the reason for this demand surge.
Sentiment exceedingly influences investing, which requires optimism for the future. Investors won’t risk deploying their scarce capital unless they believe it will grow. And the glorious expanding sunshine and warming temperatures of spring naturally breed optimism. The vast majority of the world’s investors are far enough into the northern hemisphere that spring has a major impact. This seasonality extends to stocks too.
Since it’s gold’s own demand-driven seasonality that fuels the gold stocks’ seasonality, that’s logically the best place to start to understand what’s likely coming. Price action is very different between bull and bear years, and gold is absolutely in a young bull market. After being crushed to a 6.1-year secular low in mid-December 2015 on the Fed’s first rate hike of this cycle, gold powered 29.9% higher over the next 6.7 months.
Crossing the +20% threshold in early March 2016 confirmed a new bull market was underway. Gold corrected after that sharp initial upleg, but normal healthy selling was greatly exacerbated following Trump’s surprise election win. Investors fled gold to chase the taxphoria stock-market surge. Gold’s correction cascaded to monstrous proportions, hitting -17.3% in mid-December. But that was shy of a new bear’s -20%.
Gold’s last mighty bull market ran from April 2001 to August 2011, where it soared 638.2% higher! And while gold consolidated high in 2012, that was technically a bull year too since gold just slid 18.8% at worst from its bull-market peak. Gold didn’t enter formal bear-market territory at -20% until April 2013, thanks to the crazy stock-market levitation driven by extreme distortions from the Fed’s QE3 bond monetizations.
So the bull-market years for gold in modern history ran from 2001 to 2012, skipped the intervening bear-market years of 2013 to 2015, and resumed in 2016 to 2017. Thus these are the years most relevant to understanding gold’s typical seasonal performance throughout the calendar year. We’re interested in bull-market seasonality, because gold remains in its young bull today and bear-market action is quite dissimilar.
This chart averages the individually-indexed full-year gold performances in those bull-market years from 2001 to 2012 and 2016 to 2017. 2018 isn’t included yet since it remains a work in progress. This chart distills out gold’s bull-market seasonal tendencies in like percentage terms. Quantifying gold’s bull-market seasonal tendencies requires all relevant years’ price action to be recast to be perfectly comparable.
That’s accomplished by individually indexing each calendar year’s gold price action to its final close of the preceding year, which is recast at 100. Then all gold price action of the following year is calculated off that common indexed baseline, normalizing all years regardless of price levels. So gold trading at an indexed level of 105 simply means it has rallied 5% from the prior year’s close, while 95 shows it’s down 5%.
This methodology renders all bull-market-year gold performances in like percentage terms. That’s critical since gold’s price range has been so vast, from $257 in April 2001 to $1894 in August 2011. Finally each calendar year’s individually-indexed gold prices are averaged together to arrive at this illuminating gold-bull seasonality. Gold has always tended to enjoy strong rallies in the spring months of April and May.
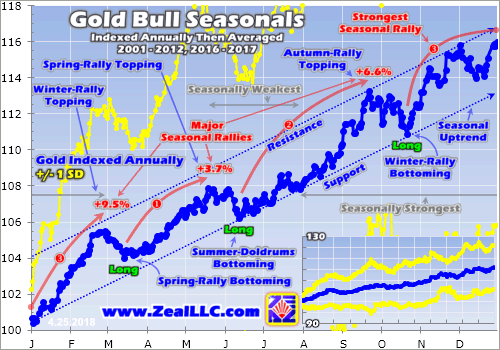
During these modern bull-market years from 2001 to 2012 and 2016 to 2017, gold’s spring rally tended to start in mid-March on average. From that major seasonal low following the winter rally, gold often starts grinding higher before its gains accelerate through April and most of May. This spring rally has generally run its course by late May. Across the 14 bull years in this study, gold averaged nice spring rallies of 3.7%.
This spring rally unfolds rapidly, with an average duration of just 2.2 months. That makes it the smallest and shortest of gold’s three major seasonal rallies, falling way behind the champion 9.5% winter rally that precedes it and strong 6.6% autumn rally that follows the summer doldrums. Nevertheless, it is still well worth trading. 3.7% gains still really make a difference, and naturally about half of years exceed this average.
This year gold’s spring-rally bottoming came on March 20th, when gold closed at $1310 the day before the Fed was universally expected to hike for the 6th time in this cycle. That was March’s 14th trading day this year, right in line with gold’s average seasonal low on March’s 10th trading day. And so far gold has largely followed the spring-rally seasonal pattern since, gradually grinding higher from late March to mid-April.
Climbing the typical 3.7% from that spring low into May’s spring-rally topping would propel gold to $1358. That’s right on the verge of being a major decisive breakout from the horizontal $1350 resistance line that gold-futures speculators watch like hawks. And it isn’t far from new bull-market highs above July 2016’s $1365 bull-to-date peak. As I wrote last week, this spring rally really ups the odds gold is nearing a bull breakout!
And given its performance in April, gold ought to see a bigger May rally than usual this year. On average in these 14 modern bull-market years, gold climbed 1.8% in Aprils then another 1.3% into its late-May spring-rally toppings. But as of the middle of this week, gold was actually down 0.1% month-to-date in April. That’s poor performance by April standards, setting up this May for a strong mean-reversion rally.
Historically this spring-rally April-May span is often self-equalizing. If gold materially underperforms or outperforms its seasonal averages in April, its May performances tend to mean revert and overshoot in the opposite direction. Back in 2009 for example, gold fell 3.4% in April but then blasted 10.0% higher in May! In 2016 gold surged 5.1% in April before dropping 6.1% in May. Weak Aprils often lead to strong Mays.
If gold is bid too aggressively in April, the resulting excitement entices in and exhausts all available near-term buying before the summer doldrums. That certainly hasn’t happened this year. Gold rallied into mid-April, but reversed sharply on a strong short-covering rally in US Dollar Index futures. Thus gold has largely drifted sideways on balance this month. So the usual spring buying likely hasn’t even started yet!
That leaves traders with full capital firepower to flood back in in May, likely as the sharp USDX rally runs out of steam. The delayed spring-rally gold buying this year can all be compressed into May, which really increases the odds of outsized gains. While nothing is guaranteed in seasonals since they merely use multi-year averages to reveal trend tendencies, strong Mays are definitely more likely following weak Aprils.
And as goes gold, so go gold stocks. Gold stocks also exhibit strong seasonality, which is of course the direct result of gold’s own seasonality. Since gold-mining costs are largely fixed when mines are being planned, fluctuations in gold’s price flow directly into amplified moves in gold-mining profits. Higher gold prices drive much-higher earnings for the gold miners, which attract in more investors to bid up stock prices.
The ironclad historical relationship between the price of gold, gold-mining profitability, and therefore the gold-stock price levels is exceedingly important to understand. If you need to get up to speed, I wrote an essay looking at gold-stock price levels relative to gold early last month. Fundamentally gold stocks are leveraged plays on gold. Thus they really outperform in the spring due to gold’s strong seasonal rally.
This next chart applies this same bull-market-seasonality methodology used on gold directly to the gold stocks. It looks at the average annual indexed performance in the flagship HUI NYSE Arca Gold BUGS Index in these same bull-market years of 2001 to 2012 and 2016 to 2017. Because of gold’s dominant influence over gold-mining earnings, gold-stock seasonality naturally mirrors and amplifies gold’s own seasonality.
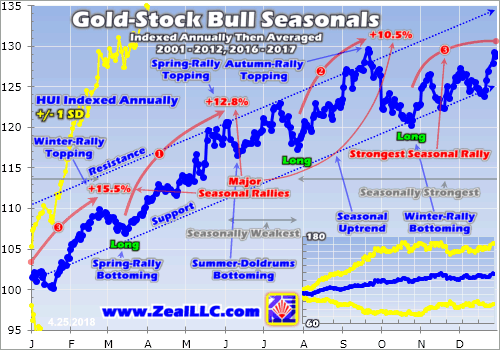
Gold stocks’ seasonal spring rally is much stronger than gold’s, buttressing that spring-optimism-drives-stock-buying thesis. Between mid-March and early June, the gold stocks have averaged hefty 12.8% rallies in these 14 modern bull-market years. That makes for exceptional 3.5x upside leverage to gold’s 3.7% seasonal spring rally! Interestingly this is gold stocks’ best seasonal leverage to gold’s gains by far.
While the HUI averaged 15.5% surges during gold’s winter rally, that only made for 1.6x upside leverage to gold’s big 9.5% gain. And the HUI’s 10.5% average gain during gold’s autumn rally also only amplified gold’s 6.6% gain by 1.6x. So while the gold-stock spring rally’s 12.8% average gains rank second out of these three seasonal rallies, it offers the most bang for the buck in gold-stock upside compared to gold!
This year the gold stocks’ spring-rally bottoming happened on March 20th, the same day as gold’s. The HUI slumped to 169.2 that day. Since then this leading gold-stock index has recovered 6.9% as of the middle of this week, trouncing gold’s 1.0% spring-rally gains so far. A merely-average spring rally would take the HUI to 190.9 by late May or early June, which is another 5.6% higher from here. That’s worth riding.
But if gold’s seasonal spring rally is compressed into May, and strong buying forces it over $1350 or even better its $1365 bull-to-date high, the gold miners’ stocks have far more near-term upside potential. For the most part gold stocks remain deeply out of favor, forgotten or ignored. But they will explode back on to speculators’ and investors’ radars if major new gold highs attract the financial media’s interest and attention.
Again as I discussed last week, gold’s nearing bull breakout will work wonders for not only psychology but hard gold-mining profits. The gold stocks are radically undervalued today compared to their actual underlying fundamentals. In Q4’17 gold averaged about $1276 per ounce, but the major gold miners of the leading GDX VanEck Vectors Gold Miners ETF reported average all-in sustaining costs of just $858 per ounce!
So they were already collectively earning fat operating profits of $418 per ounce. And these are going to soar in Q1’18, because the average gold price surged 4.1% quarter-on-quarter to $1329. Since mining costs are largely fixed, all-in sustaining costs will likely stay flat from Q4. That means major gold miners’ operating profits are likely to rocket 12.7% QoQ to $471 per ounce! That will delight contrarian investors.
The gold miners will be releasing these latest Q1 results between now and mid-May, right when gold is powering higher in its seasonal spring rally. So the gold stocks are certainly set up for an outsized spring rally this year! The potent combination of absurdly-cheap gold-stock prices, surging earnings forcing their valuations even lower, and higher gold prices attracting financial-media attention should really stoke traders’ interest.
This last chart breaks down gold-stock seasonality into even-more-granular monthly form. Each calendar month between 2001 to 2012 and 2016 to 2017 is individually indexed to 100 as of the previous month’s final close, then all like calendar months’ indexes are averaged together. Slicing up seasonal tendencies this way shows May has averaged the second-strongest monthly gold-stock gains in modern bull-market years.
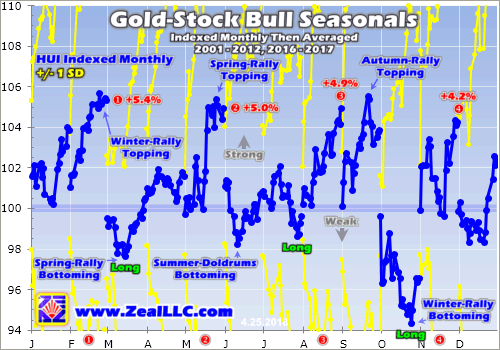
During these 14 Aprils in modern gold bull-market years, the gold stocks as measured by the HUI saw average gains of 1.6%. But the lion’s share of the spring-rally gains came in May, where average gains more than tripled to 5.0%! For decades if not longer, May has been one of the best and most-important months to be heavily long gold miners’ stocks. Only February proved better seasonally at a +5.4% average.
The key to gold stocks’ spring rally is to get your capital deployed in mid-March, when gold stocks swoon to their spring-rally bottoming. In intra-month terms the initial gains are often fast in late March as gold stocks rebound out of oversold lows. But then the spring rally tends to slow down in April, discouraging impatient and short-sighted traders. The real gains come in May, and next month’s setup is exceptionally bullish.
Of course the standard seasonality caveat applies that these are mere tendencies, not primary drivers of gold or gold stocks. Seasonal tailwinds can be easily drowned out by bearish sentiment, technicals, and fundamentals. Seasonality doesn’t always work, especially when it doesn’t align with the primary drivers of sentiment, technicals, and fundamentals in that order. Thankfully that certainly isn’t the case this year.
The gold miners’ stocks aren’t entering their second-strongest month of the year overbought after a big rally. Quite the contrary, they have really underperformed year-to-date on excessive bearishness. This week the HUI was actually still down 6.0% so far in 2018, far behind gold’s modest 1.6% gain! Since gold-mining profits amplify gold price moves, gold-stock prices tend to leverage gold by 2x to 3x much of the time.
Thus spring rally aside the HUI should already be up 3.1% to 4.7% year-to-date, or trading between 198.3 to 201.4 compared to this week’s anomalously-low 180.8. That’s another 9.6% to 11.3% higher from here even if gold merely stays near $1325. The gold stocks are overdue to mean revert higher no matter what gold does! Gold’s spring rally will simply hasten and enlarge gold stocks’ long-delayed next upleg.
The farther gold rallies in May in one of its strongest spans of the year seasonally, the closer it will get to major breakouts and new highs. The higher gold climbs, the more attention it will get from the financial media, investors, and speculators. As their sentiment turns bullish again, capital will flood back into the beaten-down gold stocks. The gold miners’ coming surging earnings in their Q1 results are icing on the cake.
While investors and speculators alike can certainly play gold stocks’ coming spring rally with the major ETFs like GDX, the best gains by far will be won in individual gold stocks with superior fundamentals. Their upside will trounce the ETFs’, which are burdened by over-diversification and underperforming gold stocks. A carefully-handpicked portfolio of elite gold and silver miners will generate much-greater wealth creation.
At Zeal we’ve literally spent tens of thousands of hours researching individual gold stocks and markets, so we can better decide what to trade and when. As of the end of Q4, this has resulted in 983 stock trades recommended in real-time to our newsletter subscribers since 2001. Fighting the crowd to buy low and sell high is very profitable, as all these trades averaged stellar annualized realized gains of +20.2%!
The key to this success is staying informed and being contrarian. That means buying low before others figure it out, before undervalued gold stocks soar much higher. An easy way to keep abreast is through our acclaimed weekly and monthly newsletters. They draw on my vast experience, knowledge, wisdom, and ongoing research to explain what’s going on in the markets, why, and how to trade them with specific stocks. For only $12 per issue, you can learn to think, trade, and thrive like contrarians. Subscribe today, and get deployed in the great gold and silver stocks in our full trading books!
The bottom line is gold stocks experience a strong spring rally seasonally. This is driven by gold’s own seasonality, where outsized investment demand arises at certain times during the calendar year. Gold usually enjoys a strong spring rally likely driven by the universal optimism this season brings. And since gold drives gold miners’ profitability, their stock prices naturally follow it higher while amplifying its gains.
And gold stocks’ already-strong spring rally is likely to prove exceptional this year. Gold stocks have really lagged gold so far in 2018, despite fat earnings rapidly growing with higher gold prices. Once gold nears breakouts, traders are going to remember the gold miners and be amazed by their dirt-cheap stock prices wildly disconnected from fundamentals. They will flood back into this small sector catapulting it higher.
Adam Hamilton, CPA
April 27, 2018
Copyright 2000 – 2018 Zeal LLC (www.ZealLLC.com)
Gold remains largely forgotten, off the radars of most investors. But that’s likely to change soon as this leading alternative investment is nearing a major bull breakout. Once gold climbs to decisive new bull-market highs, sentiment will turn and investors’ interest will surge. Their resulting buying will rapidly drive gold higher, attracting in more capital inflows. Gold is only a couple modest up days away from that key breakout.
Universally in all markets, traders’ psychology is completely dependent on price action and levels. When prices are high and rising, speculators and investors alike eagerly buy in. They love chasing winners, so buying begets buying. This creates powerful self-reinforcing virtuous circles, with rising prices helping to entice in ever-more traders. In recent years this dynamic catapulted the market-darling FANG stocks higher.
With capital inflows following performance, investments that aren’t high and rallying naturally see waning popularity. That’s the story of gold over the past couple years or so. Gold’s last new bull-market high came way back in early July 2016, when it hit $1365. That was 21.3 months ago, which may as well be an eternity in terms of sentiment. In most traders’ minds, gold has effectively been dead and buried ever since.
While contrarian investors always follow gold, most mainstream investors don’t. They only get interested when gold is powering up to major new highs. This psychology holds true everywhere in the markets, it’s certainly not unique to gold. A handful of mega-cap tech stocks have soared since Trump’s election win in November 2016, but other mega-cap tech stocks have lagged far behind. Traders always pursue performance.
This first chart looks at gold’s technical price action over the past couple years or so. A mighty new bull market erupted out of deep despair, blasting higher with steep gains. But the gold-investment-driving force behind it soon reversed, so this young bull stalled out. Gold hasn’t been able to best those initial bull highs ever since. So with no new highs to spark excitement, gold has slipped off investors’ radars.
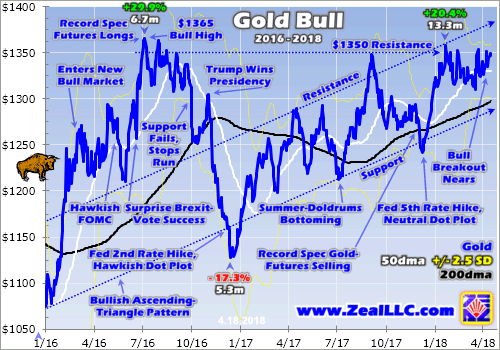
Gold prices are heavily influenced by gold-futures speculators. The extreme leverage inherent in futures trading enables these traders to punch way above their weight in bullying the gold price around. There is nothing these guys fear more than Fed rate hikes, even though history proves that’s absolutely irrational. So heading into the Fed’s first hike of this cycle in December 2015, gold slumped to ugly 6.1-year secular lows.
But such extreme bearishness made no sense, as gold has thrived in past Fed-rate-hike cycles. So once that initial rate hike came and gold didn’t plunge, speculators rushed to buy back in to gold futures after that $1051 low. They were soon joined by investors with their huge pools of capital. They were spooked by the first stock-market corrections in 3.6 years, which boost gold demand to diversify stock-heavy portfolios.
Thus gold soared 29.9% higher in just 6.7 months in essentially the first half of 2016, easily crossing that classic +20% new-bull-market threshold. Gold’s $1365 bull peak in early July 2016 was closely tied to stock-market fortunes, coming the very day before the flagship US S&P 500 stock index achieved its first new record close in 13.7 months. With stock markets off to the races again, gold investment demand waned.
Gold had been very overbought after such a blistering rally, and speculators had record long positions in gold futures which is a contrarian indicator. But gold still consolidated high in the summer of 2016 until it was hit by two anomalous events. First gold-futures stops were run as gold fell below $1300, driving a sharp drop to its 200-day moving average. Gold recovered quickly from that until Trump’s surprise win.
Very few traders expected Trump to stage a colossal underdog upset and win the presidential election in early November 2016. It was an extreme contrarian position, seen as madness. Interestingly as I wrote the very weekend before that voting, a powerful stock-market indicator predicted Trump would indeed win! That soon came to pass, shocking speculators and investors into greatly reevaluating their outlooks.
With Republicans soon to control the presidency and both chambers of Congress, traders’ euphoria flared to eye-searing brilliance. They were captivated by hopes for big tax cuts soon, and rushed to buy stocks with reckless abandon. As the stock markets surged first on Trumphoria and later taxphoria, gold fell deeply out of favor. Investors abandoned it since they felt no need to prudently diversify their soaring portfolios.
Thus a normal healthy gold correction after a strong upleg cascaded into a 17.3% plunge over 5.3 months ending in December 2016. Such sharp losses naturally devastated gold psychology among traders. The bull market was still alive and well technically, as gold didn’t cross that -20% new-bear trigger. But gold was still left for dead as the levitating stock markets sucked in most capital. Traders had largely moved on.
But gold still looked really bullish in mid-December 2016, as I explained within days of that correction low. Investors were radically underinvested in gold after fleeing in the election’s wake. And the truly incredible psychology unleashed by the Republican sweep wasn’t sustainable or repeatable. It’s pretty rare where nearly everyone gets presidential and congressional elections so wrong! So gold was overdue for some buying.
Ever since that post-election anomaly it has indeed powered higher on balance in the solid uptrend you can see in this chart above. Gold has been relentlessly carving a series of higher lows and higher highs, which made for a 20.4% upleg over the next 13.3 months. That’s actually big enough to qualify as a new bull market, but again gold never entered a bear. Such strong price action should’ve improved sentiment.
But it really didn’t. The extreme taxphoria last year made 2017 one of the most-extraordinary years on record for the US stock markets. The S&P 500 ceaselessly levitated to a massive 19.4% gain in the first year of the Trump Administration, accompanied by record-low volatility. With big US stocks powering higher so dramatically and painlessly, who needed gold? It tends to rally when stock markets are selling off.
While contrarians were rightfully impressed with gold’s strong bull-market uptrend since those anomalous post-election lows, mainstream investors didn’t know or care. Everything was rainbows and unicorns for them, despite dangerous bubble valuations in the stock markets. While gold’s 13.2% rally in 2017 would command attention normally, the 35% to 57% gains in the FANG stocks overshadowed it and stole the limelight.
There’s no doubt over a year of gold seeing higher lows and higher highs is very-bullish price action. All students of the markets would recognize this viewing gold charts. But climbing support and resistance lines are lost on the financial media and mainstream investors. Investments only start garnering talk and mindshare when major new highs are hit. Popular psychology is totally dependent on that one technical aspect.
Futures speculators view the horizontal $1350 line as key technical resistance. Gold has tried and failed to break out above it from several to nearly a dozen times since the summer of 2016 depending on how you slice such attempts. These guys need to see a decisive $1350 breakout to really motivate them to buy again. I define decisive as 1%+ beyond an old technical extreme, or about $1364 in gold’s case today.
That’s just a stone’s throw away, very close. Last week gold closed near $1352, and this week it was still up at $1349. All gold needs to see is a couple modest up days of 0.6% to push it back over $1365 for the first time in 21.3 months! That would work wonders for sentiment, rapidly turning it to bullish which would fuel much gold-futures buying. And the speculators currently have lots of room to buy gold futures.
As of the latest Commitments of Traders report before this essay was published, total spec gold-futures longs are only running 25% up into their past year’s trading range. That means 3/4ths of these traders’ likely capital firepower remains available to buy back in. Believe me, if they think gold is going to break out above $1350 resistance they will flood in with a vengeance. These elite traders follow charts by necessity.
Every gold-futures contract controls 100 troy ounces of gold, worth $134,900 this week. Yet these only require traders to keep $3,100 of cash per contract in their accounts. That works out to absurdly-extreme 43.5x maximum leverage! The legal limit in the stock markets has been 2x for decades. Traders running at that crazy limit would lose 100% of their capital risked if gold merely moves 2.3% against their futures bets.
At 20x leverage that risk is still suffocating, with a 5% adverse move necessary to wipe out capital risked. So when gold looks to be breaking out above $1350, these traders will rush to buy to cover shorts and add new longs. They are well aware gold has formed a giant ascending-triangle chart pattern over the past couple years or so. That’s defined as rising lower support compressing a price into horizontal upper resistance.
When ascending triangles resolve, it’s usually with a sharp-to-explosive upside breakout. Once that long-vexing overhead resistance fails, traders rush back in catapulting the price higher. When gold breaks out of such a massive ascending triangle, technically-oriented traders are going to get the heck out of the way if they are short and rush to ride the breakout on the long side. Futures speculators live and breathe technicals.
Their coming buying will fuel a far-more-important breakout. To the financial media and investors, new bull highs are the only thing that will draw their interest. Before July 2016’s $1365 bull-to-date peak, the last time gold closed over $1365 was way back in March 2014. So a $1365+ close right now would be a major new 4.1-year high. You better believe that will catch investors’ attention, getting gold back on radars!
A 1% decisive breakout above $1365 requires $1379 on close. That sounds lofty since it’s been so long since gold challenged $1400, but it is merely 2.2% above this week’s levels! When investors start getting excited about gold again, it takes months or even years to reestablish meaningful portfolio positions. The vastly-larger pools of capital they control overpower and dwarf whatever the futures speculators are doing.
As I explored a couple months ago, investors are radically underinvested in gold today. They will have to shift capital into gold for a long time to come to reverse this major anomaly. New gold bull-market highs all alone will prove a powerful motivator for them. But that will likely be amplified greatly by the ongoing stock-market correction. Stock selloffs ignite big investment demand for counter-moving gold to diversify portfolios.
If either speculators buy gold futures or investors buy gold and its major ETFs led by GLD SPDR Gold Shares in any significant quantities, gold will absolutely see these major breakouts. And there’s actually a good probability of that coming to pass in the next month or so. Gold tends to enjoy a major seasonal rally from late March to late May. That ought to be plenty big to drive gold decisively over $1350 and $1365.
This should really excite contrarian speculators and investors. While the gains in gold will be nice, they will be trounced by the accompanying surge in the gold miners’ stocks. This sector’s leading benchmark is the GDX VanEck Vectors Gold Miners ETF. Its technical price action over this same gold-bull span is shown in this second chart. While gold is nearing new bull highs, the gold stocks are lagging far behind.
With little interest in gold since Trump’s election victory, the gold miners’ stocks have been abandoned and left for dead. They’ve been drifting sideways in a vexing consolidation between $21 to $25 in GDX terms since late 2016. That’s despite their very-strong fundamentals. In their latest-reported quarter of Q4’17, these leading gold miners reported collective all-in sustaining costs averaging just $858 per ounce!
That’s far below prevailing gold prices, showing this industry is earning fat operating profits. In Q4’17 gold averaged about $1276 per ounce. In the latest Q1’18 which the gold miners will soon report on, that surged 4.1% quarter-on-quarter to a $1329 average. That implies profits of $471 per ounce, which is up 12.7% QoQ from Q4’17’s results! The gold miners are thriving which stock prices haven’t recognized yet.
In Q1’18 GDX’s average price of $22.57 was actually 0.8% lower than Q4’17’s $22.76! This highlights how deeply out of favor the gold miners are. But that psychology will reverse dramatically on that coming major gold breakout. Once gold starts hitting new highs again, traders will flock back to gold stocks since their mining profits leverage and amplify gold’s gains. That will drive a parallel big breakout in major gold stocks.
This week GDX was languishing near $23, dead-center in its 15.6-month-old consolidation between $21 support and $25 resistance. It would have to surge to $25.25 for a decisive breakout that would attract in a deluge of new capital. That’s 9.9% higher from this week’s levels, which actually isn’t much at all for this small volatile sector. Once gold stocks start rallying, they tend to move fast making for huge gains.
Since gold’s bull market began in mid-December 2015, GDX has actually seen 55 trading days with 3%+ gains! That’s nearly 1 out of every 10 trading days over that entire 2.3-year span. The gold stocks are truly less than a week of decent rallying away from a decisive breakout of their own. And once they start moving, traders will rush to buy back in to ride their explosive upside. When gold is in favor, this sector soars.
In roughly the same span of this gold bull’s first upleg in the first half of 2016, GDX skyrocketed 151.2% higher in 6.4 months on the parallel 29.9% gold upleg. That made for awesome wealth-multiplying 5.1x upside leverage to gold! While gold stocks are abandoned and forgotten when gold isn’t on traders’ radars, once they get interested again the gold stocks stage massive catch-up rallies. The next one is nearing.
The major gold miners’ early-2016 upleg wasn’t extreme at all considering the fundamentally-absurd prices gold stocks were trading at back then. GDX actually slumped to an all-time low, while the major gold stocks as measured by their HUI index were at a 13.5-year low. They were trading at levels last seen in July 2002 when gold was near $305. So they needed to soar to mean revert out of that crazy anomaly.
Another massive mean reversion higher is certainly needed today. Gold first hit this week’s $1350 levels in mid-October 2010. Since this metal was carving new all-time highs, investors were eager to buy in for the ride. Back then GDX was trading over $57, or 150% higher than today’s levels with these same prevailing gold prices! GDX’s bull-to-date peak in early August 2016 was $31.32, or just 36% higher from here.
So there’s a high chance the gold-stock upleg driven by the coming gold breakout will easily catapult the gold stocks to new bull highs too. During the last secular bull in gold stocks between November 2000 to September 2011, the HUI skyrocketed 1664% higher. There were 11 major uplegs during that span that averaged 81% gains over 7.9 months each! So seeing gold stocks rally 40% or 50% from here is nothing.
The gold stocks are truly a coiled spring today, ready to explode higher soon and trounce everything else. They are deeply out of favor, incredibly undervalued, and one of the only sectors that can rally sharply when general stock markets sell off. If you want to multiply your wealth this year by fighting the crowd to buy low then sell high, this small and forgotten contrarian sector is the place to be. Nothing else rivals it.
While investors and speculators alike can certainly play gold stocks’ coming powerful upleg with the major ETFs like GDX, the best gains by far will be won in individual gold stocks with superior fundamentals. Their upside will far exceed the ETFs, which are burdened by over-diversification and under-performing gold stocks. A carefully-handpicked portfolio of elite gold and silver miners will generate much-greater wealth creation.
At Zeal we’ve literally spent tens of thousands of hours researching individual gold stocks and markets, so we can better decide what to trade and when. As of the end of Q4, this has resulted in 983 stock trades recommended in real-time to our newsletter subscribers since 2001. Fighting the crowd to buy low and sell high is very profitable, as all these trades averaged stellar annualized realized gains of +20.2%!
The key to this success is staying informed and being contrarian. That means buying low before others figure it out, before undervalued gold stocks soar much higher. An easy way to keep abreast is through our acclaimed weekly and monthly newsletters. They draw on my vast experience, knowledge, wisdom, and ongoing research to explain what’s going on in the markets, why, and how to trade them with specific stocks. For only $12 per issue, you can learn to think, trade, and thrive like contrarians. Subscribe today, and get deployed in the great gold and silver stocks in our full trading books!
The bottom line is gold is nearing a major bull breakout above $1365. That will turn psychology bullish and bring traders back in droves. Gold is rallying ever closer to new bull-market highs as evidenced by its massive multi-year ascending-triangle chart pattern now nearing a bullish climax. Today gold is only a couple percent below that decisive breakout, which will finally blast it back onto the radars of investors.
That’s likely coming soon, with gold in the midst of its major spring seasonal rally. Speculators have lots of room to add gold-futures longs, while investors remain radically underinvested. And once gold comes back into favor, the abandoned gold miners’ stocks are going to soar. Their prices are far below where they ought to be based on their fundamentals and prevailing gold levels. Their upside from here is enormous.
Adam Hamilton, CPA
April 20, 2018
Copyright 2000 – 2018 Zeal LLC (www.ZealLLC.com)
The mega-cap stocks that dominate the US markets have enjoyed an amazing bull run. But February’s first correction in years proved things are changing. With that unnatural low-volatility melt-up behind us, it’s more important than ever to keep leading stocks’ underlying fundamentals in focus. They help investors understand which major American companies are the best buys and when to deploy capital in them.
For some years now, I’ve been doing deep dives into the quarterly financial and operational results in the small contrarian sector of gold and silver miners. While hard and tedious work, this exercise has proven incredibly valuable. With each passing quarter my knowledge of individual companies grows, helping to ferret out miners with superior fundamentals and the greatest upside potential. Traders love the resulting essays.
This successful fundamental-research methodology can be applied to other sectors, and even the stock markets as a whole. And no “sector” is more important to the overall stock markets than the biggest and best American companies. So I’m starting this new essay series to analyze their quarterly results on an ongoing basis. Today’s initial foray starts with their latest results from Q4’17, a critical baseline quarter.
With the new Q1’18 earnings season getting underway, Q4’17’s data is getting stale. Optimally this research would’ve been done 6 weeks or so ago. But it wasn’t until long-lost stock-market volatility finally roared back in February and March that it became abundantly clear big changes are afoot. After that it took time to build our necessary underlying spreadsheets and dive into the big US stocks’ Q4 results.
Going forward it will be easier to analyze and publish new quarters’ results much sooner after those quarters end. But getting Q4’17 baseline data was absolutely essential. That may very well prove the final quarter in one of the most-extraordinary bull markets on record. The flagship S&P 500 stock index had powered 324.6% higher over 8.9 years, making for the third-largest and second-longest US bull on record!
That was also just a hair under the second-largest ranking. 2017 was truly the best of times for the stock markets too. Record-low volatility along with extreme euphoria in anticipation of Republicans’ coming massive corporate tax cuts drove the S&P 500 (SPX) 19.4% higher with nary even a trivial 4%+ pullback. Nearly everyone was convinced this idyllic rally could continue indefinitely, traders were utterly enchanted.
A key real-world side effect of last year’s epic stock-market exuberance was sharply-higher spending by households and corporations alike. Late in major bull markets when everyone is complacent and greedy the wealth effect is very strong. People extrapolate their fat stock gains out into infinity, and ramp their spending accordingly. That drives strong growth in corporate sales and profits, greatly reinforcing the elation.
As a contrarian student of the markets and trader, I wasn’t drinking that Kool-Aid. On 2017’s final trading day I published an essay on the hyper-risky stock markets, explaining why a new bear was long overdue. The valuations of the elite SPX stocks were deep into formal bubble territory, running at average trailing-twelve-month price-to-earnings ratios of 30.7x at the time. That would further balloon to 31.8x by late January!
More importantly, the world’s major central banks were pulling away the punch bowls that had directly fueled that vast orgy of stock-market excess. The Fed was starting to ramp its first-ever quantitative-tightening campaign to begin unwinding long years and trillions of dollars of quantitative-easing money printing. And the European Central Bank was drastically tapering its own QE bond-buying campaign.
This unprecedented tightening following radically-unprecedented QE would literally strangle the stock markets, as I explained in late October. The extreme euphoria drowned out those warnings then, but traders are more receptive now after the SPX’s first 10%+ correction in 2.0 years in early February. All this suggests high odds that Q4’17 will prove the final pre-peaking quarter of that central-bank-goosed bull.
Thus I couldn’t wait for Q1’18 data to start this new essay series, I had to get Q4’17’s baseline data no matter what. The world’s most-important stock index by far is the US S&P 500, which weights America’s biggest and best companies by market capitalization. So not surprisingly the world’s largest and most-important ETF is the SPY SPDR S&P 500 ETF which tracks the SPX. This week it had net assets of $252.4b!
That’s a staggering sum, reflecting the universal popularity of index investing late in major bull markets. Two of the next three largest ETFs also track the S&P 500, the IVV iShares Core S&P 500 ETF at $140.4b and the VOO Vanguard S&P 500 ETF at $87.1b. These dwarf the entire rest of the ETF sector. For comparison, the dominant and popular GLD SPDR Gold Shares gold ETF has net assets of just $37.3b.
Unfortunately my small financial-research company lacks the manpower to analyze all 500 SPX stocks in SPY each quarter. Support our business with enough newsletter subscriptions, and I would gladly hire the people necessary to do it! But for now we’re starting with the top-34 SPY components ranked by market capitalization. That’s an arbitrary number that fits neatly into the tables below, but a commanding sample.
As of the end of Q4’17 on December 29th, these 34 companies accounted for a staggering 41.8% of the total weighting in SPY and the SPX itself! They are the biggest and best American companies that are largely-if-not-totally driving US stock-market fortunes. Whether the SPX rolls over into a new bear market or not will depend on how these elite stocks fare. They are the widely-held mega-cap stocks everyone loves.
Every quarter I’m going to wade through a ton of core fundamental data on each top-34 SPX company and dump it into a spreadsheet for analysis. The highlights make it into these tables. They start with each company’s symbol, weighting in the SPX and SPY, and market cap as of the final trading day of Q4’17. That’s followed by the year-over-year change in each company’s market capitalization, a critical metric.
Major US corporations have been engaged in a wildly-unprecedented stock-buyback binge ever since the Fed forced interest rates to deep artificial lows during 2008’s stock panic. Thus their share-price appreciation also reflects shrinking shares outstanding. Looking at market-cap changes instead of just underlying share-price changes effectively normalizes stock buybacks. It’s a purer view of company value.
The next data set is quarterly sales along with their YoY changes. Revenues are one of the best indicators of businesses’ health. While profits can be manipulated quarter-to-quarter by playing with accounting estimates, sales are mostly set in stone. Ultimately sales growth is necessary for companies to expand, as earnings boosts driven by cost-cutting are inherently limited. Sales declines are bear-market harbingers.
Operating cash flows are also very important, showing how much capital companies’ businesses are actually generating. Unfortunately most of these elite big US stocks didn’t break out Q4’17 OCF, instead lumping it in with full-year financial statements. While that can still be calculated by subtracting the Q1 to Q3 OCFs from the annual one, that’s tedious and time-consuming. Not reporting full Q4 results disrespects investors.
Next are the real quarterly earnings that must be reported to the Securities and Exchange Commission under Generally Accepted Accounting Principles. Late in bull markets, companies tend to use fake pro-forma earnings to downplay GAAP results. These are derided as EBS earnings, Everything but the Bad Stuff! Companies arbitrarily ignore certain expenses to artificially inflate their profits, which is very misleading.
While we’re also collecting earnings-per-share data, it’s more important to consider total profits. Stock buybacks are executed to drive EPS higher, because the shares-outstanding denominator shrinks as shares are repurchased. Raw profits are a cleaner measure, normalizing out stock buybacks’ impacts. When the inevitable bear market arrives, companies will attempt to mask falling earnings by emphasizing EPS.
Finally the trailing-twelve-month price-to-earnings ratio is noted. TTM P/Es look at the last four reported quarters of actual GAAP results compared to prevailing stock prices. They are the gold-standard metric for valuations. Wall Street often intentionally obscures these hard P/Es by using forward P/Es instead, which are literally mere guesses about future profits! They have usually proven far too optimistic in the past.
As expected given last year’s spending-driving stock-market euphoria, the top SPY/SPX components’ Q4’17 results were generally quite impressive. Their sales grew strongly, but were still far-outpaced by their stock-price gains driving valuations sharply higher. Earnings were heavily distorted due to the impact of Republicans’ big corporate tax cuts passing that quarter, which was fascinating to analyze.
Not surprisingly the S&P 500’s top-constituent list was little changed in 2017. Most of these elite American companies only grew larger. Three stocks did claw their way into the top 34 since Q4’16, their symbols are highlighted in blue above. Boeing is a high-priced Dow 30 stock, which has skyrocketed on better business prospects driving the Dow higher. Its market cap soared an astounding 85% higher last year!
Any company with YoY market-cap gains over 19% beat the overall SPX last year, while any company below that lagged it. These top-34 US stocks saw average market-cap gains of 29%, well ahead of that average. One of the telltale characteristics of bull-market tops is gains concentrate in fewer and fewer stocks. The well-known shrinking-business problems of GE and IBM forced them just out of the top 34 last year.
With 500 stocks in the S&P 500, it’s still amazing and damning that 41.8% of this entire index’s market cap is concentrated in just 34 big US stocks! At the end of Q4’17, investors had $10.2t of wealth tied up in these elite companies. That extreme concentration is a double-edged sword, because bear markets often inflict downside damage on individual stocks in proportion to their upsides seen in the preceding bulls.
Ominously the universally-adored and -owned mega-cap tech stocks were dominating the SPX at the end of 2017. Apple, Alphabet, Microsoft, Amazon, and Facebook all had staggering market caps in excess of a half-trillion dollars each. These 1% of SPX stocks weighed in at a colossal 13.8% of index weight! Their average TTM P/E was 61.7x, more than double the 28x classical bubble threshold. That’s super risky!
One reason investors have been willing to pay such high premiums for the tech market darlings is their astounding sales growth. While the top-34 SPX companies together averaged still-impressive 11% sales growth from Q4’16 to Q4’17, the top 5 tech stocks trounced that at 28%! The rest of these top-34 SPY components reporting Q4 sales averaged about a quarter of that at 7.7%. So these tech stocks look invincible.
But such fast sales growth is unsustainable given their massive sizes, and likely to reverse with the stock markets. Everyone loves Apple’s products, but they are expensive. iPhones and iPads last years with no need to upgrade, and major upgrades are few and far between anyway with those technologies maturing. So the upgrade cycles Apple desperately needs to drive its massive sales are lengthening considerably.
As the stock markets’ wealth effect reverses to negative in the next bear market, odds are Americans will keep their iPhones longer before buying new ones. These are sizable expenses relative to median US household incomes. Amazon might be able to better weather a stock-market storm, depending on how much of the stuff Americans order from it is necessary versus discretionary. Its bear sales trends will be interesting.
Alphabet, Microsoft, and Facebook rely heavily on business spending. The coming huge tax cuts made 2017 a banner year for business confidence, leading to giant leaps in spending on online advertising as well as back-office data services. When the next recession comes accompanying the stock bear, much of that euphoric business spending will wither and reverse. So mega-cap-tech sales growth ahead isn’t so rosy.
I was very dismayed to find only 13 of these biggest-and-best American companies bothered reporting their Q4 operating cash flows to their investors. These companies have effectively infinite accounting resources, yet their Q4 breakouts from full-year results were terrible. Even the gold miners with their wildly-varying accounting and home countries did way better. So there’s not enough Q4 OCFs to bother analyzing.
Thankfully that won’t be the case in Q1s to Q3s, where every one of these elite stocks will dutifully report their quarterly operating cash flows. In the gold-mining space, sometimes companies choosing to obscure their OCFs want to hide poor performance. I don’t think that’s the case in these top SPX/SPY companies given their strong sales growth. But I’m shocked they don’t consider shareholders worthy of this key data.
The biggest surprises for me in this first foray into big US stocks’ quarterly results came on the earnings front. As expected given all the spending-inducing stock euphoria last year, overall profits of these top-34 SPY components grew to $112.2b in Q4. That made for average YoY gains of 137%, certainly sounding phenomenal. But that was just one quarter, not the entire year. So valuations didn’t decline on that.
The dominant reason the stock markets soared in 2017 was the coming massive corporate tax cuts. All year long there was great anticipation of them becoming law. The actual Tax Cuts and Jobs Act of 2017 bill was introduced in early November, passed the House in mid-November, passed the Senate in early December, and then was passed again in its reconciled version in both Congress chambers in mid-December.
Trump signed it into law and made it official on December 22nd, 2017. This whole process surrounding the actual bill began and ended in Q4. Its flagship provision was slashing the US corporate tax rate from 35% to 21%. This was a huge cut despite many offsetting business deductions and credits also being eliminated. It was probably the biggest change in US corporate taxation in history, a huge shift to adjust to.
For large publicly-traded companies, the SEC requires formal 10-K annual reports after fiscal year-ends to be filed by 60 days after quarter-ends. So American companies only had about 9 weeks to analyze the impact of the TCJA on their businesses before reporting Q4’17. Fully 33 of these top 34 companies in the SPX reported TCJA adjustments to their Q4’17 profits. Apple was the only company not breaking it out.
These adjustments’ profits impacts had an enormous range, from a colossal $29.1b boost to Berkshire Hathaway’s Q4 profits to a gargantuan $22.0b hit on Citigroup’s! So nearly all these Q4 GAAP profits are somewhat-to-heavily distorted by one-time impacts of those corporate tax cuts. Most of the really-big profits and really-big losses above are the result of these TCJA adjustments and not business operations.
In reading through all these 10-Ks and 10-Qs, there were generally two major tax-cut drivers impacting profits. The first was deferred tax assets and liabilities. These are very complicated, but basically US companies either overpaid or underpaid their taxes in individual years due to various accounting rules. The differences become DTAs or DTLs, which reduce or increase future years’ tax burdens for these companies.
But when the corporate tax rate was drastically slashed from 35% to 21%, all of a sudden both DTAs and DTLs were worth much less going forward. DTAs shielded less future profits at lower tax rates, while DTLs would have lower future tax payments. Different industries and businesses had wildly-different deferred taxes on their books. The second provision driving the adjustments was a one-time repatriation tax.
Because the US corporate tax rate had been so obnoxiously high relative to the rest of the world for so long, major companies played accounting games recognizing earnings in other countries. This stacked up to trillions of dollars held overseas. The TCJA imposed a one-time repatriation tax assuming that this cash was being sent back to the US whether that was true or not, which was a big cost for some companies.
So these Q4’17 profits numbers are very distorted by these one-time TCJA adjustments flushed through income statements. I gathered all these with the rest of the data, and expected a big overall impact on their collective profits. The absolute value of all of them together for these top-34 US stocks was a truly-staggering $209.2b in Q4’17! That dwarfed the actual reported GAAP profits running $112.2b that quarter.
Thus I watched the running total with great interest as I waded through the quarterlies. I expected to see corporate profits greatly overstated by the TCJA adjustments. But much to my surprise, the net of all of these positive and negative profits impacts was merely +$2.7b. That’s just 2.4% of the total earnings of these top-34 big US stocks, essentially a wash. Will the corporate tax cuts be less valuable than expected?
While the old statutory corporate rate was 35%, many companies are using schemes and loopholes to pay far less. Many of those were closed to get to 21%. If the positive impact of lower corporate taxes is smaller going forward than Wall Street joyously expects, it will have a big adverse psychological impact. If profits don’t balloon dramatically as forecast, valuations are going to get even more dangerously extreme.
While individual top SPX companies’ profits won’t be comparable with those big TCJA adjustments, they will be collectively with the overall flat impact. If the $112.2b of Q4’17 GAAP profits earned by these top 34 US companies is annualized, it implies $448.9b of earnings on a $10.2t collective market cap. That equates to a 22.7x overall P/E for these big US stocks at the end of one of the best corporate-profits years ever.
That’s not in bubble territory, but still very expensive after such a big and long bull. But not aggregated these top stocks look way more overvalued. Their average TTM P/Es, which didn’t yet include Q4’17 earnings at the end of December, ran way up at 30.6x. That’s still above that 28x bubble threshold. But Amazon is an insane outlier at 190.2x earnings. Ex-Amazon, that top-SPY-stocks average drops to 25.8x.
That’s still frighteningly high. The whole purpose of bear markets following long bull markets is to drag stock prices down and sideways long enough for earnings to catch up with lofty stock prices. Bears don’t end until overall stock-market P/E ratios collapse back down to 7x to 10x earnings! That implies the US stock markets face getting at least cut in half, which is typical in major bear markets. That’s serious downside.
Ominously most of this past year’s incredible stock-price appreciation in these elite companies wasn’t driven by earnings growth. The average jump in their market capitalizations from the end of Q4’16 to the end of Q4’17 was 29%. In this same span their TTM P/E ratios climbed an average of 25%. Thus these top SPY companies’ earnings barely grew during all of last year despite all the record-high-stocks euphoria!
The hard data proves that’s true. In Q4’16, these same 34 big US stocks collectively earned $110.4b. That only rose 1.7% YoY to $112.2b in Q4’17. Yet their total market caps still blasted 26.9% higher! This proves one of the greatest stock-market years on record didn’t drive any meaningful earnings growth in Q4, which tends to be the best quarter of the year on holiday spending. Fundamentals didn’t improve.
Last year’s extreme stock-market melt-up to dazzling new all-time highs was purely a sentiment thing, not at all fueled by GAAP earnings growth. 2017’s big gains were built on sand. Psychology is a fleeting capricious thing that will absolutely mean revert back to neutral and overshoot to bearish. And when that happens, the profits won’t be there to keep these elite market-darling stocks from getting mauled by the bear.
Despite the recent mild correction, these stock markets remain exceedingly overvalued and dangerous. The big US stocks’ Q4’17 fundamentals prove corporate earnings remain far too low to justify such high stock prices. That’s terrifying in 2018 where the Fed and ECB will collectively remove $950b of liquidity compared to last year! Regardless of valuations, this alone would plunge these stock markets into a new bear.
Investors really need to lighten up on their stock-heavy portfolios, or put stop losses in place, to protect themselves from the coming central-bank-tightening-triggered valuation mean reversion in the form of a major new stock bear. Cash is king in bear markets, as its buying power grows. Investors who hold cash during a 50% bear market can double their stock holdings at the bottom by buying back their stocks at half-price!
SPY put options can also be used to hedge downside risks. They are still relatively cheap now with complacency rampant, but their prices will surge quickly when stocks start selling off materially again. Even better than cash and SPY puts is gold, the anti-stock trade. Gold is a rare asset that tends to move counter to stock markets, leading to soaring investment demand for portfolio diversification when stocks fall.
Gold surged nearly 30% higher in the first half of 2016 in a new bull run that was initially sparked by the last major correction in stock markets early that year. If the stock markets indeed roll over into a new bear in 2018, gold’s coming gains should be much greater. And they will be dwarfed by those of the best gold miners’ stocks, whose profits leverage gold’s gains. Gold stocks skyrocketed 182% higher in 2016’s first half!
Absolutely essential in bear markets is cultivating excellent contrarian intelligence sources. That’s our specialty at Zeal. After decades studying the markets and trading, we really walk the contrarian walk. We buy low when few others will, so we can later sell high when few others can. While Wall Street will deny the coming stock-market bear all the way down, we will help you both understand it and prosper during it.
We’ve long published acclaimed weekly and monthly newsletters for speculators and investors. They draw on my vast experience, knowledge, wisdom, and ongoing research to explain what’s going on in the markets, why, and how to trade them with specific stocks. As of the end of Q4, all 983 stock trades recommended in real-time to our newsletter subscribers since 2001 averaged stellar annualized realized gains of +20.2%! For only $12 per issue, you can learn to think, trade, and thrive like contrarians. Subscribe today!
The bottom line is the big US stocks’ latest quarterly results are concerning. Despite a perfect year for the stock markets, and boundless optimism fueled by hopes for big tax cuts soon, corporate profits were largely flat in Q4. If the biggest and best American companies can’t grow earnings substantially even in that ideal environment, how will they fare when these stock markets inevitably roll over into a long-overdue bear?
And the initial massive-corporate-tax-cut impact on corporate profits was effectively a wash. What if the slashed corporate tax rate doesn’t yield the expected earnings windfall in 2018? This risk coupled with slowing sales as stock markets weaken is incredibly bearish. Especially with the biggest and best US stocks everyone loves and owns still trading near or above bubble valuations as central banks greatly tighten.
Adam Hamilton, CPA
April 13, 2018
Copyright 2000 – 2018 Zeal LLC (www.ZealLLC.com)

The silver miners’ stocks have really languished since mid-2016, relentlessly grinding sideways to lower. With gold out of favor, silver and its miners have largely been left for dead and forgotten. This sector is deeply mired in universal apathy and bearishness. But since silver stocks can skyrocket when silver decisively rallies again, it’s important to keep an eye on silver miners’ fundamentals like their recent Q4’17 results.
Four times a year publicly-traded companies release treasure troves of valuable information in the form of quarterly reports. Required by securities regulators, these quarterly results are exceedingly important for investors and speculators. They dispel all the sentimental distortions surrounding prevailing stock-price levels, revealing the underlying hard fundamental realities. They serve to re-anchor perceptions.
Normally quarterlies are due 45 calendar days after quarter-ends, in the form of 10-Qs required by the SEC for American companies. But after the final quarter of fiscal years, which are calendar years for most silver miners, that deadline extends out up to 90 days depending on company size. The 10-K annual reports required once a year are bigger, more complex, and need fully-audited numbers unlike 10-Qs.
So it takes companies more time to prepare full-year financials and then get them audited by CPAs right in the heart of their busy season. The additional delay in releasing Q4 results is certainly frustrating, as that data is getting stale approaching the end of Q1. While most silver miners report their Q4 and/or full-year results by 7 to 9 weeks after year-ends, some disrespect their investors by pushing that 13-week limit.
And some silver miners only publish full-year results without breaking out Q4, masking what happened in the latest quarter. All this unfortunately makes Q4 results the hardest to analyze out of all quarterlies. But delving into them is still well worth the challenge. Quarterly results offer a very valuable true snapshot of what’s really going on, shattering all the misconceptions bred by the ever-shifting winds of sentiment.
Silver mining is a tough business both geologically and economically. Primary silver deposits, those with enough silver to generate over half their revenues when mined, are quite rare. Most of the world’s silver ore formed alongside base metals or gold, and their value usually well outweighs silver’s. So typically in any given year, less than a third of the global mined silver supply actually comes from primary silver mines!
The world authority on silver supply-and-demand fundamentals is the Silver Institute. Back in mid-May it released its latest annual World Silver Survey, which covered 2016. That year only 30% of silver mined came from primary silver mines, a slight increase. The remaining 70% of silver produced was simply a byproduct. 35% of the total mined supply came from lead/zinc mines, 23% from copper, and 12% from gold.
As scarce as silver-heavy deposits supporting primary silver mines are, primary silver miners are even rarer. Since silver is so much less valuable than gold, most silver miners need multiple mines in order to generate sufficient cash flows. These often include non-primary-silver ones, usually gold. More and more traditional elite silver miners are aggressively bolstering their gold production, often at silver’s expense.
So the universe of major silver miners is pretty small, and their purity is shrinking. The definitive list of these companies to analyze comes from the most-popular silver-stock investment vehicle, the SIL Global X Silver Miners ETF. This week its net assets are running 6.8x greater than its next-largest competitor’s, so SIL really dominates this space. As investors buy SIL, it in turn buys shares in the companies it holds.
Back in mid-March as the major silver miners were finishing reporting their Q4’17 results, SIL included 25 “silver miners”. This term is used loosely, as SIL holds plenty of companies which can’t be described as primary silver miners. Most generate well under half their revenues from silver, which really limits their stock prices’ leverage to silver rallies. Nevertheless, SIL is today’s leading silver-stock ETF and benchmark.
The higher the percentage of sales any miner derives from silver, naturally the greater its exposure to silver-price moves. If a company only earns 20%, 30%, or even 40% of its revenues from silver, it’s not a primary silver miner and its stock price won’t be very responsive to silver itself. But as silver miners are increasingly actively diversifying into gold, there aren’t enough big primary silver miners left to build an ETF alone.
Every quarter I dig into the latest results from the major silver miners of SIL to get a better understanding of how they and this industry are faring fundamentally. I feed a bunch of data into a big spreadsheet, some of which made it into the table below. It includes key data for the top 17 SIL component companies, an arbitrary number that fits in this table. That’s a commanding sample at 94.6% of SIL’s total weighting.
While most of these top-17 SIL components had reported on Q4’17 by late March, not all had. Some of these major silver miners trade in the UK or Mexico, where financial results are only required in half-year increments. If a field is left blank in this table, it means that data wasn’t available by the end of Q4’s earnings season. Some of SIL’s components also report in gold-centric terms, excluding silver-specific data.
In this table the first couple columns show each SIL component’s symbol and weighting within this ETF as of mid-March. While most of these silver stocks trade in the States, not all of them do. So if you can’t find one of these symbols, it’s a listing from a company’s primary foreign stock exchange. That’s followed by each company’s Q4’17 silver production in ounces, along with its absolute year-over-year change.
After that comes this same quarter’s gold production. Pretty much every major silver miner in SIL also produces significant-if-not-large amounts of gold! While gold stabilizes and augments the silver miners’ cash flows, it also retards their stocks’ sensitivity to silver itself. Naturally investors and speculators buy silver stocks and their ETFs because they want leveraged upside exposure to silver’s price, not gold’s.
So the next column reveals how pure the elite SIL silver miners are. This is mostly calculated by taking a company’s Q4 silver production, multiplying it by Q4’s average silver price, and then dividing that by the company’s total quarterly sales. If miners didn’t report Q4 revenues, I approximated them by adding the silver sales to gold sales based on their quarterly production and these metals’ average fourth-quarter prices.
Then comes the most-important fundamental data for silver miners, cash costs and all-in sustaining costs per ounce mined. The latter determines their profitability and hence ultimately stock prices. Those are also followed by YoY changes. Finally comes the YoY changes in cash flows generated from operations and GAAP profits. But there are a couple exceptions where YoY changes just wouldn’t yield useful results.
Percentage changes aren’t relevant or meaningful if data shifted from positive to negative or vice versa, or if derived from two negative numbers. So in those cases I included raw underlying results instead of weird or misleading percentage changes. This whole dataset offers a great high-level read on how the major silver miners are faring today as an industry. They’re doing pretty well in this weak-silver-price environment.
That’s reassuring given silver’s serious underperformance relative to gold. As a far-smaller market, silver usually amplifies gold’s advances by 2x to 3x. Yet in 2017, silver only rallied 6.4% despite a much-bigger 13.2% gold rally. That vexing trend has continued in 2018, with silver down 3.8% year-to-date while gold is 1.8% higher. With silver itself really sucking wind, investors sure aren’t motivated to buy silver stocks.
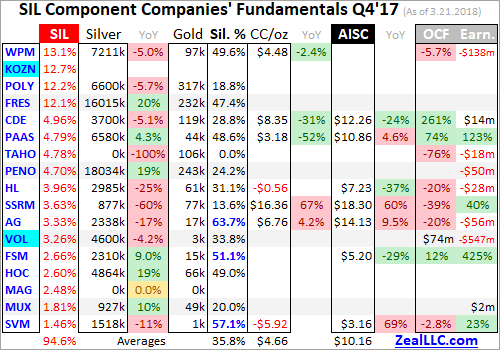
Production is the lifeblood of miners, and thus the best place to start fundamental analysis. In Q4’17, these top-17 SIL components collectively produced an impressive 78.6m ounces of silver. If 2016’s world-silver-mining run rate is applied to last year’s fourth quarter, that implies 221.5m ounces of silver mined. Thus these top SIL silver miners would account for nearly 36% of that total, they truly are major silver players.
Their collective silver production looks solid, climbing 3.0% YoY. But unfortunately that’s misleading, as huge growth in a couple mining conglomerates is masking sharp-to-catastrophic declines for some of the rest of these SIL-component miners struggling with low silver prices. Fresnillo and Industrias Peñoles enjoyed major 20% and 19% YoY gains in silver production off their already-gigantic world-leading bases!
Fresnillo and Industrias Peñoles have an incestuous relationship, as the former used to be wholly owned by the latter. Industrias Peñoles spun off Fresnillo back in May 2008 on the London Stock Exchange. While Fresnillo’s financial reporting is decent, Industrias Peñoles’ is murky. Neither my decades studying financial statements as a Certified Public Accountant nor my rudimentary Spanish can penetrate very deep.
So I haven’t been able to track down how much of Fresnillo that Industrias Peñoles still owns, nor whether the silver production reported by these silver-mining behemoths is actually mutually exclusive. I’m assuming it is for this analysis, but I’m skeptical. Both companies reported their huge YoY growth in silver production was the result of Fresnillo’s new San Julián silver mine coming online, which is a big one.
San Julián produced 4057k ounces of silver in Q4’17 alone, along with fairly-large gold, zinc, and lead byproducts. It’s anticipated to produce 11.6m and 63.7k ounces of silver and gold annually for 12 years. Without San Julián, which could be double-reported between Fresnillo and Industrias Peñoles, the top SIL silver miners’ production would look very different. These elite silver miners have had a challenging year.
Excluding Fresnillo and Peñoles, the rest of these top SIL components saw their collective silver production fall a sizable 6.8% YoY to 44.5m ounces! It’s been quite ugly out there in silver-land, for both industry-wide and company-specific reasons. Between Q4’16 and Q4’17, the average silver price retreated 2.5% to just $16.69. That was far worse than average gold’s 4.8% YoY gain, testing silver’s economics.
With silver prices so weak, sentiment so bearish, and silver-stock prices so darned low, silver miners are both starved of capital for expansions and reluctant to invest heavily in the silver side of their businesses. Mining gold is far more profitable at today’s precious metals’ prices, so they continue to allocate scarce resources to growing their gold production. That certainly isn’t helping the purity of the major silver miners.
A couple long-time favorites of American investors saw silver production plummet over this past year. Tahoe Resources was originally spun off by Goldcorp to develop the incredible high-grade Escobal silver mine in Guatemala. Over the past year that country’s corrupt government shut this mine down after a frivolous and baseless lawsuit by anti-mining activists. They sued the government regulator, not Tahoe itself!
That lawsuit claimed Guatemala’s Ministry of Energy and Mines did not properly consult with the Xinca indigenous people before granting Escobal’s permits! That shouldn’t even be Tahoe’s problem if the government bureaucrats didn’t hold enough meetings, yet Escobal’s mining license was still suspended. The dishonorable Guatemalan government has been dragging its feet ever since, so Escobal is frozen in stasis.
The government’s lack of respect for the rule of law shows why third-world countries stay that way. For many months it allowed violent anti-mine militants to illegally blockade the road to Escobal and physically attack trucks and their drivers! Tahoe eventually had to fire about half of the 1000+ local employees who had high-paying jobs at that mine. Tahoe’s silver production cratered 100% YoY from 4827k ounces to zero.
SSR Mining saw a similar sharp 60% YoY plummet in silver production to just 877k ounces in Q4’17. It had nothing to do with geopolitics like Tahoe’s mess, but is simply due to the forecast depletion of its old Pirquitas silver mine. SSR Mining, which used to be called Silver Standard Resources, is exploring in the area trying to extend the life of this mine. But most of its financial resources are being poured into its gold mines.
That gold focus among these top silver miners is common across SIL’s components. As the silver-percentage column above shows, most of these elite silver miners are actually primary gold miners by revenue! Only 3 of these 17 earned more than half of their Q4’17 sales from mining silver, and they are highlighted in blue. WPM, CDE, PAAS, TAHO, and HL are also top-34 components in the leading GDX gold miners’ ETF.
While they only comprised 8.3% of GDX’s total weighting in late March, this highlights how difficult it is to find primary silver miners. SIL’s managers have an impossible job these days with the major silver miners increasingly shifting to gold. They are really scraping the bottom of the barrel to find more silver miners. In Q3’17 they added Korea Zinc, and it’s now SIL’s 2nd-largest holding with a large 12.7% total weighting.
That was intriguing, as I’d never heard of this company after decades of intensely studying and actively trading silver stocks. So I looked into Korea Zinc and found it was merely a smelter, not even a miner! The latest financial data I could find in English was 2015’s. That year Korea Zinc “produced” 63.3m ounces of silver, which was largely a byproduct from its main business of smelting zinc, lead, copper, and gold.
I ran the numbers for the heck of it, and silver was implied as 32% of Korea Zinc’s 2015 revenues. The fact SIL’s managers included a company like this that doesn’t even mine silver as a top SIL component shows how rare major silver miners have become. The economics of silver mining at today’s prices are inferior to gold mining. Thus the average silver-purity percentage of revenues of these SIL miners is only 35.8%.
That’s right in line with the downtrend over this past year, with Q4’16, Q1’17, Q2’17, and Q3’17 seeing SIL’s top-component silver purity averaging 40.6%, 38.5%, 37.6%, and 40.1%. Silver mining is as capital-intensive as gold mining, requiring similar large expenses for planning, permitting, and constructing mines and mills. It needs similar heavy excavators and haul trucks to dig and move the silver-bearing ore.
But silver generates much lower cash flows due to its lower price. Consider hypothetical mid-sized silver and gold miners, which might produce 10m and 300k ounces annually. At last quarter’s average metals prices, these silver and gold mines would yield $167m and $383m of yearly sales. It’s far easier to pay the bills mining gold than silver, which is unfortunate. But until silver surges again, that’s the way things are.
While I understand this, as a long-time silver-stock investor it saddens me primary silver miners have apparently become a dying breed. When silver starts powering higher in one of its gigantic uplegs and way outperforms gold again, this industry’s silver-purity percentage will rise. But unless silver not only shoots far ahead but stays there while gold lags, it’s hard to see major-silver-mining purity significantly reversing.
Unfortunately SIL’s mid-March composition was such that there wasn’t a lot of Q4 cost data reported by its top component miners. A half-dozen of these top SIL companies trade in South Korea, the UK, Mexico, and Peru, where reporting only comes in half-year increments. There are also primary gold miners that don’t report silver costs, and a silver explorer with no production. So silver cost data remains scarce.
Nevertheless it’s always useful to look at what we have. Industry wide silver-mining costs are one of the most-critical fundamental data points for silver-stock investors. As long as the miners can produce silver for well under prevailing silver prices, they remain fundamentally sound. Cost knowledge helps traders weather this sector’s fear-driven plunges without succumbing to selling low like the rest of the herd.
There are two major ways to measure silver-mining costs, classic cash costs per ounce and the superior all-in sustaining costs. Both are useful metrics. Cash costs are the acid test of silver-miner survivability in lower-silver-price environments, revealing the worst-case silver levels necessary to keep the mines running. All-in sustaining costs show where silver needs to trade to maintain current mining tempos indefinitely.
Cash costs naturally encompass all cash expenses necessary to produce each ounce of silver, including all direct production costs, mine-level administration, smelting, refining, transport, regulatory, royalty, and tax expenses. In Q4’17, these top-17 SIL-component silver miners that reported cash costs averaged $4.66 per ounce. That plunged a whopping 11.6% YoY, making it look like silver miners are far more efficient.
But that’s misleading. This past quarter SIL’s 17th-largest component was Silvercorp Metals, which enjoys big lead and zinc byproducts at its China silver mines. These base metals are sold and used to offset the costs of silver mining. That forced SVM’s cash costs down to negative $5.92 per ounce, which dragged down SIL’s overall average. Hecla Mining also enjoyed negative cash costs due to byproduct credits.
Those super-low cash costs help offset SSR Mining’s super-high $16.36 per ounce. That’s not normal either, the result of that winding down of its lone silver mine. Excluding these extreme outliers, the remaining handful of silver miners had average cash costs of $5.69 per ounce. As long as silver prices stay above those levels, the silver miners can keep the lights on at their mines. Sub-$6 silver is inconceivable.
Way more important than cash costs are the far-superior all-in sustaining costs. They were introduced by the World Gold Council in June 2013 to give investors a much-better understanding of what it really costs to maintain a silver mine as an ongoing concern. AISC include all direct cash costs, but then add on everything else that is necessary to maintain and replenish operations at current silver-production levels.
These additional expenses include exploration for new silver to mine to replace depleting deposits, mine-development and construction expenses, remediation, and mine reclamation. They also include the corporate-level administration expenses necessary to oversee silver mines. All-in sustaining costs are the most-important silver-mining cost metric by far for investors, revealing silver miners’ true operating profitability.
In Q4’17 these top-17 SIL components reporting AISCs averaged just $10.16 per ounce. That was down 3.8% YoY, and far below last quarter’s average silver price of $16.69. Again SVM’s incredible byproduct production dragged down the average though. Ex-Silvercorp, these top SIL silver miners’ AISCs ran at an average of $11.33 in Q4. That’s still way below prevailing silver prices, generating nice operating profits.
All-in sustaining costs and production are inversely related. Lower silver production, which many of SIL’s top components suffered last quarter, leaves fewer ounces to spread the big fixed costs of mining across. Yet average AISCs still retreated, showing these top silver miners are getting more efficient at producing their metal. That will grant the silver miners more upside profits leverage to rising silver as this metal recovers.
At $10.16 AISCs, the major silver miners still earned big profits in the fourth quarter. Once again silver averaged $16.69, implying fat profit margins of $6.53 per ounce or 39%! Most industries would kill for such margins, yet silver-stock investors are always worried silver prices are too low for miners to thrive. That’s why it’s so important to study fundamentals, because technical price action fuels misleading sentiment.
Today’s silver price remains crazy-low relative to prevailing gold levels, portending huge mean-reversion upside. The long-term average Silver/Gold Ratio runs around 56, which means it takes 56 ounces of silver to equal the value of one ounce of gold. Silver is really underperforming gold so far in 2018, with the SGR averaging a stock-panic-like 79.5 YTD as of late March. So silver is overdue to catch up with gold.
At a 56 SGR and $1325 gold, silver is easily heading near $23.66. That’s 42% above its Q4 average. Assuming the major silver miners’ all-in sustaining costs hold, that implies profits per ounce soaring 107% higher! Plug in a higher gold price or the usual mean-reversion overshoot after an SGR extreme, and the silver-mining profits upside is far greater. Silver miners’ inherent profits leverage to rising silver is incredible.
While all-in sustaining costs are the single-most-important fundamental measure that investors need to keep an eye on, other metrics offer peripheral reads on the major silver miners’ fundamental health. The more important ones include cash flows generated from operations, actual accounting profits, revenues, and cash on hand. They generally corroborated AISCs in Q4’17, proving silver miners are weathering low prices fine.
The collective operating cash flows generated by these top-17 SIL silver miners grew 2.2% YoY to $590m. That’s not bad considering the 2.5% YoY drop in quarterly average silver prices and the 6.8% YoY lower silver production not including Fresnillo and Peñoles. These strong positive OCFs prove the major silver mines are generating much more cash than they cost to run even at these depressed silver prices.
But the elite silver miners’ GAAP accounting profits looked horrendous, weighing in at a huge $703m loss in Q4’17 compared to $157m earned a year earlier! The vast majority of that is due to a single colossal $547m loss from a company that newly climbed into SIL’s top 17 components over the past year. In the table above these new companies that weren’t among SIL’s leading stocks a year ago are highlighted in light blue.
Volcan Compañia Minera mines base metals, silver, and gold in the central highlands of Peru. In Q4 it reported a gargantuan net loss of $547m, driven entirely by a negative $570m “Exceptional adjustments”. This was described in the management discussion and analysis of quarterly results as necessary “to meet the corporate policies and accounting standards of Glencore”, which bought 55% of Volcan’s stock in November.
Pulling out that one-time Volcan loss to consolidate its financial results with its new parent’s, the top-17 SIL silver miners lost $156m in Q4’17. That’s still a major YoY drop, but is reasonable given the weak silver prices and their resulting ongoing non-cash writedowns of silver mines and deposits that look less economical. With lower silver prices and lower production, it wouldn’t have surprised me to see far-bigger losses.
The revenue front was interesting, with these top-17 SIL silver miners reporting overall sales of $3331m in Q4’17. That soared 26.6% YoY despite generally-lower production and prices. Peñoles was definitely a factor, but Fresnillo doesn’t break out Q4 sales so they weren’t included in Q4’17 or Q4’16. The primary driver was the UK’s Polymetal reporting $586m in sales in Q4’17 after breaking out none a year earlier.
These top SIL components’ collective cash on hand at the end of Q4 was largely flat at $3715m. That means the strong cash flows generated from operations were plowed back into exploring for more silver and gold to mine, expanding existing mines, and developing new ones. That’s still a big pile of cash for this small industry, giving silver miners flexibility to grow their production and ride out any unforeseen challenges.
Silver miners’ earnings power and thus stock-price upside potential will only grow as silver mean reverts higher. In mining, costs are largely fixed during the mine-planning stages. That’s when engineers decide which ore bodies to mine, how to dig to them, and how to process that ore. Quarter after quarter, the same numbers of employees, haul trucks, excavators, and mills are generally used regardless of silver prices.
So as silver powers higher in coming quarters, silver-mining profits will really leverage its advance. And that will fundamentally support far-higher silver-stock prices. The investors who will make out like bandits on this are the early contrarians willing to buy in low, before everyone else realizes what is coming. By the time silver surges higher with gold so silver stocks regain favor again, the big gains will have already been won.
While investors and speculators alike can certainly play the silver miners’ long-stalled mean-reversion bull with this leading SIL ETF, individual silver stocks with superior fundamentals will enjoy the best gains by far. Their upside will trounce the ETFs, which are burdened by companies that don’t generate enough of their sales from silver. A handpicked portfolio of purer elite silver miners will yield much-greater wealth creation.
At Zeal we’ve literally spent tens of thousands of hours researching individual silver stocks and markets, so we can better decide what to trade and when. As of the end of Q4, this has resulted in 983 stock trades recommended in real-time to our newsletter subscribers since 2001. Fighting the crowd to buy low and sell high is very profitable, as all these trades averaged stellar annualized realized gains of +20.2%!
The key to this success is staying informed and being contrarian. That means buying low before others figure it out, before undervalued silver stocks soar much higher. An easy way to keep abreast is through our acclaimed weekly and monthly newsletters. They draw on my vast experience, knowledge, wisdom, and ongoing research to explain what’s going on in the markets, why, and how to trade them with specific stocks. For only $12 per issue, you can learn to think, trade, and thrive like contrarians. Subscribe today, and get deployed in the great gold and silver stocks in our full trading books!
The bottom line is the major silver miners fared fine in Q4 despite some real challenges. A combination of silver continuing to seriously lag gold, along with anomalous company-specific problems, weighed on miners’ collective results. Yet they continued to produce silver at all-in sustaining costs way below Q4’s low prevailing silver prices. And their ongoing diversification into gold leaves them financially stronger.
With silver-stock sentiment remaining excessively bearish, this sector is primed to soar as silver itself resumes mean reverting higher to catch up with gold’s young bull market. The silver miners’ profits leverage to rising silver prices remains outstanding. After fleeing silver stocks so relentlessly over the past 19 months, investors will have to do big buying to reestablish silver-mining positions. That will fuel major upside.
Adam Hamilton, CPA
March 30, 2018
Copyright 2000 – 2018 Zeal LLC (www.ZealLLC.com)
The junior gold miners’ stocks have spent much of the past year grinding sideways near lows, sapping confidence and breeding widespread bearishness. The entire precious-metals sector has been left for dead, eclipsed by the dazzling taxphoria stock-market rally. But traders need to keep their eyes on the fundamental ball so herd sentiment doesn’t mislead them. The juniors’ recent Q4 results proved quite strong.
Four times a year publicly-traded companies release treasure troves of valuable information in the form of quarterly reports. Required by securities regulators, these quarterly results are exceedingly important for investors and speculators. They dispel all the sentimental distortions surrounding prevailing stock-price levels, revealing the underlying hard fundamental realities. That serves to re-anchor perceptions.
Normally quarterlies are due 45 calendar days after quarter-ends, in the form of 10-Qs required by the SEC for American companies. But after the final quarter of fiscal years, which are calendar years for most gold miners, that deadline extends out up to 90 days depending on company size. The 10-K annual reports required once a year are bigger, more complex, and need fully-audited numbers unlike 10-Qs.
So it takes companies more time to prepare full-year financials and then get them audited by CPAs right in the heart of their busy season. The additional delay in releasing Q4 results is certainly frustrating, as that data is getting stale approaching the end of Q1. Compounding the irritation, some gold miners don’t actually break out Q4 separately. Instead they only report full-year results, lumping in and obscuring Q4.
I always wonder what gold miners that don’t report full Q4 results are trying to hide. Some Q4 numbers can be inferred by comparing full-year results to the prior three quarterlies, but others aren’t knowable if not specifically disclosed. While most gold miners report their Q4 and/or full-year results by 7 to 9 weeks after year-ends, some drag their feet and push that 13-week limit. That’s very disrespectful to investors.
All this unfortunately makes Q4 results the hardest to analyze out of all quarterlies. But delving into them is still well worth the challenge. There’s no better fundamental data available to gold-stock investors and speculators than quarterly results, so they can’t be ignored. They offer a very valuable true snapshot of what’s really going on, shattering all the misconceptions bred by the ever-shifting winds of sentiment.
The definitive list of elite junior gold stocks to analyze comes from the world’s most-popular junior-gold-stock investment vehicle. This week the GDXJ VanEck Vectors Junior Gold Miners ETF reported $4.5b in net assets. Among all gold-stock ETFs, that was second only to GDX’s $7.9b. That is GDXJ’s big-brother ETF that includes larger major gold miners. GDXJ’s popularity testifies to the great allure of juniors.
Unfortunately this fame created major problems for GDXJ over the past couple years, severely hobbling its usefulness to investors. This ETF is quite literally the victim of its own success. GDXJ grew so large in the first half of 2016 as gold stocks soared in a massive upleg that it risked running afoul of Canadian securities laws. And most of the world’s smaller gold miners and explorers trade on Canadian stock exchanges.
Since Canada is the center of the junior-gold universe, any ETF seeking to own this sector will have to be heavily invested there. But once any investor including an ETF buys up a 20%+ stake in any Canadian stock, it is legally deemed to be a takeover offer that must be extended to all shareholders! As capital flooded into GDXJ in 2016 to gain junior-gold exposure, its ownership in smaller components soared near 20%.
Obviously hundreds of thousands of investors buying shares in an ETF have no intention of taking over gold-mining companies, no matter how big their collective stakes. That’s a totally-different scenario than a single corporate investor buying 20%+. GDXJ’s managers should’ve lobbied Canadian regulators and lawmakers to exempt ETFs from that 20% takeover rule. But instead they chose an inferior, easier solution.
Since GDXJ’s issuer controls the junior-gold-stock index underlying its ETF, it simply chose to unilaterally redefine what junior gold miners are. It rejiggered its index to fill GDXJ’s ranks with larger intermediate gold miners, while greatly demoting true smaller junior gold miners in terms of their ETF weightings. This controversial move defying many decades of convention was done stealthily behind the scenes to avoid outrage.
There’s no formal definition of a junior gold miner, which gives cover to GDXJ’s managers pushing the limits. Major gold miners are generally those that produce over 1m ounces of gold annually. For decades juniors were considered to be sub-200k-ounce producers. So 300k ounces per year is a very-generous threshold. Anything between 300k to 1m ounces annually is in the mid-tier realm, where GDXJ now traffics.
That high 300k-ounce-per-year junior cutoff translates into 75k ounces per quarter. Following the end of the gold miners’ Q4’17 earnings season in late March, I dug into the top 34 GDXJ components. That’s just an arbitrary number that fits neatly into the tables below. Although GDXJ included a staggering 73 component stocks in late March, the top 34 accounted for a commanding 80.5% of its total weighting.
Out of these top-34 GDXJ companies, only 4 primary gold miners met that sub-75k-ounces-per-quarter qualification to be a junior gold miner! Their quarterly production is highlighted in blue below, and they collectively accounted for just 8.1% of GDXJ’s total weighting. But even that is really overstated, as half of these are long-time traditional major silver miners that have started diversifying into gold in recent years.
GDXJ is inarguably now a pure mid-tier gold-miner ETF. That would be great if GDXJ was advertised as such. But it’s very misleading if investors still believe this dominant “Junior Gold Miners ETF” still gives exposure to junior gold miners. I suspect the vast majority of GDXJ shareholders have no idea just how radically its holdings have changed since early 2016, and how much it has strayed from its original mission.
I’ve been doing these deep quarterly dives into GDXJ’s top components for years now. In Q4’17, fully 31 of the top-34 GDXJ components were also GDX components! These ETFs are separate, a “Gold Miners ETF” and a “Junior Gold Miners ETF”. So there’s no reason for them to own many of the same companies. In the tables below I highlighted the rare GDXJ components not also in GDX in yellow in the weightings column.
These 31 GDX components accounted for 76.7% of GDXJ’s total weighting, not just its top 34. They also represented 32.2% of GDX’s total weighting. So over 3/4ths of the junior gold miners’ ETF is made up of nearly a third of the major gold miners’ ETF! These GDXJ components in GDX start at the 12th-highest weighting in that latter larger ETF and extend down to 44th. Do investors know GDXJ is mostly GDX gold stocks?
Fully 11 of GDXJ’s top 17 components weren’t even in this ETF a year ago in Q4’16. They alone now account for 36.6% of its total weighting. 16 of the top 34 are new, or 43.8% of the total. In the tables below, I highlighted the symbols of companies that weren’t in GDXJ a year ago in light blue. GDXJ has changed radically, and analyzing its top components’ Q4’17 results largely devoid of real juniors is frustrating.
Nevertheless, GDXJ remains the leading “junior-gold” benchmark. So every quarter I wade through tons of data from its top components’ 10-Qs or 10-Ks, and dump it into a big spreadsheet for analysis. The highlights made it into these tables. Blank fields mean a company did not report that data for Q4’17 as of this Wednesday. Companies have wide variations in reporting styles, data presented, and report timing.
In these tables the first couple columns show each GDXJ component’s symbol and weighting within this ETF as of this week. While many of these gold stocks trade in the States, not all of them do. So if you can’t find one of these symbols, it’s a listing from a company’s primary foreign stock exchange. That’s followed by each company’s Q4’17 gold production in ounces, which is mostly reported in pure-gold terms.
Many gold miners also produce byproduct metals like silver and copper. These are valuable, as they are sold to offset some of the considerable costs of gold mining. Some companies report their quarterly gold production including silver, a construct called gold-equivalent ounces. I only included GEOs if no pure-gold numbers were reported. That’s followed by production’s absolute year-over-year change from Q4’16.
Next comes the most-important fundamental data for gold miners, cash costs and all-in sustaining costs per ounce mined. The latter determines their profitability and hence ultimately stock prices. Those are also followed by YoY changes. Finally the YoY changes in cash flows generated from operations, GAAP profits, revenues, and cash on balance sheets are listed. There are a couple exceptions to these YoY changes.
Percentage changes aren’t relevant or meaningful if data shifted from positive to negative or vice versa, or if derived from two negative numbers. So in those cases I included raw underlying numbers instead of weird or misleading percentage changes. This whole dataset offers a fantastic high-level read on how the mid-tier gold miners are faring today as an industry. Contrary to their low stock prices, they’re doing quite well.
After spending days digesting these GDXJ gold miners’ latest quarterly reports, it’s fully apparent their vexing low consolidation over the past year isn’t fundamentally righteous at all! Traders have abandoned this sector because the allure of the levitating general stock markets has eclipsed gold. That has left gold stocks exceedingly undervalued, truly the best fundamental bargains out there in all the stock markets!
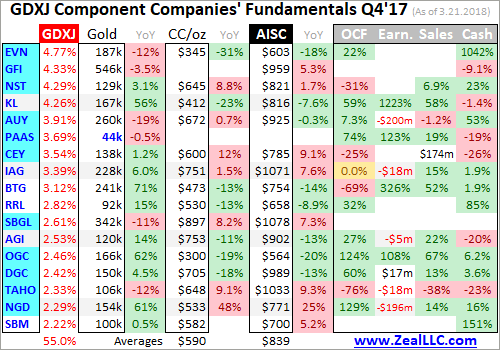
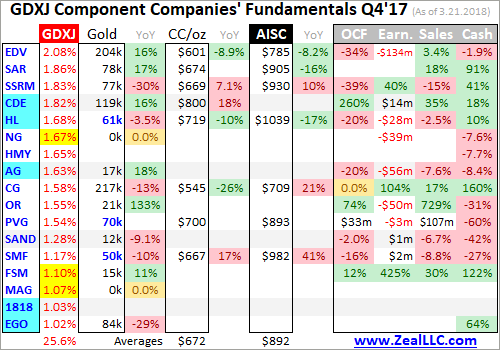
Once again the light-blue-highlighted symbols are new top-34 GDXJ components that weren’t included a year ago in Q4’16. And the meager yellow-highlighted weightings are the only stocks that were not also GDX components in late March! GDXJ is increasingly a GDX clone that offers little if any real exposure to true juniors’ epic upside potential during gold bulls. Sadly this ETF has become a shadow of its former self.
VanEck owns and manages GDX, GDXJ, and the MVIS indexing company that decides exactly which gold stocks are included in each. With one company in total control, GDX and GDXJ should have zero overlap in underlying companies! GDX or GDXJ inclusion should be mutually-exclusive based on the sizes of individual miners. That would make both GDX and GDXJ much more targeted and useful for investors.
VanEck could greatly increase the utility and thus ultimate success of both GDX and GDXJ by starting with one combined list of the world’s better gold miners. Then it could take the top 20 or 25 in terms of annual gold production and assign them to GDX. That would run down near 150k or 105k ounces of quarterly production based on Q4’17 data. Then the next-largest 30 or 40 gold miners could be assigned to GDXJ.
The worst part of GDXJ now including mid-tier gold miners instead of real juniors is the latter are being relentlessly starved of capital. As investment capital flows into ETFs, they have to buy shares in their underlying component companies. That naturally bids their stock prices higher. But in GDXJ’s case, the capital investors intend to use to buy juniors is being stealthily diverted into much-larger mid-tier gold miners.
While there are still some juniors way down the list in GDXJ’s rankings, they collectively make up about 20% of this ETF’s weighting at best. Junior gold miners rely heavily on issuing shares to finance their exploration projects and mine builds. But when their stock prices are down in the dumps because no one is buying them, that is heavily dilutive. GDXJ is effectively strangling the very industry its investors want to own!
Since gold miners are in the business of wresting gold from the bowels of the Earth, production is the best place to start. These top-34 GDXJ gold miners collectively produced 4193k ounces in Q4’17. That rocketed 87% higher YoY, but that comparison is meaningless given the radical changes in this ETF’s composition since Q4’16. On the bright side, GDXJ’s miners do still remain much smaller than GDX’s.
GDX’s top 34 components, fully 19 of which are also top-34 GDXJ components, collectively produced 10,337k ounces of gold in Q4. So GDXJ components’ average quarterly gold production of 140k ounces excluding explorers was 57% lower than GDX components’ 323k average. In spite of GDXJ’s very-misleading “Junior” name, it definitely has smaller gold miners even if they’re way above that 75k junior threshold.
Despite GDXJ’s top 34 components looking way different from a year ago, these current gold miners are generally faring well on the crucial production front. 17 of these mid-tier gold miners enjoyed big average production growth of 30% YoY! Overall average growth excluding explorers was 12.2% YoY, which is far better than world mine production which slumped 1.7% lower YoY in Q4’17 according to the World Gold Council.
These elite GDXJ mid-tier gold miners are really thriving, with production growth way outpacing their industry. That will richly reward investors as sentiment normalizes. Smaller mid-tier gold miners able to grow production are the sweet spot for stock-price upside potential. With market capitalizations much lower than major gold miners, investment capital inflows are relatively larger which bids up stock prices faster.
With today’s set of top-34 GDXJ gold miners achieving such impressive production growth, their costs per ounce should’ve declined proportionally. Higher production yields more gold to spread mining’s big fixed costs across. And lower per-ounce costs naturally lead to higher profits. So production growth is highly sought after by gold-stock investors, with companies able to achieve it commanding premium prices.
There are two major ways to measure gold-mining costs, classic cash costs per ounce and the superior all-in sustaining costs per ounce. Both are useful metrics. Cash costs are the acid test of gold-miner survivability in lower-gold-price environments, revealing the worst-case gold levels necessary to keep the mines running. All-in sustaining costs show where gold needs to trade to maintain current mining tempos indefinitely.
Cash costs naturally encompass all cash expenses necessary to produce each ounce of gold, including all direct production costs, mine-level administration, smelting, refining, transport, regulatory, royalty, and tax expenses. In Q4’17, these top-34 GDXJ-component gold miners that reported cash costs averaged just $618 per ounce. That was actually up a slight 0.5% YoY, so the higher production failed to force costs lower.
This was still quite impressive, as the mid-tier gold miners’ cash costs were only a little higher than the GDX majors’ $600. That’s despite the mid-tiers each operating fewer gold mines and thus having fewer opportunities to realize cost efficiencies. Traders must recognize these mid-sized gold miners are in zero fundamental peril as long as prevailing gold prices remain well above cash costs. And $618 gold ain’t happening!
Way more important than cash costs are the far-superior all-in sustaining costs. They were introduced by the World Gold Council in June 2013 to give investors a much-better understanding of what it really costs to maintain gold mines as ongoing concerns. AISC include all direct cash costs, but then add on everything else that is necessary to maintain and replenish operations at current gold-production levels.
These additional expenses include exploration for new gold to mine to replace depleting deposits, mine-development and construction expenses, remediation, and mine reclamation. They also include the corporate-level administration expenses necessary to oversee gold mines. All-in sustaining costs are the most-important gold-mining cost metric by far for investors, revealing gold miners’ true operating profitability.
In Q4’17, these top-34 GDXJ components reporting AISCs averaged just $855 per ounce. That only rose 0.1% YoY, effectively dead flat, despite the new mix of GDXJ components. That also compares very favorably with the GDX majors, which saw nearly-identical average AISCs at $858 in Q4. The mid-tier gold miners’ low costs prove they are faring far better fundamentally today than their low stock prices imply.
All-in sustaining costs are effectively this industry’s breakeven level. As long as gold stays above $855 per ounce, it remains profitable to mine. At Q4’s average gold price of $1276, these top GDXJ gold miners were earning big average profits of $421 per ounce last quarter! That equates to fat profit margins of 33%, levels most industries would kill for. The mid-tier gold miners aren’t getting credit for that today.
Unfortunately given its largely-junior-less composition, GDXJ remains the leading benchmark for junior gold miners. In Q4’17, this ETF averaged $32.62 per share. That was down a considerable 10.2% from Q4’16’s average of $36.34. Investors have largely abandoned gold miners because they are captivated by the extreme taxphoria stock-market rally since the election. Yet gold-mining profits certainly didn’t justify this.
A year ago in Q4’16, the top-34 GDXJ components at that time also reported average all-in sustaining costs of $855 per ounce. With gold averaging $1218 then which was 4.6% lower, that implies the mid-tier gold miners were running operating profits of $363 per ounce. Thus Q4’17’s $421 surged 16.0% YoY, a heck of a jump! Yet the mid-tier gold miners’ stock prices irrationally slumped substantially lower.
Gold miners offer such compelling investment opportunities because of their inherent profits leverage to gold. Gold-mining costs are largely fixed during mine-planning stages, when engineers and geologists decide which ore to mine, how to dig to it, and how to process it. The actual mining generally requires the same levels of infrastructure, equipment, and employees quarter after quarter regardless of gold prices.
With gold-mining costs essentially fixed, higher or lower gold prices flow directly through to the bottom line in amplified fashion. This really happened in GDXJ over the past year despite its radical changes in composition. A 4.8% gold rally in quarterly-average terms catapulted operating profits 16.0% higher, or 3.3x. That’s right in line with the typical leverage of gold-mining profits to gold prices of several times or so.
But this strong profitability sure isn’t being reflected in gold-stock prices. GDXJ shouldn’t have been lower in Q4’17 with mining profits much higher. The vast fundamental disconnect in gold-stock prices today is absurd, and can’t last forever. Sooner or later investors will rush into the left-for-dead gold stocks to bid their prices far higher. This bearish-sentiment-driven anomaly has grown more extreme in 2018.
Since gold-mining costs don’t change much quarter-to-quarter regardless of prevailing gold prices, it’s reasonable to assume the top GDXJ miners’ AISCs will largely hold steady in the current Q1’18. And it’s been a strong quarter for gold so far, with it averaging over $1328 quarter-to-date. If the mid-tier gold miners’ AISCs hold near $855, that implies their operating profits are now running way up near $473 per ounce.
That would make for a massive 12.4% QoQ jump in earnings for the mid-tier gold miners in this current quarter! Yet so far in Q1 GDXJ is languishing at an average of just $32.88, flat lined from Q4 where gold prices and mining profits were considerably lower. The mid-tier gold miners’ stocks can’t trade as if their profits don’t matter forever, so an enormous mean-reversion rally higher is inevitable sometime soon.
And that assumes gold prices merely hold steady, which is unlikely. After years of relentlessly-levitating stock markets thanks to extreme central-bank easing, radical gold underinvestment reigns today. As the wildly-overvalued stock markets inescapably sell off on unprecedented central-bank tightening this year, gold investment will really return to favor. That portends super-bullish-for-miners higher gold prices ahead.
The impact of higher gold prices on mid-tier-gold-miner profitability is easy to model. Assuming flat all-in sustaining costs at Q4’17’s $855 per ounce, 10%, 20%, and 30% gold rallies from this week’s levels would lead to collective gold-mining profits surging 45%, 77%, and 108%! And another 30% gold upleg isn’t a stretch at all. In the first half of 2016 alone after the previous stock-market correction, gold soared 29.9%.
GDXJ skyrocketed 202.5% higher in 7.0 months in largely that same span! Gold-mining profits and thus gold-stock prices surge dramatically when gold is powering higher. Years of neglect from investors have forced the gold miners to get lean and efficient, which will really amplify their fundamental upside during the next major gold upleg. The investors and speculators who buy in early and cheap could earn fortunes.
Given the radical changes in GDXJ’s composition over the past year, normal year-over-year comparisons in key financial results simply aren’t meaningful. The massive rejiggering of the index underlying GDXJ didn’t happen until Q2’17, so it will be a couple quarters yet until results finally grow comparable again. But in the meantime, here are the apples-to-oranges reads on the GDXJ components’ key financial results.
The cash flows generated from operations by these top-34 GDX components rocketed 104.5% higher YoY to $1743m. That helped boost their collective cash balances by 53.9% YoY to $6577m. Sales were up 102.6% YoY to $4282m, roughly in line with the 87.4% gold-production growth. But again GDXJ was way different a year ago, so this impressive growth merely reflects bigger mid-tier gold miners replacing true juniors.
As long as OCFs remain massively positive, the gold mines are generating much more cash than they cost to run. That gives the gold miners the capital necessary to expand existing operations and buy new deposits and mines. Given how ridiculously low gold-stock prices are today, you’d think the gold miners are hemorrhaging cash like crazy. But the opposite is true, showing how silly this bearish herd sentiment is.
Unfortunately the GAAP earnings picture looked vastly worse. These top-34 GDXJ gold miners reporting Q4 earnings collectively lost $317m, compared to a minor $2m profit in Q4’16. While that certainly looks like a disaster, it’s heavily skewed. Excluding 3 big mid-tier gold miners that reported huge losses in Q4, the other 11 of these top GDXJ gold miners reporting earnings actually earned an impressive $212m in profits.
Yamana Gold, New Gold, and Endeavour Mining suffered huge $200m, $196m, and $134m losses in Q4’17. In each case these resulted from large impairment charges. As mines are dug deeper and gold prices change, the economics of producing this metal change too. That leaves some of the mid-tier gold miners’ individual mines worth less going forward than the amount of capital invested to develop them.
So they are written off, resulting in big charges flushed through income statements that mask operating profits. But these writedowns are something of an accounting fiction, non-cash expenses not reflective of current operations. They are mostly isolated one-time events as well, not representing earnings trends. As gold continues to march higher in its young bull, impairment charges will vanish as mining economics improve.
So overall the mid-tier gold miners’ fundamentals looked quite strong in Q4’17, a stark contrast to the miserable sentiment plaguing this sector. Gold stocks’ vexing consolidation over the past year or so isn’t the result of operational struggles, but purely bearish psychology. That will soon shift as stock markets inevitably roll over and gold surges, making the beaten-down gold stocks a coiled spring overdue to soar dramatically.
Given GDXJ now diverting most of its capital inflows into larger mid-tier gold miners that definitely aren’t juniors, you won’t find sufficient junior-gold exposure in this now-mislabeled ETF. Instead traders should prudently deploy capital in the better individual mid-tier and junior gold miners’ stocks with superior fundamentals. Their upside is vast, and would trounce GDXJ’s even if it was still working as advertised.
At Zeal we’ve literally spent tens of thousands of hours researching individual gold stocks and markets, so we can better decide what to trade and when. As of the end of Q4, this has resulted in 983 stock trades recommended in real-time to our newsletter subscribers since 2001. Fighting the crowd to buy low and sell high is very profitable, as all these trades averaged stellar annualized realized gains of +20.2%!
The key to this success is staying informed and being contrarian. That means buying low before others figure it out, before undervalued gold stocks soar much higher. An easy way to keep abreast is through our acclaimed weekly and monthly newsletters. They draw on my vast experience, knowledge, wisdom, and ongoing research to explain what’s going on in the markets, why, and how to trade them with specific stocks. For only $12 per issue, you can learn to think, trade, and thrive like contrarians. Subscribe today, and get deployed in the great gold and silver stocks in our full trading books!
The bottom line is the mid-tier gold miners now dominating GDXJ enjoyed strong fundamentals in their recently-reported Q4 results. While GDXJ’s radical composition changes since last year muddy annual comparisons, today’s components mined lots more gold at dead-flat costs. These miners continued to earn fat operating profits while generating strong cash flows. Sooner or later stock prices must reflect fundamentals.
As gold itself continues mean reverting higher, these mid-tier gold miners will see their profits soar due to their big inherent leverage to gold. GDXJ now offers excellent exposure to mid-tier gold miners, which will see gains well outpacing the majors. All it will take to ignite gold stocks’ overdue mean-reversion rally is gold investment demand returning. The resulting higher gold prices will attract investors back to gold miners.
Adam Hamilton, CPA
March 23, 2018
Copyright 2000 – 2018 Zeal LLC (www.ZealLLC.com)
The gold miners’ stocks remain deeply out of favor, trading at prices seen when gold was half or even a quarter of current levels. So many traders assume this small contrarian sector must be really struggling fundamentally. But nothing could be farther from the truth! The major gold miners’ recently-released Q4’17 results prove they are thriving. Their languishing stock prices are the result of irrational herd sentiment.
Four times a year publicly-traded companies release treasure troves of valuable information in the form of quarterly reports. Required by securities regulators, these quarterly results are exceedingly important for investors and speculators. They dispel all the sentimental distortions surrounding prevailing stock-price levels, revealing the underlying hard fundamental realities. They serve to re-anchor perceptions.
Normally quarterlies are due 45 calendar days after quarter-ends, in the form of 10-Qs required by the SEC for American companies. But after the final quarter of fiscal years, which are calendar years for most gold miners, that deadline extends out up to 90 days depending on company size. The 10-K annual reports required once a year are bigger, more complex, and need fully-audited numbers unlike 10-Qs.
So it takes companies more time to prepare full-year financials and then get them audited by CPAs right in the heart of their busy season. The additional delay in releasing Q4 results is certainly frustrating, as that data is getting stale approaching the end of Q1. Compounding the irritation, some gold miners don’t actually break out Q4 separately. Instead they only report full-year results, lumping in and obscuring Q4.
I always wonder what gold miners that don’t report full Q4 results are trying to hide. Some Q4 numbers can be inferred by comparing full-year results to the prior three quarterlies, but others aren’t knowable if not specifically disclosed. While most gold miners report their Q4 and/or full-year results by 7 to 9 weeks after year-ends, some drag their feet and push that 13-week limit. That’s very disrespectful to investors.
All this unfortunately makes Q4 results the hardest to analyze out of all quarterlies. But delving into them is still well worth the challenge. There’s no better fundamental data available to gold-stock investors and speculators than quarterly results, so they can’t be ignored. They offer a very valuable true snapshot of what’s really going on, shattering all the misconceptions bred by the ever-shifting winds of sentiment.
The definitive list of major gold-mining stocks to analyze comes from the world’s most-popular gold-stock investment vehicle, the GDX VanEck Vectors Gold Miners ETF. Its composition and performance are similar to the benchmark HUI gold-stock index. GDX utterly dominates this sector, with no meaningful competition. This week GDX’s net assets are 24.4x larger than the next-biggest 1x-long major-gold-miners ETF!
Being included in GDX is the gold standard for gold miners, requiring deep analysis and vetting by elite analysts. And due to ETF investing eclipsing individual-stock investing, major-ETF inclusion is one of the most-important considerations for picking great gold stocks. As the vast pools of fund capital flow into leading ETFs, these ETFs in turn buy shares in their underlying companies bidding their stock prices higher.
This week GDX included a whopping 51 component “Gold Miners”. That term is used somewhat loosely, as this ETF also contains major silver miners, a silver streamer, and gold royalty companies. Still, all the world’s major gold miners are GDX components. Due to time constraints I limited my deep individual-company research to this ETF’s top 34 stocks, an arbitrary number that fits neatly into the tables below.
Collectively GDX’s 34 largest components now account for 90.5% of its total weighting, a commanding sample. GDX’s stocks include major foreign gold miners trading in Australia, Canada, and the UK. Some countries’ regulations require financial reporting in half-year increments instead of quarterly, which limits local gold miners’ Q4 data. But some foreign companies still choose to publish limited quarterly results.
The importance of these top-GDX-component gold miners can’t be overstated. In Q4’17 they collectively produced over 10.3m ounces of gold, or 321.5 metric tons. The World Gold Council’s recently-released Q4 Gold Demand Trends report, the definitive source on worldwide supply-and-demand fundamentals, pegged total global mine production at 833.1t in Q4. GDX’s top 34 miners alone accounted for nearly 4/10ths!
Every quarter I wade through a ton of data from these elite gold miners’ 10-Qs or 10-Ks, and dump it into a big spreadsheet for analysis. The highlights made it into these tables. Blank fields mean a company did not report that data for Q4’17 as of this Wednesday. Naturally companies always try to present their quarterly results in the best-possible light, which leads to wide variations in reporting styles and data offered.
In these tables the first couple columns show each GDX component’s symbol and weighting within this ETF as of this week. While most of these gold stocks trade in the States, not all of them do. So if you can’t find one of these symbols, it’s a listing from a company’s primary foreign stock exchange. That’s followed by each company’s Q4’17 gold production in ounces, which is mostly reported in pure-gold terms.
Many gold miners also produce byproduct metals like silver and copper. These are valuable, as they are sold to offset some of the considerable costs of gold mining. Some companies report their quarterly gold production including silver, a construct called gold-equivalent ounces. I only included GEOs if no pure-gold numbers were reported. That’s followed by production’s absolute year-over-year change from Q4’16.
Next comes the most-important fundamental data for gold miners, cash costs and all-in sustaining costs per ounce mined. The latter determines their profitability and hence ultimately stock prices. Those are also followed by YoY changes. Finally the YoY changes in cash flows generated from operations, GAAP profits, revenues, and cash on balance sheets are listed. There are a couple exceptions to these YoY changes.
Percentage changes aren’t relevant or meaningful if data shifted from positive to negative or vice versa, or if derived from two negative numbers. So in those cases I included raw underlying numbers instead of weird or misleading percentage changes. This whole dataset offers a fantastic high-level read on how the major gold miners are faring today as an industry. And contrary to their low stock prices, they are thriving!
After spending days digesting these elite gold miners’ latest quarterly reports, it’s fully apparent their vexing consolidation over the past year or so isn’t fundamentally-righteous at all! Traders have mostly abandoned this sector because the allure of the levitating general stock markets has eclipsed gold. That has left gold stocks exceedingly undervalued, truly the best fundamental bargains out there in all the stock markets!
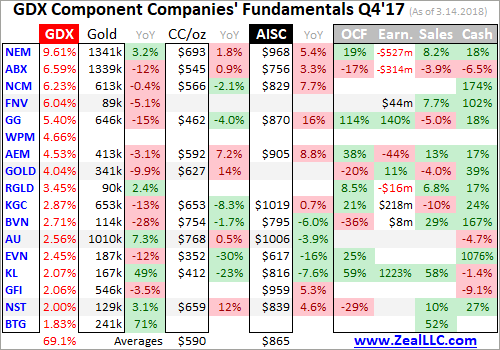
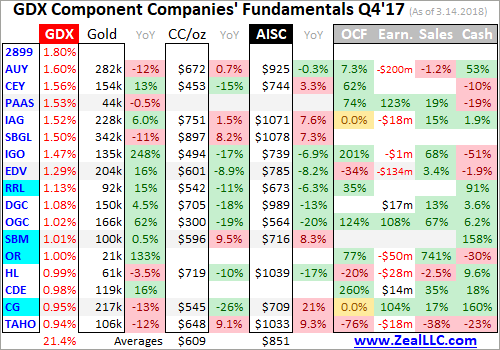
Since gold miners are in the business of wresting gold from the bowels of the Earth, production is the best place to start. The 10,337k ounces of gold collectively produced last quarter by these elite major gold miners actually fell a sizable 1.7% YoY! Interestingly that’s right in line with industry trends per the World Gold Council, as overall world gold mine production also retreated that same 1.7% YoY in Q4’17.
These biggest and best gold miners on the planet certainly had every incentive to grow their gold production. The quarterly average gold price surged 4.8% YoY in Q4’17, really boosting profitability. Of course the more gold any miner can produce, the more opportunities it has to expand thanks to higher cash flows. Investors often punish flagging production too, so the major gold miners really hate reporting it.
Most investors won’t bother studying long and detailed 10-Qs, 10-Ks, or the accompanying management discussions and analyses. So gold miners often issue short press releases summarizing some of their quarterly results. These sometimes intentionally mask production declines by excluding year-ago production, looking at quarter-on-quarter performance instead of year-over-year, or only comparing results to guidance.
As a professional speculator, investor, and newsletter writer for nearly two decades now, I spend a huge amount of time analyzing quarterly results. And I remain a CPA after my previous late-1990s gig auditing mining companies for a Big Six firm. Yet even with this exceptional experience and knowledge, I’m still surprised how deeply I have to dig for some key results miners bury and hide in hundred-plus-page-long SEC filings.
So believe me, major gold miners don’t shout out shrinking gold production from the rooftops. Yet of the 32 of these top-34 GDX gold miners reporting Q4 production as of the middle of this week, fully half saw declines. That was even with four different gold miners climbing into GDX’s top 34 components over the past year, which are highlighted in blue above. The average production decline was a serious 9.5% YoY!
Gold deposits economically viable to mine are very rare in the natural world, and the low-hanging fruit has largely been harvested. It is growing ever more expensive to explore for gold, in far-less-hospitable places. Then even after new deposits are discovered, it takes up to a decade to jump through all the Draconian regulatory hoops necessary to secure permitting. And only then can mine construction finally start.
That takes additional years and hundreds of millions if not billions of dollars per gold mine. But because gold-mining stocks have been deeply out of favor most of the time since 2013, capital has been heavily constrained. When banks are bearish on gold prices, they aren’t willing to lend to gold miners except with onerous terms. And when investors aren’t buying gold stocks, issuing new shares low is heavily dilutive.
The large gold miners used to rely heavily on the smaller junior gold miners to explore and replenish the gold-production pipeline. But juniors have been devastated since 2013, starved of capital. Not only are investors completely uninterested with general stock markets levitating, but the rise of ETFs has funneled most investment inflows into a handful of larger-market-cap juniors while the rest see little meaningful buying.
So even the world’s biggest and best gold miners are struggling to grow production. While that isn’t great for those individual miners, it’s super-bullish for gold. The less gold mined, the more gold supply will fail to keep pace with demand. That will result in higher gold prices, making gold mining more profitable in the future. Some analysts even think peak gold has been reached, that mine production will decline indefinitely.
There are strong fundamental arguments in favor of peak-gold theories. But regardless of where overall global gold production heads in coming years, the major gold miners able to grow their own production will fare the best. They’ll attract in relatively-more investor capital, bidding their stocks to premium prices compared to peers who can’t grow production. Stock picking is more important than ever in this ETF world!
But despite slowing gold production, these top-34 GDX-component gold miners remained quite strong fundamentally in Q4! Their viability and profitability are measured by the differences between prevailing gold prices and what it costs to produce that gold. Despite traders’ erroneous perception gold stocks are doomed, rising gold prices and falling mining costs are making the major gold miners much more profitable.
There are two major ways to measure gold-mining costs, classic cash costs per ounce and the superior all-in sustaining costs per ounce. Both are useful metrics. Cash costs are the acid test of gold-miner survivability in lower-gold-price environments, revealing the worst-case gold levels necessary to keep the mines running. All-in sustaining costs show where gold needs to trade to maintain current mining tempos indefinitely.
Cash costs naturally encompass all cash expenses necessary to produce each ounce of gold, including all direct production costs, mine-level administration, smelting, refining, transport, regulatory, royalty, and tax expenses. In Q4’17, these top-34 GDX-component gold miners that reported cash costs averaged just $600 per ounce. That dropped a sizable 4.4% YoY, showing serious gold-miner discipline controlling costs.
Today the gold miners’ stocks are trading at crazy-low prices implying their survivability is in jeopardy. This week the flagship HUI gold-stock index was languishing near 174, despite $1325 gold. The first time the HUI hit 175 in August 2003, gold was only in the $350s! Gold stocks are radically undervalued today by every metric. And they collectively face zero threat of bankruptcies unless gold plummets under $600.
Way more important than cash costs are the far-superior all-in sustaining costs. They were introduced by the World Gold Council in June 2013 to give investors a much-better understanding of what it really costs to maintain gold mines as ongoing concerns. AISC include all direct cash costs, but then add on everything else that is necessary to maintain and replenish operations at current gold-production levels.
These additional expenses include exploration for new gold to mine to replace depleting deposits, mine-development and construction expenses, remediation, and mine reclamation. They also include the corporate-level administration expenses necessary to oversee gold mines. All-in sustaining costs are the most-important gold-mining cost metric by far for investors, revealing gold miners’ true operating profitability.
In Q4’17, these top-34 GDX-component gold miners reporting AISC averaged just $858 per ounce. That was down a significant 2.0% YoY, extending a welcome declining trend. In 2017’s four quarters, these major gold miners’ average AISCs ran $878, $867, $868, and $858. The elite gold miners are getting more efficient at producing their metal, which is definitely impressive considering their collective lower production.
Gold-mining costs are largely fixed during mine-planning stages, when engineers and geologists decide which ore to mine, how to dig to it, and how to process it. The actual mining generally requires the same levels of infrastructure, equipment, and employees quarter after quarter. So the more gold mined, the more ounces to spread those big fixed costs across. Thus production and AISCs are usually negatively correlated.
The major gold miners have to manage costs exceptionally well to drive AISCs lower while production is also slowing. This argues against the popular complaint that gold miners’ managements are doing poor jobs. Because gold-stock prices are so darned low, traders again assume the miners must be plagued with serious fundamental problems. But it’s relentlessly-bearish herd sentiment suppressing gold-stock prices.
These top-34 GDX gold miners are actually earning strong operating profits today. Q4’17’s average gold price ran near $1276, again up 4.8% YoY. That remains far above last quarter’s low average all-in sustaining costs among these major gold miners of $858 per ounce. Thus industry profit margins are way up at $418 per ounce. Most other industries would sell their souls to earn fat profit margins at this 33% level!
A year earlier in Q4’16, the top-34 GDX gold miners reported average AISCs of $875 in a quarter where gold averaged under $1218. That made for $343 per ounce in operating profits. So in Q4’17, the major gold miners’ earnings soared 22.1% YoY to $418 on that mere 4.8% gold rally! Gold miners make such compelling investment opportunities because of their inherent profits leverage to gold, multiplying its gains.
But this strong profitability sure isn’t being reflected in gold-stock prices. In Q4’17 the HUI averaged just 189.4, actually 1.5% lower than Q4’16’s 192.3! The vast fundamental disconnect in gold-stock prices today is absurd, and can’t last forever. Sooner or later investors will rush into the left-for-dead gold stocks to bid their prices far higher. This bearish-sentiment-driven anomaly has grown more extreme in 2018.
Since gold-mining costs don’t change much quarter-to-quarter regardless of prevailing gold prices, it’s reasonable to assume the top GDX miners’ AISCs will largely hold steady in the current Q1’18. And it’s been a strong quarter for gold so far, with it averaging over $1329 quarter-to-date. If the major gold miners’ AISCs hold near $858, that implies their operating profits are now running way up near $471 per ounce.
That would make for a massive 12.7% QoQ jump in earnings for the major gold miners in this current quarter! Yet so far in Q1 the HUI is averaging just 187.1, worse than both Q4’17 and Q4’16 when gold prices were considerably lower and mining costs were higher. The gold miners’ stocks can’t trade as if their profits don’t matter forever, so an enormous mean-reversion rally higher is inevitable sometime soon.
And that assumes gold prices merely hold steady, which is unlikely. After years of relentlessly-levitating stock markets thanks to extreme central-bank easing, radical gold underinvestment reigns today. As the wildly-overvalued stock markets inescapably sell off on unprecedented central-bank tightening this year, gold investment will really return to favor. That portends super-bullish-for-miners higher gold prices ahead.
The impact of higher gold prices on major-gold-miner profitability is easy to model. Assuming flat all-in sustaining costs at Q4’17’s $858 per ounce, 10%, 20%, and 30% gold rallies from this week’s levels would lead to collective gold-mining profits surging 43%, 75%, and 107%! And another 30% gold upleg isn’t a stretch at all. In the first half of 2016 alone after the previous stock-market correction, gold soared 29.9%.
GDX skyrocketed 151.2% higher in 6.4 months in essentially that same span! Gold-mining profits and thus gold-stock prices surge dramatically when gold is powering higher. Years of neglect from investors have forced the gold miners to get lean and efficient, which will amplify their fundamental upside during the next major gold upleg. The investors and speculators who buy in early and cheap could earn fortunes.
While all-in sustaining costs are the single-most-important fundamental measure that investors need to keep an eye on, other metrics offer peripheral reads on the major gold miners’ fundamental health. The more important ones include cash flows generated from operations, actual accounting profits, revenues, and cash on hand. They generally corroborated AISCs in Q4’17, proving the gold miners are faring really well.
These top-34 GDX-component gold miners collectively reported strong operating cash flows of $4529m in Q4, surging a huge 21.6% YoY! Running gold mines is very profitable for the major miners, they have this down to a science. Of the 26 of these major gold miners reporting Q4 OCFs, every single one was positive. Most also proved relatively large compared to individual company sizes, looking really strong.
As long as OCFs remain massively positive, the gold mines are generating much more cash than they cost to run. That gives the gold miners the capital necessary to expand existing operations and buy new deposits and mines. Given how ridiculously low gold-stock prices are today, you’d think the gold miners are hemorrhaging cash like crazy. But the opposite is true, showing how silly this bearish herd sentiment is.
The top GDX gold miners’ actual GAAP accounting profits didn’t look as good, coming in at a $266m loss in Q4’17. While a big improvement over Q4’16’s $588m loss, that still seems incongruent with those great all-in sustaining costs and operating cash flows. Of the 23 of these top-34 GDX components reporting earnings in Q4, 10 had losses. Half of those were big, over $50m. I looked into the reasons behind each one.
These handful of big gold-mining losses that dragged down overall top-GDX-component earnings were mostly the result of asset-impairment charges. Some of the world’s largest gold miners led by Newmont and Barrick with $527m and $314m Q4 losses continued to write down the carrying value of some gold mines. As mines are dug deeper and gold prices change, the economics of producing the metal change too.
That leaves some of the major gold miners’ individual mines worth less going forward than the amount of capital invested to develop them. So they are written off, resulting in big charges flushed through income statements that mask operating profits. But these writedowns are something of an accounting fiction, non-cash expenses not reflective of current operations. They are mostly isolated one-time events as well.
In addition to writedowns totally irrelevant to current and future cash flows, there were also big losses recognized in Q4’17 due to the new US corporate-tax law. With tax rates slashed, deferred tax assets that were created by overpaying taxes in past years were suddenly worth a lot less. These too were non-cash charges, another accounting fiction. Finally some companies realized losses on selling gold mines.
The major gold miners all run portfolios of multiple individual gold mines, each with different AISC levels. They’ve been gradually pruning out their higher-cost operations by selling those mines to smaller gold miners, usually at losses. While this hits income statements in mine-sale quarters, it is one reason the major gold miners have been able to drive down their costs. That will lead to greater future profitability.
In price-to-earnings-ratio terms, the major gold stocks are definitely getting cheaper. Of the 23 of these top-GDX-component stocks with profits to create P/E ratios, 7 had P/Es in the single or low-double digits! There are some really-cheap gold miners out there today, even adjusted for any dilution from past share issuances. Of course P/E ratios automatically do that since stock prices are divided by earnings per share.
On the sales front these top-34 GDX gold miners’ revenues soared 13.9% YoY to $12,236m in Q4. That looks suspect given that 1.7% YoY drop in production and the 4.8% YoY rally in the average gold price. 26 of these gold miners reported Q4 sales, compared to 27 a year earlier in Q4’16. The apparent growth came from some large gold miners that didn’t disclose Q4’16 sales deciding to make that data available in Q4’17.
Cash on balance sheets is also an interesting metric to watch, because it is primarily fed by operating profitability. Nearly all the gold miners report their quarter-ending cash balances as well, whether they report quarterly like in the US and Canada or in half-year increments like in Australia and the UK. The total cash on hand reported by these top GDX gold miners surged 7.0% YoY to a hefty $13,974m in Q4’17!
That’s a big number for this small contrarian sector, and it’s conservative. I just included the bank cash reported, excluding short-term investments and gold bullion. The more cash gold miners have on hand, the more flexibility they have in growing operations and the more resilience they have to weather any unforeseen challenges. Material drops in cash at individual miners were usually spent to grow their production.
So overall the major gold miners’ fundamentals looked quite strong in Q4’17, a stark contrast to the miserable sentiment plaguing this sector. Gold stocks’ vexing consolidation over the past year or so isn’t the result of operational struggles, but purely bearish psychology. That will soon shift as stock markets inevitably roll over and gold surges, making the beaten-down gold stocks a coiled spring overdue to soar dramatically.
While investors and speculators alike can certainly play gold stocks’ coming powerful uplegs with the major ETFs like GDX, the best gains by far will be won in individual gold stocks with superior fundamentals. Their upside will far exceed the ETFs, which are burdened by over-diversification and underperforming stocks. A carefully-handpicked portfolio of elite gold and silver miners will generate much-greater wealth creation.
At Zeal we’ve literally spent tens of thousands of hours researching individual gold stocks and markets, so we can better decide what to trade and when. As of the end of Q4, this has resulted in 983 stock trades recommended in real-time to our newsletter subscribers since 2001. Fighting the crowd to buy low and sell high is very profitable, as all these trades averaged stellar annualized realized gains of +20.2%!
The key to this success is staying informed and being contrarian. That means buying low before others figure it out, before undervalued gold stocks soar much higher. An easy way to keep abreast is through our acclaimed weekly and monthly newsletters. They draw on my vast experience, knowledge, wisdom, and ongoing research to explain what’s going on in the markets, why, and how to trade them with specific stocks. For only $12 per issue, you can learn to think, trade, and thrive like contrarians. Subscribe today, and get deployed in the great gold and silver stocks in our full trading books!
The bottom line is the major gold miners’ fundamentals are quite strong based on their recently-reported Q4’17 results. While production declined, mining costs were still driven lower. That coupled with higher gold prices generated fat operating profits and strong cash flows. The resulting full coffers will help the gold miners expand operations this year, which will lead to even stronger earnings growth in the future.
Yet gold stocks are now priced as if gold was half or less of current levels, which is truly fundamentally absurd! They are the last dirt-cheap sector in these euphoric, overvalued stock markets. Once gold resumes rallying on gold investment demand returning, capital will flood back into forgotten gold stocks. That will catapult them higher, continuing their overdue mean reversion back up to fundamentally-righteous levels.
Adam Hamilton, CPA
March 16, 2018
Copyright 2000 – 2018 Zeal LLC (www.ZealLLC.com)
The small contrarian gold-mining sector remains deeply out of favor, universally ignored. Thus the gold stocks are largely drifting listlessly, totally devoid of excitement. But that’s the best time to buy low, when few others care. The gold stocks continue to form strong technical bases, paving the way for massive mean-reversion uplegs. And they remain exceedingly cheap relative to gold prices, which drive their profits.
Being a gold-stock investor feels pretty miserable and hopeless these days. The gold stocks have been consolidating low for 14.2 months now, stuck in a seemingly-endless sideways grind. There are still gains to be won, but they are mostly within that low-trading-range context. We haven’t seen one of the huge uplegs gold stocks are famous for since the first half of 2016. So most traders have given up and moved on.
That’s understandable psychologically, but unfortunate for multiplying wealth. Sometimes it takes a while for gold stocks to catch a bid, but once they get moving they often soar. This sector is so small relative to broader stock markets that even minor shifts in capital flows can drive enormous gains. While it’s hard waiting for gold stocks to return to favor, the vast upside when they do is well worth the buying-low pain.
The leading gold-stock measure and trading vehicle is the GDX VanEck Vectors Gold Miners ETF. It was the original gold-stock ETF launched in May 2006, and still maintains a commanding advantage in popularity. This week, GDX’s net assets of $7.7b were 24.0x larger than its next-biggest 1x-long major-gold-stock-ETF competitor! GDX is as big as all the other gold-stock ETFs trading in the US combined.
GDX’s price action shows why gold stocks are such compelling investments when everyone hates them. After gold stocks were universally despised in mid-January 2016, GDX soared 151.2% higher in just 6.4 months! After the previous time sentiment turned so overwhelmingly against gold stocks in October 2008, GDX rocketed 307.0% higher over the next 2.9 years. Buying gold stocks low has proven very lucrative.
That quadrupling of GDX after 2008’s first-in-a-century stock panic was actually the tail end of a vastly-larger secular gold-stock bull. Many years before GDX was even a twinkle in its creators’ eyes, that gold-stock bull started stealthily marching higher out of total despair. It can’t be measured by GDX since that ETF started too late, but the classic HUI NYSE Arca Gold BUGS Index reveals the magnitude of that bull run.
Over 10.8 years between November 2000 and September 2011, the gold stocks as measured by the HUI skyrocketed an astounding 1664.4% higher! And that was during a long bear-market span in the general stock markets, where the flagship S&P 500 drifted 14.2% lower. The gains in gold miners’ stocks as they mean revert from out of favor to popular are so epically enormous that they far outweigh any time lost waiting.
Gold stocks are even more attractive today given the exceedingly-overvalued and dangerous US stock markets, which are on the verge of a long-overdue major bear. Market valuations remain deep in literal bubble territory despite early-February’s correction. The simple-average trailing-twelve-month price-to-earnings ratio of the elite S&P 500 stocks was still 31.5x at the end of last month, above the 28x bubble threshold!
The market-darling stocks investors love today are crazy-expensive, portending huge downside in the next bear. The most-popular stock among professional and individual investors alike is Amazon.com, a great company. Yet AMZN stock is now trading at a ludicrous 252.5x earnings! That means if profits held steady it would take new investors today a quarter millennium just to recoup their stock purchase price.
Meanwhile the world’s largest gold miner in 2017-production terms, Barrick Gold, is now trading at a TTM P/E of 9.5x. That’s dirt-cheap by any standards! And ABX’s profits-growth potential is greater than AMZN’s. Last year Barrick mined 5.32m ounces of gold at all-in sustaining costs of $750 per ounce. That was $508 under gold’s average price of $1258 last year, fueling fat full-year profits over $1.5b on $8.4b in sales.
Every 10% increase in prevailing gold prices boosts Barrick’s earnings by 25%. And the average gold price so far in 2018 is already up 5.7%, so gold miners’ profits are growing fast. I’m not a Barrick Gold investor, and am just using this leading major gold miner as an example. There are plenty of smaller mid-tier gold miners with far more upside profits leverage to gold prices. Gold stocks are darned attractive!
They are one of the last bargain sectors remaining in these overheated stock markets. They are one of the only sectors that can rally in major bear markets, because they follow gold which drives their profits. Gold investment demand surges in weak stock markets, which brings investors back to gold stocks. At some point, investors are going to figure out how compelling gold stocks are today and stampede back in.
Despite the apathetic sentiment plaguing them, the gold stocks are still looking fine technically and even better fundamentally. This first chart looks at gold-stock technicals as rendered by their dominant GDX ETF. Given how bearish traders have waxed on gold miners, you’d think they are spiraling relentlessly lower. But they are actually consolidating nicely, establishing a strong base from which to launch their next upleg.
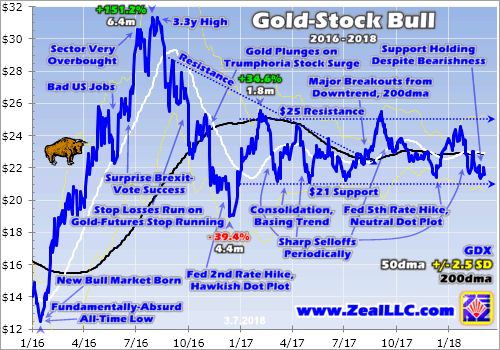
After plunging to fundamentally-absurd all-time lows in mid-January 2016, GDX soared into a major new bull market. While its 151.2% surge in just 6.4 months was undoubtedly extreme, that emerged out of even-more-extreme lows. And it merely catapulted GDX to a 3.3-year high in early-August 2016, nowhere close to secular topping levels. But the gold stocks were very overbought then, and soon corrected hard.
GDX’s enormous 39.4% correction in 4.4 months after that initial bull peak was also extreme, the result of a couple major anomalies. First gold-futures stops were run on major gold support failing, which ignited parallel cascading stop-loss selling in the gold miners’ stocks. Then investors fled gold in the wake of Trump’s surprise election victory, which led stock markets to soar on widespread hopes for big tax cuts soon.
Gold-stock selling finally exhausted itself in mid-December 2016, the day after the Fed’s 2nd rate hike of this cycle. Just a couple weeks later, GDX entered its now-14.2-month-old trading range that persists to this day. It is a basing consolidation trend running from $21 support to $25 resistance, which makes for a 19.0% trading range. This has held rock solid ever since, which has made gold-stock trading fairly easy.
My strategy has been simple. Given the extreme undervaluations in gold stocks that I’ll discuss shortly, a massive new upleg is likely to ignite anytime. So I want a full trading book to reap those enormous gains when they inevitably arrive. Thus every time GDX slumped down into the lower quarter of its consolidation range, between $21 to $22, I’ve been adding positions in great mid-tier gold miners with superior fundamentals.
All this is shared in real-time with our newsletter subscribers, who graciously support our research work. Buying low in the context of this vexing gold-stock consolidation has driven some great trades despite lackluster overall action. One example is Kirkland Lake Gold, an elite mid-tier miner. I added a new position in our popular weekly newsletter in December 2016. A year later I sold it for a hefty 184% realized gain!
So while this gold-stock trading range has sure felt dull, it has still created plenty of trading opportunities. And over the past month or so since that sharp stock-market correction, GDX has largely meandered in that lower quarter of its range near support again. That means it’s an excellent time to deploy capital in the unloved and cheap gold miners’ stocks today. Another surge higher is due, and it could be a big one.
While GDX $21 support has proven strong since the end of 2016, so has GDX $25 resistance. The gold stocks have tried and failed to break out above $25 four separate times since early 2017. A couple of the attempts were close, but weren’t sustainable as gold retreated. Once that $25 breakout finally comes to pass, investors will realize something different is happening and rush to chase gold stocks’ upside momentum.
Before early February’s sharp stock-market plunge that changed everything, I was looking to the release of gold miners’ Q4’17 operating and financial results as a potential catalyst to fuel that $25 breakout. That didn’t happen though, as gold and especially gold stocks were sucked into the fear surrounding the unprecedented stock-market volatility shock a month ago. That dragged GDX back down near support, which held.
This recent support approach is probably a blessing in disguise, offering another chance for investors to deploy capital in cheap gold stocks before they really start moving again. The great and sad paradox of the markets is investors are least willing to buy when stocks are low and out of favor, which is the exact time they should be buying before later selling high. Gold-stock prices can’t and won’t stay this low forever.
With stock-market volatility back, the highly-likely catalyst to ignite that GDX $25 breakout is gold rallying on resurgent investment demand. Gold is largely ignored when stock markets are high and investors are euphoric, as they feel no need to prudently diversify their portfolios. But once stock markets sell off for long enough to spook investors, they start shifting capital back into gold which often moves counter to stocks.
With the US stock markets still trading deep into bubble territory in late February, and euphoria remaining rampant as evidenced by the blistering bounce rally following that early-month plunge, there’s no way the stock-market selling is over yet. It will have to resume sooner or later with a vengeance to actually start rebalancing away greedy sentiment. When that happens, gold and gold stocks will soon catch major bids.
The fact gold stocks have held strong in their consolidation trading range for well over a year now is a glass-half-full kind of thing. It testifies to relatively-strong investment demand given the terribly-bearish sentiment pervasive in this sector. The longer prices base during bull markets, the greater the upside potential in their next upleg. It likely won’t take much of a gold rally to blast GDX back up through $25 again.
This strong technical picture and an inevitable sentiment mean reversion are reason enough for gold stocks to surge dramatically higher. But supercharging that is the dirt-cheap state of gold stocks today in fundamental terms. That includes current gold-mining profits compared to prevailing gold-stock prices, as well as near-future earnings-growth potential as gold itself continues mean reverting much higher ahead.
I’m well into my quarterly research work analyzing the Q4’17 results from the major gold miners of GDX. Unfortunately due to the complexities of preparing annual reports, the Q4 reporting season up to 90 days after quarter-ends is double the 45-day deadlines for Q1s through Q3s. So all the data isn’t quite in yet, but I expect to have enough to delve deeply into the major gold miners’ Q4’17 results in next Friday’s essay.
In the meantime, a great fundamental proxy for gold-stock valuations is the HUI/Gold Ratio. This is as simple as it sounds, dividing the daily close of that classic gold-stock index by the daily gold close and charting the resulting ratio over time. This reveals when gold stocks are expensive or cheap relative to the metal which drives their profits. And this sector has rarely been more undervalued than it is today!
This week the HGR was way down at 0.131x, meaning the HUI index’s close was running just over 13% of gold’s close. That’s incredibly low historically, showing that the gold miners’ stocks have been wildly underperforming gold. The gold stocks are trading at levels today implying gold and their profits were radically lower. This is a colossal fundamentally-absurd disconnect that can’t last forever, it has to unwind.
GDX and the HUI were way down at $21.57 and 173.4 in the middle of this week. The first time the HUI ever hit this level was way back in August 2003, years before GDX was even born. Back then gold was only running $357, and had yet to trade above $380 in its entire young secular bull. Let that sink in for a second. Gold stocks are trading at prices today first seen when gold was in the $350s fully 14.6 years ago!
This week gold was trading near $1325, an enormous 3.7x higher. That should certainly be reflected in gold miners’ stocks. Today’s super-low gold-stock levels aren’t much above the HUI’s stock-panic lows back in October 2008. There was only a week where the HUI traded lower than today at peak fear in the stock markets, and gold averaged $732 during that extreme span. This week it was trading 81% higher!
This is incredibly illogical, only explainable by irrational sentiment. If any other stock-market sector was trading at levels from a decade or more earlier despite the selling prices of its products doubling to quadrupling, investors would be beating down the doors to buy. That would rightfully be seen as a huge and unsustainable anomaly, a rare chance to buy deeply-undervalued stocks at decade-plus-old prices.
And it’s not just gold that’s far higher, so are the profit margins for mining it. With the new Q4’17 results from GDX’s major gold miners not all out yet, the latest data we have this week is Q3’17’s. During that previous quarter, the top GDX miners averaged all-in sustaining costs of just $868 per ounce. The costs of mining gold industrywide don’t change much, which is what creates profits’ big upside leverage to gold prices.
My still-incomplete Q4’17 analysis shows AISCs very similar to last quarter’s. That makes sense, as the past year’s quarters ending in Q3’17 had collective GDX AISCs of $875, $878, $867, and $868. Mining gold costs similar amounts regardless of prevailing gold prices, at least over medium-term multi-year spans too short for new gold mines to be built. So Q4’17 AISCs are likely to remain around these levels.
Assuming $868 carries forward into Q4’17 and Q1’18, gold-mining profits are really growing. Average gold prices surged from $1276 in Q4 to $1330 quarter-to-date in Q1. That’s up 4.2% sequentially, really strong. This implies major gold miners’ earnings are surging 13.2% QoQ in our current Q1’18 from $408 to $462 per ounce! That would make for strong 3.1x upside profits leverage to gold, which is impressive.
And whether the major gold miners are collectively earning $400, or $450, or even $500 per ounce today, such profits alone are much greater than the $350s prevailing gold price the first time the HUI traded at today’s levels. With fat profits like this heading much higher as this gold bull continues, it’s ridiculous for gold stocks to be priced as if gold was still in the $350s like mid-2003 or the $730s like in 2008’s stock panic.
This extreme anomaly can’t and won’t last. The gold stocks should be priced for today’s prevailing gold prices around $1325. The first time gold hit $1325 in October 2010, the HUI was trading at 522. That is triple today’s ludicrous levels! The gold stocks more than quadrupled in the years following 2008’s stock panic, another irrational situation where sentiment had battered gold stocks to fundamentally-absurd levels.
Between that first-in-a-century stock panic and extreme central-bank easing that really hit full steam in 2013, the last quasi-normal years in the markets were 2009 to 2012. During that post-panic span the HGR averaged 0.346x. If the HUI would merely mean revert back up to those levels relative to gold, it would have to soar to 458. That’s 164% higher than this week’s levels, upside unparalleled in any other sector.
For 5 years before the stock panic, the HGR averaged 0.511x. While gold stocks might not be able to sustain levels so high anymore, they could certainly blast up there in a temporary mean-reversion overshoot. After extremes, prices don’t simply migrate back to the average. Instead they overshoot proportionally to the opposing extreme as sentiment is equalized. That implies a HUI level of 677, 290% higher from here.
No one knows how high gold stocks can go, but there is zero doubt they are radically undervalued given today’s gold prices and the gold-mining profits they generate. Whether you expect this battered sector to quadruple again like after the stock panic, or merely double, that dwarfs the potential of the rest of the stock markets. Especially with the S&P 500 trading at bubble valuations after a long central-bank-goosed bull.
The gold stocks are truly a coiled spring today, ready to explode higher soon and trounce everything else. They are deeply out of favor, incredibly undervalued, and one of the only sectors that can rally sharply when general stock markets sell off. If you want to multiply your wealth this year by fighting the crowd to buy low then sell high, this small and forgotten contrarian sector is the place to be. Nothing else rivals it.
While investors and speculators alike can certainly play gold stocks’ coming powerful upleg with the major ETFs like GDX, the best gains by far will be won in individual gold stocks with superior fundamentals. Their upside will far exceed the ETFs, which are burdened by over-diversification and underperforming gold stocks. A carefully-handpicked portfolio of elite gold and silver miners will generate much-greater wealth creation.
At Zeal we’ve literally spent tens of thousands of hours researching individual gold stocks and markets, so we can better decide what to trade and when. As of the end of Q4, this has resulted in 983 stock trades recommended in real-time to our newsletter subscribers since 2001. Fighting the crowd to buy low and sell high is very profitable, as all these trades averaged stellar annualized realized gains of +20.2%!
The key to this success is staying informed and being contrarian. That means buying low before others figure it out, before undervalued gold stocks soar much higher. An easy way to keep abreast is through our acclaimed weekly and monthly newsletters. They draw on my vast experience, knowledge, wisdom, and ongoing research to explain what’s going on in the markets, why, and how to trade them with specific stocks. For only $12 per issue, you can learn to think, trade, and thrive like contrarians. Subscribe today, and get deployed in the great gold and silver stocks in our full trading books!
The bottom line is gold stocks are basing technically and cheap fundamentally today. While this small contrarian sector has largely been forgotten, its past year’s consolidation trading range continues to hold solid. The longer the basing, the greater the potential upleg when investors return. And despite trading at levels implying vastly-lower gold prices, the major gold miners are actually earning fat profits today.
Those earnings will surge dramatically as gold continues powering higher in its own bull market. It’s only a matter of time until investors see the extreme market-leading value inherent in the gold miners’ stocks. And with stock-market volatility roaring back after long years of central-bank suppression, diversifying portfolios with gold will soon return to favor. The gold stocks will soar as investment buying drives gold higher.
Adam Hamilton, CPA
March 9, 2018
Copyright 2000 – 2018 Zeal LLC (www.ZealLLC.com)

Gold is faring quite well today technically, though you sure wouldn’t know it from the rampant bearish sentiment. Gold’s price is in a strong uptrend over a year old, high in both its current upleg and young bull market. Gold isn’t far from breaking out to its best levels since September 2013, a really big deal. The stock markets even finally sold off after years of unnatural calm. Yet traders are still down on gold.
Across all markets price action drives psychology. When something’s price is rising, traders get excited and bullish on it. So they increasingly buy to ride that upside momentum, amplifying it. Of course the opposite is true when a price is falling, which breeds bearishness and capital flight. Given gold’s great technical picture today, investors and speculators alike should be growing enthusiastic about its upside potential.
But they really aren’t, which is certainly curious. Gold’s current upleg was born right before the Fed’s last rate hike in mid-December. Everyone thinks Fed rate hikes are very bearish for gold, but history proves the opposite as I argued near gold’s recent interim lows. In the 2.4 months since, gold has rallied 6.6% as of the middle of this week. That trounces the leading benchmark S&P 500 stock index’s mere 1.6%.
Gold’s rate of ascent since mid-December annualizes out to a 33% pace, which is pretty darned exciting! Yet gold’s two primary sentiment proxies, silver and the stocks of gold miners, show enthusiasm for gold is nonexistent. Over that same current-gold-upleg span, silver is only up 5.0% while the HUI gold-stock index clocked in with a dismal 1.8% gain. Normally silver and the gold stocks leverage gold upside by 2x to 3x!
As I discussed about a month ago, gold is on the verge of a major breakout that would greatly shift psychology back to bullish. Gold’s bull-to-date peak was carved in early-July 2016 at a $1365 close. For a variety of reasons gold stalled at best since. Just a month ago gold surged to $1358 though, and only a week ago it hit $1353. It wouldn’t take much of a rally to boost gold to new bull-market highs to catch the limelight.
Generally upside breakouts have to be decisive to really attract traders’ attention. I define that as 1% beyond the old level, so $1379 in gold’s bull-high case. That’s only a handful of good up days away, not far at all. And that’s close to $1383, which is gold’s best level in a whopping 4.5 years. Start pushing $1400 again, and even oblivious traders who’ve long forgotten about gold will realize something big is changing.
On top of these key technical upside-breakout levels so close, the sharp stock-market selloff is fantastic news for gold investment demand. The S&P 500 plunged 10.2% in just 9 trading days! That ended an all-time-record 405-trading-day span without a mere 5% pullback, and is the first stock-market correction in 2.0 years. Stock selloffs are very bullish for gold, as investors remember the wisdom of diversifying portfolios.
So gold’s popularity should really be mounting now given its strong price action. Yet that certainly hasn’t happened yet, gold’s sentiment is really curious. The prevailing psychology remains quite bearish, which feels much more like a major bottoming. The fear, anxiety, and apathy somehow still plaguing gold is the polar opposite of the greed and excitement near major highs. Gold is still overlooked, ignored, and shunned.
This weird sentiment anomaly totally disconnected from technical realities can and will turn fast, likely as gold decisively breaks out to new bull highs. That could happen anytime in the coming weeks or maybe months, it is nearing. But for now, it’s useful to understand why gold oddly remains so out of favor. The answer lies in the psychology of gold’s two primary driving forces, futures speculators and stock investors.
Gold-futures speculators exert inordinate influence on daily gold price action. This is primarily due to the extreme leverage inherent in futures trading. This week a single gold-futures contract that controls 100 ounces of gold has a maintenance-margin requirement of just $3500. That’s all the capital traders need to buy or sell a contract. But at this Wednesday’s $1323 gold, each contract controls gold worth $132,300.
That equates to extreme maximum leverage of 37.8x, death-defyingly high! For comparison, the legal limit in stock markets for decades has been 2.0x. At 35x leverage, each dollar speculators deploy in gold futures has 35x the gold-price impact of another dollar used to invest in gold outright. Such ridiculous leverage allows futures speculators to collectively punch far above their weights, dominating gold-price action.
As if that’s not unfair enough to normal investors, gold futures’ extreme leverage necessitates an ultra-short-term focus. Again at 35x leverage, a mere 2.9% adverse price move in gold would wipe out 100% of the capital speculators risked! So these guys are forced to think in terms of minutes, hours, days, or sometimes weeks for their trading time horizons. The months and years of investors may as well be eternities.
That incredibly-myopic view on gold creates all kinds of problems because data is far too sparse to justify ultra-short-term trading. The best fundamental data available on gold is only published once each quarter by the World Gold Council. Some other localized peripheral data is released monthly. So with insane leverage compressing down speculators’ gold outlooks into days or less, they have nothing to trade on.
Instead of backing way off on their leverage and taking rational longer-term trading spans, they fabricate their own gold-trading cues. The two they’ve collectively decided on are the price action in competing US Dollar Index futures and the closely-related Fed-rate-hike outlook. Developments there motivating gold-futures speculators to act are half of the explanation surrounding gold’s curious sentiment these days.
Nearly a month ago futures speculators bid gold up to $1358. They were watching USDX futures, as that leading US dollar benchmark was grinding inexorably lower. On February’s first trading day, the USDX slumped to a major 3.1-year secular low. That weak dollar is what drove gold tantalizingly close to a major bull-market breakout. But futures speculators were perplexed if not angry this was actually happening.
These elite traders hold tight to certain core beliefs with tenacity that puts religious zealots to shame. The main one is that Fed rate hikes are bullish for the US dollar and therefore bearish for gold. The idea is simple, higher rates boost dollar yields making it relatively more attractive than other currencies. So foreign investors rush to buy, bidding the dollar higher. Futures speculators know this is how the world works.
That logic appears sound, but what if their deeply-held thesis simply isn’t true? The Fed’s current rate-hike cycle began in December 2015 after 9.5 years with no rate increases, and 7.0 continuous years of a zero-interest-rate policy. The 5 hikes since coming off a near-zero base should’ve been wildly bullish for the USDX, right? Futures speculators bet heavily long the dollar and short gold heading into that initial hike.
Yet since the day before the Fed started its current rate-hike cycle, the USDX is down 8.3% and gold is up 24.7% as of the middle of this week! Clearly Fed rate hikes aren’t as bullish for the US dollar or as bearish for gold as futures speculators thought. You’d think they’d be smart enough to form their trading strategies based on hard data instead of mere conceptual arguments. But they steadfastly refuse to budge.
Gold started to sell off on Friday February 2nd in the wake of the latest monthly jobs report. It saw wage growth climb at its fastest annual pace since June 2009, stoking inflation fears. Higher inflation implies the Fed will have to hike rates faster. So the oversold USDX surged 0.7% higher that day, making for its biggest up day since late October. Gold-futures speculators saw that and fled, hammering gold 1.4% lower.
The S&P 500 happened to plunge 2.1% that day on those same inflation fears, its own worst down day since early September 2016 before Trump won the election kicking off the extreme taxphoria rally. That sharp stock-market drop shattering the unnatural calm was the dominant news that day. That led investors to assume gold fell because the stock markets sold off, but the real reason was that big dollar bounce.
That’s happened before. Back in late 2008 during that first stock panic in a century the USDX rocketed 22.6% higher in just 4.2 months, its biggest and fastest rally ever! That was in response to safe-haven buying as the S&P 500 plummeted 38.1% in that short span. But that epic dollar strength hammered gold a proportional 23.7% lower. Investors wrongly figured weak stock markets hurt gold, but it was the hot dollar.
When stock markets fall sharply, cash suddenly becomes much more attractive than stocks. So dollar demand surges as stocks plunge. Gold-futures speculators see that and dump gold, driving it lower. This dynamic fully explains gold’s weakness in recent weeks. Every single gold down day was the direct result of a parallel USDX rally! That was true in early-February’s S&P 500 selloff and then again this week.
Since the dollar’s action and the Fed-rate-hike outlook is the extent of gold-futures speculators’ entire trading worldview, they’ve been really bearish on gold as the dollar bounced twice this month. Thus they have greatly pared their long gold-futures positions. This chart superimposes gold over the total gold-futures long and short contracts held by speculators, published weekly in the Commitments of Traders reports.
CoT data is released late each Friday afternoon current to the preceding Tuesday close. So the latest-available data on speculators’ collective gold-futures trading when this essay was published is as of February 13th. In just the 3 CoT weeks since gold hit $1358, these guys dumped a massive 59.8k long contracts! That’s equivalent to 185.9 metric tons of gold, a huge amount. No wonder gold couldn’t rally during that.
But interestingly all that frenzied gold-futures long selling on modest US-dollar strength drove specs’ total longs back down to their gold-bull support line rendered above in green. Other than a brief break below leading into the Fed’s last rate hike, strong buying has soon followed earlier support approaches. That has fueled sharp gold rallies once spec longs hit support. That will likely prove true again in coming weeks.
Despite the extreme leverage they wield, gold-futures speculators’ capital is finite. They only have so much they can deploy on both the long and way-smaller short sides of the trade. So looking at where specs’ total longs and shorts are relative to their own past-year trading ranges offers an excellent approximation of how much buying or selling firepower these guys have left. That greatly affects gold’s outlook.
As of last Tuesday the 13th, their total longs were only running 35% up into their past-year trading range. That means these elite traders still had room to do nearly 2/3rds of their likely near-term buying! That’s very bullish. The short side was far-less bullish, with speculators’ total gold-futures shorting running just 14% up into their past-year trading range. That means 6/7ths of likely short-covering buying was already done.
The gold-price impact of buying new long contracts or buying to cover existing shorts is identical. If these total long and short trading ranges are combined, speculators’ effective total upside bets on gold were at 55%. That implies 45% of probable near-term buying remains! That’s exceptionally bullish with gold still up near major breakout highs. Normally near highs 80% to 90% of buying power has already been expended.
So once the USDX inevitably turns lower again, there’s lots of room for speculators to buy gold futures and push gold higher. The dollar weakness will likely reemerge on ballooning US deficits and debt. The Republican lawmakers are keeping the extreme out-of-control government spending of the Obama era intact, while simultaneously cutting taxes. Rising rates are also catapulting US interest expenses much higher.
And more Fed rate hikes aren’t likely to ride to the dollar’s rescue. The USDX entered the last Fed-rate-hike cycle between June 2004 to June 2006 relatively low, perfect conditions for a rally. Then the FOMC hiked 17 times in a row, more than quintupling its federal-funds rate to 5.25%. Yet the USDX still slipped 3.8% over that exact span, while gold powered 49.6% higher! Fed rate hikes haven’t proven great for the dollar.
The second driving force behind gold’s curious sentiment is little investor interest. Investors control vastly more capital than futures speculators. So when investment capital is moving into or out of gold in any significant way, it overpowers and drowns out all the daily gold-futures noise. Stock selloffs greatly boost gold investment demand, but not immediately. Investors first get distracted by the dollar-driven futures action.
The S&P 500 plunged 8.5% in just 5 trading day ending February 8th, a precipitous tumble. Yet instead of surging on that stock weakness, gold dropped 2.4%. Investors assume that was in sympathy with the stock markets. But it was really the result of the USDX surging a similar 2.0% over that span on safe-haven buying. The dollar surging on heavy demand in the hearts of stock-market selloffs delays gold’s reaction.
So investors weren’t yet flocking back to gold earlier this month. The world’s dominant gold ETF publishes its physical-gold-bullion holdings held in trust for shareholders daily. The GLD SPDR Gold Shares showed no holdings builds as stock markets recently plunged, indicating stock-market capital wasn’t yet flowing into gold. There were actually sizable draws over that span as stock investors dumped GLD shares.
When stock markets fall sharply, investors freak out. Fear flares so fast that people have to act instead of think. So they sell everything they can to raise cash, including gold. Weaker gold prices driven by futures selling in response to the surging USDX exacerbate any gold selling. In the heat of the moment investors think gold gets sucked into stock-market selloffs, that it really doesn’t move counter to stocks.
But once the biggest-fear days in stock-market selloffs pass, investors come to realize they are taking on too much risk with their stock-dominated portfolios. So they start rebuilding depleted gold positions in the wake of major stock-market selloffs. We’re indeed already seeing modest GLD builds return over the past week or so. And this same dynamic was actually what birthed today’s gold bull back in early 2016.
Heading into that first Fed rate hike in 9.5 years in December 2015, gold slumped to a brutal 6.1-year secular low. Because futures speculators are totally convinced Fed rate hikes are kryptonite for gold, history be damned. The S&P 500 had gone a near-record 3.6 years without a single 10%+ correction, so complacency was extreme. Investors believed stocks did nothing but rally, so they could hold them forever.
Finally back-to-back S&P 500 corrections arrived in mid-2015 into early 2016. This benchmark stock index fell 12.4% in 3.2 months, bounced most of the way back, and then dropped another 13.3% over 3.3 months into mid-February 2016. That first SPX correction only spurred limited gold investment buying. Stock investors weren’t very worried the lofty stock markets would head much lower again, so they procrastinated.
Yet after that second correction arrived shortly after, differential GLD-share demand exploded! Investors flocked back to gold to prudently diversify their stock-heavy portfolios. That heavy investment buying catapulted gold 29.9% higher in just 6.7 months, birthing today’s bull market. Gold kept rallying rather relentlessly until the stock markets finally made new highs which totally dispelled weaker-stock worries.
The same thing happened during and after 2008’s epic stock panic. Gold was hammered by the skyrocketing USDX during that extreme stock-market selloff. But in the following months gold investment demand blasted higher as investors realized they needed counter-moving gold allocations in their portfolios. That heavy gold investment demand persisted for years after the stock panic, driving gold to record highs.
History has shown over and over that gold investment demand is weak when stock markets are high and euphoric. Why buy gold when stocks apparently do nothing but rally indefinitely? But once corrections or new bear markets emerge to rebalance sentiment and knock back overvalued, overbought stocks, gold soon returns to favor. That doesn’t happen instantly, as safe-haven dollar buying temporarily forces gold lower.
But after major selloffs when investors start to realize that stock markets can fall too, they start thinking about gold again. It’s the ultimate portfolio diversifier. That post-selloff gold-investment process is very gradual, it takes months or years to rebuild significant gold positions relative to stock portfolios. Odds are a similar outcome will play out again following this latest sharp S&P 500 selloff, which likely isn’t over yet.
Given the radical gold underinvestment following this extreme stock bull, investors will likely have to do big gold buying for years to reestablish normal portfolio allocations. That will continue to fuel this young gold bull born in late 2015 in the previous stock-market correction. At best gold was only up 29.9% so far as of mid-2016, nothing yet. The last gold bull powered 638.2% higher over 10.4 years ending August 2011!
While investors can ride gold’s ongoing bull in GLD shares, far better gains will be won in the stocks of its leading miners. They tend to amplify underlying gold gains by 2x to 3x due to their profits leverage to gold. With gold so out of favor, the gold stocks are deeply undervalued today. That gives them huge upside as gold mean reverts higher, dwarfing everything else in all the stock markets. Fortunes will be won.
At Zeal we’ve literally spent tens of thousands of hours researching individual gold stocks and markets, so we can better decide what to trade and when. As of the end of Q4, this has resulted in 983 stock trades recommended in real-time to our newsletter subscribers since 2001. Fighting the crowd to buy low and sell high is very profitable, as all these trades averaged stellar annualized realized gains of +20.2%!
The key to this success is staying informed and being contrarian. That means buying low before others figure it out, before undervalued gold stocks soar much higher. An easy way to keep abreast is through our acclaimed weekly and monthly newsletters. They draw on my vast experience, knowledge, wisdom, and ongoing research to explain what’s going on in the markets, why, and how to trade them with specific stocks. For only $12 per issue, you can learn to think, trade, and thrive like contrarians. Subscribe today, and get deployed in the great gold and silver stocks in our full trading books!
The bottom line is gold’s curious sentiment today results from an interplay of factors. Safe-haven dollar buying erupted as usual during the stock markets’ first real selloff in a couple years. That led the gold-futures speculators to sell aggressively, driving gold lower. Investors saw gold falling with stocks and wrongly assumed stock selloffs aren’t bullish for gold. And their confidence in stocks remains very high.
But as stocks head lower again after their post-correction bounce, psychology will really shift. Investors will increasingly worry that stock weakness could persist for some time. They will remember gold is the ultimate portfolio diversifier, and start shifting capital back into it. The resulting investment buying will persist for months or even years, drowning out whatever the hyper-leveraged gold-futures speculators are up to.
Adam Hamilton, CPA
February 23, 2018
Copyright 2000 – 2018 Zeal LLC (www.ZealLLC.com)
The unnaturally-tranquil stock markets suddenly plunged over this past week. Volatility skyrocketed out of the blue and shattered years of artificial calm conjured by extreme central-bank distortions. This was a huge shock to the legions of hyper-complacent traders, who are realizing stocks don’t rally forever. With stock selling unleashed again, herd psychology will start shifting back to bearish which will fuel lots more selling.
As a contrarian student of the markets, I watched stocks’ recent mania-blowoff surge in stunned disbelief. On fundamental, technical, and sentimental fronts, the stock markets were as or more extreme than their last major bull-market toppings in March 2000 and October 2007! I outlined all this in an essay on these hyper-risky stock markets on 2017’s final trading day. The ominous writing was on the wall for all willing to see.
January’s extreme surge in the US stock markets made this selloff case even more likely. Mid-month in another essay I warned, “The stock markets are now dangerously overbought, implying a major selloff is probable and imminent. … Such extremes are very unusual and never sustainable for long, signaling major selloffs looming.” So the fact these crazy stock markets finally rolled over wasn’t a surprise at all.
But I was awestruck at the sheer violence of what happened last Friday and the subsequent Monday, it was very odd. Even though the countless market extremes argued strongly for a major selloff, they tend to be much more gradual initially off bull-market peaks. So it was fascinating to watch all this unfold in real-time with my data feeds and CNBC. Students of the markets live for anomalous exceedingly-rare events!
The igniting catalysts were multilayered. The US flagship S&P 500 broad-market stock index (SPX) had blasted to a dazzling new all-time record high on Friday January 26th. It was stretched a mind-boggling 14.0% over its key 200-day moving average, which itself was high and steeply rising! The 8.9-year-old stock bull that had powered 324.6% higher felt unstoppable. Traders were universally convinced it would continue.
But just a couple trading days later on Tuesday January 30th, significant selling emerged. That morning Amazon, Berkshire Hathaway, and JP Morgan declared they were going to form a healthcare company. That unanticipated news way out of left field crushed the major healthcare stocks, hammering the SPX 1.1% lower. That was actually a significant down day by recent standards, the worst seen since mid-August.
With euphoric bullish psychology dented, Jobs Friday arrived a few trading days later on February 2nd. That official monthly US jobs report saw a modest headline beat, but the big news came on the wages front. Average hourly earnings beat expectations by climbing 2.9% year-over-year, the hottest read on wage inflation since June 2009. That triggered inflation fears with the 10-year Treasury yield already at 2.78%.
Higher prevailing interest rates are a huge problem for bubble-valued stock markets. The SPX had just left January with its 500 elite component stocks sporting a simple-average trailing-twelve-month price-to-earnings ratio way up at 31.8x! Historical fair value is 14x, twice that at 28x is formal bubble territory. In a higher-rate environment, extreme valuations are far harder to tolerate. So the stock markets sold off.
A week ago Friday the SPX slid all day long to close at a major 2.1% loss. That proved its biggest down day since way back in September 2016, before Trump won the election and the resulting extreme stock rally first on Trumphoria and later on taxphoria. Something was changing, the unnaturally-low volatility regime was crumbling. That left speculators and investors alike very nervous heading into last weekend.
It had been an all-time-record 405 trading days since the SPX’s last 5% pullback, unbelievably extreme. So that selloff really struck a nerve, I started to hear from casual acquaintances I hadn’t spoken to for years. At a friend’s Super Bowl party Sunday night, once the guests I didn’t know found out what I do for a living I felt like a celebrity. We spent the first quarter talking about the markets, people were really concerned.
Monday the 5th was extraordinary, a record day in some respects. SPX futures were down less than 1% in pre-market trading, nothing wild. But once the US stock markets opened, the selling started gradually snowballing. It greatly intensified around 3pm, with the SPX plunging from -2.3% to -4.5% on the day in literally 11 minutes! There was no news at all, it simply looked and felt like cascading stop-loss selling.
All prudent traders put trailing stop-loss orders on their stock positions. They are an essential measure to manage risk. Once a stock falls a preset percentage from its best level achieved during a trade, that position is automatically sold. In big stock-market selloffs, as stop losses are sequentially hit they feed into the ongoing selling. The more stocks fall, the more stops triggered, the more sell orders fuel the maelstrom.
The SPX bounced a bit, but still plunged a whopping 4.1% on close Monday! That was a serious down day by any standard, actually the worst since way back in mid-August 2011 which followed Standard & Poor’s downgrading US sovereign debt. Everyone takes notice when stock markets suffer their biggest daily drop in 6.5 years. That really changes collective psychology, shattering the euphoria rampant in January.
But amazingly that SPX plunge wasn’t the most-interesting thing Monday. The implied volatility on SPX options is tracked in the famous VIX fear gauge. It skyrocketed a stupendous 125.8% higher that day, its largest daily spike ever witnessed! That wreaked colossal havoc in the short-volatility market. Since Trump’s election win, more traders and capital have flocked to bet on the idea that volatility will keep falling.
Students of market history knew that was an absurd bet before Monday’s spike. Stock-market volatility has always been cyclical, just like stock prices. Exceptionally-low or -high volatility levels always mean revert back to normal. So betting that the record-low stock volatility in recent months would keep going even lower was a foolish, suicidal bet even before Monday. That epic VIX spike totally gutted these guys.
There are, or were, extraordinarily-risky inverse-VIX exchange-traded notes. These were designed to rally when volatility fell, some even with leverage which traders liked to further amplify with their own margin. One of the leading inverse-VIX ETNs was XIV, which is VIX spelled backwards. It had closed at $129.35 per share on Thursday February 1st, but by this Tuesday it had imploded 94.3% in a termination event!
All these inverse-VIX ETNs were shorting VIX futures, so they had to become massive buyers on that sharp SPX selloff to close out those devastated positions. On Monday the banks sponsoring these crazy ETNs had to buy an extreme record 282k VIX futures contracts! That catapulted the VIX itself to 50.3 on Tuesday morning, about as high as it ever gets outside of actual crashes and panics. What a wild ride!
That begs the question what happens next? This stock-market-selling and volatility shock happened at a time when stock markets were already very precarious. Such an extreme event has to start altering herd psychology. This first chart looks at the SPX superimposed over the VIX during the last few years, both on a closing basis. Once serious selling starts out of toppy stock markets, it usually portends much more coming.
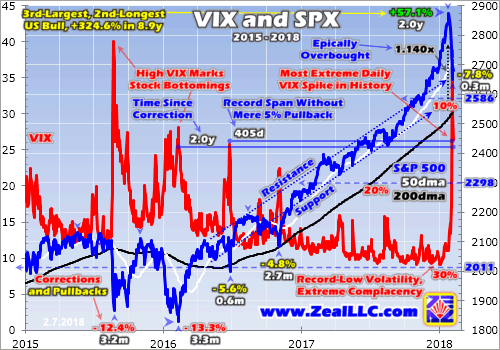
This week’s stock selling unleashed emerged in some of the most-toppy stock markets ever witnessed. Again the average SPX-component TTM P/E leading into it was a bubble-valued 31.8x! Again the SPX had stretched 14.0% above its 200-day moving average, some of the most-overbought conditions seen in all of SPX history. The SPX had rocketed vertically for most of January in popular-mania-grade euphoria.
The future impact of stock selling being unleashed really depends on the market conditions that birthed that selling spike. If stock prices were near multi-year lows leading into selling spikes, with valuations lower than their historical average of 14x earnings, these events can mark selling climaxes before major reversals higher. But unfortunately the exact opposite was true leading into our current sharp SPX plunge.
Coming out of what looked and felt like a mania blowoff top, this past week’s serious selling is surely an ominous omen. Stock markets can’t rally forever, yet that’s exactly what they seemed to be doing since Trump’s surprise election victory. Between Election Day and late January’s latest record high, the SPX had soared 34.3% higher in just 1.2 years! And that span was incredibly extreme with record-low volatility.
Again as of last Friday it had been an all-time-record 405 trading days without a single 5% peak-to-trough SPX pullback. That’s 1.6 years! Nothing like that had ever happened before. Technically a pullback is a 4%-to-10% selloff in the stock markets on a closing basis. The last pullbacks were minor, a 4.8% one in late 2016 following a 5.6% one in mid-2016. Those were the last material selloffs in the SPX before this week.
Periodic selloffs to rebalance sentiment are essential to keeping stock bulls healthy. The longer markets go without significant selloffs, the more greed and complacency multiply. Traders forget that stocks fall too, and their hubris leads them to take all kinds of excessive risks. Like betting that record-low volatility will persist indefinitely. The leveraged speculation eventually gets so extreme that it threatens the entire bull.
My favorite analogy on this is forest fires. Officials love to suppress natural wildfires to protect structures. But the longer firefighters put out every little wildfire, the denser forest underbrush gets. This fuel source grows out of control, eventually leading to a conflagration far too extreme to put out. Rather than having a bunch of smaller wildfires to keep fuel in check, suppression eventually guarantees a super-destructive hell fire.
Periodic pullbacks and corrections in stock markets allow the underbrush of greed to be burned away before it gets thick enough to become a systemic risk. Traders naively believe levitating stock markets are less risky, but the opposite is true. The longer a span without a serious selloff, the higher the odds one is coming soon. Normal healthy bull markets actually suffer 10%+ corrections once a year or so to keep balance.
It’s been 2.0 years since the last actual SPX correction, which bottomed in early 2016. The lack of both smaller pullbacks and larger corrections let complacency grow unchecked into greed, euphoria, and even hubris recently. And these emotional extremes have to be mostly burned away for this bull to have any hope of eventually heading higher. The only thing that can eradicate widespread greed is major stock selloffs.
After Monday’s serious 4.1% plunge, the SPX was still only down 7.8% since its peak just 6 trading days earlier. While that is unusual speed to see such a decline, it still only ranks towards the high end of mere pullback territory. We hadn’t even hit a correction yet at 10%, and they can stretch as high as 20%. The SPX’s last corrections ran 12.4% over 3.2 months in mid-2015 and 13.3% over 3.3 months into early 2016.
Given the extreme overvalued and overbought conditions leading into this past week’s plunge, there’s no way even that was enough to rebalance away the euphoric sentiment. So it’s all but certain the SPX will grind lower in the coming months, heading down well over 10% into deep correction territory. At 10% the SPX would merely be back to early-November levels, merely erasing the recent mania-blowoff surge.
If this correction approaches 20% as it really ought to, that would drag the SPX all the way back down to 2298. Those levels were first seen just over a year ago in late January 2017. That would reverse the lion’s share of the entire past year’s taxphoria rally, wreaking tremendous sentiment damage. But don’t forget corrections tend to take a few months, not a few days. So the selling is way more gradual than Monday’s.
That extreme 50 VIX spike Tuesday morning must be considered. Again that’s about as high as the VIX ever gets in normal corrections, implying the immediate selling pressure should have abated. The only times higher VIX levels are briefly seen is after crashes and panics. A crash is a 20%+ drop in just two trading days from very-high stock-market levels. This past week’s Friday-Monday selloff wasn’t even close.
Crashes are exceedingly rare in history, and next to impossible today given the widespread use of stock-market circuit breakers. They effectively close markets for a time after intraday selling milestones are hit. Today the SPX has levels triggered at 7%, 13%, and 20% intraday declines. The trading halts depend on when these declines occur within a trading day, before or after 3:25pm. They would slow crash-grade plummets.
Panics are steep 20%+ selloffs within two weeks, extreme but much slower than crashes. They tend to cascade from lows out of late-stage bear markets to climax them. They are very rare too, with 2008’s being the first formal one since 1907. The VIX can temporarily soar above 50 in crashes and panics, but those extremes never last for long. In normal market conditions, a 50 VIX spike should mark an absolute bottom.
But the problem this week is Tuesday’s extreme VIX spike was the result of panic buying of VIX futures to liquidate those inverse-VIX ETNs. That has never happened before. Without that dynamic, the VIX likely wouldn’t have gone much above 30. That too implies this stock-market selloff still has plenty of room to run. So the stock selling unleashed is likely to persist over a few months at least, despite the VIX spike.
Given the extremes in these stock markets in late January, I still suspect the odds heavily favor a new bear market over 20% instead of a bull-market correction. I presented this compelling SPX-bear case in late December, and don’t have room to rehash it here. Normal bear markets tend to cut stocks in half over a couple years or so, 50% SPX losses. That works out to a gradual average selling pace of 0.1% per day.
The last couple SPX bears give an idea of what to expect in the inevitable next bear after such an epic stock bull. The SPX fell 49.1% over 2.6 years ending in October 2002, and 56.8% over 1.4 years that climaxed in March 2009. A 50% SPX loss, which is conservative since bears tend to be proportional to their preceding bulls’ sizes, would drag this index back to 1436. That’s September-2012 levels, a long way down!
No one knows whether this stock selling unleashed will culminate in a bull-market correction under 20% or a new bear market over 20%. But either way, speculators and investors ought to swiftly boost their anemic portfolio allocations to gold. The record-high stock markets in recent years have led to radical gold underinvestment. Gold tends to rally on balance when stocks fall, it’s the ultimate portfolio diversifier.
As this final chart shows, after the last SPX correction ending in early 2016 gold surged into a major new bull market. Hyper-complacent stock traders suddenly realized that they needed to own gold to diversify their stock-heavy portfolios. That gold bull has persisted, powering higher in a strong uptrend ever since despite this past year’s extreme taxphoria stock-market rally. A new SPX correction will work wonders for gold.
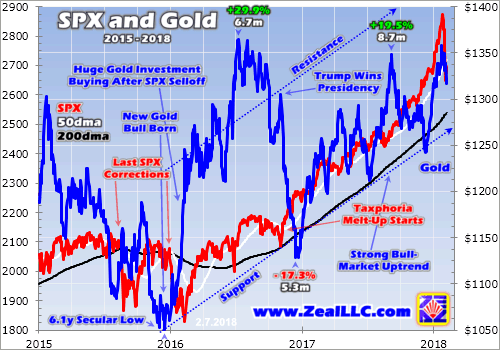
That last SPX correction into early 2016 wasn’t large at just 13.3%. Yet that was still enough to motivate complacent investors to flock back to gold. Their heavy buying catapulted gold 29.9% higher in just 6.7 months! Gold turned on a dime from deep 6.1-year secular lows because a major stock-market selloff finally convinced investors to up their meager gold allocations. Every investor should have 5% to 10%+ in gold.
Just a week ago that ratio was likely only running around 0.14% based on the values of that leading GLD gold ETF and the collective market capitalizations of the 500 SPX companies! So with gold allocations essentially zero late in an extreme stock bull, there’s vast room for massive capital inflows into gold in the coming years as investors rebalance their portfolios. Gold thrives for a long time after major stock selloffs.
The gold buying isn’t instant when the SPX falls though, as traders need time to process the drop and its likely implications. Back in early 2016 stock investors really didn’t start aggressively buying GLD shares until the SPX suffered multiple big down days. The SPX fell 1.5%, 1.3%, 2.4%, and 1.1% on separate trading days in a single week before gold buying resumed. More big SPX losses soon accelerated these inflows.
If you don’t have a significant gold allocation in your portfolio, you ought to get buying. It can be done with physical gold bullion or GLD shares. If you want to leverage gold’s bull market that will accelerate following a major stock selloff, consider the stocks of great gold miners. They tend to amplify gold upside by 2x to 3x due to their fantastic profits leverage to gold. The precious-metals sector thrives after stock selloffs!
Finally the stock selling unleashed is likely just beginning due to what the major central banks are doing this year. The Fed’s unprecedented quantitative-tightening campaign to start reversing its trillions of dollars of QE liquidity injected that levitated stocks for years is accelerating throughout 2018. At the same time the European Central Bank slashed its own QE campaign in half until September, when it may cease entirely.
Between the Fed’s QT and ECB’s QE tapering, global stock markets face central-bank tightening running $950b in 2018 and another $1450b in 2019 compared to 2017 levels! This will certainly strangle this QE-inflated monster stock bull. So on top of everything else this week’s sharp selloff portends, the euphoric stock markets were already in serious trouble from record extreme central-bank tightening. Got gold yet?
Absolutely essential in falling markets is cultivating excellent contrarian intelligence sources. That’s our specialty at Zeal. After decades studying the markets and trading, we really walk the contrarian walk. We buy low when few others will, so we can later sell high when few others can. While Wall Street will deny the coming stock-market bear all the way down, we will help you both understand it and prosper during it.
We’ve long published acclaimed weekly and monthly newsletters for speculators and investors. They draw on my vast experience, knowledge, wisdom, and ongoing research to explain what’s going on in the markets, why, and how to trade them with specific stocks. As of the end of Q4, all 983 stock trades recommended in real-time to our newsletter subscribers since 2001 averaged stellar annualized realized gains of +20.2%! For only $12 per issue, you can learn to think, trade, and thrive like contrarians. Subscribe today!
The bottom line is the stock selling unleashed this week isn’t over. Given the fundamental, technical, and sentimental extremes around January’s record highs, a sub-10% pullback isn’t enough to eradicate the euphoria. At best a major correction approaching 20% is necessary, and those tend to run a few months or so. This week’s extreme VIX spike to levels that usually mark major bottoms was artificial, not normal.
And after such an extreme bull market largely driven by record central-bank easing, the odds really favor this selloff eventually growing into a 20%+ new bear. Especially with the major central banks starting to aggressively pull their liquidity in 2018. Whether a major bull correction or major new bear market, gold tends to thrive after major stock-market weakness. That leads investors to buy gold to re-diversify their portfolios.
Adam Hamilton, CPA
February 9, 2018
Copyright 2000 – 2018 Zeal LLC (www.ZealLLC.com)
Gold’s strong upleg accelerated this week, powering to major new breakout highs. Speculators rushed to buy gold futures following surprising weak-dollar comments from the US Treasury Secretary, which hit the US dollar hard. That boosted gold to critical technical levels that should really intensify the shift back to bullish psychology. This mounting gold breakout confirms gold’s bull market is very much alive and well.
While this week’s surge put gold on many more traders’ radars, it has actually been picking up steam for 6 weeks now. Gold’s latest major interim low of $1242 came a couple days before the Fed’s latest rate hike in mid-December. The gold-futures speculators who dominate this metal’s short-term price action have always had a deep and irrational fear of Fed rate hikes. Historically gold has thrived in rate-hike cycles!
Leading into that fifth rate hike of this current cycle, these hyper-leveraged traders aggressively dumped longs and ramped shorts at record levels. That battered gold lower while exhausting potential selling. So once the Fed hiked as expected, and didn’t up its 2018 rate-hike forecast from the prior quarter’s three more, these excessively-bearish traders started buying back in. This pattern was seen around past rate hikes.
So two trading days after this latest rate hike when gold was still at $1256, I published an essay outlining why that hike was so bullish for gold. It concluded, “…Fed rate hikes are bullish for gold, and this week’s is no exception… After each past December rate hike which gold-futures speculators sold aggressively into, gold dramatically surged in the subsequent months.” And that’s indeed exactly what happened since.
By the final trading day of 2017 gold had already surged 4.9% out of its pre-rate-hike interim low. Those strong gains continued in this young new year despite these extreme mania stock markets retarding gold investment demand. By this Tuesday, gold’s new upleg extended to an 8.0% gain over nearly 6 weeks. Since the Fed’s rate hike, gold had rallied on 19 out of 27 trading days. Upleg momentum was already building.
Every January the ultra-exclusive World Economic Forum is held in Davos, Switzerland. It attracts the world’s most powerful people, from CEOs to top political leaders to billionaires. The financial media flocks to the Swiss Alps to interview these leading movers and shakers. One of this year’s attendees is Steven Mnuchin, Trump’s Treasury Secretary. He gave an interview in Davos which shocked currency traders.
Mnuchin told reporters, “Obviously a weaker dollar is good for us as it relates to trade and opportunities.” That’s certainly true, as it’s easier for American companies to export around the world when their goods are less expensive due to a lower dollar. But Treasury secretaries have a long tradition of never saying anything about the dollar beyond that they “support a strong-dollar policy”. So Mnuchin’s candor was unexpected.
Mnuchin had made similar comments last year that didn’t affect markets as much. But the combination of this past year’s strong dollar downtrend and a couple more developments that day triggered big US dollar selling. The US had just slapped tariffs on imported solar panels and washing machines hours earlier. Trump’s Commerce Secretary Wilbur Ross spoke alongside Mnuchin at that Davos conference.
Ross warned more trade measures were coming. When asked about trade wars he replied, “Trade wars are fought every single day… So a trade war has been in place for quite a little while, the difference is the US troops are now coming to the rampart.” There’s no more efficient way to boost exports and execute trade wars than jawboning the local currency lower. All this together really struck home for currency traders.
So the US Dollar Index plunged 1.0% on Wednesday following those comments, hitting its worst levels in 3.1 years. Incidentally this past year’s dollar weakness shouldn’t have surprised anyone. Back in late December 2016 when dollar euphoria reigned as the USDX traded at a 14.0-year secular high, I wrote an essay on the unsustainability of those extremes. I warned of “a major topping underway” before a new bear.
With the USDX failing below 90 on those Mnuchin and Ross comments, speculators started flooding into gold futures. After closing near $1341 in US trading Tuesday, gold surged as high as $1352 in overnight action. Those gains extended in the US on Wednesday, with gold blasting up 1.3% to $1358. That was a very important level technically and psychologically, confirming gold’s forgotten bull market is alive and well.
This chart looks at this young gold bull superimposed over speculators’ collective positions in both long and short gold-futures contracts. The Fed’s five rate hikes of this tightening cycle are also highlighted, showing how bullish they’ve proven for gold. This week’s $1358 gold levels are a major upleg breakout, and right on the verge of being a major bull-market breakout. Investors will certainly take notice of this.
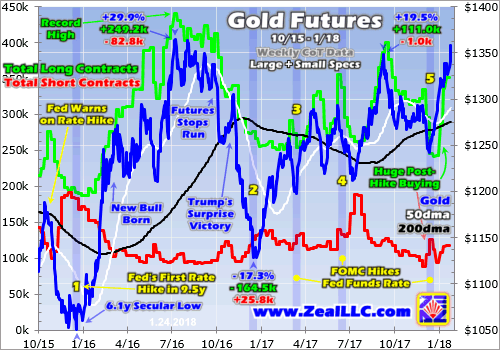
Gold’s bull was born in despair in December 2015 the day after the Fed’s first rate hike in 9.5 years. The gold-futures speculators had freaked out leading into that FOMC meeting, fleeing longs while rushing to add shorts. That hammered gold to a 6.1-year secular low. Just a few trading days before that hike when gold was despised, I published deep research showing how gold thrived during past Fed-rate-hike cycles.
Futures speculators were betting the other way, expecting gold to collapse once the Fed ended ZIRP. It didn’t take them long to realize the error in their ways though, as they quickly started buying to cover their excessive shorts while flooding into new longs with a vengeance. So gold soared 29.9% higher over the next 6.7 months, well exceeding the +20% new-bull threshold! That initial bull upleg peaked at $1365 in July 2016.
After such a blistering run, gold needed to take a breather and consolidated high for over a quarter. But that rolled over into a severe correction on two separate events. First gold-futures stops were run which blasted this metal back down to its 200-day moving average. After that gold bounced sharply, but that was truncated by Trump’s surprise election win in early November 2016. That unleashed epic Trumphoria.
Stock markets surged on hopes for big tax cuts soon from the newly-Republican-controlled government. That led futures speculators and investors alike to flee gold, crushing it sharply lower. By mid-December 2016 the day after the Fed’s second rate hike of this cycle, gold had plunged 17.3% to $1128. That was not a new bear though, as it fell shy of the necessary 20% loss. But psychologically it may as well have been!
That exceedingly-anomalous gold plunge in late 2016 mostly driven by the post-election stock-market surge wreaked tremendous sentiment damage. The investors who started getting excited about gold in the first half of 2016 abandoned it, assuming that sharp rally was a flash in the pan. And with the stock markets powering relentlessly higher all throughout 2017 on taxphoria, gold receded into the market shadows.
A couple weeks ago I wrote an essay delving into the selloff dynamics between stock markets and gold. Gold is a unique asset that tends to rally when stock markets sell off materially, making it the ultimate portfolio diversifier. Thus investors tend to view it as the anti-stock trade. It was actually the last stock-market correction in early 2016 that fueled gold’s powerful upleg early that year. Stocks greatly affect gold.
While gold can still rally when stock markets happen to be climbing, investors simply feel no need to diversify their stock-heavy portfolios. So they largely forget gold. Thus gold sentiment for much of 2017 remained nearly as bearish as at those deep late-2016 lows. Investors remembered gold spiraling lower after the election, and that continued to shape their opinions and outlooks on gold regardless of price action.
Gold actually fared really well in 2017 considering the extreme stock-market rally. Last year gold still powered 13.2% higher, very impressive considering the concurrent huge 19.4% S&P 500 surge! This gold bull’s second upleg enjoyed a 19.5% gain over 8.7 months leading into early September. Gold was able to peak at $1348 before that upleg failed after stock markets surged again following a new wave of taxphoria.
Even though gold never entered a bear market, that interim-high level was problematic for sentiment. While close, September 2017’s $1348 remained decisively below July 2016’s $1365. For key technical levels I consider decisive to be 1% beyond the previous extreme. So even though a 19.5% gold upleg is nothing to sneeze at, especially in extremely-euphoric stock markets, it wasn’t enough to change psychology.
Without a new bull-market high, gold stayed out of the financial-news headlines. The investors that had fled this leading alternative investment in the wake of Trump’s election win saw nothing to get gold back on their radars. The legions of gold bears could argue that the secondary lower top confirmed gold was in a downtrend. Technical analysis is something of a Rorschach test, often reflecting analysts’ own biases.
That gold bearishness really intensified heading into this latest Fed rate hike in December 2017. As that month dawned, it had been 16.8 months since gold’s initial bull-market high. Gold’s chance to break out a few months earlier had failed. So as you can see above, gold-futures speculators fled in terror from long positions while also ramping shorts. This latest gold-futures liquidation hit all-time record highs.
Gold-futures speculators’ collective positions are reported once a week in the CFTC’s Commitments of Traders reports. They are current to each Tuesday. In the CoT week ending December 12th on the eve of the Fed’s fifth rate hike of this cycle, speculators dumped an astounding 49.9k long contracts while adding 20.5k new short ones! That was the largest selling on record out of 989 CoT weeks since early 1999!
These traders’ collective bets had run to such hyper-bearish extremes that they had to mean revert after whatever the FOMC did in mid-December. And that has indeed happened. But as long as gold prices just meander within that giant trading range established in the first half of 2016, it will be difficult to shift psychology back to bullish. This week’s strong gold surge on that dollar weakness is starting to change that.
Gold’s $1358 close in US trading Wednesday was 0.7% above its early-September peak. While not quite at that 1%+ threshold for a decisive breakout yet, this is still a major higher high. Gold has been carving higher lows periodically ever since late 2016 when that post-election selloff exhausted itself. But higher lows don’t spark excitement outside of existing gold investors, higher highs are necessary for that.
Gold needs to close over $1361 to see a decisive breakout above the last upleg’s peak. It has traded above that level intraday in both Asian and American trading since Wednesday’s close. It’s only a matter of time until $1361+ sticks on a closing basis. That’s going to finally confirm higher highs to go along with the past 13.3 months’ higher lows. But the real prize remains a decisive breakout to new bull highs.
The new gold bull again peaked at $1365 in early July 2016 within a couple weeks of the UK’s Brexit vote. That unexpected outcome of the British people voting to take back their sovereignty from the unaccountable European Union bureaucrats was such a shock to the markets that major central banks rushed to declare they were ready to print money if necessary. Stocks rallied sharply on hopes for more easing.
The S&P 500 had been drifting sideways to lower without a single new bull-market high for 13.7 months before that. Gold $1365 in July 2016 happened the very trading day before the S&P 500 finally climbed to its first new record high. With stock markets apparently off to the races again, gold demand waned as investors weren’t interested in diversifying. A single close above $1365 will finally confirm gold’s bull persists!
But if gold just touches those bull-to-date highs and fades, bearish technical analysts can easily dismiss it as a double or triple top. In order for gold to garner financial-media attention and attract investors’ gazes back to it, a decisively 1%+ breakout is necessary. That happens at $1379. Gold is so close to a major upside breakout to new bull highs, which will conclusively prove to all investors its current bull market still lives.
That will really start shifting psychology away from the overwhelmingly-bearish levels it’s been stuck at since late 2016. In a normal year gold’s strong 2017 rally would’ve gone a long way to restore bullish sentiment. But again gold was overshadowed last year by the extreme stock-market surge, which stole all the limelight. The blind spot investors harbor for gold will start fading when new bull-market highs are seen.
The exact timing is unknowable and not really important. Gold could power over $1379 within days, or it might take weeks. Investment gold buying will flare again really boosting gold once these extremely-euphoric mania-blowoff stock markets finally roll over. Stock selloffs are great for gold, and even a minor one will easily catapult it to decisive new bull highs. That will dispel the fog of bearishness plaguing gold.
$1400+ gold may seem high after a multi-year bear market followed by a couple years of drifting low in this stock-market-surge-interrupted bull market, but it’s really not. Gold first climbed above $1400 in November 2010 and largely stayed there until June 2013. Over that 2.6-year span gold averaged $1595! And it went as high as $1894 in August 2011. Gold is nowhere near historical extremes, still relatively low.
At best gold’s young bull was only up 29.9% over 6.7 months by mid-2016. That’s trivial as far as gold bulls go, a rounding error. During gold’s last secular bull between April 2001 to August 2011, gold soared 638.2% higher in 10.4 years! Today’s young gold bull would still be tiny even if it saw gold doubled, taking it to $2102. That would still be well below gold’s inflation-adjusted real high from January 1980.
As I’ve been arguing continuously since late 2016, this young gold bull ain’t over yet! Major central banks around the world have conjured many trillions of dollars out of thin air which have levitated world stock markets. That really depressed gold demand. But once these QE-bloated markets inevitably roll over on this year’s new Fed and ECB tightening, a record flood of flight capital will likely seek the ultimate hedge of gold.
Investors can play gold’s ongoing mean-reversion bull in physical gold bullion or the leading GLD SPDR Gold Shares gold ETF. But the coming gold gains will be really amplified by the gold miners’ stocks. As gold rises, gold miners’ profits grow much faster. Thus major gold-stock prices usually leverage gold’s upside by 2x to 3x. Smaller gold miners can double that again. Gold stocks yield life-changing gains in gold bulls.
In essentially the same span of that last gold bull ending in late 2011, the HUI gold-stock index rocketed 1664.4% higher! Last week I wrote an essay explaining why the parallel flagship GDX VanEck Vectors Gold Miners ETF was on the verge of a major $25 upside breakout on strong earnings potential. There’s no doubt investors will flood into gold stocks as gold psychology changes, ultimately driving incredible gains.
While every investor needs to have a 5%-to-10%+ portfolio allocation to gold for diversification purposes, great gold stocks should be added on top of that. The beaten-down and left-for-dead gold miners’ stocks are deeply undervalued today with gold still out of favor. This is the only sector in all the stock markets likely to power much higher when everything else heads lower. Great gold stocks are essential to own today!
At Zeal we’ve literally spent tens of thousands of hours researching individual gold stocks and markets, so we can better decide what to trade and when. As of the end of Q4, this has resulted in 983 stock trades recommended in real-time to our newsletter subscribers since 2001. Fighting the crowd to buy low and sell high is very profitable, as all these trades averaged stellar annualized realized gains of +20.2%!
The key to this success is staying informed and being contrarian. That means buying low before others figure it out, before gold’s bull-market breakout becomes apparent. An easy way to keep abreast is through our acclaimed weekly and monthly newsletters. They draw on my vast experience, knowledge, wisdom, and ongoing research to explain what’s going on in the markets, why, and how to trade them with specific stocks. For only $12 per issue, you can learn to think, trade, and thrive like contrarians. Subscribe today, and get deployed in the great gold and silver stocks in our full trading books!
The bottom line is this gold bull’s third upleg is breaking out. This week gold closed above the peak from its second upleg, and is close to a decisive breakout. That puts gold within spitting distance of its bull-to-date high of $1365 from July 2016. Once gold powers decisively above those levels, it will confirm to all that gold’s bull is very much alive and well. That will work wonders to shift psychology back to bullish again.
Impressively gold is doing all this with stock markets still at mania-blowoff record highs. Gold investment demand explodes once stock markets roll over, which is what ignited and fueled this gold bull’s strong initial upleg in early 2016. So when the long-overdue and inevitable material stock-market selling finally arrives, gold’s advance will really accelerate. Get long before this major bull-market breakout changes everything!
Adam Hamilton, CPA
January 26, 2018
Copyright 2000 – 2018 Zeal LLC (www.ZealLLC.com)
The world’s leading gold-stock ETF is nearing a major upside breakout from key technical levels. GDX is getting closer to challenging and powering above $25. That would accelerate the sentiment shift in this deeply-undervalued sector back to bullish, enticing investors to return. Good operating results from the major gold miners in their upcoming Q4’17 earnings season could prove the catalyst to fuel this GDX $25 breakout.
The classic way to measure gold-stock-sector price action is with the HUI NYSE Arca Gold BUGS Index. But the HUI benchmark is being increasingly usurped by the GDX VanEck Vectors Gold Miners ETF as the gold-stock metric of choice. GDX is used far more often than the HUI in gold-stock analyses these days, both online and on financial television. I haven’t seen the HUI mentioned on CNBC for years now.
GDX does have major advantages over the HUI. Most importantly it is readily tradable as an ETF and with options. GDX’s component stocks and their weightings are also regularly updated by elite gold-stock analysts, keeping it current. The HUI is rarely if ever updated to reflect company-specific changes in the ranks of the world’s top gold miners. GDX is dynamic where the HUI is effectively static and outdated.
GDX also has limitations as a gold-stock metric though. It was only born in May 2006, so that’s the limit of its price history available for analysis. And because its managers are paid 0.51% of its assets each year to maintain this ETF, GDX is not as pure of measure of gold-stock performance as a normal index. Over a decade that adds up to a substantial 5% difference. Nevertheless GDX’s popularity continues to grow.
This week GDX had $7.7b in assets under management, dwarfing its direct competitors. That was 21x larger than the next-biggest 1x-long major-gold-stock ETF! GDX’s sister GDXJ Junior Gold Miners ETF weighed in at $4.7b, but that generally includes smaller gold miners. GDX is the undisputed king of the gold-stock ETFs. As a contrarian speculator, I watch GDX’s price action in real-time all day every day.
For an entire year now, GDX has meandered in a relatively-tight trading range between $21 to $25. As gold stocks periodically fell even deeper out of favor, this ETF slumped down near $21 lower support. Then as they inevitably rallied back out of those lows, GDX climbed back up near $25 resistance. That made for a roughly-20% gold-stock price range, certainly narrow by this sector’s standards and tough to trade.
This GDX chart over the past couple years or so highlights 2017’s gold-stock consolidation. With this unloved sector neither rallying nor falling enough to get interesting, investors mostly abandoned it over the past year. So gold stocks largely drifted sideways on balance, which certainly proved vexing for the few remaining contrarian speculators and investors. A GDX $25 breakout would greatly improve psychology.
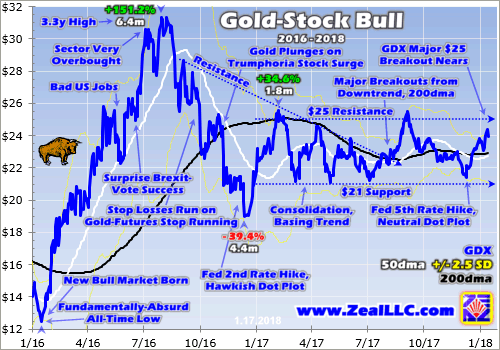
Last year’s gold-stock performance per GDX was very poor. This ETF’s price climbed 11.1% in 2017, which is better than a kick in the teeth. But gold’s impressive 13.2% gain last year well outpaced the gold stocks’ performance. Normally the major gold miners’ stocks amplify gold advances by 2x to 3x, so GDX should’ve powered 26% to 40% higher in 2017. Gold stocks are only worthwhile if they outperform gold.
That’s because gold miners face many additional operational, geological, and geopolitical risks compared to just owning gold outright. So if the gold stocks don’t outperform gold, they simply aren’t worth owning. Seeing them lag the metal which drives their profits for essentially an entire year is extremely anomalous. It’s a reflection of the entire global markets proving extremely anomalous in 2017, an exceedingly-weird year.
Gold stocks normally perform much more like 2016 than 2017. A couple years ago GDX rocketed 52.5% higher in one of the best major-sector-ETF performances in all the stock markets. That greatly amplified 2016’s underlying 8.5% gold advance by 6.2x. All those gains rapidly accrued in that year’s first half, as GDX skyrocketed 151.2% higher in 6.4 months on a parallel 29.9% gold upleg! Gold stocks can really move.
But last year as extreme record-high stock markets and the even-more-extreme bitcoin popular speculative mania stole the spotlight from gold, gold stocks were largely left for dead. Speculators and investors alike wanted nothing to do with classic alternative investments when everything else proved much more exciting. Thus GDX hasn’t been able to decisively break out above its $25 upper resistance, despite trying.
GDX did power 34.6% higher in 1.8 months early last year, peaking on a closing basis at $25.57 in early February 2017. But that rally fizzled with gold’s when stock markets started surging to new records on hopes for big tax cuts soon from the newly-Republican-controlled US government. By early March GDX had retreated back down to $21.14, right at its $21 support line. At least that held strong throughout 2017.
The gold stocks soon rebounded into another rally, but that topped at $24.57 in GDX terms in mid-April. Again gold had stalled out amidst epic general-stock euphoria. Gold is the key to gold-stock fortunes, as traders only think about the gold miners when gold itself catches their attention. GDX was repelled right at its 200-day moving average, which can prove both major support or resistance depending on market direction.
By early May GDX was right back down to $21.10 again, increasingly establishing the clear consolidation trend seen in this chart. The gold stocks couldn’t rally significantly heading into their summer-doldrums lull, and GDX was soon right back down to $21.21 in early July. That very day I published an essay on gold stocks’ summer bottom, predicting a new upleg once those usual weak summer seasonals passed.
And that indeed happened, with GDX rebounding and then accelerating to power 20.2% higher to $25.49 by early September. That was right at its early-February peak, a critical level technically to see a major upside breakout. But once again gold didn’t cooperate, selling off sharply as general stock markets yet again blasted to another series of record highs on renewed hopes for big tax cuts soon. Taxphoria was huge!
Thus the gold stocks slumped again, falling back down near GDX’s strong $21 support as this ETF hit $21.42 on close in mid-December. That was the day before the Federal Reserve’s fifth rate hike of this cycle, so gold-futures speculators were scared. They irrationally fear Fed rate hikes are bearish for gold, even though history has long proven just the opposite. Gold and gold stocks surged after that hike as I predicted.
From the day before that latest FOMC meeting to this week, GDX rallied 13.8% to $24.37. Wednesday morning when I decided to pen this essay, GDX was nearing $24.50. So the long-awaited decisive $25 breakout is in easy reach. Gold stocks are a volatile sector, with 3%+ daily swings in prices relatively common. So all it will take to propel GDX above its $25 resistance is a few solid-to-strong sector up days.
The upcoming Q4’17 earnings season for the major gold miners in the next few weeks could prove the catalyst to spark serious gold-stock buying. Because gold stocks are so deeply out of favor, the small fraction of traders that even think about them assume they are struggling operationally. Throughout all the markets, traders wrongly attribute prices stretched to anomalous levels by extreme herd sentiment to fundamentals.
A month ago bitcoin skyrocketed near $20k as many traders believed such extremes were fundamentally righteous due to the underlying blockchain technology. Yet it was a popular speculative mania, extreme greed sucking people in. In early December I warned “Once this mania bitcoin bubble bursts, and it will, the odds are very high that bitcoin will lose 50% to 75% of its value within a few months on the outside!”
This week just over a month later bitcoin has indeed been cut in half, falling to $9k intraday. Extreme prices are the result of irrational and ephemeral herd sentiment, not fundamentals. Gold stocks are now stuck on the other end of the psychology spectrum, plagued with extreme fear. Since their prices have been so weak, traders think poor fundamentals must be the reason. But that’s simply not true at all.
As a contrarian speculator and market-newsletter writer for the past couple decades, few people are more deeply immersed in the gold-stock realm than me. Every quarter just after earnings season I dive into the actual operating and financial results of the major GDX gold miners. I’m eagerly looking forward to doing that again with their new Q4’17 results, which will be reported between late January and mid-February.
So now the latest quarterly results available from the major gold miners are Q3’17’s. I explored them for the top 34 GDX gold miners, representing almost 92% of its total holdings, back in mid-November. In Q3’17 these elite gold miners reported average all-in sustaining costs of $868 per ounce. That’s what it costs them not only to produce gold, but to explore for more and build new mines to maintain production levels.
Q3’17’s average gold price was $1279, which means the major gold miners were collectively earning profits around $411 per ounce. That made for hefty 32% profit margins, revealing an industry actually thriving fundamentally instead of struggling as herd-sentiment-blinded traders wrongly assume. Gold miners make such excellent investments because their mining costs generally don’t follow gold prices.
Gold-mining costs are essentially fixed during mine-planning stages, when engineers and geologists work to decide which ore to mine, how to dig to it, and how to process it. Once mines’ necessary infrastructure is built, their actual mining costs don’t change much. Quarter after quarter generally the same levels of equipment, employees, and supplies are needed to mine gold. So all-in sustaining costs hold pretty steady.
In the four quarters leading into Q3’17, the top-34 GDX gold miners’ all-in sustaining costs averaged $855, $875, $878, and $867. That works out to an annual average of $869, virtually identical to Q3’17’s $868 per ounce. Those flat AISCs happened despite the gold price varying greatly in that five-quarter span, with this metal slumping as low as $1128 and surging as high as $1365. Gold-mining costs are static.
So as long as prevailing gold prices remain well above all-in sustaining costs, mining gold remains very profitable and spins out big positive operating cashflows. And relatively-flat mining costs generate big gold-miner profits leverage to gold. These core fundamental truths about gold-mining stocks are what could help their upcoming Q4’17 results ignite the buying necessary to propel GDX above $25 for a major breakout.
These new Q4 results aren’t going to be spectacular, as gold’s $1276 average price last quarter was just under Q3’s $1279 average. But assuming flat all-in sustaining costs as usual, $868 in Q4 would still yield fat profit margins of $408 per ounce. That too is virtually unchanged from Q3’s $411. So the major gold miners as a sector shouldn’t see collective downside surprises in earnings in Q4, avoiding damaging sentiment.
It’s not the Q4’17 results that should spark major gold-stock buying, but their implications for the current Q1’18 quarter. While Q1 is young, gold is averaging nearly $1323 so far as of the middle of this week. That is already 3.6% above Q4’s average, which is a big move higher. If these gold levels hold and the major gold miners’ all-in sustaining costs hold, they are looking at Q1’18 profits way up at $455 per ounce!
That’s a whopping 11.5% higher quarter-on-quarter! Not many if any sectors in all the stock markets can even hope for such massive earnings gains. And if gold continues powering higher in the coming months in a major new upleg, Q1’s average gold price will be pulled higher accordingly. That means even larger major-gold-miner profits growth. These super-bullish prospects ought to rekindle material gold-stock demand.
Investors usually buy stocks not because of current earnings, but because of what they expect profits to do over the coming year or so. Rising gold prices coupled with flat costs give gold-mining profits growth in 2018 some of the greatest upside potential in the entire stock markets. Institutional investors should take notice of this as Q4’17 results are released, leading to funds upping their tiny allocations to gold stocks.
On top of that January tends to be a big news month for the gold miners, as many publish their cost and production outlooks for the new year. These reports tend to be bullish on balance, with the major gold miners forecasting higher production and lower costs tending to garner the most attention. So there’s good odds of positive newsflow over the coming weeks as well, drawing investors’ focus back to gold stocks.
All this shows why the gold miners’ stocks have usually enjoyed strong seasonal rallies in January and most of February. So GDX now has its best chance in a year of decisively breaking out above $25 in the coming weeks. That would work wonders for bearish gold-stock psychology. The more gold stocks rally, the better herd sentiment, and the more traders want to buy them. And GDX’s potential upside is huge.
This last chart encompasses nearly all of GDX’s entire history going back to early 2007, a half-year after it was birthed. Gold stocks remain wildly undervalued today, so GDX $25 and even its $31.32 seen at gold stocks’ latest major interim high in early August 2016 are super-low in longer-term context. GDX is actually still down near stock-panic levels, highlighting vast upside as gold stocks inevitably mean revert higher.
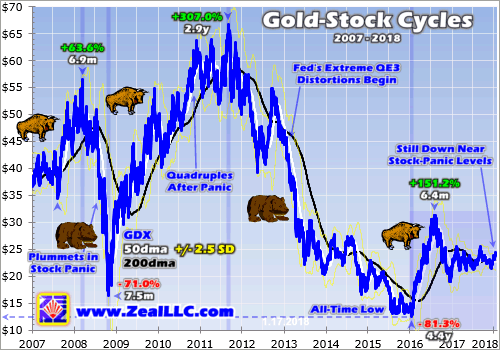
The shaded area in the lower right encompasses the last couple years. Despite GDX seeing one heck of a bull-spawning upleg in early 2016, the gold stocks remain very low. GDX itself actually hit an all-time low in January 2016. The gold stocks were trading at fundamentally-absurd prices as I pointed out that very week. That extreme anomaly was the product of fleeting herd sentiment, it had nothing to do with fundamentals.
So far in young 2018, GDX is averaging $23.66 on close. That’s actually worse than Q4’08’s $25.13, which was during the most-extreme market-fear event of our lifetimes. For the first time since 1907, the general stock markets suffered a full-blown panic in late 2008. Everything else including gold and its miners’ stocks were sucked into that epic maelstrom of fear. Traders were terrified, fleeing in horror from everything.
So GDX plummeted as low as $16.37 in late-October 2008, climaxing a devastating 71.0% drop in just 7.5 months. In that panic quarter of Q4’08, gold averaged just $797. While industry costs were lower then, the major gold miners were still earning much less in both profit-margin and absolute terms than they are today. Yet the average GDX share price was much higher in Q4’08 than it’s been over the past year!
The fact GDX could trade around $25.13 during a stock-panic quarter with $797 gold highlights the sheer madness of today’s gold-stock prices. Since 2017 dawned, GDX has averaged just $22.99 with $1261 average gold levels. Seeing gold-stock prices 8.5% lower despite strong profits and average gold prices being a whopping 58.2% higher makes zero sense! The gold stocks have to mean revert far higher from here.
That’s what happened after the extreme pricing anomalies of that late-2008 stock panic too. Over the next 2.9 years, GDX more than quadrupled with a 307.0% gain! Another proportional mean-reversion bull out of early 2016’s all-time GDX low would catapult this ETF back up near $51. That’s still more than another double from today’s levels. And with gold mining so profitable, this new bull’s gains should be far larger.
While investors and speculators alike can certainly play gold stocks’ powerful coming upleg with major ETFs like GDX, the best gains by far will be won in individual gold stocks with superior fundamentals. Their upside will far exceed the ETFs, which are burdened by over-diversification and underperforming gold stocks. A carefully-handpicked portfolio of elite gold and silver miners will generate much-greater wealth creation.
At Zeal we’ve literally spent tens of thousands of hours researching individual gold stocks and markets, so we can better decide what to trade and when. As of the end of Q4, this has resulted in 983 stock trades recommended in real-time to our newsletter subscribers since 2001. Fighting the crowd to buy low and sell high is very profitable, as all these trades averaged stellar annualized realized gains of +20.2%!
The key to this success is staying informed and being contrarian. That means buying low before others figure it out, before undervalued gold stocks soar much higher. An easy way to keep abreast is through our acclaimed weekly and monthly newsletters. They draw on my vast experience, knowledge, wisdom, and ongoing research to explain what’s going on in the markets, why, and how to trade them with specific stocks. For only $12 per issue, you can learn to think, trade, and thrive like contrarians. Subscribe today, and get deployed in the great gold and silver stocks in our full trading books!
The bottom line is the leading GDX gold-stock ETF looks to be on the verge of a major breakout. The upcoming Q4’17 results from the major gold miners along with Q1’s higher prevailing gold prices ought to catch investors’ attention. The gold miners should prove very profitable in Q4, with prospects for big and fast earnings growth in Q1 and all of 2018 as gold powers higher. This should help GDX get bid well over $25.
Once gold stocks power decisively above that vexing upper resistance level of the past year, the shift in trader psychology back to bullish will really accelerate. Gold stocks should enjoy relatively-large capital inflows from institutional investors looking for undervalued sectors in an extremely-overvalued stock market. The forgotten gold miners’ stocks have a good chance to outperform everything again this year like in 2016.
Adam Hamilton, CPA
January 19, 2018
Copyright 2000 – 2018 Zeal LLC (www.ZealLLC.com)

The stock markets have rocketed higher since Trump’s election win on hopes for big corporate tax cuts. This extreme rally has left stocks exceedingly overvalued and overbought today. A major selloff is long overdue and likely imminent. When stocks inevitably roll over and mean revert lower to rebalance away euphoric sentiment, gold is the main beneficiary. Gold investment demand soars when stocks materially slide.
Two trading days before the November 2016 presidential election, I published an essay that explored how stock-market action leading into elections really sways their results. Its conclusion based on long market history was “The stock markets overwhelmingly and conclusively predict Donald Trump will win!” That was a hardcore contrarian stance before Election Day, when such an upset seemed impossible to most.
Since Americans voted for our next president, the flagship S&P 500 broad-market stock index (SPX) has soared 28.6% higher in 14.0 months! That extraordinary rally was mostly driven by hopes for big tax cuts soon with Republicans newly controlling the US government. And they indeed delivered last month with a massive corporate tax cut. That sets up a classic buy-the-rumor-sell-the-news scenario for these record markets.
Ever since that election, Wall Street has argued that stocks are surging due to strong corporate-profits growth. But that’s not true according to hard valuation data. In late October 2016 just before Americans voted, the 500 companies of the SPX averaged trailing-twelve-month price-to-earnings ratios of 26.3x. Even before Trump won, stocks were already very expensive and nearing dangerous bubble territory.
For the past century and a quarter, average broad-market TTM P/E ratios have run 14x earnings. That’s fair value for stock markets, and twice that at 28x is formally bubble territory. Rather ironically during his campaign, Trump often warned about the stock-market bubble created by the Fed! While he loves these same stock markets now, they are a lot more expensive after this past year’s massive taxphoria-fueled rally.
2017 indeed proved a strong year for corporate profits as optimistic Americans spent money fast. Yet at the end of December a couple weeks ago, the elite SPX companies were averaging a TTM P/E way up at 30.7x! That’s well into bubble territory, and history has proven stock markets never fare well for long after valuations are bid up to such unsustainable extremes. That guarantees a major stock selloff looms.
Over roughly the same post-election span where the SPX blasted up 28.6%, SPX valuations rose 16.8%. That means about 6/10ths of the rally was driven by multiple expansion, higher valuations. Only 4/10ths can be attributable to rising corporate earnings, and even that is suspect. The economic optimism that was unleashed by the Republican sweep was huge, driving big spending. But that anomaly won’t last for long.
And the Republicans’ corporate tax cuts won’t magically rescue stocks. While good news for the US economy, they won’t do enough to work off today’s extreme bubble valuations. Wall Street estimates are generally for 10% corporate-profits growth this year due to lower taxes. That would merely push the SPX P/E back to 27.6x, near-bubble levels. Stocks are now way too expensive for corporate tax cuts to help much!
As the stock markets surged into the tax-reform bill’s actual passage in recent months, contrarian traders assumed any stock selling was being delayed. Why realize big capital gains in 2017 if tax rates might be significantly lower in 2018? But the stock markets have blasted even higher so far in January, with no meaningful selling yet materializing. That has left the SPX extremely overbought technically, a bearish omen.
In the first 4 trading days of 2018, the SPX surged another 2.6% higher. That’s truly an extreme rate of ascent by any standard. There are about 250 trading days per year, so annualize out these early-year gains and the SPX is skyrocketing at a 163% yearly rate! Obviously there’s zero chance 2018 could see such absurd gains. Ominously such a fast climb looks parabolic for a stock index as enormous as the SPX.
In late December the collective market capitalization of those 500 SPX companies was $24.4t. Such a vast number gives the stock markets great inertia. So a parabolic surge in the general stock markets will always be relatively muted. Unlike vastly-smaller assets like bitcoin, stock markets are far too large to catapult higher in the terminal phases of bull markets. The SPX’s early-2018 action has truly been extreme.
The stock markets are now dangerously overbought, implying a major selloff is probable and imminent. Overboughtness happens when stock markets surge too far too fast to be sustainable. There are many ways to measure overboughtness, but one of the best is looking at price levels relative to their own key moving averages. Well over a decade ago I developed Relativity Trading to empirically define this state.
200-day moving averages are probably the best price baselines over time, striking an excellent balance between filtering out daily noise and following long-term trends in force. A construct I call the Relative SPX looks at this dominant stock index as a multiple of its 200dma. It is simply calculated by dividing the SPX by its underlying 200dma each day. Charting the results over time yields illuminating trading insights.
In any trending market, prices tend to meander in well-defined ranges relative to their 200dmas. When they stretch too far above their 200dmas by their own historical standards, sharp selloffs soon follow to restore normalcy and rebalance sentiment. This chart superimposes the SPX itself in blue over the rSPX in red, highlighting the extreme overboughtness in the stock markets after early January’s euphoric surge.
The Relative SPX effectively flattens the SPX’s black 200dma line at 1.00x, and shows where the SPX is trading relative to that 200dma in perfectly-comparable percentage terms over time. As of this week, the rSPX soared as high as 1.103x! In other words, the mighty S&P 500 was stretched 10.3% above its key 200dma. Such extremes are very unusual and never sustainable for long, signaling major selloffs looming.
Relativity Trading looks at the past five calendar years’ trading action to define a relative range. For the SPX that now runs from 0.94x to 1.08x. When the SPX falls down near or under 94% of its 200dma, it’s very oversold so a major rally is very likely soon. But when the SPX climbs up near or over 108% of its 200dma, it’s very overbought heralding an imminent major selloff. Such fast price rises simply can’t persist.
This week’s rSPX levels hit a 4.4-year high, which might not sound too extreme. But other things need to be taken into consideration when high rSPX levels are reached. The trajectory of the 200dma is one of the most important. While 200dmas mostly rise in bull markets, that’s not always the case. Early in young bull markets 200dmas are still falling from the preceding bears. 200dmas can also drift lower in major corrections.
The last SPX corrections erupted in mid-2015 and early 2016, when the stock markets fell 12.4% in 3.2 months followed by another 13.3% in 3.3 months. A correction is technically a 10%+ SPX selloff. That pushed SPX levels low enough for long enough to drag its 200dma lower for the better part of several quarters. When stocks started rallying again, the rSPX shot to high levels before the 200dma fully turned higher.
Most rSPX extremes are seen early in bull markets or after corrections when stock prices surge higher before a declining or flat 200dma has time to catch up. But that certainly isn’t the case this year. The SPX’s 200dma has been rising sharply ever since Trump won the election in November 2016. Today’s rSPX extreme is much worse than it sounds because it’s coming from a high 200dma after a powerful rally!
Normal healthy bull markets see corrections once a year or so, when prices fall back to their 200dmas to work off greed and restore sentiment balance. Today’s SPX would have to drop more than 10% just to revisit its 200dma, a major selloff by recent standards. It’s been 1.9 years since the end of the SPX’s last correction, so the next one is long overdue. Extremely-overbought conditions like today help birth major corrections.
Considering how far and fast stock markets have rallied, how euphoric and complacent traders are today, and how extremely expensive today’s bubble-valued stock markets are, it’s hard to imagine the overdue and coming major selloff not at least testing the upper limits of corrections. That portends a selloff that nears 20%, which is probably the best-case scenario for the bulls. Anything beyond 20% is a new bear market.
And unfortunately that new-bear scenario is far more likely. As of this week this SPX bull has rocketed up an extreme 306.7% in 8.8 years, making for the third-largest and second-longest stock bull in all of US history! Much of those gains were fueled by epic central-bank easing far beyond anything ever before seen in world history. This year both the Federal Reserve and European Central Bank are slamming on the brakes.
The Fed just started its first-ever quantitative-tightening campaign in Q4’17 to unwind years and trillions of dollars of quantitative easing. QT is going to gradually ramp up in 2018 to a powerful $50b-per-month pace starting in Q4 this year. Per the Fed’s schedule, it will effectively destroy $420b of capital in 2018 by letting QE-purchased bonds roll off its balance sheet. Nothing remotely close has ever happened before!
On top of that the ECB just slashed in half its own QE campaign this month to a €30b monthly pace, with a targeted QE end date of September. That means ECB QE will collapse from €720b in 2017 to just €270b in 2018, a radical 5/8ths plunge. Between the Fed’s QT and ECB’s QE tapering, there will be the equivalent of $950b more tightening and less easing in 2018 compared to 2017! That’s going to leave a mark.
The Fed and ECB will literally strangle this stock bull by unwinding and slowing the QE that grew it. And this isn’t just a 2018 thing. In 2019 the Fed and ECB are on track to have another $1450b of tightening compared to 2017. So these stock markets are in real trouble with central-bank liquidity being pulled regardless of their extreme overvaluations and overboughtness. 2018 sure ain’t gonna look like 2017 at all!
Bear markets ultimately tend to cut stock prices in half, literal 50% losses in the SPX. The last couple bears that started in early 2000 and late 2007 saw the SPX drop 49.1% in 2.6 years and 56.8% in 1.4 years! Bear markets are exceedingly dangerous and not to be trifled with. They also tend to grow in size in proportion to their preceding bulls, so the next bear should be bigger than usual after such a massive bull.
A major stock selloff imminent, whether a serious correction or new bear, certainly sounds like bad news for investors. But like everything else in the markets, it offers huge opportunities to profit for contrarians who see it coming and prepare. A great Bible verse that applies to the inexorable stock-market cycles is Proverbs 27:12, “The prudent see danger and take refuge, but the simple keep going and pay the penalty.”
When stock markets start materially weakening, investors return to gold. Gold is the ultimate portfolio diversifier because it tends to move counter to stock markets. Gold is forgotten when stock markets are high and euphoria and complacency abound. But once major selloffs inevitably follow major rallies, gold demand explodes as investors rush to diversify their stock-heavy portfolios. Gold is effectively the anti-stock trade.
As you’d imagine with today’s taxphoria-crazed stock markets, gold investment is really low. One metric to approximate stock investors’ capital deployed in gold is the ratio between the SPX’s market cap and the value of the leading GLD SPDR Gold Shares gold ETF. At the end of December, those 500 elite SPX companies were collectively worth $24,432.5b. That dwarfs the meager capital now deployed in GLD shares.
GLD exited 2017 holding 837.5 metric tons of physical gold bullion in trust for its shareholders. That was worth just $35.1b at $1302 gold. That means only 0.14% of the stock-market capital invested in the SPX companies is invested in the world’s leading gold ETF. I’ve studied the history of this ratio, and it is usually much higher. From 2009 to 2012 for example, GLD holdings’ value averaged 0.48% of SPX market cap.
So there’s no doubt today’s stock investors are radically underinvested in gold. They couldn’t care less about it when stocks apparently do nothing but rally indefinitely. But once the next major stock selloff arrives, gold investment will quickly return to favor. This chart looks at the SPX and gold over the past few years. The last major stock-market correction was actually the catalyst that birthed today’s gold bull!
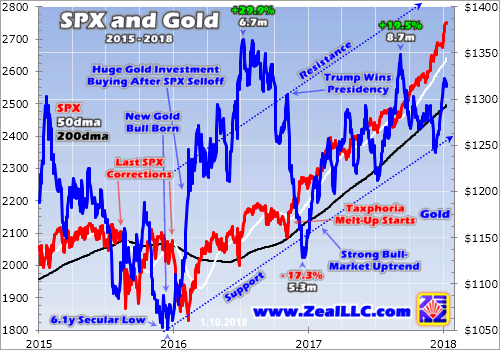
Mid-2015 was similar to late 2017 in stock-market terms. The SPX was relentlessly powering to endless new record highs while volatility was exceptionally low. Like today, stock traders were excessively bullish and hyper-complacent. It had been a near-record 3.6 years since the last correction, so people foolishly assumed stock-market cycles had vanished. Yet not even extreme central-bank easing can eliminate cycles.
That’s because they are ultimately fueled by the herd behavior of greedy and fearful humans. As long as these powerful warring emotions drive collective trading decisions, stock-market cycles will persist. Gold was despised in that record-stock-market environment, ultimately slumping to a deep 6.1-year secular low late that year. Gold-futures speculators were deeply afraid of the Fed’s coming first rate hike of this cycle.
But when the stock markets finally started falling again, triggered by sharp selloffs in the Chinese stock markets, gold rocketed higher. Stock investors watching their portfolios bleed rushed to get back some gold exposure to mitigate the stock losses. They flooded back into gold with a vengeance, catapulting it 29.9% higher in just 6.7 months in essentially the first half of 2016. That gold-bull uptrend continues today.
In Q4’15 when gold was largely forgotten and despised, GLD’s holdings fell 45.0 metric tons or 6.6%. But in Q1’16 after stock markets corrected sharply, GLD’s holdings soared 176.9t or 27.5% higher! Gold investment demand turned on a dime, and the trigger was the last stock-market correction. Stock selloffs driving surging gold buying is nothing new, so gold will certainly rally again in and after the next SPX correction.
When stock investors want gold exposure fast, they naturally turn to GLD. This gold ETF acts as conduit for the vast pools of stock-market capital to slosh into and out of gold. GLD’s mission is to track the gold price. So when stock investors buy GLD shares at faster rates than gold is rising, this ETF’s price will soon decouple to the upside and fail its mission. GLD’s managers prevent this by shunting that buying into gold.
When GLD-share demand exceeds gold’s own, GLD issues new shares to offset and absorb the excess. The capital raised from these sales is used to directly buy more physical gold bullion for GLD to hold in trust for its shareholders. Big GLD buying by American stock investors alone catapulted gold’s price far higher in Q1’16. That 176.9t surge in GLD’s holdings accounted for 95.2% of the total jump in world gold demand!
So if today’s literally-bubble-valued extremely-overbought hyper-complacent stock markets concern you, start upping your gold allocation before everyone else does. Since gold rallies when stock markets sell off, it’s the ultimate portfolio diversifier. While forgotten when stock markets are high and euphoric, gold is quickly remembered and returned to once material stock selloffs inevitably erupt. Early contrarians win big.
In roughly the first half of 2016 after the last SPX correction, gold again powered 29.9% higher. Investors could’ve easily played that in GLD shares. But when gold rallies significantly, the greatest gains are won in the gold miners’ stocks. Their profits are really leveraged to prevailing gold prices, so their stocks tend to amplify gold gains by 2x to 3x. In roughly the first half of 2016, the leading gold-stock index soared 182.2% higher!
With these taxphoria-inflated stock markets hyper-risky today, the potential upside in gold stocks is huge. This sector is often the only big winner during major stock-market selloffs, whether just bull corrections or full-on bear markets. Gold investment demand surges when stock markets materially sell off, driving gold sharply higher. The great gold miners’ stocks with superior fundamentals greatly leverage gold’s gains.
At Zeal we’ve literally spent tens of thousands of hours researching individual gold stocks and markets, so we can better decide what to trade and when. As of the end of Q3, this has resulted in 967 stock trades recommended in real-time to our newsletter subscribers since 2001. Fighting the crowd to buy low and sell high is very profitable, as all these trades averaged stellar annualized realized gains of +19.9%!
The key to this success is staying informed and being contrarian. That means buying low before others figure it out, before undervalued gold stocks soar much higher. An easy way to keep abreast is through our acclaimed weekly and monthly newsletters. They draw on my vast experience, knowledge, wisdom, and ongoing research to explain what’s going on in the markets, why, and how to trade them with specific stocks. For only $12 per issue, you can learn to think, trade, and thrive like contrarians. Subscribe today, and get deployed in the great gold and silver stocks in our full trading books!
The bottom line is stock selloffs are great for gold. This leading alternative investment is ignored when stocks are high. But since it rallies when stocks weaken, demand soars for portfolio diversification during material stock selloffs. Gold is ready to power higher again once these extreme stock markets inevitably roll over. The next major selloff is imminent given the bubble valuations and extreme overboughtness today.
Republicans’ new corporate tax cuts are good news for the economy, but they won’t boost profits anywhere near enough to work off these dangerous overvaluations. And with the Fed and ECB both engaging in unprecedented tightening campaigns this year, stock markets face fierce monetary headwinds. Gold is the best place to take refuge and grow wealth as normal stock-market cycles finally resume again.
Adam Hamilton, CPA
January 12, 2018
Copyright 2000 – 2018 Zeal LLC (www.ZealLLC.com)
The gold miners’ stocks have huge upside potential in 2018, likely the best among stock-market sectors. They really lagged gold last year, so a major mean-reversion catch-up rally is coming. The gold miners are universally ignored and deeply undervalued relative to the metal which drives their profits. And gold itself is likely to power dramatically higher this year as euphoric record-high stock markets inevitably start to falter.
Gold has always been the leading contrarian investment, tending to move counter to stock markets. So not surprisingly investment demand stalled last year as the extreme taxphoria-fueled stock surge blasted relentlessly higher. When stock markets apparently do nothing but rally indefinitely, investors feel no need to prudently diversify their portfolios with the anti-stock trade gold. So they ignored the yellow metal in 2017.
That was certainly evident in the leading proxy for gold investment demand, the flagship American GLD SPDR Gold Shares gold ETF. Its physical gold bullion held in trust for shareholders merely grew 1.9% or 15.3 metric tons in 2017. That was a colossal slowdown from 2016’s massive 28.0% or 179.8t growth! Given the weak gold investment demand last year, it’s rather impressive how well gold managed to perform.
Big up-years in the stock markets sometimes drive big down-years in gold, and 2013 was a key case in point. That year extreme Fed easing catapulted the benchmark S&P 500 broad-market stock index (SPX) an amazing 29.6% higher. Exuberant investors wanted nothing to do with gold, and dumped it in droves. So the gold price plummeted 27.9% in 2013, leaving deep psychological damage that persists to this day.
In 2017 the SPX soared 19.4% on hopes for big tax cuts soon from the newly-Republican-controlled US government. Extreme complacency, greed, euphoria, and even hubris ran rampant among investors. It was a perfect scenario to see gold crushed again on a mass exodus of investor capital. Yet despite the stock markets enjoying their best year since 2013, gold was still able to achieve a strong 13.2% gain in 2017!
Nevertheless, the wildly-optimistic stock-market sentiment drowned out everything else so psychology in precious metals remained exceptionally weak. The leading indicators for gold sentiment are this metal’s peripheral leveraged plays of silver and gold miners’ stocks. Both typically amplify gold’s upside by 2x to 3x. But oddly in 2017 despite gold’s big rally, silver and the main gold-stock index only climbed 6.4% and 5.5%.
That index is of course the NYSE Arca Gold BUGS Index, better known by its symbol HUI. It is closely mirrored by the dominant gold-stock ETF, the GDX VanEck Vectors Gold Miners ETF. The composition of these gold-stock trackers is very similar by necessity, as the universe of major gold miners to pick from when building indexes is small. Without scales, it’s impossible to tell the difference between HUI and GDX charts.
In a 13.2% gold up-year like 2017, the HUI really should’ve leveraged that by 2x to 3x to enjoy solid annual gains of 26.4% to 39.7%. Yet because investors weren’t interested in either gold or its miners’ stocks, the HUI languished with that miserable 5.5% gain last year. That made for terrible 0.4x leverage to gold, which is wildly unacceptable. Gold miners must generate greater returns than gold to be viable investments.
Owning gold miners is much riskier than simply owning gold itself. On top of all the price risks that gold faces, the miners heap many additional operational, geological, and geopolitical challenges. They must compensate investors for these considerable added risks relative to owning gold outright, or there is truly no point in owning them at all. 2017 was a rare anomaly where they dramatically lagged gold’s solid rally.
That’s very unlikely to persist into 2018, as we’re already seeing. Since the Fed’s 5th rate hike of this cycle in mid-December, gold and the HUI have rallied 5.5% and 12.8% as of the middle of this week. That makes for solid 2.3x upside leverage, already a vast improvement over last year’s 0.4x. Thus investors are already returning to gold stocks in a meaningful way, and this young trend should accelerate.
The gold miners’ stocks are radically undervalued fundamentally after so horribly underperforming gold last year. Gold mining is a simple business from a profits standpoint. Miners painstakingly wrest gold from the bowels of the Earth, then sell it at prevailing market prices. So their earnings are the differences between current gold prices and mining costs. Gold-mining profitability was actually fairly strong in 2017.
Right after quarterly earnings seasons, I dig into the newest reports from the world’s top gold miners included in that leading GDX gold-stock ETF. In their latest-reported quarter of Q3’17, the top 34 GDX component gold miners averaged all-in sustaining costs of $868 per ounce. AISCs are this industry’s main profitability measure, accounting for not only mining but maintaining production by replenishing reserves.
One of the primary attributes that makes gold stocks so attractive to investors is the fact these costs don’t change much regardless of prevailing gold prices. Over the past 7 quarters ending in Q3’17, GDX’s top-34 gold miners reported average AISC of $833, $886, $855, $875, $878, $867, and $868. That makes for a tight variance, despite gold trading as low as $1074 and as high as $1365 during this same span.
These quarterly major-gold-miner average AISCs within this gold bull have their own mean of $866, so let’s assume this industry can operate at $865 all-in sustaining costs. In 2017 gold averaged $1258 per ounce, so the major gold miners were collectively earning profits of $393 per ounce. That equates to hefty 31% profit margins, levels most industries would die for. Yet gold-mining stocks certainly didn’t reflect this!
The HUI averaged just 196.0 in 2017, incredibly-low levels. This leading gold-stock index first hit 196 in September 2003 when gold was only trading near $375. Back then the major gold miners were far less profitable in both absolute and percentage terms. In 2004 the HUI averaged 212.2, considerably better than 2017 levels despite gold’s super-low average price of $409 that year. Today’s gold-stock prices are absurd!
In 2010 the gold price averaged $1228, a bit below 2017’s $1258. Yet the HUI averaged 471.5, or a whopping 141% higher than last year’s ridiculous levels. The gold miners’ stocks are now priced as if this industry was operating at massive cashflow losses with its very future viability called into question. Yet obviously that isn’t the case, as the gold miners are generating big positive cashflows and profits today.
The only explanation for this epic fundamental anomaly is extreme sentiment, which never lasts for long. Because the stock markets soared in taxphoria last year, investors shunned gold and everything related to it. Thus the gold stocks fell deeply out of favor, universally ignored if not scorned. When that weird psychology inevitably shifts, the beaten-down gold stocks are going to stage a massive catch-up upleg.
There’s plenty of precedent for that. Back in early 2016 when the general stock markets suffered their last correction, gold investment demand exploded for prudently diversifying stock-heavy portfolios. The SPX only fell 13.3% over 3.3 months, but even that minor correction was enough to rekindle big gold buying. That catapulted gold 29.9% higher in 6.7 months, birthing its first new bull market since 2011!
Like today, gold stocks were neglected and anomalously-cheap before that last stock-selloff-driven gold upleg. Then in roughly that same first-half-of-2016 span, the HUI skyrocketed 182.2% higher in just 6.5 months! That made for amazing 6.1x upside leverage to gold. When gold stocks have underperformed their metal, their catch-up rallies are huge and greatly amplify gold’s gains. 2018’s action should echo 2016’s.
Gold stocks certainly have the potential today to see similar fast gains this year to their near-triple in a half-year on gold powering less than a third higher a couple years ago! The lead-in to 2018 was very similar to that lead-in to 2016, with gold stocks deeply out of favor and thus languishing at fundamentally-absurd price levels relative to their profits. But the vast majority of traders haven’t figured this out yet.
Investment is all about buying low then selling high, and that requires buying when assets are unpopular and thus underpriced. Unfortunately most investors ultimately perform poorly because they reverse this. They instead wait to buy until assets are adored, which forces them to buy really high. Then once those assets inevitably mean revert to much-lower levels, investors succumb to popular fear and sell low for big losses.
In late 2015 just like in late 2017, the contrarian gold-stock sector was despised. Few investors were even aware of it, and most of those didn’t want to touch it with a ten-foot pole. Yet in 2016, the gold stocks were the best-performing stock-market sector. The HUI rocketed 64.0% higher that year on a mere 8.5% gold rally, trouncing the SPX’s 9.5% gain! Fighting the crowd to buy low really multiplies wealth.
There’s a high probability the gold miners’ stocks will once again prove the best-performing stock-market sector in 2018. There’s virtually nothing else deeply out of favor and radically undervalued in these entire taxphoria-inflated stock markets! Everything else has already been bid dramatically higher, and thus is susceptible to suffering sharp selloffs as the stock markets roll over. Gold stocks are the only bargains left.
Since prevailing gold prices directly drive gold-mining profitability and hence ultimately stock prices, the HUI/Gold Ratio is a great valuation proxy for this sector. It simply divides the daily HUI close by the daily gold close. When charted over time, this core fundamental relationship reveals when gold stocks are overvalued or undervalued relative to gold. And there’s no doubt the latter is true in spades heading into 2018.
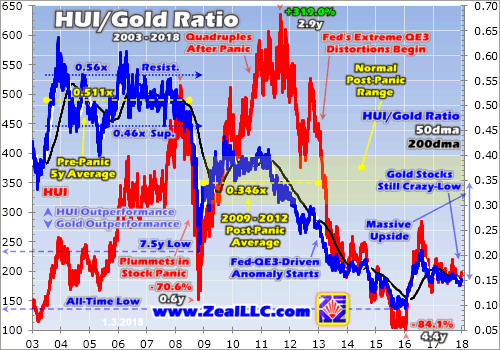
Despite the gold miners’ nice post-FOMC-meeting rally in recent weeks, they left 2017 trading at an HGR of just 0.148x. In other words, the HUI was trading at just under 15% of the gold price. This ratio means nothing in isolation, but years of history shows when gold stocks are high or low compared to gold. And they almost couldn’t be lower today, or more undervalued. Essentially only 2015 saw worse gold-stock prices.
That happened to be the climaxing stretch of a major gold bear that ran 6.1 years leading into the Fed’s first rate hike of this cycle in December 2015. The HGR slumped to all-time lows near 0.09x late that year, extreme and unsustainable. And indeed the gold stocks rallied sharply out of that anomaly, again nearly tripling in a half-year. Gold-stock prices remain super-low, overdue to mean revert dramatically higher.
This long-term HGR chart encompasses a 15-year secular span that included every conceivable market condition for gold and its miners’ stocks. The HGR averaged 0.341x through all of it, or fully 2.3x higher than today’s extreme lows. That means the gold stocks as measured by the HUI ought to be trading at least 127% higher than today’s levels! And that’s assuming gold just stalls out instead of rallying further.
Instead 2018 is almost certain to see gold surge dramatically higher in its next major bull-market upleg. That leaves the gold stocks with early-2016-like potential to skyrocket again, greatly outperforming gold until their stock prices catch up or more likely overshoot to the upside. The driver will once again be these euphoric stock markets rolling over into their next correction or more likely the long-overdue bear market.
Despite the extreme stock euphoria as 2018 dawns, today’s stock markets are hyper-risky. They have powered higher for years now on extreme central-bank easing before the recent taxphoria. But that has forced them to exceedingly-dangerous bubble valuations. The SPX left 2017 with its elite component stocks sporting an average trailing-twelve-month price-to-earnings ratio of 30.7x, above the 28x bubble threshold!
The SPX has now gone 1.9 years without a 10%+ correction, and such selloffs tend to happen at least once a year in healthy bull markets. Now that the highly-anticipated Republican corporate tax cuts have indeed come to pass, 2017’s taxphoria will naturally fade. The more-optimistic Wall Street estimates are for those tax cuts to boost corporate earnings by 10% in 2018, which still won’t justify today’s lofty stock prices.
If this year sees SPX earnings indeed grow 10%, that still leaves its components’ average P/E ratio way up at a near-bubble 27.6x! Stock valuations are so extreme after an extraordinary 8.8-year 301.0% SPX bull market that the biggest US corporate tax cuts ever will barely put a dent in bubble valuations. That leaves stock markets at risk for their first correction-grade selloff since early 2016, which is great news for gold.
But the real coup de grâce to these euphoric record stock markets will be this year’s enormous central-bank tightening radically unprecedented in history. The Fed’s new quantitative-tightening campaign is ramping up in 2018, starting to unwind years of epic quantitative easing. And the European Central Bank is sharply tapering its own QE bond buying by slashing it in half. Together this will strangle this stock bull.
There is nothing more important to the global markets this year than this unparalleled tightening by both the Fed and ECB. I wrote a whole essay analyzing it in depth back in late October, which every investor needs to understand! Compared to 2017, 2018 and 2019 will respectively see $950b and $1450b more tightening and less easing from the Fed and ECB! Nothing remotely like this has ever before been witnessed.
When these central-bank-easing-inflated record stock markets face the biggest central-bank tightening in world history, while trading at bubble valuations no less, the only possible outcome is a serious selloff. At best it will be a major correction approaching 20% in the SPX, but far more likely a new bear market. Those tend to run near 50% losses over a couple years, annihilating wealth of investors who get trapped in them.
Just like in early 2016, the long-overdue next major stock-market selloff will quickly rekindle major gold investment demand. Investors will remember gold when their stock-heavy portfolios start tanking, and rush to diversify into it. The reason gold rallied 29.9% in roughly the first half of 2016 is investors flooded back into gold following the last SPX correction. That was led by American investors heavily buying GLD shares.
This dominant global gold ETF saw its holdings skyrocket 55.7% or 351.1t over that same short span! That was just after a 13.3% SPX correction. Imagine the gold investment demand if we approach 20% or go beyond into the inevitable next bear. The differential GLD-share buying forcing stock-market capital into physical gold bullion could very well be unprecedented. That’s exceedingly bullish for gold stocks!
When this gold-demand-killing stock euphoria inescapably breaks, gold could easily power another 30% higher in 2018. But let’s be conservative and look for a 20% upleg, which would leave gold near $1563. That’s still well below gold’s all-time high of $1894 in August 2011, not extreme by any measure. Gold was above $1550 almost continuously for 1.8 years between July 2011 to April 2013, we’ve seen it before.
At $1565 gold and those top-34 GDX gold miners’ average all-in sustaining costs of $865 during this gold bull, their profits would soar to $700 per ounce! That’s 78% above 2017 levels. There’s nowhere else in all the stock markets where such huge earnings growth is even possible, let alone probable. Such a big surge in profits coupled with excessively-low gold-stock prices would lead to huge fundamentally-driven gains.
At $1565 gold and that 15-year-average 0.341x HGR, that implies the HUI fair value is around 534. That is 170% above this week’s gold-stock levels. Thus much like early 2016, the gold stocks truly have the potential to nearly triple again in 2018 on higher gold prices! Even better, after being excessively low the gold stocks tend to not just mean revert but overshoot to overvaluations. So their upside potential is huge.
The gold stocks are really a coiled spring today, ready to explode higher in 2018 and trounce everything else. They are deeply out of favor, incredibly undervalued, and one of the only sectors that can rally sharply when general stock markets sell off. If you want to multiply your wealth this year by fighting the crowd to buy low then sell high, this small and forgotten contrarian sector is the place to be. Nothing else rivals it.
While investors and speculators alike can certainly play gold stocks’ coming powerful upleg with the major ETFs like GDX, the best gains by far will be won in individual gold stocks with superior fundamentals. Their upside will far exceed the ETFs, which are burdened by over-diversification and underperforming gold stocks. A carefully-handpicked portfolio of elite gold and silver miners will generate much-greater wealth creation.
At Zeal we’ve literally spent tens of thousands of hours researching individual gold stocks and markets, so we can better decide what to trade and when. As of the end of Q3, this has resulted in 967 stock trades recommended in real-time to our newsletter subscribers since 2001. Fighting the crowd to buy low and sell high is very profitable, as all these trades averaged stellar annualized realized gains of +19.9%!
The key to this success is staying informed and being contrarian. That means buying low before others figure it out, before undervalued gold stocks soar much higher. An easy way to keep abreast is through our acclaimed weekly and monthly newsletters. They draw on my vast experience, knowledge, wisdom, and ongoing research to explain what’s going on in the markets, why, and how to trade them with specific stocks. For only $12 per issue, you can learn to think, trade, and thrive like contrarians. Subscribe today, and get deployed in the great gold and silver stocks in our full trading books!
The bottom line is gold-stock upside potential is huge in 2018. The gold miners really lagged gold last year due to the extreme stock euphoria gutting gold sentiment. That left gold stocks deeply out of favor and exceedingly cheap relative to the metal which drives their profits. This extreme anomaly won’t last for long, as investors will flood back into these fundamental bargains as gold starts powering higher again.
Gold investment demand is set to surge again when these euphoric stock markets inevitably roll over into their next major selloff. The likely trigger will be massive central-bank tightening at wildly-unprecedented levels. The last time stock markets corrected, gold shot up almost a third while gold stocks nearly tripled in merely a half-year! 2018 is perfectly set up for a similar scenario, portending massive gold-stock gains.
Adam Hamilton, CPA
January 5, 2018
Copyright 2000 – 2018 Zeal LLC (www.ZealLLC.com)
If you would like to receive our free newsletter via email, simply enter your email address below & click subscribe.
 Follow us on Twitter
 Become our facebook fan
CONNECT WITH US
Tweets
Tweet with hash tag #miningfeeds or @miningfeeds and your tweets will be displayed across this site.
MOST ACTIVE MINING STOCKS
Daily Gainers
 CMC Metals Ltd. CMC Metals Ltd. |
CMB.V | +900.00% |
 Eden Energy Ltd Eden Energy Ltd |
EDE.AX | +200.00% |
| GoviEx Uranium Inc. |
GXU.V | +42.86% |
| Eagle Nickel Ltd. |
ENL.AX | +41.67% |
| Citigold Corp. Limited |
CTO.AX | +33.33% |
| Mount Burgess Mining NL |
MTB.AX | +33.33% |
| Exalt Resources Limited |
ERD.AX | +31.94% |
| Casa Minerals Inc. |
CASA.V | +30.00% |
| Cariboo Rose Resources Ltd |
CRB.V | +28.57% |
| Belmont Resources Inc. |
BEA.V | +28.57% |


