

Despite the insistence of some, precious metals have not been in a bull market. After a big pop at the start of 2016, the sector has trended lower. Sure, Gold has traded up towards a major breakout but Silver and the gold stocks have trended lower. When the US Dollar corrected significantly, the stock market outperformed precious metals. Does that sound like a Gold bull market to you? The moribund performance has left us wondering what could turn the tide. A quick study of Fed history with the context of current conditions is very instructive as to when Gold could begin a true bull market.
Fundamentally speaking, we know that Gold performs best when real rates are declining or will soon begin declining. That usually entails either accelerating inflation (surpassing the increase in nominal rates) or falling rates amid stable inflation. At this juncture we are leaning towards the latter as the eventual catalyst for Gold.
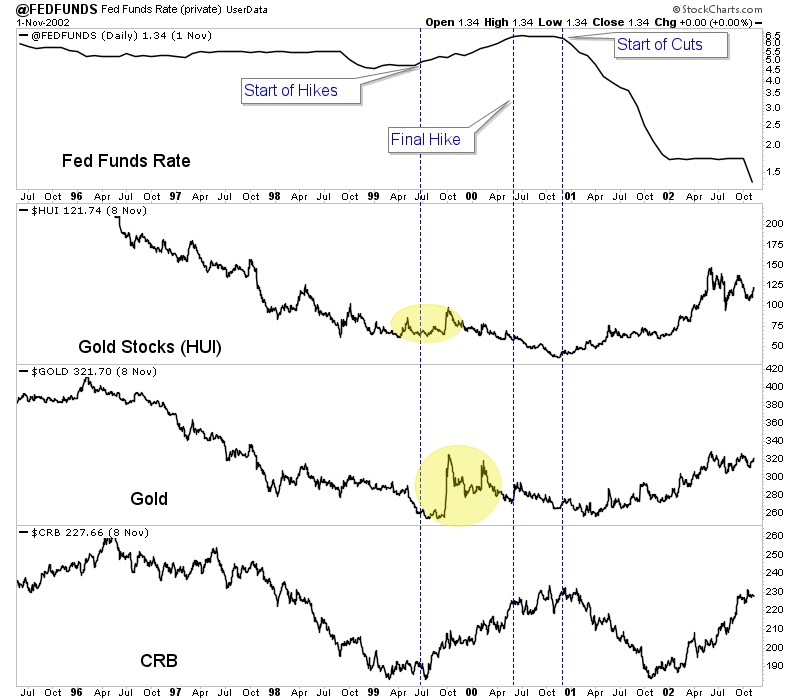
We were curious how Fed policy and policy changes impacted precious metals so we decided to plot the Fed Funds rate (above) along with gold stocks (middle) and Gold (bottom). We used the gold stocks (Barron’s Gold Mining Index) because they have a longer history than Gold. The vertical lines in blue mark lows in the BGMI that coincided with peaks in the Fed Funds rate (FFR) while the vertical lines in red mark lows in the BGMI that coincided with a bottom in the FFR.

Outside of the highly inflationary 1970s, the best bull markets in gold stocks began around the time the Fed Funds rate peaked (or in other words when the Fed ended its rate hikes). Lows in 1993, 1999 and 2016 coincided with the start of a new hiking cycle. However, unlike the lows in 1972 and 1976, inflation did not accelerate enough to drive more than a rebound.
Does that signal that gold stocks (and precious metals at large) need an end to the rate hikes?
The period from 1999 to 2001 is very instructive as there are several similarities between 1999-2000 and 2016-2017.
Like 1999, 2016 followed a nasty bear market in Gold and hard assets.
Also, the 1999 bottom in precious metals and commodities occurred around the time the Fed began a new cycle of rate hikes. Sound familiar to 2016?
As the Fed continued to hike into 2000, Gold and gold stocks trailed off but commodities were able to make higher highs until the very end of 2000. Commodities have not been quite as strong this time but they have outperformed precious metals which have trailed off since the initial rebound.
Gold and gold stocks ultimately bottomed and began spectacular rebounds around the time the Fed moved from a pause in rate hikes to rate cuts at the very start of 2001.
Unless there is an acceleration in inflation, the turning point for precious metals figures to be around the time the Fed ends its rate hikes. That would likely coincide with Gold regaining outperformance against the stock market, which we have noted as Gold’s missing link (from an intermarket perspective). Weakness in the economy and stock market would lead to an end to the rate hikes and then rate cuts. That would be the time Gold and gold stocks begin a major move higher. In the meantime we continue to focus on and accumulate the juniors that have 300% to 500% return potential. To follow our guidance and learn our favorite juniors for the balance of 2018, consider learning more about our service.

- The thrill of victory and the agony of defeat. Gold investors focused on the Western markets and government debt fear trade tend to feel the same kinds of thrills and agony that professional athletes regularly experience.
- Here’s a good example: For a few days, silver soars higher on what appears to be the guaranteed start of a long-term uptrend. Within days or just hours, the gains are suddenly gone, and the price appears to be going much lower with absolute certainty.
- Please click here now. Double-click to enlarge this positive-looking gold chart.
- Bullion banks around the world arguably have the most effect on gold price discovery and they focus on physical supply versus demand.
- Given that India’s gold-focused Akha Teej festival ended April 18, and Chinese jewellery demand is slightly soft (with dealer interest at $1320 – $1300), it’s clear that gold is not quite ready to surge above $1370 and begin a new era of sustained trading above $1400.
- Also, some Fed speakers have hinted that the pace of Fed rate hikes could be slower than expected. At first glance, that would seem to be positive for gold, but fear trade price discovery is about how rates affect risk.
- In the current environment, modest rate hikes support a “risk-on” theme. For a closer look at what I mean, please click here now. Double-click to enlarge this US dollar versus yen chart.
- Bank FOREX traders view the dollar as risk-on and the yen and gold as risk-off, and rightly so. Given the beyond-insane financial state of the government, aggressive rate hikes from the Fed put the government at serious risk of being able to finance itself. In that situation, the dollar falls against the yen and gold.
- In the immediate time frame, money managers believe that Powell will hike rates very gradually. That incentivizes money managers to take risk and invest in the dollar, because it will pay a higher rate of interest without putting too much pressure on the government’s ability to make its principal and interest payments on its debt.
- Gold peaked in February as Chinese New Year buying peaked. Now it’s made another modest peak as Akha Teej buying peaks, with Western money managers believing that the Fed cares about the US government’s debt problems. These money managers also believe the Fed cares about the stock market.
- Under Greenspan, Bernanke, and Yellen, the Fed cared. I don’t believe Powell cares what the ramifications of his actions are for the “spendaholic” government or for the Wall Street vampires that require low rate policy for their stock market buyback programs.
- Please click here now. Double-click to enlarge this key bond market chart.
- This chart tells me that the Fed is going to become vastly more aggressive with rate hikes and inflation is going much higher. The current price and time zone is the calm before that storm.
- I expected Trump to launch tariffs, and he’s done that. Most investors are focused on whether the tariffs are good or bad for growth, rather than on the fact that they are inflationary.
- Please click here now. I didn’t predict the sanctions that have been applied to Russia by the US government, although I’m not really surprised.
- That’s because most of what all governments do involves the insane use of sticks much more than the sane use of carrots. Regardless, sanctions are here and they are inflationary. I view sanctions as nothing more than aggressive tariffs.
- More are coming as governments (especially the US government) seek new sources of revenue to pay their debts as inflation and rates rise.
- Please click here now. Double-click to enlarge this GDX chart.
- While many fear traders involved with gold stocks are nervous today, I don’t see anything to be concerned about. I suggested GDX would make a short-term peak at about $23.25 as Akha Teej demand peaked with the Fed in between rate hikes.
- It’s done that and investors who have insured their “bull era ride” with GDX put options in that $23 area are now looking very good indeed. Some of these options rose 15% just in yesterday’s trading. The bottom line: Insurance works, whether it is home, auto, or price insurance for gold stocks.
- Please click here now. I have two short term scenarios for GDX. The first involves the current pullback ending in the $22 area, and the second one shown here has the pullback end at around $21. Put options enthusiasts and those carrying a short position in GDX against their portfolio of individual miners could cover off half the puts at around $22 and the rest near $21.
- As with gold and silver bullion, I have no concerns at all about the current price action in gold stocks. Most have staged huge rallies recently and many are above their February highs. A pullback is normal and expected as major Chindian festival demand peaks at a time when the Fed is in between major policy action.
- Chindian income growth versus limited mine supply is the main driver of higher gold prices for the long term. There are no “upside breakouts” in that process. It’s ongoing and relentless. The inflationary policies of the debt-plagued US government and the Fed’s increasingly aggressive QT and rate hikes in response to that will generate significant institutional interest in gold stocks as gold trades above $1400.
- All the fundamentals are in place to create significant inflation and debt financing problems for the West. They are also in place to create significant income growth in the East for a long period of time. The only thing that astute investors need to build sustained and significant wealth in the coming gold bull era is a very modest amount of patience and rational thought. It’s the greatest time in history to be invested in the precious metals asset class, and getting greater by the day!
Thanks
Cheers
St
Stewart Thomson
Graceland Updates
https://www.gracelandupdates.com
Email:
Risks, Disclaimers, Legal
Stewart Thomson is a retired Merrill Lynch broker. Stewart writes the Graceland Updates daily between 4am-7am. Stewart Thomson is no longer an investment advisor. The information provided by Stewart and Graceland Updates is for general information purposes only. Before taking any action on any investment, it is imperative that you consult with multiple properly licensed, experienced and qualified investment advisors and get numerous opinions before taking any action. Your minimum risk on any investment in the world is: 100% loss of all your money. You may be taking or preparing to take leveraged positions in investments and not know it, exposing yourself to unlimited risks. This is highly concerning if you are an investor in any derivatives products. There is an approx $700 trillion OTC Derivatives Iceberg with a tiny portion written off officially. The bottom line:
Are You Prepared?
- The appointment of Jerome Powell as new Fed chair is likely the catalyst that ushers in a multi-decade era of rising inflation and soaring gold stocks.
- I’ve announced a long term target for GDX of $15,000. That really isn’t very high… given the strong inflation numbers that I am projecting for America in the years ahead.
- Having said that, Powell has only been on the job for one day. Investors need to show patience. Wait to see what he actually does before taking “back up the truck” market actions.
- Powell’s first significant actions are likely to be announced at the March 21 Fed meeting. I expect a firm commitment to more rate hikes and more quantitative tightening.
- That’s inflationary because it boosts bank profit margins and they become more willing to take lending risk. That produces a rise in the velocity of money.
- As the cost of borrowing rises, companies will raise prices and workers will demand higher wages. If Powell also makes a firm commitment to deregulating America’s thousands of small banks on or before March 21, inflation would accelerate even more rapidly.
- Please click here now. It’s my contention that wage inflation of 20%+ is not just theoretically possibly, but morally justified. Here’s why:
- For many years, global governments have colluded with central banks to run socialist/fascist QE programs. These programs moved money from workers and savers to government bonds and stock markets. Additional money was simply printed and taken.
- QT, higher rates, and small bank deregulation are beginning to re-empower Main Street. This is happening while “Government Street” (the bond market and the dollar) and Wall Street risk disintegrating.
- Please click here now. Double-click to enlarge this exciting bond market chart. A head and shoulders top pattern is in play. The neckline has been crushed.
- Please click here now. Around the world, governments are announcing import duties. That’s inflationary. If India’s government had cut the gold import duty, it would have increased demand, but the duty itself is also inflationary.
- Please click here now. Institutional money managers are starting to focus on the inflationary implications of Trump’s tax cuts that I highlighted when he first proposed them. In the context of QT, rate hikes, and deregulation, these cuts can increase inflation quite significantly.
- Please click here now. Double-click to enlarge. The bond market is building what I have dubbed a “super top” pattern. The target of the super top is about 80.
- The Fed has projected that rates will take many years to reach “normal” levels. This chart suggests the normalization process will take about seven more years.
- This “normalization” sounds great in theory. In the real world, it involves a decline to 80 for the T-bond price. That would drive borrowing costs for the US government to incredibly painful levels.
- In addition, rates could rise much more quickly than this chart suggests if Trump ordered T-bond creditors to take a haircut on what they are owed. That’s one of his campaign promises.
- As inflation surges, Trump may be forced to devalue the dollar and revalue gold to prevent the US government from imploding or becoming a full dictatorship. Inflate, default, or die. In the near -immediate future, these are the only choices President Trump will have to manage the US government’s horrific size, power, and debt.
- On that note, click here now. Double-click to enlarge. The dollar could go into free fall if it breaks cleanly under 108 against the yen, and the bear flag chart action suggests that is going to happen very soon.
- A breakdown would almost certainly correlate with a gold price surge to about $1370. Please click here now. Double-click to enlarge this daily gold chart.
- There is a small head and shoulders top pattern in play that could push gold modestly lower to the $1310 – $1290 area. The good news is that a bull flag-like pattern is also forming that could negate the top pattern.
- Given the fast-growing inflationary fundamentals, gold investors should now be walking the price gridlines with maximum confidence. Fresh buying for eager gamblers and investors should be done at key levels that I’ve noted on the chart.
- Gold has been rising as the T-bond has fallen hard, and rising as the T-bond has rallied. That’s because gold price discovery for the fear trade is not about rates per se, but about risk. As stock and bond market investors get rocked hard, gold looks like the ultimate asset iron lady!
- Please click here now. A major gold stocks versus gold bull era will occur as the T-bond super top ushers in extraordinarily high inflation for the long term.
- Gold stock enthusiasts need to watch Powell’s actions, because they are the catalysts that will push GDX above $26 and officially begin that fabulous era. Gamblers can buy call options on a two-day close over $26. I’ve urged long term investors to be aggressive buyers in my $23 – $18 tactical accumulation zone. The bottom line is that it’s the cusp of a new era for gold stock investors, and Powell officially launches it on March 21!
Thanks and Cheers,
Stewart Thomson
Graceland Updates
https://www.gracelandupdates.com
Email:
Stewart Thomson is a retired Merrill Lynch broker. Stewart writes the Graceland Updates daily between 4am-7am. They are sent out around 8am-9am. The newsletter is attractively priced and the format is a unique numbered point form. Giving clarity of each point and saving valuable reading time.
Risks, Disclaimers, Legal
Stewart Thomson is no longer an investment advisor. The information provided by Stewart and Graceland Updates is for general information purposes only. Before taking any action on any investment, it is imperative that you consult with multiple properly licensed, experienced and qualified investment advisors and get numerous opinions before taking any action. Your minimum risk on any investment in the world is: 100% loss of all your money. You may be taking or preparing to take leveraged positions in investments and not know it, exposing yourself to unlimited risks. This is highly concerning if you are an investor in any derivatives products. There is an approx $700 trillion OTC Derivatives Iceberg with a tiny portion written off officially. The bottom line:
Are You Prepared?
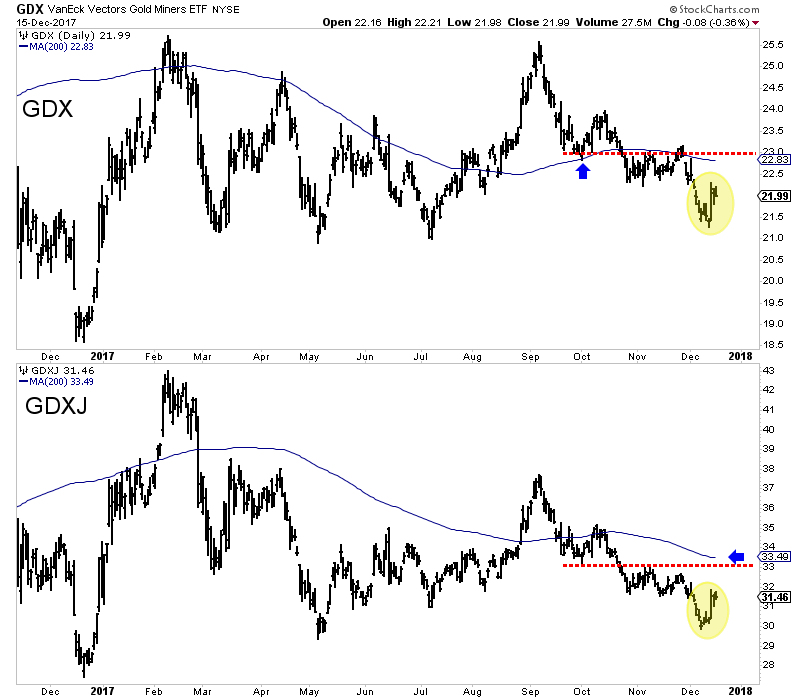
In recent days the gold stocks (GDX, GDXJ) traded within 1% of our downside targets of GDX $21.00 and GDXJ $29.50. Last week we wrote: “the miners are getting oversold and a bounce could begin from those levels.” GDXJ troughed first last week at $29.84 while GDX printed a low of $21.27 on Monday. From their September peaks down to those lows, GDX and GDXJ had declined nearly 17% and 21% respectively. They are oversold, nearly touched good support and now the rate hike is behind them. We expect a rally in the sector well into January.
With a rebound underway we should turn our attention to potential upside targets. GDX closed the week at $21.99. It has resistance at $23.00 including its 200-day moving average at $22.83. GDXJ closed at $31.46. It has resistance at $33.00. Its 200-day moving average is at $33.49. In case we are being too conservative, our optimistic upside targets would be GDX $23.50 and GDXJ $33.50.
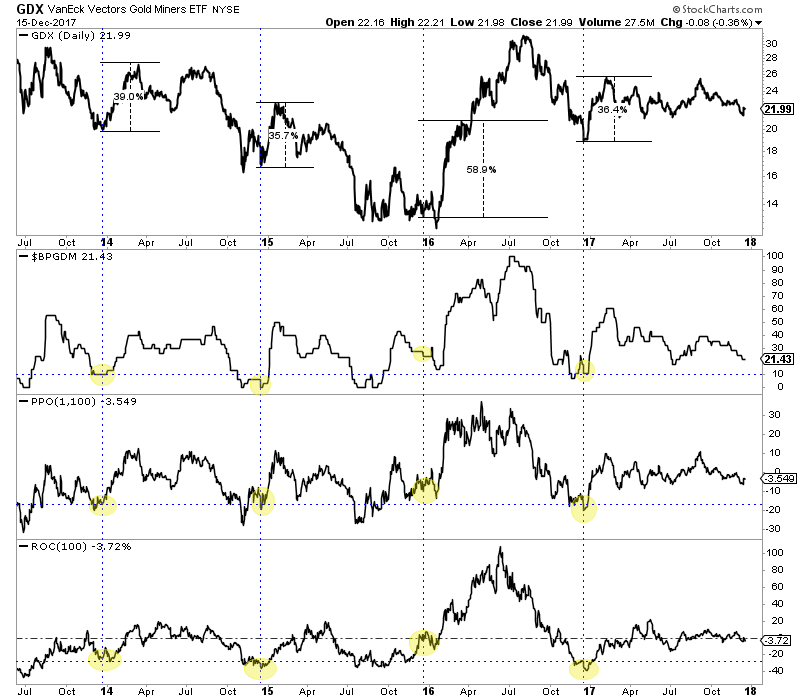
While mid to late December has been an excellent buy point over each of the past four years, we do not expect the gold stocks (this time) to match those fabulous returns. The gold stocks are not currently as oversold as they were in each of the past four years. The bullish percentage index (BPI), a breadth indicator is currently at 21.4%. Aside from the December 2015 low (which came in January 2016 at a BPI of 12%), the BPI at previous lows did not exceed 10%. Furthermore, a look at the rolling rate of change for 100 days and GDX’s distance from its 100-day exponential moving average shows that GDX currently is nowhere close to as oversold as those four previous points.
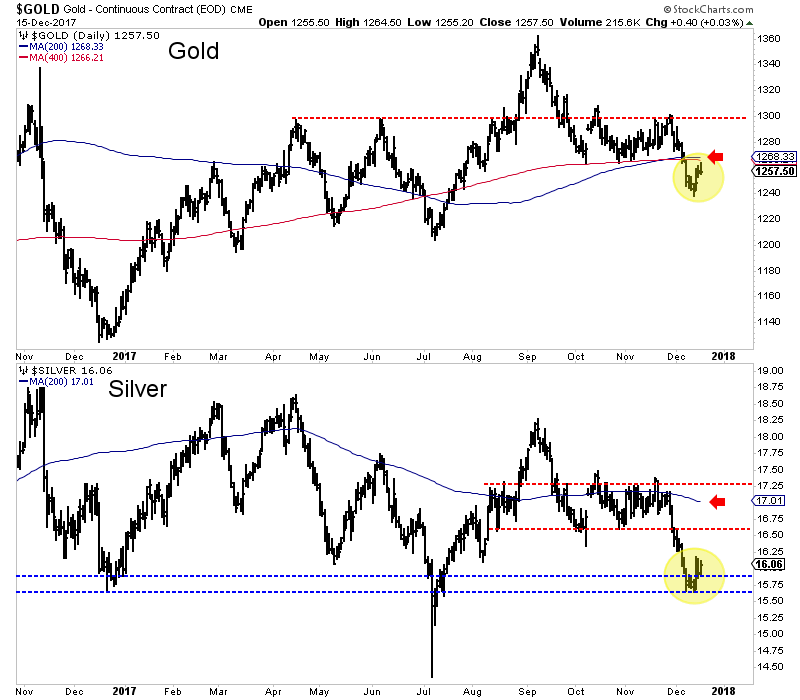
Another reason we should not expect a sizeable rebound is metals prices do not have much room to rally before running into strong resistance. Gold closed the week at $1257. It faces long-term moving average resistance at $1266-$1268 and very strong resistance above $1280. Silver meanwhile could find strong resistance at $16.60 to $16.75. Its 200-day moving average is at $17.01 and declining. Silver closed the week at $16.06.
Precious metals and gold stocks especially have begun a rebound that should last at least three or four more weeks. Due to a lack of an extreme “long-term” oversold condition (like in each of the past four December’s) and the presence of nearby overhead resistance, we would not expect sizeable gains. Another reason is strong fundamentals for precious metals (namely declining real interest rates) are not yet in place. With all that being said, some values are starting to emerge in the juniors and the sentiment in the sector has become encouraging from a contrarian standpoint. Conditions are improving but it remains early to be outright bullish on the sector. In the meantime, the key for traders and investors is to find the oversold companies with strong fundamentals with value and catalysts that will drive buying. To follow our guidance and learn our favorite juniors for 2018, consider learning more about our premium service.
Jordan@TheDailyGold.com
Gold has been battered lower in recent months as gold-futures speculators fled in dread of the Fed-rate-hike boogeyman. As universally expected, the Fed’s 5th rate hike of this cycle indeed came to pass this week. When gold didn’t collapse as irrationally feared, the cowering futures traders were quick to start returning. Past Fed rate hikes have actually proven very bullish for gold, and this latest one will be no exception.
Back in early September, gold was sitting pretty near $1348. It had rallied dramatically out of its usual summer-doldrums low in its typical major autumn rally, blasting 11.2% higher in just 2.0 months. But even way back then, Fed-rate-hike fears for the FOMC’s December 13th meeting started creeping in. When gold peaked on September 7th, federal-funds futures implied December rate-hike odds running just 32%.
Over the next 8 trading days leading into the September 20th FOMC meeting where the Fed birthed its unprecedented quantitative-tightening campaign, those rate-hike odds climbed as high as 62%. That day’s FOMC statement and subsequent Janet Yellen press conference blasted the December rate-hike odds even higher to 73%. So gold slumped back down to $1300 as futures speculators sold in trepidation.
By early October as these futures-implied rate-hike odds hit 93%, gold fell as low as $1268. Over the mere one-month span where December rate-hike odds nearly tripled from 32% to 93%, gold dropped 5.9% on heavy spec gold-futures selling. That erased nearly 6/10ths of its autumn rally, which really weighed on sentiment. Gold still managed to stabilize around the $1280s in late October and November.
Starting early last month, federal-funds futures traders became so totally convinced the Fed would hike this week that their implied odds hit 100%. They stayed pegged at total certainty for 27 trading days in a row. Gold was able to stage a minor rally to $1294 surrounding Thanksgiving, but speculators resumed dumping gold futures in early December. Thus gold fell as low as $1242 leading into this week’s FOMC decision.
Gold-futures speculators have always deeply feared Fed rate hikes. Their rationale is simple and sounds logical. Since gold pays no interest or dividends, it will struggle to compete with bonds and stocks in a higher-yielding world following Fed rate hikes. Therefore gold investment demand will wane, leading to lower gold prices. Speculators always attempt to front run their forgone conclusion by selling gold futures.
This scenario has played out for three Decembers in a row now. The Fed kicked off this rate-hike cycle back in mid-December 2015 with its first rate hike in 9.5 years. A year ago in mid-December 2016 the FOMC made its second rate hike. And following two more hikes earlier this year, the Fed’s newest mid-December hike this week was the 5th of its current cycle. Gold-futures speculators sold aggressively into all.
So gold’s slump into this week on more Fed-rate-hike fears is certainly nothing new. The lead in to this December FOMC meeting is starting to feel like that old Bill Murray movie Groundhog Day. So the key question gold investors need to ask today is how did speculators’ excessively-bearish gold-futures bets play out after the prior couple Decembers’ rate hikes? Did gold crumble in the face of higher rates as feared?
This first chart superimposes gold during this current Fed-rate-hike cycle over speculators’ collective long and short positions in gold futures. Gold is rendered in blue, and speculators’ total number of upside and downside contracts in green and red respectively. This gold-futures data comes from the CTFC’s weekly Commitments of Traders reports, which are published every Friday afternoon current to the preceding Tuesday.
Gold-futures speculators have long been utterly convinced gold’s mortal nemesis is Fed rate hikes and the resulting higher prevailing interest rates. They fervently believe a sterile asset like gold simply can’t compete in a rising-rate environment. And to their credit, these elite traders sure aren’t afraid to put their money where their mouths are. Their trading surrounding past December hikes illuminates gold’s path today.
Way back in December 2008, the Federal Reserve panicked and slashed interest rates to zero for the first time in its history. For years after that, top Fed officials talked about normalizing rates but never had the courage to start. But finally in late October 2015, the FOMC started getting serious about ending its ridiculous ZIRP anomaly. The Fed warned it might “be appropriate to raise the target range at its next meeting”.
That would be December 16th, 2015. Since there hadn’t been a Fed rate hike in nearly a decade, the gold-futures speculators freaked out. Extreme selling erupted as they rushed to dump gold-futures long contracts while catapulting their short positions higher. So between mid-October and early December that year, gold plunged 11.4% to a major new secular low. Surely rate hikes doomed zero-yielding gold!
After years of broken promises to end ZIRP, the Fed indeed hiked for the first time in 9.5 years in mid-December 2015. Gold rallied 1.1% that day, but plunged 2.1% the next to edge down to a brutal 6.1-year secular low of $1051. With relatively-low longs and extreme record short positions, speculators had heavily bet that was just the beginning of gold’s woes. Their positions were exceedingly bearish into that hike.
But gold didn’t collapse as they expected, it stabilized. Speculators had sold such huge amounts of gold-futures contracts that their selling was exhausted. Thus they had no choice but to start unwinding their own hyper-leveraged bearish bets. So after that initial Fed rate hike of this cycle, speculators first bought to cover their extreme shorts and then aggressively bought long contracts. This is readily evident in this chart.
So instead of cratering on the brand-new Fed-rate-hike campaign, gold skyrocketed on massive gold-futures buying by the very speculators convinced rate hikes would slaughter it. Over the next 6.7 months gold blasted 29.9% higher into its first new bull market since 2011! One of its primary drivers was these speculators adding 249.2k gold-futures long contracts while cutting 82.8k short ones over that gold-surge span.
Unfortunately gold-futures speculators command a super-disproportional wildly-outsized impact on gold price levels because of these contracts’ extreme inherent leverage. Each contract controls 100 troy ounces of gold, which is worth $125k this week. Yet speculators are now only required to maintain $4450 margin in their accounts for each contract held, which equates to incredible maximum leverage to gold of 28.1x!
That means any amount of capital deployed in gold futures by speculators can have up to 28x the price impact on gold as investors buying it outright. 28x is exceedingly dangerous though, as a mere 3.6% adverse move in gold prices would wipe out 100% of the capital bet by futures speculators. This forces them to have an ultra-short-term focus in order to survive. They can’t afford to be wrong for very long.
While their collective conviction that Fed rate hikes are like Kryptonite for zero-yielding gold might sound logical, history proves just the opposite! Back before that initial Fed rate hike of this cycle, I undertook a comprehensive study of how gold reacted in every Fed-rate-hike cycle in modern history. If speculators were right about Fed rate hikes’ bearish impact on gold, it would be fully confirmed in past Fed-rate-hike cycles.
The history was stunning, as you can read about in an update on this groundbreaking work we published in March 2017. Prior to today’s rate-hike cycle, the Fed had executed fully 11 between 1971 and 2015. They are defined as 3 or more consecutive federal-funds-rate increases with no interrupting decreases. During the exact spans of all 11, gold averaged a strong 26.9% rally! Fed rate hikes are actually bullish for gold.
Breaking down this critical historical precedent further, gold rallied big in 6 of these cycles while slumping in the other 5. It averaged huge gains of 61.0% in the majority in which it powered higher! Generally the lower gold was relative to recent years when entering a new rate-hike cycle, and the more gradual those Fed rate hikes were, the better its upside performance. Both conditions describe today’s 12th cycle perfectly.
And in the other 5 where gold suffered losses, they averaged an asymmetrically-small 13.9% retreat. The futures speculators’ cherished notion that Fed rate hikes crush gold is totally false, an irrational myth they deluded themselves into believing. You’d think with tens of billions of dollars of capital at stake with extreme leverage these elite traders could take the time to study historical precedent on gold and rate hikes.
While gathering and crunching all this data since 1971 certainly isn’t trivial, why not simply look to the last Fed-rate-hike cycle for some guidance? Between June 2004 to June 2006, the FOMC hiked the FFR at every meeting for 17 consecutive hikes. Those totaled 425 basis points, more than quintupling the federal-funds rate to 5.25%. If higher rates and yield differentials slay gold, it should’ve plummeted at 5%+.
Yet during that exact span, gold powered 49.6% higher! There’s literally zero chance today’s hyper-easy Fed will dare hike rates 17 times or get anywhere near 5%. The new Fed chairman Jerome Powell that Trump nominated to replace Janet Yellen in early February is widely viewed as a Republican clone of the Democratic Yellen. Powell will stay Yellen’s course, gradually hiking to new norms way below past FFR levels.
But gold-futures speculators didn’t learn their lesson after getting massively burned by their excessively-bearish bets leading into this 12th modern Fed-rate-hike cycle’s opening increase. They did the same thing again a year later leading into the Fed’s heavily-telegraphed second hike in mid-December 2016. They aggressively dumped gold-futures longs, and ramped shorts, leading into the FOMC’s year-ago decision.
While irrational rate-hike fears remained a prime motivator to sell gold futures, those decisions certainly were aided by the stock markets. After Trump’s surprise election win in early November last year, the stock markets rocketed higher in Trumphoria on hopes for big tax cuts soon. Gold investment demand really wanes when record-high stock markets generate much euphoria, killing demand for alternatives led by gold.
So just like a year earlier, following last December’s second Fed rate hike of this cycle gold dropped to a major low of $1128 the very next day. In 5.3 months gold had plunged 17.3% partially thanks to gold-futures speculators dumping 164.5k long contracts while adding 25.8k short ones. But yet again just as their collective bets hit peak bearishness on another Fed rate hike, gold was ready to reverse sharply higher.
The reason is excessive gold-futures selling by speculators is self-limiting. Despite the market power their extreme leverage grants them, their capital is finite. They only have so many long contracts they are willing and able to sell, and only so much capital available to short sell gold futures. So once they near those limits, a reversal is inevitable. They soon have to resume buying longs again while covering shorts.
So for the second year in a row, gold blasted higher out of its major lows immediately after a December Fed rate hike. Over the next 8.7 months leading into early September, gold powered 19.5% higher with speculators adding 111.0k long contracts. They were starting to learn their lesson on shorting a young bull market though, as their total shorts fell just 1.0k contracts over that span. This 2017 gold upleg was impressive.
Gold not only rallied on balance through the 3rd and 4th Fed rate hikes of this cycle in mid-March and mid-June, but climbed despite this year’s extreme stock-market euphoria generated by the endless new record highs. Speculators temporarily shorted gold-futures to near-record levels leading into gold’s usual summer doldrums, but that artificial low soon gave way to a powerful autumn rally. Gold has held strong.
Despite surging Fed-rate-hike odds leading into this week’s universally-expected 5th hike of this cycle, gold was even able to stabilize from early October to early December. But as the third Fed rate hike in as many Decembers loomed closer, gold-futures speculators again lost their nerve in recent weeks. That’s readily evident in the newest CoT report before this essay was published, current to Tuesday December 5th.
As another December rate hike looked certain, gold-futures speculators jettisoned 39.2k long contracts and short sold another 17.4k more in a single CoT week! That total selling of 56.7k contracts was the equivalent of a staggering 176.2 metric tons of gold. That ranked as the third-largest CoT week of spec gold-futures selling out of the 988 since early 1999. These goofy traders were freaking out again over a rate hike.
The Fed indeed hiked for the 5th time in this 12th modern cycle as widely forecast, taking the FFR up to a range between 1.25% to 1.50%. I suspect gold-futures speculators expected top Fed officials’ outlook for 2018 rate hikes to rise from the prior dot plot’s three published a quarter earlier. But 2018 rate-hike projections didn’t budge, holding at exactly the same average in this week’s newest mostly-neutral dot plot.
So speculators resumed buying gold futures right as the FOMC released its decision and rate-hike projections at 2pm this past Wednesday. Gold surged 1.0% higher that day, paralleling its 1.1% rate-hike-day gains two years earlier that was about to kick off a major new bull market. Gold remained up 18.3% in the Fed’s current rate-hike cycle to date, solid gains considering futures speculators’ erroneous beliefs.
Odds are their excessively-bearish bets battering gold in recent months will prove every bit as wrong this December as they did in the last couple years’ Decembers! Gold will likely again stage a powerful rebound rally into 2018 as these hyper-leveraged traders reestablish long positions. They don’t have many short contracts to cover, continuing last year’s trend. Leveraged shorting of a healthy bull market is suicidal.
Just like following the prior couple Decembers’ Fed rate hikes, gold investment buying will likely resume as well. Through speculators’ collective trading’s adverse impact on gold leading into hikes, investors too get worried about gold in higher-rate environments. But once another Fed rate hike passes and gold doesn’t collapse on cue as expected, investors resume buying. Their inflows are the most important of all.
While gold investment is usually done outright with no leverage, investors’ vast pools of capital dwarf the gold-futures speculators’ limited firepower. So gold investment trumps gold-futures speculation. This final chart looks at the best daily approximation of investment available, the holdings of the leading GLD SPDR Gold Shares gold ETF. When its holdings are rising, American stock-market capital is returning to gold.
When investors aren’t interested in gold, their lack of buying allows gold-futures speculators to dominate short-term price action. But once investors buy or sell gold en masse, that easily overpowers whatever the futures traders are up to. The main reason gold exploded into a new bull market after that initial rate hike in December 2015 was massive differential GLD-share buying by American stock investors in early 2016.
During that same 6.7-month span where gold rocketed 29.9% higher in a new bull, GLD’s physical gold bullion held in trust for shareholders soared 55.7% or 351.1t! Gold then collapsed after Trump’s election win as GLD’s holdings shrunk 14.2% or 138.9t in 5.3 months leading into last December. While GLD’s holdings kept slumping after the December 2016 hike, they soon climbed modestly and stabilized in 2017.
Early 2018 is likely to see big gold investment buying much closer to early 2016’s than early 2017’s, which will help catapult gold dramatically higher again. The extreme record stock-market rally of 2017 that generated such epic euphoria isn’t likely to persist into 2018. As stock markets finally roll over into a long overdue major correction or more likely new bear market, investment capital will flood back into gold again.
Though few investors realize it yet, 2018 is going to look radically different from 2017. The major central banks that have injected trillions of dollars of capital since 2008’s stock panic that levitated stock markets are slamming on the brakes. The Fed is ramping its new quantitative-tightening campaign that destroys the QE money created out of nothing to a $50b-per-month pace by Q4’18, something never before witnessed.
At the same time the European Central Bank is slashing its own quantitative-easing campaign from this year’s €60b-per-month pace to just €30b monthly starting in January. Together Fed QT and ECB QE tapering will drive $950b of central-bank tightening in 2018 and then another $1450b in 2019 compared to this year! I explained all this in depth in late October in a critical essay for all investors to fully digest.
As the Fed and ECB reverse sharply from their unprecedented easing of recent years to unprecedented tightening in the coming years, these record-high, euphoric, bubble-valued stock markets are in serious trouble. As they roll over and sell off, investors will rush to prudently diversify their stock-heavy portfolios with counter-moving gold. There’s nothing more bullish for gold investment demand than weakening stocks.
So contrary to recent weeks’ and months’ erroneous view that Fed rate hikes are bearish for gold, history proves just the opposite is true. Gold has thrived in the 11 modern Fed-rate-hike cycles before today’s, and it has powered higher on balance in this 12th one. While you wouldn’t know it after this past year’s extreme Trumphoria rally, Fed rate hikes are actually bearish for stocks and thus quite bullish for gold.
The last time investors flooded into gold in early 2016 after that initial December rate hike, gold powered 29.9% higher in 6.7 months. The beaten-down gold miners’ stocks greatly amplified those gains, with the leading HUI gold-stock index soaring 182.2% higher over roughly that same span! Gold stocks are again deeply undervalued relative to gold, a coiled spring ready to explode higher in this gold bull’s next major upleg.
At Zeal we diligently study market history so we aren’t deceived by irrational herd sentiment. This helps us execute better real-world trades, actually buying low before selling high. As of the end of Q3, this has resulted in 967 stock trades recommended in real-time to our newsletter subscribers since 2001. Our contrarian strategies are very profitable, as all these trades averaged stellar annualized realized gains of +19.9%!
The key to this success is staying informed and being contrarian. That means buying low when others are scared, like leading into Fed rate hikes. An easy way to keep abreast is through our acclaimed weekly and monthly newsletters. They draw on my vast experience, knowledge, wisdom, and ongoing research to explain what’s going on in the markets, why, and how to trade them with specific stocks. Easy to read and affordable, they’ll help you learn to think, trade, and thrive like contrarians. Subscribe today, and get deployed in the great gold stocks on our trading books before they surge far higher!
The bottom line is Fed rate hikes are bullish for gold, and this week’s is no exception. Gold has not only powered higher on average in past Fed-rate-hike cycles, but has rallied strongly in the current one. After each past December rate hike which gold-futures speculators sold aggressively into, gold dramatically surged in the subsequent months. These guys always buy after getting excessively bearish, forcing gold higher.
Gold’s next upleg following the Fed’s 5th rate hike since late 2015 is likely to get a massive boost from weaker stock markets. The same thing happened a couple years ago during the last US stock-market correction. As the Fed and ECB drastically reverse and slash their liquidity injections in 2018, these wild central-bank-inflated stock markets are in serious trouble. Gold investment demand surges when stocks weaken.
Adam Hamilton, CPA
December 15, 2017
Copyright 2000 – 2017 Zeal LLC (www.ZealLLC.com)
This epic central-bank-easing-driven global stock bull is starting to be strangled by the very central banks that fueled it. This week the European Central Bank made a landmark decision to drastically slash its quantitative easing next year. That follows the Fed’s new quantitative-tightening campaign just getting underway this month. With CBs aggressively curtailing easy-money liquidity, this stock bull is in serious trouble.
The US flagship S&P 500 broad-market stock index (SPX) has powered an incredible 280.6% higher over the past 8.6 years, making for the third-largest and second-longest bull market in US history! The resulting popular euphoria, a strong feeling of happiness and confidence, is extraordinary. So investors brazenly shrugged off the Fed’s September 20th QT and the ECB’s October 26th QE-tapering announcements.
That’s a grave mistake. Extreme central-bank easing unlike anything witnessed before in history is why this stock bull grew to such grotesque monstrous proportions. Without QE, it would have withered and died years ago. Central banks conjured literally trillions of new dollars and euros out of thin air, and used that new money to buy assets. This vast quantitative easing inarguably levitated the world stock markets.
QE greatly boosted stocks in two key ways. Most of it was bond buying, which forced interest rates to deep artificial lows nearing and even under zero at times. This bullied traditional bond investors looking for yield income into dividend-paying stocks. The record-low interest rates fueled by QE were also used to justify extremely-expensive stock prices. QE aggressively forced legions of investors to buy stocks high.
The super-low borrowing costs driven by QE’s crushing downward pressure on interest rates also unleashed a vast corporate-stock-buyback binge unlike anything ever witnessed. Corporations borrowed trillions of dollars and euros to use to buy back their own stocks, boosting their stock prices. QE both enabled and provided the incentives for this anomalous extreme financial engineering, indirectly levitating stock markets.
Stock traders’ apparent belief over this past month that the Fed starting to reverse its QE through QT and the ECB greatly slowing its QE will have no meaningful impact on QE-levitated stock prices is absurd. The simultaneous reversal and slowing of QE in the States and Europe is a hellstorm relentlessly bearing down on hyper-complacent traders. It’s the financial equivalent of a Category 5+ super-hurricane, a juggernaut.
This Thursday the ECB announced it is slashing in half its ongoing QE bond monetizations from their current €60b-per-month pace to €30b per month for the first 9 months of 2018. After that the ECB’s QE will likely cease entirely, since it is running out of available bonds to buy because the ECB’s total QE has been so vast. That means ECB QE will collapse from €720b this year to €270b next year, a radical 62.5% plunge!
The idea that stock markets won’t miss €450b of ECB bond buying next year is ludicrous. The ECB has been monetizing bonds continuously with at least a €60b-per-month pace since March 2015. That will make for colossal total QE from then to December 2017 exceeding €2040b, growing to over €2310b by September 2018. €60b per month falling to €30b for most of next year and then likely zero will have a huge impact.
At current exchange rates, that €450b drop of ECB QE from 2017 to 2018 translates into $530b. That is likely enough all alone to tank global stock markets reliant on aggressive central-bank QE like crack cocaine. But add that on top of the Fed’s first-ever quantitative tightening now getting underway, and 2018 will see the greatest central-bank tightening in history. How can that not drive an overdue stock bear?
I discussed the Fed’s new QT campaign and likely market impact in great detail a month ago right after it was announced. While the Fed’s own QE bond buying formally ended in October 2014, it held all those bonds on its balance sheet until this month. Starting this quarter, the Fed is allowing $10b per month to roll off as they mature. That effectively destroys the money created to buy those bonds, removing QE capital.
$10b per month isn’t much initially, but the Fed is slowly ramping that to a target of $50b per month by Q4’18. The math is simple. Total Fed QT in 2017 will only run $30b, a rounding error relative to the vast size of QE’s trillions of monetized bonds. But in 2018 that Fed QT will add up to $420b. Add that to the $530b of ECB QE here in 2017 but not coming in 2018 due to the taper, and markets face $950b of CB tightening!
Can the world’s two most-important central banks collectively withdraw almost a trillion dollars of liquidity in 2018 alone without blowing a gaping hole in these lofty stock markets? Not a freaking chance! And 2019 looks even worse. Total ECB QE will likely run at zero, down from €720b this year. That translates into $850b. And the Fed’s QT will run at its terminal full speed of $600b annually. That adds up to $1450b!
So on top of 2018’s $950b less of ECB QE and new Fed QT compared to this year, 2019 faces another $1450b of collective tightening from the Fed and ECB relative to 2017. That means $2.4t of central-bank liquidity that exists in this record stock market year will vanish over the next couple years. I can’t imagine a more-bearish omen for excessively-large QE-inflated stock bulls than such a vast reversal of CB flows.
This first chart ought to shatter the Wall Street myth that today’s monster stock bull was driven by profits instead of extreme central-bank QE. It superimposes the SPX over the Fed’s balance sheet, which is where those QE-financed bond purchases rest. This is the most-damning chart in the stock markets, no mean feat at such extremes. Fed QT and far-less ECB QE is the stuff of nightmares for QE-inflated stock markets!
While the Fed initially birthed QE back in late 2008’s first stock panic in a century, QE’s primary impact on the stock markets started in early 2013. That was soon after the Fed first launched and then quickly more than doubled its third QE campaign. QE3 was radically different from QE1 and QE2 in that it was open-ended, with no predetermined size or duration. That gave it a gargantuan impact on stock psychology.
Whenever the stock markets started to sell off, Fed officials would rush to their soapboxes to reassure traders that QE3 could be expanded anytime if necessary. Those implicit promises of central-bank intervention quickly truncated all nascent selloffs before they could reach correction territory. Traders realized that the Fed was effectively backstopping the stock markets! So greed flourished unchecked by corrections.
This stock bull went from normal between 2009 to 2012 to literally central-bank-conjured from 2013 on. The Fed’s QE3-expansion promises so enthralled traders that the SPX went an astounding 3.6 years without a correction between late 2011 to mid-2015, one of the longest-such spans ever! With the Fed jawboning negating healthy sentiment-rebalancing corrections, psychology grew ever more greedy and complacent.
QE3 was finally wound down in October 2014, leading to this Fed-evoked stock bull soon stalling out. Without central-bank money printing behind it, the stock-market levitation between 2013 to 2015 never would’ve happened! Without more QE to keep inflating stocks, the SPX ground sideways and started topping. Corrections resumed in mid-2015 and early 2016 without the promise of more Fed QE to avert them.
2013 was the peak-QE3 year, when the Fed monetized a staggering $1020b in bonds through QE. Such vast central-bank liquidity injections catapulted the SPX 29.6% higher that year! The Fed tapered QE3 in 2014, which added up to $450b of additional bond buying that year. And the SPX only rallied 11.4%. Fed QE dropped by 56% between 2013 and 2014, and stocks’ rallying shrunk 62%. That’s certainly no coincidence.
Then in 2015 when Fed QE was zero, the SPX slipped 0.7%. See the pattern here? The more QE from central banks, the more the stock markets rise. Those vast capital injections from the Fed levitated the US stock markets by forcing yield-starved bond investors into stocks and facilitating immense corporate stock buybacks. This QE-driven stock bull peaked in mid-2015 soon after the Fed ceased its own QE!
The bear market that follows every stock bull should’ve started in late 2012, but the Fed warded it off with its massive open-ended QE3 campaign. That ultimately totaled $1590b before it ended in late 2014, when the delayed stock bear should’ve begun. Indeed it looked like it had, as the SPX started rolling over without Fed QE boosting it. The SPX suffered its first corrections in 3.6 years in mid-2015 and early 2016.
There’s a stellar probability the dominant reason the overdue stock-market bear didn’t arrive in 2015 was the ECB started its own QE campaign in March that year. The ECB effectively took the QE baton from the Fed, keeping world stock markets levitated through massive liquidity injections. ECB QE levitated European stock markets through the same mechanisms as the Fed QE had earlier levitated the US ones.
The global stock markets are heavily interconnected. Both rallies and selloffs in either the United States, Europe, or Asia often create the psychology necessary to drive similar moves in the other markets. So the ECB’s QE directly buoying European stock markets bled into US stocks, fending off the overdue bear that the end of the Fed’s QE should’ve awoken. It was hopes for more ECB QE that rekindled this tired bull.
The Fed’s QE3 bond buying was tapered to zero in November 2014. From that announcement in late October that year, the SPX would rally another 7.3% into May 2015 on sheer momentum and euphoria. After that it drifted sideways to lower for the next 13.7 months, suffering two corrections. It wasn’t until July 2016 that a new bull high was finally seen. That was soon after the UK’s surprise Brexit vote to leave the EU.
That June 2016 referendum stunned European leaders, potentially threatening their entire project to unite Europe. Thus the ECB’s central bankers rushed to vociferously promise to do anything necessary to maintain market stability through the Brexit process. So the SPX only broke out of its mounting bear trend thanks to hopes for more ECB QE! That rally soon fizzled until Trump’s surprise victory unleashed Trumphoria.
This extreme Trumphoria stock rally since early last November was driven by euphoric hopes for big tax cuts soon, not central-bank easing. But without the ECB’s colossal €720b or the equivalent of $850b in QE over the past year since the election, odds are this Trumphoria rally would’ve either been far more muted or never even existed. The Fed’s QT and ECB QE tapering are grave threats to QE-inflated stock markets.
The chart above proves how heavily dependent the SPX is on the Fed’s balance sheet, which has never materially shrunk before 2018. The European stock markets have seen a similar phenomenon as the ECB’s balance sheet ballooned under QE. Germany’s flagship DAX stock index is Europe’s leading one. In 2016 the DAX rallied 6.9% on over €720b of ECB QE. So far this year the DAX is up 12.8% on €600b of QE YTD.
There is absolutely no doubt these global stock markets are greatly reliant on extreme central-bank QE to keep levitating to new record highs. So the stock markets are in world of hurt in 2018 and 2019, with total central-bank liquidity from the Fed and ECB falling by $950b and $1450b respectively relative to 2017! There’s probably never been a greater bear-market catalyst than record QE being thrown into reverse.
If the Fed’s QT and the ECB’s QE taper proves so devastating to stocks, won’t these central bankers simply stop doing it? They certainly don’t want to tank stock markets, as both the US and European economies really need high stocks’ wealth effect to thrive. If stock markets fall enough to spawn some real fear in Americans and Europeans, they will pull in their horns on spending which hurts the real economies.
Still I suspect the Fed and ECB won’t and can’t stop their new tightening campaigns for several reasons. Both central banks are doing everything they can to be as gradual and transparent as possible to avoid spooking markets, which is wise. Such slow rampings of the Fed’s QT and the ECB’s QE taper aren’t likely to spark a sharp stock-market plunge. They’ll just gradually turn the screws to stocks, slowly forcing them lower.
Major bear markets tend to cut stock prices in half, although worse losses are likely after such extreme fake central-bank-goosed bull-market toppings. But these bears that inevitably follow bulls generally play out over a couple years. There are about 250 trading days per year, so a 50% loss spread across two years works out to a trivial average of 0.1% per day! No one will panic if CB tightening slowly boils the bulls.
And the reason both the Fed and ECB are tightening is to reload easing ammunition for the inevitable next financial crisis. The more QE the Fed can reverse with QT, and the less the ECB’s balance sheet bloats, the more room they will have to relaunch QE when they get scared again in the future. Central bankers know it’s critical to slow, stop, and unwind QE so they rebuild room to aggressively ease again later.
Finally both the Fed and ECB spent long months if not years preparing traders psychologically leading into these CBs’ QT and QE tapering. If either central bank chickens out and pulls back in response to stock markets slowly rolling over, that itself risks igniting intense selling. The only reason the CBs would slow their crucial normalizations from extreme QE is if they feared another looming massive financial crisis.
Traders would read any course change to less tightening by either central bank as an admission of serious problems in global markets, and rush for the exits. Not carrying through on these carefully-laid tightening plans would also severely hobble these CBs’ credibility, and thus their future abilities to calm markets in a crisis. The die is cast on Fed QT and ECB QE tapering, it can’t be changed without creating big problems.
If this radically-unprecedented transition from extreme easing to extreme tightening was happening in normal fairly-valued stock markets, it would still ominously portend a major bear. But thanks to these goofy central banks artificially enlarging and prolonging this stock bull through their QE, stocks have soared way up to bubble valuations! The extreme overvaluation rampant in stock markets today greatly magnifies the risks.
This last chart looks at the average trailing-twelve-month price-to-earnings ratio of the 500 SPX stocks, both in simple-average and market-capitalization-weighted-average terms. The past year’s Trumphoria rally on big-tax-cuts-soon hopes catapulted valuations into nosebleed bubble territory. Such extremes would herald an imminent bear market even if the most extreme CB easing in all of history wasn’t reversing.
This is a complex chart with dire ramifications for investors, which I last discussed in depth in late June. For our purposes today on central banks starting to strangle this extreme bull they’ve nurtured, look at the blue SPX-valuation lines. The average SPX-component P/E ratio in both simple and MCWA terms is now over 28x. At Zeal we calculate this crucial valuation data each month-end, so September’s is the latest.
Weighted by market capitalization, the SPX stocks’ average P/E in late September was 28.7x earnings! In simple-average terms, it looked even worse at 29.3x. These numbers are conservative too, because we cap all trailing-twelve-month P/E ratios at 100x to avoid outliers skewing the overall average. Amazon alone with its insane 250x P/E would catapult these up to 31.7x and 29.6x respectively. Valuations are extreme.
The US stock markets’ average trailing P/E over the past century and a quarter is 14x, which is fair value. Double that at 28x is formally a bubble, where we are today. Euphoric traders get so excited about stock markets rallying forever that they are willing to pay any price to get in, eagerly buying stocks high instead of prudently waiting to buy low. The higher the prevailing valuations, the greater the downside risk stocks face.
While valuations aren’t a market-timing tool, bubbles always eventually pop. There are no exceptions to this rule in history. When bubbles fail stocks fall sharply, entering major new bear markets. In order to trade at 14x fair value based on today’s corporate earnings, the SPX would have to literally be more than cut in half to 1225ish! The white line above shows where the SPX would trade at that historical 14x fair value.
Even more ominous, valuation mean reversions following stock prices getting too high in bulls never just stop at the mean. Instead momentum carries them through 14x to a proportional overshoot below that to undervalued levels. So there’s a high probability the inevitable next stock bear won’t bottom until stocks are trading well under 10x earnings, which would make for a bigger-than-50% bear from today’s bubblicious levels.
The key point here is stock markets are exceedingly risky on bubble valuations alone after central banks’ unprecedented extreme easing forced them so high for so long. Even if the Fed wasn’t embarking on QT to reload for future easing, even if the ECB wasn’t tapering QE because it’s running out of bonds to buy, a new stock bear would be a near-certainty on extreme valuations alone. Bulls are always followed by bears.
But throw in Fed quantitative tightening and ECB quantitative-easing tapering on top of that, and we are set up for one of the worst stock bears on record after one of the biggest and longest bulls ever. Truly these central banks that fostered this monstrous bull are now starting to strangle it. The next couple of years are going to see literally trillions of dollars less CB liquidity than the markets have enjoyed in 2017!
Again between Fed QT ramping and ECB QE tapering, 2018 is on track to see a colossal total $950b less capital injected from the Fed and ECB compared to this year. And based on the Fed’s and ECB’s current plans which are hard to slow or stop without destroying market confidence, 2019’s CB liquidity will come in at another $1450b lower than 2017’s. We are talking about $2.4t of effective tightening over the next 2 years!
There is zero chance stock markets will be able to ignore such radically-unprecedented CB tightening. $1.2t a year is a devastating hit to liquidity. Remember in 2013 the SPX soared 29.6% on $1020b of Fed QE via QE3. What’s going to happen to stock markets in 2018 when that reverses to -$420b with Fed QT alone, or 2019 at another -$600b with Fed QT running full speed? Add ECB tapering on top of that.
The unpopular hard truth euphoric investors don’t want to hear is stock markets ain’t gonna be pretty under Fed QT and ECB QE tapering. For the love of all things good and holy, take this seriously! Just like in all past stock-market toppings, greed and complacency are extreme so traders have no fear of this imminent central-bank-tightening threat. But it’s a Category 5+ hellstorm, unprecedented in stock-market history.
Investors really need to lighten up on their stock-heavy portfolios, or put stop losses in place, to protect themselves from the coming valuation mean reversion in the form of a major new stock bear. Cash is king in bear markets, as its buying power increases as stock prices fall. Investors who hold cash during a 50% bear market can double their stock holdings at the bottom by buying back their stocks at half price!
Put options on the leading SPY S&P 500 ETF can be used to hedge downside risks. They are cheap now with euphoria rampant, but their prices will surge quickly when stocks start selling off materially. Even better than cash and SPY puts is gold, the anti-stock trade. Gold is a rare asset that tends to move counter to stock markets, leading to soaring investment demand for portfolio diversification when stocks fall.
Gold surged nearly 30% higher in the first half of 2016 in a new bull run that was initially sparked by the last major correction in stock markets early last year. If the stock markets indeed roll over into a new bear in 2018, gold’s coming gains should be much greater. And they will be dwarfed by those of the best gold miners’ stocks, whose profits leverage gold’s gains. Gold stocks rocketed 182% higher in 2016’s first half!
The key to thriving and multiplying your fortune in bull and bear markets alike is staying informed, about broader markets and individual stocks. That’s long been our specialty at Zeal. My decades of experience both intensely studying the markets and actively trading them as a contrarian is priceless and impossible to replicate. I share my vast experience, knowledge, wisdom, and ongoing research in our popular newsletters.
Published weekly and monthly, they explain what’s going on in the markets, why, and how to trade them with specific stocks. They are a great way to stay abreast, easy to read and affordable. Walking the contrarian walk is very profitable. As of the end of Q3, we’ve recommended and realized 967 newsletter stock trades since 2001. Their average annualized realized gain including all losers is +19.9%! That’s hard to beat over such a long span. Subscribe today and get ready before CB tightening crushes stocks!
The bottom line is the Fed and ECB have started strangling this extraordinary stock bull they nurtured. After being levitated for years by trillions of dollars and euros of quantitative easing, these central banks have started tightening. The Fed has birthed quantitative tightening, which will increasingly reverse its own extreme QE. On top of that the ECB will radically slow its own QE next year, for unprecedented tightening.
This is the death knell for QE-inflated stock markets driven to extreme bubble valuations by epic central-bank monetary injections. The Fed and ECB are finally taking away their easy-money punch bowls, with truly-dire implications for stock markets. Trillions of dollars and euros of tightening in the next couple years will finally unleash the long-overdue stock bear delayed by QE, which will likely prove proportionally oversized.
Adam Hamilton, CPA
October 27, 2017
Copyright 2000 – 2017 Zeal LLC (www.ZealLLC.com)
If you would like to receive our free newsletter via email, simply enter your email address below & click subscribe.
 Follow us on Twitter
 Become our facebook fan
CONNECT WITH US
Tweets
Tweet with hash tag #miningfeeds or @miningfeeds and your tweets will be displayed across this site.
MOST ACTIVE MINING STOCKS
Daily Gainers
 CMC Metals Ltd. CMC Metals Ltd. |
CMB.V | +900.00% |
 Eden Energy Ltd Eden Energy Ltd |
EDE.AX | +200.00% |
| GoviEx Uranium Inc. |
GXU.V | +42.86% |
| Eagle Nickel Ltd. |
ENL.AX | +41.67% |
| Citigold Corp. Limited |
CTO.AX | +33.33% |
| Mount Burgess Mining NL |
MTB.AX | +33.33% |
| Exalt Resources Limited |
ERD.AX | +31.94% |
| Casa Minerals Inc. |
CASA.V | +30.00% |
| Cariboo Rose Resources Ltd |
CRB.V | +28.57% |
| Belmont Resources Inc. |
BEA.V | +28.57% |


