Last week we discussed the difference between a rally and bull market.
Gold stocks have been in a rally.
That rally is now over as gold stocks peaked at their 400-day moving averages days ago and sliced through their 200-day moving averages Friday.
Take a look at the charts of any gold stock index (GDX, GDXJ, HUI) and it’s clear they are in a downtrend.
Go back two to three years. You’ll see lower highs and lower lows. That’s a downtrend!
Until that changes, we have to respect that.
The change will come when the market knows the Fed is done hiking and anticipates the start of rate cuts.
Going back 65 years, I counted 13 times when the Fed went from rate hikes to rate cuts. The average gain in gold stocks during 11 of those periods was 172%.
The moves higher began an average and median of three to four months after the time of the last hike.
If the final hike is in March or June then the bull run should begin around the average time frame. If December 2018 was the final hike, then obviously the move higher could begin after the average or median period.
The immediate risk is the gold stocks could be starting another leg lower. In the chart below, we see similarities between GDX today and where it was in Q2 2015.
At both junctures the market had finished rallying after breaking down from a long consolidation. Note the points 1,2,3 and also the similarities in the advance-decline line. One positive difference is GDX relative to the stock market has surpassed its 200-day moving average.
In summation, we are looking for one more leg lower before a potential historic buying opportunity in precious metals. How much lower and for how long could depend on how soon the market is certain the Fed is done hiking.
Gold investment demand reversed sharply higher in recent months, fueling a strong gold rally. The big stock-market selloff rekindled interest in prudently diversifying stock-heavy portfolios with counter-moving gold. These mounting investment-capital inflows into gold are likely to persist and intensify. Both weaker stock markets and higher gold prices will continue to drive more investment demand, growing gold’s upleg.
Early in Q4’18, gold reached a major inflection point. It languished during the first three quarters of 2018, down 8.5% year-to-date by the end of Q3. Investors wanted nothing to do with alternative investments with the stock markets powering to new record highs. The flagship S&P 500 broad-market stock index (SPX) had rallied 9.0% in the first 3/4ths of last year. That left gold deeply out of favor heading into Q4.
But a critical psychological switch was flipped as the SPX started sliding last quarter. After long years with little material downside, stock traders had been lulled into overpowering complacency. They were shocked awake as the SPX plunged 14.0% in Q4, its worst quarter since Q3’11. They poured back into gold as stocks burned, driving it a strong 7.6% higher in Q4! Rekindled investment demand was the driver.
Unfortunately gold investment demand is rather murky. Gold is bought and sold every day all over the world, in countless venues ranging from major exchanges to tiny third-world merchants. Tracking even the majority of this in real-time is impossible. The best-available data on global gold investment comes from the World Gold Council. But it is only published once per quarter, about a month after quarter-ends.
I can’t wait to see the WGC’s new Q4’18 Gold Demand Trends report due out in early February. These quarterly GDTs are very well done and essential reading for all investors. But while detailed and informative, their resolution is really low only being released 4 times per year. Investors need alternative data sources to understand and game what’s going on with gold investment demand between the GDTs, like now.
Thankfully there’s an excellent proxy of investors’ capital flows into and out of gold published daily, a high-resolution read. It is the physical gold bullion held in trust for the shareholders of the world’s dominant gold exchange-traded fund. That of course is the American GLD SPDR Gold Shares. GLD was created and launched by the World Gold Council way back in November 2004, and has grown into a gold juggernaut.
As part of the WGC’s GDT work each quarter, it tracks the world’s top 10 physically-backed gold ETFs. At the end of Q3’18 when you could hardly give away gold to American investors, GLD’s holdings still accounted for nearly 32% of the world’s top-10 gold-ETF total. Add in the 2nd-largest ETF which is also American, the IAU iShares Gold Trust, and these two leading ETFs control over 3/7ths of the global top-10 total.
The primary constituency for American gold ETFs is American stock investors. So what they are doing in terms of capital flows through GLD especially is exceedingly important for gold. In recent years most of the major quarterly moves in gold prices are nearly fully explainable by GLD’s holdings alone! They must be watched daily, as changes in them have proven the key to gold’s fortunes. It’s important to understand why.
The American stock markets are the biggest in the world, and American investors’ capital is vast beyond compare. At the end of Q3’18, the collective market capitalization of the 500 elite SPX stocks alone was a staggering $26,141.4b. By comparison, GLD’s total physical-gold-bullion holdings of 742.2 metric tons were only worth $28.4b. That’s less than 1/9th of a single percent, which for all intents and purposes is zero.
Thus if even the tiniest fraction of U.S. stock-market capital migrates into or out of GLD shares, gold itself moves big. This dominant gold ETF effectively acts as a conduit between stock-market capital and gold. But as these colossal pools of capital slosh into and out of GLD, it is always at risk of failing its mission of tracking the gold price. The supply and demand of GLD shares and gold are independent of each other.
So differential buying or selling of GLD shares by American stock investors must be directly equalized into the underlying global gold market. This mechanism is simple in concept. When GLD shares are being bought faster than gold itself, this ETF’s price threatens to decouple from gold’s price to the upside. To prevent this, GLD’s managers need to shunt that excess GLD-share demand directly into gold in real-time.
They issue enough new GLD shares to offset that excess demand, and then use the proceeds to buy physical gold bullion held in trust for GLD’s shareholders. So when GLD’s daily holdings are rising, that reveals American stock-market capital is flowing into gold. This GLD capital pipeline into gold also works similarly on the downside, when American stock investors dump GLD shares faster than gold is being sold.
GLD’s share price will soon disconnect from gold’s price to the downside. This ETF’s managers avoid that by buying back GLD shares to sop up the excess supply. They raise the capital to do this by selling some of GLD’s physical-gold-bullion holdings. So when GLD’s daily holdings are falling, American stock-market capital is being pulled back out of gold. These holdings closely mirror world gold-investment trends.
My chart this week compares GLD’s daily gold holdings in metric tons with the gold price over the past several years or so. After falling to a major 6.1-year secular low in December 2015, gold started powering higher in a new bull market. Since gold hasn’t retreated 20%+ from its bull-to-date peak in July 2016, this bull remains alive and well. It has been overwhelmingly driven by American stock-market capital flows via GLD.
Let’s start in the middle of 2018, when GLD’s holdings were stable above 800t which has proven major support for this bull market. In much of the first half of last year, the stock markets were largely grinding sideways after the SPX suffered a sharp-yet-shallow-and-short correction in early February. The SPX finally started climbing decisively again in early Q3, ultimately achieving 5 new all-time record highs in that quarter.
That stoked incredible euphoria, convincing investors these amazing stock markets could rally indefinitely. By late September the SPX had skyrocketed 333.2% higher over 9.5 years, making for the 2nd-largest and 1st-longest stock bull in U.S. history! With general stocks looking invincible, there was little incentive to prudently diversify stock-heavy portfolios with gold. American stock investors were actually fleeing it.
In Q3 they sold GLD shares so aggressively that it forced a serious 76.8t or 9.4% draw in GLD’s holdings! All that selling pressure pushed world gold prices 4.9% lower that quarter. And GLD alone was mostly responsible. The WGC’s Q3 GDT showed total global gold demand actually grew a slight 0.6% year-over-year that quarter to 964.3t. Every major demand category grew considerably with a lone exception.
Global investment demand plunged 20.8% YoY to 194.9t. The WGC breaks it out into two major sub-categories, physical bar-and-coin demand and gold-ETF demand. The former was very strong, surging 28.0% YoY to 298.1t. But the latter plummeted from +13.2t in Q3’17 to -103.2t in Q3’18! Gold would’ve rallied nicely that quarter if not for GLD, which accounted for a commanding 2/3rds of that total world ETF drop.
When American stock investors are sustaining selling GLD shares faster than gold is being sold, it forces the world gold price lower. That serious Q3’18 GLD-holdings draw was the worst by far since back in Q4’16. That was when Trump’s surprise election victory with Republicans controlling both chambers of Congress ignited a major stock-market rally on hopes for big tax cuts soon. The resulting euphoria hammered gold.
While the SPX only climbed 3.3% in Q4’16, 8 new all-time record highs were achieved. American stock investors jettisoned gold with reckless abandon, both to chase that stock surge and out of relief that the political uncertainty didn’t trigger a stock selloff as feared. The differential GLD-share selling proved so intense that this ETF suffered a colossal 125.8t or 13.3% holdings draw, which crushed gold 12.7% lower!
Total world gold demand per the latest WGC GDT dropped 103.4t or 9.0% YoY that quarter. That huge GLD draw alone was 122% of that! Overall global gold-ETF demand fell 107.0t from -66.4t in Q4’15 to -173.4t in Q4’16. GLD’s draw was 118% of that. So literally the only reason gold plunged in Trump’s election quarter was American stock investors pulling big capital out of GLD forcing it to sell physical gold bullion.
Compared to that extreme dump, gold was relatively resilient in Q3’18. While GLD’s draw ran 61% of that Q4’16 episode, gold only declined 39% as much. There were hints the stock markets were ready to roll over into a long-overdue new bear. On Q3’s final trading day with the SPX just under its recent record peak, I published an essay explaining why Q4’s first-ever full-speed Fed QT was this stock bull’s death knell.
Indeed within a week of Fed QT ramping up to $50b per month of monetary destruction, the SPX started to falter. Its first serious down day erupted on October 10th when this leading stock-market benchmark plunged 3.3%. That triggered a major sentiment shift in gold. GLD enjoyed a large 1.2% holdings build that day on heavy differential GLD-share buying. Those were its first capital inflows at all since late July.
That very day American stock investors’ faith in perpetually-levitating stock markets started to crack, they started remembering gold. As Q4 wore on and that SPX selloff snowballed into a 4%+ pullback, a 10%+ correction, and narrowly missed new-bear-market territory at -19.8% on Christmas Eve, gold investment demand continued growing. Tending to rally when stocks fall, gold is essential for wisely diversifying portfolios.
By the time the dust settled on Q4, American stock-market capital sloshing back into gold via that GLD conduit had fueled a 45.4t or 6.1% holdings build. That was the biggest by far since way back in Q2’16 soon after this latest gold bull was born. All that differential GLD-share buying forced gold 7.6% higher in Q4 as the SPX plunged 14.0%. The WGC’s coming Q4’18 GDT will likely prove GLD largely drove gold’s gains.
The last time American stock investors started returning to gold after stock-market corrections spooked them was in the first half of 2016. Remember gold had just slumped to a major 6.1-year secular low, so it was deeply out of favor suffering incredibly-bearish sentiment. Yet in Q1’16 GLD’s holdings skyrocketed an epic 176.9t of 27.5% higher, which catapulted gold up 16.1%. Nothing else mattered per the WGC.
Overall world gold demand soared 188.1t or 17.1% YoY that quarter. GLD’s enormous build driven by American stock investors returning to gold accounted for an amazing 94% of that! If their vast pools of capital hadn’t sloshed back into gold via GLD that quarter, this bull never would’ve been born. And that utter dominance of American stock-market-capital inflows through GLD persisted in the subsequent quarter.
In Q2’16 gold surged another 7.4% higher on a 130.8t or 16.0% GLD-holdings build. The WGC reports that total world gold demand climbed 123.5t or 13.2% YoY that quarter. GLD’s huge build alone was responsible for 106% of that. So again without American stock-market capital moving into gold through that leading GLD conduit, that initial gold-bull upleg wouldn’t even exist. GLD dominates the gold world.
There have been 13 quarters since Q4’15 when today’s gold bull was born. 8 of them have seen major gold moves higher or lower. In all but one of these cases, GLD’s builds or draws accounted for the vast majority of the overall yearly change in total world gold demand. In the remaining 5 quarters where gold ground sideways or moved comparatively modestly, GLD’s holdings didn’t change very much either.
So there’s no doubt GLD’s strong build in Q4’18 ignited and fueled by this new SPX selloff is an important omen for gold. Once American stock investors start buying gold again via GLD shares in a big way, the resulting major gold uplegs tend to become self-feeding. Investors love chasing performance. The higher gold rallies, the more stock investors want to own GLD. And the more GLD they buy, the faster gold climbs.
And while correction-grade 10%+ stock-market selloffs are the catalysts that trigger renewed investment demand for gold, it usually persists well after the SPX bottoms and bounces. In essentially the first half of 2016, gold blasted 29.9% higher in just 6.7 months. That was totally fueled by an epic 351.1t or 55.7% build in GLD’s holdings as American stock investors rushed back into gold. That upleg peaked in early July.
But the 13.3% SPX correction that spawned it actually bottomed in mid-February. Over the following 4.9 months leading into gold’s top, the SPX blasted 16.4% higher! Nearly 3/4ths of gold’s upleg duration came after the stock selloff that ignited it, and just over 3/4ths of GLD’s upleg build also happened after the SPX had bottomed. Major gold uplegs take on a life of their own after being triggered by stock selloffs.
So even if today’s stock selloff ended at a severe correction on Christmas Eve and this record bull still has farther to run, gold investment demand should remain strong on upside momentum. But far more likely the long-overdue young new stock bear is being born. The SPX’s enormous and violent surge since that deep Christmas Eve low looks exactly like a classic bear-market rally technically, an ominous sign.
Bear-market rallies are the biggest and fastest ever witnessed in all of stock-market history. They soar out of major lows in sharp V-bounces on frantic short covering, then gradually run out of momentum over a couple to few weeks. If the stock markets are indeed rolling over into a new bear, far more weakness is guaranteed over the next couple years or so. That will fuel sustained gold-investment-demand growth.
Bear markets in stocks following major bulls are nothing to be trifled with. The last couple bears in the early and late 2000s saw the SPX fall 49.1% over 2.6 years and 56.8% over 1.4 years! 50% bears are common and expected after large bulls. And if we are early in the next bear, gold will likely be the top-performing asset class while it runs its course. American stock investors buying GLD shares will lead the way.
So far in January 2019, this huge apparent bear-market rally in the SPX has stalled investment demand for gold. Like many bear rallies, it has rekindled great greed and complacency. So GLD hasn’t experienced many significant builds yet in this young new year. But those capital inflows will return with a vengeance once the SPX starts rolling over and weakening again, likely driving gold sharply higher like in early 2016.
Again that sustained investment demand in H1’16 catapulted the yellow metal 29.9% higher pretty much exclusively on differential GLD-share buying. A mere 20% upleg off gold’s recent mid-August low driven by record gold-futures short selling would catapult it back up over $1400. Anything above the bull-to-date peak of $1365 in July 2016 is going to unleash a flood of new investor excitement in gold and big demand.
So this gold bull is likely to grow a lot larger in coming quarters. The greatest beneficiaries will be the gold miners’ stocks, as their profits leverage gold’s gains. Roughly during that mostly-H1’16 major gold upleg, the leading GDX and GDXJ gold-stock ETFs rocketed 151.2% and 202.5% higher! The better gold stocks with good fundamentals are going to soar again during gold’s next upleg, which is already well underway.
The earlier you get deployed, the greater your gains will be. That’s why the trading books in our popular weekly and monthly newsletters are currently full of better gold and silver miners mostly added in recent months. The gains we won in 2016 were amazing the last time American stock investors returned to gold. Our newsletter stock trades that year averaged +111.0% and +89.7% annualized realized gains respectively!
The gold-stock gains should be similarly huge in this next major gold upleg. The gold miners are the last undervalued sector in these still-very-expensive stock markets, and rally with gold during stock-market bears unlike anything else. To multiply your wealth in the stock markets you have to do your homework and stay abreast, which our newsletters really help. They explain what’s going on in the markets, why, and how to trade them with specific stocks. You can subscribe today for just $12 per issue!
The bottom line is gold investment demand began surging again in Q4, ignited by that major stock-market selloff. American stock investors started remembering gold, returning to GLD to diversify their portfolios which drove gold sharply higher. Once gold begins returning to favor after such major inflection points, its uplegs tend to grow large. Investment buying is self-feeding, with higher gold prices enticing in ever more capital.
Gold buying begets gold buying long after stock markets bounce, as investors love chasing performance. But odds are these lofty stock markets are now rolling over into a major new bear, portending much more weakness to come. Gold investment demand will thrive for years in that scenario, catapulting both gold and the stocks of its miners far higher. There’s no better place to multiply wealth during bear markets.
“Some analysts believe China could deliver 2 trillion yuan ($296.21 billion) worth of cuts in taxes and fees, and allow local governments to issue another 2 trillion yuan in special bonds largely used to fund key projects.” – CNBC News, Jan 15, 2019.
China’s economy is likely to grow in the 6.2%-6.5% range for 2019 and the stimulus is inflationary. While that growth is the slowest pace in almost thirty years, it’s still “head and shoulders” above the horrifying meltdown in growth that the United States is likely about to experience.
Please click here now. Goldman is predicting a meltdown in U.S. earnings growth from 20%+ in 2018 to just 3% to 6% for 2019!
Goldman’s heavyweight analysts are also predicting that US GDP growth melts towards 1% by the third quarter of this year. This, while Morgan Stanley is predicting an “earnings recession”.
Germany’s economy is already slipping towards 1% GDP growth and EU earnings are unlikely to grow more 5% in 2019.
Interestingly, most big bank economists are predicting an uptick in inflation will accompany the slide in Western earnings and GDP growth. Clearly, all roads lead to…gold!
On that note, please click here now. Double-click to enlarge. Gold continues to perform remarkably well at a time when a substantial pullback would be expected.
Conspiracy buffs are waiting for the “banksters” to smash the gold price. Where is the smash? Well, it doesn’t exist. All that’s happening is mild consolidation.
A pullback to key Fibonacci retracement lines in the $1250-$1260 area would be healthy but even that may not happen. Current technical action indicates a very healthy gold market.
Please click here now. Gold has raced to an all-time high against the Australian dollar. There’s a loose triangle pattern in play. The target of that pattern is well above $2000.
It’s very important for gold stock enthusiasts to make some effort to own at least a few Australian gold stocks that trade on Australian markets. Many of these stocks have been in powerful uptrends for years and are likely in a new acceleration phase.
Gold is also doing well against the British Pound and the Cbone (Canadian dollar). Most of the world’s gold stocks trade on the Canadian stock market and a lot of them are beginning to show good technical action.
Please click here now. Double-click to enlarge. The paint is barely dry on the Barrick-Rangold merger, and now Newmont is buying Goldcorp!
When mergers or takeovers happen, I like to see the new entity prove itself technically, with momentum. In the case of Barrick (GOLD-NYSE), I’ve suggested that investors need to see a weekly close of $14 for that to happen.
For Newmont, I need to see a weekly close of $36. That would suggest institutional money managers are endorsing the new entity. Once that happens I would be a buyer of every dollar of price weakness in the stock.
Both Barrick and Newmont are key GDX components. I’m impressed with the relative strength of GDX in the face of the softness in both those stocks.
Please click here now. Double-click to enlarge. While GDX “should” pull back to about $20 from the current price zone, the technical action is superb.
Note the fade in volume as price drifts sideways in the $21.50 resistance area. That’s extremely positive. Eager accumulators should be buyers of every ten cents of price weakness between $21 and $20.
Once the current consolidation ends, I’m anticipating a surge to the $23 price area… on strengthening volume.
Goldman’s influential gold market analyst Jeff Currie has a new $1425 target for gold in 2019. That’s an important number, because most gold and silver miners have made a significant effort to reduce their AISC (all-in sustaining cost) numbers.
A gold price in the $1400+ area would turn many of these companies into “cash cows”… and do so at a time when most companies in America face an earnings and revenue meltdown.
An institutional stampede into gold stocks in this new and emerging situation is not a pipe dream. It’s becoming more of a probable event than just a potential scenario.
Please click here now. Double-click to enlarge. My weekly gold chart shows that $1300 resistance is merely a pitstop on the road to the inverse H&S bottom neckline at about $1392.
If Goldman’s $1425 target price is achieved in 2019, it would mean gold has traded well above the neckline, ushering in a new target zone of about $1750. That $1750 price would turn most gold miners into not just cash cows, but cash cow superstars!
Special Offer For Website Readers: Please send me an Email to freereports4@gracelandupdates.com and I’ll send you my free “Golden Sweet Spot” report. I highlight six gold stocks trading the $3 to $7 price range that give investors an ideal mix of managed risk and potentially enormous reward! I include key buy and sell points for each stock.
Stewart Thomson is no longer an investment advisor. The information provided by Stewart and Graceland Updates is for general information purposes only. Before taking any action on any investment, it is imperative that you consult with multiple properly licensed, experienced and qualified investment advisors and get numerous opinions before taking any action. Your minimum risk on any investment in the world is: 100% loss of all your money. You may be taking or preparing to take leveraged positions in investments and not know it, exposing yourself to unlimited risks. This is highly concerning if you are an investor in any derivatives products. There is an approx $700 trillion OTC Derivatives Iceberg with a tiny portion written off officially. The bottom line:
Are You Prepared?
Gold miners’ exchange-traded funds are surging with gold powering higher. These mounting gains are naturally fueling growing interest in the leading gold-stock investment vehicles. Traders looking to deploy capital are wondering which major gold-stock ETF is superior, offering the best balance between upside potential, component fundamentals, and risks. GDXJ takes the crown, besting its larger big brother GDX.
By my count, there are currently 14 gold miners ETFs trading in U.S. markets. But that’s not authoritative, as the broader ETF industry is constantly in flux. These gold-stock ETFs collectively held $17.5b in net assets as of the middle of this week. And two major ETFs utterly dominated, commanding fully 85.1% of all those gold-stock investments! They are of course GDX and GDXJ, which dwarf everything else in this sector.
The GDX VanEck Vectors Gold Miners ETF and GDXJ VanEck Vectors Junior Gold Miners ETF hold net assets of $10.6b and $4.4b, or 60.2% and 24.9% of American gold-stock ETFs’ total. They have a huge and likely-insurmountable first movers’ advantage, being birthed way back in May 2006 and November 2009 respectively. They’ve gradually built great brand recognition, even being viewed as primary sector indexes.
When hedge funds report their equity holdings every quarter, if they have any gold-stock exposure GDX or GDXJ often top those lists. When gold miners are discussed on CNBC, GDX and to a lesser extent GDXJ are used in charts as sector benchmarks. VanEck’s popular pair of leading gold-miners ETFs are well-known to investors and speculators interested in this sector. They are effectively the only game in town.
With one company managing both GDX and GDXJ, and actively marketing them as a “Gold Miners ETF” and a “Junior Gold Miners ETF”, you’d think they are as different as their names imply. But unfortunately that’s not really the case. GDX and GDXJ hold many of the same component gold miners, with massive overlap in their holdings. And GDXJ’s definitely aren’t junior gold stocks, but actually larger mid-tier gold miners.
I’ve researched and written extensively on this. Every quarter I wade through the latest results from the top 34 component stocks of both GDX and GDXJ. The latest-available data is still Q3’18’s, as the full-year reports including Q4 aren’t due until 60 to 75 days after year-end depending on companies’ market capitalizations. As the recent Q3 earnings season wrapped up, GDXJ’s components were a subset of GDX’s.
GDXJ’s top 34 stocks accounted for 82.9% of its total weighting. And fully 31 of these components were also GDX components. These common gold miners across both ETFs weighed in at a massive 79.2% of GDXJ’s total weighting, and 31.7% of GDX’s. So nearly 4/5ths of this “Junior Gold Miners ETF” is made up by nearly 1/3rd of the major “Gold Miners ETF”. GDXJ is now a mid-tier gold miners ETF, not a junior one!
It wasn’t always this way, with GDXJ staying true to its advertised mission in its early years. But GDXJ became a victim of its own success in the first half of 2016. A young gold bull fueled skyrocketing gold-stock prices as traders flooded in to chase their rallies. GDXJ quickly grew so large that it risked running afoul of Canadian securities laws, where most of the world’s smaller gold miners’ and explorers’ stocks trade.
In the Canadian stock exchanges which are the centre of the junior-gold universe, an antiquated rule severely hobbles ETFs. Once any investor including ETFs acquires a 20%+ stake in any Canadian stock, it is legally deemed a takeover offer that must be extended to all shareholders! American stock-market capital flooding into GDXJ in early 2016 pushed many of its Canadian-junior ownership percentages near 20%.
Obviously hundreds of thousands of investors buying ETF shares have no intention of taking over gold-mining companies, no matter how big their collective stakes. That’s a totally-different scenario than a single corporate investor buying 20%+. Instead of lobbying Canadian regulators to exempt ETFs, GDXJ’s managers chose to unilaterally redefine what junior gold miners are. Stakes in Canadian juniors were slashed.
For decades juniors were often considered to be gold miners producing less than 200k ounces annually. To give GDXJ the benefit of the doubt, I conservatively expand that to 300k. That works out to 75k per quarter. In Q3’18, only 3 of the top 34 GDXJ component stocks were primary gold miners that met this junior threshold! The rest were mid-tier miners between 300k to 1m ounces per year, and even 1m+ majors.
GDXJ made these mission changes stealthily, knowing they would be controversial. It took me quarters to piece this all together, and I was an outspoken critic of the “Junior Gold Miners ETF” no longer being what it was billed as. But if you ignore the deceptive title, GDXJ has grown into an amazing mid-tier gold-miners ETF. It owns lots of the world’s best gold miners, which are given much-higher weightings than in GDX.
The mid-tier gold miners producing between 300k to 1m ounces per year are in the sweet spot for stock-price upside. Unlike the majors over 1m which are struggling with production declines, the mid-tiers are expanding existing mines and building new ones to boost their output and earnings. The mid-tier gold miners have smaller market caps too, making it much easier for capital inflows to bid up their stock prices.
Production is the lifeblood of the gold-mining industry, so traders often prize growth there above anything else when picking gold stocks. In Q3’18, the top 34 GDX gold miners including all the majors saw their total production decline 2.9% year-over-year to 9.5m ounces! That was stunning compared to the World Gold Council’s read on overall global gold mined that quarter, which actually grew a healthy 1.9% YoY.
GDX is heavily burdened by giant gold miners with shrinking production and high market caps, retarding its upside potential. GDXJ has some similar problems but to a lesser extent. Inexplicably GDXJ includes the major South African gold miners which are the worst in this industry for falling production and high mining costs. In Q3 four of them weighing in at 13.1% of GDXJ’s weighting suffered sizable production declines.
Excluding them and a fast-growing mid-tier gold miner that was oddly removed from GDXJ over the past year, the rest of the top 34 GDXJ gold miners achieved strong 3.4% YoY production growth in Q3! All the growth in the gold-mining industry is now coming from the mid-tier miners. GDXJ not only holds the best mid-tiers, but they have much-higher weightings than in the major-dominated GDX. GDXJ is the place to be.
In addition to the mid-tier gold miners’ growing production and lower market capitalizations, their mining costs are in line with the majors. In Q3 the top 34 GDX gold miners averaged all-in sustaining costs of $877 per ounce. The difference between that and prevailing gold prices shows industry profitability. The top 34 GDXJ gold miners had similar $911 AISCs in Q3. Without those South African majors, it was $877 too.
So if you can get past the fact GDXJ certainly isn’t a “Junior Gold Miners” ETF, it is superior to GDX in every way. The top 34 GDX stocks averaged 288.8k ounces mined in Q3, while GDXJ’s top 34 came in 43% lower at 163.3k. That’s still far above the 75k conservative junior threshold, but this mid-tier gold-miner range is where the vast majority of world production growth is happening. GDXJ action reflects this.
I’ve been writing about GDXJ outperforming GDX in my quarterly-results essays and newsletters for the better part of several years now. But until this week I hadn’t done the work to formally quantify GDXJ’s superior upside. I’ve been curious about it for some time, and have received more questions on it with gold stocks powering higher again. So I dug into this gold-stock bull’s GDXJ and GDX performances so far.
Since gold miners’ stocks are exceedingly volatile, bulls and bears in them are often delineated instead by gold itself. Today’s gold bull was born in December 2015 before surging in a powerful upleg in the first half of 2016. While gold has suffered a couple of serious corrections since, it never crossed that -20% new-bear threshold. So with gold in a continuous bull market for 3.1 years now, so too are the gold stocks.
They are effectively leveraged plays on gold since gold-mining profits directly amplify underlying moves in gold. The major gold stocks of GDX generally leverage gold uplegs and corrections by 2x to 3x. So if gold rallies 10%, GDX usually climbs 20% to 30%. Since GDX has become the leading benchmark for this entire sector, GDXJ’s performance is best considered relative to GDX’s. This chart summarizes it all.
GDX and GDXJ were both hammered to fundamentally-absurdall-time lows back in mid-January 2016 soon after gold’s own 6.1-year secular low. Ever since gold stocks have meandered in a series of bull-market uplegs and corrections. The performances of GDXJ and GDX in these recent years are rendered in blue and red below. Key stats are shown for each major gold ETF’s uplegs and corrections during that span.
The vertical light-blue lines divide up GDXJ’s uplegs and corrections, which generally match GDX’s but sometimes see major lows or highs out of sync. Each GDXJ upleg or correction shows GDXJ’s total gain or loss, the time that move took in months, GDX’s corresponding move over that identical span, and GDXJ’s leverage to GDX in yellow. The actual full GDX uplegs and corrections are also shown below in red.
Even in today’s young, delayed, mostly-unpopular, and weak gold-stock bull, GDXJ has outperformed GDX by a wide margin. And that’s despite GDXJ morphing from being a true junior-gold-miner ETF in the first half of 2016 to a mid-tier gold-miner ETF over the subsequent year. Even holding bigger gold miners, their superior fundamentals to the struggling majors have enabled GDXJ to keep the performance crown.
In just 6.4 months in largely the first half of 2016, gold stocks as measured by GDX skyrocketed 151.2% higher on a 29.9% gold upleg. GDXJ well-outperformed GDX in roughly that same span, blasting 202.5% higher in 7.0 months! GDX actually rallied 146.6% within GDXJ’s exact upleg, showing the mid-tier gold-stock ETF leveraged the major gold-stock ETF’s massive upleg by a solid 1.38x. GDXJ’s upside bested GDX’s.
Gold’s powerful initial upleg was followed by a massive correction in the second half of 2016, where it plunged 17.3% after Trump’s surprise election victory unleashed a huge stock-market surge on hopes for big tax cuts soon. The gold-stock carnage as gold plunged was great, with GDXJ plummeting 45.5% in just 4.1 months. Interestingly that leveraged GDX’s downside by 1.20x, much less than in the preceding upleg.
Ever since, the gold stocks have been mostly stuck in a big consolidation trading range. Enthusiasm for this sector waned to nothing as general stocks kept powering higher in recent years which relegated gold to drift sideways as well. While this extraordinary gold-stock-bull disruption was highly unusual, it was the result of record U.S. corporate tax cuts levitating the stock markets. That one-off event finally passed in 2018.
If you go through all this gold-stock bull’s uplegs, GDXJ’s gains outpaced GDX’s by an average of 1.39x! Ranging from 1.30x on the low side to 1.51x on the high side, there was not a single gold-stock upleg in recent years where GDXJ didn’t majorly outperform GDX. Taking GDX’s usual 2x to 3x leverage to gold and adding another 39% of marginal GDXJ gains on top of that is impressive. What trader wouldn’t want that?
GDXJ’s much-superior upside in this young bull is also accompanied by outsized downside relative to GDX during gold-stock corrections. That’s logical, as bigger mid-tier gold-stock gains in preceding uplegs leave more room to sell off in subsequent corrections. Interestingly though, GDXJ’s downside leverage averaging 1.34x is a bit lower than its upside leverage in uplegs. That is skewed to the high side as well.
It ranged from a low of 1.07x in the latest gold-stock selloff last summer and autumn to a staggering 1.77x in spring 2017. That outlier was the result of GDXJ’s gold miners surging far faster than GDX’s in early 2017. Without that anomaly, GDXJ’s downside leverage to GDX during corrections averages only 1.20x. That is merely about half its upside leverage, so GDXJ’s added risks are disproportionally smaller than its better upside.
Given all this, there is really no reason to bother with GDX at all if you are deploying capital in major gold-stock ETFs. GDXJ has better mid-tier gold miners growing their production while trading at lower market caps than the struggling majors. GDXJ has demonstrated much-better upside during gold-stock uplegs throughout this young bull, yet its downside during corrections isn’t proportional. GDXJ is far superior.
That being said, investors and speculators are much better off avoiding these major gold ETFs entirely! While GDXJ is nowhere near as bad as GDX, both are still burdened by major gold miners with declining production and rising costs. It doesn’t make any sense to own such laggards when they can be avoided entirely in favor of mid-tiers and true juniors with great fundamentals like growing production and stable costs.
The best strategy for riding this reaccelerating gold bull to wealth-multiplying gains in gold stocks is to carefully handpick the best mid-tier gold miners mostly included in GDXJ. Every quarter I break out this ETF’s top 34 and look at their production, costs, operating cash flows, earnings, and sales trends among others. That exercise helps separate the gold miners with better fundamentals from the lagging weaker ones.
So instead of just settling and owning GDXJ, even-better gains are highly probable by sticking to mid-tiers and juniors with superior fundamentals. They rank lower in GDXJ’s weightings and are usually growing their production organically or through new mine builds that recently came online or will soon be live. With plenty of great gold miners in this sector, there’s simply no need to hold the laggards retarding even GDXJ.
With gold stocks now enjoying a major upside breakout, massive new investment buying is coming. And the best gains by far will be won in smaller mid-tier and junior gold miners with superior fundamentals. While GDXJ itself will power dramatically higher despite some deadweight in its holdings, the better gold miners will generate much-greater wealth creation. Finding and owning these better gold-mining stocks is essential.
That’s one of my important missions at Zeal, relentlessly studying the gold-stock world to uncover the stocks with the greatest upside potential. The trading books in both our weekly and monthly newsletters are currently full of these better gold and silver miners. Most of these trades are relatively new, added in recent months as gold stocks recovered from deep lows. So it’s not too late to get deployed ahead of big gains!
To multiply your wealth in stocks you have to do some homework and stay abreast, which our popular newsletters really help. They explain what’s going on in the markets, why, and how to trade them with specific stocks. Walking the contrarian walk is very profitable. As of Q3, we’ve recommended and realized 1045 newsletter stock trades since 2001. Their average annualized realized gain including all losers is +17.7%! That’s double the long-term stock-market average. Subscribe today for just $12 per issue!
The bottom line is GDXJ’s upside easily bests GDX’s. While GDXJ is now really a mid-tier gold miners ETF instead of the junior one advertised, it holds some of the world’s best gold miners. Unlike struggling majors which dominate GDX, plenty of mid-tiers are still growing their production. They enjoy superior fundamentals and are weighted much more heavily in GDXJ than GDX, giving it much-better potential gains.
Throughout this entire young gold bull of recent years, GDXJ has well-outperformed GDX during gold-stock uplegs. While that has also led to bigger downside during corrections, it is disproportionally small compared to the upleg gains. GDXJ simply offers superior gold-stock sector exposure than GDX. But both these major gold-stock ETFs are still burdened with laggards dragging down their overall performances.
As we’ve been saying, the stock market will have great influence on Gold. It has been easy to see in recent months.
The S&P 500 has cracked, losing both its 200-day and 400-day moving averages. Gold and gold stocks have benefitted and gained in recent months even with a stable to rising U.S. Dollar.
The past 65 years of history shows us that in almost any context (but not all) the time between the Fed’s last rate hike and first rate cut is exactly when you want to buy gold stocks.
We don’t know if December is the last rate hike. No one does.
What we do know is the stock market is approaching an extreme oversold condition and is likely to begin a counter trend rally very soon.
In the chart below we plot five indicators that can help define an extreme oversold condition. These include the Vix, the put-call ratio and several breadth indicators. All but the Vix are in extreme oversold territory.
As we pen this article, the S&P 500 is trading at 2436.
The 40-month moving average, which has provided key support and resistance over the past 20 years (including the 2016 and 2011 lows) is at 2395 while the 50% retracement of the 2016 to 2018 advance is at 2380.
The setup for a bullish reversal is in place.
Meanwhile, despite the recent carnage in stocks, precious metals have been unable to surpass resistance.
Gold is set to close the week right below a confluence of resistance at $1260-$1270. Perhaps it will close right on its 200-day moving average at $1258.
The gold stocks (GDX, GDXJ) have been strong since Thanksgiving but appear to have been turned back at their 200-day moving averages.
So in recent days the selloff in the S&P 500 accelerated but precious metals (at least to this point) failed to capitalize in a bullish fashion.
If the S&P 500 is within one or two days of a rally then we should not expect much more upside in Gold and GDX in particular. Those were the markets that benefited most from weakness in the S&P 500.
As we noted last week, the weakness in the stock market (and the economy) has not done enough to change Fed policy yet.
Over the past 65 years, the start of bull markets and big rallies in gold stocks coincided with the start of rate cuts. When the market sniffs the first rate cut, we will know precious metals are beginning a sustained advance and not another false start.
The recent stock-market selloff is persisting, fueling mounting worries among investors. The intensifying volatility and lack of a quick rebound higher is strangling euphoric sentiment, spawning self-reinforcing selling pressure. Scoffed at a few months ago, the notions that a young bear market is underway and a recession looms are gaining traction. The great beneficiary of this ominous stock-market downturn will be gold.
Gold has always been an essential asset class for prudently diversifying investment portfolios. Uniquely it tends to rally when stock markets weaken, offsetting some of the losses in typical stock-heavy portfolios. Gold acts like portfolio insurance, usually soaring when stock markets plunge on unforeseen news. All throughout history, wise investors have recommended everyone have 5% to 10% of their portfolios in gold.
But like insurance in general, the important role gold plays in portfolios is gradually forgotten when it isn’t needed. Just a few months ago, the U.S. stock markets seemed invincible. The flagship S&P 500 broad-market stock index (SPX) had powered 333.2% higher over 9.5 years by late September. That made for the 2nd-largest and 1st-longest stock bull in U.S. history! Investors were convinced that would last indefinitely.
The SPX had surged 9.6% year-to-date by that latest peak, while gold had slumped 7.3%. Thus investors felt no need to allocate virtually any capital to gold, they were and are radically underinvested in it. This is especially true of American stock investors, who were wildly optimistic after long years of big stock-market gains. Their effective portfolio exposure to gold was vanishingly small back in late September.
The 500 elite stocks of the SPX had an extreme collective market capitalization way up at $26,141.4b as that topping month waned. It is interesting contrasting that with the physical gold bullion holdings of the world’s dominant gold exchange-traded fund, the American GLD SPDR Gold Shares. GLD has long been the go-to destination for American stock investors looking to allocate capital for gold exposure in their portfolios.
At the end of September as stock euphoria peaked, GLD’s total holdings were merely worth $28.4b. That implies American stock investors were running trivial gold allocations around 0.11%! That’s on the order of only 1/50th the minimum 5% that’s been universally advised for centuries if not millennia. So it’s not much of a stretch to argue American stock investors had zero gold exposure, they were effectively all-out.
The sharp stock-market selloff in the few months since those halcyon all-time record highs has surprised most, but it shouldn’t have. As Q4’18 dawned, something ominous happened that was unprecedented in stock-market history. The US Federal Reserve upped its quantitative-tightening campaign necessary to start unwinding its $3625b of quantitative-easing money creation over 6.7 years to its terminal velocity.
October 2018 would be the first month ever to see the Fed’s monetary destruction ramp to a staggering $50b-per-month pace. And even to unwind just half of the Fed’s radical QE, QT would have to keep on destroying $50b per month of QE-conjured money for 30 months! At the end of September when the SPX was just 0.6% off its all-time record high, I explained all this in depth warning it was this bull’s death knell.
And indeed within a week of Fed QT going full-throttle, the SPX started to slide. There was no way QE-levitated stock markets could ignore QT obliterating that QE money. Every daily selloff since had its own unique story and specific drivers, which I discussed and analyzed in our subscription newsletters. These all added up to enough selling to spawn an ongoing stock-market correction, an SPX selloff exceeding 10%.
Blame it on Fed QT, stock-market bubble valuations, mounting US-China trade-war threats, Republicans losing the House, or whatever you want, but by Black Friday the SPX had fallen 10.2% over 2.1 months since that euphoric record peak. The stock markets staged some sharp rallies within that span, but they quickly fizzled proving to be dead-cat bounces. This recent action is ominously looking very bear-market like.
We can’t know for sure whether the long-overdue new bear market driven by epic record Fed tightening is indeed upon us until the SPX falls 20%+ on a closing basis. This recent correction would still have to double to hit that bear-market threshold. But gold has certainly been the main beneficiary of the recent stock-market weakness. Investors are starting to remember the ages-old wisdom of diversifying into gold.
This week’s chart looks at the US-dollar gold price superimposed over the SPX during the past 4 years or so. Despite gold being forgotten in recent years as the stock markets surged ever higher, it remains in a young bull market. And that was spawned by the last set of back-to-back corrections in the SPX, which catapulted gold sharply higher. We’re likely on the verge of another stock-selloff-driven major gold upleg!
GLD’s physical-gold-bullion holdings held in trust for its shareholders reveal how American stock investors feel about gold. This past spring they started slumping as gold was sold to move even more capital into the lofty US stock markets. For 5 months in a row ending in September, GLD’s holdings retreated as investors dumped GLD shares faster than gold was falling. By early October GLD’s holdings hit a 2.6-year low.
I penned a whole essay on this stock-euphoria-driven gold exodus in late September, explaining why it was happening and why it was likely to soon reverse. And that shift in gold-investment sentiment began the very day the SPX started plunging in mid-October! Up until October 9th the stock markets looked totally normal, the SPX had only drifted a trivial 1.7% lower from its peak. Everyone remained wildly bullish.
But something snapped on October 10th, that fateful day the SPX plunged 3.3% out of the blue on no catalyst at all. Heavy technically-motivated selling accelerated led by the market-darling mega tech stocks. For years investors had believed them bulletproof, their businesses so good they could weather any stock selloff or economic slowdown. Fears surged on the worst SPX down day since back in early February.
That very day American stock investors started returning to gold. They poured capital into GLD shares so aggressively they forced a major 1.2% holdings build. GLD’s mission is to track the gold price, but it has its own supply-and-demand profile independent from gold’s. So when GLD shares are being purchased faster than gold is bought, GLD’s share price threatens to decouple to the upside on that excess demand.
So GLD’s managers must vent that differential buying pressure directly into the physical gold market in order to equalize it and maintain tracking. They do this by issuing enough new GLD shares to satisfy all the excess demand, and then plow the cash proceeds into gold bullion. Thus rising GLD holdings show American stock-market capital is flowing into gold. That proved to be GLD’s biggest build in 6.7 months.
That fateful day proved a major inflection point for both near-record US stock markets and the extremely-unpopular gold. As the SPX continued to weaken over the next couple months, GLD continued to enjoy modest builds on investment gold buying. By late November GLD’s holdings had climbed a considerable 4.5% over 6 weeks. That has helped push gold 5.5% higher since its mid-August lows, a solid young upleg.
Odds are that gold buying via GLD by American stock investors is only beginning. The longer this stock-market weakness persists, the deeper their worries will grow. And the more their stock-heavy portfolios bleed, the quicker they will remember they should’ve allocated 5% to 10% to gold. Once gold investment demand is kindled by falling stock markets, it tends to balloon dramatically and take on a life of its own.
Gold’s young bull market today that was forgotten this summer began as 2016 dawned. Much like this year, in the first half of 2015 the US stock markets were powering to dazzling new record highs. Since it seemed like stocks could do nothing but rally indefinitely, gold was forgotten and shunned. It slumped to a brutal 6.1-year secular low by mid-December 2015, with investors really wanting nothing to do with it.
But their ironclad euphoria started to crack soon after the stock markets corrected. In mid-2015 the SPX finally suffered its first correction in an incredibly-extreme 3.6 yearsafter being levitated by relentless Fed money creation from its third quantitative-easing campaign. Gold caught a bid on that 12.4% SPX selloff over 3.2 months, but then faded again into the expected first Fed rate hike in 9.5 years in mid-December.
Then the SPX fell into another 13.3% correction over 3.3 months into early 2016. Seeing menacing back-to-back corrections after long years without one really deflated gold-suppressing stock-market euphoria. So in early 2016 American stock investors began prudently rediversifying their stock-dominated portfolios into gold. That birthed today’s gold bull, and the gold-buying momentum fed on itself to drive a powerful upleg.
Gold went from being left for dead in mid-December 2015 to surging 29.9% higher in just 6.7 months solely on American stock investors returning! This is no generalization, the hard numbers prove it without a doubt. The world’s best gold fundamental supply-and-demand data comes from the venerable World Gold Council. It releases fantastic quarterly reports detailing the global buying and selling happening in gold.
Gold blasted higher on SPX weakness in Q1’16 and Q2’16. According to the latest data from the WGC, total world gold demand climbed 188.1 and 123.5 metric tons year-over-year in those key quarters. That was up 17.1% and 13.2% YoY respectively! But the real stunner is exactly where those major demand boosts came from. It wasn’t from jewelry buying, central-bank buying, or even physical bar-and-coin investment.
In Q1’16 and Q2’16, GLD’s holdings alone soared 176.9t and 130.8t higher on American stock investors redeploying into gold after back-to-back SPX corrections. Incredibly this one leading gold ETF accounted for a staggering 94% of overall global gold demand growth in Q1’16 and 106% in Q2’16! So there’s no doubt without American stock investors fleeing into gold via GLD this gold bull never would’ve been born.
Gold was holding those sharp gains throughout 2016 until Trump’s surprise presidential victory unleashed a monster stock-market run on hopes for big tax cuts soon. Gold was pummeled in Q4’16 as American stock investors pulled capital back out to chase the newly-soaring SPX. That quarter total global gold demand per the WGC fell 103.4t YoY or 9.0%. GLD’s 125.8t Q4’16 holdings draw accounted for 122% of that!
Gold’s fortunes are being driven by American stock investors’ collective buying and selling of GLD shares. And nothing motivates them to redeploy capital into gold to diversify their stock-heavy portfolios like major SPX selloffs. Recent months’ one has already proven serious enough to rekindle differential GLD-share buying. And as H1’16 proved, once investors start driving gold higher its rallies tend to become self-feeding.
The more physical gold bullion American stock investors buy via GLD shares, the more gold climbs. The higher gold rallies, the more investors want to buy it to ride the momentum and chase its gains. So buying begets buying, driving gold higher fairly rapidly. And when stock markets are sliding, gold is often the only asset class rallying. That makes it even more attractive to investors getting pounded by sliding stocks.
This latest SPX correction is even more damaging to sentiment because it is 2018’s second one. Back in early February the SPX plunged 10.2% in 0.4 months, which started to crack sentiment. Back when this gold bull was born it was the second of back-to-back SPX corrections that proved the coup de grâce in hurting stock-market sentiment enough to unleash a reallocation into gold. This scenario is playing out again.
Provocatively seeing the three major US stock indexes suffer two 10%+ corrections within any single calendar year is itself a super-bearish omen. 2018 joined 1973, 1974, 1987, 2000, 2001, 2002, and 2008 as the SPX’s only other dual-correction years. Those coincided with a 48.2% SPX bear, a 20.5% single-day SPX crash, another 49.1% SPX bear, and a third 56.8% SPX bear! All three bears triggered recessions.
This stock-market weakness isn’t only likely to persist, but the odds really favor it snowballing into another major SPX bear market. Gold investment demand will naturally surge as stocks burn, fueling a strong bull market. Gold’s 29.9% gain over 6.7 months at best so far in this bull is nothing. Gold’s last secular bull from April 2001 to August 2011 saw it soar 638.2% higher! Gold’s gains as the SPX rolls over should be massive.
With a trivial 0.1% portfolio allocation to gold, what happens to gold prices if American stock investors just return to a still-immaterial 1.0%? That’s still way under the 5% to 10% recommended in normal times, and plenty of great investors believe 20% gold allocations are necessary during stock bears. Gold’s upside from here with virtually-zero US-stock-market capital allocated to it is vast. And it could accelerate rather fast.
The timing of this current SPX correction is likely to magnify bearish psychology. It has occurred entirely within Q4’18. The SPX exited Q3’18 just 0.6% off its record peak from a week earlier. So I suspect a lot of American retirement investors have no idea just how much carnage their precious capital has suffered. When they get their quarterly statements from their money managers in January, they could really freak out.
Even worse, far too much of this retirement capital was allocated to the market-darling mega techs which were the biggest holdings across most funds. Their losses have far outpaced the SPX’s. As of that latest correction low on Black Friday when the SPX was down 10.2%, Apple, Amazon, Microsoft, Alphabet, Facebook, and Netflix had collapsed 25.8%, 26.4%, 10.8%, 19.9%, 39.4%, and 38.2% from their all-time highs!
The mega techs that nearly single-handedly pushed the SPX higher for years averaged 26.8% losses, or 2.6x the SPX’s! When investors who don’t closely follow the stock markets figure that out next month, the investment demand for rallying gold ought to explode. The first half of 2019 has a setup much like H1’16, where gold essentially powered 30% higher. A similar upleg from mid-August’s lows isn’t a stretch at all.
Another 30% run from $1174 would leave gold at $1525. And once gold climbs decisively back over its bull-to-date high of $1365 from early-July 2016, investment interest and demand will soar. Just like the mega tech stocks, the higher gold prices the more investors want to buy it. A mere 16% gold upleg off August’s lows, or another 10% higher from this week’s levels, would near that psychologically-huge bull breakout!
All investors should always have 5% to 10% of their investable capital allocated to gold. But almost none do today as a long-overdue bear market fueled by epic record Fed QT looms. If you don’t have that core gold allocation, you need to get it in place before stocks fall much farther and gold surges much higher. The gold miners’ stocks will greatly leverage gold’s gains too, their leading index soared 182.2% largely in H1’16!
Absolutely essential in bear markets is cultivating excellent contrarian intelligence sources. That’s our specialty at Zeal. After decades studying the markets and trading, we really walk the contrarian walk. We buy low when few others will, so we can later sell high when few others can. While Wall Street will deny the coming stock-market bear all the way down, we will help you both understand it and prosper during it.
We’ve long published acclaimed weekly and monthly newsletters for speculators and investors. They draw on my vast experience, knowledge, wisdom, and ongoing research to explain what’s going on in the markets, why, and how to trade them with specific stocks. As of Q3, we’ve recommended and realized 1045 newsletter stock trades since 2001. Their average annualized realized gain is +17.7%! That’s double the long-term stock-market average. Subscribe today and take advantage of our 20%-off holidays sale!
The bottom line is this stock selloff is boosting gold. Flagging gold investment demand turned on a dime when the stock markets started plunging in mid-October. Gold has rallied on balance since as American stock investors start redeploying capital. Their buying alone via GLD shares was fully responsible for gold’s sharp 30% upleg in 2016’s first half. That followed the last back-to-back corrections in US stock markets.
And between record Fed tightening running full-throttle, continuing dangerous bubble valuations, and the mounting trade wars, this recent stock selling is likely to persist on balance. So gold investment will look far more attractive. Coming from virtually-zero gold portfolio allocations, investors have massive buying to do. The higher they push gold, the more other investors will chase it. Especially as US stock markets weaken.
The junior gold miners’ stocks have spent recent months mostly languishing near major multi-year lows. That spawned a sentiment wasteland riddled by bearishness and bereft of bids. But these companies’ battered stock prices aren’t fundamentally righteous, as proven yet again by their latest earnings season. Faring far better in a challenging third quarter than stock prices imply, they need to mean revert way higher.
Four times a year publicly-traded companies release treasure troves of valuable information in the form of quarterly reports. Companies trading in the States are required to file 10-Qs with the U.S. Securities and Exchange Commission by 40 calendar days after quarter-ends. Canadian companies have similar requirements at 45 days. In other countries with half-year reporting, many companies still partially report quarterly.
The definitive list of elite “junior” gold stocks to analyze comes from the world’s most-popular junior-gold-stock investment vehicle. Mid-month the GDXJ VanEck Vectors Junior Gold Miners ETF reported $4.1b in net assets. Among all gold-stock ETFs, that was second only to GDX’s $9.0b. That is GDXJ’s big-brother ETF that includes larger major gold miners. GDXJ’s popularity testifies to the great allure of juniors.
Unfortunately this fame created serious problems for GDXJ a couple years ago, resulting in a stealthy major mission change. This ETF is quite literally the victim of its own success. GDXJ grew so large in the first half of 2016 as gold stocks soared in a massive upleg that it risked running afoul of Canadian securities laws. And most of the world’s smaller gold miners and explorers trade on Canadian stock exchanges.
Since Canada is the centre of the junior-gold universe, any ETF seeking to own this sector will have to be heavily invested there. But once any investor including an ETF buys up a 20%+ stake in any Canadian stock, it is legally deemed to be a takeover offer that must be extended to all shareholders! As capital flooded into GDXJ in 2016 to gain junior-gold exposure, its ownership in smaller components soared near 20%.
Obviously hundreds of thousands of investors buying shares in an ETF have no intention of taking over gold-mining companies, no matter how big their collective stakes. That’s a totally-different scenario than a single corporate investor buying 20%+. GDXJ’s managers should’ve lobbied Canadian regulators and lawmakers to exempt ETFs from that 20% takeover rule. But instead they chose an inferior, easier fix.
Since GDXJ’s issuer controls the junior-gold-stock index underlying its ETF, it simply chose to unilaterally redefine what junior gold miners are. It rejiggered its index to fill GDXJ’s ranks with larger mid-tier gold miners, while greatly demoting true smaller junior gold miners in terms of their ETF weightings. This controversial move defying long decades of convention was done quietly behind the scenes to avoid backlash.
There’s no formal definition of a junior gold miner, which gives cover to GDXJ’s managers pushing the limits. Major gold miners are generally those that produce over 1m ounces of gold annually. For decades juniors were considered to be sub-200k-ounce producers. So 300k ounces per year is a very-generous threshold. Anything between 300k to 1m ounces annually is in the mid-tier realm, where GDXJ now traffics.
That high 300k-ounce-per-year junior cutoff translates into 75k ounces per quarter. Following the end of the gold miners’ Q3’18 earnings season in mid-November, I dug into the top 34 GDXJ components’ results. That’s simply an arbitrary number that fits neatly into the tables below. Although GDXJ included a staggering 70 component stocks mid-month, the top 34 accounted for a commanding 82.9% of its total weighting.
Out of these top 34 GDXJ companies, only 3 primary gold miners met that sub-75k-ounce-per-quarter qualification to be a junior gold miner! Their quarterly production is rendered in blue below, and they collectively accounted for just 3.8% of this ETF’s total weighting. GDXJ is inarguably now a pure mid-tier gold-miner ETF, not a junior one. But its holdings include the world’s best gold miners with huge upside potential.
I’ve been doing these deep quarterly dives into GDXJ’s top components for years now. In Q3 2018, fully 31 of the top 34 GDXJ components were also GDX components! These are separate and distinct ETFs, a “Gold Miners ETF” and a “Junior Gold Miners ETF”. So they shouldn’t have to own many of the same companies. In the tables below I highlighted the symbols of rare GDXJ components not also in GDX in yellow.
These 31 GDX components accounted for 79.2% of GDXJ’s total weighting, not just its top 34. They also represented 31.7% of GDX’s total weighting. Thus nearly 4/5ths of this “Junior Gold Miners ETF” is made up by nearly 1/3rd of the major “Gold Miners ETF”! These GDXJ components also in GDX are clustered from the 11th- to 30th-highest weightings in that latter larger ETF. GDXJ is mostly smaller GDX stocks.
In a welcome change from GDXJ’s vast component turmoil of recent years, only 4 of its top 34 stocks are new since Q3 2017. Their symbols are highlighted in light blue below. Thus the top GDXJ components’ collective results are finally getting comparable again in year-over-year terms. Analyzing ETFs is much easier if their larger components aren’t constantly in flux. Hopefully changes going forward are relatively minor.
Despite all this, GDXJ remains the leading “junior-gold” benchmark. So every quarter I wade through tons of data from its top components’ latest results, and dump it into a big spreadsheet for analysis. The highlights make it into these tables. Most of these top 34 GDXJ gold miners trade in the US and Canada, where comprehensive quarterly reporting is required by regulators. But others trade in Australia and the UK.
In these countries and most of the rest of the world, regulators only mandate that companies report their results in half-year increments. Most do still issue quarterly production reports, but don’t release financial statements. There are wide variations in reporting styles, data presented, and release timing. So blank fields in these tables mean a company hadn’t reported that particular data for Q3 2018 as of mid-November.
The first couple columns of these tables show each GDXJ component’s symbol and weighting within this ETF as of mid-November. While just over half of these stocks trade on US exchanges, the other symbols are listings from companies’ primary foreign stock exchanges. That’s followed by each gold miner’s Q3’18 production in ounces, which is mostly in pure-gold terms excluding byproduct metals often found in gold ore.
Those are usually silver and base metals like copper, which are valuable. They are sold to offset some of the considerable costs of gold mining, lowering per-ounce costs and thus raising overall profitability. In cases where companies didn’t separate out gold and lumped all production into gold-equivalent ounces, those GEOs are included instead. Then production’s absolute year-over-year change from Q3’17 is shown.
Next comes gold miners’ most-important fundamental data for investors, cash costs and all-in sustaining costs per ounce mined. The latter directly drives profitability which ultimately determines stock prices. These key costs are also followed by YoY changes. Last but not least the annual changes are shown in operating cash flows generated, hard GAAP earnings, sales, and cash on hand with a couple exceptions.
Percentage changes aren’t relevant or meaningful if data shifted from positive to negative or vice versa, or if derived from two negative numbers. So in those cases I included raw underlying data rather than weird or misleading percentage changes. This whole dataset together offers a fantastic high-level read on how the mid-tier gold miners as an industry are faring fundamentally. They actually did relatively well in Q3.
While this new mid-tier GDXJ is generally excellent, some decisions by its managers are utterly baffling. Out of all the world’s gold miners they could’ve added over this past year, they inexplicably decided on the giant largely-African AngloGold Ashanti. It produced an enormous 851k ounces of gold last quarter, the largest in GDXJ by far. It and the rest of the South African majors definitely don’t belong in GDXJ!
Remember that major-gold-miner threshold has long been 1m+ ounces per year. AU’s production is annualizing to well over 3x that, making this company the world’s 3rd-largest gold miner last quarter. Why on earth would managers running a “Junior Gold Miners ETF” even consider AngloGold Ashanti? It is as far from junior-dom as gold miners get. The same is true with the rest of the troubled South African gold miners.
AU, Gold Fields, Harmony Gold, and Sibanye-Stillwater mined 851k, 533k, 379k, and 309k ounces in Q3’18, all are majors. Yet they accounted for 13.1% of GDXJ’s total weighting. They are riddled with all kinds of problems too, from shrinking production to high costs to increasing stealth expropriations from South Africa’s openly-Marxist anti-white-investor government. Their inclusion heavily skews and taints GDXJ.
These South African majors’ Q3 production of 2.1m ounces was a whopping 41% of the GDXJ top 34’s total! And it still fell 7.0% YoY due to South Africa’s tragic death spiral. Excluding them and the amazing Kirkland Lake Gold which has grown so fast it was moved exclusively into GDX over this past year, the rest of the GDXJ top 34 grew production 3.4% YoY in Q3. The South African majors’ cost impact is even worse.
Mining in that country is very expensive thanks to very-old very-deep mines and endless new government interference via stifling regulations. In Q3 the South African majors’ cash and all-in sustaining costs came in really high averaging $925 and $1088 per ounce. The rest of GDXJ’s top 34 averaged $629 and $877, a massive 32.0% and 19.4% lower! The South African majors are really retarding GDXJ’s performance.
As struggling majors far larger than mid-tiers and juniors, they need to get kicked out of GDXJ posthaste. They can be left in GDX where they belong. AU effectively took KL’s place, which makes no sense at all fundamentally. Kirkland Lake produced 180k ounces of gold in Q3 at $351 cash costs and $645 AISCs. So unlike AU, KL remains solidly in the mid-tier realm and has been performing incredibly well operationally.
While GDXJ’s managers really dropped the ball including those South African majors, they deserve big praise for upping the weighting of the outstanding Australian miners. They are Northern Star Resources, Evolution Mining, Regis Resources, St Barbara, and Saracen Mineral. Their collective weighting in GDXJ grew to 21.7% at the end of Q3’s earnings season, nearly 2/3rds higher from their 13.3% a year earlier.
Unlike AU’s dumbfounding inclusion, the Australians’ rise is well-deserved. Their production surged 8.9% YoY to 686k ounces, or 23% of the GDXJ top 34’s total excluding those South African majors. And the Australian miners are masters at developing great gold deposits and controlling costs, as their cash costs and AISCs in Q3 averaged just $586 and $724! It’s fantastic GDXJ offers American investors this Aussie exposure.
GDXJ’s component list and weightings are a work in progress, and are gradually getting better. For years I’ve pointed out things like the South African majors that weren’t right, and GDXJ’s managers eventually seem to come around and change things for the better. Greatly helping that process is investors buying the better individual stocks like KL and shunning laggards like AU, readjusting their relative market capitalizations.
GDXJ and GDX are essentially market-cap weighted, with larger companies rightfully commanding larger weightings. These leading gold-stock ETFs’ managers can override this by deciding which gold miners to include in each ETF. So they can easily purge GDXJ of the deteriorating South African majors and add real mid-tier gold miners. But the true core problem is having so many of the same stocks in GDX and GDXJ.
Such massive overlap between these two ETFs is a huge lost opportunity for VanEck. It owns and manages GDX, GDXJ, and even the MVIS indexing company that decides exactly which gold stocks are included in each. With one company in total control, there’s no need for any overlap in the underlying companies of what should be two very-different gold-stock ETFs. Inclusion ought to be mutually-exclusive.
VanEck could greatly increase the utility of its gold-stock ETFs and thus their ultimate success by starting with one big combined list of the world’s better gold miners. Then it could take the top 20 or 25 in terms of annual gold production and assign them to GDX. Based on Q3’18 production, that would run down near 139k or 93k ounces per quarter. Then the next-largest 40 or 50 gold miners could be assigned to GDXJ.
Getting smaller gold miners back into GDXJ would be a huge boon for the junior-gold-mining industry. Most investors naturally assume this “Junior Gold Miners ETF” owns junior gold miners, which is where they are trying to allocate their capital. But since most of GDXJ’s funds are instead diverted into much-larger mid-tiers and even some majors, the juniors are effectively being starved of capital intended for them.
That’s one of the big reasons smaller gold miners’ stock prices are so darned low. They aren’t getting enough capital inflows from gold-stock-ETF investing. So their share prices aren’t bid higher. They rely on issuing shares to finance their exploration projects and mine builds. But when their stock prices are down in the dumps, that is heavily dilutive. So GDXJ is strangling the very industry its investors want to own!
Back to these mid-tier gold miners’ Q3’18 results, production is the best place to start since that is the lifeblood of the entire gold-mining industry. These top 34 GDXJ gold miners that had specifically reported Q3 production as of mid-November produced 5063k ounces. That surged by a massive 18.8% YoY, implying these miners are thriving. But that is heavily distorted by that huge 851k-ounce boost from AU’s addition.
Without the world’s 3rd-largest gold miner, the rest of the GDXJ top 34 saw their production slip 1.2% YoY to 4212k ounces. That reflected the peak-gold challenges the gold-mining industry is facing, as I discussed a couple weeks ago while reviewing the GDX majors’ Q3’18 results. The GDXJ top 34 are still outperforming the GDX top 34, which saw their gold production retreat 2.9% YoY in Q3 bucking historical trends.
Sequentially quarter-on-quarter from Q2’18 the GDXJ top 34’s production surged a dramatic 13.3%! And AU was already one of GDXJ’s top components then. That partially came from new mines ramping up at the world’s best mid-tier gold miners. It is far easier for them to grow production off lower bases than it is for the majors off high bases. That’s a key reason why the mid-tiers’ upside potential trounces that of the majors.
For all GDXJ’s faults, it does still offer investors exposure to much-smaller gold miners. The average quarterly production of all the top 34 GDXJ miners reporting it in Q3 was 163.3k ounces. That is 43% smaller than the 288.8k averaged by the top 34 GDX miners last quarter. And again AU’s crazy inclusion really skews this. Ex-AU, the GDXJ average falls to 140.4k. Without all the South African majors, it is 110.8k.
These annualize to 562k and 443k, both solidly in the mid-tier realm. Analyzing GDXJ’s production and costs requires breaking out those heavily-distorting South African majors that have no place in a mid-tier gold-miner ETF. Again their production fell 7.0% YoY in Q3, while the rest of the GDXJ top 34’s ex-KL grew 3.4%! Production and costs tend to be proportionally inversely related because of how mining works.
Gold-mining costs are largely fixed quarter after quarter, with actual mining requiring the same levels of infrastructure, equipment, and employees. The tonnage throughputs of the mills that process the gold-bearing ore are also fixed. So gold produced varies with ore grades each quarter. The more gold that is recovered, the more ounces to spread gold mining’s big fixed costs across. That lowers per-ounce costs.
There are two major ways to measure gold-mining costs, classic cash costs per ounce and the superior all-in sustaining costs per ounce. Both are useful metrics. Cash costs are the acid test of gold-miner survivability in lower-gold-price environments, revealing the worst-case gold levels necessary to keep the mines running. All-in sustaining costs show where gold needs to trade to maintain current mining tempos indefinitely.
Cash costs naturally encompass all cash expenses necessary to produce each ounce of gold, including all direct production costs, mine-level administration, smelting, refining, transport, regulatory, royalty, and tax expenses. In Q3’18, the overall cash costs of the GDXJ top 34 surged 8.4% higher YoY to $663 per ounce. That was still largely in line with the past four quarters’ $612, $618, $692, and $631 averaging $638.
But that sharp jump was mostly the result of the South African majors’ deepening troubles. Again their average cash costs last quarter were a whopping $925! Without them, the rest of the GDXJ top 34 averaged $629 per ounce which was only up 2.8% YoY and below the rolling-four-quarter mean. So the mid-tier gold miners of GDXJ are holding the line on cash costs, a sign their operations are fundamentally sound.
Way more important than cash costs are the far-superior all-in sustaining costs. They were introduced by the World Gold Council in June 2013 to give investors a much-better understanding of what it really costs to maintain gold mines as ongoing concerns. AISCs include all direct cash costs, but then add on everything else that is necessary to maintain and replenish operations at current gold-production levels.
These additional expenses include exploration for new gold to mine to replace depleting deposits, mine-development and construction expenses, remediation, and mine reclamation. They also include the corporate-level administration expenses necessary to oversee gold mines. All-in sustaining costs are the most-important gold-mining cost metric by far for investors, revealing gold miners’ true operating profitability.
The GDXJ top 34 reported average AISCs of $911 in Q3, up 3.8% YoY. But like cash costs, this was roughly in line with the $877, $855, $923, and $886 seen in the past four quarters. But again that was skewed quite a bit higher by those wrongly-included South African majors, which reported $1088 average AISCs in Q3. The rest of the top 34 averaged $877, which is actually better than the $885 four-quarter average.
So the South African majors are really tainting GDXJ’s collective operational performance, with lower production and higher costs dragging down this entire ETF. Those giant struggling gold producers are an albatross around the neck of the many great mid-tier gold miners in GDXJ! If you are a GDXJ investor, contact VanEck and urge them to boot the South African majors out of GDXJ to help it thrive going forward.
Gold-mining earnings are simply the difference between prevailing gold prices and all-in sustaining costs. And both sides of this equation moved the wrong way in Q3, squeezing the mid-tier gold miners’ profits. Q3’18’s average gold price of $1211 was 5.3% lower than Q3’17’s. And with overall GDXJ top 34 AISCs 3.8% higher at $911, that really cut into margins. These gold miners were collectively earning $300 per ounce.
That implied solid 25% profit margins absolutely, which aren’t bad. But they still plunged 25.4% YoY from Q3’17’s $402 per ounce, which amplified gold’s decline by 4.8x. But gold-mining profits leverage to gold is exactly why the gold stocks make such compelling investments. Gold stocks were weak in Q3 because gold was pounded to a deep 19.3-month low in mid-August on extreme all-time-record gold-futures short selling.
Left for dead and neglected, the gold miners’ stocks are the last cheap sector in these lofty bubble-valued stock markets. Their fundamental upside as gold mean reverts higher on speculators’ gold-futures buying and new investment demand as stock markets roll over is enormous. This is easy to understand with a simple example. In the last four quarters including Q3’18, the top 34 GDXJ gold miners’ AISCs averaged $894.
During gold’s last major upleg in essentially the first half of 2016, it powered about 30% higher driven by surging investment demand after stock markets suffered back-to-back corrections. That was even small by historical gold-bull-upleg standards. If we merely get another 30% gold advance from its recent mid-August low of $1174, we’re looking at $1525 gold. That would work wonders for gold-mining profits and stock prices.
At $1525 gold and $894 AISCs, the mid-tier gold miners would be earning $631 per ounce. That’s 110% higher than Q3’18’s $300! If gold-mining profits double, gold-stock prices will soar. Indeed during that last 30% gold bull in the first half of 2016, GDXJ rocketed 203% higher! So the gold-stock outlook is wildly bullish with gold itself due to power higher as the stock markets roll over on the Fed’s record tightening.
The rest of the top 34 GDXJ gold miners’ fundamentals were mixed last quarter. Cash flows generated from operations totaled $1.3b in Q3, down 21.2% YoY. That’s reasonable given average gold’s 5.3% YoY retreat and their leverage to it. Cash on hand remained high at $5.4b, down just 5.3% YoY. So these mid-tier gold miners have plenty of capital to build and buy new mines to continue growing their production.
Revenues only slipped 0.4% YoY to $4.1b, which means the softer gold prices were largely offset by higher production. But GAAP profits looked like a disaster, with the GDXJ top 34’s plummeting to a $379m loss in Q3’18 from being $212m in the black in Q3’17! That was far worse than the lower gold prices warranted, but thankfully it was mostly the result of big non-cash charges flushed through income statements.
Tahoe Resources reported a massive $170m impairment charge on its suspended Escobal silver mine that is being held hostage by the corrupt Guatemalan government. Yamana Gold wrote off $89m after selling a mine in Argentina. Explorer NOVAGOLD reported an $81m loss from discontinued operations on the sale of one of its projects. These three unusual items alone wiped out $340m of profits from GDXJ’s ranks.
Without them, the top 34 GDXJ gold miners’ earnings would’ve fallen to -$39m from +$212m. That isn’t great, but it doesn’t reveal any serious issues a rising gold price won’t quickly solve. Interestingly if KL was still included instead of AU, that would’ve added another $56m in Q3’18 profits. The mid-tiers’ overall earnings should dramatically leverage and outpace gold in coming quarters as it inexorably mean reverts higher.
While GDXJ should certainly no longer be advertised as a “Junior Gold Miners ETF”, it offers exposure to some of the best mid-tier gold miners on the planet. It’s really growing on me, I like this new GDXJ way better than GDX. That being said, GDXJ is still burdened by overdiversification and way too many gold miners that shouldn’t be in there. They are either too large, are saddled with inferior fundamentals, or both.
So the best way to play the gold miners’ coming massive mean-reversion bull is in individual stocks with superior fundamentals. Their gains will ultimately trounce the major ETFs like GDXJ and GDX. There’s no doubt carefully-handpicked portfolios of elite gold and silver miners will generate much-greater wealth creation. GDXJ’s component list is a great starting point, but pruning it way down offers far-bigger upside.
The key to riding any gold-stock bull to multiplying your fortune is staying informed, both about broader markets and individual stocks. That’s long been our specialty at Zeal. My decades of experience both intensely studying the markets and actively trading them as a contrarian is priceless and impossible to replicate. I share my vast experience, knowledge, wisdom, and ongoing research through our popular newsletters.
Published weekly and monthly, they explain what’s going on in the markets, why, and how to trade them with specific stocks. They are a great way to stay abreast, easy to read and affordable. Walking the contrarian walk is very profitable. As of Q3, we’ve recommended and realized 1045 newsletter stock trades since 2001. Their average annualized realized gains including all losers is +17.7%! That’s double the long-term stock-market average. Subscribe today and take advantage of our 20%-off holidays sale!
The bottom line is the mid-tier gold miners reported solid fundamentals despite a challenging third quarter for gold prices. Excluding the South African majors, they were able to grow their production nicely while holding the line on costs. That portends dramatic operating-cash-flow and earnings growth in the coming quarters as gold mean reverts higher on big investment buying. The mid-tier gold miners’ stocks will soar on that.
Gold stocks are not only unloved and dirt-cheap today, but they are a rare sector that rallies strongly with gold as general stock markets weaken. While virtually no one was interested in these leveraged plays on gold upside in recent months, that will change fast as these lofty stock markets roll over. And the mid-tier gold miners’ recent Q3 earnings season proved they remain ready to fundamentally amplify gold’s gains.
What a day! This is incredible! We called it with our wave counts, and now it’s really happening as the Fed may have just blinked!
Within wave .iii. we are now working on our first impulsive sequence, as shown on our “Daily Gold Chart”.
Within that first impulsive sequence we believe that we are working on a subdividing wave $iii$. Within wave $iii$, wave !i! ended at the 1246.00 high and all of wave !ii! at 1196.60.
We are now rallying in wave !iii!, which has an initial target of:
!iii!=1.618!i!=1296.40!
Within wave !iii! it looks like we are subdividing again as shown on the Daily Gold Chart. It looks like wave ?i? ended at 1230.90 and that we are now falling in wave ?ii?.
Our retracement levels for the end of wave ?ii? were:
50% = 1213.80;
61.8% = 1209.70.
Our report card on that call: Bingo!
We expected that gold should drop a little further before all of wave ?ii? ends, and that’s exactly what happened.
Longer term our first projection for the end of wave .iii. is:
.iii. = 1.618.i. = 1447.20.
We do have higher projections. Of course, wave .iii. should subdivide into a 5 wave impulsive sequence in its journey higher.
Trading Recommendation: Long gold. Use puts as stops.
Active Positions: We are long, with puts as stops!
Silver:
Short Term Update:
In the very short term, silver has been correcting the rally from 13.86 to 14.54. Silver could be ready to move higher again quite soon.
We are working on the assumption that all of wave ii ended at the 13.86 low and that we are now starting to work higher…
In the initial stages of wave .iii.
We have been waiting to see a very big up day to confirm this assumption.
Silver will accelerate higher (and perhaps quite dramatically) with gold once the 95.93 low in the USDX gives way.
We also need to break above our red downtrend line that is shown on the Daily Silver Chart that connects 17.35 and 14.92.
Our first projection for the end of wave iii is:
iii = 1.618i = 26.09.
Trading Recommendation: Long silver. Use a put as a stop.
Active Positions: We are long, with puts as stops!
GDX & Gold Stocks:
GDX 60 Min Chart:
GDX Daily Chart:
Short Term Update:
We have now updated our count to suggest that all of wave ^i^ ended at the 19.92 high and that all or most of wave ^ii^ at the 18.72 low.
If that is the case then we should now be moving higher in wave ^iii^, as the next big event in this market.
We are now working on the assumption that all of wave -ii- is complete at the 18.26 low and that we are now rallying in wave -iii-.
Our first projection for the end of wave -iii- is:
-iii- = 1.618-i- = 23.49.
Longer term our first projection for the end of wave 3 is:
3 = 1.618(1) = 48.95.
We have updated all of the following counts, for the following:
Kinross: Has now completed its minimum requirements for a completed wave (ii), at the 2.38 low. Wave (iii) rally is now underway.
Barrick:We have completed the minimum requirements for a completed wave (ii) at the 9.53 low. Wave (iii) rally is now underway.
HUI: We have completed the minimum requirements for a completed wave (ii), at the 131.12 low. Wave (iii) rally is now underway.
XAU: We have completed the minimum requirements for a completed wave 2 at the 60.59 low. Wave 3 rally is now underway.
Trading Recommendation: We continue to suggest buying all of the above gold stocks and indices, for a long term hold.
Active Positions: We are long the GDX, ABX, KGC, NEM, SSR, and TSX:XGD with no stops!!
Free Offer For Website Readers:Please send me an Email to admin@captainewave.com and I’ll send you our free “Gold could Hit $1300 By Christmas!” report. We highlight our new weekly wave counts chart for GDX, which suggests that $1300 gold by Christmas can really happen! We discuss tactical approaches to make money on the play!
Risk: CAPTAINEWAVE.COM IS AN IMPERSONAL ADVISORY SERVICE. AND THEREFORE, NO CONSIDERATION CAN OR IS MADE TOWARD YOUR FINANCIAL CIRCUMSTANCES. ALL MATERIAL PRESENTED WITHIN CAPTAINEWAVE.COM IS NOT TO BE REGARDED AS INVESTMENT ADVICE, BUT FOR GENERAL INFORMATIONAL PURPOSES ONLY. TRADING STOCKS DOES INVOLVE RISK, SO CAUTION MUST ALWAYS BE UTILIZED. WE CANNOT GUARANTEE PROFITS OR FREEDOM FROM LOSS. YOU ASSUME THE ENTIRE COST AND RISK OF ANY TRADING YOU CHOOSE TO UNDERTAKE. YOU ALSO AGREE TO BEAR COMPLETE RESPONSIBILITY FOR YOUR INVESTMENT RESEARCH AND DECISIONS AND ACKNOWLEDGE THAT CAPTAINEWAVE.COM HAS NOT AND WILL NOT MAKE ANY SPECIFIC RECOMMENDATIONS OR GIVE ADVICE TO YOU OR ANY OF ITS CLIENTS UPON WHICH THEY SHOULD RELY. CAPTAINEWAVE.COM SUGGESTS THAT THE CLIENT/MEMBER TEST ALL INFORMATION AND TRADING METHODOLOGIES PROVIDED AT OUR SITE THROUGH PAPER TRADING OR SOME OTHER FORM OF TESTING. CAPTAINEWAVE.COM, ITS OWNERS, OR ITS REPRESENTATIVES ARE NOT REGISTERED AS SECURITIES BROKER-DEALERS OR INVESTMENT ADVISORS EITHER WITH THE U.S. SECURITIES AND EXCHANGE COMMISSION OR WITH ANY STATE SECURITIES REGULATORY AUTHORITY. WE RECOMMEND CONSULTING WITH A REGISTERED INVESTMENT ADVISOR, BROKER-DEALER, AND/OR FINANCIAL ADVISOR. IF YOU CHOOSE TO INVEST WITH OR WITHOUT SEEKING ADVICE FROM SUCH AN ADVISOR OR ENTITY, THEN ANY CONSEQUENCES RESULTING FROM YOUR INVESTMENTS ARE YOUR SOLE RESPONSIBILITY.
ALL INFORMATION POSTED IS BELIEVED TO COME FROM RELIABLE SOURCES. CAPTAINEWAVE.COM DOES NOT WARRANT THE ACCURACY, CORRECTNESS, OR COMPLETENESS OF INFORMATION AVAILABLE FROM ITS SERVICE AND THEREFORE WILL NOT BE LIABLE FOR ANY LOSS INCURRED. DUE TO THE ELECTRONIC NATURE OF THE INTERNET, THE CAPTAINEWAVE.COM WEBSITE, ITS E-MAIL & DISTRIBUTION SERVICES AND ANY OTHER SUCH “ALERTS” COULD FAIL AT ANY GIVEN TIME. CAPTAINEWAVE.COM WILL NOT BE RESPONSIBLE FOR UNAVAILABILITY OF USE OF ITS WEBSITE, NOR UNDELIVERED E-MAILS, OR “ALERTS” DUE TO INTERNET BANDWIDTH PROBLEMS, EQUIPMENT FAILURE, OR ACTS OF GOD. CAPTAINEWAVE.COM DOES NOT WARRANT THAT THE TRANSMISSION OF E-MAILS, OR ANY “ALERT” WILL BE UNINTERRUPTED OR ERROR-FREE. CAPTAINEWAVE.COM WILL NOT BE LIABLE FOR THE ACTS OR OMISSIONS OF ANY THIRD PARTY WITH REGARDS TO CAPTAINEWAVE.COM DELAY OR NON-DELIVERY OF THE CAPTAINEWAVE.COM NIGHTLY EMAILS OR “ALERTS”. FURTHER, WE DO NOT RECEIVE ANY FORM OF PAYMENT OR OTHER COMPENSATION FOR PUBLISHING INFORMATION, NEWS, RESEARCH OR ANY OTHER MATERIAL CONCERNING ANY SECURITIES ON OUR SITE OR PUBLISH ANY INFORMATION ON OUR SITE THAT IS INTENDED TO AFFECT OR INFLUENCE THE VALUE OF SECURITIES.
THERE IS NO GUARANTEE PAST PERFORMANCE WILL BE INDICATIVE OF FUTURE RESULTS. NO ASSURANCE CAN BE GIVEN THAT THE RECOMMENDATIONS OF CAPTAINEWAVE.COM WILL BE PROFITABLE OR WILL NOT BE SUBJECT TO LOSSES. ALL CLIENTS SHOULD UNDERSTAND THAT THE RESULTS OF A PARTICULAR PERIOD WILL NOT NECESSARILY BE INDICATIVE OF RESULTS IN FUTURE PERIODS. THE RESULTS LISTED AT THIS WEBSITE ARE BASED ON HYPOTHETICAL TRADES. PLAINLY SPEAKING, THESE TRADES WERE NOT ACTUALLY EXECUTED. HYPOTHETICAL OR SIMULATED PERFORMANCE RESULTS HAVE CERTAIN INHERENT LIMITATIONS. UNLIKE AN ACTUAL PERFORMANCE RECORD, SIMULATED TRADES DO NOT REPRESENT ACTUAL TRADING. ALSO, SINCE THE TRADES HAVE NOT ACTUALLY BEEN EXECUTED, THE RESULTS MAY HAVE OVER OR UNDER COMPENSATED FOR THE IMPACT, IF ANY, OF CERTAIN MARKET FACTORS SUCH AS LACK OF LIQUIDITY. YOU MAY HAVE DONE BETTER OR WORSE THAN THE RESULTS PORTRAYED. NO REPRESENTATION IS BEING MADE THAT ANY ACCOUNT WILL OR IS LIKELY TO ACHIEVE PROFITS OR LOSSES SIMILAR TO THOSE SHOWN. NO INDEPENDENT PARTY HAS AUDITED THE HYPOTHETICAL PERFORMANCE CONTAINED AT THIS WEBSITE, NOR HAS ANY INDEPENDENT PARTY UNDERTAKEN TO CONFIRM THAT THEY REFLECT THE TRADING METHOD UNDER THE ASSUMPTIONS OR CONDITIONS SPECIFIED HEREAFTER. WHILE THE RESULTS PRESENTED AT THIS WEBSITE ARE BASED UPON CERTAIN ASSUMPTIONS BELIEVED TO REFLECT ACTUAL TRADING CONDITIONS, THESE ASSUMPTIONS MAY NOT INCLUDE ALL VARIABLES THAT WILL AFFECT, OR HAVE IN THE PAST AFFECTED, THE EXECUTION OF TRADES INDICATED BY CAPTAINEWAVE.COM. THE HYPOTHETICAL RESULTS ON THIS WEBSITE ARE BASED ON THE ASSUMPTION THAT THE CLIENT BUY AND SELLS THE POSITIONS AT THE OPEN PRICE OF THE STOCK. THE SIMULATION ASSUMES PURCHASE AND SALE PRICES BELIEVED TO BE ATTAINABLE. IN ACTUAL TRADING, PRICES RECEIVED MAY OR MAY NOT BE THE SAME AS THE ASSUMED ORDER PRICES.
November 27, 2018
The next Fed meet (and rate hike) is December 19, and just weeks after that, U.S. president Donald “The Golden Trumpster” Trump may be set to unleash a new round of inflationary and growth-crushing tariffs.
It’s not easy (to put it mildly) for American business to create new factories to replace the products made by highly productive Chinese factories.
So, for 2019, most top U.S. bank economists and money managers are slashing their U.S. GDP growth forecasts and raising their inflation forecasts.
Morgan Stanley’s global stock market weightings are legendary in the institutional world, and they just moved America to a horrifying “underweight” ranking for their global stock market positioning.
Most big-name economists in America see U.S. GDP growth sliding to sub 2% by mid 2019 while inflation stages an “upside surprise”.
Please click here now. Goldman’s top economists clearly have the same view I do.
What’s particularly interesting about this forecast is that their top economist is also forecasting four rate hikes from the Fed in 2019.
Four hikes would put enormous pressure on the U.S. government’s ability to finance its outrageous debt. It can be argued that these hikes are the Fed’s response to the insane growth of that debt.
Whether there are two rate hikes as Morgan Stanley predicts, three as I predict, or four as Goldman predicts, the growth of U.S. government debt is clearly going to put vastly more pressure on the US government bond market (and the corporate bond market) in 2019 than it already has in 2018.
In the matter of “tax loss” season, I realize that many gold market investors are nervous that gold stocks will decline into December like they have in recent years.
Please click here now. Double-click to enlarge. I don’t see anything to be concerned about on this daily gold chart.
Please click here now. Double-click to enlarge. I don’t see anything on this GDX chart to be concerned about either.
GDX and most senior gold stocks are tracking the gold price quite nicely. Gold supply is limited, and top analysts at Goldman and other firms are predicting “Commodities will soar.”
Also, 2019 is an election year in India. Morgan Stanley just raised India to “overweight” in its global stock market weightings, as it moved America to that somewhat pathetic underweight ranking. While GDP growth nosedives to potentially under 2% in America, it should be at least 7% in India for 2019, and I’m predicting it could hit 8%. GDP growth and upside action in the Indian stock market is good news for gold. The bottom line:
Gold demand in India is rock solid, as it is in China. As commodities begin to rise, Goldman will lead institutional investors into more commodities investing. Gold, GDX, GDXJ, SIL, and related stocks should have a great year.
Please click here now. Double-click to enlarge this CDNX venture index chart.
Whether it’s MACD, moving averages, RSI, or a host of other technical indicators, gold and GDX look solid. Unfortunately, that’s not the case with CDNX.
Please click here now. That’s a look at the key buy (green) and sell (gold) signals for the high risk venture sector that I cover in my gracelandjuniors.com newsletter.
The CDNX and related stocks are susceptible to tax loss selling. Penny stocks are high risk (but also high potential reward) and I don’t expect to get a major buy signal for the CDNX index until gold trades at $1420 on a weekly closing basis.
Please click here now. Double-click to enlarge what just may be the world’s most spectacular price chart!
Barrick is chaired by former Goldman president John Thornton. Thornton has aggressively bought stock in the open market and has categorically stated that he is not selling a single one of his shares for short term gain.
Clearly, Thornton is not playing for peanuts. With the majestic bull wedge and inverse head and shoulders bottom in play, it’s obvious that this man is poised to see himself and all Barrick shareholders gain enormous wealth in what I call the “bull era”.
Thornton was the driving force of the Barrick-Rangold merger. That merger was approved by a stunning 95% of shareholders of both companies. The Chinese government has awarded him the government’s highest award for a non-Chinese person. Of foreigners who have contributed significantly to Chinese growth, the Chinese government views John Thornton as one of the fifteen most important people in the world.
Barrick shareholders are not just in good hands. They are in spectacular hands! A breakout from the bull wedge with a Friday close over $14 is a rocket launch signal for the entire gold mining sector. Rather than wasting time worrying about a tax loss season that is going the way of the dodo bird, I suggest that gold stock investors should be positioning themselves, as Goldman clearly is, for the rocket ride of a lifetime, in a fabulous gold bull era!
Stewart Thomson is a retired Merrill Lynch broker. Stewart writes the Graceland Updates daily between 4am-7am. They are sent out around 8am-9am. The newsletter is attractively priced and the format is a unique numbered point form. Giving clarity of each point and saving valuable reading time.
Risks, Disclaimers, Legal
Stewart Thomson is no longer an investment advisor. The information provided by Stewart and Graceland Updates is for general information purposes only. Before taking any action on any investment, it is imperative that you consult with multiple properly licensed, experienced and qualified investment advisors and get numerous opinions before taking any action. Your minimum risk on any investment in the world is: 100% loss of all your money. You may be taking or preparing to take leveraged positions in investments and not know it, exposing yourself to unlimited risks. This is highly concerning if you are an investor in any derivatives products. There is an approx $700 trillion OTC Derivatives Iceberg with a tiny portion written off officially. The bottom line: Are You Prepared?
Fed week is exciting for some. Gold bulls and bugs alike hope the Fed will do something or say something that will trigger a huge move in precious metals. It doesn’t work like that. The Fed follows the market, which for the Fed Funds rate (FFR) is the 2-year yield. The 2-year yield has been screaming higher over the past 12 months and it implies at least another two rate hikes in the future. That’s not good for precious metals and could be partly why (among other reasons) Gold and gold stocks have lost their 200-day moving averages. Whatever the reason, the short-term technicals are negative and there is risk of increased selling before a potential rebound in July.
First, let’s take a look at Gold and gold against the equity market. As we can see from the chart, Gold in June has failed twice at its 200-day moving average. That is different from 2017 when each time Gold lost its 200-day moving average, it made a V rebound back above it.
Gold & Gold/Stocks
Gold’s weakness against the broad equity market is another concern. At the bottom of the chart we plot Gold against the NYSE, a broad stock market index. The ratio recently failed at its downtrending 200-day moving average and is also threatening a move to new lows for essentially the first time since 2015. (The December 2017 break was not sustained to the downside).
Elsewhere, the miners have spent the second quarter wrestling with their 200-day moving averages. GDX failed at its 200-dma twice in the past month, including last week. Meanwhile, GDXJ has shown a tiny bit more strength but essentially has wrestled with its 200-dma since April. The silver stocks (SIL) have been weaker as they have not traded above their 200-dma since January and could have started to breakdown on Friday by closing at 3-month low.
GDX, GDXJ, & SIL
The immediate outlook for precious metals is negative as the price action suggests but current bearish sentiment implies a rebound is on the horizon. The summer could be playing out as we anticipated three weeks ago. An immediate move lower could push Gold to strong support around $1260 and that would put sentiment indicators into truly extreme territory. From there, it is critical that the sector recaptures 200-day moving averages. Given our recent cautious views, we have narrowed our focus to a smaller group of companies capable of performing well in this environment. To follow our guidance and learn our favorite juniors for the next 6 to 12 months, consider learning about our premium service.
Last week index score: 52.74
This week: 30.90
The Oreninc Index fell in the week ending May 25th, 2018 to 30.90 from 52.74 a week ago despite gold recovering from the prior weeks’ fall below US$1,300/oz.
Gold recovered from a brief sojourn below the US$1,300/oz level as risk returned with US president Donald Trump calling off a landmark summit with North Korean leader Kim Jong Un. The yield on the US ten-year treasury fell below 3% as suggestions from the US Federal Reserve about a temporary rise in inflation raised questions over whether there will be multiple interest rate increases this year. All good news for gold. All eyes will be on the US Federal Reserve Open Market Committee meeting on June 12-13.
On to the money: total fund raises announced fell to C$38.8 million, an eleven-week low, which included two brokered financings for C$10.8 million, a two-week low and one bought deal financing for C$7.0 million, a two-week low. The average offer size fell to C$2.9 million, a three-week low and the number of financings fell to 13, an eleven-week low.
Gold closed at US$1,309/oz from US$1,293/oz a week ago. Gold is now down 0.04% this year. The US dollar index continued to increase and closed up at 94.25 from 93.63 a week ago. The Van Eck managed GDXJ made a slight gain after a volatile week closing up at US$32.89 from US$32.84 last week. The index is down 3.63% so far in 2018. The US Global Go Gold ETF fell slightly to close at US$12.93 from US$12.98 a week ago. It is now down 0.61% so far in 2018. The HUI Arca Gold BUGS Index closed up at 180.20 from 177.75 last week. The SPDR GLD ETF continued to sell off and closed its inventory at 848.50 tonnes from 855.28 tonnes a week ago.
In other commodities, silver made a small gain on a volatile week to close up at US$16.51/oz from US$16.44/oz a week ago. Copper showed a similar pattern to close up at US$3.07/lb from US$3.06/lb last week. Oil was the main loser of the week with its price taking a dump at the end of the week to close down at US$67.88 a barrel from US$71.28 a barrel a week ago.
The Dow Jones Industrial Average returned to growth to close up at 24,753 from 24,715 last week. Canada’s S&P/TSX Composite Index showed a slight loss to close down at 16,075 from 16,162 the previous week. The S&P/TSX Venture Composite Index also closed down at 775.41 from 786.39 last week.
Summary:
Number of financings crumbled to 13, an eleven-week low.
Two brokered financings were announced this week for C$10.8m, a two-week low.
One bought-deal financing was announced this week for C$7.0m, a two-week low.
Total dollars plunged to C$38.8m, an eleven-week low.
Average offer size dropped to C$2.9m, a three-week low.
Financing Highlights
Probe Metals (TSX-V: PRB) opened a C$14 million financing.
Bought deal with Sprott Capital Partners and a syndicate of underwriters
Flow through units @ C$1.90 and non flow-through units @ C$1.15
Each unit consists of one share and half a warrant exerciseable @ C$1.45 for two years.
Underwriters option to purchase C$2.1 million in units.
Gross proceeds will fund exploration on Probe’s projects in Québec.
Closing is expected on June 19th.
Major Financing Openings:
Great Bear Resources (TSX-V: GBR) opened a C$7.83 million offering on a best efforts basis. Each unit includes half a warrant that expires in 24 months.
Probe Metals (TSX-V: PRB) opened a C$7 million offering underwritten by a syndicate led by Sprott Capital Partners on a bought deal basis. Each unit includes half a warrant that expires in 24 months. The deal is expected to close on or about June 19th.
Probe Metals (TSX-V: PRB) opened a C$7 million offering on a best efforts basis. The deal is expected to close on or about June 19th.
Para Resources (TSX-V: PBR) opened a C$6.4 million offering on a best efforts basis. Each unit includes a warrant that expires in 36 months.
Major Financing Closings:
SRG Graphite (TSX-V: SRG) closed a C$8 million offering underwritten by a syndicate led by National Bank Financial on a best efforts basis. Each unit included a warrant that expires in 12 months.
Wealth Minerals (TSX-V: WML) closed a C$6.25 million offering on a best efforts basis. Each unit included half a warrant that expires in 24 months.
Zinc One Resources (TSX-V: Z) closed a C$3.89 million offering on a best efforts basis. Each unit included half a warrant that expires in 36 months.
Alexandra Capital (TSX-V: AXC) closed a C$2.6 million offering on a best efforts basis.
About Oreinc.com:
Oreninc.com is North America’s leading provider of relevant financing information in the junior commodities space. Since 2011, the company has been keeping track of financings in the junior mining as well as oil and gas space. Logging all relevant deal and company information into its proprietary database, called the Oreninc Deal Log, Oreninc quickly became the go-to website in the mining financing space for investors, analysts, fund managers and company executives alike.
The Oreninc Deal Log keeps track of over 1,400 companies, bringing transparency to an otherwise impenetrable jungle of information. The goal is to increase the visibility of transactions and to show financings activity in a digestible format. Through its daily logging activities, Oreninc is in a position to pinpoint momentum changes in the markets, identify which commodities are trending and which projects are currently receiving funding.
Gold failed to breakout in the spring and recently lost weekly support at $1310. Meanwhile, the gold stocks have held up well in recent weeks (considering Gold) but still have much to prove. Silver couldn’t rally much when its net speculative position was at an all time low. The question now is where do things go from here. The price action is not bullish but with a Fed hike looming and negative sentiment, Gold could be poised to snapback after testing lower levels.
The technicals for Gold show a strong confluence of support at $1265 to $1270. It has traded as low as $1281 in recent days. Trendlines and long-term moving averages coalesce at $1265 to $1270. On the weekly chart, $1265 stands out as a key level. A little bit more selling could bring Gold down to key support.
Gold with Sentiment Indicators
The sentiment indicators (shown at the bottom of the above chart) are encouraging and would be more so with a test of that aforementioned support. The net speculative position as of last Tuesday hit 22.7% of open interest, which is one of the lowest readings of the past two years. The daily sentiment index hit only 10% bulls last week. It’s 21-day average is 32% bulls and if that fell below 30% it would mark a 9-month low.
Turning to the miners, we find a sector that continues to be wedged in between support and resistance. GDXJ has trendline and lateral support in the $31s with key resistance in the low $34s. GDX has immediate support at $22 and strong support at $21 while initial resistance is at $23. If Gold is to have another chance to breakout in the months ahead then GDX and GDXJ need to surpass their April highs.
GDXJ, GDX Daily Bar Charts
While we are concerned about Gold for the remainder of 2018, it could be setting up for a summer rally and especially if it drops to strong support around $1265. Sentiment would reach even more encouraging levels and that coupled with strong technical support could produce a rebound. In the meantime we continue to focus on and accumulate the juniors that have 300% to 500% return potential over the next 12 to 18 months. To follow our guidance and learn our favorite juniors for the balance of 2018, consider learning more about our premium service.
A few weeks ago we wrote that it may not be Gold’s time yet but a few recent developments suggest its time could be sooner than we anticipated. Although Gold failed to breakout last week, we should note the positive action in the miners. Over the past seven trading days the miners have strongly outperformed Gold. That includes the juniors, which appear very close to breaking out of the downtrend that has been in effect for over 12 months.
In the chart below we plot the three major junior ETFs: GDXJ, GOEX (explorers) and SILJ (silver juniors). The juniors have trended lower since February 2017 but are now threatening to break trendline resistance. Since December 2017 the juniors have traded in an increasingly tighter and tighter range which indicates a break is coming very soon. Also, note how the 200-day moving averages are flat and no longer sloping lower. That reflects a mature correction and the potential for a new uptrend if the juniors break above resistance in a strong fashion.
GDXJ, GOEX, SILJ Daily Bar Charts
There are a few other things worth mentioning.
First, as we alluded to, GDXJ has strongly outperformed Gold over the past seven trading days. The GDXJ to Gold ratio has reached its highest mark since the start of February. That sudden relative strength is significant considering Gold is within spitting distance of a major breakout.
Second, one custom breadth indicator we track is the percentage of juniors (a basket of 50 stocks) trading above the 200-day moving average. This figure (currently 42%) has not exceeded 51% since February 2017. A strong push above 51% could confirm a renewed uptrend in the juniors.
If juniors are going to break out of their downtrends, it could mark the start of potentially a very large move. Gold, upon a breakout through $1375, will have a measured upside target of roughly $1700/oz. Although the juniors aren’t very close to breaking their 2016 high, they, upon a breakout would have similar upside potential. GDXJ, upon a breakout through $50 would have a measured upside target of $83.
GDXJ & Gold Necklines
That potential measured upside target for GDXJ may seem extreme but for juniors its par for the course. Below we show an updated chart of our Junior Gold Stocks Bull Analog. By my data, juniors are well below where they were during the 2001-2007 and 2008-2011 bull markets. So if Gold breaks higher and is going to reach $1700/oz then juniors are likely to catch up to historical performance.
TDG Junior Gold Stocks Bull Analog
Although Gold failed to breakout (again) last week, the performance in the gold stocks did not confirm that failure. The newfound relative strength, if sustained over the next few weeks could signal that a sector breakout is much closer than previously anticipated. The juniors are very close to breaking their downtrend and that break could only be the start of a potentially massive move. In anticipation of that potential move, we have been accumulating the juniors that have 300% to 500% upside potential over the next 18-24 months. To follow our guidance and learn our favorite juniors, consider learning more about our premium service.
Last week index score: 28.01 (updated)
This week: 42.63
Zinc One Resources (TSXV:Z) received the first results from drilling at its Bongará zinc mine project in north-central Peru.
NuLegacy Gold (TSXV: NUG) said late winter storms deposited as much as three feet of snow on parts of its Red Hill property in the Cortez gold trend of Nevada, USA.
Prospero Silver (TSXV: PSL) announced the results of the third hole of a three-hole drill program at the Pachuca SE project in Hidalgo, Mexico.
Avrupa Minerals (TSXV: AVU) closed a private placement and raised C$550,000.
The Oreninc Index increased in the week ending March 30th, 2018 to 42.63 from an updated 28.01 a week ago as brokered and bought deal financings returned, even though it was a short week due to the Easter break.
Another swinging volatile week for gold as its recent fear trade boost subsided as US president Donald Trump deflated some of his trade tariff rhetoric. However, market analysts increasingly expect a gold breakout to occur, with the latest portent being that the gold/silver price ratio has gone past 80:1. This is the fifth time in the past 23 years that this has happened and on each previous occasion gold and silver equities exploded to the upside starting between 30-60 days later.
On to the money: total fund raises announced tripled to C$96.1 million, a four-week high, which included three brokered financings for C$13.3m, a two-week high, and two bought-deal financings for C$3.0 million, also a two-week high. The average offer size almost tripled to C$3.7 million, a four-week high.
Another range-bound volatile week for gold during which the yellow metal closed down at US$1,325/oz from US$1,347/oz a week ago despite hitting a mid-week high of US$1,353/oz. Gold is now up 1.74% this year. Meanwhile, the US dollar index closed up at 89.97 from 89.44 a week ago. The van Eck managed GDXJ alsoclosed down at US$32.15 from US$32.78 last week. The index is down 5.80% so far in 2018. The US Global Go Gold ETF manged to hold its ground, dipping slightly to close down at US$12.71 from US$12.74 a week ago. It is down 2.31% so far in 2018. The HUI Arca Gold BUGS Index closed down at 175.41 from 176.86 last week. The SPDR GLD ETF saw some selling to close down at 846.12 tonnes from 850.54 tonnes a week ago.
In other commodities, the silver closed down at US$16.36/oz from US$16.56/oz a week ago. Copper recovered from its recent fall below the US$3.00/lb level to close up at US$3.02/lb from US$2.99/lb last week. Oil put in a losing week and closed down at US$64.94 a barrel from US$65.88 a barrel a week ago.
The Dow Jones Industrial Average showed signs of recovering from the trade-war potential resulting from Trump’s China tariffs announcement, to close up at 24,103 from 23,533 last week. Likewise, Canada’s S&P/TSX Composite Index got on the road to recovery to close up at 15,367 from 15,223 the previous week. The S&P/TSX Venture Composite Index closed down at 796.67 from 817.80 last week.
Summary:
Number of financings grew to 26, a two-week high.
Three brokered financings were announced this week for C$13.3m, a two-week high.
Two bought-deal financings were announced this week for C$3.0, a two-week high.
Total dollars jumped up to C$96.1m, a four-week high.
Average offer size also grew to C$3.7m, a four-week high.
Financing Highlights
Asanko Gold (TSX: AKG) opened a US$17.6 million (C$22.79 million) offering on a strategic deal basis with Gold Fields, which will purchase 22.4 million shares @ US$0.79, a 9.9% interest.
Asanko also entered into a JV with Gold Fields under which it will receive US$185 million for a 50% interest in its Asanko gold mine.
Asanko will use the proceeds to repay US$164 million of debt with Red Kite.
Serabi Gold (TSX: SBI) announced a US$15 million strategic private placement with Greenstone Resources.
297.8 million @ 0.5 pence, a 29.82% interest.
Funds will be used to undertake drilling to delineate additional resources and expand the life of mine at the Palito and Sao Chico projects, and advance the recently acquired Coringa project, all in Brazil.
Serabi also opened a private placement for a minimum of US$8.0 million @ 3.6 pence undertaken by Peel Hunt.
Major Financing Openings:
Asanko Gold (TSX:AKG) opened a C$22.79 million offering on a strategic deal basis.
Serabi Gold (TSX:SBI) opened a C$18.46 million offering on a strategic deal basis.
North American Nickel (TSXV:NAN) opened a C$15 million offering on a best efforts basis. Each unit includes half a warrant that expires in two years.
Serabi Gold (TSX:SBI) opened a C$10.32 million offering underwritten by a syndicate led by Peel Hunt on a best efforts basis.
Major Financing Closings:
Serabi Gold (TSX:SBI) closed a C$11.53 million offering underwritten by a syndicate led by Peel Hunt on a best efforts basis.
Auryn Resources (TSXV:AUG) closed a C$10.08 million offering underwritten by a syndicate led by Cantor Fitzgerald Canada on a bought deal basis.
Skeena Resources (TSXV:SKE) closed a C$8.46 million offering underwritten by a syndicate led by PI Financial on a best efforts basis. Each unit included half a warrant that expires in two years.
Chakana Copper (TSXV:PERU) closed an C$8 million offering underwritten by a syndicate led by Eventus Capital on a best efforts basis.
Company News
Zinc One Resources (TSXV: Z) received the first results from drilling at its Bongará zinc mine project in north-central Peru. Drilling commenced at the Mina Grande Sur and Bongarita zones where two portable drill rigs are currently operating. At Mina Grande Sur, 543m were completed in 33 holes with highlights including 5.5m @ 26.1% Zn in hole MGS18001. At Bongarita, 587m were completed in 36 holes with highlights including 11.5m @ 16.0% Zn in hole BO18005.
Analysis
The initial results are very optimistic and demonstrate the potential of the project by confirming its high-grade nature, particularly given that many intercepts start at or near surface. The results will contribute to the upcoming resource estimate and PEA planned for 2018.
NuLegacy Gold (TSXV: NUG) said late winter storms deposited as much as three feet of snow on parts of its Red Hill property in the Cortez gold trend of Nevada, USA making access to selected drill target areas difficult and dangerous. As a consequence, the company had to release a reverse circulation drill rig it contracted to begin drilling in late March and replaced it with a drill scheduled to arrive late April. Drilling will initially focus on following up on the 2017 success in the Serena and Avocado zones in areas with broad intervals of intense alteration, silicification and decalcification seen in several of the drill holes in this large exploration area.
Analysis
Freak weather can happen, but this event should only delay the company by a month.
Prospero Silver (TSXV: PSL) announced the results of the third hole of a three-hole drill program at the Pachuca SE project in Hidalgo, Mexico. Drilling confirmed the presence of highly anomalous silver values hosted by blind epithermal veining in three widely separated zones hosted by 7km of structures on the property. Hole 3 cut multiple zones of anomalous silver including 1.5m @ 121.3g/t Ag & 0.37g/t Au.
Analysis
Drilling of the Pachuca targets continues drilling the third of three initial projects funded by Fortuna Silver (TSX: FVI) in early stage proof of concept programs. The program successfully demonstrated that Pachua SE hosts blind epithermal veins with silver and gold mineralization. The next step will be to agree additional drilling to define the extent of mineralization in the veins.
Avrupa Minerals (TSXV: AVU) closed a private placement and raised C$550,000 and issued 6.9 million units @ C$0.08. Each unit consists of one share and one warrant exercisable @ C$0.12 for two years. The funds will be used for exploration mainly in Portugal and Kosovo.
About Oreinc.com:
Oreninc.com is North America’s leading provider of relevant financing information in the junior commodities space. Since 2011, the company has been keeping track of financings in the junior mining as well as oil and gas space. Logging all relevant deal and company information into its proprietary database, called the Oreninc Deal Log, Oreninc quickly became the go-to website in the mining financing space for investors, analysts, fund managers and company executives alike.
The Oreninc Deal Log keeps track of over 1,400 companies, bringing transparency to an otherwise impenetrable jungle of information. The goal is to increase the visibility of transactions and to show financings activity in a digestible format. Through its daily logging activities, Oreninc is in a position to pinpoint momentum changes in the markets, identify which commodities are trending and which projects are currently receiving funding.
Gold has firmed above $1300 in recent days and is holding comfortably above $1300 for now. We think the market will break to the upside sometime this year. The question is when. Here are 3 things to watch that will tell us if Gold is on the cusp of that break-out soon or later.
First, keep your eye on Gold’s close at the end of next week. It’s not only the end of the week and month but also the end of the quarter. While Gold has traded above $1350 multiple times in the past two years, it has not made a quarterly close above $1330 since 2012. Since this is a quarterly time frame, we would need to see a close above $1340 or even $1345 to mark a significant breakout. If Gold can make such a close next Friday then the odds are good that it could break above $1375 fairly soon.
Gold Quarterly Chart
Second, (and I always beat this to death) Gold needs to break its downtrends relative to foreign currencies (FC) and equities. The Gold/equities ratio appears to be breaking out but needs follow through for confirmation. The 200-day moving average in that chart appears to have stopped declining. If the ratio can hold above the 200-day moving average then it’s obviously a bullish sign. Meanwhile, Gold/FC has work to do. Over the last 10 months, it has traded in a tighter and tighter range. That trendline resistance could go hand in hand with resistance at $1365-$1375.
Gold, Gold/Foreign Currencies, Gold/Stocks
Finally, on the equity side, we want to see if GDX and GDXJ can break above their “A” resistance levels which are roughly $23 for GDX and $34 for GDXJ. The miners have been relatively oversold and with improving breadth (discussed in our premium updates) they could reach the A targets, which are slightly above the 200-day moving averages. If the market is sensing a break-out in Gold then GDX and GDXJ should trend above the A targets while the 200-day moving averages would become support. A move up to the B targets over the next four to six weeks would be very bullish.
GDX, GDXJ (Daily Line Charts)
Of course, the price action in Gold itself will answer the question but these other charts can not only give an early hint but can also inform as to the sustainability of Gold’s strength. The first test will be the quarterly close next week. Then we can monitor if the Gold/equities ratio is holding its breakout and if Gold/FC is strengthening.
The junior gold miners’ stocks have spent much of the past year grinding sideways near lows, sapping confidence and breeding widespread bearishness. The entire precious-metals sector has been left for dead, eclipsed by the dazzling taxphoria stock-market rally. But traders need to keep their eyes on the fundamental ball so herd sentiment doesn’t mislead them. The juniors’ recent Q4 results proved quite strong.
Four times a year publicly-traded companies release treasure troves of valuable information in the form of quarterly reports. Required by securities regulators, these quarterly results are exceedingly important for investors and speculators. They dispel all the sentimental distortions surrounding prevailing stock-price levels, revealing the underlying hard fundamental realities. That serves to re-anchor perceptions.
Normally quarterlies are due 45 calendar days after quarter-ends, in the form of 10-Qs required by the SEC for American companies. But after the final quarter of fiscal years, which are calendar years for most gold miners, that deadline extends out up to 90 days depending on company size. The 10-K annual reports required once a year are bigger, more complex, and need fully-audited numbers unlike 10-Qs.
So it takes companies more time to prepare full-year financials and then get them audited by CPAs right in the heart of their busy season. The additional delay in releasing Q4 results is certainly frustrating, as that data is getting stale approaching the end of Q1. Compounding the irritation, some gold miners don’t actually break out Q4 separately. Instead they only report full-year results, lumping in and obscuring Q4.
I always wonder what gold miners that don’t report full Q4 results are trying to hide. Some Q4 numbers can be inferred by comparing full-year results to the prior three quarterlies, but others aren’t knowable if not specifically disclosed. While most gold miners report their Q4 and/or full-year results by 7 to 9 weeks after year-ends, some drag their feet and push that 13-week limit. That’s very disrespectful to investors.
All this unfortunately makes Q4 results the hardest to analyze out of all quarterlies. But delving into them is still well worth the challenge. There’s no better fundamental data available to gold-stock investors and speculators than quarterly results, so they can’t be ignored. They offer a very valuable true snapshot of what’s really going on, shattering all the misconceptions bred by the ever-shifting winds of sentiment.
The definitive list of elite junior gold stocks to analyze comes from the world’s most-popular junior-gold-stock investment vehicle. This week the GDXJ VanEck Vectors Junior Gold Miners ETF reported $4.5b in net assets. Among all gold-stock ETFs, that was second only to GDX’s $7.9b. That is GDXJ’s big-brother ETF that includes larger major gold miners. GDXJ’s popularity testifies to the great allure of juniors.
Unfortunately this fame created major problems for GDXJ over the past couple years, severely hobbling its usefulness to investors. This ETF is quite literally the victim of its own success. GDXJ grew so large in the first half of 2016 as gold stocks soared in a massive upleg that it risked running afoul of Canadian securities laws. And most of the world’s smaller gold miners and explorers trade on Canadian stock exchanges.
Since Canada is the center of the junior-gold universe, any ETF seeking to own this sector will have to be heavily invested there. But once any investor including an ETF buys up a 20%+ stake in any Canadian stock, it is legally deemed to be a takeover offer that must be extended to all shareholders! As capital flooded into GDXJ in 2016 to gain junior-gold exposure, its ownership in smaller components soared near 20%.
Obviously hundreds of thousands of investors buying shares in an ETF have no intention of taking over gold-mining companies, no matter how big their collective stakes. That’s a totally-different scenario than a single corporate investor buying 20%+. GDXJ’s managers should’ve lobbied Canadian regulators and lawmakers to exempt ETFs from that 20% takeover rule. But instead they chose an inferior, easier solution.
Since GDXJ’s issuer controls the junior-gold-stock index underlying its ETF, it simply chose to unilaterally redefine what junior gold miners are. It rejiggered its index to fill GDXJ’s ranks with larger intermediate gold miners, while greatly demoting true smaller junior gold miners in terms of their ETF weightings. This controversial move defying many decades of convention was done stealthily behind the scenes to avoid outrage.
There’s no formal definition of a junior gold miner, which gives cover to GDXJ’s managers pushing the limits. Major gold miners are generally those that produce over 1m ounces of gold annually. For decades juniors were considered to be sub-200k-ounce producers. So 300k ounces per year is a very-generous threshold. Anything between 300k to 1m ounces annually is in the mid-tier realm, where GDXJ now traffics.
That high 300k-ounce-per-year junior cutoff translates into 75k ounces per quarter. Following the end of the gold miners’ Q4’17 earnings season in late March, I dug into the top 34 GDXJ components. That’s just an arbitrary number that fits neatly into the tables below. Although GDXJ included a staggering 73 component stocks in late March, the top 34 accounted for a commanding 80.5% of its total weighting.
Out of these top-34 GDXJ companies, only 4 primary gold miners met that sub-75k-ounces-per-quarter qualification to be a junior gold miner! Their quarterly production is highlighted in blue below, and they collectively accounted for just 8.1% of GDXJ’s total weighting. But even that is really overstated, as half of these are long-time traditional major silver miners that have started diversifying into gold in recent years.
GDXJ is inarguably now a pure mid-tier gold-miner ETF. That would be great if GDXJ was advertised as such. But it’s very misleading if investors still believe this dominant “Junior Gold Miners ETF” still gives exposure to junior gold miners. I suspect the vast majority of GDXJ shareholders have no idea just how radically its holdings have changed since early 2016, and how much it has strayed from its original mission.
I’ve been doing these deep quarterly dives into GDXJ’s top components for years now. In Q4’17, fully 31 of the top-34 GDXJ components were also GDX components! These ETFs are separate, a “Gold Miners ETF” and a “Junior Gold Miners ETF”. So there’s no reason for them to own many of the same companies. In the tables below I highlighted the rare GDXJ components not also in GDX in yellow in the weightings column.
These 31 GDX components accounted for 76.7% of GDXJ’s total weighting, not just its top 34. They also represented 32.2% of GDX’s total weighting. So over 3/4ths of the junior gold miners’ ETF is made up of nearly a third of the major gold miners’ ETF! These GDXJ components in GDX start at the 12th-highest weighting in that latter larger ETF and extend down to 44th. Do investors know GDXJ is mostly GDX gold stocks?
Fully 11 of GDXJ’s top 17 components weren’t even in this ETF a year ago in Q4’16. They alone now account for 36.6% of its total weighting. 16 of the top 34 are new, or 43.8% of the total. In the tables below, I highlighted the symbols of companies that weren’t in GDXJ a year ago in light blue. GDXJ has changed radically, and analyzing its top components’ Q4’17 results largely devoid of real juniors is frustrating.
Nevertheless, GDXJ remains the leading “junior-gold” benchmark. So every quarter I wade through tons of data from its top components’ 10-Qs or 10-Ks, and dump it into a big spreadsheet for analysis. The highlights made it into these tables. Blank fields mean a company did not report that data for Q4’17 as of this Wednesday. Companies have wide variations in reporting styles, data presented, and report timing.
In these tables the first couple columns show each GDXJ component’s symbol and weighting within this ETF as of this week. While many of these gold stocks trade in the States, not all of them do. So if you can’t find one of these symbols, it’s a listing from a company’s primary foreign stock exchange. That’s followed by each company’s Q4’17 gold production in ounces, which is mostly reported in pure-gold terms.
Many gold miners also produce byproduct metals like silver and copper. These are valuable, as they are sold to offset some of the considerable costs of gold mining. Some companies report their quarterly gold production including silver, a construct called gold-equivalent ounces. I only included GEOs if no pure-gold numbers were reported. That’s followed by production’s absolute year-over-year change from Q4’16.
Next comes the most-important fundamental data for gold miners, cash costs and all-in sustaining costs per ounce mined. The latter determines their profitability and hence ultimately stock prices. Those are also followed by YoY changes. Finally the YoY changes in cash flows generated from operations, GAAP profits, revenues, and cash on balance sheets are listed. There are a couple exceptions to these YoY changes.
Percentage changes aren’t relevant or meaningful if data shifted from positive to negative or vice versa, or if derived from two negative numbers. So in those cases I included raw underlying numbers instead of weird or misleading percentage changes. This whole dataset offers a fantastic high-level read on how the mid-tier gold miners are faring today as an industry. Contrary to their low stock prices, they’re doing quite well.
After spending days digesting these GDXJ gold miners’ latest quarterly reports, it’s fully apparent their vexing low consolidation over the past year isn’t fundamentally righteous at all! Traders have abandoned this sector because the allure of the levitating general stock markets has eclipsed gold. That has left gold stocks exceedingly undervalued, truly the best fundamental bargains out there in all the stock markets!
Once again the light-blue-highlighted symbols are new top-34 GDXJ components that weren’t included a year ago in Q4’16. And the meager yellow-highlighted weightings are the only stocks that were not also GDX components in late March! GDXJ is increasingly a GDX clone that offers little if any real exposure to true juniors’ epic upside potential during gold bulls. Sadly this ETF has become a shadow of its former self.
VanEck owns and manages GDX, GDXJ, and the MVIS indexing company that decides exactly which gold stocks are included in each. With one company in total control, GDX and GDXJ should have zero overlap in underlying companies! GDX or GDXJ inclusion should be mutually-exclusive based on the sizes of individual miners. That would make both GDX and GDXJ much more targeted and useful for investors.
VanEck could greatly increase the utility and thus ultimate success of both GDX and GDXJ by starting with one combined list of the world’s better gold miners. Then it could take the top 20 or 25 in terms of annual gold production and assign them to GDX. That would run down near 150k or 105k ounces of quarterly production based on Q4’17 data. Then the next-largest 30 or 40 gold miners could be assigned to GDXJ.
The worst part of GDXJ now including mid-tier gold miners instead of real juniors is the latter are being relentlessly starved of capital. As investment capital flows into ETFs, they have to buy shares in their underlying component companies. That naturally bids their stock prices higher. But in GDXJ’s case, the capital investors intend to use to buy juniors is being stealthily diverted into much-larger mid-tier gold miners.
While there are still some juniors way down the list in GDXJ’s rankings, they collectively make up about 20% of this ETF’s weighting at best. Junior gold miners rely heavily on issuing shares to finance their exploration projects and mine builds. But when their stock prices are down in the dumps because no one is buying them, that is heavily dilutive. GDXJ is effectively strangling the very industry its investors want to own!
Since gold miners are in the business of wresting gold from the bowels of the Earth, production is the best place to start. These top-34 GDXJ gold miners collectively produced 4193k ounces in Q4’17. That rocketed 87% higher YoY, but that comparison is meaningless given the radical changes in this ETF’s composition since Q4’16. On the bright side, GDXJ’s miners do still remain much smaller than GDX’s.
GDX’s top 34 components, fully 19 of which are also top-34 GDXJ components, collectively produced 10,337k ounces of gold in Q4. So GDXJ components’ average quarterly gold production of 140k ounces excluding explorers was 57% lower than GDX components’ 323k average. In spite of GDXJ’s very-misleading “Junior” name, it definitely has smaller gold miners even if they’re way above that 75k junior threshold.
Despite GDXJ’s top 34 components looking way different from a year ago, these current gold miners are generally faring well on the crucial production front. 17 of these mid-tier gold miners enjoyed big average production growth of 30% YoY! Overall average growth excluding explorers was 12.2% YoY, which is far better than world mine production which slumped 1.7% lower YoY in Q4’17 according to the World Gold Council.
These elite GDXJ mid-tier gold miners are really thriving, with production growth way outpacing their industry. That will richly reward investors as sentiment normalizes. Smaller mid-tier gold miners able to grow production are the sweet spot for stock-price upside potential. With market capitalizations much lower than major gold miners, investment capital inflows are relatively larger which bids up stock prices faster.
With today’s set of top-34 GDXJ gold miners achieving such impressive production growth, their costs per ounce should’ve declined proportionally. Higher production yields more gold to spread mining’s big fixed costs across. And lower per-ounce costs naturally lead to higher profits. So production growth is highly sought after by gold-stock investors, with companies able to achieve it commanding premium prices.
There are two major ways to measure gold-mining costs, classic cash costs per ounce and the superior all-in sustaining costs per ounce. Both are useful metrics. Cash costs are the acid test of gold-miner survivability in lower-gold-price environments, revealing the worst-case gold levels necessary to keep the mines running. All-in sustaining costs show where gold needs to trade to maintain current mining tempos indefinitely.
Cash costs naturally encompass all cash expenses necessary to produce each ounce of gold, including all direct production costs, mine-level administration, smelting, refining, transport, regulatory, royalty, and tax expenses. In Q4’17, these top-34 GDXJ-component gold miners that reported cash costs averaged just $618 per ounce. That was actually up a slight 0.5% YoY, so the higher production failed to force costs lower.
This was still quite impressive, as the mid-tier gold miners’ cash costs were only a little higher than the GDX majors’ $600. That’s despite the mid-tiers each operating fewer gold mines and thus having fewer opportunities to realize cost efficiencies. Traders must recognize these mid-sized gold miners are in zero fundamental peril as long as prevailing gold prices remain well above cash costs. And $618 gold ain’t happening!
Way more important than cash costs are the far-superior all-in sustaining costs. They were introduced by the World Gold Council in June 2013 to give investors a much-better understanding of what it really costs to maintain gold mines as ongoing concerns. AISC include all direct cash costs, but then add on everything else that is necessary to maintain and replenish operations at current gold-production levels.
These additional expenses include exploration for new gold to mine to replace depleting deposits, mine-development and construction expenses, remediation, and mine reclamation. They also include the corporate-level administration expenses necessary to oversee gold mines. All-in sustaining costs are the most-important gold-mining cost metric by far for investors, revealing gold miners’ true operating profitability.
In Q4’17, these top-34 GDXJ components reporting AISCs averaged just $855 per ounce. That only rose 0.1% YoY, effectively dead flat, despite the new mix of GDXJ components. That also compares very favorably with the GDX majors, which saw nearly-identical average AISCs at $858 in Q4. The mid-tier gold miners’ low costs prove they are faring far better fundamentally today than their low stock prices imply.
All-in sustaining costs are effectively this industry’s breakeven level. As long as gold stays above $855 per ounce, it remains profitable to mine. At Q4’s average gold price of $1276, these top GDXJ gold miners were earning big average profits of $421 per ounce last quarter! That equates to fat profit margins of 33%, levels most industries would kill for. The mid-tier gold miners aren’t getting credit for that today.
Unfortunately given its largely-junior-less composition, GDXJ remains the leading benchmark for junior gold miners. In Q4’17, this ETF averaged $32.62 per share. That was down a considerable 10.2% from Q4’16’s average of $36.34. Investors have largely abandoned gold miners because they are captivated by the extreme taxphoria stock-market rally since the election. Yet gold-mining profits certainly didn’t justify this.
A year ago in Q4’16, the top-34 GDXJ components at that time also reported average all-in sustaining costs of $855 per ounce. With gold averaging $1218 then which was 4.6% lower, that implies the mid-tier gold miners were running operating profits of $363 per ounce. Thus Q4’17’s $421 surged 16.0% YoY, a heck of a jump! Yet the mid-tier gold miners’ stock prices irrationally slumped substantially lower.
Gold miners offer such compelling investment opportunities because of their inherent profits leverage to gold. Gold-mining costs are largely fixed during mine-planning stages, when engineers and geologists decide which ore to mine, how to dig to it, and how to process it. The actual mining generally requires the same levels of infrastructure, equipment, and employees quarter after quarter regardless of gold prices.
With gold-mining costs essentially fixed, higher or lower gold prices flow directly through to the bottom line in amplified fashion. This really happened in GDXJ over the past year despite its radical changes in composition. A 4.8% gold rally in quarterly-average terms catapulted operating profits 16.0% higher, or 3.3x. That’s right in line with the typical leverage of gold-mining profits to gold prices of several times or so.
But this strong profitability sure isn’t being reflected in gold-stock prices. GDXJ shouldn’t have been lower in Q4’17 with mining profits much higher. The vast fundamental disconnect in gold-stock prices today is absurd, and can’t last forever. Sooner or later investors will rush into the left-for-dead gold stocks to bid their prices far higher. This bearish-sentiment-driven anomaly has grown more extreme in 2018.
Since gold-mining costs don’t change much quarter-to-quarter regardless of prevailing gold prices, it’s reasonable to assume the top GDXJ miners’ AISCs will largely hold steady in the current Q1’18. And it’s been a strong quarter for gold so far, with it averaging over $1328 quarter-to-date. If the mid-tier gold miners’ AISCs hold near $855, that implies their operating profits are now running way up near $473 per ounce.
That would make for a massive 12.4% QoQ jump in earnings for the mid-tier gold miners in this current quarter! Yet so far in Q1 GDXJ is languishing at an average of just $32.88, flat lined from Q4 where gold prices and mining profits were considerably lower. The mid-tier gold miners’ stocks can’t trade as if their profits don’t matter forever, so an enormous mean-reversion rally higher is inevitable sometime soon.
And that assumes gold prices merely hold steady, which is unlikely. After years of relentlessly-levitating stock markets thanks to extreme central-bank easing, radical gold underinvestment reigns today. As the wildly-overvalued stock markets inescapably sell off on unprecedented central-bank tightening this year, gold investment will really return to favor. That portends super-bullish-for-miners higher gold prices ahead.
The impact of higher gold prices on mid-tier-gold-miner profitability is easy to model. Assuming flat all-in sustaining costs at Q4’17’s $855 per ounce, 10%, 20%, and 30% gold rallies from this week’s levels would lead to collective gold-mining profits surging 45%, 77%, and 108%! And another 30% gold upleg isn’t a stretch at all. In the first half of 2016 alone after the previous stock-market correction, gold soared 29.9%.
GDXJ skyrocketed 202.5% higher in 7.0 months in largely that same span! Gold-mining profits and thus gold-stock prices surge dramatically when gold is powering higher. Years of neglect from investors have forced the gold miners to get lean and efficient, which will really amplify their fundamental upside during the next major gold upleg. The investors and speculators who buy in early and cheap could earn fortunes.
Given the radical changes in GDXJ’s composition over the past year, normal year-over-year comparisons in key financial results simply aren’t meaningful. The massive rejiggering of the index underlying GDXJ didn’t happen until Q2’17, so it will be a couple quarters yet until results finally grow comparable again. But in the meantime, here are the apples-to-oranges reads on the GDXJ components’ key financial results.
The cash flows generated from operations by these top-34 GDX components rocketed 104.5% higher YoY to $1743m. That helped boost their collective cash balances by 53.9% YoY to $6577m. Sales were up 102.6% YoY to $4282m, roughly in line with the 87.4% gold-production growth. But again GDXJ was way different a year ago, so this impressive growth merely reflects bigger mid-tier gold miners replacing true juniors.
As long as OCFs remain massively positive, the gold mines are generating much more cash than they cost to run. That gives the gold miners the capital necessary to expand existing operations and buy new deposits and mines. Given how ridiculously low gold-stock prices are today, you’d think the gold miners are hemorrhaging cash like crazy. But the opposite is true, showing how silly this bearish herd sentiment is.
Unfortunately the GAAP earnings picture looked vastly worse. These top-34 GDXJ gold miners reporting Q4 earnings collectively lost $317m, compared to a minor $2m profit in Q4’16. While that certainly looks like a disaster, it’s heavily skewed. Excluding 3 big mid-tier gold miners that reported huge losses in Q4, the other 11 of these top GDXJ gold miners reporting earnings actually earned an impressive $212m in profits.
Yamana Gold, New Gold, and Endeavour Mining suffered huge $200m, $196m, and $134m losses in Q4’17. In each case these resulted from large impairment charges. As mines are dug deeper and gold prices change, the economics of producing this metal change too. That leaves some of the mid-tier gold miners’ individual mines worth less going forward than the amount of capital invested to develop them.
So they are written off, resulting in big charges flushed through income statements that mask operating profits. But these writedowns are something of an accounting fiction, non-cash expenses not reflective of current operations. They are mostly isolated one-time events as well, not representing earnings trends. As gold continues to march higher in its young bull, impairment charges will vanish as mining economics improve.
So overall the mid-tier gold miners’ fundamentals looked quite strong in Q4’17, a stark contrast to the miserable sentiment plaguing this sector. Gold stocks’ vexing consolidation over the past year or so isn’t the result of operational struggles, but purely bearish psychology. That will soon shift as stock markets inevitably roll over and gold surges, making the beaten-down gold stocks a coiled spring overdue to soar dramatically.
Given GDXJ now diverting most of its capital inflows into larger mid-tier gold miners that definitely aren’t juniors, you won’t find sufficient junior-gold exposure in this now-mislabeled ETF. Instead traders should prudently deploy capital in the better individual mid-tier and junior gold miners’ stocks with superior fundamentals. Their upside is vast, and would trounce GDXJ’s even if it was still working as advertised.
At Zeal we’ve literally spent tens of thousands of hours researching individual gold stocks and markets, so we can better decide what to trade and when. As of the end of Q4, this has resulted in 983 stock trades recommended in real-time to our newsletter subscribers since 2001. Fighting the crowd to buy low and sell high is very profitable, as all these trades averaged stellar annualized realized gains of +20.2%!
The key to this success is staying informed and being contrarian. That means buying low before others figure it out, before undervalued gold stocks soar much higher. An easy way to keep abreast is through our acclaimed weekly and monthly newsletters. They draw on my vast experience, knowledge, wisdom, and ongoing research to explain what’s going on in the markets, why, and how to trade them with specific stocks. For only $12 per issue, you can learn to think, trade, and thrive like contrarians. Subscribe today, and get deployed in the great gold and silver stocks in our full trading books!
The bottom line is the mid-tier gold miners now dominating GDXJ enjoyed strong fundamentals in their recently-reported Q4 results. While GDXJ’s radical composition changes since last year muddy annual comparisons, today’s components mined lots more gold at dead-flat costs. These miners continued to earn fat operating profits while generating strong cash flows. Sooner or later stock prices must reflect fundamentals.
As gold itself continues mean reverting higher, these mid-tier gold miners will see their profits soar due to their big inherent leverage to gold. GDXJ now offers excellent exposure to mid-tier gold miners, which will see gains well outpacing the majors. All it will take to ignite gold stocks’ overdue mean-reversion rally is gold investment demand returning. The resulting higher gold prices will attract investors back to gold miners.
The precious metals sector continues to correct and consolidate. Gold remains in a bullish consolidation. It recently reached resistance again and even though it has failed to breakout, it remains above long-term moving averages which are sloping upward. However, the gold stocks and Silver remain in correction mode. They are trading below the long-term moving averages and at the lower end of their ranges over the past 12 months. That certainly provides an opportunity but these markets may not truly perform until Gold is ready to breakout.
Bullish Silver commentaries (because of its CoT) have been making the rounds and I don’t disagree. In the chart below we plot the net speculative position as a percentage of open interest. It is at 7.4%, which is the lowest reading in nearly three years. Interestingly, the daily sentiment index for Silver is not at an extreme. Its at 40% bulls. Technically, Silver is wedged in between support and resistance. A break does not appear imminent.
Like Silver, the gold stocks are oversold but we do not see an indication of an extreme oversold condition. In the chart below we plot GDX along with the difference between new highs and new lows. We also plot GDXJ along with the percentage of stocks (from a group of 50 we follow) that are trading above the 50-dma and 200-dma. GDX recently held above $21 again (even with over 20% of the index making new 52-week lows) while GDXJ is starting to show a bit more strength relative to GDX. At the low last Wednesday, 19% of those 50 juniors were trading above the 50-dma while 27% were trading above the 200-dma.
Gold, unlike Silver and the gold stocks, has not corrected much and remains much closer to resistance than support. Also, sentiment in Gold is much more optimistic than in Silver. The net speculative position in Gold is 37%, which dwarfs the 7.4% reading in Silver. Gold’s daily sentiment index is 56% bulls which is comfortably above Silver’s. During bull markets, corrections in Gold tend to push the net speculative position below 30%. Gold continues to maintain support at $1300 but we wonder if it needs to break that level and flush out some speculators before breaking out of its larger consolidation.
The precious metals sector is at an interesting juncture and it remains to be seen how the current disparity will resolve. One scenario is Gold breaks $1300 and this causes a mini-washout in the gold stocks and Silver. The other scenario is Gold continues to consolidate above $1300 and the gold stocks and Silver firm in anticipation of a major breakout in Gold. This is something that could take weeks to answer. In any event, we continue to remain patient and continue to accumulate the juniors we think have 5-fold potential over the next 18 months. To follow our guidance and learn our favorite juniors for the next 12-18 months, consider learning more about our service.
The gold miners’ stocks weathered the recent stock-market plunge really well. As evident in their leading GDX ETF, they were already beaten down before stock markets started falling. The resulting explosion of fear bled into GDX, forcing it even lower. Nevertheless, no major technical damage was done. GDX remained well within its consolidation trend channel and is still within striking distance of a major $25 breakout.
Gold stocks’ behavior during stock-market selloffs can seem capricious. This small contrarian sector generally amplifies the price action in gold, which drives its collective profitability. Gold tends to surge in the wake of major stock-market selloffs, which erode investors’ confidence in stocks’ near-term outlook. That greatly boosts gold investment demand as investors soon rush to wisely diversify their stock-heavy portfolios.
This drives gold prices higher after material stock-market weakness. So naturally the gold stocks mirror and amplify gold’s gains which really improve their fundamentals. But this broader strengthening trend is interrupted by a lot of chaotic noise. The collective greed and fear generated by the stock markets’ daily action heavily influences gold-stock traders, especially when the stock markets are exceptionally volatile.
The gold miners’ stocks are just that, stocks. So it’s not uncommon for them to get sucked into serious down days in the general stock markets, which fuel widespread fear. When the flagship S&P 500 stock index (SPX) falls sharply, nearly everything else is dumped in sympathy including the gold stocks. The SPX truly is the dominant center of the global financial-market-sentiment universe, greatly affecting everything.
Unfortunately sharp SPX down days’ ability to heavily influence GDX wreaks havoc on sentiment in the gold-stock sector. Traders read historical studies proving the precious-metals realm is the best place to deploy capital in and after weakening stock markets. So they rightfully expect gold-stock prices to rally on balance. But when GDX plunges on a big SPX down day, their fear soars and they abandon gold stocks.
Human psychology always tends to overweight the importance of recent and traumatic events, with our minds wanting to extrapolate short-term turmoil out into infinity. Thus when gold stocks get sucked into a sharp general-stock selloff, traders assume they can’t thrive in weak stock markets. They lose the trend forest for the daily trees! This fearful herd sentiment scares them into panicking and selling gold stocks low.
Weakening stock markets are like springtime for gold and its miners’ stocks due to higher investment demand. Just as daily temperatures gradually warm over time during spring, gold stocks rally on balance after material stock-market weakness. But spring weather also includes periodic cold snaps that can feel winter-like. They are just temporary counter trend aberrations though, like gold-stock drops on big SPX down days.
This first chart looks at gold stocks’ recent price action through the lens of GDX, the VanEck Vectors Gold Miners ETF. Since its birth in May 2006, GDX has grown into the leading and dominant gold-stock ETF. As of this week GDX’s $7.6b in assets under management ran a whopping 22.0x larger than its next-biggest 1x-long major-gold-stock-ETF competitor! GDX actually weathered the stock plunge really well.
The sharp stock-market selloff in the past couple weeks has been extraordinary, largely unprecedented on multiple key fronts. The S&P 500 was wildly overvalued and overbought in late January, deep in its longest span ever witnessed without a mere 5% pullback. Volatility was trading near record lows, which catapulted complacency off the charts. Last week I explored all this in an essay analyzing stock selling unleashed.
The first real day of serious SPX selling was Friday February 2nd. The gold stocks certainly weren’t high leading into that, as GDX had closed the day before at $23.70. That was merely on the high-middle side of gold stocks’ consolidation trading range. Really since late 2016, GDX has largely meandered between $21 support and $25 resistance. It had neared a major $25 breakout in late January, but couldn’t punch through.
On Friday the 2nd the SPX plunged 2.1% after rising wages on the US monthly jobs report stoked fears of inflation. 10-year Treasury yields continued their sharp surge since the latest Fed rate hike in mid-December. That SPX down day was the worst since September 2016, before Trump won the election and the resulting extreme taxphoria rally. It generated some real fear which spilled over into the gold stocks.
But that stock-fear bleed-in sure wasn’t the only reason GDX fell 3.3% that day to revisit its technically-important 200-day moving average. With inflation fears mounting, futures traders figured the Fed might have to increase the tempo of this rate-hike cycle. So the US Dollar Index surged a sharp 0.7% higher, which led gold-futures speculators to hammer gold 1.4% lower. GDX’s initial stock-selloff loss was reasonable.
The major gold stocks tend to amplify gold’s underlying price action by 2x to 3x. And GDX’s downside leverage to gold that day ran 2.4x, right in line. Most of the time gold stocks still follow gold, even when stock markets are weaker. But on exceptional SPX down days when fear really flares, that overshadows gold as traders are infected by prevailing herd sentiment. That really started to happen on Monday the 5th.
The SPX selloff greatly intensified as it plunged 4.1%, its worst daily drop since way back in mid-August 2011! That was extreme, as stock markets usually don’t plummet so rapidly from record highs. Because it had been so long since the SPX plunged, fear skyrocketed as evidenced by the VIX implied-volatility index. Foolish traders who had aggressively shorted volatility near record lows scrambled to unwind their bets.
Gold caught a modest bid that day, rallying 0.6% despite the US Dollar Index climbing another 0.4% on safe-haven buying. On days when the SPX plunges yet gold climbs, traders are torn about what to follow so the gold stocks generally split the difference. Indeed that day GDX slid another 0.9%, far milder than the sharp SPX plunge but still worse than gold. That left GDX at $22.71, sliding farther under its key 200dma.
After plunging even deeper early on Tuesday the 6th, the SPX reversed sharply to a 1.7% gain on close as the extreme VIX-futures long buying abated. Gold suffered a 1.1% loss on the stronger stock markets as well as a major 1.4% draw in its leading GLD gold ETF’s holdings. Investors likely dumped GLD shares for a source of capital. Since gold is much stronger than general stocks in SPX selloffs, GLD is easy to sell.
With gold falling sharply GDX dropped another 2.6% on that third day of the SPX selloff. Once again that made for 2.4x downside leverage to gold, which is perfectly normal. Although that decisively broke GDX below its 200dma, at $22.11 it remained well within its long-established consolidation trend channel. With trend support at $21, gold stocks still had a ways to go before they threatened a major technical breakdown.
The SPX selling resumed on Wednesday the 7th with a relatively-minor 0.5% loss. Gold fell by the same amount, as once again the US Dollar Index surged 0.7% on flight-capital safe-haven buying. GDX lost another 1.4% to hit $21.80 on close. That amplified gold by 2.8x, still within that normal 2x to 3x range for the major gold stocks. The gold stocks were weathering that sharp SPX selloff really well by that point.
On Thursday the 8th the stock markets started sliding again on no news, and the SPX fell relentlessly all day long. By the time the dust settled, it had collapsed another 3.8%! Two huge 4%ish down days out of just four trading days was very serious, generating the most fear traders have experienced for at least a couple years. Gold eked out a 0.1% gain with the US dollar flat, and the gold stocks split the difference as usual.
GDX only retreated 0.6% that day the SPX formally plunged into correction territory for the first time since early 2016. That was truly an impressive show of strength given the stock markets rapidly spiraling lower. At $21.68, GDX remained well above its $21 support line that has held rock solid since late 2016. It looked like the gold stocks were nearing selling exhaustion since they fell so little on such a huge SPX down day.
In just five trading days the SPX had plummeted 8.5%! That was a big drop by any standard, let alone off record highs out of near-record-low volatility. Interestingly GDX exactly mirrored that drop, falling an identical 8.5% in that same span. Relative to gold that was excessive, 3.5x the 2.4% gold lost during that same timeframe. But with GDX remaining well within its consolidation trend channel, technical damage was minor.
Last Friday the 9th once again saw the SPX slide rapidly after open before reversing sharply to a large 1.5% daily gain. Gold stocks got sucked into that early fear-spawning selling, which was exacerbated by gold itself slumping lower before a -0.2% close. GDX tested that $21 support intraday, but bounced back to a dead-flat close. This small contrarian sector had successfully weathered an exceptional SPX selloff!
This week the SPX and gold both rebounded, each rallying Monday, Tuesday, and Wednesday. Thus it wasn’t surprising GDX followed suit, rallying 1.3%, 0.1%, and a monster 4.6% by the data cutoff for this essay. Thus over the entire 9-trading-day span of the recent volatility storm, GDX merely slipped 2.9%. That was again between the SPX’s 4.4% loss and gold’s slight gain. The gold miners’ stocks are faring fine!
This Wednesday GDX was back up to $23.01, exactly in the middle of its consolidation trading range of the past year between $21 support and $25 resistance. GDX was back over its 200dma again, and still within striking range of that critical $25 breakout I discussed a month ago. If you had totally tuned out for 9 trading days and ignored the SPX-selloff action, it would’ve looked like gold stocks were still merely basing.
One of the greatest benefits to continuing to study the markets and staying immersed in them is you will gradually become immune to herd sentiment. After you’ve seen enough selloffs, they increasingly lose their ability to scare you. And you remember that sharp selloffs are short-lived, whether in the general stock markets or gold stocks. So you come to accept them as inevitable periodically, and they don’t rile you up.
A great analogy is a beekeeper. Most people are scared of bees, freaking out if bees buzz too closely or land on them. I know I’m no fan of bees invading my personal space. But beekeepers have no fear of bees because they work with them all the time. They certainly respect bees and understand the risks of being around them. But all their experience with bees leads to enough knowledge to negate emotional responses.
Gold stocks have always been a volatile sector. That’s actually a core reason they are so alluring, as this volatility translates into big and fast gains when they are rallying. In roughly the first half of 2016, GDX rocketed 151.2% higher on a parallel 29.9% gold upleg! Volatility is a double-edged sword, sectors that can rally fast will also fall fast. So gold-stock investors must accept periodic sharp selloffs as par for this course.
The major gold stocks as represented by GDX are doing fine. Despite some choppiness as the SPX was flailing about in recent weeks, they are continuing to base in their well-established consolidation trend. They are still on track for a major GDX $25 breakout, which will work wonders to shift sector psychology back to bullish again and spur big capital inflows. The gold miners’ stocks are low technically and cheap fundamentally.
This last chart zooms out to the bigger picture, looking at GDX since 2007 which is largely its entire life. Gold stocks move in great bull-bear cycles like everything else, and they remain incredibly low today. The small highlighted square in the lower right encompasses the entire first chart. These prevailing gold-stock levels are almost as low as during 2008’s epic stock panic, which is absurd based on fundamentals.
This powerful new gold-stock bull ignited in early 2016 remains young and small. Its bull-to-date peak in early August 2016 was merely a 3.3-year GDX high, still very low in secular context. After this sector was sucked into 2008’s stock panic, the major gold stocks more than quadrupled out of those extreme lows. A quadruple from January 2016’s all-time low birthing this bull would catapult GDX back up near $50.
That means the major gold stocks easily have the potential to more than double again from here, seeing another 117% GDX gain in the next couple years! Is there any other sector in all these wildly-overvalued stock markets that can make such a claim? No way. Like gold, the gold stocks are now deeply out of favor thanks to the extreme stock-market bull that may have just peaked in late January. Sentiment is poor.
But as gold inevitably powers higher in the wake of this newest SPX correction on strengthening demand from investors, the gold stocks will follow and amplify its gains. Fundamentally the major gold stocks are still dirt-cheap. That’s readily evident in their quarterly operational and financial reports, which I closely follow and analyze for the major GDX gold miners. I can’t wait for their Q4’17 results over the coming weeks.
The primary measure of industry-wide gold-mining profitability is all-in sustaining costs, what its costs to mine and replenish an ounce of gold. In Q3’17 that averaged $868 for the GDX gold miners. And these costs are pretty stable, averaging $867, $878, $875, and $855 in the four quarters before that. So odds are the major gold miners’ collective all-in sustaining costs will hold near these levels in Q4’17 and Q1’18 too.
Gold averaged $1279 in Q3, leading to fat per-ounce profits of $411. Gold was essentially flat in Q4 with a $1276 average price. That means the GDX-component gold miners are likely to soon report profits of $408 per ounce. I’ll dig deeply into those new Q4 quarterlies as they are released, and publish an essay on the results in mid-March. Since Q4 reporting includes full-year results, regulatory deadlines are twice as long.
The SEC requires normal quarterly reports to be filed within 40 to 45 days after quarter-ends, depending on companies’ sizes. But since they have to prepare annual reports with the quarter that ends fiscal years, usually Q4, that deadline is extended to 60 to 90 days. So by mid-March most of the major gold miners’ Q4’17 results will be out. I expect average all-in sustaining costs to come in flat like usual in these reports.
And that’s super-bullish given what gold is doing. The yellow metal that drives its miners’ profits is faring much better in Q1 than it did in Q4. It’s averaging $1331 quarter-to-date, up 4.3% sequentially from Q4. So if AISCs are stable like usual, profits will surge which investors will anticipate in advance. The same $868 AISC implies Q1 GDX-major-gold-miner profitability of $463 per ounce, soaring 13.3% quarter-on-quarter!
So my month-old forecast of a GDX $25 breakout on Q4 earnings remains highly likely. When investors see how the gold miners are faring in their latest reported quarter, they are going to extrapolate mining costs into Q1. That will portend exploding profitability. GDX only needs to rally another 8.6% from its mid-week levels to hit $25. And once gold stocks break out decisively to the upside, they are off to the races.
In all the markets buying begets buying. The more a sector or asset is rallying, the more investors want to participate. And the more capital they pour in, the more those prices keep rallying. That creates and fuels a powerful virtuous circle of buying. Gold stocks have drifted sideways for so long now that they need to achieve a major upside breakout from their consolidation to catch investors’ interest. That’s not far away.
Despite the roller-coaster ride in gold stocks as the wild SPX volatility bullied them around in the past couple weeks, GDX is still within striking distance of that key $25 breakout. Once that happens, the gold stocks’ popularity will surge again. There’s still time to buy low before lots more investors start returning which will catapult this small contrarian sector sharply higher. The gold stocks look really bullish today!
While investors and speculators alike can certainly play gold stocks’ powerful coming upleg with major ETFs like GDX, the best gains by far will be won in individual gold stocks with superior fundamentals. Their upside will far exceed the ETFs, which are burdened by over-diversification and underperforming gold stocks. A carefully-handpicked portfolio of elite gold and silver miners will generate much-greater wealth creation.
At Zeal we’ve literally spent tens of thousands of hours researching individual gold stocks and markets, so we can better decide what to trade and when. As of the end of Q4, this has resulted in 983 stock trades recommended in real-time to our newsletter subscribers since 2001. Fighting the crowd to buy low and sell high is very profitable, as all these trades averaged stellar annualized realized gains of +20.2%!
The key to this success is staying informed and being contrarian. That means buying low before others figure it out, before undervalued gold stocks soar much higher. An easy way to keep abreast is through our acclaimed weekly and monthly newsletters. They draw on my vast experience, knowledge, wisdom, and ongoing research to explain what’s going on in the markets, why, and how to trade them with specific stocks. For only $12 per issue, you can learn to think, trade, and thrive like contrarians. Subscribe today, and get deployed in the great gold and silver stocks in our full trading books!
The bottom line is the gold stocks weathered the recent sharp stock-market selloff really well. The SPX plunged for the first time in a couple years, generating a big and sharp fear spike. As usual that spooked the gold-stock traders, who sold and fled. Yet despite the carnage GDX’s major consolidation support at $21 held solid. The gold miners’ stocks soon rebounded sharply back up to the middle of their basing channel.
With GDX trading near $23 this week, that critical $25 breakout to entice investors back remains within easy range. Once the collective gold-mining costs reported in the upcoming Q4 results are compared with higher Q1 prevailing gold prices, strong gold-stock buying should resume. Gold stocks have always been a volatile sector, so there’s no reason for traders to fear periodic selloffs like they suffered in recent weeks.
It was a rough week for investors in stocks and stocks of all kinds. The S&P 500 lost 5%. Emerging Markets also lost 5%. Gold Stocks, which had weakened before the broader equity market have been hit hard. They (GDX, GDXJ) also lost 5% last week. The HUI Gold Bugs Index (which excludes royalty companies unlike GDX) lost 7%. After a strong start to the year, gold stocks have essentially given back all their gains. Nevertheless, we remain extremely optimistic on gold stocks over the next 12-18 months as trends in the economy and stock market should begin to support Gold after the second quarter.
Historically speaking some of the best performance in Gold and gold stocks occurred during or after a bear market in stocks. The best examples can be found in the 1970s and 2000s as the charts show. Gold surged after the bottom in stocks in 1970 and continued to perform very well during the 1973-1974 bear market. After a brief but sharp bear in 1975-1976 Gold rebounded strongly as the S&P 500 began a mild bear market in 1977. Years later Gold emerged from a significant bottom in 2001 while the stock market endured its worst bear market in a quarter century. Gold continued to perform even after the market bottom in late 2002. Gold emerged from the global financial crisis before the stock market but continued to make new highs after the stock market bottomed in March 2009.
This performance is not just random. It makes quite a bit of fundamental sense. As we know, Gold is driven by falling or negative real rates. Typically policy makers in response to a recession or bear market will pursue policies that lead to falling or negative real rates. These policies are not reversed until the economy gains strength. Gold can also benefit from inflationary recessions, which we saw in the 1970s. Perhaps we are headed for that outcome at somepoint but I digress.
The best comparison to today may be the mid 1960s. Although the Gold price was fixed until 1971, we can use gold stocks to study the macro picture of the 1960s and how it may relate to today.
Gold stocks and the stock market were positively correlated during the 1960s but gold stocks dramatically outperformed and especially from 1964 to 1968. That outperformance accelerated after 1963 as inflation and bond yields began to rise to higher and higher levels in the years ahead. That would soon negatively impact the stock market in both nominal and real terms. The Dow peaked in 1966 while the S&P 500 did not peak until 1973 (as it made marginal new highs in 1969 and 1973). In real terms stocks would peak in 1966 or 1968 (depending on which index you use).
Economic fundamentals appear to be headed in a direction that is bullish for Gold and gold stocks and less positive for the stock market. While inflation has yet to be unleashed, the markets are showing that inflationary pressures are forming. This will impact corporate margins (which are extremely high) as well as profits. Higher inflation also leads to higher bond yields which means higher costs to service debt. That is a problem for the economy and equity market due to the debts that have piled up in recent years.
So the question now is where is the threshold for when inflation and bond yields start affecting the economy and stock market in a way that is favorable for precious metals?
With respect to the 1960s and 1970s, the answer would be 1964.
When precious metals begin and sustain outperformance against the stock market it will signal that the threshold or inflection point has been reached. That outperformance will also go a long way in helping Gold make its major breakout.
It is not yet time for Gold and gold stocks to shine but it is getting very close. Gold remains in a bullish consolidation pattern that should give way to a breakout later in the year. Meanwhile, gold stocks and Silver are lagging badly but that does not have us concerned. The next few months could prove to be the best buying opportunity in precious metals since the end of 2015. Quality juniors that are bought on weakness over the medium term should deliver fantastic returns over the ensuing 12 to 18 months. To follow our guidance and learn our favorite juniors for 2018, consider learning more about our premium service.
The unnaturally-tranquil stock markets suddenly plunged over this past week. Volatility skyrocketed out of the blue and shattered years of artificial calm conjured by extreme central-bank distortions. This was a huge shock to the legions of hyper-complacent traders, who are realizing stocks don’t rally forever. With stock selling unleashed again, herd psychology will start shifting back to bearish which will fuel lots more selling.
As a contrarian student of the markets, I watched stocks’ recent mania-blowoff surge in stunned disbelief. On fundamental, technical, and sentimental fronts, the stock markets were as or more extreme than their last major bull-market toppings in March 2000 and October 2007! I outlined all this in an essay on these hyper-risky stock markets on 2017’s final trading day. The ominous writing was on the wall for all willing to see.
January’s extreme surge in the US stock markets made this selloff case even more likely. Mid-month in another essay I warned, “The stock markets are now dangerously overbought, implying a major selloff is probable and imminent. … Such extremes are very unusual and never sustainable for long, signaling major selloffs looming.” So the fact these crazy stock markets finally rolled over wasn’t a surprise at all.
But I was awestruck at the sheer violence of what happened last Friday and the subsequent Monday, it was very odd. Even though the countless market extremes argued strongly for a major selloff, they tend to be much more gradual initially off bull-market peaks. So it was fascinating to watch all this unfold in real-time with my data feeds and CNBC. Students of the markets live for anomalous exceedingly-rare events!
The igniting catalysts were multilayered. The US flagship S&P 500 broad-market stock index (SPX) had blasted to a dazzling new all-time record high on Friday January 26th. It was stretched a mind-boggling 14.0% over its key 200-day moving average, which itself was high and steeply rising! The 8.9-year-old stock bull that had powered 324.6% higher felt unstoppable. Traders were universally convinced it would continue.
But just a couple trading days later on Tuesday January 30th, significant selling emerged. That morning Amazon, Berkshire Hathaway, and JP Morgan declared they were going to form a healthcare company. That unanticipated news way out of left field crushed the major healthcare stocks, hammering the SPX 1.1% lower. That was actually a significant down day by recent standards, the worst seen since mid-August.
With euphoric bullish psychology dented, Jobs Friday arrived a few trading days later on February 2nd. That official monthly US jobs report saw a modest headline beat, but the big news came on the wages front. Average hourly earnings beat expectations by climbing 2.9% year-over-year, the hottest read on wage inflation since June 2009. That triggered inflation fears with the 10-year Treasury yield already at 2.78%.
Higher prevailing interest rates are a huge problem for bubble-valued stock markets. The SPX had just left January with its 500 elite component stocks sporting a simple-average trailing-twelve-month price-to-earnings ratio way up at 31.8x! Historical fair value is 14x, twice that at 28x is formal bubble territory. In a higher-rate environment, extreme valuations are far harder to tolerate. So the stock markets sold off.
A week ago Friday the SPX slid all day long to close at a major 2.1% loss. That proved its biggest down day since way back in September 2016, before Trump won the election and the resulting extreme stock rally first on Trumphoria and later on taxphoria. Something was changing, the unnaturally-low volatility regime was crumbling. That left speculators and investors alike very nervous heading into last weekend.
It had been an all-time-record 405 trading days since the SPX’s last 5% pullback, unbelievably extreme. So that selloff really struck a nerve, I started to hear from casual acquaintances I hadn’t spoken to for years. At a friend’s Super Bowl party Sunday night, once the guests I didn’t know found out what I do for a living I felt like a celebrity. We spent the first quarter talking about the markets, people were really concerned.
Monday the 5th was extraordinary, a record day in some respects. SPX futures were down less than 1% in pre-market trading, nothing wild. But once the US stock markets opened, the selling started gradually snowballing. It greatly intensified around 3pm, with the SPX plunging from -2.3% to -4.5% on the day in literally 11 minutes! There was no news at all, it simply looked and felt like cascading stop-loss selling.
All prudent traders put trailing stop-loss orders on their stock positions. They are an essential measure to manage risk. Once a stock falls a preset percentage from its best level achieved during a trade, that position is automatically sold. In big stock-market selloffs, as stop losses are sequentially hit they feed into the ongoing selling. The more stocks fall, the more stops triggered, the more sell orders fuel the maelstrom.
The SPX bounced a bit, but still plunged a whopping 4.1% on close Monday! That was a serious down day by any standard, actually the worst since way back in mid-August 2011 which followed Standard & Poor’s downgrading US sovereign debt. Everyone takes notice when stock markets suffer their biggest daily drop in 6.5 years. That really changes collective psychology, shattering the euphoria rampant in January.
But amazingly that SPX plunge wasn’t the most-interesting thing Monday. The implied volatility on SPX options is tracked in the famous VIX fear gauge. It skyrocketed a stupendous 125.8% higher that day, its largest daily spike ever witnessed! That wreaked colossal havoc in the short-volatility market. Since Trump’s election win, more traders and capital have flocked to bet on the idea that volatility will keep falling.
Students of market history knew that was an absurd bet before Monday’s spike. Stock-market volatility has always been cyclical, just like stock prices. Exceptionally-low or -high volatility levels always mean revert back to normal. So betting that the record-low stock volatility in recent months would keep going even lower was a foolish, suicidal bet even before Monday. That epic VIX spike totally gutted these guys.
There are, or were, extraordinarily-risky inverse-VIX exchange-traded notes. These were designed to rally when volatility fell, some even with leverage which traders liked to further amplify with their own margin. One of the leading inverse-VIX ETNs was XIV, which is VIX spelled backwards. It had closed at $129.35 per share on Thursday February 1st, but by this Tuesday it had imploded 94.3% in a termination event!
All these inverse-VIX ETNs were shorting VIX futures, so they had to become massive buyers on that sharp SPX selloff to close out those devastated positions. On Monday the banks sponsoring these crazy ETNs had to buy an extreme record 282k VIX futures contracts! That catapulted the VIX itself to 50.3 on Tuesday morning, about as high as it ever gets outside of actual crashes and panics. What a wild ride!
That begs the question what happens next? This stock-market-selling and volatility shock happened at a time when stock markets were already very precarious. Such an extreme event has to start altering herd psychology. This first chart looks at the SPX superimposed over the VIX during the last few years, both on a closing basis. Once serious selling starts out of toppy stock markets, it usually portends much more coming.
This week’s stock selling unleashed emerged in some of the most-toppy stock markets ever witnessed. Again the average SPX-component TTM P/E leading into it was a bubble-valued 31.8x! Again the SPX had stretched 14.0% above its 200-day moving average, some of the most-overbought conditions seen in all of SPX history. The SPX had rocketed vertically for most of January in popular-mania-grade euphoria.
The future impact of stock selling being unleashed really depends on the market conditions that birthed that selling spike. If stock prices were near multi-year lows leading into selling spikes, with valuations lower than their historical average of 14x earnings, these events can mark selling climaxes before major reversals higher. But unfortunately the exact opposite was true leading into our current sharp SPX plunge.
Coming out of what looked and felt like a mania blowoff top, this past week’s serious selling is surely an ominous omen. Stock markets can’t rally forever, yet that’s exactly what they seemed to be doing since Trump’s surprise election victory. Between Election Day and late January’s latest record high, the SPX had soared 34.3% higher in just 1.2 years! And that span was incredibly extreme with record-low volatility.
Again as of last Friday it had been an all-time-record 405 trading days without a single 5% peak-to-trough SPX pullback. That’s 1.6 years! Nothing like that had ever happened before. Technically a pullback is a 4%-to-10% selloff in the stock markets on a closing basis. The last pullbacks were minor, a 4.8% one in late 2016 following a 5.6% one in mid-2016. Those were the last material selloffs in the SPX before this week.
Periodic selloffs to rebalance sentiment are essential to keeping stock bulls healthy. The longer markets go without significant selloffs, the more greed and complacency multiply. Traders forget that stocks fall too, and their hubris leads them to take all kinds of excessive risks. Like betting that record-low volatility will persist indefinitely. The leveraged speculation eventually gets so extreme that it threatens the entire bull.
My favorite analogy on this is forest fires. Officials love to suppress natural wildfires to protect structures. But the longer firefighters put out every little wildfire, the denser forest underbrush gets. This fuel source grows out of control, eventually leading to a conflagration far too extreme to put out. Rather than having a bunch of smaller wildfires to keep fuel in check, suppression eventually guarantees a super-destructive hell fire.
Periodic pullbacks and corrections in stock markets allow the underbrush of greed to be burned away before it gets thick enough to become a systemic risk. Traders naively believe levitating stock markets are less risky, but the opposite is true. The longer a span without a serious selloff, the higher the odds one is coming soon. Normal healthy bull markets actually suffer 10%+ corrections once a year or so to keep balance.
It’s been 2.0 years since the last actual SPX correction, which bottomed in early 2016. The lack of both smaller pullbacks and larger corrections let complacency grow unchecked into greed, euphoria, and even hubris recently. And these emotional extremes have to be mostly burned away for this bull to have any hope of eventually heading higher. The only thing that can eradicate widespread greed is major stock selloffs.
After Monday’s serious 4.1% plunge, the SPX was still only down 7.8% since its peak just 6 trading days earlier. While that is unusual speed to see such a decline, it still only ranks towards the high end of mere pullback territory. We hadn’t even hit a correction yet at 10%, and they can stretch as high as 20%. The SPX’s last corrections ran 12.4% over 3.2 months in mid-2015 and 13.3% over 3.3 months into early 2016.
Given the extreme overvalued and overbought conditions leading into this past week’s plunge, there’s no way even that was enough to rebalance away the euphoric sentiment. So it’s all but certain the SPX will grind lower in the coming months, heading down well over 10% into deep correction territory. At 10% the SPX would merely be back to early-November levels, merely erasing the recent mania-blowoff surge.
If this correction approaches 20% as it really ought to, that would drag the SPX all the way back down to 2298. Those levels were first seen just over a year ago in late January 2017. That would reverse the lion’s share of the entire past year’s taxphoria rally, wreaking tremendous sentiment damage. But don’t forget corrections tend to take a few months, not a few days. So the selling is way more gradual than Monday’s.
That extreme 50 VIX spike Tuesday morning must be considered. Again that’s about as high as the VIX ever gets in normal corrections, implying the immediate selling pressure should have abated. The only times higher VIX levels are briefly seen is after crashes and panics. A crash is a 20%+ drop in just two trading days from very-high stock-market levels. This past week’s Friday-Monday selloff wasn’t even close.
Crashes are exceedingly rare in history, and next to impossible today given the widespread use of stock-market circuit breakers. They effectively close markets for a time after intraday selling milestones are hit. Today the SPX has levels triggered at 7%, 13%, and 20% intraday declines. The trading halts depend on when these declines occur within a trading day, before or after 3:25pm. They would slow crash-grade plummets.
Panics are steep 20%+ selloffs within two weeks, extreme but much slower than crashes. They tend to cascade from lows out of late-stage bear markets to climax them. They are very rare too, with 2008’s being the first formal one since 1907. The VIX can temporarily soar above 50 in crashes and panics, but those extremes never last for long. In normal market conditions, a 50 VIX spike should mark an absolute bottom.
But the problem this week is Tuesday’s extreme VIX spike was the result of panic buying of VIX futures to liquidate those inverse-VIX ETNs. That has never happened before. Without that dynamic, the VIX likely wouldn’t have gone much above 30. That too implies this stock-market selloff still has plenty of room to run. So the stock selling unleashed is likely to persist over a few months at least, despite the VIX spike.
Given the extremes in these stock markets in late January, I still suspect the odds heavily favor a new bear market over 20% instead of a bull-market correction. I presented this compelling SPX-bear case in late December, and don’t have room to rehash it here. Normal bear markets tend to cut stocks in half over a couple years or so, 50% SPX losses. That works out to a gradual average selling pace of 0.1% per day.
The last couple SPX bears give an idea of what to expect in the inevitable next bear after such an epic stock bull. The SPX fell 49.1% over 2.6 years ending in October 2002, and 56.8% over 1.4 years that climaxed in March 2009. A 50% SPX loss, which is conservative since bears tend to be proportional to their preceding bulls’ sizes, would drag this index back to 1436. That’s September-2012 levels, a long way down!
No one knows whether this stock selling unleashed will culminate in a bull-market correction under 20% or a new bear market over 20%. But either way, speculators and investors ought to swiftly boost their anemic portfolio allocations to gold. The record-high stock markets in recent years have led to radical gold underinvestment. Gold tends to rally on balance when stocks fall, it’s the ultimate portfolio diversifier.
As this final chart shows, after the last SPX correction ending in early 2016 gold surged into a major new bull market. Hyper-complacent stock traders suddenly realized that they needed to own gold to diversify their stock-heavy portfolios. That gold bull has persisted, powering higher in a strong uptrend ever since despite this past year’s extreme taxphoria stock-market rally. A new SPX correction will work wonders for gold.
That last SPX correction into early 2016 wasn’t large at just 13.3%. Yet that was still enough to motivate complacent investors to flock back to gold. Their heavy buying catapulted gold 29.9% higher in just 6.7 months! Gold turned on a dime from deep 6.1-year secular lows because a major stock-market selloff finally convinced investors to up their meager gold allocations. Every investor should have 5% to 10%+ in gold.
Just a week ago that ratio was likely only running around 0.14% based on the values of that leading GLD gold ETF and the collective market capitalizations of the 500 SPX companies! So with gold allocations essentially zero late in an extreme stock bull, there’s vast room for massive capital inflows into gold in the coming years as investors rebalance their portfolios. Gold thrives for a long time after major stock selloffs.
The gold buying isn’t instant when the SPX falls though, as traders need time to process the drop and its likely implications. Back in early 2016 stock investors really didn’t start aggressively buying GLD shares until the SPX suffered multiple big down days. The SPX fell 1.5%, 1.3%, 2.4%, and 1.1% on separate trading days in a single week before gold buying resumed. More big SPX losses soon accelerated these inflows.
If you don’t have a significant gold allocation in your portfolio, you ought to get buying. It can be done with physical gold bullion or GLD shares. If you want to leverage gold’s bull market that will accelerate following a major stock selloff, consider the stocks of great gold miners. They tend to amplify gold upside by 2x to 3x due to their fantastic profits leverage to gold. The precious-metals sector thrives after stock selloffs!
Finally the stock selling unleashed is likely just beginning due to what the major central banks are doing this year. The Fed’s unprecedented quantitative-tightening campaign to start reversing its trillions of dollars of QE liquidity injected that levitated stocks for years is accelerating throughout 2018. At the same time the European Central Bank slashed its own QE campaign in half until September, when it may cease entirely.
Between the Fed’s QT and ECB’s QE tapering, global stock markets face central-bank tightening running $950b in 2018 and another $1450b in 2019 compared to 2017 levels! This will certainly strangle this QE-inflated monster stock bull. So on top of everything else this week’s sharp selloff portends, the euphoric stock markets were already in serious trouble from record extreme central-bank tightening. Got gold yet?
Absolutely essential in falling markets is cultivating excellent contrarian intelligence sources. That’s our specialty at Zeal. After decades studying the markets and trading, we really walk the contrarian walk. We buy low when few others will, so we can later sell high when few others can. While Wall Street will deny the coming stock-market bear all the way down, we will help you both understand it and prosper during it.
We’ve long published acclaimed weekly and monthly newsletters for speculators and investors. They draw on my vast experience, knowledge, wisdom, and ongoing research to explain what’s going on in the markets, why, and how to trade them with specific stocks. As of the end of Q4, all 983 stock trades recommended in real-time to our newsletter subscribers since 2001 averaged stellar annualized realized gains of +20.2%! For only $12 per issue, you can learn to think, trade, and thrive like contrarians. Subscribe today!
The bottom line is the stock selling unleashed this week isn’t over. Given the fundamental, technical, and sentimental extremes around January’s record highs, a sub-10% pullback isn’t enough to eradicate the euphoria. At best a major correction approaching 20% is necessary, and those tend to run a few months or so. This week’s extreme VIX spike to levels that usually mark major bottoms was artificial, not normal.
And after such an extreme bull market largely driven by record central-bank easing, the odds really favor this selloff eventually growing into a 20%+ new bear. Especially with the major central banks starting to aggressively pull their liquidity in 2018. Whether a major bull correction or major new bear market, gold tends to thrive after major stock-market weakness. That leads investors to buy gold to re-diversify their portfolios.
I told subscribers to expect $1320 to function as a headwind for gold on this rally, and that’s happening right on schedule. To understand the nature of this headwind, please click here now. Double-click to enlarge this important weekly gold chart.
Note that the two biggest volume bars both occurred as key events in India occurred.It could be said that when America catches a general stock market cold, world markets get the flu.
Horrifically, when India catches the gold demand sniffles, Western gold and silver stocks can look like they have financial Ebola.
It’s clear that $1320 has functioned as a significant headwind to all the major rallies of the past four years. The good news is that technically, resistance weakens the more times it is tested. I’ve predicted that gold is nearing the day when it shoots up above $1320 and begins the climb towards the next massive resistance zone at $1500.
Will India be the catalyst that launches the price blast to the upside? Well, that’s the most likely scenario, but a big helping hand could come from new central bank chief Powell in America. He’s due to be sworn in on February 4, 2018. That’s less than a month from now.
Powell’s proposed deregulation of America’s small banking industry, combined with rate hikes and quantitative tightening (QT) should create a major money velocity bull cycle.That bull cycle is more important to gold stocks than bullion. There’s no point buying gold stocks if they can’t outperform low risk bullion.
For bullion, the most likely catalyst for significantly higher prices is a long overdue gold import duty cut in India.
The good news is that I’m predicting that both a duty cut and the US money velocity bull cycle are coming. India has national elections in 2019 and Prime Minister Modi’s promises to help jewellers and create a million jobs a month are dismal failures.
To win the election, it’s likely that Modi soon starts spending money like water and asks his finance minister Jaitley to cut the gold import duty. With both India and Powell poised to take action that is positive for gold, all precious metals market investors (both bullion and mine stocks) should feel very comfortable now.
For a closer look at gold’s price action here in the $1320 resistance zone, please click here now. Double-click to enlarge.
The $1300 and $1270 price zones both offer decent minor support. A pullback to $1270 would also increase symmetry in the big weekly chart inverse H&S bottom pattern.
I’m a buyer at both price points, if gold trades there. I never recommend cheering for lower prices, because governments generally hate gold. If the price moves lower, governments can gloat over the supposed superiority of their fiat money, so I never cheer for lower prices.
Gold doesn’t need any “healthy corrections” against government fiat money. As money, gold is always healthy, but price declines do happen, and investors need to take buy-side action at support zones like $1300 and $1270.
The Chinese central bank stopped buying gold once the IMF accepted their fiat yuan into their global fiat currency basket. I expect the same thing to happen in Russia in time. The bottom line is that governments do not like private money, and gold is the ultimate private money.
Gold competes with what are generally pathetic government fiat systems, but as long as governments can prevent gold from becoming a major medium of exchange, investors will always buy gold as an investment to make fiat dollars rather than buying fiat as an investment strategy to get more ounces of gold money.
What could resurrect gold as a medium of exchange globally? For the likely answer, please click here now. Double-click to enlarge this fabulous Ethereum chart. Blockchain (aka crypto) currencies have attained a market capitalization of about $700 billion (USD), and Ethereum is one of the hottest kids on the block!
It’s also one of my top four core blockchain holdings. I’m an eager seller of trading positions this morning in the $1200 zone. Nothing feels better than starting a new day by booking juicy profits. I’ve already placed new orders to buy fresh trading positions in the $1150, $1100, $1050, and $1000 price zones, and I urge all Ethereum fans to consider taking similar action.
My www.gublockchain.com newsletter is designed to put investors in the hottest blockchain currencies and make them richer by taking action at my key buy and sell points.
In the big picture, blockchain infrastructure experts are working to create powerful partnerships between gold and blockchain currency. On that note, please click here now. Goldguard’s fabulous “One Gram” gold backed blockchain token appears to represent just the beginning of an era that will see significant gold-blockchain business partnerships created around the world.
The very nature of bloated government fiat money limits investment returns in those traditional currency markets. In contrast, blockchain’s superior technology and limited supply is making returns that frequently exceed 10% a month the “new investor normal”.
Gold-blockchain partnerships could weaken the power of central banks, and perhaps ultimately make them obsolete. I’ve predicted that central banks don’t become obsolete, but they will be forced to buy private money like Bitcoin, Ethereum, Ripple, and Litecoin. They will start to hold them as central bank and treasury reserve assets when one or more of these key blockchain currencies becomes a widely-used medium of exchange.
The coming blockchain-gold partnerships should boost global demand for gold, and that’s good news for gold stock investors. Please click here now. Double-click to enlarge this great looking GDX chart. A possible flag pattern is in play. If it fails, that failure simply creates a beautiful high right shoulder of an inverse H&S bottom pattern.
Gold and silver stock enthusiasts need to respect the power of $1320 resistance. Investors who are nervous should buy GDX put options. I’m not nervous. I’m excited to watch Modi open the spending spigot and to see Jerome Powell unleash the money velocity hounds at thousands of small American banks, with a deregulatory bomb.
Chinese New Year buying appears to have started early in December but it’s in a lull now. Indian dealers are also in no hurry to buy gold after a $90 rally. The COT report shows commercial traders adding 40,000 short gold contracts, which likely means they respect the $1320 resistance zone. So, gold stock traders can book light profits now. Rebuy lightly if gold trades at $1300. At $1270, all investors should be eager buyers!
Special Offer For Website Readers: Please send me an Email to freereports4@gracelandupdates.com and I’ll send you my free “Rock My Golden Block!” report. I highlight two key crypto currencies for blockchain beginners, and eight junior gold stocks that are “Must Have” stocks for 2018, with key buy and sell points for each stock!
Stewart Thomson is a retired Merrill Lynch broker. Stewart writes the Graceland Updates daily between 4am-7am. They are sent out around 8am-9am. The newsletter is attractively priced and the format is a unique numbered point form. Giving clarity of each point and saving valuable reading time.
Risks, Disclaimers, Legal
Stewart Thomson is no longer an investment advisor. The information provided by Stewart and Graceland Updates is for general information purposes only. Before taking any action on any investment, it is imperative that you consult with multiple properly licensed, experienced and qualified investment advisors and get numerous opinions before taking any action. Your minimum risk on any investment in the world is: 100% loss of all your money. You may be taking or preparing to take leveraged positions in investments and not know it, exposing yourself to unlimited risks. This is highly concerning if you are an investor in any derivatives products. There is an approx $700 trillion OTC Derivatives Iceberg with a tiny portion written off officially. The bottom line:
Are You Prepared?
There are very few sellers left
There were very few sellers left in January 2016 when the devastating “forever bear” was about to end. Six months later and a 150% rebound in the large caps and 200% rise in the juniors (GDXJ) provided sellers an opportunity. They drove the miners and juniors down by 40% to 45% in less than five months. However, both GDX and GDXJ have been able to hold above that low multiple times. GDX has held $21 four times! GDXJ has held $29.50 twice in solid fashion.
The bears had multiple opportunities in 2017 to push the miners lower but the miners held above their December 2016 lows and maintained the 62% retracement of the 2016 surge. The miners did not break out in 2017 but they held key support multiple times and the latest rebound suggests selling power has dried up.
The recovery pattern following a mega-bear market bodes well for gold stocks in the second half of 2018
In November we wrote about this history and the potential implication for gold stocks in 2018 and beyond. The mega bear markets that compare to gold stocks from 2011-2016 with respect to price (+80% decline) and time (+2 years) follow a distinct pattern. The initial rebound is sizeable in price but not so much in time. That gives way to a correction and consolidation that lasts a minimum of 18 months. Then the market surges higher in third-wave like fashion.
The gold stocks are nearly 17 months through their consolidation. We do not know if the consolidation is ending soon or if it will last another three, six or even nine months. We do know that history argues the correction and consolidation should end sometime in 2018.
Gold is not too far away from breaking out
Gold is much closer to breaking its 2016 high than the miners but the miners could begin to sniff that potential breakout in Gold before or as it happens. Gold recently bottomed around $1240 with sentiment indicators at encouraging levels. In the chart below we plot Gold along with its net speculative position as a percentage of open interest (CoT) and the GLD put-call ratio. The CoT recently touched 27% which, although not a bearish extreme is fairly low relative to most readings since February 2016. The GLD put-call ratio recently touched the highest level in more than two years. With current sentiment relatively muted, Gold has a chance to rally up to trendline resistance. That would put it in position to breakout sometime in 2018.
Gold Stocks are one of the few sectors that offer compelling value
As we discussed last week, the gold stocks continue to offer historic value. The value is not quite as historic as in January 2016 when it was absolutely historic but it remains exceptional. Outside of the commodity sector there is nothing in a value sense that compares with the gold stocks. Even within the commodity sector, there is little that compares to gold stocks. Heading into 2018 traders and investors have to be intrigued at the deep value opportunity in the gold stocks in nominal and especially relative terms.
Increasing inflation expectations
Commodities typically outperform at the end of an expansion and into the beginning of a recession. This is accompanied by rising inflation. Some commodity sectors have performed well but the commodities as a whole (CRB or CCI) has yet to make new highs. One thing that could trigger a sharp rise in inflation expectations would be a breakdown in long-term bond prices.
In the chart below we plot the 5-year bond price, the 10-year bond price and the 30-year bond price. The 5-year bond has already broken to a 7-year low while the 10-year bond is not far behind. The 30-year bond continues to hold above its 2015-2016 lows but does not have much wiggle room. A breakdown in the 10-year and 30-year bonds may not be immediately bullish for precious metals but a continued decline or acceleration to the downside would be.
The strength of the current rebound in the gold stocks has definitely surpassed our expectations and the December lows should hold moving forward. If that is the case then a breakout move for the gold stocks this year is more likely than not. More backing and filling may be ahead but if GDX and GDXJ can surpass their September highs it would be a very good sign for 2018. The miners have plenty of work to do before a true breakout move can begin but traders and investors would be wise to keep a close eye on the sector. We prefer companies with strong fundamentals that are trading at reasonable values and have upcoming catalysts that will drive buying. To follow our guidance and learn our favorite juniors for 2018, consider learning more about our premium service.
The junior gold miners’ stocks have spent months grinding sideways near lows, sapping confidence and breeding widespread bearishness. The entire precious-metals sector has been left for dead, eclipsed by the dazzling Trumphoria stock-market rally. But traders need to keep their eyes on the fundamental ball so herd sentiment doesn’t mislead them. The juniors recently reported Q3 earnings, and enjoyed strong results.
Four times a year publicly-traded companies release treasure troves of valuable information in the form of quarterly reports. Companies trading in the States are required to file 10-Qs with the US Securities and Exchange Commission by 45 calendar days after quarter-ends. Canadian companies have similar requirements. In other countries with half-year reporting, many companies still partially report quarterly.
The definitive list of elite junior gold stocks to analyze used to come from the world’s most-popular junior-gold-stock investment vehicle. This week the GDXJ VanEck Vectors Junior Gold Miners ETF reported $4.4b in net assets. Among all gold-stock ETFs, that was only second to GDX’s $8.1b. That is GDXJ’s big-brother ETF that includes larger major gold miners. GDXJ’s popularity testifies to the great allure of juniors.
Unfortunately this fame has recently created major problems severely hobbling the usefulness of GDXJ. This sector ETF has shifted from being beneficial for junior gold miners to outright harming them. GDXJ is literally advertised as a “Junior Gold Miners ETF”. Investors only buy GDXJ shares because they think this ETF gives them direct exposure to junior gold miners’ stocks. But unfortunately that’s no longer true!
GDXJ is quite literally the victim of its own success. This ETF grew so large in the first half of 2016 as gold stocks soared in a massive upleg that it risked running afoul of Canadian securities law. Most of the world’s junior gold miners and explorers trade in Canada. In that country once any investor including an ETF goes over 20% ownership in any stock, it is deemed a takeover offer that must be extended to all shareholders!
Understanding what happened in GDXJ is exceedingly important for junior-gold-stock investors, and I explained it in depth in my past essay on juniors’ Q1’17 results. GDXJ’s managers were forced to reduce their stakes in leading Canadian juniors. So capital that GDXJ investors intended to deploy in junior gold miners was instead diverted into much-larger gold miners. GDXJ’s effective mission stealthily changed.
Not many are more deeply immersed in the gold-stock sector than me, as I’ve spent decades studying, trading, and writing about this contrarian realm. These huge GDXJ changes weren’t advertised, and it took even me months to put the pieces together to understand what was happening. GDXJ’s managers may have had little choice, but their major direction change has been devastating to true junior gold miners.
Investors naturally pour capital into GDXJ, the “Junior Gold Miners ETF”, expecting to own junior gold miners. But instead of buying junior gold miners’ shares and bidding up their prices, GDXJ is instead shunting those critical inflows to the much-larger mid-tier and even major gold miners. That left the junior gold miners starved of capital, as their share prices they rely heavily upon for financing languished in neglect.
GDXJ’s managers should’ve lobbied Canadian regulators and lawmakers to exempt ETFs from that 20% takeover rule. Hundreds of thousands of investors buying an ETF obviously have no intention of taking over gold-mining companies! And higher junior-gold-stock prices boost the Canadian economy, helping these miners create valuable high-paying jobs. But GDXJ’s managers instead skated perilously close to fraud.
This year they rejiggered their own index underlying GDXJ, greatly demoting most of the junior gold miners! Investors buying GDXJ today are getting very-low junior-gold-miner exposure, which makes the name of this ETF a deliberate deception. I’ve championed GDXJ for years, it is a great idea. But in its current sorry state, I wouldn’t touch it with a ten-foot pole. It is no longer anything close to a junior-gold-miners ETF.
There’s no formal definition of a junior gold miner, which gives cover to GDXJ’s managers pushing the limits. Major gold miners are generally those that produce over 1m ounces of gold annually. For years juniors were considered to be sub-200k-ounce producers. So 300k ounces per year is a very-generous threshold. Anything between 300k to 1m ounces annually is in the mid-tier realm, where GDXJ now traffics.
That high 300k-ounce-per-year junior cutoff translates into 75k ounces per quarter. Following the end of the gold miners’ Q3 earnings season in mid-November, I dug into the top 34 GDXJ components. That’s just an arbitrary number that fits neatly into the tables below. While GDXJ included a staggering 73 component stocks in mid-November, the top 34 accounted for a commanding 81.1% of its total weighting.
Out of these top 34 GDXJ companies, only 5 primary gold miners met that sub-75k-ounces-per-quarter qualification to be a junior gold miner! Their quarterly production is highlighted in blue below, and they collectively accounted for just 7.1% of GDXJ’s total weighting. But even that isn’t righteous, as these include a 126-year-old silver miner and a mid-tier gold miner suffering temporary production declines.
GDXJ is inarguably now a pure mid-tier gold-miner ETF. That’s great if GDXJ is advertised as such, but terrible if capital investors explicitly intend for junior gold miners is instead being diverted into mid-tiers without their knowledge or consent. The vast majority of GDXJ shareholders have no idea how radically this ETF has changed since early 2016. It is all but unrecognizable, straying greatly from its original mission.
I’ve been doing these deep quarterly dives into GDXJ’s top components for years now. In Q3’17, fully 32 of the top 34 GDXJ components were also GDX components! These ETFs are separate, a “Gold Miners ETF” and a “Junior Gold Miners ETF”. So why on earth should they own many of the same companies? In the tables below I highlighted the rare GDXJ components not also in GDX in yellow in the weightings column.
These 32 GDX components accounted for 78.7% of GDXJ’s total weighting, not just its top 34. They also represented 31.4% of GDX’s total weighting. So almost 4/5ths of the junior gold miners’ ETF is made up of nearly a third of the major gold miners’ ETF! I’ve talked with many GDXJ investors over the years, and have never heard one wish their capital allocated specifically to junior golds would instead go to much-larger miners.
Fully 10 of GDXJ’s top 17 components weren’t even in this ETF a year ago in Q3’16. They alone now account for 34.5% of its total weighting. 16 of the top 34 are new, or 44.4% of the total. In the tables below, I highlighted the symbols of companies that weren’t in GDXJ a year ago in light blue. Today’s GDXJ is a radical departure from last year. Analyzing Q3’17 results largely devoid of real juniors is frustrating.
Nevertheless, GDXJ remains the leading “junior-gold” benchmark. So every quarter I wade through tons of data from its top components’ 10-Qs, and dump it into a big spreadsheet for analysis. The highlights made it into these tables. A blank field means a company didn’t report that data for Q3’17 as of that mid-November 10-Q deadline. Companies have wide variations in reporting styles, data presented, and report timing.
In these tables the first couple columns show each GDXJ component’s symbol and weighting within this ETF as of mid-November. While most of these gold stocks trade in the States, not all of them do. So if you can’t find one of these symbols, it’s a listing from a company’s primary foreign stock exchange. That’s followed by each company’s Q3’17 gold production in ounces, which is mostly reported in pure-gold terms.
Many gold miners also produce byproduct metals like silver and copper. These are valuable, as they are sold to offset some of the considerable costs of gold mining. Some companies report their quarterly gold production including silver, a construct called gold-equivalent ounces. I only included GEOs if no pure-gold numbers were reported. That’s followed by production’s absolute year-over-year change from Q3’16.
Next comes the most-important fundamental data for gold miners, cash costs and all-in sustaining costs per ounce mined. The latter determines their profitability and hence ultimately stock prices. Those are also followed by YoY changes. Finally the YoY changes in cash flows generated from operations, GAAP profits, revenues, and cash on balance sheets are listed. There’s one key exception to these YoY changes.
Percentage changes aren’t relevant or meaningful if data shifted from negative to positive or vice versa. Plenty of GDXJ gold miners that earned profits in Q3’16 suffered net losses in Q3’17. So in cases where data crossed that zero line, I included the raw numbers instead. This whole dataset offers a fantastic high-level fundamental read on how the mid-tier gold miners are faring today, and they’re actually doing quite well.
After spending days digesting these GDXJ gold miners’ latest quarterly reports, it’s fully apparent their vexing consolidation this year isn’t fundamentally righteous at all! Traders have abandoned this sector since the election because the allure of the levitating general stock markets has eclipsed gold. That has left gold stocks exceedingly undervalued, truly the best fundamental bargains out there in all the stock markets!
Once again the light-blue-highlighted symbols are new GDXJ components that weren’t included a year ago in Q3’16. And the meager yellow-highlighted weightings are the only stocks that were not also GDX components in mid-November! GDXJ is increasingly a GDX clone that offers little if any real exposure to true gold juniors’ epic upside potential during gold bulls. GDXJ has become a shadow of its former self.
VanEck owns and manages GDX, GDXJ, and the MVIS indexing company that decides exactly which gold stocks are included in each. With one company in total control, GDX and GDXJ should have zero overlap in underlying companies! GDX or GDXJ inclusion should be mutually-exclusive based on the size of individual miners. That would make both GDX and GDXJ much more targeted and useful for investors.
Two of GDXJ’s heaviest-weighted component choices are mystifying. Sibanye Gold and Gold Fields are major South African gold miners, way bigger than mid-tier status and about as far from junior-dom as you can get. In Q3’17 they both mined way in excess of that 250k-ounce quarterly threshold that is definitely major status. They are among the world’s largest gold miners, so it’s ludicrous to have them in a juniors ETF.
Since gold miners are in the business of wresting gold from the bowels of the Earth, production is the best place to start. These top 34 GDXJ gold miners collectively produced 4352k ounces in Q3’17. That rocketed 121% higher YoY, but that comparison is meaningless given the radical changes in this ETF’s composition since Q3’16. On the bright side, GDXJ’s miners do still remain significantly smaller than GDX’s.
GDX’s top 34 components, fully 20 of which are also top-34 GDXJ components, collectively produced 9947k ounces of gold in Q3. So GDXJ components’ average quarterly gold production of 136k ounces excluding explorers was 55% lower than GDX components’ 301k average. In spite of GDXJ’s very-misleading “Junior” name, it definitely has smaller gold miners even if they’re well above that 75k junior threshold.
Despite GDXJ’s top 34 components looking way different from a year ago, these current gold miners are faring well on the crucial production front. Fully 22 of these mid-tier gold miners enjoyed big average YoY production growth of 18%! Overall average growth excluding explorers was 8.2% YoY, which is far better than world mine production which slumped 1.3% lower YoY in Q3’17 according to the World Gold Council.
These elite GDXJ mid-tier gold miners are really thriving, with production growth way outpacing their industry. That will richly reward investors as sentiment normalizes. Smaller mid-tier gold miners able to grow production are the sweet spot for stock-price upside potential. With market capitalizations much lower than major gold miners, investment capital inflows are relatively larger which bids up stock prices faster.
With today’s set of top-34 GDXJ gold miners achieving such impressive production growth, their costs per ounce should’ve declined proportionally. Higher production yields more gold to spread mining’s big fixed costs across. And lower per-ounce costs naturally lead to higher profits. So production growth is highly sought after by gold-stock investors, with companies able to achieve it commanding premium prices.
There are two major ways to measure gold-mining costs, classic cash costs per ounce and the superior all-in sustaining costs per ounce. Both are useful metrics. Cash costs are the acid test of gold-miner survivability in lower-gold-price environments, revealing the worst-case gold levels necessary to keep the mines running. All-in sustaining costs show where gold needs to trade to maintain current mining tempos indefinitely.
Cash costs naturally encompass all cash expenses necessary to produce each ounce of gold, including all direct production costs, mine-level administration, smelting, refining, transport, regulatory, royalty, and tax expenses. In Q3’17, these top-34 GDXJ-component gold miners that reported cash costs averaged just $612 per ounce. That indeed plunged a major 6.9% YoY from Q3’16, and even 2.5% QoQ from Q2’17.
This was really quite impressive, as the mid-tier gold miners’ cash costs were only a little higher than the GDX majors’ $591. That’s despite the mid-tiers each operating fewer gold mines and thus having fewer opportunities to realize cost efficiencies. Traders must recognize these mid-sized gold miners are in zero fundamental peril as long as prevailing gold prices remain well above cash costs. And $612 gold ain’t happening!
Way more important than cash costs are the far-superior all-in sustaining costs. They were introduced by the World Gold Council in June 2013 to give investors a much-better understanding of what it really costs to maintain a gold mine as an ongoing concern. AISC include all direct cash costs, but then add on everything else that is necessary to maintain and replenish operations at current gold-production levels.
These additional expenses include exploration for new gold to mine to replace depleting deposits, mine-development and construction expenses, remediation, and mine reclamation. They also include the corporate-level administration expenses necessary to oversee gold mines. All-in sustaining costs are the most-important gold-mining cost metric by far for investors, revealing gold miners’ true operating profitability.
In Q3’17, these top 34 GDXJ components reporting AISC averaged just $877 per ounce. That’s down a sharp 3.7% YoY and 0.2% QoQ. That also compares very favorably with the GDX majors, which saw nearly-identical average AISC at $868 in Q3. The mid-tier gold miners’ low costs prove they are faring far better fundamentally today than traders think based on this year’s vexing sideways-grinding stock-price action.
All-in sustaining costs are effectively this industry’s breakeven level. As long as gold stays above $877 per ounce, it remains profitable to mine. At Q3’s average gold price of $1279, these top GDXJ gold miners were earning big average profits of $402 per ounce last quarter! That equates to hefty profit margins of 31%, levels most industries would kill for. The mid-tier gold miners aren’t getting credit for that today.
Unfortunately given its largely-junior-less composition, GDXJ remains the leading benchmark for junior gold miners. In Q3’17, GDXJ averaged $33.81 per share. That was down a serious 28.6% from Q3’16’s average of $47.38. Investors have largely abandoned gold miners because they are captivated by the extreme Trumphoria stock-market rally since the election. Yet gold-mining profits certainly didn’t justify this.
A year ago in Q3’16, the top 34 GDXJ components at that time reported average all-in sustaining costs of $911 per ounce. With gold averaging $1334 then which was 4.4% higher, that implies the mid-tier gold miners were running operating profits of $423 per ounce. Thus Q3’17’s $402 merely slumped 5.0% YoY, which definitely isn’t worthy of hammering mid-tier gold miners’ stock prices over a quarter lower over the past year.
Gold miners offer such compelling investment opportunities because of their inherent profits leverage to gold. Gold-mining costs are largely fixed during mine-planning stages, when engineers and geologists decide which ore to mine, how to dig to it, and how to process it. The actual mining generally requires the same levels of infrastructure, equipment, and employees quarter after quarter regardless of gold prices.
With gold-mining costs essentially fixed, higher or lower gold prices flow directly through to the bottom line in amplified fashion. That wasn’t really apparent in GDXJ over this past year since its composition changed so radically. Normally a 4.2% drop in average gold prices would lead to much more than a 5.0% YoY operating-profit decline. Gold-stock profits generally leverage gold price moves by several times.
Gold itself is overdue for a major new upleg driven by investment demand returning. As I discussed several weeks ago, investment demand has stalled thanks to the extreme stock-market euphoria. These bubble-valued stock markets are due to roll over imminently as the Fed and European Central Bank both start aggressively choking off liquidity. That will strangle this stock bull, reigniting big gold investment demand.
The impact of higher gold prices on mid-tier-gold-miner profitability is easy to model. Assuming flat all-in sustaining costs at Q3’17’s $877 per ounce, 10%, 20%, and 30% gold rallies from this week’s levels will lead to collective gold-mining profits surging 36%, 68%, and 100%! And another 30% gold upleg isn’t a stretch at all. In essentially the first half of 2016 alone after the last stock-market correction, gold surged 29.9%.
The major gold stocks as measured by the HUI, which closely mirrors GDX, skyrocketed 182.2% higher in roughly that same span! Gold-mining profits and thus gold-stock prices soar when gold is powering higher. So if you believe gold is heading higher in coming quarters as these crazy stock markets falter, the gold stocks are screaming buys today fundamentally. That’s especially true of the best mid-tier gold miners.
Since today’s bastardized GDXJ mostly devoid of juniors changed so radically since last year, the normal year-over-year comparisons in key financial results aren’t comparable. But here they are for reference. These top 34 GDXJ companies’ cashflows generated from operations soared 65% YoY to $1515m. That was driven by sales up 96% YoY to $4130m. That left miners’ collective cash balances $28% higher YoY at $5672m.
Yet top-34-GDXJ-component profits crumbled 38% YoY to $212m. Again don’t read too much into this since it’s an apples-to-oranges comparison. Interestingly a single company that was in GDXJ in both quarters is responsible for over 2/3rds of that drop. Endeavour Mining’s earnings plunged from +$24m a year ago to -$65m in Q3’17, largely due to a $54m impairment charge in its Nzema mine which is being sold.
GDXJ’s component list was much more consistent between Q2’17 and Q3’17. QoQ these top 34 GDXJ gold miners saw operating cash flows rise 3.9%, sales surge 7.5%, cash on hand fall 7.6%, and profits plummet 72%. Again an anomaly in a single company is responsible for nearly 9/10ths of this sequential decline. In Q2 IAMGOLD reported a gigantic $524m non-cash gain on the reversal of an impairment charge!
The massive non-cash gains and losses flushed through net income are one reason why all-in sustaining costs offer a better read on gold-miner health. If GDXJ’s component list and weightings finally stabilize after this past year’s extreme tumult, we’ll have clean comps again next year. For now these mid-tier gold miners are generally doing far better operationally than their neglected super-low stock prices imply.
So overall the mid-tier gold miners’ fundamentals looked quite impressive in Q3’17, a stark contrast to the miserable sentiment plaguing this sector. Gold stocks’ vexing consolidation this year wasn’t the result of operational struggles, but purely bearish psychology. That will soon shift as the stock markets roll over and gold surges, making the beaten-down gold stocks a coiled spring today. They are overdue to soar again!
Though this contrarian sector is widely despised now, it was the best-performing in all the stock markets last year despite that sharp post-election selloff in Q4. The HUI blasted 64.0% higher in 2016, trouncing the S&P 500’s mere 9.5% gain! Similar huge 50%+ gold-stock gains are likely again in 2018, as gold mean reverts higher on the coming stock-market selloff. The gold miners’ strong Q3 fundamentals prove this.
Given GDXJ’s serious problems, leading to diverting most of its capital inflows into larger gold miners that definitely aren’t juniors, you won’t find sufficient junior-gold exposure in this troubled ETF. Instead traders should prudently deploy capital in the better individual mid-tier and junior gold miners’ stocks with superior fundamentals. Their upside is vast, and would trounce GDXJ’s even if it was still working as advertised.
At Zeal we’ve literally spent tens of thousands of hours researching individual gold stocks and markets, so we can better decide what to trade and when. As of the end of Q3, this has resulted in 967 stock trades recommended in real-time to our newsletter subscribers since 2001. Fighting the crowd to buy low and sell high is very profitable, as all these trades averaged stellar annualized realized gains of +19.9%!
The key to this success is staying informed and being contrarian. That means buying low when others are scared, like late in this year’s vexing consolidation. An easy way to keep abreast is through our acclaimed weekly and monthly newsletters. They draw on my vast experience, knowledge, wisdom, and ongoing research to explain what’s going on in the markets, why, and how to trade them with specific stocks. Easy to read and affordable, they’ll help you learn to think, trade, and thrive like contrarians. Subscribe today, and get deployed in the great gold stocks on our trading books before they surge far higher!
The bottom line is the mid-tier gold miners now dominating GDXJ enjoyed strong fundamentals in their recently-reported Q3 results. While GDXJ’s radical composition changes since last year muddy annual comparisons, today’s components mined lots more gold at lower costs. These gold miners continued to earn hefty operating profits while generating strong cash flows. Sooner or later stock prices must reflect fundamentals.
As gold itself continues mean reverting higher, these mid-tier gold miners will see their profits soar due to their big inherent leverage to gold. GDXJ now offers excellent exposure to mid-tier gold miners, which will see gains well outpacing the majors. All it will take to ignite gold stocks’ overdue mean-reversion rally is gold investment demand returning. The resulting higher gold prices will attract investors back to gold miners.
Gold cleared $1300 early in the week and padded its gains on Friday even amid a bullish weekly reversal in the US Dollar. Gold’s breakout was validated by a strong monthly close on Thursday and then a strong weekly close Friday. As predicted, the miners perked up with the breakout in Gold. GDX and GDXJ gained nearly 6% and 7% respectively for the week. Look for the miners to continue to trend higher as Gold attempts to retest its 2016 highs around $1375/oz.
The miners (GDX and GDXJ) have more immediate upside potential. The daily line charts show two levels of resistance. The first level is around $26 for GDX and $38 for GDXJ while the second level is $28 for GDX and $40-$41 for GDXJ.
While Gold closed well above $1300 at $1330/oz, it faces resistance at the 2016 highs around $1375/oz. The net speculative position has reached 248K contracts or 46% of open interest. As the chart below shows, the 2016, 2012 and 2011 peaks in Gold all coincided with a net speculative position of 55% of open interest. If current trends continue, the net speculative position could reach 55% as Gold tests $1375/oz.
Circling back to the stocks, we see that our mini-GDXJ index, which consists of 26 stocks and has a median market cap of ~$100 Million closed the week at a +6 month high. The exploration juniors have led the entire sector this year and we expect that to continue. The price action is healthy as the index is trading above its 50-day, 200-day and 400-day moving averages which are all sloping higher. The index closed at 206 and should reach resistance at 215-220. A correction from there (perhaps in October) could setup a push to the 2016 high.
Welcome to the dog days of summer. The low volatility in precious metals continues. Janet Yellen or some other Fed heads said something Friday. Precious Metals sold off but quickly recovered. It appears that not much has transpired in recent weeks as precious metals have grinded higher, albeit slowly. However, while it may be a fledgling development, the miners appear to be leading Gold now.
In the chart below we plot a number of markets including Gold, GDX, GDXJ, our 55-stock junior index and our optionality index. We marked three points that help inform our analysis.
From point 1 to point 3, the gold stocks went from underperforming Gold to slightly leading Gold. The gold stocks began to underperform in late winter. They peaked in February and did not even come close to reaching those highs in March while Gold made a higher high. Gold retested that high at point 2 in June while miners made another lower high. However, there has been a change from then to point 3. Gold is at the same level at point 3 as point 2 but so are the miners! Furthermore, in recent days (since point 3) the gold stocks have made higher highs while Gold has not.
The most important recent development in precious metals could be the renewed relative strength in the gold stocks. Volatility has been very low and Gold has yet to break $1300/oz but the gold stocks have managed to reverse their previous underperformance. They were lagging badly from late winter through spring. Ratio charts (not shown) show that the underperformance ended in May and the outperformance began only days ago. If that holds up into September and Gold breaks above $1300/oz then the gold stocks could enjoy strong gains over the weeks ahead.
The junior gold miners’ stocks have spent months grinding sideways near lows, sapping confidence and breeding widespread bearishness. The entire precious-metals sector has been left for dead, eclipsed by the dazzling Trumphoria stock-market rally. But traders need to keep their eyes on the fundamental ball so herd sentiment doesn’t mislead them. The juniors recently reported Q2 earnings, and enjoyed strong results.
Four times a year publicly-traded companies release treasure troves of valuable information in the form of quarterly reports. Companies trading in the States are required to file 10-Qs with the US Securities and Exchange Commission by 45 calendar days after quarter-ends. Canadian companies have similar requirements. In other countries with half-year reporting, some companies still partially report quarterly.
The definitive list of elite junior gold stocks to analyze used to come from the world’s most-popular junior-gold-stock investment vehicle. This week the GDXJ VanEck Vectors Junior Gold Miners ETF reported $4.0b in net assets. Among all gold-stock ETFs, that was only second to GDX’s $7.5b. That is GDXJ’s big-brother ETF that includes larger major gold miners. GDXJ’s popularity testifies to the great allure of juniors.
Unfortunately this fame has recently created major problems severely hobbling the usefulness of GDXJ. This sector ETF has shifted from being beneficial for junior gold miners to outright harming them. GDXJ is literally advertised as a “Junior Gold Miners ETF”. Investors only buy GDXJ shares because they think this ETF gives them direct exposure to junior gold miners’ stocks. But unfortunately that’s no longer true!
GDXJ is quite literally the victim of its own success. This ETF grew so large in the first half of 2016 as gold stocks soared in a massive upleg that it risked running afoul of Canadian securities law. Most of the world’s junior gold miners and explorers trade in Canada. In that country once any investor including an ETF goes over 20% ownership in any stock, it is deemed a takeover offer that must be extended to all shareholders!
Understanding what happened in GDXJ is exceedingly important for junior-gold-stock investors, and I explained it in depth in my last essay on juniors’ Q1’17 results. GDXJ’s managers were forced to reduce their stakes in leading Canadian juniors. So last year capital that GDXJ investors intended to deploy in junior gold miners was instead diverted into much-larger gold miners. GDXJ’s effective mission stealthily changed.
Not many are more deeply immersed in the gold-stock sector than me, as I’ve spent decades studying, trading, and writing about this contrarian realm. These huge GDXJ changes weren’t advertised, and it took even me months to put the pieces together to understand what was happening. GDXJ’s managers may have had little choice, but their major direction change has been devastating to the junior gold miners.
Investors naturally poured capital into GDXJ, the “Junior Gold Miners ETF”, expecting to own junior gold miners. But instead of buying junior gold miners’ shares and bidding up their prices, GDXJ was instead shunting those critical inflows to the much-larger mid-tier and even major gold miners. That left the junior gold miners starved of capital, as their share prices they rely heavily upon for financing languished in neglect.
GDXJ’s managers should’ve lobbied Canadian regulators and lawmakers to exempt ETFs from that 20% takeover rule. Hundreds of thousands of investors buying an ETF obviously have no intention of taking over gold-mining companies! And higher junior-gold-stock prices boost the Canadian economy, helping these miners create valuable high-paying jobs. But GDXJ’s managers instead skated perilously close to fraud.
This year they rejiggered their own index underlying GDXJ, greatly demoting most of the junior gold miners! Investors buying GDXJ today are getting very-low junior-gold-miner exposure, which makes the name of this ETF a deliberate deception. I’ve championed GDXJ for years, it is a great idea. But in its current sorry state, I wouldn’t touch it with a ten-foot pole. It is no longer anything close to a junior-gold-miners ETF.
There’s no formal definition of a junior gold miner, which gives cover to GDXJ’s managers pushing the limits. Major gold miners are generally those that produce over 1m ounces of gold annually. For years juniors were considered to be sub-200k-ounce producers. 300k ounces per year is a very generous threshold. Anything between 300k to 1m ounces annually is in the mid-tier realm, where GDXJ now traffics.
That high 300k-ounce-per-year junior cutoff translates into 75k ounces per quarter. Following the end of the gold miners’ Q2 earnings season in mid-August, I dug into the top 34 GDXJ components. That is just an arbitrary number that fits neatly into the tables below. While GDXJ had a whopping 73 component stocks in mid-August, the top 34 accounted for 81.5% of its total weighting. That’s a commanding sample.
Out of these top 34 GDXJ companies, only 4 primary gold miners met that sub-75k-ounces-per-quarter qualification to be a junior gold miner! Their quarterly production is highlighted in blue below, and they collectively accounted for just 7.1% of GDXJ’s total weighting. And that isn’t righteous, as these include a 126-year-old silver miner, a mid-tier miner with temporary production declines, and a ramping mid-tier producer.
GDXJ is inarguably now a pure mid-tier gold-miner ETF. That’s great if GDXJ is advertised as such, but terrible if capital investors explicitly intend for junior gold miners is instead being diverted into mid-tiers without their knowledge or consent. The vast majority of GDXJ shareholders have no idea how radically this ETF has changed since early 2016. It is all but unrecognizable, straying greatly from its original mission.
I’ve been doing these deep quarterly dives into GDXJ’s top components for years now. In Q2’17, fully 29 of the top 34 GDXJ components were also GDX components. These ETFs are separate, a “Gold Miners ETF” and a “Junior Gold Miners ETF”. So why on earth should they own many of the same companies? In the tables below I highlighted GDXJ components also in GDX in yellow in the column showing GDXJ weightings.
These 29 GDX components accounted for 74.6% of GDXJ’s total weighting, not just its top 34. They also represented 30.1% of GDX’s total weighting. So three-quarters of the junior gold miners’ ETF is made up of nearly a third of the major gold miners’ ETF! I’ve talked with many GDXJ investors over the years, and have never heard one wish their capital allocated specifically to junior golds would instead go to much-larger miners.
Fully 12 of GDXJ’s top 17 components weren’t even in this ETF a year ago in Q2’16. They alone now account for 40.6% of its total weighting. 15 of the top 34 are new, or 45.3% of the total. In the tables below, I highlighted the symbols of companies actually in GDXJ a year ago in light blue. Today’s GDXJ is a radical departure from a year ago. Analyzing Q2’17 results largely devoid of real juniors was frustrating.
Nevertheless, GDXJ remains the leading “junior-gold” benchmark. So every quarter I wade through tons of data from its top components’ 10-Qs, and dump it into a big spreadsheet for analysis. The highlights made it into these tables. A blank field means a company didn’t report that data for Q2’17 as of that mid-August 10-Q deadline. Companies have wide variations in reporting styles, data presented, and report timing.
In these tables the first couple columns show each GDXJ component’s symbol and weighting within this ETF as of mid-August. While most of these gold stocks trade in the States, not all of them do. So if you can’t find one of these symbols, it’s a listing from a company’s primary foreign stock exchange. That’s followed by each company’s Q2’17 gold production in ounces, which is mostly reported in pure-gold terms.
Many gold miners also produce byproduct metals like silver and copper. These are valuable, as they are sold to offset some of the considerable costs of gold mining. Some companies report their quarterly gold production including silver, a construct called gold-equivalent ounces. I only included GEOs if no pure-gold numbers were reported. That’s followed by production’s absolute year-over-year change from Q2’16.
Next comes the most-important fundamental data for gold miners, cash costs and all-in sustaining costs per ounce mined. The latter determines their profitability and hence ultimately stock prices. Those are also followed by YoY changes. Finally the YoY changes in cash flows generated from operations, GAAP profits, revenues, and cash on balance sheets are listed. There’s one key exception to these YoY changes.
Percentage changes aren’t relevant or meaningful if data shifted from negative to positive or vice versa. Plenty of major gold miners earning profits in Q2’17 suffered net losses in Q2’16. So in cases where data crossed that zero line, I included the raw numbers instead. This whole dataset offers a fantastic high-level fundamental read on how the mid-tier gold miners are faring today. They’re looking quite impressive.
After spending days digesting these GDXJ gold miners’ latest quarterly reports, it’s fully apparent their vexing consolidation this year isn’t fundamentally righteous at all! Traders have abandoned this sector since the election because the allure of the levitating general stock markets has eclipsed gold. That has left gold stocks exceedingly undervalued, truly the best fundamental bargains out there in all the stock markets!
Once again the light-blue-highlighted symbols are GDXJ components that were there a year ago. The white-backgrounded ones are new additions. And the yellow-highlighted GDXJ weightings are stocks that were also GDX components in mid-August. GDXJ is increasingly a GDX clone that offers little if any real exposure to true gold juniors’ epic upside potential during gold bulls. GDXJ is but a shadow of its former self.
VanEck owns and manages GDX, GDXJ, and the MVIS indexing company that decides exactly which gold stocks are included in each. With one company in total control, GDX and GDXJ should have zero overlap in underlying companies! GDX or GDXJ inclusion should be mutually-exclusive based on the size of individual miners. That would make both GDX and GDXJ much more targeted and useful for investors.
GDXJ’s highest-ranked component choices made by its managers are mystifying. This “Junior Gold Miners ETF” has a major primary silver miner as its largest component. Over half of PAAS’s sales in Q2 came from silver. And the next two biggest are large South African gold miners. That country has one of the most anti-shareholder governments in the world now, forcing unconscionable racial quotas on owners.
Since gold miners are in the business of wresting gold from the bowels of the Earth, production is the best place to start. These top 34 GDXJ gold miners collectively produced 3,583k ounces in Q2’17. That rocketed 74% higher YoY, but that comparison is meaningless given the extreme changes in this ETF’s composition since mid-2016. On the bright side, GDXJ’s miners do remain significantly smaller than GDX’s.
GDX’s top 34 components, fully 20 of which are also top-34 GDXJ components, collectively produced 9854k ounces of gold in Q2. So GDXJ components’ average quarterly gold production of 119k ounces excluding explorers was 61% lower than GDX components’ 308k average. So even if GDXJ’s “Junior” name is very misleading, it definitely has smaller gold miners even if they’re well above that 75k junior threshold.
Despite GDXJ’s top 34 components looking way different from a year ago, these current gold miners are faring well on the crucial production front. Fully 19 of these mid-tier gold miners enjoyed big average YoY production growth of 26%! Overall average growth excluding explorers was 12% YoY, which is nothing to sneeze at given gold’s rough year since mid-2016. These elite GDXJ gold “juniors” are really thriving.
Gold production varies seasonally within calendar years partially due to mining-plan timing. Gold-bearing ore was certainly not created equal, with even individual deposits seeing big internal variations in their metal-to-waste-rock ratios. Miners often have to dig through lower-grade ore to get to the higher-grade zones underneath. This still has economically-valuable amounts of gold, so it is run through the mills.
These mills are essentially giant rock grinders that break ore into smaller pieces, vastly increasing its surface area for chemicals to later leach out the gold. Mill capacity is fixed, with limits on ore tonnage throughput. So when miners are blasting and hauling lower-grade ore, fewer ounces are produced. As they transition into higher-grade zones, the same amount of rock naturally yields more payable ounces.
Regardless of the ore grades being blasted and milled, the overall quarterly costs of mining don’t change much. Operations require the same levels of employees, fuel, maintenance, and electricity no matter how rich the rock being processed. So higher gold production directly leads to lower per-ounce mining costs. The big fixed costs of gold mining are spread across more ounces, making this business more profitable.
There are two major ways to measure gold-mining costs, classic cash costs per ounce and the superior all-in sustaining costs per ounce. Both are useful metrics. Cash costs are the acid test of gold-miner survivability in lower-gold-price environments, revealing the worst-case gold levels necessary to keep the mines running. All-in sustaining costs show where gold needs to trade to maintain current mining tempos indefinitely.
Cash costs naturally encompass all cash expenses necessary to produce each ounce of gold, including all direct production costs, mine-level administration, smelting, refining, transport, regulatory, royalty, and tax expenses. In Q2’17, these top 34 GDXJ-component gold miners that reported cash costs averaged just $628 per ounce. That was indeed down a sizable 1.3% YoY from Q2’16, and 3.0% QoQ from Q1’17.
This was really quite impressive, as the mid-tier gold miners’ cash costs were only a little higher than the GDX majors’ $605. That’s despite the mid-tiers each operating fewer gold mines and thus having fewer opportunities to realize cost efficiencies. Traders must recognize these smaller gold miners are in zero fundamental peril as long as prevailing gold prices remain well above cash costs. And $628 gold ain’t happening!
Way more important than cash costs are the far-superior all-in sustaining costs. They were introduced by the World Gold Council in June 2013 to give investors a much-better understanding of what it really costs to maintain a gold mine as an ongoing concern. AISC include all direct cash costs, but then add on everything else that is necessary to maintain and replenish operations at current gold-production levels.
These additional expenses include exploration for new gold to mine to replace depleting deposits, mine-development and construction expenses, remediation, and mine reclamation. They also include the corporate-level administration expenses necessary to oversee gold mines. All-in sustaining costs are the most-important gold-mining cost metric by far for investors, revealing gold miners’ true operating profitability.
In Q2’17, these top 34 GDXJ components reporting AISC averaged just $879 per ounce. That’s down 0.9% YoY and 4.9% QoQ. That also compares very favorably with the GDX majors, which saw average AISC nearly identical at $867 in Q2. The mid-tier gold miners’ low costs show they are faring far better fundamentally today than everyone thinks based on this year’s largely-disappointing technical stock-price action.
All-in sustaining costs are effectively this industry’s breakeven level. As long as gold stays above $879 per ounce, it remains profitable to mine. At Q2’s average gold price of $1258, these top GDXJ gold miners were earning big average profits of $379 per ounce last quarter! That equates to hefty profit margins of 30%, levels most industries would kill for. The mid-tier gold miners aren’t getting credit for that today.
Unfortunately given its largely-junior-less composition, GDXJ remains the leading benchmark for junior gold miners. In Q2’17, GDXJ averaged $33.30 per share. That was down a sharp 11% from Q1’s average of $37.46. Investors have largely abandoned gold miners because they are captivated by the extreme Trumphoria stock-market rally since the election. Yet gold-mining profits surged in that span.
At Q1’s average gold price of $1220 and Q1’s average top GDXJ components’ AISC of $924, these elite mid-tier miners were earning $296 per ounce on average. That’s already quite healthy. But quarter-on-quarter from Q1 to Q2, these top 34 GDXJ components’ operating profits rocketed 28% higher to $379 per ounce. There’s absolutely no doubt the sharp decline in gold-stock prices in Q2 had nothing to do with fundamentals!
Gold stocks are in the dumps technically because these lofty stock markets keep powering higher. Even though they are in dangerous bubble territory and the Fed is on the verge of starting to suck capital out of the markets via super-bearish quantitative tightening. These record stock markets have really retarded investment demand for gold, which tends to move counter to stock markets. So gold stocks are deeply out of favor.
Gold-stock price levels and psychology are totally dependent on gold, the dominant driver of miners’ profits. Gold stocks enjoy major profits leverage to gold, which gives their stocks big upside potential when gold rallies. Gold-mining costs are essentially fixed during mine-planning stages. Generally the same numbers of employees and equipment are used quarter after quarter regardless of the gold price.
So higher gold prices flow right through to the bottom line, costs don’t rise with them. If gold rallies just another 3.4% from Q2’s average prices to average $1300 in a coming quarter, profits will surge another 11.1% at Q2’s all-in sustaining costs. In a $1400-average-gold quarter, merely 11.3% higher from Q2’s levels, gold-mining profits would soar 37.5% higher. At $1500, those gains surge to 19.3% and 63.9%!
And a 20% gold rally from Q2’s levels is nothing special. Back in roughly the first half of last year after a sharp stock-market correction, gold powered 29.9% higher in just 6.7 months! So if you believe gold is heading higher in coming quarters as these crazy stock markets falter, the gold stocks are screaming buys today fundamentally. Their already-strong profitability will soar, amplifying gold’s mean-reversion upleg.
Since today’s bastardized GDXJ largely devoid of juniors changed so radically since last year, the normal year-over-year comparisons in key financial results aren’t comparable. But here they are for reference. These top-34 GDXJ companies’ cashflows generated from operations soared 57% YoY to $1458m. That was driven by sales up 59% YoY to $3840m. That left their collective cash balances $34% higher YoY at $6140m.
And top-34-GDXJ-component profits skyrocketed 385% YoY to $751m. Again don’t read too much into this since it’s an apples-to-oranges comparison. If GDXJ’s component list and weightings finally stabilize after such extreme tumult, we’ll have clean comps again next year. We can still look at operating cash flows and GAAP profits among this year’s list of top-34 components, which offers some additional insights.
On the OCF front, 10 of these 34 miners reported average YoY gains of 54%, while 13 of them reported average declines of 33%. Together all 23 averaged operating-cash-flows growth of 5%. That isn’t much, but it’s positive. And it’s not bad considering Q2’17’s average gold price was dead flat from Q2’16’s. These mid-tier gold miners are doing far better operationally than their neglected super-low stock prices imply.
On the GAAP-earnings front, the 10 miners that earned profits in both Q2s averaged huge growth of 110% YoY! And out of 14 more miners that saw profits cross zero in the past year, 8 swung from losses to gains. Total annual earnings growth among those zero-crossing swingers exceeded $536m. Make no mistake, these “junior” gold miners are thriving fundamentally even at Q2’s relatively-low $1258 average gold.
So overall the mid-tier gold miners’ fundamentals looked quite impressive in Q2’17, a stark contrast to the miserable sentiment plaguing this sector. Gold stocks’ vexing consolidation this year wasn’t the result of operational struggles, but purely bearish psychology. That will soon shift as stock markets roll over and gold surges, making the beaten-down gold stocks a coiled spring today. They are overdue to soar again!
Though this contrarian sector is despised, it was the best-performing in all the stock markets last year despite a sharp Q4 post-election selloff. The leading HUI gold-stock index blasted 64.0% higher in 2016, trouncing the S&P 500’s 9.5% gain! Similar huge 50%+ gold-stock gains are possible again this year, as gold mean reverts higher as stock markets sell off. The gold miners’ strong Q2 fundamentals prove this.
Given GDXJ’s serious problems, leading to diverting most of its capital inflows into larger gold miners that definitely aren’t juniors, you won’t find sufficient junior-gold exposure in this troubled ETF. Instead traders should prudently deploy capital in the better individual junior gold miners’ stocks with superior fundamentals. Their upside is vast, and would trounce GDXJ’s even if it was still working as advertised.
At Zeal we’ve literally spent tens of thousands of hours researching individual gold stocks and markets, so we can better decide what to trade and when. As of the end of Q2, this has resulted in 951 stock trades recommended in real-time to our newsletter subscribers since 2001. Fighting the crowd to buy low and sell high is very profitable, as all these trades averaged stellar annualized realized gains of +21.2%!
The key to this success is staying informed and being contrarian. That means buying low when others are scared, like late in this year’s vexing consolidation. An easy way to keep abreast is through our acclaimed weekly and monthly newsletters. They draw on our vast experience, knowledge, wisdom, and ongoing research to explain what’s going on in the markets, why, and how to trade them with specific stocks. For only $10 per issue, you can learn to think, trade, and thrive like contrarians. Subscribe today, and get deployed in the great gold stocks on our trading books before they surge far higher!
The bottom line is the mid-tier gold miners that now dominate GDXJ enjoyed strong fundamentals in their recently-reported Q2 results. Despite a flat comp-quarter gold price, they collectively mined more gold at lower costs. That naturally fueled better operating cash flows and profits. Today’s low gold-stock prices and popular bearishness are wildly unjustified fundamentally, an anomaly that doesn’t reflect operations.
As gold itself continues mean reverting higher, these mid-tier gold miners will see their profits soar due to their big inherent leverage to gold. GDXJ now offers excellent exposure to mid-tier gold miners, which will see gains well outpacing the majors. But if you are looking for the extreme upside likely in true junior gold miners, avoid today’s GDXJ and buy individual stocks. GDXJ is no longer a “Junior Gold Miners ETF”!

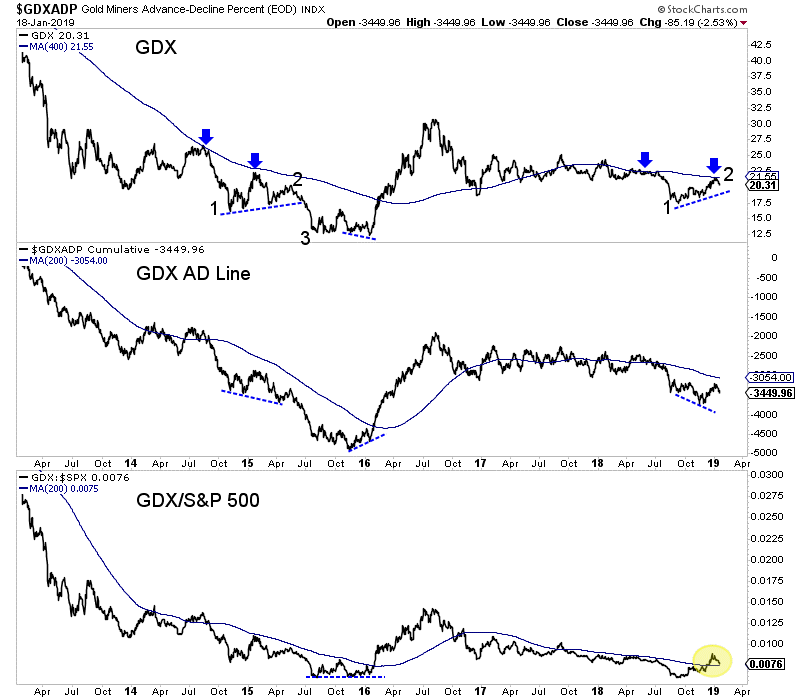
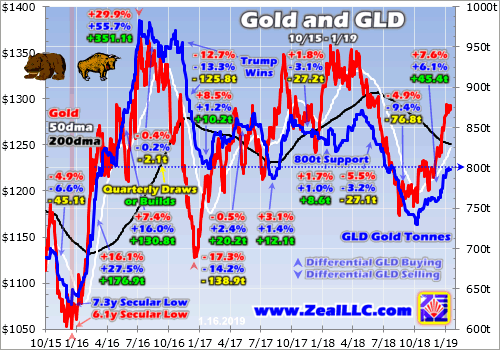
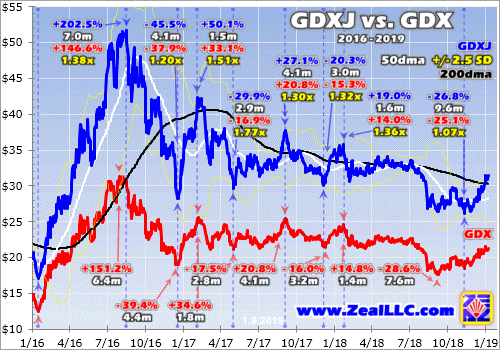
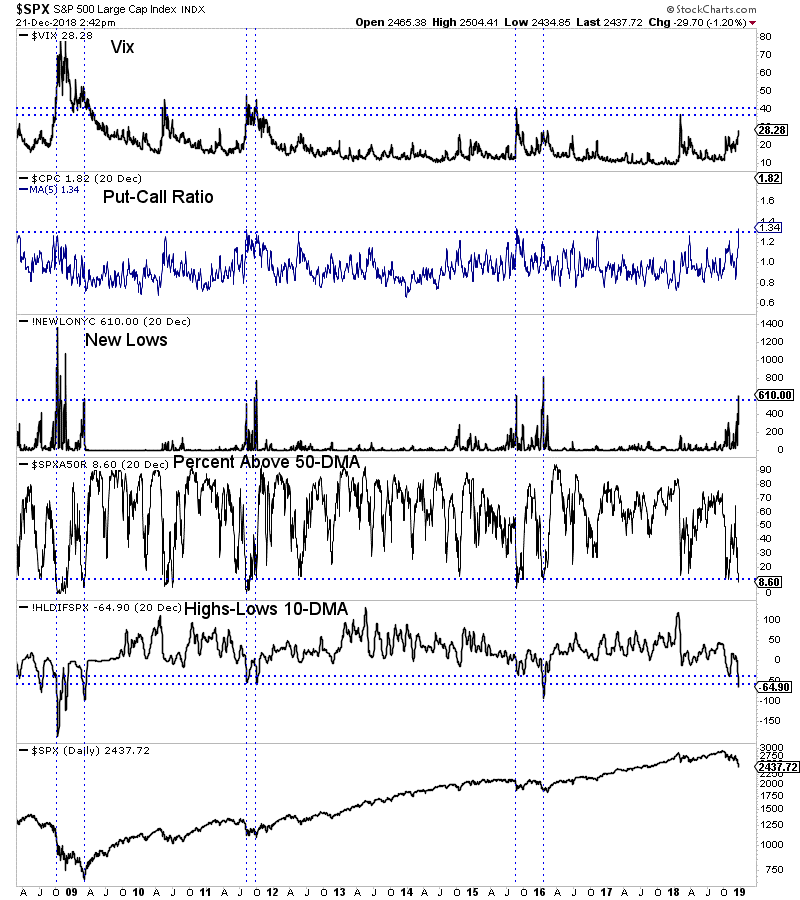
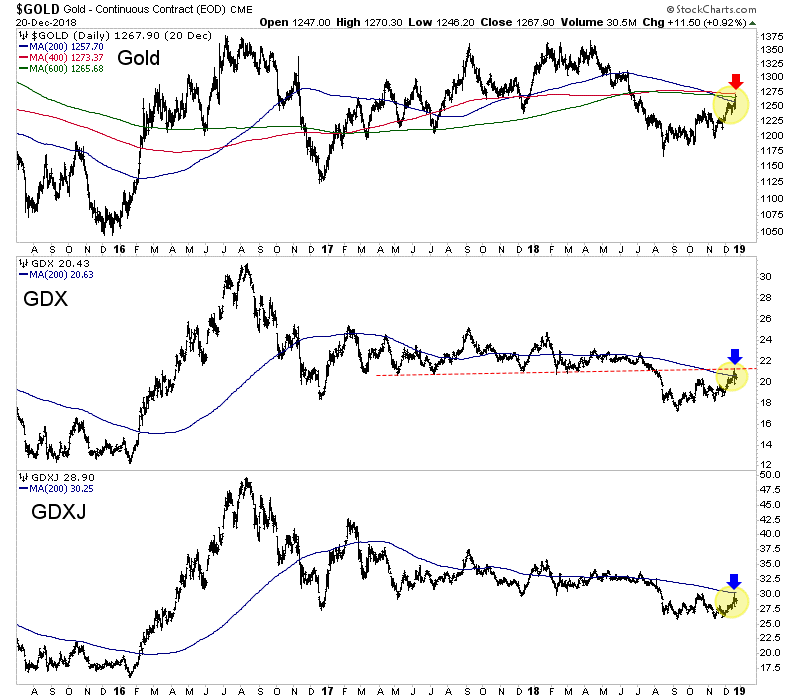
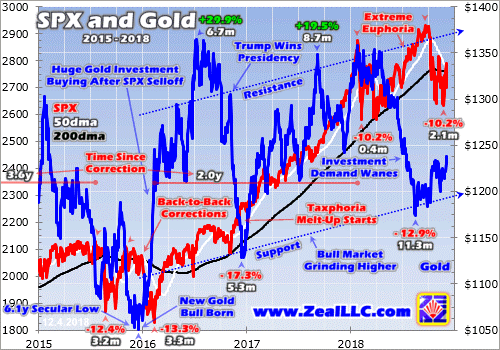
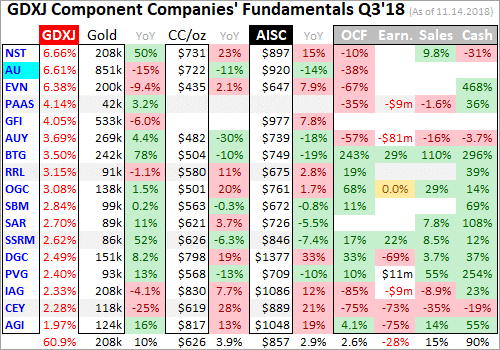
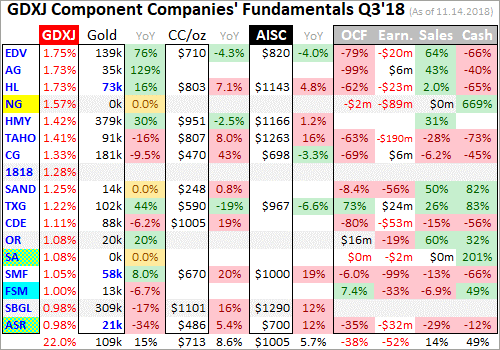
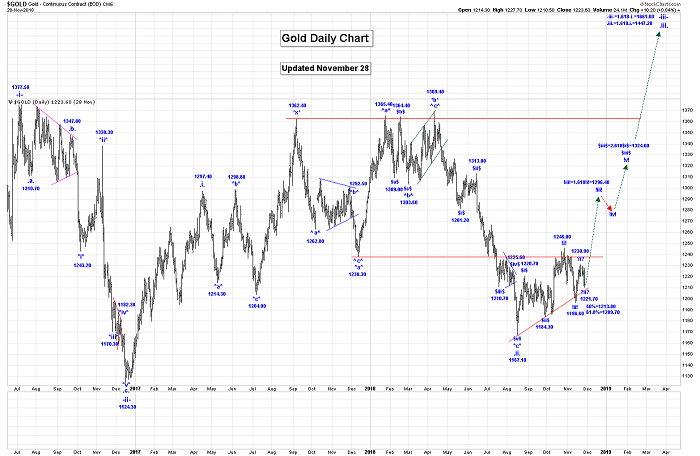
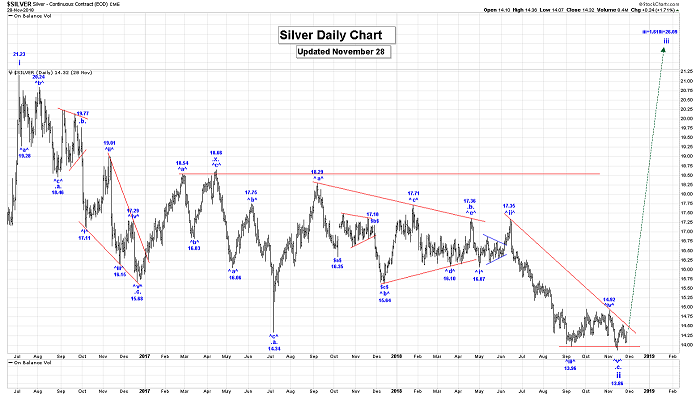
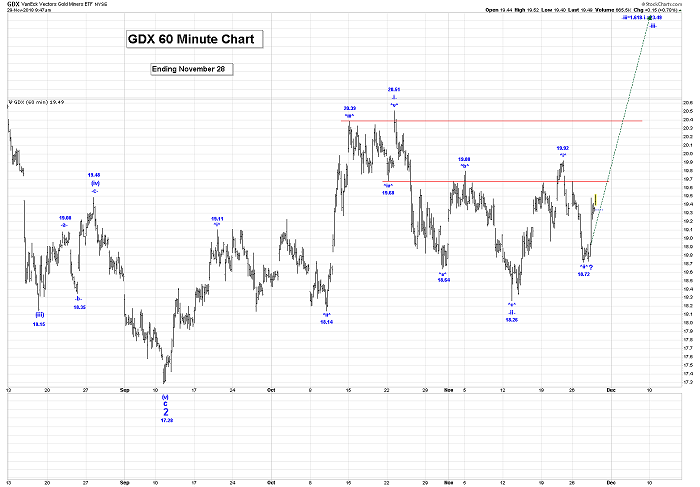
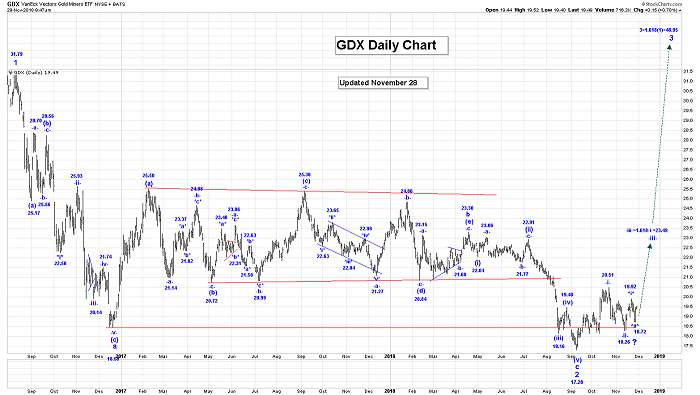
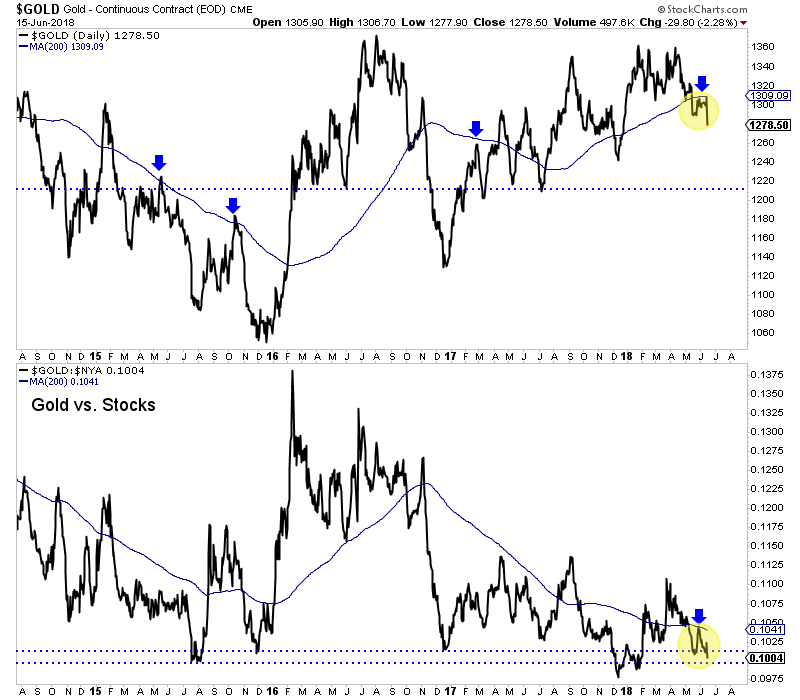
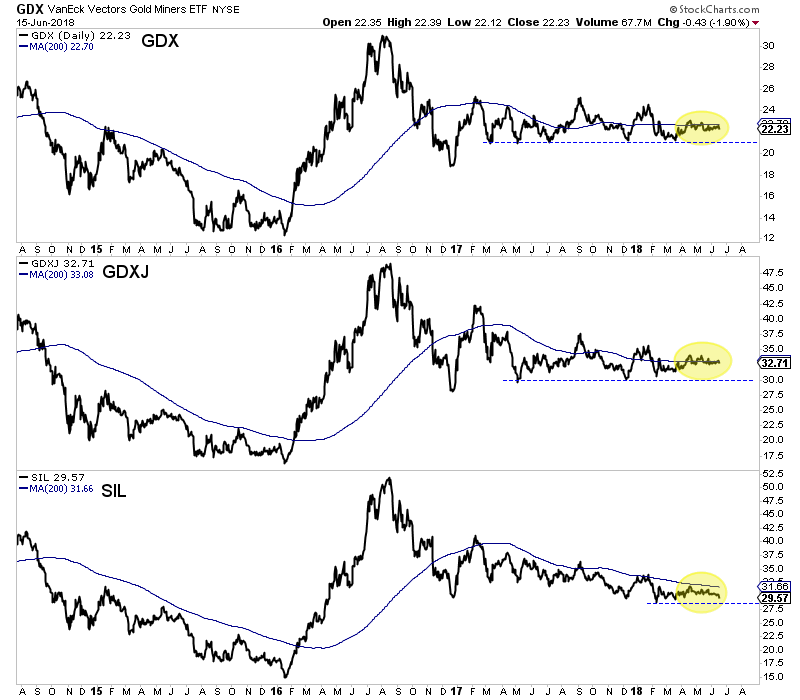

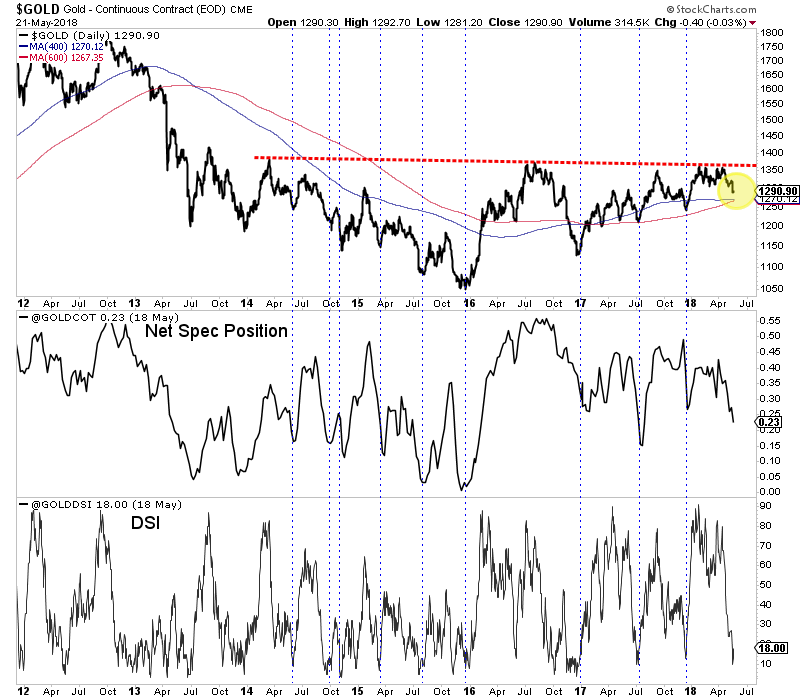
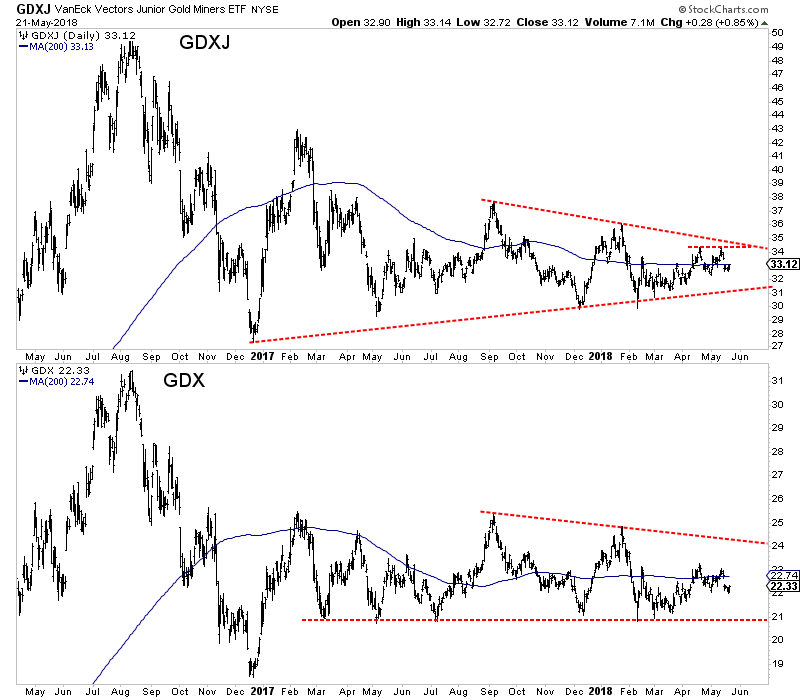

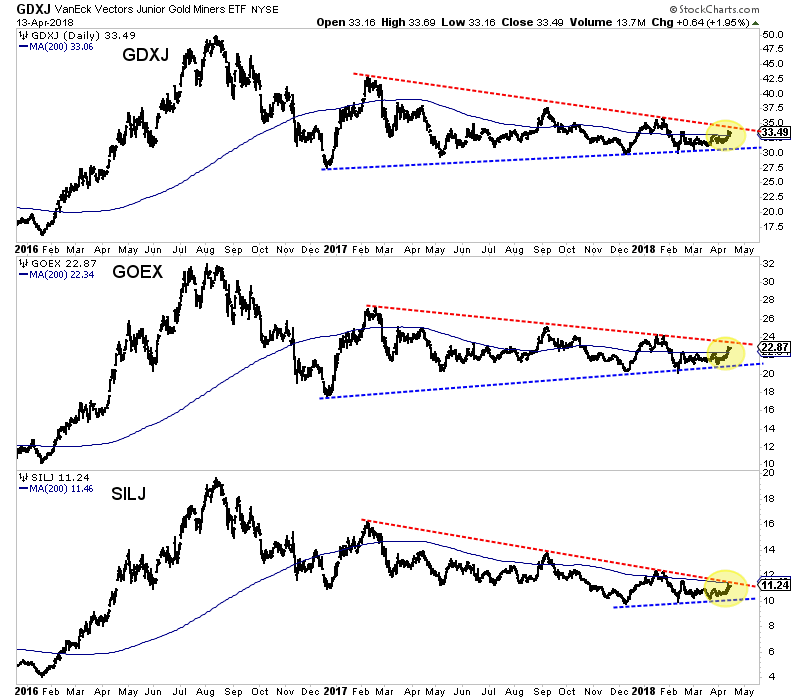
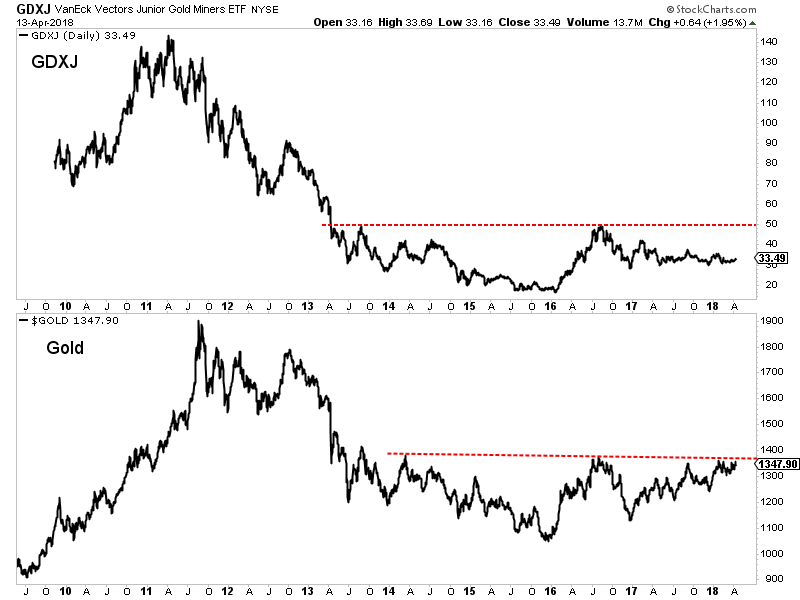
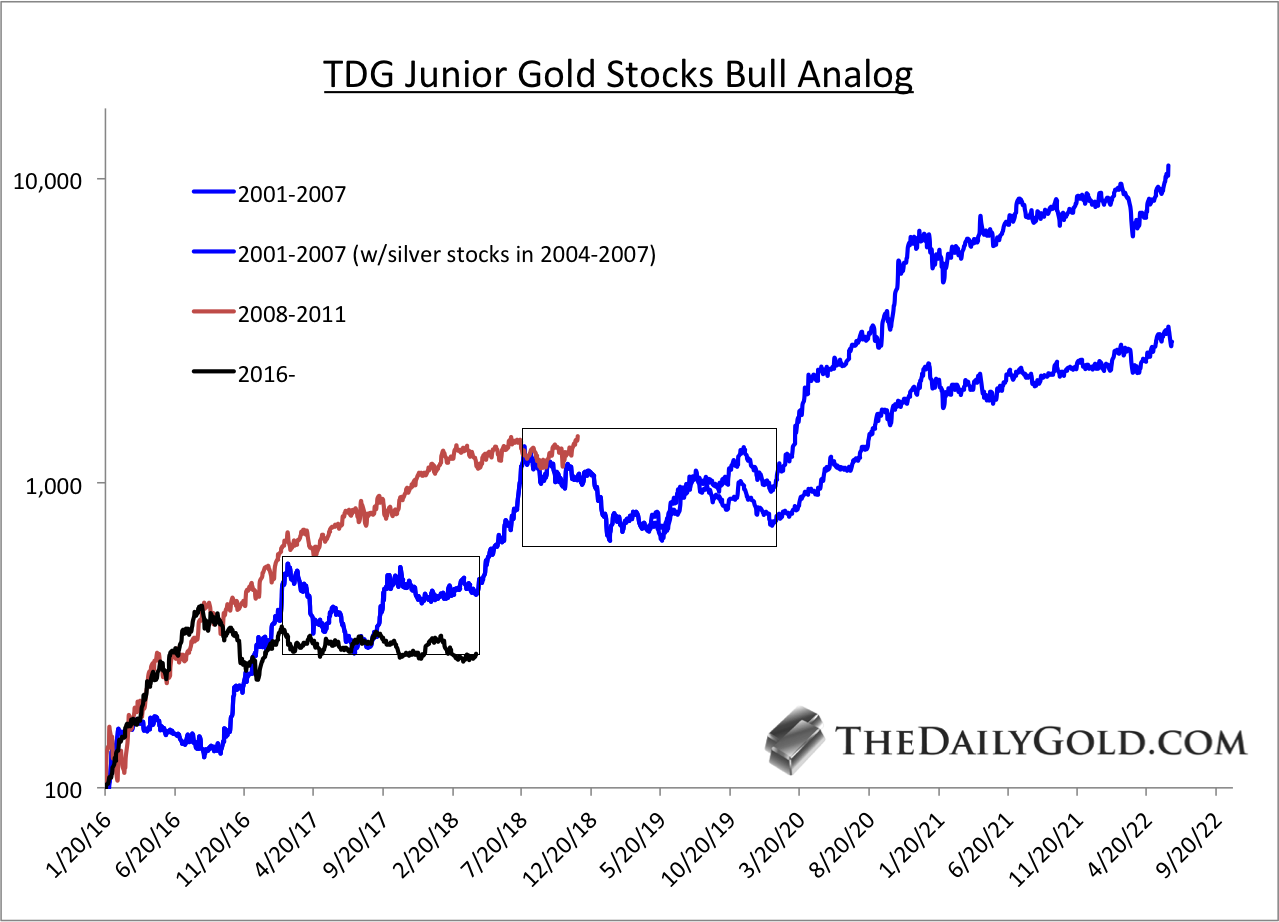

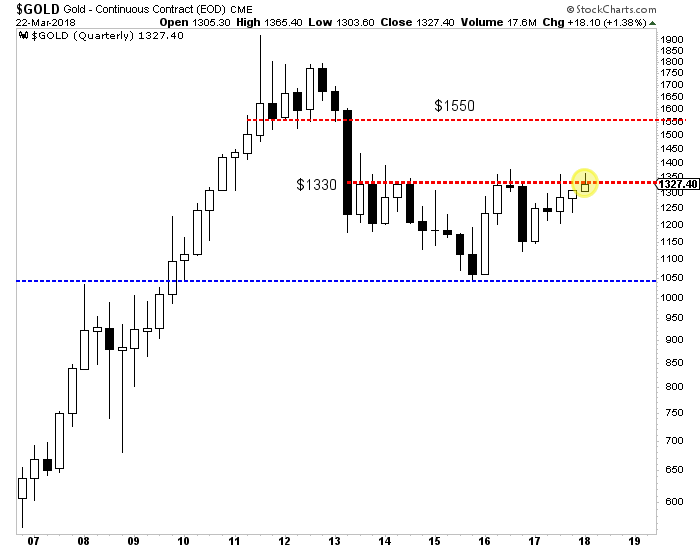


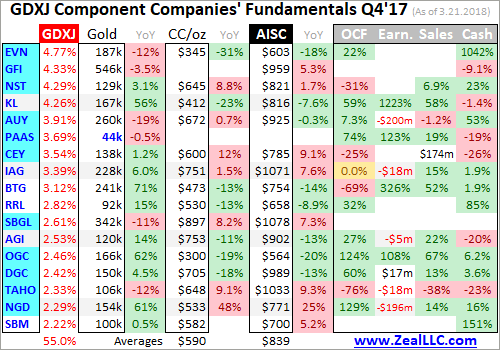
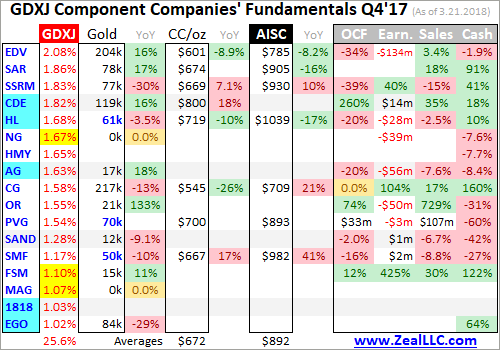

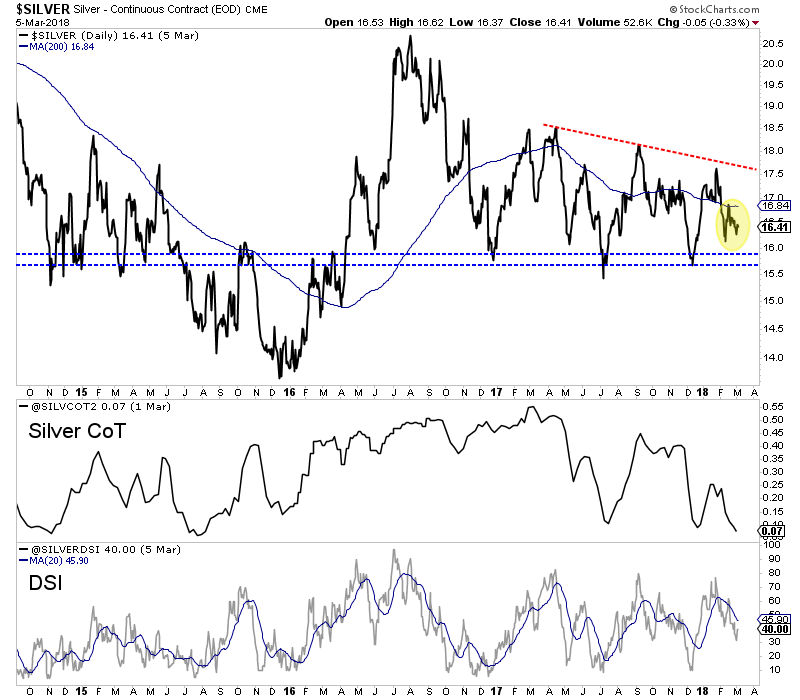

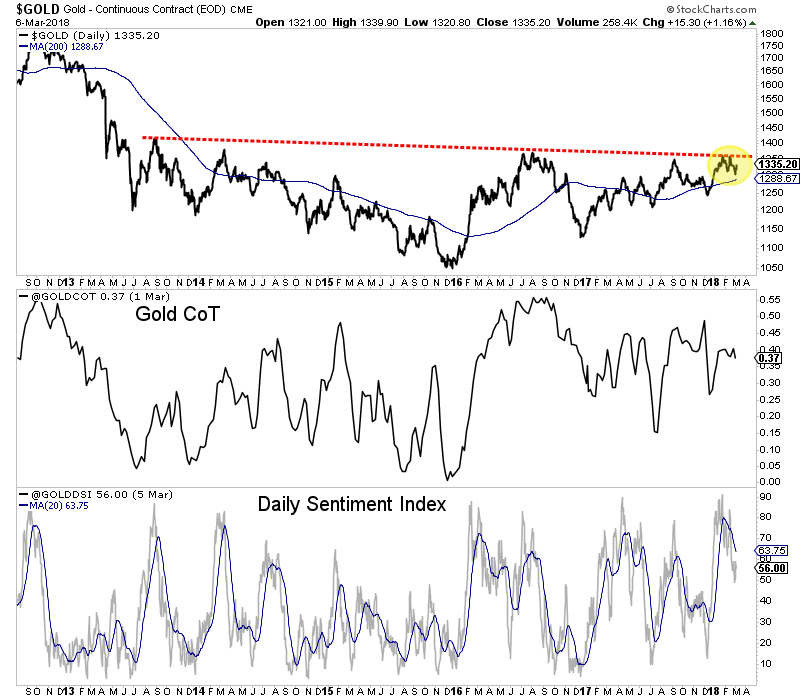

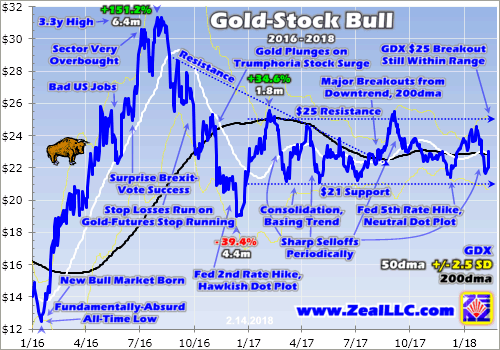
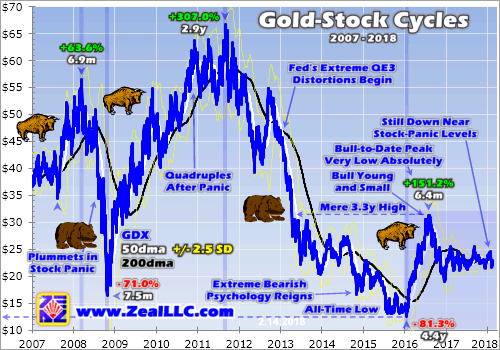
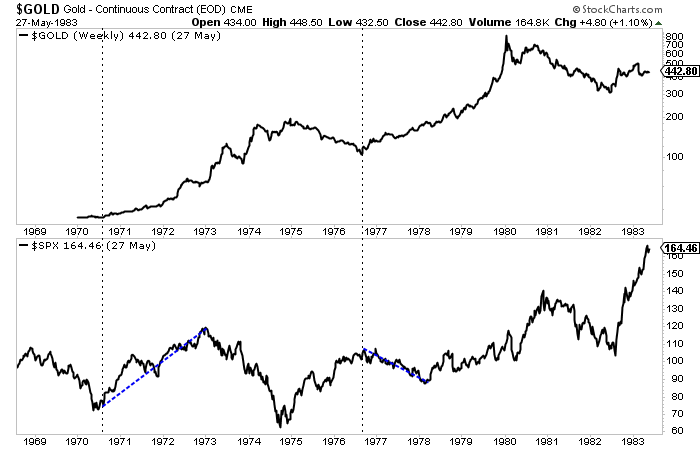
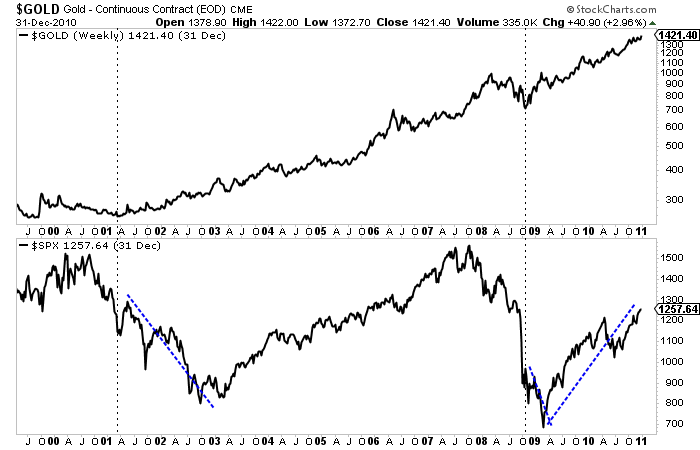

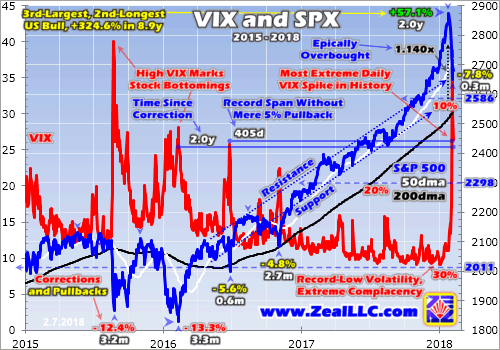
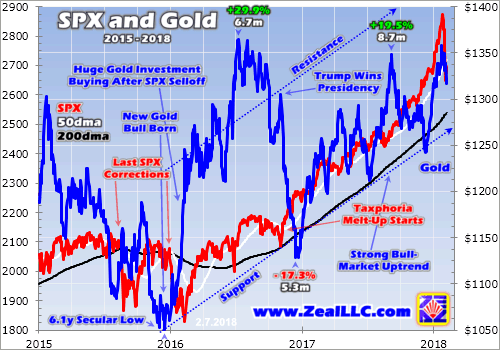
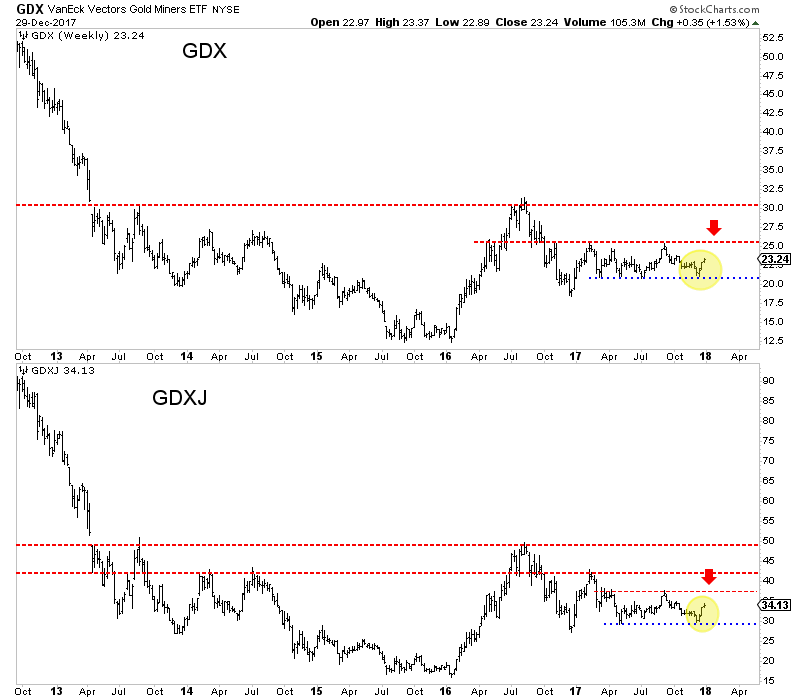
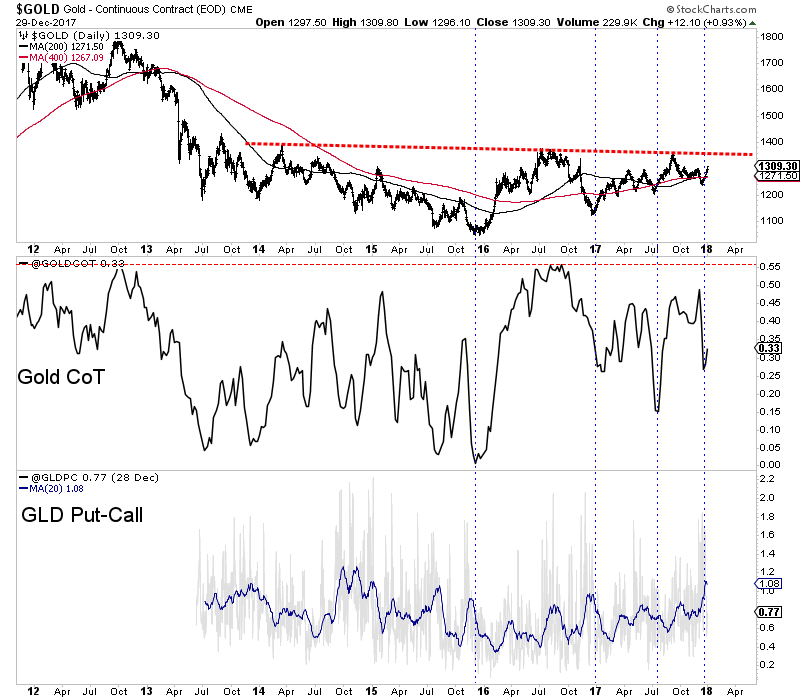
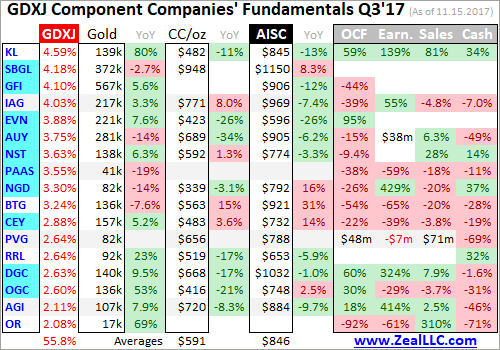
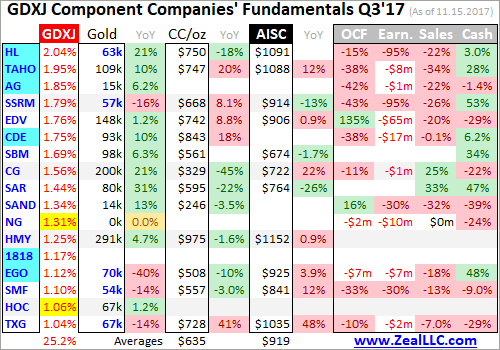
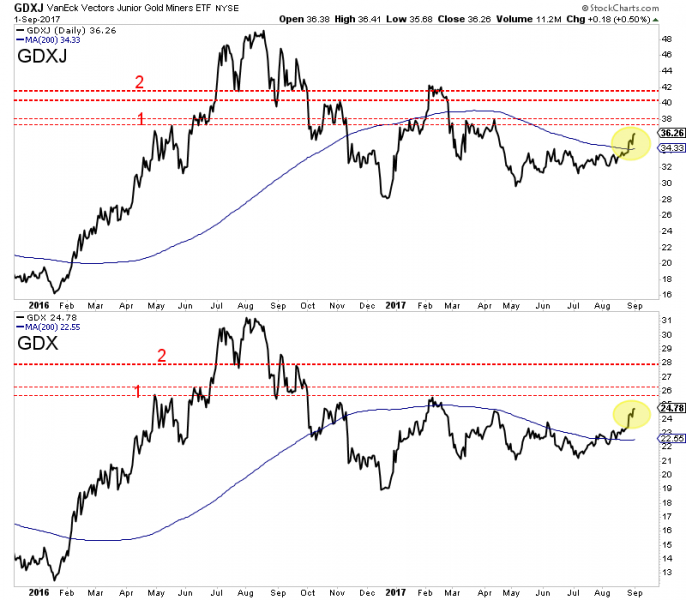
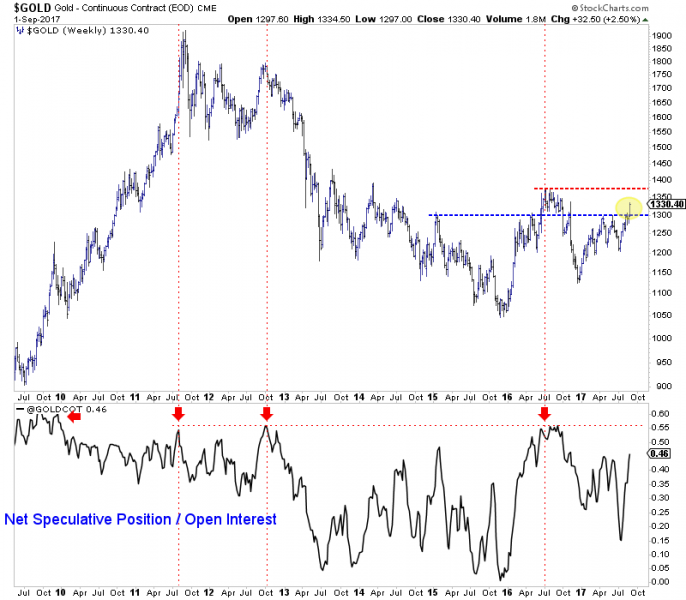
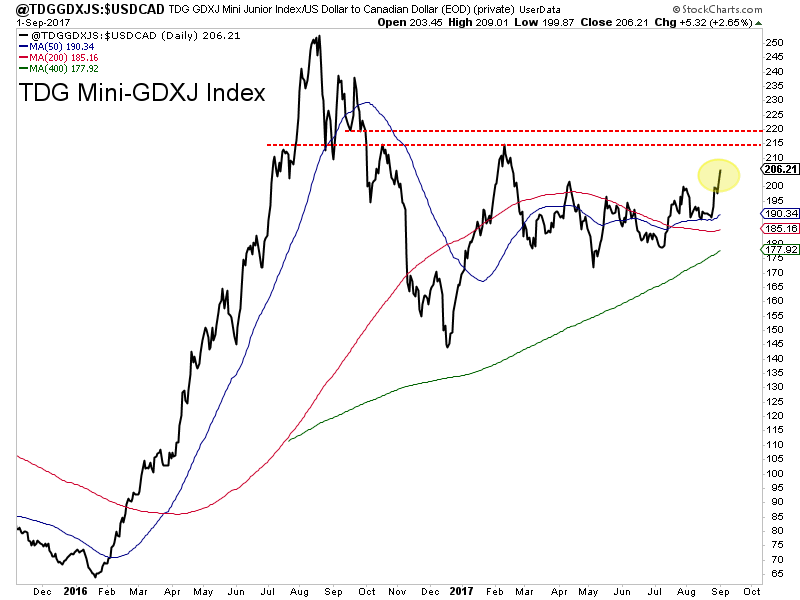


 Follow us on Twitter
 Become our facebook fan


