
The downside potential in precious metals discussed last week is playing out as Gold and gold stocks have broken down technically.
The global economy appears to be firming and that is evidenced by a sustained rebound in global equity markets.
As a result, the potential for a rate cut which pushed precious metals higher is now unwinding. That has caused the breakdown in precious metals and there is more unwinding to go.
We have trumpeted the need (in precious metals) for a rate cut as a fundamental catalyst for the next bull market. But there is another scenario that plays well for Gold.
Let’s step back for a second and remember that Gold is driven by declining real interest rates and secondarily, a steepening yield curve. Either essentially entails Fed rate cuts or inflation rising faster than short-term rates which in other words equates to rising inflation expectations.
In the chart below we plot Gold along with a number of fundamental indicators for Gold. These include the real 5-year TIPS yield (as calculated from the TIPS market), the real 5-year yield, the real fed funds rate and the yield curve (upside down).
If the Federal Reserve is not cutting rates in the next 12 months then the best case scenario for Gold would be a bump in inflation that leads to a material decline in real interest rates and a steepening of the yield curve.
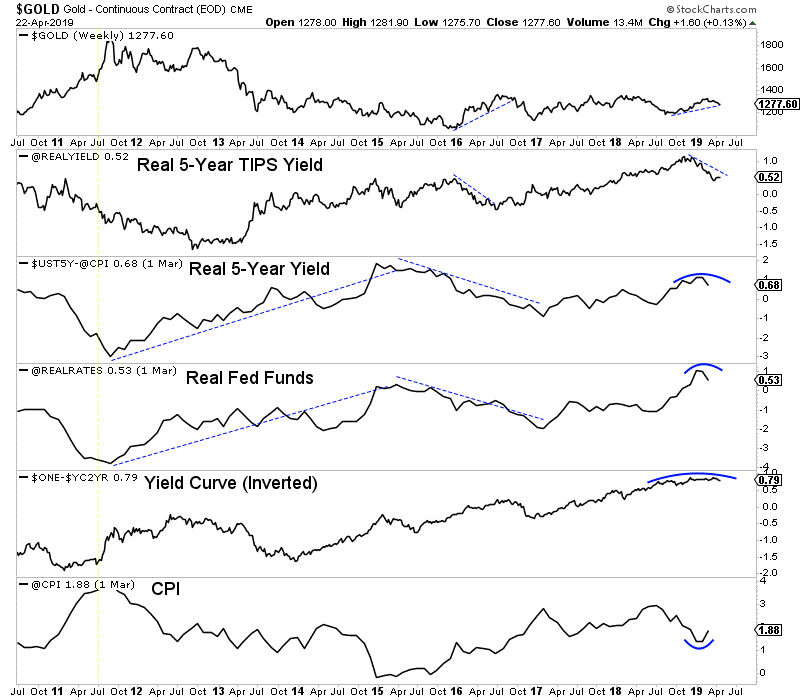
The CPI is rebounding and if it were to reach 3% while the Fed stands pat, that would equate to a real Fed Funds rate of -1.6%. That would imply a decline of -2.1% from here.
Gold would definitely rally in that scenario but for now, the market is focused on the declining expectations for a rate cut in the next 12 months. Until the unwinding of that trade is complete, Gold is likely to trade lower.
However, the point is that we should not be bearish for long if inflation indicators and inflation expectations increase in a sustained fashion. That equates to falling real interest rates which is bullish for Gold.
The CPI may ultimately need to exceed 3% or even 4% to spring a huge breakout in Gold, but a return to 3% with the Fed remaining paused could push Gold back to the wall of resistance.
The gold stocks are extremely oversold on a short-term basis and a rally should begin within the next day or two. That being said, the path of least resistance is lower until the market shifts its focus from a rate cut to rising inflation. That will take some time.
The months ahead could be an especially opportune time to position yourself in this sector. We will be looking for anything we missed in recent months that gives us a second chance opportunity. To learn what stocks we own and intend to buy that have 3x to 5x potential, consider learning more about our premium service.
By Jordan Roy-Byrne CMT, MFTA
April 25, 2019
The great euphoria emanating from these near-record-high stock markets is breathtaking. Traders are again convinced stocks do nothing but rally indefinitely. That everything-is-awesome mindset has stunted gold’s latest upleg, since there’s no perceived need for prudently diversifying stock-heavy portfolios. But that psychology can change fast, as we saw a half-year ago. Gold investment roars back as stocks roll over.
The word “euphoria” is widely misunderstood, often confused with “mania.” The latter is when stocks rocket vertically in blowoff tops, and is defined as “an excessively intense enthusiasm, interest, or desire”. The US stock markets certainly aren’t in a mania. At its latest high last Friday, the flagship U.S. S&P 500 broad-market stock index (SPX) had only edged up 1.2% over the past 14.5 months. That’s not parabolic.
The closest thing to a mania seen in recent years was the SPX’s 18.4% surge over just 5.3 months that led into its initial January 2018 peak. Traders were ecstatic about Republicans’ coming major corporate tax cuts, and aggressively piled into stocks. While euphoria accompanies manias, it is entirely different. It is simply “a strong feeling of happiness, confidence, or well-being”. That psychology is universal today.
Traders have fully persuaded themselves that these stock markets have virtually no material downside risks. Like all sentiment, that’s the direct result of recent price action. These beliefs were last seen in late September and early October. The SPX had just hit a dazzling all-time record high, extending its monster bull market to 333.2% gains over 9.5 years. That was the second-biggest and first-longest in U.S. history!
Gold was deeply out of favor near that last SPX topping too. As a rare counter-moving asset that tends to rally when stock markets weaken, gold investment demand wanes when stock euphoria grows extreme. The whole discipline of portfolio diversification is based on acknowledging that stock markets rise and fall. Since investors can’t know when the next major stock-market selloff will erupt, they keep some non-stock holdings.
But euphoria blinds traders to long centuries of financial wisdom. They tend to extrapolate present conditions out into infinity, assuming they will last indefinitely. But betting any trend will run forever is just plain foolish, as markets are forever cyclical. “Complacency” always accompanies euphoria, “a feeling of contentment or self-satisfaction, especially when coupled with an unawareness of danger or trouble”.
Soon after traders overwhelmingly believe major selloffs are extinct, the next one pummels them. The endless stock-market cycles reassert themselves with a vengeance, punishing the scoffers. The severe correction after late-September’s peak is a textbook example. Over the next 3.1 months into Christmas Eve, the SPX plunged 19.8%! That was right on the verge of confirming a new bear at its -20% threshold.
Traders were confronted with the painful truth that stock markets don’t rally forever, that major selloffs are inevitable. So gold investment demand surged as investors rushed to start diversifying their bleeding stock-dominated portfolios. Major stock-market plunges are always followed by big and sharp rebound rallies. Just 5 weeks after those deep near-bear lows, the SPX had blasted 15.0% higher by the end of January.
That’s when euphoria and complacency started to return. These perilous herd emotions strengthened with every daily SPX rally over the past several months or so. The higher the stock markets bounced, the more selloff fears faded. That left portfolio diversification and gold investment increasingly out of favor again. The result is today’s extreme euphoria resembles late September’s, traders don’t have a care in the world.
While euphoria and complacency are ethereal and unmeasurable, they can be inferred. The classic VIX fear gauge is the most-popular way. It quantifies the implied volatility options traders expect in the SPX over the next month, as expressed through their collective trades. While a high VIX reveals fear, a low one shows the direct opposite which is complacency. Last Friday the VIX slumped under 12.0 on close.
The SPX’s massive rebound rally had extended to 23.7% over 3.6 months, recovering over 19/20ths of the preceding severe-correction losses. The SPX had soared back to within just 0.8% of its record peak of 6.7 months earlier! The stocks-to-the-moon zeitgeist had returned in an extreme way. The VIX hadn’t been lower since early October, when the SPX still lingered merely 0.2% under its unprecedented crest.
So per the leading approximation, traders’ current euphoria and fear have reverted right back to their very same high and low levels just before the last major SPX selloff! That’s why gold has slumped in recent weeks. Investors forget about it when they come to believe stock markets’ downside risks have vanished. When they buy into that peaking delusion that stocks can rally indefinitely, there’s no perceived need for gold.
This psychology creates an inverse relationship between stock-market levels and gold. It becomes most-pronounced when stock markets are near record highs generating great euphoria. This chart shows how the SPX and gold have traded over the past several years or so. Ever since that mania-like SPX surge into late January 2018 on corporate-tax-cut hopes, gold has generally meandered in opposition to stock markets.
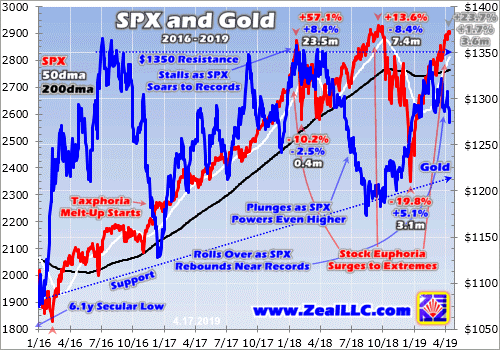
The greater stock-market euphoria, for the most part the weaker gold investment demand and thus gold prices. And of course euphoria is a direct function of how high the stock markets are. The SPX has surged to record and near-record levels 3 times over the past 15 months or so. It peaked at 2872.9 in late January 2018, 2930.8 in late September 2018, and has shot as high as 2907.4 so far in mid-April 2019.
These two confirmed major toppings along with today’s likely third averaged 2903.7, so call it 2900. The SPX is now trading just slightly above January 2018 levels, despite last year being one of the greatest in history for corporate-profits growth. The underlying earnings of the 500 elite SPX companies soared well over 20% in 2018! The SPX should’ve surged proportionally on such strong underlying fundamentals.
But it didn’t, mostly grinding sideways to lower. The U.S. stock markets were already wildly overvalued, spending most of last year trading literally in bubble territory. That’s 28x+ in trailing-twelve-month price-to-earnings-ratio terms, twice historical fair value at 14x. Stocks were already far too expensive to bid to major new highs, a dangerous problem which persists in their latest quarterly results. And 2018 was one-off.
Its four quarters were the only ones comparing pre-tax-cut and post-tax-cut results. That unprecedented discontinuity is the only reason earnings growth was so enormous last year. Profits are expected to stall out this year at best, and likely shrink. All quarterly comparisons going forward already include those big corporate tax cuts. So if the SPX couldn’t materially rally even in 2018, it’s in a world of trouble this year.
In December 2017 just before the corporate tax cuts kicked in, the 500 SPX stocks traded at a simple-average TTM P/E ratio of 30.7x. At the end of March 2019, that had merely retreated modestly to 26.3x which is still just under perilous bubble territory. Without strong double-digit earnings growth, such rich stock valuation levels won’t be sustainable for long. That’s great news for gold’s investment demand and prices.
The first time the SPX topped in January 2018, gold’s powerful upleg stalled just shy of breaking out to new bull-market highs. Gold held those strong levels until the SPX started powering higher again, which quickly rekindled euphoria dousing portfolio diversification. Gold suffered a major correction as the SPX challenged and exceeded new records into September 2018. Gold languished near lows as the SPX peaked.
Gold investment demand didn’t flare again to force gold higher until the SPX decisively rolled over from those all-time record highs. Once the stock markets started falling long enough and far enough to scare traders into remembering stocks can fall too, gold investment demand surged pushing this metal’s prices much higher. Gold was nearing another breakout before stock-market euphoria grew extreme again.
That’s why gold’s latest upleg stalled in recent weeks, why its price has slumped after nearing another major bull-market breakout. Gold has actually shown remarkable resiliency considering stock euphoria soaring right back up to early-October extremes. Last Friday when the VIX fell under 12.0 on close, gold was trading near $1291. That was way better than early October’s $1198 the last time the VIX traded that low.
Stock-market psychology’s primary impact on gold is sentimental. The higher stocks and the greater the herd belief they will keep rallying, the more gold interest and investment demand fade. But there’s also a way to measure capital flows into and out of gold from American stock investors. That is through the gold-bullion holdings of the world’s leading and dominant gold exchange-traded fund, the GLD SPDR Gold Shares.
GLD is a behemoth, holding 752.9 metric tons of physical gold bullion in trust for its shareholders this week. According to the World Gold Council, GLD is the world’s biggest gold ETF by far. At the end of Q4’18 its gold holdings were 2.8x larger than its next-biggest competitor’s. GLD commanded nearly 3/7ths of the total gold bullion held by the world’s top-10-largest physical-gold-backed ETFs, a vast amount!
GLD’s mission is to track the gold price, to give stock traders easy access to gold exposure. This is only possible if GLD can vent excess supply and demand for its shares directly into the global gold market, as the supply and demand for GLD shares is independent of gold’s own. GLD prices can’t mirror gold prices unless this ETF is able to buy and sell physical gold bullion to equalize supply and demand, which it does daily.
It also reports its total gold holdings daily, allowing traders to see whether American stock-market capital is flowing into or out of gold. When GLD’s holdings are rising, investors are buying gold. When they are falling, investors are selling gold. The capital flows into and out of GLD are heavily influenced by stock-market fortunes, stunted when euphoria grows extreme. Gold investment has suffered with the SPX so high.
Understanding how these capital flows work is important. When traders buy GLD shares faster than gold itself is being bought, GLD’s price threatens to decouple from gold to the upside. GLD’s managers avert this by shunting that excess GLD-share demand directly into gold itself. They issue enough new GLD shares to offset that differential demand, and use the proceeds to buy more physical gold bullion to hold in trust.
Conversely when GLD shares are being sold faster than gold, GLD’s price will soon break away from gold on the downside. GLD’s managers stave that off by buying back its shares to sop up that excess supply. The capital necessary to finance those repurchases is obtained by selling some of GLD’s physical-gold-bullion holdings. So rising and falling GLD holdings show stock-market capital migrating into and out of gold.
This chart superimposes GLD’s daily gold holdings in metric tons over the closing gold price. They are well-correlated with gold, showing American stock traders’ GLD trading heavily influences how gold is faring. Each calendar quarter’s gold-price percentage change, and both the percentage and absolute changes in GLD’s holdings, are noted. Over the past year in extreme SPX euphoria, GLD has driven gold.
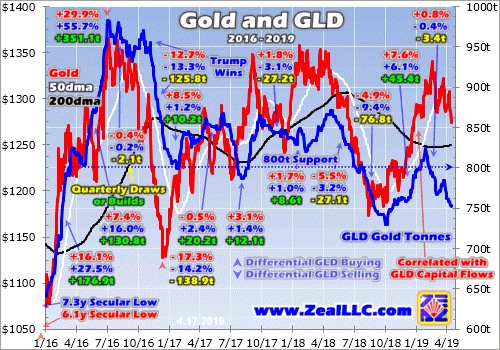
Incredibly GLD’s and thus American stock traders’ huge impact on the gold price is often not understood. Overlooking it is a grave error, greatly hobbling chances of multiplying wealth in gold. To show how dominant GLD is, consider some of the larger quarterly gold moves of this young bull born from deep 6.1-year secular lows in mid-December 2015. GLD’s holdings languished near 7.3-year lows at that same time.
In Q1’16 gold surged 16.1% after the first SPX corrections in 3.6 years made traders remember gold’s crucial role in portfolio diversification. They flooded into GLD shares at dizzying rates, catapulting its holdings 27.5% or 176.9t higher that quarter! Per the latest comprehensive fundamental data from the World Gold Council, GLD’s build accounted for 84% of the year-over-year growth in total global gold demand!
In Q2’16 that massive gold upleg continued, pushing gold another 7.4% higher. GLD’s holdings surged another 16.0% or 130.8t higher on heavy differential buying by American traders. That GLD build alone ran 106% of gold’s total YoY worldwide demand growth! Had U.S. stock-market capital not been flowing into gold via GLD, this gold bull never would’ve existed. Q4’16’s gold plunge drove home that critical point.
After Trump won the presidency that quarter, stock markets surged on hopes for big tax cuts soon with Republicans controlling the U.S. government. Euphoria soared with the SPX, leading investors to jettison gold and chase stocks. Gold plunged 12.7% that quarter, driven by a huge 13.3% or 125.8t draw in GLD’s holdings. That selling was a whopping 112% of the total YoY decline in global gold demand that quarter!
While American stock traders certainly aren’t the only gold investors, they command vast capital that has really moved gold in recent years. Gold’s price behavior in each quarter of this bull has generally been quite proportional with capital flows into and out of GLD. That’s certainly proven true in this past year as well, when SPX euphoria ran rampant other than deep in Q4’18’s severe near-bear correction in the SPX.
After that initial SPX peak in January 2018 and the subsequent sharp-yet-shallow-and-short correction, gold investment demand grew as euphoria wavered. Between mid-January to late April that year, GLD enjoyed a 5.1% holdings build. That wasn’t enough to push gold much higher, it only climbed 0.4%. Differential GLD-share trading isn’t gold’s only driver, gold-futures trading also plays a major role for different reasons.
But as the SPX powered higher out of that initial post-topping selloff, so did investors’ stock euphoria. So they again started to pull capital out of GLD faster than gold was falling, forcing a major holdings draw. Between late April to early October soon after the SPX’s second topping and new all-time record highs, GLD’s holdings plunged 16.2%. That gold-investment exodus pushed gold prices 9.0% lower in that span.
The relentless slump in GLD’s holdings reversed sharply on a very telling day. American stock traders finally started aggressively buying GLD again on October 10th, forcing a major 1.2% daily holdings build. What happened? That was the first day the SPX sold off hard after its recent record high, plunging 3.3% to shatter complacency. That budding sentiment shift was evident in the VIX, which soared 39.7% to 22.6.
The more that serious Q4’18 SPX selloff intensified, the greater gold investment demand grew. This was most evident in December, when the stock markets plunged a brutal 9.2% alone! That pain really helped investors remember the wisdom of having gold allocations in their stock-heavy portfolios. Gold surged 4.9% that month on a 3.4% GLD-holdings build. Gold investment was strong with stock euphoria gone.
Investors’ interest in gold continued well after the SPX started rebounding, as GLD’s holdings peaked in late January 2019 about 5 weeks after the SPX had bottomed. But with the SPX already soaring 15.0% off its lows, euphoria was mushrooming rapidly. Between early October to late January, GLD’s holdings surged 12.8% driving a parallel 9.7% gold rally with stock euphoria not stunting gold investment demand.
Though gold’s latest interim high of $1341 came a couple weeks later in mid-February, American stock traders’ capital outflows from gold were well underway. As the SPX powered ever higher that month, GLD suffered draws on fully 13 of its 19 trading days! That differential GLD-share selling on resurgent stock euphoria continued to this week. Since late January, GLD’s holdings have shrunk another 8.7%.
Though gold has been fairly resilient considering the lofty stock-market levels, it still slid 3.3% in that span. Gold’s upleg was stunted by stock markets’ powerful rebound rally. It rekindled the same levels of extreme euphoria and complacency seen near the SPX’s late-September record peak. With everyone once again convinced stocks can rally indefinitely with no material selloffs, gold investment demand withered.
While wearying for long-suffering contrarian investors, this is actually quite bullish for gold. Back in early October GLD’s holdings slumped to 730.2t in extreme stock-bull-peaking euphoria. Gold fell as low as $1188 as GLD’s holdings bottomed before the SPX started dropping again. Forced way back down to 752.3t this week, GLD’s holdings are only 3.0% above those deep early-October lows. Yet gold was way higher.
At $1276, gold was fully 7.4% above its own early-October low! This is a much-higher base from which to launch its next surge higher, with gold-investment buying potential via GLD shares almost fully reset! When these dangerously-overvalued stock markets inevitably roll over again, American stock traders will again remember prudently diversifying with gold. Their big capital inflows will again drive gold much higher.
That has real potential to fuel a major bull-market breakout for gold above its $1365 bull-to-date peak seen way back in July 2016. This is even more likely because gold-futures speculators aren’t very long as I discussed in last week’s essay. Just like American stock traders, they have lots of room to buy gold aggressively as it resumes marching higher. Gold investment demand only grows as gold prices climb.
Realize gold’s big problem right now is universal stock-market euphoria at extreme stock-bull-peaking levels. But that won’t last, it never does. Once the SPX inescapably starts sliding again in its next material selloff, gold demand will surge back. These lofty overvalued and overbought stock markets near record highs look exhausted. They are likely to turn back south any day, bleeding away euphoria and rekindling gold.
The biggest beneficiaries of gold uplegs are the gold miners’ stocks, which tend to leverage gold’s gains by 2x to 3x. Back in essentially the first half of 2016 when gold surged 29.9% higher in response to back-to-back SPX corrections, the leading GDX and GDXJ gold-stock ETFs soared 151.2% and 202.5% higher in roughly that same span! When gold starts powering higher again, the coming gold-stock gains will be big.
One of my core missions at Zeal is relentlessly studying the gold-stock world to uncover the stocks with superior fundamentals and upside potential. The trading books in both our popular weekly and monthly newsletters are currently full of these better gold and silver miners. Mostly added in recent months as gold stocks recovered from deep lows, our unrealized gains are still running as high as 59% this week!
To multiply your capital in the markets, you have to stay informed. Our newsletters are a great way, easy to read and affordable. They draw on my vast experience, knowledge, wisdom, and ongoing research to explain what’s going on in the markets, why, and how to trade them with specific stocks. As of Q1 we’ve recommended and realized 1089 newsletter stock trades since 2001, averaging annualized realized gains of +15.8%! That’s nearly double the long-term stock-market average. Subscribe today for just $12 per issue!
The bottom line is stock-market euphoria has stunted gold’s upleg. With U.S. stock markets once again back up challenging all-time-record highs, traders have forgotten the hard lessons from late September’s peak. They’ve deluded themselves into believing stocks can rally indefinitely, that near-bubble valuations don’t matter. Thus gold investment demand has withered, which is normal when stock markets are topping.
But once these lofty stock markets inevitably roll over decisively again, gold demand will come roaring back just like in Q4. Investors will remember the wisdom of prudently diversifying their stock-dominated portfolios with counter-moving gold, and start shifting capital back in. That will push gold prices much higher, with real potential for a major bull-market breakout. The gold stocks will amplify those gains like usual.
Adam Hamilton, CPA
April 24, 2019
Copyright 2000 – 2019 Zeal LLC (www.ZealLLC.com)
- Global stock and bond markets continue to be driven by the macros of a possible trade deal, accommodative central banks, weaker earnings, continued stock buybacks, and rising government debt.
- Gold is driven by these same macros, but it has the additional price driver of seasonal Chindian physical market demand.
- It’s currently the soft season for physical demand, but the rest of the price drivers are quite positive. Most big bank analysts have gold price targets of about $1400 for 2019.
- Unfortunately, they don’t see gold reaching their target prices until seasonal physical demand strengthens later in the year.
- Please click here now. Double-click to enlarge this key USD vs yen chart. During the September-December period in 2018, global stock markets tumbled as the Fed put pressure on the stock market with higher rates and QT on “autopilot”.
- Risk-on markets (stocks and the dollar) tumbled, and risk-off markets (yen and gold) soared. Then a dramatic about-face by the Fed in late December sent the dollar and stocks soaring.
- Note that gold continued to rise until mid-February even though stocks and the dollar rallied. That’s because of strong Chinese New Year physical market demand.
- The bottom line: When push comes to shove, it is the physical market that ultimately determines the actions the COMEX commercial traders take and that determines the price trend.
- In 2019, from February to the current time frame, risk-on markets have continued to strengthen, physical market demand continues its seasonal softness, and so gold meanders sideways with a slight downwards bias.
- Please click here now. Double-click to enlarge this chart of DIA-NYSE, a Dow proxy ETF. From a technical perspective, the U.S. stock market has meandered sideways since the U.S. government launched a wave of tariff taxes.
- Then it began crashing when the Fed became more aggressive about rate hikes and QT in the late stage of the current business cycle.
- The market can probably rally to around where it would have been without the “tariff tax tantrum”, but most mainstream analysts don’t see much more than 2% GDP growth over the long term for the U.S. economy.
- It could be said that in America there are a few thousand modestly-socialist politicians and more than 300 million capitalist citizens. Likewise, it could be said in China and India there are a few thousand fully-socialist politicians and 3 billion capitalist citizens.
- Regardless of how they vote, citizens in all three countries generally work hard to make ends meet and to build quality products… while being controlled by debt-worshipping politicians.
- Chindian citizens are in the early stages of their latest empire cycle, and U.S. citizens are in the late stages of their first empire cycle. A gold-orientation of the gargantuan Chindian population essentially guarantees that gold will quickly become a mainstream asset for global investment.
- That’s because there is only about 1% annual growth in mine supply while Chindian citizen wealth is growing at about 6%-8% each year. Gold demand growth mirrors citizen wealth growth.
- In America, the Fed’s accommodative stance can only buy the government limited time. The rate of annual U.S. government debt growth is very similar to Chindian citizen wealth growth.
- On that note, please click here now. Double-click to enlarge. I’m predicting that the gold price drivers of the U.S. government debt behemoth and the Chindian wealth trade are set to collide… in this weekly chart inverse H&S neckline zone at about $1450.
- That should push gold towards the $2000 area neckline zone of an even bigger inverse H&S pattern that targets the $3000 price area.
- Please click here now. Double-click to enlarge this short-term GDX chart. I’ve highlighted my guswinger.com buy and sell signals on the chart. I buy NUGT when there’s a GDX buy signal and buy DUST when there is a GDX sell signal.
- This proprietary system is mechanical and investors are almost always in a trade. The current daily chart price action in GDX is boring at best and can be demoralizing, but for swing traders, almost every day is exciting! The bottom line:
- During the strong season, core positions will make the most money for investors in the gold market. During the weak season (now), a solid short-term trading plan reduces negative emotion, limits drawdowns, and puts money in the bank.
- Please click here now. Double-click to enlarge this daily gold chart. Some investors may be concerned about the fourth touching of the $1288 June futures and $1280 cash market floor, but my question to them is:
- Is this a floor, or is it a sponge? The gold market now is vastly different (both fundamentally and technically) than it was when the price touched the $1523 area for the fourth time in 2013. Investors should think about modest price softness on a $1280 area sponge rather than possible sharp weakness at a $1280 floor. The $1450-$1400 price zone will become a beautiful floor as the gargantuan Chindian wealth trade and U.S. government debt behemoth of doom collide!
Stewart Thomson
Graceland Updates
Email:
Stewart Thomson is a retired Merrill Lynch broker. Stewart writes the Graceland Updates daily between 4am-7am. They are sent out around 8am-9am. The newsletter is attractively priced and the format is a unique numbered point form. Giving clarity of each point and saving valuable reading time.
Risks, Disclaimers, Legal
Stewart Thomson is no longer an investment advisor. The information provided by Stewart and Graceland Updates is for general information purposes only. Before taking any action on any investment, it is imperative that you consult with multiple properly licensed, experienced and qualified investment advisors and get numerous opinions before taking any action. Your minimum risk on any investment in the world is: 100% loss of all your money. You may be taking or preparing to take leveraged positions in investments and not know it, exposing yourself to unlimited risks. This is highly concerning if you are an investor in any derivatives products. There is an approx $700 trillion OTC Derivatives Iceberg with a tiny portion written off officially. The bottom line:
Are You Prepared?
The big picture fundamentals for precious metals have been trending more bullish in recent months as expectations for the Federal Reserve went from a few rate hikes in 2019 to an expectation of a rate cut within the next 12 months. That is aligned with the peak in the 2-year yield and growing concerns over slowing growth globally.
However, that doesn’t preclude a temporary improvement in the economy and markets. China is stimulating again. Global equities have recovered and the S&P 500 is on the cusp of a new high.
All of this means a Fed rate cut in the next 12 months is less likely. Not unlikely but less likely.
Precious Metals have been trading on Fed rate expectations for a while. Higher highs in equities and some stabilization in the economy will chip away at expectations for a rate cut and as a result, some bearish price action is showing up in the precious metals sector.
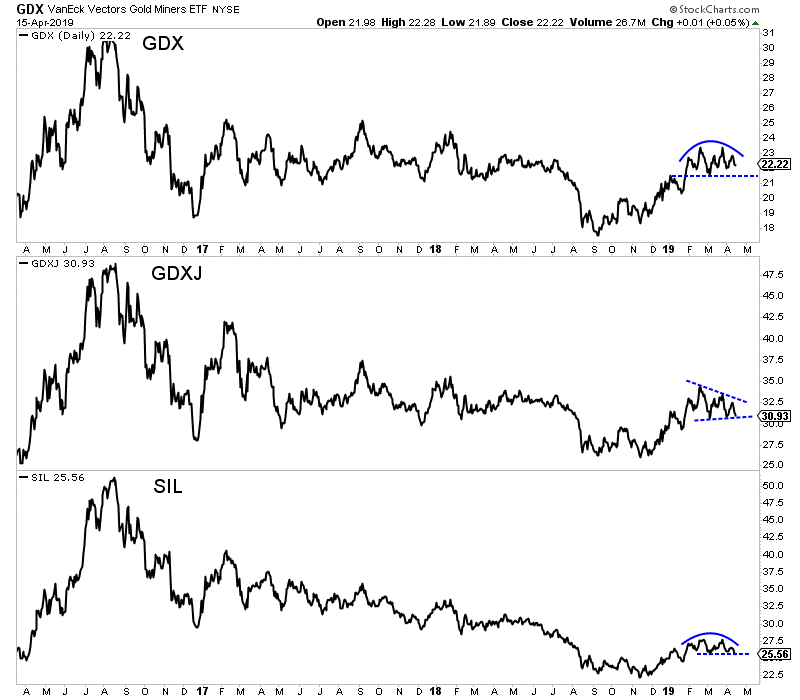
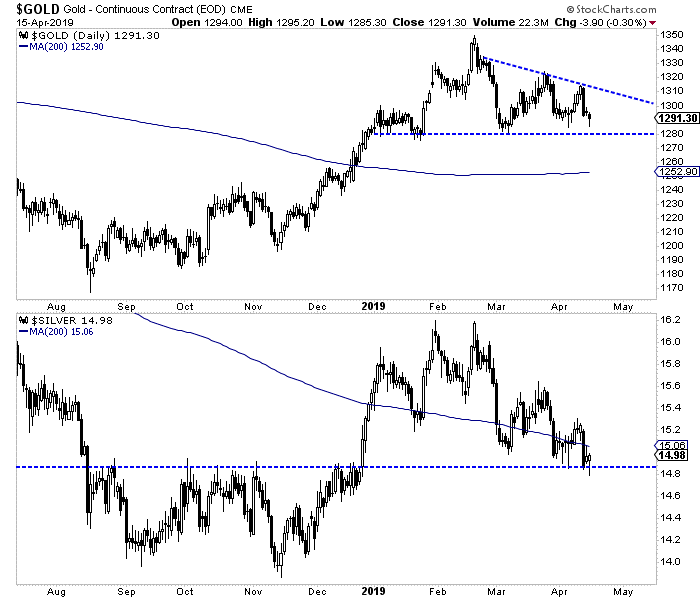
Below we plot the daily line charts of the gold and silver stocks.
They have formed bearish patterns with the silver stocks (SIL) leading to the downside followed by GDXJ while GDX has held up the best. These charts need to hold their early March low to avoid a break to the downside.
Turning to the metals, we find Silver has been leading the entire complex lower. It has found temporary support just below $15.00.
Meanwhile, Gold has formed a bearish pattern and if it loses support at $1280 will likely dump to its 200-day moving average at $1253 and probably lower.
Circling back to the gold stocks, I do want to note the weekly candle charts because they illustrate the big picture prognosis.
We can see that for GDX and GDXJ the critical levels are clearly $23 and $34. The gold stocks have failed to break resistance for now but it’s clear that a weekly close above those levels would signal a bull market.
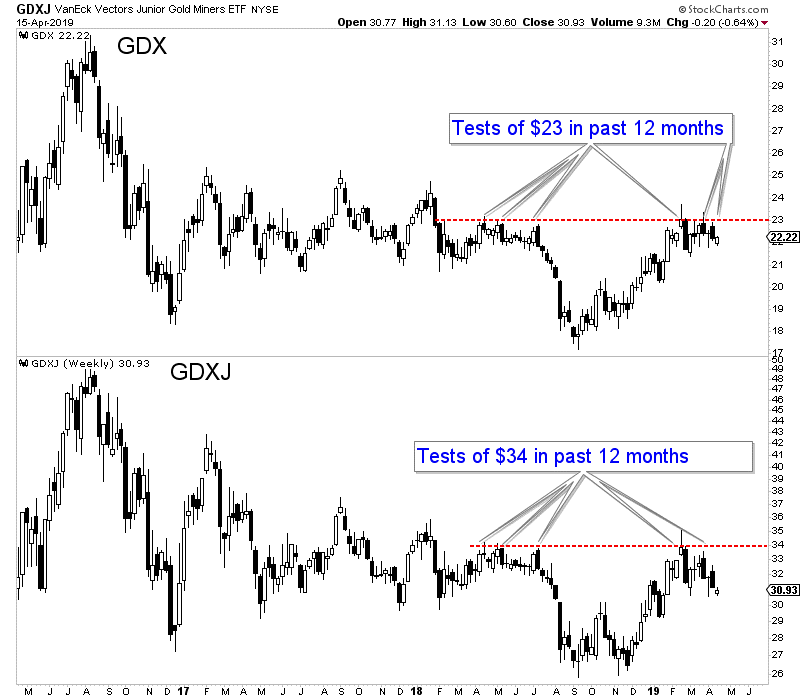
If the miners and Gold break lower then it’s no reason to throw in the towel. We would not be surprised if the next low the miners make could be the last one before a bull run begins.
In the meantime, the question is will it be a higher low or will the miners form huge double bottoms at $18 and $26?
The weeks and months ahead should be an especially opportune time to position yourself in this sector. We will be looking for anything we missed in recent months that gives us a second chance opportunity. To learn what stocks we own and intend to buy that have 3x to 5x potential, consider learning more about our premium service.
Gold has faded from interest in the past couple months, overshadowed by the monster stock-market rally. But gold has been consolidating high, quietly basing before its next challenge to major $1350 bull-market resistance. A decisive breakout above will really catch investors’ attention, greatly improving sentiment and driving major capital inflows. With gold-futures speculators not very long yet, plenty of buying power exists.
Last August gold was pummeled to a 19.3-month low near $1174 by extreme all-time-record short selling in gold futures. The speculators trading these derivatives command a wildly-disproportional influence on short-term gold price action, especially when investors aren’t buying. Gold-futures trading bullies gold’s price around considerably to majorly, which can really distort psychology surrounding the gold market.
The main reason is the incredible leverage inherent in gold futures. This week the maintenance margin required to trade a single 100-troy-ounce gold-futures contract is just $3400. That’s the minimum cash traders have to keep in their accounts. Yet at the recent $1300 gold price, each contract controls gold worth $130,000. So gold-futures speculators are legally allowed to run extreme leverage up to 38.2x!
That’s extraordinarily risky of course. A mere 2.6% adverse move in gold against traders’ fully-leveraged positions would result in 100% total losses. It’s amazing these guys can sleep at night. For comparison, the stock markets’ legal limit has been 2x leverage since 1974. 10x, 20x, 30x+ is crazy, and has been very problematic for gold for decades. It greatly amplifies gold-futures speculators’ impact on gold prices.
Every dollar deployed in gold futures at 30x leverage literally has 30x the influence on gold prices as a dollar invested in gold outright! So even though gold-futures speculators have far less capital available than investors, it is way more potent amplified up to 38x! Thus when gold investment demand is weak like recently with stellar stock-market complacency, gold-futures speculators utterly dominate gold price action.
Their collective trading effectively controls gold psychology too, since the American gold-futures price has become the world’s leading gold reference one. Investors start feeling bullish on gold and buying usually only after gold-futures speculators push its price higher. And gold-futures selling leaves investors bearish and worried, impelling them to exit gold. Gold-futures trading is the tail that wags the gold-investment dog!
So everyone interested in gold has no choice but to follow what the gold-futures speculators as a herd are doing. The US Commodity Futures Trading Commission publishes weekly data showing their collective positioning, the famous Commitments of Traders reports. They are released late Friday afternoons, and show traders’ aggregate gold-futures long and short contracts held as of the preceding Tuesday closes.
Despite gold’s solid upleg since those deep mid-August lows, these traders still have lots of buying power left to push gold considerably higher. This first chart superimposes the daily gold price in blue over specs’ weekly total gold-futures long and short contracts in greed and red. The great majority of gold’s upleg-to-date gains have been driven by short-covering buying. Very bullishly the larger long buying is still yet to come.
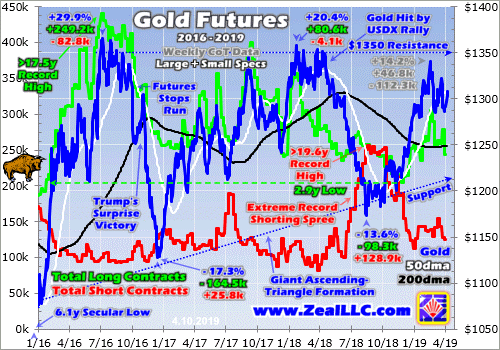
In mid-August when today’s gold upleg was born, speculators’ total gold-futures shorts rocketed way up to 256.7k contracts! That was the highest witnessed in the 19.6 years since early 1999, almost certainly an all-time record. That unprecedented orgy of extreme shorting hammered gold from roughly $1300 down to $1175 in a couple months or so. That sharp futures-driven gold plunge naturally devastated psychology.
The gold-futures traders were effectively borrowing gold they didn’t own to dump in the markets, hoping to buy it back later at lower prices and profitably repay those debts. They were doing it at extreme 30x+ leverage, proportionally amplifying their capital’s price impact. That record shorting spree had nothing to do with fundamentals, it was a snowballing momentum thing. Yet investors were spooked into selling in sympathy.
In mid-June when gold traded just over $1300, total spec shorts were only 100.3k contracts. But over the next 10 CoT weeks they skyrocketed 156% higher to that record 256.7k. The resulting gold carnage led American stock investors to sell shares in the leading GLD SPDR Gold Shares gold ETF much faster than gold was being sold. That forced its gold-bullion holdings 60.1 metric tons or 7.2% lower in that short span!
Gold bottomed the very week gold-futures short sellers had exhausted themselves, reached the limits of their available capital. Since then gold has powered nicely higher on balance, enjoying a 14.2% upleg over the next 6.2 months into mid-February. Gold peaked near $1341 then and has been consolidating high ever since. This upleg has been almost fully driven by gold-futures buying, which is totally normal.
To close gold-futures short positions and repay those debts, speculators have to buy gold-futures long contracts to offset them. They bought to cover an enormous 112.3k short contracts in this upleg’s span, mostly unwinding last summer’s record shorting spree. They also added another 46.8k long contracts, leveraged upside bets on gold’s price. Despite all that gold-futures buying, there is still room for much more.
Major gold uplegs have three stages, each driven by distinctive buying from different groups of traders. Uplegs are always born and initially fueled by gold-futures short covering, as speculators are motivated to buy to cover and realize their shorting profits. Short covering quickly becomes self-feeding, as resulting fast gold-price gains force other short-side traders to rapidly buy to cover or face catastrophic leveraged losses.
Thus that stage-one short-covering buying quickly burns itself out after a couple months or so. But it first pushes gold high enough for long enough to convince long-side gold-futures speculators to return. They command way more capital than the short-side guys, as evidenced by the green long line in this chart usually being much higher than the red short line. Spec gold-futures long buying is uplegs’ second stage.
That unfolds more gradually than short covering, typically 6 months or longer. Long-side traders not only have lots more capital to deploy, but their buying is voluntary. They have to really believe gold is heading higher to make such risky hyper-leveraged upside bets. In contrast short covering is mandatory and often involuntary, as those effective debts must legally be repaid. Stage-one buying directly ignites stage two.
Gold has real bull-market breakout potential in the coming months because this current upleg hasn’t yet seen much gold-futures long buying. Stage two is underway, but the majority is likely still yet to come. The green total-spec-gold-futures-longs line above proves this. At best in mid-February near gold’s latest high, total spec longs peaked at 305.0k contracts. And they have since retreated sharply to 243.8k as of last Tuesday.
Both levels are really low by bull-to-date precedent. This young secular gold bull was born out of deep 6.1-year secular lows in mid-December 2015. Its maiden upleg was big and fast, gold rocketed 29.9% higher in just 6.7 months in essentially the first half of 2016. As that peaked in early July 2016, total spec longs hit an all-time record high of 440.4k contracts! Gold-futures traders piled on, helping fuel big upside momentum.
Total spec shorts that same CoT week ran 100.2k contracts. That upleg had been partially driven by the gold-futures speculators buying a monster 249.2k longs while covering 82.8k shorts. Gold crested at $1365 in early July, which remains this bull’s best level today. Over the subsequent years $1350 would repel gold multiple times, becoming major overhead resistance as gold kept failing to break out above it.
Speculators soon started to unwind their excessive long positions, helping hammer gold 17.3% lower by mid-December 2016. That heavy gold-futures selling was greatly exacerbated by stock markets surging after Trump’s surprise election victory. This gold bull’s second upleg emerged from the ashes, driven first by gold-futures short covering which soon ignited gold-futures long buying. That was also the first upleg’s order.
Gold powered another 20.4% higher to $1358 by late January 2018, and once again gave up its ghost right near that key $1350 resistance. Gold-futures speculators ultimately played a smaller role in that upleg as investors returned. Gold investment buying is the third stage of gold uplegs, which can grow far larger than gold-futures-driven stages. Futures buying is a two-stage ignition mechanism to attract investors.
Total gold-futures longs only climbed 80.6k contracts during that second upleg, while shorts only slipped 4.1k. That’s somewhat misleading though, as the precise upleg dates mask the green long line trending higher while the red short line trended lower. When that upleg peaked, total spec longs and shorts were running 356.4k and 121.9k contracts. The former was still much higher than today’s levels, a very-bullish omen.
This gold bull’s first two uplegs failed with total spec longs far higher than today’s 243.8k, averaging 398.4k contracts. Second-stage spec long buying has exhausted itself and killed uplegs between roughly 350k to 450k contracts in this gold bull. So the sub-250k levels seen last Tuesday remained way too low to likely signal a mature gold upleg. Speculators still have room to do the majority of their stage-two long buying!
This gold upleg is highly likely to see at least another 100k contracts of long buying, and potentially up to 200k if gold returns to favor! That is the gold-futures equivalent to another 311 to 622 metric tons of gold. That will almost certainly catapult gold much higher, just like during this bull’s prior uplegs. Given where gold is today, this creates major bull-market breakout potential. A concerted assault on $1350 is likely.
Throughout this entire gold bull, gold has never been higher with sub-250k spec longs than it is today near $1300! Usually the yellow metal was only around $1250 at this kind of positioning. So we are now witnessing gold’s highest basing in its bull market relative to spec longs. $1350 isn’t much higher than $1300, just another 3.8%. There’s a good chance the remaining stage-two buying will drive gold there.
While it’s certainly not exact, 50k contracts of gold-futures long buying in this bull’s other gold uplegs have often pushed gold $50 higher. Again we are almost certain to see another 100k and potentially a best case of 200k. So gold has never been better positioned in this bull market to surge up to and through its multi-year $1350 resistance! A decisive breakout above $1350 would change everything in the gold market.
Gold-futures speculators are necessarily trapped in the short term by their extreme leverage. They don’t care what gold does, they just want to ride its momentum. Investors are way different, with no leverage at all they have a long-term focus. There’s nothing that excites them more, and drives more capital inflows into gold, than new bull-market highs. Higher highs prove gold is still marching, portending more future gains.
Investors haven’t seen a new gold-bull high since way back in early July 2016, which feels like forever ago in these markets. As the months and years paraded by and gold kept failing to best $1350, most investors gradually lost interest in gold. While its bull-market lower-support zone has gradually risen, the horizontal upper resistance really tainted psychology. Gold has been viewed as consolidating, not in a bull.
But 100k to 200k contracts of spec gold-futures long buying starting near $1300 has real potential to blast gold back above $1350. A decisive breakout is 1%+ beyond that, or $1364. Once gold climbs back over $1365, it will start hitting new bull-to-date highs. That will bring gold back into the financial news in a big way, rekindling investor interest and capital inflows. The resulting bullish sentiment becomes self-feeding.
Major stage-three investment gold buying gets way more likely the higher gold forges above $1350. It’s ironic that although investment is all about buying low when assets are out of favor, the great majority of investors instead prefer to buy high. They love chasing winners, and increasingly crowd into positions the higher their prices climb. There’s no doubt new bull-market gold highs will fuel big excitement in this metal.
Gold’s bull-market breakout potential in the coming months is amplified by a couple other major factors. Gold is in a seasonally-strong time of the year, enjoying its seasonal spring rally. That provides a solid sentimental tailwind that should help motivate gold-futures speculators to continue rebuilding their low gold-futures long positions. Their buying also becomes self-feeding the higher and longer gold runs.
Far more importantly, gold-investment levels are really low thanks to the monster stock-market rally since late December. With the US stock markets skyrocketing from ugly near-bear severe-correction lows to nearly regaining September’s all-time highs, complacency and euphoria are epic. Stock investors have virtually no fear of a major stock-market selloff, which like usual has greatly retarded gold investment demand.
But these lofty stock markets are dangerously overvalued and overbought, heading into a Q1’19 earnings season which is looking to be the weakest in years. When the stock markets roll over again, investors will again remember the wisdom of prudently diversifying their stock-dominated portfolios with gold. It tends to rally when stock markets weaken, a rare and desirable quality. The next material stock selloff will goose gold.
Back in December when the flagship US S&P 500 stock index plunged 9.2%, gold surged 4.9% higher. Any material stock-market selloff, regardless of the reason, will quickly rekindle gold investment demand. And if investors start buying even before gold-futures speculators’ stage-two long buying is complete, a decisive breakout back above $1350 is all but certain. This gold bull’s upside breakout potential is very real.
The biggest beneficiaries of higher gold prices reviving interest in its bull market will be the gold miners’ stocks. The major gold miners of the GDX VanEck Vectors Gold Miners ETF usually amplify gold’s own moves by 2x to 3x. So a 10% gold rally will often translate into 20% to 30% GDX gains. But when gold really shifts back into favor among investors, the upside can be far greater. We’ve already seen that in this bull.
This GDX gold-stock-bull chart is updated from last week’s essay, where I explained the bullish gold-stock situation in depth. So check that out if you need to get up to speed. But for our purposes today, note the last time gold powered to new bull-market highs exciting investors was during this bull’s first upleg largely in the first half of 2016. GDX skyrocketed 151.2% higher in essentially the same span of that 29.9% gold upleg!
That made for outstanding 5.1x upside leverage to gold from the major gold miners. The smaller mid-tier and junior gold miners of the GDXJ VanEck Vectors Junior Gold Miners ETF did even better. With their superior fundamentals and lower market capitalizations, mid-tier upside is much better than the majors. Even if gold merely challenges $1350 again, the gold stocks will surge dramatically higher as traders flock back.
So while the lack of interest in gold and its miners’ stocks these days is understandable, it is unfortunate. The biggest gains are won by buying relatively low before everyone gets excited about an asset or stock sector. Once gold and the gold stocks start surging again as $1350 nears, speculators and investors alike will have to buy much higher. Deploying aggressively before new bull highs should yield impressive gains.
One of my core missions at Zeal is relentlessly studying the gold-stock world to uncover the stocks with superior fundamentals and upside potential. The trading books in both our popular weekly and monthly newsletters are currently full of these better gold and silver miners. Mostly added in recent months as gold stocks recovered from deep lows, our unrealized gains are already running as high as 76% this week!
To multiply your capital in the markets, you have to stay informed. Our newsletters are a great way, easy to read and affordable. They draw on my vast experience, knowledge, wisdom, and ongoing research to explain what’s going on in the markets, why, and how to trade them with specific stocks. As of Q1 we’ve recommended and realized 1089 newsletter stock trades since 2001, averaging annualized realized gains of +15.8%! That’s nearly double the long-term stock-market average. Subscribe today for just $12 per issue!
The bottom line is this gold bull now has the highest major-upside-breakout potential of its entire lifespan. This latest gold upleg fueled by gold-futures buying hasn’t matured yet, as speculators’ long positioning remains quite low. For the first time in this bull, gold is already consolidating high around $1300 before most of the likely gold-futures long buying has run its course. That makes an assault on $1350 very likely.
If gold can break decisively above that multi-year resistance and start forging new bull-market highs, its psychology will greatly improve. Investors will take notice and start buying again, driving gold higher and fueling mounting bullishness. The gold miners’ stocks will be the biggest beneficiaries of new bull-market gold highs. Their stocks soared the last time investors were excited about this gold bull, rapidly multiplying wealth.
Adam Hamilton, CPA
April 15, 2019
Copyright 2000 – 2019 Zeal LLC (www.ZealLLC.com)
There are more than a handful of things I can cite as leading indicators for the Gold price.
Ratios such as Gold against the stock market and Gold against foreign currencies are generally good leading indicators. The gold stocks and Silver can function as leading indicators at times.
The yield curve and bonds can also be leading indicators.
But there is one thing I’ve never mentioned, nor written about. It makes sense in the current context though. That’s Platinum.
Platinum has a brief but clear history as a leading indicator for Gold.
Platinum outperformed and led Gold higher immediately after the two most recent major lows: 1985 and 1999-2001.
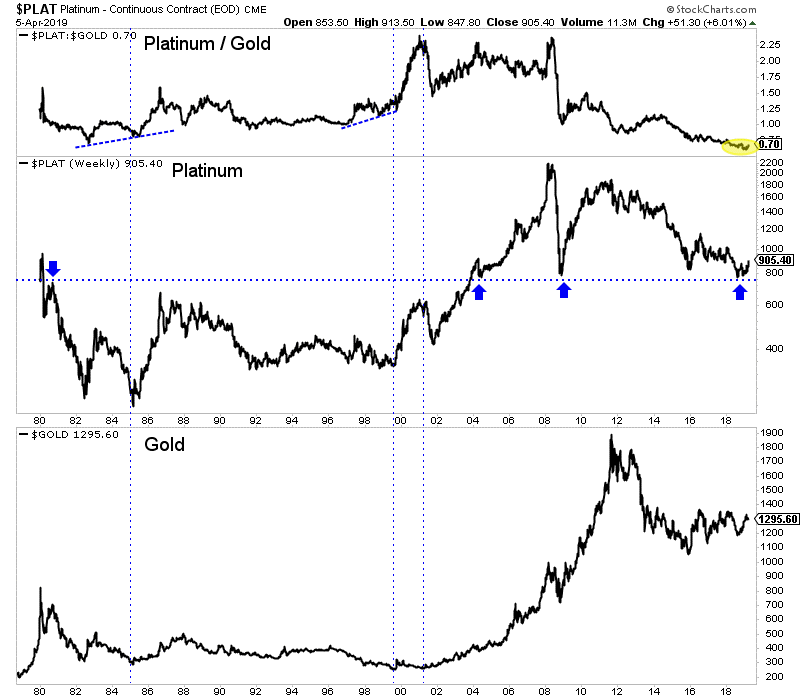
We also want to note the 1966-1968 period when Platinum tripled in price. Silver doubled and Gold of course was still fixed in price. In any event, Platinum’s huge move in the late 1960s was a leading indicator for Gold’s forthcoming surge.
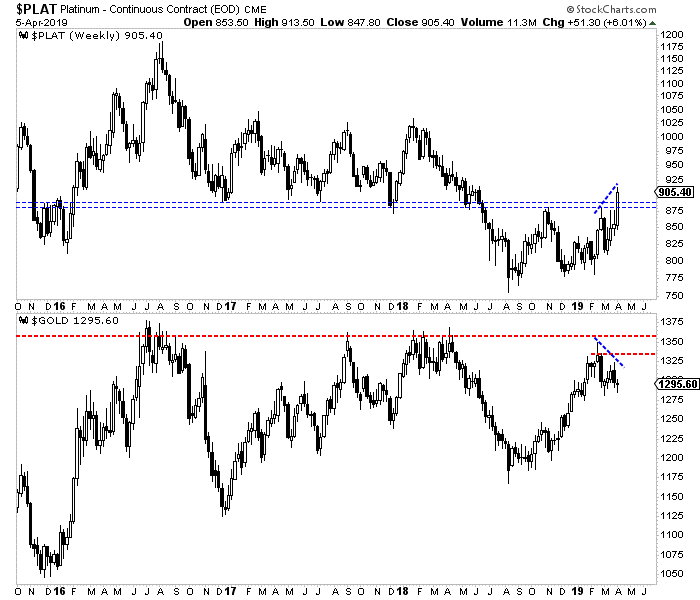
Since the February highs Platinum has made a higher high while Gold has corrected. Platinum looks like it has a reasonable shot to make a new 52-week high this year while Gold would need to fight through the wall of resistance to make a new 52-week high.
According to BMG Group, a study by Wainright Economics showed that Platinum is the leading indicator of inflation. While Gold and Silver lead by a year, Platinum leads by 16 months.
Whatever the reason, history is clear. Around major bottoms in precious metals, Platinum tends to outperform and lead Gold. Since February Platinum has strongly outperformed Gold while registering an important positive divergence.
We will certainly keep abreast of the other leading indicators such as relative performance of the miners, Fed policy, a steepening yield curve and precious metals performance against the stock market. We will also keep an eye on Platinum as continued outperformance would be a strongly bullish signal for Gold for 2020 and beyond.
The weeks and months ahead should continue to be an especially opportune time to position yourself in this sector. To learn what stocks we are buying and have 3x to 5x potential, consider learning more about our premium service.
April 11, 2019
Jordan Roy-Byrne
- Chinese economic growth is probably the main driver of both physical gold demand and the global bull market in stocks.
- Please click here now. I’m invested in China through ETFs, bank stocks, and… gold!
- With the possible exception of HSBC, most analysts in the West appear to be underestimating the resilience of a billion Chinese citizens working maniacally in the private sector.
- I’ll go even further than HSBC and predict that Chinese GDP growth could re-touch the 7% area if a trade deal is announced.
- Please click here now. Double-click to enlarge. The FXI-NYSE Chinese stock market ETF is breaking out of a powerful inverse H&S bottom pattern. The technical action fits with the growing GDP fundamentals, and key Chinese gold jewellery stocks are racing to fresh highs for the year.
- My guswinger.com leveraged ETF swing trade service focuses on YINN-NYSE for Chinese stock market action. YINN is a triple-leveraged ETF. Its price should soar if even a fraction of the positive Chinese growth scenario laid out by HSBC and myself comes to pass.
- Please click here now. Double-click to enlarge. While gold is doing extremely well so far in the weak demand season, a trade deal and/or a Chinese GDP surge could end this weak season earlier than usual.
- Most big bank analysts see gold at $1400 or higher within 12 months. That $1400 price would turn many gold miners into gargantuan cash cows.
- Mining stock dividends would soar and make global money managers embrace the sector in a much more consistent way than they have in the past.
- Please click here now. If Chinese growth can reach the 7% area, Indian growth should reach 8%. India’s central bank has started its own gold buy program and all the silly government attacks on the Indian gold sector have ended.
- Most gold analysts look for signs of a weakening global economy to propel gold higher. In contrast, I look for signs of strength in the private sector and signs of weakness in the US government sector. Both are present now.
- The U.S. government is a walking tombstone. Its debt cannot be paid. It’s a gargantuan glutton that is clearly out of control. The government and its central bank recklessly smash savers by demanding ultra-low rates and QE. It does so because its own grotesque appetite for borrowed money is insatiable.
- Interestingly, Trump has just nominated gold standard enthusiast Herman Cain as a potential Fed governor. Trump says that Herman “gets it”.
- Does Trump mean Herman understands that only a gold standard can end the insane growth of the U.S. government?
- I think so. The current bottom line for gold is that all Chindian growth lights are green and all U.S. government debt lights are red. This is the perfect environment for creating rallies in the gold price that are sustained.
- Please click here now. Double-click to enlarge. The price action of the TLT-NYSE bond market ETF supports my theme of strength in global stock markets and gold, and weakness in bonds.
- Sometimes gold rallies when interest rates decline and sometimes it rallies when they rise. If there’s enough fear in either scenario, gold will rally strongly.
- Gold soared in 2009 after rates were dramatically lowered with QE and fear of system collapse was rampant.
- Gold soared in 1979 as rates went ballistic and fear of hyperinflation was rampant.
- Libertarians are obviously eager to watch the U.S. government incinerate in a rocketing rates bond market fireball, but I think the coming swoon in bond prices will be more mundane.
- Simply put, the U.S. government debt fireball lies ahead, but in the medium-term gold is likely to rally to $1400 mostly because of the fundamentals of strong Chinese growth.
- Please click here now. Double-click to enlarge this solid-looking GDX chart.
- I’ve been adamant that the weak season sideways action for GDX and associated miners won’t end until there’s a Friday close of $23 or better.
- Will this be the week that it happens? Well, it feels imminent and the good news for investors is that the symmetrical triangle now in play for GDX has an upside price target of about $26!
Special Offer For Website Readers: Please send me an Email to freereports4@gracelandupdates.com and I’ll send you my free “The Golden Surge!” report. I highlight eight key gold and silver miners with similar technical patterns to GDX that can stage much bigger rallies as GDX breaks out to upside!
Stewart Thomson
Graceland Updates
Written between 4am-7am. 5-6 issues per week. Emailed at approx 9am daily.
Email:
Risks, Disclaimers, Legal
Stewart Thomson is no longer an investment advisor. The information provided by Stewart and Graceland Updates is for general information purposes only. Before taking any action on any investment, it is imperative that you consult with multiple properly licensed, experienced and qualified investment advisors and get numerous opinions before taking any action. Your minimum risk on any investment in the world is: 100% loss of all your money. You may be taking or preparing to take leveraged positions in investments and not know it, exposing yourself to unlimited risks. This is highly concerning if you are an investor in any derivatives products. There is an approx $700 trillion OTC Derivatives Iceberg with a tiny portion written off officially. The bottom line:
Are You Prepared?
The gold miners’ stocks are still marching, grinding higher on balance in a solid upleg. While interest in this sector has faded since late February, it is nicely set up for a strong rally. After consolidating high and establishing a sturdy base, the gold miners are likely to soon report greatly-improved first-quarter results. Couple that with gold itself powering higher, and the slumbering gold stocks should surge substantially.
The gold stocks are mired in something of a psychological limbo these days. They aren’t exactly out of favor, but there’s little enthusiasm for this sector. Investors and speculators have largely lost interest for technical, sentimental, and fundamental reasons. It’s been 6 weeks since this gold-stock upleg surged to material new highs. The major gold miners have been mostly grinding sideways since, consolidating and basing.
Contributing heavily to traders’ apathy is gold’s own price action in that recent span. Gold overwhelmingly drives gold-mining profits, making these stocks leveraged plays on gold. Gold’s own latest upleg high of $1341 came back in mid-February right before gold stocks topped. Over the next 12 trading days gold fell 4.1% to $1285 during its usual pre-spring-rally-pullback period. Slumps invariably sap traders’ enthusiasm.
Gold’s seasonal spring rally launched right on schedule after that. By late March this metal had gained back 2/3rds of its pullback losses. The gold stocks surged right back up to challenge their late-February highs on that, but couldn’t break out decisively. Then gold rolled over again during these last couple weeks, revisiting those pre-spring-rally lows. That spooked gold-stock traders, so they sold in sympathy.
Gold’s problem is the great complacency and euphoria spewing forth from the massive rally in the general stock markets. Largely in Q4, the flagship S&P 500 broad-market stock index (SPX) plunged 19.8% from an all-time record peak to deep near-bear lows. But since then it has soared 22.2% higher in what looks like a monster bear-market rally. The SPX has regained an incredible 9/10ths of its severe-correction loss!
Gold is the ultimate portfolio diversifier, tending to rally when stock markets fall. Gold investment demand surges as traders rush to diversify stock-dominated portfolios. December was a key case in point, as gold powered 4.9% higher while the SPX plunged 9.2%. But complacency mushrooms after stock markets rally strongly, and prudent money management is quickly forgotten. So capital inflows into gold wither again.
While sideways-at-best technicals and deteriorating sentiment are the main reasons this gold-stock upleg has stalled, fundamentals played a role too. The major gold miners of the leading gold-stock investment vehicle, the GDX VanEck Vectors Gold Miners ETF, reported their Q4’18 operating and financial results between early February to mid-March. And they proved fairly lackluster due to lower prevailing gold prices.
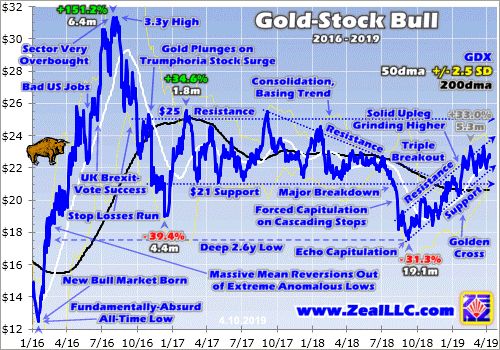
Yet despite these considerable headwinds, the gold stocks are still marching higher on balance. This chart looks at GDX over the past several years or so. Despite the apathy traders feel, this young gold-stock upleg remains solid. The gold miners’ stocks are still gradually grinding higher in a well-defined uptrend channel. They are well-positioned to surge on any good news, which is likely right around the corner.
While indifference reigns in this small contrarian sector today, that’s actually a major improvement! Back in early September GDX plunged to a deep 2.6-year secular low. Gold stocks had just been crushed on cascading selling as stop losses were sequentially tripped. That brutal forced capitulation was the direct result of gold getting hammered by all-time-record gold-futures short selling. This sector was loathed then.
Those extreme gold-stock lows weren’t fundamentally righteous, so a big mean-reversion rebound higher was inevitable. That very week in my essay I argued “The technicals and sentiment spawned by capitulations are so extreme they usually birth massive uplegs and entire bull markets.” As contrarians we aggressively bought gold stocks and recommended our newsletter subscribers load up near those lows.
The gold stocks indeed bounced and started recovering, gradually fleshing out the solid uptrend channel in this chart. GDX rallied to cross multiple major technical milestones. A simultaneous triple breakout above three major resistance zones was soon followed by a major Golden Cross buy signal. Triggered by a 50-day moving average climbing back above a 200dma after a major low, these herald big runs higher.
GDX rallied 33.0% over 5.3 months, regaining recent years’ large consolidation trend between $21 support and $25 resistance. At its recent highs of $23.36 on February 20th and $23.35 on March 26th, GDX edged into the upper half of this range for the first time in 12.6 months! The best gold-stock levels in over a year were something to celebrate, technical proof things are changing in this long-neglected sector.
Even better, GDX leveraged gold’s own gains over this upleg-to-date span by 2.8x. That’s strong, on the high side of the usual historical 2x-to-3x range. Gold-stock gains hadn’t outpaced gold’s to such a degree in years, yet again showing this gold-stock upleg is impressive and robust. GDX’s recent high consolidation was just a normal and healthy mid-upleg drift entirely within its uptrend channel, nothing to fear.
Uplegs naturally flow and ebb, surging two steps higher before slumping one step back. This rhythm is essential to keep sentiment balanced, which helps maximize uplegs’ ultimate durations and gains. Once gold stocks blast higher fast enough to rekindle greed, that has to be bled away by subsequent selloffs or drifts. Without these retreats, too much buying too fast burns out uplegs prematurely truncating their potential.
So technically the major gold stocks are looking a lot better today than most traders give them credit for. The consolidating pullback since late February has done its work brilliantly, heavily dampening sentiment while gold-stock prices remain relatively close to upleg highs. Without this critical perspective, it’s not too surprising traders are so indifferent. But enthusiasm can return fast with the right catalyst, and some are coming.
Without any doubt gold stocks will catch a strong bid when gold’s spring rally resumes. In December as gold rallied 4.9% while the stock markets burned, GDX blasted 10.5% higher. In late January gold surged 3.1% higher in a week, fueling GDX soaring 10.7% in that short span! All gold-stock traders really care about is gold, and rightly so. Once gold gets moving again, the gold stocks are going to surge sharply higher.
There are two big catalysts that could start pushing gold considerably higher any day now. Gold-futures speculators drive much of gold’s short-term price action, and closely watch the US dollar’s fortunes for trading cues. The US Dollar Index (USDX) hit a major 20.5-month high in early March, and is likely to roll over soon. The Fed just kneecapped the US dollar by slashing its rate-hike outlook and prematurely killing QT!
Any meaningful dollar selling will drive big gold-futures buying, pushing the yellow metal higher. A good example of this just happened in mid-March. After hitting that major high, the USDX retreated 1.8% over the next couple weeks or so. Gold bottomed the very day the dollar topped, then rallied 2.2% in that span on gold-futures buying. GDX amplified that with a solid 3.9% advance. Gold stocks rally on a weaker dollar.
The US stock markets are way overextended and overvalued, also ready to roll over imminently. This week the monster likely-bear rally in the SPX had carried it back within just 2.0% of late September’s all-time record peak! But such lofty levels aren’t fundamentally-justified. The 500 elite SPX stocks left March trading at average trailing-twelve-month price-to earnings ratios way up at 26.4x, near bubble territory.
And even the Wall Street perma-bulls universally expect SPX earnings growth to be flat at best in 2019. This is a colossal slowdown from 2018’s 20%+ driven by Republicans’ massive corporate tax cuts. Very-expensive valuations aren’t sustainable without surging profits. As the general stock markets start selling off again, investors will resume returning to gold. Their capital inflows will drive its price higher, boosting the miners.
A great proxy for gold investment demand is the physical gold bullion held in trust for shareholders of the world’s largest and dominant gold ETF, the GLD SPDR Gold Shares. Back in early October with the SPX still just under record highs and complacency extreme, GLD’s holdings fell to a deep 2.6-year secular low. They started climbing again the very day the SPX first plunged, as American stock investors remembered gold.
Their big differential-buying pressure on GLD’s shares drove its holdings up 12.8% to 823.9 metric tons by late January. That helped push gold 8.9% higher over that span, which GDX leveraged with a nice 17.8% gain. Gold buying, whether from gold-futures speculators watching a flagging USDX or American stock investors worried about a rolling-over SPX, will push its price higher. That will bring traders back to gold stocks.
Gold’s upleg resuming is the key to reigniting gold stocks’ own upleg. But the major gold miners’ nearing Q1’19 earnings season should provide further fundamental justification for big gold-stock buying. Odds are their results will show big improvements over Q4’18, which should catch investors’ and speculators’ attention and entice them back. The main reason is higher prevailing gold prices really boosting earnings.
Every quarter I dive deeply into the major gold miners’ latest fundamentals. Several weeks ago I looked at the just-reported Q4’18 results from the top 34 GDX components. Those were lackluster, with lower production, higher costs, and lower prevailing gold prices. While gold averaged $1228 per ounce in Q4, the major gold miners’ average all-in sustaining costs rose to $889 per ounce. Profits were the difference at $339.
Q1 is going to look far better, which most gold-stock traders likely haven’t figured out yet given the apathy for this drifting sector. Thanks to the SPX’s severe near-bear correction largely in Q4, resurgent gold investment demand catapulted it a major 6.2% higher quarter-on-quarter to average over $1303 in Q1. The considerably-higher prevailing gold prices should combine with flat-to-lower AISCs to greatly boost earnings.
All-in sustaining costs generally don’t change much regardless of gold’s action. They are largely fixed as mines are being planned. Operating them generally requires similar levels of spending on infrastructure and employees quarter after quarter. Over the past 4 quarters, the GDX-top-34 gold miners’ AISCs have averaged $884, $856, $877, and $889 per ounce. That works out to a tight mean of $877, close to $875.
If the major gold miners produced gold last quarter at $877 per ounce, that implies $426 profits given the $1303 average prevailing gold prices in Q1. That would make for utterly-enormous 25.7% QoQ growth in gold-mining profits! Such massive earnings growth would really catch investors’ attention, especially with general stocks’ profits expected to be flat at best. Gold-stock fundamentals radically improve with higher gold.
And all this is happening during one of gold stocks’ strongest times of the year seasonally, their powerful spring rally. I explained this next chart in depth about a month ago in my latest spring-rally essay, and it’s important to remember. Gold stocks have powered sharply higher on average between mid-March to early June in modern bull-market years. We’re talking 12.2% average gains in the benchmark HUI gold-stock index!
Not only is gold stocks’ spring rally underway, but it’s this sector’s second-strongest seasonal advance of the year. Even if much-stronger fundamentals weren’t likely, even if gold wasn’t due to continue powering higher on a weakening U.S. dollar and rolling-over stock markets, gold stocks tend to rally considerably in the spring. Greatly-improving earnings and stronger gold prices will really amplify this seasonal strength.
Strong seasonals act like tailwinds, boosting gold-stock uplegs fueled by improving technicals, sentiment, and fundamentals. When all these forces align, the gold-stock gains can be enormous. The last major spring rally happened in 2016, part of a monster gold-stock upleg where GDX skyrocketed 151.2% higher in just 6.4 months driven by a parallel strong gold upleg. GDX blasted 37.7% higher in that spring-rally span!
Although traders’ apathetic view on gold stocks in recent weeks is understandable, it isn’t justified at all. This sector has big potential to run much higher in the next couple months, which most traders aren’t yet ready for. The time to get deployed is of course before gold stocks surge higher again, when they can still be bought at relatively-low prices. This consolidation-drift window won’t last long, as gold is due to rally.
While investors and speculators can ride gold stocks’ next move higher in GDX, that is suboptimal. The largest gold miners dominating its weightings are really struggling with depleting production, retarding this entire ETF’s upside potential. Far-better gains will be won in the smaller mid-tier and junior gold miners. Plenty of them have superior fundamentals to the large majors, growing their outputs and driving down costs.
One of my core missions at Zeal is relentlessly studying the gold-stock world to uncover the stocks with superior fundamentals and upside potential. The trading books in both our popular weekly and monthly newsletters are currently full of these better gold and silver miners. Mostly added in recent months as gold stocks recovered from deep lows, our unrealized gains are already running as high as 66% this week!
To multiply your capital in the markets, you have to stay informed. Our newsletters are a great way, easy to read and affordable. They draw on my vast experience, knowledge, wisdom, and ongoing research to explain what’s going on in the markets, why, and how to trade them with specific stocks. As of Q4 we’ve recommended and realized 1076 newsletter stock trades since 2001, averaging annualized realized gains of +16.1%! That’s nearly double the long-term stock-market average. Subscribe today for just $12 per issue!
The bottom line is gold stocks are still marching higher despite the pall of apathy hanging over them. This upleg that excited traders back in February remains intact, with this sector simply pulling back within its uptrend. That has rebalanced sentiment, bleeding away greed. This basing has left gold stocks ready to rally to new upleg highs again, fueled by better gold prices greatly improving gold-mining fundamentals.
Gold-mining earnings are set to surge quarter-on-quarter due to gold’s own upleg powering higher. It too is on the verge of accelerating again as buyers return. A weaker U.S. dollar and rolling-over stock markets will motivate speculators and investors to buy gold again. And naturally the gold miners’ stocks will really leverage those gains like usual. Especially this time of year in the midst of their strong spring-rally season.
Adam Hamilton, CPA
April 9, 2019
Copyright 2000 – 2019 Zeal LLC (www.ZealLLC.com)
- There’s a time for gold stocks to rally… and a time for consolidation and retracement. Please click here now. We have joy, we have fun, we have gold price seasonality in the sun?
- To view seasonality on the daily gold chart, please click here now. Double-click to enlarge.
- The COMEX price of gold is determined mainly by commercial bank traders and hedge funds reacting to physical market supply versus demand. Currently, mine supply is relatively constant, central banks are net buyers, and the scrap market is stable.
- With supply essentially fixed, the seasonal ebb and flow of demand is mainly what moves the price.
- Roughly speaking, physical market demand strengthens from August until February and it weakens from February to August.
- It’s April now, so higher price enthusiasts need patience.
- Events related to the “fear trade” in the West can upset the seasonality apple cart, but a U.S.-China trade deal seems imminent, there is still some time left in the U.S. business cycle’s bull run, and the Fed’s recent actions are likely to reinvigorate stock buybacks.
- Unfortunately, in the short and medium term, there’s not much related to the Western fear trade that would “juice” gold ETF or COMEX contract demand enough to make up for the current seasonal physical market slackness.
- Trump is a business-oriented president, and the private sector in America is quite healthy. He’s supporting that health. In contrast, the government sector (in America and most of the Western world) is a horrifying mess.
- Trump, like his presidential predecessors, has lorded over a massive rise in government spending and debt. Unfortunately for Trump, he just happens to be president when the government’s ability to borrow ever-more money will soon meet a brick wall. Legendary hedge fund manager Ray Dalio believes the government may have only two years of “sand in the hourglass” before the demand for U.S. T-bonds fails to match the supply.
- I’ve suggested the U.S. government could stagger forwards for another 3-4 years before a bond market supernova event occurs. Regardless, the bottom line is that the next financial markets meltdown is set to be a government crisis much more than a private sector crisis. The government’s dollar is like a corporation’s stock, and it will burn as its bond market burns.
- I’ve also predicted that unlike the late 1930s crisis that was followed by U.S. war with Germany, Japan, and Italy, this crisis could cause a war within America, pitting the rich against the poor. It could get quite ugly, especially for citizens with no gold.
- An institutional gold buying frenzy would occur in even the mildest version of this projected scenario. A collapse of the U.S. bond market would smash other Western government bond markets too.
- In a government bond market crisis, all roads lead to gold!
- Also, QE doesn’t work in this type of crisis, because it’s no longer a booster shot for private sector stocks, businesses, and bonds.
- In 2008-2014, QE was mostly deflationary. When it’s used again, it will be used to fill a demand gap for government bonds. In that situation, QE is highly inflationary and could even become “hyperinflationary”.
- Please click here now. Double-click to enlarge this GDX chart. The weak demand season for gold has only been underway since February, so patience is required.
- Regardless, the price action of GDX and its leading component stocks has been impressive. Most of the strong season gains are holding and the price action is essentially sideways now.
- More “bump and grind” trading is expected but the gold mining stocks market is generally very healthy.
- How should investors deal with the weak demand season for gold in regards to GDX and gold stocks in general? Well, for one possible solution, please click here now. Double-click to enlarge this hourly bars swing trades chart for GDX.
- My guswinger.com trade alert service can help investors ease the weak season doldrums. I use triple-leveraged ETFs like NUGT, JNUG, DUST, & JDST… so nobody gets bored! I also take all the trades myself, but only after I send them by cell phone text and email to all the happy subscribers.
- I also recommend items like bitcoin (which is up about 15% this morning), and I’m introducing bond market trades for my main gracelandupdates.com newsletter. That’s partly to get everyone ready for the coming U.S. government bond market supernova explosion. It’s also to help investors understand the more mundane bond market price drivers so they get modestly and consistently richer while waiting for “the big bang”.
- Please click here now. Double-click to enlarge. TLT-NYSE is a bond market ETF. The next signal will be a sell, which means interest rates will rise in the short term. That’s likely because institutional investors see a U.S.-China trade deal as imminent, and so they are moving money from bonds to stocks.
- Because investors are taking more risk now, fear trade demand for gold is softening at a time when love trade demand is seasonally soft. This is just short-term noise. A bond market supernova event lies ahead. During normal times, higher rates are usually mildly negative for gold. During extraordinary times featuring a U.S. government bond market wipeout, rates soar but an institutional buying frenzy means that gold market investors need to prepare for vastly higher prices!
Special Offer For Website Readers: Please send me an Email to freereports4@gracelandupdates.com and I’ll send you my free “Riding The Range!” GDXJ and SILJ report. I highlight how to play the weak season range for these ETFs and for six exciting junior miners!
Stewart Thomson
Graceland Updates
Email:
Stewart Thomson is a retired Merrill Lynch broker. Stewart writes the Graceland Updates daily between 4am-7am. They are sent out around 8am-9am. The newsletter is attractively priced and the format is a unique numbered point form. Giving clarity of each point and saving valuable reading time.
Risks, Disclaimers, Legal
Stewart Thomson is no longer an investment advisor. The information provided by Stewart and Graceland Updates is for general information purposes only. Before taking any action on any investment, it is imperative that you consult with multiple properly licensed, experienced and qualified investment advisors and get numerous opinions before taking any action. Your minimum risk on any investment in the world is: 100% loss of all your money. You may be taking or preparing to take leveraged positions in investments and not know it, exposing yourself to unlimited risks. This is highly concerning if you are an investor in any derivatives products. There is an approx $700 trillion OTC Derivatives Iceberg with a tiny portion written off officially. The bottom line:
Are You Prepared?
Stop me if you’ve heard this before. Precious Metals disappointed again.
The miners were leading the metals but the metals broke down from bear flag patterns and that took the miners lower, suggesting an interim top is in place.
The technicals suggest weakness could be ahead for the sector but the fundamentals are finally turning bullish.
Before we get to fundamentals, let’s look at the technicals. The weekly candle chart of GDX and GDXJ is below.
After last week’s failure to break weekly resistance, GDX now has resistance at $23 and GDXJ has resistance at $34.
The near-term trend is probably lower but if the Fed is going to cut rates later this year, I’d expect the miners to eventually make a higher low which could also look like the right shoulder of an irregular head and shoulders bottoming pattern.
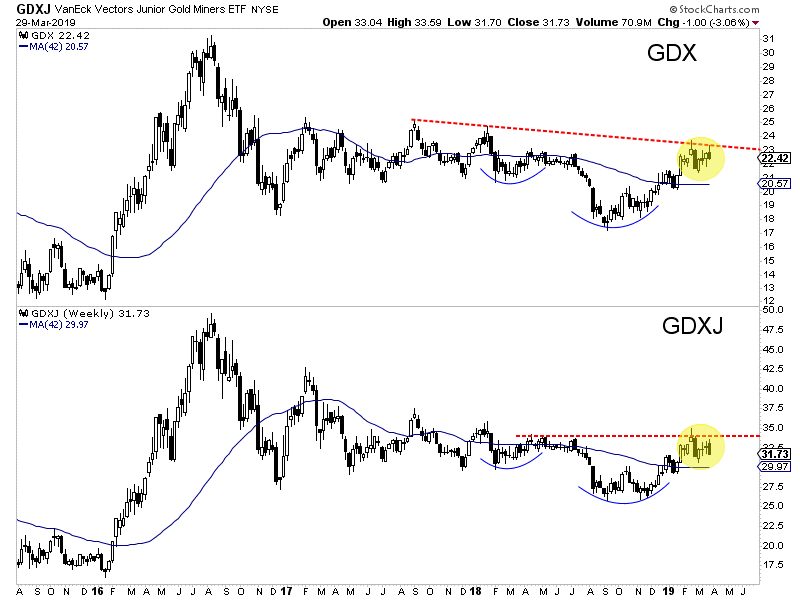
As we noted last week, it wasn’t until after the first rate cut (in the previous two occurrences) that precious metals began to outperform.
The chart below shows the pattern that leads to strong performance in gold stocks. The 2-year yield starts to decline, the Fed pauses, the yield curve steepens, the Fed cuts and then gold stocks perform.
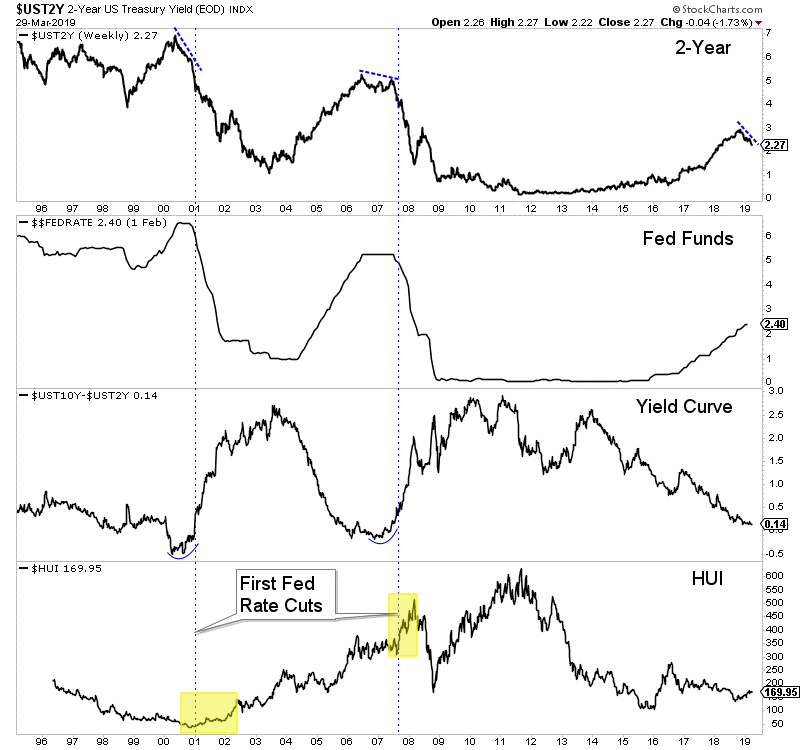
With the current context and history, we can make the case that gold stocks and Gold will not officially move into a bull market until the Fed makes its first rate cut. Fed funds futures are now essentially discounting a rate cut by December and showing nearly a 30% chance of two rate cuts by January 2020.
Bonds are overbought (and yields are oversold) and so these markets could see a counter trend move which would align with weakness in precious metals.
However, precious metals bulls should not be dissuaded by weakness as a rate cut is likely coming within the next 12 months and probably sooner. The weeks and months ahead could prove to be an especially opportune time to position in advance of the first cut and a confirmed new bull market in gold stocks. To learn what stocks we are buying and think have 3x to 5x potential, consider learning more about our premium service.
April 3, 2019
Jordan Roy-Byrne
- Please click here now. Double-click to enlarge this long-term gold chart. Fundamental and technical analysis are both strongly supporting gold’s rally towards the key $1400 area.
- Having said that, COMEX price action mainly reflects action in the physical market and this is the weak season for gold.
- Investors need patience. News in the West that “should” push gold $100/ounce higher is in play, but modest physical market demand in China and India means that rallies are modest.
- Please click here now. If this news was happening during the Chinese New Year Jan-Feb peak physical demand time frame, gold would be staging a “barn burner” rally.
- Instead, it’s contained in a $1280-$1350 consolidation range.
- Please click here now. Double-click to enlarge this daily gold chart.
- The bottom line: Gold is on a journey to the $1400-$1420 price zone, but it’s not a rocket ride. It’s more of what I call a “bull era plod”.
- The other fact to keep in mind is that the inversion of the US yield curve with artificially low rates isn’t suggesting that American economic growth is “cratering”.
- Growth is slowing down, but it’s too early to predict that a recession is imminent. A US-China trade deal could provide some medium-term support for stock markets without being negative for gold.
- Central bank gold accumulation is another positive factor, but it’s currently only about 50-60 tons a month. In the weak season Chindian demand often drops from 200+ tons a month to about 60-80.
- Central bank and Western fear trade demand is decent, but isn’t making up for the shortfall caused by the drop in Chindian demand. That’s being reflected in commercial trader action on the COMEX.
- Gold is rallying strongly from the $1280 zone because Chindian dealers are buyers there. They are fading their buying in the $1310-$1320 area, leaving Western money managers to do the heavy lifting. That’s no easy task with Chindia quiet.
- To put it simply, Western financial news is gold-supportive in content, but until Chindian buying resumes in size gold will be more of a trader’s market than the start of a “huge bull run”.
- The good news is that $1280-$1350 gold is a great price for the miners, and many are surging to one fresh high after another!
- Please click here now. Double-click to enlarge this fabulous GDX chart.
- I’ve suggested that a Friday close of $23 or higher for GDX and $14 for Barrick (GOLD-NYSE) would open the door to a much more significant rally for most gold and silver mining stocks.
- GDX closed above $23 yesterday and Barrick closed above $14. It’s not Friday yet, but this is a very positive sign!
- I don’t expect gold to move above $1350 until Chindian demand begins to strengthen in August… unless there’s a major economic shock in the West.
- Having said that, when it does rise to $1400-$1420, I expect a massive bull run to occur in the miners.
- The logic for this outlook is that most analysts have underestimated the profits that miners will make at $1400+, and global stock markets are likely to swoon again in the Aug-Oct crash season.
- In Sept 2018, gold was in the $1200 range. If it is in the $1400 area in Sept 2019 with stock markets swooning, institutional money managers could engage in a gold stock buying frenzy!
- A September rate cut from the Fed to calm the panic would likely enhance the frenzy.
- Please click here now. Double-click to enlarge this silver stock ETF chart.
- Note the recent rise of the key TRIX indicator above the zero line. That’s the sign of a technically healthy market. A sustained bull run for silver stocks would be signalled by a Friday SIL-NYSE close above $30!
Special Offer For Website Readers: Please send me an Email to freereports4@gracelandupdates.com and I’ll send you my free “Barrick & Agnico Lead The Juniors Higher!” report. I highlight money making tactics for Barrick, Agnico, and key juniors that are joining the upside fun!
Thanks!!
Cheers
Stewart Thomson
Email:
Graceland Updates daily between 4am-7am. They are sent out around 8am-9am. The newsletter is attractively priced and the format is a unique numbered point form. Giving clarity of each point and saving valuable reading time.
Risks, Disclaimers, Legal
Stewart Thomson is no longer an investment advisor. The information provided by Stewart and Graceland Updates is for general information purposes only. Before taking any action on any investment, it is imperative that you consult with multiple properly licensed, experienced and qualified investment advisors and get numerous opinions before taking any action. Your minimum risk on any investment in the world is: 100% loss of all your money. You may be taking or preparing to take leveraged positions in investments and not know it, exposing yourself to unlimited risks. This is highly concerning if you are an investor in any derivatives products. There is an approx $700 trillion OTC Derivatives Iceberg with a tiny portion written off officially. The bottom line:
Are You Prepared?
Since last spring we’ve written over and over again about a Fed rate cut being the catalyst for a bull move in gold stocks.
The history is almost bulletproof. Many lows in gold stocks over the past 60 years coincided with the end of rate hikes.
At present the Federal Reserve is in pause mode and the market is on the cusp of pricing in a rate cut. Friday, Fed funds futures showed a 56% chance of a rate cut by January 2020.
However, precious metals have yet to make new 52-week highs. The gold stocks (GDX & GDXJ) are much closer to doing so than the metals.
Simply waiting for the Fed to cut rates risks missing out on some upside. As market timers, we have to anticipate it.
Is there a leading indicator for the Fed moving from a pause to a cut?
Take a look at the chart below in which we plot data from the last two instances of new rate cut cycles: 2001 and 2007. The vertical lines highlight the Fed’s first cut in those two cycles.
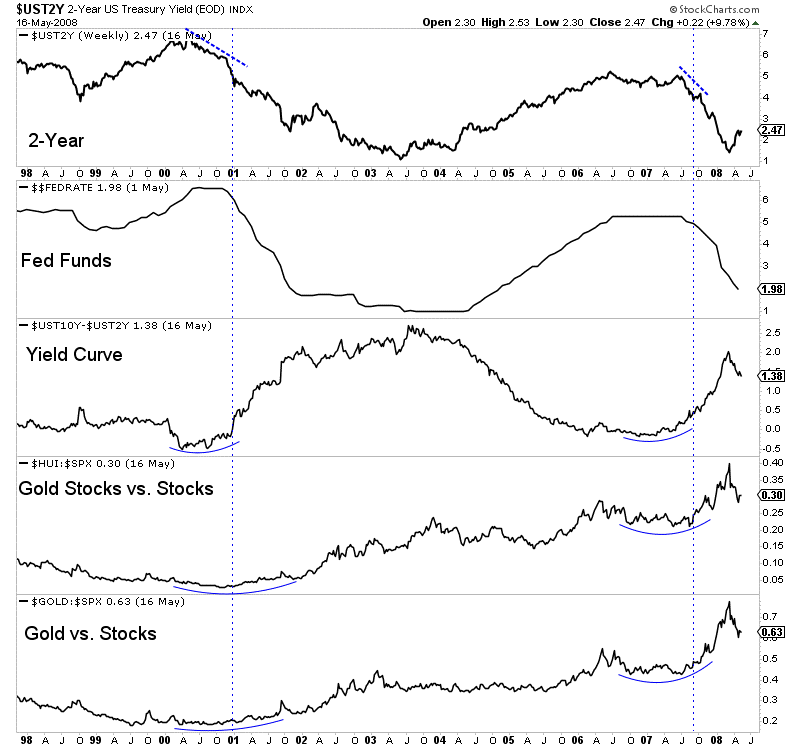
There are several observations to make.
First, Gold and gold stock relative performance accelerated after the rate hikes.
Second, the 10-year and 2-year yield spread began to steepen prior to that outperformance and prior to the rate cuts. And that’s because the 2-year yield, which is a proxy for the Fed funds rate, was trending lower in advance of the first cut.
In short, the sharp decline in the 2-year yield preceded the Fed moving from a pause to a cut. Prior to both the 2001 and 2007 cuts, the 2-year yield had declined by over 1%.
How does this compare to today?
The yield curve has yet to steepen and precious metals have not begun or confirmed outperformance against the stock market.
However, the positive sign for precious metals is the 2-year yield has already declined from nearly 3% down to 2.24% as we pen this.
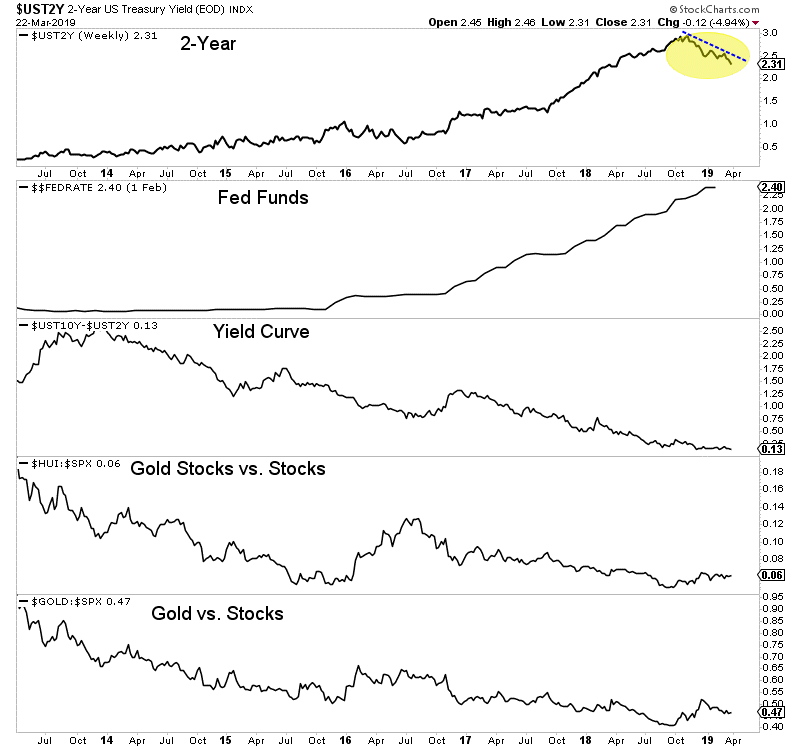
Every cycle is different and each has its own nuances but we cannot ignore the current decline in the 2-year yield. The closer it gets to 2.00%, the more the market will price in a rate cut.
With its decline to 2.24% today (Monday) the market has now priced in a 73% chance of a rate cut by January 2020. Not surprisingly, precious metals are trading higher.
If the 2-year yield continues to decline then precious metals (and gold stocks especially) should build more and more evidence that they are in a new bull market. To learn what stocks we are buying and think have 3x to 5x potential, consider learning more about our premium service.
Here are today’s videos and charts (double-click to enlarge):
SFS Key Charts, Signals, & Video Analysis
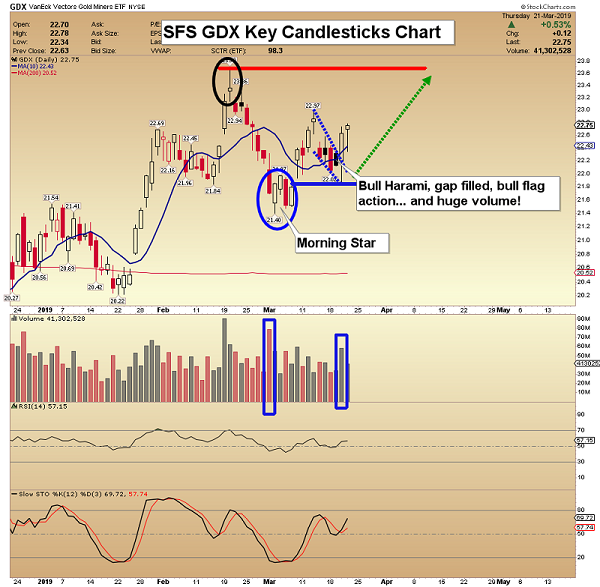
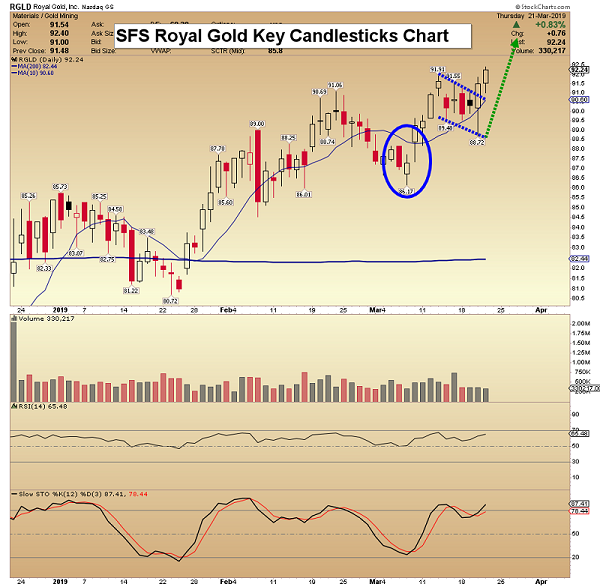
SF60 Key Charts, Signals, & Video Analysis
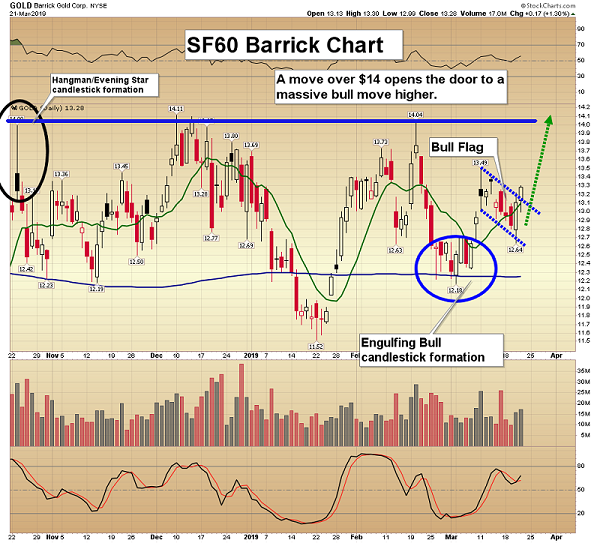
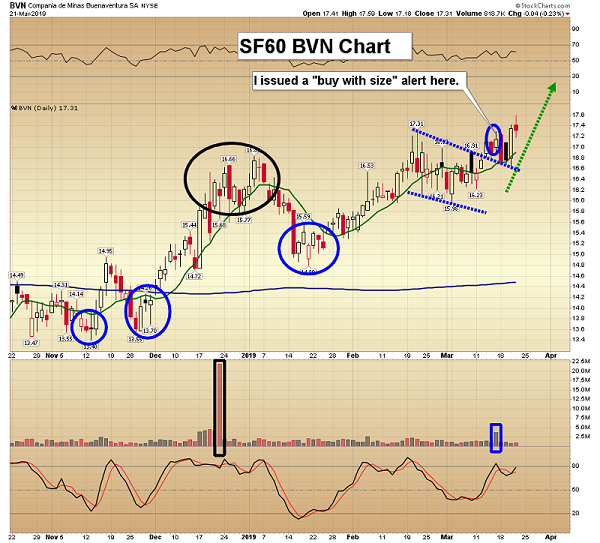
SF Trader Key Charts, Signals, & Video Analysis
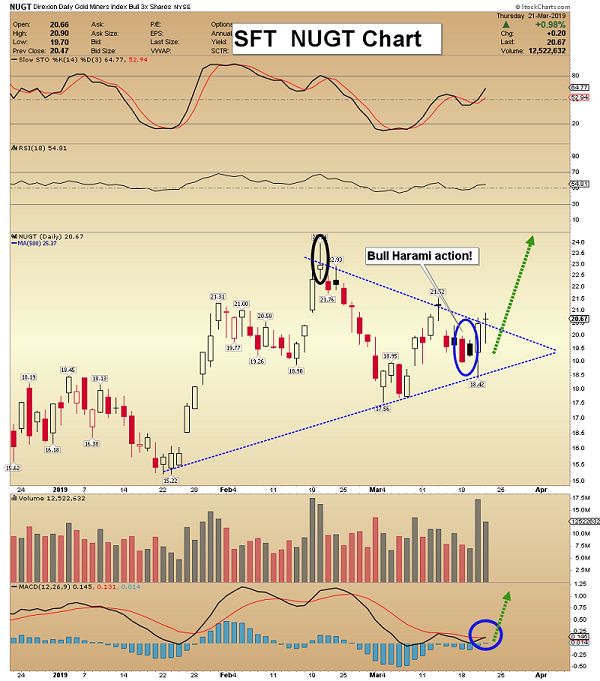
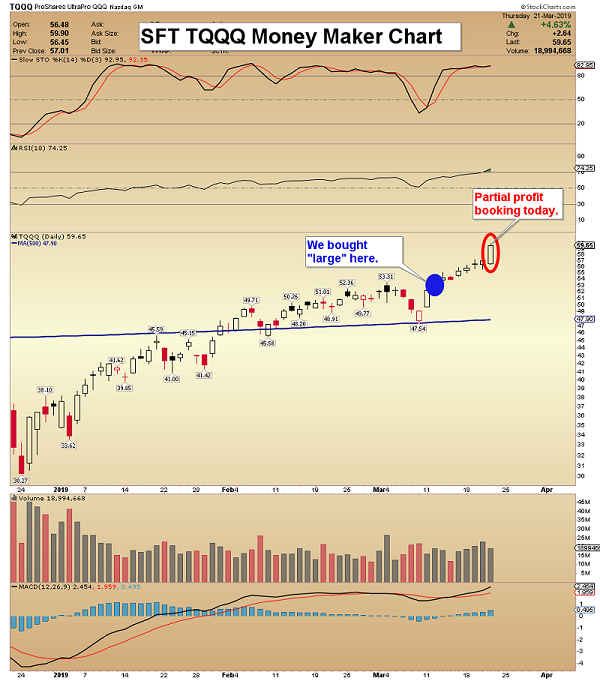
SFJ Key Charts, Signals, & Video Analysis
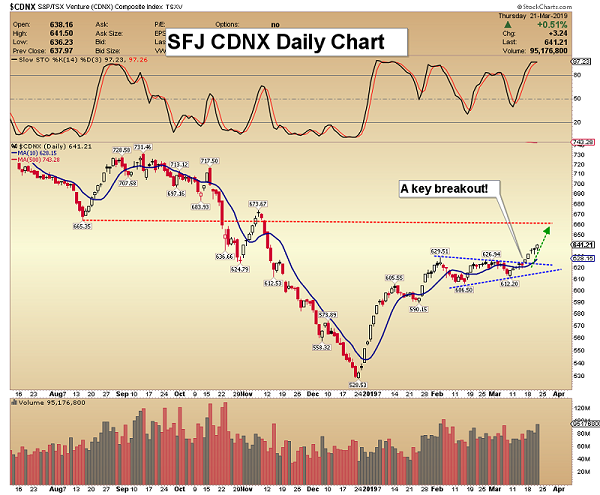
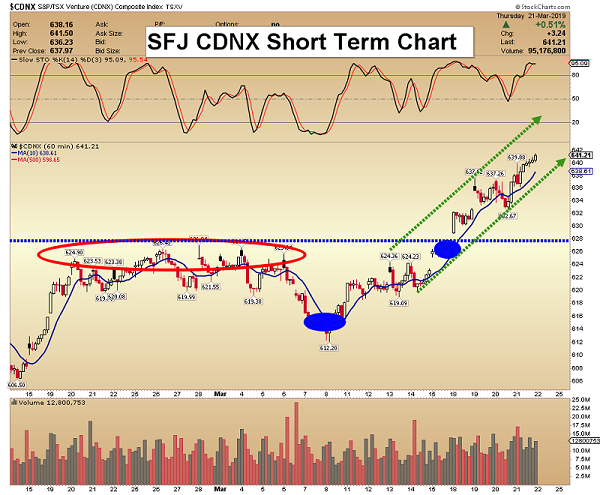
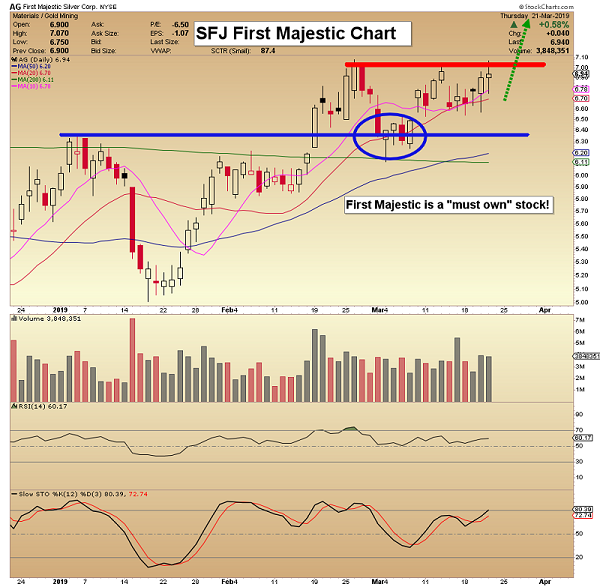
March 26, 2019
Morris Hubbartt
Unique Introduction For Website Readers: Send me an email to signals@superforcesignals.com and I’ll send you my free “Candlesticks Of Thunder!” junior gold stocks video report. I’ll also include 3 of my next Super Force Surge Signals free of charge, as I send them to paid subscribers. Thank you!
Stay alert for our Super Force alerts, sent by email to subscribers, for both the daily charts on Super Force Signals at www.superforcesignals.com and for the 60 minute charts at www.superforce60.com
About Super Force Signals:
Our Super Force signals are created thru our proprietary blend of the highest quality technical analysis and many years of successful business building. We are two business owners with excellent synergy. We understand risk and reward. Our subscribers are generally successful business owners, people like yourself with speculative funds, looking for serious management of your risk and reward in the market.
Frank Johnson: Executive Editor, Macro Risk Manager.
Morris Hubbartt: Chief Market Analyst, Trading Risk Specialist.
Email:
The mid-tier gold miners’ stocks have been rallying on balance in recent months, carving a solid young upleg. They’ve mostly finished reporting their latest fourth-quarter results, revealing how they are faring fundamentally. Their operating and financial performance is very important for investors, as the mid-tier realm is where most of the gold-stock sector’s gains accrue. They fared really well in a challenging quarter.
Four times a year publicly-traded companies release treasure troves of valuable information in the form of quarterly reports. Required by the U.S. Securities and Exchange Commission, these 10-Qs and 10-Ks contain the best fundamental data available to traders. They dispel all the sentiment distortions inevitably surrounding prevailing stock-price levels, revealing corporations’ underlying hard fundamental realities.
While 10-Qs with filing deadlines of 40 days after quarter-ends are required for normal quarters, 10-K annual reports are instead mandated after quarters ending fiscal years. Most gold miners logically run their accounting on calendar years, so they issue 10-Ks after Q4s. Since these annual reports are larger and must be audited by independent CPAs, their filing deadlines are extended to 60 days after quarter-ends.
The global nature of the gold-mining industry complicates efforts to gather this all-important fundamental data. Many mid-tier gold miners trade in Australia, South Africa, Canada, the United Kingdom, and other countries with quite-different reporting requirements. These include half-year reporting rather than quarterly, long 90-day filing deadlines after year-ends, and dissimilar presentations of operating and financial results.
The definitive list of mid-tier gold miners to analyze comes from the GDXJ VanEck Vectors Junior Gold Miners ETF. Despite its misleading name, GDXJ is largely dominated by mid-tier gold miners and not juniors. GDXJ is the world’s second-largest gold-stock ETF, with $4.1b of net assets this week. That is only behind its big-brother GDX VanEck Vectors Gold Miners ETF that includes the major gold miners.
Major gold miners are those that produce over 1m ounces of gold annually. The mid-tier gold miners are smaller, producing between 300k to 1m ounces each year. Below 300k is the junior realm. Translated into quarterly terms, majors mine 250k+ ounces, mid-tiers 75k to 250k, and juniors less than 75k. GDXJ was originally launched as a real junior-gold-stock ETF as its name implies, but it was forced to change its mission.
Gold stocks soared in price and popularity in the first half of 2016, ignited by a new bull market in gold. The metal itself awoke from deep secular lows and surged 29.9% higher in just 6.7 months. GDXJ and GDX skyrocketed 202.5% and 151.2% higher in roughly that same span, greatly leveraging gold’s gains. As capital flooded into GDXJ to own junior gold stocks, this ETF risked running afoul of Canadian securities laws.
Canada is the center of the junior-gold universe, where most juniors trade. Once any investor including an ETF buys up a 20%+ stake in a Canadian stock, it is legally deemed a takeover offer. This may have been relevant to a single corporate buyer amassing 20%+, but GDXJ’s legions of investors certainly weren’t trying to take over small gold miners. GDXJ diversified away from juniors to comply with that archaic rule.
Smaller juniors by market capitalization were abandoned entirely, cutting them off from the sizable flows of ETF capital. Larger juniors were kept, but with their weightings within GDXJ greatly demoted. Most of its ranks were filled with mid-tier gold miners, as well as a handful of smaller majors. That was frustrating, but ultimately beneficial. Mid-tier gold miners are in the sweet spot for stock-price-appreciation potential!
Major gold miners are increasingly struggling with declining production, they can’t find or buy enough new gold to offset their depletion. And the stock-price inertia from their large market capitalizations is hard to overcome. The mid-tiers can and are boosting their gold output, fueling big growth in operating cash flows and profitability. With much-lower market caps, capital inflows drive their stock prices higher much faster.
Every quarter I dive into the latest results from the top 34 GDXJ components. That’s simply an arbitrary number that fits neatly into the tables below, but a commanding sample. These companies represented 82.1% of GDXJ’s total weighting this week, even though it contained a whopping 71 stocks! 6 of the top 34 were majors mining 250k+ ounces, 17 mid-tiers at 75k to 250k, 8 “juniors” under 75k, and 3 explorers with zero.
These majors accounted for 19.8% of GDXJ’s total weighting, and really have no place in a “Junior Gold Miners ETF” when they could instead be exclusively in GDX. These mid-tiers weighed in at 44.3% of GDXJ. The “juniors” among the top 34 represented just 14.8% of GDXJ’s total. But only 4 of them at a mere 6.1% of GDXJ are true junior golds, meaning they derive over half their revenues from actually mining gold.
The rest are primary silver miners, gold-royalty companies, and gold streamers. GDXJ is overwhelmingly a mid-tier gold miners ETF, with sizable small-major exposure. Investors and speculators need to realize it is not a junior-gold investment vehicle as advertised. GDXJ also has major overlap with GDX. Fully 28 of these top 34 GDXJ gold miners are included in GDX too, with 23 of them also among GDX’s top 34 stocks.
The GDXJ top 34 accounting for 82.1% of its total weighting also represent 36.6% of GDX’s own total weighting! The GDXJ top 34 clustered between the 11th- to 40th-highest weightings in GDX. Thus over 4/5ths of GDXJ is made up by almost 3/8ths of GDX. But GDXJ is far superior, excluding the large gold majors struggling with production growth. GDXJ gives much-higher weightings to better mid-tier miners.
The average Q4’18 gold production among GDXJ’s top 34 was 164k ounces, just over half as big as the GDX top 34’s 302k average. Despite these two ETFs’ extensive common holdings, GDXJ is increasingly outperforming GDX. GDXJ holds many of the world’s best mid-tier gold miners with big upside potential as gold’s own bull gradually powers higher. Thus it is important to analyze GDXJ miners’ latest results.
So after every quarterly earnings season I wade through all available operational and financial results and dump key data into a big spreadsheet for analysis. Some highlights make it into these tables. Any blank fields mean a company hadn’t reported that data as of this Wednesday. The first couple columns show each GDXJ component’s symbol and weighting within this ETF as of this week. Not all are US symbols.
19 of the GDXJ top 34 primarily trade in the US, 5 in Australia, 8 in Canada, and 2 in the U.K. So some symbols are listings from companies’ main foreign stock exchanges. That’s followed by each gold miner’s Q4’18 production in ounces, which is mostly in pure-gold terms excluding byproducts often found in gold ore like silver and base metals. Then production’s absolute year-over-year change from Q4’17 is shown.
Next comes gold miners’ most-important fundamental data for investors, cash costs and all-in sustaining costs per ounce mined. The latter directly drives profitability which ultimately determines stock prices. These key costs are also followed by YoY changes. Last but not least the annual changes are shown in operating cash flows generated, hard GAAP earnings, revenues, and cash on hand with a couple exceptions.
Percentage changes aren’t relevant or meaningful if data shifted from positive to negative or vice versa, or if derived from two negative numbers. So in those cases I included raw underlying data rather than weird or misleading percentage changes. In cases where foreign GDXJ components only released half-year data, I used that and split it in half where appropriate. That offers a decent approximation of Q4’18 results.
Symbols highlighted in light blue newly climbed into the ranks of GDXJ’s top 34 over this past year. And symbols highlighted in yellow show the rare GDXJ-top-34 components that aren’t also in GDX. If both conditions are true blue-yellow checkerboarding is used. Finally production bold-faced in blue shows the handful of junior gold miners in GDXJ’s higher ranks, under 75k ounces quarterly with over half of sales from gold.
This whole dataset together compared with past quarters offers a fantastic high-level read on how mid-tier gold miners as an industry are faring fundamentally. While Q4’18 proved challenging with lower average gold prices, the GDXJ miners generally weathered it well. These elite mid-tier miners did much better last quarter than the major-dominated GDX elites. Their profits and stock prices are ready to soar with higher gold.
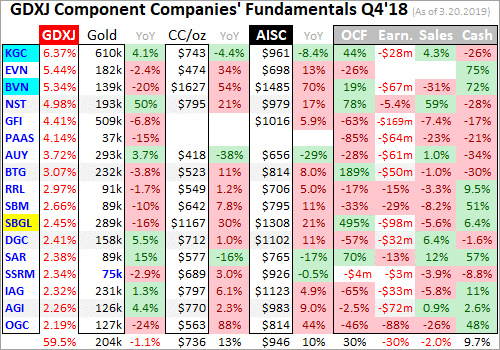
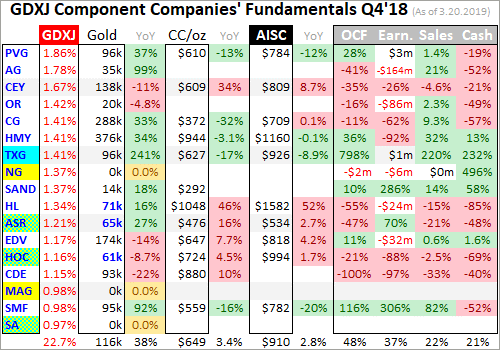
GDXJ’s managers have continued to fine-tune its ranks over this past year, making some good changes. For some inexplicable reason, one of the world’s largest gold miners AngloGold Ashanti was one of this ETF’s top holdings as discussed last quarter. AU was finally kicked out and replaced with a smaller major gold miner Kinross Gold and a mid-tier Buenaventura. Together they now account for 11.7% of GDXJ’s weighting.
Reshuffling at the top makes year-over-year changes less comparable, particularly given KGC’s larger size relative to most of the rest of the GDXJ top 34. Neither it nor BVN were included in GDXJ a year ago, and are new additions since Q3’18 results. Both are sizable GDX components, probably added to GDXJ to keep the weightings down in its smaller Canadian components. 4 other stocks climbed into the top 34.
Torex, Alacer, Hochschild, and Seabridge were already in GDXJ a year ago but weighted below the top 34. GDXJ is largely-but-not-entirely market-cap weighted, so it’s normal for components to rise into or fall out of the top 34 as their stock prices move higher or lower. All the following comparisons between Q4’18 and Q4’17 are across the two slightly-different GDXJ-top-34 sets, not the exact companies shown above.
Production has always been the lifeblood of the gold-mining industry. Gold miners have no control over prevailing gold prices, their product sells for whatever the markets offer. Thus growing production is the only manageable way to boost revenues, leading to amplified gains in operating cash flows and profits. Higher production generates more capital to invest in expanding existing mines and building or buying new ones.
Gold-stock investors have long prized production growth above everything else, as it is inexorably linked to company growth and thus stock-price-appreciation potential. The top 34 GDXJ gold miners excelled in that department, growing their aggregate output by a big 12.8% YoY to 5.1m ounces! That’s really impressive, trouncing both the major gold miners dominating GDX as well as the entire world’s gold-mining industry.
Last week I analyzed the GDX majors’ Q4’18 results, which revealed they are still struggling with serious challenges. The GDX top 34’s total production fell 3.9% YoY when adjusted for a mega-merger. That was worse than total global output slumping 0.9% YoY according to the World Gold Council. So GDXJ’s mostly-mid-tier gold miners really stand out. They are bucking the industry trend with strong production growth.
Again GDXJ’s top 34 components start at the 11th-highest weighting within GDX. Most of the production problems occurred above that threshold, in GDX’s top 10 components which include the world’s largest major gold miners. Their immense average production of 630k ounces in Q4’18 was nearly 4x the 164k average among GDXJ’s top 34! Those GDX top 10 also accounted for a dominant 59.1% of its total weighting.
GDXJ excluding these depleting giants and reallocating their heavy weightings across smaller majors and mid-tier gold miners makes all the difference. The big majors’ waning production and large market caps act as an anchor retarding GDX’s upside. GDXJ doesn’t share that burden, which helped its top 34 show such strong production growth. There’s no reason to own the large majors with their serious challenges.
Also interesting on the GDXJ production front last quarter was silver. This “Junior Gold Miners ETF” also includes major silver miners, both primary and byproduct ones. The GDXJ top 34’s silver mined rocketed 53.8% higher YoY to 31.2m ounces! For comparison the GDX top 34’s total reported output of 28.8m ounces actually slumped 1.5% YoY. The smaller GDXJ mid-tiers are way better than majors at growing their outputs.
The mid-tier gold miners continue to prove all-important production growth is doable off smaller bases. With a handful of mines or less to operate, mid-tiers can focus on expanding them or building a new mine to boost their output beyond depletion. But the majors are increasingly failing to do this with the super-high production bases they operate at. As long as the majors are struggling, it’s prudent to avoid them.
GDXJ investors would be better served if this ETF contained no major gold miners producing over 250k ounces a quarter on average. They still command nearly 1/5th of its weighting, which could be far better reallocated in mid-tiers and juniors. If VanEck kept the major gold miners in GDX where they should be, it could give GDXJ much-better upside potential. That would make this ETF more popular and successful.
In gold mining, production and costs are generally inversely related. Gold-mining costs are largely fixed quarter after quarter, with actual mining requiring about the same levels of infrastructure, equipment, and employees. So the higher production, the more ounces to spread mining’s big fixed costs across. Thus with sharply-higher YoY production in Q4’18, the GDXJ top 34 should’ve seen proportionally-lower costs.
There are two major ways to measure gold-mining costs, classic cash costs per ounce and the superior all-in sustaining costs per ounce. Both are useful metrics. Cash costs are the acid test of gold-miner survivability in lower-gold-price environments, revealing the worst-case gold levels necessary to keep the mines running. All-in sustaining costs show where gold needs to trade to maintain current mining tempos indefinitely.
Cash costs naturally encompass all cash expenses necessary to produce each ounce of gold, including all direct production costs, mine-level administration, smelting, refining, transport, regulatory, royalty, and tax expenses. In Q4’18 these top-34-GDXJ-component gold miners that reported cash costs averaged $698 per ounce. That was up a sharp 10.8% YoY, and considerably worse than the GDX top 34’s $655 average.
Those were the highest GDXJ cash costs seen since at least Q2’16, when I started this research thread. But even $698 is far lower than prevailing gold prices, showing the mid-tier gold miners face no existential threat. And GDXJ’s high cash costs last quarter aren’t righteous anyway, as they were skewed higher by an extreme outlier. One of the new GDXJ companies Buenaventura reported crazy cash costs of $1627 per ounce!
Excluding that wild anomaly, the rest of the GDXJ top 34 averaged cash costs of $662 which was right in line with Q3’18’s $663. They’d be even lower without Sibanye-Stillwater, a troubled South-African major gold miner that saw cash costs soar 30.1% YoY to an ugly $1167. If that too is excluded the overall average falls to $642. So for the most part the mid-tier gold miners’ cash costs remain really low relative to gold.
Way more important than cash costs are the far-superior all-in sustaining costs. They were introduced by the World Gold Council in June 2013 to give investors a much-better understanding of what it really costs to maintain gold mines as ongoing concerns. AISCs include all direct cash costs, but then add on everything else that is necessary to maintain and replenish operations at current gold-production levels.
These additional expenses include exploration for new gold to mine to replace depleting deposits, mine-development and construction expenses, remediation, and mine reclamation. They also include the corporate-level administration expenses necessary to oversee gold mines. All-in sustaining costs are the most-important gold-mining cost metric by far for investors, revealing gold miners’ true operating profitability.
The GDXJ top 34 reporting AISCs averaged $932 per ounce in Q4’18, which was also up a sizable 7.1% YoY. That was also barely the highest seen since at least Q2’16, contradicting the big production growth these miners achieved. But once again this was heavily skewed by extreme outliers, including both BVN and SBGL. Hecla also reported a stunning 52.3% YoY surge in its gold AISCs to a nosebleed $1582 per ounce!
Both BVN and SBGL reported sharply-lower YoY production, helping explain their huge cost surges. HL’s is more temporary, as it expects 2019 gold AISCs to average a still-high-but-much-lower $1250. Without these abnormal situations, the rest of the GDXJ top 34 averaged excellent AISCs of just $863 per ounce. That would be down 0.8% YoY, and is close to the GDX majors’ $837 average also excluding BVN and HL.
Yet even at that skewed artificially-high $932 per ounce, the elite GDXJ gold miners have great potential to enjoy surging profits and hence stock prices. Gold was relatively weak last quarter, averaging $1228 which was 3.8% lower YoY. That implied the mid-tier gold miners as an industry were earning $296 per ounce. That’s still a 24% profit margin, proving Q4’18’s major GDXJ lows weren’t fundamentally righteous.
Gold is faring much better in this almost-over Q1’19, averaging $1303 which is up a big 6.1% quarter-on-quarter. Assuming GDXJ-top-34 AISCs are flat, these elite mid-tier gold miners are earning around $371 per ounce this quarter. That implies enormous 25.3% QoQ profits growth! We won’t know for sure until after Q1’s earnings season, near mid-May. But the mid-tiers’ fundamentals should’ve greatly improved.
Bigger profits driven by higher gold prices are sure to attract investors back to the still-beaten-down gold-stock sector in a big way. The gold miners will stand out even more with earnings growth expected to be scarce in the general stock markets this year. If gold continues marching higher on balance as it ought to, and GDXJ average AISCs retreat as BVN and HL get anomalous costs under control, GDXJ profits will soar.
The GDXJ top 34’s hard accounting results in Q4’18 were mixed, but way better than GDX on all fronts. These elite mid-tier gold miners reported total sales of $7.4b last quarter, up a strong 12.1% YoY. That is right in line with their 12.8% YoY total gold production growth. That huge 53.8% YoY surge in their silver output helped offset the 3.8% YoY decline in average gold prices. The mid-tier gold miners’ revenues are strong.
Compare that to the GDX top 34, which saw sales plunge 10.3% YoY in Q4 due to 3.9%-lower merger-adjusted gold output. Those strong GDXJ-top-34 revenues kept operating-cash-flow generation solid, totaling $2.2b which was down 9.2% YoY. That again crushed the majors in the GDX top 34, which saw OCFs plummet 30.4% YoY. The divergence between how mid-tiers and majors are faring these days is gaping.
The elite GDXJ mid-tier gold miners also invested in growing their production, so their collective total cash on hand slid 14.3% YoY to $5.9b. The GDX majors saw a similar 14.6% YoY decline in their cash, yet they certainly didn’t spend enough to offset their depleting mines. The only real blemish on the GDXJ top 34’s Q4 results came in hard GAAP profits. Their aggregate bottom line collapsed to a $732m loss last quarter!
That was far worse than Q4’17’s $26m loss. Much of this was due to big non-cash impairment charges, writedowns of the carrying value of gold mines and deposits due to lower gold prices and forecasts. If gold miners expect lower gold prices going forward, they have to flush the resulting expected economic losses through current-quarter results when those impairments are perceived. That hammered overall results.
Honestly the Q4’18 impairments seemed pretty unnecessary, with average gold prices merely down 3.8% YoY. 2018’s full-year average gold price actually rose 0.8% YoY. Major impairments usually happen in years gold plunges sharply, like 2013’s brutal 27.9% plummeting. Something like that really changes the economic assumptions underlying gold mines. But gold only slumped 1.6% last year, which is utterly trivial.
Some of the bigger impairment charges came from First Majestic Silver and Osisko Gold, which wrote off $168m and $166m. This primary silver miner and gold-royalty company aren’t even mid-tier gold miners. And the perpetually-troubled South African majors Gold Fields and Sibanye-Stillwater which have long tainted GDXJ reported big half-year losses implying $169m and $98m in Q4. These alone total $601m of losses.
That accounted for nearly 5/6ths of the GDXJ top 34’s total GAAP losses last quarter. While many of the elite mid-tier gold miners reported small losses, the great majority of the surge in losses came from a handful of stocks. Overall the GDXJ GAAP profits looked relatively decent compared to the majors. GDX’s top 34 reported a staggering $6.0b in accounting losses in Q4’18! The mid-tiers are thrashing the majors.
GDXJ’s mostly-mid-tier component list of great gold miners is really faring well, especially compared to the struggling large gold miners. Investors looking to ride this gold-stock bull should avoid the world’s biggest gold producers and instead deploy their capital in the mid-tier realm. The best gains will be won in individual smaller gold miners with superior fundamentals, plenty of which are included within GDXJ.
Despite being the world’s leading gold-stock ETF, GDX needs to be avoided. The major gold miners that dominate its weightings are struggling too much fundamentally, unable to grow their production. Capital will instead flow into the mid-tiers, juniors, and maybe a few smaller majors still able to boost their output and thus earnings going forward. None of this is new, but the major and mid-tier disconnect continues to worsen.
Again back in essentially the first half of 2016, GDXJ skyrocketed 202.5% higher on a 29.9% gold upleg in roughly the same span! While GDX somewhat kept pace then at +151.2%, it is lagging GDXJ more and more as its weightings are more concentrated in stagnant gold mega-miners. The recent big mergers are going to worsen that investor-hostile trend. Investors should buy better individual gold stocks, or GDXJ.
One of my core missions at Zeal is relentlessly studying the gold-stock world to uncover the stocks with superior fundamentals and upside potential. The trading books in both our popular weekly and monthly newsletters are currently full of these better gold and silver miners. Mostly added in recent months as gold stocks recovered from deep lows, our unrealized gains are already running as high as 74% this week!
If you want to multiply your capital in the markets, you have to stay informed. Our newsletters are a great way, easy to read and affordable. They draw on my vast experience, knowledge, wisdom, and ongoing research to explain what’s going on in the markets, why, and how to trade them with specific stocks. As of Q4 we’ve recommended and realized 1076 newsletter stock trades since 2001, averaging annualized realized gains of +16.1%! That’s nearly double the long-term stock-market average. Subscribe today for just $12 per issue!
The bottom line is the mid-tier gold miners are thriving fundamentally. They are still rapidly growing their production while majors suffer sharp output declines. The mid-tiers are holding the line on costs, which portends strong leveraged profits growth as gold continues grinding higher on balance. The performance gap between the smaller mid-tier and junior gold miners and larger major ones is big and still mounting.
Investors and speculators really need to pay attention to this intra-sector disconnect. Gold and its miners’ stocks should power far higher in coming years as the lofty general stock markets roll over. But the vast majority of the gains will be concentrated in growing gold miners, not shrinking ones. This means the mid-tier and junior gold miners will far outperform the majors. The smaller miners have superior fundamentals.
Adam Hamilton, CPA
March 25, 2019
Copyright 2000 – 2019 Zeal LLC (www.ZealLLC.com)
1. The latest U.S. central bank announcement was a win-win for gold.
2. If the Fed surprised analysts and hiked rates, the stock market probably crashes, and gold stocks rally strongly.
3. As expected, the Fed did nothing and gold stocks outperformed.
4. It’s a clear win-win situation for gold bugs around the world.
5. I’m adamant that the U.S. stock market would already look somewhat akin to the 1929 bear market if the Fed had not killed its “ QT on auto pilot ” and “ rates are years away from being normalized ” statements.
6. In contrast, there was/is no QE in China or India. In addition, interest rates are twice as high in China as America, and three times as high in India.
7. The bottom line: Stock markets are propelled significantly higher or lower by central bank policy. Chinese and Indian central banks have vastly more long-term ability to “ juice ” their stock markets higher than the Fed does.
8. This leaves aside the “minor detail” that there are three billion citizens in Chindia. The Chindian population absolutely dwarfs the U.S. population. The citizens are gold-oriented workaholics growing their economy at 6%-7% annually.
9. Most incredible of all: This growth is happening against the background of a quasi-communist government in China and a mafia-like government in India.
10. What happens as those governments transition to the more business-friendly type of government that exists in America? Answer: Vastly more wealth and vastly more demand for gold!
11. Please click here now: [ https://gracelandjuniors.com/wordpress/wp-content/uploads/2019/03/2019mar19bankgold1.png ] The almost universal enthusiasm for gold amongst elite bank analysts around the world right now is highly impressive.
12. Their support for gold on this $70/ounce pullback has been unwavering and Commerzbank analysts appear to be predicting that a surge to the $1700 price zone is imminent!
13. These heavyweight bank analysts influence the decision-making process of institutional money managers. They also affect mainstream financial media. Gold is gaining news coverage as an asset class to be respected.
14. Please click here now: [ https://gracelandjuniors.com/wordpress/wp-content/uploads/2019/03/2019mar19bankgold2.png ] Bank America’s elite gold market analysts note the steady progress being made with global de-dollarization.
15. The bulk of the action taking place on that front involves fresh and steady allocation to gold by central banks. India’s savvy central bank was a massive buyer near the 2009 lows and now it appears to be committing to a monthly buy program.
16. For gold price forecasting, retail investor sentiment is becoming less important than it was in the past. What matters now is central bank sentiment and bank analyst sentiment. The phrase that describes that sentiment best is: Solid as a golden rock!
17. Please click here now: [ https://gracelandjuniors.com/wordpress/wp-content/uploads/2019/03/2019mar19gold1.png ] Double-click to enlarge. As relentless Chindian demand growth, limited mine supply growth, and central bank de-dollarization all take the centre stage of price discovery in the eyes of the elite bank analysts, negative technical formations like this H&S top will continue be voided, and gold’s uptrend will continue.
18. As gold pulled back to the $1280 I suggested that could be the new floor for the price. The powerful rally in the rupee taking place against the dollar now is triggering a surge in Indian dealer demand. In turn, that’s causing powerful commercial bank traders to cover short positions.
19. Trump is working hard to reverse the damage to global stock markets that his tariffs caused and the Fed has become highly supportive with its statements and actions. I see no reason for that to change with this week’s FOMC policy announcement and Trump is going to intensify his efforts to get a trade deal that is friendly to stock markets.
20. I’m “ long and strong ” the U.S. stock market, the Indian stock market, the Chinese stock market, and the entire precious metals sector… with a wide array of investment vehicles.
21. Please click here now: [ https://gracelandjuniors.com/wordpress/wp-content/uploads/2019/03/2019mar19gdx.png ] Double-click to enlarge this GDX daily chart. While I’m long DUST-NYSE at my [http://www.guswinger.com/ ] swing trade service, that’s a mechanical short-term system designed to produce solid profits during wild volatility events like the Fed meet.
22. In the big picture, volume is soft on down days for most gold stocks. Volume is rising as the price rises. That’s bullish. Most importantly, the GDX price action can be themed as… “ solid” . As gold rallied to $1350, I predicted that many individual miners would keep rallying as gold pulled back.
23. A big feature of the current $70/ounce gold price consolidation has been the continued rally of many miners . A rise in gold to the $1520 area would turn these miners into cash cows, and a further rally to Commerzbank’s $1700 predicted price should cause an institutional feeding frenzy!
24. Gold is steadily reclaiming its title as “ ultimate asset ”, which means it rises in good times and bad. If global stock markets rise, gold rises. If global stock markets crash, gold rises. Owning gold is now the “ ultimate no-brainer ” tactic for central banks and heavyweight bank analysts. Let’s hope that sentiment envelops 100% of the Western gold community… right here, right now!
Special Offer For Website Readers: Please send me an Email to freereports4@gracelandupdates.com and I’ll send you my free “Golden Seniors!” report. I highlight key senior gold stocks with incredible upside potential that are trading at under $10/share. It’s essentially an opportunity to buy senior producers at junior prices! I include key buy and sell zones for each great stock.
Thanks!!
Cheers
Stewart Thomson
Graceland Updates
mail:
stewart@gracelandupdates.com
stewart@gracelandjuniors.com
Stewart Thomson is a retired Merrill Lynch broker. Stewart writes the Graceland Updates daily between 4am-7am. They are sent out around 8am-9am. The newsletter is attractively priced and the format is a unique numbered point form. Giving clarity of each point and saving valuable reading time.
Risks, Disclaimers, Legal
Stewart Thomson is no longer an investment advisor. The information provided by Stewart and Graceland Updates is for general information purposes only. Before taking any action on any investment, it is imperative that you consult with multiple properly licensed, experienced and qualified investment advisors and get numerous opinions before taking any action. Your minimum risk on any investment in the world is: 100% loss of all your money. You may be taking or preparing to take leveraged positions in investments and not know it, exposing yourself to unlimited risks. This is highly concerning if you are an investor in any derivatives products. There is an approx $700 trillion OTC Derivatives Iceberg with a tiny portion written off officially. The bottom line:
Are You Prepared?
In recent weeks we noted the bullish outlook for the stock market.
Friday the S&P 500 as well as ACWX (global equity ETF ex US stocks) closed above resistance and made higher highs.
Not surprisingly, as US and global equities have avoided a bear market (for the time being), precious metals have weakened. It’s not a surprise that as Gold failed to breakout both the S&P 500 and global equities (ACWX) held their 200-day moving averages and then made a higher high.
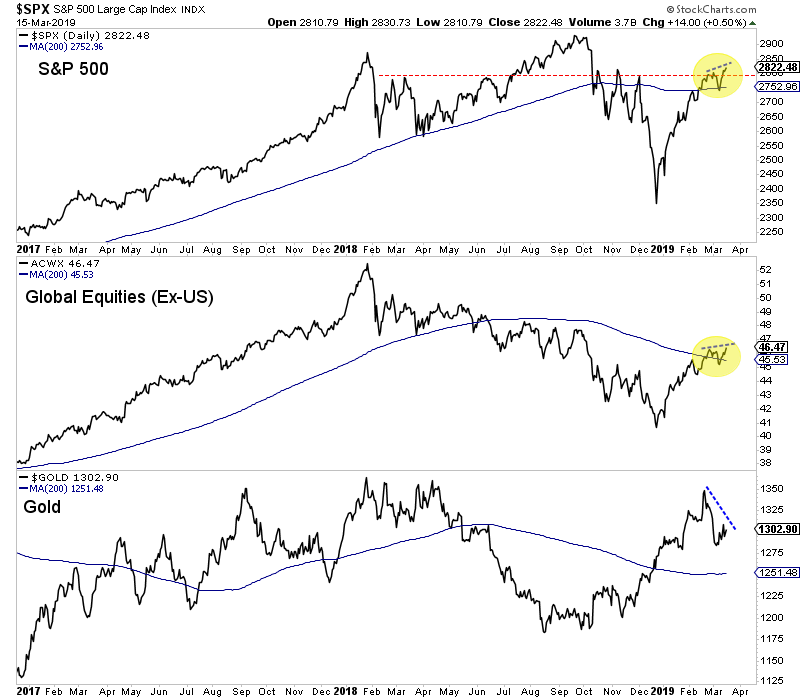
The very recent underperformance in Gold and precious metals is better illustrated in the ratio charts below.
Gold against stocks made a very strong move in the fourth quarter but instead of digesting or consolidating that move, the ratios have steadily declined. The same could be said for the GDX ratios as they have formed rounding tops.
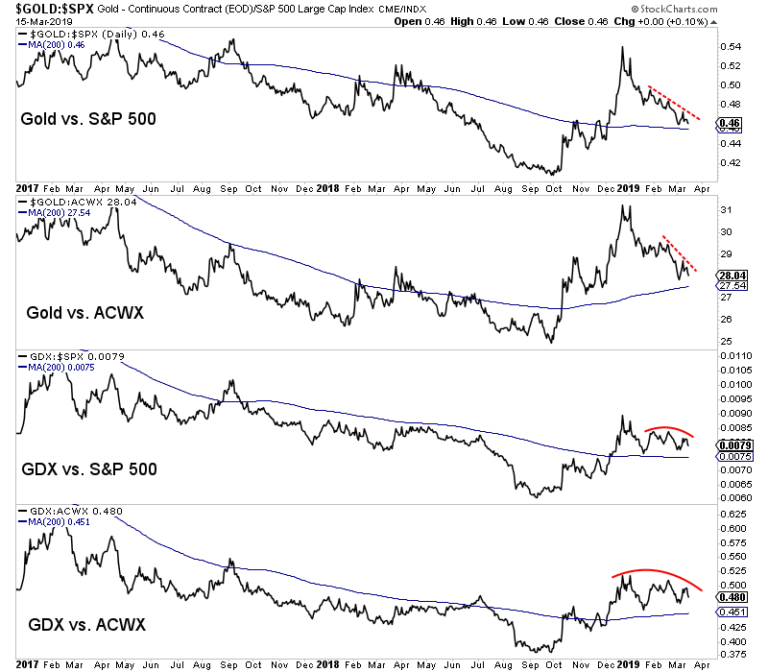
The implication is obviously not favorable for precious metals because outperformance of the stock market is a necessity for a bull market and especially so, given the current context.
That being said, one positive for the precious metals complex is the miners are outperforming the metals. Last week the GDX to Gold ratio hit a seven and a half month high.
Another positive is breadth has not deteriorated yet. The GDX advance decline line is only a tiny bit off the recent high and 73% of the HUI and 65% of GDXJ are above the 200-day moving averages.
Ultimately and to continue to beat the dead horse, a bull market in precious metals cannot begin without outperformance against the stock market. That will likely coincide with the Fed moving from pause mode to rate cuts.
The immediate outlook is bullish for stocks and therefore do not expect Gold to breakout or begin a bull market. It’s unclear if renewed stock market strength will lead to a larger topping pattern or if its an indication that growth will stabilize for the rest of 2019.
Regardless, until Gold outperforms stocks and the Fed is ready to cut, we are focused on the companies that can perform without a rising Gold price. To learn which juniors have 3x to 5x potential over the next 12 to 18 months, consider learning more about our premium service.
The major gold miners are grinding higher in a solid upleg, fueling growing interest in this small contrarian sector. They’ve mostly finished reporting their fourth-quarter results, revealing how they are really faring fundamentally. Collectively the world’s biggest gold miners continue to face serious challenges, which often stem from declining production. That makes stock picking more important than ever for investment success.
Four times a year publicly-traded companies release treasure troves of valuable information in the form of quarterly reports. Required by the U.S. Securities and Exchange Commission, these 10-Qs and 10-Ks contain the best fundamental data available to traders. They dispel all the sentiment distortions inevitably surrounding prevailing stock-price levels, revealing corporations’ underlying hard fundamental realities.
While 10-Qs with filing deadlines of 40 days after quarter-ends are required for normal quarters, 10-K annual reports are instead mandated after quarters ending fiscal years. Most gold miners logically run their accounting on calendar years, so they issue 10-Ks after Q4s. Since these annual reports are larger and must be audited by independent CPAs, their filing deadlines are extended to 60 days after quarter-ends.
The definitive list of major gold-mining stocks to analyze comes from the world’s most-popular gold-stock investment vehicle, the GDX VanEck Vectors Gold Miners ETF. Launched way back in May 2006, it has an insurmountable first-mover lead. GDX’s net assets running $10.6b this week were a staggering 47.1x larger than the next-biggest 1x-long major-gold-miners ETF! GDX is effectively this sector’s blue-chip index.
It currently includes 45 component stocks, which are weighted in proportion to their market capitalizations. This list is dominated by the world’s largest gold miners, and their collective importance to this industry cannot be overstated. Every quarter I dive into the latest operating and financial results from GDX’s top 34 companies. That’s simply an arbitrary number that fits neatly into the tables below, but a commanding sample.
As of this week these elite gold miners accounted for fully 94.1% of GDX’s total weighting. Last quarter they combined to mine 300.8 metric tons of gold. That was 35.2% of the aggregate world total in Q4’18 according to the World Gold Council, which publishes comprehensive global gold supply-and-demand data quarterly. So for anyone deploying capital in gold or its miners’ stocks, watching GDX miners is imperative.
The largest primary gold miners dominating GDX’s ranks are scattered around the world. 21 of the top 34 mainly trade in US stock markets, 6 in Australia, 5 in Canada, and 1 each in China and the United Kingdom. GDX’s geopolitical diversity is good for investors, but makes it more difficult to analyze and compare the biggest gold miners’ results. Financial-reporting requirements really vary from country to country.
In Australia, South Africa, and the UK, companies report in half-year increments instead of quarterly. The big gold miners often publish quarterly updates, but their data is limited. In cases where half-year data is all that is made available, I split it in half for a Q4 approximation. While Canada has quarterly reporting, the deadlines are looser than in the States. Some Canadian gold miners drag their feet in getting results out.
While it is challenging bringing all the quarterly data together for the diverse GDX-top-34 gold miners, analyzing it in the aggregate to see how they are doing is essential. So each quarter I wade through all available operational and financial reports and dump the data into a big spreadsheet for analysis. The highlights make it into these tables. Blank fields mean a company hadn’t reported that data as of this Wednesday.
The first couple columns of these tables show each GDX component’s symbol and weighting within this ETF as of this week. While most of these stocks trade on U.S. exchanges, some symbols are listings from companies’ primary foreign stock exchanges. That’s followed by each gold miner’s Q4’18 production in ounces, which is mostly in pure-gold terms. That excludes byproduct metals often present in gold ore.
Those are usually silver and base metals like copper, which are valuable. They are sold to offset some of the considerable expenses of gold mining, lowering per-ounce costs and thus raising overall profitability. In cases where companies didn’t separate out gold and lumped all production into gold-equivalent ounces, those GEOs are included instead. Then production’s absolute year-over-year change from Q4’17 is shown.
Next comes gold miners’ most-important fundamental data for investors, cash costs and all-in sustaining costs per ounce mined. The latter directly drives profitability which ultimately determines stock prices. These key costs are also followed by YoY changes. Last but not least the annual changes are shown in operating cash flows generated, hard GAAP earnings, revenues, and cash on hand with a couple exceptions.
Percentage changes aren’t relevant or meaningful if data shifted from positive to negative or vice versa, or if derived from two negative numbers. So in those cases I included raw underlying data rather than weird or misleading percentage changes. Companies with symbols highlighted in light-blue have newly climbed into the elite ranks of GDX’s top 34 over this past year. This entire dataset together is quite valuable.
It offers a fantastic high-level read on how the major gold miners are faring fundamentally as an industry. Unfortunately they were generally struggling on multiple fronts in Q4’18. The more quarterly reports I read and data I gathered, the more apparent it became that many if not most of the world’s biggest gold miners continue to face serious challenges. That makes GDX itself way less attractive to gold-stock investors.
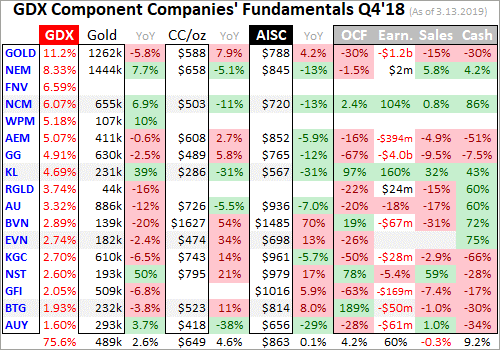
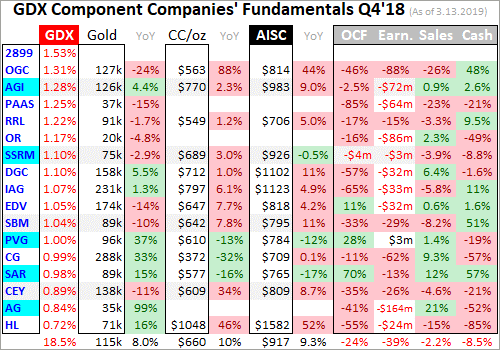
GDX’s holdings grew much more concentrated over this past year, with the top 34’s total weighting rising from 90.5% in Q4’17 to 94.1% in Q4’18. That is partially due to increased merger-and-acquisition activity driven by big gold miners trying to replace depleting production. For years many have proven unable to replenish mined gold organically, leaving buying other companies the only option to maintain mining tempos.
Production has always been the lifeblood of the gold-mining industry. Gold miners have no control over prevailing gold prices, their product sells for whatever the markets offer. Thus growing production is the only manageable way to boost revenues, leading to amplified gains in operating cash flows and profits. Higher production generates more capital to invest in expanding existing mines and building or buying new ones.
Gold-stock investors have long prized production growth above everything else, as it is inexorably linked to company growth and thus stock-price-appreciation potential. But for some years now the major gold miners have been struggling to grow production. Large economically-viable gold deposits are getting increasingly harder to find and more expensive to exploit, with the low-hanging fruit long since picked.
More and more gold-industry experts believe peak gold is nearing, after which global mine production will start declining. For many years now new deposit discoveries and mine builds have failed to keep pace with depletion at existing mines. So production growth is slowing. According to the World Gold Council’s latest fundamental data, global mine production only edged 0.8% higher in 2018 compared to 5.3% in 2013!
GDX’s major gold miners are the biggest in the world, with access to many billions of dollars of capital to expand their operations. Yet even with those vast resources by his sector’s standards, the top 34 have still failed to grow their production. In Q4’18 they collectively produced 9.7m ounces of gold, plunging a colossal 7.5% YoY from Q4’17’s 10.5m! That is shockingly bad, and the root of the major gold miners’ problems.
Total world gold production per the WGC merely slipped 0.9% YoY last quarter. Incidentally that was just the second YoY quarterly decline in the past 32 quarters, adding more fuel to peak-gold theories. Across all of them growth averaged 2.5% YoY. Seeing the top 34 GDX gold miners’ production plunge at 8.3x the world rate in Q4’18 is very concerning. Many major gold miners are stagnating, retarding GDX’s potential.
Just over half of GDX’s top 34 gold miners, fully 18 of them, suffered average production declines of 8.9% YoY! The worst in terms of impact came from GDX’s largest component Barrick Gold. GOLD’s gold mined fell 5.8% YoY in Q4’18, representing 1/10th of the total drop among the GDX top 34. Barrick is so desperate to buy production to offset its serious depletion that it recently purchased major gold miner Randgold.
That deal completed on January 1st, 2019, so GOLD’s Q4’18 results don’t yet reflect it. Randgold mined 374.6k ounces last quarter, which was actually up an impressive 9.9% YoY. That helps explain some of the big production drop among the GDX top 34. Randgold’s production was included in the GDX top 34 in Q4’17, but of course its stock no longer exists this week when I downloaded GDX’s current component list.
Adding Randgold’s Q4’18 production in cuts the GDX top 34’s production decline to 3.9% YoY. Going the other way and instead removing it from Q4’17’s total leaves the top 34’s mined gold down 4.4% YoY. But that’s still much worse than that overall 0.9% YoY decline in global gold mine production last quarter. As I explained in depth in a mid-February essay, gold-stock mega-mergers won’t solve this depletion problem.
Before Q4’18, Randgold suffered 4 quarters in a row of falling production averaging declines of 7.4% YoY. Barrick’s quarterly production has fallen for 6 quarters in a row, averaging hefty 13.4% YoY drops! Merging depleting major gold miners together doesn’t magically boost their collective production. It just masks production declines for a single year, the first 4 quarters comparing post-merger results with pre-merger ones.
Once those great cross-merger YoY comparisons pass, the relentless depletion in both companies’ gold mines will quickly become apparent again. The larger any gold miner, the harder it is to grow and even just maintain production levels. Because exploration budgets largely collapsed since 2013 when gold plunged and crushed gold stocks, the global pipeline of bigger economic gold deposits to mine has mostly dried up.
GDX’s top-two components have always been Barrick Gold and Newmont Gold. This week together they accounted for 19.5% of its total weighting and a whopping 28.0% of the top 34’s total Q4’18 gold mined! Had Barrick’s and Randgold’s merger been consummated in Q4, GOLD’s production would’ve soared over 1.8m ounces. Newmont didn’t want Barrick to surpass it, so in January it announced it was buying Goldcorp.
GG produced 630k ounces of gold in Q4, which will be added onto Newmont’s production going forward once this deal is done. Had Newmont and Goldcorp been together in Q4’18, this gold-mining behemoth would’ve produced nearly 2.1m ounces! Those levels are staggering, and will really increase these two mega-miners’ dominance over this sector and GDX. These mergers’ pro-forma impact on GDX is massive.
Using Q4’s numbers, Newmont and Barrick would’ve accounted for a colossal 38.8% of the GDX top 34’s entire gold mined including Randgold. Their collective weighting in this leading gold-stock ETF would shoot over a quarter. So the overall GDX future performance will be more dominated by Newmont and Barrick than ever before. If they can’t grow production from such stratospheric levels, they’ll retard GDX’s upside.
With gold deposits increasingly harder to discover, and taking even longer to get permitted and brought into production at ever-higher costs, the biggest gold miners are going to find it impossible to even maintain their outputs. Any production growth is going to come from smaller gold miners, and their stocks will soar to reflect it. Unfortunately the impact on GDX will be muted, since its weightings are tyrannized by the giants.
Kirkland Lake Gold has been one of the best-performing gold stocks over this past year. In 2018 its stock rocketed 69.9% higher as GDX fell 9.3%! The reason investors flocked to KL is it has rapidly grown its gold output, which soared 38.8% YoY in Q4’18. That greatly boosted its sales, operating cash flows, and profits. More gold produced spreads out the big fixed costs of mining across more ounces, amplifying earnings.
No matter how awesome KL’s management has proved, such production growth was only possible from a relatively-low base. KL produced 167k ounces of gold in Q4’17, compared with around 8x that from each Newmont and Barrick. The biggest gains in gold-stock prices won’t come from super-major-dominated GDX, but from smaller mid-tier gold miners. Investors will continue to prize and richly reward production growth.
Peak gold is likely bearish for the largest gold miners that drive GDX. Capital inflows from investors will wane along with their shrinking production. But lower gold mined supply on balance going forward is wildly bullish for the mid-tier and junior gold miners growing their production! The resulting higher gold prices will catapult their profits and thus stock prices far higher, attracting investors fleeing the struggling majors.
The only way to reap these massive gains is directly investing in the best individual gold miners. Their fundamentals are far superior to their sector’s as a whole. While buying GDX is easy, the lion’s share of that capital is funneled into the major gold miners with slowing production. Their underperformance will dilute away any outperformance among mid-tier miners in this ETF, leading to way-inferior overall gains.
Given the sharply-lower gold production by the GDX top 34 in Q4’18, per-ounce mining costs should’ve risen proportionally. Gold-mining costs are largely fixed quarter after quarter, with actual mining requiring the same levels of infrastructure, equipment, and employees. So the lower production, the fewer ounces to spread mining’s big fixed costs across. These elite gold miners indeed reported higher costs last quarter.
There are two major ways to measure gold-mining costs, classic cash costs per ounce and the superior all-in sustaining costs per ounce. Both are useful metrics. Cash costs are the acid test of gold-miner survivability in lower-gold-price environments, revealing the worst-case gold levels necessary to keep the mines running. All-in sustaining costs show where gold needs to trade to maintain current mining tempos indefinitely.
Cash costs naturally encompass all cash expenses necessary to produce each ounce of gold, including all direct production costs, mine-level administration, smelting, refining, transport, regulatory, royalty, and tax expenses. In Q4’18 these top 34 GDX-component gold miners that reported cash costs averaged $655 per ounce. That was up a sharp 9.1% YoY, among the highest quarterly cash costs seen in years.
That still shows the major gold miners face no existential threat as long as gold stays over $650, which is about half current levels. And Q4’s cash costs are artificially high due to two anomalies. Buenaventura and Hecla both reported cash costs rocketing to extremes of $1627 and $1048! Excluding these outliers, the rest of the GDX top 34 averaged cash costs of $598, which was right in line with Q4’17’s overall $600 read.
Way more important than cash costs are the far-superior all-in sustaining costs. They were introduced by the World Gold Council in June 2013 to give investors a much-better understanding of what it really costs to maintain gold mines as ongoing concerns. AISCs include all direct cash costs, but then add on everything else that is necessary to maintain and replenish operations at current gold-production levels.
These additional expenses include exploration for new gold to mine to replace depleting deposits, mine-development and construction expenses, remediation, and mine reclamation. They also include the corporate-level administration expenses necessary to oversee gold mines. All-in sustaining costs are the most-important gold-mining cost metric by far for investors, revealing gold miners’ true operating profitability.
The GDX top 34 gold miners reported average AISCs of $889 in Q4’18, up 3.6% YoY. That is inversely proportional to the 4%ish YoY drop in their gold production when Randgold is accounted for. While $889 is the highest seen since at least Q2’16 when I started doing this quarterly research, it is still roughly in line with the past four quarters’ averages of $858, $884, $856, and $877. And like cash costs this is skewed high.
Buenaventura and Hecla also reported anomalous super-high AISCs of $1485 and $1582. Excluding them, the rest of the GDX top 34 averaged much-lower all-in sustaining costs of $837 per ounce in Q4’18. So much to their credit, the major gold miners are ruthlessly managing their costs as their production slumps. That’s bullish for their coming earnings growth as gold continues grinding higher in this bull market.
Gold-mining profits really leverage higher gold prices, and big earnings growth attracts in investors to bid up stock prices. In Q4’18 gold averaged about $1228 per ounce. At the GDX top 34’s average AISC of $889, that implies the major gold miners as an industry were earning profits of $339 per ounce. Those are going to grow considerably this quarter. The almost-over Q1’19 has seen average gold prices near $1303.
AISCs are likely to decline from Q4’s high levels in this current Q1, but let’s assume they remain stable at $889. That implies the major gold miners are earning about $414 per ounce this quarter. In other words a mere 6.1% quarter-on-quarter rally in average gold prices could drive a major 22.1% QoQ jump in the major gold miners’ profits! That’s why major gold stocks tend to amplify gold uplegs by 2x to 3x or so.
It is encouraging the gold miners’ costs remain well-positioned to fuel big profits growth in a higher-gold-price environment despite their intractable production slumps. Investors love chasing earnings growth, which is looking to be scarce in the general stock markets this year. The good gold miners’ stocks are likely to see big capital inflows as gold continues climbing, driving them and to a lesser extent GDX higher.
Unfortunately the hard accounting results in Q4’18 were far worse than AISCs. Q4’18’s average gold price was 3.8% lower year-over-year, which combined with the 4%ish-lower gold production including Randgold among the GDX top 34 to really weaken financial performance. Overall quarterly revenues among these elite major gold miners fell 10.3% YoY to $12.8b. Operating cash flows amplified that drop.
Total OCFs among these GDX stocks collapsed 30.4% YoY to $3.7b in Q4’18. That means less capital available to finance mine expansions and new mine builds, exacerbating the production struggles. Yet overall corporate treasuries fared relatively better with a 14.6% YoY decline to total cash balances near $12.1b for all these miners. All this was understandable, but hard GAAP accounting profits were a total disaster.
Warren Buffett once famously joked about airline stocks, saying he would’ve done investors a huge favor if he could’ve shot down the Wright brothers’ maiden flight in 1903 killing that whole industry before it was born. His point was the airlines never earned profits over the long-term, so they weren’t worth investors’ time. The major gold stocks’ Q4 losses made it look like they could never earn any money either, terrible.
Last quarter the top 34 GDX gold miners, the biggest and supposedly best in the world, lost a staggering $6.0b collectively! That compared to relatively-minor total losses under $0.1b in Q4’17. At $1228 gold the major gold miners should’ve been earning solid profits. Yet they were hemorrhaging money in an accounting sense fast enough to make drunken sailors blush. So what the heck happened in this sector?
The problem was colossal non-cash impairment charges, gold miners writing down the value of mines on their books for a variety of reasons. These were mainly lower forecast gold prices reducing the economic reserves at those mines. While an accounting fiction, these perceived losses must still be flushed through income statements when they are believed to happen. The list of impairments disclosed in quarterlies was long.
GOLD reported about $1.1b in impairment charges in Q4’18, AEM $390m, AUY $151m, AG $168m, and the list goes on. But the writeoff king last quarter was Goldcorp, reporting an inconceivable $4.7b in impairment charges across multiple mines! Newmont’s offer for Goldcorp valued its mines much lower than their carried book value, forcing GG to write off the enormous differences in what may be its last solo quarter.
Together Barrick and Goldcorp wrote off $5.8b in assets in Q4’18, 97% of the GDX top 34’s total GAAP losses last quarter! This is yet another reason gold-stock mega-mergers are bad news for this entire sector. They give the managements of these giant gold miners cover for flushing away what were likely poor past decisions in allocating capital. Smaller miners focused on fewer mines seem to suffer fewer impairments.
I’ve extensively studied and actively traded gold-mining stocks for decades now, and these latest writeoffs seem really fishy. Major impairments are understandable in years gold plunges sharply, like 2013 when it plummeted 27.9%. That really changes the economic assumptions underlying the value of gold mines on balance sheets. But 2018 saw nothing like that, with gold slumping a trivial 1.6%. Big impairments made no sense.
While the average gold price slumped 3.8% YoY in Q4’18, that isn’t even material. And in full-year terms, 2018’s average gold price was actually 0.8% higher YoY. Huge writedowns on a flat gold year don’t look righteous at all. Gold-mining-company managements have a serious credibility problem with gold-stock investors, and pulling stunts like this worsen it. These guys need to start managing for their shareholders.
The major gold miners’ Q4’18 results were disappointing overall. Huge sky-is-falling impairments along with sharply-lower production driving much-weaker sales and operating-cash-flow generation sure made GDX look like an iffy investment at best. Offsetting that negativity somewhat was good control over their all-in sustaining costs, which only moved modestly higher and would’ve fallen without a couple anomalous reads.
The key takeaway here is avoid GDX. The world’s leading gold-stock ETF is increasingly burdened with giant gold miners struggling too much fundamentally. Their high weightings within this ETF are certain to retard its future performance. It’s far better to deploy capital in great smaller individual gold miners with superior fundamentals. Plenty of these companies are included in GDX, but have relatively-low weightings.
GDX’s little-brother ETF GDXJ is another option. While advertised as a “Junior Gold Miners ETF”, it is really a mid-tier gold miners ETF. It includes most of the better GDX components, with higher weightings since the largest gold miners are excluded. I wrote an entire essay in mid-January explaining why GDXJ is superior to GDX, and my next essay a week from now will delve into the GDXJ gold miners’ Q4’18 results.
Back in essentially the first half of 2016, GDXJ rocketed 202.5% higher on a 29.9% gold upleg in roughly the same span! While GDX somewhat kept pace then at +151.2%, it is lagging GDXJ more and more as its weightings are more concentrated in stagnant gold mega-miners. The recent big mergers are going to worsen that investor-hostile trend. Investors should buy better individual gold stocks, or GDXJ, instead of GDX.
One of my core missions at Zeal is relentlessly studying the gold-stock world to uncover the stocks with superior fundamentals and upside potential. The trading books in both our popular weekly and monthly newsletters are currently full of these better gold and silver miners. Mostly added in recent months as gold stocks recovered from deep lows, our unrealized gains are already running as high as 75%+ this week!
If you want to multiply your capital in the markets, you have to stay informed. Our newsletters are a great way, easy to read and affordable. They draw on my vast experience, knowledge, wisdom, and ongoing research to explain what’s going on in the markets, why, and how to trade them with specific stocks. As of Q4 we’ve recommended and realized 1076 newsletter stock trades since 2001, averaging annualized realized gains of +16.1%! That’s nearly double the long-term stock-market average. Subscribe today for just $12 per issue!
The bottom line is the major gold miners are still struggling fundamentally. Their production shrinkage is accelerating, pushing costs proportionally higher. That led to weaker sales and operating cash flows in Q4. And accounting profits cratered into a dark abyss on enormous and suspicious impairment charges by big gold miners involved in mega-mergers. These poor results are retarding GDX’s upside potential.
But smaller mid-tier and junior gold miners with superior fundamentals are bucking this trend to enjoy big stock-price gains. They are still able to grow production off way-smaller bases, boosting their earnings and attracting investment capital. They will continue amplifying gold’s uplegs, multiplying wealth for their contrarian investors. Gold-stock upside potential remains huge outside of the increasingly-problematic majors.
Adam Hamilton, CPA
March 18, 2019
Copyright 2000 – 2019 Zeal LLC (www.ZealLLC.com)
A lack of exploration and discovery near Hemlo has created an opportunity for one Canadian company with a deep connection to the region to make the next discovery and the regional connection between two possible gold systems.
by Nicholas LePan
The winters in Northern Ontario pause most exploration programs, however for one company, the deep chill provides an opportunity to follow up on an impressive drill hole in the shadow of Hemlo’s headframe, one of Canada’s largest gold discoveries.
Over the winter, Canadian Orebodies Inc. (TSX-V: CORE) has been building ice pads on a lake in preparation for a 1000-metre-plus drilling program. The drill program seeks to explore the extension of recently drilled high-grade gold-bearing veins on the Black Raven property. The ice pads allow the drill to target the right angle to follow up on results received from the fall 2018 drilling program.
On Dec. 11, 2018, the company announced that drilling had intercepted 133.2 g/t Au over 2.0 metres, which included 443.0 g/t Au over 0.6 metres (see press release), in a vein which the company has dubbed the Super G vein in the Smoke Lake Gold System. These results were the confirmation the company needed; the Super G vein is part of a much larger mineralized system, which comprises multiple mineralized stacked layers with potential for high-grade gold in every structure.
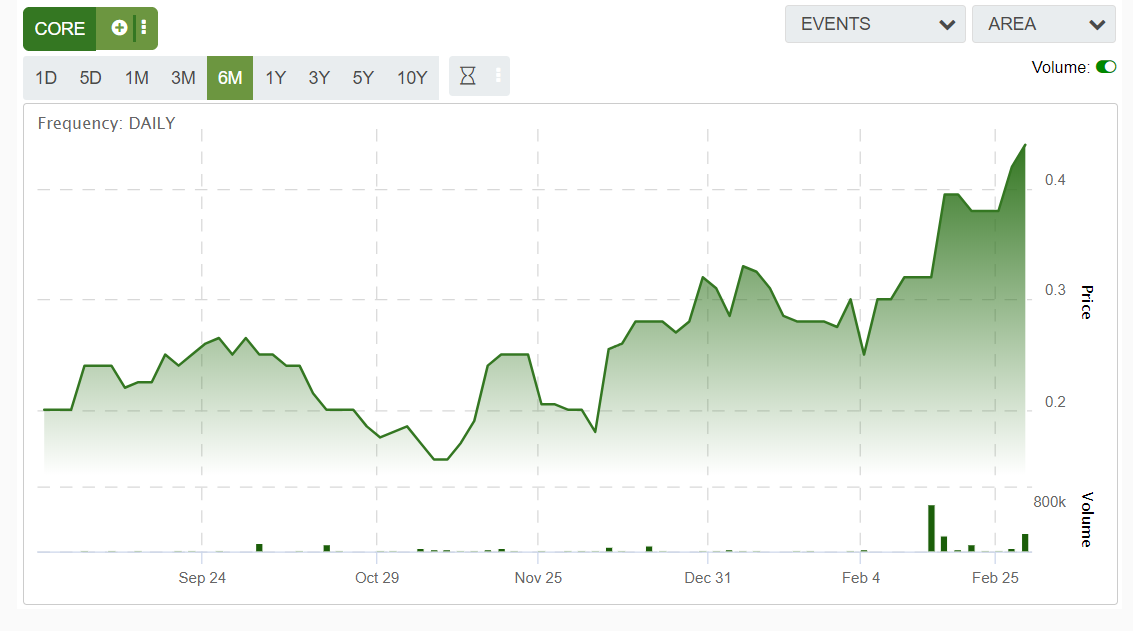
This hole was the highest grade reported on the property and it sparked interest from the market. Since that time, anticipation of further drilling has driven up share prices from 18 cents before the results to currently 34 cents per share.
Gordon McKinnon, President of Canadian Orebodies, stated:
“Our intersection from hole BR-2018-002 produced one of the highest-grade gold intercepts in the Hemlo Greenstone Belt outside of the Hemlo Mines complex, which was discovered in 1981. Looking into 2019, the combination of this season’s results, with the historic drilling results, will greatly improve our exploration model to expand the high-grade gold zones known in the system and to discover new ones.”
The significance of this new drill program is not be understated. There has been very little discovery since Hemlo, largely in part due to a lack of systematic exploration. Typically, the presence of one large orebody indicates the region has the geological potential to host further deposits, it is just a matter of getting the trend right and doing the drilling.
The main target of the 2019 drilling program is the Super G Structure of the Smoke Lake Gold System. Part of the program will target the up-dip and lateral extensions of the high-grade zone intersected in BR-2018-002.
The emerging picture suggests that the stacking of high and low grade gold zones is forming the Smoke Lake Gold System. The company is comparing its results to the width and grade of results from Amex Exploration’s (TSX-V: AMX) Eastern Gold Zone on its Perron Project.
Potential upside from the ongoing drill program could come from the extension of the discovered high-grade zone in the Super G Structure and extensions in its mineralization footprint. This could lead to the discovery of new high-grade zones in the other structures forming the Smoke Lake Gold System.
This work is going toward a larger regional picture of the potential for gold mineralization on the company’s land package. In 2017, drilling at the company’s Wire Lake project suggested that higher grade gold mineralization surrounded by a halo of lower grade mineralization can be hosted in the Wire Lake Gold System, with a headline result of 7.56 g/t gold over 4.9 metres in WL-2017-001 including 57.3 g/t gold over 0.5 metres (see release).
New geochemical data suggests that the Wire Lake Gold system is possibly related to the Smoke Lake Gold System, based on similarities between the alteration and mineralization in the two systems. If confirmed this would add an additional 5 kilometers to the Wire Lake Gold System which is already confirmed over a strike length of 3 kilometres, creating an even larger target in a underexplored greenstone belt.
This is just the beginning for the Canadian Orebodies team led by Gordon McKinnon. Calling on his family tradition, McKinnon has built a team that knows the region well and is looking to prove the continuity of his father’s success, who played a key role in the discovery of Hemlo.
On the board is John Harvey, who served as President and CEO of Hemlo Gold Mines Inc. from 1989 to 1991. Serving as an advisor to the company is Robert Middleton, who led the Rosario Resources team that discovered the Bell Creek Mine in Timmins, Ontario and, in 1982, he played a role in drilling the discovery hole at the Goliath Mine in Hemlo, Ontario.
Alongside this proven team is a series of successful shareholders such as Robert Cudney of Northfield Capital, who sold Gold Eagle Mines to Goldcorp for $1.5 billion, Sean Roosen’s Osisko Mining, Rob McEwen and Rick Rule. With these shareholders, the company has access to capital despite the company already being in a well-funded position with $2.2 million and ~58 million shares fully diluted.
The company is expecting the program to wrap in late March with assays shortly after that. These results could prove that there are more Hemlos in Ontario.
About Canadian Orebodies Inc.
Canadian Orebodies is a Canadian-based mineral exploration company with a portfolio of properties in Ontario and Nunavut. Canadian Orebodies is focused on generating shareholder value through the advancement of its two Hemlo area projects: Wire Lake and the North Limb.
By Nicholas LePan
March 14, 2019
The author of this article was compensated in cash and does not hold any securities in Canadian Orebodies.
- With little fanfare, gold is staging a nice consolidation in the $1280-$1350 price zone.
- Please click here now. Double-click to enlarge. A breakout from this $70 trading range would usher in a fresh target of $1400 and perhaps $1420.
- Note the superb position of the 14,7,7 series Stochastics oscillator at the bottom of the chart.
- Its great positioning is just one of many reasons why $1280 could be the launch pad for the next significant rally.
- Fundamentals make charts, and there are no long-term fundamentals more bullish for gold than the relentless growth of Chindian demand versus limited global mine supply growth.
- On that note, please click here now. Most American investors are wasting time begging the U.S. stock market to go higher, while the nation’s top institutional analysts are wisely focused on the incredibly bullish developments taking place in the Asian markets.
- Chinese government stimulus, rising demand for copper, and rising corporate earnings across Asia are all creating a stock market rally that could become a serious barn burner.
- That’s good news for physical market gold demand, which is good news for Western gold stock investors!
- Please click here now. The U.S. stock market situation is also positive for gold.
- Most U.S. stocks would have already melted far below their December lows if the Fed had not changed course so suddenly on rate hikes and quantitative tightening.
- U.S. first quarter GDP and earnings growth are likely abysmal, even after a major corporate tax cut, tariffs, ultra-low interest rates, and a mountain of stock market buybacks.
- Morgan Stanley analysts believe U.S. corporate earnings growth will fall to 1% in 2019 and I’ll suggest it would be negative if not for the stock market buybacks.
- Without the Fed’s backstop and the corporate buybacks, the U.S. stock market would probably be in free-fall right now.
- GDP growth in China is 6%+ and in India it is 7%+. The bottom line: Weakening growth in the West and solid growth in Asia is a win-win situation for gold.
- Please click here now. Double-click to enlarge this FXI-NYSE chart.
- The Chinese stock market just completed a textbook pullback to the neckline of a double bottom pattern after an upside breakout.
- With heavyweights like Morgan Stanley backing the rally, the Chinese stock market is likely headed much higher, and Asian investors will celebrate the upside action by purchasing gold.
- It’s mathematics as simple as 1+1=2.
- Central bank buying is another important factor for gold demand… and it’s accelerating.
- Please click here now. China’s central bank has resumed its monthly gold buying, and now India’s central bank seems to be buying consistently too!
- Please click here now. Double-click to enlarge this GDX chart.
- The bounce from the $21.50 support zone feels “perky”.
- Most intermediate and senior miners have made significant progress in cutting their AISC (all-in sustaining costs).
- A rally in bullion to above $1400 would turn many of these miners into “cash cows” and open the door to sustained institutional interest in the sector. That’s the main reason why I’m adamant that the entire $23 – $18 price zone for GDX is such an important buying area for investors!
Special Offer For Website Readers: Please send me an Email to freereports4@gracelandupdates.com and I’ll send you my free “Gold Portfolio With Silver Lining!” report. I highlight an ideal mix of gold and silver stocks for investors to profit as the gold price rally resumes!
Thanks!!
Stewart Thomson
March 13, 2019
Email:
Stewart Thomson is a retired Merrill Lynch broker. Stewart writes the Graceland Updates daily between 4am-7am. They are sent out around 8am-9am. The newsletter is attractively priced and the format is a unique numbered point form. Giving clarity of each point and saving valuable reading time.
Risks, Disclaimers, Legal
Stewart Thomson is no longer an investment advisor. The information provided by Stewart and Graceland Updates is for general information purposes only. Before taking any action on any investment, it is imperative that you consult with multiple properly licensed, experienced and qualified investment advisors and get numerous opinions before taking any action. Your minimum risk on any investment in the world is: 100% loss of all your money. You may be taking or preparing to take leveraged positions in investments and not know it, exposing yourself to unlimited risks. This is highly concerning if you are an investor in any derivatives products. There is an approx $700 trillion OTC Derivatives Iceberg with a tiny portion written off officially. The bottom line:
Are You Prepared?
It’s important to understand Gold’s fundamentals as it will help us confirm a new bull market.
To this point, Gold’s rallies have failed to make higher highs and higher lows because, although there has been improvement in fundamentals, the fundamentals have not turned bullish yet.
The technical trigger will be Gold and gold stock outperformance of the stock market which will likely lead to the fundamental catalyst of Fed rate cuts. The start of rate cuts will indicate declining real interest rates which is the key driver of bull markets in Gold.
With that said, here are some things that do not impact the price of Gold.
Geopolitics
This was borne out of the 1970s because geopolitical developments then did impact Gold. They affected Oil prices which impacts inflation. Random geopolitical events have no immediate impact on Gold unless they directly impact the fundamentals. Unless an event has immediate and sustained consequences for energy prices, it should be ignored and deemed short-term noise.
Central Bank Buying
This sounds impressive and important. Central Banks are powerful entities who help manage economies. Surely, they know something? According to Bloomberg, Central Banks are buying Gold at the fastest clip in almost 50 years!
The truth is Central Banks don’t have any inside information and their buying or selling cannot be used for market timing purposes. The chart below shows that the 2001-2011 run began with record central bank selling. Central Banks have been consistent buyers since the 2011 peak. If anything at all, the information is a contrary indicator.
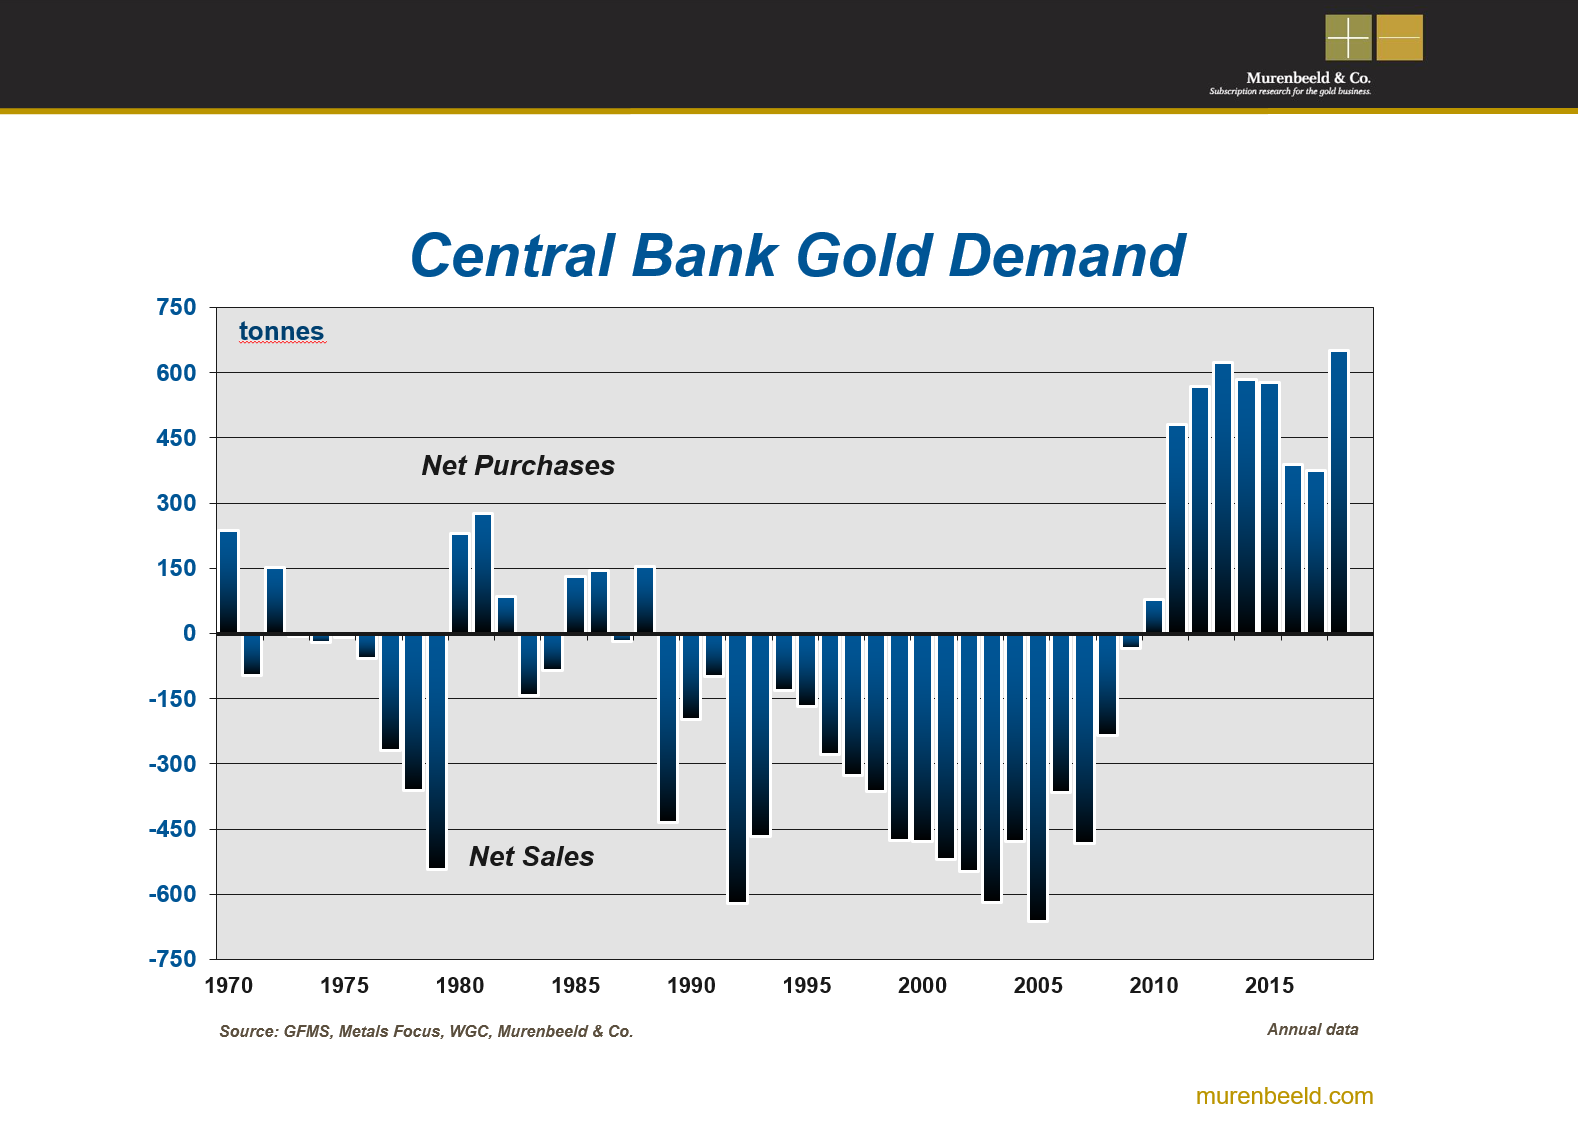
Supply & Demand
Gold is not like the other commodities. It acts far more like a currency as its drivers are inflation, interest rates and the U.S. Dollar.
The price of Gold doesn’t respond to changes in supply and demand. The chart below from Nick Laird shows that demand actually surged in the 1980s and 1990s, creating a rising deficit throughout the late 1980s and entire 1990s. But that was a time when the price trended sideways to lower.
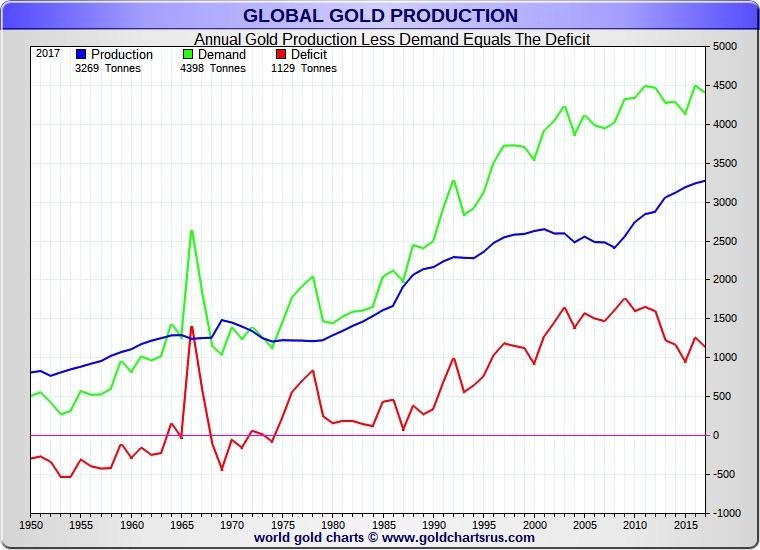
Part of the reason for that is jewelry demand is the largest component of Gold demand and it trends inversely to the Gold price.
It’s also important to note, Gold isn’t consumed like other commodities. Its supply grows in perpetuity. This is another reason its not impacted by supply and demand.
It’s also another reason why “Peak Gold” if true, will not impact the Gold price.
To sum things up, its ultimately inflation and interest rates which drive Gold because they drive real interest rates. Investment demand usually mirrors the trend in real interest rates and it impacts the price trend more than any other form of demand.
Other factors such as geopolitics, jewelry demand, Central Bank buying, Peak Gold and physical demand (which, if you read most gold bugs is always red hot) don’t impact the primary trend in the Gold price.
While Peak Gold or production difficulties do not affect the Gold price, they are hugely bullish for the companies that are making high margin discoveries or adding value to high margin deposits. Capital is flowing to the companies that are making these discoveries regardless of the trend in metals prices. When Gold fundamentals turn bullish, that is when massive amounts of capital will flow into juniors, creating a historic bull market. To learn which juniors have 3x to 5x potential over the next 12 to 18 months, consider learning more about our premium service.
The widely-held mega-cap stocks that dominate the U.S. markets recently finished reporting their Q4 2018 financial results. Because the tenor of stock markets changed radically last quarter, this latest earnings season is more important than usual. An extreme monster bull market suddenly rolled over into a severe near-bear correction in Q4. How major corporations fared offers insights into whether a young bear is upon us.
Four times a year publicly-traded companies release treasure troves of valuable information in the form of quarterly reports. Required by the U.S. Securities and Exchange Commission, these 10-Qs and 10-Ks contain the best fundamental data available to traders. They dispel all the sentiment distortions inevitably surrounding prevailing stock-price levels, revealing corporations’ underlying hard fundamental realities.
While 10-Qs with filing deadlines of 40 days after quarter-ends are required for normal quarters, 10-K annual reports are instead mandated after quarters ending fiscal years. Most big companies logically run their accounting on calendar years, so they issue 10-Ks after Q4s. Since these annual reports are larger and must be audited by independent CPAs, their filing deadlines are extended to 60 days after quarter-ends.
So the 10-K filing season just wrapped up last Friday, revealing how the biggest and best U.S. companies were doing in Q4 2018. They are the stocks of the flagship S&P 500 stock index (SPX). At the end of Q4 they commanded a gigantic collective market capitalization of $22.2t! The vast majority of investors own the big U.S. stocks of the SPX, as some combination of them are usually the top holdings of nearly every fund.
The major ETFs that track the S&P 500 dominate the increasingly-popular passive-investment strategies as well. The SPY SPDR S&P 500 ETF, IVV iShares Core S&P 500 ETF, and VOO Vanguard S&P 500 ETF are among the largest in the world. This past week they reported colossal net assets running $262.4b, $160.5b, and $103.2b respectively! Overall stock-market fortunes are totally dependent on big U.S. stocks.
Q4 2018 proved extraordinary. Leading into it, the SPX hit a dazzling all-time record high in late September about a week before Q4 arrived. That extended an extreme monster stock bull to 333.2% gains over 9.5 years, the 2nd-largest and 1st-longest in all of U.S. stock-market history! But as I warned days after that euphoric peaking, the Fed’s unprecedented quantitative-tightening campaign would finally ramp to full speed in Q4.
Stock markets artificially inflated by $3625b of Fed QE over 6.7 years couldn’t react well to Fed QT finally starting to unwind that epic monetary inflation. With QT hitting $50b per month starting in Q4, the stock markets indeed wilted. Over the next 3.1 months into Christmas Eve, the SPX plummeted 19.8%! That was right on the verge of a new bear market at -20%. The SPX suffered its worst December since 1931, -9.2%.
That sure looked like a young bear market, really freaking out traders. But since those deep and ominous lows, the SPX has soared 19.3% at best in a massive rally! That has reversed nearly 4/5ths of the total correction losses largely suffered in Q4. This looked and acted like a classic bear-market rally, rocketing higher to eradicate fear and restore universal complacency. New-bear worries have shriveled to nothing.
Given Q4 2018’s colossal stock-market inflection and subsequent huge rebound, whether the SPX narrowly evaded the overdue-bear bullet or not is supremely important. Bear markets exist for one reason, to maul overvalued stocks back down below historic fair-value levels. So how the major U.S. corporations actually fared last quarter, how large their earnings were compared to their stock prices, offers essential bull-bear clues.
Every quarter I analyze the top 34 SPX/SPY component stocks ranked by market cap. This is just an arbitrary number that fits neatly into the tables below, but is a dominant sample of the SPX. At the end of Q4, these American giants alone commanded fully 43.7% of the SPX’s total weight! Their $9.7t collective market cap exceeded that of the bottom 437 SPX companies. Big U.S. stocks’ importance cannot be overstated.
I wade through the 10-K or 10-Q SEC filings of these top SPX companies for a ton of fundamental data I dump into a spreadsheet for analysis. The highlights make it into these tables below. They start with each company’s symbol, weighting in the SPX and SPY, and market cap as of the final trading day of Q4 2018. That’s followed by the year-over-year change in each company’s market capitalization, a key metric.
Major U.S. corporations have been engaged in a wildly-unprecedented stock-buyback binge ever since the Fed forced interest rates to deep artificial lows during 2008’s stock panic. Thus the appreciation in their share prices also reflects shrinking shares outstanding. Looking at market-cap changes instead of just underlying share-price changes effectively normalizes out stock buybacks, offering purer views of value.
That’s followed by quarterly sales along with their y/y changes. Top-line revenues are one of the best indicators of businesses’ health. While profits can be easily manipulated quarter to quarter by playing with all kinds of accounting estimates, sales are tougher to artificially inflate. Ultimately sales growth is necessary for companies to expand, as bottom-line profits growth driven by cost-cutting is inherently limited.
Operating cash flows are also important, showing how much capital companies’ businesses are actually generating. Using cash to make more cash is a core tenet of capitalism. Unfortunately many companies are now obscuring quarterly OCFs by reporting them in year-to-date terms, lumping in multiple quarters together. So the Q4 2018 OCFs shown are mostly calculated by subtracting Q3’18 YTD OCFs from full-year ones.
Next are the actual hard quarterly earnings that must be reported to the SEC under Generally Accepted Accounting Principles. Lamentably companies now tend to use fake pro-forma earnings to downplay real GAAP results. These are derided as EBS profits, Everything but the Bad Stuff! Certain expenses are simply ignored on a pro-forma basis to artificially inflate reported corporate profits, often misleading traders.
While we’re also collecting the earnings-per-share data Wall Street loves, it’s more important to consider total profits. Stock buybacks are executed to manipulate EPS higher, because the shares-outstanding denominator of its calculation shrinks as shares are repurchased. Raw profits are a cleaner measure, again effectively neutralizing the impacts of stock buybacks. They better reflect underlying business performance.
Finally the trailing-twelve-month price-to-earnings ratios as of the end of Q4 2018 are noted. TTM P/Es look at the last four reported quarters of actual GAAP profits compared to prevailing stock prices. They are the gold-standard metric for valuations. Wall Street often intentionally conceals these hard P/Es by using the fictional forward P/Es instead, which are literally mere guesses about future profits that often prove far too optimistic.
These are mostly calendar-Q4 results, but some big U.S. stocks use fiscal quarters offset from normal ones. Walmart, Home Depot, and Cisco have quarters ending one month after calendar ones, so their results here are current to the end of January instead of December. Oracle uses quarters that end one month before calendar ones, so its results are as of the end of November. Offset reporting ought to be banned.
Reporting on offset quarters renders companies’ results way less comparable with the vast majority that report on calendar quarters. We traders all naturally think in calendar-quarter terms too. Decades ago there were valid business reasons to run on offset fiscal quarters. But today’s sophisticated accounting systems that are largely automated running in real-time eliminate all excuses for not reporting normally.
Stocks with symbols highlighted in blue have newly climbed into the ranks of the SPX’s top 34 companies over the past year, as investors bid up their stock prices and thus market caps relative to their peers. Overall the big U.S. stocks’ Q4 2018 results looked impressive, with good sales and profits growth. But that masks a sharp slowdown from prior quarters that will be exacerbated as the corporate-tax-cut transition year ends.
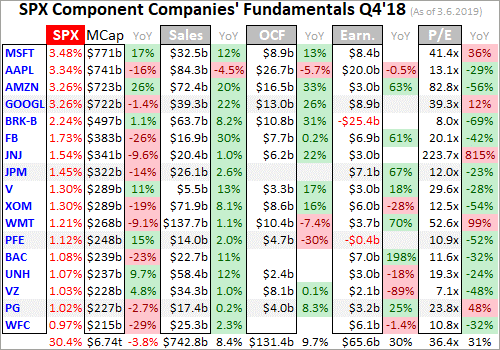
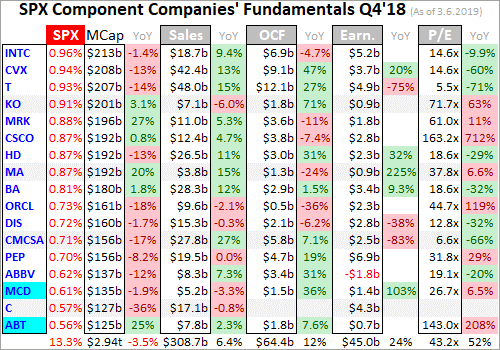
2018 was a banner year for corporate earnings because of Republicans’ massive corporate tax cuts. The Tax Cuts and Jobs Act was signed into law on December 22nd, 2017 to go into effect on January 1st, 2018. Its centerpiece was slashing the U.S. corporate tax rate from 35% to 21%, which naturally boosted reported profits. But 2018’s four quarters were the only ones that would experience anomalous TCJA growth.
Q4 2018 was the last quarter comparing year-over-year growth between a pre-TCJA quarter and post-TCJA quarter. That major discontinuity distorted corporate-earnings growth. Profits soared last year not just because companies were doing better, but because they were paying taxes at much-lower rates. But starting in Q1 2019, that TCJA-transition boost is gone forever. Normal same-tax-regime y/y comparisons will return.
But before we get to all-important corporate earnings and resulting valuations, let’s work our way through these tables. Thanks to the SPX’s brutal 14.0% plunge in Q4, this leading broad-market stock index lost 6.2% last year. The biggest and best US companies fared a little better, with the collective market cap of the top 34 sliding 5.2% y/y. These elite corporations had average market-cap losses running 3.6% y/y.
That certainly isn’t calamitous, but the deceleration is neck-snapping! In the prior four quarters starting in Q4 2017, the SPX’s top 34 components saw enormous average YoY market-cap gains of 29.2%, 14.6%, 23.5%, and 24.2%. Make no mistake, Q4’18 saw a massive and ominous stock-market inflection. The severe near-bear correction’s selling pressure was even heavier in smaller SPX stocks below the top 34.
That pushed the top 34’s share of the SPX’s total weighting to 43.7%, a big increase from Q4 2017’s 41.8%. The more capital concentrated in fewer stocks, the riskier the entire stock markets become. Big down days driven by company-specific news in highly-weighted individual stocks can drag down the entire stock markets. A great example occurred in mighty Apple just after Q4 ended, when it warned on weak Q4 sales.
For years Apple had been the largest U.S. stock by market cap, commanding the highest ranking in the SPX and SPY. Just after 2019’s first trading day closed, Apple cut its Q4 revenue guidance by 7.7% from its own midpoint given 2 months earlier. The next day AAPL stock collapsed by 10.0%, which pummeled the entire SPX 2.5% lower in its worst loss so far this year. When a top U.S. stock sneezes, markets catch a cold.
Falling stock markets exert a strong negative wealth effect. Both consumers and corporations get scared as stocks suffer big and fast drops, so they pull in their horns on spending. That left all kinds of economic data covering parts of Q4 weaker than expected, sometimes shockingly so. Lower spending weighs on corporate revenues, as fewer people buy less goods and services. Would the top 34’s Q4 2018 sales reflect this?
On the surface these biggest-and-best U.S. companies looked immune. Their total Q4 sales of $1051.6b still climbed an impressive 4.2% YoY in the stock markets’ worst quarter since Q3 2011. These companies averaged big sales growth of 7.4% y/y, which was surprisingly robust given the stock-market carnage. Yet even that good top-line growth still reflects a major slowdown for the top 34 from the past year’s pace.
In the preceding four quarters, the SPX’s top 34 component stocks averaged y/y revenues growth way up at 10.8%, 14.0%, 14.0%, and 11.5%. So Q4’s was a serious deceleration, which may be an ominous portent for 2019. Q4’s revenues growth may be overstated too. Nearly 2/3rds of the SPX’s spending-sapping Q4 plunge came in December alone, after much of the surge in holiday shopping was already over.
If big U.S. companies’ sales growth continues slowing or even starts shrinking in 2019, corporate-profits growth will collapse. While Q1 2019’s earnings season doesn’t start for another 5 weeks or so, plenty of companies have warned that they see revenues slowing much more than Wall Street expected. If Q4 2018 was indeed a major stock-market trend change from bull to bear, corporate results will continue deteriorating.
The mega-cap companies dominating the SPX and American investors’ portfolios also enjoyed strong operating-cash-flow-generation growth in Q4. Their collective OCFs surged 11.5% y/y to $195.8b. Individual companies enjoyed average OCF gains of 10.8% y/y. That looks great on the surface, but just like sales it represents a sharp slowdown from huge y/y OCF growth seen in the prior four quarters.
Starting in Q4 2017 the SPX top 34’s operating cash flows averaged growth of 17.0%, 52.5%, 30.3%, and 20.6% YoY. So Q4’18’s still-strong OCF growth actually decelerated by almost 2/3rds from the precedent of the prior year. That was the prevailing theme of Q4’18 results, good numbers but already slowing fast from the rest of 2018’s even though last quarter had easy annual comparisons across those corporate tax cuts.
Actual corporate profits among these elite U.S. companies are critical to prevailing valuations. The price-to-earnings ratio is the classic measure of how expensive stock prices are. It simply divides companies’ current stock prices by their total earnings per share over the last four reported quarters. So profits are really the only corporate results that matter for valuations, making their growth trends the most important of all.
Interestingly the top 34 SPX components’ total GAAP profits actually shrunk 1.4% y/y to $110.6b in Q4! That doesn’t make sense given their total revenues growth of 4.2%, which earnings should’ve amplified. But a couple big factors played into that surprising decline. After the Tax Cuts and Jobs Act was passed near the end of 2017, companies had to make huge adjustments to overpaid or underpaid taxes on their books.
These are called deferred tax assets and liabilities, which would suddenly be valued very differently under the new corporate-tax rules. So as I analyzed last year, the top 34 SPX companies ran a staggering $209.2b of TCJA adjustments through their earnings in Q4’17! Thus that earlier comparable quarter to Q4 2018 was a mess in GAAP-earnings terms. Q4 2017 was probably the most-distorted quarter in SPX history.
But with about half those one-time TCJA adjustments resulting in profits gains and half in losses, the net impact to overall SPX-top-34 earnings in Q4 2017 was essentially a wash at +$2.7b. That merely boosted overall Q4 2017 profits by 2.5%. A far-more-important factor in Q4’18’s YoY earnings decline came from a single company, Warren Buffett’s Berkshire Hathaway. It was the 5th-largest SPX component as 2018 ended.
BRK suffered a catastrophic $25.4b GAAP loss last quarter! That was almost entirely due to the sharp stock-market decline, which hammered Berkshire’s gigantic investment portfolio lower. It suffered $27.6b of non-cash losses that now have to be run through quarterly earnings. A new accounting rule now requires that unrealized capital gains and losses must be flushed through the bottom line, really irritating Buffett.
In BRK’s 2018 annual report he wrote “As I emphasized in the 2017 annual report, neither Berkshire’s Vice Chairman, Charlie Munger, nor I believe that rule to be sensible. Rather, both of us have consistently thought that at Berkshire this mark-to-market change would produce what I described as “wild and capricious swings in our bottom line.” … Wide swings in our quarterly GAAP earnings will inevitably continue.”
“That’s because our huge equity portfolio – valued at nearly $173 billion at the end of 2018 – will often experience one-day price fluctuations of $2 billion or more, all of which the new rule says must be dropped immediately to our bottom line. … Our advice? Focus on operating earnings, paying little attention to gains or losses of any variety.” Berkshire’s operating earnings were $5.7b in Q4’18, soaring 71.4% y/y!
If BRK’s epic unrealized capital loss is ignored, total SPX-top-34 earnings would’ve surged 23.2% y/y in Q4 2018. On average these top 34 SPX companies reporting profits in both Q4 2017 and Q4 2018 averaged similar 27.8% y/y gains. But the same sharp-deceleration story seen in revenues and OCFs also applies here. The previous four quarters saw far-stronger average growth of 137.0%, 45.9%, 44.5%, and 53.8% y/y!
The massive swings in Berkshire’s enormous investment portfolio are going to distort overall corporate profits in all future quarters with significant SPX gains or losses. We’ll have to watch that going forward, and adjust for it if necessary. But overall corporate profits will be much cleaner in coming years with the TCJA transition year of 2018 behind us. Apples-to-apples comparisons will once again become the norm.
The major slowdown in big U.S. companies’ revenues, operating cash flows, and earnings growth in Q4 2018 is certainly ominous. Especially since the majority of the SPX’s plunge last quarter came relatively late in December. But the most-important thing for attempting to divine whether that monster bull remains alive and well having merely suffered a severe correction, or a young bear is underway, is how valuations look.
These top 34 SPX companies that earned GAAP profits over the past four quarters averaged trailing-twelve-month price-to-earnings ratios way up at 39.7x as Q4 ended! That’s 29.4% above Q4 2017’s average a year earlier, and well into dangerous bubble territory. Over the past century-and-a-quarter or so, U.S. stock markets have averaged 14x earnings which is fair value. Twice that at 28x is where bubble territory begins.
Despite remaining scary-high, big U.S. companies’ average valuations did moderate considerably in Q4. The prior four quarters saw the SPX top 34’s average TTM P/Es run 30.6x, 46.0x, 53.4x, and 49.0x. So the severe near-bear correction definitely did some real work in mauling valuations down. And the P/Es in these tables are as of the end of Q4, which of course didn’t yet reflect the solid y/y growth in Q4 earnings.
By the end of February the top 34 SPX companies’ average TTM P/Es had further dropped to 26.4x, still very expensive but no longer bubble levels. That includes these Q4 results and is even despite the SPX’s powerful rebound rally out of late December’s near-bear lows. So the situation today is nowhere near as dire as at the end of Q4’18 on the valuation front. But that doesn’t mean stock markets are out of the woods.
Bear markets exist because stocks get too expensive leading into the ends of preceding bulls. At 14x fair value it takes 14 years for a company to earn back the price investors are paying for it. The reciprocal of that is a 7.1% return, which is mutually beneficial for both investors with surplus capital and companies that need it. Once extreme bubble valuations birth bear markets, they don’t hibernate until stocks are cheap.
Throughout all of 2018 the U.S. stock markets were trading at extreme bubble valuations. Then in Q4 that severe 19.8% correction hammered the SPX to the verge of formal bear territory. The rebound since has all the hallmarks of a massive bear-market rally. Wall Street’s oft-cited belief that Q4’s plunge was more than enough to restore balance to these stock markets isn’t credible. Bears don’t stop with stocks still expensive!
Historical bear markets after major bulls nearly always maul prevailing US-stock-market valuations back down to cheap levels at 7x to 10x earnings in TTM P/E terms. With the top U.S. stocks averaging 39.7x as Q4 waned and 26.4x at the end of February, the valuation-mean-reversion work still has a long way to go. It is certainly not safe to assume no bear is coming until the SPX trades under 14x, which is far lower.
The SPX soared 11.1% YTD by the end of February, hitting 2784.5. Merely to get to fair value at 14x earnings, not even overshoot to the downside, the SPX has to fall to 1476.6! That’s another 46.7% under this week’s levels! And if corporate earnings actually start retreating this year, the SPX downside targets will fall proportionally. Big bears are normal and inevitable after big bulls, as I explained in depth in late December.
Nearly a decade of Fed-QE-goosed bull market has left traders forgetting how dangerous bears are. The SPX’s last two bears were a 49.1% decline over 2.6 years ending in October 2002, and a 56.8% plunge in 1.4 years climaxing in a stock panic to a March 2009 low! With the big U.S. stocks sporting extreme bubble valuations all of last year, and still near bubble valuations now, it’s hard to believe we aren’t in a young bear.
If that proves true, investors need to lighten up on their stock-heavy portfolios, or at least put stop losses in place. Cash is king in bear markets, since its buying power grows. Investors who hold cash during a 50% bear market can double their holdings at the bottom by buying back their stocks at half-price. But cash doesn’t appreciate in value like gold, which actually grows wealth during major stock-market bears.
Gold investment demand surges as stock markets weaken, as we got a taste of in December. While the SPX plunged 9.2%, gold rallied 4.9% as investors flocked back. The gold miners’ stocks which leverage gold’s gains fared even better, with their leading index surging 10.7% higher. The last time a major SPX selloff awakened gold in the first half of 2016, it soared 30% higher fueling a massive 182% gold-stock upleg!
Absolutely essential in bear markets is cultivating excellent contrarian intelligence sources. That’s our specialty at Zeal. After decades studying the markets and trading, we really walk the contrarian walk. We buy low when few others will, so we can later sell high when few others can. While Wall Street will deny this likely young stock-market bear all the way down, we will help you both understand it and prosper during it.
We’ve long published acclaimed weekly and monthly newsletters for speculators and investors. They draw on my vast experience, knowledge, wisdom, and ongoing research to explain what’s going on in the markets, why, and how to trade them with specific stocks. As of Q4, we’ve recommended and realized 1076 newsletter stock trades since 2001. Their average annualized realized gain is +16.1%! That’s nearly double the long-term stock-market average. Subscribe today for just $12 per issue!
The bottom line is big U.S. stocks’ Q4 2018 results looked impressive on the surface. Good annual growth in sales, operating cash flows, and even earnings excluding Berkshire’s huge mark-to-market losses appeared to buck Q4’s major stock-market selloff. But these growth rates all suffered sharp decelerations from those seen in preceding quarters, suggesting a slowdown is underway. That’s a real problem for stock markets.
Valuations remain dangerously high, deep into bubble territory at the end of Q4. And even after the Q4 earnings were included by late February, near-bubble valuations persisted. That means the likely bear has barely started its stock-price-mauling work to mean revert expensive valuations. On top of that, 2018’s anomalous corporate-tax-cut-transition growth rates are history. All this will continue to pressure stock prices.
Adam Hamilton, CPA
March 11, 2019
Copyright 2000 – 2019 Zeal LLC (www.ZealLLC.com)
The recent rally showed quite a bit of promise.
Gold stocks surged past their long-term moving averages while breadth indicators surpassed all prior bear market peaks (excluding 2016). 71% of the HUI and 81% of GDXJ closed above the 200-day moving average.
GDX and GDXJ looked to be on their way to $25 and $37, with Gold approaching $1360/oz and those breadth figures on the way to hitting 90%.
However, the stock market rebound pushed past its initial resistance and precious metals reversed course yet again before hitting those targets.
Other than 1985-1987 there has never been a bull market in precious metals without their simultaneous outperformance of the stock market.
Gold stocks and Gold especially have trended lower against the stock market since the end of December. The price action suggests this relative weakness should continue over the days and weeks ahead. If the ratios in the chart below lose the 200-day moving average then the next strong support becomes the 2018 autumn lows.
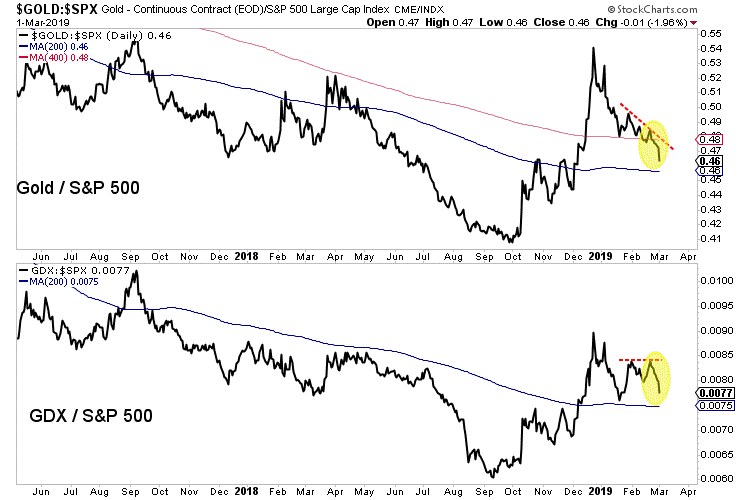
It was also disappointing that Gold peaked prior to touching $1360/oz. This leaves a noticeable lower high on the chart.
Meanwhile, Silver did not confirm Gold’s rise in February. It formed a double top as twice it failed at a confluence of resistance at $16.00/oz.
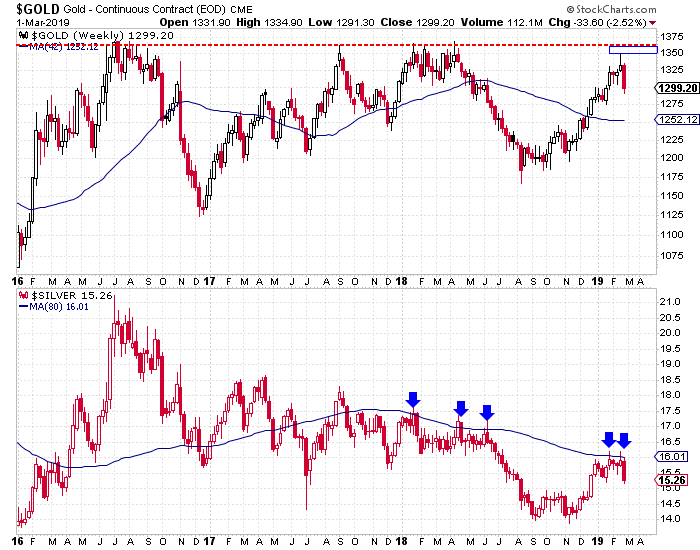
Turning to the gold stocks, we find the price action of the past two weeks is similar to the peaks in summer 2017 and January 2018.
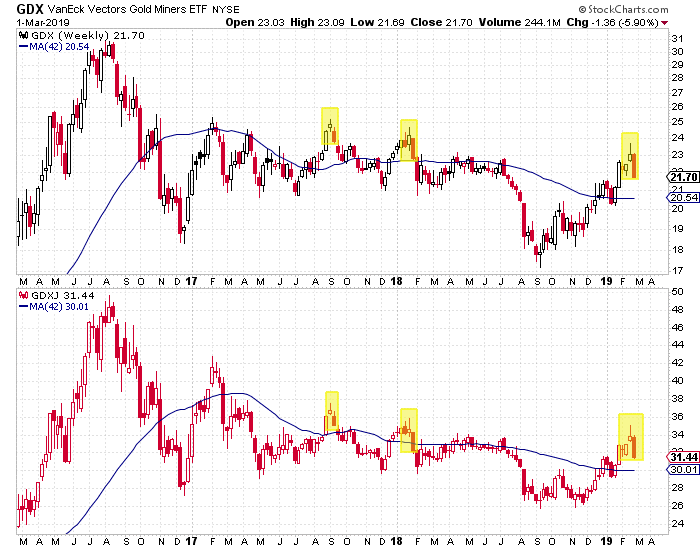
February 2019 figures to mark at least an interim peak in precious metals. The next key support for Gold and the gold stocks are the 200-day moving averages.
If the gold stocks can maintain recent breadth gains then the 200-day moving averages could mark an important low within a fledgling uptrend. If not, then a retest of the 2018 lows (especially in the gold stocks and Silver) becomes a stronger possibility.
As we noted last week, the near-term outlook for the stock market is bullish and in the current context that is negative for precious metals which cannot breakout or begin a bull market until the Fed turns from a pause to rate cuts.
Plenty of values remain in the mining equities and we should see more come about as spring beckons. To learn which juniors have 3x and 5x potential over the next 12-18 months, consider learning more about our premium service.
- The U.S. stock market and bullion swooned yesterday, but the GDX gold stocks ETF was up!
- Gold stocks continue to perform impressively. Rallies look impulsive and corrections feel solid.
- Please click here now. Double-click to enlarge this daily gold chart. Gold has pulled back by about 30% after staging an enormous $170/ounce rally.
- In the scenario shown on this chart, gold could trade down to the 50% retracement area and support zone at $1250-$1260.
- From there, the rally would resume and gold should surge to my next $1400 target zone.
- The next U.S. jobs report is on Friday, and that report is likely to help indicate whether gold range trades or pulls back to $1260 or so before that rally to $1400 takes place.
- Please click here now. Double-click to enlarge. My alternative scenario has the current area as the correction low, and a range trade between $1275 and $1350 would occur over the next few months.
- Even though gold has corrected by about $70 from the $1350 zone, some individual miners have barely corrected at all. This is another sign of a very healthy market.
- Over the weekend, some readers told me they were worried that Goldman Sachs’ influential analysts may be about to lower their $1425 gold price target back down to $1050.
- With thanks to the forexLive team, I’d like to put that worry to rest. For the good news, please click here now. Not only are Goldman’s analysts still positive about gold…
- They are raising their target prices!
- The Western gold community can relax and enjoy this price pullback because there’s nothing to fear and everything is fundamentally solid.
- Please click here now. There’s an important double bottom pattern in play on this FXI-NYSE Chinese stock market chart.
- I’ll also note that it closed higher yesterday while the American Dow fell hard. Tariffs progress, government stimulus, and bigger weighting in international indexes should push the FXI higher.
- In turn, that’s going to put Chinese citizens in a positive mood and make them eager to buy more gold.
- Please click here now. Double-click to enlarge this superb SIL silver stocks ETF chart.
- All silver stock enthusiasts should feel confident and happy when looking at this chart. That’s because the slope of the current uptrend is solid and sustainable.
- Violent rallies like the one in 2016 are not sustainable. They cause a lot of investor price chasing as they peak and tend to end very badly.
- The fundamentals of this market are much different from 2016. That’s why key research analysts at firms like Goldman are so positive on gold. Where gold goes, silver tends to follow.
- Silver can outperform gold without leading it. What I mean by that statement is that gold can be the first metal to make a new intermediate trend high, but the percentage gains for that move are bigger for silver. When silver leads gold, the market tends to be more speculative and that’s not healthy.
- Gains that are sustained come from a market where gold leads the trending action, and that’s what is happening now.
- Please click here now. Monster bank BMO says that the combination of falling mine supply and rising jewellery demand will provide a “tailwind” for the price of gold, propelling it higher into 2021.
- Some bank analysts feel mine supply will decline, some see it static, and some see it rising, but only slightly, but almost all of them see demand bigger than supply. Government debt and de-dollarization are likely to become much more significant drivers of demand by 2021 than they are now. Both the fear trade and the love trade should be solid tailwinds for gold in the years ahead.
- Please click here now. Double-click to enlarge. GDX bounced nicely off the $21.50 support zone yesterday. More gyration is likely, but I think GDX will rise above $24 before gold moves over $1350. This market is solid. Gold stocks look like tourists in a bus climbing up a mountain of fiat at a leisurely pace. My suggestion: Enjoy the ride!
Special Offer For Website Readers: Please send me an Email to freereports4@gracelandupdates.com and I’ll send you my “Golden Ten Baggers!” report. I highlight key gold stocks trading under $10 that are poised for ten bagger gains as gold moves to $1400! I include buy and sell tactics to help investors manage the action professionally!
Thanks!!
Stewart Thomson
Email:
Stewart Thomson is a retired Merrill Lynch broker. Stewart writes the Graceland Updates daily between 4am-7am. They are sent out around 8am-9am. The newsletter is attractively priced and the format is a unique numbered point form. Giving clarity of each point and saving valuable reading time.
Risks, Disclaimers, Legal
Stewart Thomson is no longer an investment advisor. The information provided by Stewart and Graceland Updates is for general information purposes only. Before taking any action on any investment, it is imperative that you consult with multiple properly licensed, experienced and qualified investment advisors and get numerous opinions before taking any action. Your minimum risk on any investment in the world is: 100% loss of all your money. You may be taking or preparing to take leveraged positions in investments and not know it, exposing yourself to unlimited risks. This is highly concerning if you are an investor in any derivatives products. There is an approx $700 trillion OTC Derivatives Iceberg with a tiny portion written off officially. The bottom line:
Are You Prepared?
The battle for Cornerstone Capital Resources Inc. (TSXV-CGP, OTC-CTNXF) is heating up following a preliminary takeover bid from joint venture partner SolGold. However, Cornerstone is likely to reject the overture, based on its latest press release on the matter and on comments by Glen McKay, a co-founder and former president and CEO of the junior mining exploration company.
Cornerstone has a joint venture agreement with SolGold on the Cascabel project in Ecuador, which is believed to be one of the world’s largest gold-copper deposits. SolGold is the operator of the Cascabel project and owns a majority stake. Larger gold players are also involved, with both BHP Billiton and Newcrest Mining holding minority positions in SolGold.
In a February 8 press release, Cornerstone noted that SolGold had issued a press release of its own on January 31, announcing its intention to commence an offer to acquire all of the issued and outstanding common shares of Cornerstone in an all-stock transaction, providing 0.55 of a SolGold share for every one Cornerstone share tendered.
“As previously announced by Cornerstone, shareholders of the company that collectively own over 50% of the company’s outstanding shares have notified Cornerstone that they will not support the terms announced by SolGold,” the Cornerstone release stated. “As a result, if SolGold proceeds to make a formal offer on these terms, the company believes that SolGold’s offer would be incapable of being successfully completed.”
The Board of Directors of Cornerstone said it had assessed the SolGold proposal with its financial advisor and believes that the proposal significantly undervalues Cornerstone. The Cascabel Project is owned by SolGold’s 85% owned Ecuador subsidiary Exploraciones Novomining S.A. (ENSA). The remaining 15% of ENSA is currently held by Cornerstone. In addition, Cornerstone owns approximately 9.2% of the outstanding shares of SolGold. In effect, Cornerstone has a combined direct and indirect 23% interest in the Cascabel concession.
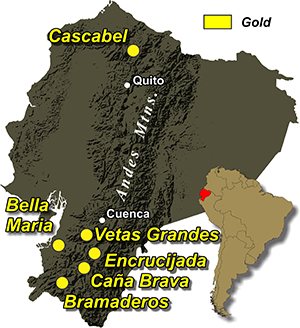
Cornerstone said it was disappointed by SolGold’s latest press release, stating that it contains “numerous inaccurate and misleading statements and baseless innuendo.” Still, Cornerstone said it remains open to constructively discussing with SolGold and other potential bidders any value enhancing transaction that would garner the support of Cornerstone’s shareholders.
In an interview, Cornerstone co-founder and former chief executive Glen McKay called the SolGold preliminary offer a poor bid, or an offer so far below the current value that under most circumstances it will be rejected. McKay is a major shareholder and a special advisor to Cornerstone. “I know that we can identify 60% of shareholders who have been surveyed and unanimously we are going to reject the offer, if SolGold comes with it,” McKay said. “They may still come with an offer, but it will be a waste of their money to do so and will be really embarrassing for SolGold.” An additional factor is that SolGold is mostly an illiquid stock so that even if Cornerstone accepted the deal there would be little chance of current CGP shareholders being able to monetize their new shares of SolGold in the short term.
The price SolGold is offering is not based on the fair value of the Cascabel project, McKay said. In addition, he says there are a number of issues with the joint venture agreement between SolGold and Cornerstone that have not been fulfilled.
This may not be an issue in the future, if BHP Billiton or Newcrest or some other suitor comes in with an offer for both companies and consolidates them. But for now, McKay says SolGold is not in a position of strength and the deal as it stands is “not going to happen.”
Stressing that he can’t predict the future, McKay nonetheless believes that another bid for Cornerstone will take place, perhaps as soon as this year. Although BHP Billiton has signed a deal which rules out a takeover bid until November, Newcrest Mining is under no such restriction.
Newcrest has signed two major joint venture agreements with Cornerstone in the last couple of months, McKay notes, including an agreement on the Cana Brava project in Ecuador and the Miocene property in Chile.
McKay sees the two deals as an indication that Newcrest is positioning itself for a bid so that they are in a good place in terms of their relationship with Cornerstone. “If I had to make a bet, I would say that Newcrest is the front runner and it may be that they will do it as a partnership,” he says. “I think something will happen before the end of 2019. We’re hoping that another interested player comes in and starts a bidding war.”
With consolidation on the rise in the metals sector, a SolGold-Cornerstone merger perhaps makes sense, although SolGold may have to sweeten its offer to cement the deal. But Cornerstone’s initial negative response suggests even that won’t be enough. For now, interested observers will have to be content to wait for another missive from SolGold to see if the offer changes or is simply shelved.
Whatever the outcome, McKay believes that Cornerstone will spin off its other assets before a sale of its interest in Cascabel due to the potential of other properties that are under other JVs such as the Bramaderos project in Ecuador. Malcolm Norris, the CEO of Cornerstone partner (Sunstone) on the project was the CEO of SolGold in 2012 when Cornerstone completed a JV deal on Cascabel. Norris and Cornerstone VP Exploration Yvan Crepeau are due the credit for the discovery of Cascabel, McKay says. They are hoping to replicate that success on Bramaderos.
Here are today’s videos and charts (double-click to enlarge):
SFS Key Charts, Signals, & Video Analysis
I’m quite excited about the pullback in gold because the fundamentals are getting better and the technical action is healthy.
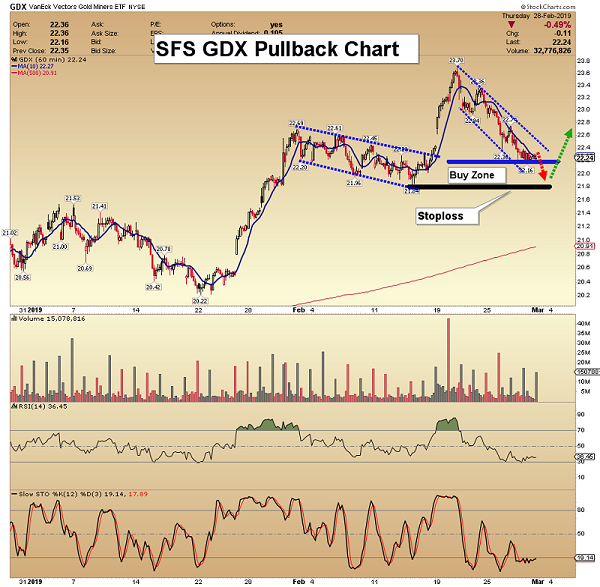
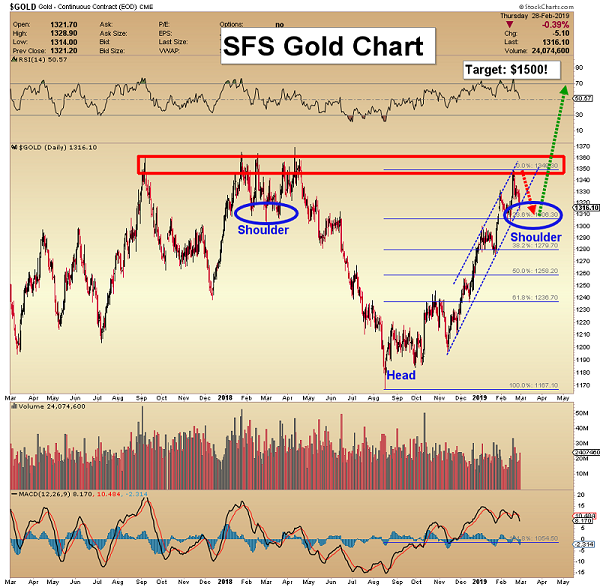
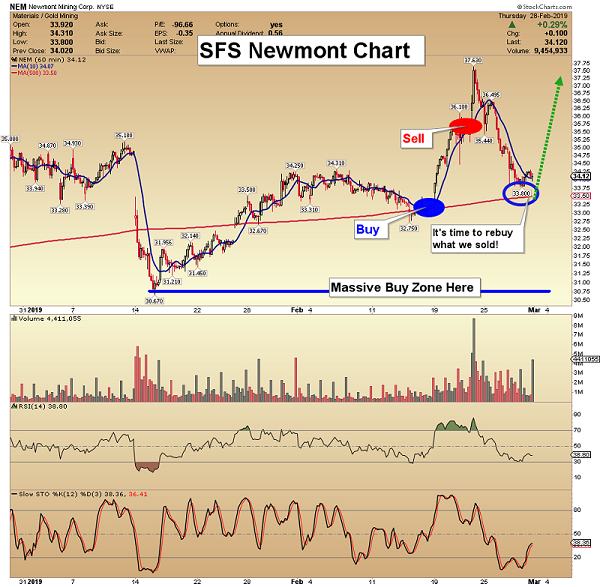
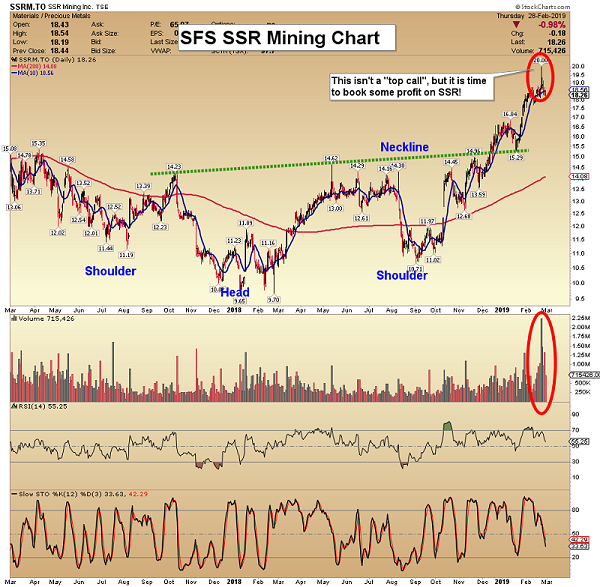
SF60 Key Charts, Signals, & Video Analysis
Kirkland is a leader in the gold stock sector and it’s now in one of the important Investor’s Business Daily growth stock indexes.
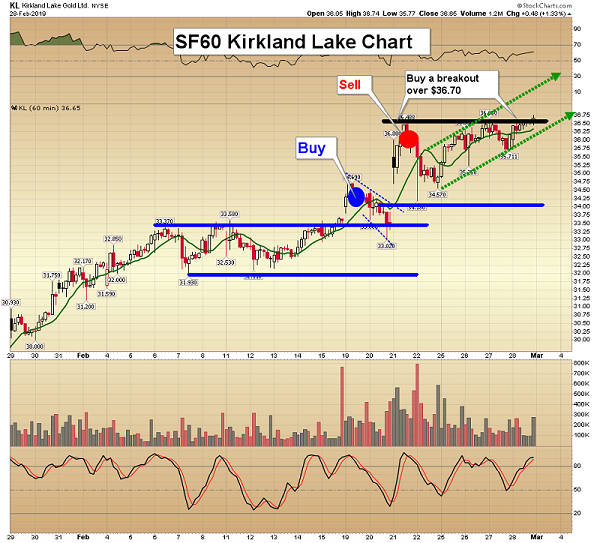
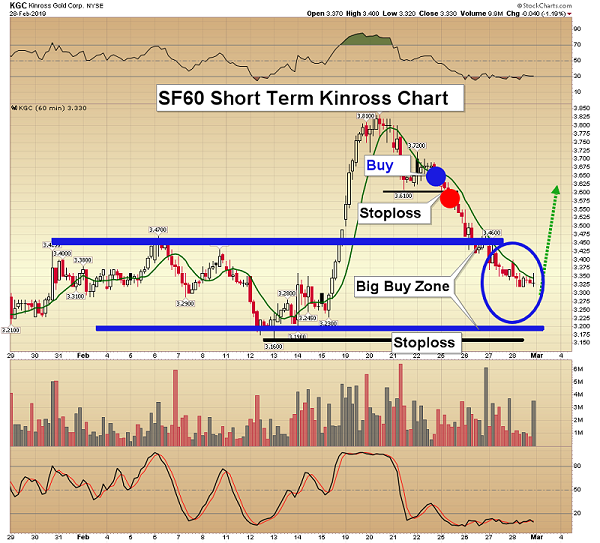
SF Trader Key Charts, Signals, & Video Analysis
Our positioning into DUST was timely!
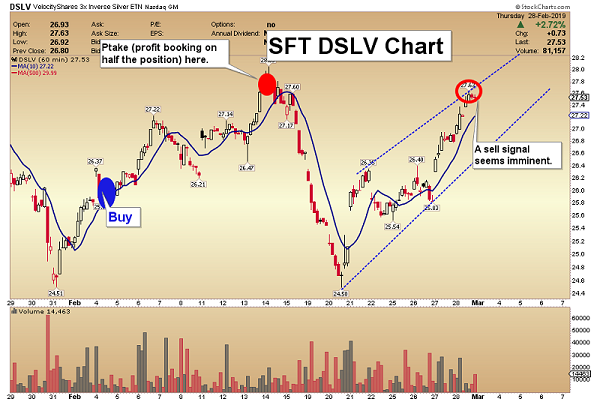
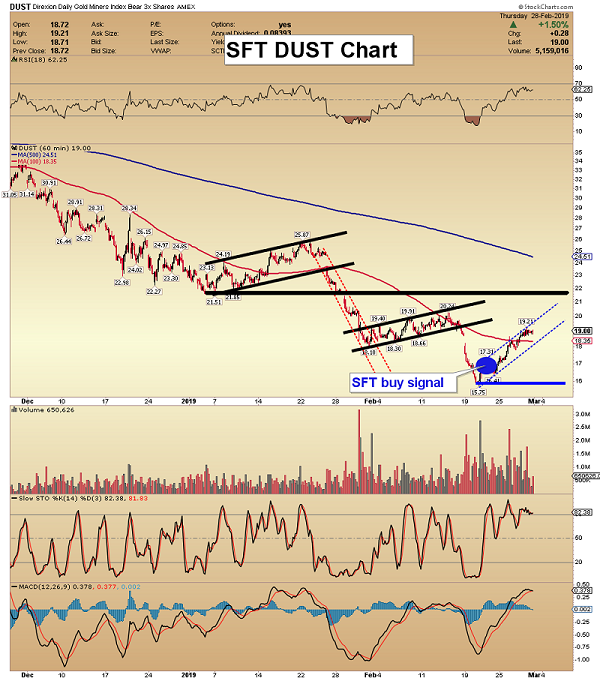
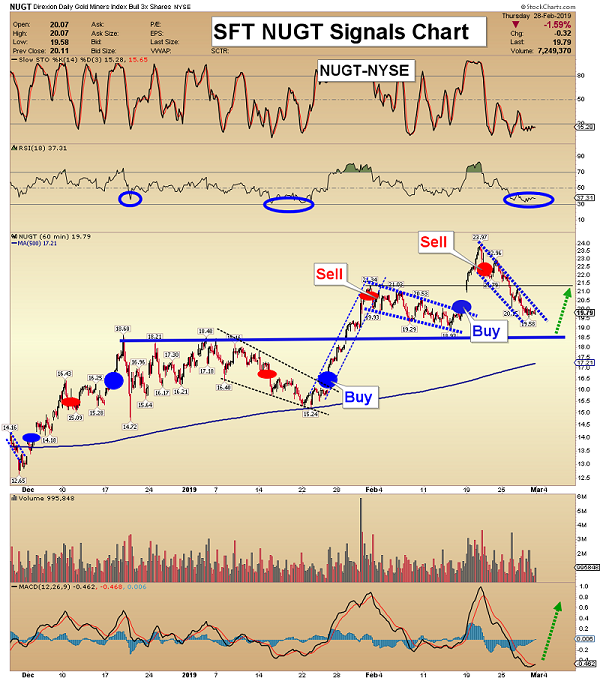
SFJ Key Charts, Signals, & Video Analysis
Prudent profit booking into strength in this gold bull market is important.
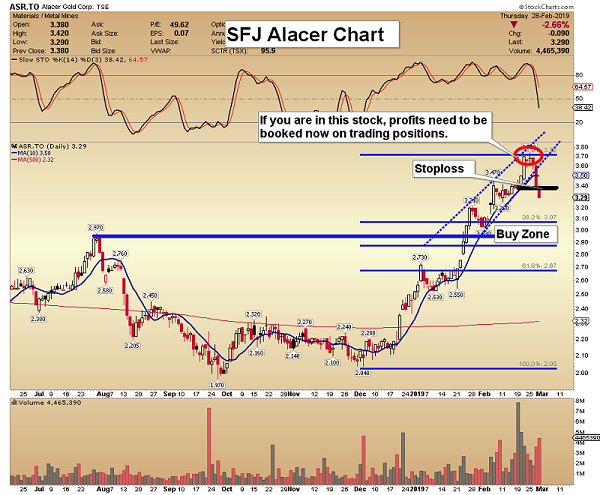
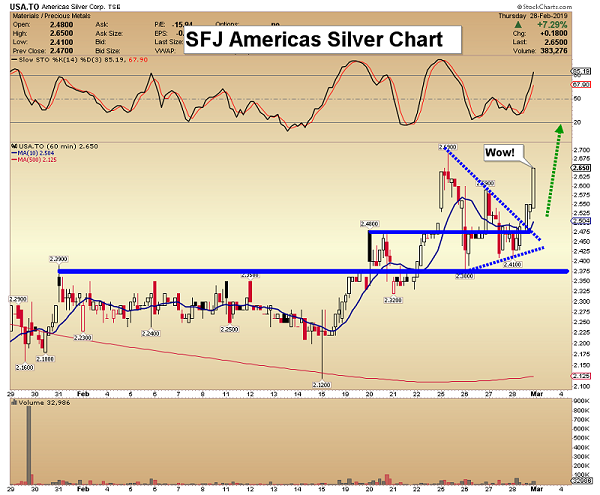
Thanks,
Morris Hubbartt
Unique Introduction For Website Readers: Send me an email to signals@superforcesignals.com and I’ll send you 3 of my next Super Force Surge Signals free of charge, as I send them to paid subscribers. Thank you!
Stay alert for our Super Force alerts, sent by email to subscribers, for both the daily charts on Super Force Signals at www.superforcesignals.com and for the 60 minute charts at www.superforce60.com
Frank Johnson: Executive Editor, Macro Risk Manager.
Morris Hubbartt: Chief Market Analyst, Trading Risk Specialist.
Email:
The gold miners’ stocks have been climbing higher on balance, enjoying a solid upleg that is gathering steam. That’s fueling improving sentiment, driving more interest in this small contrarian sector. This gold-stock upleg is likely to grow in coming months, partially because of very-favorable spring seasonals. The gold stocks’ second-strongest seasonal rally of the year typically unfolds between mid-March to early June.
Seasonality is the tendency for prices to exhibit recurring patterns at certain times during the calendar year. While seasonality doesn’t drive price action, it quantifies annually-repeating behavior driven by sentiment, technicals, and fundamentals. We humans are creatures of habit and herd, which naturally colors our trading decisions. The calendar year’s passage affects the timing and intensity of buying and selling.
Gold stocks exhibit strong seasonality because their price action mirrors that of their dominant primary driver, gold. Gold’s seasonality generally isn’t driven by supply fluctuations like grown commodities experience, as its mined supply remains fairly steady year-round. Instead gold’s major seasonality is demand-driven, with global investment demand varying dramatically depending on the time in the calendar year.
This gold seasonality is fueled by well-known income-cycle and cultural drivers of outsized gold demand from around the world. The seasonal gold year starts in late July as Asian farmers begin reaping their harvests. They plow some of their surplus income into gold. That’s soon followed by the famous Indian wedding season in autumn, with its heavy gold buying for brides’ dowries during marriage-auspicious festivals.
After that comes the Western holiday season, where gold jewelry demand surges for Christmas gifts for wives, girlfriends, daughters, and mothers. Following year-end, Western investment demand balloons after bonuses and tax calculations as investors figure out how much surplus income the prior year generated for investment. Then after that Chinese New Year gold buying flares up heading into February.
These understandable cultural factors drive surges of outsized gold demand between late summer and late winter. But interestingly there is one more gold-demand spike in spring. Over the years I’ve seen a variety of theses explaining this mid-March-to-late-May gold rally, but nothing definitive like for the rest of the year’s seasonality. As silly as it sounds, I suspect spring itself is the reason for this demand surge.
Sentiment exceedingly influences investing, which requires optimism for the future. Investors won’t risk deploying their scarce capital unless they believe it will grow. And the glorious expanding sunshine and warming temperatures of spring naturally breed optimism. The vast majority of the world’s investors are far enough into the northern hemisphere that spring has a major psychological impact, buoying their spirits.
Since it is gold’s own demand-driven seasonality that fuels the gold stocks’ seasonality, that’s logically the best place to start to understand what’s likely coming. Price action is very different between bull and bear years, and gold remains in a young bull market. After being crushed to a 6.1-year secular low in mid-December 2015 on the Fed’s first rate hike of this cycle, gold blasted 29.9% higher over the next 6.7 months.
Crossing the +20% threshold in March 2016 confirmed a new bull market was underway. Gold corrected after that sharp initial upleg, but normal healthy selling was greatly exacerbated after Trump’s surprise election win. Investors fled gold to chase the taxphoria stock-market surge. Gold’s correction cascaded to mammoth proportions, hitting -17.3% in mid-December 2016. But that remained shy of a new bear’s -20%.
Gold’s last mighty bull market ran from April 2001 to August 2011, where it soared 638.2% higher! And while gold consolidated high in 2012, that was technically a bull year too since gold just slid 18.8% at worst from its bull-market peak. Gold didn’t enter formal bear-market territory at -20% until April 2013, thanks to the crazy stock-market levitation driven by extreme distortions from the Fed’s QE3 bond monetizations.
So the bull-market years for gold in modern history ran from 2001 to 2012, skipped the intervening bear-market years of 2013 to 2015, and resumed in 2016 to 2019. Thus these are the years most relevant to understanding gold’s typical seasonal performance throughout the calendar year. We’re interested in bull-market seasonality, because gold remains in its latest bull today and bear-market action is quite dissimilar.
Prevailing gold prices varied radically throughout these modern bull-market years, running between $257 when gold’s last secular bull was born to $1894 when it peaked a decade later. All these years along with gold’s current bull since 2016 have to first be rendered in like-percentage terms in order to make them perfectly comparable. Only then can they be averaged together to distill out gold’s bull-market seasonality.
That’s accomplished by individually indexing each calendar year’s gold price action to its final close of the preceding year, which is recast at 100. Then all gold price action of the following year is calculated off that common indexed baseline, normalizing all years regardless of price levels. So gold trading at an indexed level of 105 simply means it has rallied 5% from the prior year’s close, while 95 shows it’s down 5%.
This chart averages the individually-indexed full-year gold performances in those bull-market years from 2001 to 2012 and 2016 to 2018. 2019 isn’t included yet since it remains a work in progress. This bull-market-seasonality methodology reveals that gold’s spring rally is its last push higher before the summer doldrums arrive. While this is gold’s smallest seasonal rally of the year, the gold stocks greatly leverage it.
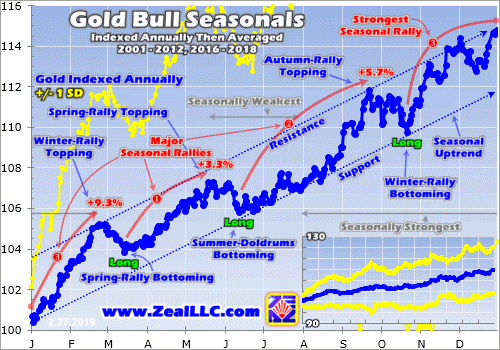
During these modern bull-market years from 2001 to 2012 and 2016 to 2018, gold’s spring rally tended to start in mid-March on average. From that major seasonal low following the winter rally, gold often starts grinding higher before its gains accelerate through April and much of May. This spring rally has generally run its course by late May. Across the 15 bull years in this study, gold averaged modest spring rallies of 3.3%.
This spring rally unfolds rapidly, with an average duration of just 2.2 months. That makes it the smallest and shortest of gold’s three major seasonal rallies, falling way behind the champion 9.3% winter rally that precedes it and the strong 5.7% autumn rally that follows the summer doldrums. Nevertheless, it is still well worth trading. 3.3% gains do really make a difference, and naturally about half of years exceed this mean.
On average gold’s spring-rally bottoming occurred on March’s 10th trading day, which will be the 14th this year. If today’s seasonals stay true to form, gold will slump in the first couple weeks of March. But that seasonal pullback between the winter and spring rallies is pretty modest, averaging just 1.3% over a few weeks at most. The resulting mid-March lull in gold prices spawns an excellent gold-stock buying opportunity.
Gold’s average seasonal performances in March, April, and May during these modern bull-market years ran -0.3%, +1.6%, and +0.6%. While even April is just gold’s 6th-best month of the year, it still has an outsized impact on gold-stock prices. This has to be sentiment-driven. Optimism runs high in the spring anyway, and plenty of bullish psychology lingers following gold stocks’ strong winter rally in preceding months.
This year’s spring gold rally has excellent potential to come in on the large side. Gold investment demand surged in Q4’18 as global stock markets crumbled. They are likely rolling over into a long-overdue major bear. When investors start worrying its next major downleg is brewing, they will again flood into gold to continue diversifying their stock-heavy portfolios. Surging gold investment demand propels gold strongly higher.
That may push gold to the verge of a major decisive breakout to new bull highs! At best in February, gold hit $1341 on close. Assuming a 1.3% early-March seasonal pullback before a typical 3.3% spring rally, gold would hit $1367. That’s just above its bull-to-date peak of $1365 seen way back in early July 2016. Investor and speculator interest in gold, and capital inflows into it, will explode as new bull highs are achieved.
And as goes gold, so go gold stocks. Gold stocks also exhibit strong seasonality, which is of course the direct result of gold’s own seasonality. Since gold-mining costs are largely fixed when mines are being planned, fluctuations in gold’s price flow directly into amplified moves in gold-mining profits. Higher gold prices drive much-higher earnings for the gold miners, which attract in more investors to bid up stock prices.
The ironclad historical relationship between the price of gold, gold-mining profitability, and therefore gold-stock price levels is exceedingly important to understand. If you need to get up to speed, I wrote an essay looking at gold-stock price levels relative to gold early last month. Fundamentally gold stocks are leveraged plays on gold, and greatly outperform in the spring on gold’s seasonals and general optimism.
This next chart applies this same bull-market-seasonality methodology used on gold directly to the gold stocks. It looks at the average annual indexed performance in the flagship HUI NYSE Arca Gold BUGS Index in these same bull-market years of 2001 to 2012 and 2016 to 2018. Using the HUI is necessary because the popular GDX VanEck Vectors Gold Miners ETF was only born in May 2006, missing bull years.
That was halfway into the last secular gold-stock bull, which ran from November 2000 to September 2011. Over that long 10.8-year span, the HUI skyrocketed a life-changing 1664.4% higher on gold’s parallel 638.2% bull! Gold-stock prices naturally mirror and amplify gold action since it dominates gold-mining earnings. That’s true across entire secular bulls, within individual uplegs, and even in calendar-year seasons.
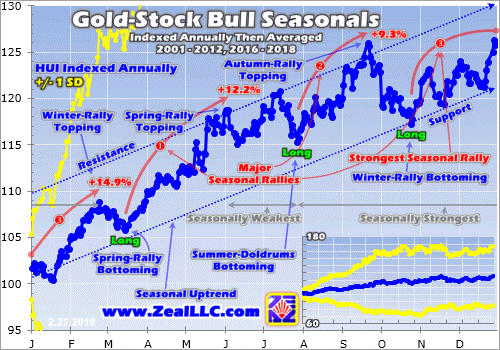
Gold stocks’ seasonal spring rally is much stronger than gold’s, buttressing that spring-optimism-drives-stock-buying thesis. Between mid-March and early June, the gold stocks have averaged hefty 12.2% rallies in these 15 modern bull-market years. That makes for exceptional 3.7x upside leverage to gold’s 3.3% seasonal spring rally! Interestingly this is gold stocks’ best seasonal leverage to gold’s gains by far.
While the HUI averaged 14.9% surges during gold’s winter rally, that only made for 1.6x upside leverage to gold’s big 9.3% gain. And the HUI’s 9.3% average gain during gold’s autumn rally also only amplified gold’s 5.7% gain by 1.6x. So while the gold-stock spring rally’s 12.2% average gains rank second out of these three seasonal rallies, it offers the most bang for the buck in gold-stock upside compared to gold!
Like gold, the gold miners’ stocks suffer a seasonal slump from late February to mid-March. That has averaged 2.7% in these modern bull-market years. So don’t be worried into selling if we see a typical early-March slump in this sector. That’s usually just a mild pullback before gold stocks’ strong spring rally gets underway. Any seasonal weakness is a great opportunity to add new gold-stock trades relatively low.
The gold stocks’ post-winter-rally pre-spring-rally lull tends to bottom on March’s 11th trading day, which will be the 15th this year. From there the HUI surges 12.2% higher on average over the next 2.7 months into early June. Interestingly the gold stocks tend to top a couple weeks after gold peaks in late May. That’s likely the result of momentum fueled by spring optimism and strong gains since the prior summer.
Assuming this year’s gold-stock seasonals conform to their bull-year precedent in coming months, some impressive levels are coming before summer. If the HUI first retreats 2.7% from its February peak into mid-March before powering 12.2% higher into early June, we are looking at 193.0 heading into this year’s summer doldrums. Those would be the best gold-stock levels since February 2018 on merely normal seasonals.
But this year’s spring seasonal rally has real potential to grow much larger than usual. Of course if gold’s own spring rally becomes outsized due to stock-market-selloff-driven surging gold investment demand, the gold miners’ stocks will leverage those gains. And the higher gold stocks climb, the more bullish their psychology. Speculators and investors alike love chasing momentum and piling into winning trades en masse.
More importantly this sector’s strengthening fundamentals should support bigger seasonal gains. Gold’s price averaged $1228 in Q4’18. While the gold miners are still finishing reporting their results for last quarter and full-year 2018, odds are their collective all-in sustaining costs will remain flat. Every quarter I wade through the latest results of the major gold miners of GDX, and usually publish the Q4 ones in mid-March.
Over the last four fully-reported quarters ending in Q3’18, the GDX gold miners averaged AISCs of $858, $884, $856, and $877. That makes for an $869 mean, but let’s round that to $875 for easier calculations. At Q4’s average gold price of $1228 and $875 AISCs, the major gold miners of GDX and the HUI likely earned profits near $353 per ounce last quarter. But so far in Q1, the average gold price has surged to $1305!
With AISCs this quarter likely to be stable too around that usual $875, the gold miners are likely earning profits of $430 per ounce so far in Q1. That is a massive 21.8% higher quarter-on-quarter! If investors expect Q1’19 earnings to come in this strong, there’s no way gold stocks will merely see a seasonally-average spring rally. Strong operational results in both Q4 and Q1 reporting should fuel a major gold-stock bid.
Seasonal spring rallies can balloon very large in rising-gold-price environments, which drive excellent fundamentals for the gold miners. The last example happened in spring 2016, when the HUI powered 32.3% higher within its normal spring-rally span! That was just a fraction of a monster 182.2% upleg that skyrocketed over just 6.5 months. Gold-stock buying is fast and furious when momentum fuels enthusiasm.
This last chart breaks down gold-stock seasonality into even-more-granular monthly form. Each calendar month between 2001 to 2012 and 2016 to 2018 is individually indexed to 100 as of the previous month’s final close, then all like calendar months’ indexes are averaged together. Slicing up seasonal tendencies this way shows May has actually averaged gold stocks’ strongest month of the year in modern bull-market years!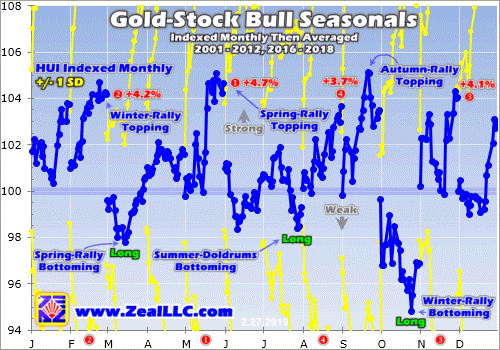
During the 15 Aprils in these modern gold bull-market years, the gold stocks as measured by the HUI saw average gains of 1.6%. But the lion’s share of the spring-rally gains came in May, where average gains nearly tripled to 4.7%! For decades if not longer, May has been one of the best and most-important months to be heavily long gold miners’ stocks. Only February and November have managed to rival it.
The key to gold stocks’ spring rally is to get your capital deployed by mid-March, when gold stocks swoon to their spring-rally bottoming. In intra-month terms the initial gains are often fast in late March as gold stocks rebound out of their seasonal lull. But then the spring rally tends to slow down in mid-April, which invariably discourages impatient and short-sighted traders. The real gains come in May, when gold stocks surge.
Of course the standard seasonality caveat applies that these are mere tendencies, not primary drivers of gold or gold stocks. Seasonal tailwinds can be easily drowned out by bearish sentiment, technicals, and fundamentals. Seasonality doesn’t always work, especially when it doesn’t align with the primary drivers of sentiment, technicals, and fundamentals in that order. Thankfully that certainly isn’t the case this year.
Gold-stock sentiment is growing increasingly bullish as this sector’s solid upleg gathers steam. Seeing higher lows and higher highs on balance further feeds into positive psychology, and traders love to chase momentum in rallying sectors. Mounting stock-market fears of a young bear getting underway should continue to push gold investment demand higher. The resulting higher gold prices really boost mining profits.
Outsized gold-stock gains during this spring-rally timeframe are fully justified fundamentally when gold itself is rallying. When sentiment, technicals, fundamentals, and seasonals all align behind gold stocks, they often surge dramatically higher. Unfortunately most speculators and investors won’t realize this until most of the spring-rally gains have already been won. Buy low in mid-March instead of buying high in early June!
While you can ride gold stocks’ spring rally higher in GDX, the major miners dominating it are struggling to grow their production. Far-better gains will be won in smaller mid-tier and junior gold miners with superior fundamentals. The best are increasing their output through new mine builds and expansions, which also lowers their costs further boosting their profits. Their upside potential utterly trounces that of the GDX majors.
The earlier you get deployed, the greater your gains will be. That’s why the trading books in our popular weekly and monthly newsletters are currently full of better gold and silver miners mostly added in recent months. The gains we won in 2016 were amazing the last time American stock investors returned to gold. Our newsletter stock trades that year averaged +111.0% and +89.7% annualized realized gains respectively!
The gold-stock gains should get really big as today’s young gold and gold-stock uplegs grow. The gold miners are the last undervalued sector in these still-expensive stock markets, and rally with gold during stock-market bears unlike anything else. To multiply your wealth in the stock markets you have to do your homework and stay abreast, which our newsletters really help. They explain what’s going on in the markets, why, and how to trade them with specific stocks. You can subscribe today for just $12 per issue!
The bottom line is gold stocks often experience a strong spring rally seasonally. This is driven by gold’s own seasonality, where outsized investment demand arises at certain times during the calendar year. Gold usually enjoys a solid spring rally likely driven by the universal optimism this season brings. And since gold drives gold miners’ profitability, their stock prices naturally follow it higher while amplifying its gains.
This year’s coming spring rally is due to start in mid-March, with great potential to grow much larger than normal. Gold-stock sentiment is slowly improving as this sector’s current upleg continues grinding higher on balance. And higher gold prices driven by renewed investment demand on stock-market-selloff fears is really boosting gold-mining earnings. All this with strong seasonal tailwinds should fuel an outsized spring rally.
Adam Hamilton, CPA
March 4, 2019
Copyright 2000 – 2019 Zeal LLC (www.ZealLLC.com)
Back in 2013 I recall having a bearish view on the stock market due to extremely bullish sentiment readings. The market completely ignored that, made a major breakout through 13 year resistance and continued running for years.
Lesson learned.
Turning to Gold, we find something similar during major breakouts in 2005, 2007 and 2009. In the chart below we plot Gold along with its net speculative position (as a percentage of open interest) and the widely followed daily sentiment index.
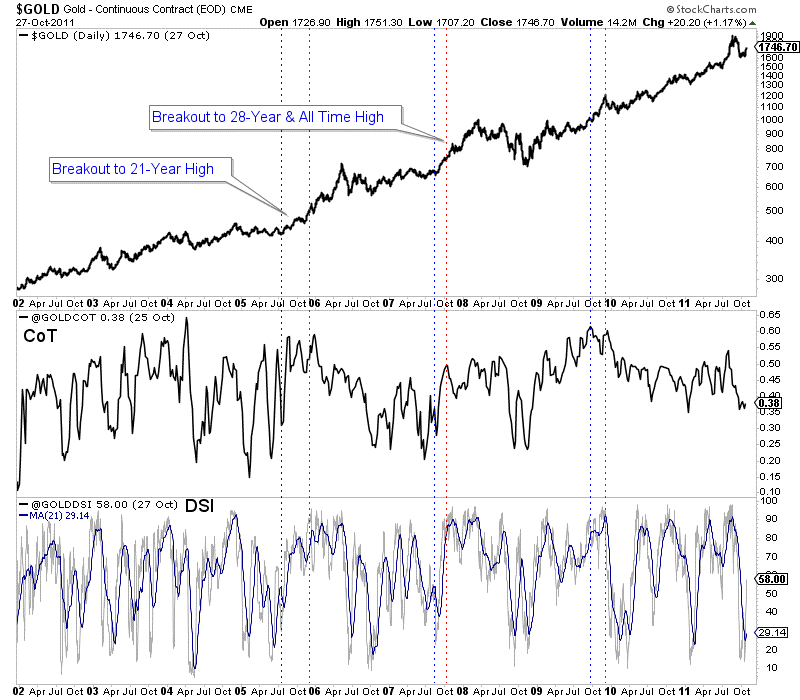
In August 2005 and the start of 2006, the net speculative position in Gold reached (excluding 2004) what were the highest levels since the start of the data in 1987.
In late 2007, the net speculative position was not at an extreme but the daily sentiment index spent quite a bit of time around 90% bulls immediately prior to Gold breaking out to a new all time high.
Both the net speculative position and daily sentiment index were very elevated in the fall of 2009, immediately prior to Gold breaking out above its 2008 peak. The net speculative position then was at its second highest level since 1987.
As of February 5, when the Gold price closed at $1319/oz, the net speculative position in Gold was 27% of open interest. Gold gained $30/oz since then but that is well below the 55%-60% peak levels seen in 2016, 2012, 2009 and 2004-2006.
While that is encouraging, history shows that if and when Gold breaks its resistance ($1375-$1400/oz) sentiment indicators figure to be close to bullish extremes. When a market is coming out of a bad bear market or on the cusp of a multi-year breakout, bullish sentiment isn’t necessarily bearish.
In fact, a market that cannot register bullish sentiment extremes is one that may not be strong enough to breakout.
Circling back to the present, the one thing that can prevent Gold from breaking out is renewed underperformance against the stock market. In the chart below we plot Gold and GDX against the S&P 500.
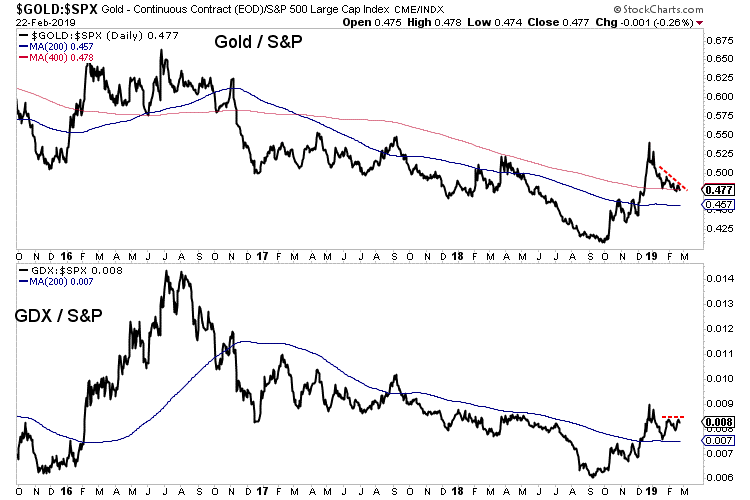
Precious metals stopped outperforming the stock market in late December and the Gold to S&P 500 ratio appears weak and likely to weaken further.
The S&P 500 recently cleared its moving average resistance and its advance decline line hit a new all time high. These things suggest higher prices in the near future and that, rather than bullish sentiment would provide resistance to Gold over the next few months.
Although Gold will not break resistance in that scenario, we should keep an eye on the gold stocks which have shown improving breadth and relative strength. Plenty of great values remain and there is still plenty of time to position yourself to take advantage. If a huge breakout is coming later in the year then the next few months may be your last chance. To learn what stocks we are buying and have 3x to 5x potential consider learning more about our premium service.
- The biggest driver of major markets right now is the possibility of a U.S.-China trade deal.
- On that note, please click here now. The U.S. government’s wild launch of tariff taxes caused global markets to swoon in the first half of 2018. Gold and the Chinese stock market were hurt more than a lot of other markets.
- Gold has done well with QE, QT, falling rates, and rising rates, but tariff taxes hurt the Chinese economy. That put a damper on the growth of Chinese gold demand.
- The Chinese stock market is now rallying in anticipation of a trade deal, but even if there is no deal (unlikely), the Chinese government has embarked on a significant stimulus program.
- U.S. money managers are getting more interested in the Chinese stock market because of that stimulus. A trade deal that includes more intellectual property protection would create a huge U.S. stock market rally. More importantly, it would create a huge rally in the Chinese market and that would increase gold demand significantly.
- If the Fed hikes or signals that QT is going back to auto pilot mode, institutional money managers will buy gold because of growing concerns about the U.S. government’s ability to finance itself, and because the Fed’s move would hurt low interest rate loans for U.S. stock market buybacks. A situation like September 2018 would occur, with gold rallying and stock markets tanking.
- On the other hand, a pause in hikes and an earlier-than-expected end to QT is also viewed as good news for gold.
- Additionally, even without a trade deal, China’s economy is becoming consumer-oriented, and that means more imports and less exports. In turn, that means less need for the purchase of U.S. government debt.
- A trade deal would speed up this process.
- The U.S. government’s ability to finance itself without foreign government purchases of its bonds is becoming a significant concern for powerful money managers like Larry Fink of Blackrock.
- The bottom line: A trade deal is good for stock markets and gold, but it likely flips the U.S. government’s financial situation out of the fry pan… and into the fire!
- Clearly, the current global-macro situation is extremely positive for gold. What about the technical situation? For the answer to that question, please click here now. Double-click to enlarge this daily gold chart.
- It really doesn’t matter whether gold makes a beeline for my new $1400 target immediately, or whether there’s a “pitstop” in the $1300-$1280 support zone.
- It doesn’t matter because the big picture fundamentals and technicals are outrageously positive, so there’s no need for fear amongst investors.
- Please click here now. Double-click to enlarge. The higher-price implications of the technical action on this weekly gold chart are obvious. The $1000/ounce price zone is major support, $2000 is resistance, and $3000 is the target price!
- The world’s need for dollars is declining, for a multitude of reasons. Please click here now. Whether it’s caused by the simple but gargantuan growth of the Chinese and Indian economies, or the U.S. government’s “My way or the highway” approach to sanctioning Russia, bank and government entities around the world are steadily distancing themselves from the dollar.
- Gold is the best way for individuals, banks, and governments to do that. The buy programs of emerging central banks are only in their infancy, and the tonnage being bought is consistently rising.
- As somebody who aggressively bought the U.S. stock market right into the October 2008-March 2009 lows, I can assure the Western gold community that there is no event to fear in the current gold market. The market is rock-solid.
- The rise of the Eastern economies is a titanic force that is creating both de-dollarization and demand growth for gold. Citizens of the East view gold as the best investment asset from both a risk and reward perspective. Their view is now being adopted by more and more Western money managers. In time (and not much time), this positive view of gold will also be the view of the average American citizen. Gold bashers like Warren Buffett prospered in the fiat era, but that era is waning fast. A new bull era is being born and all roads lead to gold.
- Please click here now. Double-click to enlarge this interesting GDX chart. Merger-mania is underway in the gold and silver mining stocks and there’s “bull flag mania” on the daily GDX chart!
- Larger gold mining entities are required to service the global demand growth for gold. I’ve predicted that Chinese miners, banks, and industrial companies will ultimately be involved in mergers with Western mining companies.
- In the coming years, gold miners could become as important as the giant base metal miners.
- Please click here now. Double-click to enlarge. That’s another look at the GDX daily chart, with the support zones highlighted. Mining stock enthusiasts should be buyers of their favourite miners any time GDX trades at a support zone.
- Gold stock investors should understand that the current market is not like the early 2000s, 2007, or 2016. This is a market like the 1970s, and the upside fun… has only just begun!
Special Offer For Website Readers: Please send me an Email to freereports4@gracelandupdates.com and I’ll send you my free “Gold Stocks Merger Mania!” report. I highlight ten fabulous gold miners that are ripe to be taken over, with key buy and sell points for each stock! Email me today, and I’ll send it to you today!
Stewart Thomson
Graceland Updates
Email:
Stewart Thomson is a retired Merrill Lynch broker. Stewart writes the Graceland Updates daily between 4am-7am. They are sent out around 8am-9am. The newsletter is attractively priced and the format is a unique numbered point form. Giving clarity of each point and saving valuable reading time.
Risks, Disclaimers, Legal
Stewart Thomson is no longer an investment advisor. The information provided by Stewart and Graceland Updates is for general information purposes only. Before taking any action on any investment, it is imperative that you consult with multiple properly licensed, experienced and qualified investment advisors and get numerous opinions before taking any action. Your minimum risk on any investment in the world is: 100% loss of all your money. You may be taking or preparing to take leveraged positions in investments and not know it, exposing yourself to unlimited risks. This is highly concerning if you are an investor in any derivatives products. There is an approx $700 trillion OTC Derivatives Iceberg with a tiny portion written off officially. The bottom line:
Are You Prepared?
Feb 26, 2019
Here are today’s videos and charts (double-click to enlarge):
SFS Key Charts, Signals, & Video Analysis
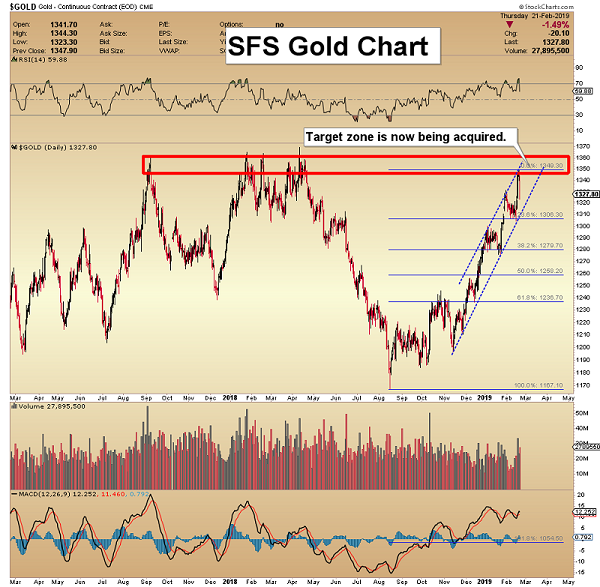
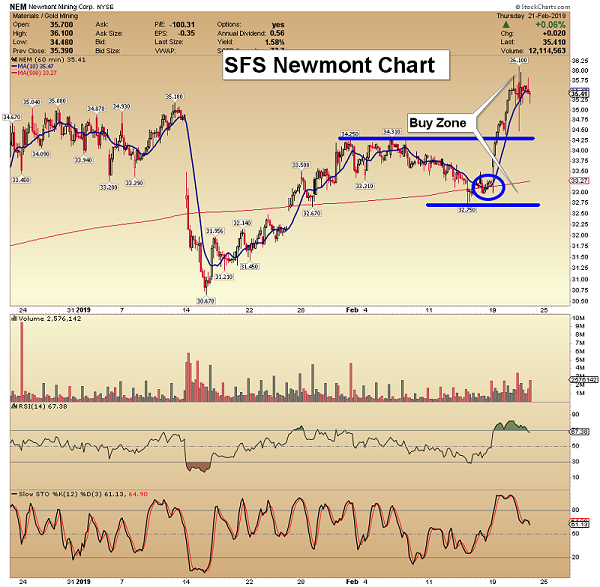
SF60 Key Charts, Signals, & Video Analysis
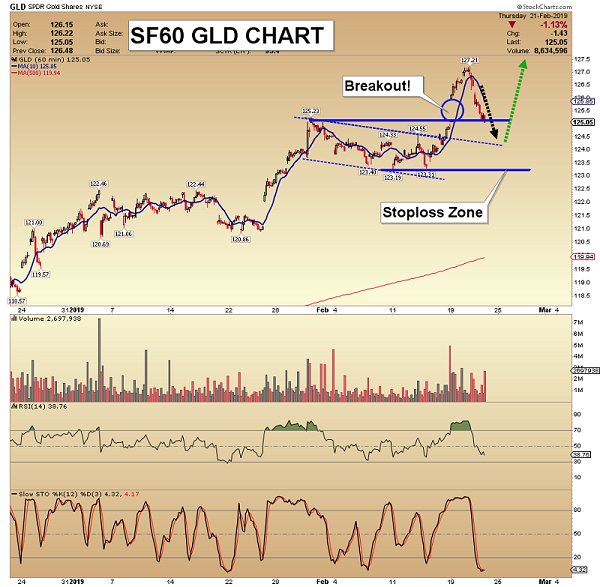
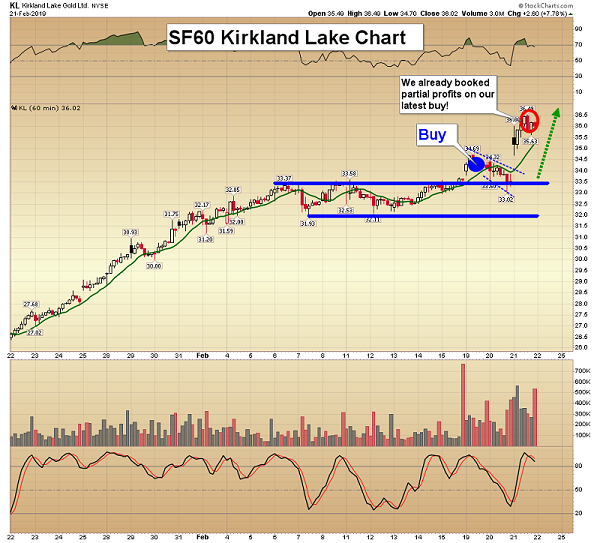
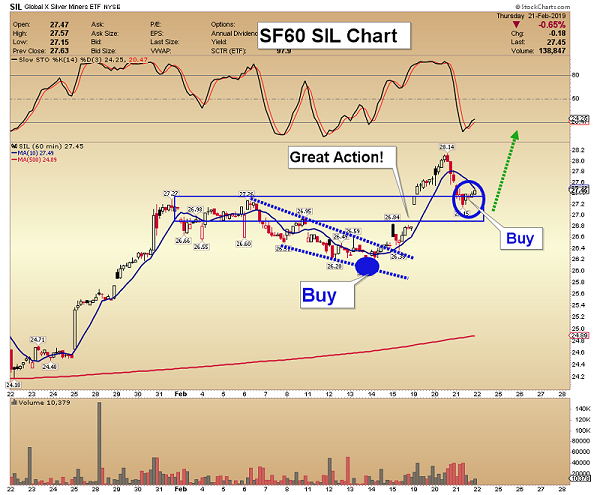
SF Trader Key Charts, Signals, & Video Analysis
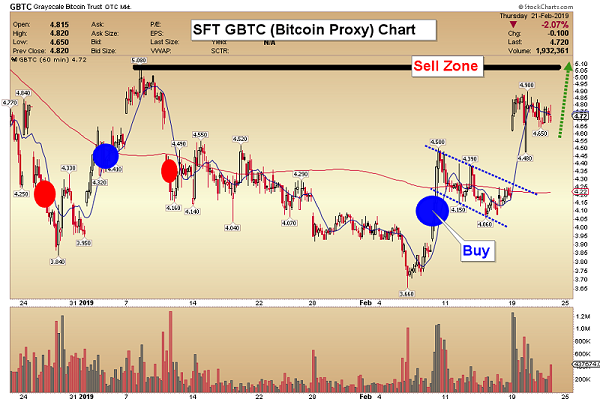
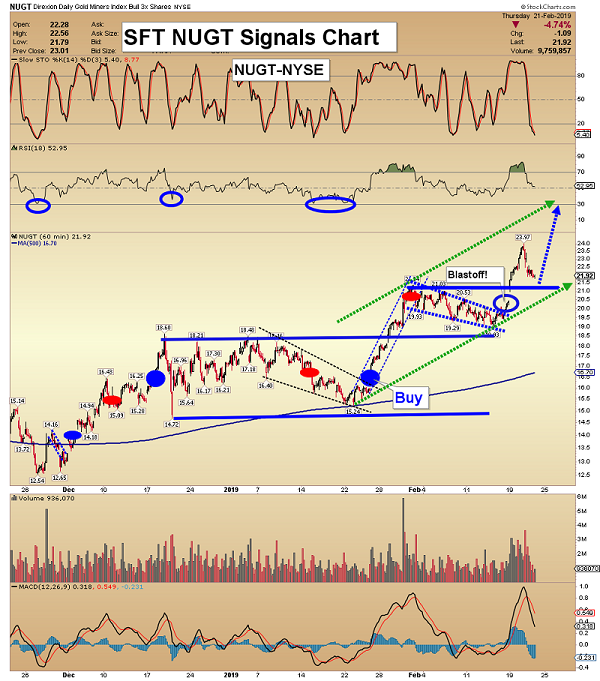
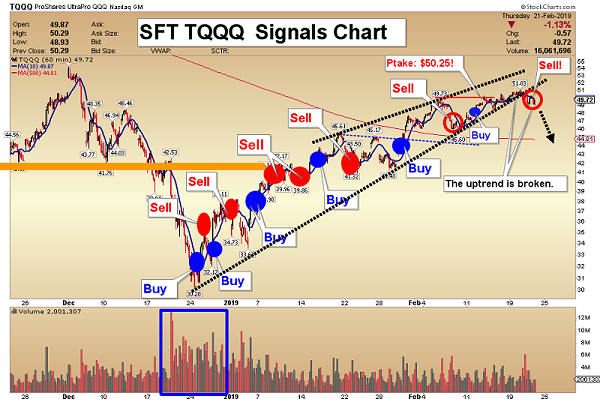
SFJ Key Charts, Signals, & Video Analysis
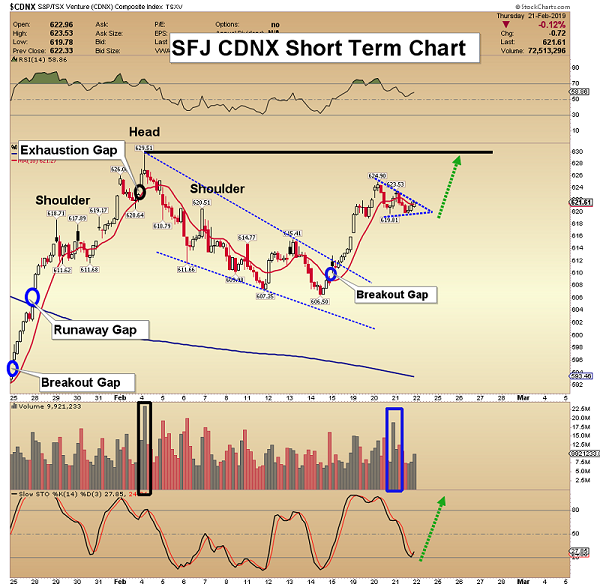
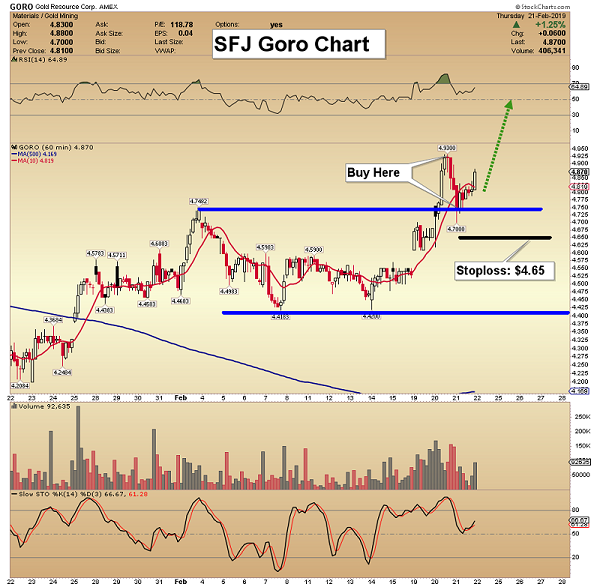
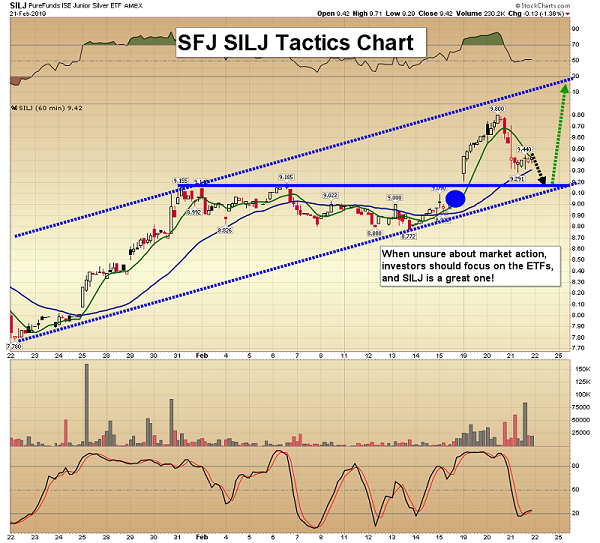
Thanks,
Morris Hubbartt
Unique Introduction For Web Readers: Send me an email to signals@superforcesignals.com and I’ll send you my “Hot Off The Press” junior miners free report, and 3 of my next Super Force Surge Signals free of charge, as I send them to paid subscribers. Thank you!
The gold miners’ stocks surged strongly last week, blasting to new upleg highs. The mounting gains are naturally driving more interest in this small contrarian sector, shifting sentiment towards bullish. Despite their accelerating rally, gold stocks still remain fairly low technically and deeply undervalued relative to gold. So their strengthening upleg likely has plenty of room to run considerably higher in coming months.
The gold miners’ stocks are ultimately leveraged plays on gold, which overwhelmingly drives their profits. The much-maligned yellow metal has enjoyed a strong upleg since mid-August, when record gold-futures short selling pounded it to a deep 19.3-month low of $1174. Gold has been gradually powering higher on balance ever since, surging near $1341. That makes for 14.2% gains over 6.1 months, an excellent run.
Gold miners’ earnings are amplifying these higher gold prices, driving this parallel gold-stock upleg. This is readily evident in the most-popular gold-stock benchmark, the GDX VanEck Vectors Gold Miners ETF. Launched back in May 2006, GDX has an insurmountable first-mover lead. This week its net assets of $11.1b were a whopping 50.6x larger than the next-biggest 1x-long major-gold-miners-ETF competitor!
The gold stocks as measured by GDX have certainly capitalized on gold’s advance. Between its own brutal 2.6-year low in early September and this week, GDX has surged 33.0% higher in 5.3 months. That works out to gold stocks leveraging gold’s gains by 2.3x in recent months. That is right in line with the 2x to 3x usually seen historically in the major gold miners. Many smaller gold miners are doing even better.
As this upleg was being born and growing, I wrote multiple essays explaining what was happening and why it was important to get heavily long gold stocks. We filled the trading books in our newsletters with great smaller gold and silver miners with superior fundamentals to the majors. Our unrealized gains this week were already running 60%+ on multiple trades! This young gold-stock upleg is even now quite lucrative.
While it is always better to buy in earlier than later, GDX’s 33.0% upleg to date remains relatively small. In essentially the first half of 2016, GDX soared 151.2% higher in just 6.4 months in its last major upleg! Really-big uplegs are par for the course in the volatile gold-stock sector. Gold stocks’ last secular bull ran from November 2000 to September 2011. Half of that was in the pre-gold-stock-ETF era before GDX’s launch.
During that long 10.8-year span, the classic HUI NYSE Arca Gold BUGS Index skyrocketed an incredible 1664.4% higher! That life-changing secular bull consisted of 12 separate uplegs. One was an anomaly, the mean reversion out of 2008’s first stock panic in a century. Excluding that behemoth, the 11 normal ones averaged hefty gains of 80.7% over 7.9 months. So GDX’s recent run is nothing by this sector’s standards.
At this stage all gold stocks have really done is regain their sharp late-summer losses. This GDX chart over the past few years or so illuminates the gold-stock technicals. The major gold miners’ stocks have merely climbed back up into their multi-year consolidation basing trading range. The lion’s share of this upleg’s gains are most probable as GDX breaks out above longstanding resistance, likely in coming months.
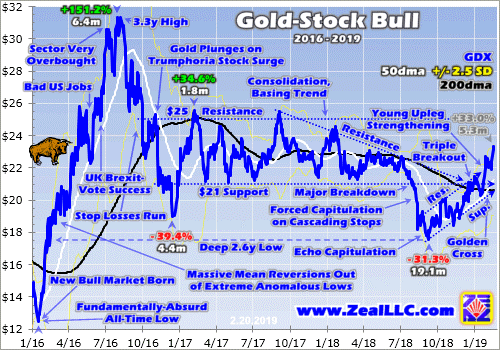
For fully 21.5 months leading into August 2018, GDX consolidated in a well-defined trading range from $21 lower support to $25 upper resistance. That sideways grind bled away bullish psychology, leading many traders to abandon this drifting sector. By late last summer not many were left, and most of them were soon driven out too. August’s extreme record gold-futures short selling spawned a washout in gold stocks.
Because this sector is so volatile, running loose trailing stops is essential for managing risk. The lower gold was hammered, the more selling pressure mounted in its miners. That forced them to stop losses, unleashing more mechanical selling and fueling a vicious circle. Gold stocks cascaded lower in a brutal forced capitulation into mid-August, and a secondary echo capitulation bashed them lower still in early September.
GDX’s $21 support was shattered as this benchmark ETF plunged to $17.57 by mid-September. Several days later I published an essay Gold-Stock Forced Capitulation explaining all this right in those depths of bearish despair. I concluded “…the aftermath of capitulations is exceedingly bullish. … The technicals and sentiment spawned by capitulations are so extreme they usually birth massive uplegs and entire bull markets.”
With GDX just plunging to an extreme and unsustainable 2.6-year low, we were aggressively buying great gold stocks and recommending them to our newsletter subscribers. Being bullish when everyone else was bearish was the right call of course. The gold stocks started powering higher in their upleg persisting to today. I did my best to let speculators and investors know about the great upside opportunities in this sector.
Since that forced-capitulation essay, I’ve published 23 more weekly essays on subsequent Fridays. Fully 14 of those were about gold stocks, exploring their deep undervaluation relative to gold, their excellent technicals, and strong fundamentals. If you want to multiply your wealth in the stock markets, you have to pay attention all the time. Most traders make the costly mistake of ignoring sectors until they get exciting.
I’ve been trading stocks for over three decades now, and doing it full-time professionally to earn a living for two-thirds of that long span. One of the most-important lessons I’ve learned is it’s critical to always keep plugged in. If you are not following the markets, you are missing great opportunities. The only way to buy low before later selling high is staying abreast of beaten-down sectors, especially when they are despised.
The gold stocks kept marching higher on balance after that anomalous forced capitulation, carving higher lows and higher highs. In mid-October with GDX under $19 I explained why gold stocks were Stocks’ Last Cheap Sector. I concluded, “These gold miners’ stock prices are wildly undervalued relative to the metal which drives their profits. So they are overdue for a massive mean reversion and eventually overshoot.”
This new gold-stock upleg mostly drifted sideways in November, discouraging even early contrarians. I did my usual quarterly analyses of the newest Q3’18 results of the major gold miners of GDX and mid-tier gold miners of the GDXJ Van Eck Vectors Junior Gold Miners ETF. This critical fundamental homework proved “…the major gold miners’ fundamentals remain far stronger than implied by their left-for-dead stock prices.”
While few traders cared about gold stocks in this upleg’s initial few months, December’s action started to change that. Gold surged 4.9% higher to $1282 that month as the US stock markets rolled over into a severe near-bear correction. Down 19.8% at worst since its late-September peak, the flagship S&P 500 broad-market stock index plunged 9.2% in its worst December since 1931 in the midst of the Great Depression!
The gold miners’ stocks ignored the burning stock markets to follow gold higher and leverage its gains like usual. GDX blasted up 10.5% that month, amplifying gold’s strong advance by a solid 2.1x! Finally this young gold-stock upleg was getting big enough to attract traders’ attention. I continued to do my best to spread awareness, writing about an imminent Gold-Stock Triple Breakout in mid-December with GDX near $20.
This leading gold-stock benchmark was on the verge of breaking out above three major upper-resistance zones simultaneously. These included the old $21 support of its consolidation basing trend, a downward-sloping resistance line from a bearish descending-triangle technical pattern, and most importantly GDX’s key 200-day moving average. Gold stocks’ improving technicals were on the verge of getting far more bullish.
I concluded, “Three major GDX resistance zones have converged just above current levels. Once the gold stocks surge decisively over, the technically-oriented traders will take notice. They will likely start chasing the momentum accelerating the gains, with buying begetting buying.” That indeed came to pass. By early January that super-bullish upside triple breakout in GDX had already become a fait accompli.
I wrote another essay Gold-Stock Upleg Breaking Out to explain the huge upside potential the gold stocks had after clearing those essential technical hurdles. I concluded this gold-stock upleg “is now surging in a major upside breakout that should unleash a flood of new buying. With gold climbing on balance too, everything is in place to fuel a major gold-stock upleg.” There were many opportunities to buy gold stocks low.
January was a roller-coaster month for gold stocks, with GDX rallying then swooning then surging to big new upleg highs at month-end. But on balance this leading gold-stock benchmark continued carving both higher lows and higher highs. In late January I explained why Gold-Stock Upleg Pauses were nothing to worry about. All major uplegs flow and ebb, surging two steps forward before slumping one step back.
Speculators and investors needed to remember that “Uplegs don’t shoot higher in straight lines, pullbacks within them are normal and expected. They serve to rebalance sentiment keeping uplegs healthy.” Then in early February GDX flashed one of the most-powerful buy signals of all, the fabled Golden Cross. That is when its 50dma crosses back above its 200dma soon after a major secular low in GDX, a wildly-bullish omen.
But gold stocks again retreated in early February after surging in late January, again worrying traders who lacked perspective. So a couple weeks ago with GDX just over $22, I published another essay showing Gold Stocks Gather Steam. It explained that rare Golden Cross buy signal and concluded, “All this has really started to shift sentiment back to bullish, which will attract in lots more capital to chase the momentum.”
That indeed proved correct again. The more you study markets, the deeper you understand them and the more sense their seemingly-capricious rhythms make. The more your market experience and knowledge grow, the higher the odds you can figure out what’s most likely next. If you aren’t in a position to watch markets full-time for decades, it’s essential to spend a little time and money to learn from someone who is and has.
I started investing in stocks when I was 12 years old, using money earned from summer jobs. I had very little market knowledge in those early years. So I subscribed to a few financial newsletters written by market experts with vastly more experience and wisdom than me. Their hard-earned insights from long decades of study kept me on the right track to gradually grow my meager capital at the time. I loved those guys!
Universally in life, the more time anyone spends doing anything the better they get at it. Success is often directly proportional to time on task. So if you can’t or don’t want to devote your life to trading, you need to diligently and consistently learn from those who have. Being right on this gold-stock upleg is no big deal, as it’s been garden-variety and in line with precedent so far. It has been both predictable and gameable.
After drifting lower in the first half of February, GDX started surging again late last week. Heading into last weekend the major gold stocks enjoyed solid 1.0% and 1.3% daily rallies per this ETF. Those were directly driven by gold climbing 0.5% and 0.7% after slumping to its own mid-month lows. While US stock markets were closed Monday, that gold-stocks-rallying-and-amplifying-gold trend really accelerated on Tuesday.
After edging up to a new upleg high last Friday, gold continued climbing modestly in foreign trading over the long weekend in the U.S. By Tuesday morning gold-futures speculators were seeing gold at its best levels in 10.1 months. So they apparently rushed to buy, catapulting gold 1.5% higher to $1341! GDX surged 3.2% that day, leveraging gold’s advance by 2.1x. That momentum drove another 1.0% rally Wednesday.
But despite the major gold stocks climbing 33.0% in 5.3 months as of the middle of this week, they remain fairly low technically. At $23.36, GDX was merely back up to the middle of its old multi-year consolidation basing trend between $21 to $25. Traders aren’t going to get really excited until GDX powers decisively above $25 for the first time since mid-2016. While improving, gold-stock psychology is still relatively bearish.
I suspect GDX will challenge $25 in the next few months. Though this sector often experiences a seasonal lull into mid-March, gold stocks then enjoy a strong spring rally. As long as gold continues slowly climbing on balance, the gold stocks have excellent upside potential. Remember GDX’s last major upleg soared 151.2% in essentially the first half of 2016, and the prior secular gold-stock bull’s uplegs averaged +80.7%!
While the major gold miners’ technicals and sentiment both support bigger gains to come, perhaps the most-bullish argument of all comes from the fundamental side. The gold stocks remain relatively low compared to prevailing gold prices, the metal which directly drives their profits. They need to mean revert much higher to regain normal levels compared to gold. A simple ratio of gold stocks to gold illustrates this.
The GLD SPDR Gold Shares is the world’s dominant gold ETF. Dividing GDX’s daily close by GLD’s daily close yields the GDX/GLD Ratio, a great fundamental proxy for gold-stock valuations. Hammered to the low side by gold stocks’ late-summer forced capitulation, the GGR is just now regaining average levels for recent years’ gold bull. But mean reversions rarely stop at the averages, instead overshooting proportionally.
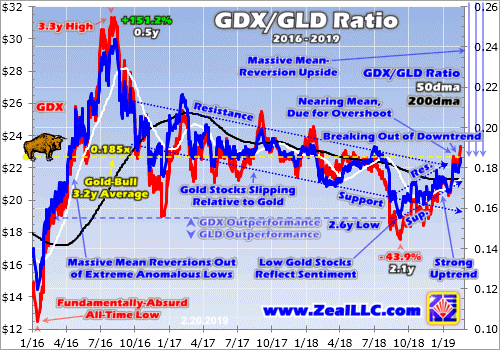
I explained this chart in depth a couple weeks ago in another essay, so just a brief update today. This Wednesday the GGR clawed back up to 0.185x, which is exactly at the 3.2-year average since today’s gold bull was born in mid-December 2015. At worst in mid-September, the GGR plunged to a deep 2.6-year secular low of 0.155x. That was 0.030x under this bull’s mean, portending a proportional overshoot higher.
Before this gold-stock upleg gives up its ghost, the odds really favor the GGR surging back to 0.215x. At this week’s gold-upleg-to-date high of $126.70 in GLD, that implies GDX near $27.25. That would be a powerful breakout above that old $25 consolidation-trend resistance line, and would catalyze a lot more trader interest in this small sector! It would extend this current gold-stock upleg’s gains to a more-normal 55.1%.
But if gold keeps rallying like it ought to as these overvalued and overbought US stock markets roll over again, the potential gold-stock upside is far greater. $1400 gold is just 4.4% above this week’s levels, not a stretch at all. That would be a new bull-market high exceeding July 2016’s $1365, generating serious excitement to attract in new traders. At a proportional-overshoot 0.215x GGR, that leaves GDX near $28.50.
That’s still not particularly high, as GDX traded over $31.25 in early August 2016 in its own gold-bull-to-date peak. With speculators and investors actually excited about gold stocks then, the GGR hit 0.244x. Apply that to $1400 gold, and the GDX target climbs above $32.25. That would grow this upleg to +84%, right in line with the prior secular bull’s average. Make no mistake, the gold-stock upside from here is still big!
And that’s just this upleg, not the entire gold-stock bull. In the 2 years before 2008’s stock panic radically changed the markets, the GGR averaged 0.591x. In the 2 years after of 2009 and 2010, the GGR was still far higher than recent levels averaging 0.422x. Plug in the much-higher historical GGRs seen when gold stocks were far more popular, and higher gold prices, and GDX’s potential upside in this bull gets huge.
The best gains in today’s mounting gold-stock upleg are likely still yet to come. While you can play it in GDX, the major gold miners dominating this ETF are really struggling to grow their production. And that problem is even worse in the newly-merged super-majors, further retarding GDX’s performance. So the best gains will be won in smaller gold miners with superior fundamentals that are still expanding their outputs.
The earlier you get deployed, the greater your gains will be. That’s why the trading books in our popular weekly and monthly newsletters are currently full of better gold and silver miners mostly added in recent months. The gains we won in 2016 were amazing the last time American stock investors returned to gold. Our newsletter stock trades that year averaged +111.0% and +89.7% annualized realized gains respectively!
Coming gold-stock gains should be similarly huge as today’s strengthening gold and gold-stock uplegs grow. To multiply your wealth in the stock markets you have to do your homework and stay abreast, which our newsletters really help. They explain what’s going on in the markets, why, and how to trade them with specific stocks. You can subscribe today for just $12 per issue! That’s a trivial pittance for decades of hard-won market experience, knowledge, wisdom, and ongoing research.
The bottom line is gold stocks just surged higher again, their upleg getting stronger on balance. GDX continues to carve higher lows and higher highs, fueling improving sentiment. More traders are getting interested in this sector and bringing in more capital, driving gold stocks higher to strengthen a virtuous circle of buying. Gold-stock technicals, sentiment, and fundamentals all argue for bigger gains to come.
This current upleg remains relatively small by sector precedent. And gold stocks are just regaining their bull-average levels relative to gold, with lots of room to rally on a proportional mean overshoot. While a seasonal lull nears, mid-upleg pullbacks or consolidating drifts are normal and healthy. This gold-stock upleg is likely to grow a heck of a lot bigger in coming months’ major spring rally. Get deployed if you aren’t yet!
Adam Hamilton, CPA
February 25, 2019
Copyright 2000 – 2019 Zeal LLC (www.ZealLLC.com)
If you would like to receive our free newsletter via email, simply enter your email address below & click subscribe.
 Follow us on Twitter
 Become our facebook fan
CONNECT WITH US
Tweets
Tweet with hash tag #miningfeeds or @miningfeeds and your tweets will be displayed across this site.
MOST ACTIVE MINING STOCKS
Daily Gainers
 CMC Metals Ltd. CMC Metals Ltd. |
CMB.V | +900.00% |
 Eden Energy Ltd Eden Energy Ltd |
EDE.AX | +200.00% |
| GoviEx Uranium Inc. |
GXU.V | +42.86% |
| Eagle Nickel Ltd. |
ENL.AX | +41.67% |
| Citigold Corp. Limited |
CTO.AX | +33.33% |
| Mount Burgess Mining NL |
MTB.AX | +33.33% |
| Exalt Resources Limited |
ERD.AX | +31.94% |
| Casa Minerals Inc. |
CASA.V | +30.00% |
| Cariboo Rose Resources Ltd |
CRB.V | +28.57% |
| Belmont Resources Inc. |
BEA.V | +28.57% |


