
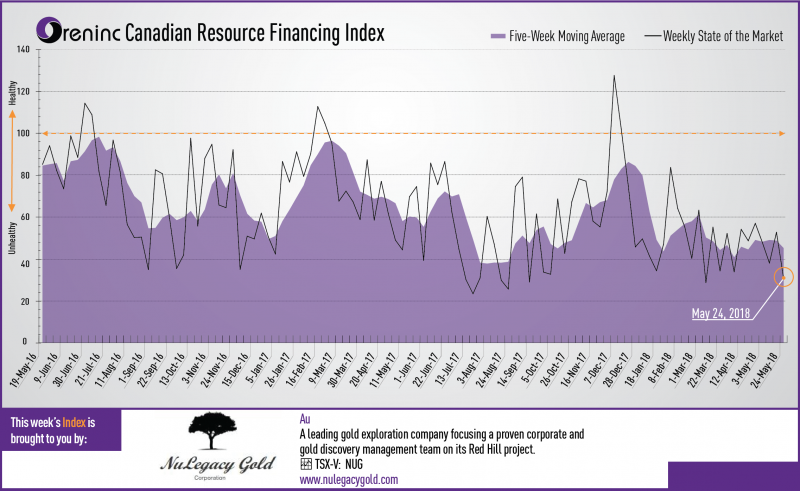
Last week index score: 52.74
This week: 30.90
The Oreninc Index fell in the week ending May 25th, 2018 to 30.90 from 52.74 a week ago despite gold recovering from the prior weeks’ fall below US$1,300/oz.
Gold recovered from a brief sojourn below the US$1,300/oz level as risk returned with US president Donald Trump calling off a landmark summit with North Korean leader Kim Jong Un. The yield on the US ten-year treasury fell below 3% as suggestions from the US Federal Reserve about a temporary rise in inflation raised questions over whether there will be multiple interest rate increases this year. All good news for gold. All eyes will be on the US Federal Reserve Open Market Committee meeting on June 12-13.
On to the money: total fund raises announced fell to C$38.8 million, an eleven-week low, which included two brokered financings for C$10.8 million, a two-week low and one bought deal financing for C$7.0 million, a two-week low. The average offer size fell to C$2.9 million, a three-week low and the number of financings fell to 13, an eleven-week low.
Gold closed at US$1,309/oz from US$1,293/oz a week ago. Gold is now down 0.04% this year. The US dollar index continued to increase and closed up at 94.25 from 93.63 a week ago. The Van Eck managed GDXJ made a slight gain after a volatile week closing up at US$32.89 from US$32.84 last week. The index is down 3.63% so far in 2018. The US Global Go Gold ETF fell slightly to close at US$12.93 from US$12.98 a week ago. It is now down 0.61% so far in 2018. The HUI Arca Gold BUGS Index closed up at 180.20 from 177.75 last week. The SPDR GLD ETF continued to sell off and closed its inventory at 848.50 tonnes from 855.28 tonnes a week ago.
In other commodities, silver made a small gain on a volatile week to close up at US$16.51/oz from US$16.44/oz a week ago. Copper showed a similar pattern to close up at US$3.07/lb from US$3.06/lb last week. Oil was the main loser of the week with its price taking a dump at the end of the week to close down at US$67.88 a barrel from US$71.28 a barrel a week ago.
The Dow Jones Industrial Average returned to growth to close up at 24,753 from 24,715 last week. Canada’s S&P/TSX Composite Index showed a slight loss to close down at 16,075 from 16,162 the previous week. The S&P/TSX Venture Composite Index also closed down at 775.41 from 786.39 last week.
Summary:
- Number of financings crumbled to 13, an eleven-week low.
- Two brokered financings were announced this week for C$10.8m, a two-week low.
- One bought-deal financing was announced this week for C$7.0m, a two-week low.
- Total dollars plunged to C$38.8m, an eleven-week low.
- Average offer size dropped to C$2.9m, a three-week low.
Financing Highlights
Probe Metals (TSX-V: PRB) opened a C$14 million financing.
- Bought deal with Sprott Capital Partners and a syndicate of underwriters
- Flow through units @ C$1.90 and non flow-through units @ C$1.15
- Each unit consists of one share and half a warrant exerciseable @ C$1.45 for two years.
- Underwriters option to purchase C$2.1 million in units.
- Gross proceeds will fund exploration on Probe’s projects in Québec.
- Closing is expected on June 19th.
Major Financing Openings:
- Great Bear Resources (TSX-V: GBR) opened a C$7.83 million offering on a best efforts basis. Each unit includes half a warrant that expires in 24 months.
- Probe Metals (TSX-V: PRB) opened a C$7 million offering underwritten by a syndicate led by Sprott Capital Partners on a bought deal basis. Each unit includes half a warrant that expires in 24 months. The deal is expected to close on or about June 19th.
- Probe Metals (TSX-V: PRB) opened a C$7 million offering on a best efforts basis. The deal is expected to close on or about June 19th.
- Para Resources (TSX-V: PBR) opened a C$6.4 million offering on a best efforts basis. Each unit includes a warrant that expires in 36 months.
Major Financing Closings:
- SRG Graphite (TSX-V: SRG) closed a C$8 million offering underwritten by a syndicate led by National Bank Financial on a best efforts basis. Each unit included a warrant that expires in 12 months.
- Wealth Minerals (TSX-V: WML) closed a C$6.25 million offering on a best efforts basis. Each unit included half a warrant that expires in 24 months.
- Zinc One Resources (TSX-V: Z) closed a C$3.89 million offering on a best efforts basis. Each unit included half a warrant that expires in 36 months.
- Alexandra Capital (TSX-V: AXC) closed a C$2.6 million offering on a best efforts basis.
About Oreinc.com:
Oreninc.com is North America’s leading provider of relevant financing information in the junior commodities space. Since 2011, the company has been keeping track of financings in the junior mining as well as oil and gas space. Logging all relevant deal and company information into its proprietary database, called the Oreninc Deal Log, Oreninc quickly became the go-to website in the mining financing space for investors, analysts, fund managers and company executives alike.
The Oreninc Deal Log keeps track of over 1,400 companies, bringing transparency to an otherwise impenetrable jungle of information. The goal is to increase the visibility of transactions and to show financings activity in a digestible format. Through its daily logging activities, Oreninc is in a position to pinpoint momentum changes in the markets, identify which commodities are trending and which projects are currently receiving funding.
- SPDR fund tonnage (GLD-NYSE) has recaptured the 800 ton mark, and rose to 814 yesterday. This is happening as a steady wave of institutional money managers embrace gold as an important portfolio component.
- It’s also occurring as Indian dealers begin buying for Diwali. The result of this overall ramp-up in demand is a beautiful surge higher in the gold price!
- Please click here now. Double-click to enlarge this important gold chart. I call this my “Road To $1392” chart.
- When the price of an asset arrives at major resistance in a huge chart pattern, a real upside breakout and sustained move higher can only occur if market fundamentals are aligned with the technical set-up.
- The good news is that for gold, this appears to be the case. Please click here now. Double-click to enlarge this monthly gold chart. The $1377 – $1392 price range is the resistance zone of a huge inverse head and shoulders bottom pattern. It is the neckline of the pattern.
- Note the tremendous rise in volume that is occurring as gold makes a beeline to that neckline. The Indian gold market has completed its restructuring, and Western money managers are lining up to add gold to their portfolios.
- The managers are not just making a one-time purchase. They are adding gold as apercentage allocation. That allocation seems to be averaging around 5%. As the funds gather new assets, they buy more gold to maintain that 5% allocation.
- Asian fund managers typically give gold an even higher allocation to gold in their funds than Western managers. As China and India become the main economic empires, Western money managers will tend to play “follow the Chindian leader”.
- That means the current Western money manager allocation to gold that is about 5% could easily rise to 10% or 15% in the coming years. Clearly, all liquidity flow lights for gold…are green!
- My weekly chart roadmap suggests that gold will rise not just to $1392, but to $1526, and $1800. Importantly, the rise will be accompanied by substantial growth in respect for gold as an asset class.
- There’s a huge difference in a rally based on an event like QE and a rally based on a permanent portfolio commitment to the asset class. The latter produces price gains that are sustained.
- Please click here now. Double-click to enlarge this important dollar versus yen chart. The 108 “line in the sand” seems ready to fail. A tumble towards 100 would almost guarantee that gold surges to $1392 and begins the move towards $1526.
- The yen and gold are the two most important risk-off assets for heavyweight FOREX traders. The dollar entered a long-term bear market against the yen in 2016. That defined risk itself as entering a major bear market.
- Please click here now. Double-click to enlarge. That’s a daily chart of the dollar versus the yen. It looks like a train wreck.
- US taxes have not been cut. There’s not even any intention to cut the capital gains rate, let alone abolish it. That makes it almost impossible to attract serious long term investment capital into demographically-disastrous America.
- Trump had a chance to turn the country into a bigger and better version of Switzerland, and oversee a tax-free empire where the citizens age with grace. Instead, a 1929 type of situation now seems imminent.
- An inflationary depression is likely to follow the US government’s launch of what I call Trump’s “Tariffs to Infinity” program. He’s launching a mirror image of Herb Hoover’s tariffs program, and doing it with stocks, bonds, and real estate all in a precarious position.
- That’s truly great news for gold stock investors! Please click here now. Double-click to enlarge this fabulous GDX chart. I’ve told gold bugs to watch for a big volume day to send GDX rocketing towards my $26 target, after buying every ten cents decline in the $23 – $18 price zone.
- That volume surge occurred yesterday. Please click here now. Double-click to enlarge. On this two-year chart for GDX, my new $31 target is clear. That’s a key number, because it’s the equivalent of $1392 for gold.
- The 2014 – 2017 period is the most important accumulation zone for gold stock enthusiasts in the history of the gold market, and perhaps in the history of all markets.
- That’s because a reversal in US money velocity is imminent, and the gold stocks versus gold bullion bear market that began in 1995 has ended.
- Tactics? Well, I realize that many gold bugs may have sold their gold stocks in 2014 – 2016 instead of launching the major accumulation program that I adamantly recommended. Some investors bought penny stocks in the general US equity market to try to make back the losses they booked with gold stocks.
- That was obviously a mistake, and those stocks are vulnerable now to a 1929 type of crash. The bottom line is that the current situation of many gold bugs is unfortunate, but just as a car can be repaired, so can a portfolio be repaired.
- Yesterday’s volume bar in GDX is a game changer. So is the growing allocation to gold by institutional money managers, and so is the completed restructuring of the Indian gold market. It’s time for investors to forget the past, move their portfolio cars into the gas station, and fuel up on gold and silver stocks!
Special Offer For Website Readers: Please send me an Email to freereports4@gracelandupdates.
Thanks! Cheers
Stewart Thomson, Graceland Updates
Stewart Thomson is a retired Merrill Lynch broker. Stewart writes the Graceland Updates daily between 4am-7am. They are sent out around 8am-9am. The newsletter is attractively priced and the format is a unique numbered point form. Giving clarity of each point and saving valuable reading time.
https://www.gracelandupdates.
Risks, Disclaimers, Legal
Stewart Thomson is no longer an investment advisor. The information provided by Stewart and Graceland Updates is for general information purposes only. Before taking any action on any investment, it is imperative that you consult with multiple properly licensed, experienced and qualified investment advisors and get numerous opinions before taking any action. Your minimum risk on any investment in the world is: 100% loss of all your money. You may be taking or preparing to take leveraged positions in investments and not know it, exposing yourself to unlimited risks. This is highly concerning if you are an investor in any derivatives products. There is an approx $700 trillion OTC Derivatives Iceberg with a tiny portion written off officially. The bottom line:
Are You Prepared?
If you would like to receive our free newsletter via email, simply enter your email address below & click subscribe.
 Follow us on Twitter
 Become our facebook fan
CONNECT WITH US
Tweets
Tweet with hash tag #miningfeeds or @miningfeeds and your tweets will be displayed across this site.
MOST ACTIVE MINING STOCKS
Daily Gainers
 CMC Metals Ltd. CMC Metals Ltd. |
CMB.V | +900.00% |
 Eden Energy Ltd Eden Energy Ltd |
EDE.AX | +200.00% |
| GoviEx Uranium Inc. |
GXU.V | +42.86% |
| Eagle Nickel Ltd. |
ENL.AX | +41.67% |
| Citigold Corp. Limited |
CTO.AX | +33.33% |
| Mount Burgess Mining NL |
MTB.AX | +33.33% |
| Exalt Resources Limited |
ERD.AX | +31.94% |
| Casa Minerals Inc. |
CASA.V | +30.00% |
| Cariboo Rose Resources Ltd |
CRB.V | +28.57% |
| Belmont Resources Inc. |
BEA.V | +28.57% |


