
The widely-held mega-cap stocks that dominate the U.S. markets recently finished reporting their Q4 2018 financial results. Because the tenor of stock markets changed radically last quarter, this latest earnings season is more important than usual. An extreme monster bull market suddenly rolled over into a severe near-bear correction in Q4. How major corporations fared offers insights into whether a young bear is upon us.
Four times a year publicly-traded companies release treasure troves of valuable information in the form of quarterly reports. Required by the U.S. Securities and Exchange Commission, these 10-Qs and 10-Ks contain the best fundamental data available to traders. They dispel all the sentiment distortions inevitably surrounding prevailing stock-price levels, revealing corporations’ underlying hard fundamental realities.
While 10-Qs with filing deadlines of 40 days after quarter-ends are required for normal quarters, 10-K annual reports are instead mandated after quarters ending fiscal years. Most big companies logically run their accounting on calendar years, so they issue 10-Ks after Q4s. Since these annual reports are larger and must be audited by independent CPAs, their filing deadlines are extended to 60 days after quarter-ends.
So the 10-K filing season just wrapped up last Friday, revealing how the biggest and best U.S. companies were doing in Q4 2018. They are the stocks of the flagship S&P 500 stock index (SPX). At the end of Q4 they commanded a gigantic collective market capitalization of $22.2t! The vast majority of investors own the big U.S. stocks of the SPX, as some combination of them are usually the top holdings of nearly every fund.
The major ETFs that track the S&P 500 dominate the increasingly-popular passive-investment strategies as well. The SPY SPDR S&P 500 ETF, IVV iShares Core S&P 500 ETF, and VOO Vanguard S&P 500 ETF are among the largest in the world. This past week they reported colossal net assets running $262.4b, $160.5b, and $103.2b respectively! Overall stock-market fortunes are totally dependent on big U.S. stocks.
Q4 2018 proved extraordinary. Leading into it, the SPX hit a dazzling all-time record high in late September about a week before Q4 arrived. That extended an extreme monster stock bull to 333.2% gains over 9.5 years, the 2nd-largest and 1st-longest in all of U.S. stock-market history! But as I warned days after that euphoric peaking, the Fed’s unprecedented quantitative-tightening campaign would finally ramp to full speed in Q4.
Stock markets artificially inflated by $3625b of Fed QE over 6.7 years couldn’t react well to Fed QT finally starting to unwind that epic monetary inflation. With QT hitting $50b per month starting in Q4, the stock markets indeed wilted. Over the next 3.1 months into Christmas Eve, the SPX plummeted 19.8%! That was right on the verge of a new bear market at -20%. The SPX suffered its worst December since 1931, -9.2%.
That sure looked like a young bear market, really freaking out traders. But since those deep and ominous lows, the SPX has soared 19.3% at best in a massive rally! That has reversed nearly 4/5ths of the total correction losses largely suffered in Q4. This looked and acted like a classic bear-market rally, rocketing higher to eradicate fear and restore universal complacency. New-bear worries have shriveled to nothing.
Given Q4 2018’s colossal stock-market inflection and subsequent huge rebound, whether the SPX narrowly evaded the overdue-bear bullet or not is supremely important. Bear markets exist for one reason, to maul overvalued stocks back down below historic fair-value levels. So how the major U.S. corporations actually fared last quarter, how large their earnings were compared to their stock prices, offers essential bull-bear clues.
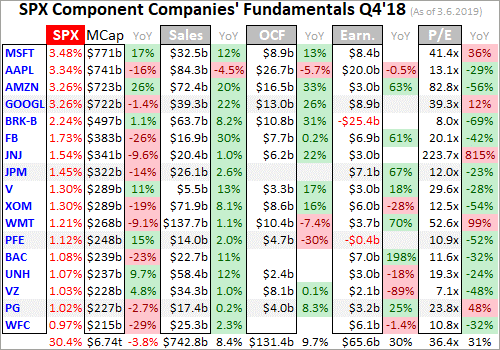
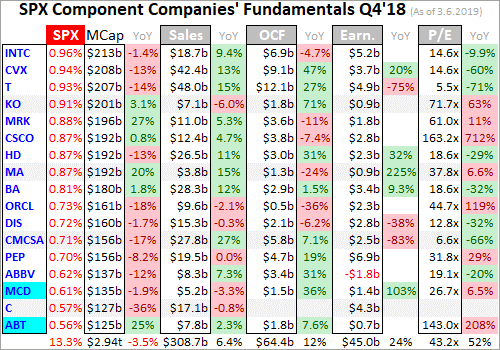
Every quarter I analyze the top 34 SPX/SPY component stocks ranked by market cap. This is just an arbitrary number that fits neatly into the tables below, but is a dominant sample of the SPX. At the end of Q4, these American giants alone commanded fully 43.7% of the SPX’s total weight! Their $9.7t collective market cap exceeded that of the bottom 437 SPX companies. Big U.S. stocks’ importance cannot be overstated.
I wade through the 10-K or 10-Q SEC filings of these top SPX companies for a ton of fundamental data I dump into a spreadsheet for analysis. The highlights make it into these tables below. They start with each company’s symbol, weighting in the SPX and SPY, and market cap as of the final trading day of Q4 2018. That’s followed by the year-over-year change in each company’s market capitalization, a key metric.
Major U.S. corporations have been engaged in a wildly-unprecedented stock-buyback binge ever since the Fed forced interest rates to deep artificial lows during 2008’s stock panic. Thus the appreciation in their share prices also reflects shrinking shares outstanding. Looking at market-cap changes instead of just underlying share-price changes effectively normalizes out stock buybacks, offering purer views of value.
That’s followed by quarterly sales along with their y/y changes. Top-line revenues are one of the best indicators of businesses’ health. While profits can be easily manipulated quarter to quarter by playing with all kinds of accounting estimates, sales are tougher to artificially inflate. Ultimately sales growth is necessary for companies to expand, as bottom-line profits growth driven by cost-cutting is inherently limited.
Operating cash flows are also important, showing how much capital companies’ businesses are actually generating. Using cash to make more cash is a core tenet of capitalism. Unfortunately many companies are now obscuring quarterly OCFs by reporting them in year-to-date terms, lumping in multiple quarters together. So the Q4 2018 OCFs shown are mostly calculated by subtracting Q3’18 YTD OCFs from full-year ones.
Next are the actual hard quarterly earnings that must be reported to the SEC under Generally Accepted Accounting Principles. Lamentably companies now tend to use fake pro-forma earnings to downplay real GAAP results. These are derided as EBS profits, Everything but the Bad Stuff! Certain expenses are simply ignored on a pro-forma basis to artificially inflate reported corporate profits, often misleading traders.
While we’re also collecting the earnings-per-share data Wall Street loves, it’s more important to consider total profits. Stock buybacks are executed to manipulate EPS higher, because the shares-outstanding denominator of its calculation shrinks as shares are repurchased. Raw profits are a cleaner measure, again effectively neutralizing the impacts of stock buybacks. They better reflect underlying business performance.
Finally the trailing-twelve-month price-to-earnings ratios as of the end of Q4 2018 are noted. TTM P/Es look at the last four reported quarters of actual GAAP profits compared to prevailing stock prices. They are the gold-standard metric for valuations. Wall Street often intentionally conceals these hard P/Es by using the fictional forward P/Es instead, which are literally mere guesses about future profits that often prove far too optimistic.
These are mostly calendar-Q4 results, but some big U.S. stocks use fiscal quarters offset from normal ones. Walmart, Home Depot, and Cisco have quarters ending one month after calendar ones, so their results here are current to the end of January instead of December. Oracle uses quarters that end one month before calendar ones, so its results are as of the end of November. Offset reporting ought to be banned.
Reporting on offset quarters renders companies’ results way less comparable with the vast majority that report on calendar quarters. We traders all naturally think in calendar-quarter terms too. Decades ago there were valid business reasons to run on offset fiscal quarters. But today’s sophisticated accounting systems that are largely automated running in real-time eliminate all excuses for not reporting normally.
Stocks with symbols highlighted in blue have newly climbed into the ranks of the SPX’s top 34 companies over the past year, as investors bid up their stock prices and thus market caps relative to their peers. Overall the big U.S. stocks’ Q4 2018 results looked impressive, with good sales and profits growth. But that masks a sharp slowdown from prior quarters that will be exacerbated as the corporate-tax-cut transition year ends.
2018 was a banner year for corporate earnings because of Republicans’ massive corporate tax cuts. The Tax Cuts and Jobs Act was signed into law on December 22nd, 2017 to go into effect on January 1st, 2018. Its centerpiece was slashing the U.S. corporate tax rate from 35% to 21%, which naturally boosted reported profits. But 2018’s four quarters were the only ones that would experience anomalous TCJA growth.
Q4 2018 was the last quarter comparing year-over-year growth between a pre-TCJA quarter and post-TCJA quarter. That major discontinuity distorted corporate-earnings growth. Profits soared last year not just because companies were doing better, but because they were paying taxes at much-lower rates. But starting in Q1 2019, that TCJA-transition boost is gone forever. Normal same-tax-regime y/y comparisons will return.
But before we get to all-important corporate earnings and resulting valuations, let’s work our way through these tables. Thanks to the SPX’s brutal 14.0% plunge in Q4, this leading broad-market stock index lost 6.2% last year. The biggest and best US companies fared a little better, with the collective market cap of the top 34 sliding 5.2% y/y. These elite corporations had average market-cap losses running 3.6% y/y.
That certainly isn’t calamitous, but the deceleration is neck-snapping! In the prior four quarters starting in Q4 2017, the SPX’s top 34 components saw enormous average YoY market-cap gains of 29.2%, 14.6%, 23.5%, and 24.2%. Make no mistake, Q4’18 saw a massive and ominous stock-market inflection. The severe near-bear correction’s selling pressure was even heavier in smaller SPX stocks below the top 34.
That pushed the top 34’s share of the SPX’s total weighting to 43.7%, a big increase from Q4 2017’s 41.8%. The more capital concentrated in fewer stocks, the riskier the entire stock markets become. Big down days driven by company-specific news in highly-weighted individual stocks can drag down the entire stock markets. A great example occurred in mighty Apple just after Q4 ended, when it warned on weak Q4 sales.
For years Apple had been the largest U.S. stock by market cap, commanding the highest ranking in the SPX and SPY. Just after 2019’s first trading day closed, Apple cut its Q4 revenue guidance by 7.7% from its own midpoint given 2 months earlier. The next day AAPL stock collapsed by 10.0%, which pummeled the entire SPX 2.5% lower in its worst loss so far this year. When a top U.S. stock sneezes, markets catch a cold.
Falling stock markets exert a strong negative wealth effect. Both consumers and corporations get scared as stocks suffer big and fast drops, so they pull in their horns on spending. That left all kinds of economic data covering parts of Q4 weaker than expected, sometimes shockingly so. Lower spending weighs on corporate revenues, as fewer people buy less goods and services. Would the top 34’s Q4 2018 sales reflect this?
On the surface these biggest-and-best U.S. companies looked immune. Their total Q4 sales of $1051.6b still climbed an impressive 4.2% YoY in the stock markets’ worst quarter since Q3 2011. These companies averaged big sales growth of 7.4% y/y, which was surprisingly robust given the stock-market carnage. Yet even that good top-line growth still reflects a major slowdown for the top 34 from the past year’s pace.
In the preceding four quarters, the SPX’s top 34 component stocks averaged y/y revenues growth way up at 10.8%, 14.0%, 14.0%, and 11.5%. So Q4’s was a serious deceleration, which may be an ominous portent for 2019. Q4’s revenues growth may be overstated too. Nearly 2/3rds of the SPX’s spending-sapping Q4 plunge came in December alone, after much of the surge in holiday shopping was already over.
If big U.S. companies’ sales growth continues slowing or even starts shrinking in 2019, corporate-profits growth will collapse. While Q1 2019’s earnings season doesn’t start for another 5 weeks or so, plenty of companies have warned that they see revenues slowing much more than Wall Street expected. If Q4 2018 was indeed a major stock-market trend change from bull to bear, corporate results will continue deteriorating.
The mega-cap companies dominating the SPX and American investors’ portfolios also enjoyed strong operating-cash-flow-generation growth in Q4. Their collective OCFs surged 11.5% y/y to $195.8b. Individual companies enjoyed average OCF gains of 10.8% y/y. That looks great on the surface, but just like sales it represents a sharp slowdown from huge y/y OCF growth seen in the prior four quarters.
Starting in Q4 2017 the SPX top 34’s operating cash flows averaged growth of 17.0%, 52.5%, 30.3%, and 20.6% YoY. So Q4’18’s still-strong OCF growth actually decelerated by almost 2/3rds from the precedent of the prior year. That was the prevailing theme of Q4’18 results, good numbers but already slowing fast from the rest of 2018’s even though last quarter had easy annual comparisons across those corporate tax cuts.
Actual corporate profits among these elite U.S. companies are critical to prevailing valuations. The price-to-earnings ratio is the classic measure of how expensive stock prices are. It simply divides companies’ current stock prices by their total earnings per share over the last four reported quarters. So profits are really the only corporate results that matter for valuations, making their growth trends the most important of all.
Interestingly the top 34 SPX components’ total GAAP profits actually shrunk 1.4% y/y to $110.6b in Q4! That doesn’t make sense given their total revenues growth of 4.2%, which earnings should’ve amplified. But a couple big factors played into that surprising decline. After the Tax Cuts and Jobs Act was passed near the end of 2017, companies had to make huge adjustments to overpaid or underpaid taxes on their books.
These are called deferred tax assets and liabilities, which would suddenly be valued very differently under the new corporate-tax rules. So as I analyzed last year, the top 34 SPX companies ran a staggering $209.2b of TCJA adjustments through their earnings in Q4’17! Thus that earlier comparable quarter to Q4 2018 was a mess in GAAP-earnings terms. Q4 2017 was probably the most-distorted quarter in SPX history.
But with about half those one-time TCJA adjustments resulting in profits gains and half in losses, the net impact to overall SPX-top-34 earnings in Q4 2017 was essentially a wash at +$2.7b. That merely boosted overall Q4 2017 profits by 2.5%. A far-more-important factor in Q4’18’s YoY earnings decline came from a single company, Warren Buffett’s Berkshire Hathaway. It was the 5th-largest SPX component as 2018 ended.
BRK suffered a catastrophic $25.4b GAAP loss last quarter! That was almost entirely due to the sharp stock-market decline, which hammered Berkshire’s gigantic investment portfolio lower. It suffered $27.6b of non-cash losses that now have to be run through quarterly earnings. A new accounting rule now requires that unrealized capital gains and losses must be flushed through the bottom line, really irritating Buffett.
In BRK’s 2018 annual report he wrote “As I emphasized in the 2017 annual report, neither Berkshire’s Vice Chairman, Charlie Munger, nor I believe that rule to be sensible. Rather, both of us have consistently thought that at Berkshire this mark-to-market change would produce what I described as “wild and capricious swings in our bottom line.” … Wide swings in our quarterly GAAP earnings will inevitably continue.”
“That’s because our huge equity portfolio – valued at nearly $173 billion at the end of 2018 – will often experience one-day price fluctuations of $2 billion or more, all of which the new rule says must be dropped immediately to our bottom line. … Our advice? Focus on operating earnings, paying little attention to gains or losses of any variety.” Berkshire’s operating earnings were $5.7b in Q4’18, soaring 71.4% y/y!
If BRK’s epic unrealized capital loss is ignored, total SPX-top-34 earnings would’ve surged 23.2% y/y in Q4 2018. On average these top 34 SPX companies reporting profits in both Q4 2017 and Q4 2018 averaged similar 27.8% y/y gains. But the same sharp-deceleration story seen in revenues and OCFs also applies here. The previous four quarters saw far-stronger average growth of 137.0%, 45.9%, 44.5%, and 53.8% y/y!
The massive swings in Berkshire’s enormous investment portfolio are going to distort overall corporate profits in all future quarters with significant SPX gains or losses. We’ll have to watch that going forward, and adjust for it if necessary. But overall corporate profits will be much cleaner in coming years with the TCJA transition year of 2018 behind us. Apples-to-apples comparisons will once again become the norm.
The major slowdown in big U.S. companies’ revenues, operating cash flows, and earnings growth in Q4 2018 is certainly ominous. Especially since the majority of the SPX’s plunge last quarter came relatively late in December. But the most-important thing for attempting to divine whether that monster bull remains alive and well having merely suffered a severe correction, or a young bear is underway, is how valuations look.
These top 34 SPX companies that earned GAAP profits over the past four quarters averaged trailing-twelve-month price-to-earnings ratios way up at 39.7x as Q4 ended! That’s 29.4% above Q4 2017’s average a year earlier, and well into dangerous bubble territory. Over the past century-and-a-quarter or so, U.S. stock markets have averaged 14x earnings which is fair value. Twice that at 28x is where bubble territory begins.
Despite remaining scary-high, big U.S. companies’ average valuations did moderate considerably in Q4. The prior four quarters saw the SPX top 34’s average TTM P/Es run 30.6x, 46.0x, 53.4x, and 49.0x. So the severe near-bear correction definitely did some real work in mauling valuations down. And the P/Es in these tables are as of the end of Q4, which of course didn’t yet reflect the solid y/y growth in Q4 earnings.
By the end of February the top 34 SPX companies’ average TTM P/Es had further dropped to 26.4x, still very expensive but no longer bubble levels. That includes these Q4 results and is even despite the SPX’s powerful rebound rally out of late December’s near-bear lows. So the situation today is nowhere near as dire as at the end of Q4’18 on the valuation front. But that doesn’t mean stock markets are out of the woods.
Bear markets exist because stocks get too expensive leading into the ends of preceding bulls. At 14x fair value it takes 14 years for a company to earn back the price investors are paying for it. The reciprocal of that is a 7.1% return, which is mutually beneficial for both investors with surplus capital and companies that need it. Once extreme bubble valuations birth bear markets, they don’t hibernate until stocks are cheap.
Throughout all of 2018 the U.S. stock markets were trading at extreme bubble valuations. Then in Q4 that severe 19.8% correction hammered the SPX to the verge of formal bear territory. The rebound since has all the hallmarks of a massive bear-market rally. Wall Street’s oft-cited belief that Q4’s plunge was more than enough to restore balance to these stock markets isn’t credible. Bears don’t stop with stocks still expensive!
Historical bear markets after major bulls nearly always maul prevailing US-stock-market valuations back down to cheap levels at 7x to 10x earnings in TTM P/E terms. With the top U.S. stocks averaging 39.7x as Q4 waned and 26.4x at the end of February, the valuation-mean-reversion work still has a long way to go. It is certainly not safe to assume no bear is coming until the SPX trades under 14x, which is far lower.
The SPX soared 11.1% YTD by the end of February, hitting 2784.5. Merely to get to fair value at 14x earnings, not even overshoot to the downside, the SPX has to fall to 1476.6! That’s another 46.7% under this week’s levels! And if corporate earnings actually start retreating this year, the SPX downside targets will fall proportionally. Big bears are normal and inevitable after big bulls, as I explained in depth in late December.
Nearly a decade of Fed-QE-goosed bull market has left traders forgetting how dangerous bears are. The SPX’s last two bears were a 49.1% decline over 2.6 years ending in October 2002, and a 56.8% plunge in 1.4 years climaxing in a stock panic to a March 2009 low! With the big U.S. stocks sporting extreme bubble valuations all of last year, and still near bubble valuations now, it’s hard to believe we aren’t in a young bear.
If that proves true, investors need to lighten up on their stock-heavy portfolios, or at least put stop losses in place. Cash is king in bear markets, since its buying power grows. Investors who hold cash during a 50% bear market can double their holdings at the bottom by buying back their stocks at half-price. But cash doesn’t appreciate in value like gold, which actually grows wealth during major stock-market bears.
Gold investment demand surges as stock markets weaken, as we got a taste of in December. While the SPX plunged 9.2%, gold rallied 4.9% as investors flocked back. The gold miners’ stocks which leverage gold’s gains fared even better, with their leading index surging 10.7% higher. The last time a major SPX selloff awakened gold in the first half of 2016, it soared 30% higher fueling a massive 182% gold-stock upleg!
Absolutely essential in bear markets is cultivating excellent contrarian intelligence sources. That’s our specialty at Zeal. After decades studying the markets and trading, we really walk the contrarian walk. We buy low when few others will, so we can later sell high when few others can. While Wall Street will deny this likely young stock-market bear all the way down, we will help you both understand it and prosper during it.
We’ve long published acclaimed weekly and monthly newsletters for speculators and investors. They draw on my vast experience, knowledge, wisdom, and ongoing research to explain what’s going on in the markets, why, and how to trade them with specific stocks. As of Q4, we’ve recommended and realized 1076 newsletter stock trades since 2001. Their average annualized realized gain is +16.1%! That’s nearly double the long-term stock-market average. Subscribe today for just $12 per issue!
The bottom line is big U.S. stocks’ Q4 2018 results looked impressive on the surface. Good annual growth in sales, operating cash flows, and even earnings excluding Berkshire’s huge mark-to-market losses appeared to buck Q4’s major stock-market selloff. But these growth rates all suffered sharp decelerations from those seen in preceding quarters, suggesting a slowdown is underway. That’s a real problem for stock markets.
Valuations remain dangerously high, deep into bubble territory at the end of Q4. And even after the Q4 earnings were included by late February, near-bubble valuations persisted. That means the likely bear has barely started its stock-price-mauling work to mean revert expensive valuations. On top of that, 2018’s anomalous corporate-tax-cut-transition growth rates are history. All this will continue to pressure stock prices.
Adam Hamilton, CPA
March 11, 2019
Copyright 2000 – 2019 Zeal LLC (www.ZealLLC.com)

The gold miners’ stocks weathered the recent stock-market plunge really well. As evident in their leading GDX ETF, they were already beaten down before stock markets started falling. The resulting explosion of fear bled into GDX, forcing it even lower. Nevertheless, no major technical damage was done. GDX remained well within its consolidation trend channel and is still within striking distance of a major $25 breakout.
Gold stocks’ behavior during stock-market selloffs can seem capricious. This small contrarian sector generally amplifies the price action in gold, which drives its collective profitability. Gold tends to surge in the wake of major stock-market selloffs, which erode investors’ confidence in stocks’ near-term outlook. That greatly boosts gold investment demand as investors soon rush to wisely diversify their stock-heavy portfolios.
This drives gold prices higher after material stock-market weakness. So naturally the gold stocks mirror and amplify gold’s gains which really improve their fundamentals. But this broader strengthening trend is interrupted by a lot of chaotic noise. The collective greed and fear generated by the stock markets’ daily action heavily influences gold-stock traders, especially when the stock markets are exceptionally volatile.
The gold miners’ stocks are just that, stocks. So it’s not uncommon for them to get sucked into serious down days in the general stock markets, which fuel widespread fear. When the flagship S&P 500 stock index (SPX) falls sharply, nearly everything else is dumped in sympathy including the gold stocks. The SPX truly is the dominant center of the global financial-market-sentiment universe, greatly affecting everything.
Unfortunately sharp SPX down days’ ability to heavily influence GDX wreaks havoc on sentiment in the gold-stock sector. Traders read historical studies proving the precious-metals realm is the best place to deploy capital in and after weakening stock markets. So they rightfully expect gold-stock prices to rally on balance. But when GDX plunges on a big SPX down day, their fear soars and they abandon gold stocks.
Human psychology always tends to overweight the importance of recent and traumatic events, with our minds wanting to extrapolate short-term turmoil out into infinity. Thus when gold stocks get sucked into a sharp general-stock selloff, traders assume they can’t thrive in weak stock markets. They lose the trend forest for the daily trees! This fearful herd sentiment scares them into panicking and selling gold stocks low.
Weakening stock markets are like springtime for gold and its miners’ stocks due to higher investment demand. Just as daily temperatures gradually warm over time during spring, gold stocks rally on balance after material stock-market weakness. But spring weather also includes periodic cold snaps that can feel winter-like. They are just temporary counter trend aberrations though, like gold-stock drops on big SPX down days.
This first chart looks at gold stocks’ recent price action through the lens of GDX, the VanEck Vectors Gold Miners ETF. Since its birth in May 2006, GDX has grown into the leading and dominant gold-stock ETF. As of this week GDX’s $7.6b in assets under management ran a whopping 22.0x larger than its next-biggest 1x-long major-gold-stock-ETF competitor! GDX actually weathered the stock plunge really well.
The sharp stock-market selloff in the past couple weeks has been extraordinary, largely unprecedented on multiple key fronts. The S&P 500 was wildly overvalued and overbought in late January, deep in its longest span ever witnessed without a mere 5% pullback. Volatility was trading near record lows, which catapulted complacency off the charts. Last week I explored all this in an essay analyzing stock selling unleashed.
The first real day of serious SPX selling was Friday February 2nd. The gold stocks certainly weren’t high leading into that, as GDX had closed the day before at $23.70. That was merely on the high-middle side of gold stocks’ consolidation trading range. Really since late 2016, GDX has largely meandered between $21 support and $25 resistance. It had neared a major $25 breakout in late January, but couldn’t punch through.
On Friday the 2nd the SPX plunged 2.1% after rising wages on the US monthly jobs report stoked fears of inflation. 10-year Treasury yields continued their sharp surge since the latest Fed rate hike in mid-December. That SPX down day was the worst since September 2016, before Trump won the election and the resulting extreme taxphoria rally. It generated some real fear which spilled over into the gold stocks.
But that stock-fear bleed-in sure wasn’t the only reason GDX fell 3.3% that day to revisit its technically-important 200-day moving average. With inflation fears mounting, futures traders figured the Fed might have to increase the tempo of this rate-hike cycle. So the US Dollar Index surged a sharp 0.7% higher, which led gold-futures speculators to hammer gold 1.4% lower. GDX’s initial stock-selloff loss was reasonable.
The major gold stocks tend to amplify gold’s underlying price action by 2x to 3x. And GDX’s downside leverage to gold that day ran 2.4x, right in line. Most of the time gold stocks still follow gold, even when stock markets are weaker. But on exceptional SPX down days when fear really flares, that overshadows gold as traders are infected by prevailing herd sentiment. That really started to happen on Monday the 5th.
The SPX selloff greatly intensified as it plunged 4.1%, its worst daily drop since way back in mid-August 2011! That was extreme, as stock markets usually don’t plummet so rapidly from record highs. Because it had been so long since the SPX plunged, fear skyrocketed as evidenced by the VIX implied-volatility index. Foolish traders who had aggressively shorted volatility near record lows scrambled to unwind their bets.
Gold caught a modest bid that day, rallying 0.6% despite the US Dollar Index climbing another 0.4% on safe-haven buying. On days when the SPX plunges yet gold climbs, traders are torn about what to follow so the gold stocks generally split the difference. Indeed that day GDX slid another 0.9%, far milder than the sharp SPX plunge but still worse than gold. That left GDX at $22.71, sliding farther under its key 200dma.
After plunging even deeper early on Tuesday the 6th, the SPX reversed sharply to a 1.7% gain on close as the extreme VIX-futures long buying abated. Gold suffered a 1.1% loss on the stronger stock markets as well as a major 1.4% draw in its leading GLD gold ETF’s holdings. Investors likely dumped GLD shares for a source of capital. Since gold is much stronger than general stocks in SPX selloffs, GLD is easy to sell.
With gold falling sharply GDX dropped another 2.6% on that third day of the SPX selloff. Once again that made for 2.4x downside leverage to gold, which is perfectly normal. Although that decisively broke GDX below its 200dma, at $22.11 it remained well within its long-established consolidation trend channel. With trend support at $21, gold stocks still had a ways to go before they threatened a major technical breakdown.
The SPX selling resumed on Wednesday the 7th with a relatively-minor 0.5% loss. Gold fell by the same amount, as once again the US Dollar Index surged 0.7% on flight-capital safe-haven buying. GDX lost another 1.4% to hit $21.80 on close. That amplified gold by 2.8x, still within that normal 2x to 3x range for the major gold stocks. The gold stocks were weathering that sharp SPX selloff really well by that point.
On Thursday the 8th the stock markets started sliding again on no news, and the SPX fell relentlessly all day long. By the time the dust settled, it had collapsed another 3.8%! Two huge 4%ish down days out of just four trading days was very serious, generating the most fear traders have experienced for at least a couple years. Gold eked out a 0.1% gain with the US dollar flat, and the gold stocks split the difference as usual.
GDX only retreated 0.6% that day the SPX formally plunged into correction territory for the first time since early 2016. That was truly an impressive show of strength given the stock markets rapidly spiraling lower. At $21.68, GDX remained well above its $21 support line that has held rock solid since late 2016. It looked like the gold stocks were nearing selling exhaustion since they fell so little on such a huge SPX down day.
In just five trading days the SPX had plummeted 8.5%! That was a big drop by any standard, let alone off record highs out of near-record-low volatility. Interestingly GDX exactly mirrored that drop, falling an identical 8.5% in that same span. Relative to gold that was excessive, 3.5x the 2.4% gold lost during that same timeframe. But with GDX remaining well within its consolidation trend channel, technical damage was minor.
Last Friday the 9th once again saw the SPX slide rapidly after open before reversing sharply to a large 1.5% daily gain. Gold stocks got sucked into that early fear-spawning selling, which was exacerbated by gold itself slumping lower before a -0.2% close. GDX tested that $21 support intraday, but bounced back to a dead-flat close. This small contrarian sector had successfully weathered an exceptional SPX selloff!
This week the SPX and gold both rebounded, each rallying Monday, Tuesday, and Wednesday. Thus it wasn’t surprising GDX followed suit, rallying 1.3%, 0.1%, and a monster 4.6% by the data cutoff for this essay. Thus over the entire 9-trading-day span of the recent volatility storm, GDX merely slipped 2.9%. That was again between the SPX’s 4.4% loss and gold’s slight gain. The gold miners’ stocks are faring fine!
This Wednesday GDX was back up to $23.01, exactly in the middle of its consolidation trading range of the past year between $21 support and $25 resistance. GDX was back over its 200dma again, and still within striking range of that critical $25 breakout I discussed a month ago. If you had totally tuned out for 9 trading days and ignored the SPX-selloff action, it would’ve looked like gold stocks were still merely basing.
One of the greatest benefits to continuing to study the markets and staying immersed in them is you will gradually become immune to herd sentiment. After you’ve seen enough selloffs, they increasingly lose their ability to scare you. And you remember that sharp selloffs are short-lived, whether in the general stock markets or gold stocks. So you come to accept them as inevitable periodically, and they don’t rile you up.
A great analogy is a beekeeper. Most people are scared of bees, freaking out if bees buzz too closely or land on them. I know I’m no fan of bees invading my personal space. But beekeepers have no fear of bees because they work with them all the time. They certainly respect bees and understand the risks of being around them. But all their experience with bees leads to enough knowledge to negate emotional responses.
Gold stocks have always been a volatile sector. That’s actually a core reason they are so alluring, as this volatility translates into big and fast gains when they are rallying. In roughly the first half of 2016, GDX rocketed 151.2% higher on a parallel 29.9% gold upleg! Volatility is a double-edged sword, sectors that can rally fast will also fall fast. So gold-stock investors must accept periodic sharp selloffs as par for this course.
The major gold stocks as represented by GDX are doing fine. Despite some choppiness as the SPX was flailing about in recent weeks, they are continuing to base in their well-established consolidation trend. They are still on track for a major GDX $25 breakout, which will work wonders to shift sector psychology back to bullish again and spur big capital inflows. The gold miners’ stocks are low technically and cheap fundamentally.
This last chart zooms out to the bigger picture, looking at GDX since 2007 which is largely its entire life. Gold stocks move in great bull-bear cycles like everything else, and they remain incredibly low today. The small highlighted square in the lower right encompasses the entire first chart. These prevailing gold-stock levels are almost as low as during 2008’s epic stock panic, which is absurd based on fundamentals.
This powerful new gold-stock bull ignited in early 2016 remains young and small. Its bull-to-date peak in early August 2016 was merely a 3.3-year GDX high, still very low in secular context. After this sector was sucked into 2008’s stock panic, the major gold stocks more than quadrupled out of those extreme lows. A quadruple from January 2016’s all-time low birthing this bull would catapult GDX back up near $50.
That means the major gold stocks easily have the potential to more than double again from here, seeing another 117% GDX gain in the next couple years! Is there any other sector in all these wildly-overvalued stock markets that can make such a claim? No way. Like gold, the gold stocks are now deeply out of favor thanks to the extreme stock-market bull that may have just peaked in late January. Sentiment is poor.
But as gold inevitably powers higher in the wake of this newest SPX correction on strengthening demand from investors, the gold stocks will follow and amplify its gains. Fundamentally the major gold stocks are still dirt-cheap. That’s readily evident in their quarterly operational and financial reports, which I closely follow and analyze for the major GDX gold miners. I can’t wait for their Q4’17 results over the coming weeks.
The primary measure of industry-wide gold-mining profitability is all-in sustaining costs, what its costs to mine and replenish an ounce of gold. In Q3’17 that averaged $868 for the GDX gold miners. And these costs are pretty stable, averaging $867, $878, $875, and $855 in the four quarters before that. So odds are the major gold miners’ collective all-in sustaining costs will hold near these levels in Q4’17 and Q1’18 too.
Gold averaged $1279 in Q3, leading to fat per-ounce profits of $411. Gold was essentially flat in Q4 with a $1276 average price. That means the GDX-component gold miners are likely to soon report profits of $408 per ounce. I’ll dig deeply into those new Q4 quarterlies as they are released, and publish an essay on the results in mid-March. Since Q4 reporting includes full-year results, regulatory deadlines are twice as long.
The SEC requires normal quarterly reports to be filed within 40 to 45 days after quarter-ends, depending on companies’ sizes. But since they have to prepare annual reports with the quarter that ends fiscal years, usually Q4, that deadline is extended to 60 to 90 days. So by mid-March most of the major gold miners’ Q4’17 results will be out. I expect average all-in sustaining costs to come in flat like usual in these reports.
And that’s super-bullish given what gold is doing. The yellow metal that drives its miners’ profits is faring much better in Q1 than it did in Q4. It’s averaging $1331 quarter-to-date, up 4.3% sequentially from Q4. So if AISCs are stable like usual, profits will surge which investors will anticipate in advance. The same $868 AISC implies Q1 GDX-major-gold-miner profitability of $463 per ounce, soaring 13.3% quarter-on-quarter!
So my month-old forecast of a GDX $25 breakout on Q4 earnings remains highly likely. When investors see how the gold miners are faring in their latest reported quarter, they are going to extrapolate mining costs into Q1. That will portend exploding profitability. GDX only needs to rally another 8.6% from its mid-week levels to hit $25. And once gold stocks break out decisively to the upside, they are off to the races.
In all the markets buying begets buying. The more a sector or asset is rallying, the more investors want to participate. And the more capital they pour in, the more those prices keep rallying. That creates and fuels a powerful virtuous circle of buying. Gold stocks have drifted sideways for so long now that they need to achieve a major upside breakout from their consolidation to catch investors’ interest. That’s not far away.
Despite the roller-coaster ride in gold stocks as the wild SPX volatility bullied them around in the past couple weeks, GDX is still within striking distance of that key $25 breakout. Once that happens, the gold stocks’ popularity will surge again. There’s still time to buy low before lots more investors start returning which will catapult this small contrarian sector sharply higher. The gold stocks look really bullish today!
While investors and speculators alike can certainly play gold stocks’ powerful coming upleg with major ETFs like GDX, the best gains by far will be won in individual gold stocks with superior fundamentals. Their upside will far exceed the ETFs, which are burdened by over-diversification and underperforming gold stocks. A carefully-handpicked portfolio of elite gold and silver miners will generate much-greater wealth creation.
At Zeal we’ve literally spent tens of thousands of hours researching individual gold stocks and markets, so we can better decide what to trade and when. As of the end of Q4, this has resulted in 983 stock trades recommended in real-time to our newsletter subscribers since 2001. Fighting the crowd to buy low and sell high is very profitable, as all these trades averaged stellar annualized realized gains of +20.2%!
The key to this success is staying informed and being contrarian. That means buying low before others figure it out, before undervalued gold stocks soar much higher. An easy way to keep abreast is through our acclaimed weekly and monthly newsletters. They draw on my vast experience, knowledge, wisdom, and ongoing research to explain what’s going on in the markets, why, and how to trade them with specific stocks. For only $12 per issue, you can learn to think, trade, and thrive like contrarians. Subscribe today, and get deployed in the great gold and silver stocks in our full trading books!
The bottom line is the gold stocks weathered the recent sharp stock-market selloff really well. The SPX plunged for the first time in a couple years, generating a big and sharp fear spike. As usual that spooked the gold-stock traders, who sold and fled. Yet despite the carnage GDX’s major consolidation support at $21 held solid. The gold miners’ stocks soon rebounded sharply back up to the middle of their basing channel.
With GDX trading near $23 this week, that critical $25 breakout to entice investors back remains within easy range. Once the collective gold-mining costs reported in the upcoming Q4 results are compared with higher Q1 prevailing gold prices, strong gold-stock buying should resume. Gold stocks have always been a volatile sector, so there’s no reason for traders to fear periodic selloffs like they suffered in recent weeks.
Adam Hamilton, CPA
February 16, 2018
Copyright 2000 – 2018 Zeal LLC (www.ZealLLC.com)
The stock markets have rocketed higher since Trump’s election win on hopes for big corporate tax cuts. This extreme rally has left stocks exceedingly overvalued and overbought today. A major selloff is long overdue and likely imminent. When stocks inevitably roll over and mean revert lower to rebalance away euphoric sentiment, gold is the main beneficiary. Gold investment demand soars when stocks materially slide.
Two trading days before the November 2016 presidential election, I published an essay that explored how stock-market action leading into elections really sways their results. Its conclusion based on long market history was “The stock markets overwhelmingly and conclusively predict Donald Trump will win!” That was a hardcore contrarian stance before Election Day, when such an upset seemed impossible to most.
Since Americans voted for our next president, the flagship S&P 500 broad-market stock index (SPX) has soared 28.6% higher in 14.0 months! That extraordinary rally was mostly driven by hopes for big tax cuts soon with Republicans newly controlling the US government. And they indeed delivered last month with a massive corporate tax cut. That sets up a classic buy-the-rumor-sell-the-news scenario for these record markets.
Ever since that election, Wall Street has argued that stocks are surging due to strong corporate-profits growth. But that’s not true according to hard valuation data. In late October 2016 just before Americans voted, the 500 companies of the SPX averaged trailing-twelve-month price-to-earnings ratios of 26.3x. Even before Trump won, stocks were already very expensive and nearing dangerous bubble territory.
For the past century and a quarter, average broad-market TTM P/E ratios have run 14x earnings. That’s fair value for stock markets, and twice that at 28x is formally bubble territory. Rather ironically during his campaign, Trump often warned about the stock-market bubble created by the Fed! While he loves these same stock markets now, they are a lot more expensive after this past year’s massive taxphoria-fueled rally.
2017 indeed proved a strong year for corporate profits as optimistic Americans spent money fast. Yet at the end of December a couple weeks ago, the elite SPX companies were averaging a TTM P/E way up at 30.7x! That’s well into bubble territory, and history has proven stock markets never fare well for long after valuations are bid up to such unsustainable extremes. That guarantees a major stock selloff looms.
Over roughly the same post-election span where the SPX blasted up 28.6%, SPX valuations rose 16.8%. That means about 6/10ths of the rally was driven by multiple expansion, higher valuations. Only 4/10ths can be attributable to rising corporate earnings, and even that is suspect. The economic optimism that was unleashed by the Republican sweep was huge, driving big spending. But that anomaly won’t last for long.
And the Republicans’ corporate tax cuts won’t magically rescue stocks. While good news for the US economy, they won’t do enough to work off today’s extreme bubble valuations. Wall Street estimates are generally for 10% corporate-profits growth this year due to lower taxes. That would merely push the SPX P/E back to 27.6x, near-bubble levels. Stocks are now way too expensive for corporate tax cuts to help much!
As the stock markets surged into the tax-reform bill’s actual passage in recent months, contrarian traders assumed any stock selling was being delayed. Why realize big capital gains in 2017 if tax rates might be significantly lower in 2018? But the stock markets have blasted even higher so far in January, with no meaningful selling yet materializing. That has left the SPX extremely overbought technically, a bearish omen.
In the first 4 trading days of 2018, the SPX surged another 2.6% higher. That’s truly an extreme rate of ascent by any standard. There are about 250 trading days per year, so annualize out these early-year gains and the SPX is skyrocketing at a 163% yearly rate! Obviously there’s zero chance 2018 could see such absurd gains. Ominously such a fast climb looks parabolic for a stock index as enormous as the SPX.
In late December the collective market capitalization of those 500 SPX companies was $24.4t. Such a vast number gives the stock markets great inertia. So a parabolic surge in the general stock markets will always be relatively muted. Unlike vastly-smaller assets like bitcoin, stock markets are far too large to catapult higher in the terminal phases of bull markets. The SPX’s early-2018 action has truly been extreme.
The stock markets are now dangerously overbought, implying a major selloff is probable and imminent. Overboughtness happens when stock markets surge too far too fast to be sustainable. There are many ways to measure overboughtness, but one of the best is looking at price levels relative to their own key moving averages. Well over a decade ago I developed Relativity Trading to empirically define this state.
200-day moving averages are probably the best price baselines over time, striking an excellent balance between filtering out daily noise and following long-term trends in force. A construct I call the Relative SPX looks at this dominant stock index as a multiple of its 200dma. It is simply calculated by dividing the SPX by its underlying 200dma each day. Charting the results over time yields illuminating trading insights.
In any trending market, prices tend to meander in well-defined ranges relative to their 200dmas. When they stretch too far above their 200dmas by their own historical standards, sharp selloffs soon follow to restore normalcy and rebalance sentiment. This chart superimposes the SPX itself in blue over the rSPX in red, highlighting the extreme overboughtness in the stock markets after early January’s euphoric surge.
The Relative SPX effectively flattens the SPX’s black 200dma line at 1.00x, and shows where the SPX is trading relative to that 200dma in perfectly-comparable percentage terms over time. As of this week, the rSPX soared as high as 1.103x! In other words, the mighty S&P 500 was stretched 10.3% above its key 200dma. Such extremes are very unusual and never sustainable for long, signaling major selloffs looming.
Relativity Trading looks at the past five calendar years’ trading action to define a relative range. For the SPX that now runs from 0.94x to 1.08x. When the SPX falls down near or under 94% of its 200dma, it’s very oversold so a major rally is very likely soon. But when the SPX climbs up near or over 108% of its 200dma, it’s very overbought heralding an imminent major selloff. Such fast price rises simply can’t persist.
This week’s rSPX levels hit a 4.4-year high, which might not sound too extreme. But other things need to be taken into consideration when high rSPX levels are reached. The trajectory of the 200dma is one of the most important. While 200dmas mostly rise in bull markets, that’s not always the case. Early in young bull markets 200dmas are still falling from the preceding bears. 200dmas can also drift lower in major corrections.
The last SPX corrections erupted in mid-2015 and early 2016, when the stock markets fell 12.4% in 3.2 months followed by another 13.3% in 3.3 months. A correction is technically a 10%+ SPX selloff. That pushed SPX levels low enough for long enough to drag its 200dma lower for the better part of several quarters. When stocks started rallying again, the rSPX shot to high levels before the 200dma fully turned higher.
Most rSPX extremes are seen early in bull markets or after corrections when stock prices surge higher before a declining or flat 200dma has time to catch up. But that certainly isn’t the case this year. The SPX’s 200dma has been rising sharply ever since Trump won the election in November 2016. Today’s rSPX extreme is much worse than it sounds because it’s coming from a high 200dma after a powerful rally!
Normal healthy bull markets see corrections once a year or so, when prices fall back to their 200dmas to work off greed and restore sentiment balance. Today’s SPX would have to drop more than 10% just to revisit its 200dma, a major selloff by recent standards. It’s been 1.9 years since the end of the SPX’s last correction, so the next one is long overdue. Extremely-overbought conditions like today help birth major corrections.
Considering how far and fast stock markets have rallied, how euphoric and complacent traders are today, and how extremely expensive today’s bubble-valued stock markets are, it’s hard to imagine the overdue and coming major selloff not at least testing the upper limits of corrections. That portends a selloff that nears 20%, which is probably the best-case scenario for the bulls. Anything beyond 20% is a new bear market.
And unfortunately that new-bear scenario is far more likely. As of this week this SPX bull has rocketed up an extreme 306.7% in 8.8 years, making for the third-largest and second-longest stock bull in all of US history! Much of those gains were fueled by epic central-bank easing far beyond anything ever before seen in world history. This year both the Federal Reserve and European Central Bank are slamming on the brakes.
The Fed just started its first-ever quantitative-tightening campaign in Q4’17 to unwind years and trillions of dollars of quantitative easing. QT is going to gradually ramp up in 2018 to a powerful $50b-per-month pace starting in Q4 this year. Per the Fed’s schedule, it will effectively destroy $420b of capital in 2018 by letting QE-purchased bonds roll off its balance sheet. Nothing remotely close has ever happened before!
On top of that the ECB just slashed in half its own QE campaign this month to a €30b monthly pace, with a targeted QE end date of September. That means ECB QE will collapse from €720b in 2017 to just €270b in 2018, a radical 5/8ths plunge. Between the Fed’s QT and ECB’s QE tapering, there will be the equivalent of $950b more tightening and less easing in 2018 compared to 2017! That’s going to leave a mark.
The Fed and ECB will literally strangle this stock bull by unwinding and slowing the QE that grew it. And this isn’t just a 2018 thing. In 2019 the Fed and ECB are on track to have another $1450b of tightening compared to 2017. So these stock markets are in real trouble with central-bank liquidity being pulled regardless of their extreme overvaluations and overboughtness. 2018 sure ain’t gonna look like 2017 at all!
Bear markets ultimately tend to cut stock prices in half, literal 50% losses in the SPX. The last couple bears that started in early 2000 and late 2007 saw the SPX drop 49.1% in 2.6 years and 56.8% in 1.4 years! Bear markets are exceedingly dangerous and not to be trifled with. They also tend to grow in size in proportion to their preceding bulls, so the next bear should be bigger than usual after such a massive bull.
A major stock selloff imminent, whether a serious correction or new bear, certainly sounds like bad news for investors. But like everything else in the markets, it offers huge opportunities to profit for contrarians who see it coming and prepare. A great Bible verse that applies to the inexorable stock-market cycles is Proverbs 27:12, “The prudent see danger and take refuge, but the simple keep going and pay the penalty.”
When stock markets start materially weakening, investors return to gold. Gold is the ultimate portfolio diversifier because it tends to move counter to stock markets. Gold is forgotten when stock markets are high and euphoria and complacency abound. But once major selloffs inevitably follow major rallies, gold demand explodes as investors rush to diversify their stock-heavy portfolios. Gold is effectively the anti-stock trade.
As you’d imagine with today’s taxphoria-crazed stock markets, gold investment is really low. One metric to approximate stock investors’ capital deployed in gold is the ratio between the SPX’s market cap and the value of the leading GLD SPDR Gold Shares gold ETF. At the end of December, those 500 elite SPX companies were collectively worth $24,432.5b. That dwarfs the meager capital now deployed in GLD shares.
GLD exited 2017 holding 837.5 metric tons of physical gold bullion in trust for its shareholders. That was worth just $35.1b at $1302 gold. That means only 0.14% of the stock-market capital invested in the SPX companies is invested in the world’s leading gold ETF. I’ve studied the history of this ratio, and it is usually much higher. From 2009 to 2012 for example, GLD holdings’ value averaged 0.48% of SPX market cap.
So there’s no doubt today’s stock investors are radically underinvested in gold. They couldn’t care less about it when stocks apparently do nothing but rally indefinitely. But once the next major stock selloff arrives, gold investment will quickly return to favor. This chart looks at the SPX and gold over the past few years. The last major stock-market correction was actually the catalyst that birthed today’s gold bull!
Mid-2015 was similar to late 2017 in stock-market terms. The SPX was relentlessly powering to endless new record highs while volatility was exceptionally low. Like today, stock traders were excessively bullish and hyper-complacent. It had been a near-record 3.6 years since the last correction, so people foolishly assumed stock-market cycles had vanished. Yet not even extreme central-bank easing can eliminate cycles.
That’s because they are ultimately fueled by the herd behavior of greedy and fearful humans. As long as these powerful warring emotions drive collective trading decisions, stock-market cycles will persist. Gold was despised in that record-stock-market environment, ultimately slumping to a deep 6.1-year secular low late that year. Gold-futures speculators were deeply afraid of the Fed’s coming first rate hike of this cycle.
But when the stock markets finally started falling again, triggered by sharp selloffs in the Chinese stock markets, gold rocketed higher. Stock investors watching their portfolios bleed rushed to get back some gold exposure to mitigate the stock losses. They flooded back into gold with a vengeance, catapulting it 29.9% higher in just 6.7 months in essentially the first half of 2016. That gold-bull uptrend continues today.
In Q4’15 when gold was largely forgotten and despised, GLD’s holdings fell 45.0 metric tons or 6.6%. But in Q1’16 after stock markets corrected sharply, GLD’s holdings soared 176.9t or 27.5% higher! Gold investment demand turned on a dime, and the trigger was the last stock-market correction. Stock selloffs driving surging gold buying is nothing new, so gold will certainly rally again in and after the next SPX correction.
When stock investors want gold exposure fast, they naturally turn to GLD. This gold ETF acts as conduit for the vast pools of stock-market capital to slosh into and out of gold. GLD’s mission is to track the gold price. So when stock investors buy GLD shares at faster rates than gold is rising, this ETF’s price will soon decouple to the upside and fail its mission. GLD’s managers prevent this by shunting that buying into gold.
When GLD-share demand exceeds gold’s own, GLD issues new shares to offset and absorb the excess. The capital raised from these sales is used to directly buy more physical gold bullion for GLD to hold in trust for its shareholders. Big GLD buying by American stock investors alone catapulted gold’s price far higher in Q1’16. That 176.9t surge in GLD’s holdings accounted for 95.2% of the total jump in world gold demand!
So if today’s literally-bubble-valued extremely-overbought hyper-complacent stock markets concern you, start upping your gold allocation before everyone else does. Since gold rallies when stock markets sell off, it’s the ultimate portfolio diversifier. While forgotten when stock markets are high and euphoric, gold is quickly remembered and returned to once material stock selloffs inevitably erupt. Early contrarians win big.
In roughly the first half of 2016 after the last SPX correction, gold again powered 29.9% higher. Investors could’ve easily played that in GLD shares. But when gold rallies significantly, the greatest gains are won in the gold miners’ stocks. Their profits are really leveraged to prevailing gold prices, so their stocks tend to amplify gold gains by 2x to 3x. In roughly the first half of 2016, the leading gold-stock index soared 182.2% higher!
With these taxphoria-inflated stock markets hyper-risky today, the potential upside in gold stocks is huge. This sector is often the only big winner during major stock-market selloffs, whether just bull corrections or full-on bear markets. Gold investment demand surges when stock markets materially sell off, driving gold sharply higher. The great gold miners’ stocks with superior fundamentals greatly leverage gold’s gains.
At Zeal we’ve literally spent tens of thousands of hours researching individual gold stocks and markets, so we can better decide what to trade and when. As of the end of Q3, this has resulted in 967 stock trades recommended in real-time to our newsletter subscribers since 2001. Fighting the crowd to buy low and sell high is very profitable, as all these trades averaged stellar annualized realized gains of +19.9%!
The key to this success is staying informed and being contrarian. That means buying low before others figure it out, before undervalued gold stocks soar much higher. An easy way to keep abreast is through our acclaimed weekly and monthly newsletters. They draw on my vast experience, knowledge, wisdom, and ongoing research to explain what’s going on in the markets, why, and how to trade them with specific stocks. For only $12 per issue, you can learn to think, trade, and thrive like contrarians. Subscribe today, and get deployed in the great gold and silver stocks in our full trading books!
The bottom line is stock selloffs are great for gold. This leading alternative investment is ignored when stocks are high. But since it rallies when stocks weaken, demand soars for portfolio diversification during material stock selloffs. Gold is ready to power higher again once these extreme stock markets inevitably roll over. The next major selloff is imminent given the bubble valuations and extreme overboughtness today.
Republicans’ new corporate tax cuts are good news for the economy, but they won’t boost profits anywhere near enough to work off these dangerous overvaluations. And with the Fed and ECB both engaging in unprecedented tightening campaigns this year, stock markets face fierce monetary headwinds. Gold is the best place to take refuge and grow wealth as normal stock-market cycles finally resume again.
Adam Hamilton, CPA
January 12, 2018
Copyright 2000 – 2018 Zeal LLC (www.ZealLLC.com)
The US stock markets enjoyed an extraordinary surge in 2017, shattering all kinds of records. This was fueled by hopes for big tax cuts soon since Republicans regained control of the US government. But such relentless rallying has catapulted complacency, euphoria, and valuations to dangerous bull-slaying extremes. This has left today’s beloved and lofty stock markets hyper-risky, with serious selloffs looming large.
History proves that stock markets are forever cyclical, no trend lasts forever. Great bulls and bears alike eventually run their courses and give up their ghosts. Sooner or later every secular trend yields to extreme sentiment peaking, then the markets inevitably reverse. Popular greed late in bulls, and fear late in bears, ultimately hits unsustainable climaxes. All near-term buyers or sellers are sucked in, killing the trend.
This mighty stock bull born way back in March 2009 has proven exceptional in countless ways. As of mid-December, the flagship S&P 500 broad-market stock index (SPX) has powered 297.6% higher over 8.8 years! Investors take this for granted, but it’s far from normal. That makes this bull the third-largest and second-longest in US stock-market history. And the superior bull specimens vividly highlight market cyclicality.
The SPX’s biggest and longest bull on record soared 417% higher between October 1990 and March 2000. After it peaked in epic bubble-grade euphoria, the SPX soon yielded to a brutal 49% bear market over the next 2.6 years. The SPX wouldn’t decisively power above those bull-topping levels until 12.9 years later in early 2013, thanks to the Fed’s unprecedented QE3 campaign! The greatest bull ended in tears.
The second-largest bull was a 325% monster between July 1932 to March 1937. But that illuminated the inexorable cyclicality of stock markets too, as it arose from the ashes of a soul-crushing 89% bear in the aftermath of 1929’s infamous stock-market crash. Seeing today’s central-bank-inflated bull balloon to such monstrous proportions rivaling the greatest stock bulls on record highlights how extreme it has become.
All throughout stock-market history, this binary bull-bear cycle has persisted. Though some bulls grow bigger and last longer than others, all eventually give way to subsequent bears to rebalance sentiment and valuations. So stock investing late in any bull market, which is when investors complacently assume it will last indefinitely, is hyper-risky. Bear markets start at serious 20% SPX losses, and often approach 50%!
Popular psychology in peaking bull markets is well-studied and predictable. Investors universally believe “this time is different”, that some new factor leaves their bull impregnable and able to keep on powering higher indefinitely. This new-era mindset fuels extreme euphoria and complacency, with memories of big selloffs fading. Investors’ hubris swells, as they forget markets are cyclical and ridicule any who dare warn.
To any serious student of stock-market history, there’s little doubt today’s stock-market situation feels exactly like a major bull-market topping. All the necessary ingredients are in place, ranging from extreme greed-drenched sentiment to extreme bubble valuations literally. If this bull was merely normal, the risks of an imminent countertrend bear erupting to eradicate these late-bull excesses would absolutely be stellar.
But the downside risks in the wake of this exceptional bull are far greater than usual. That’s because much of this bull is artificial, essentially a Fed-conjured illusion. And that was even before the incredible 2017 taxphoria surge in the wake of Trump’s surprise victory! Back in early 2013 as the SPX was finally regaining its previous bull’s peak, the Fed unleashed its wildly-unprecedented open-ended QE3 campaign.
Understanding the Fed’s role in fomenting this anomalous stock bull is more important than ever. Not only is the Fed deep into its 12th rate-hike cycle of the past half-century or so, it has begun quantitative tightening for the first time ever. This QT is starting to unwind the trillions of dollars of QE that levitated the stock markets for years. While QT started small in Q4’17, it’s ramping to a $50b-per-month pace in Q4’18!
The Fed’s QE giveth, so the Fed’s QT taketh away. Literally trillions of dollars of capital evoked out of nothing by the Fed to monetize bonds directly and indirectly bid stock markets higher. The Fed’s deep intertwinement in this stock bull’s fortunes is easiest to understand with a chart. Here the SPX in blue is superimposed over its implied-volatility index, the famous VIX that acts as a proxy for popular greed and fear.
This anomalous stock bull was again birthed in March 2009 in the wake of the first true stock panic since 1907. After that epic maelstrom of fear fueled such an extreme plummet to climax a 57% bear market, a new bull was indeed overdue despite rampant bearishness and pessimism. The very trading day before the SPX bottomed, I wrote a hardcore contrarian essay explaining why a major new bull market was imminent.
Back in early 2009 stock-market valuations were so low after the panic that a new bull was fully justified fundamentally. And its first four years or so played out perfectly normally. Between early 2009 to late 2012, this bull market’s trajectory was typical. It rocketed higher initially out of deep bear lows, but those gains moderated as this bull matured. And its upside progress was punctuated by healthy major corrections.
Stock-market selloffs are generally defined in set ranges. Anything under 4% isn’t worth classifying, it is just normal market noise. Then from 4% to 10%, selloffs become pullbacks. Beyond that in the 10%-to-20% range are corrections. Selloffs greater than 20% are formally considered bear markets. In both 2010 and 2011 the SPX suffered major corrections in the upper teens, which are essential to rebalance sentiment.
As bull markets power higher, greed naturally grows among investors and speculators. They start to get very complacent and expect higher stocks indefinitely. Eventually this metastasizes into euphoria and even hubris. Major corrections, big and sharp mid-bull selloffs, rekindle fear to offset excessive greed and keep bulls healthy. Interestingly even in 2010 and 2011 the Fed played a key role in stock-market timing.
Those early bull years’ major corrections coincided exactly with the ends of the Fed’s first and second quantitative-easing campaigns. QE is an extreme monetary-policy measure central banks can use after they force interest rates, their normal tool, down to zero. The Fed’s zero-interest-rate policy went live in mid-December 2008 in response to that first stock panic in a century, and QE1 then QE2 soon followed.
Quantitative easing involves creating new money out of thin air to buy up bonds, effectively monetizing debt. While QE1 and QE2 certainly caused market distortions, both campaigns had predetermined sizes and durations. When traders knew a particular QE campaign was nearing its end, they started selling stocks which drove the major corrections. So the Fed decided to change tactics when it launched QE3.
As the SPX approached 1450 in late 2012, that normal stock-market bull was topping due to expensive valuations. After peaking in April, stock markets started rolling over heading into that year’s presidential election. Stock-market fortunes in the final several months leading into elections can greatly sway their outcomes. So in mid-September 2012 less than 8 weeks before the election, a very-political Fed hatched QE3.
QE3 was radically different from QE1 and QE2 in that it was totally open-ended. Unlike its predecessors, QE3 had no predetermined size or duration! So stock traders couldn’t anticipate when QE3 would end or how big it would get. Stock markets surged on QE3’s announcement and subsequent expansion a few months later. Fed officials started to deftly use QE3’s inherent ambiguity to herd stock traders’ psychology.
Whenever the stock markets started to sell off, Fed officials would rush to their soapboxes to reassure traders that QE3 could be expanded anytime if necessary. Those implicit promises of central-bank intervention quickly truncated all nascent selloffs before they could reach correction territory. Traders realized that the Fed was effectively backstopping the stock markets! So greed flourished unchecked by corrections.
This stock bull went from normal between 2009 to 2012 to literally central-bank conjured from 2013 on! The Fed’s QE3-expansion promises so enthralled traders that the SPX went an astounding 3.6 years without a correction between late 2011 to mid-2015, one of the longest-such spans ever. With the Fed jawboning negating healthy sentiment-rebalancing corrections, sentiment grew ever more greedy and complacent.
QE3 was finally wound down in late 2014, leading to this Fed-goosed stock bull stalling out. Without central-bank money printing behind it, the stock-market levitation between 2013 to 2015 never would’ve happened! One of the most-damning charts of recent years shows the SPX perfectly tracking the growth in the Fed’s balance sheet as its monetized bonds accumulated there. This great stock bull is largely fake.
Without the Fed’s QE firehose blasting new money into the system, stock-market corrections resumed in mid-2015 and early 2016. After topping in May 2015 not much higher than QE3-ending levels, the SPX drifted sideways to lower for fully 13.7 months. That too should’ve proven this artificially-extended bull’s top, giving way to the overdue subsequent bear. But it was miraculously short-circuited by the Brexit vote.
Heading into late June 2016, Wall Street was forecasting a sharp global stock-market selloff if British people actually voted to leave the EU. What was seen as a low-probability outcome promised to unleash all kinds of uncertainty and chaos. And indeed when that Brexit vote surprised and passed, the SPX plunged for a couple trading days. Then meddling central banks stepped in assuring they were ready to intervene.
So this tired old bull again started surging to new record highs in July and August 2016, although they weren’t much better than May 2015’s. After that euphoric surge on hopes for post-Brexit-vote central-bank easings, the SPX started to roll over again heading into the US presidential election. Wall Street warned just like Brexit that a Trump win would ignite a major stock-market selloff, and again proved dead wrong.
The shocking post-election stock surge has been called Trumphoria or taxphoria. Capital flooded into stocks for a variety of reasons. In addition to hopes for far-superior government policies boosting corporate profits, funds rushed to buy to chase good year-end gains to report to their investors. And the resulting stock-market record highs, and fevered anticipation for big tax cuts, started seducing investors back.
This exuberant psychology greatly intensified in 2017, with the SPX periodically surging to series of new record highs on political news fanning investors’ optimism. Since Trump won the election, nearly all of the SPX’s significant daily rallies ignited on news implying big tax cuts were indeed coming soon as widely hoped. The wealth effect from that stock elation unleashed big spending, which really boosted corporate profits.
But this Fed-goosed stock bull was already very long in the tooth, and stock valuations were already near formal bubble territory, even before Trump was elected. The resulting Trumphoria surge on hopes for big tax cuts soon really exacerbated serious pre-election risks. That included extending the span since the end of the last SPX correction to 1.9 years. Normal healthy bull markets see correction-grade selloffs annually.
Between the SPX’s original top in May 2015 soon after QE3 ended and Election Day 2016, at best stock markets simply ground sideways. At worst they were rolling over into what should’ve grown into a major new bear. Trumphoria short-circuited all that, sending stocks sharply higher and delaying the inevitable cyclical reckoning. By mid-December 2017 the SPX had rocketed a crazy 25.7% higher since Election Day alone!
An ominous side effect of that anomalous late-bull surge was extremely-low volatility, with all kinds of low-volatility records set. The VIX S&P 500 implied-volatility index on this chart reflects that, slumping to multi-decade lows throughout 2017! Low volatility reflects low fear and high complacency, the exact herd sentiment ubiquitous at major bull-market toppings. Just like stock markets, volatility is forever cyclical too.
Volatility often skyrockets off exceptional lows, as the great sentiment pendulum must swing back to fear after peaking deep in the greed side of its arc. And the only thing that generates fear late in stock bulls is sharp selloffs. No matter how bad news is, euphoric investors happily ignore it if it doesn’t drive stocks lower. But eventually some catalyst always arrives, usually unforeseen, that finally stakes the geriatric bull.
When the last stock bulls peaked in March 2000 and October 2007, there was no specific news that killed them. Lofty euphoric stock markets simply started gradually rolling over, mostly through relatively-minor down days which generated little fear. These modest grinds lower kept most investors unaware of the waking bears, boiling them slowly like the proverbial frog in the pot. But even little losses eventually add up.
Since nearly all the amazing stock-market gains between late 2012 to mid-2015 were directly fueled by the Fed’s QE3 money printing, fears of the coming quantitative tightening may prove the bull-slaying catalyst. The Fed conjured money out of thin air to buy bonds in QE, and it will destroy that very money by effectively selling bonds in QT. QT’s capital outflows should prove as bearish for stocks as QE’s inflows were bullish!
The FOMC actually started discussing QT at its early-May meeting, and formally announced it at its late-September meeting. QT actually got underway in Q4’17 at a modest $10b-per-month pace. But it’s on autopilot to grow by $10b per month each quarter until it reaches terminal speed at a $50b-per-month pace in Q4’18. That will make for $600b per year of QE-injected capital removed from markets and destroyed.
QT is utterly unprecedented in history, and its acceleration in 2018 has profoundly-bearish implications for these QE-inflated record stock markets. As QT started late in 2017 at low levels, it only totaled $30b this year. But in 2018 alone that will explode 14x higher to a total of $420b of QT! Prudent investors will sell in anticipation of QT hitting full steam, as unwinding the Fed’s huge QE-bloated balance sheet is a grave threat.
Back in the first 8 months of 2008 before that stock panic, the Fed’s balance sheet averaged $849b. By February 2015, it had ballooned to a freakish $4474b. That’s up a staggering 427% or $3625b over 6.5 years of QE! QE levitated the stock markets in two primary ways. That Fed bond buying bullied yields to artificial lows, forcing bond investors starving for yields to buy far-riskier stocks that were paying dividends.
More importantly, those unnatural contrived extremely-low yields courtesy of QE fueled a boom in stock buybacks by corporations unlike anything ever witnessed. American companies took advantage of the crazy-low interest rates to literally borrow trillions of dollars to buy back their own stocks! Between QE3’s launch and Trump’s victory, corporate stock buybacks were the dominant source of stock-market capital inflows.
QT along with the Fed’s current rate-hike cycle will allow bond yields to rise again, eventually greatly retarding corporations’ desire and ability to borrow vast sums of money to use to manipulate their own stock prices higher. In late December, the Fed’s balance sheet was still way up at $4408b. These QE-inflated stock markets have never experienced QT, and it ain’t gonna be pretty no matter how slowly QT is implemented.
While this easy Fed is far too cowardly to fully reverse $3.6t worth of QE since late 2008, even a trillion or two of QT over the coming years is going to wreak havoc on these QE-levitated stock markets! That’s a serious problem for today’s extreme Fed-goosed bull with a rotten fundamental foundation. Underlying corporate earnings never supported such extreme record stock prices, and the coming reckoning is unavoidable.
Regardless of the Fed’s balance sheet, quantitative tightening, or valuations, the near-record-low VIX slumping into the 9s since back in May shows these stock markets are ripe for a major selloff anyway. At absolute minimum, it needs to be a serious correction approaching 20%. But with this stock bull so big, so old, and so fake thanks to the Fed, that selloff is almost certain to snowball into the long-overdue next bear.
And investors aren’t taking the threat of a new bear seriously. Crossing the bear threshold just requires a 20% retreat. Even such a baby bear would erase all SPX gains since mid-2016. A normal bear market at this stage in the Long Valuation Waves is actually 50%, cutting stock prices in half! That would wipe out the great majority of this entire mighty stock bull, dragging the SPX all the way back down to mid-2011 levels.
Even more ominously, bear markets naturally following bulls tend to be proportional. That makes sense since bears’ job is to rebalance sentiment and work off overvalued conditions. So there’s a high chance the coming bear after such an anomalous Fed-goosed bull won’t stop at 50%! The downside risks from here are incredibly dire after such a huge bull driven by extreme central-bank easing instead of corporate profits.
And that finally brings us to valuations, this old stock bull’s core problem. This final chart looks at the SPX superimposed over a couple key valuation metrics. Both are derived from averaging the trailing-twelve-month price-to-earnings ratios of all 500 elite SPX companies. The light-blue line is their simple average, while the dark-blue one is weighted by market capitalization. Today’s valuations ought to terrify investors.
Unfortunately today corporate earnings are intentionally obscured by Wall Street to mask the dangerous overvaluation that is rampant. Analysts make up blatant fictions including forward earnings, which are literally guesses about what companies will earn in the coming year! These almost always prove wildly optimistic. Analysts also look at adjusted earnings, another Pollyannaish farce where companies ignore expenses.
Wall Street also plays a deceptive estimate game to make quarterly-earnings results look way better than they really are. Instead of comparing actual hard quarterly profits with the same quarter a year earlier, they intentionally lowball estimates so companies beat regardless of their actual earnings trends. Investors are being bamboozled, with the only honest way of measuring corporate profits buried and forgotten.
That is based on generally-accepted accounting principles which are required when companies actually report to regulators. The only righteous way to measure price-to-earnings ratios is using the last four quarters of GAAP profits, or trailing twelve months. Those numbers are hard, established in the real world based on real sales and real expenses. They are not mere estimates like totally-bogus forward earnings.
Every month at Zeal we look at the TTM P/Es of all 500 SPX companies. At the end of November, the simple average of all SPX companies actually earning profits so they can have P/Es was an astounding 30.5x! That’s literally in bubble territory, just as Trump had warned about during his campaign. 14x earnings is the historical fair value over a century and a quarter, and double that at 28x is where bubble levels start.
If you study the history of the stock markets, stock prices never do well for long starting from bubble valuations. Such extreme stock prices relative to underlying corporate earnings streams actually herald the births of major new bear markets. Again these usually cut stock prices in half. So buying stocks here, late in a huge old bull market artificially levitated by the Fed, is the height of folly. Massive losses are inevitable.
Remember stock markets perpetually meander through alternating bull-bear cycles. Back in late 2012 before the Fed stepped in to try and brazenly short-circuit these valuation-driven cycles, valuations were actually in a secular-bear downtrend. After secular bulls drive valuations to bubble extremes, with greed forcing stock prices far beyond underlying corporate earnings, secular bears emerge to reverse those excesses.
During secular bears, stock prices grind sideways on balance for long enough for earnings to catch up with lofty stock prices. Before QE3 temporarily broke stock-market cycles, that process had been happening as normal between 2000 to 2012. Secular bears don’t end until valuations get to half fair value, 7x earnings. So instead of being into bubble levels, valuations would normally be between 7x to 10x today.
That’s the massive downside risk stocks face due to their Fed-conjured bubble valuations! While the red line above shows the actual SPX, the white line shows where it would be trading at 14x fair value. Even that is way down around 1235 today, less than half current levels! But mean reversions from extremes nearly always overshoot in the opposite direction, so the potential SPX bear-market bottom is much lower.
Sadly Wall Street will never bother telling investors that valuations matter. Stock-market history proves beyond all doubt that buying stocks high in valuation terms nearly always leads to considerable-to-huge losses. All the financial industry cares about is keeping people fully invested no matter what, since that maximizes their fees derived from percentages of assets under management. Talk about a conflict of interest!
The more expensive stocks are in valuation terms when they are purchased, the worse the subsequent returns will be. And no matter how awesome Trump’s policies may ultimately prove, they aren’t going to rescue corporate profits anytime soon. Republicans’ corporate-tax cuts have long been way more than fully priced in to stock prices. Wall Street analysts love to claim 2017’s extraordinary rally was earnings-driven.
But valuations prove otherwise. By late November the SPX had soared 24.2% since Trump won the US presidency. But during nearly that same span the SPX’s simple-average TTM P/E surged 15.9%. That implies only about a third of the entire Trumphoria rally was driven by higher corporate profits! And even that is suspect, since the wealth effect from this year’s record stock markets fueled exceptionally-high spending.
The stock markets’ lofty valuations before Trumphoria and the bubble valuations since are a very serious problem that can only be resolved by an overdue major bear market! Only that will drag stock prices low enough for existing and future corporate earnings to support reasonable valuations again. Investors sure don’t believe a new bear market is possible, but they never do when bull markets are topping in extreme euphoria.
It’s not just the Fed’s QT that’s coming in 2018 and 2019, but the European Central Bank is also slashing its own QE campaign. That ran at a blistering €60b-per-month pace in 2017, totaling €720b. But it will be cut in half to just €30b a month starting in January. The combination of Fed QT and ECB QE tapering is going to strangle this stock bull! A QE-conjured stock bull can’t persist when QE is reversed and slashed.
Together these leading global central banks so critical to stock-market fortunes are effectively tightening massively in 2018 and 2019 compared to 2017. Next year alone will see the equivalent of $950b more Fed QT and less ECB QE than this year. Can bubble-valued stocks survive nearly a trillion dollars less central-bank liquidity in 2018? And two years from now that will swell to another $1450b less than this year!
Investors really need to lighten up on their stock-heavy portfolios, or put stop losses in place, to protect themselves from the coming central-bank-tightening-triggered valuation mean reversion in the form of a major new stock bear. Cash is king in bear markets, as its buying power grows. Investors who hold cash during a 50% bear market can double their stock holdings at the bottom by buying back their stocks at half price!
Put options on the leading SPY S&P 500 ETF can also be used to hedge downside risks. They are cheap now with euphoria rampant, but their prices will surge quickly when stocks start selling off materially. Even better than cash and SPY puts is gold, the anti-stock trade. Gold is a rare asset that tends to move counter to stock markets, leading to soaring investment demand for portfolio diversification when stocks fall.
Gold surged nearly 30% higher in the first half of 2016 in a new bull run that was initially sparked by the last major correction in stock markets early that year. If the stock markets indeed roll over into a new bear in 2018, gold’s coming gains should be much greater. And they will be dwarfed by those of the best gold miners’ stocks, whose profits leverage gold’s gains. Gold stocks rocketed 182% higher in 2016’s first half!
Absolutely essential in bear markets is cultivating excellent contrarian intelligence sources. That’s our specialty at Zeal. After decades studying the markets and trading, we really walk the contrarian walk. We buy low when few others will, so we can later sell high when few others can. While Wall Street will deny the coming stock-market bear all the way down, we will help you both understand it and prosper during it.
We’ve long published acclaimed weekly and monthly newsletters for speculators and investors. They draw on my vast experience, knowledge, wisdom, and ongoing research to explain what’s going on in the markets, why, and how to trade them with specific stocks. As of the end of Q3, all 967 stock trades recommended in real-time to our newsletter subscribers since 2001 averaged stellar annualized realized gains of +19.9%! For only $12 per issue, you can learn to think, trade, and thrive like contrarians. Subscribe today!
The bottom line is today’s euphoric record stock markets are hyper-risky. They are trading up at bubble valuations thanks to 2017’s stunning post-election rally. Such lofty stock prices are risky any time, but exceedingly dangerous late in an enormous bull market artificially extended by the Fed. A major new bear market is long overdue that will at least cut stock prices in half. Don’t be fooled by the extreme complacency!
Prudent investors have to overcome this groupthink herd euphoria and protect themselves from what’s coming. That means lightening up on overvalued stocks, building cash, and buying gold. Central banks have a long history of trying and failing to eliminate stock-market cycles. The longer they are artificially suppressed, the worse the inevitable reckoning as these inexorable market cycles resume with a vengeance.
Adam Hamilton, CPA
December 29, 2017
Copyright 2000 – 2017 Zeal LLC (www.ZealLLC.com)
If you would like to receive our free newsletter via email, simply enter your email address below & click subscribe.
 Follow us on Twitter
 Become our facebook fan
CONNECT WITH US
Tweets
Tweet with hash tag #miningfeeds or @miningfeeds and your tweets will be displayed across this site.
MOST ACTIVE MINING STOCKS
Daily Gainers
 CMC Metals Ltd. CMC Metals Ltd. |
CMB.V | +900.00% |
 Eden Energy Ltd Eden Energy Ltd |
EDE.AX | +200.00% |
| GoviEx Uranium Inc. |
GXU.V | +42.86% |
| Eagle Nickel Ltd. |
ENL.AX | +41.67% |
| Citigold Corp. Limited |
CTO.AX | +33.33% |
| Mount Burgess Mining NL |
MTB.AX | +33.33% |
| Exalt Resources Limited |
ERD.AX | +31.94% |
| Casa Minerals Inc. |
CASA.V | +30.00% |
| Cariboo Rose Resources Ltd |
CRB.V | +28.57% |
| Belmont Resources Inc. |
BEA.V | +28.57% |


