
Ecuador has become one of the most attractive countries for mining investments in Latin America, with a favourable investment climate, attractive legal and tax frameworks, and a wide variety of mineral deposits. With this in mind, here are some of the mining companies in Ecuador to watch in 2023.
Solaris Resources (TSX:SLS) (OTCQB:SLSSF)
Solaris Resources is a junior mining company based in Canada, with its flagship Warintza Project located in southeastern Ecuador. The company has enjoyed multiple successful discoveries at the Warintza Project while building a positive relationship with the government and signing an important investment contract protecting the project.
On December 22, 2022, Solaris and the government of Ecuador signed an investment contract ratifying the Investment Protection Agreement announced on June 9, 2022. The important contract marked a major milestone for the company and displays how important the project is to the country. Some of the highlights of the agreement surrounding protections and incentives for the duration of the title of the Project which extends with renewal to 2066 are as follows:
- Security of investment
- Stability of mining law
- Stability of taxes at a reduced income tax rate of 20% (25% previously)
- Exemption from capital outflow tax (5% previously)
- Exemption from import duties (up to 5% previously)
- Detailed procedures for dispute resolution and international arbitration protection
Solaris also recently announced results from metallurgical test work at the project conducted by FLSmidth USA with high recoveries of over 90% copper and 80% molybdenum. The test work revealed and confirmed that the project holds further potential for high-grade copper discoveries and more.
Luminex Resources (TSXV:LR)
Luminex Resources recently reported new drill results from its Condor copper-gold project in Ecuador. Drilling confirmed a strike length of 350 metres, and the anomaly has now been mapped at surface for more than 500 metres at the Cuyes West step-out holes.
Highlights from the results are as follows:
- CU22-12 – 2.5 metres grading 18.54 g/t Au Eq
- CU22-13 – 36.0 metres grading 2.29 g/t Au Eq
- CU22-14 – 4.0 metres grading 19.35 g/t Au Eq; including 2.0 metres grading 36.59 g/t Au Eq
- CU22-15 – 17.5 metres grading 3.07 g/t Au Eq
Lundin Gold’s Fruta Del Norte mine in southeast Ecuador has also seen results from ongoing drilling. The company reported results from the 2022 near-mine expiration program identifying new zones of mineralization to the south and at depth of FDN’s currently defined Mineral Resources.
Highlights from the results are as follows:
- Drillhole FDN2022-009 intersected 5.11 g/t Au over 30.3m from a depth of 267.7m, including;
- 9.79 g/t Au over 14.0m from 284.0m
- Drillhole FDN2022-006 intersected 3.99 g/t Au over 4.8m from 181.7m, and 4.40 g/t Au over 8.1m from 213.9m
Highlights from holes drilled under the southern portion of the FDN mineral resource envelope:
- Drillhole UGE-DD-22-008 intersected 4.11 g/t Au over 23.0m from 197.7m, including;
- 6.03 g/t Au over 10.0m from 202.7m
- Drillhole UGE-DD-22-005 intersected 3.53 g/t Au over 44.9m from 134.8m, including;
- 5.25 g/t Au over 12.9m from 134.8m, and;
- 4.32 g/t Au over 15.0m from 164.7m
The above references an opinion and is for information purposes only. It is not intended to be investment advice. Seek a licensed professional for investment advice. The author is not an insider or shareholder of any of the companies mentioned above.
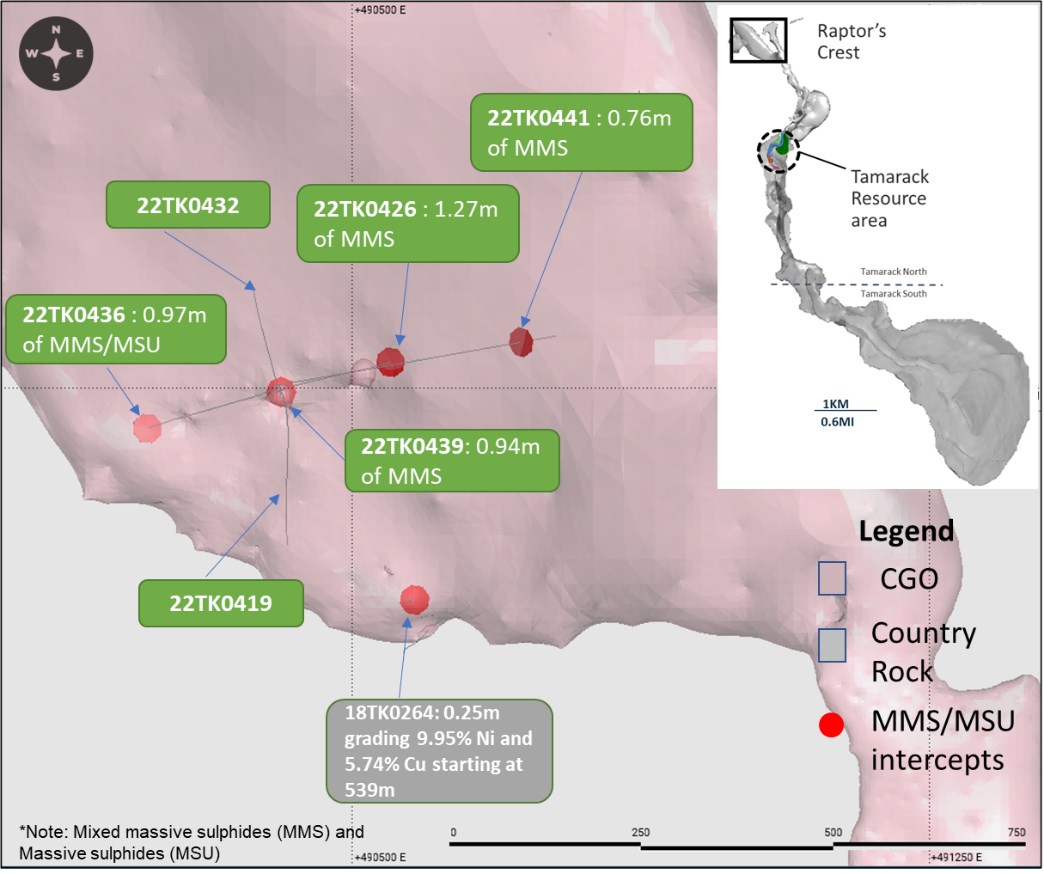
Talon Metals (TSX:TLO) has intercepted a new high-grade nickel-copper mineralization approximately 2 miles outside of the current nickel-copper resource area at the Tamarack Nickel-Copper-Cobalt Project in Minnesota. The company believes it has confirmed a new “system” of high-grade nickel-copper mineralization in the Tamarack Intrusive Complex. The exploration team has called the new nickel mineralization the “Raptor Zone”, which intersects high-grade nickel in the first 6 out of 9 holes roughly 2 miles from the current resource area.
Brian Goldner, Chief Exploration and Operations Officer of Talon, commented in a press release: “New drilling shows us that the Tamarack Intrusive Complex can be a district-scale nickel-copper resource right here in the United States. We’ve moved nearly 2 miles outside of the Company’s current nickel-copper resource area and successfully intercepted high-grade nickel-copper in a different intrusion (new system) as compared to the current resource area.
“While still early in the process, these preliminary results provide definitive evidence that the Tamarack Intrusive Complex has district-scale potential, and as a consequence of these exciting initial results, we intend to make further exploration along the Tamarack Intrusive Complex a priority in 2023.
“Last year’s discovery of the shallow high-grade nickel mineralization in the CGO West area started with only a small 1.3-meter intercept of high-grade nickel massive sulphide – that mineralization ultimately grew to nearly 14 meters thick only 25 meters away. I expect this same thickening could occur in the new area called the “Raptor Zone”, especially with the amount of unexplored space we have to work with.”
Highlights from the results are as follows:
The potential for additional high-grade nickel-copper mineralization within the 11-mile-long Tamarack Intrusive Complex has been recognized by Talon for some time. Talon’s primary focus to date has been the discovery and delineation of the Main Zone, the CGO West area and the CGO East area (collectively referred to as the “Company’s nickel-copper resource area”). To accomplish this growth, Talon spent the past 2 years building a complete in-house exploration team, incorporating among other things, a fleet of five Talon-owned and staffed drill rigs, along with precision borehole and surface geophysical guidance equipment. With the advancement of the delineation work, Talon’s in-house team has now been tasked with evaluating the exploration upside over the entire length of the 11-mile-long Tamarack Intrusive Complex starting at the northern end of the complex where the “Raptor Zone” has been identified. The name “Raptor” has been chosen given the resemblance to the iconic predator’s profile that shows up in the magnetic survey (see Figure 2).
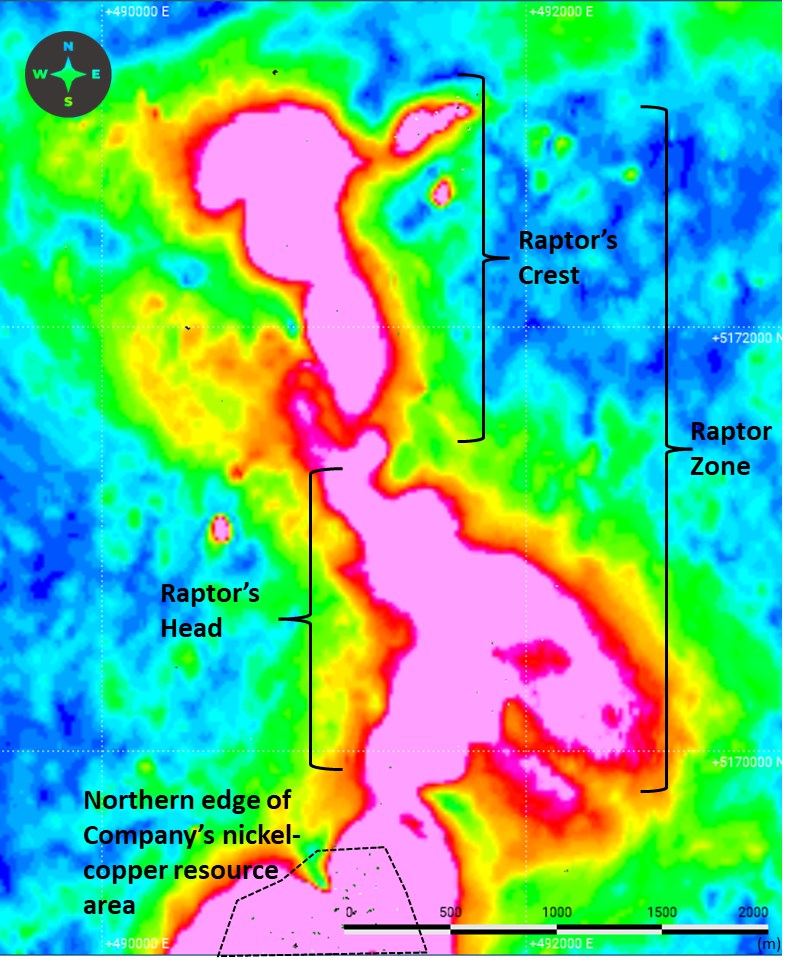
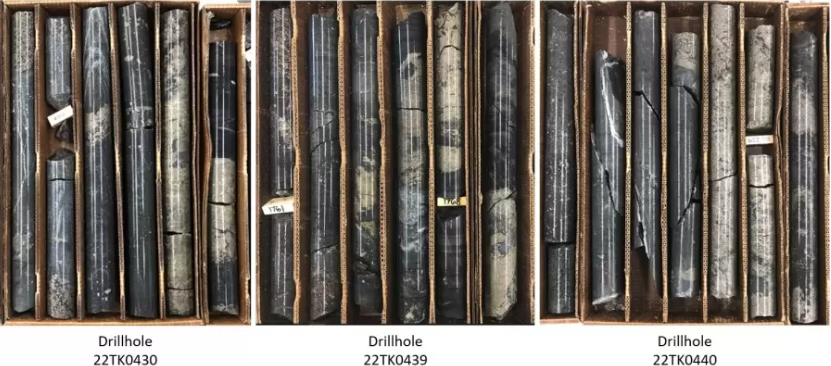
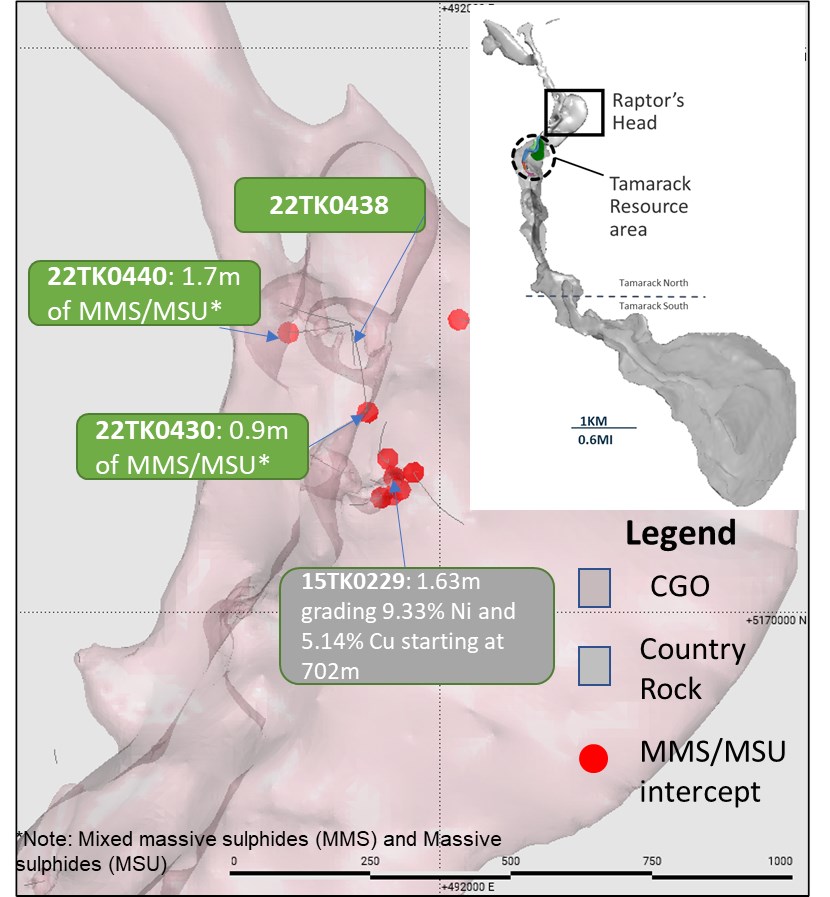
Since September 2022, Talon has completed 9 new drill holes outside of the Company’s nickel-copper resource area, 6 of which have already intersected high-grade nickel-copper mineralization. These intercepts occur in 2 new areas of mineralization within the larger “Raptor Zone”, including the “Raptor’s Crest” (previously referred to as the 264 Zone) located approximately 1.8 miles (3 km) north of the Company’s nickel-copper resource area and the “Raptor’s Head” (previously referred to as the 221 Zone) located approximately 1 mile (1.6 km) north of the Company’s nickel-copper resource area (see Figure 2). These two areas (Raptor’s Crest and Raptor’s Head) have very limited historic drilling, but assays do include high-grade nickel massive sulphide intercepts of up to 9.95% Ni1 and 9.33% Ni2 within these respective zones. Of note, in between the drill holes lie 1-mile (1.6 km) of ground that has never been drilled and therefore, this ground represents a high priority exploration target for the Company in 2023, given that it is bookended with high-grade nickel massive sulphide intercepts on both sides.
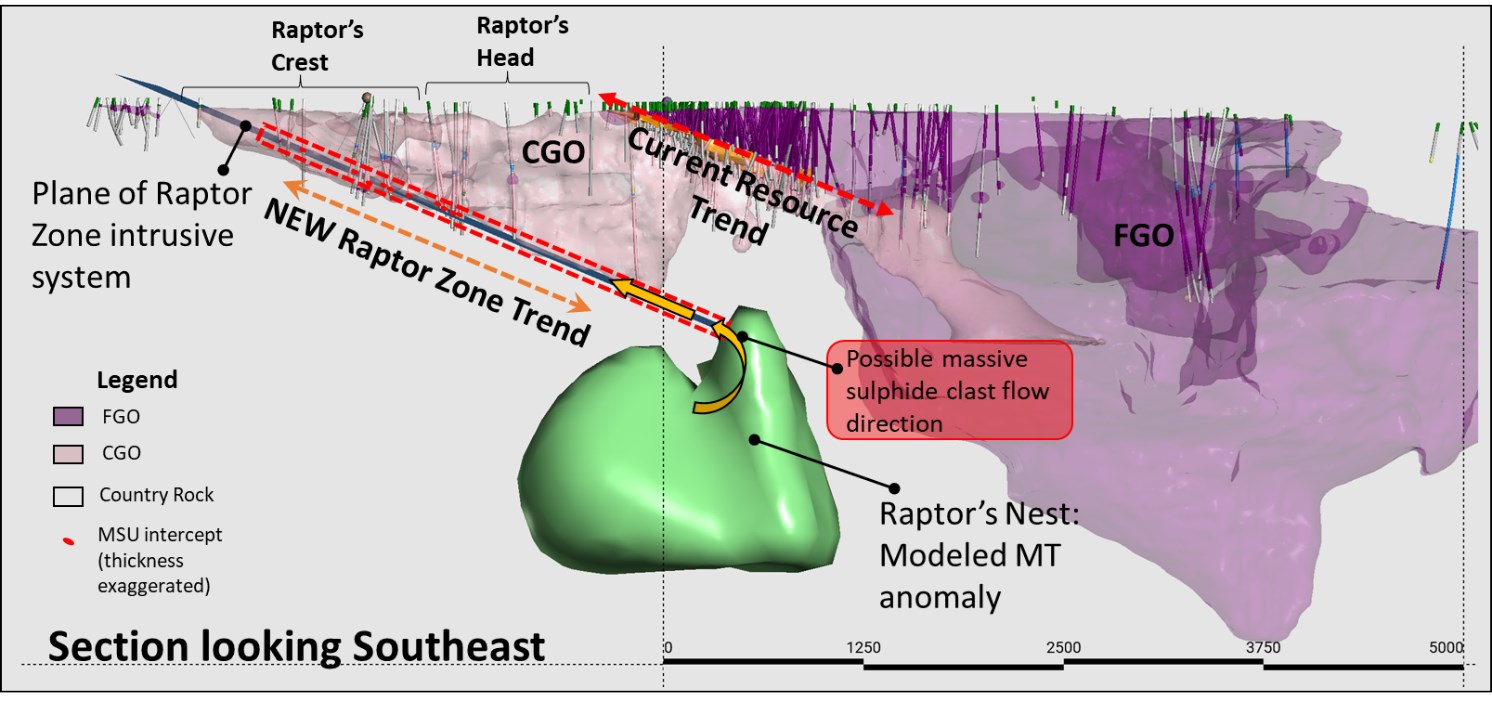
The Company’s recent drilling in the Raptor Zone has suggested that the intrusive depositing the high-grade nickel mineralization appears to be a completely different intrusive (i.e., a brand new “system” of mineralization) as compared to the Company’s nickel-copper resource area. Additionally, the nickel mineralization found in the Raptor Zone appears to be dominantly massive sulphide rip ups, suggesting that the massive sulphide was originally formed elsewhere and has been eroded and transported to where it currently resides. The Raptor Zone is following a similar trend (plunge and dip) and is parallel to the intrusive units in the Company’s nickel-coper resource area but lies at a different elevation below the resource and the down-dip projection of that structure lines up with the top of the Magnetotelluric (MT) anomaly, now named “Raptor’s Nest” (see Figure 3).
The above references an opinion and is for information purposes only. It is not intended to be investment advice. Seek a licensed professional for investment advice. The author is not an insider or shareholder of any of the companies mentioned above.
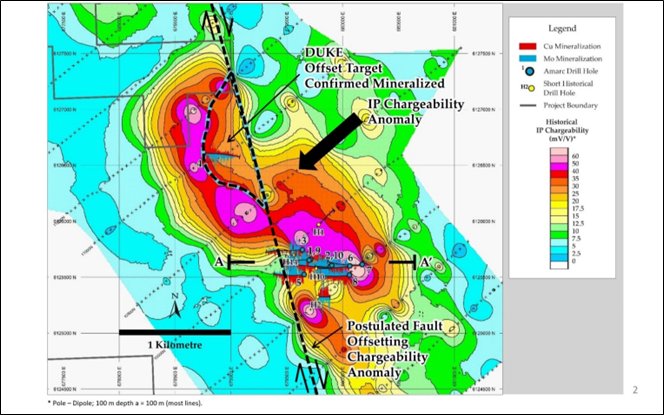
Amarc Resources (TSXV: AHR) has announced new assay results from the ongoing 2022-2023 drilling program at the DUKE deposit in the 100%-owned DUKE porphyry Cu-Au district in British Columbia. The results from the first drill hole are part of the first phase program funded under the Mineral Property Earn-in Agreement with Boliden Mineral Canada.
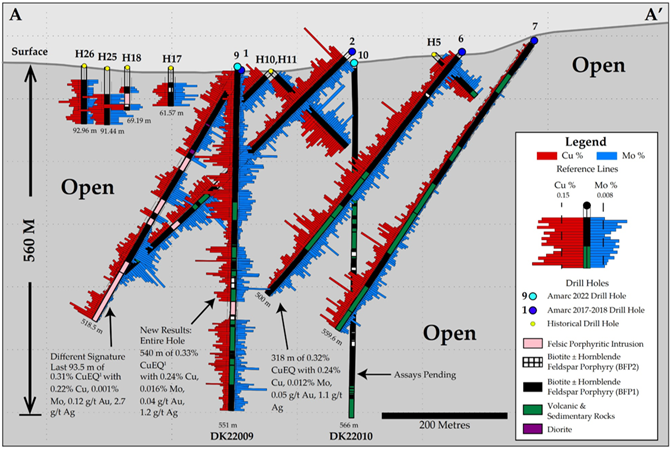
The results are for Hole DK22009 and are the first results from one of two holes completed in December 2022. Drilling was done in the central area of the DUKE deposit to test the geometry and depth potential of the mineralization there. The hole was drilled in the vicinity of previous Amarc drill holes (including DK17001 and DK17002, listed as “1” and “2” on Figures 1 and 2; see also December 19, 2017 and June 12, 2018 news releases). The hole intercepted significant Cu-Mo-Au-Ag mineralization from the bedrock surface to the bottom of hole, including several sub-intervals of a higher grade. The results are of good tenor and continuity and indicate that the DUKE Deposit extends to a significantly greater depth than previously known (seen in Figure 1).
Amarc President and CEO Diane Nicolson commented in a press release: “With the release of these initial encouraging results, we are pleased with the excellent progress has already been made in our first work program with partner Boliden. Our teams are excited about DUKE’s tremendous potential, and are looking forward to further expanding and delineating the mineralization at DUKE while also testing the multiple other targets within the DUKE District.”
Highlights from the results are as follows:
- 542 m of 0.33% CuEQ* (0.24% Cu, 0.016% Mo, 0.04 g/t Au and 1.2 g/t Ag) from 9.4 m
- Including 183 m of 0.43% CuEQ (0.31% Cu, 0.019% Mo, 0.07 g/t Au and 1.5 g/t Ag) from 65 m
- Including 126 m of 0.52% CuEQ (0.38% Cu, 0.024% Mo, 0.08 g/t Au and 1.8 g/t Ag) from 122 m
* Copper Equivalent (CuEQ) and other details are provided below with Table 1
Table 1: Drill Hole DK22009 Assay Results
| Drill Hole ID1 | Azim (°) | Dip (°) | EOH (m) | Incl. | From (m) | To (m) | Int.2,3,4 (m) | CuEQ5 (%) | Cu (%) | Mo (%) | Au (g/t) | Ag (g/t) |
| DK22009 | 0 | -90 | 551 | 9.40 | 551.00 | 541.60 | 0.33 | 0.24 | 0.016 | 0.04 | 1.2 | |
| Incl. | 9.40 | 247.62 | 238.22 | 0.39 | 0.29 | 0.016 | 0.06 | 1.4 | ||||
| and | 65.00 | 247.62 | 182.62 | 0.43 | 0.31 | 0.019 | 0.07 | 1.5 | ||||
| and | 122.00 | 247.62 | 125.62 | 0.52 | 0.38 | 0.024 | 0.08 | 1.8 | ||||
| and | 128.00 | 161.00 | 33.00 | 0.59 | 0.42 | 0.028 | 0.10 | 1.8 | ||||
| and | 176.00 | 245.00 | 69.00 | 0.57 | 0.42 | 0.023 | 0.09 | 2.1 | ||||
| Incl. | 289.88 | 376.90 | 87.02 | 0.36 | 0.25 | 0.020 | 0.05 | 1.5 | ||||
| and | 289.88 | 336.87 | 46.99 | 0.43 | 0.31 | 0.022 | 0.06 | 1.7 | ||||
| Incl. | 406.12 | 551.00 | 144.88 | 0.31 | 0.22 | 0.018 | 0.03 | 1.1 | ||||
| and | 412.00 | 488.00 | 76.00 | 0.38 | 0.28 | 0.018 | 0.04 | 1.4 | ||||
| and | 412.00 | 434.00 | 22.00 | 0.42 | 0.31 | 0.022 | 0.04 | 1.5 | ||||
| and | 459.54 | 488.00 | 28.46 | 0.41 | 0.30 | 0.018 | 0.05 | 1.5 |
- DK22009 is collared at UTM NAD83, Zone 9, Easting 679708, Northing 6125648.
- Widths reported are drill widths, such that true thicknesses are unknown.
- All assay intervals represent length-weighted averages.
- Some figures may not sum exactly due to rounding.
- Copper equivalent (CuEQ) calculations use metal prices of: Cu US$4.00/lb, Mo US$15.00/lb, Au US$1,800.00/oz, Ag US$24.00/oz and and conceptual recoveries of: Cu 85%, Mo 82%, Au 72% and 67% Ag. Conversion of metals to an equivalent copper grade based on these metal prices is relative to the copper price per unit mass factored by conceptual recoveries for those metals normalized to the conceptualized copper recovery. The metal equivalencies for each metal are added to the copper grade. The general formula for this is: CuEQ % = Cu% + (Au g/t * (Au recovery / Cu recovery) * (Au $ per oz/ 31.1034768) / (Cu $ per lb* 22.04623)) + (Ag g/t * (Ag recovery / Cu recovery) * (Ag $ per oz/ 31.1034768) / (Cu $ per lb* 22.04623)+ (Mo% * (Mo recovery / Cu recovery) * (Mo $ per lb / Cu $ per lb)).
The above references an opinion and is for information purposes only. It is not intended to be investment advice. Seek a licensed professional for investment advice. The author is not an insider or shareholder of any of the companies mentioned above.
Troilus Gold (TSX:TLG) has reported new assay results from the Troilus Project in Quebec, Canada. The results come from drilling at the Connector Zone, a target located in between two previously mined Z87 and J4 open pits. The drilling at Connector Zone is part of the 5,000-metre drill program with the goal of targeting and expanding shallow high-grade mineralization intersection in the zone in November 2022.
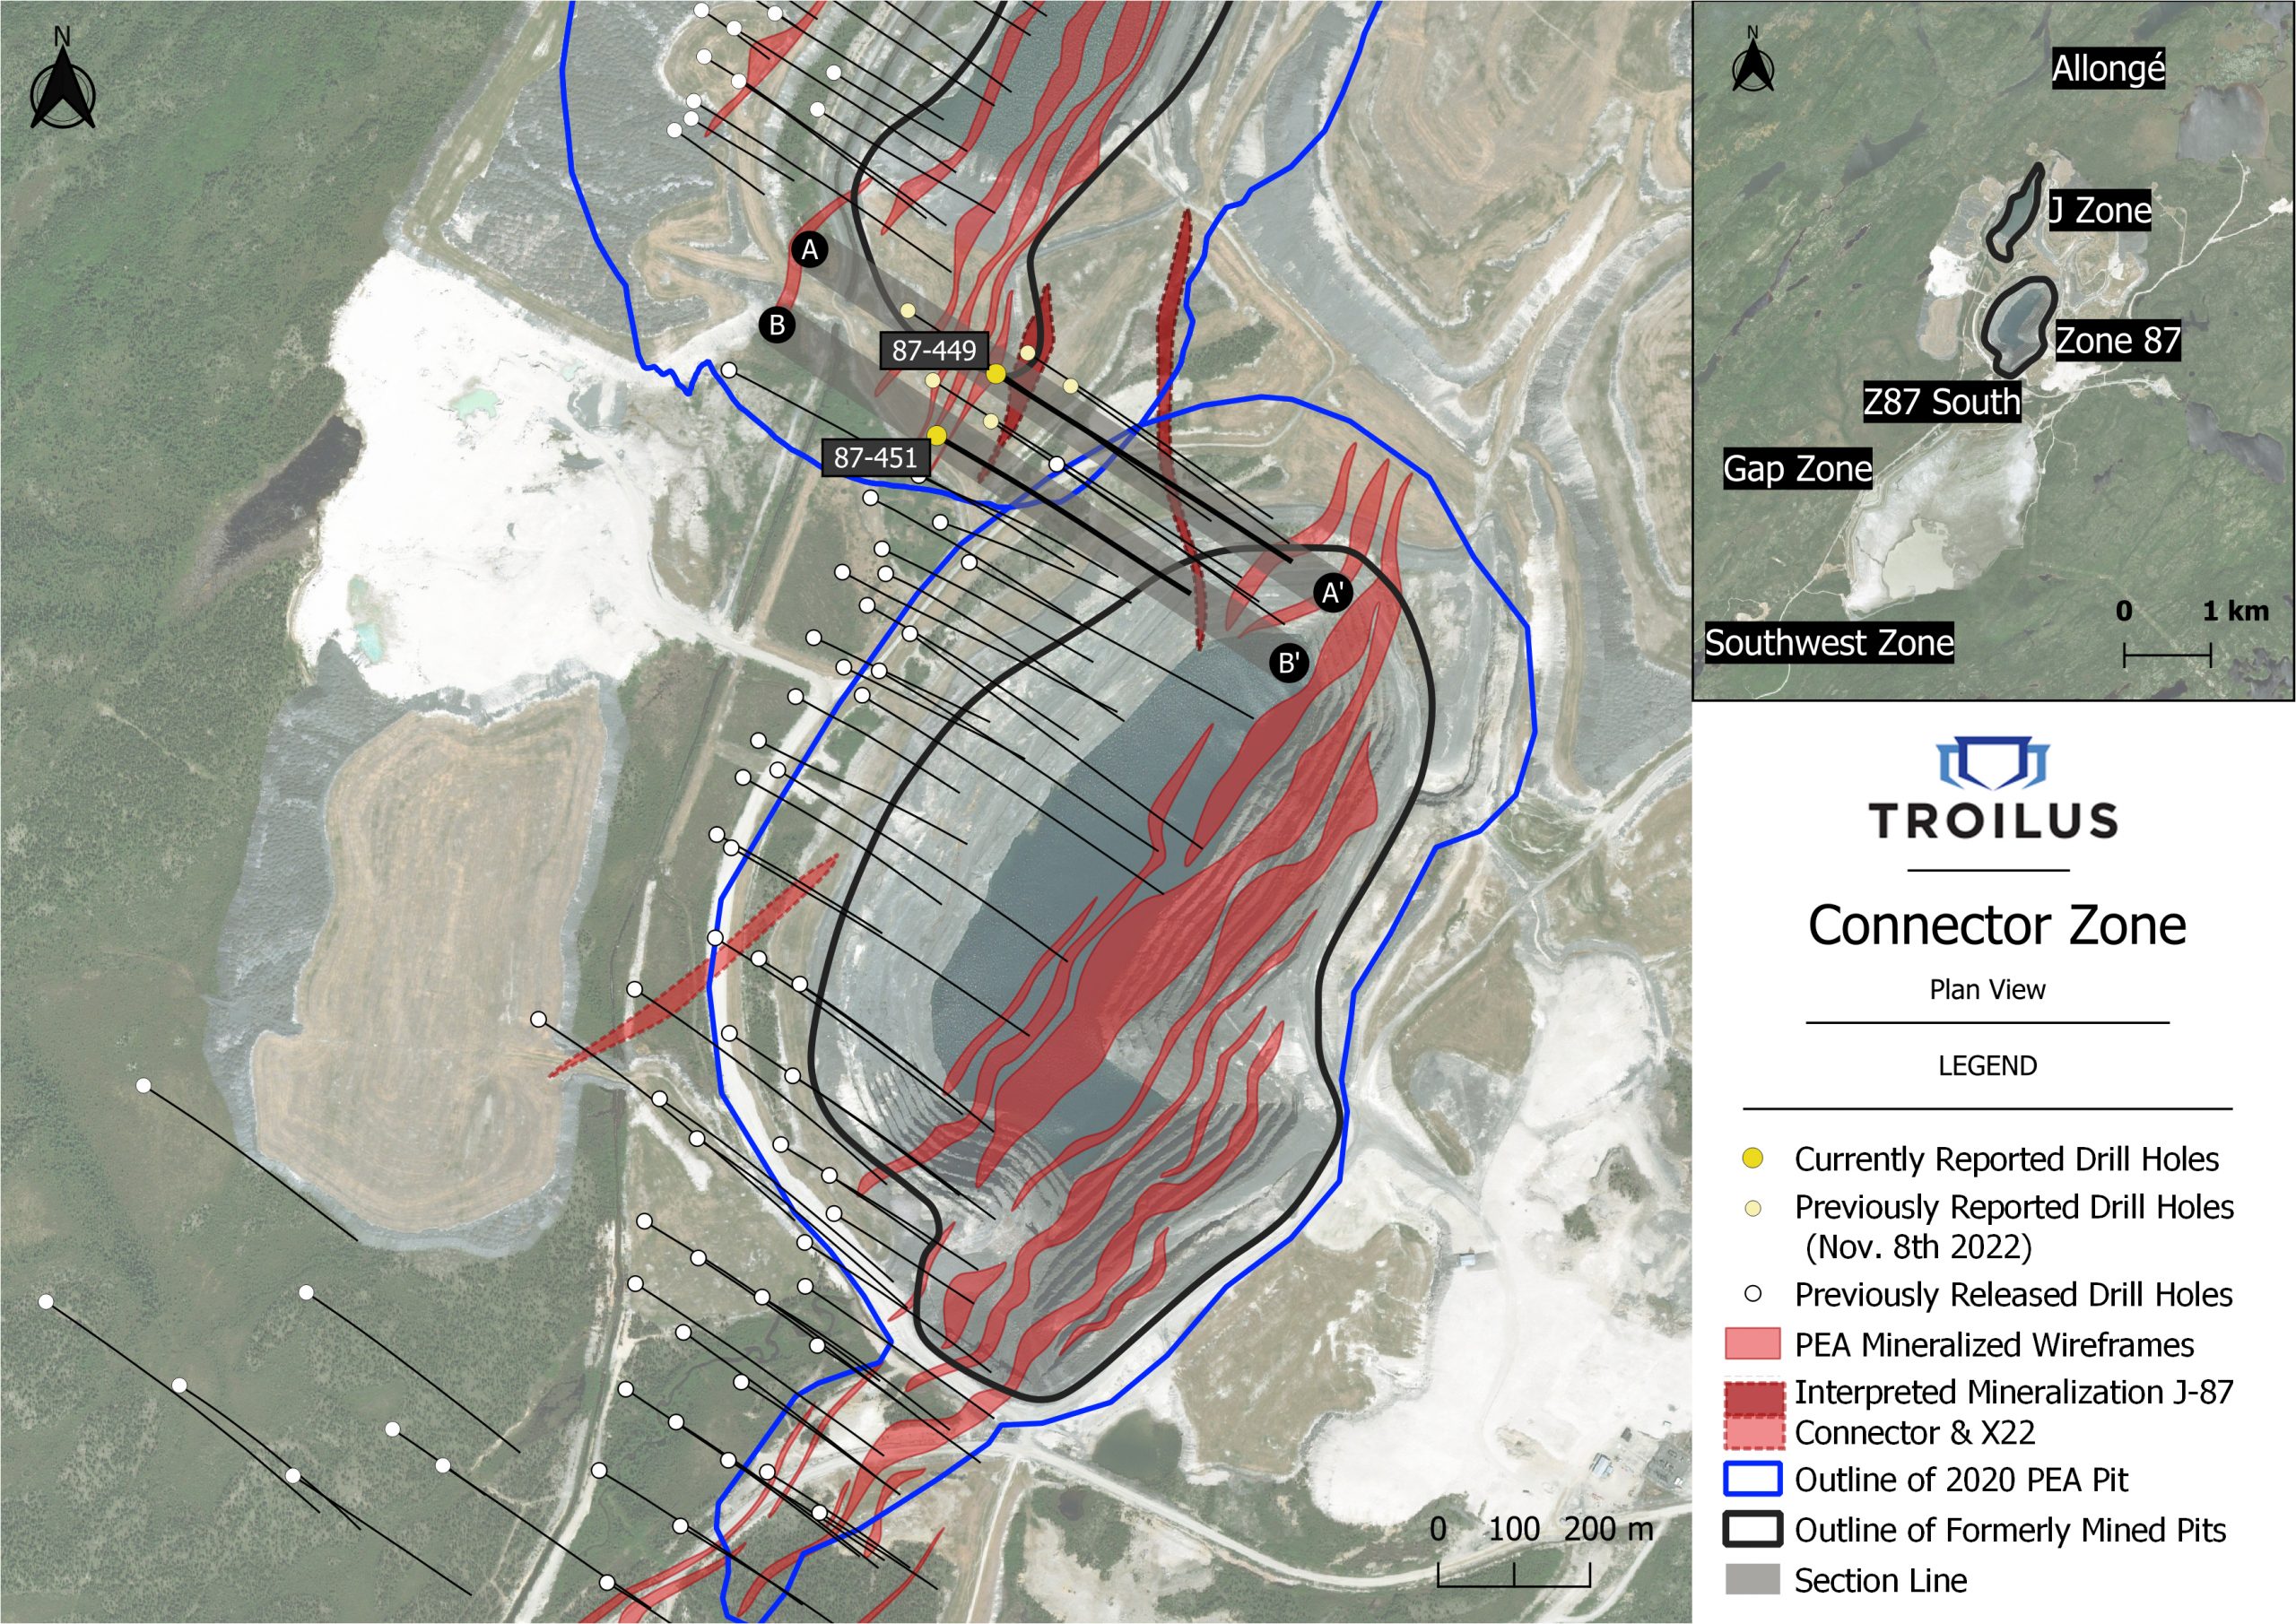
The company’s results show that there is a high-grade mineral continuity extending on a north, northwest trend between the two formerly mined pits.
Justin Reid, CEO of Troilus Gold, commented in a press release: “The latest drill results from this new and exciting target further demonstrate the continuity of mineralized high-grade structures between the two formerly mined open pits. Detailed structural work completed by the geology team has greatly contributed to the understanding and successful targeting of these high-grade trends. These shallow high-grade zones exist within and in close proximity to the PEA pit shells and we believe they could be brought into the mine plan to positively impact the strip ratio and project economics. In the coming months our team will continue to focus on maximizing opportunities for discovery and delineation of high-grade near surface targets for inclusion in our upcoming Feasibility Study, expected in the second half of 2023.”
Connector Zone Intercept Highlights:
Hole 87-449
- 2.07 g/t AuEq over 11.2m, including 4.07 g/t AuEq over 5m
This interval is located directly at surface; the hole collared into bedrock within this high-grade mineralized zone.
- 1.22 g/t AuEq over 10.0m, including 1.49 g/t AuEq over 6.2m
- 1.31 g/t AuEq over 6m
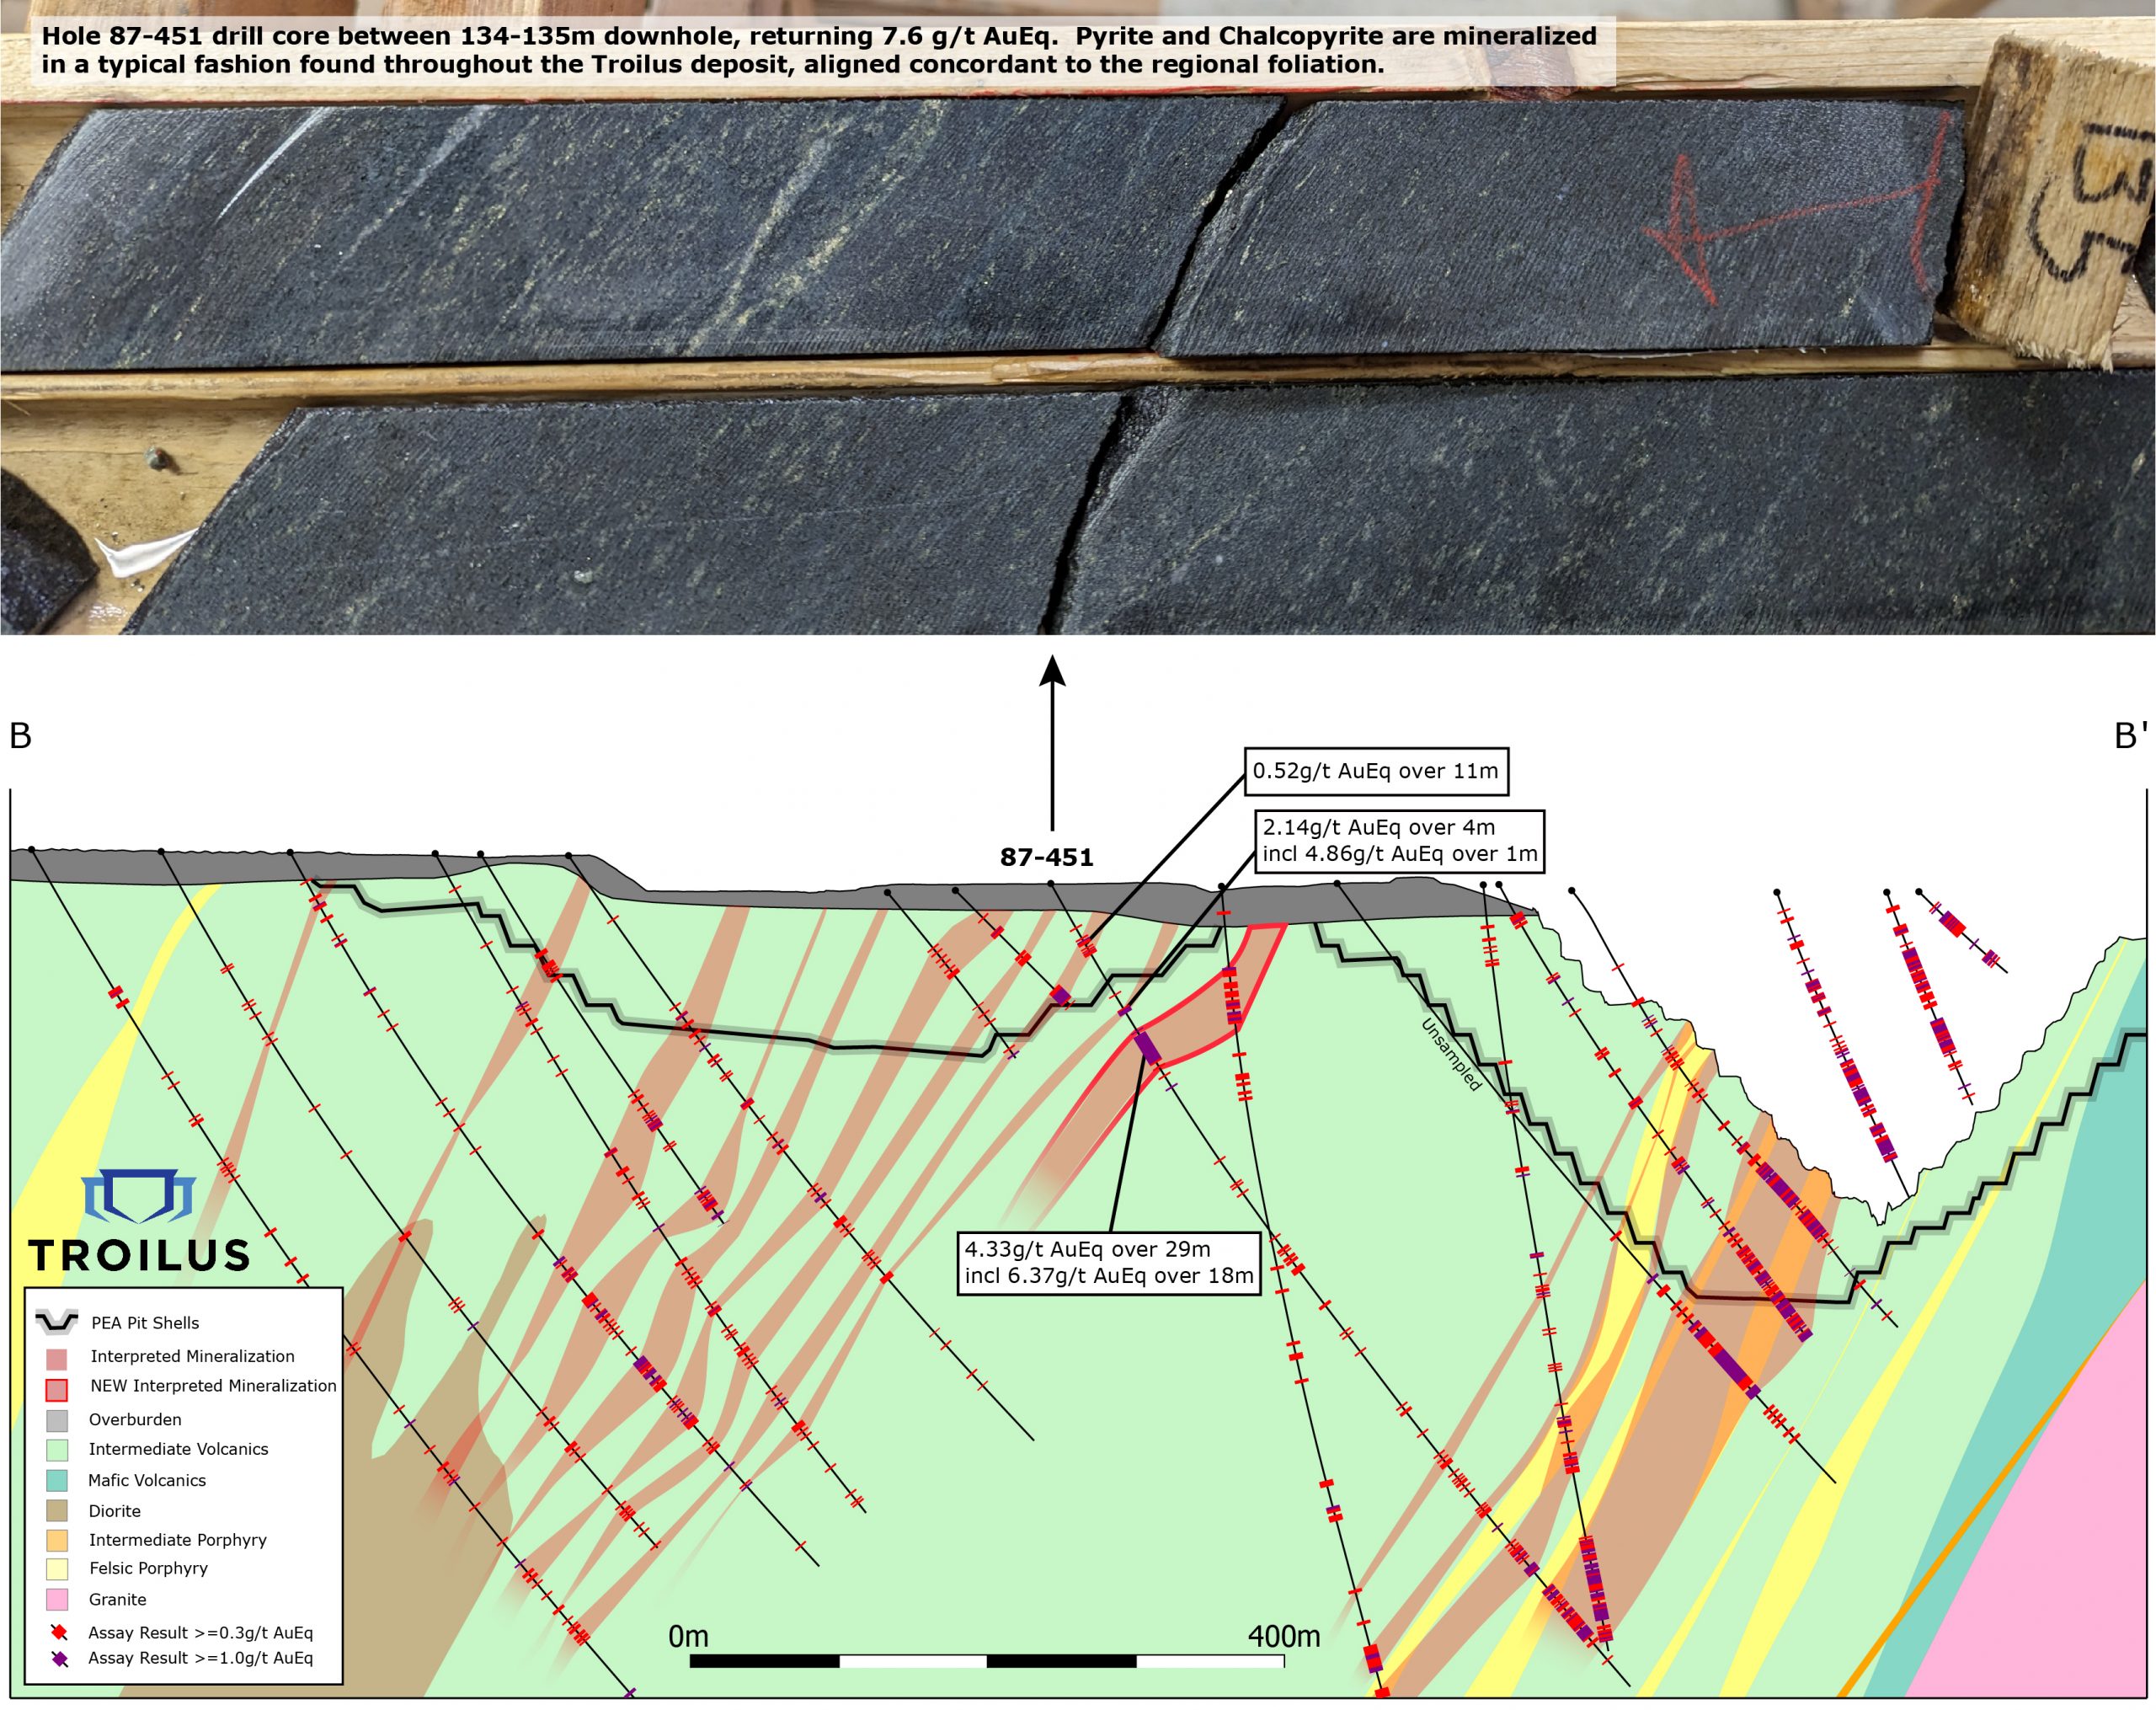
Hole 87-451
- 4.33 g/t AuEq over 29m, including 6.37 g/t AuEq over 18m
- 5.5 g/t AuEq over 6m
- 1.01 g/t AuEq over 49m, including 1.99 g/t AuEq over 10m
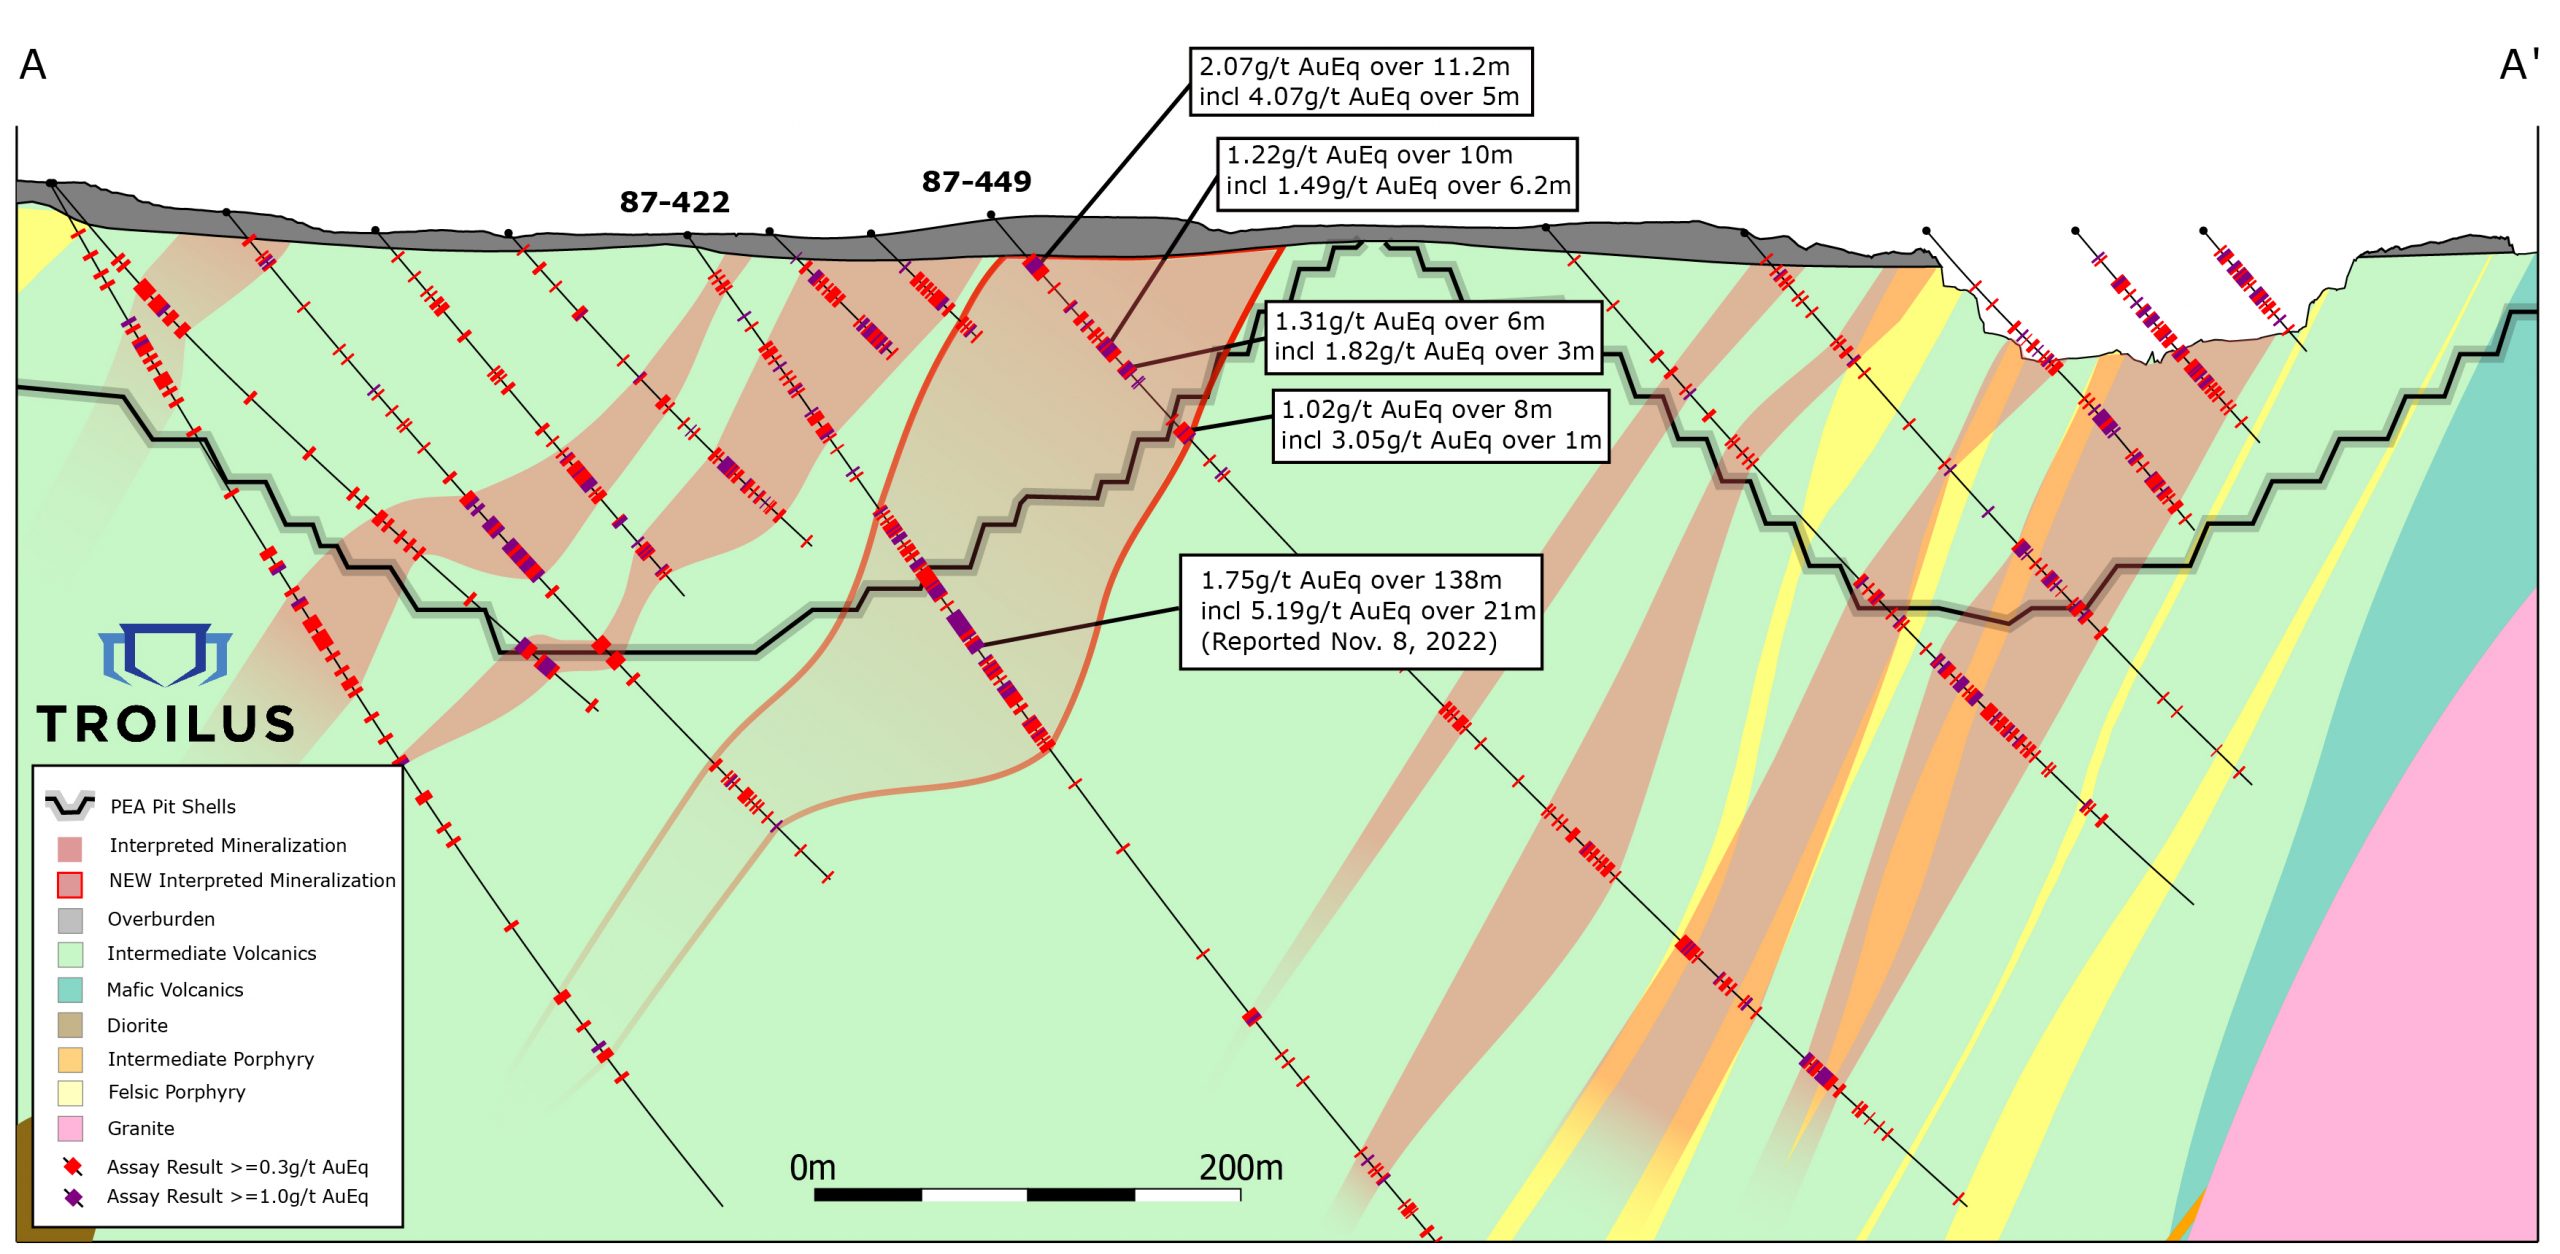
Table 1 – Connector Zone Drill Results
| Hole | From (m) | To (m) | Interval (m) | Inside/Outside of PEA Pit Shell | Au Grade (g/t) | Cu Grade (%) | Ag Grade (g/t) | AuEq Grade (g/t) | ||||
| 87-449 | ||||||||||||
| 26.8 | 38 | 11.2 | Inside | 1.68 | 0.26 | 5.91 | 2.07 | |||||
| incl | 29 | 34 | 5.0 | Inside | 3.36 | 0.47 | 10.80 | 4.07 | ||||
| 57 | 58 | 1.0 | Inside | 0.73 | 0.30 | 6.00 | 1.17 | |||||
| 79 | 89 | 10.0 | Inside | 1.00 | 0.14 | 4.62 | 1.22 | |||||
| incl | 80 | 86.2 | 6.2 | Inside | 1.25 | 0.15 | 4.83 | 1.49 | ||||
| 94 | 100 | 6.0 | Inside | 1.08 | 0.16 | 2.57 | 1.31 | |||||
| incl | 95 | 98 | 3.0 | Inside | 1.51 | 0.23 | 3.30 | 1.82 | ||||
| 104 | 105.8 | 1.8 | Inside | 1.51 | 0.03 | 9.24 | 1.65 | |||||
| 133 | 141 | 8.0 | Outside | 0.94 | 0.05 | 1.78 | 1.02 | |||||
| incl | 140 | 141 | 1.0 | Outside | 2.95 | 0.06 | 1.50 | 3.05 | ||||
| 470 | 482 | 12.0 | Outside | 0.48 | 0.23 | 3.30 | 0.80 | |||||
| incl | 474 | 477 | 3.0 | Outside | 1.66 | 1.05 | 0.43 | 2.98 | ||||
| 550.3 | 569 | 18.7 | Outside | 1.15 | 0.13 | 3.65 | 1.35 | |||||
| incl | 560.1 | 566 | 5.9 | Outside | 2.09 | 0.18 | 4.04 | 2.36 | ||||
| 87-451 | ||||||||||||
| 97 | 101 | 4.0 | Outside | 1.79 | 0.22 | 6.88 | 2.14 | |||||
| incl | 100 | 101 | 1.0 | Outside | 4.31 | 0.34 | 11.10 | 4.86 | ||||
| 115 | 144 | 29.0 | Outside | 3.90 | 0.32 | 2.90 | 4.33 | |||||
| incl | 119 | 137 | 18.0 | Outside | 5.77 | 0.45 | 3.96 | 6.37 | ||||
| 159 | 160 | 1.0 | Outside | 3.41 | 0.19 | 2.40 | 3.67 | |||||
| 545 | 557 | 12.0 | Outside | 0.80 | 0.06 | 0.85 | 0.88 | |||||
| incl | 550 | 555 | 5.0 | Outside | 1.40 | 0.09 | 1.14 | 1.52 | ||||
| 562 | 568 | 6.0 | Outside | 2.53 | 2.36 | 0.12 | 5.50 | |||||
| 581 | 630 | 49.0 | Outside | 0.84 | 0.12 | 1.27 | 1.01 | |||||
| incl | 614 | 624 | 10.0 | Outside | 1.71 | 0.20 | 1.91 | 1.99 | ||||
The above references an opinion and is for information purposes only. It is not intended to be investment advice. Seek a licensed professional for investment advice. The author is not an insider or shareholder of any of the companies mentioned above.
American Eagle Gold (TSXV:AE) has reported new assay results from its NAK copper-gold porphyry project of significant high-grade surface and depth zones. The results come from the third and fourth holes from the 2022 drill program at the project.
Anthony Moreau, American Eagle’s CEO, commented in a press release: “This fourth drill hole is our best intercept to date and encountered a new higher-grade copper-rich zone 500 metres from our discovery hole. Hole NAK22- 04 ended within a wide high-grade zone but was unfortunately terminated early for technical reasons; however, holes NAK22-06 and – 07 successfully intersected the continuation of the same zone at depth and hit similar mineralization. We anticipate that the pending assays from those two holes will show similar results. Our step-out drilling continues to demonstrate a substantial footprint for this system.”
Highlights from the results are as follows:
- NAK22-04 returned 527 m @ 0.45% copper equivalent (“CuEq”) from surface, including 185 m @ 0.74% CuEq, and ended in high-grade mineralization (88 m @ 0.98% CuEq), representing the best deep intercept to date in the 2022 drill program
- NAK22-04 appears to have intersected a new copper-rich zone at depth, 500 metres north of discovery hole
- NAK22-03 and NAK22-04 are very widely spaced step-out holes from:
- NAK22-01: 126 m @ 1.05% CuEq from surface within 851 m @ 0.37% CuEq
- NAK22-02: 301 m @ 0.61% CuEq from surface within 956 m @ 0.37% CuEq
- Footprint is 1.5 km X 1.5 km and 1 km deep and is open in all directions
- Large bulk tonnage potential with high-grade surface and depth zones developing
- All holes show widespread mineralization, including high-grade zones
- Assays for holes NAK22-05, -06 & -07 are pending
Highlights of NAK’s 2022 Drill Program:
- NAK22-01 returned 851 m of 0.37% CuEq, including 126 metres of 1.05% CuEq from surface
- NAK22-02 returned 956 m of 0.37% CuEq, including 301 metres of 0.61% CuEq from surface
- NAK22-03 returned 906 m of 0.21% CuEq from surface, including 645 metres of 0.24% CuEq
- NAK22-04 returned 527 m of 0.45% CuEq from surface, including 89 metres of 0.98% CuEq
NAK22-04 Assay Results: Table 1
| From (m) | To (m) | Length (m) | Au (g/t) | Cu (%) | Ag (g/t) | Mo (ppm) | Cu Eq % |
| 20.28 | 548 | 527.72 | 0.11 | 0.32% | 1.55 | 63 | 0.45% |
| Including | |||||||
| 20.28 | 166.59 | 146.31 | 0.07 | 0.44 | 1.4 | 27 | 0.51% |
| And Including | |||||||
| 439.2 | 528.0 | 88.8 | 0.27 | 0.69% | 4.5 | 98 | 0.98% |
| Within | |||||||
| 363.0 | 548.0 | 185.0 | 0.23 | 0.49% | 2.8 | 91 | 0.74% |
*Copper Equivalent (CuEq) % calculated using copper and gold length weighted assay results, with commodity prices assumed at Cu = 3.50 USD/lb, Au = 1700 USD/oz, Ag = 20 USD/oz, and Mo = 21 USD/lb. CuEq grade, including copper, gold, silver, and molybdenum based on 100% recoveries, is calculated using the following equation: CuEq. = Cu % + (Au grade in g/t x [Au price ÷ 31] / [Cu price x 2200]) + (Ag grade in g/t x [Ag price ÷ 31] / [Cu price x 2200] + (Mo grade in % x [Mo price x 2200] / [Cu price x 2200]). The assays have not been capped.
NAK22-03 Assay Results: Table 2
| From (m) | To (m) | Length (m) | Au (g/t) | Cu (%) | Ag (g/t) | Mo (ppm) | Cu Eq % |
| 35 | 941 | 906 | 0.06 | 0.14% | 0.87 | 38 | 0.21% |
| Including | |||||||
| 296 | 941 | 645 | 0.07 | 0.17% | 1.1 | 32 | 0.24% |
| Within | |||||||
| 296 | 433.77 | 137.77 | 0.11 | 0.20% | 0.84 | 36 | 0.30% |
| And Including | |||||||
| 502.67 | 672 | 169.33 | 0.10 | 0.20% | 1.2 | 38 | 0.30% |
| Within | |||||||
| 502.67 | 941 | 438.33 | 0.06 | 0.17% | 1.3 | 33 | 0.24% |
Collar details for holes drilled in the 2022 drill program: Table 3
| Hole | UTM_Grid | UTM_East | UTM_North | Azimuth | Dip |
| NAK22-01 | NAD83_Z9 | 675281 | 6129359 | n/a | -90 |
| NAK22-02 | NAD83_Z9 | 675281 | 6129359 | 340 | -70 |
| NAK22-03 | NAD83_Z9 | 675201 | 6129658 | n/a | -90 |
| NAK22-04 | NAD83_Z9 | 675181 | 6129862 | n/a | -90 |
| NAK22-05 | NAD83_Z9 | 675105 | 6130067 | n/a | -90 |
| NAK22-06 | NAD83_Z9 | 675376 | 6129782 | 260 | -77 |
| NAK22-07 | NAD83_Z9 | 675181 | 6129862 | 170 | -81 |
The above references an opinion and is for information purposes only. It is not intended to be investment advice. Seek a licensed professional for investment advice. The author is not an insider or shareholder of any of the companies mentioned above.
Discovery Silver (TSXV:DSV) has reported results from the 100%-owned Cordero silver project’s Preliminary Feasibility Study (PFS) in Chihuahua State, Mexico. The project team was led by Ausenco Engineering Canada, AGP Mining Consultants, and Knight Piesold.
Tony Makuch, CEO, commented in a press release: “We are extremely pleased with the results from our Pre-Feasibility Study. The PFS positions Cordero uniquely in the silver developer space with a long mine life of 18 years and production averaging over 35 Moz AgEq in the first 12 years of the mine life. This represents an approximate 40% increase in total ounces produced compared to our 2021 PEA. Despite significant industry-wide cost escalation over the last year, cost savings from a streamlined process design and improved metallurgical performance have resulted in a highly capital efficient project with excellent margins.
“The Study also outlines the significant economic contribution the Project will have through employment, taxes and the purchases of local goods and services in the Municipality of Parral, in Chihuahua State and in Mexico. We now look forward to advancing the Project toward a Feasibility Study and surfacing additional value through numerous optimization opportunities we have already identified.”
Highlights from the Preliminary Feasibility Study are as follows:
- Excellent project economics: Base Case after-tax NPV5% of $1.2 Billion (C$1.5 Billion) and IRR of 28% (Ag – $22.00/oz, Au – $1,600/oz, Pb – $1.00/lb and Zn – $1.20/lb).
- Extended mine life & higher production: 18-year mine life with average annual production of 33 Moz AgEq representing an increase of ~40% in total AgEq ounces produced over the life of the Project compared to the 2021 Preliminary Economic Assessment (“PEA”).
- High margins & low capital intensity maintained: average AISC of $12.80/oz AgEq in Years 1 to 12 with an initial development capex of $455 M resulting in an attractive NPV-to-capex ratio of 2.5x.
- Significantly de-risked Reserve base: new Reserves declared of Ag – 266 Moz, Au – 790 koz, Pb – 2,970 Mlb and Zn – 4,650 Mlb; more than 70% of mill feed in Years 1 to 5 classified as Proven.
- Exceptional silver price leverage: PFS mine plan assumes only 42% of Measured & Indicated Resource tonnes are processed; clear potential to significantly extend mine life at higher silver prices.
- ESG/economic contribution: total estimated taxes payable of $1.2 Billion, a peak estimated local workforce of over 1,000 employees and over $4 Billion of expected goods and services purchased locally within Mexico over the life of the mine.
PRE-FEASIBILITY STUDY SUMMARY
Project Economics
The economics for the PFS were based on the following metal prices: Ag – $22.00/oz, Au – $1,600/oz, Pb – $1.00/lb and Zn – $1.20/lb. Sensitivity of the Project’s expected after-tax NPV, IRR and payback at different commodity price assumptions is outlined in the table below:
| Units | Base Case | Spot Price | Base Case
+15% |
Base Case
-15% |
|
| After-Tax NPV (5% discount rate) | (US$ M) | $1,153 | $1,723 | $1,797 | $508 |
| Internal Rate of Return | (%) | 28.0% | 35.9% | 37.5% | 16.9% |
| Payback | (yrs) | 4.2 | 3.4 | 3.2 | 6.0 |
- Spot Price assumptions (as at close on January 20, 2023): Ag = $23.87/oz, Au = $1,925/oz, Pb = $0.97/lb, Zn = $1.54/lb
Production & Costs
Annual production over the life-of-mine (“LOM”) is expected to average 33 Moz AgEq. In Years 5 – Year 12 production averages 40 Moz AgEq with peak production in Year 11 of 52 Moz AgEq. These production levels position Cordero as one of the largest primary silver mines globally.
All-In Sustaining Costs (“AISC”) average $12.80/oz AgEq in Year 1 – Year 12 and $13.62/oz AgEq over the LOM. This represents an approximate increase of 10% versus the PEA. This increase is primarily due to higher treatment and refining charges and industry wide cost escalation including higher assumed prices for consumables, diesel ($1.10/L vs $1.00/L in PEA) and power ($0.068/kWh vs $0.062/kWh). These increases were offset to a large extent by cost reductions from lower reagent consumptions and unit cost reductions attributable to higher throughput rates in the PFS compared to the PEA.
A summary of AgEq production and AISC is provided in the table below. A breakdown of the production proportions of each individual metal and AISC over the LOM is provided in the graph below the table.
| Units | Year 1 – 4 | Year 5 – 12 | Year 13 -18 | LOM | |
| AgEq Produced – Average/yr | (Moz) | 30 | 40 | 25 | 33 |
| AgEq Payable – Average/yr | (Moz) | 25 | 34 | 21 | 27 |
| AgEq Produced – Total | (Moz) | 118 | 322 | 151 | 591 |
| AgEq Payable – Total | (Moz) | 102 | 268 | 124 | 494 |
| All-In Sustaining Cost (AISC) | (US$/AgEq oz) | $12.29 | $12.99 | $16.05 | $13.62 |
Note – AgEq Produced is metal recovered in concentrate. AgEq Payable is metal payable from concentrate and incorporates metal payment terms outlined in the Concentrate Terms section below. AgEq is calculated as Ag + (Au x 72.7) + (Pb x 45.5) + (Zn x 54.6); these factors are based on metal prices of Ag – $22/oz, Au – $1,600/oz, Pb – $1.00/lb and Zn – $1.20/lb. AISC is a non-GAAP measure; refer to the Non-GAAP Measures section of the release for further information on this measure. See Technical Disclosure section for AISC calculation methodology.
LOM Production & AISC

Note – Au/Pb/Zn production is shown on an AgEq basis based on: Ag = $22/oz, Au = $1,600/oz, Pb = $1.00/lb and Zn = $1.20/lb
2023 PFS vs 2021 PEA Summary
The PFS incorporates numerous significant positive developments in comparison to the PEA. Based on drilling success at depth and in the northeast of the deposit the size of the open pit has increased by over 30% and the strip ratio has improved to 2.1:1. This additional drilling has also significantly increased the confidence level of the underlying resource with the PFS supported by Reserves of which 54% are in the Proven category.
The PFS incorporates throughput rates of 25,500 tpd in Phase 1 and 51,000 tpd in Phase 2, ~25% higher than the PEA. This has resulted in average annual production increasing by 27% over an extended mine life of 18 years. The process design has been streamlined based on the excellent results from the 2022 metallurgical testwork program with the co-processing of oxides and sulphides via flotation allowing for the elimination of the heap leach circuit.
The payback period has increased to 4.2 years. This is due to the delay in processing oxide material from eliminating the heap leach and given the mill expansion occurs in Year 3 of the mine life (deferral of the expansion would reduce the payback period to 3.0 years). The payback period has been significantly de-risked with more than 70% of the mill feed in Years 1 to Year 5 in the Proven category and the removal of the elevated risk typically associated with heap leach ramp ups.
Initial capital increased by 24% to $455 M. This was primarily due to the 25% increase in the initial size of the plant, a switch to owner-operated mining (assuming lease finance of mine equipment) driven by the growth in size of the open pit (the PEA assumed contractor mining) and cost inflation.
| PARAMETER | UNITS | 2023 PFS | 2021 PEA |
| SUMMARY | |||
| After-Tax NPV (5% discount rate) | (US$ M) | $1,153 | $1,160 |
| Internal Rate of Return | (%) | 28.0% | 38.2% |
| Mine Life | (yrs) | 18 | 16 |
| Initial Capital | (US$ M) | $455 | $368 |
| Payback | (yrs) | 4.2 | 2.0 |
| OPERATIONS | |||
| Tonnes Processed (LOM – Total) | (Mt) | 302 | 228 |
| Strip ratio (LOM) | (w:o) | 2.1 | 2.2 |
| PRODUCTION & COSTS | |||
| AgEq Produced (LOM – Annual Average) | (Moz) | 33 | 26 |
| AgEq Produced (LOM – Total) | (Moz) | 591 | 426 |
| All-In Sustaining Cost (Y1 – Y12) | (US$/AgEq oz) | $12.82 | $11.73 |
| All-In Sustaining Cost (LOM) | (US$/AgEq oz) | $13.62 | $12.35 |
Project Economics are based on Ag = $22.00/oz, Au = $1,600/oz, Pb = $1.00/lb, Zn = $1.20/lb. See Technical Disclosure section for AgEq and AISC calculation methodology.
Feasibility Study Opportunities
The Feasibility Study (“FS”) is already being advanced and is expected to be completed in 1Q 2024. Key areas for optimization in the FS include:
- Metallurgical performance: further testwork to improve recoveries and optimize the mine schedule through modifying the blending of rock types and oxides/sulphides.
- Mining costs: an evaluation of optimal bench height and mine equipment sizing to potentially increase the size of mining equipment and reduce unit mining costs.
- Processing costs: additional comminution testwork targeting reduced power and grinding media consumption and further flotation testwork targeting lower reagent consumption and reagent substitutions.
- Timing of mill expansion: evaluation of deferral of the mill expansion to accelerate the payback period
- Tailings Storage facility (TSF): optimization of the tailing storage design as well as the water efficiency and recirculation within the TSF. Further work will be completed on the option to use filtered (dry stacked) tailings (the PFS assumed high-density thickened tailings).
- Mine life extension: the FS will incorporate an additional ~30,000 m of drilling in and around the pit focused on upgrading the resource classification within the pit and expanding and upgrading resource blocks between the open pit and the Resource constraining pit shell. There is also over 270 Mt of Measured & Indicated Resource that sits outside the PFS design pit but within the Resource pit shell that could significantly extend the mine life at higher metal prices.
The above references an opinion and is for information purposes only. It is not intended to be investment advice. Seek a licensed professional for investment advice. The author is not an insider or shareholder of any of the companies mentioned above.
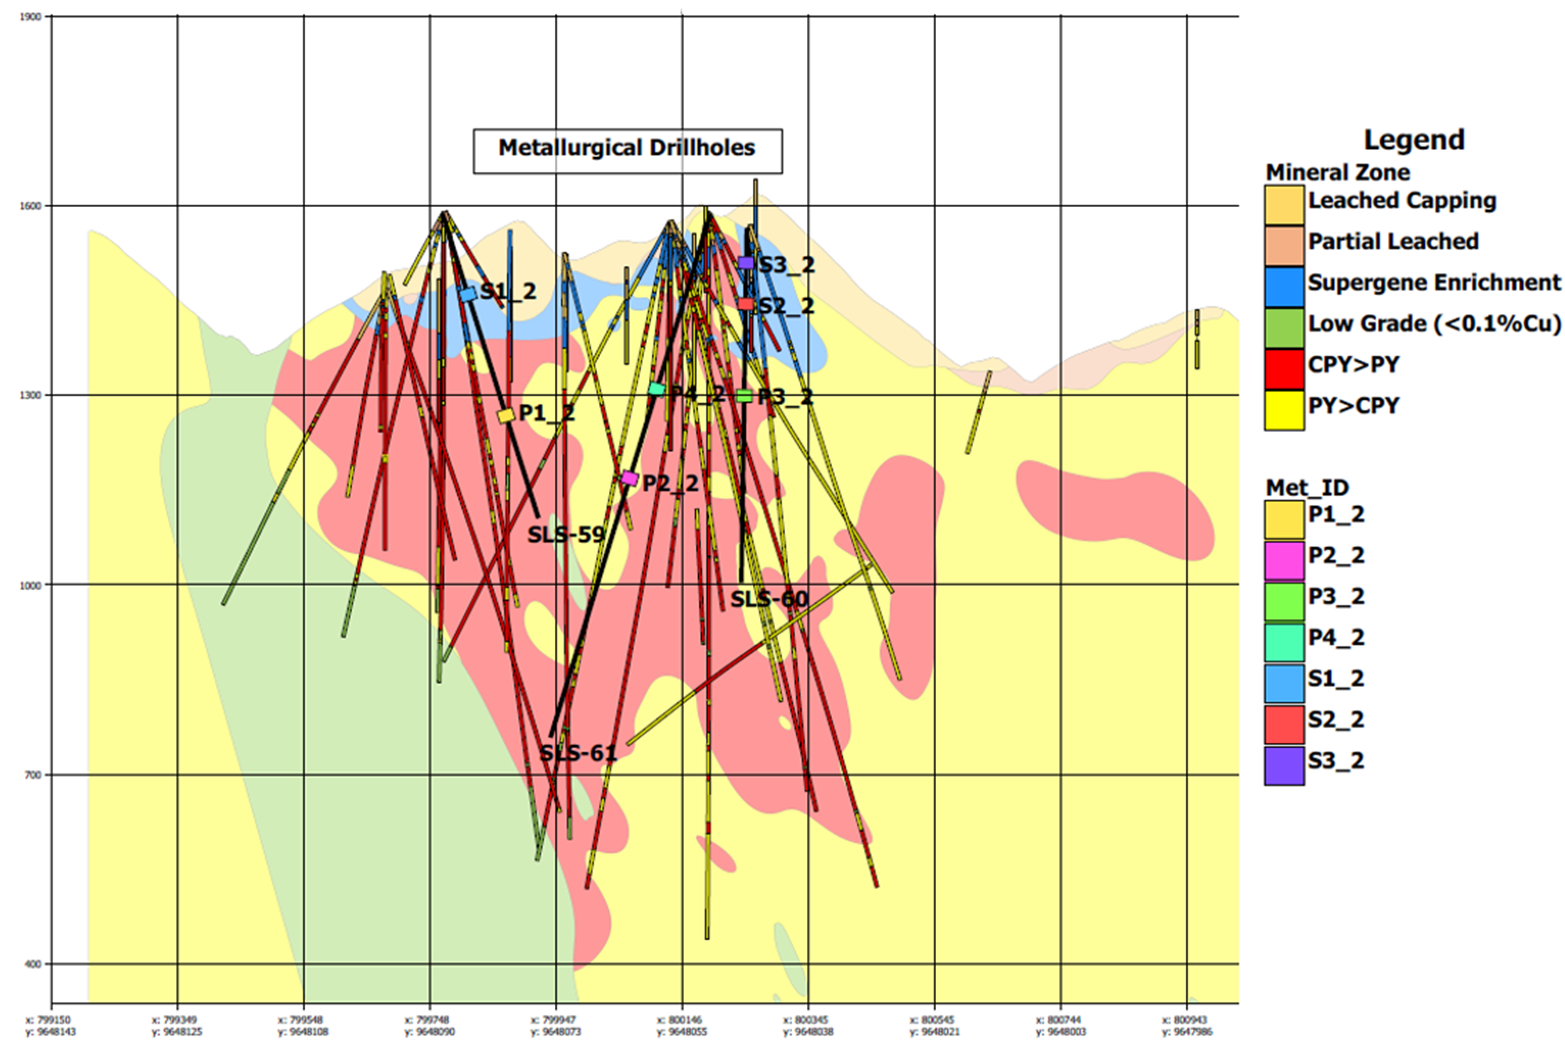
Solaris Resources (TSX:SLS) (OTCQB:SLSSF) has reported new results from metallurgical test work at the Warintza Project in Ecuador, showing high recoveries of copper, molybdenum, and gold in rougher flotation, cleaner flotation, and locked cycle testing. The company commissions FLSmidth USA Inc. to perform all comminution and metallurgical flotation test work programs.
Mr. Daniel Earle, President & CEO, commented in a press release: “Warintza is blessed with simple metallurgy that readily returns high recoveries of critical minerals from standard flotation processes into high-grade concentrates free of deleterious elements. Historical testing reported high recoveries of over 90% for copper and 70% for gold; our testing has reproduced these results and established high recoveries for molybdenum of over 80% at a time when molybdenum prices recently eclipsed $30/lb due to structural supply issues in the sector.”
Highlights from the results are as follows:
- High recoveries for copper (“Cu”), molybdenum (“Mo”) and gold (“Au”) in rougher flotation, cleaner flotation and locked cycle testing
- Low reagent dosages and short flotation times over a wide range of pH levels, and requiring only moderate to coarse grind sizes for both supergene and hypogene samples
- High copper concentrate grades expected from both supergene material at 40% Cu and hypogene material at 22% Cu with both concentrates containing in excess of 1 g/t Au
- High molybdenum concentrate grades expected to meet or exceed 51% Mo independent of feed type given excellent liberation of coarse grained molybdenite
- For context, the Warintza Mineral Resource Estimate (“MRE”)¹ includes a molybdenum byproduct estimate containing 150 kt Mo grading 0.03% Mo (Indicated) and 130 kt Mo grading 0.01% Mo (Inferred), in addition to gold
- Concentrates free of deleterious elements, with no significant values of arsenic, antimony, bismuth or mercury
- Optimization testing with larger sample sizes planned for hypogene material aimed at further increasing recoveries
Metallurgical Test Work Program Scope
The metallurgical test work program at FLS included comminution grind studies on two master composites, ore characterization, grinding indices, rougher and cleaner flotation tests, locked cycle testing and variability rougher kinetics flotation tests. The objective of the test work was to evaluate the metallurgical flotation response of the master composites and variability samples, establish metal recoveries, evaluate if any deleterious elements were present, and assess whether clean, high-grade concentrates could be produced with industry standard processing practices and reagents.
Sample Selection
The metallurgical samples were taken from three drill holes specifically drilled for metallurgical test work. The hole depths range from 500m to 960m with sample selection ranging from 46m below surface to a depth of 450m. Seven samples which consisted of 20m intervals of half core were selected for the test work program for a total weight of 651kg of sample material. The samples were selected from the Warintza Central deposit to represent the mineralization, metal grades, and lithology type which formed the first pit phases of the MRE.
Table 1: Sample Selection
| Met ID | Hole ID | From (m) | To (m) | Interval (m) | Mineralization |
| S1_2 | SLS-59 | 126 | 146 | 20 | Supergene |
| S2_2 | SLS-60 | 112 | 132 | 20 | Supergene |
| S3_2 | SLS-60 | 46 | 66 | 20 | Supergene |
| P1_2 | SLS-59 | 330 | 350 | 20 | Hypogene |
| P2_2 | SLS-61 | 428 | 448 | 20 | Hypogene |
| P3_2 | SLS-60 | 260 | 280 | 20 | Hypogene |
| P4_2 | SLS-61 | 280 | 300 | 20 | Hypogene |
| Total | 140 |
Table 2: Collar Location
| Hole ID | Easting | Northing | Elevation (m) | Depth (m) | Azimuth (degrees) | Dip (degrees) |
| SLS-61 | 800191 | 9648065 | 1573 | 967 | 255 | -72 |
| SLS-60 | 800258 | 9648097 | 1559 | 873 | 190 | -80 |
| SLS-59 | 799765 | 9648033 | 1571 | 513 | 65 | -70 |
| Notes to Table 2: The coordinates are in WGS84 17S Datum. | ||||||
The metallurgical samples were combined by mineralization type and classified as supergene and hypogene which formed two master composites (“MC”) for the flotation test work program. MC #1 represents the supergene material and MC #2 represents the hypogene material. Each MC was assayed to confirm the metal grades are within range of the grades expected in the first phases of a potential mine plan. The head grades for each MC can be found in Table 3.
Table 3: Master Composite Head Grade
| Composite | Head Grade | ||
| Cu, % | Mo, % | Au, g/t | |
| Supergene | |||
| MC #1 | 1.22 | 0.03 | 0.07 |
| MC #1B | 1.13 | 0.04 | 0.07 |
| Hypogene | |||
| MC #2 | 0.66 | 0.03 | 0.06 |
| MC#2B | 0.58 | 0.03 | 0.07 |
Rougher Flotation Testing
FLS completed six rougher flotation tests on MC #1 and five rougher flotation tests on MC #2. In both composites, the copper recovery does not appear to be influenced significantly by pH, grind size, or collector dosages. The rougher flotation tests focused on primary grind size, pH, and collector dosage as the variables for influencing the flotation behavior. The collector used in all tests is Cytec Aero 8989 for copper and burner oil as a molybdenum collector. Below is a summary of MC #1 and #2 tests at various grind sizes and pH.
Table 4: Rougher Recoveries and Grades
| MC #1 – Supergene | |||||||
| Actual Grind Size, µm | pH | Recovery | Grade | ||||
| Cu, % | Mo, % | Au, % | Cu, % | Mo, % | Au, g/t | ||
| 117 | 6.8 | 91.7 | 89.3 | 80.3 | 9.63 | 0.24 | 0.38 |
| 122 | 8.5 | 91.7 | 88.6 | 78.2 | 7.74 | 0.19 | 0.43 |
| 143 | 8.5 | 91.0 | 90.7 | 77.3 | 12.32 | 0.31 | 0.65 |
| 144 | 9.8 | 91.0 | 92.3 | 68.2 | 13.41 | 0.32 | 0.85 |
| 144 | 9.2 | 91.9 | 91.5 | 71.7 | 12.95 | 0.30 | 0.92 |
| 167 | 8.8 | 91.1 | 86.6 | 74.0 | 12.53 | 0.30 | 0.62 |
| Average | 91.4 | 89.8 | 75.0 | ||||
| MC #2 – Hypogene | |||||||
| Actual Grind Size, µm | pH | Recovery | Grade | ||||
| Cu, % | Mo, % | Au, % | Cu, % | Mo, % | Au, g/t | ||
| 98 | 8.5 | 95.0 | 94.4 | 78.0 | 4.39 | 0.20 | 0.38 |
| 129 | 8.6 | 95.1 | 91.6 | 78.8 | 4.37 | 0.20 | 0.39 |
| 177 | 8.6 | 94.5 | 93.9 | 78.7 | 4.32 | 0.18 | 0.39 |
| 147 | 9.4 | 95.5 | 91.4 | 70.0 | 4.44 | 0.15 | 0.45 |
| 147 | 8.9 | 94.8 | 91.6 | 68.8 | 4.78 | 0.18 | 0.47 |
| Average | 95.0 | 92.6 | 74.8 | ||||
Cleaner and Locked Cycle Flotation Testing
Batch cleaner tests were conducted to ensure that bulk concentrates could be produced without significant cleaner losses. One cleaner test was conducted on MC #1 and four cleaner tests were conducted on MC #2, with regrind size being the most significant variable tested. A second set of master composites were created with the same blend of variability samples as the original master composites labeled MC #1B and MC #2B and were used for seven locked cycle tests and copper-molybdenum separation tests. Batch cleaner and locked cycle testing produces high recoveries for the supergene composite of 90% Cu and 83% Mo and hypogene composite of 89% Cu and 75% Mo. FLS concluded that higher recoveries could be achieved for MC #2 and #2B with reagent optimization, which will be incorporated into the next phase of testing.
Copper-Molybdenum Concentrate Separation Test
The second set of master composites, MC #1B and MC #2B, were used for the copper-molybdenum separation of the bulk concentrates. The test work only included a rougher stage molybdenum float that was carried out for both MC #1B and MC #2B due to the size of the remaining sample. The molybdenum separated from the copper successfully into a rougher concentrate for both master composites given excellent liberation characteristics and coarse grain size for molybdenum, with the majority of grains by mass > 200 microns in size. Flotation testing of the supergene samples produced a copper concentrate grading approximately 40% Cu and containing in excess of 1 g/t Au. Flotation testing of the hypogene samples produced a copper concentrate grading approximately 22% Cu and containing in excess of 1 g/t Au. Molybdenum concentrate grades at 51% Mo independent of feed type.
Endnotes
- Refer to Solaris’ technical report titled, “NI 43-101 Technical Report for the Warintza Project, Ecuador” with an effective date of April 1, 2022, prepared by Mario E. Rossi and filed on the Company’s SEDAR profile at www.sedar.com.
The above references an opinion and is for information purposes only. It is not intended to be investment advice. Seek a licensed professional for investment advice. The author is not an insider or shareholder of any of the companies mentioned above.
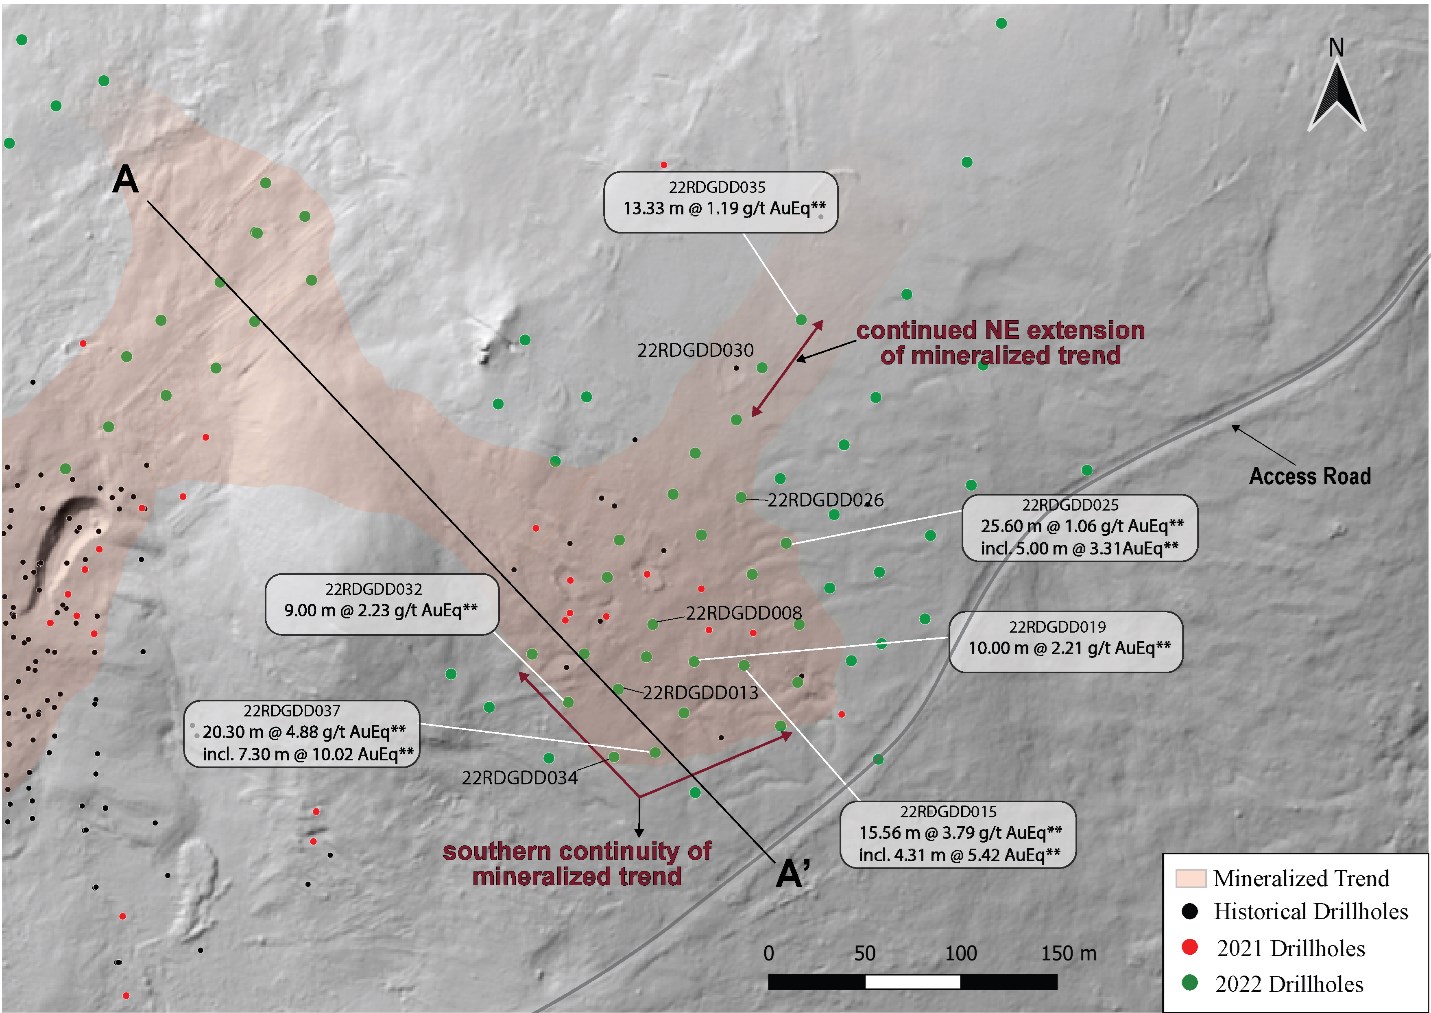
Thesis Gold (TSXV:TAU) has announced new assay results from 11 holes at the Bonanza-Ridge Zone during the 2022 field season. The company’s results expand the mineralized footprint at the Bonanza-Ridge Zone located at the Ranch Gold Project in north-central British Columbia.
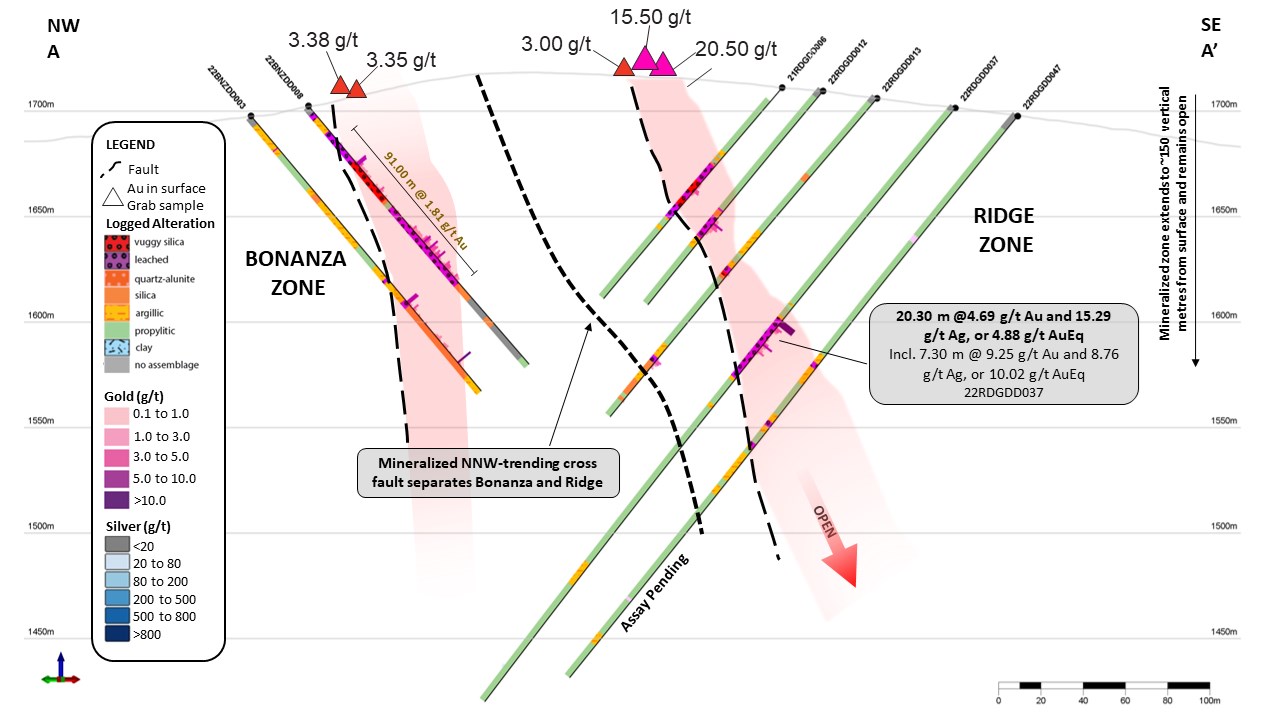
The reported results increase the footprint of the previous metal mineralization at the Ridge Zone. The company continues to work on northeast and southwest-directed step-out drilling at Ridge Zone in an effort to intersect broad 10-25m wide intervals of mineralization. Thesis is extending the strike length of the Bonanza-Ridge Zone to over 700m.
The current mineralized structure at the Bonanza-Ridge Zone coincides with linear magnetic lows and shows potential across multiple datasets the company has compiled. This means the project remains highly prospective for further expansion with future drilling.
Ewan Webster, President and CEO, commented in a press release: “Drilling at the Bonanza-Ridge Zone continues to return significant gold and silver intercepts at surface, while delivering continuity and consistent grade to depth. The consistency of results received thus far supports the tremendous upside on the resource potential of this rapidly expanding target, it will remain a key focus for our 2023 drill program.”
Highlights from the drill results are as follows:
- Ridge hole 22RDGDD037 returned 20.30 metres (m) core length of 4.69 grams per tonne (g/t) gold (Au), 15.29 g/t silver (Ag) or 4.88 g/t AuEq** (Table 1), including 7.30 m of 9.25 g/t Au, 8.76 g/t Ag or 10.02 g/t AuEq** (Figures 1 & 2).
- High-grade gold (17.08 g/t Au) was intersected over a 3.30 m interval beginning at 129.70 m depth.
- High-grade gold in hole 037 demonstrates excellent downdip continuity across numerous drill holes and high-grade gold in rock samples collected at surface (Figure 2).
- Strong gold mineralization over wide intercepts at the Ridge Zone further extended mineralization at depth and along strike (Figure 1 and Table 1).
- 22RDGDD015: 15.56 m of 3.79 g/t AuEq**
- 22RDGDD025: 25.60 m of 1.14 g/t AuEq**
- 22RDGDD035: 13.33 m of 1.19 g/t AuEq** – (Furthest NE confirmed mineralization)
- Bonanza-Ridge mineralization now extends over 700 m along strike
- Mineralization associated with northwest and northeast-oriented structures continues to demonstrate good continuity and remains open along strike.
- The Company will continue to provide additional results from the 2022 drill program as they become available.
Table 1: Drill core assay results from the Ridge Zone.
| Drillhole | From | To | Interval | Au (g/t) | Ag (ppm) | AuEq** | |
| 22RDGDD008 | 109.83 | 121.00 | 11.17 | 0.42 | 48.64 | 1.02 | |
| incl. | 111.00 | 115.00 | 4.00 | 1.15 | 116.93 | 2.61 | |
| 22RDGDD013 | 106.24 | 113.71 | 7.47 | 0.51 | 11.47 | 0.66 | |
| incl. | 106.24 | 111.03 | 4.79 | 0.79 | 12.59 | 0.95 | |
| and | 161.14 | 175.00 | 13.86 | 1.31 | 4.81 | 1.37 | |
| incl. | 161.14 | 167.00 | 5.86 | 2.42 | 6.59 | 2.50 | |
| and | 186.00 | 187.87 | 1.87 | 0.98 | 5.29 | 1.05 | |
| 22RDGDD015 | 146.02 | 161.58 | 15.56 | 2.96 | 66.33 | 3.79 | |
| incl. | 150.69 | 155.00 | 4.31 | 4.27 | 92.06 | 5.42 | |
| and | 242.00 | 244.00 | 2.00 | 0.00 | 58.50 | 0.73 | |
| 22RDGDD019 | 132.00 | 142.00 | 10.00 | 1.83 | 30.37 | 2.21 | |
| incl. | 135.00 | 142.00 | 7.00 | 2.56 | 23.31 | 2.85 | |
| 22RDGDD025 | 127.40 | 153.00 | 25.60 | 1.10 | 3.94 | 1.14 | |
| incl. | 129.00 | 134.00 | 5.00 | 3.29 | 1.78 | 3.31 | |
| and | 161.00 | 162.00 | 1.00 | 0.07 | 25.40 | 0.39 | |
| 22RDGDD026 | 100.00 | 120.00 | 20.00 | 0.86 | 8.22 | 0.96 | |
| incl. | 105.00 | 112.00 | 7.00 | 2.01 | 7.48 | 2.11 | |
| 22RDGDD030 | 89.00 | 111.00 | 22.00 | 0.41 | 5.90 | 0.48 | |
| incl. | 89.00 | 95.00 | 6.00 | 1.00 | 4.29 | 1.05 | |
| and incl. | 101.79 | 105.00 | 3.21 | 0.76 | 11.00 | 0.90 | |
| 22RDGDD032 | 72.35 | 92.00 | 19.65 | 0.06 | 46.03 | 0.64 | |
| incl. | 83.00 | 92.00 | 9.00 | 0.12 | 77.10 | 1.09 | |
| and | 137.00 | 146.00 | 9.00 | 2.15 | 6.47 | 2.23 | |
| incl. | 137.00 | 143.00 | 6.00 | 2.97 | 7.61 | 3.07 | |
| and | 161.00 | 185.00 | 24.00 | 0.66 | 1.90 | 0.69 | |
| incl. | 162.00 | 170.00 | 8.00 | 1.24 | 2.22 | 1.27 | |
| and incl. | 174.56 | 177.26 | 2.70 | 0.86 | 2.65 | 0.90 | |
| 22RDGDD034 | 110.00 | 113.00 | 3.00 | 2.08 | 5.27 | 2.14 | |
| incl. | 110.00 | 111.00 | 1.00 | 3.36 | 4.97 | 3.42 | |
| and | 281.00 | 282.00 | 1.00 | 0.00 | 17.25 | 0.22 | |
| 22RDGDD035 | 100.67 | 114.00 | 13.33 | 1.06 | 10.33 | 1.19 | |
| incl. | 100.67 | 110.00 | 9.33 | 1.51 | 10.15 | 1.64 | |
| 22RDGDD037 | 120.83 | 123.00 | 2.17 | 0.01 | 30.30 | 0.39 | |
| and | 129.70 | 150.00 | 20.30 | 4.69 | 15.29 | 4.88 | |
| incl. | 129.70 | 137.00 | 7.30 | 9.25 | 8.76 | 10.02 | |
| and incl. | 129.70 | 133.00 | 3.30 | 17.08 | 7.40 | 17.17 | |
| and | 143.00 | 150.00 | 7.00 | 3.46 | 13.97 | 3.64 | |
| and | 161.00 | 165.15 | 4.15 | 0.14 | 17.11 | 0.35 |
*True width of the intervals has not yet been established by drilling.
**AuEq calculated on 1:80 gold-to-silver.
The above references an opinion and is for information purposes only. It is not intended to be investment advice. Seek a licensed professional for investment advice. The author is not an insider or shareholder of any of the companies mentioned above.
As the year kicks off and investors prepare for the future, here are some of the potash mining companies that should be on their radar in 2023. These companies have created some of the biggest producing projects, opened new hiring or investment initiatives, or are developing new projects that are set to change the potash market completely.
Brazil Potash
Brazil Potash is a Canadian potash mining company developing the Autazes Potash Project in Manaus, Amazonas State in Brazil. The project aims to double potash output in the coming years and make Brazil self-sufficient in terms of potash production in the near future. The project is a sustainable engineering investment that will produce potassium chloride, an extremely important fertilizer.
Brazil is currently a net importer of potash, due to a combination of factors like limited production and growing demand. With Brazilian demand expected to continue growing, the project has the potential to make a huge dent in the demand domestically. The country is the world’s largest net exporter of agricultural products and food but requires potash imports to hit those numbers. This could be solved with domestic potash production which would drive down agricultural input costs immensely.
The company is currently in the pre-production phase but is open to investment, providing an opportunity for investors to get in on the ground floor of an exciting new potash project.
Western Resources (TSX:WRX)
Western Resources (TSX:WRX) and its wholly owned subsidiary, Western Potash, are working to build a capital-efficient, environmentally friendly potash solution mine at the Milestone Project in Saskatchewan. The full ramp up of operations is projected to begin in mid-2023. In June 2022, WRX announced the next phase of Milestone Project restart, which will involve the completion of processing facilities and the development of solution mining.
Karnalyte Resources (TSX:KRN)
Karnalyte Resources (TSX:KRNN) is a company specializing in the construction of its advanced Wynyard Potash Project in Central Saskatchewan. The company has completed feasibility studies, and the project is ready for construction, with financing in the process of being secured.
Why Potash Mining is More Critical Than Ever
The potash mining industry is seeing more investment and attention than ever before for a few key reasons:
Potash and Fertilizer Shortages Threaten Food Security
One of the biggest risks to global food security is the current and potential shortages of potash and fertilizers. Potash is a critical mineral for crop growth and food production, as it increases yields and helps to keep soil healthy. As population growth and demand for food and resources increases, potash and fertilizer shortages could become a major concern.
With potash and fertilizer prices rising, potash mining is becoming an increasingly attractive industry with the potential to help ensure food security. By investing in potash production, countries can reduce their reliance on imports and gain more control over their own food security.
A Monopolized Market
The potash market is currently dominated by only a few major players, with most of the major extraction and production operations concentrated in North America and Russia. This has led to a lack of competition, which has resulted in artificially high prices and a lack of innovation.
Investing in potash mining companies and diversifying production could help create a more competitive and open market, which could lead to lower prices and better products.
Opportunity for Growing Brazil’s Domestic Potash Market
Brazil is the world’s largest net exporter of agricultural products and food, yet it is a net importer of potash. This is due to a combination of factors, such as limited production and growing demand. With Brazilian demand expected to continue growing, there is a vast opportunity for potash mining companies to capitalize on this potential.
The Autazes Potash Project from Brazil Potash, for example, aims to make Brazil self-sufficient in terms of potash production in the near future, which could drastically reduce agricultural input costs and provide a more secure food supply for the country.
Potash mining is an incredibly important industry for global food security, and with the right investments and initiatives, it could help to ensure a more secure future. In 2023, investors should keep a close eye on the potash mining companies mentioned above, as they are well-positioned to capitalize on the opportunities in the sector.
The above references an opinion and is for information purposes only. It is not intended to be investment advice. Seek a licensed professional for investment advice. The author is not an insider or shareholder of any of the companies mentioned above.
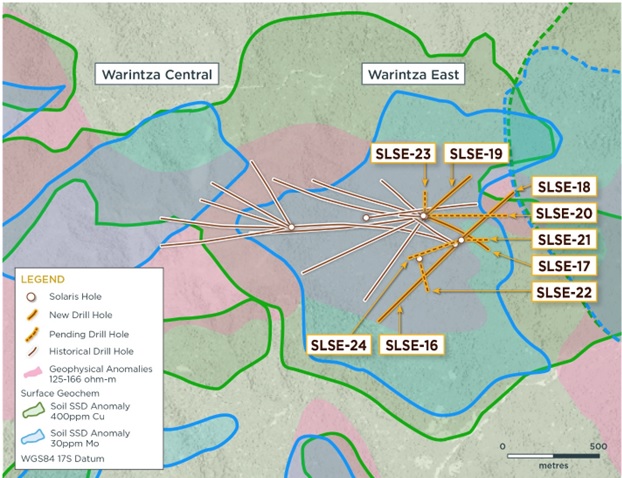
Solaris Resources (TSX:SLS) (OTCQB:SLSSF) has reported new assay results from a series of holes at the Warintza East Discovery aimed at growing mineral resources at the Warintza Project in Ecuador. The company made the initial discovery in July 2021, with a total of eight holes covering the overlapping periphery. These were included in the Warintza Central Mineral Resource Estimate (MRE) released in April 2022.
These new results expand the drilled dimensions of the Warintza East footprint to the northeast, east, and south. The deposit still remains open in those directions, with particularly strong soil anomalism to the south.
Mr. Jorge Fierro, Vice President, Exploration, commented in a press release: “Warintza East’s largely undrilled footprint is a target for major mineral resource growth in the ongoing drilling program where only minimal drilling was included in the MRE and adjoins with Warintza Central. Assays are pending from further extensional holes to the north and east and targeting strong soil anomalism in step-out drilling to the south.”
Highlights from the results are as follows:
- SLSE-16 was collared at the eastern limit of the grid and drilled southwest into an open volume, returning 108m of 0.57% CuEq² within a broader interval of 712m of 0.45% CuEq² from surface, extending mineralization to the south and southeast where it remains open
- This hole was collared approximately 250m to the southeast of SLSE-13 (refer to Company press release dated Nov 14, 2022), which previously returned 104m of 0.45% CuEq² from surface within a broader interval of 618m of 0.29% CuEq²
- SLSE-17 was collared in the middle of the Warintza East drill grid and drilled southeast into an open volume, returning 144m of 0.52% CuEq² from surface within a broader interval of 914m of 0.40% CuEq², extending mineralization to the east where it remains open
- This hole extends the drilled dimensions further to the east beyond SLSE-14 (refer to Company press release dated Nov 14, 2022), which previously returned 292m of 0.50% CuEq² from near surface within a broader interval of 694m of 0.40% CuEq²
- SLSE-19 was collared in the middle of the Warintza East drill grid and drilled northeast into an open volume, returning 270m of 0.40% CuEq² from surface within a broader interval of 580m of 0.31% CuEq², expanding the footprint to the northeast where it remains open
- Drilling to date confirms Warintza East as a significant porphyry deposit that adjoins Warintza Central and remains open for expansion, with assays pending from a series of extensional holes to the north, east, south and southeast
Table 1 – Assay Results
| Hole ID | Date Reported | From (m) | To (m) | Interval (m) | Cu (%) | Mo (%) | Au (g/t) | CuEq² (%) |
| SLSE-19 | Jan 17, 2023 | 0 | 580 | 580 | 0.24 | 0.01 | 0.03 | 0.31 |
| Including | 0 | 270 | 270 | 0.31 | 0.02 | 0.04 | 0.40 | |
| SLSE-18 | 30 | 524 | 494 | 0.16 | 0.01 | 0.04 | 0.20 | |
| SLSE-17 | 0 | 914 | 914 | 0.32 | 0.01 | 0.04 | 0.40 | |
| Including | 0 | 144 | 144 | 0.45 | 0.01 | 0.05 | 0.52 | |
| SLSE-16 | 8 | 720 | 712 | 0.36 | 0.02 | 0.05 | 0.45 | |
| Including | 76 | 184 | 108 | 0.46 | 0.02 | 0.06 | 0.57 |
Notes to table: True widths of the mineralized zone are not known at this time.
Table 2 – Collar Location
| Hole ID | Easting | Northing | Elevation (m) | Depth (m) | Azimuth (degrees) | Dip (degrees) |
| SLSE-19 | 801485 | 9648192 | 1170 | 816.48 | 48 | -65 |
| SLSE-18 | 801684 | 9648074 | 1221 | 1018.74 | 48 | -65 |
| SLSE-17 | 801485 | 9648192 | 1170 | 1011.39 | 105 | -70 |
| SLSE-16 | 801684 | 9648074 | 1221 | 844.61 | 225 | -45 |
| Notes to table: The coordinates are in WGS84 17S Datum. | ||||||
The above references an opinion and is for information purposes only. It is not intended to be investment advice. Seek a licensed professional for investment advice. The author is not an insider or shareholder of any of the companies mentioned above.
Brazil is home to a vast supply of potash, a natural mineral found in abundance within the country’s soil. This mineral is helpful in the production of fertilizer and is an important resource for the agricultural industry. Thanks to recent advancements in technology, the potential of Brazil’s potash mining industry has been unlocked, allowing Brazilian miners to access and harvest this mineral in a safe and efficient manner. Let’s explore the potential of Brazil’s potash mining industry, the technology that is being used, and the economic benefits it could bring to the country and the potash mining market.
Brazil Potash is a Canadian mining company with its flagship Autazes Potash Project near Manaus, Brazil. The Brazilian government has given the project its support, and last year there had been plenty of discussion about the importance of fertilizers to the country. The administration released the National Fertilizer Plan, highlighting the importance of potash in the country’s fertilizer mix.
The Autazes Potash Project’s goal is to double the current production, changing the domestic market completely. Currently, the global potash market is dominated by a small group of countries including Russia, Canada, and Belarus. This in turn makes it more expensive for companies and countries to import potash for important applications such as improving crop yields and fertilizer quality.
The Autazes Potash Project has the potential to be so large that it could single-handedly change the potash market dynamic and ultimately shift Brazil from a net importer to a net exporter in the future.
Brazil is one of the world’s largest exporters of agricultural products, and its potash mining industry is not contributing to this success. The country has a large number of potash deposits, estimated to be around 45 billion tons, which is enough to cover the world’s demand for the mineral for decades. The deposits are located mainly in the northern regions of Brazil, and they are considered to be some of the most promising in the world.
The Development of a Potash Mining Project
There are several stages to a potash mining project that must be completed before the mineral can be effectively and safely extracted. The first step is to conduct a geological survey of the area, which includes the use of geophysical instruments to determine the size and shape of the potash deposits. After this, a drilling program is conducted to further characterize the deposits and create a three-dimensional map of them. This is followed by the construction of a mine, which is typically done using underground mining techniques.
Once the mine is operational, the mineral is extracted and processed in a number of ways, depending on the type of potash being mined. Potash can be processed into a variety of different products, including fertilizer, animal feed, and industrial chemicals. After this, it is ready to be transported to its destination.
The Benefits of Potash Mining in Brazil
Potash mining in Brazil has a number of benefits to the country’s economy. It creates jobs in the mining industry and helps to drive the development of rural areas. It also generates taxes for the government and provides a reliable source of income for the communities around the mines.
The increased production of potash also helps to promote the sustainable development of the agricultural sector. The fertilizer produced from potash helps to increase crop yields and improve soil fertility, which can help to reduce hunger and poverty in rural areas.
Unlocking Brazil’s Full Potash Potential
Thanks to projects like the Autazes Potash Project, Brazil is now on the verge of unlocking the full potential of its potash industry. This will bring significant economic benefits to the country and the potash market as a whole. It will also help to reduce the global dependence on a small group of suppliers and provide a reliable source of potash to the world.
The above references an opinion and is for information purposes only. It is not intended to be investment advice. Seek a licensed professional for investment advice. The author is not an insider or shareholder of any of the companies mentioned above.
Carlyle Commodities (CSE:CCC) has commenced its Phase 1 diamond drilling at the Newton Gold Silver Project in British Columbia. The Phase 1 program will test numerous high-priority targets to increase tonnage and ounces at Carlyle’s current NI 43-101 resource calculation. The first focus will be to test multiple zones of felsic volcanic host rock outside of the current pit-constrained resource calculation to discover new mineralization zones.
The first Phase 1 initial drill targets include:
- Drill site 1: Targets continuity of the well mineralized main felsic domain, which remains open. This will be completed by a 500 meter to 1,000 meter drill hole through the current resource and extending to untested sections of the felsic domain.
- Drill site 2: Targets a potential felsic domain starting at surface and extending into a second felsic domain which remains open along trend. Geological modelling suggests that these may represent three stacked mineralized felsic domains.
- Drill site 3: Targets an additional felsic domain more than 100 metres outside of the current resource. Historical DDH 12-076 returned 171m of 0.69 Au and 2.1 Ag (288-459m) which has not been followed up on.
Mr. Jeremy Hanson, VP Exploration commented in a press release: “We are very excited to begin this first phase of drilling. We have a number of high-priority domains to test. Our modeling is indicating that these mineralized felsic domains extend significantly outside of the current resource and with potential for discoveries of new zones of mineralization.”
Carlyle President and Chief Executive Officer, Morgan Good, also commented: “We believe momentum is building across the junior resource equity markets. Carlyle’s timing with its Phase 1 diamond drill program to test high potential targets looks to position the Company well.”
Issuance of Shares and Options Grants
The company also announced that it had issued 78,606 shares of Carlyle Commodities Corp. at $0.16875 per share to two strategy and business consultants Carlyle has engaged. The shares were issued according to the terms of consulting agreements, equal to the lowest permitted price by the applicable policies of the Canadian Securities Exchange.
Carlyle Commodities also issued 1,000,000 options to a consultant for the company for the purchase of up to 1,000,000 shares according to the company’s Omnibus Equity Incentive Plan. All options were vested immediately and are exercisable for a period of five years at a price of $0.31 per share.
The above references an opinion and is for information purposes only. It is not intended to be investment advice. Seek a licensed professional for investment advice. The author is not an insider or shareholder of any of the companies mentioned above.
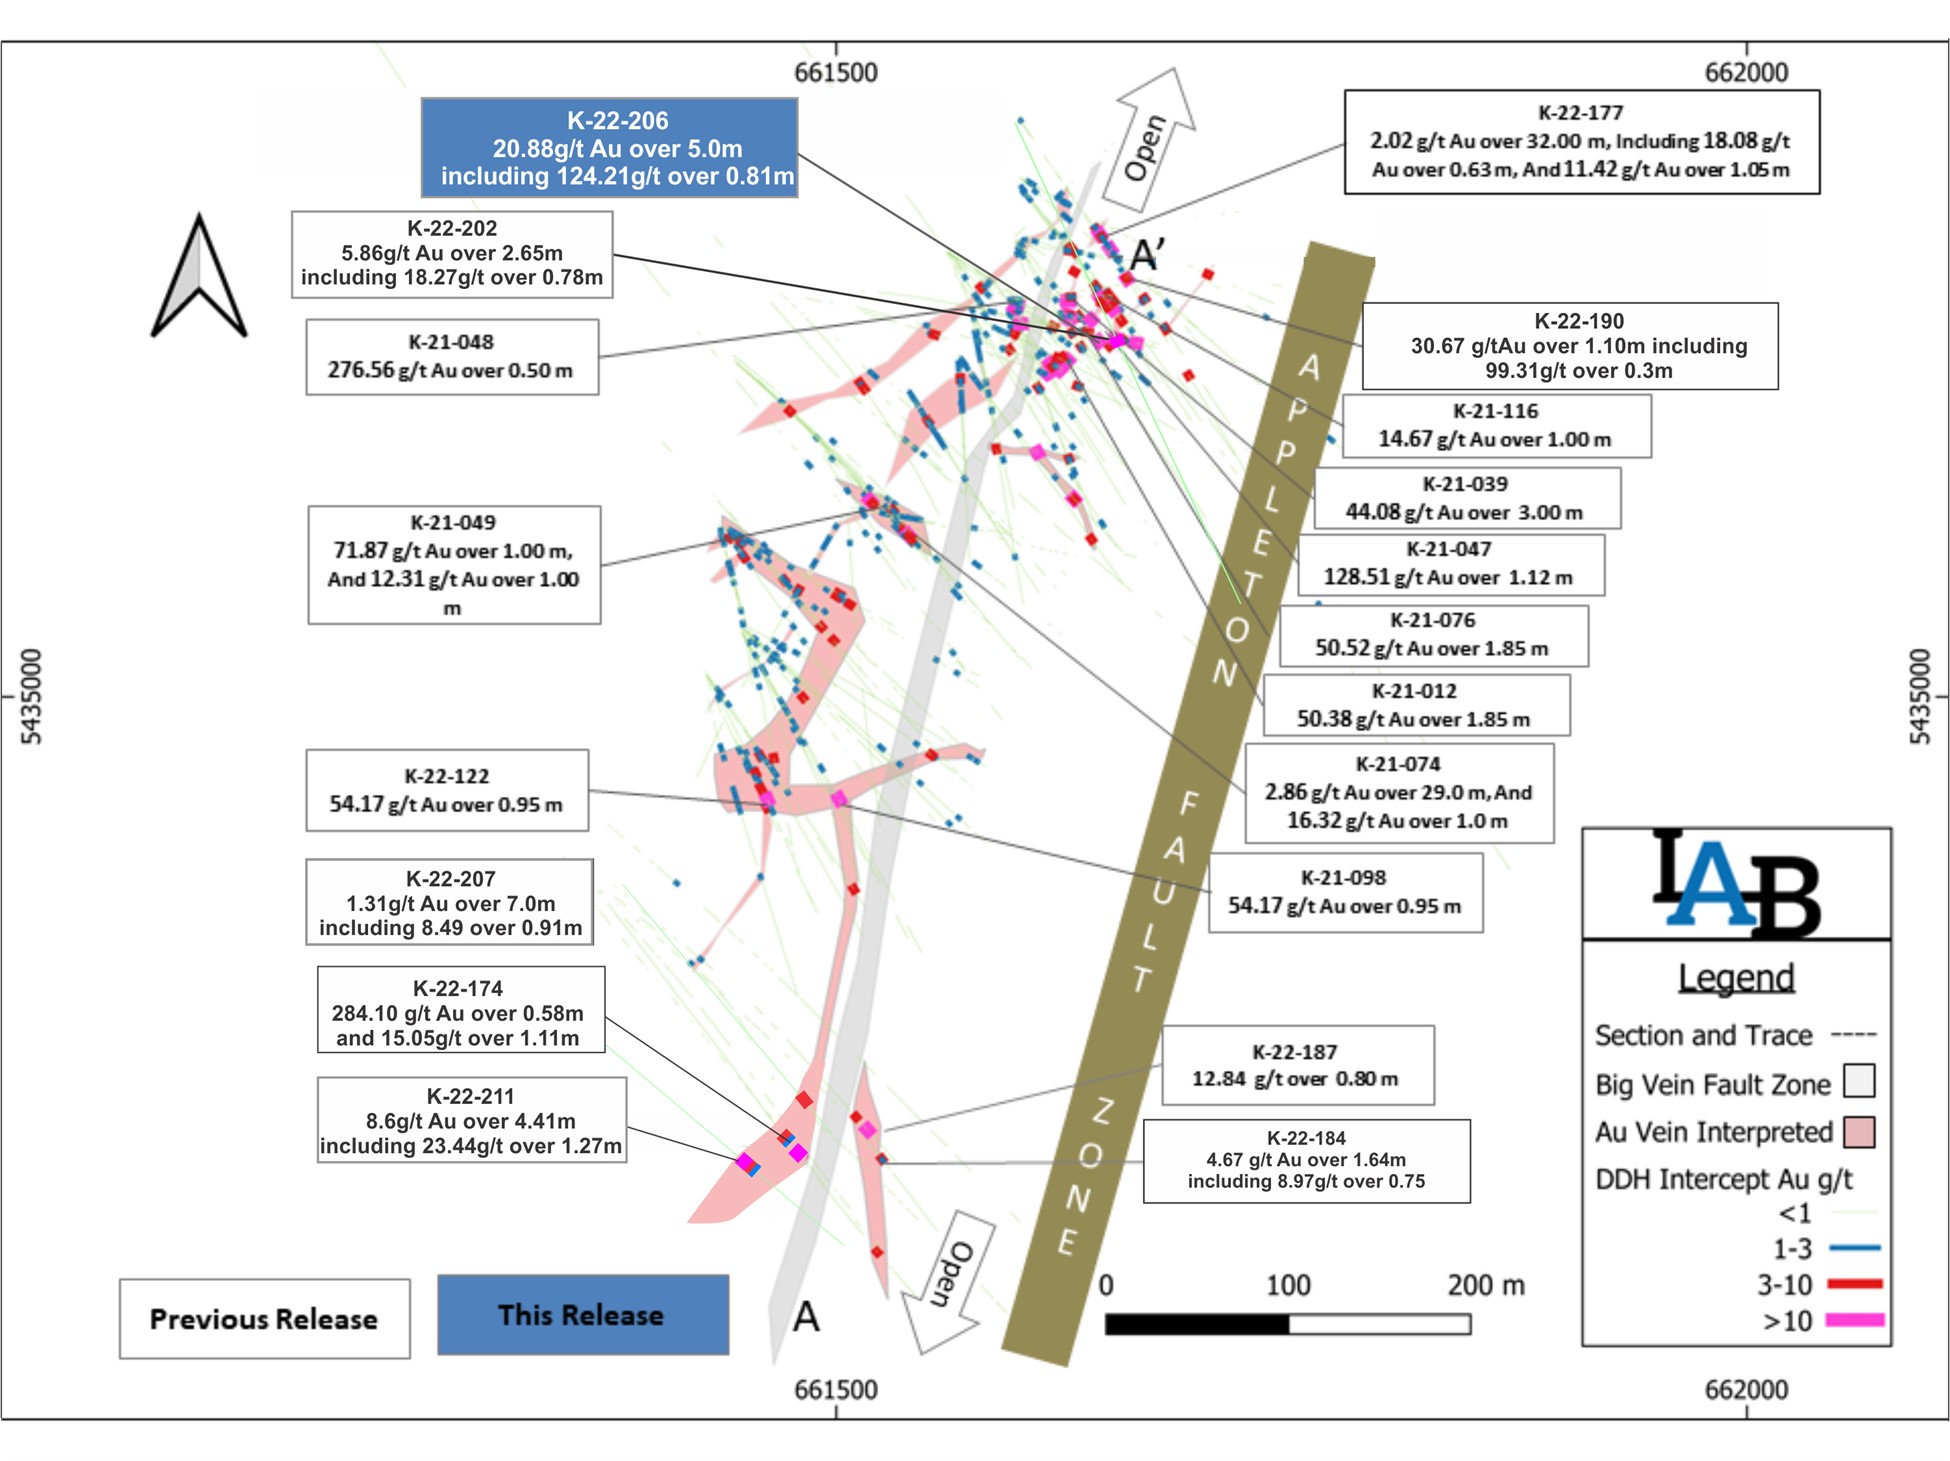
Labrador Gold (TSXV:LAB) has announced new results from its ongoing drilling targeting the Appleton Fault Zone over a 12-kilometre strike length. The drilling at the site is part of the company’s 100,000-metre diamond drill program at the Kingsway Project.
Results included an intersection of 20.88 g/t Au Over 5 Metres at Big Vein, and 124.21g/t Au over 0.81 metres and 7.41 g/t Au over 1.0 metres in Hole K-22-206, and 6.04 g/t Au over 1.20 metres in Hole K-22-208, also drilled at the north end of Big Vein.
63,055 metres out of the planned 100,000 have been drilled so far, with assays pending for 2,700 of core samples. Labrador Gold also has approximately $18 million in cash and is funded to complete the remaining 37,000 metres of the program. The company will add further exploration targets on the property to add to the pipeline after the program is completed.
Roger Moss, President and CEO of Labrador Gold, commented in a press release: “We continue to follow up on the success of last year’s drilling at Big Vein with another high-grade intersection at the north end of the zone. Big Vein has now been drilled over a strike length of approximately 520 metres along the west side of the Appleton Fault Zone and remains open to the northeast and to the southwest. Drilling is ongoing at both ends of the zone to extend the strike length of the mineralization.”
Table 1. Summary of assay results. All intersections are downhole length as there is insufficient Information to calculate true width.
| Hole ID | From (m) | To (m) | Interval (m) | Au (g/t) | Zone |
| K-22-208 | 116.00 | 118.00 | 2.00 | 1.07 | Big Vein |
| 176.58 | 178.12 | 1.54 | 5.00 | ||
| including | 176.58 | 177.78 | 1.20 | 6.04 | |
| K-22-206 | 24.00 | 25.00 | 1.00 | 1.13 | Big Vein |
| 319.00 | 320.00 | 1.00 | 7.41 | ||
| 371.00 | 376.00 | 5.00 | 20.88 | ||
| including | 374.56 | 375.37 | 0.81 | 124,213 | |
| K-22-204 | nsv | CSAMT | |||
| K-22-203 | nsv | Golden Glove |
Table 2. Drill hole collar details
| Hole ID | Easting | Northing | Elevation (m) | Azimuth | Dip | Total depth (m) |
| K-22-208 | 661571 | 5435366 | 58 | 145 | 50 | 497 |
| K-22-206 | 661593 | 5435331 | 54 | 155 | 60 | 422.11 |
| K-22-204 | 666713 | 5443698 | 50 | 295 | 55 | 482 |
| K-22-203 | 660958 | 5432372 | 40 | 108 | 45 | 520.38 |
The above references an opinion and is for information purposes only. It is not intended to be investment advice. Seek a licensed professional for investment advice. The author is not an insider or shareholder of any of the companies mentioned above.
Brixton Metals (TSXV:BBB) has reported new drill results from the 2022 drill program at the Trapper Gold Target at the Thorn Project in Northwest British Columbia. The 2022 program totaled 9,119m of drilling at the Trapper Gold Target, with all of the assay values being uncut weighted averages and intervals reflecting drill lengths. Further drilling is still necessary to determine the final true widths of the mineralization. Assays are pending for the remaining 9 drill holes. Eight are from the Metla Target, and one is from the Camp Creek Target.
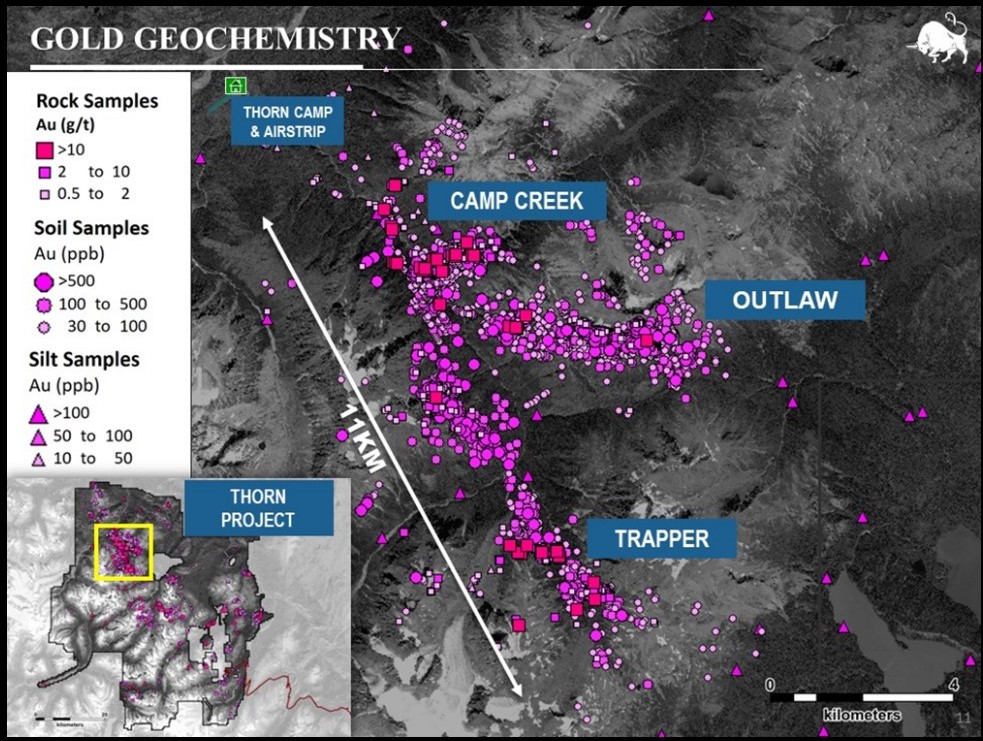
Vice President of Exploration, Christina Anstey, commented in a press release: “We are delighted with these final drill results from the 2022 program at the Trapper Gold Target, which confirms a significant new gold discovery. We are highly encouraged by the broad gold intercepts and high-grades drilled on the Trapper Gold Target to date. We look forward to reporting on the additional results from the Camp Creek and Metla Targets from the 2022 season.”
Highlights from the results are as follows:
- Hole THN22-244 yielded 253.00m of 1.40 g/t Au from 42m depth
- Including 157.00m of 2.10 g/t Au
- Including 93.00m of 3.22 g/t Au
- Including 20.00m of 10.77 g/t Au
- Including 12.31m of 16.18 g/t Au
- Hole THN22-250 yielded 232.00m of 0.95 g/t Au from 9m depth
- Including 70.00m of 2.60 g/t Au
- Including 25.00m of 4.47 g/t Au
- Including 13.00m of 6.05 g/t Au
- Including 1.49m of 41.75 g/t Au
- Hole THN22-256 yielded 138.00m of 1.20 g/t Au
- Including 46.39m of 1.84 g/t Au
- Including 17.59m of 4.09 g/t Au
- Including 8.34m of 5.02 g/t Au
Table 1. Select Mineralized Intervals for the Trapper Target Drilling.
| Hole ID | From (m) | To (m) | interval (m) | Au (g/t) |
| THN22-244 | 42.00 | 295.00 | 253.00 | 1.40 |
| including | 87.00 | 244.00 | 157.00 | 2.10 |
| including | 151.00 | 244.00 | 93.00 | 3.22 |
| including | 151.00 | 171.00 | 20.00 | 10.77 |
| including | 155.00 | 167.31 | 12.31 | 16.18 |
| THN22-250 | 9.00 | 241.00 | 232.00 | 0.95 |
| including | 171.00 | 241.00 | 70.00 | 2.60 |
| including | 177.00 | 202.00 | 25.00 | 4.47 |
| including | 188.00 | 201.00 | 13.00 | 6.05 |
| including | 197.00 | 201.00 | 4.00 | 10.41 |
| including | 238.20 | 239.69 | 1.49 | 41.75 |
| THN22-256 | 5.00 | 143.00 | 138.00 | 1.20 |
| including | 20.66 | 67.05 | 46.39 | 1.84 |
| including | 20.66 | 38.25 | 17.59 | 4.09 |
| including | 20.66 | 29.00 | 8.34 | 5.02 |
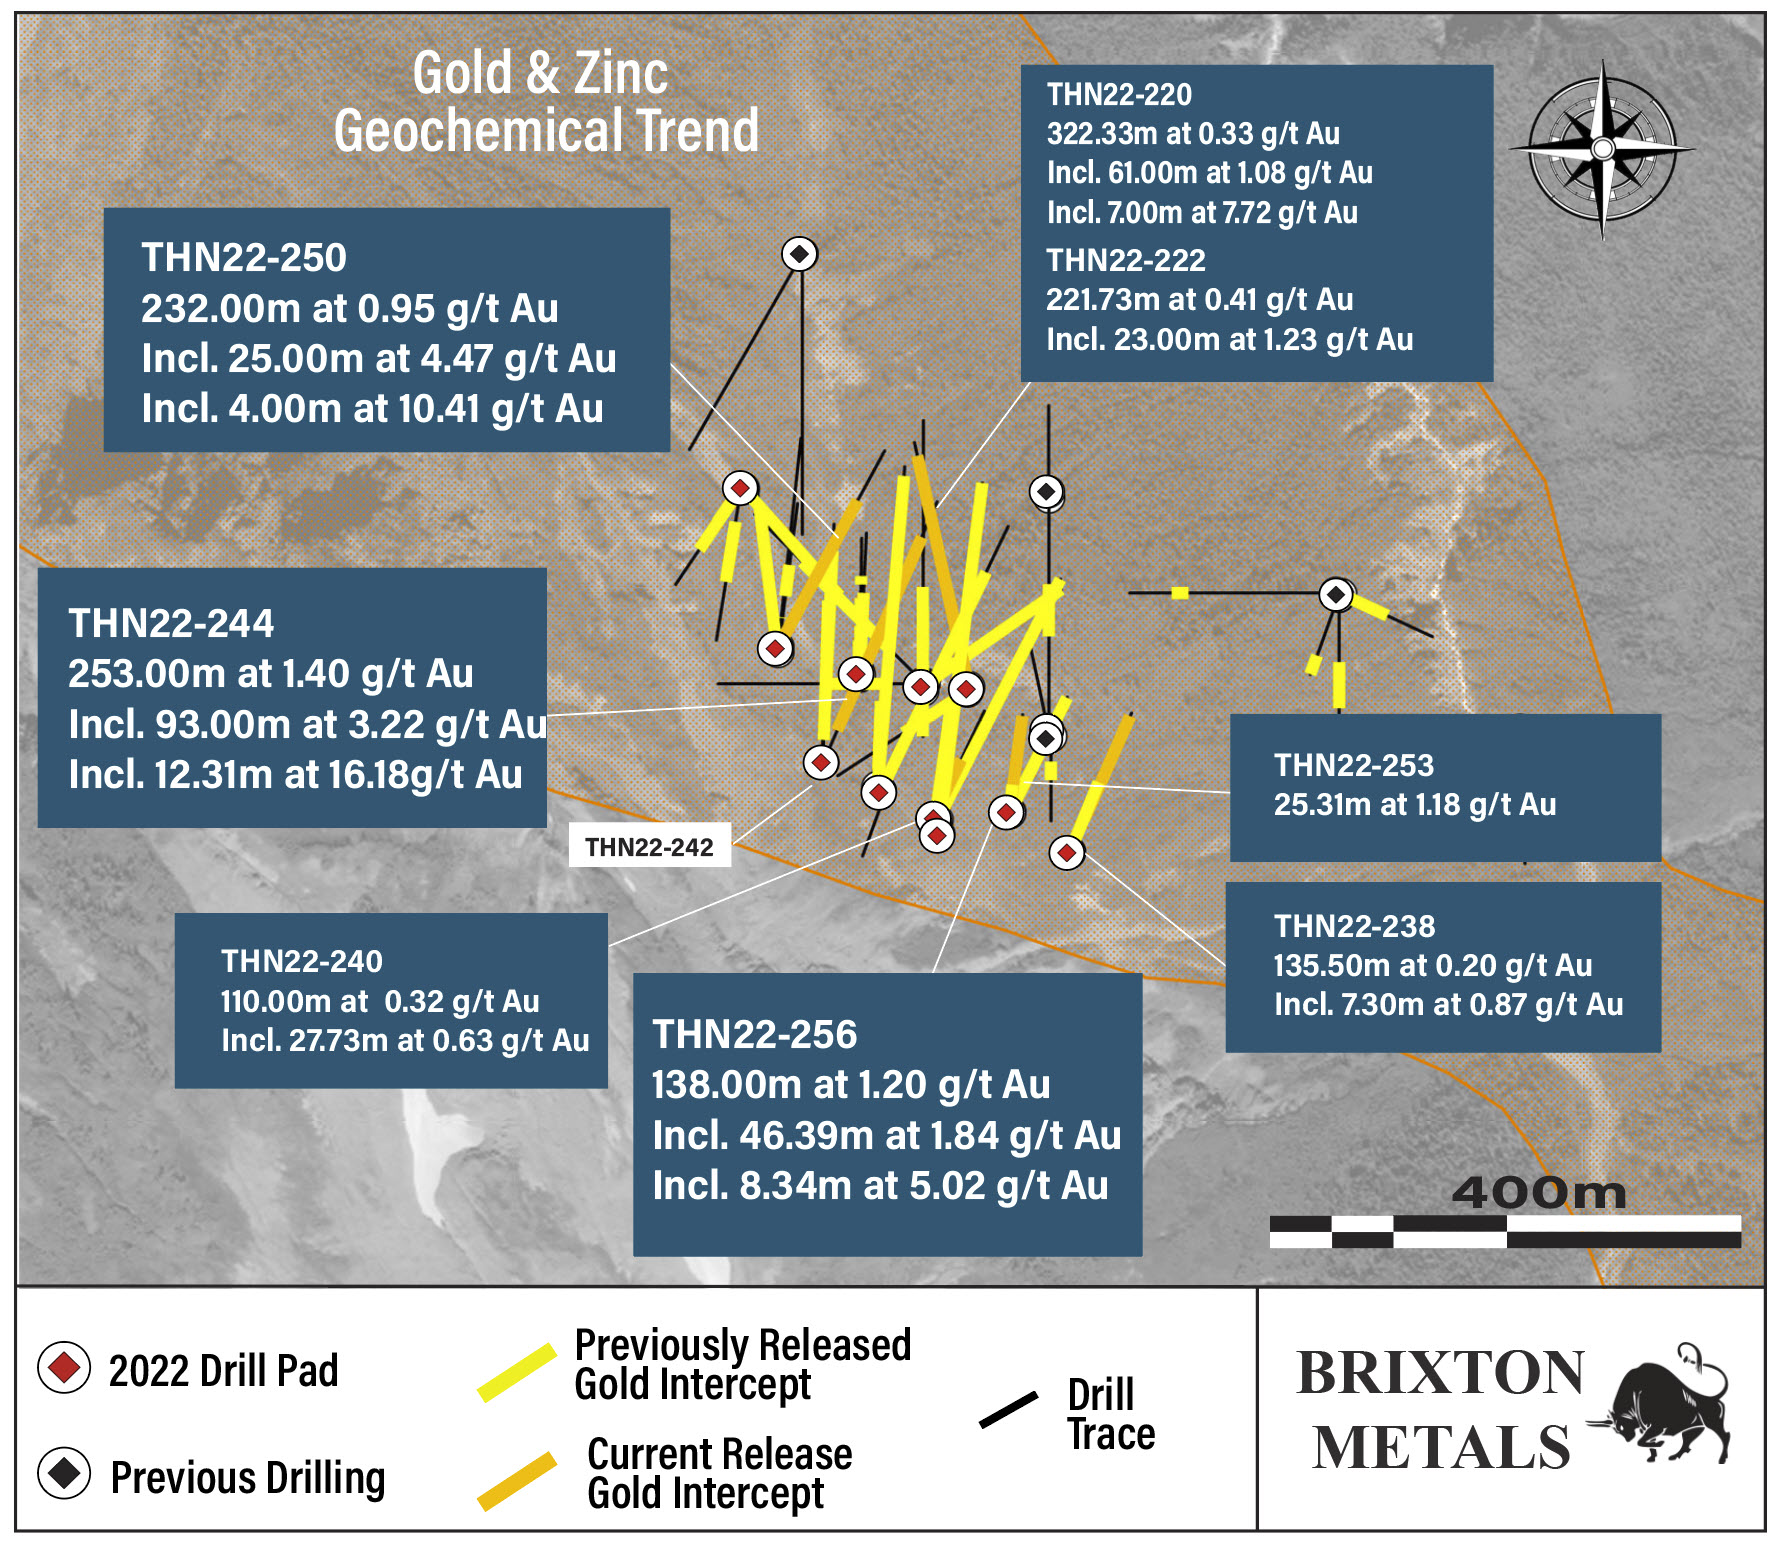
Table 2. Additional Select Reported Mineralized Intervals for the Trapper Target Drilling.
| Hole ID | From (m) | To (m) | interval (m) | Au (g/t) |
| THN22-220 | 10.67 | 333.00 | 322.33 | 0.33 |
| 79.00 | 200.00 | 121.00 | 0.72 | |
| 139.00 | 200.00 | 61.00 | 1.08 | |
| 172.00 | 200.00 | 28.00 | 2.12 | |
| 193.00 | 200.00 | 7.00 | 7.72 | |
| THN22-240 | 6.00 | 116.00 | 110.00 | 0.32 |
| 85.00 | 112.73 | 27.73 | 0.63 | |
| 85.00 | 94.00 | 9.00 | 1.03 | |
| THN22-238 | 42.00 | 177.50 | 135.50 | 0.20 |
| 42.00 | 49.30 | 7.30 | 0.87 | |
| THN22-253 | 7.00 | 32.31 | 25.31 | 1.18 |
| THN22-242 | no significant assays | |||
| THN22-222 | 21.50 | 243.23 | 221.73 | 0.41 |
| 99.00 | 157.00 | 58.00 | 0.77 | |
| 143.00 | 166.00 | 23.00 | 1.23 | |
| 143.00 | 157.00 | 14.00 | 1.82 | |
| 143.00 | 146.00 | 3.00 | 6.34 | |
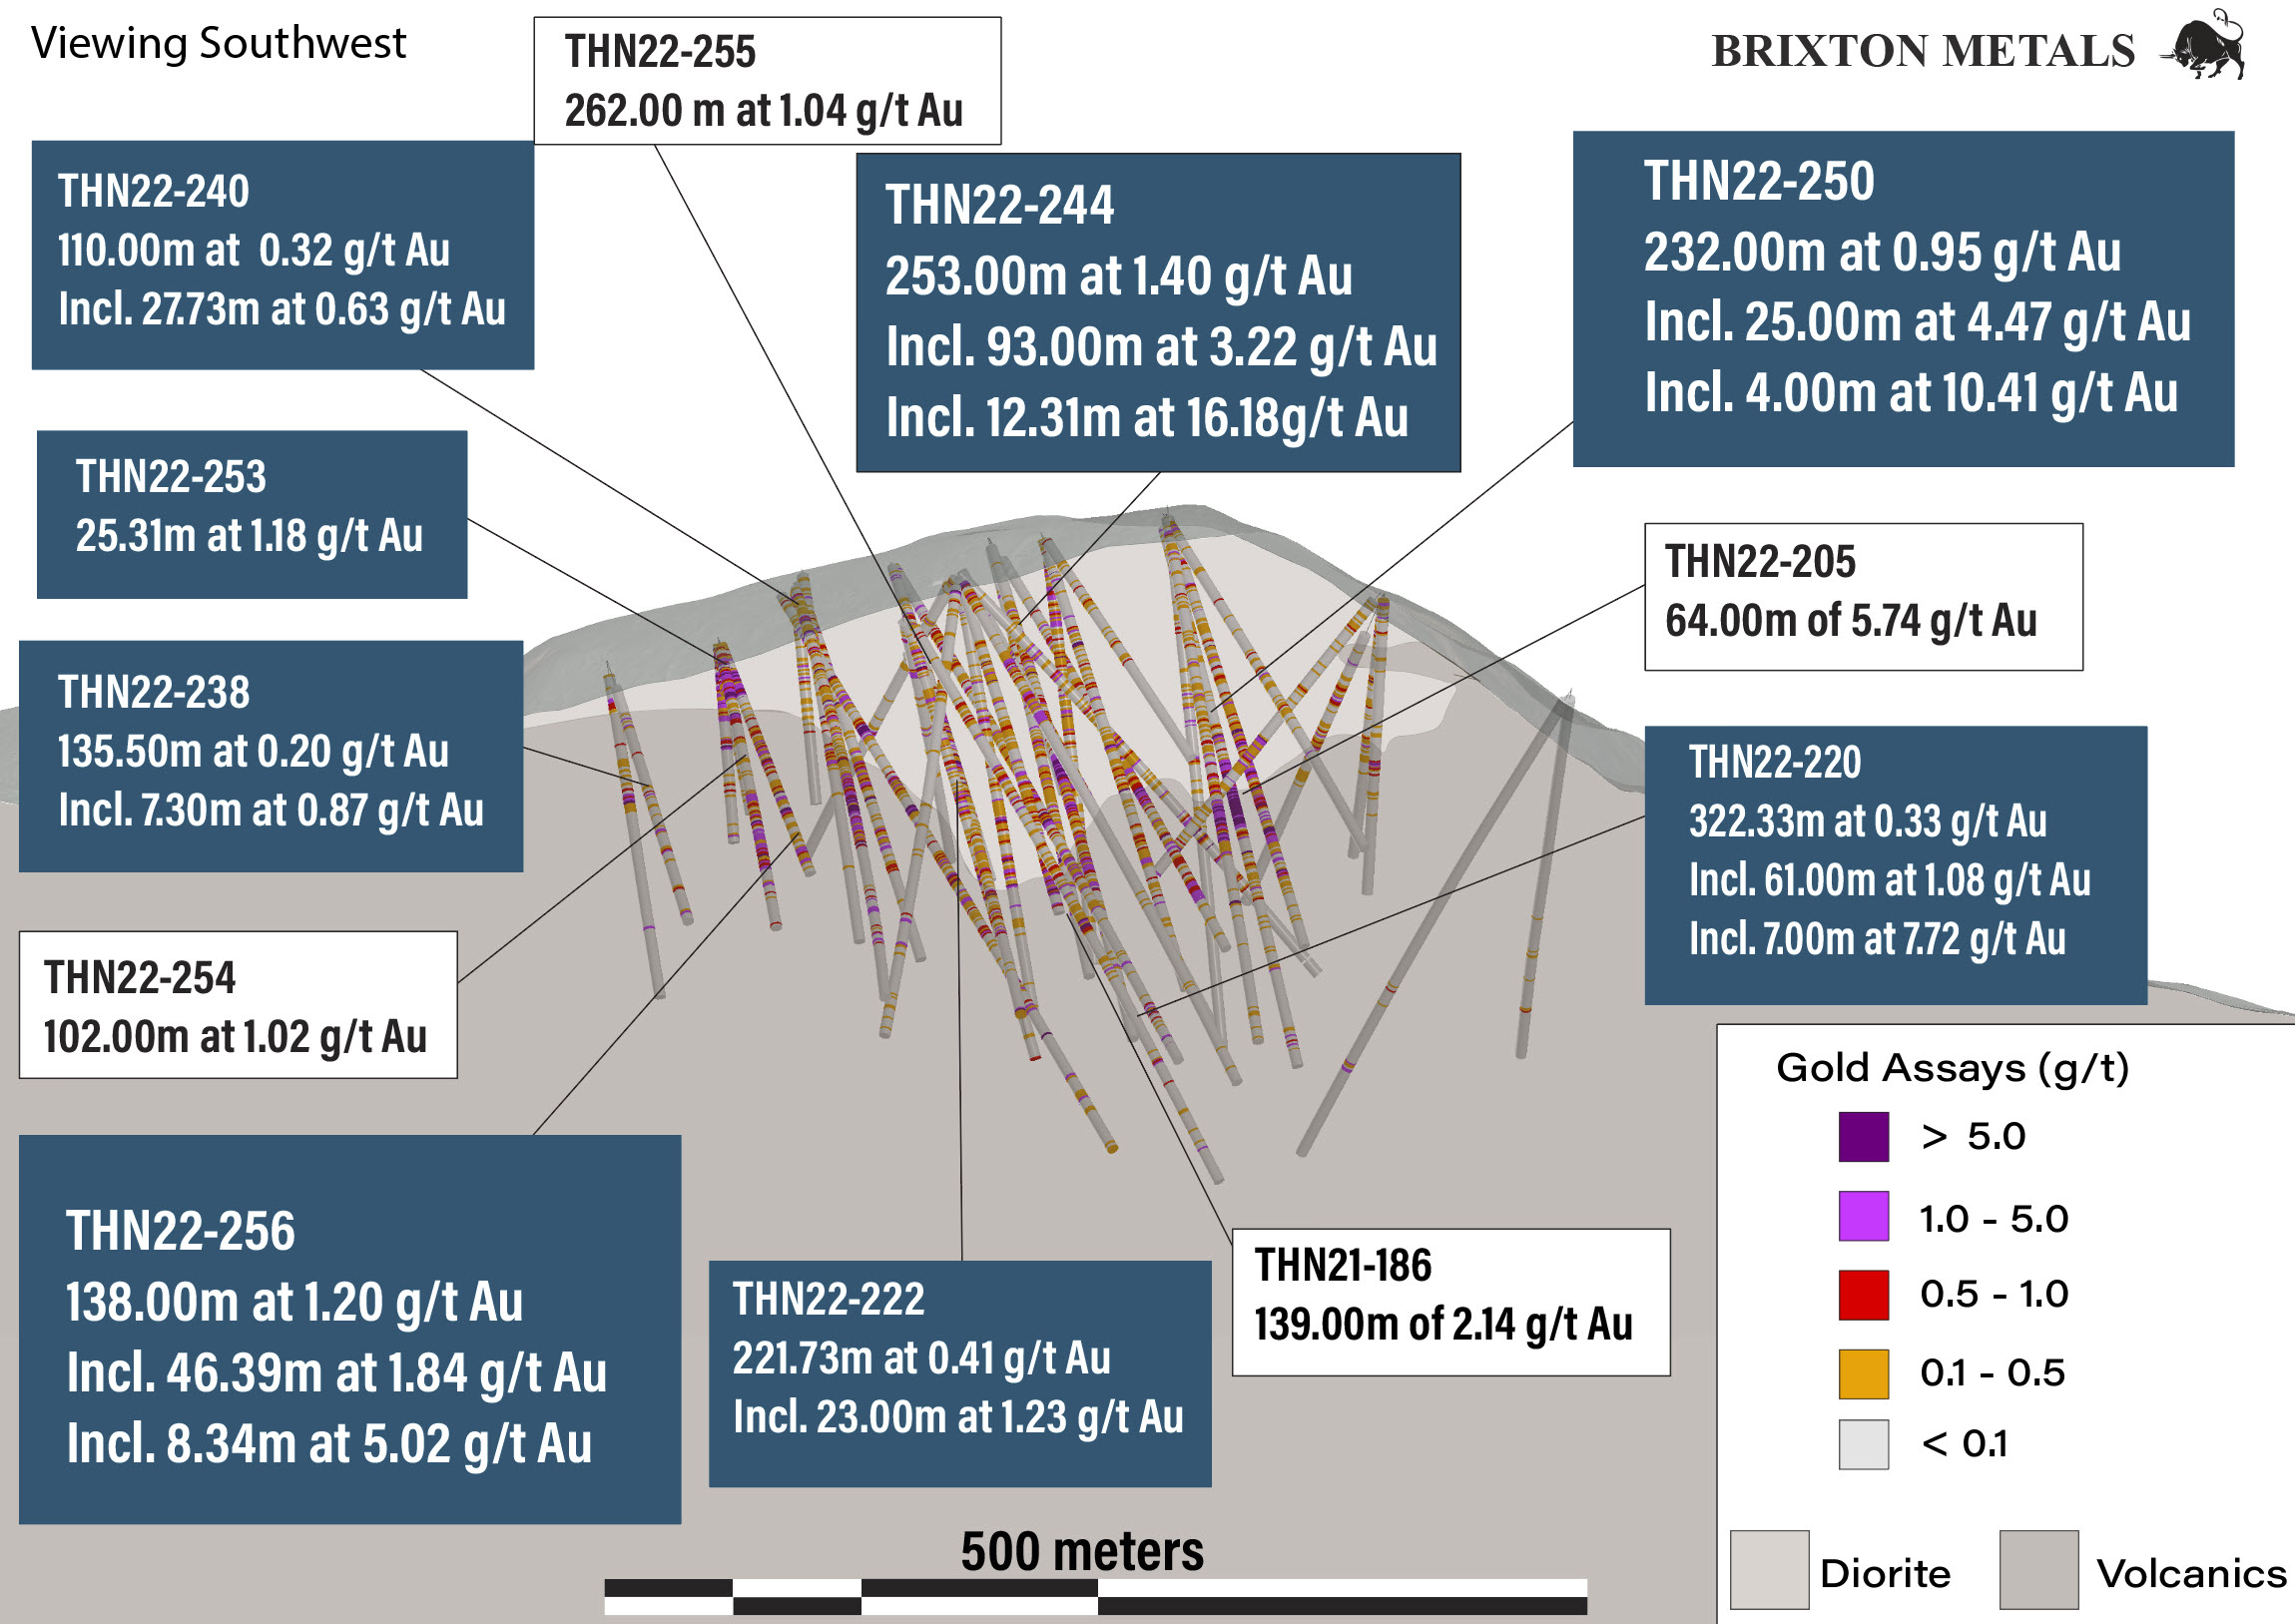
Table 3. Drill Collar and Hole Information of Current News Release.
| Thorn Drill Holes: This Release | ||||||||
| Hole ID | Easting | Northing | Elevation (m) | Azimuth | Dip | Depth (m) | Zone | Status |
| THN22-220 | 630376 | 6485538 | 1286.59 | 348 | -55 | 352.04 | Trapper | Current Release |
| THN22-222 | 630376 | 6485538 | 1286.58 | 348 | -71 | 243.23 | Trapper | Current Release |
| THN22-238 | 630459 | 6485405 | 1260.78 | 24 | -47 | 181.36 | Trapper | Current Release |
| THN22-240 | 630348 | 6485433 | 1307.80 | 26 | -63 | 213.09 | Trapper | Current Release |
| THN22-242 | 630257 | 6485477 | 1323.75 | 1 | -66 | 142.64 | Trapper | Current Release |
| THN22-244 | 630258 | 6485477 | 1323.46 | 24 | -47 | 341.07 | Trapper | Current Release |
| THN22-250 | 630221 | 6485569 | 1335.95 | 28 | -55 | 321.86 | Trapper | Current Release |
| THN22-253 | 630410 | 6485436 | 1275.95 | 25 | -65 | 32.31 | Trapper | Current Release |
| THN22-256 | 630409 | 6485437 | 1275.76 | 8 | -57 | 145.08 | Trapper | Current Release |
| Total Meters | 1972.68 | |||||||
The above references an opinion and is for information purposes only. It is not intended to be investment advice. Seek a licensed professional for investment advice. The author is not an insider or shareholder of any of the companies mentioned above.
Banyan Gold (TSXV:BYN) has announced new analytical results from 37 diamond drill holes collared during the 2022 exploration program for the Aurex Hill and Powerline deposits at its AurMac Property in Yukon.
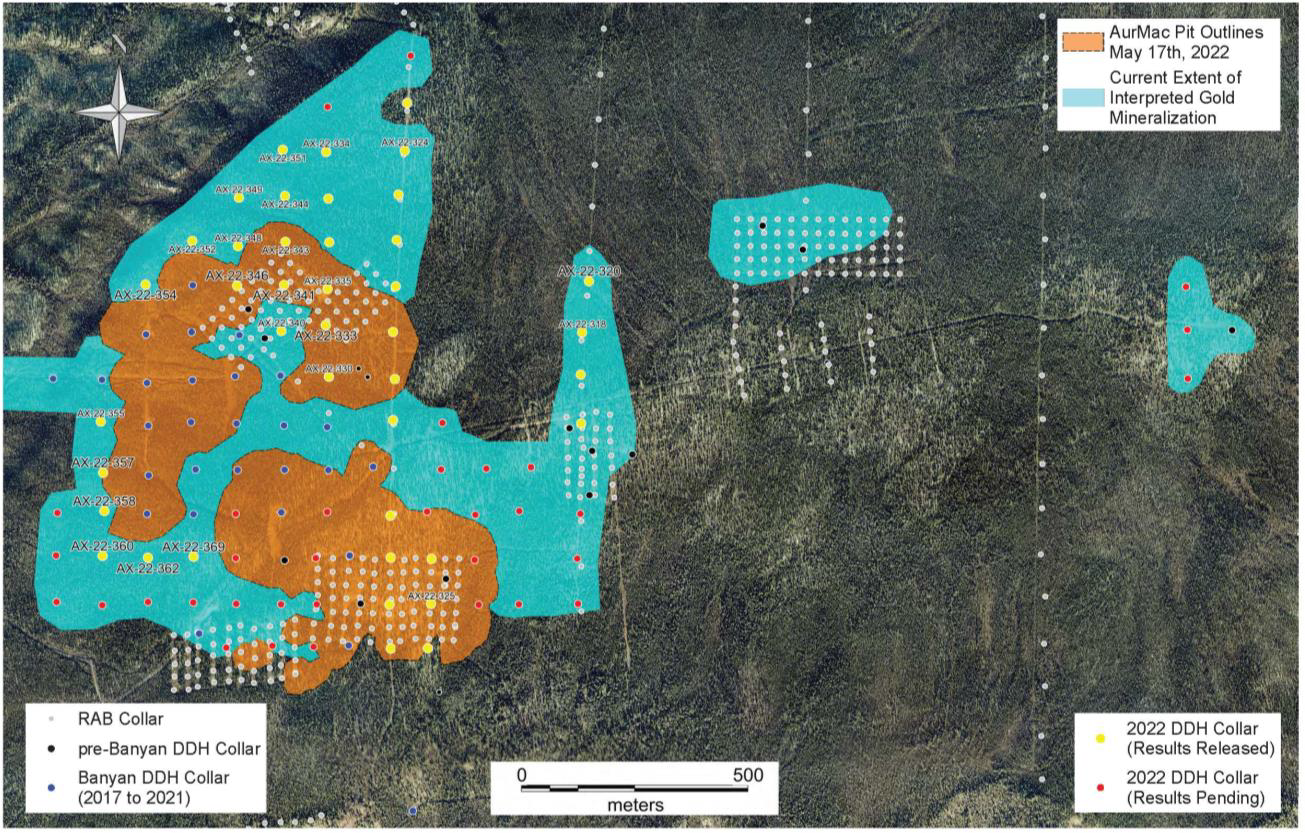
The results are consistent with the previous drill results at both deposits and confirm and expand the areal extent of the interpreted gold mineralization. Power and Aurex hill are contained in a metasedimentary package that consists mainly of schists, quartzites, and limestones from the late Proterozoic to Cambrian Hylan Group. The company chiefly associates the gold mineralization with low-angle quartz-sulfosalt-arsenopyrite veins, which crosscut all lithologies. This has been interpreted to be associated with a large intrusion-related gold system that has been typical of the Selwyn Basin and Tombstone Gold Belt deposits. Banyan has also identified a strong bismuth-gold association at AurMac, which is being used to establish possible new exploration vectors.
Tara Christie, President & CEO of Banyan Gold, commented in a press release: “2022 drill results continue to expand the extent of near/on-surface gold mineralization at the Powerline and Aurex Hill Deposits. Both deposits remain open and these most recent results received have demonstrated two notable mineralized trends in Aurex Hill.”
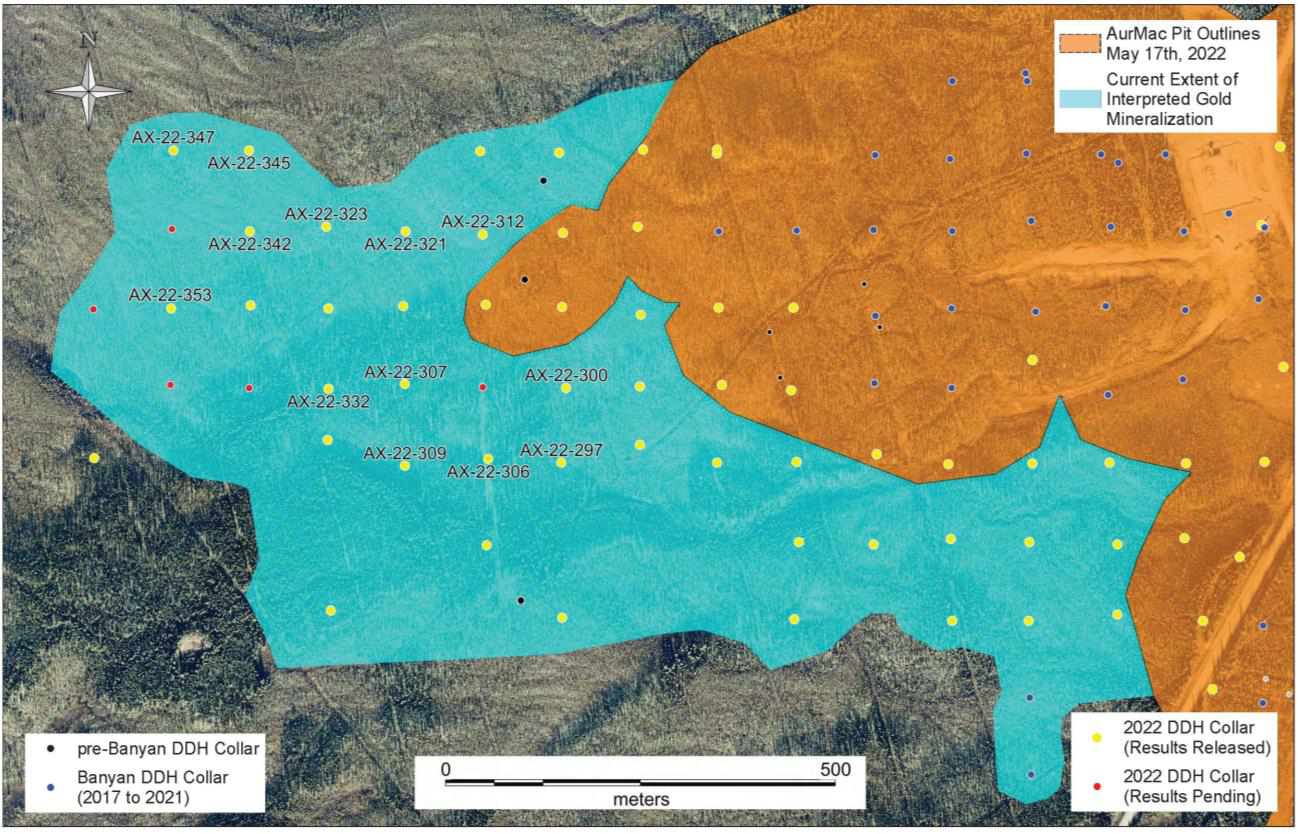
Highlights from the results are as follows:
- 62.2 metres (“m”) of 0.59 g/t Au from 269.5 m in DDH AX-22-306
- 32.5 m of 0.69 g/t Au from 52.4 m in DDH AX-22-312
- 45.4 m of 0.57 g/t Au from 115.8 m in DDH AX-22-321
- 47.7 m of 0.70 g/t Au from 47.7 m in DDH AX-22-323
- 46.9 m of 0.65 g/t Au from 149.4 m in DDH AX-22-333
- 66.5 m of 0.36 g/t Au from surface (4.6 m) in DDH AX-22-341
- 34.8 m of 1.02 g/t Au from 153.9 m in DDH AX-22-346
- 42.9 m of 0.80 g/t Au from 100.0 m in DDH AX-22-354
- 63.8 m of 0.69 g/t Au from 160.2 m in DDH AX-22-357
- 55.5 m of 0.45 g/t Au from 121.9 m in DDH AX-22-358
- 144.8 m of 0.30 g/t Au from 12.2 m in DDH AX-22-360
- 143.2 m of 0.31 g/t Au from 18.3 m in DDH AX-22-362
Table 1: Highlighted Powerline and Aurex Hill Diamond Drill Analytical Results. (Maps, sections and full assay results will be made available on Banyan’s website).
| Hole ID | From (m) | To (m) | Interval (m*) | Au (g/t) |
| AX-22-287 | 117.4 | 239.8 | 122.4 | 0.20 |
| AX-22-297 | 60.8 | 68.6 | 7.8 | 0.36 |
| and | 120.4 | 124.9 | 4.5 | 0.41 |
| and | 154.8 | 191.8 | 37.0 | 0.33 |
| AX-22-300 | 89.4 | 98.5 | 9.1 | 0.23 |
| and | 167.4 | 176.2 | 8.8 | 0.30 |
| and | 200.0 | 202.9 | 2.9 | 0.79 |
| and | 224.8 | 268.6 | 43.8 | 0.30 |
| AX-22-306 | 174.9 | 202.0 | 27.1 | 0.40 |
| and | 269.5 | 331.7 | 62.2 | 0.59 |
| AX-22-307 | 142.5 | 159.5 | 17.0 | 0.24 |
| AX-22-309 | 91.4 | 96.0 | 4.6 | 0.23 |
| and | 106.7 | 154.8 | 48.1 | 0.23 |
| and | 192.3 | 230.1 | 37.8 | 0.24 |
| AX-22-312 | 52.4 | 84.9 | 32.5 | 0.69 |
| and | 166.6 | 193.3 | 26.7 | 0.25 |
| AX-22-318 | 166.1 | 191.3 | 25.2 | 0.50 |
| AX-22-321 | 39.6 | 54.9 | 15.3 | 0.41 |
| and | 115.8 | 161.2 | 45.4 | 0.57 |
| and | 214.3 | 227.1 | 12.8 | 0.22 |
| and | 241.6 | 257.3 | 15.7 | 0.20 |
| AX-22-323 | 46.2 | 53.3 | 7.1 | 0.22 |
| and | 83.8 | 131.5 | 47.7 | 0.70 |
| and | 260.3 | 263.7 | 3.4 | 0.58 |
| AX-22-324 | 48.5 | 73.8 | 25.3 | 0.27 |
| and | 180.1 | 195.1 | 15.0 | 0.23 |
| AX-22-325 | 8.5 | 29.4 | 20.9 | 0.27 |
| and | 43.3 | 52.1 | 8.8 | 0.56 |
| AX-22-330 | 84.9 | 94.1 | 9.2 | 0.43 |
| and | 177.7 | 185.9 | 8.2 | 0.27 |
| and | 198.1 | 211.8 | 13.7 | 0.33 |
| AX-22-332 | 40.0 | 49.0 | 9.0 | 0.45 |
| and | 142.5 | 150.8 | 8.3 | 0.64 |
| and | 202.6 | 220.4 | 17.8 | 0.32 |
| and | 263.7 | 332.2 | 68.5 | 0.24 |
| AX-22-333 | 54.0 | 90.9 | 36.9 | 0.36 |
| and | 121.9 | 135.0 | 13.1 | 0.38 |
| and | 149.4 | 196.3 | 46.9 | 0.65 |
| AX-22-334 | 20.7 | 24.6 | 3.9 | 0.57 |
| and | 146.3 | 152.4 | 6.1 | 0.26 |
| and | 167.9 | 172.9 | 5.0 | 0.39 |
| AX-22-335 | 9.5 | 44.2 | 34.7 | 0.27 |
| and | 55.5 | 61.5 | 6.0 | 0.33 |
| and | 74.5 | 80.8 | 6.3 | 0.22 |
| AX-22-340 | 39.6 | 54.9 | 15.3 | 0.37 |
| and | 67.1 | 95.3 | 28.2 | 0.31 |
| and | 102.8 | 137.2 | 34.4 | 0.33 |
| and | 149.4 | 180.7 | 31.3 | 0.27 |
| AX-22-341 | 4.6 | 71.1 | 66.5 | 0.36 |
| AX-22-342 | 96.0 | 122.5 | 26.5 | 0.44 |
| and | 240.8 | 254.4 | 13.6 | 0.77 |
| AX-22-343 | 1.5 | 25.9 | 24.4 | 0.42 |
| and | 35.1 | 65.6 | 30.5 | 0.37 |
| and | 99.0 | 146.3 | 47.3 | 0.31 |
| and | 185.9 | 197.5 | 11.6 | 0.40 |
| AX-22-344 | 9.1 | 36.6 | 27.5 | 0.23 |
| AX-22-345 | 93.9 | 101.8 | 7.9 | 0.32 |
| and | 150.8 | 165.0 | 14.2 | 0.87 |
| AX-22-346 | 4.3 | 18.9 | 14.6 | 0.38 |
| and | 41.1 | 55.7 | 14.6 | 0.79 |
| and | 153.9 | 188.7 | 34.8 | 1.02 |
| AX-22-347 | 156.3 | 190.5 | 34.2 | 0.35 |
| AX-22-348 | 18.1 | 49.0 | 30.9 | 0.58 |
| and | 71.7 | 80.4 | 8.7 | 0.88 |
| and | 172.2 | 185.9 | 13.7 | 0.43 |
| AX-22-349 | 100.6 | 120.1 | 19.5 | 0.26 |
| AX-22-351 | 175.7 | 200.4 | 24.7 | 0.22 |
| AX-22-352 | 14.9 | 44.2 | 29.3 | 0.31 |
| and | 71.3 | 82.4 | 11.0 | 0.25 |
| and | 123.9 | 185.2 | 61.3 | 0.24 |
| AX-22-353 | 187.4 | 220.8 | 33.4 | 0.20 |
| and | 245.4 | 297.2 | 51.8 | 0.20 |
| AX-22-354 | 4.6 | 36.6 | 32.0 | 0.22 |
| and | 100.0 | 142.9 | 42.9 | 0.80 |
| AX-22-355 | 12.1 | 59.4 | 47.3 | 0.27 |
| and | 152.5 | 158.5 | 6.0 | 0.39 |
| and | 185.5 | 217.9 | 32.4 | 0.23 |
| AX-22-357 | 0.5 | 7.6 | 7.1 | 0.24 |
| and | 15.3 | 29.0 | 13.7 | 0.20 |
| and | 50.3 | 88.4 | 38.1 | 0.20 |
| and | 160.2 | 224.0 | 63.8 | 0.69 |
| AX-22-358 | 4.6 | 48.0 | 43.4 | 0.26 |
| and | 121.9 | 177.4 | 55.5 | 0.45 |
| and | 192.0 | 208.2 | 16.2 | 0.42 |
| AX-22-360 | 12.2 | 157.0 | 144.8 | 0.29 |
| AX-22-362 | 18.3 | 161.5 | 143.2 | 0.31 |
| AX-22-369 | 3.1 | 132.1 | 129.0 | 0.24 |
*True widths are estimated to be approximately 90% of drilled intervals.
Table 2: Drill Collar Location for Released Results
| Collar ID | East NAD83_Z8 | North NAD83_Z8 | Elev. (m) | Azimuth | Dip (°) | Depth (m) |
| AX-22-287 | 466396 | 7083706 | 729 | 003 | -60 | 271.3 |
| AX-22-297 | 466099 | 7082802 | 734 | 001 | -60 | 296.7 |
| AX-22-300 | 466105 | 7082898 | 733 | 004 | -62 | 307.9 |
| AX-22-306 | 466005 | 7082807 | 730 | 360 | -58 | 350.5 |
| AX-22-307 | 465898 | 7082903 | 726 | 007 | -56 | 256.0 |
| AX-22-309 | 465898 | 7082798 | 725 | 008 | -60 | 277.4 |
| AX-22-312 | 465998 | 7083095 | 722 | 357 | -62 | 283.5 |
| AX-22-318 | 469662 | 7082500 | 995 | 355 | -58 | 210.3 |
| AX-22-321 | 465899 | 7083099 | 717 | 355 | -53 | 299.2 |
| AX-22-323 | 465797 | 7083105 | 708 | 008 | -62 | 289.6 |
| AX-22-324 | 469270 | 7082902 | 972 | 357 | -64 | 205.7 |
| AX-22-325 | 469328 | 7081900 | 972 | 358 | -59 | 233.2 |
| AX-22-330 | 469102 | 7082402 | 984 | 004 | -62 | 236.5 |
| AX-22-332 | 465800 | 7082897 | 723 | 001 | -57 | 345.9 |
| AX-22-333 | 469095 | 7082516 | 980 | 359 | -63 | 200.6 |
| AX-22-334 | 469096 | 7082899 | 956 | 358 | -60 | 193.9 |
| AX-22-335 | 469099 | 7082596 | 976 | 001 | -61 | 209.1 |
| AX-22-340 | 468997 | 7082503 | 972 | 004 | -60 | 192.0 |
| AX-22-341 | 469003 | 7082605 | 965 | 357 | -59 | 222.5 |
| AX-22-342 | 465699 | 7083099 | 702 | 353 | -58 | 286.5 |
| AX-22-343 | 469006 | 7082701 | 957 | 002 | -60 | 207.3 |
| AX-22-344 | 469005 | 7082802 | 953 | 356 | -60 | 213.4 |
| AX-22-345 | 465698 | 7083203 | 700 | 003 | -59 | 248.4 |
| AX-22-346 | 468899 | 7082603 | 954 | 347 | -59 | 210.3 |
| AX-22-347 | 465601 | 7083203 | 697 | 011 | -58 | 309.4 |
| AX-22-348 | 468901 | 7082691 | 947 | 006 | -60 | 202.7 |
| AX-22-349 | 468903 | 7082798 | 941 | 003 | -61 | 202.7 |
| AX-22-351 | 469000 | 7082904 | 946 | 044 | -59 | 243.8 |
| AX-22-352 | 468800 | 7082703 | 933 | 348 | -61 | 201.2 |
| AX-22-353 | 465597 | 7083001 | 703 | 359 | -57 | 303.3 |
| AX-22-354 | 468697 | 7082606 | 926 | 006 | -60 | 201.2 |
| AX-22-355 | 468598 | 7082303 | 929 | 359 | -60 | 220.1 |
| AX-22-357 | 468603 | 7082190 | 934 | 002 | -61 | 227.1 |
| AX-22-358 | 468606 | 7082105 | 941 | 003 | -58 | 253.2 |
| AX-22-360 | 468602 | 7082006 | 944 | 005 | -60 | 222.5 |
| AX-22-362 | 468702 | 7082002 | 955 | 358 | -61 | 233.2 |
| AX-22-369 | 468803 | 7082004 | 965 | 359 | -62 | 235.3 |
Table 3: Pit-Constrained Inferred Mineral Resources – AurMac Property
|
Deposit |
Gold Cut-Off g/t |
Tonnage M Tonnes |
Average Gold Grade
g/t |
Gold Content k oz |
| Airstrip | 0.2 | 42.5 | 0.64 | 874 |
| Powerline | 0.2 | 152.0 | 0.59 | 2,898 |
| Aurex Hill | 0.3 | 12.5 | 0.53 | 215 |
| Total Combined | 0.2 – 0.3 | 207.0 | 0.60 | 3,990 |
The above references an opinion and is for information purposes only. It is not intended to be investment advice. Seek a licensed professional for investment advice. The author is not an insider or shareholder of any of the companies mentioned above.
Peru’s Ministry of Energy and Mines recently reported that mining investments increased through November 202 to an accumulated total of $4.6 billion, up from $4.4 billion in 2021. The country has focused on attracting more investments in the sector, which has been a major contributor to its economy.
The final month of the period, November, was the best performing month with the most inflows with a total of $467 million, 7.8% higher than October’s total of $434 million, as reported in the Mining Statistical Bulletin.
The biggest investor was Anglo American (LON:AAL) which invested $964 million in the country in 2022, bringing its share of mining investments to 20.9% for the year. The company’s share is the biggest in the sector in Peru. The runner-up was Minera Antamina, owned by BHP, Glencore, Mitsubishi, and Teck Resources, investing $394 million. Third place was given to Minera Yanacocha, owned by Newmont (NYSE:NEM), with $332 million invested, and fourth was Southern Peru, with $238 million invested. Those four mining companies comprised 42.7% of all mining investment in Peru for 2022.
The report is important to the country, which has long been dependent on the mining sector, as it demonstrates that the sector is still a major driver of Peru’s economy and that investors are confident in the industry’s future. The investments also represent a major source of revenue for the government, with the majority of investments going toward infrastructure and operations.
Exploration activities were also a highlight in 2022, where $383 million in investments flowed from January to November 2022, up 33.9% from the previous year. For existing projects and accumulated mine development investments, the total reaches $778 million, up 49.5% from the same period the previous year.
Peru’s copper production is second only to Chile, which is the world’s largest producer of the metal. The country is also a major producer of silver, zinc, lead, and gold. The mining sector has been a major contributor to the Peruvian economy for many years, and the recent investments show that this trend will likely continue for years to come. The further boost to the industry from the ongoing green energy transition accelerated by factors including the pandemic, rising demand for metals and minerals, and technological advancements should further support the sector’s growth in the years to come.
The above references an opinion and is for information purposes only. It is not intended to be investment advice. Seek a licensed professional for investment advice. The author is not an insider or shareholder of any of the companies mentioned above.
Magna Mining (TSXV:NICU) has announced it has received new assays from its November 2022 drill program a the Crean Hill Mine in Sudbury. Drillhole MCR-22-005 followed up on high grade nickel mineralization intersected in the 101 Footwall Zone from drillhole MCR-22-003. The resulting assay was as follows: Hole MCR-22-005 intersected mineralization grading 4.0 % Ni, 0.7 % Cu, 0.7 g/t Pt+Pd+Au over 31.1 metres, including two massive sulphide intervals grading 6.5 % Ni, 1.0 % Cu, 0.5 g/t Pt+Pd+Au over 5.0 metres, and 5.7 % Ni, 0.7 % Cu, 0.8 g/t Pt+Pd+Au over 16.1 metres.
The company plans to resume scheduled drilling at Crean hill or the 2023 drill program on January 9th. Magna has budgeted 15,000 metres of drilling for the year.
2022 saw four drillholes target the 101 FW zone below historical mining. Previously, Lonmin Canada did not focus on this area because it isn’t considered a low-sulphide, high PGE system. The zone consists of disseminated to locally massive sulphide, which is hosted in a footwall breccia system that extends southwest into the footwall of the intermediate Zone.
The footwall orebodies in Sudbury are normally hosted within breccia systems, and are known to be elevated in Ni, Cu, and PGE mineralization.
David King, Senior Vice President for Magna, commented in a press release: “We are excited to announce additional assay results from our current drilling at Crean Hill. These assay results from drillhole MCR-22-005 are the second set of assay results received from the 101 FW Zone, and they demonstrate the continuity of high grade, massive sulphide mineralization within the footwall breccia zone. The 2022 drilling has improved our geological understanding of the 101 FW Zone mineralization and these results will enable Magna to effectively explore along strike and down-dip of the known mineralization, as well as explore for additional, similar mineralization within the footwall environment at Crean Hill. Additional assay results are expected over the coming weeks and will be announced shortly thereafter.”
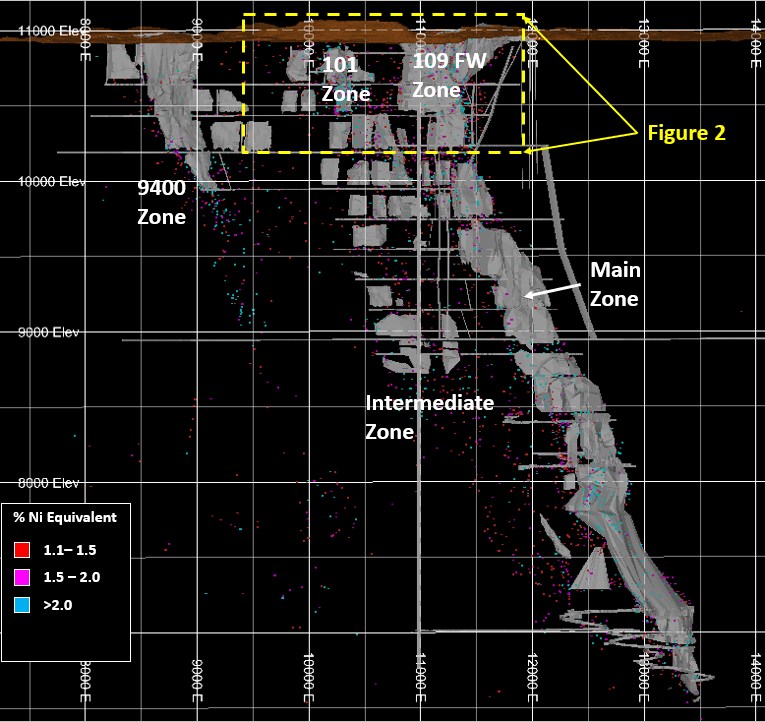
Highlights from the results are as follows:
- Drillhole MCR-22-005, intersected 4.0 % Ni, 0.7 % Cu, 0.7 g/t Pt+Pd+Au over 31.1 metres, Including 6.5 % Ni, 1.0 % Cu, 0.5 g/t Pt+Pd+Au over 5.0 metres, and 5.7 % Ni, 0.7 % Cu, 0.8 g/t Pt+Pd+Au over 16.1 metres in the 101 FW Zone
- The 101 FW Zone represents an area of high grade, massive sulphide mineralization over significant widths that was un-mined by prior operators
- 101 FW Zone mineralization is hosted within an approximately 70 metre wide footwall breccia package which remains open for exploration down-dip and along strike
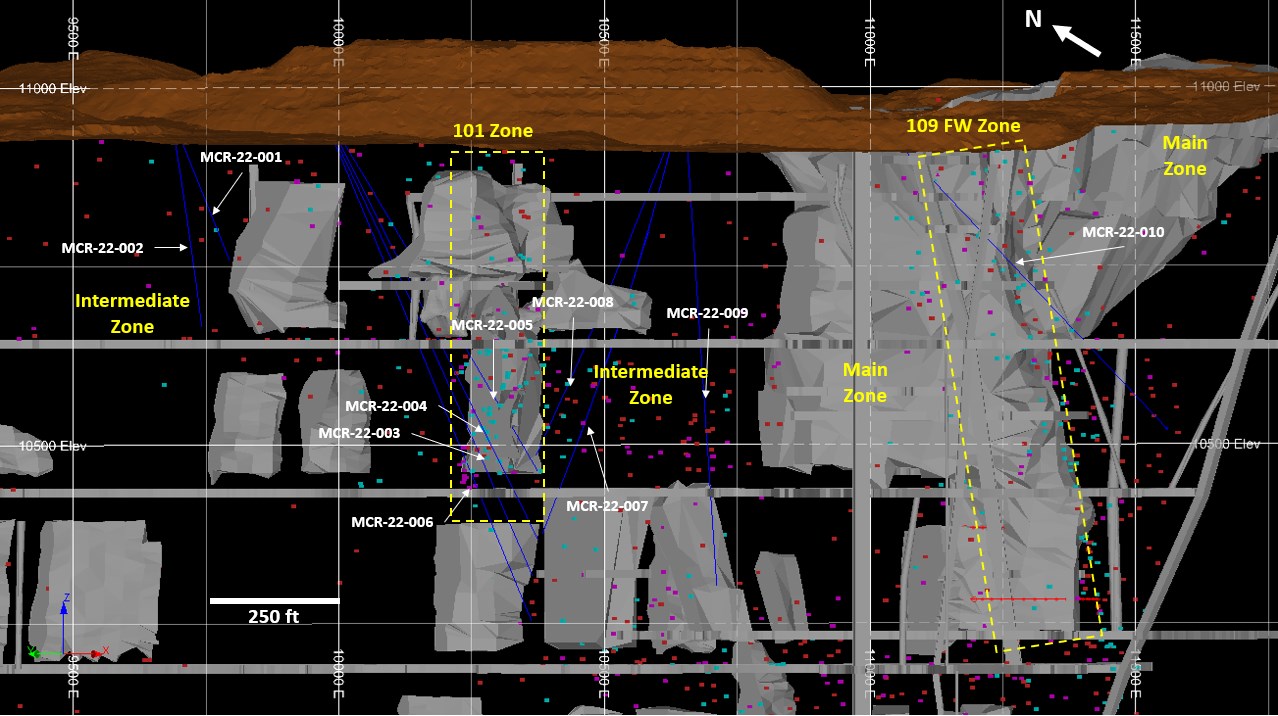
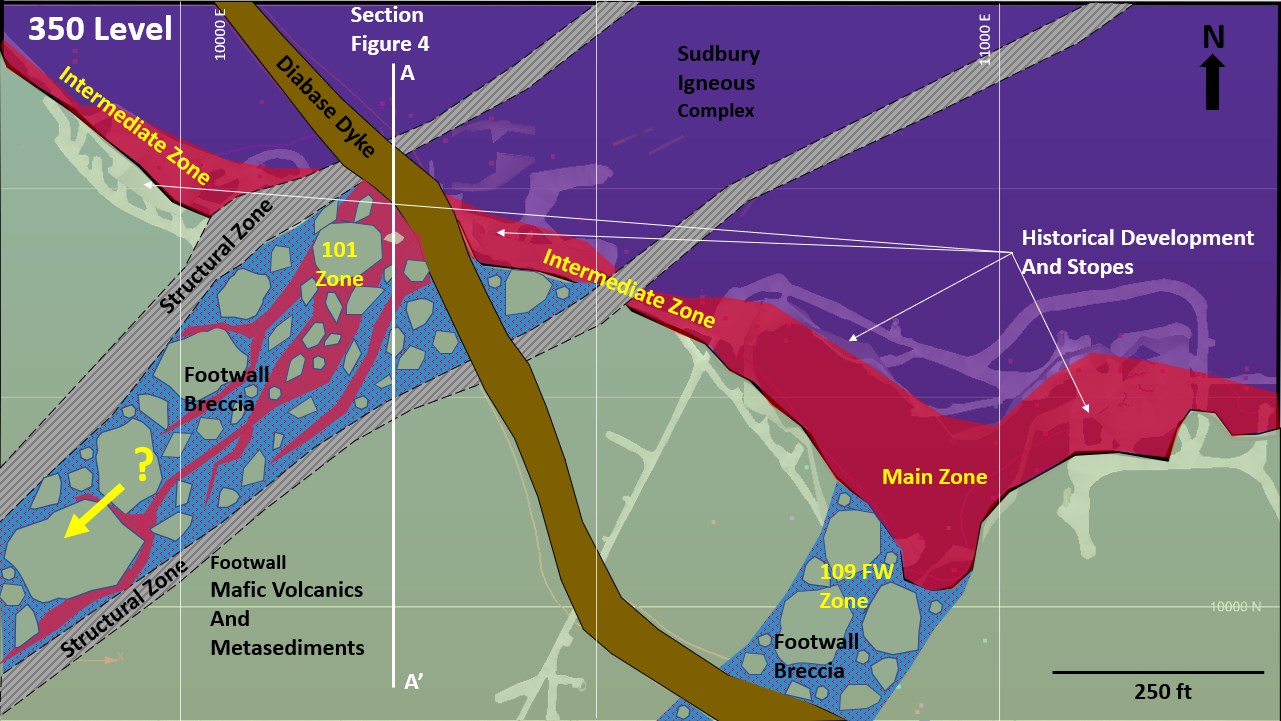
Table 1 Summary of Assay Results Received to Date
| Drillhole | Zone | From (m) | To
(m) |
Length (m) | Ni % | Cu % | Co % | Pt g/t | Pd g/t | Au g/t | TPM g/t | NiEq | |
| MCR-22-001 | Assays Pending | ||||||||||||
| MCR-22-002 | Assays Pending | ||||||||||||
| MCR-22-003 | Intermediate | 75.83 | 105.06 | 30.23 | 0.68 | 0.43 | 0.02 | 0.36 | 0.13 | 0.11 | 0.60 | 0.99 | |
| including | 95.55 | 105.06 | 10.51 | 1.11 | 0.61 | 0.03 | 0.86 | 0.31 | 0.20 | 1.37 | 1.63 | ||
| 101 FW | 154.53 | 157.20 | 2.67 | 2.57 | 0.40 | 0.07 | 0.94 | 0.67 | 0.17 | 1.78 | 3.15 | ||
| 101 FW | 168.12 | 178.90 | 10.78 | 3.75 | 1.74 | 0.09 | 0.20 | 0.22 | 0.04 | 0.46 | 4.69 | ||
| including | 168.12 | 169.78 | 1.66 | 3.24 | 8.30 | 0.08 | 0.07 | 0.24 | 0.21 | 0.52 | 7.65 | ||
| and | 173.10 | 178.90 | 5.80 | 6.01 | 0.33 | 0.14 | 0.35 | 0.33 | 0.02 | 0.70 | 6.47 | ||
| 101 FW | 192.27 | 195.47 | 3.20 | 0.80 | 3.76 | 0.06 | 1.00 | 2.52 | 0.67 | 4.19 | 3.31 | ||
| 101 FW | 215.75 | 222.00 | 6.25 | 0.19 | 0.71 | 0.01 | 0.02 | 0.02 | 0.08 | 0.13 | 0.52 | ||
| MCR-22-004 | Assays Pending | ||||||||||||
| MCR-22-005 | Intermediate | 75.27 | 98.09 | 22.82 | 0.50 | 0.48 | 0.01 | 0.18 | 0.06 | 0.07 | 0.31 | 0.77 | |
| including | 88.17 | 92.23 | 4.06 | 0.88 | 0.97 | 0.02 | 0.45 | 0.16 | 0.14 | 0.75 | 1.44 | ||
| 101 FW | 138.39 | 169.44 | 31.06 | 4.04 | 0.69 | 0.10 | 0.36 | 0.25 | 0.07 | 0.67 | 4.58 | ||
| including | 138.39 | 143.42 | 5.03 | 6.50 | 1.03 | 0.17 | 0.28 | 0.17 | 0.03 | 0.48 | 7.26 | ||
| and | 153.08 | 169.44 | 16.07 | 5.68 | 0.69 | 0.13 | 0.43 | 0.29 | 0.05 | 0.78 | 6.29 | ||
| 101 FW | 178.70 | 184.74 | 6.04 | 0.19 | 0.22 | 0.01 | 0.38 | 0.54 | 0.42 | 1.33 | 0.55 | ||
| MCR-22-006 | Assays Pending | ||||||||||||
| MCR-22-007 | Assays Pending | ||||||||||||
| MCR-22-008 | Assays Pending | ||||||||||||
| MCR-22-009 | Assays Pending | ||||||||||||
| MCR-22-010 | Assays Pending | ||||||||||||
All lengths are downhole length. True width is estimated at 60-80% of downhole length.
NiEq % = ( (Ni% x 2204 x Ni Price $/lb) + (Cu% x Cu Recovery% x 2204 x Cu Price $/lb) + (Co% x Co Recovery % x 2204 x Co Price $/lb) + (Pt gpt x Pt Recovery % / 31.1035 x Pt $/oz) +(dt gpt x Pd Recovery % / 31.1035 x Pd $/oz) + (Au gpt x Au Recovery % / 31.1035 x Au $/oz))/2204 x Ni $/lb
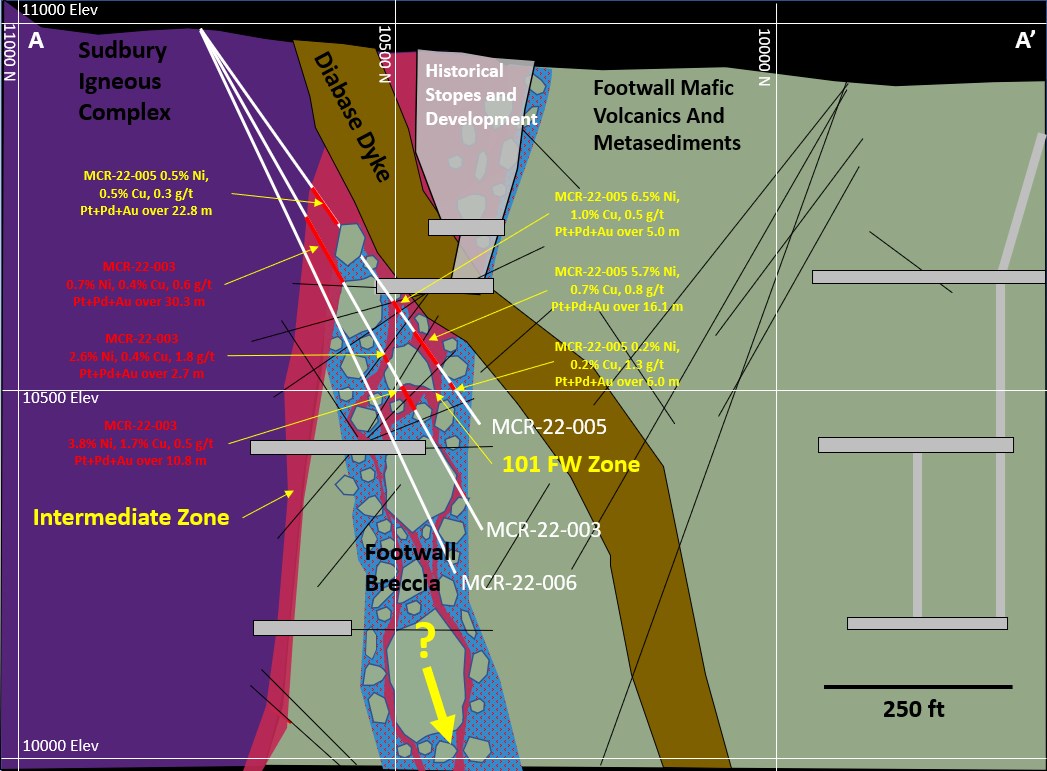
The above references an opinion and is for information purposes only. It is not intended to be investment advice. Seek a licensed professional for investment advice. The author is not an insider or shareholder of any of the companies mentioned above.
Brixton Metals (TSXV:BBB) has reported new drilling results from the Camp Creek Cu-Au-Ag-Mo Porphyry Target at the Thorn Project in British Columbia, Canada. A total of 18,122 metres were drilled for the 2022 season. This includes 6,484m at the Camp Creek Porphyry Target and an additional 9,119m at the Trapper Target. The company collected 1,157 soil samples and 520 rocks from the Metla and Trapper Targets, along with the East Copper Target and the Val Copper Target. Brixton also completed a total of 1,229 line kilometres of airborne magnetics and radiometric work flown over the Trapper, Metla, and Val, and East Targets. This drill program began in May 2022 and was completed by late October 2022.
Chairman & CEO, Gary Thompson, commented in a press release: “We are excited to see the potential scale emerge of the Camp Creek Porphyry Target. The distance between these two reported holes is 420m. Drill hole 213 was collared 235m west-southwest of the collars for 201-184 and drill hole 231 was collared 280m north from the collars for 201-184. Mr. Thompson further stated that, “we have yet to process all of the 2022 data and convene our maiden technical committee meeting with BHP but one of the 2023 exploration objectives may be to identify the high-grade copper core of the Camp Creek porphyry and to test the limits of the mineralized system.”
Vice President of Exploration, Christina Anstey, commented in a press release: “We are encouraged by the large-scale potential of the Camp Creek Copper Porphyry Target. We collected a molybdenite sample for age dating (pending) from hole 150 which was drilled to 829m in the Oban Diatreme Breccia (see Figure 2 and 3) where considerable mineralized (chalcopyrite-molybdenite) porphyry clasts were identified. This is important for a few reasons: one is that hole 150 is collared 1000m east from hole 213 and we have yet to make the connection genetically or physically from the mineralized diatreme to the porphyry; and two, if we can make this link through age dating then it really opens up the eastern potential of the target which has not been drilled at depth.”
Highlights from the results are as follows:
- Hole THN22-213 yielded 709.00m of 0.34% CuEq from 534m depth
- Including 484.00m of 0.41% CuEq
- Including 362.00m of 0.44% CuEq
- Including 102.15m of 0.61% CuEq
- Including 64.15m of 0.65% CuEq
- Hole THN22-231 yielded 778.08m of 0.30% CuEq from 519.5m depth
- Including 531.00m of 0.36% CuEq
- Including 102.00m of 0.46% CuEq
- This copper dominant porphyry mineralization remains wide open, including at depth.
The Camp Creek acid-sulphate alteration and geochemical expression further to the east-northeast is covered and unconformably overlain by a late rhyolite flowdome complex, which suggests the porphyry mineralization may continue under this volcanic cover (see Figure 1) providing for a 1km by 2km porphyry target area.
Table 1. Select Intervals of Mineralization in Holes THN22-213 and THN22-231.
| Hole ID | From (m) | To (m) | Interval (m) | Cu (%) | Au (g/t) | Ag (g/t) | Mo (ppm) | CuEq (%)* |
| THN22-213 | 64.50 | 75.00 | 10.50 | 0.91 | 0.51 | 24.40 | 1.70 | 1.36 |
| 534.00 | 1243.00 | 709.00 | 0.24 | 0.06 | 2.42 | 140.54 | 0.34 | |
| including | 697.00 | 1181.00 | 484.00 | 0.29 | 0.07 | 2.99 | 158.95 | 0.41 |
| including | 790.00 | 1152.00 | 362.00 | 0.33 | 0.08 | 2.63 | 159.78 | 0.44 |
| including | 938.00 | 1040.15 | 102.15 | 0.48 | 0.09 | 3.82 | 174.32 | 0.61 |
| including | 976.00 | 1040.15 | 64.15 | 0.53 | 0.09 | 4.03 | 176.40 | 0.65 |
| THN22-231 | 519.50 | 1297.58 | 778.08 | 0.20 | 0.05 | 2.03 | 145.90 | 0.30 |
| including | 766.00 | 1297.00 | 531.00 | 0.25 | 0.06 | 2.41 | 178.31 | 0.36 |
| including | 1045.00 | 1147.00 | 102.00 | 0.34 | 0.07 | 2.92 | 192.37 | 0.46 |
All assay values are uncut weighted averages. Intervals reflect drilled intercept lengths as further drilling is required to determine the true widths of the mineralization.
*Copper Equivalent (CuEq) is calculated based on US$ 4.30/lb Cu, US$ 1820.00/oz Au, US$ 23.80/oz Ag, US $18.00/lb Mo. These prices represent the approximate one year trailing moving averages of metal prices and calculations assume 95% recovery. The formula is: CuEq % = (Cu % + (0.617248 * Au g/t) + (0.008072 * Ag g/t) + (0.000419 * Mo ppm)) * 0.95.
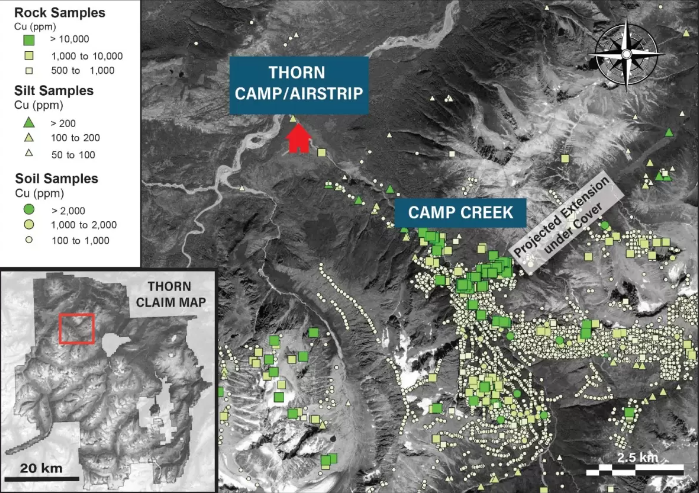
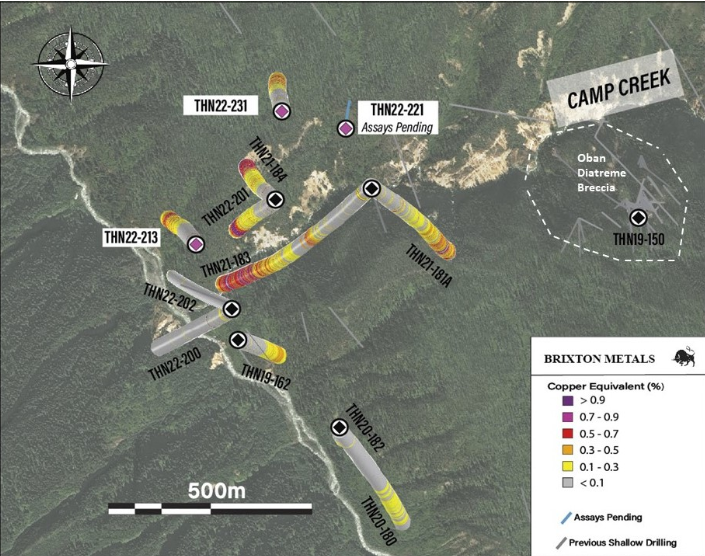
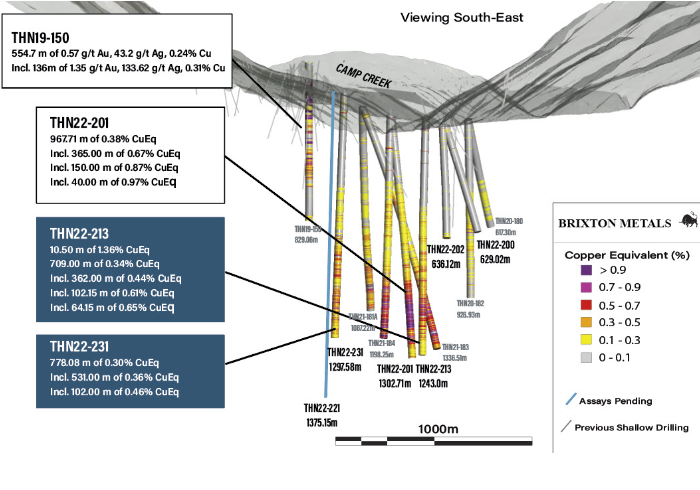
Discussion
The objective of holes THN22-213 and THN22-231 was to test the mineralization west and north of THN22-201 (967.71m of 0.39% CuEq) and THN21-184 (821.25m of 0.38% CuEq). The distance between hole 213 and 231 is 420m. Both holes reached depths over 1200m, intersecting hundreds of meters of mineralized Porphyry X and hornfels sediments and ended in mineralization. Calc-alkalic porphyry Cu-Au-Ag-Mo mineralization at the Camp Creek target is disseminated and within quartz-anhydrite veins and as chalcopyrite-molybdenite veins-veinlets. Mineralization is hosted within Porphyry X, a crowded plagioclase porphyry of Cretaceous age (85.1Ma +- 1.1Ma), characterized by well-defined stacked biotite, a feature typical of mineral-related porphyry phases. Mineralization is also hosted in hornfels of Triassic Stuhini Group sedimentary rocks, which are intruded by the porphyry phases.
Hole THN22-213 was collared 235 meters west-southwest of THN22-201 and THN21-184, reaching a total depth of 1243m. Porphyry X was first intersected at 608 meters and short alternating sequences of mineralized hornfels sediments and Porphyry X continued to the end depth. Overall, the mineralized zone was 709.00 meters grading 0.34% CuEq (0.24% Cu, 0.06 g/t Au, 2.4 g/t Ag and 141 ppm Mo), including a 64.15m enriched zone of 0.65% CuEq (0.53% Cu, 0.09 g/t Au, 4.0 g/t Ag, 176 ppm Mo) centered on a 30 meters interval of chlorite-sericite altered Porphyry X.
Hole THN22-231 was collared 280 meters north of THN22-201 and THN21-184, reaching a total depth of 1297.58m. The mineralized zone was from 519.50 meters depth with grades of 0.30% CuEq (0.20% Cu, 0.05 g/t Au, 2.0 g/t Ag, 146 ppm Mo) over 778.08m, including 0.46% CuEq (0.34% Cu, 0.07 g/t Au, 2.9 g/t Ag, 192 ppm Mo) over 102.00m.
Assays are pending for hole THN22-221, which is located 275m northeast from collar THN22-201. Hole THN22-221 was drilled to a depth of 1375.13m, which ended in visibly similar porphyry mineralization hosted in Porphyry X and hornfels sediments. (See Figure 2 for collar locations).
The cross-section view to the Southeast in Figure 3 represents all of the deep holes in the Camp Creek to date. It may appear that some of the holes are overlapping, but note the scale of the slice is greater than one kilometer and the reader should see Figure 2 for the considerable distances from each of the drill collars.
The above references an opinion and is for information purposes only. It is not intended to be investment advice. Seek a licensed professional for investment advice. The author is not an insider or shareholder of any of the companies mentioned above.
Musk Metals (CSE:MUSK) has completed its drill campaign at the Elon Lithium project in Quebec, where four drill holes were completed. Drilling focused on the southwest part of the Elon project.
After the summer trail opening program, six drill pads were prepared from the west. The four drill holes were completed from those drill pads. Each of the four reached a depth of 150m, even though overburden in the area was quite thick. Thickness ranged from 20 to 39m of sand that originated from glacial sedimentary deposits. The program’s goal was to investigate soil anomalies after the initial trenching program; the trenching program was not successful because of the bedrock depth.
The first three holes went through roughly 20m of overburden before reaching that bedrock, and the final hole went through approximately 39m of overburden. This complicated the drill campaign for the company for all four holes (DDH-EL22-001, DDH- EL22-003 and DDH- EL22-004, DDH- EL22-007).
Musk Metals has already conducted logging for the core and has made some lithological observations. The lithology for the three western holes is a blend of andesite and intermediate tuff, compared to the interpreted intrusion (DDH- EL22-007) located to the east which has been found to be granodioritic. Sulphides including pyrite, pyrhotite, sphalerite and chalcopyrite have been observed in nearly all of the lithologies and all core length, even though the company has not observed any pegmatites in the core.
Other highlights from the campaign are as follows:
Table 1: Completed Drill Holes Details.
| DDH ID | Overburden (m) | Length (m) | Main Lithology | Target |
| DDH-EL22-001 | 21 | 150 | Andesite. Disseminated sulphides. | Hole 1 is located on the T4 Trench, it aim at the NNW-SSE low magnetic corridor emanating from the interpreted intrusion |
| DDH- EL22-004 | 21 | 150 | Andesite and Intermediate tuff. Disseminated sulphides. | Hole 2 is located on the T10 Trench, it aims at a low magnetic corridor emanating from the interpreted intrusion that has been interpreted as a possible dyke swarm |
| DDH- EL22-003 | 19 | 150 | Andesite and Intermediate tuff. Disseminated sulphides. | Hole 3 aims at a low magnetic corridor emanating from the interpreted intrusion that has been interpreted as a possible dyke swarm |
| DDH- EL22-007 | 39 | 150 | Granodiorite. Disseminated sulphides. | Hole 4 aims at the same low magnetic corridor than Hole 3, emanating from the interpreted intrusion that has been interpreted as a possible dyke swarm |
In total, including blanks and core sample, 118 samples were sent to ALS laboratory in Val-d’Or. 114 has been sent for a full-metallic package (protocols Au-ICP21 for gold and ME-MS61L for base metals), 12 were sent for whole rock analysis (protocol ME-XRF26) and 6 were sent for lithium analysis (protocols LI-ICP82, ME-MS81 and ME-4ACED81).
The next step will consist of a review of the assay results and reinterpretation of the geological maps to better define future steps forward. The Property is adjacent to significant lithium mineralization and the previous soil surveys indicate potential for lithium mineralization being hosted on the Property. The data we obtained from this initial campaign will help us to better define a potential source of anomaly. Recently, Lithium Amérique du Nord (LAN), a division of Sayona Mining Ltd acquired the mineral rights to the Vallée Lithium property, owned by Jourdan Resources Inc., located just south and adjacent to the Elon Property.
Figure 1. Drilled Holes.
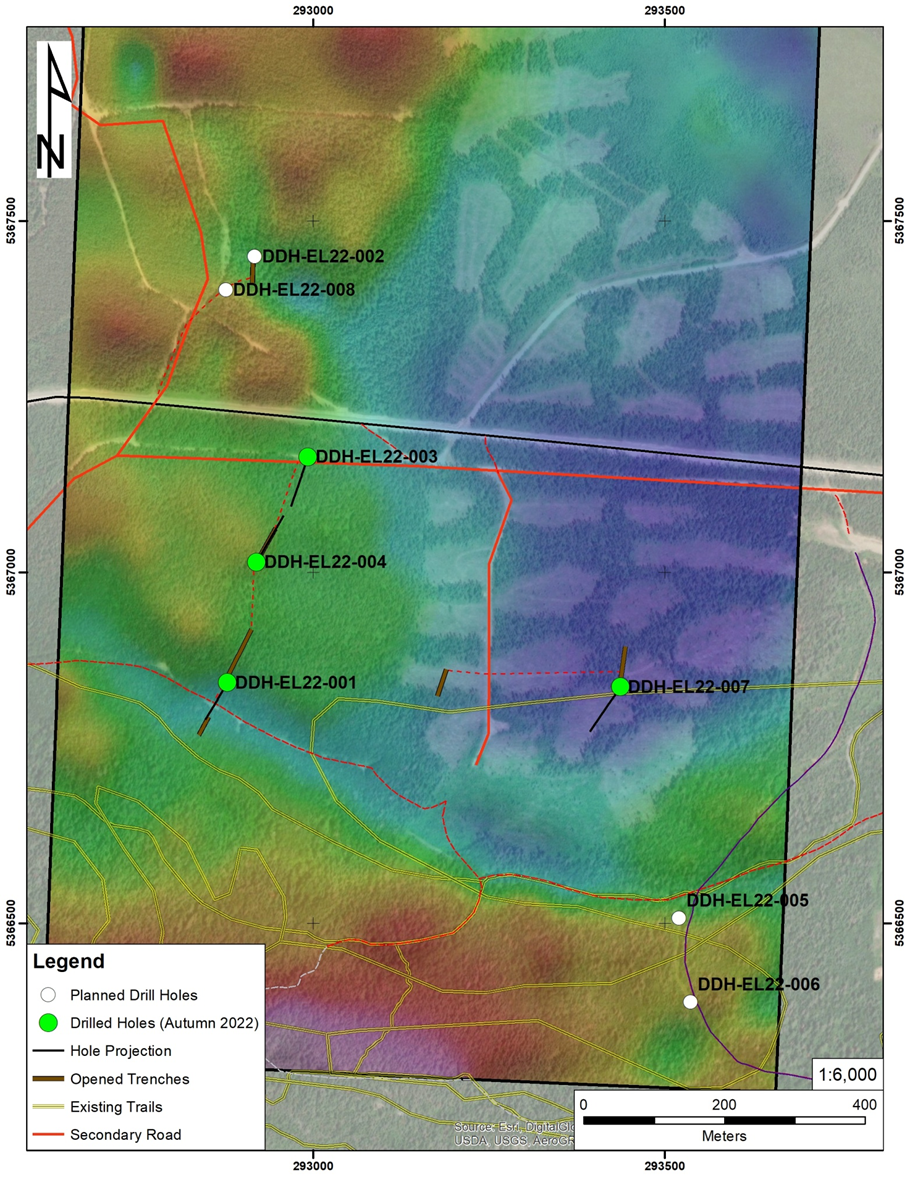
The Property and Adjacent Properties
The Elon Property is strategically located in Abitibi, Qc at approximately 600 meters northeast of North American Lithium Project (recently acquired by Sayona Québec) and formerly known as Mine Québec Lithium. North American Lithium produced over 907,000 tons of material at 1.40% Li2O between 1955 and 1965 (Boily et al, 1989). In a June 28th, 2022 news release, Sayona Québec formally approved the restart of North American Lithium operation for lithium extraction and spodumene concentrate production. In September 2022 Sayona announced a 200 million dollars contract for the mining operations (September 27th, 2022 press release).
Jourdan Resources is investigating a pegmatite field approximately 1000m SE of the Elon Property, has reported lithium content of up to 2.38% Li2O over 0.90m and 1.33% Li2O over 5.25m in pegmatites (June 9th, 2022 and July 7th, 2022 news release) and plans to conduct a second drilling campaign (September 15th, 2022 press release). Sayona announced in November the acquisition of the Vallée Lithium property (November 14th, 2022 press release).
This might indicate that the general area is fertile in lithium and that the regional environment is more favorable for additional lithium discovery in the future.
The above references an opinion and is for information purposes only. It is not intended to be investment advice. Seek a licensed professional for investment advice. The author is not an insider or shareholder of any of the companies mentioned above.
If you would like to receive our free newsletter via email, simply enter your email address below & click subscribe.
 Follow us on Twitter
 Become our facebook fan
CONNECT WITH US
Tweets
Tweet with hash tag #miningfeeds or @miningfeeds and your tweets will be displayed across this site.
MOST ACTIVE MINING STOCKS
Daily Gainers
 CMC Metals Ltd. CMC Metals Ltd. |
CMB.V | +900.00% |
 Eden Energy Ltd Eden Energy Ltd |
EDE.AX | +200.00% |
| GoviEx Uranium Inc. |
GXU.V | +42.86% |
| Eagle Nickel Ltd. |
ENL.AX | +41.67% |
| Citigold Corp. Limited |
CTO.AX | +33.33% |
| Mount Burgess Mining NL |
MTB.AX | +33.33% |
| Exalt Resources Limited |
ERD.AX | +31.94% |
| Casa Minerals Inc. |
CASA.V | +30.00% |
| Cariboo Rose Resources Ltd |
CRB.V | +28.57% |
| Belmont Resources Inc. |
BEA.V | +28.57% |


