
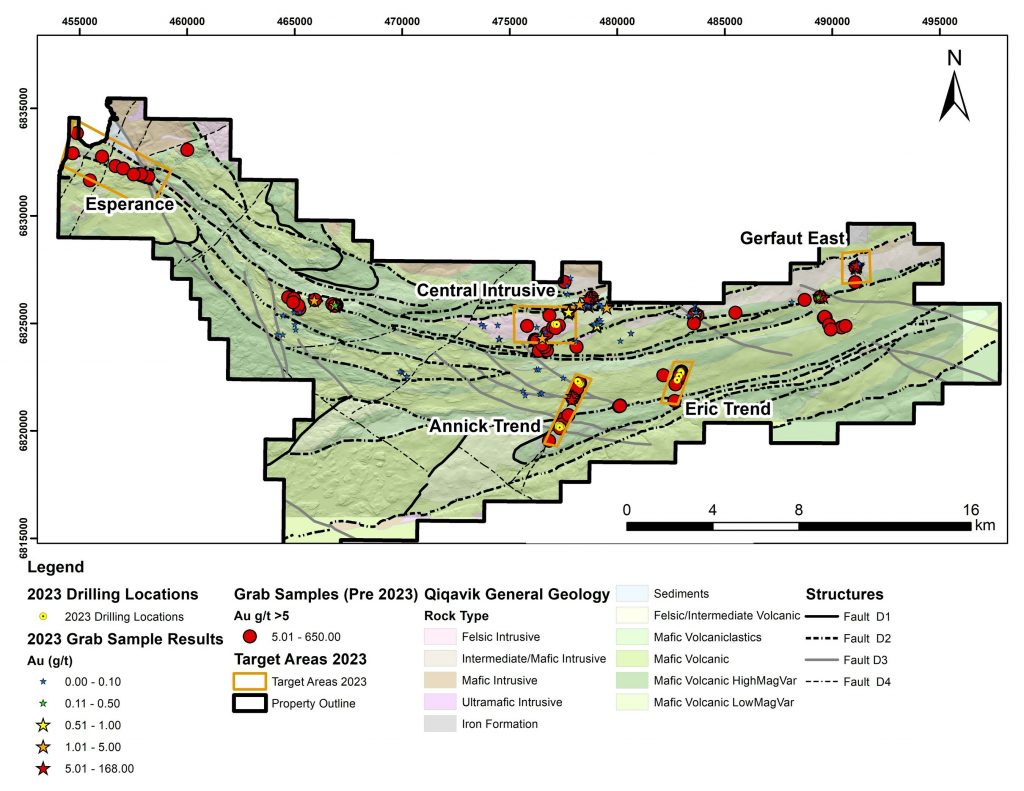
Orford Mining (TSXV:ORM) has reported the discovery of two new quartz vein gold systems—named Gerfaut East and Central Intrusive—and a new copper showing in the Esperance area on its Qiqavik gold property. The drilling was conducted in several project areas across the property, which spans more than 40 kilometres and hosts high-grade gold occurrences at surface. In 2023, Orford’s work focused on drilling, geophysics, and prospecting in various areas of the belt, including Gerfaut East, Central, Annick, and Eric. A total of 34 Rotary Air Blast (RAB) holes were drilled, covering 2,435 meters, and 32 line-km of ground Induced Polarization (IP) surveys were completed. The company is awaiting results for the majority of the 2,620 samples taken from drilling and the 233 surface samples collected.
David Christie, President and CEO of Orford commented in a press release: “The expertise of our field crews has been rewarded with new gold and copper discoveries on the vastly underexplored Qiqavik property. The ability of our team to continue to make new discoveries illustrates the high prospectivity of the Qiqavik property and how underexplored it remains.”
The Gerfaut East vein system has been located within a north-northeast trending structure that can be traced for over 400 meters along strike. It is characterized by sulfide-bearing quartz veins, which outcrop up to 15 meters in length and contain minerals such as galena, chalcopyrite, and pyrite. These veins are found in a felsic intrusive corridor known to host gold-bearing quartz. Six RAB drill holes were completed in this area, intersecting quartz veins within the top 50 meters of drilling. Assay results for these drill holes are still pending, though some surface grab samples have shown gold concentrations up to 32.3 grams per tonne (g/t Au).
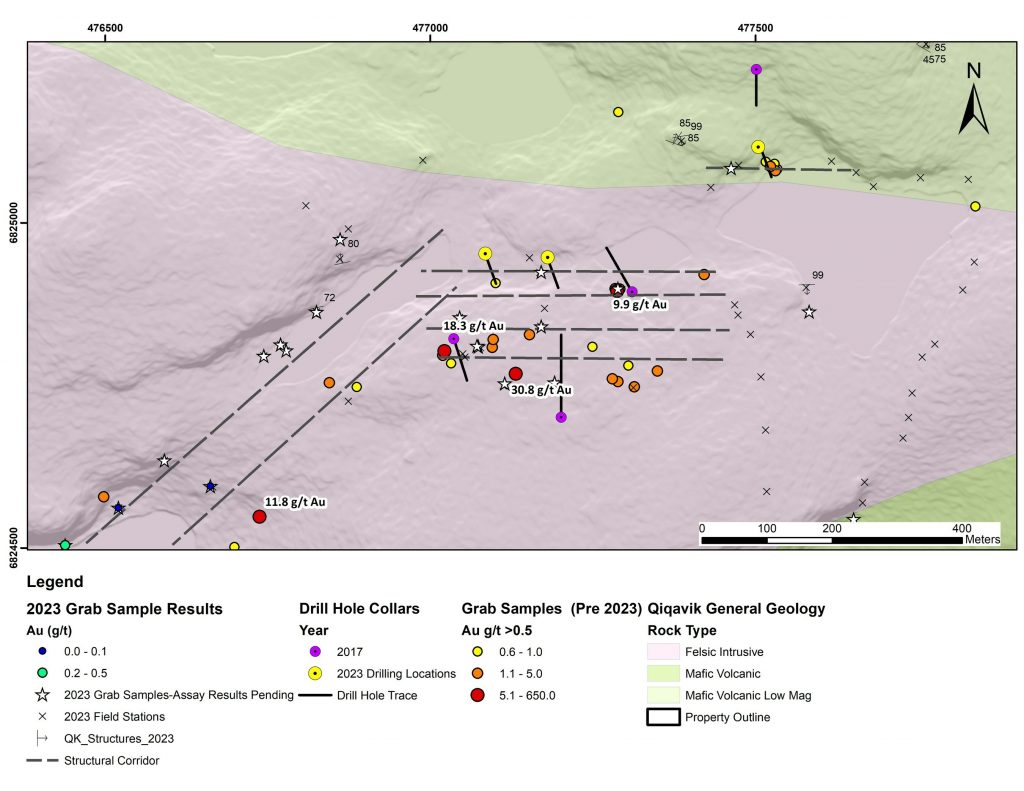
The Central Intrusive vein system is defined by a series of subparallel east-west shears with ankerite alteration and sulfide veins up to 2 cm in width. These veins contain minerals like galena, pyrite, and arsenopyrite, and are found in local granodiorite boulders. Three holes were drilled in the Central Intrusive area that intersected altered granodiorite containing minor sulfides. Assay results from grab samples and drilling in this area are also pending. Previously collected grab samples in nearby areas have reported gold concentrations up to 30.8 g/t Au.
In the Esperance area, a new zone of semi-massive sulphide with up to 5% chalcopyrite has been identified, hosted in a sheared basalt. This new mineralization outcrops discontinuously over an area of 10 meters by 25 meters and lies 200 meters south of the main Esperance trend. Four channel samples were collected from the exposed mineralization, which covers a width of 5.0 meters. Airborne EM conductors suggest the mineralization may extend eastward for an additional 250 meters. Assay results for these channel samples are pending.
Note that grab samples are selective by nature and values reported may not be representative of mineralized zones. Source: Orford Mining Corporation
Highlights from the results are as follows:
- New gold-bearing quartz vein system discovered at Gerfaut East. Surface grab samples returned up to 32.3 g/t Au (Figure 2). Drill results pending.
- New style of sulphide rich vein mineralization discovered in the Central Intrusive Zone. Surface and drill assays pending.
- New mineralized zone discovered south of the Esperance Gold-Copper trend. Channel sample assay results pending.
The above references an opinion and is for information purposes only. It is not intended to be investment advice. Seek a licensed professional for investment advice. The author is not an insider or shareholder of any of the companies mentioned above.
AbraSilver Resource (TSXV:ABRA) has reported assay results from the final set of drill holes conducted under its Phase III drilling program at its wholly-owned Diablillos property in Salta Province, Argentina. The drill holes were aimed at defining the scope of the JAC zone ahead of an upcoming Mineral Resource Estimate (MRE) and Pre-Feasibility Study (PFS) on the Diablillos project.
John Miniotis, President and CEO, commented in a press release: “We are delighted with the results of our highly successful Phase III drill campaign. The consistent, high-grade drill results encountered throughout the past year clearly demonstrate the large-scale silver-gold mineralization potential at our flagship Diablillos project. The completion of this drill campaign represents another major milestone for the Company and reinforces our belief in the tremendous value remaining to be unlocked through our ongoing exploration efforts.”
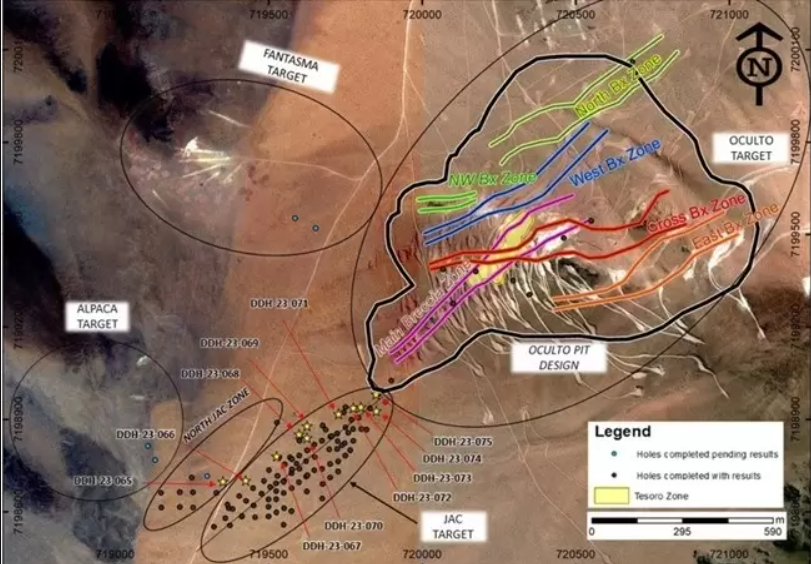
Drill holes DDH 23-066 to DDH 23-070 focused on mapping the northwestern edge of the JAC zone and consistently showed signs of silver mineralization. Notably, hole DDH 23-070 recorded a 64-meter intercept grading 148 grams per tonne (g/t) of silver at a downhole depth of 41 meters. Further, holes DDH 23-071 to DDH 23-075 were drilled to explore the northeastern edge of the JAC zone and also revealed varying degrees of silver mineralization. For example, hole DDH 23-075 intersected 15 meters grading 93 g/t of silver and 0.78 g/t of gold.
Results from DDH 23-075 were particularly noteworthy for demonstrating a continuity of mineralization between the JAC zone and the main Oculto deposit, raising the possibility of a combined open pit. Meanwhile, hole DDH 23-065 was drilled into the recently discovered JAC North zone, situated beyond the northwestern edge of the JAC zone. The hole intersected a near-surface layer of 7 meters grading 119 g/t of silver and 0.14 g/t of gold at a downhole depth of 85 meters, confirming a new significant mineralized structure in the area.
As of August 9, 2023, the JAC North zone is located over 900 meters beyond the conceptual open pit’s current Mineral Resource estimate at Oculto and approximately 100 meters northwest of the high-grade JAC zone. The company has also drilled six additional holes at nearby exploration targets, including JAC North, Alpaca, and Fantasma, the results of which are expected in the coming weeks.
With the successful completion of the Phase III drill program, AbraSilver Resource Corp. is now preparing an updated MRE, scheduled for completion within the next few weeks. This will be followed by a PFS on the Diablillos project. The Phase III program aimed to systematically grid drill the silver-dominant mineralization at the JAC zone, delineate its margins, and conduct necessary geotechnical drilling for a conceptual open-pit design. It also included reconnaissance drilling at other targets on the Diablillos land package.
The next phase of drilling, Phase IV, will prioritize targets based on a range of factors including distance from the probable porphyry progenitor beneath Oculto and structural trends revealed in magnetic surveys. Targets in the area west of Oculto such as JAC North, Alpaca, and Fantasma are currently the focus, with additional targets being developed to the east and north of Oculto.
Highlights from the results are as follows:
Table 1 – Summary of Diablillos Drill Results
| Drill Hole | Area | From (m) | To (m) | Type | Interval (m) | Ag g/t | Au g/t | ||||||
| DDH-23-065 | JAC North | 85.0 | 92.0 | Oxides | 7.0 | 119.1 | 0.14 | ||||||
| DDH-23-065 | 101.0 | 117.0 | Oxides | 16.0 | 63.4 | – | |||||||
| DDH-23-066 | JAC | 140.0 | 159.0 | Oxides | 19.0 | 68.9 | – | ||||||
| DDH-23-068 | JAC | 36.0 | 44.0 | Oxides | 8.0 | 175.4 | – | ||||||
| DDH-23-068 | 62.0 | 91.0 | Oxides | 29.0 | 69.6 | – | |||||||
| DDH-23-069 | JAC | 39.0 | 42.0 | Oxides | 3.0 | 58.4 | – | ||||||
| DDH-23-069 | 46.0 | 50.0 | Oxides | 4.0 | 36.4 | – | |||||||
| DDH-23-070 | JAC | 41.0 | 105.0 | Oxides | 64.0 | 148.1 | – | ||||||
| DDH-23-070 | 135.0 | 139.0 | Oxides | 4.0 | 93.9 | – | |||||||
| DDH-23-071 | JAC | 72.0 | 76.0 | Oxides | 4.0 | 32.2 | – | ||||||
| DDH-23-072 | JAC | 90.0 | 96.0 | Oxides | 6.0 | 56.1 | – | ||||||
| DDH-23-073 | JAC | 94.5 | 112.0 | Oxides | 17.5 | 68.9 | 0.20 | ||||||
| DDH-23-074 | JAC | 163.0 | 165.0 | Oxides | 2.0 | 41.8 | – | ||||||
| DDH-23-075 | JAC/Oculto | 94.5 | 102.0 | Oxides | 7.5 | 42.7 | – | ||||||
| DDH-23-075 | 112.0 | 127.0 | Oxides | 15.0 | 93.1 | 0.78 | |||||||
Note: All results in this news release are rounded. Assays are uncut and undiluted. Widths are drilled widths, not true widths. True widths are estimated to be approximately 80% of the interval widths for oxides.
Table 2 – Highlights of Phase III High-Grade Intercepts at JAC Zone
| Drill Hole | From (m) | To (m) | Type | Interval (m) | Ag (g/t) | Au (g/t) | AgEq1 (g/t) |
| DDH-22-019 | 89.0 | 176.0 | Oxides | 87.0 | 346.0 | 0.15 | 356.5 |
| DDH-22-044 | 121.0 | 179.0 | Oxides | 58.0 | 208.8 | 0.20 | 222.8 |
| DDH-22-046 | 123.0 | 165.5 | Oxides | 42.5 | 400.5 | 0.11 | 408.2 |
| DDH-22-052 | 139.5 | 164.5 | Oxides | 25.0 | 754.4 | 0.12 | 764.2 |
| DDH-22-053 | 140.5 | 168.5 | Oxides | 28.0 | 266.4 | 0.64 | 318.8 |
| DDH-22-056 | 110.0 | 167.5 | Oxides | 57.5 | 141.4 | 0.27 | 163.5 |
| DDH-22-057 | 144.0 | 164.0 | Oxides | 20.0 | 498.6 | 0.10 | 506.8 |
| DDH-22-060 | 114.0 | 154.0 | Oxides | 40.0 | 203.4 | – | 203.4 |
| DDH-22-061 | 65.0 | 168.0 | Oxides | 103.0 | 138.7 | – | 138.7 |
| DDH-22-062 | 119.0 | 170.0 | Oxides | 51.0 | 169.4 | 0.20 | 185.8 |
| DDH-22-063 | 56.0 | 85.0 | Oxides | 33.0 | 143.4 | – | 143.4 |
| DDH-22-063 | 135.0 | 169.0 | Oxides | 34.0 | 118.6 | 0.08 | 125.2 |
| DDH-22-067 | 143.0 | 179.0 | Oxides | 36.0 | 463.3 | 0.71 | 521.5 |
| DDH-22-067 | 179.0 | 206.0 | Sulphides | 27.0 | 745.0 | 1.54 | 871.1 |
| DDH-22-075 | 151.0 | 167.0 | Oxides | 16.0 | 604.4 | 0.82 | 671.5 |
| DDH-22-076 | 147.0 | 169.0 | Oxides | 22.0 | 476.8 | 0.20 | 493.2 |
| DDH-22-076 | 169.0 | 177.5 | Oxides | 8.5 | 1,952.8 | 6.66 | 2,498.3 |
| DDH-22-077 | 60.0 | 92.0 | Oxides | 32.0 | 121.9 | – | 121.9 |
| DDH-22-078 | 58.0 | 99.0 | Oxides | 41.0 | 103.5 | – | 103.5 |
| DDH-22-079 | 144.0 | 179.0 | Oxides | 35.0 | 199.2 | 0.36 | 228.7 |
| DDH-22-080 | 50.0 | 102.0 | Oxides | 52.0 | 125.1 | – | 125.1 |
| DDH-22-081 | 128.0 | 165.0 | Oxides | 37.0 | 179.3 | – | 179.3 |
| DDH-22-082 | 154.5 | 181.0 | Transition | 26.5 | 311.4 | 0.43 | 346.6 |
| DDH-22-083 | 159.0 | 184.0 | Transition | 25.0 | 773.8 | 0.28 | 796.7 |
| DDH-22-086 | 158.0 | 167.0 | Sulphides | 9.0 | 342.3 | – | 342.3 |
| DDH-23-002 | 148.0 | 165.0 | Transition | 17.0 | 288.6 | 0.14 | 300.1 |
| DDH-23-003 | 155.8 | 161.5 | Sulphides | 5.8 | 502.2 | – | 502.2 |
| DDH-23-004 | 136.0 | 150.0 | Oxides | 14.0 | 3,024.5 | 0.21 | 3,041.7 |
| DDH-23-007 | 115.0 | 119.0 | Oxides | 4.0 | 2,320.0 | – | 2,320.0 |
| DDH-23-009 | 161.0 | 169.5 | Oxides | 8.5 | 479.2 | 0.15 | 491.5 |
| DDH-23-010 | 132.0 | 177.5 | Oxides | 45.5 | 233.4 | – | 233.4 |
| DDH-23-014 | 127.0 | 173.5 | Oxides | 46.5 | 185.0 | 0.50 | 226.0 |
| DDH-23-017 | 92.0 | 104.0 | Oxides | 12.0 | 876.1 | – | 876.1 |
| DDH-23-021 | 161.5 | 193.5 | Oxides | 32.0 | 530.8 | 0.60 | 579.9 |
| DDH-23-024 | 144.0 | 161.0 | Oxides | 17.0 | 828.9 | – | 828.9 |
| DDH-23-025 | 100.0 | 179.0 | Oxides | 79.0 | 237.6 | 0.15 | 249.9 |
| DDH-23-036 | 140.0 | 150.0 | Oxides | 10.0 | 520.0 | 0.04 | 523.3 |
| DDH-23-039 | 105.0 | 124.0 | Oxides | 19.0 | 253.4 | – | 253.4 |
| DDH-23-046 | 157.0 | 160.0 | Oxides | 3.0 | 2,070.0 | 0.27 | 2,092.1 |
| DDH-23-061 | 134.0 | 153.5 | Oxides | 19.5 | 272.8 | – | 272.8 |
| DDH-23-070 | 41.0 | 105.0 | Oxides | 64.0 | 148.1 | – | 148.1 |
Note: All results are rounded. Assays are uncut and undiluted. Widths are drilled widths, not true widths. True widths are estimated to be approximately 80% of the interval widths.
1 AgEq based on 81.9(Ag):1(Au) calculated using long-term prices of US$25.00/oz Ag and US$1,750/oz Au, and 73.5% process recovery for Ag, and 86.0% process recovery for Au as demonstrated in the Company’s PEA in respect of Diablillos dated January 13, 2022, using formula: AgEq g/t = Ag g/t + Au g/t x (Gold Price/Silver Price) x (Gold Recovery/Silver Recovery).
Collar Data
| Hole Number | UTM Coordinates | Elevation | Azimuth | Dip | Depth (m) | |
| DDH 23-065 | E719351 | N7198699 | 4,141 | 0 | -60 | 152 |
| DDH 23-066 | E719425 | N7198702 | 4,147 | 0 | -60 | 182 |
| DDH 23-067 | E719526 | N7198780 | 4,155 | 0 | -60 | 155 |
| DDH 23-068 | E719599 | N7198852 | 4,162 | 0 | -60 | 170 |
| DDH 23-069 | E719625 | N7198879 | 4,164 | 0 | -60 | 152 |
| DDH 23-070 | E719625 | N7198840 | 4,165 | 0 | -60 | 191 |
| DDH 23-071 | E719728 | N7198918 | 4,173 | 0 | -60 | 175 |
| DDH 23-072 | E719250 | N7198710 | 4,135 | 0 | -60 | 173 |
| DDH 23-073 | E719800 | N7198941 | 4,178 | 0 | -60 | 170 |
| DDH 23-074 | E719850 | N7198928 | 4,182 | 0 | -60 | 176 |
| DDH 23-075 | E719849 | N7198982 | 4,182 | 0 | -60 | 179 |
About Diablillos
The 80 km2 Diablillos property is located in the Argentine Puna region – the southern extension of the Altiplano of southern Peru, Bolivia, and northern Chile – and was acquired from SSR Mining Inc. by the Company in 2016. There are several known mineral zones on the Diablillos property, with the Oculto zone being the most advanced with over 120,000 metres drilled to date. Oculto is a high-sulphidation epithermal silver-gold deposit derived from remnant hot springs activity following Tertiarty-age local magmatic and volcanic activity. Comparatively nearby examples of high sulphidation epithermal deposits include: Yanacocha (Peru); El Indio (Chile); Lagunas Nortes/Alto Chicama (Peru) Veladero (Argentina); and Filo del Sol (Argentina).
The most recent Mineral Resource estimate for the Oculto Deposit is shown in Table 3:
Table 3 – Oculto Mineral Resource Estimate – As of October 31, 2022
| Category | Tonnage (000 t) | Ag (g/t) | Au (g/t) | Contained Ag (000 oz Ag) | Contained Au (000 oz Au) |
| Measured | 19,336 | 98 | 0.88 | 60,634 | 544 |
| Indicated | 31,978 | 47 | 0.73 | 48,737 | 752 |
| Measured & Indicated | 51,314 | 66 | 0.79 | 109,370 | 1,297 |
| Inferred | 2,216 | 30 | 0.51 | 2,114 | 37 |
Notes: Effective October 31, 2022. Mineral Resources are not Mineral Reserves and have not demonstrated economic viability. The Mineral Resource estimate is N.I. 43-101 compliant and was prepared by Luis Rodrigo Peralta, B.Sc., FAusIMM CP(Geo), Independent Consultant. The mineralization estimated in the Mineral Resource is sub-horizontal with sub-vertical feeders and a reasonable prospect for eventual economic extraction by open pit methods.
The above references an opinion and is for information purposes only. It is not intended to be investment advice. Seek a licensed professional for investment advice. The author is not an insider or shareholder of any of the companies mentioned above.
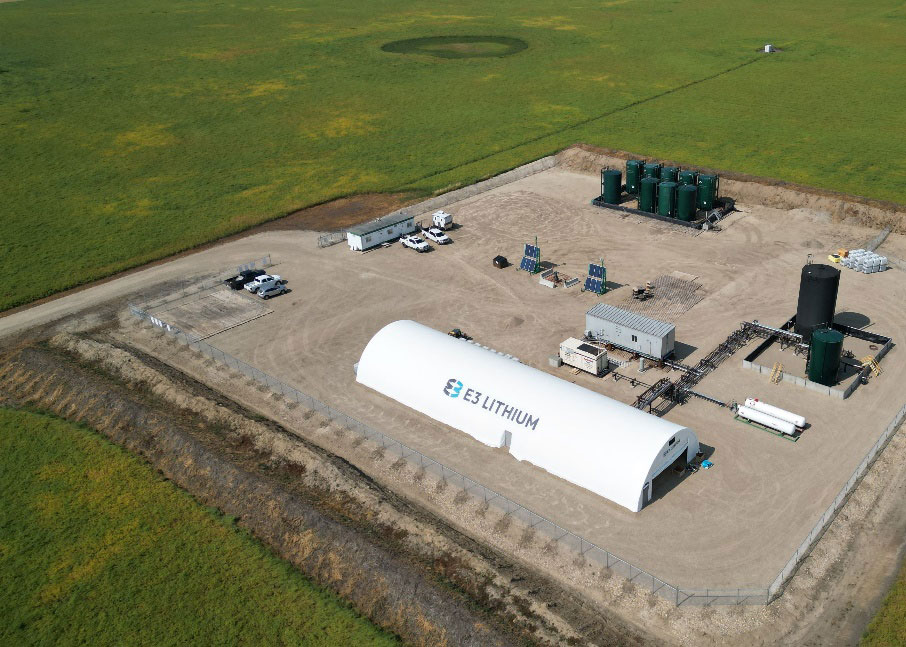
E3 Lithium (TSXV:ETL) has begun operations at its Direct Lithium Extraction (DLE) facility in Alberta. This marks the province’s inaugural plant dedicated to testing this alternate method for lithium extraction from brine projects.
Chris Doornbos, President and CEO of E3 Lithium, commented in a press release: “The start of full operations is a testament to the hard work the team has been putting in to get this equipment running. This is a foundational moment for E3 Lithium, as demonstrating DLE at pilot scale will enable us to move forward in developing this lithium asset in Alberta towards commercialization.”
Goldman Sachs analysts have previously pointed to the potential of DLE technology to revolutionize the industry. Similar to how shale transformed the oil market, DLE may allow companies to nearly double their lithium yield from evaporation ponds.
The primary objective of E3 Lithium’s operations is to assess specific parameters believed to yield optimal results for extracting lithium from brines. Subsequent to initial testing, the system will operate for extended periods to validate its performance and generate increased volumes of lithium concentrate. This concentrate will then undergo refinement into market-ready products, notably lithium hydroxide.
DLE distinguishes itself from traditional methods. Instead of evaporating brine in large pools to concentrate lithium, DLE processes the brine directly in a plant. Here, a series of chemical reactions segregate the lithium, which is then reintroduced underground. This method yields battery-grade lithium carbonate or hydroxide in mere hours, a stark contrast to the traditional 18-month timeframe. Thereis also no requirement to ship concentrates to a different location for processing.
The plant currently processes brine from E3 Lithium’s Clearwater project. A 2020 preliminary economic evaluation anticipates this project to produce 20,000 tonnes of lithium hydroxide annually over two decades. The after-tax net present value, with an 8% discount, is approximately $820 million and boasts an internal rate of return of 27%.
With one of the most substantial inferred lithium resources in its category, E3 holds 16 million tonnes of lithium carbonate equivalent (LCE) in the Measured and Indicated sector. Additionally, there’s 0.9 million tonnes LCE of Inferred mineral resources located in the Leduc Aquifer. The Clearwater project, with 2.2 million tonnes of LCE at an average concentration of 74 mg/L, forms part of this resource.
According to Benchmark Mineral Intelligence, DLE lithium production is set to surge from around 54,000 tonnes currently to an impressive 647,500 tonnes by 2032.
The commissioning process for E3 Lithium’s plant involved integrating all main equipment pieces with the onsite piping and wiring systems. Comprehensive inspections and tests were performed, confirming the DLE system’s operation as projected based on established pre-pilot performance metrics.
The pilot operations, which began with an exploration of different DLE process settings to identify the most efficient lithium extraction method, will be instrumental in shaping the commercial design of the processing facility in future studies.
The above references an opinion and is for information purposes only. It is not intended to be investment advice. Seek a licensed professional for investment advice. The author is not an insider or shareholder of any of the companies mentioned above.
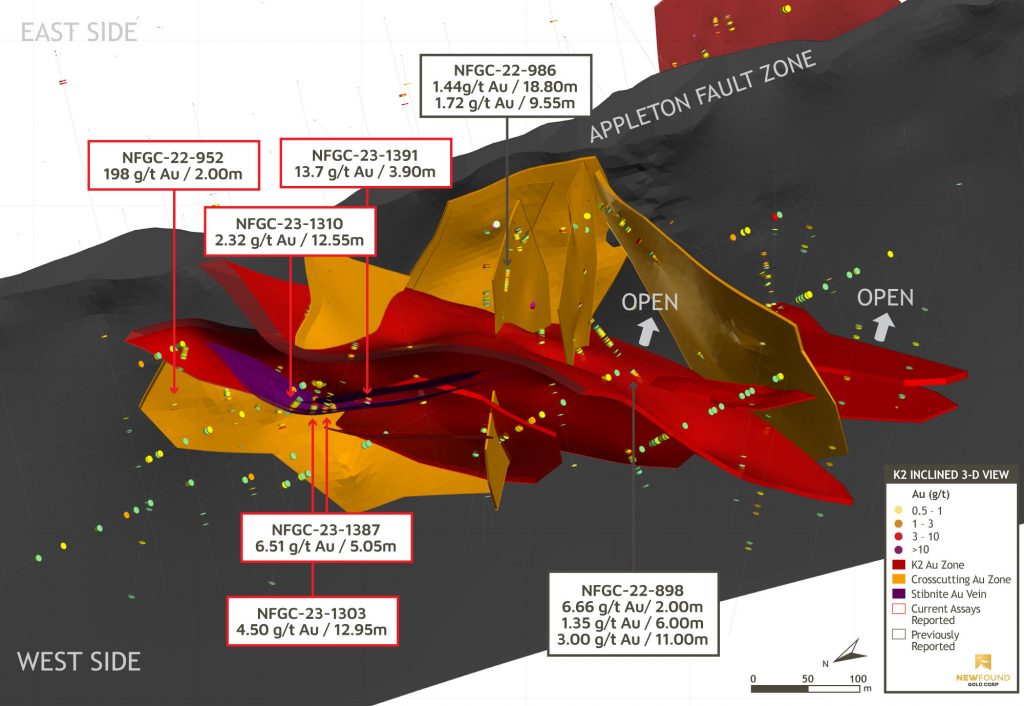
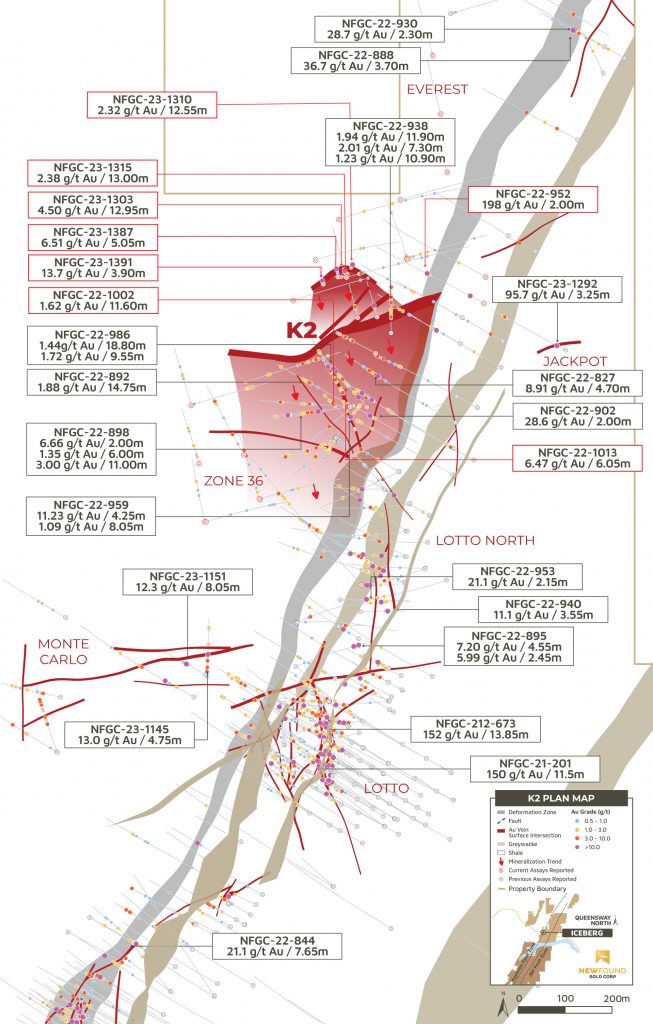
New Found Gold (TSXV:NFG) has reported the results from 36 diamond drill holes, a part of an ongoing drill program aimed at expanding the recently discovered K2 Zone. The K2 Zone is located 725 meters north of Lotto and 2.2 km north of Keats West, on the western side of the Appleton Fault Zone (AFZ). This drilling is a component of New Found’s Queensway Project, covering a 1,662 square kilometre area, situated 15 km west of Gander, Newfoundland and Labrador, and accessible via the Trans-Canada Highway.
The K2 Zone has been identified as an intricate system consisting of multiple structures and intersecting vein orientations. This area spans a mineralized footprint of 410 meters in length by 395 meters in width. The gold mineralization begins at the surface and has been defined to a maximum depth of 250 meters through drilling. A significant portion of the gold is located in what is referred to as the “K2 Main” structure, a low-angle, gold-bearing fault zone that dips 40 degrees to the south. This zone averages 65 meters in thickness and shares a similar orientation to Keats West.
Melissa Render, VP of Exploration of New Found, commented in a press release: “Drilling at K2 has led to the discovery of a significant gold-bearing structural zone with a large and growing footprint that includes an array of veining and strong associated gold grades. Like Keats West, K2 is located west of the AFZ and gold is generally hosted in a low-angle, gently dipping structure, with the majority of mineralization found close to surface. With minimal drilling into this new zone, it is already apparent that the complexity and sheer number of associated veins at K2 far exceeds the system at Keats West. Additionally, the overall K2 zone shares many similarities with Keats Main, including general orientation and the presence of numerous, steeply dipping cross-structures. It is these complex environments that create opportune hosts for high-grade gold deposition and today’s highlight interval of 198 g/t Au over 2m gives us great enthusiasm that, like our flagship zones found 2.5km to the south, K2 can also host high-grade gold. The introduction of stibnite at K2 provides one additional curiosity; high-grade concentrations of stibnite are commonly observed at Fosterville near to high-grade epizonal gold zones. Through further drilling, we look forward to seeing if a similar association presents itself at Queensway. Exploration will remain focussed on expanding K2, which remains open in all directions and at depth, where limited drilling has been conducted below 150m vertical.”
The style of mineralization at K2 is categorized by a series of stockwork and fault-fill style quartz veins. These veins parallel the K2 Main structure and intersect it, forming a broad domain of gold-mineralized brittle faults. Additional drilling is needed to fully understand this complex network. One vein in this structure, named the “Stibnite” vein, has returned several noteworthy intervals, including grades of gold and antimony that are significant. This is the first time this kind of mineral association has been observed at Queensway North.
New Found Gold is currently executing a 500,000-meter drill program at Queensway, with approximately 39,400 meters of core samples pending assay results. The samples are being processed using both fire assay and photon assay techniques by ALS Canada Ltd. and MSALABS, under a commercial contract with New Found Gold. Sampling procedures follow a structured approach, with the drill core examined by geologists to mark intervals to be sampled. Half of the core is retained as a witness sample, while the other half is submitted for analysis.
The results, as released, are uncut, and composite intervals are calculated using a minimum weighted average of 1 gram per ton of gold, diluted over a minimum core length of 2 meters. Any high-grade intercepts, defined as consecutive intervals with grades higher than 10 grams per ton of gold, are reported separately. This data contributes to the ongoing evaluation of the mineral potential in the Queensway Project area.
Highlights from the results are as follows:
K2 Highlights:
|
Hole No. |
From (m) |
To (m) |
Interval (m) |
Au (g/t) |
Sb (%) |
Zone |
|
NFGC-22-9522 |
187.00 |
189.00 |
2.00 |
197.78 |
|
K2 |
|
Including |
188.20 |
188.60 |
0.40 |
988.70 |
|
|
|
NFGC-22-10021 |
132.30 |
143.90 |
11.60 |
1.62 |
|
K2 |
|
NFGC-22-10131 |
202.95 |
209.00 |
6.05 |
6.47 |
<0.01 |
K2 |
|
Including |
204.50 |
205.20 |
0.70 |
27.50 |
<0.01 |
|
|
NFGC-23-13031 |
22.35 |
35.30 |
12.95 |
4.50 |
0.95 |
K2 |
|
Including |
23.20 |
24.35 |
1.15 |
21.12 |
1.12 |
|
|
Including |
25.00 |
25.45 |
0.45 |
12.05 |
10.45 |
|
|
NFGC-23-13101 |
30.00 |
42.55 |
12.55 |
2.32 |
<0.01 |
K2 |
|
Including |
40.85 |
41.60 |
0.75 |
10.10 |
<0.01 |
|
|
NFGC-23-13151 |
22.00 |
35.00 |
13.00 |
2.38 |
<0.01 |
K2 |
|
Including |
34.30 |
35.00 |
0.70 |
10.75 |
<0.01 |
|
|
NFGC-23-13871 |
19.90 |
24.95 |
5.05 |
6.51 |
0.02 |
K2 |
|
Including |
22.85 |
23.55 |
0.70 |
27.70 |
0.05 |
|
|
NFGC-23-13911 |
6.00 |
9.90 |
3.90 |
13.72 |
0.04 |
K2 |
|
Including |
7.50 |
8.00 |
0.50 |
20.60 |
0.21 |
|
|
Including |
8.50 |
9.90 |
1.40 |
26.93 |
0.02 |
|
Table 1: K2 Drilling Highlights |
|
Note that the host structures are interpreted to be steeply dipping and true widths are generally estimated to be 170% to 95% and 240% to 70% of reported intervals. Infill veining in secondary structures with multiple orientations crosscutting the primary host structures are commonly observed in drill core which could result in additional uncertainty in true width. Composite intervals reported carry a minimum weighted average of 1 g/t Au diluted over a minimum core length of 2m with a maximum of 4m consecutive dilution when above 200m vertical depth and 2m consecutive dilution when below 200m vertical depth. Included high-grade intercepts are reported as any consecutive interval with grades greater than 10 g/t Au. Grades have not been capped in the averaging and intervals are reported as drill thickness. |
Drillhole Details
|
Hole No. |
From (m) |
To (m) |
Interval (m) |
Au (g/t) |
Zone |
|
NFGC-22-9241 |
77.70 |
83.05 |
5.35 |
3.65 |
K2 |
|
And1 |
102.35 |
110.35 |
8.00 |
2.08 |
|
|
And1 |
122.85 |
125.00 |
2.15 |
1.21 |
|
|
NFGC-22-9524 |
46.00 |
48.20 |
2.20 |
6.54 |
Everest |
|
Including |
46.00 |
46.55 |
0.55 |
26.11 |
|
|
And2 |
179.00 |
181.00 |
2.00 |
1.47 |
K2 |
|
And2 |
187.00 |
189.00 |
2.00 |
197.78 |
|
|
Including |
188.20 |
188.60 |
0.40 |
988.70 |
|
|
NFGC-22-9722 |
5.30 |
7.55 |
2.25 |
7.08 |
K2 |
|
Including |
6.20 |
7.20 |
1.00 |
14.84 |
|
|
And1 |
139.15 |
141.35 |
2.20 |
2.54 |
|
|
And2 |
237.80 |
239.85 |
2.05 |
2.82 |
|
|
NFGC-22-987 |
No Significant Values |
K2 |
|||
|
NFGC-22-10021 |
132.30 |
143.90 |
11.60 |
1.62 |
K2 |
|
NFGC-22-10134 |
53.00 |
55.35 |
2.35 |
4.46 |
K2 |
|
Including |
54.50 |
55.35 |
0.85 |
10.35 |
|
|
And4 |
78.50 |
80.85 |
2.35 |
1.12 |
|
|
And4 |
158.00 |
160.00 |
2.00 |
4.15 |
|
|
And4 |
177.85 |
180.10 |
2.25 |
1.07 |
|
|
And1 |
202.95 |
209.00 |
6.05 |
6.47 |
|
|
Including |
204.50 |
205.20 |
0.70 |
27.50 |
|
|
And1 |
217.05 |
219.35 |
2.30 |
4.21 |
|
|
Including |
218.45 |
219.35 |
0.90 |
10.60 |
|
|
NFGC-22-10241 |
69.00 |
71.00 |
2.00 |
1.80 |
K2 |
|
And1 |
184.30 |
186.70 |
2.40 |
2.99 |
|
|
NFGC-23-12274 |
91.00 |
93.10 |
2.10 |
2.09 |
K2 |
|
NFGC-23-1256 |
No Significant Values |
K2 |
|||
|
NFGC-23-12581 |
321.00 |
323.00 |
2.00 |
1.17 |
K2 |
|
NFGC-23-1270 |
No Significant Values |
K2 |
|||
|
NFGC-23-1276 |
No Significant Values |
K2 |
|||
|
NFGC-23-12821 |
78.45 |
80.65 |
2.20 |
1.04 |
K2 |
|
NFGC-23-1296 |
No Significant Values |
K2 |
|||
|
NFGC-23-13031 |
22.35 |
35.30 |
12.95 |
4.50 |
K2 |
|
Including |
23.20 |
24.35 |
1.15 |
21.12 |
|
|
Including |
25.00 |
25.45 |
0.45 |
12.05 |
|
|
NFGC-23-1305 |
No Significant Values |
K2 |
|||
|
NFGC-23-13104 |
5.55 |
7.75 |
2.20 |
1.59 |
K2 |
|
And1 |
30.00 |
42.55 |
12.55 |
2.32 |
|
|
Including |
40.85 |
41.60 |
0.75 |
10.10 |
|
|
NFGC-23-13131 |
23.90 |
28.20 |
4.30 |
1.53 |
K2 |
|
And1 |
31.80 |
34.05 |
2.25 |
1.56 |
|
|
NFGC-23-1314 |
No Significant Values |
K2 |
|||
|
NFGC-23-13151 |
22.00 |
35.00 |
13.00 |
2.38 |
K2 |
|
Including |
34.30 |
35.00 |
0.70 |
10.75 |
|
|
NFGC-23-13191 |
37.55 |
46.60 |
9.05 |
1.29 |
K2 |
|
NFGC-23-13224 |
58.00 |
60.00 |
2.00 |
4.64 |
K2 |
|
NFGC-23-13291 |
195.40 |
197.40 |
2.00 |
1.39 |
K2 |
|
And1 |
221.85 |
228.60 |
6.75 |
2.32 |
|
|
NFGC-23-1338 |
No Significant Values |
K2 |
|||
|
NFGC-23-13441 |
5.00 |
8.70 |
3.70 |
1.67 |
K2 |
|
NFGC-23-13454 |
75.55 |
77.55 |
2.00 |
1.71 |
K2 |
|
NFGC-23-13511 |
5.00 |
8.70 |
3.70 |
1.03 |
K2 |
|
NFGC-23-13554 |
185.40 |
188.75 |
3.35 |
1.22 |
K2 |
|
And3 |
231.00 |
233.30 |
2.30 |
1.22 |
|
|
NFGC-23-13701 |
178.85 |
181.00 |
2.15 |
1.34 |
K2 |
|
And1 |
182.60 |
184.65 |
2.05 |
1.01 |
|
|
And1 |
185.60 |
188.45 |
2.85 |
1.02 |
|
|
NFGC-23-1377 |
No Significant Values |
K2 |
|||
|
NFGC-23-13871 |
19.90 |
24.95 |
5.05 |
6.51 |
K2 |
|
Including |
22.85 |
23.55 |
0.70 |
27.70 |
|
|
NFGC-23-13911 |
6.00 |
9.90 |
3.90 |
13.72 |
K2 |
|
Including |
7.50 |
8.00 |
0.50 |
20.60 |
|
|
Including |
8.50 |
9.90 |
1.40 |
26.93 |
|
|
NFGC-23-13921 |
26.25 |
28.25 |
2.00 |
1.00 |
K2 |
|
And1 |
32.60 |
37.00 |
4.40 |
2.38 |
|
|
NFGC-23-13981 |
32.75 |
36.15 |
3.40 |
5.99 |
K2 |
|
Including |
35.00 |
35.70 |
0.70 |
20.60 |
|
|
NFGC-23-1522 |
No Significant Values |
K2 West |
|||
|
NFGC-23-1546 |
No Significant Values |
K2 West |
|||
|
Table 2: Summary of composite results reported in this press release for K2. |
|
Note that the host structures are interpreted to be steeply dipping and true widths are generally estimated to be 170% to 95%, 240% to 70%, and 310% to 40% of reported intervals. 4True widths are unknown at this time. Infill veining in secondary structures with multiple orientations crosscutting the primary host structures are commonly observed in drill core which could result in additional uncertainty in true width. Composite intervals reported carry a minimum weighted average of 1 g/t Au diluted over a minimum core length of 2m with a maximum of 4m consecutive dilution when above 200m vertical depth and 2m consecutive dilution when below 200m vertical depth. Included high-grade intercepts are reported as any consecutive interval with grades greater than 10 g/t Au. Grades have not been capped in the averaging and intervals are reported as drill thickness. |
| Hole No. |
Azimuth (°) |
Dip (°) |
Length (m) |
UTM E |
UTM N |
Prospect |
|
NFGC-22-924 |
300 |
-45 |
227 |
659018 |
5429879 |
K2 |
|
NFGC-22-952 |
300 |
-45 |
360 |
659249 |
5429986 |
K2 |
|
NFGC-22-972 |
272 |
-52 |
308 |
658964 |
5429766 |
K2 |
|
NFGC-22-987 |
300 |
-45 |
339 |
659252 |
5430042 |
K2 |
|
NFGC-22-1002 |
320 |
-60 |
194 |
658974 |
5429719 |
K2 |
|
NFGC-22-1013 |
320 |
-60 |
317 |
659000 |
5429765 |
K2 |
|
NFGC-22-1024 |
330 |
-45 |
239 |
658738 |
5429664 |
K2 |
|
NFGC-23-1227 |
345 |
-60 |
260 |
659140 |
5430512 |
K2 |
|
NFGC-23-1256 |
345 |
-60 |
251 |
659157 |
5430388 |
K2 |
|
NFGC-23-1258 |
320 |
-45 |
456 |
658988 |
5429388 |
K2 |
|
NFGC-23-1270 |
345 |
-60 |
305 |
659171 |
5430264 |
K2 |
|
NFGC-23-1276 |
75 |
-45 |
302 |
659071 |
5430206 |
K2 |
|
NFGC-23-1282 |
75 |
-45 |
395 |
658940 |
5430164 |
K2 |
|
NFGC-23-1296 |
75 |
-45 |
263 |
658891 |
5430078 |
K2 |
|
NFGC-23-1303 |
345 |
-60 |
227 |
658956 |
5430041 |
K2 |
|
NFGC-23-1305 |
345 |
-59 |
290 |
658655 |
5429522 |
K2 |
|
NFGC-23-1310 |
25 |
-45 |
65 |
658957 |
5430041 |
K2 |
|
NFGC-23-1313 |
15 |
-78 |
80 |
658956 |
5430041 |
K2 |
|
NFGC-23-1314 |
75 |
-45 |
263 |
658658 |
5429521 |
K2 |
|
NFGC-23-1315 |
270 |
-60 |
53 |
658956 |
5430041 |
K2 |
|
NFGC-23-1319 |
75 |
-45 |
386 |
658957 |
5430041 |
K2 |
|
NFGC-23-1322 |
75 |
-45 |
251 |
658772 |
5429570 |
K2 |
|
NFGC-23-1329 |
345 |
-60 |
299 |
658771 |
5429570 |
K2 |
|
NFGC-23-1338 |
75 |
-45.5 |
257 |
658843 |
5429992 |
K2 |
|
NFGC-23-1344 |
345 |
-59 |
251 |
659084 |
5430081 |
K2 |
|
NFGC-23-1345 |
344 |
-59 |
260 |
658642 |
5429645 |
K2 |
|
NFGC-23-1351 |
75 |
-45 |
254 |
659086 |
5430081 |
K2 |
|
NFGC-23-1355 |
74 |
-45.5 |
317 |
658741 |
5429818 |
K2 |
|
NFGC-23-1370 |
75 |
-45 |
251 |
658626 |
5429769 |
K2 |
|
NFGC-23-1377 |
345 |
-60 |
257 |
658626 |
5429769 |
K2 |
|
NFGC-23-1387 |
345 |
-45 |
50 |
658939 |
5430042 |
K2 |
|
NFGC-23-1391 |
345 |
-45 |
53 |
658907 |
5430027 |
K2 |
|
NFGC-23-1392 |
345 |
-45 |
104 |
658980 |
5429955 |
K2 |
|
NFGC-23-1398 |
345 |
-45 |
113 |
659021 |
5429957 |
K2 |
|
NFGC-23-1522 |
20 |
-45 |
212 |
658014 |
5429658 |
K2 West |
|
NFGC-23-1546 |
353 |
-45 |
215 |
658015 |
5429656 |
K2 West |
|
Table 3: Details of drill holes reported in this press release |
The above references an opinion and is for information purposes only. It is not intended to be investment advice. Seek a licensed professional for investment advice. The author is not an insider or shareholder of any of the companies mentioned above.
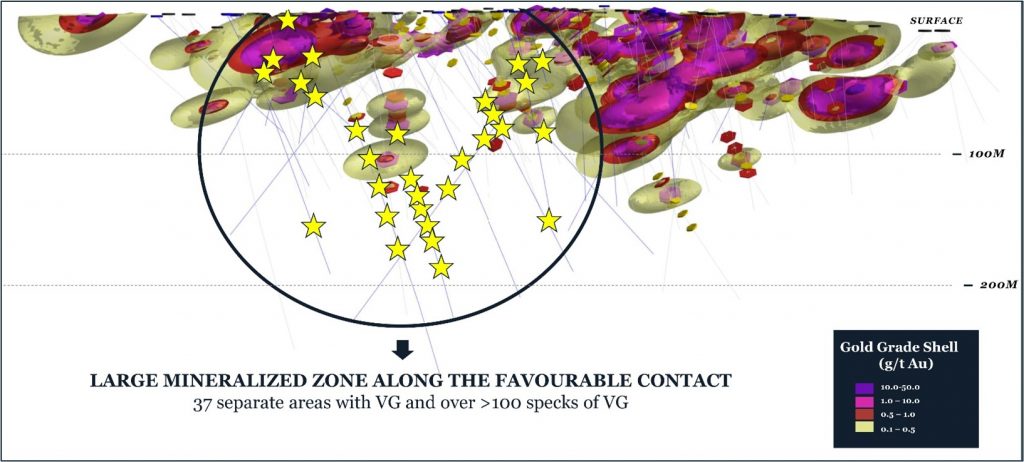
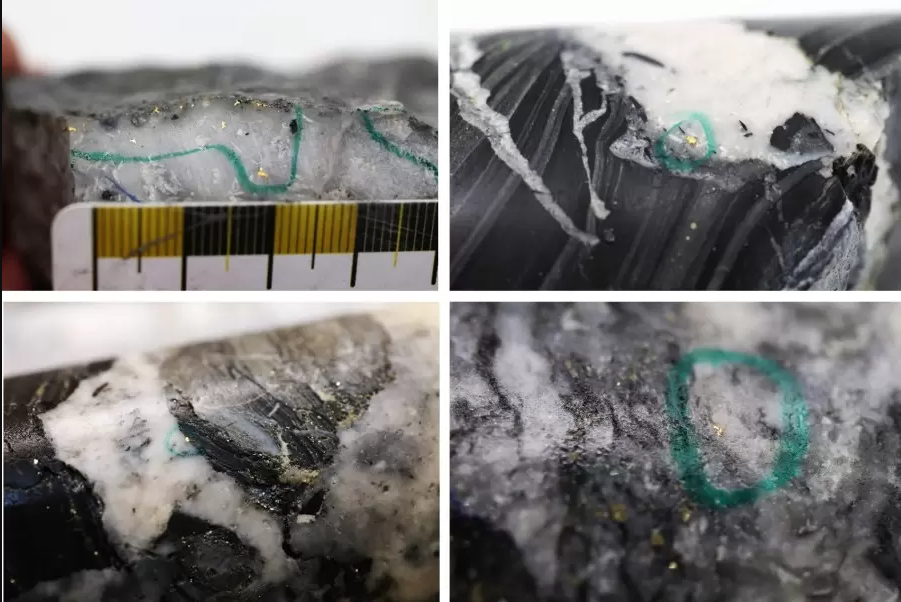
Puma Exploration (TSXV:PUMA) has reported preliminary findings from its 2023 drilling program at the Williams Brook Gold Project in Northern New Brunswick, Atlantic Canada, demonstrating that gold mineralization extends beyond 100 meters depth. The exploration, entirely owned by Puma, took place at the Lynx Gold Zone, where 24 holes amounting to 3,475 meters were drilled.
The drilling exposed more than 100 specks of visible gold in 37 different locations, with 16 occurrences situated between 100 meters and 211 meters downhole depth. The gold mineralization appears to be constrained at the favourable contact between rhyolite and sediment, and potential high-grade veins are often found in association with carbonate alteration (dolomite) and sulphides.
Puma Exploration President and CEO Marcel Robillard commented in a press release: “We are extremely pleased with this first phase of our 2023 drilling program and what we see in the core. There’s tremendous validation of our approach and model when we can hit VG successfully, and multiple instances of it is remarkable. The mineralization, mineralogy, alteration etc., all indicate that we are dealing with a large hydrothermal system that extends laterally and at depth. We are confident that we’ll substantially add to the gold inventory at the Lynx Gold Zone as we continue to advance our 2023 program and beyond.”
This initial phase of drilling was conducted with a specific focus on the Lynx and Moose areas of the LGZ and was purposed to confirm and expand the known high-grade gold mineralization both at depth and along strike. An additional objective was to target veins previously mapped at the surface using different drilling orientations to improve the understanding of the veins’ geometry and update the structural model.
The results from the Phase 1 drilling not only confirmed the extension of the mineralization beyond 150 meters depth but also shed light on the alteration observed in the core. As drilling reached 100 meters vertical depth, the supergene alteration transitioned to fresh sulphides. Although many holes showed pervasive sericitization, the presence of visible gold and associated potential high-grade veins was linked to the existence of carbonate alteration and specific sulphide assemblages. These sulphides were also found 255 meters downhole in one of the drilling holes.
Looking ahead at the 2023 Drilling Program, the fully-funded and permitted progress has three primary objectives: to extend the continuity of the LGZ at depth and along strike, to validate and refine the existing geological model, and to corroborate Puma’s current geophysical pathfinder tool. Initially planned for 15 holes and approximately 2,000 meters, Phase 1 drilling was expanded to 24 holes and 3,500 meters after the Company successfully intercepted the depth extensions of the high-grade shoots identified by previous programs. Assays from the Phase 1 drilling are still pending, and the results will be announced upon receipt.
To advance exploration, Puma is preparing to conduct surface exploration work to locate the favourable rhyolite sediment contact along the strike extension of the Lynx Gold Zone. This work is in preparation for the Company’s forthcoming Phase 2 drilling program. The discovery has marked a significant development in understanding the Williams Brook Gold Project’s potential and demonstrates Puma’s commitment to thorough exploration and evaluation.
Highlights from the results are as follows:
Table 1. Visible gold occurrences in Phase 1 2023 drilling
| DDH # | Downhole Depth (m) | Vein type | Host rock | Associated sulphides |
| WB23-129 | 45.4 | white qtz | rhyolite | ga |
| WB23-129 | 48.4 | white qtz | Sed-lim/GS in rhyolite | |
| WB23-132 | 87.9 | white qtz | sed-lim | ga |
| WB23-133 | 32.5 | fracture in GS | Sed altered-lim | |
| WB23-133 | 49.2 | white qtz | rhyolite | |
| WB23-133 | 50.3 | white qtz | Sed altered at contact with rhyolite | sph |
| WB23-133 | 60.7 | white qtz | Sed altered | |
| WB23-136 | 37.6 | milky white qtz brec with GS fragments | rhy-lim/Sed altered-lim | |
| WB23-137 | 3.0 | white qtz | sed-lim | |
| WB23-137 | 26.7 | white qtz brec. With rhy fragments | rhyolite-lim | |
| WB23-137 | 33.3 | stw QV 1cm | Rhy-lim | |
| WB23-137 | 33.6 | stw QV 1cm | Rhy-lim | |
| WB23-138 | 100.4 | white qtz | rhyolite | ga |
| WB23-138 | 109.2 | white qtz | rhyolite | ga-cpy-sph |
| WB23-138 | 138.7 | white qtz | rhyolite | ga-sph-lim |
| WB23-138 | 153.8 | white qtz | rhyolite | ga-sph-lim-ma-cpy |
| WB23-138 | 175.9 | white qtz | rhyolite | sph-ga |
| WB23-139 | 90.5 | white qtz | rhyolite | cpy-ga-sph |
| WB23-139 | 139.9 | white qtz | rhyolite | cpy-ga-sph |
| WB23-139 | 149.8 | white qtz | rhyolite | cpy-ga-sph |
| WB23-139 | 149.9 | white qtz | rhyolite | cpy-ga-sph |
| WB23-139 | 150.0 | white qtz | rhyolite | cpy-ga-sph |
| WB23-139 | 150.1 | white qtz | rhyolite | cpy-ga-sph |
| WB23-139 | 151.9 | white qtz | rhyolite | cpy-ga-sph |
| WB23-139 | 211.2 | white qtz | rhyolite | ga-sph |
| WB23-140 | 129.8 | white qtz | rhyolite | ga-cpy-py-sph |
| WB23-142 | 60.7 | Rusted qtz, stw | rhyolite-lim | |
| WB23-142 | 64.0 | white qtz | rhyolite-lim/sediment altered | ga-cpy-ma |
| WB23-142 | 82.0 | white qtz | rhyolite | ga |
| WB23-142 | 136.3 | white qtz, stw | rhyolite | ga-cpy-sph |
| WB23-144 | 161.7 | white qtz | rhyolite / sediment altered | ga-sph-cpy |
| WB23-145 | 80.6 | white qtz rusted | rhyolite-lim | ga-ma |
| WB23-145 | 81.8 | white qtz | rhyolite-lim | |
| WB23-145 | 81.8 | white qtz | rhyolite-lim | ga-cpy |
| WB23-145 | 82.6 | white qtz | rhyolite-lim | ga-cpy-sph |
| WB23-145 | 82.7 | white qtz | rhyolite-lim | ga-cpy-sph |
| WB23-145 | 174.4 | white qtz | rhyolite | ga |
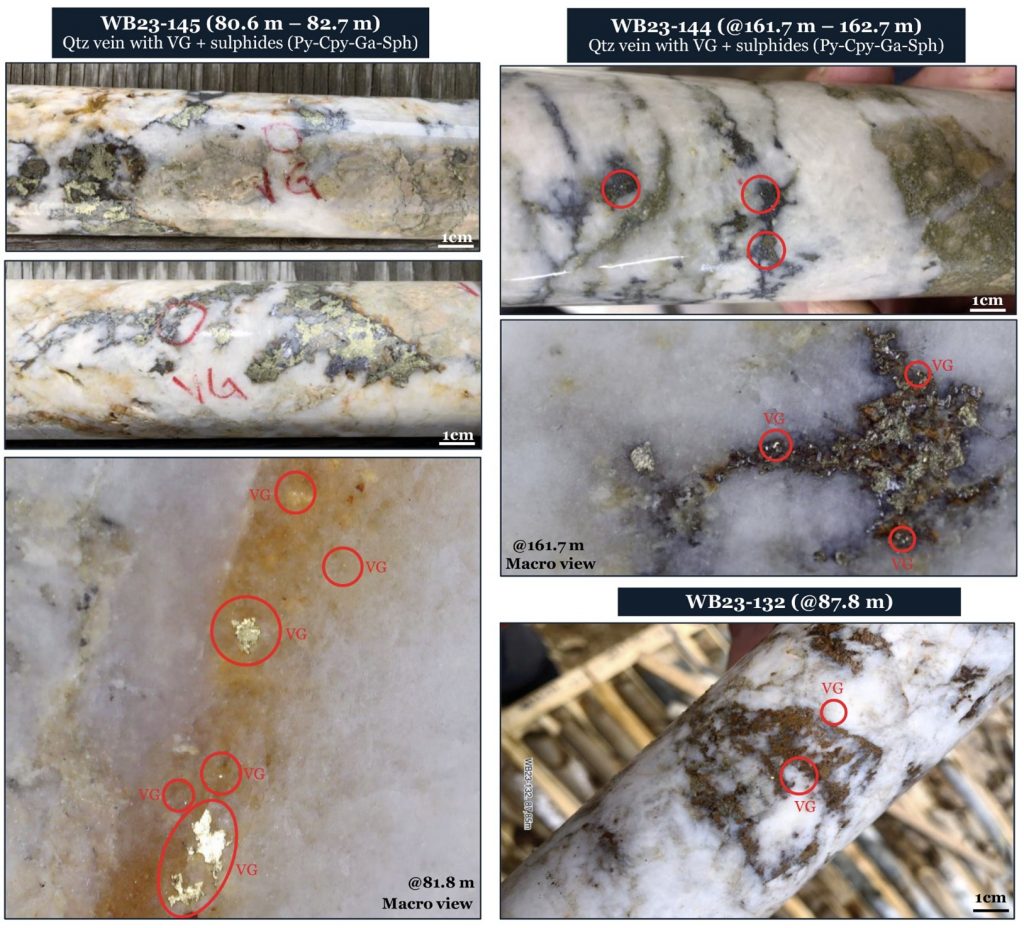
Table 2. Coordinates and depth of drilled holes
| DDH # | Easting * | Northing* | Azimuth (°) | Dip (°) | Length (m) |
| WB23-122 | 660246 | 5259235 | 335 | -45 | 107.0 |
| WB23-123 | 660256 | 5259214 | 335 | -65 | 83.0 |
| WB23-124 | 660213 | 5259379 | 155 | -80 | 122.0 |
| WB23-125 | 660263 | 5259293 | 330 | -45 | 170.0 |
| WB23-126 | 660242 | 5259412 | 155 | -65 | 80.0 |
| WB23-127 | 660237 | 5259421 | 155 | -75 | 134.0 |
| WB23-128 | 660236 | 5259382 | 155 | -85 | 116.0 |
| WB23-129 | 660263 | 5259417 | 155 | -65 | 65.0 |
| WB23-130 | 660207 | 5259347 | 155 | -80 | 113.2 |
| WB23-131 | 660227 | 5259340 | 165 | -65 | 89.0 |
| WB23-132 | 660303 | 5259443 | 230 | -45 | 196.0 |
| WB23-133 | 660336 | 5259560 | 202 | -45 | 107.3 |
| WB23-134 | 660312 | 5259564 | 155 | -65 | 122.0 |
| WB23-135 | 660335 | 5259521 | 335 | -55 | 100.0 |
| WB23-136 | 660350 | 5259505 | 295 | -55 | 92.0 |
| WB23-137 | 660371 | 5259519 | 295 | -50 | 87.0 |
| WB23-138 | 660362 | 5259507 | 260 | -45 | 257.0 |
| WB23-139 | 660361 | 5259481 | 260 | -45 | 230.0 |
| WB23-140 | 660343 | 5259458 | 260 | -45 | 218.0 |
| WB23-141 | 660343 | 5259458 | 330 | -45 | 178.0 |
| WB23-142 | 660287 | 5259359 | 338 | -46 | 236.0 |
| WB23-143 | 660351 | 5259599 | 202 | -45 | 101.0 |
| WB23-144 | 660388 | 5259550 | 260 | -46 | 197.0 |
| WB23-145 | 660335 | 5259430 | 260 | -46 | 275.0 |
| * Projection: UTM Nad83 zone 19 | Total: | 3475.5 | |||
The above references an opinion and is for information purposes only. It is not intended to be investment advice. Seek a licensed professional for investment advice. The author is not an insider or shareholder of any of the companies mentioned above.
In a move that could signal a shift in Sweden’s energy landscape, Climate Minister Romina Pourmokhtari announced plans to lift the country’s longstanding ban on uranium mining. This strategic decision is seen as an effort to accommodate the nation’s increasing nuclear energy aspirations.
Government’s Stance
Pourmokhtari confirmed to The Times that a majority within the government supports the removal of the uranium mining ban. This announcement came shortly after Prime Minister Ulf Kristersson expressed the administration’s intent in January, stating that they are in the process of “altering the legislation” to bolster nuclear investments within the country.
The Climate Minister further highlighted the government’s ambitious energy plans, stating, “The government is aiming at doubling electricity production in 20 years.”
Sweden’s Nuclear History
Sweden’s reliance on nuclear power is not new. The country’s nuclear power reactors currently account for approximately 40% of its total electricity supply. However, a decision made in 1980 to phase out nuclear power saw a dramatic reversal three decades later. In June 2010, the Swedish Parliament voted to repeal the phase-out policy, marking the nation’s continued commitment to nuclear energy.
Nuclear Expansion and Mining Opportunities
To support this ambitious energy transition, the government has laid down a roadmap for the construction of at least ten large reactors over the next two decades. The lifting of the mining ban could be the key to achieving this, especially considering that Sweden houses a whopping 80% of the European Union’s uranium deposits.
While uranium has traditionally been extracted as a byproduct during the mining of other metals, dedicated uranium mining projects are poised to take off, and the lifting of the ban could spur further investment.
What it Means for the European Market
Sweden’s potential mining resurgence doesn’t stop at uranium. The country is also believed to possess Europe’s largest deposit of rare earths, minerals that are pivotal for the shift to zero-emission technologies. This development could solidify Sweden’s position as a critical player in Europe’s green transition.
Sweden’s move to lift the uranium mining ban could change its domestic energy landscape, the broader European mining industry, and the global shift towards sustainable technologies. Now, mining companies will watch closely for the vote and whether some of the largest reserves may become available for exploration after many decades.
The above references an opinion and is for information purposes only. It is not intended to be investment advice. Seek a licensed professional for investment advice. The author is not an insider or shareholder of any of the companies mentioned above.
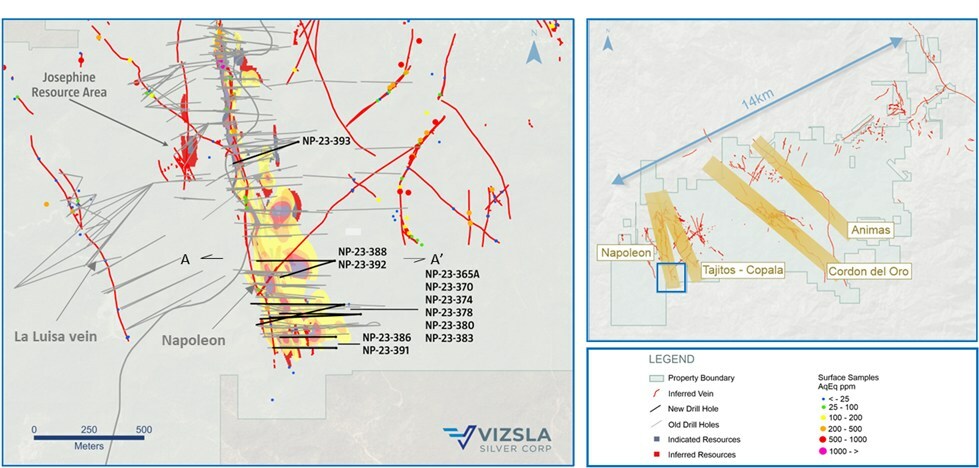
Vizsla Silver Corp. (TSXV:VZLA) has reported results from 11 new drill holes at the southern extension of the Napoleon Vein, within the company’s Panuco silver-gold project located in Mexico. The recent findings are focused on the western part of the district and are part of a 90,000-metre resource infill and expansion or discovery-focused drilling initiative.
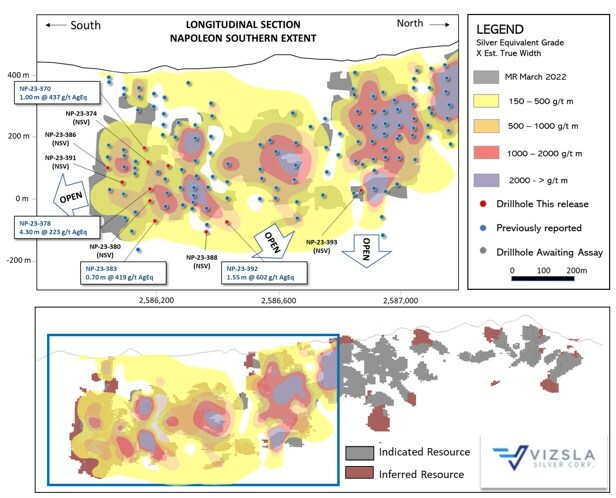
Michael Konnert, President and CEO, commented in a press release: “Infill and expansionary drilling targeting the southern extent of Napoleon continues to intersect high silver and gold grades on both the main vein and its overlapping splay structures. We have now identified several splay veins branching off the main Napoleon structure located within both the footwall and hanging wall that remain open for future expansion. Most notable is the shallow dipping Hanging Wall 4 structure which returned 646 grams per tonne silver equivalent over ten meters true width and is open down dip. We continue to view the Napoleon Area as a primary target for future resource growth and development. Of the six drill rigs currently turning on the property, infill drilling continues at Napoleon with one rig. In addition to drilling, we are pleased to announce Vizsla has achieved 1.5 million work hours without a lost time incident at Panuco. This is yet another major milestone for the Company and is a testament to the focus and dedication of every Vizsla employee and contractor working on the Project.”
The Napoleon Southern Extent has revealed enhanced comprehension of the mineralization controls along the vein corridor. The pattern of metal zonation and alteration indicates that the corridor is tilted. The southern reach of the drilling appears at the top of the mineralized horizon, close to the surface. Previously reported high-grade gold assay values near the surface were consistent with this model, according to releases dated December 16, 2021, and March 29, 2022.
The infill drilling assay results show additional high-grade silver and gold values in vein splays located at the hanging wall of the primary Napoleon structure. These vein splays are typically situated between 25 to 120 meters into the hanging wall and often include high concentrations of lead and zinc along with precious metal values. Recent drilling suggests that the shallow-dipping Hanging Wall 4 splay remains open down dip to the east. Results from the hole designated NP-23-388 have prompted further exploration to the east and depth along Hanging Wall 4. Vizsla continues to work on structural and 3D geological modelling to help design specific drilling targets for further exploration of these vein splays.
In related news, Vizsla Silver also announced a significant safety milestone at the Panuco site. The company has achieved 1.5 million work hours without any lost time incidents. The accomplishment was attributed to the dedication of the safety department, employees, and contractors in maintaining a strong safety culture and ensuring safe working conditions throughout the project’s life.
Highlights from the results are as follows:
- NP-23-388 returned 646 grams per tonne (g/t) silver equivalent (AgEq) over 10.00 metres true width (mTW) (217 g/t silver, 3.03 g/t gold, 1.44 % lead and 5.44 % zinc),
- including: 3,625 g/t AgEq over 0.95 mTW (1,590 g/t silver, 25.50 g/t gold, 7.28 % lead and 5.80 % zinc),
- and 1,323 g/t AgEq over 0.78 mTW (159 g/t silver, 0.89 g/t gold, 4.97 % lead and 26.70 % zinc)
- NP-23-391 returned 1,568 g/t AgEq over 1.90 mTW (908 g/t silver, 7.37 g/t gold, 1.62 % lead and 4.91 % zinc),
- including: 2,205 g/t AgEq over 0.65 mTW (1,500 g/t silver, 8.96 g/t gold, 2.05 % lead and 3.98 % zinc)
- And 648 g/t AgEq over 3.20 mTW (559 g/t silver, 1.53 g/t gold, 0.23 % lead and 0.49 % zinc),
- including: 1,720 g/t AgEq over 0.96 mTW (1,500 g/t silver, 3.89 g/t gold, 0.61 % lead and 1.22 % zinc)
- NP-23-392 returned 989 g/t AgEq over 2.50 mTW (527 g/t silver, 3.78 g/t gold, 2.13 % lead and 4.98 % zinc),
- including: 2,465 g/t AgEq over 0.69 mTW (1,500 g/t silver, 9.97 g/t gold, 5.25 % lead and 6.66 % zinc).
|
Drillhole |
From |
To |
Downhole |
Estimated |
Ag |
Au |
Pb |
Zn |
AgEq |
Vein |
|
(m) |
(m) |
(m) |
(g/t) |
(g/t) |
(g/t) |
% |
% |
(g/t) |
||
|
NP-23-365A |
No significant values |
HW 7 |
||||||||
|
NP-23-365A |
No significant values |
HW 2 |
||||||||
|
NP-23-365A |
454.65 |
455.15 |
0.5 |
0.45 |
178 |
8.33 |
0.07 |
0.17 |
736 |
Napoleon |
|
NP-23-365A |
No significant values |
FW 1 |
||||||||
|
NP-23-365A |
496.5 |
497.5 |
1 |
0.85 |
290 |
1.71 |
1.05 |
1.56 |
473 |
FW 2 |
|
NP-23-370 |
346.1 |
346.65 |
0.55 |
0.45 |
597 |
0.72 |
0.02 |
0.04 |
606 |
HW 6 |
|
NP-23-370 |
No significant values |
HW 2 |
||||||||
|
NP-23-370 |
432.05 |
433.25 |
1.2 |
1 |
349 |
1.58 |
0.05 |
0.13 |
437 |
Napoleon |
|
NP-23-374 |
303.9 |
306.05 |
2.15 |
1.7 |
90 |
0.95 |
0.02 |
0.03 |
149 |
HW 7 |
|
NP-23-374 |
No significant values |
HW 2 |
||||||||
|
NP-23-374 |
527.9 |
529.25 |
1.35 |
1 |
34 |
0.32 |
0.02 |
0.02 |
173 |
Napoleon |
|
NP-23-374 |
No significant values |
FW 2 |
||||||||
|
NP-23-374 |
585.8 |
586.25 |
0.45 |
0.45 |
433 |
2.92 |
0.83 |
1.19 |
667 |
FW 3 |
|
NP-23-378 |
555 |
556 |
1 |
0.9 |
1,135 |
1.29 |
1.14 |
4.74 |
1,348 |
HW 2 |
|
NP-23-378 |
563.8 |
569 |
5.2 |
4.3 |
73 |
1.42 |
0.46 |
1.24 |
223 |
Napoleon |
|
Includes |
566.9 |
568 |
1.1 |
0.91 |
284 |
1.92 |
1.44 |
3.28 |
555 |
|
|
NP-23-378 |
575.9 |
577.5 |
1.6 |
1.1 |
1,805 |
16.56 |
0.2 |
0.38 |
2,817 |
FW 1 |
|
Includes |
576.5 |
577.5 |
1 |
0.69 |
2,780 |
26.1 |
0.29 |
0.55 |
4,376 |
|
|
NP-23-378 |
588 |
588.6 |
0.6 |
0.46 |
184 |
1.48 |
0.6 |
15.9 |
865 |
FW 2 |
|
NP-23-380 |
317.05 |
322.45 |
5.4 |
4.1 |
111 |
0.64 |
0.01 |
0.01 |
147 |
HW 7 |
|
NP-23-380 |
554.2 |
555.7 |
1.5 |
1.35 |
551 |
1.08 |
1.29 |
6.23 |
849 |
HW 2 |
|
NP-23-380 |
581.25 |
581.7 |
0.45 |
0.4 |
346 |
2.21 |
0.8 |
4.29 |
650 |
Napoleon |
|
NP-23-383 |
No significant values |
HW 7 |
||||||||
|
NP-23-383 |
616.15 |
618.1 |
1.95 |
1.27 |
207 |
2.37 |
4.43 |
14.37 |
1,005 |
HW 2 |
|
Includes |
616.8 |
617.8 |
1 |
0.65 |
270 |
4.15 |
8.4 |
23.2 |
1,621 |
|
|
NP-23-383 |
636.25 |
637 |
0.75 |
0.7 |
154 |
1.37 |
1.04 |
4.21 |
419 |
Napoleon |
|
NP-23-386 |
140.9 |
141.85 |
0.95 |
0.78 |
218 |
0.24 |
0.21 |
0.43 |
241 |
HW 7 |
|
NP-23-386 |
410.35 |
410.75 |
0.4 |
0.3 |
430 |
1.59 |
0.08 |
0.22 |
517 |
HW 2 |
|
NP-23-386 |
414.35 |
415.6 |
1.25 |
0.85 |
177 |
0.73 |
0.11 |
0.25 |
226 |
Napoleon |
|
NP-23-386 |
536.8 |
537.25 |
0.45 |
0.4 |
444 |
10.3 |
0.46 |
1.11 |
1,162 |
FW 3 |
|
NP-23-388 |
No significant values |
HW 5 |
||||||||
|
NP-23-388 |
426.25 |
437.8 |
11.55 |
10 |
217 |
3.03 |
1.44 |
5.44 |
646 |
HW 4 |
|
Includes |
434.8 |
435.9 |
1.1 |
0.95 |
1,590 |
25.5 |
7.28 |
5.8 |
3,625 |
|
|
Includes |
435.9 |
436.8 |
0.9 |
0.78 |
159 |
0.89 |
4.97 |
26.7 |
1,323 |
|
|
NP-23-388 |
556.8 |
559 |
2.2 |
1.95 |
31 |
0.59 |
1.46 |
6.36 |
343 |
HW 2 |
|
NP-23-388 |
No significant values |
Napoleon |
||||||||
|
NP-23-391 |
No significant values |
HW 7 |
||||||||
|
NP-23-391 |
420.1 |
424.1 |
4 |
3.2 |
559 |
1.53 |
0.23 |
0.49 |
648 |
HW 2 |
|
Includes |
422.35 |
423.55 |
1.2 |
0.96 |
1,500 |
3.89 |
0.61 |
1.22 |
1,720 |
|
|
NP-23-391 |
No significant values |
Napoleon |
||||||||
|
NP-23-391 |
483.6 |
484.85 |
1.25 |
1 |
64 |
0.72 |
0.81 |
0.77 |
160 |
FW 1 |
|
NP-23-391 |
526.15 |
528.2 |
2.05 |
1.9 |
908 |
7.37 |
1.62 |
4.91 |
1,568 |
FW 2 |
|
Includes |
526.15 |
526.85 |
0.7 |
0.65 |
1,500 |
8.96 |
2.05 |
3.98 |
2,205 |
|
|
NP-23-392 |
408.1 |
410.65 |
2.55 |
2.5 |
527 |
3.78 |
2.13 |
4.98 |
989 |
HW 4 |
|
Includes |
409.25 |
409.95 |
0.7 |
0.69 |
1,500 |
9.97 |
5.25 |
6.66 |
2,465 |
|
|
NP-23-392 |
450.5 |
451.5 |
1 |
0.95 |
258 |
1.62 |
1.95 |
15.45 |
967 |
HW 3 |
|
NP-23-392 |
No significant values |
HW 2 |
||||||||
|
NP-23-392 |
644.6 |
646.6 |
2 |
1.55 |
40 |
1.96 |
0.62 |
11.4 |
602 |
Napoleon |
|
NP-23-393 |
258.15 |
259.2 |
1.05 |
0.8 |
204 |
3.52 |
1.42 |
6.52 |
706 |
HW 4 |
|
NP-23-393 |
485.35 |
486.35 |
1 |
0.6 |
65 |
0.38 |
1.34 |
13.85 |
627 |
HW 3 |
|
NP-23-393 |
No significant values |
Napoleon |
||||||||
|
Table 1: Downhole drill intersections from the holes completed along the Napoleon main and vein splays. Note: AgEq = Ag g/t x Ag rec. + ((Au g/t x Au Rec x Au price/gram)+(Pb% x Pb rec. X Pb price/t) + (Zn% x Zn rec. X Zn price/t))/Ag price/gram. Metal price assumptions are $24.00/oz silver, $1,800/oz gold, $2,424.4/t lead and $2,975.4/t zinc. Metallurgical recoveries assumed are 93% for silver, 90% for gold, 94% for lead and 94% for zinc. Metallurgical recoveries used in this release are from metallurgical test results of the Napoleon vein (see press release dated February 17, 2022). |
|
Drillhole |
Easting |
Northing |
Elevation |
Azimuth |
Dip |
Depth |
|
NP-23-365A |
403,888 |
2,586,230 |
434 |
270 |
-49 |
636.0 |
|
NP-23-370 |
403,891 |
2,586,232 |
434 |
258 |
-40 |
534.0 |
|
NP-23-374 |
403,967 |
2,586,189 |
467 |
267 |
-43 |
621.0 |
|
NP-23-378 |
403,967 |
2,586,189 |
467 |
268 |
-52 |
674.0 |
|
NP-23-380 |
403,967 |
2,586,189 |
467 |
268 |
-56 |
702.0 |
|
NP-23-383 |
403,967 |
2,586,189 |
467 |
270 |
-60 |
750.0 |
|
NP-23-386 |
403,856 |
2,586,035 |
450 |
271 |
-60 |
582.0 |
|
NP-23-388 |
403,849 |
2,586,432 |
477 |
253 |
-68 |
705.0 |
|
NP-23-391 |
403,854 |
2,586,086 |
449 |
271 |
-63 |
558.0 |
|
NP-23-392 |
403,849 |
2,586,432 |
477 |
270 |
-61 |
738.0 |
|
NP-23-393 |
403,683 |
2,586,973 |
480 |
251 |
-57 |
582.0 |
|
Table 2: Napoleon vein drillhole details. Coordinates in WGS84, Zone 13. |
The above references an opinion and is for information purposes only. It is not intended to be investment advice. Seek a licensed professional for investment advice. The author is not an insider or shareholder of any of the companies mentioned above.
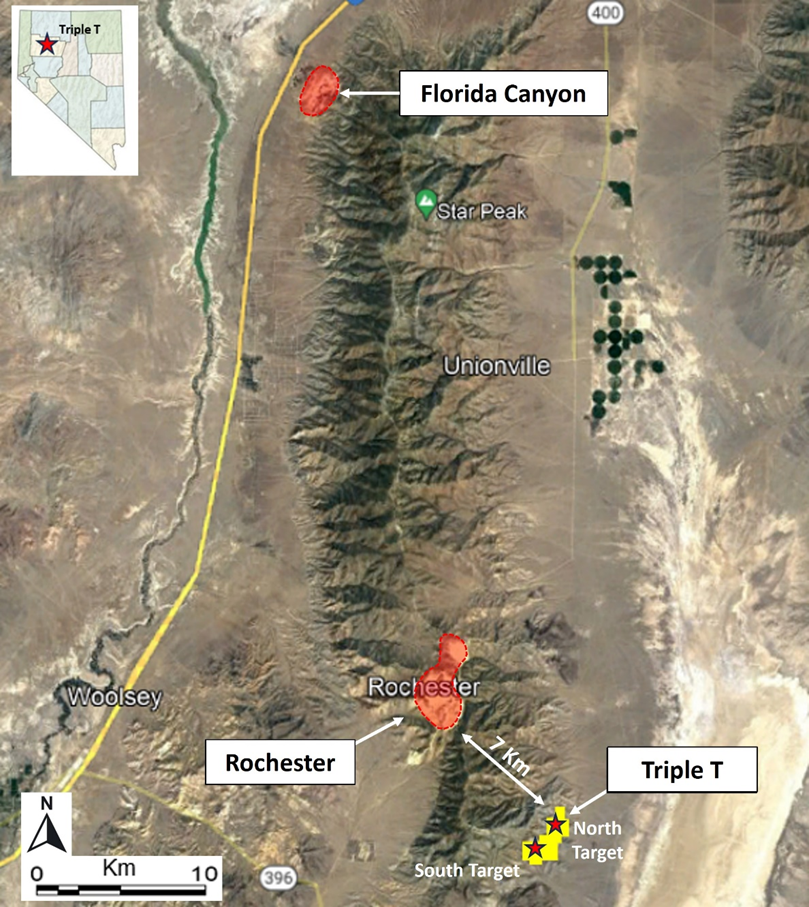
NV Gold (TSXV:NVX) has released assay results from its recently completed Reverse Circulation (RC) Drill Program at the Triple T Gold Project in the Humboldt Range, Nevada. The Project’s location is 7 kilometres east of the Rochester silver-gold operation and 42 kilometres southeast of the Florida Canyon Gold Mine.
John Watson, Chairman of NVX, commented in a press release: “Our recent successful drilling at Triple T, combined with detailed geologic mapping and structural interpretation has illuminated new targets and expanded dimensions for this project. Recent sampling of numerous outcropping quartz veins north of the drilling area has the potential to enlarge the mineralized zone even further. We are very pleased with the results of the program and are excited about the potential of the project going forward.”
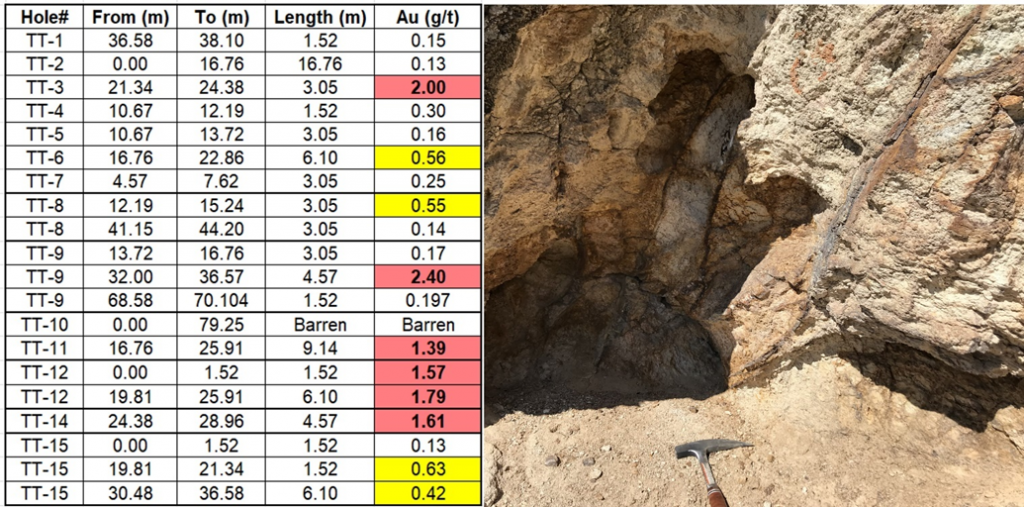
The program included 14 shallow RC drill holes, totaling 719.3 meters, in the northern-most of the three target areas. The majority of these drill holes intersected one or more near-surface mineralized quartz veins. Some of the notable findings include up to 4.57 meters averaging 2.40 g/t Au in hole TT-9 and 9.14 meters averaging 1.39 g/t Au in hole TT-11.
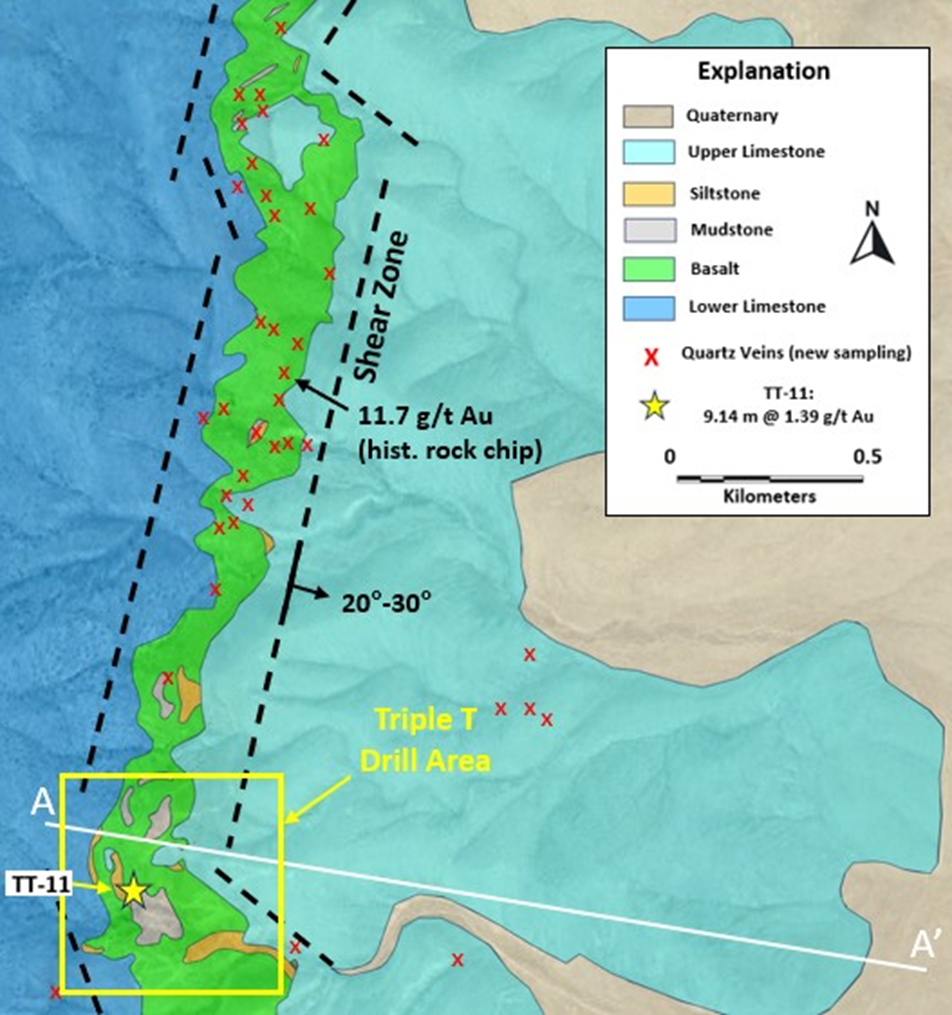
Recent drilling and mapping have also confirmed the presence of a regional low-angle thrust plane (shear zone) that controls the Triple T gold mineralization over a strike length of up to 5 kilometers, with the possibility of further extensions beneath cover rocks. The North Target area measures 250 by 400 meters and remains open in several directions.
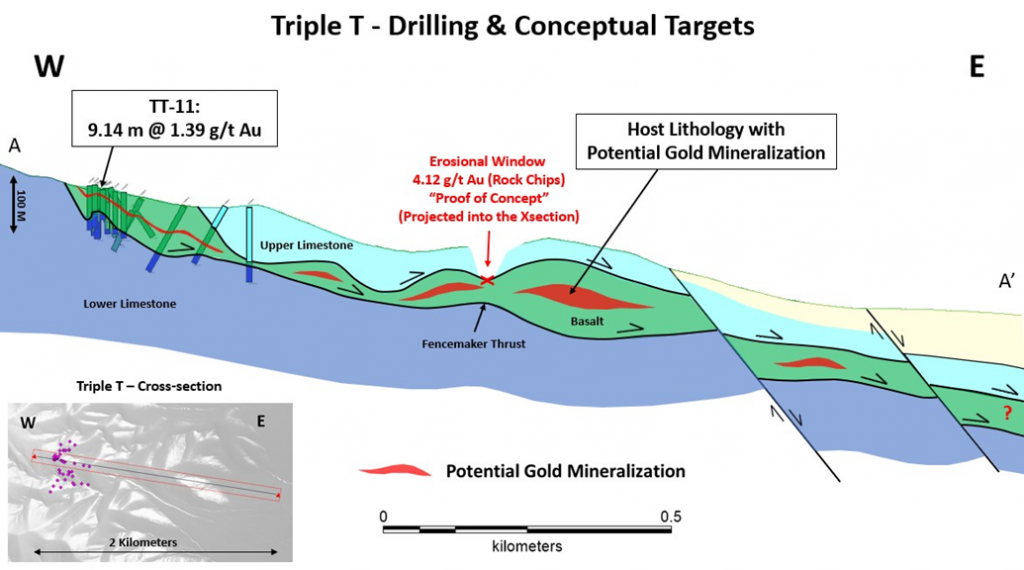
NV Gold now plans to conduct geophysical (Induced Polarization (IP)) investigations to identify potentially larger erosion-protected targets along the structural gold corridor. The aim is to explore further underneath the carbonate unit to the east (Upper Limestone), expanding the knowledge of gold mineralization in the area.
The above references an opinion and is for information purposes only. It is not intended to be investment advice. Seek a licensed professional for investment advice. The author is not an insider or shareholder of any of the companies mentioned above.
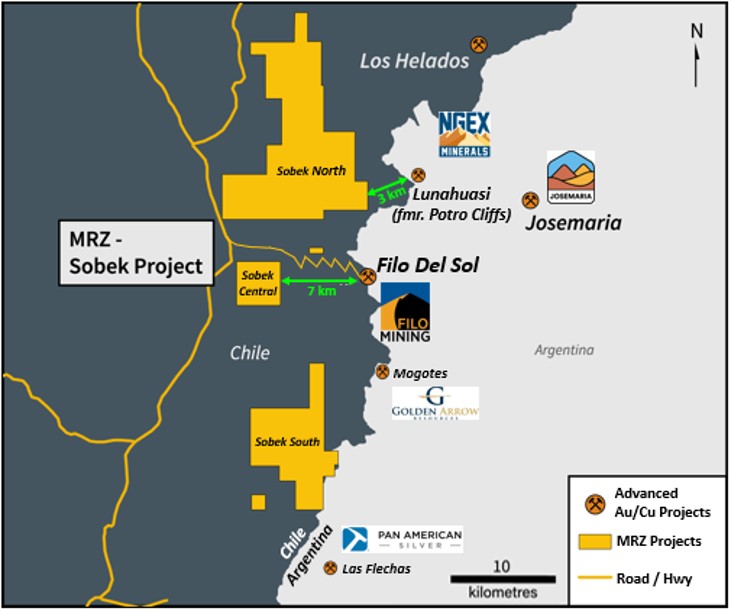
Mirasol Resources (TSXV:MRZ) announced inconclusive results from their preliminary drill program at their wholly-owned Sobek Copper-Gold Project located in the Vicuña District of Chile. The drilling was halted before reaching the desired targets due to early winter weather in the high Andes.
This drill program began late in the drilling season following the completion of road construction which facilitated drill rig access. The drilling will continue and targets will be tested again in the fourth quarter of 2023. The Sobek Project was of interest to Mirasol because of its promising local geology. Notably, it is situated near the 2021 discovery of the high-grade feeder zone at the Filo del Sol gold-copper deposit and NGEx Minerals discovery at Lunahuasi.
Mirasol’s President, Tim Heenan, commented in a press release: “Mirasol is the only junior exploration company actively drilling in the middle of the high-profile Vicuña Copper-Gold district in northeast Chile where extraordinary discoveries continue to be made. In the interest of safety, our maiden drill campaign was suspended due to the onset of winter weather before we could adequately test our first targets. However, these early results have provided some important structural data which will help to refine our drill plans. We have only just started to scratch the surface at Sobek and high-priority targets of massive scale remain to be drill tested. We are excited to resume drilling in just a couple of months as soon as the weather allows for access.”
Sobek Central Details
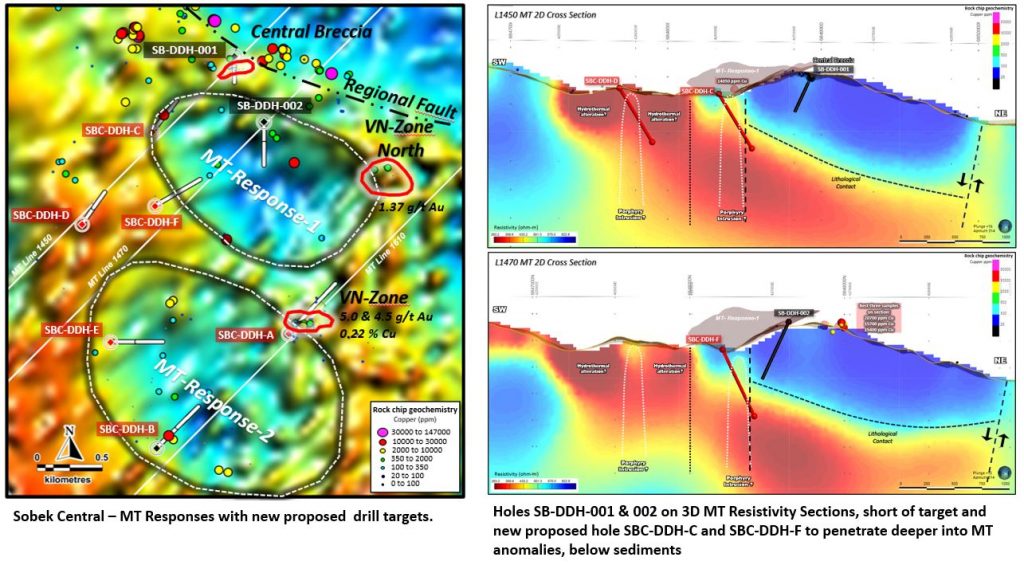
The Sobek Central’s initial two drill holes sought to test high-priority targets. However, the drilling was inconclusive. Drill hole SB-DDH-001, which intended to explore the source of surface soil grid anomalies around the Central Breccia Zone, was stopped at a depth of 352m due to a structural fault zone. Similarly, for safety concerns, drilling of hole SB-DDH-002 was halted at 586m without hitting its target. The drilling strategy will be reassessed based on these initial outcomes.
Construction of the drill access road is set to recommence in Q4 2023, ensuring better access to all Sobek Central targets.
Exploration of VN-Zone and Other Sites
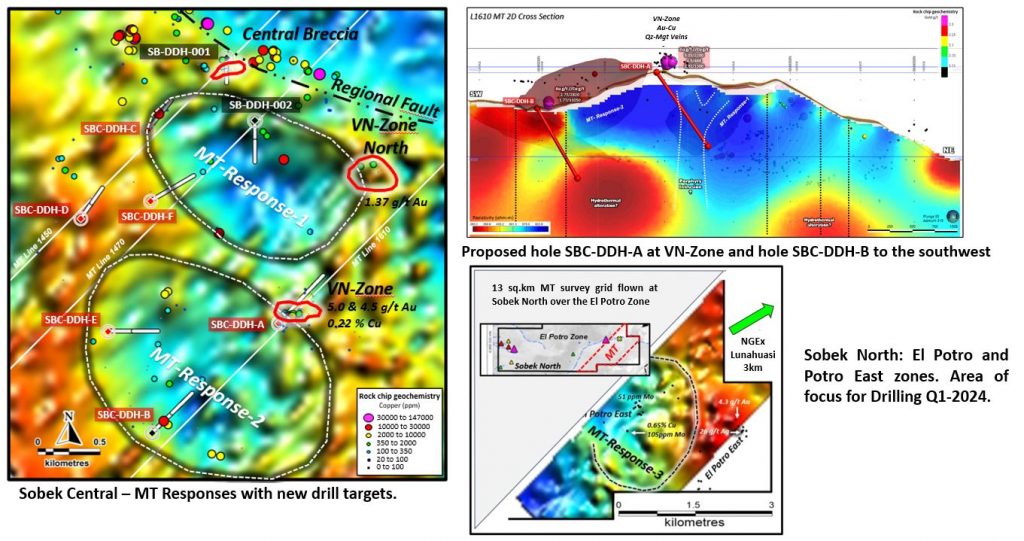
Late-season prospecting revealed high gold grades in the VN-Zone. Promising samples displayed results up to 5.0 g/t gold and 2,200 ppm copper. Plans are underway to evaluate the best locations and orientations for drilling this significant anomaly.
Additionally, a new mineral occurrence was identified near the VN-Zone, known as the VN-Zone North, yielding promising gold results. Exploration is also planned for the Sobek North Block, specifically the El Potro Zone.
Mirasol Resources anticipates resuming their maiden drill campaign in the fourth quarter of 2023, with an additional 3,400m of drilling scheduled to further explore priority targets at Sobek Central and Sobek North.
Highlights from the results are as follows:
- Sobek is located 7 km directly west of Filo Mining’s Filo del Sol Project and 3 km from NGEx´s new discovery at Lunahuasi
- Initial drill campaign cut short with only two targets partially tested, both require follow-up drilling
- Several compelling high-priority drill targets remain to be tested outlined by the Airborne Mobile MT survey coincident with geochemical anomalies and select high-grade surface samples
- Drill program to resume in early October when spring weather returns
- Planning for 3,400 meters of drilling distributed between Sobek Central and Sobek North (El Potro)
The above references an opinion and is for information purposes only. It is not intended to be investment advice. Seek a licensed professional for investment advice. The author is not an insider or shareholder of any of the companies mentioned above.

On August 6th, the Brazilian Senate held an important debate regarding “Fertilizers in Brazil”. Although Brazil has the potential to become the world’s foremost fertilizer producer, the nation produces only 20% of its fertilizer needs. Brazil’s current dependency on the international market has led to an alarming reliance on importing at least 80% of the fertilizers required for enhancing the quality and productivity of its crops.
Senator Laércio Oliveira (PP-SE) voiced concerns over Brazil’s susceptibility to global events, citing the ongoing conflict between Russia and Ukraine, which has heightened the country’s dependence on foreign fertilizers and adversely affected its economy. He emphasized the pressing need to diversify imports and explore other nations as potential suppliers. Furthermore, Senator Oliveira pointed out that Russia accounts for 23% of Brazil’s fertilizer imports, with Brazil expending approximately US$ 15 billion on fertilizer imports in 2021 alone.
National Fertilizer Plan: A Vision for the Future
Senator Oliveira advocated for the National Fertilizer Plan, which ambitiously aspires to slash Brazil’s dependence on foreign fertilizers to about 50% by 2050. Alongside this, Senator Oliveira proposed the Fertilizer Industry Development Program, a project he pioneered. This project, as elucidated by Senator Eduardo Gomes (MDB-TO), intends to invigorate the domestic production of fertilizers by offering incentives to companies in the sector to invest in machinery, equipment, services, and the establishment of new factories.
The Need for National Production and Diversification
The emphasis on increasing national production resonated with many senators. Senator Angelo Coronel (PSD-BA) highlighted the current imbalance, with Brazil importing 8% of the world’s total fertilizer production but generating only 20% of its domestic consumption. Senator Mauro Carvalho Junior (União-MT) touched upon the environmental challenges linked to potassium chloride production, a fertilizer staple in Brazilian agriculture. He stressed the significance of supporting the entire productive sector, recognizing its role in employment and economic growth.
Natural Gas: A Key Component in Fertilizer Production
Rodolfo Saboia, the general director of the National Agency of Petroleum, Natural Gas, and Biofuels (ANP), underlined that fertilizer production heavily relies on natural gas. He acknowledged the challenges of ensuring affordable gas prices but assured the agency’s commitment to enhancing natural gas supply at competitive prices.
Several representatives from multiple national ministries weighed in on the importance of fertilizers for Brazil. Vitor Eduardo de Almeida Saback, from the Ministry of Mines and Energy, emphasized that fertilizers, especially NPK (nitrogen, phosphate, and potassium), are crucial for improving agricultural productivity. Bruno Santos Abreu Calligaris, from the Ministry of Development, underscored the necessity for Brazil to innovate and adapt fertilizer technology to its unique tropical environment, aligning with sustainability and environmental preservation.
Brazil Potash and the Autazes Potash Project: A Step Towards Self-Reliance
Brazil Potash stands out as a major step in Brazil’s quest to reduce its reliance on potash imports. The potash mining company, strategically located, aims to curtail Brazil’s over 95% dependence on potash imports, offering a sustainable alternative for a country that has predominantly relied on overseas potash supplies.
Its flagship venture, the Autazes Potash Project, situated 120 km southeast of Manaus, is a testament to Brazil Potash’s commitment. With the endorsement of the Brazilian government, this project has the potential to cater to 20% of Brazil’s potash requirements. Utilizing 85% renewable energy resources, the project endeavours to mitigate carbon emissions and minimize environmental implications.
Central to Brazil Potash’s operation is the potash extraction process, extracting potash from depths of 800 meters and refining it into fertilizer that fortifies soil and augments agricultural productivity. The company’s efforts are intrinsically tied to ensuring nutritious food reaches consumers.
Emphasizing sustainable growth, Brazil Potash establishes strong ties with communities, public agents, and NGOs. Their commitment to environmental preservation and indigenous rights is evident in the meticulous preliminary environmental studies conducted for the Autazes Potash Project.
By welcoming investors aligned with its vision, Brazil Potash hopes to challenge the existing Canadian-Russian potash duopoly, signalling a transformative phase in Brazil’s potash sector.
A Need to Bolster Domestic Production Quickly
Brazil’s current dependency on foreign fertilizers underscores the importance of bolstering domestic production and seeking alternative international suppliers. The initiatives proposed by Senator Laércio Oliveira and the promise of projects like the Autazes Potash Project by Brazil Potash are important steps toward guaranteeing Brazil’s agricultural sector thrives without compromising its economic and environmental interests.
The above references an opinion and is for information purposes only. It is not intended to be investment advice. Seek a licensed professional for investment advice. The author is not an insider or shareholder of any of the companies mentioned above.
Adriano Espeschit, the President of Potássio do Brasil, recently provided an insightful lecture on “Potassium Mining in the Amazon – Food Security for Brazil and the World” as part of the 2023 lecture cycle of the Associação Paulista de Engenheiro de Minas (APEMI). The focus of his discussion was the Autazes Potassium Project, which is currently under the environmental licensing process.
The Autazes Potash Project, under the umbrella and management of Brazil Potash, is located in the Amazonas region. The project has substantial potential to revolutionize Brazil’s potash landscape. Targeting potash, a vital mineral for producing potassium-rich fertilizers, the project has the capability to produce an estimated 2.2 million tonnes annually when fully operational.
The strategic location of the project, the proximity to major farming regions, and access to renewable energy sources equip the project for success. It offers the opportunity to reduce Brazil’s reliance on imported potash while also boosting local and national economies through job creation and revenue generation.
Consultation and Consent Protocol
Espeschit highlighted the consultation and consent protocol involving the indigenous Mura de Autazes and Careiro da Várzea people. The protocol comprises seven steps to inform the Autazes community and the region about the Potássio project. Currently, the project is transitioning through the third and fourth steps of this phase.
Impact on Agribusiness and Regional Development
The Autazes Potash Project promises significant benefits to Brazilian agribusiness and the regional development where it will be established. Espeschit emphasized the potential reduction of fertilizer imports, crucial for the country’s agricultural sector. Moreover, the project will contribute to regional infrastructure development, including paving the connecting road between Vila de Urucurituba and Lago de Soares and constructing a port near Vila de Urucurituba in Autazes.
Espeschit also shed light on the potassium chloride extraction process and the underground mining method using chambers and pillars.
Socioeconomic and Environmental Commitments
Potássio do Brasil has committed to hiring 80% of local labor, thus promising substantial job creation for the local community. Moreover, the company plans to implement over 30 socioeconomic-environmental projects in Autazes.
Espeschit reiterated the company’s environmental responsibility, promising no residues left on the surface of the project. Moreover, there’s a commitment to reforest an area ten times larger than that used for the implementation of the enterprise, demonstrating a solid commitment to environmental sustainability.
Nourishing Communities and Promoting Sustainable Agriculture
Beyond its mining activities, Brazil Potash is committed to transforming the lives of residents in the communities where it operates. The company has made considerable contributions to tackle food security issues in many parts of Brazil. During the COVID-19 pandemic, large quantities of food were donated to the local communities surrounding the Autazes Potash Project.
In addition to addressing immediate food security needs, Brazil Potash has also demonstrated commitment towards promoting sustainable agriculture within these communities. The company recently donated over 5,000 seedlings grown in their nursery located in the Urucurituba village in the Autazes municipality to the Amazonas state government. This initiative not only boosts rural production and promotes food security, but it also contributes to climate change mitigation by sequestering greenhouse gasses.
The Future of Potash Mining
Espeschit’s insightful discussion at APEMI’s lecture series underlined the Autazes Potash Project’s potential in revolutionizing the potash landscape in Brazil. The project’s substantial benefits extend from agribusiness to local communities and sustainability initiatives. As the project navigates through its licensing phase, it has the potential to contribute to Brazil’s potash self-sufficiency, job creation, and socio-environmental development.
The above references an opinion and is for information purposes only. It is not intended to be investment advice. Seek a licensed professional for investment advice. The author is not an insider or shareholder of any of the companies mentioned above.
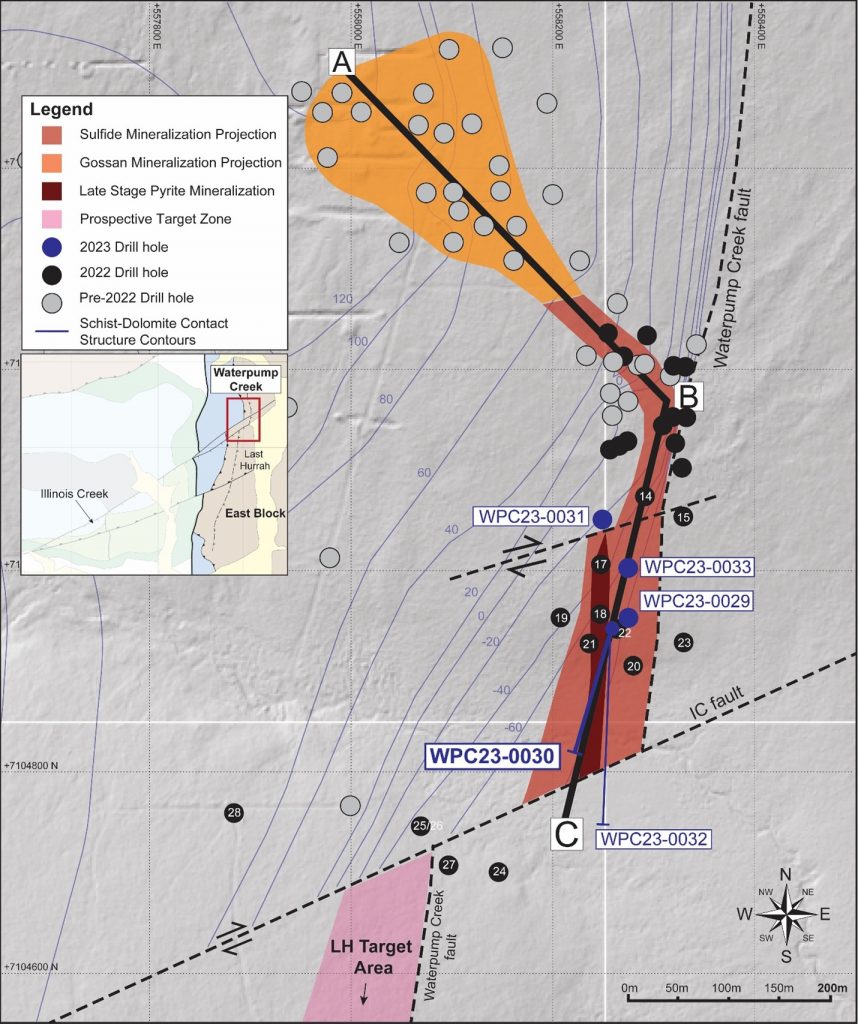
Western Alaska Minerals (TSXV:WAM) has released the initial assay results from the step-out phase of its second-year of drilling at the Waterpump Creek Carbonate Replacement Deposit. The results indicate that Hole WPC23-0030 has expanded the Waterpump Creek zone to 495 meters in strike length.
The hole was part of a two-drill program aiming to examine the continuation of the Waterpump Creek system southwards. Notably, this hole was drilled from the same pad as WPC22-022, albeit at an angle of -70° facing south. WPC22-022 had previously been identified as intersecting a structure believed to be a feeder chimney, with several high-grade zones of mineralization, as reported on December 7, 2022. Further details on these findings, along with intercepts from other drills, were provided in a press release dated July 6, 2023, which also detailed the outcomes from the step-out hole WPC23-0032 that identified the Illinois Creek fault’s location.
Kit Marrs, CEO of Western Alaska Minerals, commented in a press release: “We welcome this proof that high-grade mineralization at Waterpump Creek remains open to the south and that the distinctive CRD alteration seen there is turning up in our drilling 700m farther south at Last Hurrah. We look forward to continuing drilling at Last Hurrah to find the sulphides that the alteration is telling us should be nearby and trace it back towards WPC, which may just be the tip of the finger of a major CRD manto”.
Characteristically, the intercepts mentioned are dominated by in-situ gossan intertwined with residual galena. Throughout the intercepts, Pb and Zn carbonates and oxides are observed. The identified gap in mineralization from 249.3 to 262.1 in the referenced table is attributed to a significant amount of late-stage pyrite, comparable to what was found in WPC22-018 and WPC22-022.
When considering this year’s results, along with data from the previous 26 drill holes at Waterpump Creek, there’s confirmation of the continuity of massive sulfides ranging between 30 to 75 meters in width and 495 meters in length, which show a gentle plunge towards the south.
Update on Phase II Drilling at Last Hurrah Target
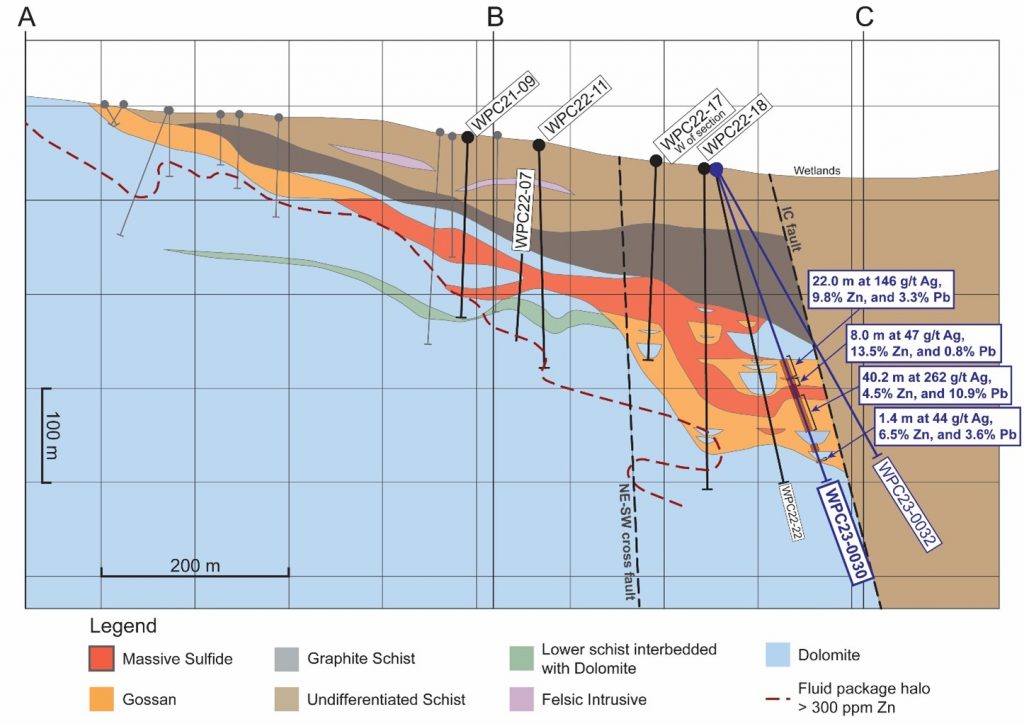
The initial drilling at the Last Hurrah target, which is situated 700 meters south of Waterpump Creek, has been completed. Positioned across the Illinois Creek fault from Waterpump Creek, Last Hurrah was earmarked as a potential site due to a reinterpretation of past geology, soil geochemistry, geophysical examinations, and previous drills carried out by Anaconda and NovaGold.
Four holes, spaced at intervals of approximately 120 meters, were drilled along an east-west line, focusing on the north-south-aligned alteration vectors. These holes aimed to pinpoint mineralization in this previously uncharted territory. Each of these holes revealed widespread and intricate alteration, including signs of sanding, bleaching, and UV fluorescence. This suggests that the area experienced multiple episodes of hydrothermal fluid activity. Hole LH23-0005 was a standout, displaying the distinct “Barbeque Rock” fluorescence (vivid orange and pink under Shortwave UV), accompanied by anomalous Pb and Zn values as evidenced by a hand-held XRF Analyzer.
These findings are consistent and similar to the data from hole WPC22-021, which was drilled 30 meters away from the high-grade sulfide intercept in hole WPC22-022, strongly hinting at the close vicinity of mineralization.
Highlights from the results are as follows:
- Step-out drill hole WPC23-0030:
- Cumulative 71.6 meters of multiple high-grade zones
- 22.0m of 146 gpt Ag (4.7 opt), 3.3% Pb and 9.8% Zn
- 40.2m of 262 gpt Ag (8.4 opt), 10.9% Pb and 4.5% Zn, including
- 5.3 meters of 729 gpt Ag (23.4 opt), 24.1% Pb and 3.1 % Zn, and
- 8.6 meters of 493 gpt Ag (15.8 opt), 22.9% Pb and 2.6% Zn
- Extends the WPC system at least 45 meters down plunge to the south and demonstrates continuity of the system.
- Extends WPC system to 495m in total length.
- Cumulative 71.6 meters of multiple high-grade zones
- Last Hurrah Drilling:
- The Company is excited to share visuals from the first drilling at Anaconda’s “Last Hurrah”* target, which appears to be an offset continuation of Waterpump Creek. Hole LH23-0005 cut 21.4m of strongly ultraviolet fluorescent “Barbecue Rock” in “Fugitive Calcite” veining, a proximal “exhaust” feature of CRD mineralization according to CRD expert, Dr. Peter Megaw, technical advisor to WAM. Similar Barbeque Rock surrounds mineralization at the Waterpump Creek deposit, where it occurs within 25m to 50m of high-grade CRD massive sulphide mineralization.
Table 1. Drill intercepts within hole WPC23-0030.
| Hole | From | To | Thickness | Ag | Ag | Zn | Pb |
| (meters) | (meters) | (meters) | g/t | oz/t | % | % | |
| WPC23-0030 | 216.6 | 238.6 | 22.0 | 146 | 4.7 | 9.8 | 3.3 |
| WPC23-0030 | 241.4 | 249.3 | 8.0 | 47 | 1.5 | 13.5 | 0.8 |
| WPC23-0030 | 260.6 | 300.8 | 40.2 | 262 | 8.4 | 4.5 | 10.9 |
| Including | 264.7 | 270.1 | 5.3 | 729 | 23.4 | 3.1 | 24.1 |
| Including | 278.3 | 286.9 | 8.6 | 493 | 15.8 | 2.6 | 22.9 |
| WPC23-0030 | 334.6 | 336.0 | 1.4 | 44 | 1.4 | 6.5 | 3.6 |
*All intercepts are core length; true widths have not been determined for the above intercepts but are thought to be greater than 80% of actual drill thicknesses.
Table 2. Hole Location table.
| Hole | Azimuth | Dip | Length (m) | UTM East (m) | UTM North (m) | Elevation (m) |
| WPC23-0030 | 185 | -70 | 365.2 | 558260 | 7104945 | 87 |
The above references an opinion and is for information purposes only. It is not intended to be investment advice. Seek a licensed professional for investment advice. The author is not an insider or shareholder of any of the companies mentioned above.
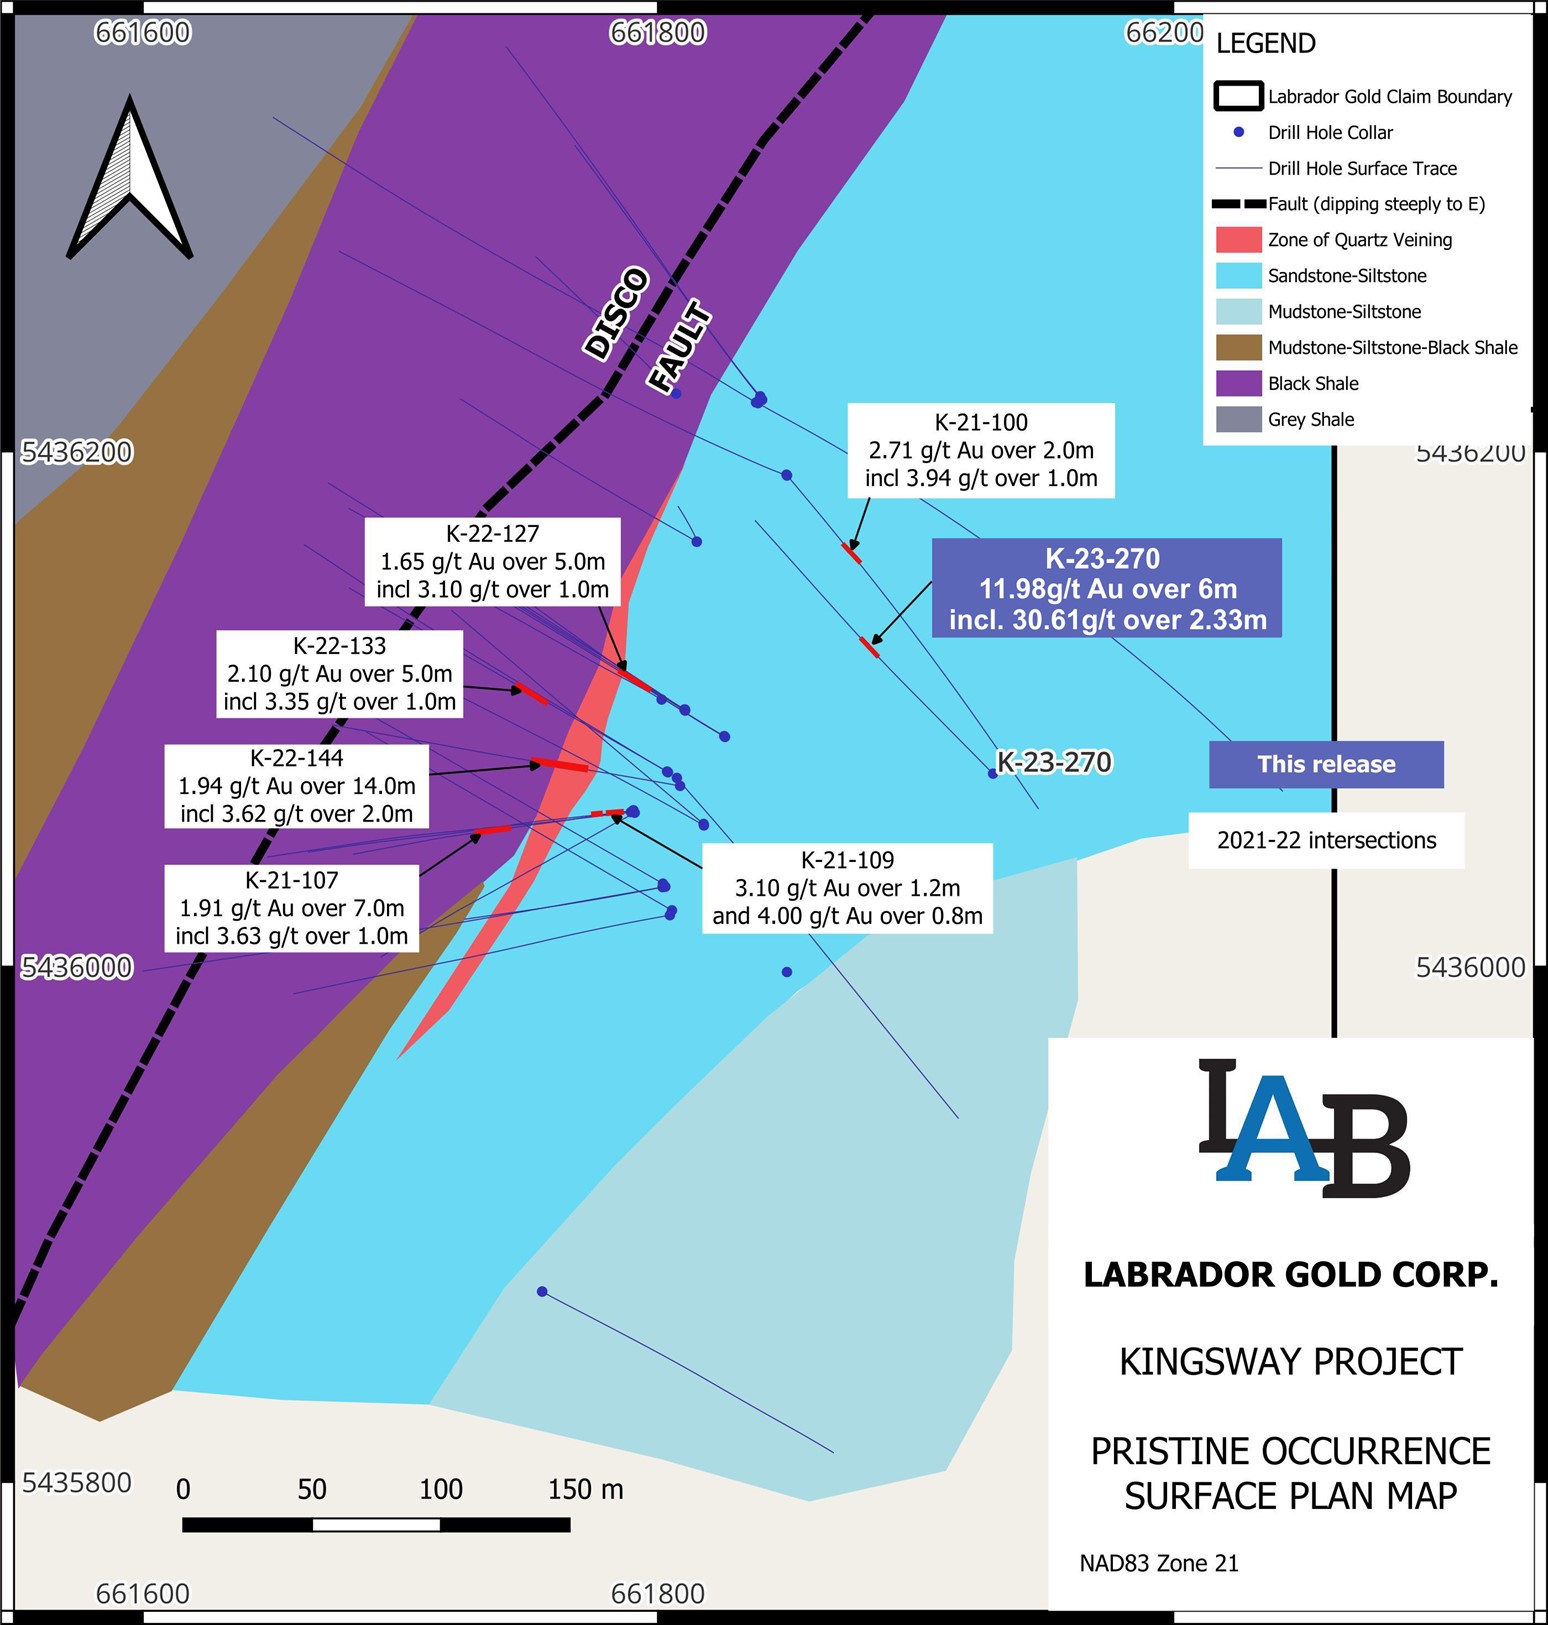
Labrador Gold (TSXV:LAB) has reported data from its recent drill tests in the Appleton Fault Zone. The tests are part of Labrador Gold’s ongoing 100,000-metre diamond drilling program at its wholly-owned Kingsway Project.
Roger Moss, President and CEO of Labrador Gold, commented in a press release: “Today’s result of high-grade, near surface gold mineralization at Pristine validates our belief that there is more to be found at Pristine. It is also the third discovery along the Appleton Fault Zone, after Big Vein and Dropkick, to produce such high grades associated with visible gold. Following our initial discovery of near surface visible gold at Pristine announced in May 2022, we did not intersect similar high-grades to those seen at Big Vein. As a result, we returned our focus to expanding Big Vein along strike and at depth and have successfully defined mineralization there over a 720-metre strike length. With near surface mineralization at Pristine now drilled over an approximate 160 metre strike length and the potential for high grades demonstrated, we are looking forward to receiving the permit to drill The Gap between Pristine and Big Vein, a distance of approximately 700 metres, as we continue to focus our drilling along the very prospective Appleton Fault Zone.”
The latest results from the Pristine site show a notable intersection of 11.98g/t Au spanning 6 metres from a depth of 91 metres, including an impressive 30.61g/t over 2.33 metres and 82.2g/t over 0.75 metres. Remarkably, Hole K-22-270 contained 77 grains of visible gold. All the mineral deposits identified at Pristine are situated above a vertical depth of 86 metres, covering an approximate strike length of 160 metres.
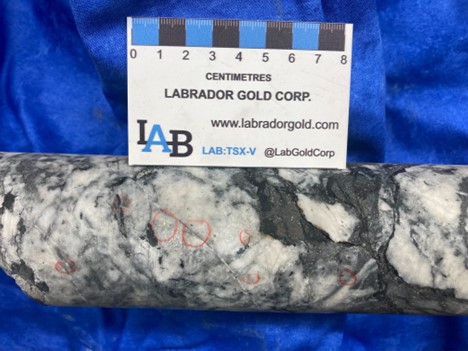
Initial drilling results from the DropKick site revealed 1.15g/t Au over 12.4 metres from a depth of 190.25 metres and 1.46g/t Au over 6.75 metres from 162.25 metres in Holes K-23-231 and K-23-251, respectively.
At the Big Vein site, the tests showed 1.10g/t Au over 9.3 metres from a depth of 195 metres and 1.47g/t Au over 6.55 metres from 107.88 metres in Holes K-23-246 and K-23-237, respectively.
To date, Labrador Gold has completed almost 83,000 metres of its proposed 100,000-metre drilling. Assessment results are awaited for approximately 8,877 metres of the core samples.
With a financial reserve of about $12 million, Labrador Gold is well-prepared to complete the remaining 17,000 metres of its drilling plan and to continue exploration for more potential drill targets within the property.
Highlights from the results are as follows:
| Hole ID | From (m) | To (m) | Interval (m) | Au (g/t) | Zone |
| K-23-270 | 91.00 | 97.00 | 6.00 | 11.98 | Pristine |
| including | 92.97 | 95.30 | 2.33 | 30.61 | |
| including | 94.00 | 94.75 | 0.75 | 82.20 | |
| K-23-251 | 162.25 | 169.00 | 6.75 | 1.46 | DropKick |
| including | 166.45 | 168.60 | 2.15 | 3.72 | |
| including | 167.00 | 168.60 | 1.60 | 4.48 | |
| K-23-250 | 152.40 | 152.80 | 0.40 | 6.87 | Big Vein |
| K-23-246 | 195.00 | 204.30 | 9.30 | 1.10 | Big Vein |
| including | 199.00 | 204.30 | 5.30 | 1.49 | |
| K-23-240 | 75.22 | 75.63 | 0.41 | 1.82 | DropKick |
| 86.00 | 90.72 | 4.72 | 1.16 | ||
| including | 86.00 | 88.68 | 2.68 | 1.51 | |
| K-23-237 | 93.00 | 120.00 | 27.00 | 0.63 | Big Vein |
| including | 107.88 | 114.43 | 6.55 | 1.47 | |
| K-23-234 | 100.55 | 101.90 | 1.35 | 1.02 | DropKick |
| 116.00 | 117.00 | 1.00 | 1.26 | ||
| K-23-231 | 190.25 | 202.65 | 12.40 | 1.15 | Dropkick |
| including | 197.45 | 201.60 | 4.15 | 1.78 | |
| including | 201.30 | 201.60 | 0.30 | 7.74 | |
| K-23-230 | 16.00 | 19.30 | 3.30 | 0.41 | Big Vein |
| K-23-229 | nsv | Big Vein SW | |||
| K-23-228 | 91.55 | 91.85 | 0.30 | 1.18 | DropKick |
| 122.35 | 123.15 | 0.80 | 2.63 | ||
| K-23-226 | nsv | Big Vein SW |
Table 1. Summary of assay results. All intersections are downhole length as there is insufficient Information to calculate true width.
| Hole ID | Easting | Northing | Elevation | Azimuth | Inclination | Total Depth |
| K-23-270 | 661930 | 5436075 | 52.0 | 315 | 45 | 187 |
| K-23-251 | 663167 | 5438130 | 58.2 | 140 | 65 | 229 |
| K-23-250 | 661554 | 5435471 | 53.0 | 125 | 70 | 320 |
| K-23-246 | 661272 | 5435093 | 62.4 | 145 | 45 | 250 |
| K-23-240 | 663365 | 5438261 | 60.2 | 140 | 45 | 128 |
| K-23-237 | 661352 | 5435080 | 45.8 | 145 | 45 | 280 |
| K-23-234 | 663304 | 5438259 | 55.9 | 140 | 45 | 266 |
| K-23-231 | 663303 | 5438259 | 56.3 | 140 | 65 | 260 |
| K-23-230 | 661737 | 5435329 | 44.7 | 20 | 45 | 208 |
| K-23-229 | 661133 | 5434768 | 42.9 | 140 | 45 | 173 |
| K-23-228 | 663348 | 5438353 | 54.7 | 140 | 65 | 126.2 |
| K-23-226 | 661176 | 5434794 | 42.3 | 140 | 45 | 528 |
Table 2. Drill hole collar details
The above references an opinion and is for information purposes only. It is not intended to be investment advice. Seek a licensed professional for investment advice. The author is not an insider or shareholder of any of the companies mentioned above.
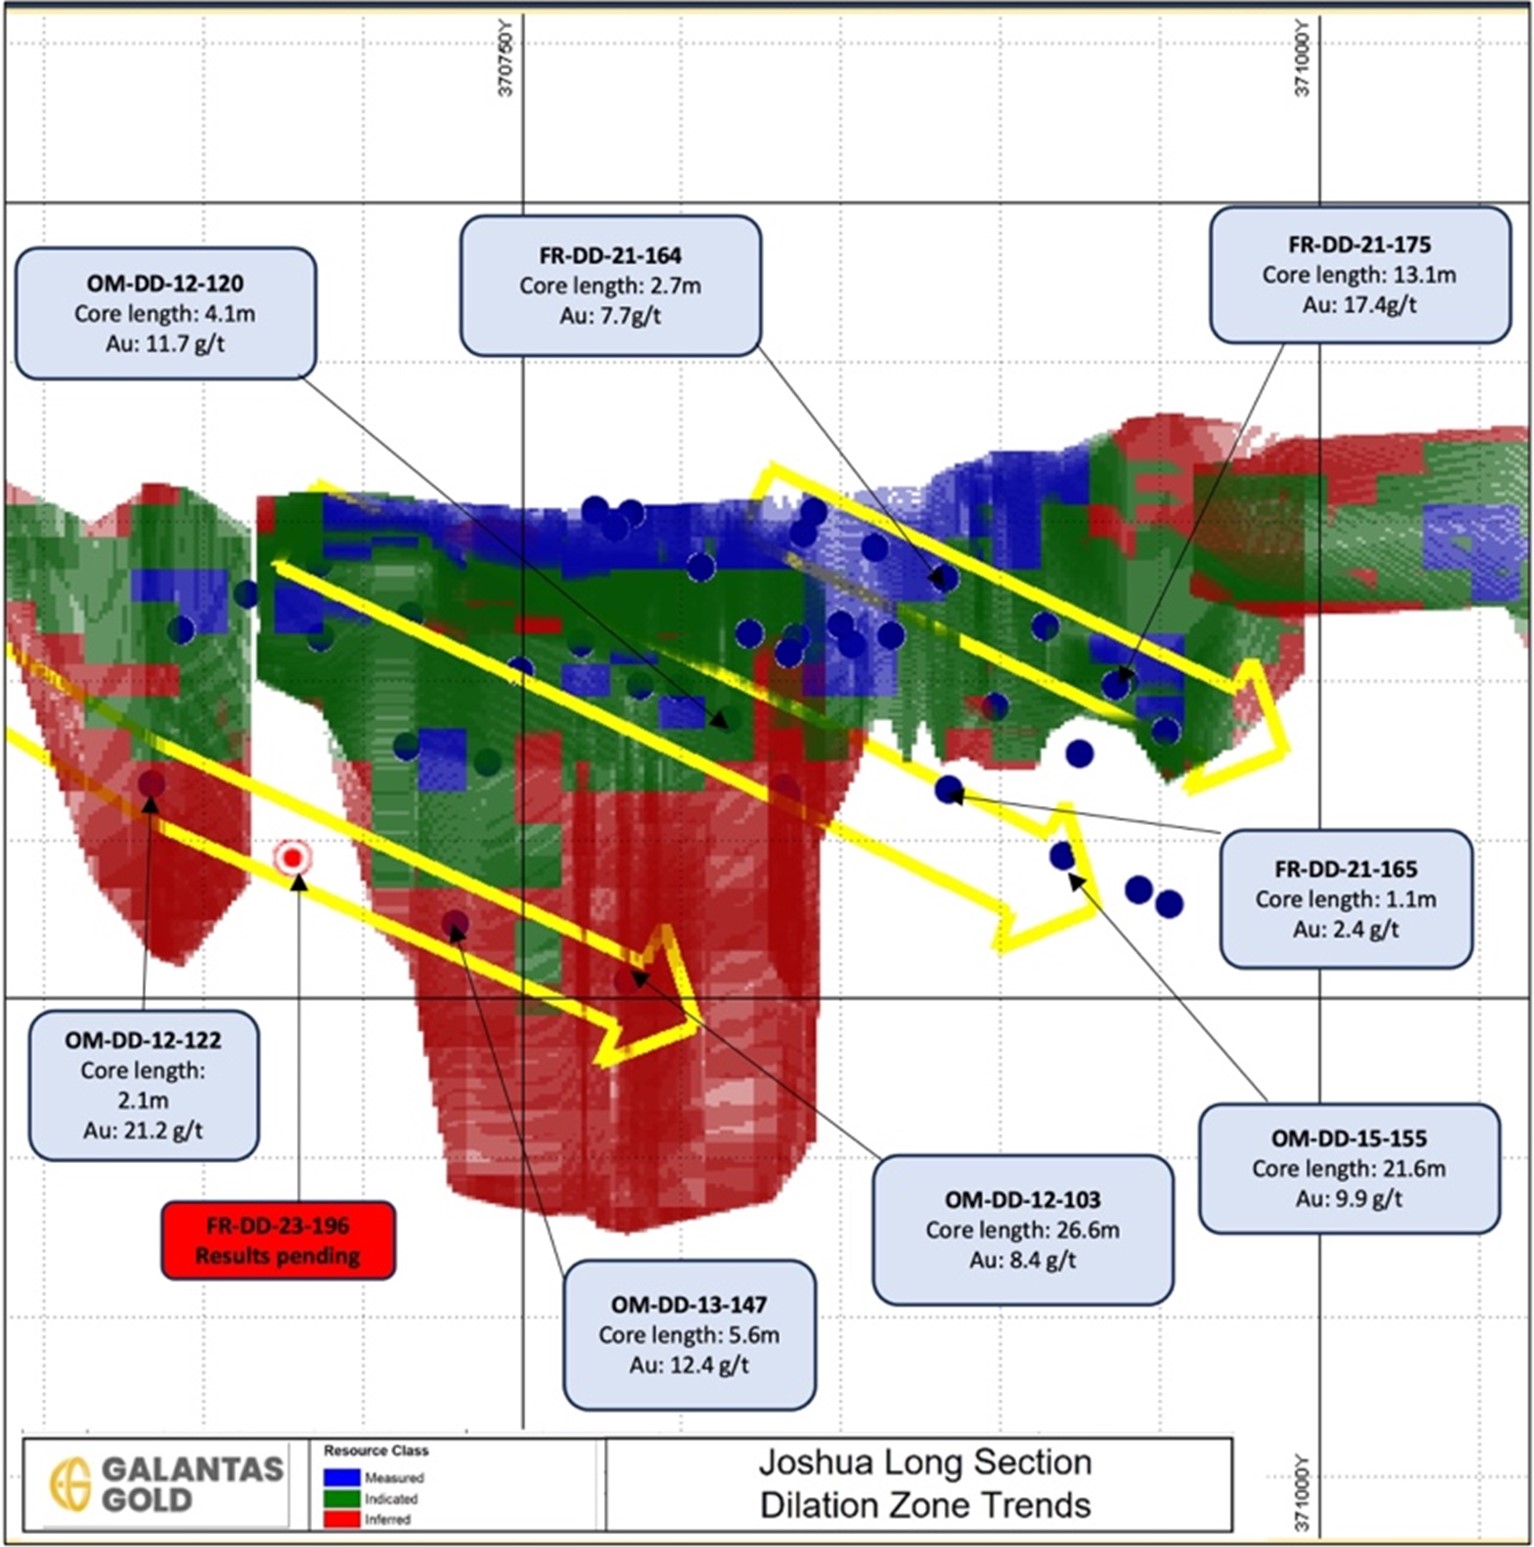
Galantas Gold Corporation (TSXV:GAL) has announced progress from its partnership with mining contractor QME Mining Services Ltd. Ireland for the company’s Omagh Gold Project in Northern Ireland. QME has delivered a contract mining plan which utilizes their skilled workforce and original equipment manufacturer (OEM) mining equipment.
Mario Stifano, CEO of Galantas, commented in a press release: “We are looking forward to having QME begin development work at Omagh, as it has the workforce and equipment to quickly commence development and mining with a plan to provide a sustainable 5,000 tonnes per month of mill feed. As we’ve kicked off drilling at the Joshua Vein from surface, we will focus on resource expansion at the Joshua and Kearney veins to expand known resources with a goal to increase the mill capacity from 180 tonnes per day to 500 tonnes per day. In addition, with the recent successful drilling at the Gairloch Project, including hole 23-GL-02 intersecting 1.88 g/t gold, 1.23% copper, 0.51% zinc, 0.01% cobalt and 4.64 g/t silver over 33 metres1, we will look to expand our exploration efforts in northern Scotland.”
QME has prior mining experience across Europe and was notably involved in the development and bulk sampling of Dalradian’s nearby gold project, situated 20 km from Omagh. This background makes them a suitable partner for this project.
The mining plan outlines that QME will begin with development mining at the Kearney and Joshua veins, expecting a period of 9 months, before anticipated ramping up to about 5,000 tonnes per month of both development and production mineralized material within 12 months of start-up. The estimated cost of development before steady-state production is approximately US$12 million.
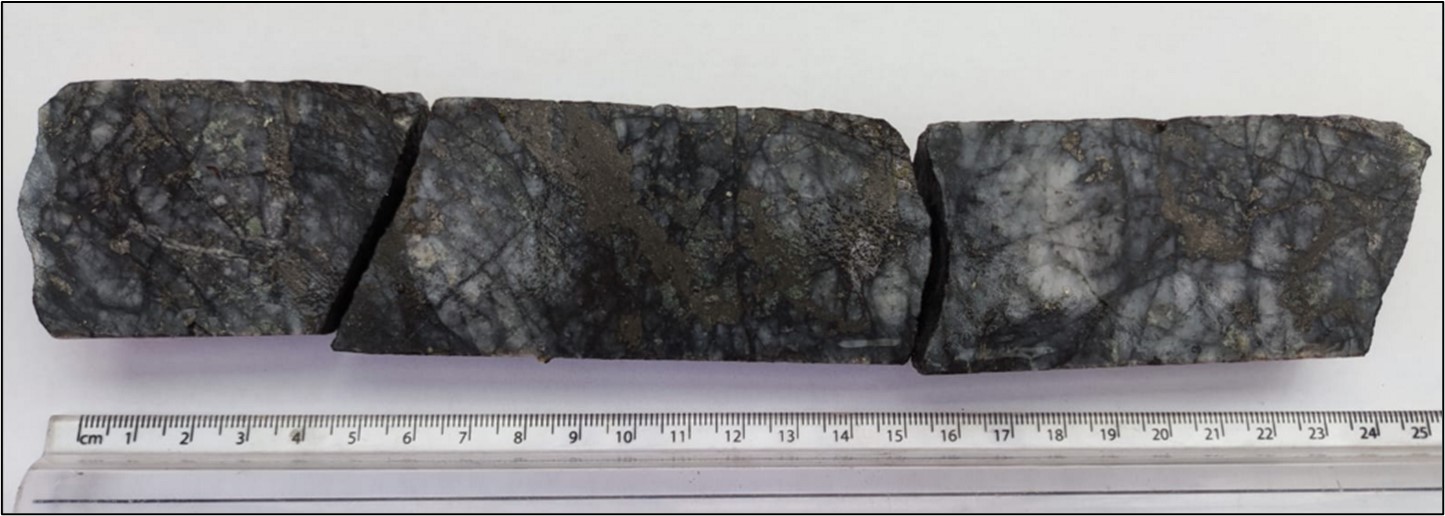
Galantas plans to mine the high-grade dilation zones, aiming for a monthly production of 1,200 to 1,400 gold ounces post-development. Multiple mine levels have been developed at both the Joshua and Kearney veins. Together with QME’s experienced underground workforce, the Company is considering an expansion to the existing permitted mill to increase the targeted annual production to 30,000 to 35,000 gold ounces per annum.
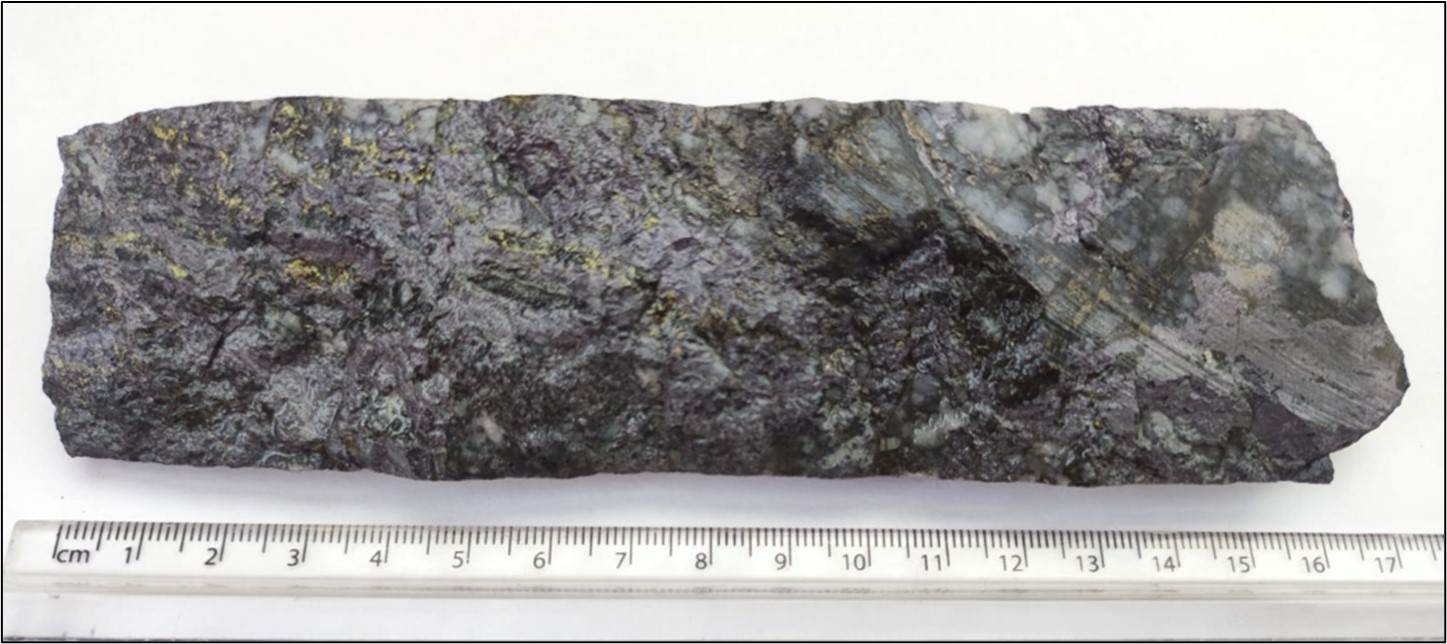
Galantas has also reported success in intersecting massive sulphides in drill hole FR-DD-23-196 at the Joshua Vein, marking the first exploration hole drilled from the surface in 19 months. This fills a significant gap in the earlier resource model. Assay results for this hole are pending.
The Joshua Vein’s high-grade dilation zones remain open along strike and down-plunge. Previously, the Company identified multiple wide high-grade intersections at Joshua, including 9.9 g/t gold over a 21.6-metre intersection, 8.4 g/t Au over 26.6 metres, and 17.4 g/t Au over 13.1 metres. More details can be found in Galantas’ news releases dated June 11, 2012, January 25, 2016, and January 31, 2022.
The above references an opinion and is for information purposes only. It is not intended to be investment advice. Seek a licensed professional for investment advice. The author is not an insider or shareholder of any of the companies mentioned above.
Brazil’s state-run oil corporation Petrobras is considering potential investments in Bolivia’s lithium-rich salt flats for industrial-scale projects, according to the country’s Energy Minister Franklin Molina.
In an interview with state-owned Bolivia TV on Tuesday, Molina detailed Petrobras’s interest in Bolivia, a nation focusing on electric vehicles and battery production. “They also showed an interest in visiting Bolivian salt flats and were motivated by our industrialization projects,” Molina said. He further highlighted that Bolivia’s government aims to progress on lithium, an essential component in battery technology.
On the same day, Bolivian President Luis Arce met with Petrobras CEO Jean-Paul Prates on the sidelines of an Amazon rainforest summit in Belem, Brazil. Later, Petrobras confirmed the meeting in a statement, which revealed that the discussions concentrated on evaluating “potential alliances and joint projects” in oil and gas, fertilizers, and “energy transition” projects. The latter term often refers to initiatives involving key battery metals like lithium.
Bolivia has extensive lithium resources within its vast salt flats, but commercial-scale production remains unrealized. A partnership with the Chinese battery manufacturer CATL is currently in the early stages.
Petrobras’s interest also extends to Bolivian natural gas, the country’s principal fossil fuel industry. “They’re not just talking about the continuity in exports of gas to Brazil, but also in developing future investments in new exploration projects to increase production,” Molina explained.
The Energy Minister also mentioned that a high-level Petrobras delegation focused on natural gas projects will visit Bolivia in the coming weeks, although he did not provide further details. Petrobras, in its statement, anticipates a company visit to Bolivia in September, suggesting continued collaboration and exploration of investment opportunities.
Lithium’s Crucial Role in Renewable Energy Transitions and the Growing Value in the Mining Industry
Lithium has become an essential material in the global push towards renewable energy and sustainability. Its unique electrochemical properties have made it a vital component in the batteries that power electric vehicles (EVs), renewable energy storage systems, and various consumer electronics.
The Rising Demand for Lithium
As governments around the world set ambitious goals to reduce carbon emissions and shift away from fossil fuels, the demand for EVs and renewable energy storage solutions has surged. This trend has, in turn, led to a significant increase in the demand for lithium, making its exploration and extraction a high-priority industry.
The growing need for lithium has led to increased exploration activities, focusing on regions rich in lithium deposits like salt flats and hard rock mines. Nations with substantial lithium reserves are finding themselves at the centre of a strategic global race to secure these resources. The value of lithium deposits has consequently skyrocketed, attracting investments and collaborations from various industries.
M&A Activities in the Mining Industry
The busy M&A environment in the mining industry further reflects the rising importance of lithium. Major corporations, startups, and even traditional oil and gas companies are engaging in partnerships, joint ventures, and acquisitions to stake their claims early in development.
The above references an opinion and is for information purposes only. It is not intended to be investment advice. Seek a licensed professional for investment advice. The author is not an insider or shareholder of any of the companies mentioned above.
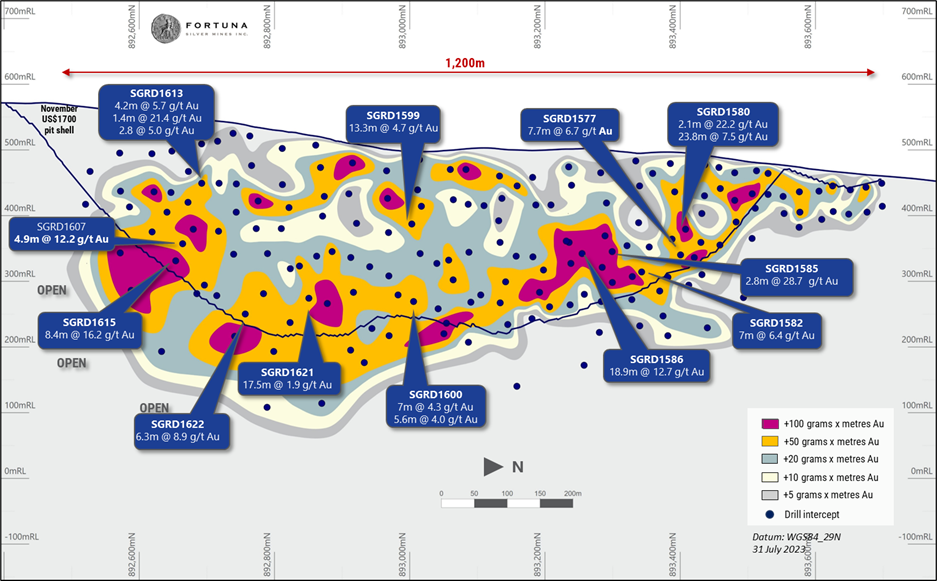
Fortuna Silver (TSX:FVI) has released details and results from its exploration program at multiple sites, including the Séguéla Mine in Côte d’Ivoire, the Yaramoko Mine in Burkina Faso, and the Baborigame Project in Mexico. In the Sunbird Deposit, infill drilling has been conducted to expand geological confidence, with 47 holes drilled that total 11,075 meters of a larger 15,126-meter program. This expansion is due to consistently positive results, up from the initially planned 9,500 meters. The drilling identified high-grade mineralization near the pit optimization limit, including significant intersections in drill holes SGRD1580 and SGRD1281. The findings will be utilized in an updated Mineral Resource and Mineral Reserve estimate, planned for release in the fourth quarter of 2023. Further drilling to investigate the depth potential of the southerly plunging high-grade shoots is scheduled for the latter half of 2023.
Paul Weedon, Senior Vice President of Exploration at Fortuna, commented in a press release: “Infill drilling at the Sunbird Deposit to upgrade geologic confidence has concluded, with the next phase of estimation, optimization, and design having commenced as part of reserve development and expected life-of-mine extension for the Séguéla Mine. With this underway, the focus has returned to generating new anomalies and testing prospects, with positive near surface results at Barana emphasising the regional potential; such as drill hole SGRD1647 intersecting 90.9 g/t Au over an estimated true width of 1.8 meters. Recent drilling of Zone 55 at the Yaramoko Mine has identified high grade mineralization extending at least 130 meters beyond the current resource envelope to the west, confirmed by recent mine development in the area, with intervals such as 32.8 g/t Au over an estimated true width of 3.1 meters in drill hole YRM-23-GCDD-203.
“In addition to the encouraging results from West Africa, first pass drilling to test geological concepts at our Baborigame Project in Mexico was successful in testing several vein arrays, intersecting multiple mineralized zones such as 2.7 g/t Au and 155 g/t Ag over an estimated true width of 4.04 meters in drill hole BAB-22-004.”
At the Barana and Badior prospects, a total of 30 holes equaling 3,907 meters have been drilled. The objective was to examine the strike extent and continuity of mineralization and to enhance understanding of the structures associated with mineralization controls. More drilling is expected later in the year.
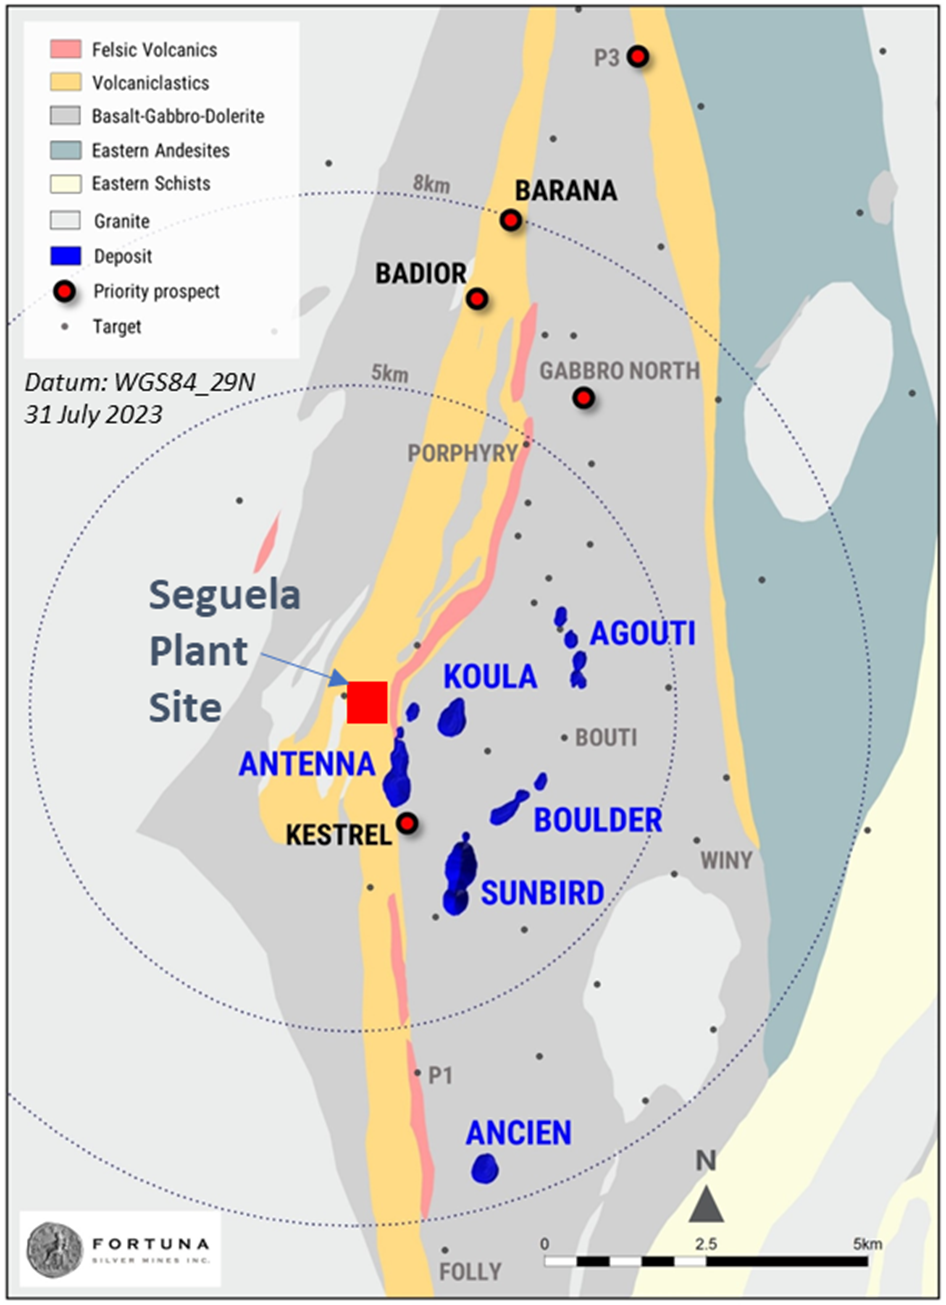
The Yaramoko Mine saw the completion of a 29-hole drilling program, amounting to 7,011 meters, testing various extents of high-grade extensions. Positive results have led to an expectation for an updated Mineral Resource and Mineral Reserve estimate for Yaramoko before year’s end. Drilling also revealed new high-grade mineralization beyond the 2022 Mineral Resource boundary and will continue to test depth potential in the second half of the year.
Additional drilling to the east has also discovered the Zone 55 mineralized structure beyond the previous limits, with promising results, including drill hole GCDD-224’s return of 8.9 g/t Au. Further exploration is planned for later in 2023.
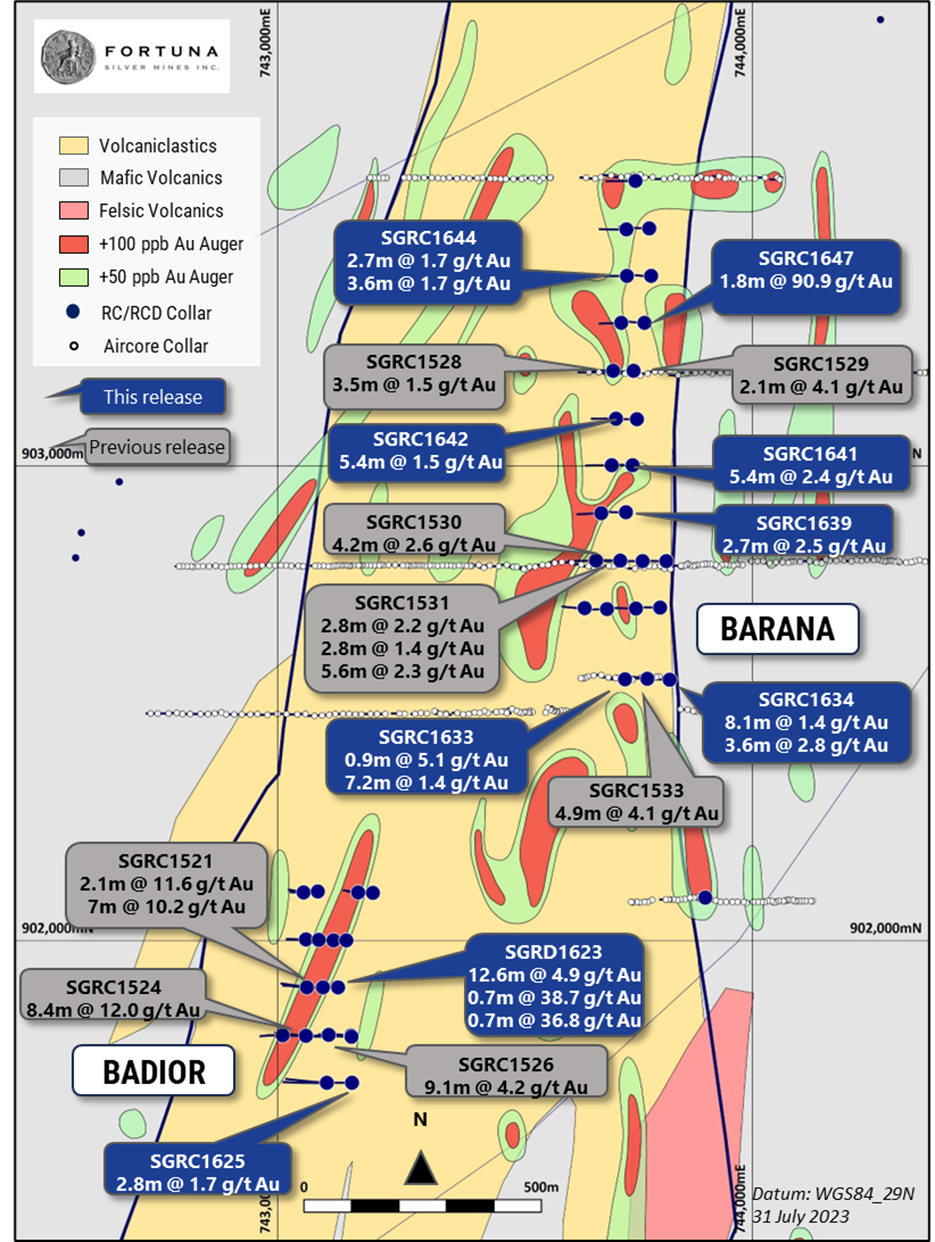
At the Baborigame Project in Mexico, 14 diamond drill holes across two phases totaling 3,902 meters were carried out as part of an evaluation. Located in southwestern Chihuahua, the exploration focused on key structural zones. Of the 14 drill holes, 10 returned positive exploration findings and further exploration is planned for the second half of 2023.
Highlights from the results are as follows:
Séguéla Mine, Cote d’Ivoire
Sunbird Deposit drilling highlights:
- SGRD1586: 12.7 g/t Au over an estimated true width of 18.9 meters from 147 meters
- SGRD1580: 22.2 g/t Au over an estimated true width of 2.1 meters from 115 meters and 7.5 g/t Au over an estimated true width of 23.8 meters from 128 meters
- SGRD1615: 16.2 g/t Au over an estimated true width of 8.4 meters from 270 meters
- SGRD1585: 28.7 g/t Au over an estimated true width of 2.8 meters from 151 meters
- SGRD1599: 4.7 g/t Au over an estimated true width of 13.3 meters from 81 meters
- SGRD1281: 10.7 g/t Au over an estimated true width of 5.6 meters from 199 meters (re-entered hole)
Barana and Badior drilling highlights:
- SGRD1647: 90.9 g/t Au over an estimated true width of 1.8 meters from 43 meters (Barana)
- SGRD1634: 1.4 g/t Au over an estimated true width of 8.1 meters from 77 meters (Barana)
- SGRD1641: 2.4 g/t Au over an estimated true width of 5.4 meters from 67 meters (Barana)
- SGRD1623: 4.9 g/t Au over an estimated true width of 12.6 meters from 110 meters (Badior)
Zone 55 drilling highlights:
- YRM-22-GCDD-184: 9.6 g/t Au over an estimated true width of 5.5 meters from 254.10 meters
- YRM-23-GCDD-203: 32.8 g/t Au over an estimated true width of 3.1 meters from 287.90 meters
- YRM-23-GCDD-205: 13.2 g/t Au over an estimated true width of 4.6 meters from 302.28 meters
- YRM-23-GCDD-224: 8.9 g/t Au over an estimated true width of 8.2 meters from 120.95 meters
- YRM-23-GCDD-227: 8.8 g/t Au over an estimated true width of 8.6 meters from 140.10 meters
Baborigame drilling highlights:
- BAB-22-004: 2.7 g/t Au and 155 g/t Ag over an estimated true width of 4.04 meters from 192.00 meters
- BAB-23-010: 3.3 g/t Au and 538 g/t Ag over an estimated true width of 1.20 meters from 191.00 meters
- BAB-23-009: 2.4 g/t Au and 314 g/t Ag over an estimated true width of 2.04 meters from 188.15 meters
The above references an opinion and is for information purposes only. It is not intended to be investment advice. Seek a licensed professional for investment advice. The author is not an insider or shareholder of any of the companies mentioned above.
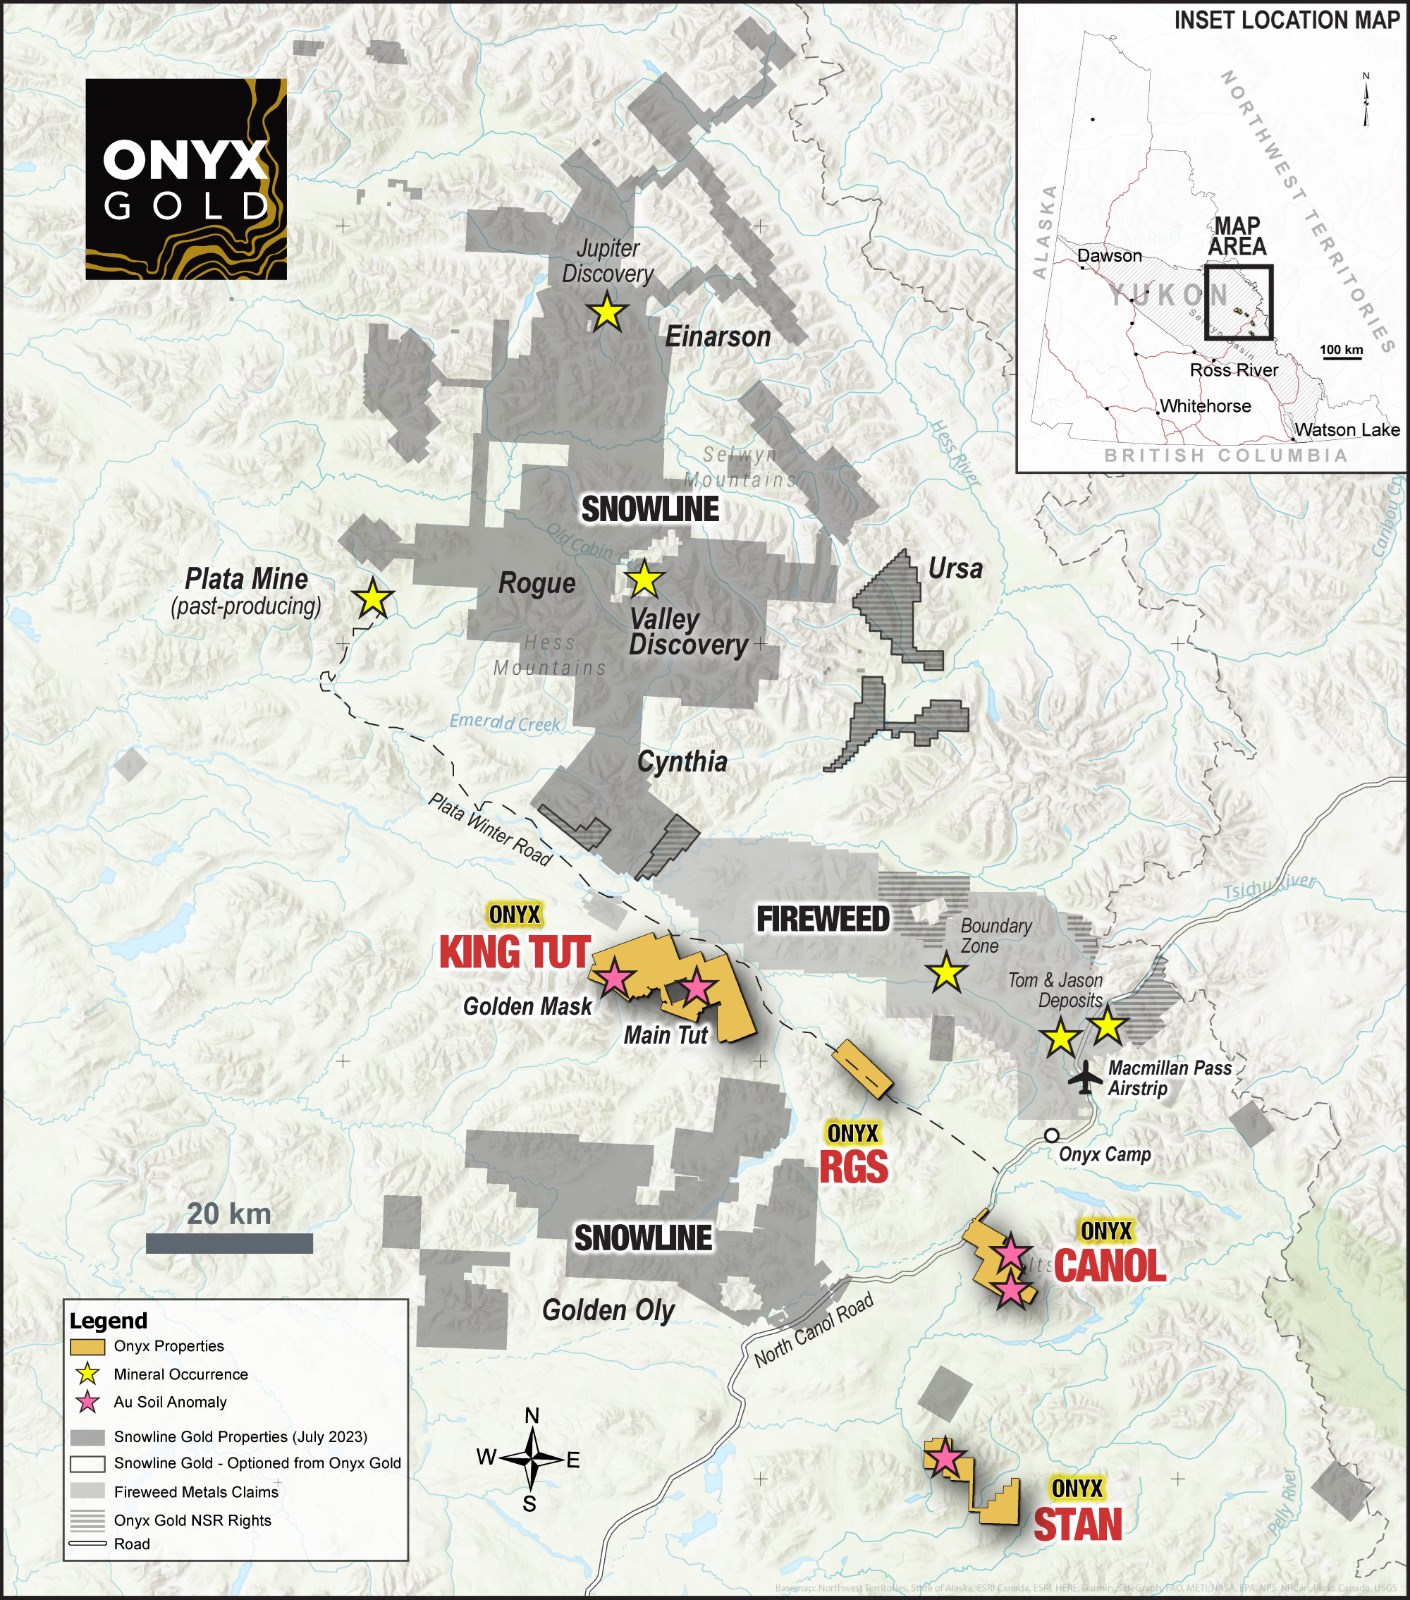
Onyx Gold (TSXV: ONYX) has initiated drilling at its King Tut Gold Project, situated in the Tombstone Gold Belt in east-central Yukon, Canada. The King Tut project, the most developed of the four properties owned by Onyx Gold in Yukon, displays high-grade gold-in-soil anomalies associated with reduced intrusions. This mineralization pattern is similar to the one found at Snowline Gold Corp’s recent Valley discovery at their Rogue project, located 50 km away.
Project crews have been working at the King Tut site since the beginning of July, conducting preliminary operations to refine targets. Drilling is currently underway at the first hole at the Main Tut gold-in-soil anomaly.
Brock Colterjohn, President & CEO of Onyx Gold, commented in a press release: “We’re very excited to launch the first-ever drill program at King Tut. Our first drill program will target two highly prospective gold anomalies at Golden Mask and Main Tut, which we believe are some of the best undrilled intrusive-related gold-in-soil anomalies in this emerging new gold district. In addition, our planned mapping, sampling, and drone-magnetic survey work programs represent a significant and extensive regional exploration program on a district-scale property that has seen no significant work completed in more than a decade. We look forward to communicating our progress to the market over the coming months.”
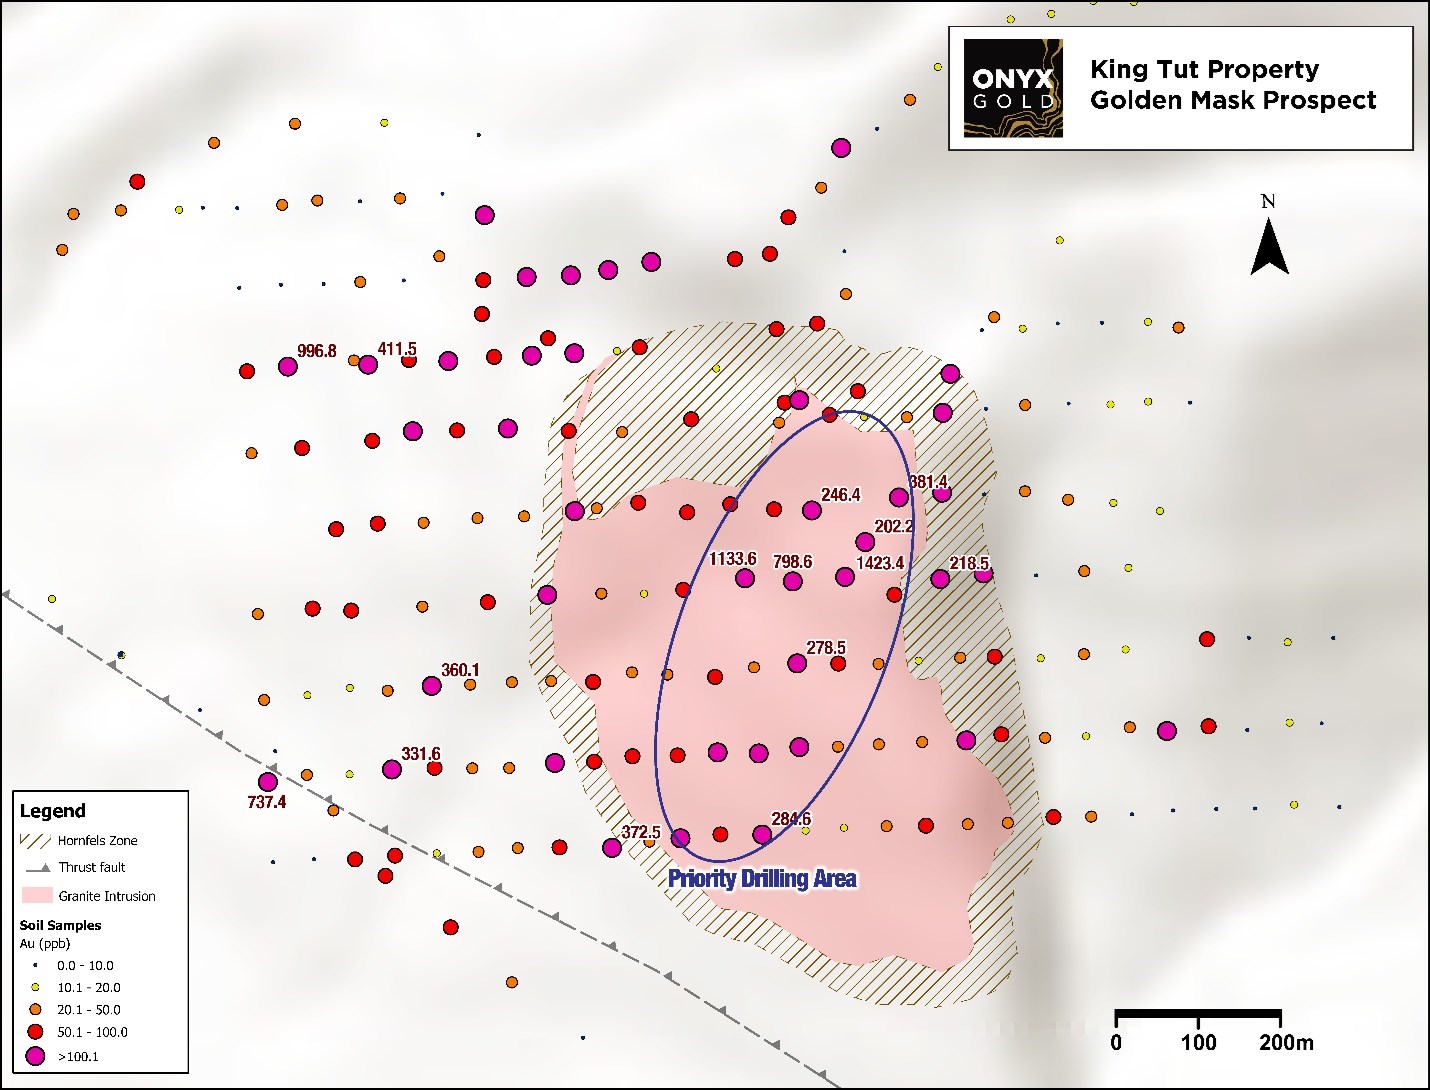
For the 2023 exploration program, the company aims to examine several extensive, undrilled gold-in-soil anomalies connected to identified felsic intrusive rocks and their contact with metamorphic ‘hornfelsed’ aureoles, as mapped by a previous company during the 2010 and 2011 field seasons. The exploration includes approximately 2,500 meters of helicopter-supported diamond drilling with one rig, primarily focusing on the Golden Mask and Main Tut anomalies.
The Golden Mask area, having several crucial characteristics of RIRGS deposits, will be the focus of about 75% of the drilling operations. The remaining 25% will be assigned to the Main Tut anomaly, targeting gold mineralization associated with thick (35-50 meter), tabular aplite with quartz-arsenopyrite vein material. This operation will be accompanied by extensive geological mapping, a planned 1,200 sample soil program, prospecting, rock sampling, airborne drone-magnetic surveying, and LIDAR imagery over the main anomalies to enhance drill targeting and property-wide evaluation to identify other potential areas for follow-up.
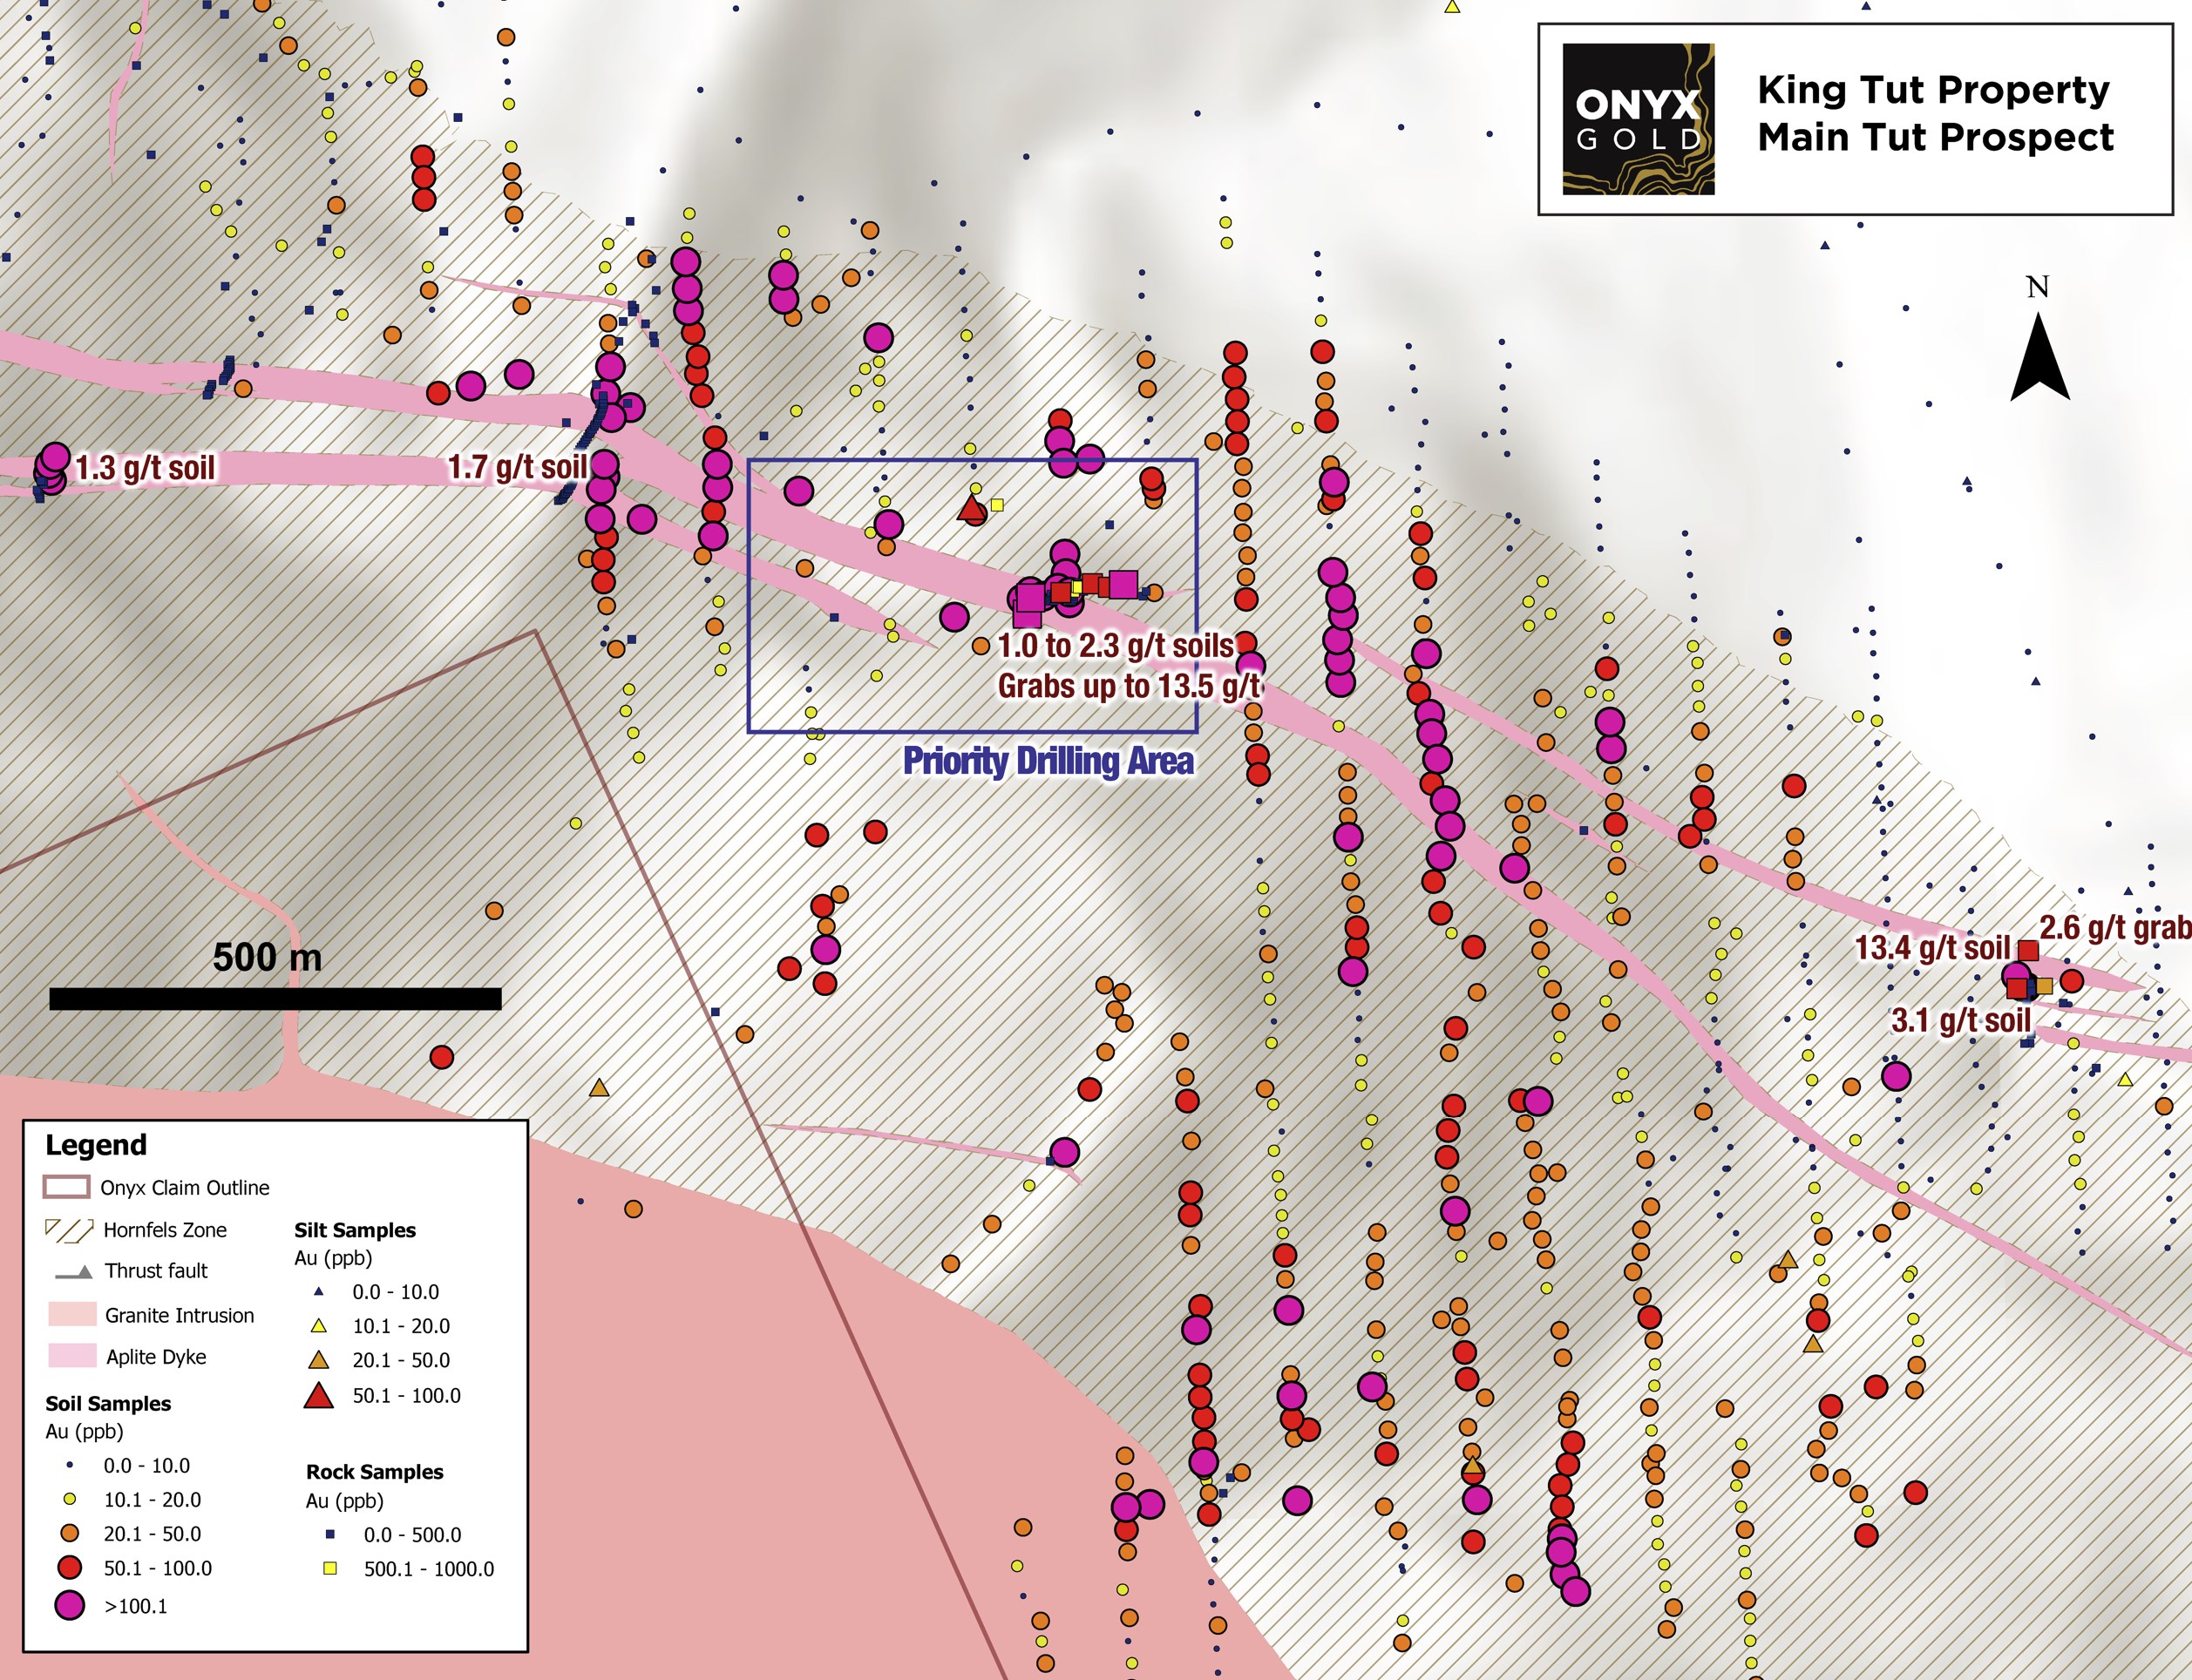
The Golden Mask anomaly is located within and adjacent to the upper carapace of an elongated granitic stock. The anomaly is almost entirely composed of samples that returned > 20 ppb gold, with most samples exceeding 50 ppb gold to a maximum of 1,423 ppb gold-in-soil. The anomaly is open for expansion to the southwest, south, and north.
The Main Tut anomaly, located 9 km east of Golden Mask and near the center of the property, has an arcuate shape over six kilometers in length and 200 to 1,500 m in width. It is defined by a broad zone of moderately to strongly anomalous gold-in-soil values to a maximum of 13,390 ppb gold.
Highlights from the program are as follows:
- Plans for 2,500 meters (8-12 drill holes) of diamond drilling with one drill rig;
- 100% allocated towards discovery drilling at two untested intrusive-related gold-in-soil anomalies, Golden Mask and Main Tut;
- Detailed airborne drone-magnetic surveying and LiDAR imagery to refine drill targeting and delineate new targets in prospective geological and structural corridors;
- Geological and alteration mapping to contextualize historical work and generate new targets in prospective areas for follow-up, and;
- Sizeable soil and rock grab sampling programs to generate new target areas (1,200 soil samples planned)
The above references an opinion and is for information purposes only. It is not intended to be investment advice. Seek a licensed professional for investment advice. The author is not an insider or shareholder of any of the companies mentioned above.
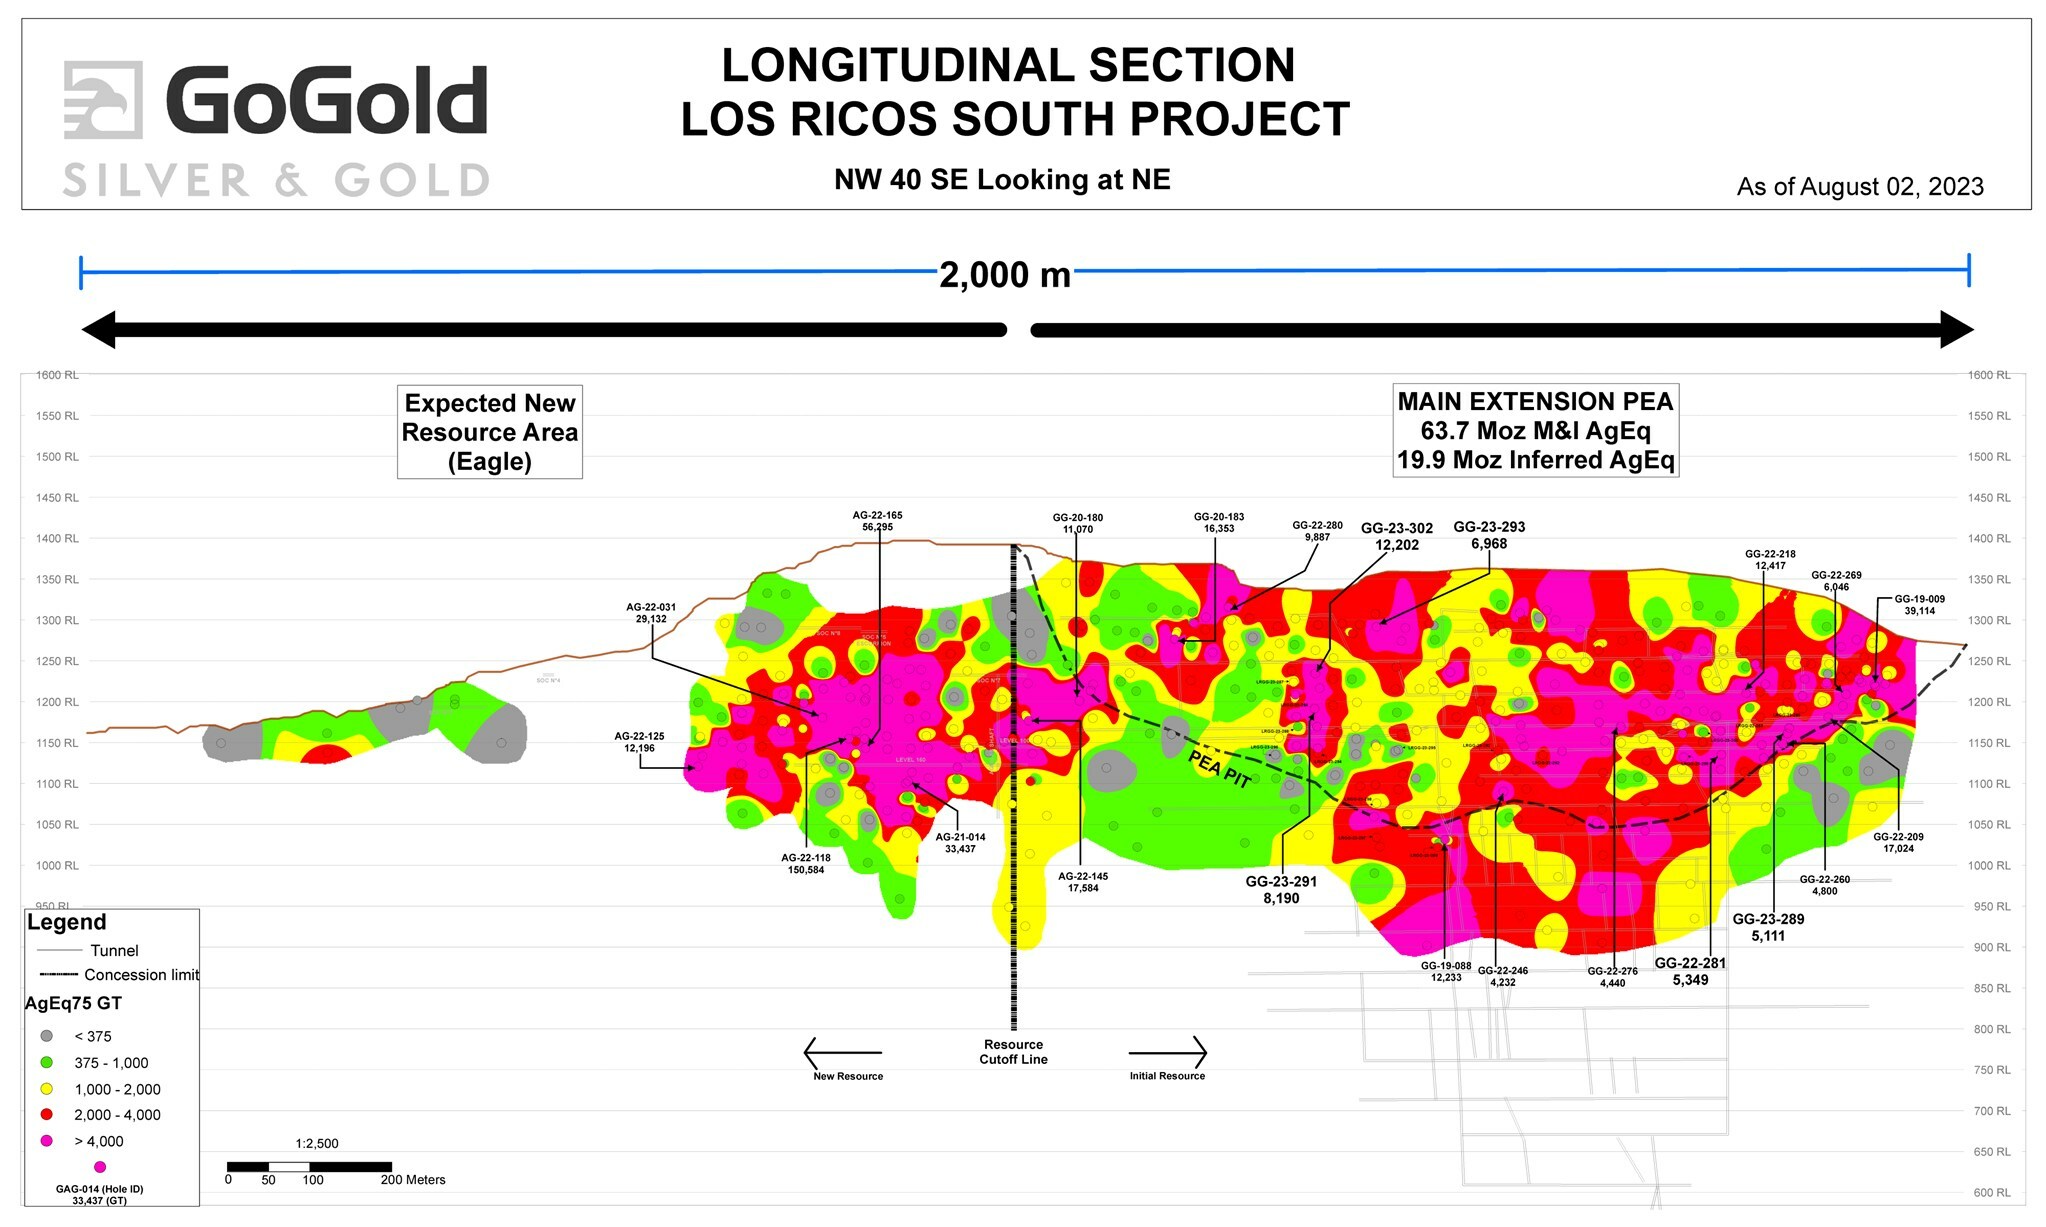
GoGold Resources (TSX:GGD), has announced new drill findings from Los Ricos South, specifically within its Main area. Hole LRGG-23-302, among the recent discoveries, yielded an impressive high-grade intercept of 404 grams per tonne (g/t) of silver equivalent across a length of 30.2 meters. Within this, an interval of 9.7 meters demonstrated 1,110 g/t of silver equivalent, which further comprised a 0.8-meter segment that showed a significantly high-grade reading of 5,468 g/t.
The aim of the current Main area drill exercise is to more accurately identify high-grade segments of the present deposit suitable for bulk underground mining. These recently drilled holes add to the findings of 2019 and 2020, which played a crucial role in forming the initial Mineral Resource Estimate. This provided the basis for the Los Ricos South Preliminary Economic Assessment (PEA), published on January 20, 2021. The expectation is to incorporate these new holes in an updated Resource set for release by summer’s end.
Brad Langille, President and CEO, commented in a press release: “We’ve drilled an additional 100 holes in the Main zone at Los Ricos South since our initial July 2020 Mineral Resource Estimate and we believe they are proving to be quite impactful on our upcoming updated Resource and Preliminary Economic Assessment,” said Brad Langille, President and CEO. “Our team is diligently working to complete the studies expected to release before end of summer.”
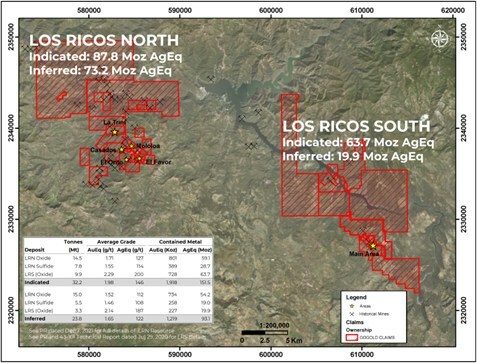
GoGold Resources operates two exploratory ventures at the Los Ricos Property, situated in the state of Jalisco, Mexico. The Los Ricos South Project, initiated in March 2019, disclosed its initial Mineral Resource Estimate on July 29, 2020. The figures comprised a Measured & Indicated Mineral Resource of 63.7 million ounces of silver equivalent at a grade of 199 g/t across 10.0 million tonnes, and an Inferred Mineral Resource of 19.9 million ounces of silver equivalent at a grade of 190 g/t across 3.3 million tonnes. The project’s initial PEA, revealed on January 20, 2021, pointed towards an NPV5% of US$295M. The Eagle Concession, located next to the Main Area, was secured in October 2022.
The Los Ricos North Project, embarked upon in March 2020, publicized its initial Mineral Resource on December 7, 2021. The data included an Indicated Mineral Resource of 87.8 million ounces of silver equivalent at a grade of 122 g/t across 22.3 million tonnes, and an Inferred Mineral Resource of 73.2 million ounces of silver equivalent at a grade of 111 g/t across 20.5 million tonnes. The project’s initial PEA, declared on May 17, 2023, indicated an NPV5% of US$413M.
Highlights from the results are as follows:
Table 1: Drill Hole Intersections
|
Hole ID |
Area / Vein |
From |
To |
Length1 |
Au |
Ag |
AuEq2 |
AgEq2 |
|
(m) |
(m) |
(m) |
(g/t) |
(g/t) |
(g/t) |
(g/t) |
||
|
LRGG-23-302 |
Main area |
52.8 |
83.0 |
30.2 |
1.68 |
277.7 |
5.39 |
404.0 |
|
including |
67.0 |
76.7 |
9.7 |
4.54 |
769.1 |
14.79 |
1,109.5 |
|
|
including |
72.0 |
73.8 |
1.8 |
18.99 |
3,484.3 |
65.44 |
4,908.2 |
|
|
including |
73.0 |
73.8 |
0.8 |
30.10 |
3,210.0 |
72.90 |
5,467.5 |
|
|
LRGG-22-281 |
Main area |
135.8 |
147.5 |
11.7 |
0.93 |
387.3 |
6.10 |
457.2 |
|
including |
136.6 |
138.0 |
1.4 |
5.36 |
2,780.4 |
42.43 |
3,182.6 |
|
|
LRGG-22-282 |
Main area |
175.1 |
190.8 |
13.0 |
0.99 |
216.0 |
3.87 |
290.0 |
|
including |
186.8 |
188.8 |
1.9 |
2.59 |
474.0 |
8.91 |
668.3 |
|
|
LRGG-22-283 |
Main area |
106.1 |
118.0 |
12.0 |
0.67 |
80.2 |
1.74 |
130.7 |
|
including |
106.1 |
107.1 |
1.1 |
5.06 |
169.0 |
7.31 |
548.5 |
|
|
LRGG-23-284 |
Main area |
91.1 |
96.3 |
5.3 |
1.62 |
144.6 |
3.55 |
265.9 |
|
including |
94.6 |
96.3 |
1.7 |
2.98 |
180.9 |
5.39 |
404.3 |
|
|
LRGG-23-285 |
Main area |
68.7 |
74.8 |
6.1 |
1.01 |
173.4 |
3.32 |
249.3 |
|
and |
90.2 |
92.6 |
2.4 |
1.84 |
366.0 |
6.72 |
503.9 |
|
|
LRGG-23-286 |
Main area |
142.4 |
165.5 |
23.1 |
0.80 |
143.3 |
2.71 |
203.0 |
|
including |
144.4 |
146.0 |
1.7 |
9.03 |
1,352.8 |
27.07 |
2,030.0 |
|
|
LRGG-23-287 |
Main area |
62.5 |
72.6 |
10.1 |
1.48 |
81.9 |
2.58 |
193.3 |
|
including |
62.5 |
69.3 |
6.8 |
2.02 |
97.3 |
3.31 |
248.6 |
|
|
and |
79.2 |
80.2 |
1.1 |
1.55 |
459.0 |
7.67 |
575.3 |
|
|
LRGG-23-288 |
Main area |
114.6 |
121.3 |
6.7 |
0.45 |
111.1 |
1.93 |
144.8 |
|
including |
120.2 |
121.3 |
1.1 |
0.36 |
222.0 |
3.32 |
249.0 |
|
|
LRGG-23-289 |
Main area |
101.3 |
129.4 |
28.1 |
0.71 |
128.7 |
2.42 |
181.9 |
|
including |
111.5 |
112.5 |
1.1 |
3.38 |
1,080.0 |
17.78 |
1,333.5 |
|
|
LRGG-23-291 |
Main area |
87.0 |
121.8 |
34.8 |
1.37 |
132.4 |
3.14 |
235.3 |
|
including |
113.8 |
120.8 |
7.0 |
4.68 |
440.4 |
10.55 |
791.1 |
|
|
including |
116.7 |
117.7 |
1.0 |
19.30 |
1,935.0 |
45.10 |
3,382.5 |
|
|
LRGG-23-292 |
Main area |
141.0 |
152.8 |
11.8 |
0.91 |
224.1 |
3.89 |
292.1 |
|
including |
141.0 |
145.3 |
4.3 |
2.33 |
563.1 |
9.84 |
737.7 |
|
|
including |
144.2 |
145.3 |
1.1 |
3.24 |
1,295.0 |
20.51 |
1,538.0 |
|
|
LRGG-23-293 |
Main area |
8.1 |
40.7 |
32.7 |
1.19 |
124.4 |
2.85 |
213.4 |
|
including |
26.2 |
27.3 |
1.1 |
3.33 |
518.0 |
10.24 |
767.7 |
|
|
LRGG-23-294 |
Main area |
145.2 |
161.4 |
16.3 |
1.02 |
69.8 |
1.95 |
146.6 |
|
including |
145.2 |
146.3 |
1.1 |
5.53 |
125.0 |
7.20 |
539.8 |
|
|
LRGG-23-295 |
Main area |
121.9 |
123.1 |
1.2 |
1.30 |
91.0 |
2.51 |
188.1 |
|
and |
137.3 |
140.5 |
3.1 |
0.43 |
85.7 |
1.57 |
117.7 |
|
|
LRGG-23-296 |
Main area |
147.6 |
150.2 |
2.6 |
0.75 |
62.4 |
1.58 |
118.6 |
|
LRGG-23-297 |
Main area |
221.6 |
232.2 |
10.6 |
1.15 |
189.9 |
3.68 |
276.4 |
|
including |
228.5 |
230.0 |
1.6 |
3.06 |
414.4 |
8.59 |
644.2 |
|
|
LRGG-23-298 |
Main area |
196.2 |
204.5 |
8.3 |
0.83 |
121.7 |
2.45 |
183.6 |
|
including |
199.1 |
201.8 |
2.7 |
1.71 |
222.2 |
4.68 |
350.7 |
|
|
LRGG-23-299 |
Main area |
233.5 |
244.8 |
11.3 |
1.36 |
223.7 |
4.35 |
325.9 |
|
including |
242.4 |
243.4 |
1.0 |
3.92 |
662.0 |
12.75 |
956.0 |
|
|
LRGG-23-300 |
Main area |
135.4 |
138.4 |
3.1 |
1.23 |
112.5 |
2.73 |
204.5 |
|
1. Not true width |
|
2. AgEq converted using a silver to gold ratio of 75:1 at recoveries of 100% |
The Main area drilling campaign’s purposes is to better define the very high-grade portions of the current deposit that may be amenable to bulk underground mining. These holes are in addition to those drilled in 2019 and 2020 which formed part of the initial Mineral Resource Estimate (“Resource”) upon which the Los Ricos South Preliminary Economic Assessment (“PEA”) was based upon when it was released on January 20, 2021. It is expected that these holes will be included in an updated Resource to be released by the end of the summer.
Table 2: Drill Hole Locations
|
Hole ID |
Easting |
Northing |
Elevation |
Azimuth |
Dip |
Length |
|
LRGG-22-281 |
610614 |
2327542 |
1253 |
50 |
-53 |
177 |
|
LRGG-22-282 |
610423 |
2327672 |
1280 |
50 |
-53 |
191 |
|
LRGG-22-283 |
610665 |
2327547 |
1251 |
50 |
-53 |
156 |
|
LRGG-23-284 |
610272 |
2327935 |
1278 |
50 |
-51 |
129 |
|
LRGG-23-285 |
610722 |
2327532 |
1245 |
50 |
-49 |
125 |
|
LRGG-23-286 |
610571 |
2327568 |
1254 |
50 |
-52 |
183 |
|
LRGG-23-287 |
610300 |
2327962 |
1281 |
50 |
-59 |
104 |
|
LRGG-23-288 |
610272 |
2327935 |
1278 |
50 |
-67 |
164 |
|
LRGG-23-289 |
610699 |
2327512 |
1246 |
50 |
-49 |
153 |
|
LRGG-23-290 |
610248 |
2328048 |
1306 |
50 |
-55 |
104 |
|
LRGG-23-291 |
610300 |
2327928 |
1284 |
50 |
-64 |
149 |
|
LRGG-23-292 |
610428 |
2327742 |
1270 |
50 |
-64 |
160 |
|
LRGG-23-293 |
610422 |
2327934 |
1312 |
50 |
-60 |
65 |
|
LRGG-23-294 |
610272 |
2327902 |
1278 |
50 |
-66 |
186 |
|
LRGG-23-295 |
610317 |
2327812 |
1256 |
50 |
-56 |
170 |
|
LRGG-23-296 |
610207 |
2327916 |
1251 |
50 |
-52 |
186 |
|
LRGG-23-297 |
610223 |
2327766 |
1233 |
50 |
-61 |
290 |
|
LRGG-23-298 |
610223 |
2327766 |
1233 |
50 |
-50 |
250 |
|
LRGG-23-299 |
610281 |
2327717 |
1237 |
50 |
-65 |
302 |
|
LRGG-23-300 |
610604 |
2327563 |
1258 |
50 |
-45 |
144 |
|
LRGG-23-301 |
610604 |
2327563 |
1258 |
50 |
-49 |
136 |
|
LRGG-23-302 |
610318 |
2327943 |
1286 |
50 |
-51 |
116 |
The above references an opinion and is for information purposes only. It is not intended to be investment advice. Seek a licensed professional for investment advice. The author is not an insider or shareholder of any of the companies mentioned above.
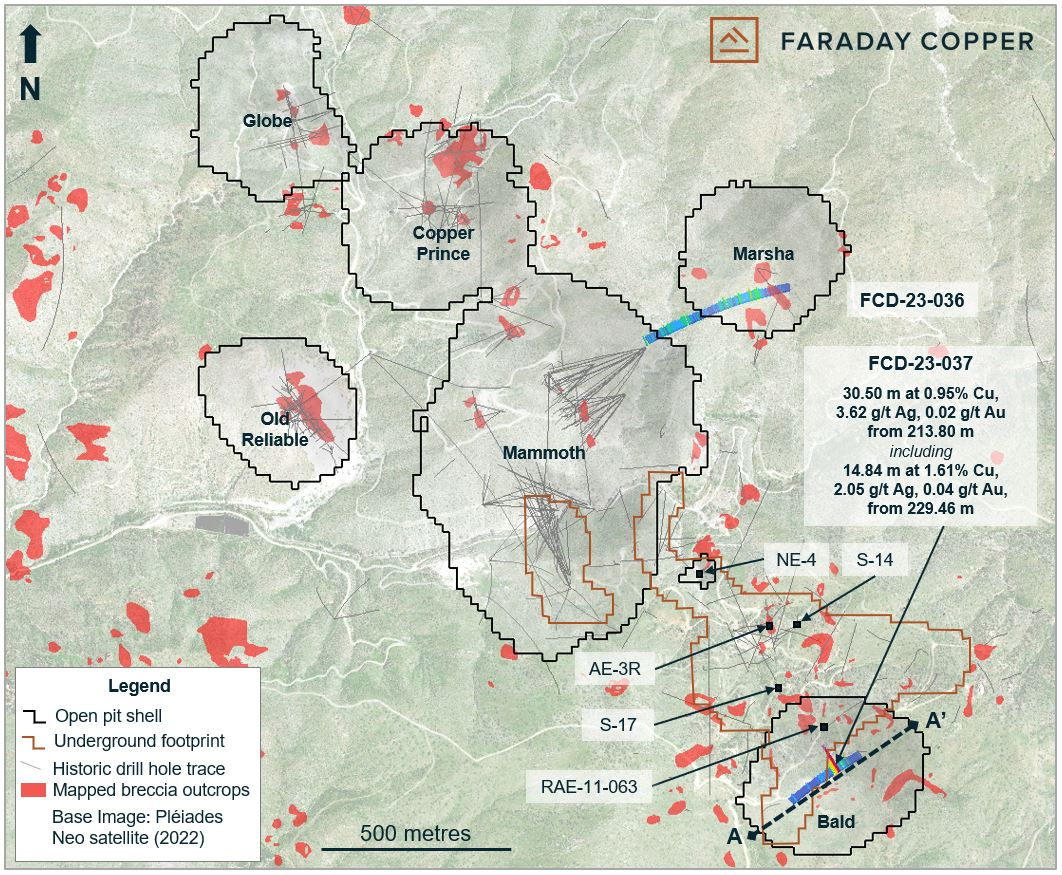
Faraday Copper (TSX:FDY) has disclosed the outcomes of the concluding two drill holes from the Phase II initiative at the Copper Creek Project, positioned in Arizona, USA. The purpose of these two holes was to evaluate the vertical extension of the breccia mineralization, above the American Eagle underground section, and target areas yet unexplored.
Drill hole FCD-23-037 started southwest of the Bald breccia and proceeded towards the northeast (Figures 1 and 2). This hole aimed to uncover the mineralization initially identified in a previous reverse circulation drill hole. FCD-23-037 was drilled as diamond core, showing that the mineralization is located in a crackle breccia made up of intensely sericite altered granodiorite fragments, glued together by chalcopyrite and pyrite (Figure 3). This breccia was intersected about 500 m above the American Eagle underground footprint. Historical extensive vertical drilling had not explored the vertical extension of this breccia, which is still open-ended. Further drilling in this area is slated as part of the Phase III program.
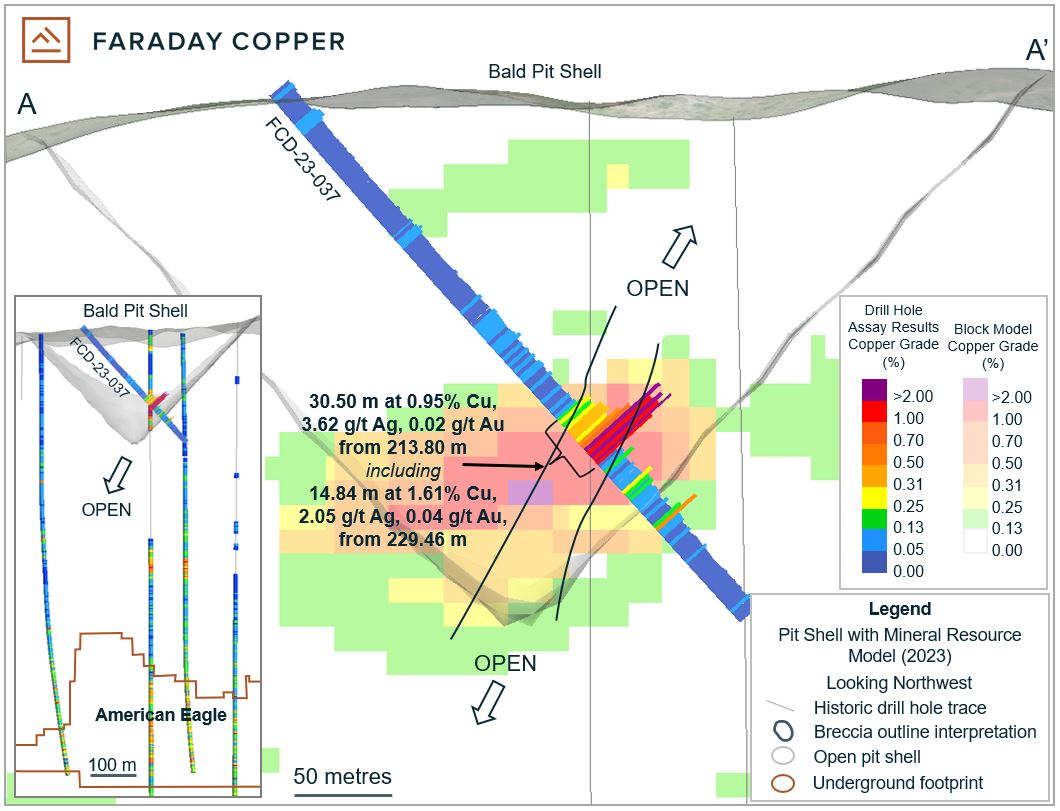
Drill hole FCD-23-036 commenced southwest of the Marsha pit shell and continued towards the northeast (Figure 1). The hole spans a drilling gap and verifies low-grade mineralization 160 m beneath the base of the Marsha pit shell utilized to limit the MRE. This drill hole points out that the Marsha area still offers prospects for resource expansion.
Historical drilling around the American Eagle region primarily targeted the gently dipping veins, which are crucial hosts of mineralization in the underground resource. The previous drilling was not ideally positioned for outlining the steeply dipping veins and breccia zones near the surface. Angled drilling in this zone is scheduled as part of the Phase III program to target open pit resource expansion.
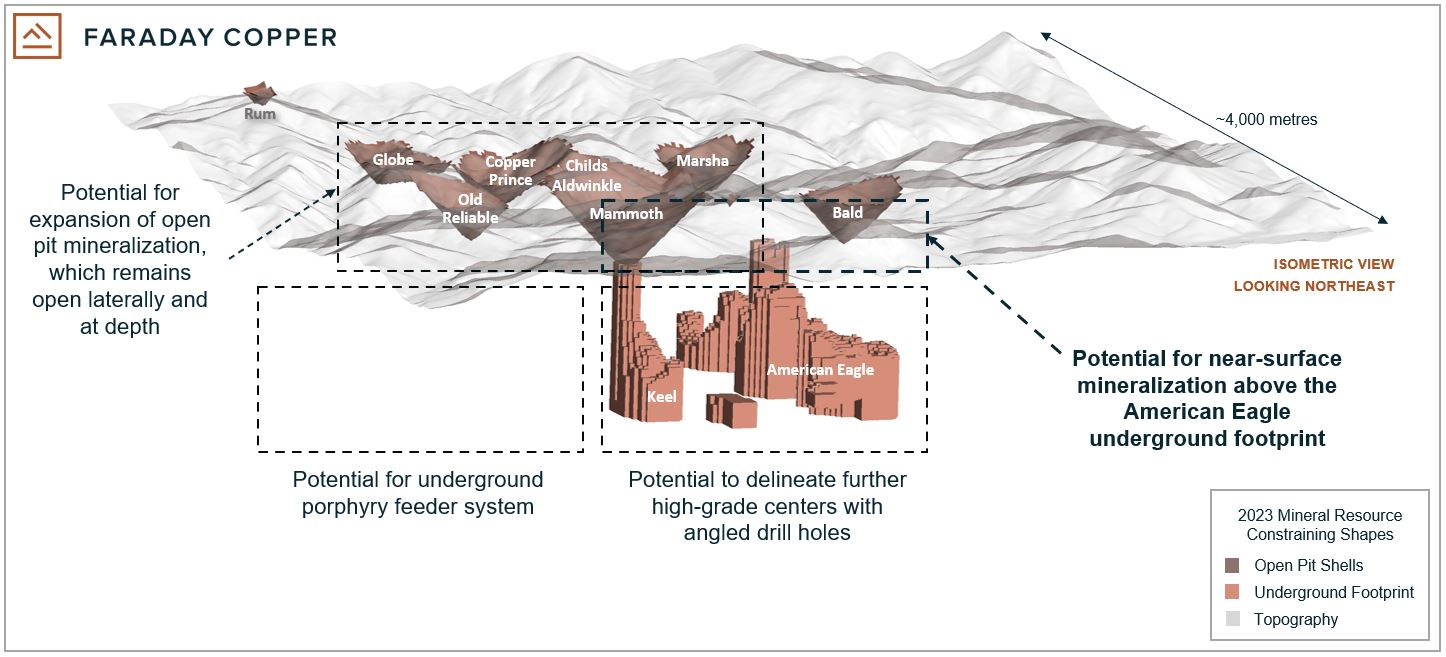
Historical findings, along with drill hole FCD-23-037, between the Mammoth and Bald pit shells, covering about one kilometre, emphasize the potential for mineralization to be outlined above the American Eagle porphyry between the surface and a depth of 500 m. Some instances of historical drill results suggesting near-surface potential include (Figure 1):
- 18.29 m at 0.94% Cu from 85.34 m (AE-3R)
- 18.23 m at 0.84% Cu from 39.62 m (S-14)
- 27.32 m at 0.51% Cu from 186.54 m (RAE-11-063)
- 21.33 m at 0.34% Cu from 6.10 m (NE-4)
- 70.10 m at 0.38% Cu from 176.78 m (S-17)
The Phase II drilling, comprising a total of twenty-eight drill holes, concluded in June 2023. This press release includes the results of the final two drill holes.
To categorize and prioritize targets for the 20,000-meter Phase III drill program, the company is combining and interpreting multiple datasets, including geological mapping, drill core, geochemistry, hyperspectral data, airborne magnetic, and electromagnetic geophysical data. The Phase III drill program is set to begin in the final quarter of 2023 with the following three goals:
- Expanding the MRE
- Enhancing delineation of high-grade mineralized zones
- Reconnaissance drilling on fresh targets
A program to assay historical drill core samples has been launched to evaluate the potential for inclusion of gold in future resource updates. Historically, approximately 12 percent of all core samples analyzed for copper were also analyzed for gold. As part of the program, the first breccia to be analyzed is Childs Aldwinkle, with 359 samples submitted to the laboratory. Results will be publicized as they are received, analyzed and confirmed by the Company. Following the completion of the Childs Aldwinkle assaying, the Copper Prince, Pole, and Copper Giant breccias, as well as the Keel underground zone, will be prioritized for gold analysis.
The Phase II metallurgical program has started, focusing on grind size optimization to evaluate the feasibility of coarser particle flotation, gold deportment to concentrate, and further test work on near-surface mineralization.
Highlights from the results are as follows:
- Intersected 30.50 metres (“m”) at 0.95% copper, 3.62 g/t silver and 0.02 g/t gold from 213.80 m, including 14.84 m at 1.61% copper, 2.05 g/t silver and 0.04 g/t gold from 229.46 m in drill hole FCD-23-037 at the Bald breccia. (For true width information see Table 1)
- This result confirms near-surface, high-grade breccia mineralization within the Bald resource pit shell and highlights the potential for resource expansion above the American Eagle porphyry.
- Results from Phase II drilling, along with new geophysical data, spectral data and geological mapping, will contribute to ranking and prioritizing targets for a 20,000-metre Phase III drill program planned to commence in the fourth quarter of 2023.
- A metallurgical program has commenced and is focused on grind size optimization, gold deportment and further test work on near surface mineralization.
- Analysis of historical drill core for gold in selected breccias is in progress.
Table 1: Selected Drill Results from Copper Creek
| Drill Hole ID | From | To | Length | True Width | Cu | Mo | Au | Ag |
| (m) | (m) | (m) | (m) | (%) | (%) | (g/t) | (g/t) | |
| FCD-23-037 | 213.80 | 244.30 | 30.50 | 24 | 0.95 | 0.009 | 0.02 | 3.62 |
| including | 229.46 | 244.30 | 14.84 | 12 | 1.61 | 0.008 | 0.04 | 2.05 |
| FCD-23-036 | 447.54 | 487.12 | 39.58 | 39 | 0.16 | 0.006 | N/A | 0.41 |
Notes: All intercepts are reported as downhole drill widths. Mineralization includes bulk porphyry-style zones and breccia mineralization. Porphyry-style zones true widths are interpreted to be close to drilled widths. Breccia true widths are approximate due to the irregular shape of mineralized domains.
Table 2: Collar Locations from the Drill Holes Reported Herein
| Drill Hole ID | Easting | Northing | Elevation | Azimuth | Dip | Target | Depth | Depth |
| (m) | (°) | (°) | (ft) | (m) | ||||
| FCD-23-037 | 549088 | 3622920 | 1374 | 050 | -50 | Bald Breccia | 1148.0 | 349.91 |
| FCD-23-036 | 548678 | 3624198 | 1245 | 062 | -45 | Marsha Deep | 1968.0 | 599.85 |
Note: Coordinates are given as World Geodetic System 84, Universal Transverse Mercator Zone 12 north (WGS84, UTM12N).
The above references an opinion and is for information purposes only. It is not intended to be investment advice. Seek a licensed professional for investment advice. The author is not an insider or shareholder of any of the companies mentioned above.
If you would like to receive our free newsletter via email, simply enter your email address below & click subscribe.
 Follow us on Twitter
 Become our facebook fan
CONNECT WITH US
Tweets
Tweet with hash tag #miningfeeds or @miningfeeds and your tweets will be displayed across this site.
MOST ACTIVE MINING STOCKS
Daily Gainers
 CMC Metals Ltd. CMC Metals Ltd. |
CMB.V | +900.00% |
 Eden Energy Ltd Eden Energy Ltd |
EDE.AX | +200.00% |
| GoviEx Uranium Inc. |
GXU.V | +42.86% |
| Eagle Nickel Ltd. |
ENL.AX | +41.67% |
| Citigold Corp. Limited |
CTO.AX | +33.33% |
| Mount Burgess Mining NL |
MTB.AX | +33.33% |
| Exalt Resources Limited |
ERD.AX | +31.94% |
| Casa Minerals Inc. |
CASA.V | +30.00% |
| Cariboo Rose Resources Ltd |
CRB.V | +28.57% |
| Belmont Resources Inc. |
BEA.V | +28.57% |


