
Fathom Nickel (CSE:FNI) has completed its Fall 2023 drilling program at the Gochager Lake deposit, part of the company’s 22,620-hectare Gochager Lake Project. The company expects to receive assay results for the drilling program within the next four to five weeks. Alongside the drilling efforts, the company is also working on modelling BHEM and surface geophysics results, with the outcomes set to be released in the coming weeks.
As a part of the same project, Fathom Nickel has also undertaken soil geochemistry profiling near the 2008 VTEM anomaly, as well as other prominent VTEM/TDEM anomalies. Ground prospecting activities have also been initiated in areas around the Mal Lake nickel occurrence and the Borys Lake Zn-Pb-Ag deposit. The company plans to disclose the findings of these additional studies in the near future.
In financial news related to the project, Fathom Nickel has completed the first-year anniversary payment obligations for the Gochager Lake Earn-In Agreement. Originally, the company was supposed to make a cash payment of $15,000 and issue 170,000 shares to earn a 10% interest in the Gochager Lake property. However, upon request from the vendor, the cash requirement was reduced to $5,000, while the share issuance was increased to 210,000 shares. These additional shares are valued at $0.25 per share. This completes the company’s requirements for the first anniversary of the agreement.
Ian Fraser, CEO and VP Exploration commented in a press release: “The recently completed drill program has accomplished exactly what we set out to do. We now have a much better understanding of geological controls on the impressive nickel-cobalt values intersected in GL23003 and we have been able to extend this mineralization both up and down plunge. We are dealing with a very dynamic intrusive at Gochager Lake and we are very encouraged to be intersecting a wide range of sulphide textures typical of magmatic nickel sulphide deposits. We confirmed that the deep off-hole conductor detected in historic drillhole GL18002 is associated with a build up of semi-massive to massive sulphide mineralization at depth. Furthermore, BHEM continues to indicate conductivity build-up beyond the bottom of several drillholes, suggesting the possible continuation of mineralization at depth. We look forward to continuing to demonstrate that there are chutes of high-grade nickel-copper-cobalt mineralization within the historic Gochager Lake deposit2. We also look forward to defining the source, or the “feeder”, of the magmatic sulphide textures we continue to consistently encounter at the Gochager Lake deposit. We are also very encouraged and intrigued with the presence of massive sulphide veinlets occurring in GL23011 – some 400 meters from the known Gochager Lake deposit. Additionally, BHEM identified two prominent off-hole anomalies occurring within favourable host rock proximate to the off-hole anomalies. GL23011 was a follow-up to a VTEM anomaly first detected in 2008 but never drilled until now.”
Highlights from the program are as follows:
- Seven drillholes completed totaling 2,168 meters.
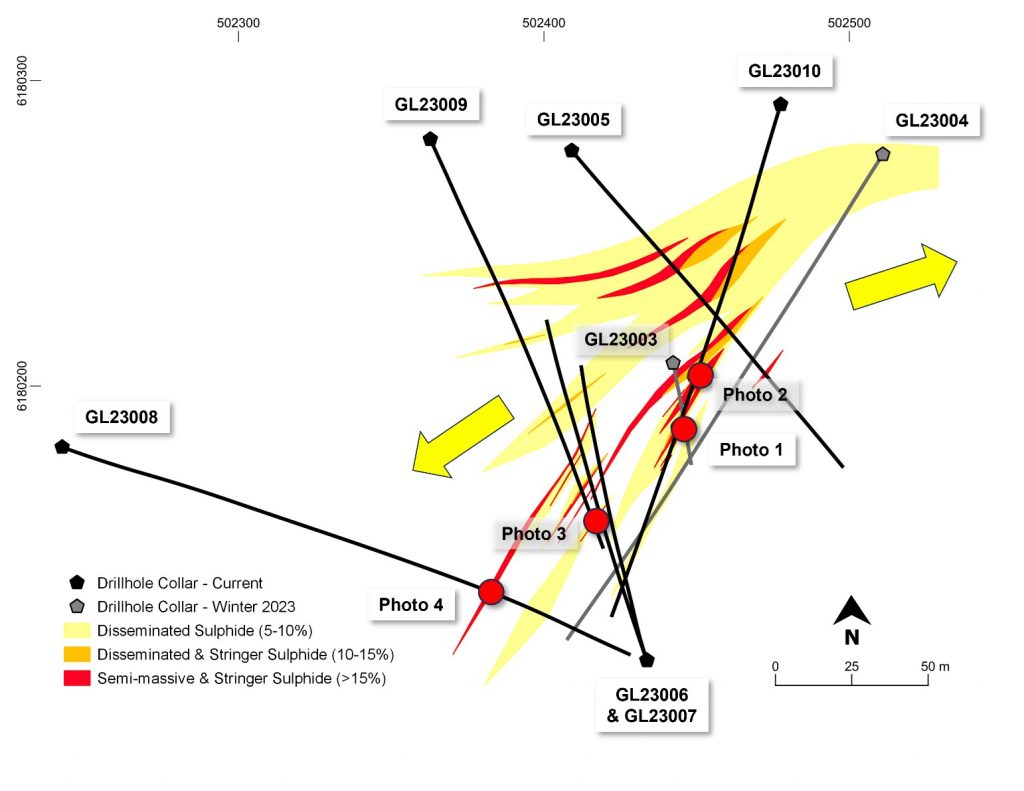
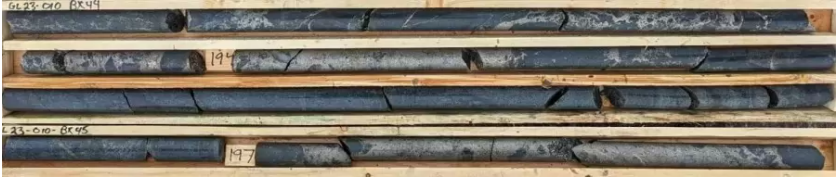
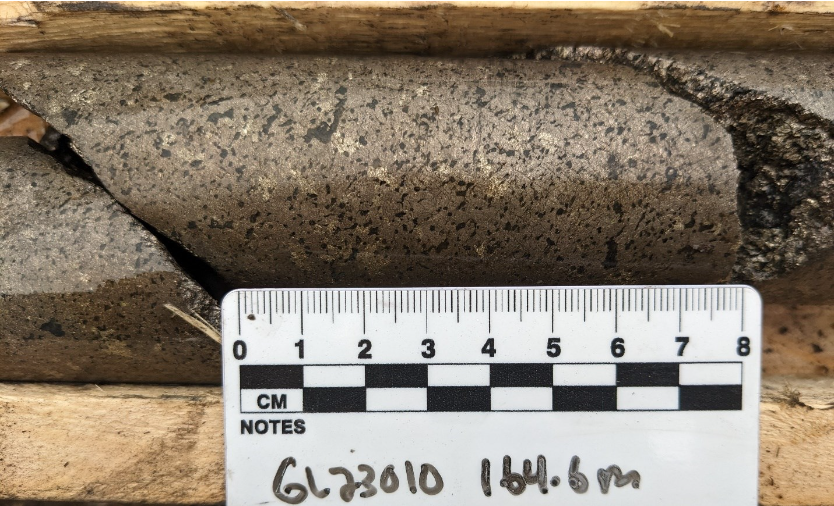
- Semi-massive, massive sulphides intersected in GL23005 and GL23010; extending the nickel-copper-cobalt mineralization intersected in GL23003 (see Press Release April 12, 2023) both up and down plunge (Photos 1 & 2)1.
- Disseminated, interstitial, net-textured, semi-massive, sulphide mineralization occurring at 304 – 384.5m1 in GL23009 (Photo 3)1 significantly extends the historic Gochager Lake deposit at depth.
- Massive sulphide veins (Photo 4)1 observed cross cutting the gabbro host rock throughout the drilled area.
- Multiple off-hole borehole electromagnetic (BHEM) responses detected in all drillholes and BHEM surveys suggest significant conductivity build up at depth.
- Two strong off-hole BHEM anomalies associated with favourable host rocks encountered in drillhole GL23011 located approximately 400 meters northeast of the Gochager Lake deposit.
Drillhole Location Details:
| Drillhole ID | UTM Easting | UTM Northing | Azimuth | Dip | Total Depth (m) |
| GL23005 | 502409.1 | 6180277.1 | 140° | -55° | 236.0 |
| GL23006 | 502433.7 | 6180110.2 | 340° | -66° | 266.0 |
| GL23007 | 502433.8 | 6180110.1 | 340° | -72° | 299.0 |
| GL23008 | 502242.3 | 6180180.0 | 110° | -55° | 341.0 |
| GL23009 | 502362.8 | 6180280.8 | 156° | -69° | 428.0 |
| GL23010 | 502477.5 | 6180292.2 | 197° | -55.5° | 314.0 |
| GL23011 | 502735.9 | 6180631.4 | 109° | -65° | 284.0 |
The above references an opinion and is for information purposes only. It is not intended to be investment advice. Seek a licensed professional for investment advice. The author is not an insider or shareholder of any of the companies mentioned above.
In a significant development for Brazil Potash’s Autazes potash project in the Amazonas State of Brazil, the Mura Indigenous people have voiced their support for the project. The Mura recently concluded free, prior, and informed consultations and participated in a vote which resulted in unanimous favour of the project’s construction. This decision signals a meaningful demonstration of the Mura’s wishes and is an important step in the project’s advancement.
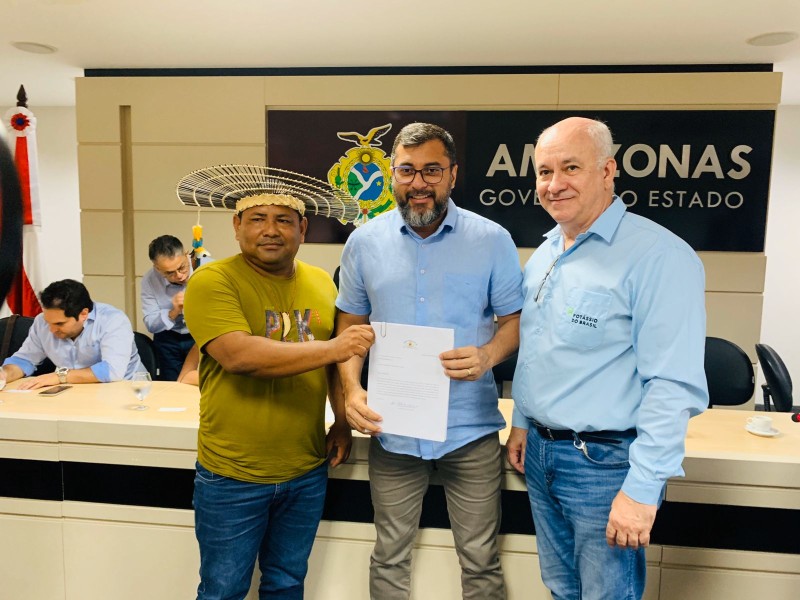
Leaders of the Mura community from Autazes, who represent 36 villages and around 12,000 indigenous residents, made a formal visit to the Government of Amazonas’ headquarters on Monday, September 25th. During this visit, they submitted a report and record of a General Assembly meeting that took place the previous week among indigenous chiefs in Autazes. This assembly ratified the community’s decision to support the Autazes Potash Project. The event also saw the participation of Potássio do Brasil, as well as state deputies, secretaries, and the president of IPAAM, the environmental licensing agency responsible for the project.
Wilson Lima, Governor of Amazonas, commented: “This is a very important day, a historic day because we are taking a significant step towards changing the lives of the people who reside in the state of Amazonas, especially those in the municipality of Autazes. This is a fundamental step, and I consider it the most important one, which is the process of consulting the Mura people about the potassium exploration activity in the municipality of Autazes. We are talking here about another economic model for the state of Amazonas. We have the Zona Franca, which we will not relinquish, we have the natural gas issue, which we have already made significant progress on, and the next step is the potassium matter.”
José Cláudio dos Santos Pereira, the general coordinator of the Indigenous Mura Council (CIM), said, “For us, this is very important because it represents the future, the economic progress of Autazes and the state of Amazonas. But it is important to emphasize that the Mura people understand that we are working alongside the Federal Justice, and we do not intend to challenge it. We understand that IPAAM is the licensing authority and should proceed with the process.”
Adriano Espeschit, the president of Potássio do Brasil, weighed in on the importance of the project to global food security and ending world hunger: “This is a new moment for Autazes, for Amazonas, for Brazil, and why not say it for the world, as food security depends on fertilizers for agriculture, to feed people and eradicate hunger in our world. As President Lula said at the opening of the UN Assembly, over 750 million people are suffering from hunger. This is a strategic project to end world hunger. We will work on the next steps to advance licensing and begin the project’s installation in Autazes.”
Governor Wilson Lima of Amazonas stated that the Mura people’s endorsement is pivotal not only for the Autazes municipality but also for the broader Amazonas region. He mentioned the possibility of establishing a new economic model for the state based on this support. José Cláudio dos Santos Pereira, the general coordinator of the Indigenous Mura Council (CIM), represented the Mura community during this occasion. He presented a letter and a report from the General Assembly, confirming that indigenous leaders have accepted the project’s implementation.
The meeting also included several key figures alongside the indigenous leaders. These individuals included the president of Potássio do Brasil, state deputies, and state secretaries overseeing Economic Development, Science, Technology, and Innovation, Mining, Gas, and Energy, as well as the President of the Amazonas Environmental Protection Institute (Ipaam) and the mayor of Autazes.
While the project is not situated on indigenous land, it falls within 10 kilometres (around 6 miles) of two indigenous reserves. These communities hold the legal right to consultation in accordance with International Labour Organization 169 protocols. The Mura people had the autonomy to determine which tribes would be consulted, as well as the format for consultation and vote support threshold. A series of gatherings were conducted to inform the Mura about the project’s potential impacts and benefits. Ultimately, consultations took place with 36 tribes, some located as far away as 70 kilometers (about 45 miles) from the project site. A vote was organized with the participation of over 200 Mura individuals, culminating in a positive outcome in favor of the project.
The Mura community stands to gain various benefits from the development of the Autazes Potash Project. These benefits include opportunities for direct employment, funding for new businesses that can contribute to the project and local community, and the initiation of several programs aimed at improving general well-being as dictated by the Mura’s wellness program.
It’s worth noting that Brazil Potash still awaits a review from Brazil’s government Indigenous people’s agency, FUNAI, concerning the Company’s Indigenous Consultation Study (the “ECI”). This review is one of the final steps necessary for obtaining the Installation License needed to commence project construction. The Mura’s informed and positive vote undoubtedly sends a constructive signal to FUNAI, emphasizing the community’s wish for the project to proceed and for the necessary permits to be granted.
The above references an opinion and is for information purposes only. It is not intended to be investment advice. Seek a licensed professional for investment advice. The author is not an insider or shareholder of any of the companies mentioned above.
As part of its efforts in sustainability and education with communities in Ecuador, Solaris Resources (TSX:SLS) (OTCQB:SLSSF) subsidiary Lowell Mineral Exploration Ecuador S.A., in January of 2023, partnered with the Private Technical University of Loja (UTPL) to launch an online education program called “Understanding Mining.” The program is designed to educate people about the mining industry in Ecuador. The course is free of charge and specifically targets residents of Morona Santiago, where the Warintza Project is located, as well as any other Ecuadorians interested in learning about the sector.
Upon completing the course, participants will receive a certificate from UTPL. The only prerequisite for taking part in this educational program is access to a device with an internet connection, such as a computer, tablet, or smartphone. The course material is accessible via UTPL’s virtual platform and covers six modules. These modules include an Introduction to the Mining Industry, Geology and Distribution of Mineral Deposits, Phases of Mining, Economic and Social Development Around Mining, the Legal Framework of Mining in Ecuador, and a section on Solaris Resources’ Warintza Project.
To enroll, interested individuals can visit UTPL’s continuing education website and follow a simple registration process that includes filling out a form. Solaris Resources, which operates the Warintza Project in the province of Morona Santiago in south-eastern Ecuador, aims to promote inclusion and access to information through its “Warintza Education” program. This initiative is in line with the United Nations Sustainable Development Goal #4, which emphasizes inclusive and quality education for all.
The above references an opinion and is for information purposes only. It is not intended to be investment advice. Seek a licensed professional for investment advice. The author is not an insider or shareholder of any of the companies mentioned above.
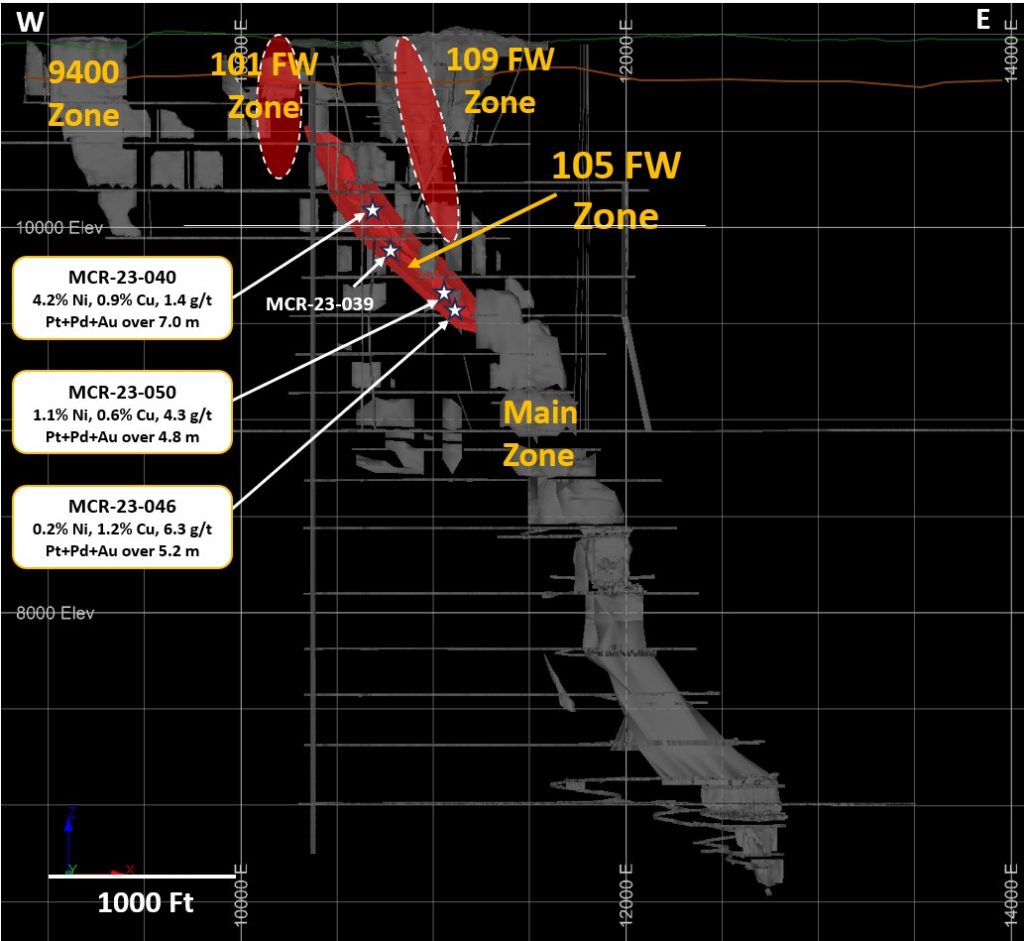
Magna Mining (TSXV: NICU) has announced further assay results from its 2023 diamond drilling program. The company continues to find high-grade nickel mineralization in the 105 Footwall (“FW”) Zone. Specifically, drillhole MCR-23-040 intersected a segment with 4.2% nickel, 0.9% copper, and 1.4 grams per ton of platinum, palladium, and gold across a 7.0-metre length.
Dave King, SVP Technical Services commented in a press release: “The 105 FW Zone is similar to the 101 FW Zone, and consists of high nickel tenor, semi-massive to massive sulphide veins hosted within a breccia structure extending into the footwall from the Sudbury Igneous Complex (“SIC”). Additional diamond drilling within the 105 FW zone continues to intersect high-grade mineralization with increasing precious metals (Pt, Pd, Au) as this structure approaches the Main Zone. We are encouraged to see high-grade PGE mineralization at the 1500 ft level, down-plunge of the defined 109 FW zone, where these two structures are interpreted to intersect, indicating this style of mineralization may continue to depth” (see Figure 1).
The focus of the 105 FW diamond drilling to this point has aimed to expand the existing Indicated Mineral Resource. The goal is to better understand the geological factors that influence mineralization and the consistency of the grades. Drillhole MCR-23-040 also showed two high-grade intersections rich in precious metals, registering 0.3% nickel, 0.8% copper, and 38.6 grams per ton of platinum, palladium, and gold over 0.3 metres and 0.2% nickel, 0.5% copper, and 35.2 grams per ton of platinum, palladium, and gold over 0.5 metres. These findings are connected to the 109 FW zone and lie outside of its current Mineral Resource, suggesting the potential for adding near-surface resources that may be suitable for more selective mining techniques.
The update also includes additional assay results from the G1 and G2 contact exploration targets, along with remaining assays for near-surface drilling in the 109 FW zone. These results were presented along with a location map and summarized data tables.
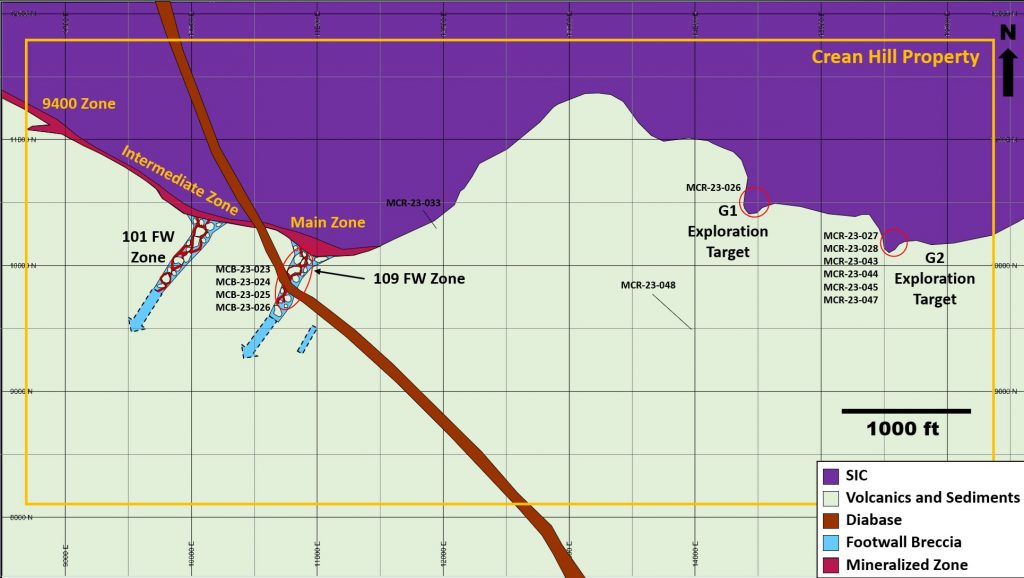
Magna Mining is continuing its diamond drilling operations at Crean Hill. Currently, one diamond drill is focused on exploring deeper sections of the footwall.
Highlights from the results are as follows:
- 105 FW Zone
MCR-23-040: 4.2% Ni, 0.9 % Cu, 1.4 g/t Pt + Pd + Au over 7.0 metres
MCR-23-046: 0.2% Ni, 1.2 % Cu, 6.3 g/t Pt + Pd + Au over 5.2 metres
And 2.7% Ni, 1.5 % Cu, 18.1 g/t Pt + Pd + Au over 0.9 metres
MCR-23-050: 1.1% Ni, 0.6 % Cu, 4.3 g/t Pt + Pd + Au over 8.8 metres
And 0.6% Ni, 3.5 % Cu, 10.1 g/t Pt + Pd + Au over 1.1 metres
Table 1: Summary of Assay Results
| Drillhole | Zone | From (m) |
To (m) |
Length (m) |
Ni % | Cu % | Co % | Pt g/t | Pd g/t | Au g/t | TPM g/t | NiEq | |
| MCR-23-026 | G1 | 240.51 | 244.73 | 4.22 | 0.47 | 0.42 | 0.03 | 0.07 | 0.03 | 0.04 | 0.13 | 0.70 | |
| MCR-23-027 | G2 | 28.08 | 37.11 | 9.03 | 0.75 | 0.33 | 0.04 | 0.03 | 0.02 | 0.04 | 0.09 | 0.96 | |
| Including | 34.19 | 37.11 | 2.92 | 1.59 | 0.17 | 0.07 | 0.02 | 0.01 | 0.01 | 0.04 | 1.77 | ||
| MCR-23-028 | G2 | 38.83 | 46.23 | 7.40 | 0.42 | 0.42 | 0.03 | 0.01 | 0.01 | 0.01 | 0.03 | 0.65 | |
| MCR-23-033 | Intermediate | 35.81 | 43.84 | 8.03 | 0.12 | 0.66 | 0.01 | 0.02 | 0.04 | 0.19 | 0.24 | 0.47 | |
| MCR-23-039 | 105 FW | 471.00 | 471.66 | 0.66 | 0.33 | 0.20 | 0.01 | 2.39 | 1.07 | 1.13 | 4.59 | 1.20 | |
| and | 530.61 | 534.75 | 4.14 | 0.20 | 0.09 | 0.01 | 1.25 | 0.61 | 0.45 | 2.30 | 0.63 | ||
| MCR-23-040 | 109 FW | 21.30 | 21.60 | 0.30 | 0.31 | 0.81 | 0.09 | 9.38 | 26.71 | 2.52 | 38.61 | 8.65 | |
| 109 FW | 65.45 | 65.91 | 0.46 | 0.18 | 0.45 | 0.01 | 26.50 | 5.00 | 3.68 | 35.18 | 5.44 | ||
| 105 FW | 261.00 | 267.98 | 6.98 | 4.19 | 0.87 | 0.11 | 0.42 | 0.80 | 0.15 | 1.37 | 4.98 | ||
| MCR-23-43 | G2 | No Significant Values | |||||||||||
| MCR-23-44 | G2 | 50.57 | 52.51 | 1.94 | 0.45 | 0.27 | 0.03 | 0.11 | 0.02 | 0.01 | 0.14 | 0.62 | |
| MCR-23-45 | G2 | No Significant Values | |||||||||||
| MCR-23-46 | 105 FW/109 FW | 453.09 | 458.24 | 5.15 | 0.24 | 1.15 | 0.02 | 1.32 | 4.20 | 0.74 | 6.26 | 2.04 | |
| and | 466.02 | 466.89 | 0.87 | 2.70 | 1.53 | 0.07 | 17.16 | 0.67 | 0.22 | 18.05 | 5.68 | ||
| Intermediate | 639.69 | 645.20 | 5.51 | 1.16 | 0.72 | 0.05 | 0.36 | 1.42 | 0.03 | 1.80 | 1.91 | ||
| MCR-23-47 | G2 | No Significant Values | |||||||||||
| MCR-23-48 | Exploration | No Significant Values | |||||||||||
| MCR-23-50 | 105 FW/109 FW | 448.36 | 453.12 | 4.76 | 1.06 | 0.64 | 0.03 | 2.92 | 0.84 | 0.58 | 4.34 | 2.04 | |
| and | 461.28 | 462.40 | 1.12 | 0.62 | 3.52 | 0.05 | 0.64 | 4.60 | 4.89 | 10.14 | 4.32 | ||
| and | 469.58 | 470.34 | 0.76 | 0.23 | 1.01 | 0.01 | 0.31 | 6.00 | 2.24 | 8.55 | 2.57 | ||
| and | 488.77 | 489.10 | 0.33 | 1.97 | 6.25 | 0.04 | 5.10 | 0.29 | 0.09 | 5.48 | 5.35 | ||
| and | 513.10 | 513.36 | 0.26 | 1.54 | 0.37 | 0.25 | 0.01 | 24.50 | 0.03 | 24.54 | 7.78 | ||
| MCB-23-023 | 109 FW | 29.12 | 35.99 | 6.87 | 0.08 | 0.11 | 0.01 | 2.04 | 0.90 | 0.61 | 3.55 | 0.71 | |
| MCB-23-024 | 109 FW | 10.00 | 12.02 | 2.02 | 0.03 | 0.07 | 0.02 | 2.63 | 0.75 | 0.57 | 3.95 | 0.69 | |
| MCB-23-025 | 109 FW | 27.22 | 36.00 | 8.78 | 0.05 | 0.03 | 0.01 | 2.65 | 1.16 | 0.68 | 4.49 | 0.80 | |
| MCB-23-026 | 109 FW | No Significant Values | |||||||||||
All lengths are downhole length.
NiEq % = ( (Ni% x 2204 x Ni Price $/lb) + (Cu% x 96% Recovery x 2204 x Cu Price $/lb) + (Co% x 56% Recovery x 2204 x Co Price $/lb) + (Pt gpt x 69% Recovery / 31.1035 x Pt $/oz) +(Pd gpt x 68% Recovery / 31.1035 x Pd $/oz) + (Au gpt x 68% Recovery / 31.1035 x Au $/oz))/2204 x Ni $/lb
Metal prices in US$: $8.50/lb Ni, $3.75/lb Cu, $22.00/lb Co, $1000/oz Pt, $2000/oz Pd and $1,750/oz Au
Table 2: Drillhole Collar Coordinates
| BHID | Easting | Northing | Elevation | Azimuth | Dip | Depth |
| MCR-23-026 | 474330 | 5142140 | 296 | 192 | 52 | 350 |
| MCR-23-027 | 474511 | 5141877 | 294 | 175 | 44 | 325 |
| MCR-23-028 | 474510 | 5141876 | 294 | 100 | 45 | 80 |
| MCR-23-033 | 473426 | 5141934 | 299 | 130 | 59 | 147 |
| MCR-23-039 | 473099 | 5141551 | 301 | 353 | 49 | 575 |
| MCR-23-040 | 473033 | 5141813 | 288 | 1 | 72 | 402 |
| MCR-23-043 | 474510 | 5141879 | 294 | 229 | 45 | 50 |
| MCR-23-044 | 474511 | 5141881 | 294 | 129 | 45 | 65 |
| MCR-23-045 | 474510 | 5141882 | 294 | 143 | 75 | 51 |
| MCR-23-046 | 473269 | 5141611 | 301 | 331 | 67 | 692 |
| MCR-23-047 | 474508 | 5141880 | 294 | 74 | 65 | 69 |
| MCR-23-048 | 473942 | 5141740 | 299 | 130 | 45 | 248 |
| MCR-23-050 | 473269 | 5141611 | 301 | 331 | 64 | 581 |
| MCB-23-023 | 473070 | 5141754 | 294 | 310 | 38 | 36 |
| MCB-23-024 | 473061 | 5141726 | 293 | 252 | 42 | 80 |
| MCB-23-025 | 473061 | 5141726 | 293 | 305 | 38 | 51 |
| MCB-23-026 | 473048 | 5141780 | 292 | 265 | 38 | 30 |
*Drillhole Coordinates are in coordinate system NAD 83 Zone 17
The above references an opinion and is for information purposes only. It is not intended to be investment advice. Seek a licensed professional for investment advice. The author is not an insider or shareholder of any of the companies mentioned above.
The mining industry, known for its energy-intensive operations, is increasingly focusing on reducing its greenhouse gas (GHG) emissions. This shift comes in response to mounting pressure from various stakeholders, including investors, customers, and regulators.
Several mining companies have already initiated significant steps toward emission reduction. For example, Lowell Mineral Exploration Ecuador S.A., a subsidiary of Solaris Resources (TSX:SLS) (OTQB:SLSSF)., has been awarded a Level 1 “Carbon Footprint Quantification Badge” by Ecuador’s Ministry of Environment, Water, and Ecological Transition (MAATE). The badge is part of the Ministry’s Zero Carbon Ecuador Program (PECC) and marks Lowell as the first mining company to join the initiative. José Dávalos, the Minister of Environment, Water, and Ecological Transition, noted the difficulty of accurately measuring a mining company’s carbon footprint and praised Lowell for setting an example of responsible mining in Ecuador. He encouraged other companies in various industries to adopt international environmental standards and go beyond what is legally required by Ecuadorian laws.
The PECC aims to help companies quantify, reduce, and neutralize their greenhouse gas (GHG) emissions through a transparent verification system. To earn the Carbon Footprint Quantification Badge, companies must measure and report their emissions, in line with specific guidelines. These guidelines include compliance with the NTE INEN-ISO 14064-1:2018-GHG PROTOCOL, Zero Carbon Ecuador Program PECC MAATE-2021-047 standards, and ISO standards.
Federico Velásquez, President of Solaris for Latin America, commented in a press release: “This milestone is the first step in the implementation of our carbon reduction strategy by quantifying our carbon footprint through an independent, verified entity in order to reduce our emissions and contribute to mitigating climate change. These concrete actions allow us to catalyze change and lead our industry towards a greener future and guarantee the rights of the communities involved in the Warintza Project. We are now actively working towards achieving the targets set for Level 2 of PECC carbon reduction where we not only implement actions to mitigate environmental impacts but also further safeguard natural resources for future generations.”
Solaris Resources, the parent company of Lowell, is exploring the Warintza Project in southeastern Ecuador’s Morona Santiago province. The company has a program called “Warintza Verde” through which it aligns with United Nations Sustainable Development Goal #13. This program commits the company to incorporate climate-friendly policies and strategies and to take active steps to reduce its carbon footprint.
Global giants in the industry are also setting ambitious targets. Rio Tinto aims to cut its Scope 1 and 2 emissions by 33% by 2030, focusing on renewable energy, energy efficiency, and electrification. Similarly, BHP has committed to reducing its operational emissions by at least 30% by 2030 through comparable means. Vale has even set goals for Scope 3 emissions, aiming for a 15% reduction by 2035, in addition to a 33% reduction in its Scope 1 and 2 emissions by 2030.
As mentioned, the most common approach is enhancing energy efficiency. By investing in new technologies and upgrading equipment, companies can achieve this goal. Simple changes, like opting for energy-efficient lighting, heating, and ventilation systems, can make a substantial difference. There is also a growing trend to reduce dependence on diesel fuel, a significant source of GHG emissions. Alternatives like renewable energy sources or battery-powered vehicles are being explored to replace diesel-powered machinery.
Switching to renewable energy is another avenue to curb emissions. Investments in solar and wind energy are on the rise within the mining sector. Utilizing these cleaner energy options not only lowers emissions but also diminishes the reliance on fossil fuels, a known contributor to GHG emissions.
Additionally, mining companies are beginning to extend their emission reduction efforts to their supply chain. By setting emissions targets for suppliers and offering support to meet these goals, the industry can create a more comprehensive approach to sustainability.
Investors are demanding these initiatives more frequently for several reasons. Firstly, tackling climate change is an ethical imperative. The growing recognition of climate change as a severe threat to both the environment and human society makes emission reduction efforts more critical. Second, sustainability is becoming a key competitive differentiator. Companies demonstrating a commitment to reducing their environmental impact are more appealing to customers, who are increasingly valuing sustainability. And of course, these initiatives often translate to reduced operational costs, primarily through savings in energy expenses, making them financially advantageous for the companies.
The mining industry is proactively taking steps to lessen its environmental footprint, mainly by focusing on energy efficiency, renewable energy adoption, and collaborative efforts with suppliers, for a new competitive edge that will take the industry into the future.
The above references an opinion and is for information purposes only. It is not intended to be investment advice. Seek a licensed professional for investment advice. The author is not an insider or shareholder of any of the companies mentioned above.
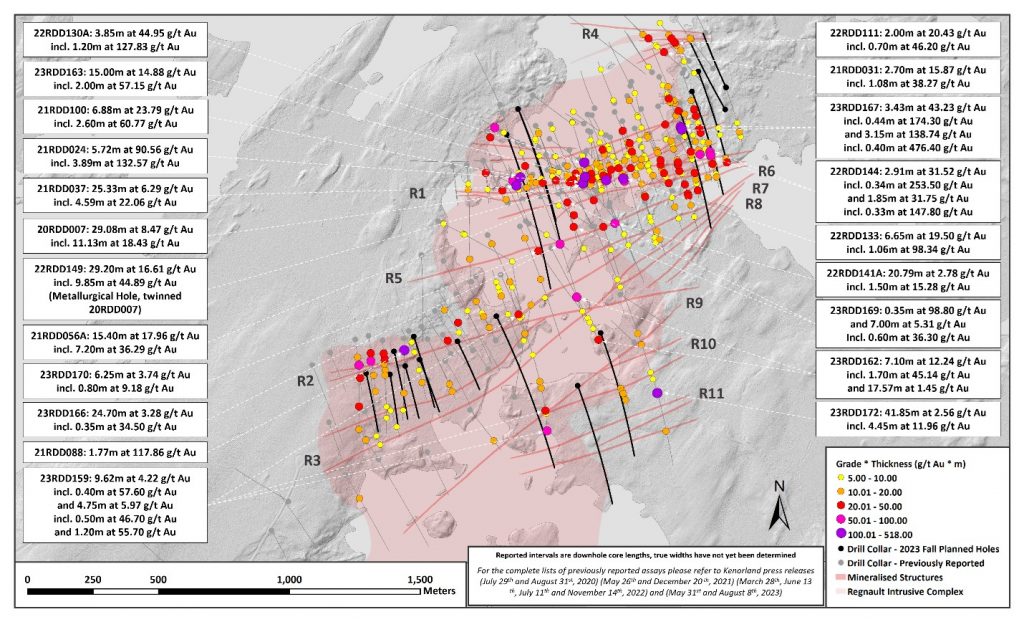
Kenorland Minerals (TSXV:KLD), recently announced the initiation of their Fall 2023 exploration program at the Frotet Project. Located in northern Quebec, the project is being conducted under a joint venture with Sumitomo Metal Mining Canada Ltd. (SMMCL).
Zach Flood, President and CEO of Kenorland Minerals, commented in a press release: “We’re excited to see the drills turning again at Regnault. During the previous phase of drilling, completed in the first quarter, we discovered a number of additional high-grade veins in the deepest parts of the system explored to date. This program will include step-outs on those discoveries as well as advancing drill targets directly to the east of the Regnault discovery. We are now at a stage where we can leverage a strong understanding of the geometry and controls on mineralisation to continue growing the footprint of the gold system.”
The Q3 2023 exploration program is set to include up to 11,300 meters of diamond drilling, with a focus on the Regnault gold discovery. The decision for this program comes after a recently concluded 13,360-meter drill program. Among the notable results from the last drill were findings of 11.96 g/t Au over a span of 4.45m and 55.70 g/t Au over 1.20m. These results were found in new vein structures approximately 1,000m below the surface, as per press releases on May 31 and August 8, 2023.
Details on the Fall Exploration Program
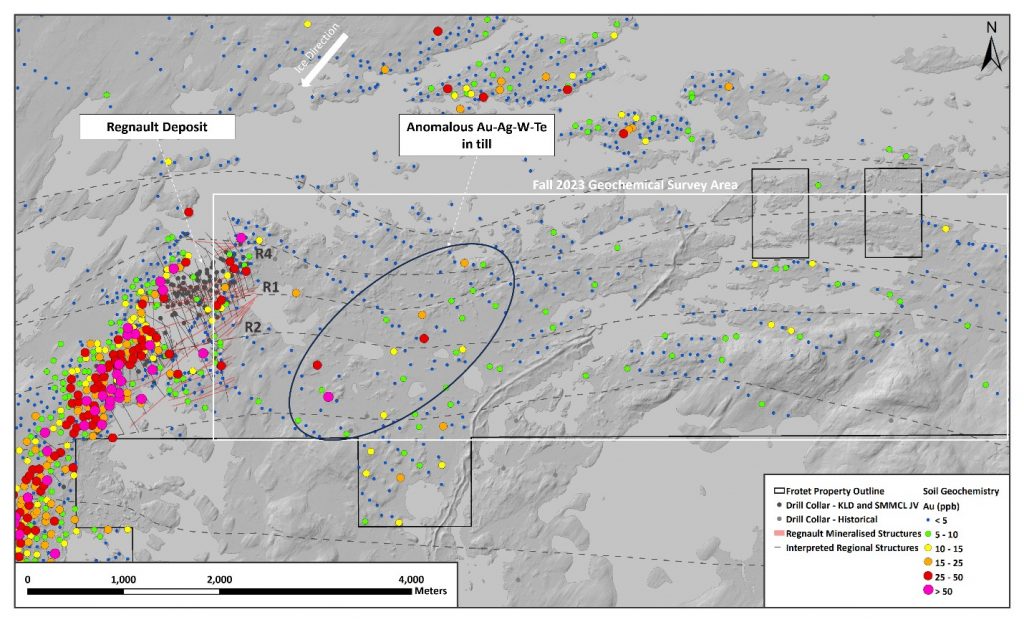
The exploration will also comprise an infill soil geochemical survey to the east of the Regnault discovery, intending to target further extensions of the gold system in this area.
For a more detailed breakdown:
- 45% of the proposed drilling will focus on the R5, R6, R7, and R8 mineralized structures at depth. There are plans to significantly expand these structures and infill the R1 vein system.
- 20% of the drilling will be reserved for the R2 and R3 trends. This will mainly involve infill drilling to improve geological modelling and understand grade continuity.
- 25% of the program will centre on the R9, R10, and R11 structures, especially focusing on the shallower portions of the Regnault diorite.
- The final 10% is planned to explore moderate step-outs along the R4 structures to the east.
A major component of the exploration is the collection of approximately 1,200 soil samples from the glacial till substrate. These samples will be obtained from a grid area adjacent to the Regnault gold discovery. The objective of this survey is to gain insights from previous gold anomalies detected from one of the Frotet Project’s initial geochemical surveys. Current structural interpretations, based on magnetics, indicate the gold mineralization-controlling structures from the Regnault discovery could extend eastward.
The data and targets derived from this survey are expected to guide the subsequent phase of drilling planned for early 2024.
Kenorland Minerals first recognized the potential of the Frotet Project in 2017. The project spans the Abitibi and Frotet-Evans Greenstone Belts of Quebec. The initial acquisition of the property was in March 2017, and by April 2018, it was optioned to SMMCL, a subsidiary of Sumitomo Metal Mining Co., Ltd.
Systematic sampling over two years paved the way for the first drill program in 2020, leading to a grassroots discovery at the now-named Regnault prospect. Currently, the joint venture between SMMCL and Kenorland Minerals Ltd. holds the project, with interest divisions at 80% and 20%, respectively. Under the agreement, Kenorland is the current operator, and exploration funding is proportionate between the two entities. If a party’s contribution falls below a 10% interest, their stake converts to a 2% uncapped net smelter royalty.
The above references an opinion and is for information purposes only. It is not intended to be investment advice. Seek a licensed professional for investment advice. The author is not an insider or shareholder of any of the companies mentioned above.
B2Gold (TSX:BTO), a Canadian gold producer, has finalized a deal to obtain full ownership of the Gramalote gold project in Colombia. This acquisition involves purchasing the 50% stake of the project previously held by AngloGold Ashanti (NYSE:AU) with the transaction priced at $60 million.
The Gramalote gold project, located 124km to the northeast of Medellin, underwent a pause in development during August of the previous year. This decision was due to preliminary outcomes from an optimized feasibility study, indicating that the project wasn’t meeting the joint venture’s criteria for mine development. Following this, the partnered companies debated over the project’s future. They eventually settled on selling Gramalote as the most suitable choice for both. However, they were unable to locate a third-party buyer.
B2Gold has clarified its intentions post-acquisition, emphasizing the advantages of bringing Gramalote under a singular ownership. This move is expected to pave the way for examining more affordable and higher-yielding developmental opportunities. The company highlighted that until now, the approach towards Gramalote was viewing it as a large-scale project with the potential to significantly increase production for both partnering entities. With this consolidation, B2Gold, headquartered in Vancouver, is set to delve into exploring diverse, smaller-scale developmental options in pursuit of cost-efficiency. Furthermore, a fresh study is on the horizon, scheduled to commence in the year’s last quarter, aiming for a preliminary assessment by mid-2024.
In terms of resource augmentation, B2Gold’s possession of Gramalote will incorporate an additional 2.11 million gold ounces of indicated mineral resources and 0.74 million gold ounces of inferred mineral resources.
AngloGold Ashanti, on the other hand, perceives this sale as an opportunity to sharpen its concentration on operational assets and potential projects ripe for development. The company shared these sentiments in a distinct announcement. Alberto Calderon, the Chief Executive Officer, expressed the company’s enduring dedication to Colombia, especially in light of their promising Quebradona copper and gold project. He stated, “AngloGold Ashanti remains a committed, long-term investor in Colombia with our exciting Quebradona copper and gold project and we look forward to playing a key role in developing of a modern, responsible mining sector in the country.”
The payment structure for the transaction has been broken down, with B2Gold scheduled to remit $20 million upon finalizing the deal. The remaining amount will be disbursed in segments, contingent on the attainment of specified milestones. An intriguing clause specifies that if the commercial production doesn’t kick off within half a decade post-transaction, B2Gold will owe nothing.
Gramalote holds a special place for B2Gold as its inaugural project during its exploration company phase. It made headlines in 2015 when it secured the first environmental permit in Colombia after a long hiatus of 35 years. This authorization presented a three-year window to address socio-environmental concerns, notably the relocation of artisanal miners and certain locals. Gramalote has also been dealing with a mining rights conflict with Canada’s Zonte Metals, which is still ongoing.
The above references an opinion and is for information purposes only. It is not intended to be investment advice. Seek a licensed professional for investment advice. The author is not an insider or shareholder of any of the companies mentioned above.
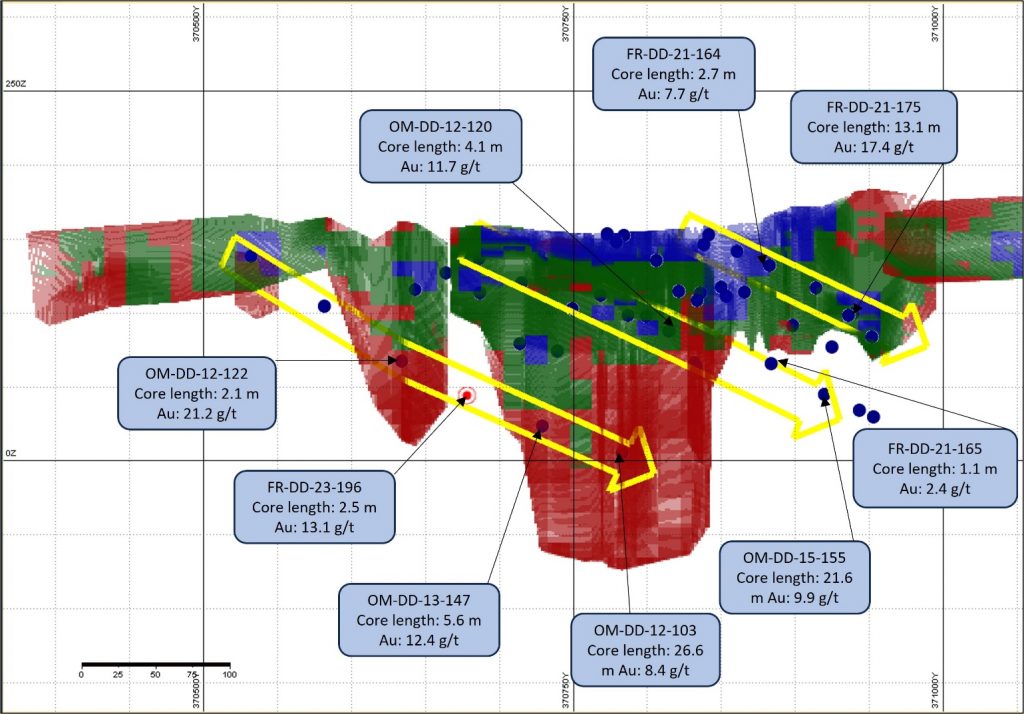
Galantas Gold (TSXV:GAL) has announced the results of the initial hole from their new surface drill operation at the Omagh Project located in Northern Ireland. This hole, labeled FR-DD-23-196, was aimed at a previously unexplored segment in the earlier resource model of the main Joshua Vein. During this drilling, they found an intersection with 13.1 grams per tonne (g/t) of gold and 91.6 g/t of silver spanning 2.5 metres.
Mario Stifano, CEO of Galantas, commented in a press release: “We are pleased with the encouraging early results of our new drill program from surface. As we continue drilling on the Joshua Vein, we will test the down-dip potential of this dilation zone with the aim of expanding the resource to ultimately add to the Omagh Mine’s production capacity.”
This new hole is significant as it traverses an area that hadn’t been drilled in the former resource model. Moreover, this site is situated within an anticipated dilation zone. Some other noteworthy findings from this same dilation trend include the OM-DD-12-122 hole which showed 21.2 g/t gold over 2.1 metres, the OM-DD-13-147 hole with 12.4 g/t gold across 5.6 metres, and the OM-DD-12-103 hole having 8.4 g/t gold over 26.6 metres.
Highlights from the results are as follows:
Table 1: Summary of drill results.
| Hole ID | Collar location | Collar elevation | Azimuth/ Dip (deg.) |
Intersect (m) (downhole) | Est. true width (m) | Intersect vertical depth (m)* | Gold (g/t) | Silver (g/t) |
Lead (%) |
Core loss (%) |
| FR-DD-23-196 | 239794 E 370715 N |
168 m | 250.1/50.3 | 2.5 | 1.5 | 132 | 13.1 | 91.6 | 8.9 | 1 |
Notes:
- Drill hole was NQ size and drilled using a triple tube method to maximize core recovery. The samples were analyzed (gold by fire assay and other metals by ICP-ORE) at ALS Laboratory Ltd (ISO 17025) of Galway, Ireland.
- Intersect vertical depth intervals are from ground surface to the top of the mineralized zone.
- Data has been rounded to 1 decimal place.
- All assays are reported without application of a top cut.
The above references an opinion and is for information purposes only. It is not intended to be investment advice. Seek a licensed professional for investment advice. The author is not an insider or shareholder of any of the companies mentioned above.
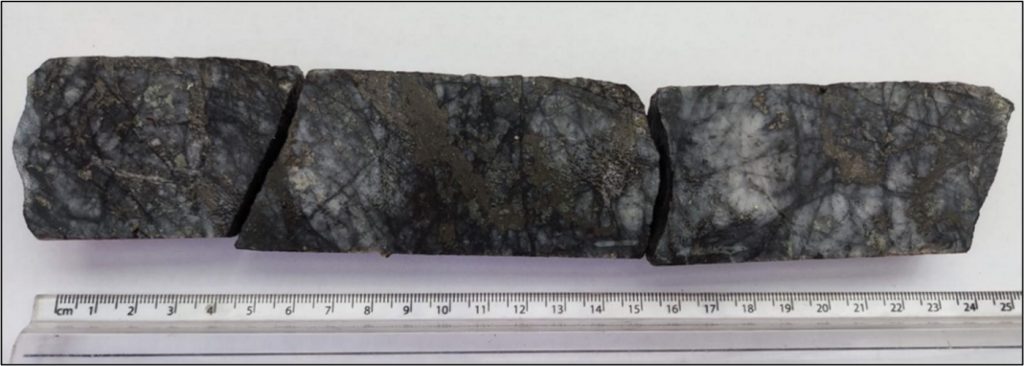
Goliath Resources (TSXV:GOT) has announced assay results for several drill holes from the Golden Gate Feeder Zone at its Golddigger Property located in the Golden Triangle, B.C. All of the drill holes revealed extensive intervals of quartz-sulphide mineralization accompanied by several occurrences of visible gold.
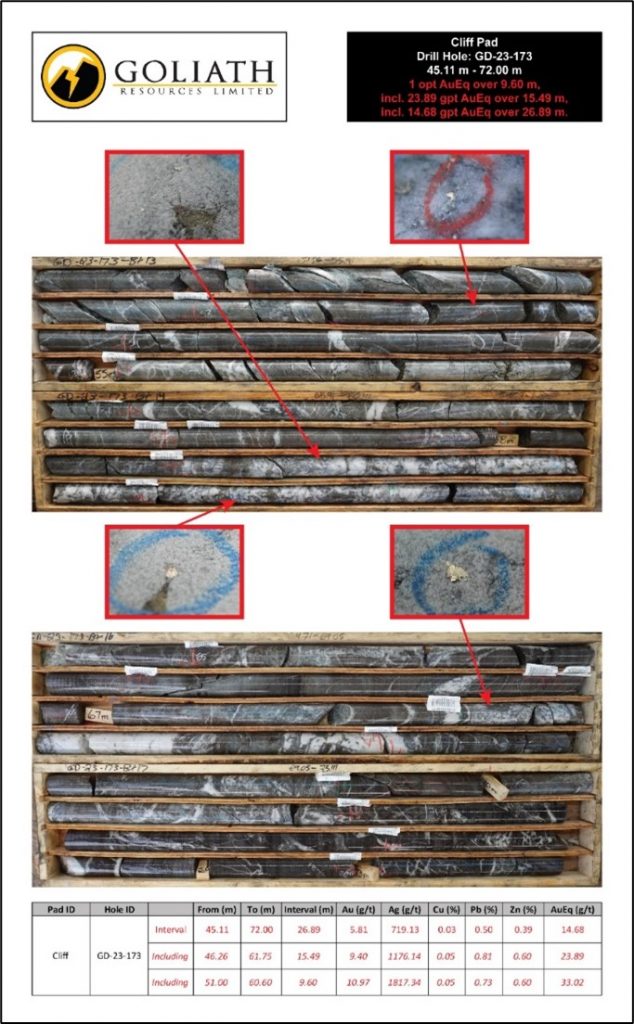
For hole GD-23-173, gold was discovered in two main intervals. The most notable interval, known as the Surebet Zone, ranged from 45.11 to 72 meters. Within this section, concentrations of 33.02 g/t gold equivalent were detected over 9.60 meters. The observed minerals in this zone include pyrrhotite, sphalerite, galena, and minor chalcopyrite. Visible gold was spotted seven times in the Surebet Zone, with the largest piece measuring up to 0.7 mm. Another significant interval, called the Bonanza Shear, was found between 446 and 455.27 meters. Assays for the latter are still underway.
In the GD-23-116 hole, three distinct mineralized intervals were noted. The Surebet Zone was detected between 38 and 42 meters with a concentration of 11.86 g/t gold equivalent over 3.00 meters. Further in-depth, another segment was located between 104 to 107 meters and a third at depths between 513 and 516.64 meters. The detected minerals in this hole were predominantly galena, sphalerite, pyrrhotite, chalcopyrite, and pyrite.
Hole GD-23-151 exhibited quartz-sulphide mineralization over three segments. The first is believed to be a splay of the Surebet zone, yielding 2.36 g/t gold equivalent over 2.70 meters. The primary Surebet Zone displayed a concentration of 8.28 g/t gold equivalent over 2.70 meters. Further results for the Bonanza Shear are pending. A notable find was a 0.5-millimeter-wide flake of visible gold at a depth of 143.85 m.
GD-23-135 demonstrated visible gold and quartz-sulphide mineralization over three intervals. The primary interval, linked to the Bonanza Shear, showed concentrations of 4.06 g/t gold equivalent over 5.00 meters. Two other intervals connected to the Surebet Zone were also observed. Visible gold was located at the 61.00-meter depth.
The drill results offer insights into the mineral wealth of the Golden Gate Feeder Zone. They not only highlight the presence of gold but also provide details on other minerals such as sphalerite, galena, and chalcopyrite among others. Further analyses and studies are expected to shed more light on the potential of the Golddigger Property.
The Golddigger Property is situated in the renowned geological setting of the Eskay Rift, nestled within the famed Golden Triangle of British Columbia. Spanning a vast expanse of 59,089 hectares (or 146,012 acres), this property is positioned within just 3 kilometers of the pivotal ‘Red Line,’ a geological marker known to host multiple world-class deposits.
A standout feature of the Golddigger Property is the Surebet discovery. This discovery boasts outstanding metallurgical results with gold recoveries standing at an impressive 92.2%. A significant portion, 48.8% to be precise, of this gold can be derived just from gravity at a 327-micrometer crush, highlighting the discovery’s potential.
Strategically, the location of the Golddigger Property is unparalleled. It is comfortably close to the communities of Alice Arm and Kitsault, and there’s an added advantage of having a permitted mill site on private property nearby. The property is ideally located on tide water, making it conveniently accessible by barge all the way to Prince Rupert, a distance of 190 kilometers via the Observatory inlet/Portland inlet. Further bolstering its accessibility, the town of Kitsault can be reached by road and boasts facilities like a barge landing, dock, and infrastructure that can accommodate up to 300 people. This town is also equipped with high-tension power, making it energy-efficient.
The region surrounding the Golddigger Property is also well-developed. Notably, the Dolly Varden Silver Mine Road is merely 7 kilometers east of the Surebet discovery. Other key infrastructures, such as the Alice Arm barge landing and high-tension power, are also in close proximity.
The city of Terrace, with a population of 16,000, acts as a pivotal hub, offering access to railways, major highways, and an airport. It also serves as a crucial supply point for essentials ranging from food and fuel to lumber. On the other hand, the coastal town of Prince Rupert, home to 12,000 residents, is significant in its own right. Apart from housing an international container seaport, it provides access to a railway network, an airport, and supplies.
Highlights from the results are as follows:
- GD-23-173 intercepted Visible Gold and significant quartz-sulphide mineralization in 2 broad mineralized intervals. The main interval corresponds to the Surebet Zone and was intersected from 45.11 to 72.00 meters.
- The main intercept consists of 14.68 g/t AuEq (5.81 g/t Au and 719.13 g/t Ag) over 26.89 meters (approx. true width) including 23.89 g/t AuEq (9.40 g/t Au and 1176.14 g/t Ag) over 15.49 meters and 33.02 g/t AuEq (10.97 g/t Au and 1817.34 g/t Ag) over 9.60 meters.
- A 9.27-meter interval from the deeper high grade Bonanza Shear intercepted from 446 to 455.27 meters that contains Visible Gold and abundant semi-massive and stringer galena, sphalerite, pyrrhotite and chalcopyrite (assays pending).
- An accompanying infographic is available here
- GD-23-116 intercepted 3 intervals with significant quartz-sulphide mineralization as massive to semi-massive and stockwork galena, sphalerite, pyrrhotite, chalcopyrite and pyrite. The main intercept between 38 and 42 meters corresponds to the Surebet Zone, a second interval from 104 to 107 meters corresponds to a Surebet splay and the third interval corresponds to the Bonanza Shear from 513 to 516.64 meters.
- The main intercept consists of 11.86 g/t AuEq (8.92 g/t Au and 147.53 g/t Ag) over 3.00 meters* within 8.94 g/t AuEq (6.75 g/t Au and 73.10 g/t Ag) over 4.00 meters*.
- A second mineralized interval consists of 5.11 g/t AuEq (2.39 g/t Au and 219.00 g/t Ag) over 3.00 meters*.
- The third interval consists of 5.77 g/t AuEq (4.70 g/t Au and 29.93 g/t Ag) over 3.64 meters* interpreted as the Bonanza Shear.
- An accompanying infographic is available here
- GD-23-151 intercepted 3 mineralized intervals. The first two intercepts were intersected from 79.15 to 81.85 meters and 99.15 to 168.38 meters and are interpreted to be a Surebet Splay and Surebet Zone, respectively. One intercept of the Bonanza Shear was intersected from 475.41 to 502.00 meters.
- The main intercept corresponds to the Surebet Zone and consists of 8.28 g/t AuEq (7.25 g/t Au and 51.81 g/t Ag) over 2.70 meters* within 3.77 g/t AuEq (3.32 g/t Au and 23.07 g/t Ag) over 6.70 meters* within 2.93 g/t AuEq (2.56 g/t Au and 18.64 g/t Ag) over 8.85 meters* and within 1.05 g/t AuEq (0.89 g/t Au and 8.21 g/t Ag) over 29.85 meters*.
- Assays are pending on a 26.59 meter* interval from the lower high grade Bonanza Shear consisting of abundant stockwork, stringer and massive galena, sphalerite and pyrrhotite.
- Mineralization in the gold-rich intercepts consists of stockwork to stringer and massive sulphides with up to 1% sphalerite, 1% galena and 10% pyrrhotite, and includes one occurrence of Visible Gold at a depth of 143.85 meters (Surebet Zone).
- An accompanying infographic is available here
- GD-23-135 intercepted Visible Gold and quartz-sulphide mineralization in 3 significant mineralized intervals:
- The main interval corresponds to the Bonanza Shear and consists of 5.00 meters* of 4.06 g/t AuEq (3.97 g/t Au and 2.08 g/t Ag) within 9.00 meters* of 2.87 g/t AuEq (2.81 g/t Au and 1.70 g/t Ag) and within 19.02 meters* of 1.75 g/t AuEq (1.70 g/t Au and 1.21 g/t Ag).
- A second interval corresponds to the Surebet Zone and consists of 1.17 meters* of 6.33 g/t AuEq (5.75 g/t Au and 32.50 g/t Ag) within 3.17 meters* of 3.31 g/t AuEq (2.82 g/t Au and 25.59 g/t Ag).
- The last interval is most likely a splay off the Surebet Zone and consists of 2.00 meters* of 4.41 g/t AuEq (2.76 g/t Au and 76.70 g/t Ag) within 4.76 meters* of 2.09 g/t AuEq (1.22 g/t Au and 39.16 g/t Ag).
- An accompanying infographic is available here
- All the occurrences of Visible Gold to date have been consistently identified within quartz-breccia and veins in contact with or in close proximity to pyrrhotite, sphalerite and/or galena mineralization.
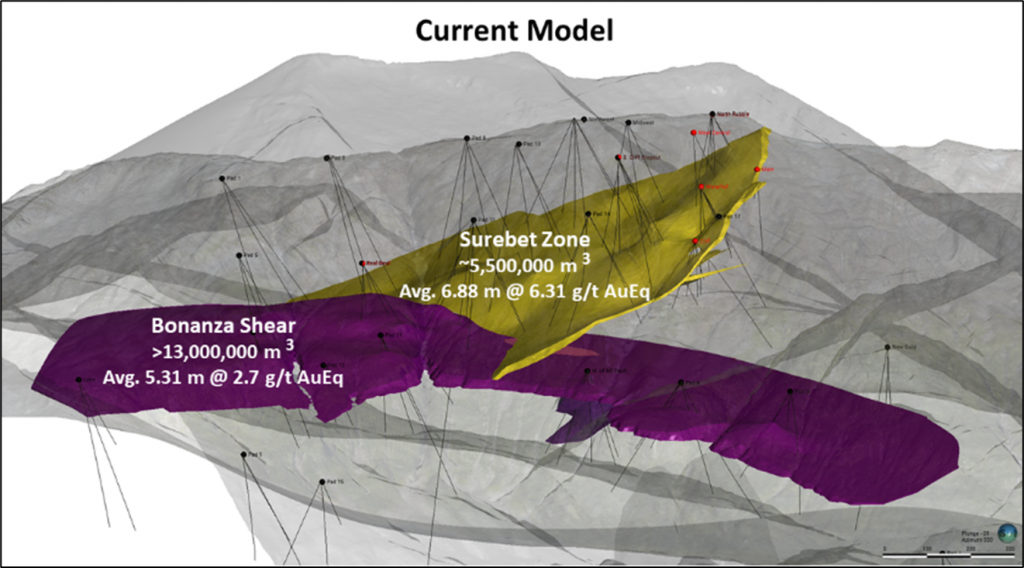
- Based on 2021 and 2022 drill assay results, the Bonanza Shear and Surebet Zone are currently modeled to be >13,000,000 m3 (Avg. 5.31 meters* @ 2.7 AuEq) and 5,500,000 m3 (Avg. 6.88 meters* @ 6.31 g/t AuEq) respectively (see model below).
- An accompanying infographic is available here
Table 1: Selected 2023 Golddigger drill hole assay results.
| Hole ID | From (m) | To (m) | Interval (m) | Au (g/t) | Ag (g/t) | Cu (%) | Pb (%) | Zn (%) | AuEq (g/t) | |
| GD-23-116 | Interval | 38.00 | 42.00 | 4.00 | 6.75 | 73.10 | 0.02 | 0.02 | 0.00 | 8.94 |
| Including | 38.00 | 41.00 | 3.00 | 8.92 | 147.53 | 0.09 | 1.70 | 1.23 | 11.86 | |
| Interval | 104.00 | 107.00 | 3.00 | 2.39 | 219.00 | 0.02 | 0.12 | 0.16 | 5.11 | |
| Interval | 513.00 | 516.64 | 3.64 | 4.70 | 29.93 | 0.03 | 0.97 | 0.86 | 5.77 | |
| GD-23-135 | Interval | 54.80 | 66.00 | 11.20 | 0.58 | 20.73 | 0.01 | 0.26 | 0.33 | 1.07 |
| Including | 59.00 | 63.76 | 4.76 | 1.22 | 39.16 | 0.02 | 0.50 | 0.53 | 2.09 | |
| Including | 59.00 | 61.00 | 2.00 | 2.76 | 76.70 | 0.02 | 0.98 | 0.97 | 4.41 | |
| Interval | 100.00 | 113.62 | 13.62 | 0.86 | 9.74 | 0.01 | 0.03 | 0.08 | 1.03 | |
| Including | 100.00 | 105.17 | 5.17 | 1.82 | 22.16 | 0.01 | 0.08 | 0.20 | 2.20 | |
| Including | 102.00 | 105.17 | 3.17 | 2.82 | 25.59 | 0.01 | 0.13 | 0.31 | 3.31 | |
| Including | 104.00 | 105.17 | 1.17 | 5.75 | 32.50 | 0.02 | 0.13 | 0.32 | 6.33 | |
| Interval | 141.52 | 148.85 | 7.33 | 0.41 | 8.19 | 0.00 | 0.06 | 0.13 | 0.58 | |
| Including | 144.00 | 145.70 | 1.70 | 1.19 | 8.13 | 0.00 | 0.06 | 0.26 | 1.42 | |
| Including | 144.86 | 145.70 | 0.84 | 1.61 | 6.72 | 0.00 | 0.08 | 0.32 | 1.85 | |
| Interval | 388.15 | 407.17 | 19.02 | 1.70 | 1.21 | 0.00 | 0.00 | 0.06 | 1.75 | |
| Including | 397.00 | 406.00 | 9.00 | 2.81 | 1.70 | 0.00 | 0.00 | 0.10 | 2.87 | |
| Including | 397.00 | 404.00 | 7.00 | 3.32 | 2.00 | 0.00 | 0.00 | 0.12 | 3.40 | |
| Including | 397.00 | 402.00 | 5.00 | 3.97 | 2.08 | 0.00 | 0.00 | 0.15 | 4.06 | |
| Interval | 430.00 | 432.00 | 2.00 | 0.39 | 1.07 | 0.01 | 0.00 | 0.02 | 0.42 | |
| Including | 430.00 | 431.00 | 1.00 | 0.67 | 1.02 | 0.01 | 0.00 | 0.03 | 0.70 | |
| GD-23-151 | Interval | 99.15 | 129 | 29.85 | 0.89 | 8.21 | 0.01 | 0.08 | 0.06 | 1.05 |
| Including | 99.15 | 108.00 | 8.85 | 2.56 | 18.64 | 0.01 | 0.21 | 0.17 | 2.93 | |
| Including | 100.30 | 107.00 | 6.70 | 3.32 | 23.07 | 0.01 | 0.26 | 0.19 | 3.77 | |
| Including | 100.30 | 103.00 | 2.70 | 7.25 | 51.81 | 0.02 | 0.63 | 0.44 | 8.28 | |
| GD-23-173 | Interval | 45.11 | 72.00 | 26.89 | 5.81 | 719.13 | 0.03 | 0.50 | 0.39 | 14.68 |
| Including | 46.26 | 61.75 | 15.49 | 9.40 | 1176.14 | 0.05 | 0.81 | 0.60 | 23.89 | |
| Including | 51.00 | 60.60 | 9.60 | 10.97 | 1817.34 | 0.05 | 0.73 | 0.60 | 33.02 |
Table 2: Collar information for the drill hole reported in this news release.
| Drillhole Name | Easting | Northing | CRS | Azimuth | Dip | Length (m) |
| GD-23-116 | 457720.7 | 6162966 | NAD83 UTM Z9N | 130 | 63 | 532 |
| GD-23-135 | 457712.0 | 6162910 | NAD83 UTM Z9N | 160 | 55 | 521 |
| GD-23-151 | 457717.5 | 6162967 | NAD83 UTM Z9N | 215 | 55 | 555 |
| GD-23-173 | 457717.2 | 6162968 | NAD83 UTM Z9N | 235 | 85 | 473 |
The above references an opinion and is for information purposes only. It is not intended to be investment advice. Seek a licensed professional for investment advice. The author is not an insider or shareholder of any of the companies mentioned above.
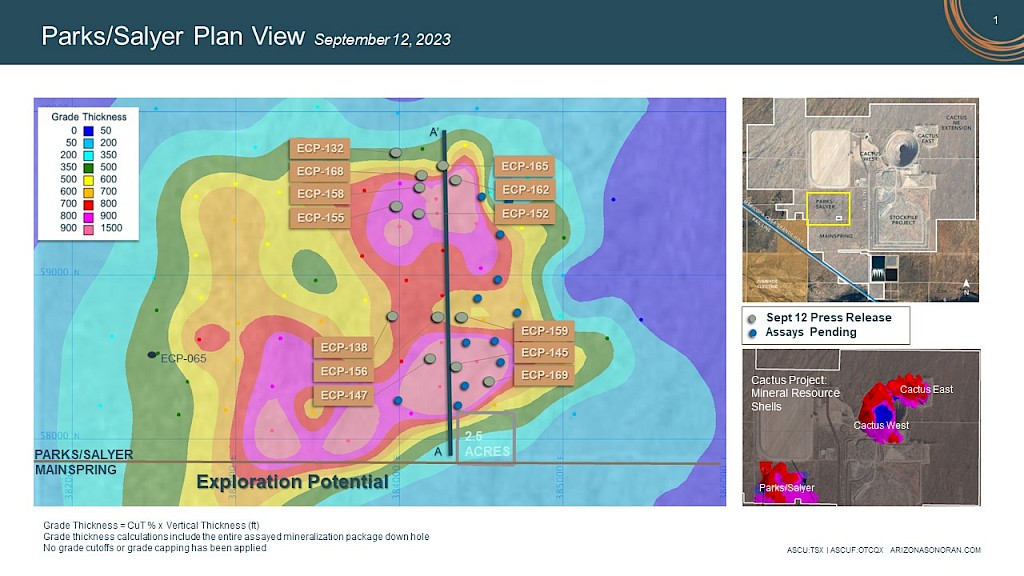
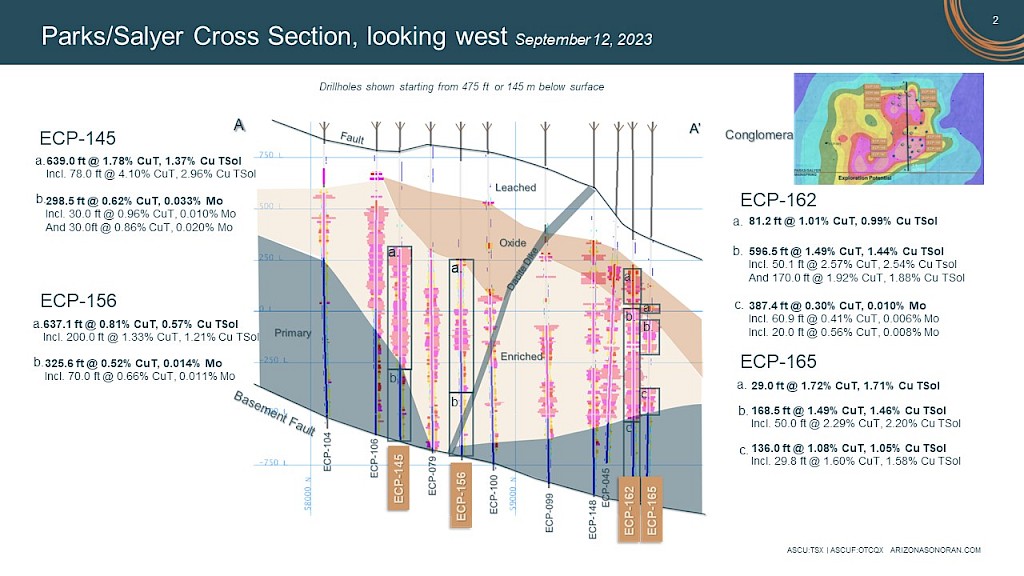
Arizona Sonoran Copper (TSX:ASCU) has successfully completed drilling of 13 infill holes at the Parks/Salyer deposit’s high-grade core, which displays consistency in both grade and mineralized widths at a 125 ft (38 m) drill spacing. Out of the total planned drilling for the Cactus Project deposits, 29,036 ft (8,850.2 m) has been covered, aiming to complete an overall 105,000 ft (32,000 m) by the end of the program. This extensive drill program seeks to improve the precision of the current mineral resources, setting the stage for a detailed feasibility study in 2024.
Since the beginning of April 2023, 26 out of a proposed 47-hole program have been drilled at 125 ft (38m) drill centres in the eastern section of the Parks/Salyer mineral resource area. The primary aim remains to pinpoint the high-grade core of the mineral resource, with the geological team noting steady intervals of mineralization. This effort is gearing up for a comprehensive feasibility study next year. Notably, holes ECP-145 and ECP-162 indicate a continuity of width and grade that aligns with expectations set by an earlier 250 ft (76m) drill program. This consistency is particularly evident in areas previously identified to have a thicker and higher-grade copper presence. As drilling progresses, forthcoming results are anticipated to provide more insights into the specific traits and boundaries of the two prominent high-grade mineralization centres.
George Ogilvie, Arizona Sonoran President and CEO commented in a press release: “The team continues to execute and deliver solid results as we advance our Cactus and Parks/Salyer projects. The proven continuity of the Parks/Salyer mineralization within the deposit continues to support our vision of a top tier asset within a tier 1 jurisdiction. Additionally, with the recent option of MainSpring, the Parks/Salyer southern extension, we see a tremendous opportunity to continue building the Parks/Salyer mineral resource beyond the current 2.9 billion pounds at 1.015% total copper inferred resource.”
Highlights from the results are as follows:
– Drilling replicating high-grade thicknesses from prior drill programs, including 5 new intervals in the top 10 grade thickness intervals at Parks/Salyer
– In July and August, 2 drill rigs focused in the eastern section, interpreted to be the high grade core of the deposit
– ECP-145: 937 ft (285.8 m) @ 1.41% CuT of continuous mineralization
- 639 ft (194.8 m) @ 1.78% CuT, 1.37% Cu TSol, 0.016% Mo (enriched)
- Incl 78 ft (23.8 m) @ 4.10% CuT, 2.96% Cu TSol, 0.013% Mo
– ECP-147: 1,023 ft (312 m) @ 1.05% CuT of continuous mineralization
- 935 ft (285.2 m) @ 1.02% CuT, 0.63% Cu TSol, 0.014% Mo (enriched)
- Incl 202 ft (61.6 m) @ 2.03% CuT, 1.28% Cu TSol, 0.016% Mo
– ECP-162: 1,132 ft (344.9 m) @ 1.23% CuT of continuous mineralization
- 597 ft (181.8 m) @ 1.49% CuT, 1.44% Cu TSol, 0.019% Mo (enriched)
- And 170 ft (51.8 m) @ 1.92% CuT, 1.88% Cu TSol, 0.023% Mo
– ECP-169: 880.2 ft (268.3 m) @ 1.13% CuT of continuous mineralization
- 519 ft (158.2 m) @ 1.49% CuT, 1.09% Cu TSol, 0.011% Mo (enriched)
- Incl 158ft (48.2m) @ 2.16% CuT, 2.10% Cu TSol, 0.004% Mo
– ECP-152: 1,011 ft (308.2 m) @ 0.78% CuT of continuous mineralization
- 674 ft (205.6 m) @ 1.0% CuT, 0.94% Cu TSol, 0.020% Mo (enriched)
- Incl 125 ft (38.3 m) @ 2.18% CuT, 2.13% Cu TSol, 0.017% Mo
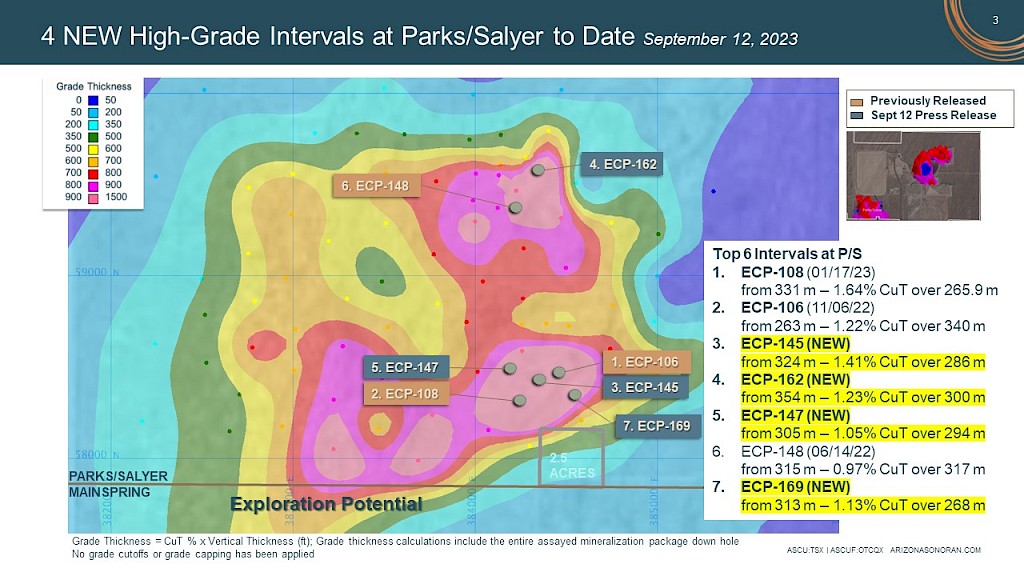
TABLE 1
|
Hole Id |
Zone |
Feet |
Metres |
Grade |
||||||
|
From |
To |
Length |
From |
To |
Length |
CuT |
TSol |
Mo |
||
|
ECP-132 |
oxide |
1,535.5 |
1,586.9 |
51.4 |
468.0 |
483.7 |
15.7 |
0.95 |
0.94 |
0.011 |
|
enriched |
1,586.9 |
1,816.0 |
229.1 |
483.7 |
553.5 |
69.8 |
1.02 |
0.95 |
0.007 |
|
|
including |
1,586.9 |
1,634.7 |
47.8 |
483.7 |
498.3 |
14.6 |
1.52 |
1.45 |
0.012 |
|
|
and |
1,678.0 |
1,708.0 |
30.0 |
511.5 |
520.6 |
9.1 |
1.24 |
1.20 |
0.005 |
|
|
and |
1,752.6 |
1,804.0 |
51.4 |
534.2 |
549.9 |
15.7 |
1.17 |
1.03 |
0.005 |
|
|
primary |
1,816.0 |
2,246.0 |
430.0 |
553.5 |
684.6 |
131.1 |
0.21 |
0.02 |
0.004 |
|
|
including |
1,843.0 |
1,896.0 |
53.0 |
561.7 |
577.9 |
16.2 |
0.36 |
0.05 |
0.002 |
|
|
ECP-138 |
enriched |
1,041.4 |
1,159.0 |
117.6 |
317.4 |
353.3 |
35.8 |
1.58 |
1.54 |
0.010 |
|
including |
1,068.0 |
1,108.0 |
40.0 |
325.5 |
337.7 |
12.2 |
2.52 |
2.51 |
0.007 |
|
|
enriched |
1,268.0 |
1,313.3 |
45.3 |
386.5 |
400.3 |
13.8 |
0.96 |
0.93 |
0.028 |
|
|
enriched |
1,376.2 |
1,497.7 |
121.5 |
419.5 |
456.5 |
37.0 |
1.00 |
0.78 |
0.016 |
|
|
including |
1,386.0 |
1,451.0 |
65.0 |
422.5 |
442.3 |
19.8 |
1.39 |
1.30 |
0.016 |
|
|
primary |
1,497.7 |
2,115.8 |
618.1 |
456.5 |
644.9 |
188.4 |
0.49 |
0.05 |
0.013 |
|
|
including |
1,597.0 |
1,657.3 |
60.3 |
486.8 |
505.1 |
18.4 |
0.65 |
0.07 |
0.016 |
|
|
and |
1,798.5 |
2,008.3 |
209.8 |
548.2 |
612.1 |
63.9 |
0.69 |
0.05 |
0.020 |
|
|
ECP-145 |
enriched |
1,064.0 |
1,703.0 |
639.0 |
324.3 |
519.1 |
194.8 |
1.78 |
1.37 |
0.016 |
|
including |
1,074.0 |
1,152.0 |
78.0 |
327.4 |
351.1 |
23.8 |
4.10 |
2.96 |
0.013 |
|
|
primary |
1,703.0 |
2,001.5 |
298.5 |
519.1 |
610.1 |
91.0 |
0.62 |
0.05 |
0.033 |
|
|
including |
1,703.0 |
1,733.0 |
30.0 |
519.1 |
528.2 |
9.1 |
0.96 |
0.09 |
0.010 |
|
|
and |
1,852.0 |
1,882.0 |
30.0 |
564.5 |
573.6 |
9.1 |
0.86 |
0.07 |
0.020 |
|
|
ECP-147 |
enriched |
1,000.3 |
1,936.0 |
935.7 |
304.9 |
590.1 |
285.2 |
1.02 |
0.63 |
0.014 |
|
including |
1,145.0 |
1,347.0 |
202.0 |
349.0 |
410.6 |
61.6 |
2.03 |
1.28 |
0.016 |
|
|
and |
1,397.0 |
1,427.0 |
30.0 |
425.8 |
434.9 |
9.1 |
1.75 |
1.29 |
0.021 |
|
|
primary |
1,936.0 |
2,024.0 |
88.0 |
590.1 |
616.9 |
26.8 |
0.62 |
0.05 |
0.013 |
|
|
ECP-152 |
oxide |
1,042.0 |
1,062.3 |
20.3 |
317.6 |
323.8 |
6.2 |
1.00 |
0.97 |
0.018 |
|
enriched |
1,272.0 |
1,946.7 |
674.7 |
387.7 |
593.4 |
205.6 |
1.00 |
0.94 |
0.020 |
|
|
including |
1,293.4 |
1,419.0 |
125.6 |
394.2 |
432.5 |
38.3 |
2.18 |
2.13 |
0.017 |
|
|
and |
1,674.0 |
1,724.0 |
50.0 |
510.2 |
525.5 |
15.2 |
1.33 |
1.31 |
0.028 |
|
|
and |
1,892.0 |
1,916.0 |
24.0 |
576.7 |
584.0 |
7.3 |
1.68 |
1.65 |
0.032 |
|
|
primary |
1,946.7 |
2,283.0 |
336.3 |
593.4 |
695.9 |
102.5 |
0.35 |
0.04 |
0.016 |
|
|
including |
1,946.7 |
2,075.0 |
128.3 |
593.4 |
632.5 |
39.1 |
0.54 |
0.05 |
0.017 |
|
|
ECP-155 |
oxide |
1,072.0 |
1,140.0 |
68.0 |
326.7 |
347.5 |
20.7 |
0.72 |
0.70 |
0.018 |
|
oxide |
1,223.5 |
1,315.0 |
91.5 |
372.9 |
400.8 |
27.9 |
0.87 |
0.85 |
0.018 |
|
|
enriched |
1,315.0 |
1,887.6 |
572.6 |
400.8 |
575.3 |
174.5 |
1.04 |
0.92 |
0.023 |
|
|
including |
1,322.0 |
1,347.0 |
25.0 |
402.9 |
410.6 |
7.6 |
2.20 |
2.17 |
0.031 |
|
|
and |
1,510.0 |
1,620.0 |
110.0 |
460.2 |
493.8 |
33.5 |
1.29 |
1.06 |
0.028 |
|
|
and |
1,690.0 |
1,730.0 |
40.0 |
515.1 |
527.3 |
12.2 |
1.41 |
1.31 |
0.021 |
|
|
primary |
1,887.6 |
2,290.0 |
402.4 |
575.3 |
698.0 |
122.7 |
0.23 |
0.02 |
0.011 |
|
|
including |
1,988.0 |
2,017.0 |
29.0 |
605.9 |
614.8 |
8.8 |
0.87 |
0.06 |
0.017 |
|
|
ECP-156 |
enriched |
1,118.9 |
1,756.0 |
637.1 |
341.0 |
535.2 |
194.2 |
0.81 |
0.57 |
0.010 |
|
including |
1,366.0 |
1,566.0 |
200.0 |
416.4 |
477.3 |
61.0 |
1.33 |
1.21 |
0.009 |
|
|
primary |
1,756.0 |
2,081.6 |
325.6 |
535.2 |
634.5 |
99.2 |
0.52 |
0.05 |
0.014 |
|
|
including |
1,806.0 |
1,876.0 |
70.0 |
550.5 |
571.8 |
21.3 |
0.66 |
0.06 |
0.011 |
|
|
ECP-158 |
oxide |
1,256.0 |
1,336.7 |
80.7 |
382.8 |
407.4 |
24.6 |
1.70 |
1.69 |
0.020 |
|
enriched |
1,367.0 |
1,876.9 |
509.9 |
416.7 |
572.1 |
155.4 |
1.20 |
1.09 |
0.020 |
|
|
including |
1,382.0 |
1,432.0 |
50.0 |
421.2 |
436.5 |
15.2 |
2.79 |
2.13 |
0.032 |
|
|
and |
1,634.0 |
1,734.0 |
100.0 |
498.0 |
528.5 |
30.5 |
1.45 |
1.40 |
0.016 |
|
|
primary |
1,876.9 |
2,311.0 |
434.1 |
572.1 |
704.4 |
132.3 |
0.27 |
0.03 |
0.011 |
|
|
including |
1,897.0 |
1,969.4 |
72.4 |
578.2 |
600.3 |
22.1 |
0.42 |
0.04 |
0.009 |
|
|
and |
2,240.0 |
2,300.0 |
60.0 |
682.8 |
701.0 |
18.3 |
0.41 |
0.03 |
0.011 |
|
|
ECP-159 |
enriched |
1,493.0 |
1,823.2 |
330.2 |
455.1 |
555.7 |
100.6 |
1.27 |
0.77 |
0.015 |
|
including |
1,503.0 |
1,587.0 |
84.0 |
458.1 |
483.7 |
25.6 |
1.84 |
1.35 |
0.012 |
|
|
primary |
1,823.2 |
2,056.3 |
233.1 |
555.7 |
626.8 |
71.0 |
0.58 |
0.14 |
0.017 |
|
|
including |
1,833.0 |
1,903.5 |
70.5 |
558.7 |
580.2 |
21.5 |
0.70 |
0.09 |
0.017 |
|
|
ECP-162 |
oxide |
1,163.0 |
1,310.8 |
147.8 |
354.5 |
399.5 |
45.0 |
1.39 |
1.36 |
0.015 |
|
including |
1,212.7 |
1,280.7 |
68.0 |
369.6 |
390.4 |
20.7 |
2.09 |
2.05 |
0.017 |
|
|
enriched |
1,321.0 |
1,917.5 |
596.5 |
402.6 |
584.5 |
181.8 |
1.49 |
1.44 |
0.019 |
|
|
including |
1,367.9 |
1,418.0 |
50.1 |
416.9 |
432.2 |
15.3 |
2.57 |
2.54 |
0.016 |
|
|
and |
1,668.0 |
1,838.0 |
170.0 |
508.4 |
560.2 |
51.8 |
1.92 |
1.88 |
0.023 |
|
|
primary |
1,917.5 |
2,304.9 |
387.4 |
584.5 |
702.5 |
118.1 |
0.30 |
0.03 |
0.010 |
|
|
including |
1,917.5 |
1,978.4 |
60.9 |
584.5 |
603.0 |
18.6 |
0.41 |
0.05 |
0.006 |
|
|
and |
2,059.0 |
2,079.0 |
20.0 |
627.6 |
633.7 |
6.1 |
0.56 |
0.06 |
0.008 |
|
|
ECP-165 |
oxide |
1,357.0 |
1,386.0 |
29.0 |
413.6 |
422.5 |
8.8 |
1.72 |
1.71 |
0.033 |
|
enriched |
1,429.5 |
1,598.0 |
168.5 |
435.7 |
487.1 |
51.4 |
1.49 |
1.46 |
0.012 |
|
|
including |
1,437.0 |
1,487.0 |
50.0 |
438.0 |
453.2 |
15.2 |
2.29 |
2.20 |
0.013 |
|
|
enriched |
1,748.0 |
1,884.0 |
136.0 |
532.8 |
574.2 |
41.5 |
1.08 |
1.05 |
0.009 |
|
|
including |
1,758.2 |
1,788.0 |
29.8 |
535.9 |
545.0 |
9.1 |
1.60 |
1.58 |
0.010 |
|
|
primary |
1,884.0 |
2,327.0 |
443.0 |
574.2 |
709.3 |
135.0 |
0.28 |
0.03 |
0.011 |
|
|
including |
1,908.5 |
1,945.0 |
36.5 |
581.7 |
592.8 |
11.1 |
0.46 |
0.04 |
0.007 |
|
|
ECP-168 |
oxide |
1,282.0 |
1,385.5 |
103.5 |
390.8 |
422.3 |
31.5 |
0.97 |
0.97 |
0.027 |
|
including |
1,365.4 |
1,385.5 |
20.1 |
416.2 |
422.3 |
6.1 |
2.36 |
2.36 |
0.036 |
|
|
enriched |
1,405.0 |
1,570.5 |
165.5 |
428.2 |
478.7 |
50.4 |
1.28 |
1.22 |
0.016 |
|
|
including |
1,405.0 |
1,439.0 |
34.0 |
428.2 |
438.6 |
10.4 |
2.09 |
2.08 |
0.038 |
|
|
and |
1,518.0 |
1,548.0 |
30.0 |
462.7 |
471.8 |
9.1 |
1.63 |
1.62 |
0.010 |
|
|
enriched |
1,696.3 |
1,862.5 |
166.2 |
517.0 |
567.7 |
50.7 |
1.49 |
1.46 |
0.008 |
|
|
including |
1,730.0 |
1,800.0 |
70.0 |
527.3 |
548.6 |
21.3 |
1.93 |
0.35 |
0.006 |
|
|
primary |
1,862.5 |
2,300.4 |
437.9 |
567.7 |
701.2 |
133.5 |
0.25 |
0.03 |
0.010 |
|
|
including |
1,862.5 |
1,960.0 |
97.5 |
567.7 |
597.4 |
29.7 |
0.44 |
0.06 |
0.012 |
|
|
ECP-169 |
enriched |
693.3 |
730.0 |
36.7 |
211.3 |
222.5 |
11.2 |
0.79 |
0.79 |
0.007 |
|
enriched |
1,028.1 |
1,547.0 |
518.9 |
313.4 |
471.5 |
158.2 |
1.49 |
1.09 |
0.011 |
|
|
including |
1,036.0 |
1,194.0 |
158.0 |
315.8 |
363.9 |
48.2 |
2.16 |
2.10 |
0.004 |
|
|
primary |
1,547.0 |
1,908.3 |
361.3 |
471.5 |
581.6 |
110.1 |
0.61 |
0.05 |
0.017 |
|
|
including |
1,601.5 |
1,692.0 |
90.5 |
488.1 |
515.7 |
27.6 |
0.75 |
0.08 |
0.020 |
|
|
1. |
Intervals are presented in core length and are drilled with vertical, or steep dip angles. |
|
|
2. |
Drill assays assume a mineralized cut-off grade of 0.5% CuT reflecting the potential for heap leaching of underground material in the case of Oxide and Enriched or in the case of Primary material, 0.1% CuT, to provide typical average grades. Holes were terminated below the basement fault. |
|
|
3. |
Assay results are not capped. Intercepts are aggregated within geological confines of major mineral zones. |
|
|
4. |
True widths are not known. |
Table 2: Drilling details
|
Hole |
Easting (m) |
Northing (m) |
Elevation (ft) |
TD (ft) |
Azimuth |
Dip |
|
ECP-132 |
421884.8 |
3645378.0 |
1386.7 |
2430.0 |
235.0 |
-80.0 |
|
ECP-138 |
421775.2 |
3645055.4 |
1376.0 |
2248.0 |
115.0 |
-80.0 |
|
ECP-145 |
421948.2 |
3644932.1 |
1377.2 |
2011.6 |
0.0 |
-90.0 |
|
ECP-147 |
421897.2 |
3644937.9 |
1374.2 |
2219.9 |
0.0 |
-90.0 |
|
ECP-152 |
421876.6 |
3645214.3 |
1381.0 |
2315.0 |
0.0 |
-90.0 |
|
ECP-155 |
421843.8 |
3645229.5 |
1381.0 |
2315.4 |
0.0 |
-90.0 |
|
ECP-156 |
421919.7 |
3645022.2 |
1376.8 |
2103.0 |
0.0 |
-90.0 |
|
ECP-158 |
421876.6 |
3645251.8 |
1381.9 |
2347.2 |
0.0 |
-90.0 |
|
ECP-159 |
421960.0 |
3645022.5 |
1377.4 |
2077.0 |
0.0 |
-90.0 |
|
ECP-162 |
421945.2 |
3645277.4 |
1383.3 |
2323.0 |
0.0 |
-90.0 |
|
ECP-165 |
421921.3 |
3645307.7 |
1384.6 |
2373.0 |
0.0 |
-90.0 |
|
ECP-168 |
421884.6 |
3645283.8 |
1382.8 |
2360.1 |
0.0 |
-90.0 |
|
ECP-169 |
422007.8 |
3644902.1 |
1374.8 |
1912.8 |
0.0 |
-90.0 |
The above references an opinion and is for information purposes only. It is not intended to be investment advice. Seek a licensed professional for investment advice. The author is not an insider or shareholder of any of the companies mentioned above.
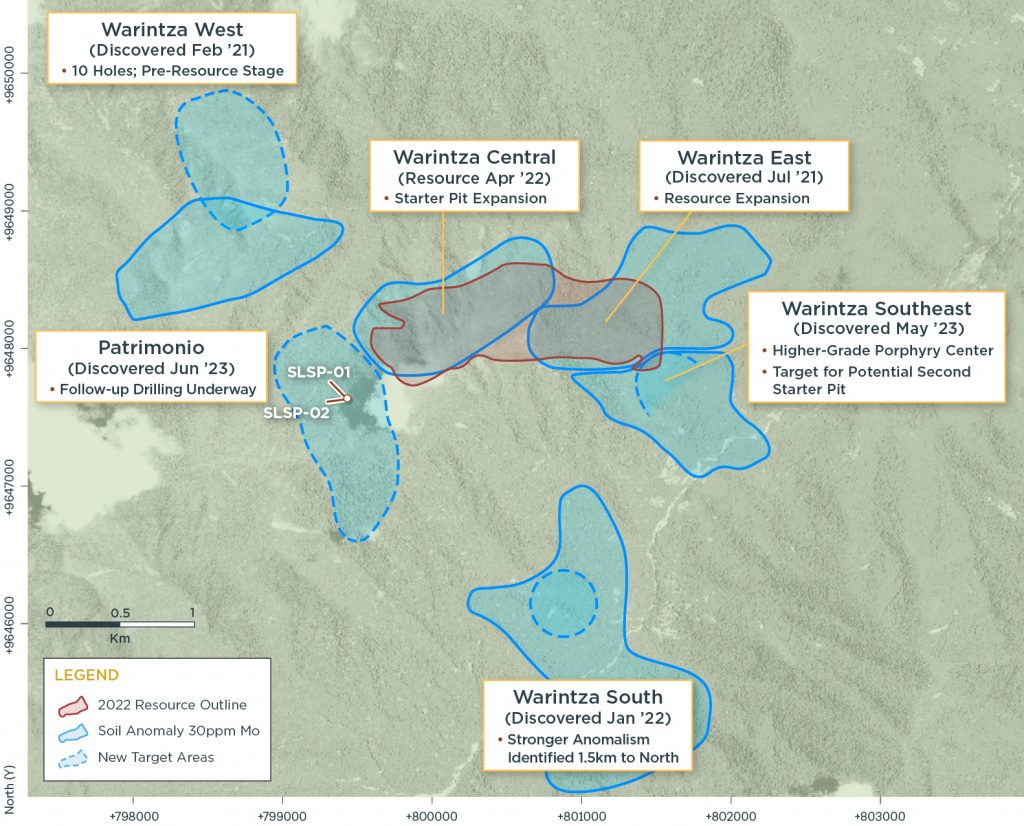
Solaris Resources (TSX:SLS) has reported assay results from its initial two reconnaissance drill holes at the Patrimonio target located within the Warintza Project in southeastern Ecuador. These results solidify the finding of a substantial new copper deposit southwest of Warintza Central.
The Patrimonio discovery was made in June 2023 during a mapping and sampling initiative in proximity to Warintza Central, specifically about 0.5 km to its southwest. These early drill holes have now confirmed the existence of this notable copper reserve. Furthermore, a unique skarn mineralization has been observed within volcanic sequences rich in carbonate. The source of this mineralization is still under investigation.
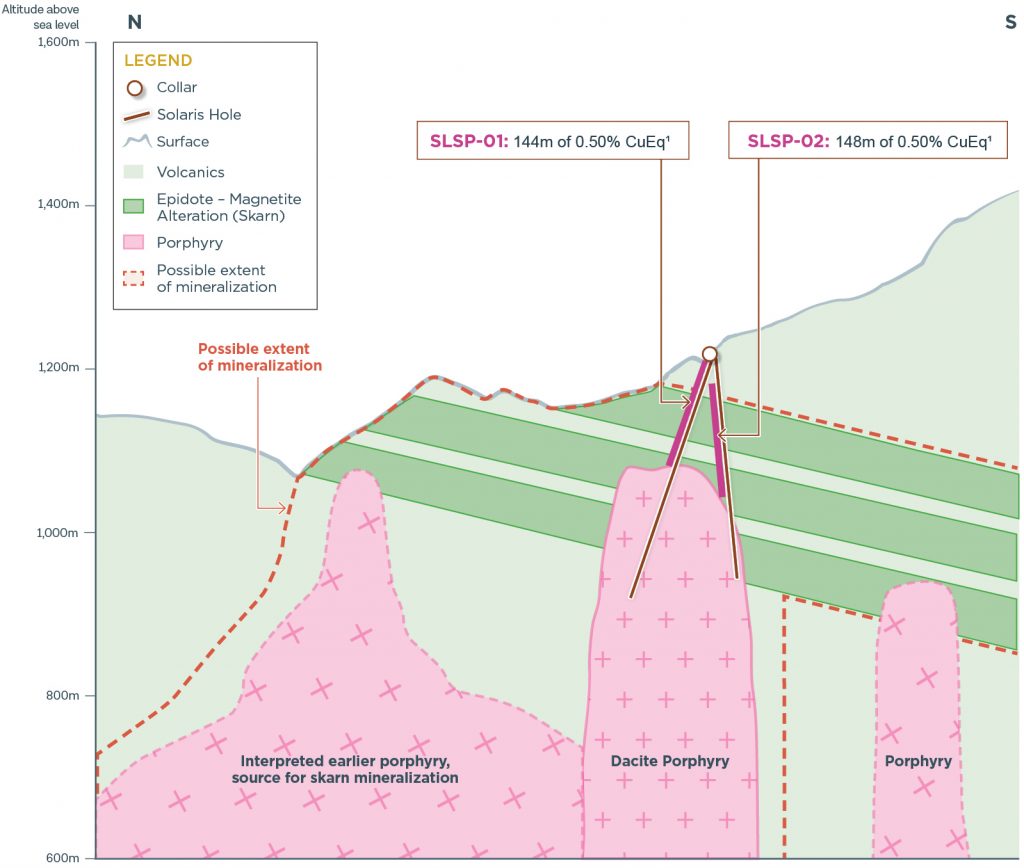
Details regarding the drilling specify that hole SLSP-01, drilled in a northwest direction, unveiled 50m of 0.75% CuEq¹ and 96m of 0.59% CuEq¹ within a larger span of 144m of 0.50% CuEq¹ from the surface. This was prior to its entry into a mildly mineralized dacite porphyry stock. On the other hand, hole SLSP-02, drilled westward from an identical platform, indicated 148m of 0.52% CuEq¹ inside a more expansive range of 276m of 0.40% CuEq¹ near the surface, culminating in the porphyry.
Two unique mineralization phases have been identified. The first is evident in the upper sections of the holes, showcasing potent epidote-magnetite (skarn) alterations and secondary biotite (potassic) alterations within a series of volcanic structures. The subsequent phase is linked with a later-developing dacite porphyry influenced by quartz-sericite-pyrite alteration which intersects the mineralization in the aforementioned volcanic segments.
Insights gathered from the drill core imply that the epidote-magnetite (skarn) mineralization has origins different from the dacite porphyry, suggesting a captivating possibility for unveiling more skarn mineralization or even its intrusive source within the Patrimonio anomaly.
Furthermore, the later dacite porphyry-influenced quartz-sericite-pyrite alteration possesses around 10% sulphides, primarily pyrite, surpassing chalcopyrite. This indicates potential for similar target settings in other porphyries within the Warintza cluster, where favourable sulphide layers associated with earlier alteration phases are dominated by chalcopyrite over pyrite.
Current efforts are in place for meticulous mapping and sampling to understand this mineral system better and to determine directions for skarn and alteration layers. This will also assist in setting priorities for drill locations that are presently in the construction phase. The copper mineralization is still not fully explored towards the northwest, south, and west, while it touches a slightly mineralized quartz-monzodiorite porphyry on its northeast side.
Patrimonio is characterized by a north-south molybdenum soil anomaly that measures approximately 1.5km x 0.5km, surrounded by a copper soil anomaly extending towards the west. Here, outcropping porphyry shows noticeable alteration and veining, situated on the western flank of an assumed major north-south fault close to Warintza Central.
Highlights from the results are as follows:
Table 1 – Assay Results
| Hole ID | Date Reported | From (m) | To (m) | Interval (m) | Cu (%) | Mo (%) | Au (g/t) | CuEq¹ (%) |
| SLSP-01 | Sep 12, 2023 | 16 | 160 | 144 | 0.34 | 0.03 | 0.09 | 0.50 |
| Including | 16 | 112 | 96 | 0.43 | 0.03 | 0.11 | 0.59 | |
| Including | 62 | 112 | 50 | 0.58 | 0.03 | 0.11 | 0.75 | |
| SLSP-02 | 18 | 294 | 276 | 0.29 | 0.02 | 0.07 | 0.40 | |
| Including | 42 | 190 | 148 | 0.38 | 0.02 | 0.09 | 0.52 |
Notes to table: True widths of the mineralized zone are not known at this time.
Table 2 – Collar Location
| Hole ID | Easting | Northing | Elevation (m) |
Depth (m) |
Azimuth (degrees) | Dip (degrees) |
| SLSP-01 | 799430 | 9647634 | 1519 | 310 | 315 | -60 |
| SLSP-02 | 799430 | 9647634 | 1519 | 310 | 260 | -65 |
Notes to table: The coordinates are in WGS84 17S Datum.
Endnotes
- Copper-equivalence calculated as: CuEq (%) = Cu (%) + 4.0476 × Mo (%) + 0.487 × Au (g/t), utilizing metal prices of US$3.50/lb Cu, US$15.00/lb Mo, and US$1,500/oz Au, and assumes recoveries of 90% Cu, 85% Mo, and 70% Au based on preliminary metallurgical test work.
The above references an opinion and is for information purposes only. It is not intended to be investment advice. Seek a licensed professional for investment advice. The author is not an insider or shareholder of any of the companies mentioned above.
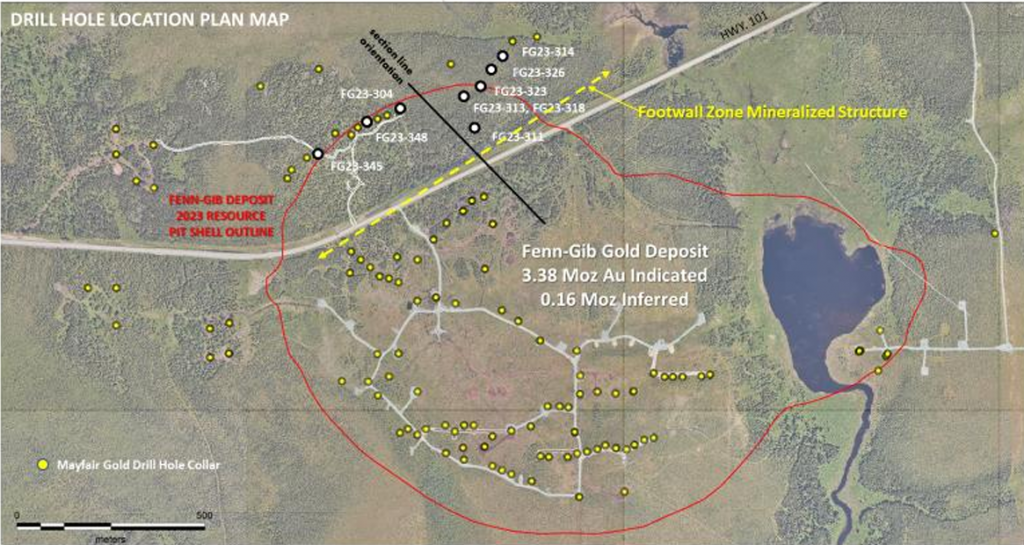
Mayfair Gold (TSXV:MFG) has reported new drill results from its higher-grade Footwall Zone, which is situated roughly 100 meters north of the Fenn-Gib gold deposit.
The Fenn-Gib Project, under Mayfair’s full control, is located in the Timmins region of Northeast Ontario. This project houses an open-pit-constrained Indicated mineral resource, which estimates 3.38 million ounces of gold at a grade of 0.93 grams per tonne. Additionally, it hosts an Inferred mineral resource of 0.16Moz gold at 0.85 g/t. The Fenn-Gib gold mineralization is recognized to be broadly disseminated, extending east-west on the Pipestone Fault for over 1.5 kilometers and reaching a width of over 500m at its westernmost point.
Mayfair Gold President and CEO Patrick Evans commented in a press release: “The Fenn-Gib pit-constrained deposit is a high-quality ‘cornerstone’ asset with highly favorable geology capable of delivering industry-leading gold recoveries with standard flowsheet options. Beyond that, ongoing drilling at the Footwall Zone and Contact Zone discoveries immediately adjacent to the Fenn-Gib deposit continues to identify wide zones of higher-grade gold mineralization. Step-out drilling supported by two drill rigs has so far extended the strike of the outcropping Footwall Zone to more than 500m, remaining open both to the northeast and southwest, and confirmed continuity to a depth of more than 600m. Mayfair expects to report a maiden underground Footwall Zone resource in early 2024.”
Continued drilling at the Footwall Zone has consistently intersected notable gold mineralization. Key results include:
- FG21-139: 1.94 g/t gold over 38.0m, with concentrations up to 4.06 g/t gold over 15.0m.
- FG21-170: A high of 59.05 g/t gold over a 1.0m stretch.
- FG22-218: 0.71 g/t gold over an expansive 92.0m, with spikes up to 6.78 g/t gold over 7.0m.
- FG23-300: 2.05 g/t gold over 16.2m, including a segment with 3.72 g/t gold over 6.2m.
- FG23-344A: 4.72 g/t gold across 30.0m, peaking at 6.59 g/t gold over 19.6m.
The Footwall Zone’s mineral makeup consists of several zones, predominantly found in the footwall mafic volcanic assemblage just north of Fenn-Gib. The mineralization here is mainly composed of bleached, buff-altered pillowed mafic volcanic with pyrite concentrations varying from 2% to over 20%.
In terms of metallurgical insights, tests conducted on a Footwall Zone underground sample highlighted a promising 94.2% gold extraction rate. This was achieved with whole ore cyanidation at a P80 60 µm grind over 48 hours, beginning with a head grade of 4.15 g/t gold with 2.5% S2-. Alternative processing methods, including flotation followed by fine grinding and cyanidation, yielded similar extraction rates of approximately 94%. The hybrid method displayed consistent gold recovery across the deposit’s varying content and lithology.
Highlights from the results are as follows:
- Hole FG23-314 reports 2.19 g/t Au over 17.1m, including 13.67 g/t Au over 2.0m
- Mineralization outside Fenn-Gib current pit-constrained 3.38M Indicated ounce resource
- Footwall Zone structure approx. 500m strike length, open in all directions
- Steep dipping mineralization from surface to below 600m
- Multiple parallel mineralized structures intersected
- Two drill rigs active at Footwall Zone
Table 1 – Footwall Zone reported drill hole results summary.
| Hole | From | To | Interval | Gold | Zone | |
| Name | metres | metres | metres | grams/tonne | ||
| FG22-304 | 336.0 | 361.9 | 25.9 | 1.46 | Main Footwall Zone | |
| including | 336.0 | 337.0 | 1.0 | 14.32 | ||
| and | 345.5 | 349.0 | 3.5 | 3.00 | ||
| and | 360.0 | 361.9 | 1.9 | 5.88 | ||
| 387.3 | 389.6 | 2.3 | 2.49 | Footwall Mafic Volcanics (south of Main Zone) | ||
| 435.5 | 437.5 | 2.0 | 2.20 | Footwall Mafic Volcanics (south of Main Zone) | ||
| FG23-311 | 58.3 | 61.2 | 2.9 | 0.87 | Footwall Mafic Volcanics (north of Main Zone) | |
| 145.0 | 163.0 | 18.0 | 1.15 | Main Footwall Zone | ||
| including | 145.0 | 148.0 | 3.0 | 5.98 | ||
| including | 145.0 | 146.0 | 1.0 | 14.57 | ||
| FG23-313 | 198.0 | 203.0 | 5.0 | 1.41 | Main Footwall Zone | |
| including | 198.0 | 200.0 | 2.0 | 2.48 | ||
| including | 199.0 | 200.0 | 1.0 | 3.60 | ||
| FG23-314 | 73.0 | 81.0 | 8.0 | 2.19 | Footwall Mafic Volcanics (north of Main Zone) | |
| including | 80.0 | 81.0 | 1.0 | 13.48 | ||
| 174.0 | 191.1 | 17.1 | 2.19 | Main Footwall Zone | ||
| including | 174.0 | 176.0 | 2.0 | 13.67 | ||
| and | 188.4 | 189.3 | 0.9 | 4.66 | ||
| 382.0 | 383.0 | 1.0 | 2.32 | Footwall Mafic Volcanics (south of Main Zone) | ||
| FG23-318 | 24.4 | 25.2 | 0.8 | 3.53 | Footwall Mafic Volcanics (north of Main Zone) | |
| 122.8 | 131.0 | 8.2 | 1.94 | Main Footwall Zone | ||
| including | 125.0 | 131.0 | 6.0 | 2.47 | ||
| including | 125.0 | 128.0 | 3.0 | 4.40 | ||
| FG23-323 | 61.5 | 62.9 | 1.4 | 1.93 | Footwall Mafic Volcanics (north of main zone) | |
| 121.0 | 122.0 | 1.0 | 4.21 | Footwall Mafic Volcanics (north of Main Zone) | ||
| 184.5 | 186.0 | 1.5 | 2.86 | Footwall Mafic Volcanics (north of Main Zone) | ||
| 198.1 | 218.0 | 19.9 | 1.34 | Main Footwall Zone | ||
| including | 198.1 | 206.0 | 7.9 | 2.59 | ||
| including | 198.1 | 199.0 | 0.9 | 11.73 | ||
| FG23-326 | 48.0 | 49.0 | 1.0 | 1.72 | Footwall Mafic Volcanics (north of Main Zone) | |
| 149.2 | 151.4 | 2.2 | 1.17 | Footwall Mafic Volcanics (north of Main Zone) | ||
| 180.0 | 188.0 | 8.0 | 3.67 | Main Footwall Zone | ||
| including | 180.0 | 184.2 | 4.2 | 6.47 | ||
| including | 181.3 | 182.2 | 0.9 | 19.89 | ||
| 205.3 | 206.4 | 1.1 | 2.81 | Footwall Mafic Volcanics (south of Main Zone) | ||
| FG23-345 | 461.0 | 510.5 | 49.5 | 1.44 | Main Footwall Zone | |
| including | 461.0 | 463.5 | 2.5 | 9.20 | ||
| and | 488.5 | 491.5 | 3.0 | 2.92 | ||
| including | 505.0 | 506.0 | 1.0 | 4.36 | ||
| 555.0 | 561.0 | 6.0 | 1.43 | Footwall Mafic Volcanics (south of Main Zone) | ||
| including | 555.0 | 557.0 | 2.0 | 2.25 | ||
| 590.4 | 596.0 | 5.6 | 1.18 | Footwall Mafic Volcanics (south of Main Zone) | ||
| including | 590.4 | 592.8 | 2.4 | 2.05 | ||
| 694.9 | 700.3 | 5.4 | 2.47 | Footwall Mafic Volcanics (south of Main Zone) | ||
| including | 697.0 | 698.2 | 1.2 | 8.99 | ||
| FG23-348 | 514.0 | 517.0 | 3.0 | 1.10 | Footwall Mafic Volcanics (north of Main Zone) | |
| 622.0 | 624.3 | 2.3 | 6.44 | Main Footwall Zone | ||
| including | 623.0 | 624.3 | 1.3 | 9.30 |
Table 2 – Footwall Zone reported drill hole collar information.
| Hole Name | Collar Easting | Collar Northing | Collar Elevation | Depth | Collar Azimuth | Collar Dip |
| FG23-304 | 558400 | 5375795 | 5313 | 540 | 130 | -55 |
| FG23-311 | 558600 | 5375750 | 5313 | 366 | 126 | -58 |
| FG23-313 | 558575 | 5375830 | 5313 | 363 | 126 | -45 |
| FG23-314 | 558677 | 5375942 | 5313 | 504 | 126 | -45 |
| FG23-318 | 558575 | 5375830 | 5313 | 432 | 126 | -71 |
| FG23-323 | 558616 | 5375865 | 5313 | 306.8 | 126 | -57 |
| FG23-326 | 558645 | 5375903 | 5313 | 314.6 | 126 | -45 |
| FG23-345 | 558186 | 5375678 | 5323 | 723 | 128 | -50 |
| FG23-348 | 558320 | 5375762 | 5320 | 777 | 128 | -74 |
The above references an opinion and is for information purposes only. It is not intended to be investment advice. Seek a licensed professional for investment advice. The author is not an insider or shareholder of any of the companies mentioned above.
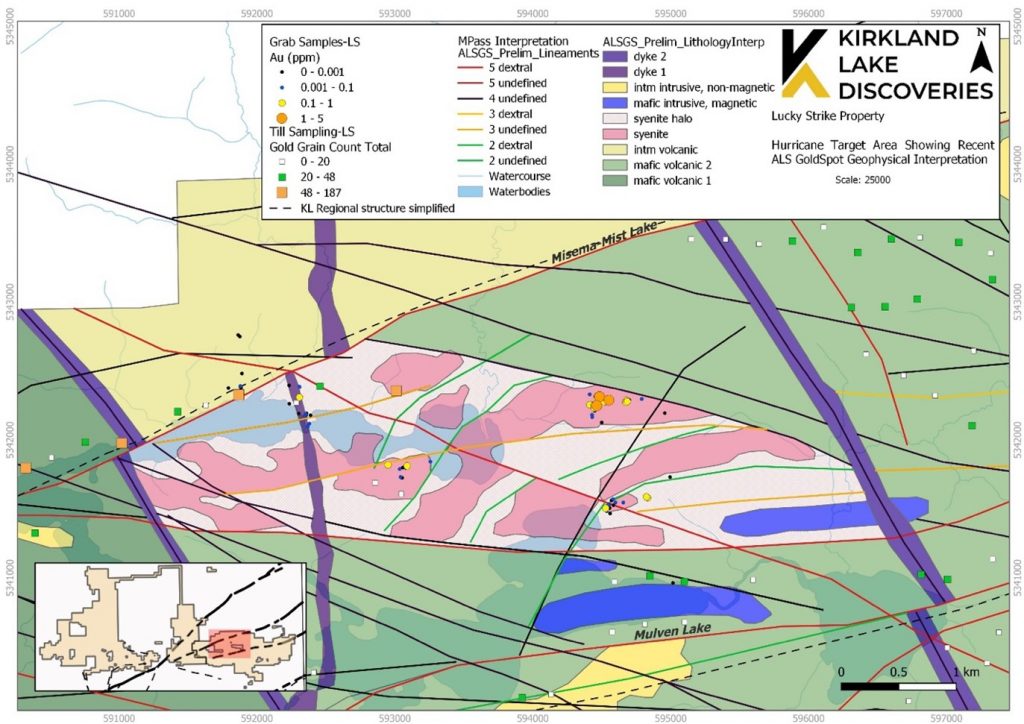
Kirkland Lake Discoveries (TSXV:KLDC) has reported the successful completion of their Phase 1 drill program at the Kirkland Lake Project. This phase, the first out of three previously declared drill phases, consisted of nine drill holes spanning 2,991m on the Goodfish-Kirana property.
Danièle Spethmann, President and CEO of Kirkland Lake Discoveries, commented in a press release: “This drill program was planned through a meticulous targeting exercise incorporating all the exploration tools deployed over the Goodfish-Kirana claim package over the last ten years. The Kirana Deformation Zone, a second-order structure of the Larder Lake Cadillac Deformation Zone, remains a target of high merit. Initial observations indicate the presence of sulphide mineralization, alteration, and shearing at the targeted intervals.”
The primary focus of the Phase 1 drilling was on regional targets situated along the Kirana Deformation Zone which trends from east to west. This particular zone was identified based on coinciding intersecting northwest structures, IP chargeability anomalies, and recognized gold mineralization at relatively shallow depths. Furthermore, to investigate high-grade assays from previous drilling in 2021, two holes were drilled on the Jo Zone, where past results showed 155 g/t Au over 0.75m and 72 g/t Au over 0.50m.
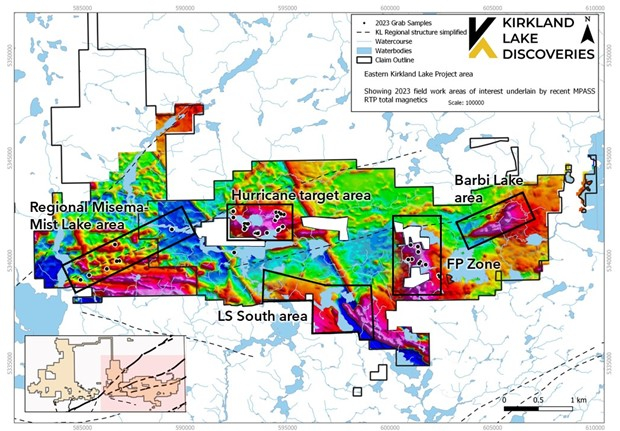
Significant in the drilling sequence were drill holes KLD23-08 and KLD23-09. These were designed as down-dip step-outs to further assess the Jo Zone shear structure and previous high-grade intersections in the hanging-wall. Notably, both holes managed to intersect the primary shear zone, with assay results still awaited.
In a related update, the detailed analysis of a high-resolution airborne magnetic geophysical survey for the Lucky Strike property, which was initially communicated on July 13, 2023, has been completed by ALS GoldSpot. This analysis has improved the geological and structural knowledge of the property, aiding in target prioritization and subsequent field operations. The findings by ALS GoldSpot have identified various potential targets, which align with the geology maps of the Ontario Geological Survey. Recently, field crews have made strides in mapping and sampling, uncovering structural trends, mineralization, and alteration signatures that appear promising.
A noteworthy point is the discovery of the Hurricane target area. This area, nestled within a structurally complex zone flanked by felsic to intermediate intrusions between the Mulven and Misema Mist Lake faults, has shown intriguing geological features. Recent mapping has revealed epidote-altered intermediate intrusions intersected by quartz stockwork veinlets and pyrite mineralization. Furthermore, historical data from 1936 suggests that samples from this area produced multi-ounce gold assays.
Looking ahead, the Kirkland Lake Discoveries team is in the process of planning Phase 2 drilling. This phase will focus on many of the recently identified target areas based on the 2023 fieldwork and geophysical interpretation. In anticipation of this next phase, they are also preparing additional exploration permits for the new areas on the Lucky Strike property, and drilling will recommence once these permits are approved.
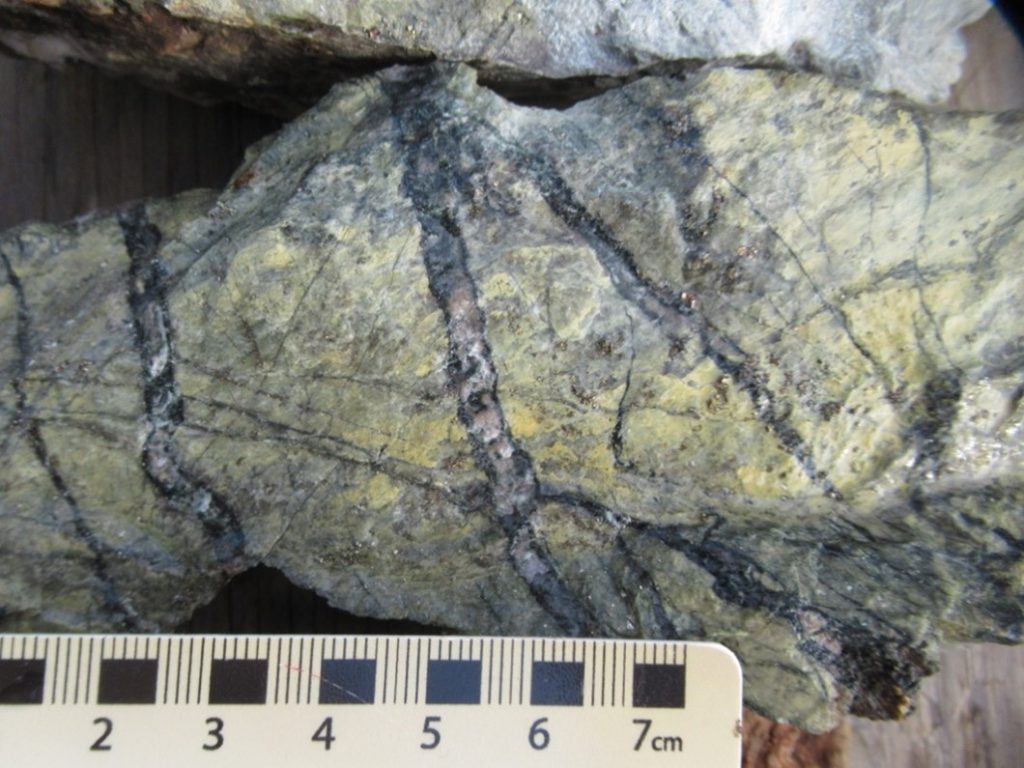
Highlights from the results are as follows:
|
Drill Hole No. |
Easting |
Northing |
Elevation (m) |
Azimuth |
Dip |
Total Depth (m) |
|
KLD23-01 |
574531 |
5339050 |
269 |
350 |
-60 |
129 |
|
KLD23-02 |
574337 |
5339047 |
333 |
45 |
-45 |
147 |
|
KLD23-03 |
574327 |
5338119 |
334 |
45 |
-50 |
351 |
|
KLD23-04 |
574419 |
5338223 |
327 |
225 |
-50 |
339 |
|
KLD23-05 |
574223 |
5337887 |
331 |
155 |
-60 |
204 |
|
KLD23-06 |
573390 |
5338094 |
331 |
180 |
-55 |
399 |
|
KLD23-07 |
373390 |
5338094 |
331 |
225 |
-50 |
285 |
|
KLD23-08 |
573722 |
5339190 |
333 |
190 |
-50 |
558 |
|
KLD23-09a |
573722 |
5339190 |
333 |
200 |
-48 |
15 |
|
KLD23-09 |
573722 |
5339190 |
333 |
200 |
-55 |
564 |
|
Coordinates in UTM NAD83 Zone 17 T datum. |
2,991 |
|||||
Table 1 – Phase 1 drill holes location, orientation, and total depth.
The above references an opinion and is for information purposes only. It is not intended to be investment advice. Seek a licensed professional for investment advice. The author is not an insider or shareholder of any of the companies mentioned above.
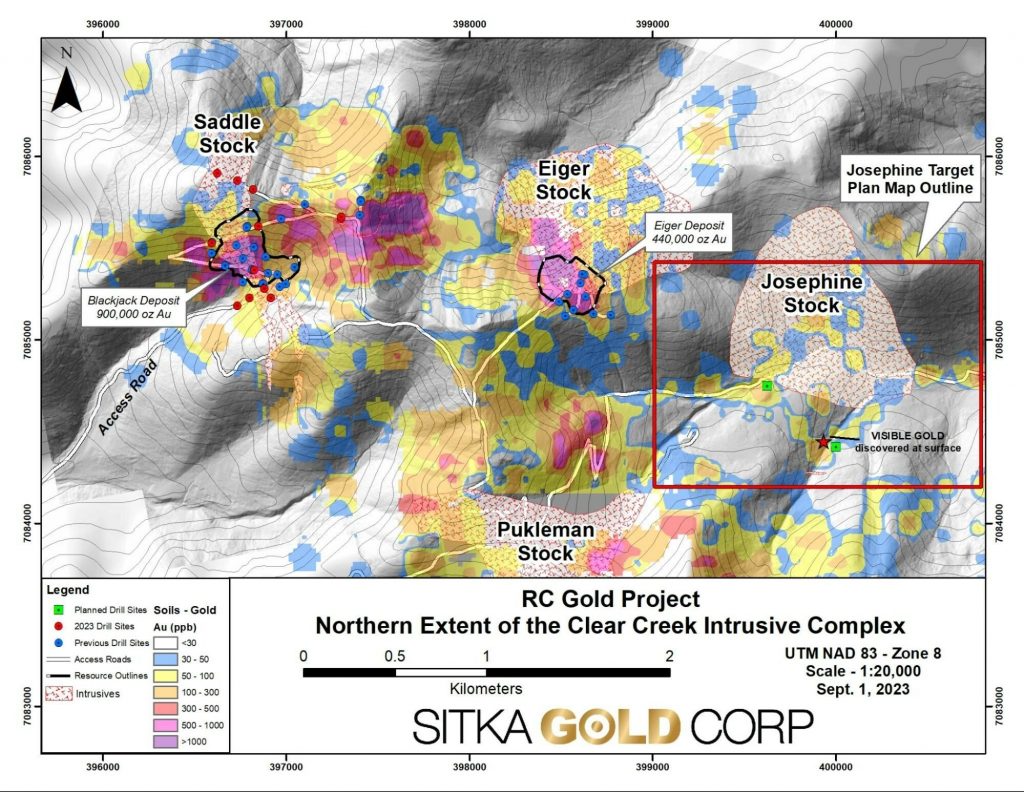
Sitka Gold (CSE:SIG) has commenced the maiden diamond drill testing of the Josephine intrusion, situated in the northern section of the Clear Creek Intrusive Complex (CCIC) on its RC Gold Project in Yukon’s Tombstone Gold Belt, roughly 100 kilometres east of Dawson City. This road-accessible project, spanning 376 square kilometres, is currently experiencing a diamond drilling exercise of up to 10,000 metres. Earlier this year, the project was noted to have an Initial Mineral Resource Estimate of approximately 1,340,000 ounces of gold with a grade of 0.68 g/t, beginning at the surface.
Cor Coe, Director and CEO of Sitka Gold, commented in a press release: “We are excited to be conducting the first ever diamond drilling of the Josephine intrusion, one of the six intrusions located in the Clear Creek Intrusive Complex (See Figure 1). The discovery of visible gold this summer in the altered rocks adjacent to the intrusion during geological mapping and subsequent prospecting, which identified gold-bearing sheeted veins both within the intrusion and in the adjacent altered rocks, highlights the potential of the Josephine intrusion. The intrusion is not well exposed at surface so we look forward to getting an initial look using the drill bit at the potential of the Josephine to be the third intrusion on the project to host a gold deposit.
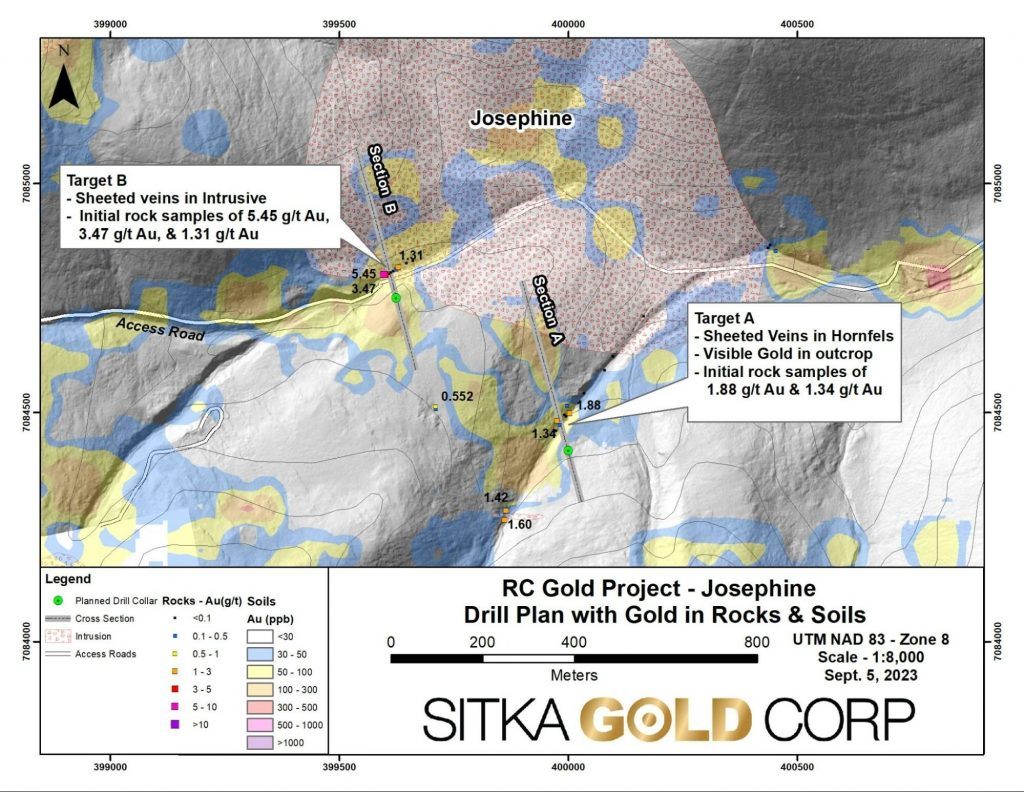
From the Josephine target, results for 30 out of 86 surface rock samples have been collected. The gold values in these samples varied between 0.003 g/t and 5.45 g/t. Notably, seven samples showed results surpassing 1.0 g/t Au, while thirteen samples displayed values exceeding 0.10 g/t Au.
The company has outlined plans for two drill holes to examine two targets, located roughly 500 metres apart, on the southern boundary of the Josephine intrusion. To facilitate the drilling tests for these specific targets, a second diamond drill rig has been dispatched to the RC Gold Project.
The first of these, dubbed Target A, is the site where geological surveys and prospecting previously identified visible gold at the surface. The prospected area revealed altered and mineralized metasedimentary rocks stretching about 500 metres south of the intrusion. This initial drill aims to evaluate the most profoundly altered rocks spanning an area of around 220 metres. These rocks are marked by abundant veining that contains arsenopyrite-pyrite and occasionally bismuthinite mineralization. The drill is also expected to encounter the obscured intrusive contact deeper down.
Meanwhile, Target B is positioned roughly 500 metres northwest of Target A. Here, an exposure of the Josephine intrusion was found alongside altered metasedimentary rocks in a creek base. Both these rocks and the intrusion itself were richly mineralized with veins comprised of arsenopyrite-pyrite, with occasional bismuthinite content. This preliminary drill is set to assess the Josephine intrusion at its southern contact.
To date, within its 2023 diamond drill venture at RC Gold, Sitka Gold has wrapped up 14 drill holes, amounting to nearly 6,000 metres. Reports for the other 9 drill holes, completed so far, are anticipated to be made public once received and organized.
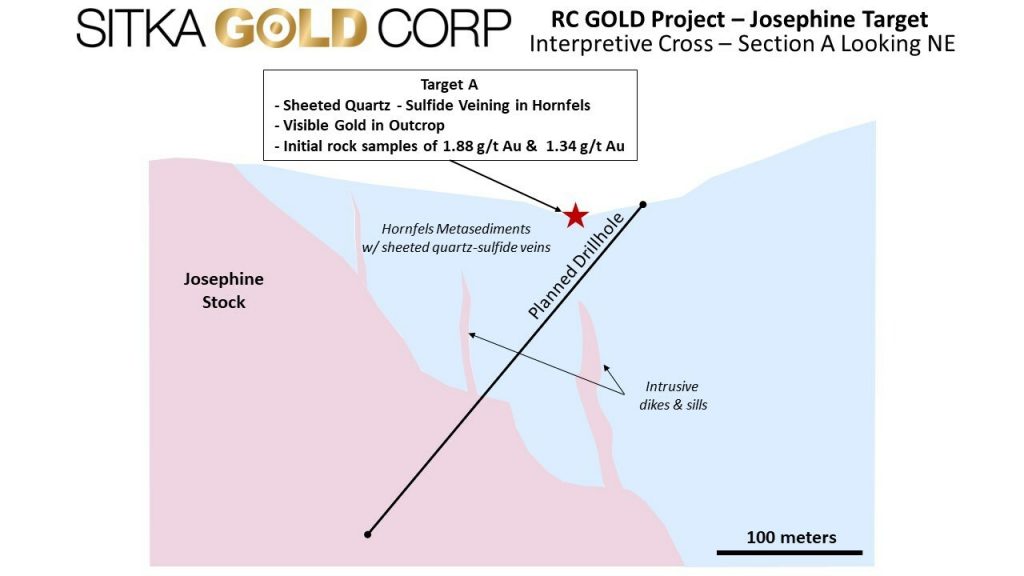
Highlights from surface exploration:
- Target A
- Sheeted veins in altered metasedimentary rocks adjacent to intrusion returned values of 1.88 and 1.34 g/t gold
- Visible gold in outcrop
- Target B
- Sheeted veins in intrusive returned values of 5.45, 3.47 and 1.31 g/t gold
Table 2: RC Gold Inferred Mineral Resource Estimate
|
COG g/t Au |
Blackjack Zone |
Eiger Zone |
Combined |
||||||||
|
Tonnes |
Au g/t |
0z Au |
Tonnes |
Au g/t |
0z Au |
Tonnes |
Au g/t |
0z Au |
|||
|
0.20 |
35,798 |
0.80 |
921 |
32,523 |
0.45 |
471 |
68,321 |
0.63 |
1,391 |
||
|
0.25 |
33,743 |
0.83 |
900 |
27,362 |
0.50 |
440 |
61,105 |
0.68 |
1,340 |
||
|
0.30 |
31,282 |
0.88 |
885 |
22,253 |
0.55 |
393 |
53,535 |
0.74 |
1,279 |
||
|
0.35 |
29,065 |
0.92 |
860 |
17,817 |
0.60 |
344 |
46,882 |
0.80 |
1,203 |
||
|
0.40 |
26,975 |
0.96 |
833 |
14,506 |
0.66 |
308 |
41,481 |
0.86 |
1,140 |
||
|
Notes |
|
|
1. |
Mineral resource estimate prepared by Ronald G. Simpson of GeoSim Services Inc. with an effective date of January 19, 2023. Mineral Resources are classified using the 2014 CIM Definition Standards. |
|
2. |
The cut-off grade of 0.25 g/t Au is believed to provide a reasonable margin over operating and sustaining costs for open-pit mining and processing |
|
3. |
Mineral resources are constrained by an optimised pit shell using the following assumptions: US$1800/oz Au price; a 45° pit slope; assumed metallurgical recovery of 85%; mining costs of US$2.00 per tonne; processing costs of US$8.00 per tonne; G&A of US$1.50/t. |
|
4. |
Mineral resources are not mineral reserves and do not have demonstrated economic viability. |
|
5. |
Totals may not sum due to rounding. |
The above references an opinion and is for information purposes only. It is not intended to be investment advice. Seek a licensed professional for investment advice. The author is not an insider or shareholder of any of the companies mentioned above.
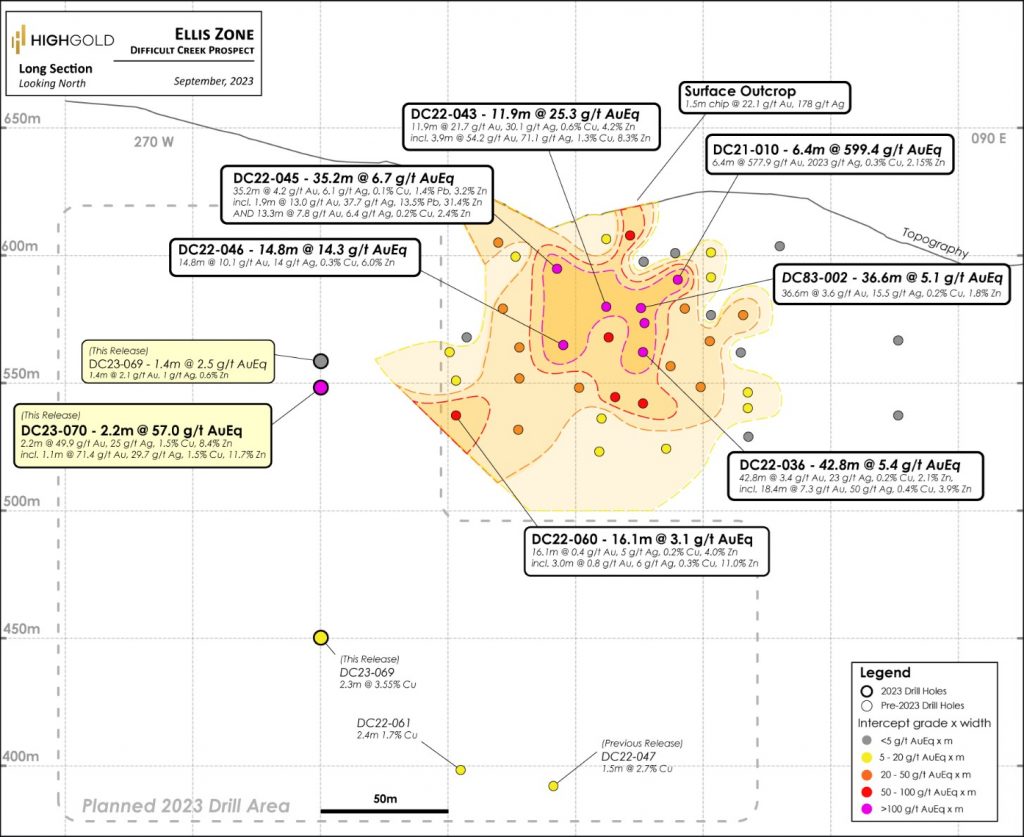
HighGold Mining (TSXV:HIGH) has revealed initial assay results from its 2023 exploration and development program at the Johnson Tract polymetallic Gold Project in Southcentral Alaska, USA. The project features a high-grade JT Deposit with a 1.05 million ounces indicated resource at 9.39 g/t gold equivalent.
Darwin Green, CEO of HighGold Mining, commented in a press release: “The Johnson Tract project is synonymous with high-grade gold and these first results of our 2023 drill program do not disappoint. Hole DC23-070 is a near-surface 50-meter step out to the west of the Ellis Zone and is the 8th intersection to date from the recent discovery to yield a ‘grade-thickness’ greater than 100 gxm AuEq*. Two drill rigs are currently active on site, focused on the continued expansion of the Ellis Zone and JT Deposit as well as exploring for new discoveries.”
The newly disclosed data confirms the western expansion of high-grade gold mineralization in the Ellis Zone, situated four kilometres northeast of the JT Deposit. The Ellis Zone was a focal point of drilling activities during the 2022 field season. The information comes from the first two 50-meter step-out drill holes completed in 2023.
The DC Prospect, like the Ellis Zone, is also four kilometres northeast of the JT Deposit. It is marked by a series of large gossan alteration zones, similar to the JT Deposit, stretching over a 1.5 km x 3.0 km area. The area features a variety of mineralizations including gold, silver, copper, zinc, and lead. These minerals are found in epithermal to VMS-style veins and breccia, primarily hosted in dacitic to rhyolitic volcanic and volcaniclastic rocks.
Drilling in late 2021 led to the discovery of near-surface bonanza-grade mineralization at the Ellis Zone. Specifically, hole DC21-010 returned 577.9 g/t gold and 2,023 g/t silver over a 6.40-meter distance. Subsequent drilling in 2022 further defined the Ellis Zone mineralization, mapping it over a strike length of 125 meters and down to a depth of 225 meters.
The first two drill holes for 2023, named DC23-069 and DC23-070, intersected vein- and replacement-style mineralization consisting mainly of pyrite-chalcopyrite-sphalerite 50 to 60 meters below the surface. These intersections confirm the western extension of the Ellis Zone and showcase elevated concentrations of gold within the polymetallic mineralized zone. Ongoing drilling activities at the Ellis Zone are set to explore further along strike and down-dip of these reported intersections.
Regarding the 2023 program, HighGold Mining plans to conduct 8,000 meters of drilling to expand known mineralized zones at both the Ellis Zone and the JT Deposit. The program will also explore new high-potential prospects and undertake geotechnical and hydrogeological studies. As part of the program, an airborne Mobile MagnetoTellurics geophysical survey, geological mapping, and geochemical sampling will be carried out, along with environmental studies.
As of August 31, a total of 5,283 meters have been drilled, distributed across 23 holes which include 17 exploration holes and 6 geotechnical drill holes. Assay results will be released periodically after undergoing quality assurance and control protocols set by the company.
Highlights from the results are as follows:
- 2.2 m at 57.0 g/t AuEq (49.9 g/t Au, 25 g/t Ag, 1.5% Cu, 8.4% Zn) in hole DC23-070, including
- 1.1 m at 80.5 g/t AuEq, (71.40 g/t Au, 29.7 g/t Ag, 1.5% Cu, 11.7% Zn).
Table 1. Significant Assay Intersections from the Ellis Zone, Johnson Tract Project
| Drill Hole | From | To | Length | Au | Ag | Cu | Pb | Zn | AuEq |
| (meters) | (meters) | (meters) | (g/t) | (g/t) | % | % | % | (g/t) | |
| DC23-069 | 52.2 | 53.6 | 1.4 | 2.05 | 0.9 | 0.01 | 0.08 | 0.60 | 2.5 |
| And | 185.3 | 187.6 | 2.3 | 0.16 | 0.5 | 3.55 | 0.01 | 0.48 | 5.0 |
| Incl | 185.3 | 186.8 | 1.5 | 0.23 | 82.6 | 4.72 | 0.04 | 1.77 | 8.1 |
| DC23-070 | 59.2 | 61.4 | 2.2 | 49.85 | 24.6 | 1.50 | 0.01 | 8.40 | 57.0 |
| Incl | 59.2 | 60.3 | 1.1 | 71.40 | 29.7 | 1.51 | 0.02 | 11.65 | 80.5 |
| And Incl | 60.3 | 61.4 | 1.1 | 28.30 | 19.5 | 1.50 | 0.00 | 5.14 | 33.5 |
| And | 71.4 | 72.9 | 1.5 | 0.34 | 2.3 | 0.07 | 1.17 | 2.92 | 2.5 |
*True thickness for the reported intersections in holes JT22-069 and JT-070 is estimated at 85% to 95% of the reported width. Gold Equivalent (“AuEq”) based on assumed metal prices of US$1650/oz for Au, US$20/oz for Ag, US$3.50/lb for Cu, US$1.00/lb for Pb and US$1.50/lb for Zn and payable metal recoveries of 97% for Au, 85% for Ag, 85% Cu, 72% Pb and 92% Zn. Grade-thickness is the product of multiplying the drilled intercept length by the grade of the intercept.
The above references an opinion and is for information purposes only. It is not intended to be investment advice. Seek a licensed professional for investment advice. The author is not an insider or shareholder of any of the companies mentioned above.
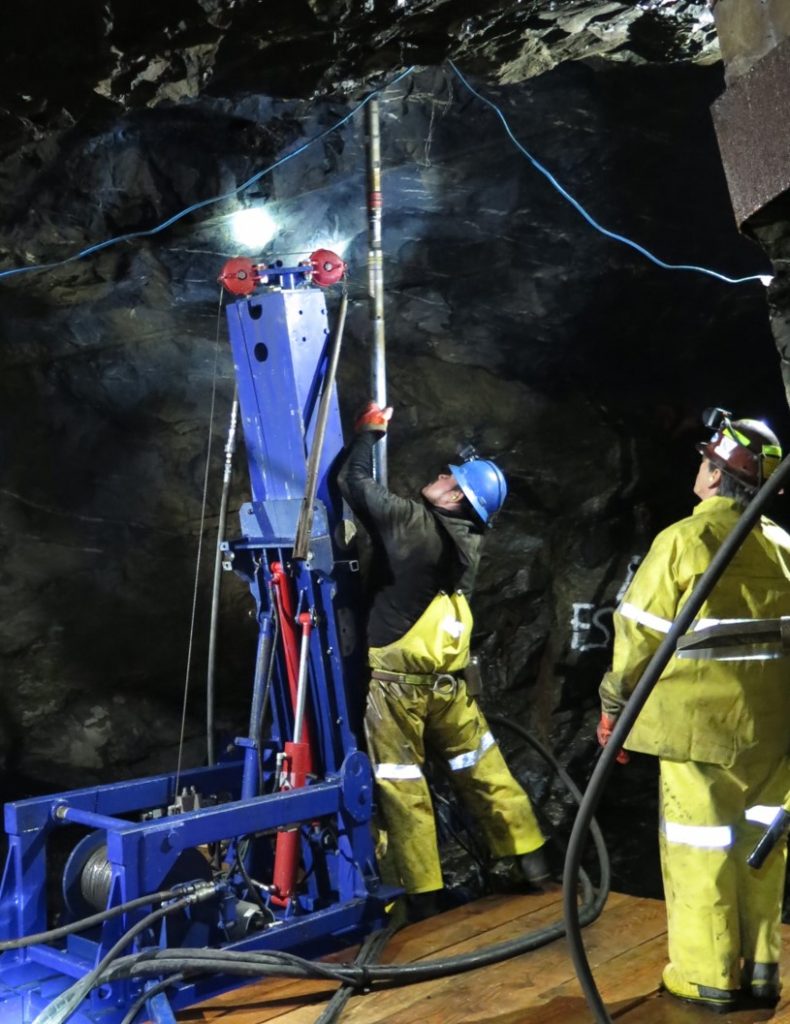
Skeena Resources (TSX:SKE) has issued an updated Mineral Resource Estimate (MRE) for its wholly-owned Snip Gold Project, situated in British Columbia’s Golden Triangle, as of September 5, 2023. This revision includes additional data from 307 drill holes covering 46,268 meters. These new figures come with improvements in geological interpretation, resource estimation methods, long hole mining parameters, and updated metallurgical recovery rates.
Randy Reichert, Skeena’s President & CEO, commented in a press release: “With the successful conversion of over 570,000 gold ounces to the Indicated category, we are very pleased with the updated Mineral Resource Estimate for Snip. This Resource will form the basis of a detailed engineering study with project economics, which we anticipate being released in H1 2024. The study will demonstrate the potential benefits of adding Snip mineralization to the Eskay Creek Project as a satellite operation, likely including an increased mine life and improved concentrate payabilities at Eskay Creek. We look forward to continuing to unlock value for all stakeholders as we advance the Project.”
During 2021 and 2022, Skeena Resources Limited and its former partner, Hochschild Mining, conducted infill drilling programs. Skeena completed 238 drill holes covering 35,891 meters, and Hochschild completed 69 drill holes totalling 10,377 meters. These drilling efforts led to the identification of new zones of mineralization, expansion of existing veins, confirmation of vein continuity, and increased confidence in variogram range. The programs also explored areas that Skeena had not previously tested to validate historical assays and consider potential classification upgrades.
In the MRE from 2020, a 40-meter omnidirectional 3-D buffer had been placed around drill holes conducted by Skeena between 2016 and 2019. This buffer was established due to the presence of quality assurance and quality control (QAQC) data in these recent drill holes, which was absent in historical assays. Consequently, this led to the downgrade of certain Indicated Resources to Inferred Resources. However, the 2021 and 2022 drilling programs included 28 twin drill holes totaling 3,318 meters to validate historical data. These new findings have enabled the use of historical drill hole data in the updated grade estimation process without further constraints.
Changes have also been made in the density values used in the model. In 2020, two density values were utilized: 2.78 g/cm3 for vein mineralization and 2.86 g/cm3 for the Biotite Spotted Unit (BSU). The 2023 MRE incorporates 1,770 additional specific gravity measurements and has updated the values to 2.91 g/cm3 for vein mineralization and 2.84 g/cm3 for the BSU.
The 2023 MRE update has also switched from using a single-search ellipsoid of the variogram to dynamic anisotropy for estimating larger veins. This new approach allows for adjustments to the search ellipse on a block-by-block basis, thereby leading to more accurate local estimates that better align with original vein model interpretations.
Skeena Resources Limited has announced plans to release a comprehensive engineering study covering project economics for the Snip Gold Project in the first half of 2024. This forthcoming study is expected to consider Snip as a potential satellite operation that would supply a centralized mill at Eskay Creek. The company anticipates that the added high-grade mineralization from Snip could extend the operational life at Eskay Creek while possibly reducing smelter penalties.
Highlights from the update are as follows:
- Updated MRE of 823,000 ounces grading 9.35 g/t Au in the Indicated category and 114,000 ounces grading 7.10 g/t Au in the Inferred category
- An increase of 579,000 Au ounces in the Indicated Resource, representing a growth of 237% since the 2020 MRE
- 2021 and 2022 drilling programs heightened confidence of historical drilling data and improved certainty in continuity of the ore body
- Metallurgical recovery increased to 96% from 90%
Table 1: 2023 Indicated and Inferred Underground Resource Reported in Veins Contained Within Long Hole Stope Optimized Shapes Created at a 2.5 g/t Au Cut-off Grade
| Category | Domain | Tonnes (‘000) |
Contained Grade Au (g/t) |
Contained Ounces Au (‘000) |
| Indicated | Main – V | 850 | 9.59 | 262 |
| Main – S | 1,718 | 9.28 | 513 | |
| Twin West | 171 | 8.69 | 48 | |
| Total Indicated | 2,739 | 9.35 | 823 | |
| Inferred | Main – V | 115 | 7.38 | 27 |
| Main – S | 323 | 6.22 | 65 | |
| Twin West | 61 | 11.02 | 22 | |
| Total Inferred | 499 | 7.10 | 114 | |
Table 2: 2020 vs 2023 Resource Comparison
| 2023 Snip Resource | |||
| Category | Tonnes
(000) |
Contained Grade
Au (g/t) |
Contained Ounces
Au (000) |
| Total Indicated | 2,739 | 9.35 | 823 |
| Total Inferred | 499 | 7.10 | 114 |
| 2020 Snip Resource | |||
| Category | Tonnes
(000) |
Contained Grade
Au (g/t) |
Contained Ounces
Au (000) |
| Total Indicated | 539 | 14 | 244 |
| Total Inferred | 942 | 13.3 | 402 |
| 2020 vs 2023 Resource Comparison | |||
| Category | Tonnes
(000) |
Contained Grade
Au (g/t) |
Contained Ounces
Au (000) |
| Total Indicated | 408% | -33% | 237% |
| Total Inferred | -47% | -47% | -72% |
Table 3: Underground Scenario Assumptions for Determining Cut-off Grades With Reasonable Prospects of Eventual Economic Extraction Assuming Long Hole Mining Method
| Input Parameters | Value | Unit |
|---|---|---|
| Gold Price | 1,700 | US Dollars per Ounce |
| Exchange Rate | 1.3 | CAD:USD |
| Metallurgical Recovery | 96 | Percent |
| Royalty | 1 | Percent |
| Selling Cost | 18.50 | CAD Dollars per Ounce |
| Mining Cost | 115 | CAD Dollars per Tonne |
| Process Cost | 29 | CAD Dollars per Tonne |
| G&A Cost | 17 | CAD Dollars per Tonne |
| All-in Cost | 161 | CAD Dollars per Tonne |
| Mining Method | N/A | Longhole: 10 m H x 5 m L x 2 m W
Dip: 55 – 90 degrees 1 m offset to UG workings |
| Cut-off Grade | 2.5 | Grams per tonne (g/t) |
Table 4: Reminder of Near-Term Value-Generating Catalysts for Skeena
| Catalyst | Expected Completion Date |
|---|---|
| Updated Mineral Resource Estimate for Eskay Creek | Completed Q2 2023 |
| Increased Land Package Surrounding Eskay Creek | Completed Q3 2023 |
| Updated Mineral Resource Estimate for Snip | Completed Q3 2023 |
| Metallurgical Optimization & Simplified Flowsheet at Eskay Creek | Expected Q3 2023 |
| Exploration Results from Eskay Creek | Expected Q3/Q4 2023 |
| Definitive Feasibility Study for Eskay Creek | Expected Q4 2023 |
| Maiden Engineering Study for Snip | Expected H1 2024 |
The above references an opinion and is for information purposes only. It is not intended to be investment advice. Seek a licensed professional for investment advice. The author is not an insider or shareholder of any of the companies mentioned above.
If you would like to receive our free newsletter via email, simply enter your email address below & click subscribe.
 Follow us on Twitter
 Become our facebook fan
CONNECT WITH US
Tweets
Tweet with hash tag #miningfeeds or @miningfeeds and your tweets will be displayed across this site.
MOST ACTIVE MINING STOCKS
Daily Gainers
 CMC Metals Ltd. CMC Metals Ltd. |
CMB.V | +900.00% |
 Eden Energy Ltd Eden Energy Ltd |
EDE.AX | +200.00% |
| GoviEx Uranium Inc. |
GXU.V | +42.86% |
| Eagle Nickel Ltd. |
ENL.AX | +41.67% |
| Citigold Corp. Limited |
CTO.AX | +33.33% |
| Mount Burgess Mining NL |
MTB.AX | +33.33% |
| Exalt Resources Limited |
ERD.AX | +31.94% |
| Casa Minerals Inc. |
CASA.V | +30.00% |
| Cariboo Rose Resources Ltd |
CRB.V | +28.57% |
| Belmont Resources Inc. |
BEA.V | +28.57% |


