
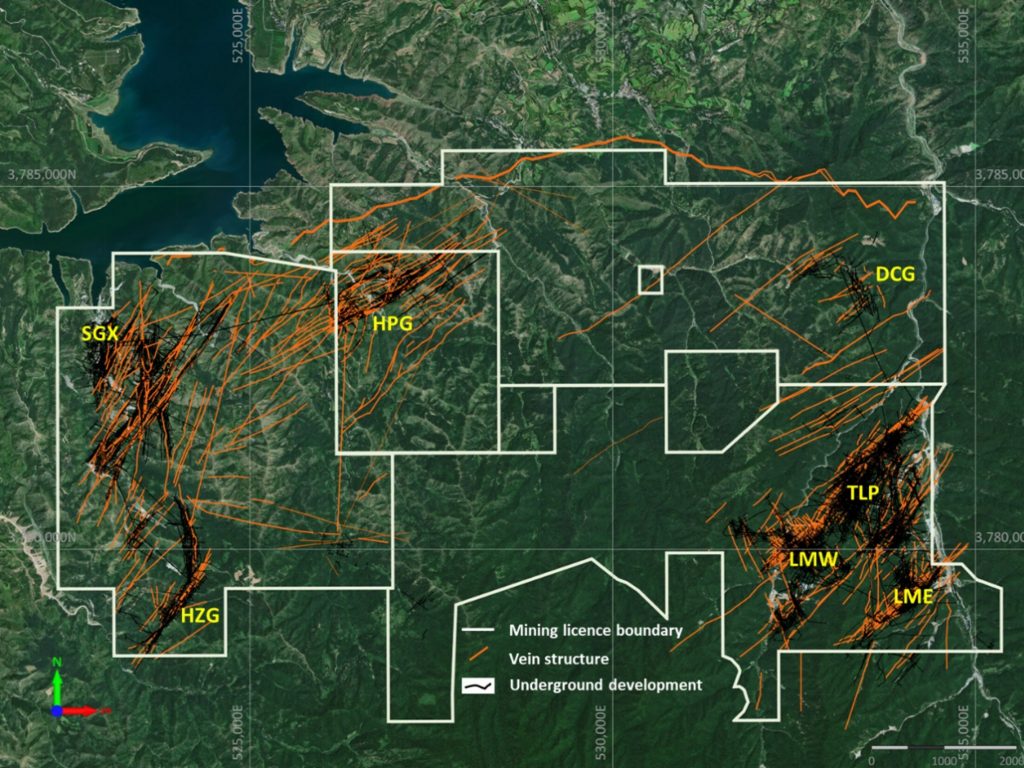
Silvercorp Metals (TSX:SVM) has recently reported the results of its extensive diamond drilling program at the HPG mine, located in China’s Ying Mining District. The company’s operations, conducted from the beginning of 2022 through mid-November 2023, encompassed a comprehensive exploration initiative.
The drilling program extended over a period of almost two years, during which the company drilled a total of 45,046 meters across 297 diamond drill holes. This intensive effort included 215 underground and 82 surface holes. As of now, the assay results for 270 of these holes have been received, with 139 holes encountering mineralized zones. To continue this exploration, eight drilling rigs are currently operational at the HPG mine site.
Silvercorp’s drilling initiative at the HPG mine concentrated on three primary areas. The first area, known as the upper zone (U), involved drilling near the surface for gold, silver, lead, and zinc vein structures within the resource area. This part of the mine had seen limited exploration in the past. The second focus area, termed the production zone (P), comprised infill drilling above or beneath previously mined stopes. The stopes had been abandoned earlier due to unexpected variability in ore grades, vein thicknesses, and orientations. The third area, identified as the breccia zone (B), involved testing the mineralization potential within a rhyolitic breccia dyke located within the existing underground mining infrastructure.
In the upper zone, the drilling targeted the strike and downdip extent of known vein structures, particularly above the 600 meters above mean sea level elevation. The results from this drilling revealed high-grade gold, silver, lead, and zinc vein structures at higher elevations. The significant findings in this zone included intercepts from various series, such as H13, H15, H16, H17, H32, H42, and others.
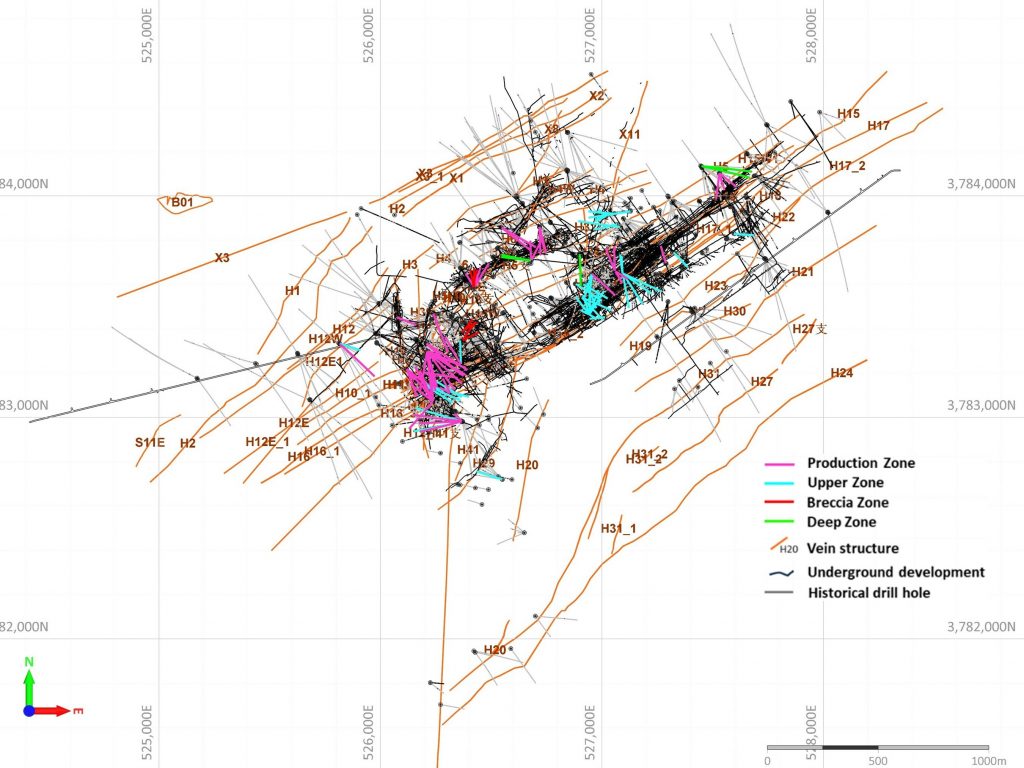
The production zone drilling focused on areas previously underexplored due to variability in ore shoot grades and vein trends below the 600-meter elevation. This drilling campaign led to the discovery and expansion of high-grade resources in several vein series, enhancing the understanding of the mine’s potential.
The breccia zone drilling aimed to assess the extent of mineralization within a rhyolitic breccia dyke, specifically in the B8 area. This zone, characterized by disseminated gold, silver, lead, zinc, and copper mineralization, measured approximately 50 meters in length, 30 meters in height, and 20 meters in width. The B8 orebody, discovered during this exploration phase, has been mined since October 2023 using long-hole stoping techniques.
Furthermore, additional drilling was conducted to explore the down-dip extension of major vein structures, including the H15, H16, and H17 series, below the 300-meter elevation in the Deep Zone (zone D). This exploration confirmed the continuation of mineralization along these structures, expanding the potential for further resource development.
Silvercorp Metals’ extensive and methodical exploration program at the HPG mine reflects a significant commitment to understanding and developing the mine’s resources. The results from this program are likely to influence the company’s future mining strategies and operational decisions in the Ying Mining District.
Highlights from the results are as follows:
- Surface hole ZK1645 intersected an 8.24 metre (“m”) interval of vein H4 grading 4.31 grams per tonne (“g/t”) gold (“Au”), 15 g/t silver (“Ag”), and 2.10% lead (“Pb”), from 56.28 m depth, at an elevation of 819 m;
- Underground hole ZK02N36 intersected a 0.61 m interval of vein H5E grading 3.86 g/t Au, 6,132 g/t Ag, 6.45% Pb, 8.47% zinc (“Zn”), and 0.33% copper (“Cu”) from 72.36 m depth, at an elevation of 331 m;
- Surface hole ZK3421 intersected a 0.63 m interval of vein H17_1 grading 23.80 g/t Au and 14 g/t Ag, from 71.95 m depth, at an elevation of 761 m;
- Underground hole ZKH12N21 intersected a 4.60 m interval of vein H17 grading 1.23 g/t Au, 193 g/t Ag, 7.56% Pb, 3.79% Zn, and 0.38% Cu from 68.67 m depth, at an elevation of 329 m;
- Underground hole ZK21N11 intersected a 2.05 m interval of vein H16_3 grading 3.75 g/t Au, 128 g/t Ag, 2.26% Pb, and 1.05% Zn, from 148.72 m depth, at an elevation of 381 m;
- Underground hole ZKH21N20 intersected a 2.69 m interval of vein H16_3 grading 2.72 g/t Au, 269 g/t Ag, 1.02% Pb, 0.69% Zn, and 0.80% Cu from 147.79 m depth, at an elevation of 338 m;
- Underground hole ZKH27N03 intersected a 1.70 m interval of vein H14a grading 10.49 g/t Au, 18 g/t Ag, 1.02% Pb, and 0.75% Zn, from 181.11 m depth, at an elevation of 440 m;
- Underground hole ZKH21N22 intersected a 0.95 m interval of vein H16_3 grading 6.62 g/t Au, 507 g/t Ag, 1.77% Pb, 1.35% Zn, and 0.97% Cu from 151.45 m depth, at an elevation of 350 m;
- Underground hole ZK19N15 intersected a 0.45 m interval of vein H10_1 grading 25.80 g/t Au and 216 g/t Ag, from 148.64 m depth, at an elevation of 599 m;
- Underground hole ZK04N14 intersected a 1.01 m interval of vein H13 grading 0.62 g/t Au, 930 g/t Ag, 25.93% Pb, 0.30% Zn, and 1.24% Cu from 63.67 m depth, at an elevation of 683 m;
Table 1: Selected intercepts from the drilling programs at the U zone of the HPG mine
|
Hole ID |
From |
To |
Elevation |
interval |
Au |
Ag |
Pb |
Zn |
Cu |
Vein |
|
ZK02N05 |
53.62 |
54.45 |
661 |
0.83 |
0.19 |
227 |
21.15 |
0.14 |
0.19 |
H32 |
|
ZK04N10 |
56.67 |
57.10 |
687 |
0.43 |
0.05 |
114 |
9.94 |
0.08 |
0.19 |
H32 |
|
ZK04N14 |
63.67 |
64.68 |
683 |
1.01 |
0.62 |
930 |
25.93 |
0.30 |
1.24 |
H13 |
|
ZK04N15 |
58.89 |
59.52 |
666 |
0.63 |
0.21 |
88 |
7.09 |
0.12 |
0.13 |
H32 |
|
ZK04W02 |
59.54 |
60.08 |
729 |
0.54 |
0.94 |
178 |
15.28 |
0.02 |
0.03 |
H15 |
|
ZK06N13 |
67.49 |
69.55 |
682 |
2.06 |
0.31 |
184 |
10.59 |
0.09 |
0.25 |
H13 |
|
ZK06S03 |
124.59 |
125.82 |
717 |
1.23 |
0.20 |
57 |
8.92 |
0.05 |
0.06 |
H13 |
|
ZK06S04 |
128.02 |
129.58 |
724 |
1.56 |
0.10 |
69 |
1.84 |
0.57 |
0.03 |
H15_2 |
|
ZK08N13 |
84.64 |
86.04 |
680 |
1.40 |
0.37 |
441 |
11.75 |
0.42 |
0.25 |
H13 |
|
ZK08N14 |
101.76 |
102.11 |
678 |
0.35 |
0.72 |
261 |
0.93 |
0.49 |
0.20 |
H13 |
|
ZK08S01 |
90.55 |
91.36 |
760 |
0.81 |
0.37 |
72 |
17.30 |
0.08 |
0.11 |
H13 |
|
ZK08S05 |
87.75 |
89.40 |
774 |
1.65 |
0.15 |
17 |
4.01 |
0.03 |
0.01 |
H15_2 |
|
ZK11004 |
105.13 |
105.60 |
605 |
0.47 |
0.04 |
592 |
0.94 |
0.37 |
0.01 |
H41W_1 |
|
ZK11205 |
103.81 |
105.45 |
614 |
1.64 |
3.31 |
1 |
0.01 |
0.01 |
0.01 |
H42a |
|
ZK14N23 |
80.61 |
81.11 |
705 |
0.50 |
0.97 |
110 |
13.55 |
0.53 |
0.80 |
H15W |
|
ZK14N25 |
89.92 |
90.75 |
676 |
0.83 |
0.81 |
41 |
4.37 |
0.02 |
0.04 |
H15W |
|
ZK14S22 |
36.91 |
37.94 |
731 |
1.03 |
0.07 |
42 |
3.40 |
0.11 |
0.01 |
H15 |
|
ZK1644 |
190.15 |
190.73 |
689 |
0.58 |
4.71 |
152 |
15.71 |
1.73 |
0.54 |
H32a |
|
ZK1645 |
56.28 |
64.52 |
819 |
8.24 |
4.31 |
15 |
2.10 |
0.01 |
0.02 |
H4 |
|
ZK1645 |
210.11 |
210.59 |
671 |
0.48 |
0.61 |
27 |
9.36 |
0.04 |
0.01 |
H32a |
|
ZK1646 |
66.45 |
67.61 |
809 |
1.16 |
2.48 |
13 |
2.48 |
0.02 |
0.01 |
H4 |
|
ZK1646 |
204.79 |
206.45 |
675 |
1.66 |
0.05 |
23 |
5.14 |
3.02 |
0.05 |
H4a |
|
ZK1646 |
218.66 |
219.85 |
662 |
1.19 |
0.39 |
32 |
4.71 |
0.12 |
0.06 |
H32a |
|
ZK1647 |
222.14 |
224.11 |
663 |
1.97 |
1.72 |
103 |
3.72 |
0.67 |
0.55 |
H32a |
|
ZK17N05 |
100.28 |
100.75 |
625 |
0.47 |
0.16 |
78 |
4.91 |
0.28 |
0.01 |
H9 |
|
ZK21N41 |
47.21 |
47.76 |
600 |
0.55 |
1.74 |
76 |
5.97 |
1.73 |
0.01 |
H39_2 |
|
ZK2346 |
113.21 |
114.22 |
716 |
1.01 |
2.59 |
8 |
0.20 |
0.53 |
0.01 |
H42 |
|
ZK2346 |
123.36 |
123.91 |
710 |
0.55 |
5.21 |
8 |
1.70 |
1.49 |
0.03 |
H15 |
|
ZK2347 |
106.66 |
107.46 |
740 |
0.80 |
1.48 |
19 |
1.61 |
0.48 |
0.02 |
H16_3 |
|
ZK2348 |
56.19 |
56.85 |
776 |
0.66 |
2.13 |
8 |
0.41 |
0.97 |
0.02 |
H14 |
|
ZK2348 |
64.67 |
66.39 |
771 |
1.72 |
3.16 |
4 |
0.12 |
0.43 |
0.01 |
H14a |
|
ZK2348 |
132.58 |
133.26 |
733 |
0.68 |
2.00 |
4 |
0.19 |
0.20 |
0.01 |
H15 |
|
ZK23S03 |
107.58 |
108.43 |
790 |
0.85 |
0.68 |
132 |
0.78 |
0.60 |
0.07 |
H16 |
|
ZK2412 |
172.03 |
173.06 |
720 |
1.03 |
1.98 |
6 |
0.01 |
0.02 |
0.01 |
H17 |
|
ZK24S01 |
199.44 |
200.03 |
721 |
0.59 |
0.34 |
95 |
14.67 |
0.88 |
0.01 |
H32a |
|
ZK29S02 |
211.70 |
212.20 |
684 |
0.50 |
0.16 |
89 |
17.02 |
4.86 |
0.04 |
H29 |
|
ZK3421 |
71.95 |
72.58 |
761 |
0.63 |
23.80 |
14 |
0.03 |
0.03 |
0.01 |
H17_1 |
|
ZK3638 |
37.58 |
37.96 |
804 |
0.38 |
1.10 |
197 |
0.19 |
0.08 |
0.03 |
H17_1 |
|
ZKH00N42 |
48.80 |
50.96 |
635 |
2.16 |
0.68 |
140 |
1.08 |
0.14 |
0.05 |
H5 |
|
ZKH04S01 |
50.64 |
51.27 |
656 |
0.63 |
0.15 |
659 |
0.31 |
2.29 |
0.14 |
H17 |
|
ZKH06N01 |
64.39 |
64.71 |
618 |
0.32 |
0.16 |
309 |
0.60 |
0.10 |
0.49 |
H32E1 |
|
ZKH06N02 |
50.40 |
51.01 |
615 |
0.61 |
5.10 |
28 |
0.48 |
0.12 |
0.01 |
H32E1 |
|
ZKH06S01 |
99.64 |
101.43 |
606 |
1.79 |
1.03 |
76 |
2.14 |
0.09 |
0.69 |
H15 |
|
ZKH06S01 |
102.56 |
109.99 |
605 |
7.43 |
0.61 |
89 |
7.08 |
0.19 |
0.36 |
H17 |
|
ZKH06S09 |
17.36 |
18.28 |
633 |
0.92 |
0.16 |
115 |
0.53 |
1.91 |
0.03 |
H13 |
|
ZKH12S52 |
45.57 |
47.28 |
718 |
1.71 |
0.11 |
33 |
3.33 |
0.04 |
0.08 |
H15 |
|
ZKH12S52 |
163.31 |
164.40 |
670 |
1.09 |
0.29 |
133 |
2.02 |
1.40 |
0.06 |
H18 |
|
ZKH130C01 |
92.85 |
93.96 |
712 |
1.11 |
4.04 |
3 |
0.02 |
0.01 |
0.01 |
H15 |
|
ZKH14S31 |
38.31 |
39.37 |
730 |
1.06 |
0.05 |
45 |
3.75 |
0.04 |
0.05 |
H15 |
|
ZKH14S31 |
153.43 |
154.53 |
712 |
1.10 |
2.56 |
41 |
1.32 |
0.82 |
0.02 |
H18 |
|
ZKH16S51 |
85.99 |
87.16 |
676 |
1.17 |
0.16 |
177 |
0.34 |
0.01 |
0.86 |
H15E |
|
ZKH16S51 |
168.41 |
169.33 |
619 |
0.92 |
0.45 |
128 |
3.23 |
1.25 |
0.04 |
H18 |
|
ZKH16S52 |
35.85 |
40.22 |
733 |
4.37 |
0.08 |
28 |
4.13 |
0.03 |
0.03 |
H15 |
|
ZKH16S52 |
171.30 |
172.25 |
719 |
0.95 |
0.12 |
211 |
1.21 |
0.63 |
0.06 |
H18 |
|
ZKH18N01 |
147.22 |
147.86 |
756 |
0.64 |
0.04 |
10 |
4.44 |
0.99 |
0.01 |
H6 |
|
ZKH24S05 |
157.87 |
159.05 |
741 |
1.18 |
0.17 |
22 |
5.65 |
0.81 |
0.03 |
H32a |
|
ZKH33N10 |
28.61 |
29.06 |
627 |
0.45 |
5.42 |
4 |
0.08 |
0.16 |
0.01 |
H12E1 |
Table 2: Selected intercepts from the drilling programs at the P zone of the HPG mine
|
Hole ID |
From |
To |
Elevation |
interval |
Au |
Ag |
Pb |
Zn |
Cu |
Vein |
|
ZK02N36 |
72.36 |
72.97 |
331 |
0.61 |
3.86 |
6,132 |
6.45 |
8.47 |
0.33 |
H5E |
|
ZK04N06 |
124.59 |
125.01 |
515 |
0.42 |
0.04 |
27 |
8.36 |
0.65 |
0.03 |
H5 |
|
ZK04N07 |
165.80 |
166.26 |
467 |
0.46 |
0.47 |
416 |
40.18 |
0.35 |
0.13 |
H5E |
|
ZK04N08 |
95.05 |
95.63 |
582 |
0.58 |
0.89 |
91 |
1.01 |
0.09 |
0.10 |
H5a |
|
ZK04N09 |
100.28 |
101.00 |
581 |
0.72 |
0.07 |
284 |
0.09 |
0.02 |
0.03 |
H5a |
|
ZK04N09 |
102.91 |
104.23 |
580 |
1.32 |
0.61 |
66 |
13.01 |
0.12 |
0.18 |
H5 |
|
ZK04N19 |
15.15 |
15.48 |
375 |
0.33 |
5.52 |
23 |
0.42 |
0.98 |
0.01 |
H5E |
|
ZK05N11 |
118.87 |
119.53 |
371 |
0.66 |
2.86 |
15 |
0.05 |
0.03 |
0.01 |
H5 |
|
ZK07N21 |
101.34 |
103.31 |
332 |
1.97 |
0.26 |
123 |
3.50 |
3.42 |
0.08 |
H5 |
|
ZK07N22 |
56.03 |
57.57 |
346 |
1.54 |
2.00 |
14 |
0.03 |
0.01 |
0.01 |
H5E |
|
ZK09N23 |
82.17 |
82.52 |
332 |
0.35 |
21.00 |
120 |
2.85 |
15.03 |
0.09 |
H5 |
|
ZK09N31 |
2.81 |
3.54 |
462 |
0.73 |
0.21 |
106 |
0.10 |
0.03 |
1.07 |
H5E |
|
ZK09N31 |
80.42 |
81.30 |
415 |
0.88 |
0.34 |
300 |
1.24 |
0.92 |
0.06 |
H5 |
|
ZK11007 |
240.47 |
241.68 |
497 |
1.21 |
2.39 |
2 |
0.08 |
0.07 |
0.01 |
H12_1 |
|
ZK11008 |
225.13 |
225.59 |
518 |
0.46 |
7.44 |
17 |
0.39 |
0.50 |
0.04 |
H12_1 |
|
ZK11204 |
205.86 |
206.86 |
555 |
1.00 |
2.92 |
5 |
0.14 |
0.04 |
0.01 |
H20W |
|
ZK11209 |
202.55 |
203.11 |
527 |
0.56 |
2.71 |
8 |
0.76 |
0.75 |
0.03 |
H20W1 |
|
ZK11211 |
82.05 |
82.40 |
591 |
0.35 |
4.42 |
26 |
1.79 |
0.05 |
0.01 |
H41W |
|
ZK11614 |
44.23 |
44.80 |
446 |
0.57 |
11.90 |
45 |
3.39 |
0.49 |
0.19 |
H20W1 |
|
ZK11614 |
46.12 |
46.95 |
445 |
0.83 |
3.26 |
84 |
0.94 |
0.49 |
0.10 |
H20W |
|
ZK14N18 |
13.94 |
14.58 |
380 |
0.64 |
1.55 |
58 |
2.54 |
9.79 |
0.21 |
H32E1 |
|
ZK14N19 |
28.10 |
28.52 |
377 |
0.42 |
7.00 |
10 |
0.31 |
0.25 |
0.01 |
H32E1 |
|
ZK19N15 |
148.64 |
149.09 |
599 |
0.45 |
25.80 |
216 |
0.04 |
0.01 |
0.01 |
H10_1 |
|
ZK19N20 |
8.53 |
9.40 |
462 |
0.87 |
0.97 |
108 |
16.84 |
0.33 |
0.26 |
H11 |
|
ZK19N20 |
208.43 |
208.94 |
369 |
0.51 |
3.25 |
5 |
0.40 |
0.14 |
0.01 |
H42 |
|
ZK21N11 |
148.72 |
150.77 |
381 |
2.05 |
3.75 |
128 |
2.26 |
1.05 |
0.20 |
H16_3 |
|
ZK21N37 |
131.58 |
132.30 |
435 |
0.72 |
7.51 |
15 |
0.10 |
0.18 |
0.01 |
H16_1 |
|
ZK21N39 |
126.31 |
128.05 |
432 |
1.74 |
2.10 |
56 |
2.71 |
1.25 |
0.08 |
H16_1 |
|
ZK21N41 |
114.86 |
117.14 |
559 |
2.28 |
0.25 |
49 |
5.17 |
0.06 |
0.01 |
H12_1 |
|
ZK21N42 |
55.06 |
55.50 |
589 |
0.44 |
1.01 |
164 |
2.23 |
0.85 |
0.01 |
H39_2 |
|
ZK21N42 |
131.24 |
131.92 |
533 |
0.68 |
1.35 |
94 |
0.65 |
0.26 |
0.01 |
H12_1 |
|
ZK22N01 |
99.79 |
100.94 |
588 |
1.15 |
4.59 |
23 |
0.94 |
0.07 |
0.11 |
H15 |
|
ZK23N05 |
141.55 |
142.62 |
381 |
1.07 |
1.63 |
16 |
1.13 |
0.62 |
0.01 |
H16_1 |
|
ZK23N32 |
54.49 |
54.93 |
429 |
0.44 |
3.36 |
43 |
0.15 |
0.10 |
0.35 |
H17_1W |
|
ZK23N34 |
5.54 |
6.15 |
466 |
0.61 |
1.75 |
27 |
0.31 |
0.82 |
0.06 |
H11 |
|
ZK23N34 |
121.72 |
122.34 |
439 |
0.62 |
2.43 |
11 |
0.48 |
0.23 |
0.04 |
H16_1 |
|
ZK23N35 |
5.59 |
6.59 |
465 |
1.00 |
1.43 |
28 |
1.88 |
0.24 |
0.09 |
H11 |
|
ZK23N35 |
181.11 |
181.60 |
405 |
0.49 |
0.09 |
52 |
10.80 |
0.04 |
0.13 |
H17_1 |
|
ZK25N04 |
55.72 |
56.13 |
435 |
0.41 |
4.48 |
77 |
0.34 |
0.56 |
0.01 |
H13 |
|
ZK25N05 |
83.43 |
84.69 |
515 |
1.26 |
1.73 |
9 |
0.35 |
0.33 |
0.03 |
H16_1 |
|
ZK25N08 |
94.53 |
95.59 |
417 |
1.06 |
2.05 |
3 |
0.03 |
0.04 |
0.01 |
H16 |
|
ZK27N04 |
161.78 |
162.48 |
484 |
0.70 |
1.98 |
9 |
0.24 |
0.15 |
0.02 |
H16_1 |
|
ZK27N07 |
105.32 |
106.13 |
552 |
0.81 |
2.00 |
13 |
0.20 |
0.08 |
0.03 |
H16 |
|
ZK27N07 |
137.48 |
138.13 |
534 |
0.65 |
2.21 |
15 |
0.40 |
0.36 |
0.06 |
H40 |
|
ZK27N08 |
143.28 |
143.82 |
480 |
0.54 |
2.96 |
7 |
0.14 |
0.06 |
0.01 |
H16 |
|
ZK29N10 |
136.81 |
139.45 |
530 |
2.64 |
2.09 |
4 |
0.39 |
0.21 |
0.01 |
H16_1a |
|
ZKH02N37 |
127.89 |
128.54 |
324 |
0.65 |
8.78 |
35 |
1.12 |
0.16 |
0.06 |
H5_2 |
|
ZKH02N38 |
116.61 |
117.60 |
328 |
0.99 |
9.21 |
8 |
0.08 |
0.14 |
0.09 |
H5_2W |
|
ZKH02N38 |
141.53 |
142.38 |
324 |
0.85 |
0.34 |
73 |
1.56 |
0.42 |
0.07 |
H5_2 |
|
ZKH02N38 |
172.02 |
172.65 |
320 |
0.63 |
0.13 |
67 |
2.49 |
6.17 |
0.04 |
H5E |
|
ZKH08N03 |
132.56 |
133.27 |
591 |
0.71 |
0.40 |
382 |
6.23 |
1.38 |
0.51 |
H15_2 |
|
ZKH12N21 |
67.10 |
67.77 |
330 |
0.67 |
1.17 |
172 |
3.23 |
12.97 |
0.22 |
H17_1 |
|
ZKH12N21 |
68.67 |
73.27 |
329 |
4.60 |
1.23 |
193 |
7.56 |
3.79 |
0.38 |
H17 |
|
ZKH12N22 |
28.43 |
28.88 |
361 |
0.45 |
0.28 |
76 |
4.92 |
0.13 |
0.01 |
H15 |
|
ZKH12N22 |
67.78 |
69.48 |
331 |
1.70 |
0.23 |
61 |
2.04 |
6.67 |
0.21 |
H17_1 |
|
ZKH12N22 |
71.25 |
73.94 |
328 |
2.69 |
0.53 |
86 |
4.33 |
2.61 |
0.18 |
H17 |
|
ZKH19N25 |
13.44 |
14.21 |
571 |
0.77 |
0.14 |
190 |
0.28 |
0.17 |
0.28 |
H39_1E |
|
ZKH21N20 |
64.38 |
65.22 |
361 |
0.84 |
0.29 |
54 |
1.44 |
1.70 |
0.01 |
H13 |
|
ZKH21N20 |
68.18 |
69.13 |
360 |
0.95 |
0.68 |
382 |
0.54 |
0.57 |
0.02 |
H13a |
|
ZKH21N20 |
141.43 |
142.15 |
339 |
0.72 |
1.62 |
13 |
1.30 |
1.00 |
0.03 |
H16_1 |
|
ZKH21N20 |
147.79 |
150.48 |
338 |
2.69 |
2.72 |
269 |
1.02 |
0.69 |
0.80 |
H16_3 |
|
ZKH21N20 |
160.42 |
161.02 |
334 |
0.60 |
5.66 |
7 |
0.24 |
0.08 |
0.02 |
H15Wa |
|
ZKH21N20 |
168.74 |
169.82 |
332 |
1.08 |
0.41 |
21 |
5.00 |
0.11 |
0.05 |
H15 |
|
ZKH21N20 |
188.06 |
188.68 |
326 |
0.62 |
1.87 |
45 |
0.75 |
0.13 |
0.52 |
H17_1 |
|
ZKH21N22 |
51.71 |
52.66 |
369 |
0.95 |
2.53 |
3 |
0.03 |
0.05 |
0.01 |
H11Ea |
|
ZKH21N22 |
68.83 |
69.73 |
366 |
0.90 |
0.99 |
84 |
0.28 |
0.61 |
0.01 |
H13 |
|
ZKH21N22 |
142.40 |
143.19 |
351 |
0.79 |
0.71 |
22 |
1.83 |
1.95 |
0.15 |
H16_1 |
|
ZKH21N22 |
151.45 |
152.40 |
350 |
0.95 |
6.62 |
507 |
1.77 |
1.35 |
0.97 |
H16_3 |
|
ZKH21N22 |
165.32 |
166.62 |
347 |
1.30 |
1.71 |
11 |
0.42 |
0.07 |
0.03 |
H15 |
|
ZKH27N02 |
16.60 |
18.68 |
535 |
2.08 |
2.10 |
74 |
0.31 |
0.12 |
0.28 |
H20W |
|
ZKH27N03 |
15.14 |
15.86 |
531 |
0.72 |
5.97 |
15 |
0.43 |
0.37 |
0.04 |
H20W |
|
ZKH27N03 |
120.16 |
122.82 |
473 |
2.66 |
1.27 |
23 |
1.27 |
0.10 |
0.02 |
H40 |
|
ZKH27N03 |
181.11 |
182.81 |
440 |
1.70 |
10.49 |
18 |
1.02 |
0.75 |
0.03 |
H14a |
|
ZKH27N04 |
94.47 |
95.70 |
510 |
1.23 |
1.43 |
32 |
1.10 |
0.69 |
0.01 |
H16_1 |
|
ZKH27N05 |
14.12 |
14.95 |
531 |
0.83 |
3.30 |
9 |
0.24 |
0.11 |
0.09 |
H20W |
|
ZKH27N06 |
24.51 |
25.40 |
535 |
0.89 |
4.05 |
197 |
0.69 |
0.15 |
0.99 |
H17_1 |
|
ZKH27N06 |
26.90 |
28.91 |
535 |
2.01 |
0.14 |
240 |
0.68 |
1.37 |
0.41 |
H20W |
|
ZKH27N06 |
114.53 |
115.25 |
522 |
0.72 |
1.65 |
293 |
2.09 |
0.47 |
0.54 |
H16 |
|
ZKH27N07 |
34.66 |
35.48 |
515 |
0.82 |
1.34 |
45 |
0.26 |
0.05 |
0.07 |
H20W |
|
ZKH29N16 |
93.05 |
93.84 |
581 |
0.79 |
1.20 |
33 |
6.92 |
0.77 |
0.04 |
H41W |
|
ZKH33N11 |
94.57 |
95.44 |
588 |
0.87 |
0.05 |
25 |
6.99 |
0.55 |
0.01 |
H12E |
|
ZKH36N06 |
132.35 |
133.48 |
368 |
1.13 |
0.11 |
37 |
2.41 |
4.59 |
0.03 |
H15_1 |
|
ZKH36N07 |
135.56 |
136.22 |
354 |
0.66 |
0.18 |
61 |
7.00 |
3.04 |
0.03 |
H15_1 |
|
ZKH38N01 |
127.63 |
128.77 |
373 |
1.14 |
0.51 |
32 |
2.36 |
2.85 |
0.04 |
H17 |
Table 3: Selected intercepts from the drilling programs at the B zone of the HPG mine
|
Hole ID |
From |
To |
Elevation |
interval |
Au |
Ag |
Pb |
Zn |
Cu |
Vein |
|
ZK09N23 |
61.99 |
63.77 |
345 |
1.78 |
1.56 |
63 |
0.21 |
0.05 |
0.11 |
B |
|
ZK09N31 |
18.91 |
19.47 |
452 |
0.56 |
3.04 |
120 |
0.12 |
0.02 |
0.35 |
B |
|
ZK1323 |
20.66 |
21.40 |
727 |
0.74 |
0.01 |
22 |
1.41 |
3.05 |
0.03 |
B07 |
|
ZK15N26 |
75.65 |
77.12 |
576 |
1.47 |
0.85 |
135 |
0.72 |
1.50 |
0.15 |
B08 |
|
ZK15N27 |
91.75 |
92.82 |
555 |
1.07 |
0.62 |
288 |
1.81 |
0.11 |
0.29 |
B08 |
|
ZK15N30 |
67.58 |
71.80 |
571 |
4.22 |
0.45 |
144 |
0.99 |
0.61 |
0.07 |
B08 |
|
ZK15N32 |
73.19 |
74.77 |
568 |
1.58 |
1.71 |
93 |
0.22 |
0.08 |
0.02 |
B08 |
|
ZKH07N12 |
48.07 |
48.81 |
346 |
0.74 |
1.88 |
17 |
0.03 |
0.02 |
0.01 |
B02 |
Table 4: Selected intercepts from the drilling programs at the D zone of the HPG mine
|
Hole ID |
From |
To |
Elevation |
interval |
Au |
Ag |
Pb |
Zn |
Cu |
Vein |
|
ZK03N35 |
174.26 |
174.81 |
267 |
0.55 |
15.55 |
52 |
1.67 |
2.46 |
0.01 |
H5 |
|
ZK03N37 |
143.41 |
144.00 |
295 |
0.59 |
0.83 |
236 |
12.14 |
7.04 |
0.01 |
H5 |
|
ZK40N02 |
233.57 |
233.92 |
179 |
0.35 |
0.72 |
185 |
6.51 |
0.01 |
0.01 |
H17 |
|
ZKH00N39 |
255.51 |
256.21 |
119 |
0.70 |
0.18 |
22 |
1.85 |
5.23 |
0.08 |
H5E |
|
ZKH06N34 |
106.37 |
107.11 |
-11 |
0.74 |
2.60 |
76 |
6.06 |
4.68 |
0.23 |
H15_1 |
|
ZKH06N34 |
159.08 |
159.74 |
-42 |
0.66 |
0.50 |
82 |
3.00 |
1.56 |
0.11 |
H17 |
|
ZKH4204 |
192.72 |
193.25 |
194 |
0.53 |
4.00 |
434 |
11.02 |
0.06 |
3.02 |
H15_1 |
|
ZKH4204 |
226.08 |
226.57 |
176 |
0.49 |
0.78 |
118 |
25.65 |
25.81 |
0.11 |
H15 |
The above references an opinion and is for information purposes only. It is not intended to be investment advice. Seek a licensed professional for investment advice. The author is not an insider or shareholder of any of the companies mentioned above.
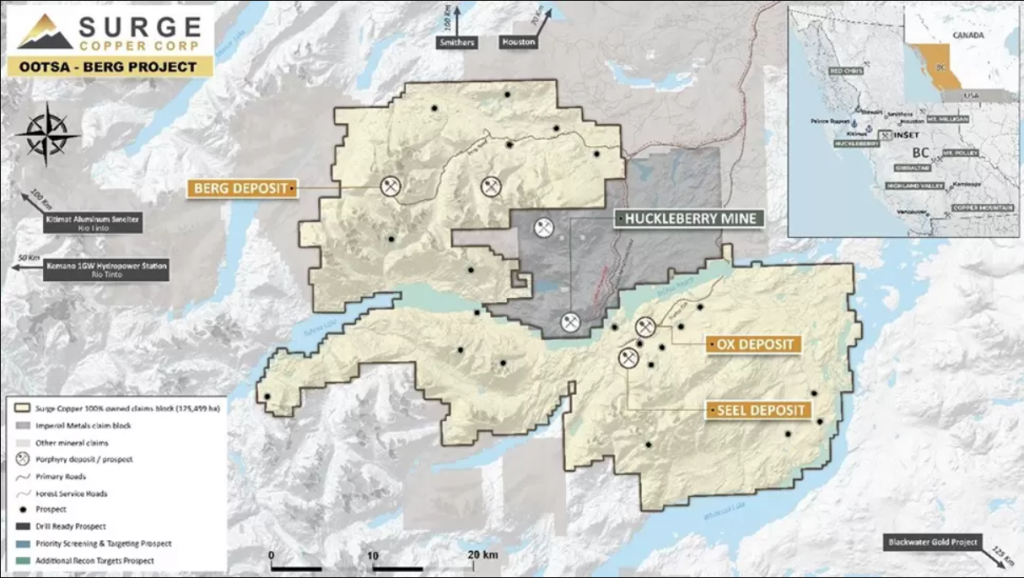
Surge Copper (TSXV:SURG) has finalized a Purchase Agreement with Thompson Creek Metals Company Inc., a subsidiary of Centerra Gold Inc. This agreement grants Surge complete ownership of the Berg Property, in exchange for 21,221,165 of its common shares. As a result of this transaction, TCM will hold about 15% of Surge’s outstanding common shares. This Purchase Agreement supersedes the December 2020 Option Agreement between the two companies, which had previously allowed Surge to acquire a 70% interest in the Berg Property through a C$8 million investment over five years and the issuance of C$5 million in common shares to TCM.
Leif Nilsson, Chief Executive Officer of Surge Copper, commented in a press release: “We are very pleased to be consolidating a 100% interest in the Berg Property, which firmly establishes our ownership position in the broader Berg-Huckleberry-Ootsa district, results in a more simplified ownership structure for all parties, and provides Surge with significantly more flexibility in future financing choices to advance its assets. Surge now holds a simple 100% ownership interest in a contiguous 125,499-hectare land package that hosts the Berg Project, for which we released a maiden NI 43-101 compliant PEA in June 2023, the Ootsa Project, for which we released an updated NI 43-101 mineral resource estimate in June 2022, and an extensive pipeline of exploration targets prospective for porphyry copper and associated breccia and hydrothermal vein style base metal and precious metal deposits. Looking forward, our goal is to continue to advance and de-risk this large, emerging critical minerals district and systematically explore the high-potential regional targets. We value our partnership with Centerra and look forward to welcoming them as a significant shareholder in Surge going forward.”
The Berg Property, encompassing 34,798 hectares, is adjacent to Surge’s existing mineral claims. The property features the Berg deposit, for which Surge publicized a Preliminary Economic Assessment (PEA) and a Mineral Resource Estimate (MRE) in June 2023. The PEA described a large-scale, stand-alone greenfield development project with a straightforward design and high outputs of critical minerals in a region with excellent infrastructure. Key findings from the PEA include a base case after-tax Net Present Value (NPV) of C$2.1 billion and an Internal Rate of Return (IRR) of 20%, predicated on long-term commodity price assumptions. The mine life is projected to be 30 years, with total payable production estimated at 5.8 billion pounds of copper equivalent. The updated mineral resource estimate includes a significant amount of copper, molybdenum, silver, and gold.
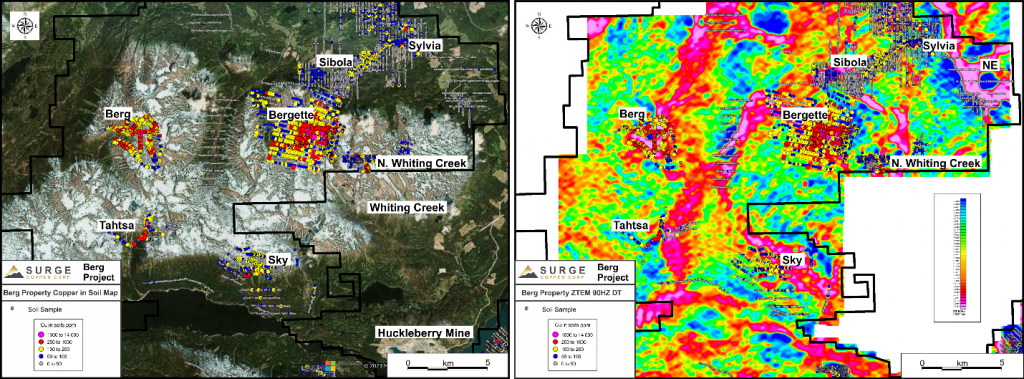
In addition to the Berg deposit, the Berg Property and the adjacent claims held by Surge house several early-stage exploration targets. These include the Bergette, Sibola, Sylvia, Tahtsa, North Whiting Creek, and Sky targets, each showing promising signs of mineralization, including copper, molybdenum, gold, and silver, as indicated by various drilling and surface exploration activities reported in 2022 and 2023. These findings were supported by regional airborne surveys, ground-based IP grids, and other earlier datasets.
The mining claims under the Purchase Agreement are valid until February 2032, with a current 5-year area-based permit extending until March 2027. This acquisition marks a significant expansion of Surge Copper Corp.’s mineral exploration and potential development activities.
The above references an opinion and is for information purposes only. It is not intended to be investment advice. Seek a licensed professional for investment advice. The author is not an insider or shareholder of any of the companies mentioned above.
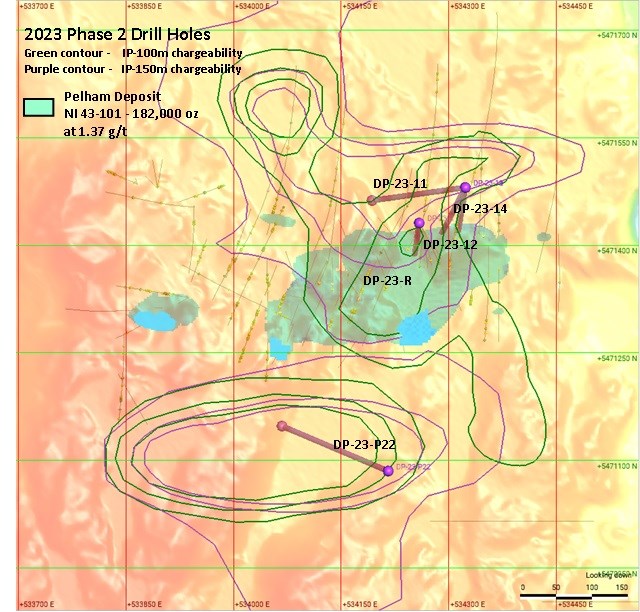
For 2023, Dynasty Gold (TSXV:DYG), a gold exploration and development company, reported significant developments at its Thundercloud project located in the Manitou-Stormy Lakes Greenstone belt, approximately 47 kilometres southeast of Dryden in northwestern Ontario. The company’s exploration activities have centred around the Pelham deposit within this project.
Dynasty Gold President and CEO Ivy Chong commented in a press release: “2023 has been an exhilarating year for the Company. We are pleased with the success of continually intersecting rich mineralization in the Pelham Zone and are excited by the discovery of new mineralization outside the Pelham deposit. To grow the deposit, it is pivotal to step-out to new areas. These new test drilling data provide valuable information and direction for next year’s drill program. With $3.5 million in the treasury and no debt, we are fully funded for the 2024 drilling.”
The past year has been pivotal for Dynasty Gold Corp., marked by a substantial 278% increase in its market capitalization. This growth can be attributed to several successful drilling programs and attracting new investors, including renowned mining entrepreneur Rob McEwen, the founder of Goldcorp and the current Chairman and Chief Owner of McEwen Mining Inc. McEwen’s investment in Dynasty Gold Corp. is notable, considering his previous success in growing Goldcorp’s market capitalization from $50 million to over $8 billion.
In 2023, the company completed a total of 3,670 meters of drilling in two phases at the Thundercloud project. The first phase aimed to follow up on significant discovery holes reported earlier in the year. These included impressive gold intercepts such as 5.98 grams per tonne (g/t) over 34.5 meters and 25.5 g/t over 1.5 meters. The second phase of drilling, completed in August, intersected over 741 meters of mineralization across ten holes in the Pelham Zone, with most holes within 200 meters of the surface. This phase expanded the known mineralization east and west of the initial discovery holes.
The successful drilling results have led to a reevaluation and expansion of the inferred resource initially estimated in January 2022. The updated internal 3-D resource model shows an increase in both tonnage and grade, although the official NI 43-101 resource estimate will be revised in the future.
Building on this success, the company began an ambitious exploration strategy in October 2023, drilling five wildcat holes totalling 1,320 meters to the north and south of the Pelham deposit, areas previously unexplored. This drilling, guided by geophysical surveys, intersected low-grade mineralization, extending the known mineralized area beyond the Pelham deposit. These results, along with prior sampling, suggest a potentially extensive mineralized corridor spanning 1.5 kilometres by 12 kilometres.
The geological characteristics of the recent finds are consistent with an Archean orogenic hydrothermal deposit, indicating potential for depth extension and repetition along untested trends. The mineralization is primarily found in altered volcanic rocks and is associated with pyrite, pyrrhotite, quartz, and other minerals.
Looking ahead to 2024, Dynasty Gold Corp. is planning an extensive exploration program based on the 2023 drilling results, geophysical data, and a comprehensive Lidar survey. The focus will be on expanding the high-grade core of the deposit, detailed mapping, channel sampling, and step-out drilling within the identified mineralized corridor. The exploration strategy will also include follow-up work on the West Contact zone trench, which previously yielded significant gold grades. The company aims to leverage the structural and geophysical data to discover multiple near-surface deposits in the area, with a focus on shallow drilling to explore steeply dipping structures.
Other highlights from the results are as follows:
| Hole ID | From (m) | To (m) | Interval (m) | G/T Au |
| DP-23-01 | 134.7 | 187.5 | 52.8 | 2.7 |
| Incl. | 162.0 | 165.0 | 3.0 | 19.3 |
| And incl. | 184.5 | 187.5 | 3.0 | 18.3 |
| DP-23-02 | 109.5 | 160.5 | 51.0 | 1.40 |
| Incl. | 151.5 | 154.5 | 3.0 | 5.91 |
| DP-23-03 | 99.0 | 154.3 | 55.3 | 3.4 |
| Incl. | 139.5 | 154.3 | 14.8 | 7.1 |
| And incl. | 147.0 | 153.0 | 6.0 | 10.4 |
| DP-23-04 | 93.0 | 163.5 | 70.5 | 3.2 |
| Incl. | 109.5 | 121.5 | 12.0 | 11.0 |
| And incl. | 112.5 | 114.0 | 1.5 | 62.5 |
| DP-23-05 | 104.5 | 154.5 | 50.0 | 3.1 |
| Incl. | 148.5 | 151.5 | 3.0 | 8.3 |
| DP-23-06 | 100.5 | 231.0 | 130.5 | 1.2 |
| Incl. | 100.5 | 157.5 | 57.0 | 2.30 |
| DP-23-07 | 99.0 | 160.5 | 61.5 | 1.08 |
| Incl. | 106.5 | 141.0 | 34.5 | 1.58 |
| DP-23-08 | 73.5 | 130.5 | 57.0 | 1.42 |
| Incl. | 99.0 | 103.5 | 4.5 | 4.43 |
| DP-23-09 | 58.0 | 106.5 | 48.5 | 1.01 |
| Incl. | 90.0 | 91.5 | 1.5 | 8.13 |
| DP-23-10 | 33.0 | 196.5 | 163.5 | 1.0 |
| Incl. | 67.5 | 75.0 | 7.5 | 8.8 |
| And incl. | 52.5 | 55.5 | 3.0 | 11.2 |
The above references an opinion and is for information purposes only. It is not intended to be investment advice. Seek a licensed professional for investment advice. The author is not an insider or shareholder of any of the companies mentioned above.
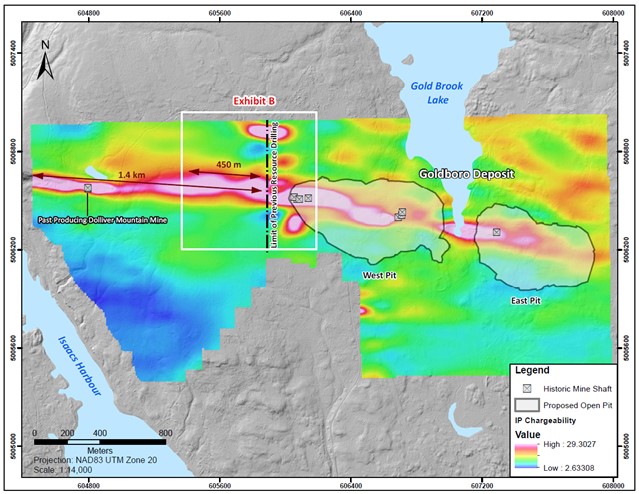
Signal Gold (TSX:SGNL) has released results from its diamond drilling program at the Goldboro Project in Nova Scotia. The project underwent a step-out drilling program involving 31 holes covering 6,026.5 metres. This program aimed to explore gold mineralization west of the Goldboro Deposit. Remarkably, gold mineralization has been discovered up to 450 metres west of the area previously drilled for resource definition. The findings are a part of a broader exploration project that has examined a 1.4-kilometre stretch of the Goldboro Trend west of the established Goldboro Mineral Resource.
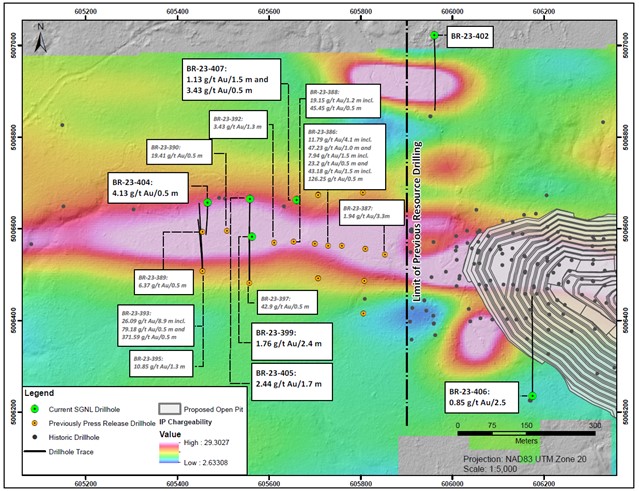
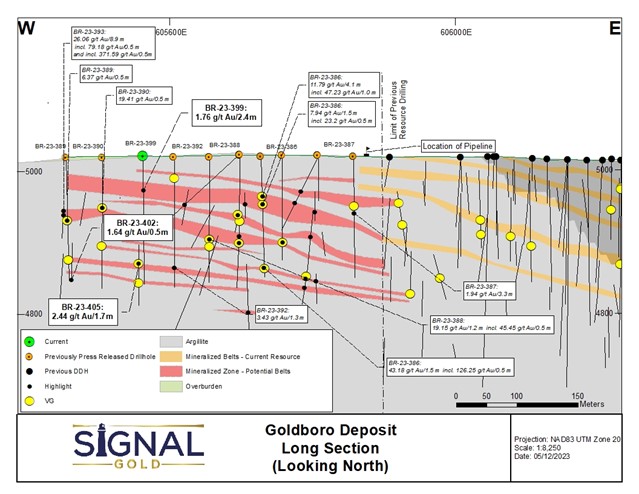
The latest drilling results include 1,446.5 metres from seven diamond drill holes, labelled BR-23-399, 402, and 404 to 407. This drilling yielded 27 intersections of gold mineralization, including three instances where gold was visibly evident. Notable findings from these drill holes are as follows:
– 109.91 grams per tonne (g/t) of gold over 0.5 metres at a depth between 92.8 and 93.3 metres in hole BR-23-399.
– 2.44 g/t of gold over 1.7 metres at a depth between 167.6 and 169.3 metres in hole BR-23-405.
– 1.76 g/t of gold over 2.4 metres at the same depths in hole BR-23-399.
Earlier drilling in this area had uncovered high-grade gold mineralization. Some of the notable past results include:
– 26.09 g/t of gold over 8.9 metres at depths between 105.5 and 114.4 metres in hole BR-23-393, which includes segments of 79.18 g/t and 371.59 g/t gold over 0.5 metres each.
– 11.79 g/t of gold over 4.1 metres at depths between 49.9 and 54.0 metres in hole BR-23-386, including a segment with 47.23 g/t gold over 1.0 metre.
– Several other high-grade intersections in various drill holes.
The exploration in the area extending up to 450 metres west of the Goldboro Deposit continues to uncover gold mineralization. These findings suggest that the mineralization extends further west towards the previously operational Dolliver Mountain Gold Mine and remains open at depth.
During the drilling program, holes BR-23-402 and 406 were specifically designed to target IP (Induced Polarization) chargeability anomalies. These anomalies were located parallel to but on either side of the main host structure and chargeability trend. However, drill hole BR-23-402, positioned north of the Goldboro Trend, did not intersect significant gold mineralization. Similarly, drill hole BR-23-407, located south of the trend, did not find significant gold mineralization in the associated chargeability response area but did intersect gold deeper within the hinge of the anticline in the West Goldbrook System.
The company is awaiting assay results for an additional 32 drill holes, which encompass 6,195 metres of drilling from the overall program.
Highlights from the results are as follows:
A table of selected composited assay results from the drill program
| Drill hole | From (m) | To (m) | Interval (m) | Gold (g/t) | Visible Gold |
| BR-23-399 | 17.6 | 18.1 | 0.5 | 1.84 | |
| and | 33.2 | 33.7 | 0.5 | 1.95 | |
| and | 39.7 | 43.0 | 3.3 | 0.66 | |
| and | 44.2 | 46.6 | 2.4 | 1.76 | |
| and | 51.1 | 51.6 | 0.5 | 2.12 | |
| and | 56.3 | 57.0 | 0.7 | 2.31 | |
| and | 92.8 | 93.3 | 0.5 | 109.91 | |
| and | 118.6 | 121.7 | 3.1 | 1.14 | |
| and | 132.1 | 132.6 | 0.5 | 0.93 | |
| and | 153.0 | 155.4 | 2.4 | 1.51 | |
| and | 158.7 | 159.2 | 0.5 | 4.69 | |
| BR-23-404 | 54.8 | 55.3 | 0.5 | 4.13 | |
| and | 120.5 | 121.5 | 1.0 | 1.70 | |
| and | 180.7 | 181.2 | 0.5 | 1.64 | |
| BR-23-404A | 37.4 | 39.5 | 2.1 | 1.01 | |
| BR-23-405 | 87.5 | 88.1 | 0.6 | 3.82 | |
| and | 122.6 | 123.1 | 0.5 | 1.07 | |
| and | 129.8 | 130.3 | 0.5 | 1.87 | |
| and | 167.6 | 169.3 | 1.7 | 2.44 | |
| including | 168.4 | 169.3 | 0.9 | 4.33 | VG |
| and | 193.9 | 195.0 | 1.1 | 0.53 | |
| BR-23-406 | 185.4 | 187.9 | 2.5 | 0.85 | VG |
| and | 234.5 | 235.0 | 0.5 | 0.50 | |
| and | 288.2 | 288.7 | 0.5 | 0.84 | VG |
| and | 300.0 | 301.2 | 1.2 | 0.71 | |
| and | 307.7 | 308.2 | 0.5 | 1.11 | |
| BR-23-407 | 69.2 | 70.7 | 1.5 | 1.13 | |
| and | 217.1 | 217.6 | 0.5 | 3.73 |
Footnotes:
- Intervals are reported as core length only. True widths are estimated to be between 70% and 100% of the core length.
- All drill hole results are reported using fire assay only. See notes on QAQC procedures at the bottom of this press release.
- All drill holes not reported in the table above did not encounter significant mineralization, with the exception of drill holes BR-23-402.
- Drill holes were oriented along a north-south trend with holes on the north limb of the hosting anticlinal structure drilled southward and holes located south of the anticlinal structure drilled northward. The dip of holes is dependent upon the location relative to the anticline with the goal of intersecting mineralized zones orthogonally.
The above references an opinion and is for information purposes only. It is not intended to be investment advice. Seek a licensed professional for investment advice. The author is not an insider or shareholder of any of the companies mentioned above.
Brazil’s agricultural sector is a major factor in global food security, contributing approximately 30% to the nation’s GDP. This sector has positioned Brazil with a significant trade surplus, a trend recently highlighted by Robin Brooks, Chief Economist at the Institute of International Finance. Brooks stated, “Brazil’s massive trade surplus this year gets dismissed as an outlier event, but it isn’t. There’s been a gradual move towards bigger and bigger agricultural exports which power the trade surplus. This trade surplus isn’t an outlier. It’s a lasting transformation.”
In 2023, Brazil is poised to surpass $100 billion in agricultural exports, an amount unmatched by any other South American country. This economic strength is further strengthened by Brazil’s stable currency, high employment levels, and robust foreign exchange reserves. Despite some unresolved economic challenges, the collective efforts of Brazilian farmers, companies in the sector, and government support at federal and state levels have laid a solid foundation for wealth creation and distribution.
The global climate of instability has impacted food security and the availability and pricing of essential commodities. For Brazil, potash, a key fertilizer component, has emerged as both a strategic and vulnerable resource. Potash enhances plant resilience against drought, temperature extremes, and pests. The global potash market is largely dominated by Canada, Russia, and Belarus, who historically have supplied over 80% of the market. The Russian invasion of Ukraine and subsequent trade restrictions on Russia and Belarus led to a dramatic increase in potash prices, from $250 to over $1,200 per ton. This spike presented Brazilian farmers with not only increased costs but also the risk of interrupted potassium chloride shipments. Diplomatic efforts were made to ensure the continuity of potash supplies, which also resulted in substantial payments to Russia during its invasion of Ukraine. Had potash prices remained at $1,200, Brazil would have faced an expense exceeding $16 billion, a significant burden given the country’s extensive potash reserves.
Brazil, which imports 98% of its potash needs, has seen a tenfold increase in its usage per hectare, coinciding with increased agricultural yields. Now, Brazil possesses a world-class potash deposit in the Amazonas State, comparable to those in Canada, Russia, and Belarus – the Autazes Potash Project by Brazil Potash. This deposit, located approximately 850 meters underground, is a remnant of an ancient sea. The proposed extraction and processing techniques are similar to those used in Canada, which involve mining the ore (salt), extracting the potash, and reintegrating the sodium chloride tailings underground. This project is environmentally advantageous, particularly considering the lengthy transportation of Canadian potash to Brazil and Brazil’s predominantly renewable energy grid.
The strategic importance of this resource for Brazil and global food security is evident. However, there are potential benefits for the Mura indigenous communities near the project and who live in the state. Currently, Brazilian farmers pay royalties to indigenous communities in Canada through Canadian mining companies. Canpotex, a Canadian firm, has exported over 50 million tons of potash to Brazil, resulting in payments of approximately $17.5 billion. These royalties support community wellbeing, employment, and business opportunities for indigenous groups in Canada.
In contrast, the Indigenous Mura Council (CIM), representing 36 tribes and over 12,000 indigenous people near the Autazes potash project in Brazil, has shown support for the project following a comprehensive consultation process. The project, which is not located on a reserve, is crucial for Brazil and its agricultural sector. The benefits, including shared prosperity with the residents of Autazes, local indigenous communities, and the State of Amazonas, underscore its potential to contribute significantly to global food security.
Food security has been highlighted at the United Nations, COP28, and other global summits where world leaders have tried bringing attention to this critical issue. Now, the world will look to projects that can help secure a future with steady agriculture around the world, with potash mining and projects like the Autazes Potash Project ready to help meet those goals.
The above references an opinion and is for information purposes only. It is not intended to be investment advice. Seek a licensed professional for investment advice. The author is not an insider or shareholder of any of the companies mentioned above.
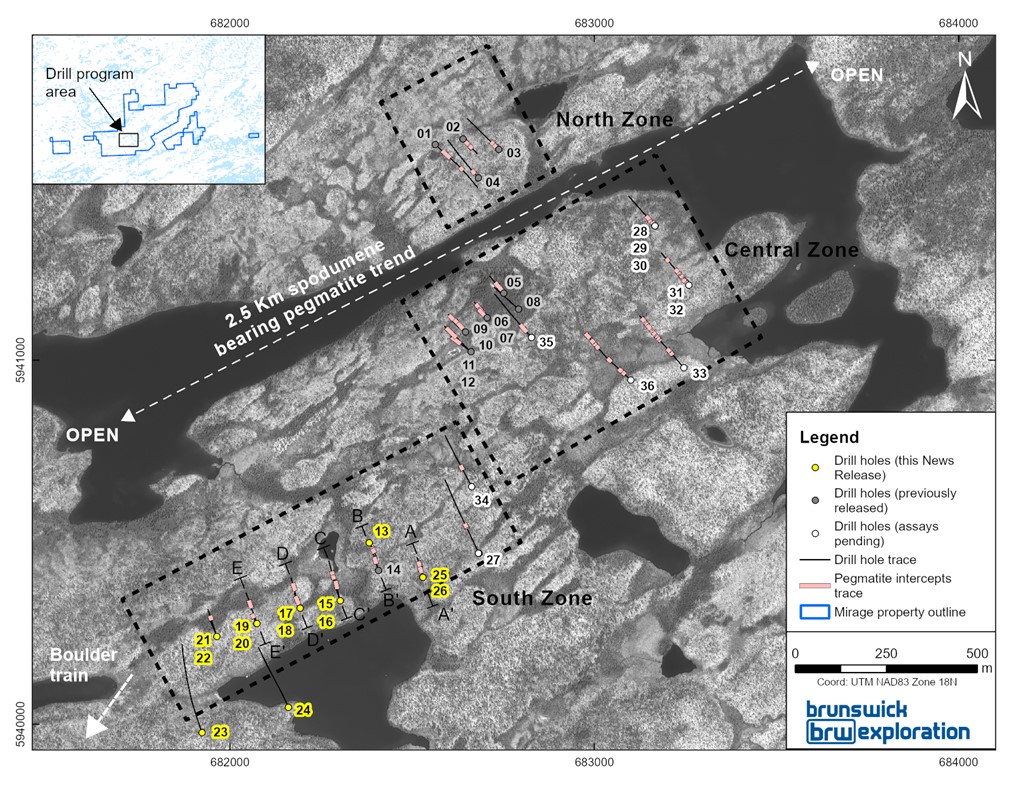
Brunswick Exploration (TSXV:BRW) has released new assay results from its ongoing drill program at the Mirage Project in the Eeyou Istchee-James Bay region of Quebec. The company has completed thirteen additional drill holes, primarily focusing on the South Zone of the project.
Mr. Killian Charles, President and CEO of BRW, commented: “The contiguous high-grade mineralization reported today at MR-4 is impressive. We have now traced the MR-4 pegmatite over a minimum length of 600 meters with all eleven holes returning significant lithium grades. Furthermore, two of the four pegmatites drilled and announced to date at Mirage exhibit high-grade mineralization with very coarse, pale grey, strongly fluorescent spodumene crystals that suggests potential for high-quality concentrates. I am very eager to begin our winter 2024 exploration campaign that will be designed to expand upon many of these significant intercepts while drill testing for new blind targets across this exciting property.”
In the South Zone, nine out of ten drill holes have encountered significant amounts of high-grade spodumene mineralization, with lithium oxide (Li2O) concentrations exceeding 2.0%. This mineralization is located within the MR-4 dyke. These results demonstrate consistent high-grade lithium values and continuity in both width and depth. The true thickness of the mineralization is estimated to be about 95% of the core length extracted from the drilling.
The MR-4 dyke has been drilled extensively, from the surface to depths just over 100 meters vertically. It stretches over a 600-meter strike length. The dyke is positioned at a stratigraphic contact point between metasediments and metabasalts, dipping southeast at an angle of around 45 degrees. Topographically, the dyke’s surface projection is marked by a narrow depression, with visible outcrops along parts of its length.
Two specific drill holes, MR-23-21 and MR-23-22, were located at the southwestern end of the current drilling program. While MR-23-21 intersected the dyke, MR-23-22 did not, which might indicate a potential pinch-out of the MR-4 dyke in this area. However, the discovery of a thin, mineralized dyke within the metabasalt suggests that the South Zone may still extend southwestward.
Two other drill holes, MR-23-23 and MR-23-24, were positioned 350 meters south of the initial pegmatite outcrop discovery for MR-4. These holes aimed to test the down-dip projection near the southwestern end but were halted before reaching their target areas. This was due to the conclusion of the fall drilling season. These holes are planned to be extended in the upcoming winter 2024 drilling campaign. The company’s exploration efforts indicate that the MR-4 dyke remains open for further exploration to the northeast and at greater depths.
Highlights from the results are as follows:
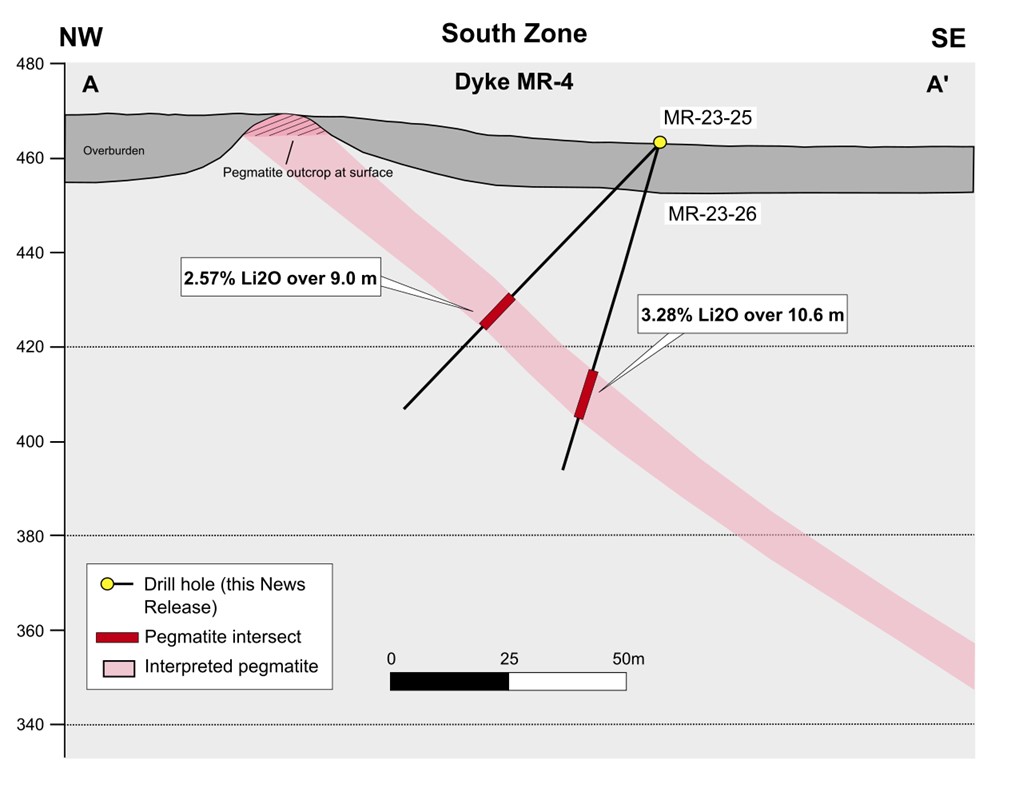
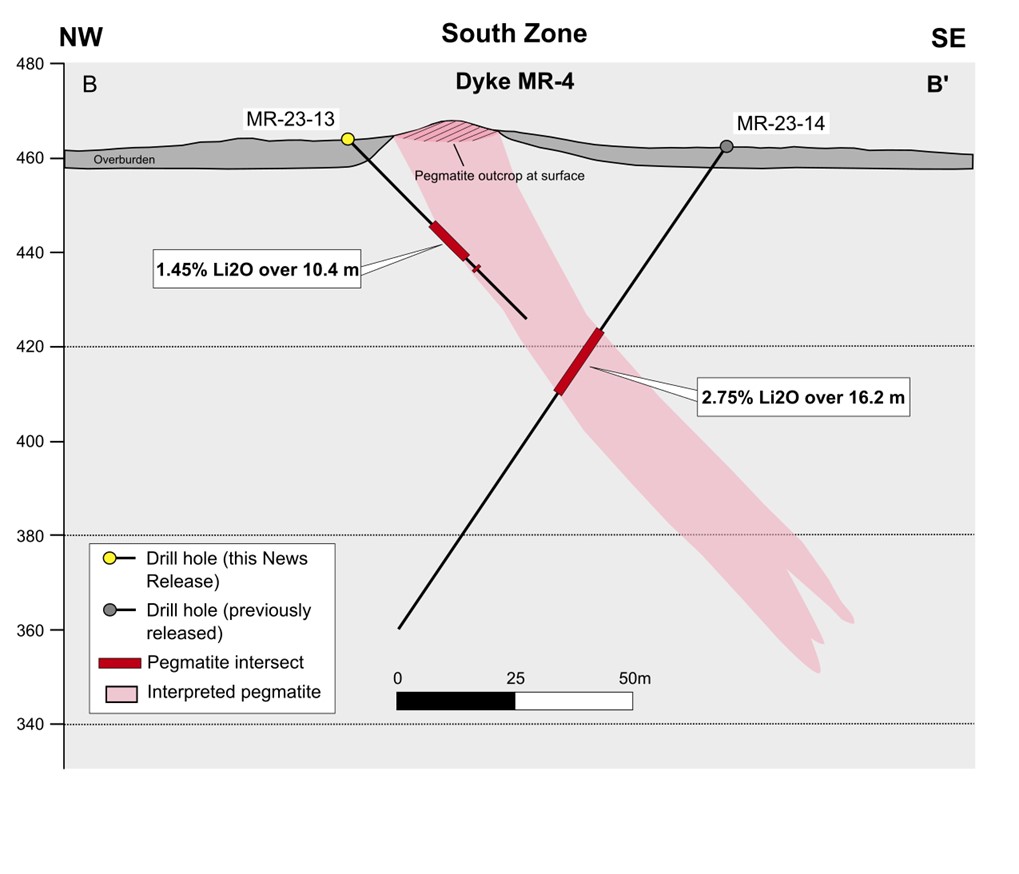
- Highest grade intercept reported to date at Mirage with 3.28% Li2O over 10.6 meters in drill hole MR-23-26 at a vertical depth of 50 meters.
- Shallow intercept of 2.92% Li2O over 14.0 meters in drill hole MR-23-19 at a vertical depth of 46 meters.
- 2.88% Li2O over 13.4 meters in drill hole MR-23-16 at a vertical depth of 86 meters.
- High-grade (>2.0% Li2O) mineralization has now been reported in 9 holes in MR-4 along the entire strike length drilled to date.
- MR-4 has been traced by drilling over a strike length of 600 meters and remains open to the northeast and at depth.
- Assays are pending for a further 10 drill holes (MR-23-27 to MR-23-36) completed during the fall 2023 program.
Table 1: Highlights from Maiden Drilling Program at MR-4
| Hole ID | Zone | Dyke | From (m) | To (m) | Length (m) | Li2O% | Ta2O5 (ppm) |
| MR-23-13 | South | MR-4 | 25.3 | 35.7 | 10.4 | 1.45 | 171 |
| MR-23-14* | South | MR-4 | 46.5 | 62.7 | 16.2 | 2.75 | 98 |
| MR-23-15 | South | MR-4 | 91.3 | 104.7 | 15.7 | 2.09 | 49 |
| MR-23-16 | South | MR-4 | 95.9 | 109.3 | 13.4 | 2.88 | 86 |
| MR-23-17 | South | MR-4 | 76.0 | 90.1 | 14.1 | 2.24 | 65 |
| MR-23-18 | South | MR-4 | 87.8 | 100.1 | 12.3 | 2.06 | 112 |
| MR-23-19 | South | MR-4 | 68.1 | 82.1 | 14.0 | 2.92 | 70 |
| MR-23-20 | South | MR-4 | 76.9 | 84.4 | 7.5 | 1.55 | 97 |
| MR-23-21 | South | MR-4A | 70.9 | 73.0 | 2.1 | 2.23 | 83 |
| MR-23-25 | South | MR-4 | 44.7 | 53.6 | 9.0 | 2.57 | 77 |
| MR-23-26 | South | MR-4 | 49.9 | 60.4 | 10.6 | 3.28 | 166 |
*Previously reported in December 4, 2023 press release.
The above references an opinion and is for information purposes only. It is not intended to be investment advice. Seek a licensed professional for investment advice. The author is not an insider or shareholder of any of the companies mentioned above.
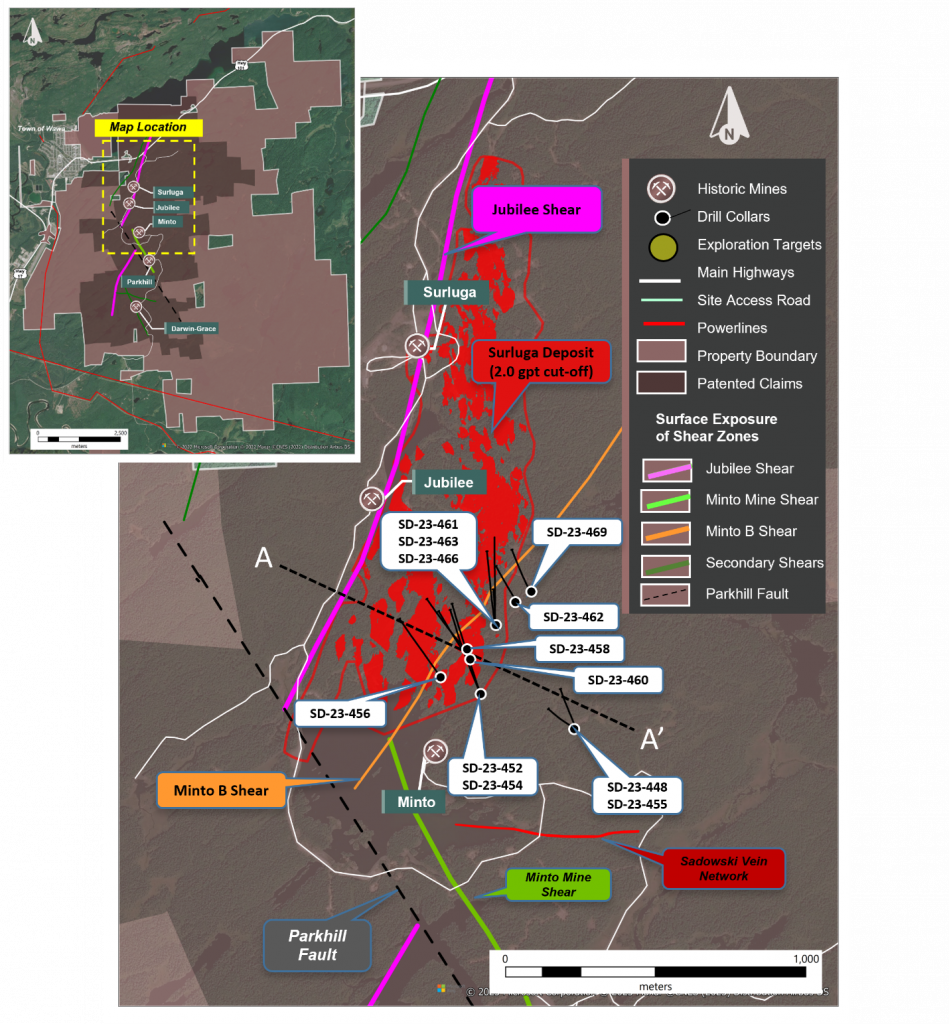
Red Pine Exploration (TSXV:RPX) shared new results from its ongoing exploration program. These results have demonstrated a significant expansion in the exploration potential at depth in the Jubilee Shear. The findings have broadened the known area of gold mineralization, filling in previously unexplored gaps within the existing Surluga resource.
Quentin Yarie, President and CEO of Red Pine Exploration commented in a press release: “The intersection of further continuous mineralization is a reminder of our continued positive results from our ongoing exploration program. As we expand our focus in the Jubilee Shear we remain on track for our revised resource in Q3 of 2024.”
Key discoveries include the intersection of notable gold mineralization in the Jubilee Shear, which lies outside the boundaries of the existing resource. One such intersection showed 3.80 grams per tonne (g/t) gold over a length of 36.94 meters. This included higher concentrations of 24.04 g/t gold over 1.71 meters and 46.9 g/t gold over 1.04 meters in drill hole SD-23-456. Further results revealed an extension of mineralization 370 meters down-dip from the existing resource and 400 meters north of the Surluga South discovery. In drill hole SD-23-448, gold was found at a rate of 5.33 g/t over 2.09 meters, approximately 80 meters north of another significant intersection in SD-23-455.
Additionally, the presence of a zone with significant gold mineralization has been supported at depth north of the Surluga South discovery. The findings also include an expansion of the mineralization footprint in the Minto B and Minto C Shear systems above the Jubilee Shear. Notable concentrations include 3.91 g/t gold over 3.90 meters in the Minto C Shear system (SD-23-452) and 1.27 g/t gold over 21.96 meters in a zone of Intrusion-Related Gold System (IRGS) mineralization within the Minto B Shear.
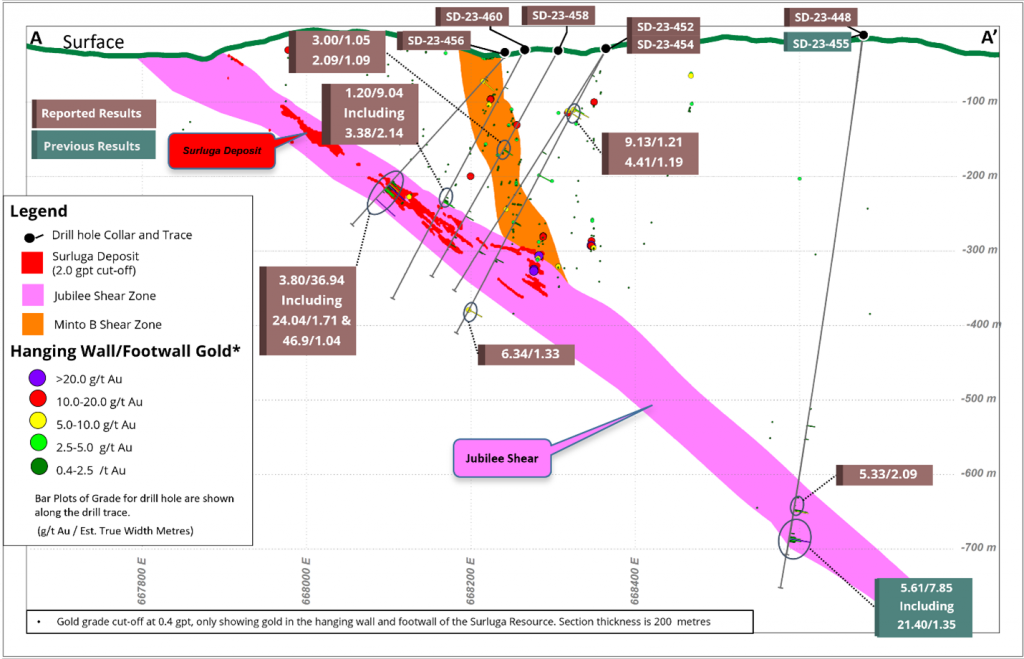
Regarding the ongoing exploration at the Wawa Gold Project, Red Pine is making progress in defining a new or revised resource. Currently, two drills are active on-site, producing about 3,750 meters of core per month. The drilling is focused on the hanging wall of the Jubilee Shear, covering the area of the 2019 resource. Efforts are also being made to explore gaps in the previous resource that were left unexamined.
The potential of finding significant mineralization in these previously unexplored areas has been confirmed by several noteworthy intersections. These include 9.57 g/t gold over 10.95 meters in SD-23-457, 8.01 g/t gold over 32.95 meters in SD-23-451, and 10.92 g/t gold over 28.05 meters in SD-23-442. Drilling is set to continue at the Wawa Gold Property through the summer and fall of 2024. Red Pine has a large number of samples from the exploration program awaiting analysis, with 5,711 samples currently pending assays.
Highlights from the results are as follows:
Table 1– Highlights from drilling in the Wawa Gold Corridor (Figure 1)
| Hole | From (m) | To | Length (m)* | Visible Gold | Gold (g/t) | Zone |
| (m) | ||||||
| SD-23-448 | 532.9 | 534.2 | 1.30 | 1.75 | ||
| 551.39 | 552.61 | 1.22 | 0.78 | |||
| 631.44 | 632.89 | 1.45 | 0.68 | Jubilee Shear | ||
| 649.49 | 651.58 | 2.09 | 5.33 | |||
| SD-23-452 | 100.01 | 103.91 | 3.90 | 3.91 | Minto C Shear | |
| Including | ||||||
| 102.7 | 103.91 | 1.21 | 9.13 | |||
| 212.48 | 213.57 | 1.19 | 4.41 | Minto B/Minto C Shear | ||
| 289.6 | 294.21 | 4.61 | 0.90 | Jubilee Shear | ||
| 352.58 | 357.63 | 5.05 | 0.91 | |||
| 439.67 | 441 | 1.33 | 6.34 | Lower Jubilee Shear | ||
| SD-23-454 | 188.79 | 190.76 | 1.97 | 0.82 | Minto B/Minto C Shear | |
| 366.1 | 375.08 | 8.98 | 0.43 | Jubilee Shear | ||
| 386.11 | 387.11 | 1.00 | 2.03 | |||
| SD-23-456 | 42.00 | 50.77 | 8.77 | 1.10 | Minto B Shear | |
| Including | ||||||
| 49.53 | 50.77 | 1.24 | 6.03 | |||
| 242.7 | 279.64 | 36.94 | VG | 3.80 | Jubilee Shear | |
| Including | ||||||
| 249.12 | 250.03 | 0.91 | VG | 5.21 | ||
| 251.85 | 253.56 | 1.71 | 24.04 | |||
| 256.29 | 257.45 | 1.16 | 15.00 | |||
| 278.6 | 279.64 | 1.04 | 46.9 | |||
| SD-23-458 | 155.95 | 164.52 | 8.57 | 0.71 | Minto B Shear | |
| Including | ||||||
| 160.15 | 161.2 | 1.05 | 3.00 | |||
| 267.51 | 268.6 | 1.09 | 2.09 | Jubilee Shear | ||
| 312.72 | 313.96 | 1.24 | 1.34 | |||
| SD-23-460 | 230.26 | 239.3 | 9.04 | 1.20 | Jubilee Shear | |
| Including | ||||||
| 237.16 | 239.3 | 2.14 | 3.38 | |||
| 338.3 | 339.49 | 1.19 | 1.68 | |||
| SD-23-461 | 160.29 | 161.45 | 1.16 | 1.49 | Minto B Shear | |
| 188.79 | 194.28 | 8.22 | 0.41 | |||
| 279.73 | 282.05 | 2.32 | 0.71 | Jubilee Shear | ||
| 297.04 | 303.99 | 6.95 | 2.07 | |||
| Including | ||||||
| 301.08 | 303.99 | 2.91 | 3.73 | |||
| SD-23-462 | 9.93 | 11.32 | 1.39 | 1.34 | ||
| 214.54 | 236.5 | 21.96 | 1.27 | HW IRGS / Minto B Shear | ||
| 260.52 | 263.5 | 2.98 | 0.43 | |||
| SD-23-463 | 60.93 | 67.18 | 6.25 | 0.70 | HW IRGS | |
| Including | ||||||
| 63.48 | 64.75 | 1.27 | 2.21 | |||
| 212.75 | 222.78 | 10.03 | 0.49 | Minto B Shear | ||
| 251.32 | 271.72 | 20.40 | 1.09 | |||
| 294.00 | 297.68 | 3.68 | 0.81 | |||
| SD-23-466 | 148.06 | 151.00 | 2.94 | 0.40 | Minto B Shear | |
| 169.68 | 174.94 | 5.26 | 0.39 | |||
| 186.04 | 198.15 | 12.11 | 0.65 | |||
| SD-23-469 | 187.66 | 195.47 | 7.81 | 0.43 | Minto B Shear | |
Assay results presented over core length. True width for the intersections varies between 50 to 95% depending on the intersected geological structure.
The above references an opinion and is for information purposes only. It is not intended to be investment advice. Seek a licensed professional for investment advice. The author is not an insider or shareholder of any of the companies mentioned above.
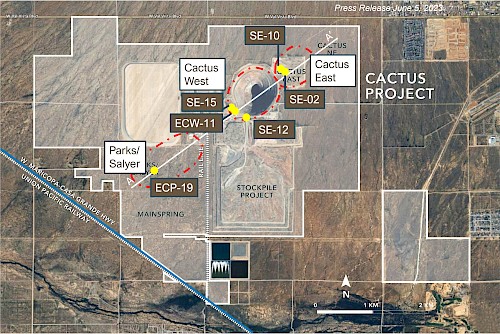
Arizona Sonoran Copper (TSX:ASCU) has announced a significant option to joint venture agreement with Nuton LLC, a subsidiary of the mining giant Rio Tinto. This agreement involves a strategic partnership focusing on the deployment of Nuton’s technologies at ASCU’s Cactus Mine and the Parks/Salyer Project in Arizona, USA.
Under this agreement, Nuton has been granted the exclusive option to acquire a 35% to 40% interest in ASCU’s Cactus Project. The agreement involves a total funding commitment of up to $33 million from Nuton, which includes an initial payment of $10 million and additional funding for various project costs.
George Ogilvie, President and CEO of ASCU commented in a press release: “We are delighted to announce this strategic joint venture transaction with Nuton. We welcome the expertise and financial support as we expand testing of Nuton’s heap leaching technologies, while concurrently advancing ASCU’s projects. Nuton’s column test results have demonstrated continued improvements in extraction rates from both the primary and enriched mineral resources, resulting in potentially more efficient operations. We look forward to advancing into Phase 2 testing, which includes an expanded understanding of the Nuton technologies’ economic benefits within a fully-integrated pre-feasibility study, anticipated by the end of 2024. The proposed heap leach and SXEW flowsheet utilizing Nuton is intended to build upon the strength of our standalone base case, utilizing the same infrastructure proving economies of scale. Nuton has indicated the potential to significantly increase copper cathode output from our current 45-50 ktpa target which could materially enhance project economics. Furthermore, we see this as a significant de-risking event for ASCU shareholders with up to US$33 million in non-dilutive near-term financing and the addition of a strong project partner for future financing and development.”
Adam Burley, CEO of Nuton LLC, also commented: “We are pleased to be advancing our strategic partnership with ASCU. Successful deployment of Nuton Technologies at Cactus and Park/Salyer has the potential to materially enhance the economic and environmental performance of the projects.”
ASCU, through its subsidiaries Arizona Sonoran Copper Company (USA) Inc. and Cactus 110 LLC, is set to collaborate with Nuton on a work program starting in the first quarter of 2024. This program aims to deliver a pre-feasibility study by the end of 2024, evaluating the integration of Nuton’s technologies into the Cactus Project.
A key aspect of this partnership is the formation of a Steering Committee, comprising representatives from both ASCU and Nuton. This committee will oversee the project’s execution scope. Additionally, Nuton will have the opportunity to nominate a member to ASCU’s Technical & Sustainability Committee and maintain observer rights based on a previous Investor Rights Agreement.
The agreement stipulates conditions under which Nuton can exercise its option to acquire a larger stake in the Cactus Project. These conditions include the project’s net present value (NPV) with Nuton technologies being significantly higher than without, and ASCU’s equity contribution to project capital costs remaining equal or lower compared to the standalone case.
Moreover, the agreement covers the potential incorporation of the Mainspring Property into the project. If this occurs and becomes material to ASCU, Nuton’s option to acquire a stake in the project would be adjusted accordingly, based on the comparative NPV of the project with and without the Mainspring Property.
In case Nuton exercises its option, it will pay the option exercise price, adjusted for any pre-payments and accrued interest, to ASCU’s subsidiary. The agreement also details the ownership percentages Nuton would hold based on the NPV multiples achieved.
Furthermore, the agreement includes provisions for the formation of a joint venture company and outlines scenarios in which Nuton can terminate the agreement or be repaid. This includes a clause that allows Nuton to convert certain payments into an exchangeable debenture, which can be settled in ASCU common shares, subject to stock exchange conditions and ownership limits.
ASCU will continue to act as the operator of the Cactus Project, maintaining the remaining equity interest in the joint venture corporation. This partnership marks a significant step in the advancement of ASCU’s Cactus Project, leveraging Nuton’s technologies to potentially enhance the project’s value and efficiency.
Highlights from the transaction are as follows:
- US$33 million in non-dilutive financing to ASCU
- Global Mining and Innovation Industry partner validates scalability of Cactus Project and Nuton’s confidence in enhancing project economics
Creating a Straightforward Mechanism for Significant Project Funding
- Endorses the Cactus Project through up to US$33 million in non-dilutive financing
- Creates a straightforward mechanism for significant project funding, designed to minimize ASCU’s future share of equity contributions to capital costs
- Commitment from Nuton to support the creation of a funding strategy for ASCU, which may include the provision of a completion guarantee for the Cactus Project or a performance guarantee related to the Nuton technologies
- Potential to improve per share returns to ASCU shareholders
Reduction of Execution Risks
- Establishes a framework for a joint-venture partnership with industry-leading technical and innovation leader to deliver value-enhancing project economics
- Potential to significantly increase attributable copper production per share
- Defines near-term project advancement strategy with the goal of delivering an Integrated Nuton Case PFS (defined below) by December 31, 2024
- Preserves long-term optionality for ASCU and outlines a clear path towards environmentally- friendly copper production in the USA, with a focus on Nuton’s positive impact pillars: water, energy, land, materials, and society
The above references an opinion and is for information purposes only. It is not intended to be investment advice. Seek a licensed professional for investment advice. The author is not an insider or shareholder of any of the companies mentioned above.
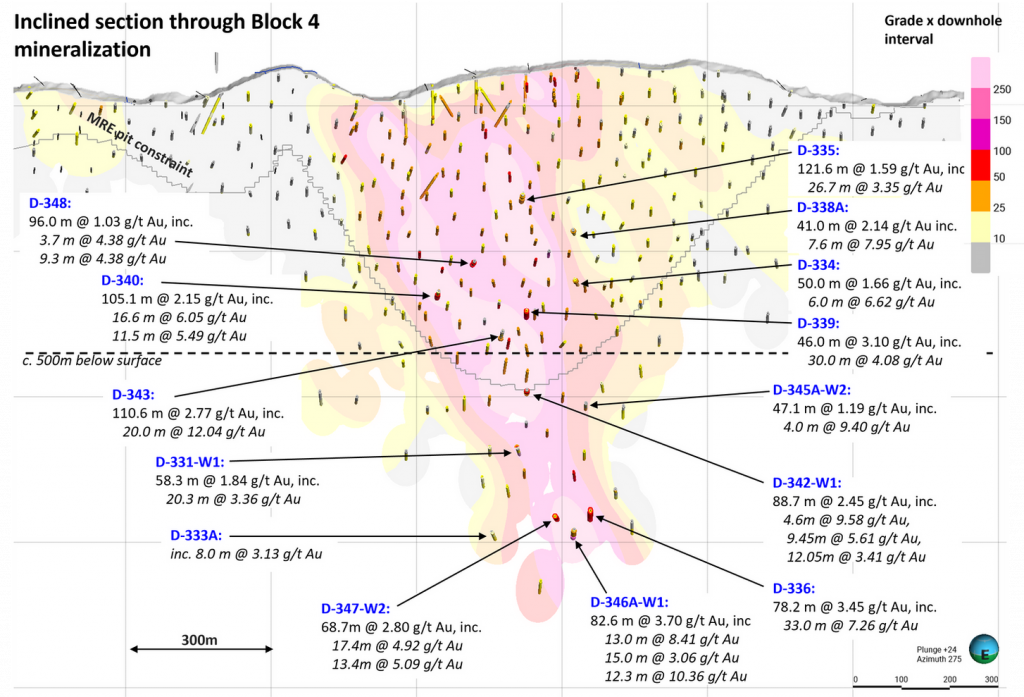
Reunion Gold’s (TSXV:RGD) Oko West gold project in Guyana continues to report further drill results, revealing both the extension of high-grade mineralization at depth and the strong consistency of the deposit within the established Mineral Resource Estimate (MRE) pit shell.
Rick Howes, President and CEO of Reunion Gold, commented in a press release: “We are pleased with the results of the deep drill program which continues to indicate that the high-grade zone that was identified within the MRE in Block 4, continues to a depth of at least 1000 meters and is open below that. We expect this resource expansion drill program to be completed early in 2024 and those results will be included in the resource. The resource will include both an updated pit constrained resource in the area above 500 m and an initial resource in the area down to a 1,000-meter depth. We remain on track to release a Preliminary Economic Assessment (“PEA”) in Q2/24, which will include this resource update and investigate the potential for a combined open pit and underground mining operation. We also continue to explore other areas of the Oko West prospecting license for potential satellite deposits.”
Deep Drilling Uncovers Significant High-Grade Intercepts
Drilling below the MRE pit shell delivered several notable results, highlighting the potential for resource expansion at greater depths. Hole D-336 intersected a remarkable 33 meters grading 7.26 g/t Au within a broader interval of 78.2 meters averaging 3.45 g/t Au, pushing high-grade mineralization down to approximately 805 meters. Hole D-346A-W1 further bolstered this excitement, encountering 13.0 meters of 8.41 g/t Au and 12.3 meters of 10.36 g/t Au within a broader 82.6-meter interval averaging 3.7 g/t Au, reaching a depth of approximately 820 meters. These are just two examples of the numerous high-grade intercepts reported across the deep drilling program, suggesting significant potential for further resource growth beyond the current MRE.
Resource Conversion Drilling Confirms Deposit Continuity Within Pit Shell
Drilling within the MRE pit shell also delivered positive results, confirming the strong continuity and consistency of the deposit within the planned mining area. Hole D-343 intersected a substantial 110.6 meters grading 2.77 g/t Au, while Hole D-340 returned an impressive 105.1 meters averaging 2.15 g/t Au. Holes D-335 and D-339 also contributed significant intercepts, further solidifying the confidence in the deposit’s continuity and potential within the established pit shell.
Development Studies Progressing Steadily
Reunion Gold is actively advancing several development-related initiatives at Oko West. Environmental and social baseline studies have been completed, with the second phase fieldwork finalized. The Environmental Permit application has been submitted to the relevant authorities, marking a crucial step in the permitting process. Terms of Reference for the comprehensive Environmental and Social Impact Assessment (ESIA) are expected to be finalized in Q4 2024.
Team Bolstered by New Country Manager Appointment
Further strengthening their commitment to Oko West’s development, Reunion Gold welcomes Bjorn Jeune as their Country Manager for Guyana. Bjorn brings extensive experience in the mining industry, particularly within Guyana, and will play a key role in overseeing the permitting process, public affairs, and community engagement initiatives.
Looking Ahead
With ongoing exploration success at depth and within the planned pit area, coupled with consistent progress on development studies and team expansion, Reunion Gold’s Oko West project continues to demonstrate immense potential. The coming months promise further exciting developments as the ESIA progresses and permitting discussions advance, paving the way for the project’s future success.
Highlights from the results are as follows:
- Highlights from the resource expansion drilling program beneath the June 2023 Mineral Resource Estimate (“MRE”) pit shell between approx. 500 m to 1,000 m include Holes: D-336 intersecting 33.0 m @ 7.26 g/t Au; D-346A-W1 intersecting 13.0 m @ 8.41 g/t Au and 12.3 m @ 10.36 g/t Au; and D-347-W2 intersecting 17.4 m @ 4.92 g/t Au and 13.4 m @ 5.09 g/t Au (all reported using a 1.5 g/t cutoff grade).
- Highlights from resource conversion drilling above approx. 500 m include Holes D-343 intersecting 110.6 m @ 2.77 g/t Au; D-340 intersecting 105.1 m @ 2.15 g/t Au; and D-342-W1 intersecting 88.7 m @ 2.45 g/t Au (all reported using a 0.3 g/t cutoff grade).
- Resource expansion drilling at depth below the MRE pit continues to indicate that the high-grade zone identified within the MRE in block 4 continues to a depth of at least 1000 meters.
Table 1 – Significant Intervals below the MRE in Block 4, from the expansion drilling program being carried out at depths below 500 m from surface.
| Hole ID | From (m) |
To (m) |
Downhole Interval (m) |
Au Grade (g/t) |
Grade x Downhole Interval (gm/t) |
ETT* (m) |
Cutoff ** (Au g/t) |
| OKWD23-331-W1 | 730.9 | 789.2 | 58.3 | 1.84 | 107.13 | 47.82 | 0.3 |
| inc. | 735.4 | 738.4 | 3.0 | 4.76 | 14.29 | 2.44 | 1.5 |
| inc. | 752.7 | 773.0 | 20.3 | 3.36 | 68.16 | 16.66 | 1.5 |
| OKWD23-333A | 893.0 | 962.4 | 69.4 | 0.67 | 46.77 | 55.25 | 0.3 |
| inc. | 893.0 | 901.0 | 8.0 | 3.13 | 25.01 | 6.26 | 1.5 |
| OKWD23-333A | 974.0 | 990.0 | 16.0 | 0.57 | 9.16 | 13.18 | 0.3 |
| OKWD23-336 | 778.8 | 857.0 | 78.2 | 3.45 | 269.80 | 56.49 | 0.3 |
| inc. | 804.3 | 807.3 | 3.0 | 3.09 | 9.28 | 2.15 | 1.5 |
| inc. | 814.0 | 847.0 | 33.0 | 7.26 | 239.58 | 23.97 | 1.5 |
| OKWD23-341-W1 | 743.5 | 773.1 | 29.7 | 0.94 | 28.01 | 23.43 | 0.3 |
| OKWD23-341-W1 | 804.6 | 822.3 | 17.7 | 0.32 | 5.60 | 14.24 | 0.3 |
| OKWD23-342-W1 | 673.3 | 762.0 | 88.7 | 2.45 | 217.13 | 83.78 | 0.3 |
| inc. | 677.3 | 687.0 | 9.7 | 3.14 | 30.47 | 9.06 | 1.5 |
| inc. | 693.8 | 698.1 | 4.3 | 2.47 | 10.50 | 4.03 | 1.5 |
| inc. | 701.4 | 706.0 | 4.6 | 9.58 | 44.08 | 4.33 | 1.5 |
| inc. | 718.6 | 728.0 | 9.5 | 5.61 | 53.05 | 8.88 | 1.5 |
| inc. | 732.7 | 744.7 | 12.1 | 3.41 | 41.05 | 11.36 | 1.5 |
| OKWD23-345A-W2 | 582.0 | 614.5 | 32.5 | 0.69 | 22.41 | 27.84 | 0.3 |
| inc. | 592.0 | 598.0 | 6.0 | 1.87 | 11.21 | 5.14 | 1.5 |
| OKWD23-345A-W2 | 663.0 | 710.1 | 47.1 | 1.19 | 55.96 | 40.61 | 0.3 |
| inc. | 664.0 | 668.0 | 4.0 | 9.40 | 37.61 | 3.44 | 1.5 |
| OKWD23-346A-W1 | 785.6 | 819.3 | 33.7 | 0.54 | 18.21 | 26.64 | 0.3 |
| OKWD23-346A-W1 | 861.0 | 943.6 | 82.6 | 3.70 | 305.58 | 66.23 | 0.3 |
| inc. | 861.0 | 864.0 | 3.0 | 3.12 | 9.35 | 2.39 | 1.5 |
| inc. | 876.7 | 889.7 | 13.0 | 8.41 | 109.36 | 10.39 | 1.5 |
| inc. | 897.0 | 912.0 | 15.0 | 3.06 | 45.84 | 12.03 | 1.5 |
| inc. | 916.0 | 928.3 | 12.3 | 10.36 | 127.49 | 9.93 | 1.5 |
| OKWD23-347-W2 | 970.5 | 1039.2 | 68.7 | 2.80 | 192.51 | 64.75 | 0.3 |
| inc. | 994.6 | 1012.0 | 17.4 | 4.92 | 85.56 | 16.39 | 1.5 |
| inc. | 1015.6 | 1029.0 | 13.4 | 5.09 | 68.26 | 12.68 | 1.5 |
| OKWD23-352 | 770.0 | 781.0 | 11.0 | 0.64 | 7.02 | 8.34 | 0.3 |
| OKWD23-352 | 813.0 | 834.0 | 21.0 | 0.35 | 7.27 | 16.74 | 0.3 |
Table 2 – Significant Intervals within Block 4, from the infill drilling program being carried out at depths less than 500 m below surface.
| Hole ID | From (m) |
To (m) |
Downhole Interval (m) |
Au Grade (g/t) |
Grade x Downhole Interval (gm/t) |
ETT* (m) |
Cutoff ** (Au g/t) |
| OKWD23-334 | 359.9 | 374.7 | 14.8 | 0.32 | 4.69 | 12.70 | 0.3 |
| OKWD23-334 | 410.0 | 460.0 | 50.0 | 1.66 | 82.92 | 42.93 | 0.3 |
| inc. | 420.0 | 426.0 | 6.0 | 2.89 | 17.33 | 5.15 | 1.5 |
| inc. | 452.0 | 458.0 | 6.0 | 6.62 | 39.70 | 5.16 | 1.5 |
| OKWD23-335 | 143.0 | 264.6 | 121.6 | 1.59 | 193.13 | 98.40 | 0.3 |
| inc. | 143.0 | 158.0 | 15.0 | 2.01 | 30.22 | 11.89 | 1.5 |
| inc. | 182.0 | 190.0 | 8.0 | 2.22 | 17.79 | 6.42 | 1.5 |
| inc. | 226.0 | 229.8 | 3.8 | 3.06 | 11.62 | 3.11 | 1.5 |
| inc. | 235.9 | 262.6 | 26.7 | 3.35 | 89.49 | 21.89 | 1.5 |
| OKWD23-338A | 274.0 | 300.5 | 26.5 | 0.70 | 18.43 | 24.28 | 0.3 |
| OKWD23-338A | 327.0 | 368.0 | 41.0 | 2.14 | 87.94 | 37.59 | 0.3 |
| inc. | 329.0 | 333.0 | 4.0 | 1.89 | 7.54 | 3.67 | 1.5 |
| inc. | 356.4 | 364.0 | 7.6 | 7.95 | 60.20 | 6.97 | 1.5 |
| OKWD23-339 | 398.0 | 425.0 | 27.0 | 0.79 | 21.42 | 22.68 | 0.3 |
| inc. | 399.0 | 404.0 | 5.0 | 1.88 | 9.40 | 4.19 | 1.5 |
| OKWD23-339 | 439.0 | 485.0 | 46.0 | 3.10 | 142.40 | 39.09 | 0.3 |
| inc. | 439.0 | 442.0 | 3.0 | 2.43 | 7.28 | 2.54 | 1.5 |
| inc. | 447.0 | 477.0 | 30.0 | 4.08 | 122.33 | 25.49 | 1.5 |
| OKWD23-340 | 386.7 | 491.8 | 105.1 | 2.15 | 225.69 | 88.92 | 0.3 |
| inc. | 444.9 | 461.5 | 16.6 | 6.05 | 100.14 | 14.05 | 1.5 |
| inc. | 464.5 | 476.0 | 11.5 | 5.49 | 63.14 | 9.75 | 1.5 |
| OKWD23-343 | 419.8 | 530.4 | 110.6 | 2.77 | 306.86 | 85.95 | 0.3 |
| inc. | 425.0 | 428.0 | 3.0 | 2.76 | 8.27 | 2.29 | 1.5 |
| inc. | 489.0 | 493.8 | 4.8 | 3.39 | 16.27 | 3.77 | 1.5 |
| inc. | 503.0 | 523.0 | 20.0 | 12.04 | 240.72 | 15.89 | 1.5 |
| OKWD23-348 | 349.0 | 445.0 | 96.0 | 1.03 | 98.56 | 88.56 | 0.3 |
| inc. | 399.3 | 403.0 | 3.7 | 4.38 | 16.19 | 3.42 | 1.5 |
| inc. | 414.0 | 423.3 | 9.3 | 4.38 | 40.72 | 8.59 | 1.5 |
The above references an opinion and is for information purposes only. It is not intended to be investment advice. Seek a licensed professional for investment advice. The author is not an insider or shareholder of any of the companies mentioned above.
Arizona Sonoran Copper (TSX:ASCU) recently shared updates on their metallurgical testing from the Nuton Phase 1 column leach program at the Cactus copper porphyry project in Arizona. This testing forms part of the company’s evaluation of new technologies for copper extraction.
George Ogilvie, Arizona Sonoran Copper Company President and CEO commented in a press release: “We are encouraged by the extraction rates resulting from our primary and secondary sulphides using the Nuton™ technologies. These results demonstrate a continued extraction rate improvement from the columns reported in June. Nuton’s heap leaching technology is a potential solution to gain access to our currently stranded primary mineral resource while also incrementally improving the copper extraction rates from the enriched material. Particularly interesting to ASCU, is that Nuton’s flow sheet could be integrated into the planned Cactus heap leach and SXEW flow sheet. With a successfully negotiated Commercial Framework Agreement in place and a completed Phase 1 test program, we would seek to coordinate the improved extraction rates into an updated and expanded technical study, complementing the base case PFS anticipated in Q1 2024 and demonstrating economies of scale.”
The first phase of the program focused on assessing the efficiency of using Nuton’s proprietary additives in extracting copper from both primary and enriched sulphides at the Cactus site. The tests experimented with various operating conditions, such as temperature variations and different additive combinations. Following the Phase 1 results, ASCU and Nuton are considering moving to Phase 2, which aims to address the challenges and opportunities identified in the initial phase.
The Cactus deposit underwent 23 small-scale column leach tests, covering 10 different ore types and a Life of Asset (LoA) Blend. Early results suggest that Nuton additives, particularly at higher temperatures, could significantly improve chalcopyrite extraction in both the LoA blend and other primary sulphide ores. The highest copper extraction rate recorded for the LoA Blend was 80%. Efforts are ongoing to optimize conditions, especially temperature, to consistently exceed this extraction rate.
Acid consumption for processing primary sulfide ores varied widely, from 10 to 60 kilograms per tonne. For ores with higher acid consumption, adjusting the pH level showed mixed results, reducing acid use but also slowing down copper extraction. Nuton plans to continue its analysis, focusing on residue samples for additional insights. Extraction rates for secondary sulfide dominant ore types were notably high, ranging from 86% to 98%, attributed to the low reactive gangue content in these ores, making them net acid generators.
Highlights from the results are as follows:
- Phase 1: Indicative, interim results available at the end of November 2023, for first 15 small (3 ft | 1 m) columns completed:
- Targeting an average life of asset (“LoA”) copper extraction rate of 80% from the Cactus area material
- Primary sulphide as dominant material copper extractions at elevated temperatures range from 80% to 85%
- Secondary sulfide (“enriched”) as dominant material copper extraction at elevated temperatures range from 85% to +95%
- Phase 1: Next steps
- To conduct small column tests (3 ft | 1 m) on a Parks/Salyer primary blend and a mixed enriched blend sample
- Phase 2: Next Steps
- Metallurgical program contingent upon advancing a Commercial Framework agreement with Nuton
- To include tall column tests (30 ft | 10 m) on Cactus mineralized material to mitigate or test threats/opportunities identified under the Phase 1 test program
TABLE 1: Copper Extraction and Acid Consumption Estimates by Material Type
|
|
ASCU |
NUTON™ |
||||
|
|
Programs updated Feb 2022 and May 2023 |
Preliminary Column Data, updated November 2023 |
||||
|
Mineral Resource Location |
Net Copper Extraction (% Cu AS) |
Net Copper Extraction (% CuCN) |
Blended Extraction (%) |
Net Acid Consumption (kg/tonne) |
Extraction (%) |
Net Acid Consumption (kg/tonne) |
|
Oxides |
||||||
|
Stockpile |
90% 1 |
40% 1 |
81% |
81 |
n/a |
|
|
Cactus West |
92% 1 |
73% 1 |
88% |
81 |
|
|
|
Cactus East |
92% 1 |
73% 1 |
90% |
81 |
|
|
|
Parks Salyer |
|
|
|
|
|
|
|
Enriched (Secondary Sulphide) |
||||||
|
Cactus West |
92% 1 |
73% 1 |
78% |
(-) 5 |
86% – 98% |
-5 – 15 |
|
Cactus East |
92% 1 |
73% 1 |
76% |
(-) 5 |
86% – 98% |
-5 – 15 |
|
Parks Salyer |
|
|
80% |
(-) 5 |
80% |
-5 – 15 |
|
Primary Sulphides |
||||||
|
Flotation (ASCU) |
|
|
86% 2 |
(-) 5 |
n/a |
|
|
Leaching (Nuton) |
|
|
|
|
80% – 85% 3 |
10 – 45 |
|
Blended (Primary and Secondary Sulphide) |
||||||
|
Flotation (ASCU)/ |
|
|
91% 2 |
(-) 5 |
n/a |
|
|
Leaching (LoA) (Nuton) |
|
|
|
|
86% – 95% 4 |
25 – 404 |
|
1 As reported on February 23, 2022, Arizona Sonoran Updates on Metallurgical improvements at the Cactus Mine Project, acid consumption converted to kg/tonne from lbs/ton for comparison purposes |
||||||
|
2 Initial flotation results from 2022 testing program |
||||||
|
3 Excludes ASC 6 (ECW-011) that has anomalous high Biotite content (See Phase 2 workplan) |
||||||
|
4 Excludes column ASC 6 (ECW-011) that has anomalous high Biotite content and low temperature (See Phase 2 workplan) |
||||||
|
5 Net acid consumption is either nil or net generating |
||||||
The above references an opinion and is for information purposes only. It is not intended to be investment advice. Seek a licensed professional for investment advice. The author is not an insider or shareholder of any of the companies mentioned above.
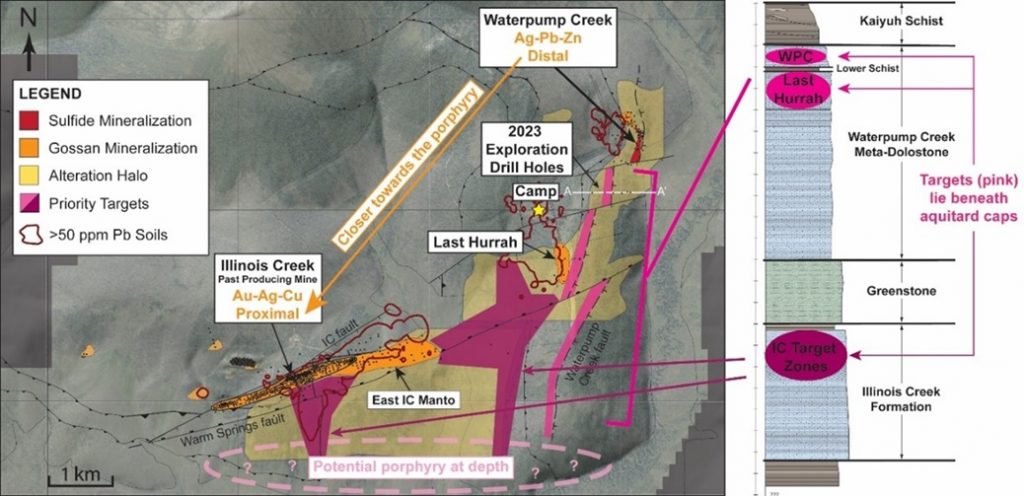
Western Alaska Minerals (TSXV:WAM) recently completed its 2023 exploration activities at the Illinois Creek Carbonate Replacement Deposit (CRD) project, which it wholly owns. Located in central Alaska, the project encompasses approximately 30,000 hectares.
CEO Kit Marrs commented in a press release: “It is rare for a junior exploration company to control, in a stable mining jurisdiction, an entire, intact system of this scale, that even at this early stage is showing the hallmarks of a well-mineralized CRD system. It took several tries with the drill bit at WPC, but once we intercepted the exceptionally high-grade silver-lead-zinc sulfides there, it took just two seasons of drilling to flesh out a substantial zone, justifying the calculation of an initial mineral resource estimate. Results to date suggest that WPC is just the fingertip of a 6 km-long mineralized trend that runs back to Illinois Creek, of which only 8% has been drill tested to date. With our updated understanding of the system, we are excited to be zeroing in at Last Hurrah and continuing to trace high-grade mineralization back towards Illinois Creek.”
The site includes a six-kilometer corridor of CRD-style alteration, structural features, and stratigraphy favorable for mineral deposits. This corridor connects the previously mined Illinois Creek Mine, known for gold and silver deposits, with the Waterpump Creek massive sulfide CRD deposit, rich in silver, lead, and zinc.
In 2023, WAM focused its drilling efforts on two areas: Waterpump Creek and the Last Hurrah target area. At Waterpump Creek, five drill holes totaling 1,706 meters aimed to expand the known high-grade sulfide mineralization. The most notable outcome was from drill hole WPC23-30, which intersected significant mineralization, including 40.2 meters with high concentrations of silver, lead, and zinc.
The exploration then shifted to the Last Hurrah area, located 700 meters south across a fault line. This site, based on geophysical surveys and previous drilling, was believed to be part of the mineralized corridor. Nine drill holes totaling 3,412 meters were completed here, encountering broad zones of CRD alteration and dispersed mineralization. Two of these holes indicated the potential for mineralization in deeper limestone units, suggesting new avenues for exploration across the property.
The company’s technical team is integrating these findings into an enhanced district model, which is being prepared for the next drilling season. This model also includes a reinterpretation of the geophysics.
WAM’s exploration results support the theory of a continuous and intensifying pattern of CRD-style mineralization and alteration extending south and west. This pattern aligns with the district’s zonation, transitioning from low-temperature silver-zinc-lead mineralization at Waterpump Creek to higher-temperature copper-gold-silver deposits at Illinois Creek.
Additional exploration at the Last Hurrah area in 2023 revealed strong CRD alteration in most drill holes, with fugitive carbonate veins indicative of proximity to mineralization. Geophysical surveys suggested an increase in the alteration’s extent toward the Illinois Creek mine. However, no massive sulfides were intersected in this area.
A comprehensive 3-D resistivity and induced polarization survey conducted over Waterpump Creek and Last Hurrah target areas by DIAS Geophysical highlighted key structural and stratigraphic controls of CRD mineralization. The survey also identified distinct fault structures, including a potential north-south fault that could be controlling the mineralizing fluids.
The 2023 drilling program at Waterpump Creek, comprising five holes totaling 1,706 meters, yielded significant results. These included high-grade silver-lead-zinc infill and expansion, with notable intercepts in multiple drill holes. This data is contributing to a preliminary NI 43-101 compliant resource estimate, expected to be published in early 2024.
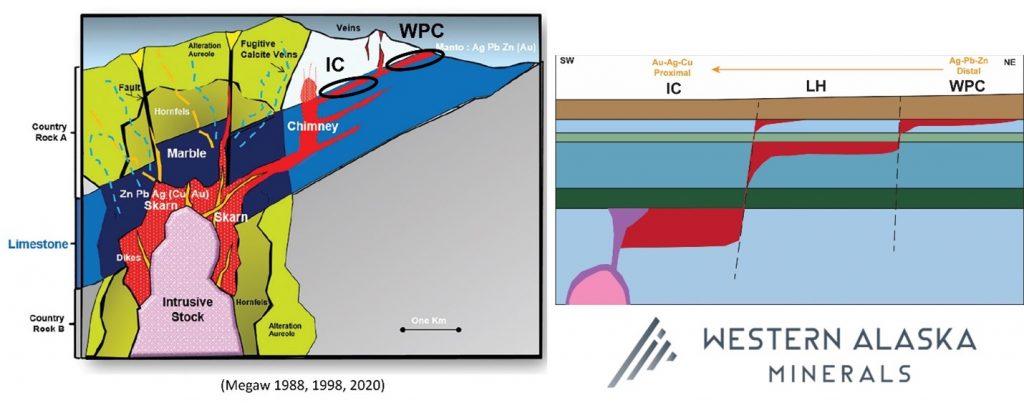
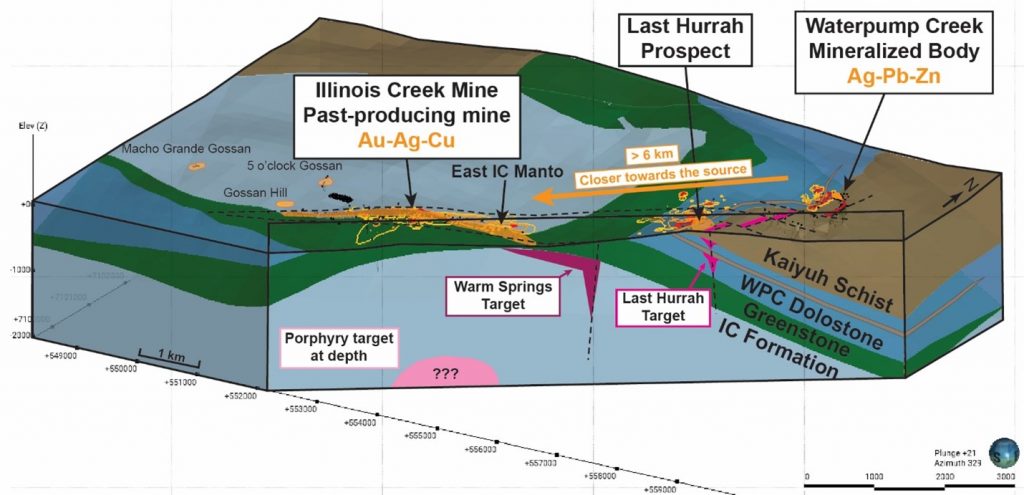
Highlights from the results are as follows:
- In-fill and additional high-grade intercepts from step-out drilling at Waterpump Creek were completed, adding 45 meters to the mineralization trend, allowing for an initial NI 43-101 complaint resource estimate, anticipated in Q1 2024.
- Exploration drilling at Last Hurrah yielded strong CRD alteration which correlates with both the 2005 and 2023 modelled geophysics (Figures 1,3, and 4). More importantly, the alteration and anomalous geochemistry occur in two separate stratigraphic units, effectively doubling the exploration potential.
- The 2023 and prior drilling results now indicate that three carbonate units exist, separated by impermeable or unreactive units, and a progressive southwesterly shift of mineralization focus from the uppermost carbonate at WPC, through the middle unit at LH and the deepest known unit at Illinois Creek (Figure 2).
- This new geologic recognition, combined with advanced remodeling of the eleven square-kilometer high-resolution 3D geophysical survey covering both WPC and Last Hurrah, is helping to determine the structural and stratigraphic controls on mineralizing fluid migration from the probable porphyry source near the Illinois Creek Mine, through Last Hurrah to WPC (Figure 3).
The above references an opinion and is for information purposes only. It is not intended to be investment advice. Seek a licensed professional for investment advice. The author is not an insider or shareholder of any of the companies mentioned above.
Solaris Resources (TSX:SLS) (OTCQB:SLSSF) has announced finalized agreements with Orion Mine Finance Management LP for a funding package totaling US$80 million, aimed at supporting the development of the Warintza Project in Ecuador through studies and permitting.
The financing package is diverse, consisting of several components. Firstly, there is a senior secured debt facility amounting to US$60 million, known as the Senior Loan. This loan has a term of four years and notably does not include any hedging conditions. The drawdown of this loan will occur in three stages, each linked to specific milestones. The initial tranche of US$30 million is expected to close soon, followed by a US$15 million drawdown contingent on the submission of an Environmental Impact Assessment (EIA), and another US$15 million upon the publication of a Pre-Feasibility Study (PFS) for the Warintza Project.
Additionally, the agreement includes an offtake arrangement with a buyback provision, under which Orion will purchase 20% of the metals produced from the Warintza Project for 20 years starting from the commencement of production. This offtake is subject to a buyback clause in certain change of control scenarios.
Mr. Richard Warke, Executive Chairman, commented in a press release: “This financing package funds the advancement of Warintza through studies and permitting, leading to a substantially de-risked Project. This is a very special asset that has the potential to create tremendous long-term value for all stakeholders as it unlocks one of the last remaining major greenfield copper districts at low elevation and adjacent to infrastructure in the entire mining industry.”
The funding package also incorporates an equity component. Orion has agreed to subscribe to US$10 million of Solaris’ common shares at a price of C$5.11 each, which is the closing price as of November 6, 2023, prior to the initial announcement. There is also a commitment for an additional US$10 million in equity financing, which Solaris can call upon later under specific conditions.
The net proceeds from this financing will be utilized to advance the Warintza Project. This includes funding for exploration and infill drilling, technical and environmental programs and studies, permitting processes, community social relations programs, and general and working capital needs.
Solaris Resources is an exploration company with a focus on developing its portfolio of copper and gold assets in the Americas. The Warintza Project, located in Ecuador, is its flagship project and is recognized as a large-scale resource with significant potential for expansion and discovery.
The above references an opinion and is for information purposes only. It is not intended to be investment advice. Seek a licensed professional for investment advice. The author is not an insider or shareholder of any of the companies mentioned above.
Ximen Mining Corp. (TSXV:XIM) has released preliminary data from its seventh drill hole at the Amelia Gold project in Camp McKinney near Rock Creek, southern British Columbia. This drilling effort is part of the company’s initiative to explore extensions to the historic Cariboo-Amelia gold mine in the Greenwood Mining Division, BC.
The Cariboo-Amelia mine, recognized as BC’s first dividend-paying gold mine, has a notable production history. Over 68 years, it yielded 81,602 ounces of gold and 32,439 ounces of silver from 112,254 tonnes of ore, according to BC Minfile Records. The mine is located within a 4-kilometer network of gold-quartz veins and historical mining operations.
In 2023, Ximen Mining’s drilling focused on the McKinney vein below the eastern end of the historic mine. To date, seven drill holes have been completed, totaling 1,846 meters of NQ sized core drilling. The target vein was intersected in four of these holes (AM23-01, 03, 05, and 07) at depths of 30 to 45 meters below the mine’s lowest level and over a strike length of 150 meters.
The mineralized sections found in these cores range from 0.26 to 0.70 meters in length. They contain a mix of pyrite, sphalerite, galena, and chalcopyrite. Although no visible gold has been identified, the sulphide mineral assemblage mirrors that historically mined from the vein. The cores are set to be analyzed following geological logging and sampling.
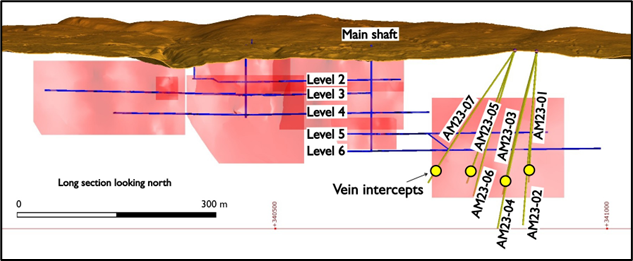
Additionally, holes AM23-03, 04, and 05 revealed a second mineralized vein approximately 50 meters south of the main vein, also containing pathfinder minerals. The full extent of this vein is yet to be established.
Other drilling efforts, specifically in holes AM23-02, 04, and 06, aimed at deeper zones, did not intersect the vein. It is suspected that faults similar to those in the upper mine levels, where the vein is slightly displaced to the south, may have affected these areas.
The results suggest the possibility of additional mineable material below the lowest level of the historic mine and in parallel zones.
Ximen Mining Corp. wholly owns three precious metal projects in southern BC, including the Amelia Gold Mine, the Brett Epithermal Gold Project, and the Treasure Mountain Silver Project, which is adjacent to the previously operational Huldra Silver Mine. The Treasure Mountain Silver Project is currently under an option agreement, with the partner responsible for annual payments and project development. Ximen also controls the Kenville Gold mine near Nelson, BC, which includes surface and underground rights, buildings, and equipment.
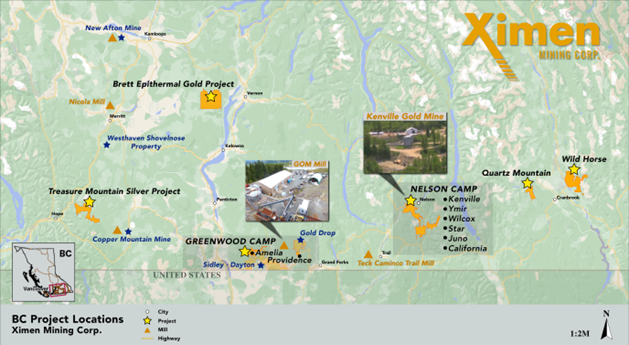
Highlights from the results are as follows:
| Hole | From | To | Length (m) | Mineralization |
| AM23-01 | 218.02 | 218.63 | 0.61 | Quartz Vein with Py, Sp, Gn, Cp |
| AM23-03 | 230.80 | 231.06 | 0.26 | Quartz Vein with Py, Sp, Gn, Cp |
| AM23-05 | 214.55 | 215.25 | 0.70 | Quartz Vein with Py, Sp, Cp |
| AM23-07 | 194.60 | 194.81 | 0.21 | Quartz Vein with Py, Sp, Gn |
| AM23-07 | 195.71 | 195.99 | 0.28 | Quartz Vein with Py, Po, Sp, Gn |
| AM23-07 | 215.47 | 215.66 | 0.19 | Quartz Vein with Py, Sp, Gn |
| AM23-07 | 217.64 | 217.76 | 0.32 | Quartz Vein with Py, Po, Sp, Gn |
Abbreviations: Py: pyrite, Sp: sphalerite, Gn: galena, Cp: chalcopyrite
Note: Reported lengths are core lengths not true widths.
The above references an opinion and is for information purposes only. It is not intended to be investment advice. Seek a licensed professional for investment advice. The author is not an insider or shareholder of any of the companies mentioned above.
Defense Metals (TXV:DEFN) has successfully completed the Phase 2 open pit diamond core and sonic infrastructure geotechnical drilling program at its Wicheeda Rare Earth Element (REE) Project near Prince George, Canada. This phase of drilling was conducted in collaboration with APEX Geoscience Ltd., under the guidance of SRK Consulting (Canada) Inc., a key consultant for the project’s ongoing preliminary feasibility study (PFS).
Craig Taylor, CEO of Defense Metals, commented in a press release: “We are pleased to have completed Phase 2 geotechnical programs and are encouraged that open pit geotechnical drilling has intersected significant widths of REE mineralized carbonatite within the western pit wall not previously known. Given the success of the prior ground radiometric surveys, the Company commissioned a 45 square-km airborne geophysical survey surrounding the Wicheeda REE Deposit, which we are now interpreting to guide property-wide exploration efforts. The ongoing Wicheeda Project PFS study remains on target for completion at the end of Q2 2024, and the data gathered as part of this drilling campaign will provide key inputs to inform the open pit slope design work by SRK.”
The company also engaged Precision GeoSurveys Inc. to conduct a 503 line-kilometre airborne magnetic and radiometric survey across 45 square kilometres of the Wicheeda Project. The collected data is currently being analyzed by Defense Metals’ technical team to identify exploration targets, with findings to be disclosed in due course.
Key accomplishments of the Phase 2 drilling program and future plans include:
– The drilling of six diamond drill holes, totalling 1,182 meters, within the Wicheeda REE Deposit pit shell. This includes four open pit geochemical drill holes (920 meters in total) and two near-mine exploration holes (262 meters in total).
– The south and west pit wall drill holes (WI23-81 and WI23-82) encountered significant widths of visibly REE mineralized dolomite carbonatite. The drill holes yielded core intervals of 54 meters and 21 meters, followed by a 65-meter core interval of xenolithic-dolomite carbonatite, respectively. The drilling of WI23-82 was particularly noteworthy for testing a new ground radiometric anomaly. Assay results from these drillings are pending.
– Completion of nine sonic overburden drill holes (160 meters in total) and 14 test pits (62 meters in total) for subsurface characterization. These will aid in planning for potential future infrastructure such as waste rock storage, mineralization stockpile, contact water pond, crusher, processing plant, and tailings storage facility locations.
– Preparation for the final Phase 3 sonic overburden and test pit campaign, involving 10 sonic overburden drill holes and 3 test pits, is underway. This phase is expected to be completed within four weeks.
Additionally, mineralized drill core samples from the Phase 2 pit geotechnical campaign have been sent to ALS Global in North Vancouver for analysis, with results anticipated in the coming months.
Defense Metals has also announced the appointment of Alex Heath as Vice President of Corporate Development. Mr. Heath holds a Bachelor of Commerce with honors from the University of British Columbia and is a Chartered Financial Analyst (CFA) Charterholder. His experience includes eight years at Salman Partners, where he served as Vice-President of Investment Banking, specializing in mining financings and merger and acquisition transactions. Since 2019, he has been part of the Discovery Group as a Strategic Advisor in Corporate Development and Investor Relations. Heath also serves as a director for several public mining companies.
The above references an opinion and is for information purposes only. It is not intended to be investment advice. Seek a licensed professional for investment advice. The author is not an insider or shareholder of any of the companies mentioned above.
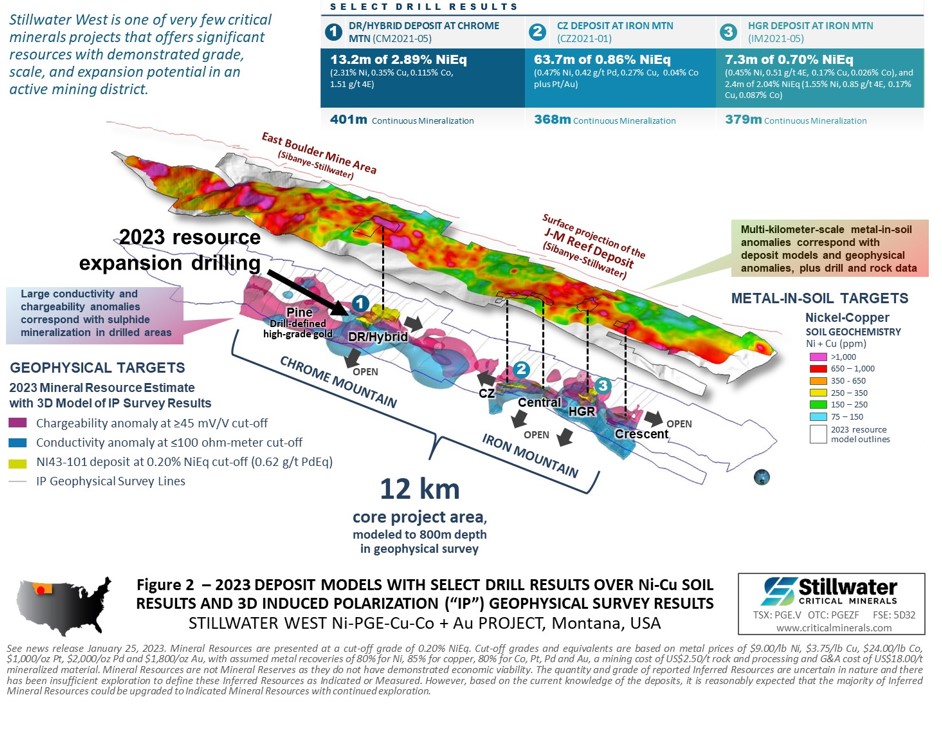
Stillwater Critical Minerals (TSXV:PGE) recently reported an updated on its 2023 diamond drilling activities at its flagship Stillwater West Ni-PGE-Cu-Co + Au project in Montana. The focus of the 2023 drill campaign was to expand the NI 43-101-compliant resources, initially announced on January 25, 2023. This expansion was particularly concentrated on the recent high-grade discoveries at Chrome Mountain, located at the west end of the nine-kilometer-long resource area.
Michael Rowley, Stillwater President and CEO, commented in a press release: “We continue to advance new sulphide-rich discoveries at our flagship Stillwater West project as we apply geologic models from South Africa’s giant polymetallic nickel sulphide mines to similar geology at our Stillwater West project. Recent work is identifying additional styles of mineralization, and we look forward to expanding further on these exciting developments as they advance. Overall, the Stillwater district remains underexplored – and therefore wide open for significant expansion of known mineralization – despite having produced critical and strategic minerals such as nickel, copper, palladium, platinum and chrome for over a century. We look forward to reporting assay results and providing updated analysis as we work with our partners at Glencore PLC and the US Geological Survey to advance primary domestic supply of nine of the commodities identified as critical by the US Government. Additional news is expected from our Kluane and Drayton-Black Lake projects, carbon sequestration studies, and other initiatives including continued work on government funding channels.”
The company completed six drilling holes, totaling 2,310 meters, both within and outside the current resource area, specifically west and south of the DR-Hybrid deposit. This drilling is part of a planned multi-phase program. The campaign led to the discovery of multiple new mineralized zones, including the identification and expansion of the N series of sulphide-rich mineralized structures. These structures are parallel to high-grade nickel sulphide mineralization first discovered in previous drilling efforts.
The drilling in 2023 intersected the N2 and N3 mineralized zones parallel to the N1 zone, previously identified in CM2021-05. N1 showed significant results in previous analyses, yielding 13.2 meters grading 2.89% Recovered Nickel Equivalent. The N series structures are now understood to be part of a series of north-south trending structures crosscutting the layered sequence and Platreef-style mineralization of the Stillwater Igneous Complex.
Further, drilling confirmed nickel and copper sulphide mineralization in a large, previously untested geophysical anomaly, extending over 12 kilometers along strike. All core from this drilling campaign has been submitted for assay, with results expected in the coming weeks. This success demonstrates the effectiveness of the company’s updated exploration model.
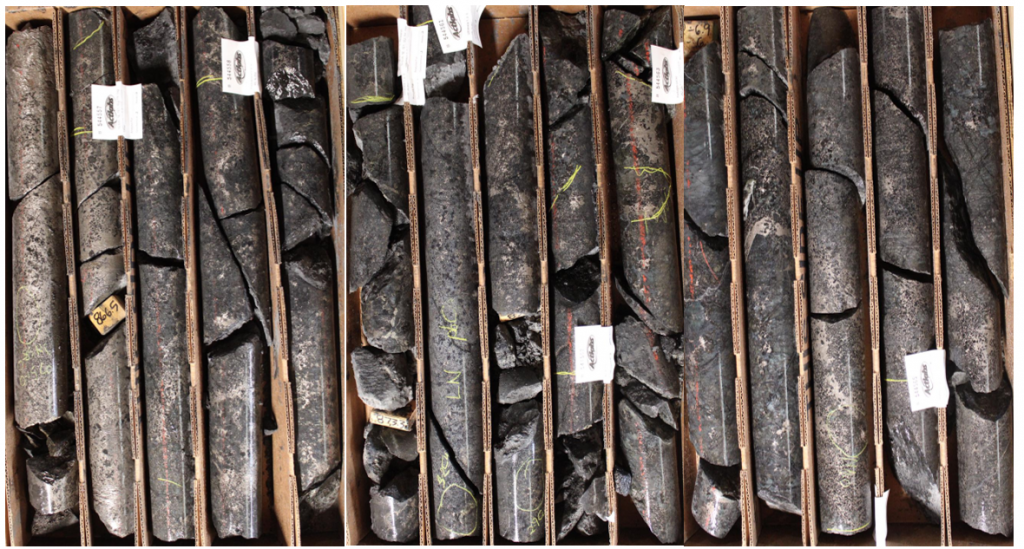
The 2023 drilling campaign, the first to be funded by Glencore PLC’s strategic investment in June 2023, marks the first application of updated geological models incorporating similar geology from South Africa’s Platreef district. This initiative was led by Dr. Danie Grobler, who joined the team as Vice-President of Exploration in May 2022.
Looking ahead, drilling plans for 2024 aim to continue the expansion around known mineralization at existing resource areas, recent discoveries including the N series structures, and more broadly across the 32-kilometer-long project.
Additionally, Stillwater Critical Minerals’ President & CEO, Michael Rowley, will present at the upcoming Clean Energy and Precious Metals Virtual Investor Conference, followed by a Q&A session. The company will also display core from the 2023 drill season at the AMEBC Mineral Roundup event in Vancouver, BC.
On the government collaboration front, the company continues to work with Cornell University under a Department of Energy grant and with the US Geological Survey on other programs at Stillwater West. They are actively pursuing other US government initiatives for developing domestic supply of critical minerals.
In other developments, the company completed geological mapping, drone LiDAR, and imagery acquisition at its Kluane PGE-Ni-Cu project in Yukon, Canada. This field work was partially funded by a Yukon Mineral Exploration Program grant. The company is also exploring carbon capture opportunities at this site.
Finally, Heritage Mining continues to fulfill its obligations under the earn-in agreement for the Drayton-Black Lake gold project in Ontario, with results from recent drill campaigns pending and plans for further exploration in 2024. The project is located in a region with proven significant gold potential, adjacent to Treasury Metals’ Goliath Gold Complex project.
The above references an opinion and is for information purposes only. It is not intended to be investment advice. Seek a licensed professional for investment advice. The author is not an insider or shareholder of any of the companies mentioned above.
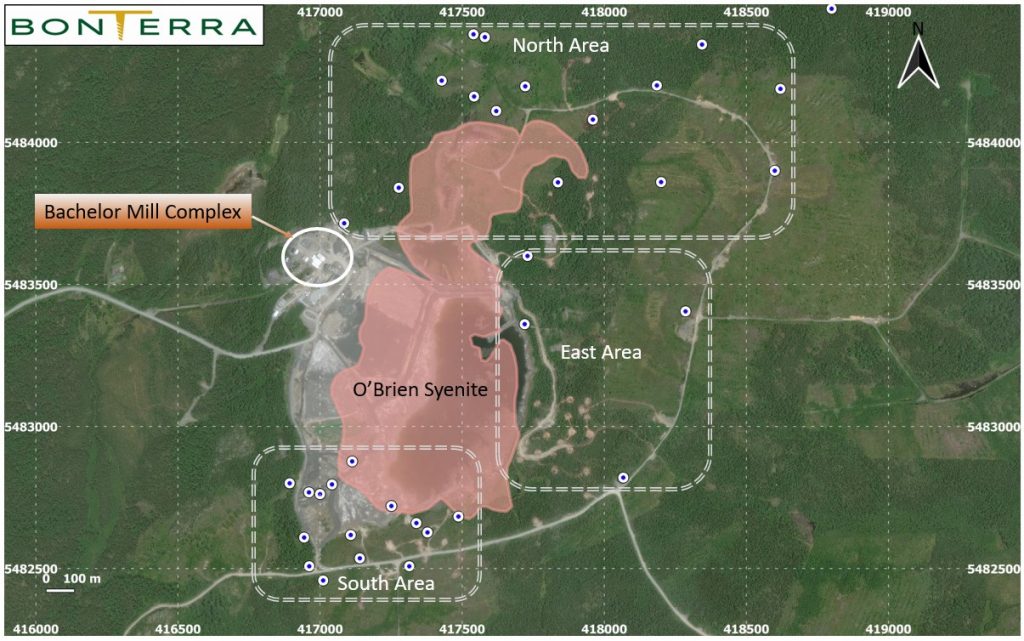
Bonterra Resources (TSXV:BTR) has announced the initial results of its 15,000-meter drilling program at the Desmaraisville South project. The company has deployed three diamond drill rigs to explore various new geological and geophysical targets, as well as historical gold mineralization near the surface along the edges of the O’Brien Syenite Intrusion.
Marc-André Pelletier, President and CEO, commented in a press release: “After entering into an earn-in and joint venture agreement with Osisko Mining Inc. in the Urban-Barry camp, our Company has redirected its exploration efforts to focus on our 100%-owned Desmaraisville projects, which is close to where the Bachelor Mill Complex is situated. The current 15,000 m drill program aims to explore new targets across our land package and validate our improved geological interpretation. The recent discovery of mineralized zones at Desmaraisville South supports our current understanding of the gold potential, indicating similarities to the Bachelor and Moroy deposits on the western side of the O’Brien Intrusive, located about 3 km from the Bachelor Mill. The ongoing drill program with three rigs, set to conclude this year, should provide valuable insights that will guide our future exploration strategy. It is to be noted that the nearby Bachelor Mine historically produced over 350,000 ounces of gold from two million tonnes at a grade of 5.0 g/t Au.”
The project, situated within three kilometres of the Bachelor Mill Complex, has seen drilling activities in three distinct areas: north, east, and south of the O’Brien Intrusive. The Southern Area, in particular, has revealed new drilling targets following a reevaluation of previously identified gold-bearing structures. This reevaluation utilized Bonterra’s drill hole database and historical 3D models of high-grade gold intercepts.
To date, 17 diamond drill holes, covering a distance of 4,332 meters, have been completed in the Southern Area. The drilling has uncovered several sub-parallel zones rich in hematite and silica, containing trace to 8% fine-grained and disseminated pyrite, which are hosting the gold mineralization. These mineralized zones vary in orientation and suggest a complex network of brittle zones with different orientations and plunges.
Bonterra has submitted 3,955 samples for assay, with many results still pending. The company also noted that a review of historical data indicated an absence of systematic sampling, with several gold mineralized intervals not sampled adequately. As a result, Bonterra plans to undertake a re-sampling program in early 2024.
Once all analytical data is received, the company intends to update its 3D model to include updated information on geology, alteration, structures, and mineralization. This update aims to enhance understanding and evaluation of the near-surface gold potential in the Southern Area.
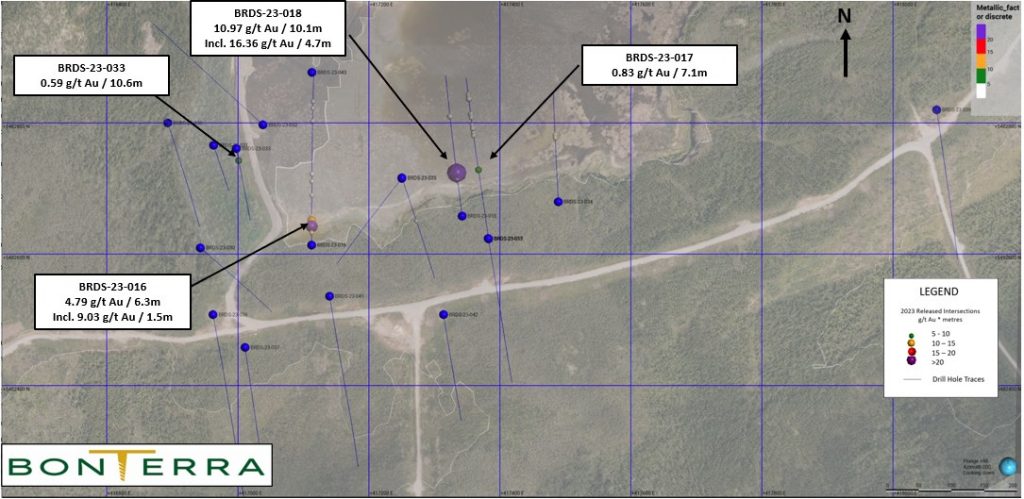
Highlights from the results are as follows:
- 10.97 g/t Au over 10.1 m, including 16.36 g/t Au over 4.7 m in hole BRDS-23-018
- 4.79 g/t Au over 6.3 m, including 9.03 g/t Au over 1.5 m in hole BRDS-23-016
- 2.65 g/t Au over 4.2 m in hole BRDS-23-016
Table 1: Drill Hole Locations – Desmaraisville South project, Quebec
| Hole ID | Easting | Northing | Elevation (m) | Azimuth | Dip | Length (m) |
| BRDS-23-016 | 417108 | 5482618 | 330 | 360 | -45 | 366.0 |
| BRDS-23-017 | 417378 | 5482627 | 336 | 350 | -45 | 339.0 |
| BRDS-23-018 | 417339 | 5482660 | 328 | 350 | -45 | 297.0 |
| BRDS-23-033 | 417000 | 5482762 | 330 | 170 | -45 | 156.0 |
UTM Coordinates, System: NAD83 Zone 18
Table 2: Significant Mineralized Intersections from Drilling on the Desmaraisville South project, South Area
| Hole ID | From (m) |
To (m) |
Length (m) |
Grades (g/t Au) |
Metal Factor (Length x Grade) |
|
| BRDS-23-016 | 36.80 | 43.10 | 6.3 | 4.79 | 30.2 | |
| BRDS-23-016 | including | 38.70 | 40.20 | 1.5 | 9.03 | 13.5 |
| BRDS-23-016 | and | 51.80 | 56.00 | 4.2 | 2.65 | 11.1 |
| BRDS-23-017 | 144.6 | 151.7 | 7.1 | 0.83 | 5.9 | |
| BRDS-23-018 | 88.00 | 98.10 | 10.1 | 10.97 | 110.8 | |
| BRDS-23-018 | including | 93.40 | 98.10 | 4.7 | 16.36 | 76.9 |
| BRDS-23-033 | 21.40 | 32.00 | 10.6 | 0.59 | 6.3 |
- The meterage represents the length of the drilled lengths.
- The mineralized intervals shown above use a 0.5 g/t Au cut-off grade.
- Gold results obtained above <0.5 g/t Au and with a Metal Factor above 5.
The above references an opinion and is for information purposes only. It is not intended to be investment advice. Seek a licensed professional for investment advice. The author is not an insider or shareholder of any of the companies mentioned above.
Torex Gold Resources (TSX:TXG) has announced the results of its 2023 exploration drilling program at Media Luna West, a project aimed at assessing the potential of the Media Luna Cluster and exploring opportunities near the Morelos Complex. The exploration is intended to enhance future production and extend the reserve life beyond 2033.
Jody Kuzenko, President & CEO of Torex, commented in a press release: “We are highly encouraged by the results of our 2023 exploration drilling program at Media Luna West, which continue to enhance our confidence in the mineralized potential of the ever-expanding Media Luna Cluster. While exploration at Media Luna West is still at an early-stage relative to the nearby Media Luna and EPO deposits, the latest results, when combined with historical results and a new structural model, highlight the potential for Media Luna West to become a future source of feed for the Morelos Complex. Follow-up drilling at Media Luna West is planned for 2024 as we advance this zone to the next exploration stage.”
Located near the Media Luna and EPO deposits, Media Luna West is an early-stage exploration target in proximity to existing and planned infrastructure, including the Guajes Tunnel. The 2023 drilling program included several holes that yielded mineralized intercepts. Notably, hole ML23-986A showed significant results with 29.76 grams per tonne gold equivalent (gpt AuEq) over 14.10 meters, including high concentrations of gold, silver, and copper.
This drilling site is located north of the historic MLW-02 drill hole and west of the MLW-04 drill hole, both of which had previously returned promising intercepts. The 2023 drilling program consisted of seven holes (excluding three mother holes), covering a total distance of 9,722 meters. The goal was to build upon historical drilling data from Media Luna West, utilizing insights from recent comprehensive drilling at the EPO deposit.
All seven drill holes provided assay results, with two holes intersecting mineralization at the periphery of the main feeder system. The pattern of these intercepts suggests a north-south extension of over 600 meters, comparable in size to the EPO deposit, indicating a potentially similar mineral potential for Media Luna West. The exploration potential in this area remains open to the north.
Media Luna West is situated within the Morelos Platform, a Mesozoic carbonate-rich region overlaid by Cuautla and Mezcala formations. The area has been influenced by Paleocene intrusions of granodioritic to tonalitic composition. The potential deposit is structured by the north-south trending Cuajiote thick skin fault, along with other sub-parallel secondary faults.
The site exhibits skarn-hosted copper and gold-silver mineralization, developed in areas of intense fracturing and influenced by the intrusion of dykes. The mineralization is also affected by the interaction between Morelos limestone and Media Luna granodiorite. The skarn mineral assemblage at Media Luna West includes pyroxene, garnet, magnetite, and a retrograde alteration phase characterized by amphibole, phlogopite, chlorite, and calcite, among others.
The style of mineralization is marked by gold with occasional high silver and copper grades. The gold precipitation is associated with the early stages of calc-silicate alteration and sulfide mineralization, often dissociated from the copper event mainly related to chalcopyrite.
Highlights from the results are as follows:
Table 1: Highlights from the 2023 exploration drilling program at Media Luna West
| Drill Hole | From (m) |
To (m) |
Core Length1 (m) |
Au (gpt) |
Ag (gpt) |
Cu (%) |
AuEq2 (gpt) |
| ML23-965 | 686.15 | 693.00 | 6.85 | 1.63 | 12.7 | 0.48 | 2.55 |
| 727.35 | 730.31 | 2.96 | 4.42 | 0.9 | 0.04 | 4.50 | |
| ML23-970A | 559.00 | 564.00 | 5.00 | 2.81 | 26.8 | 0.31 | 3.62 |
| ML23-986A | 784.53 | 798.63 | 14.10 | 27.50 | 27.9 | 1.20 | 29.76 |
| Notes to Table: | ||
| 1) | Intercepts are reported as core length (not true width/thickness). Core lengths reflect drilling core recovery. | |
| 2) | The gold equivalent grade calculation used is as follows: AuEq (gpt) = Au (gpt) + Ag (gpt) * 0.0114 + Cu (%) * 1.6212 and use the same metal prices ($1,550/oz Au, $20/oz Ag, and $3.50/lb Cu) and metallurgical recoveries (85% Au, 75% Ag, and 89% Cu) used in the Mineral Resource estimate for EPO. | |
The following table summarizes the most notable historical holes in Media Luna West which were reported within several press releases published in 2012 and 2013.
Table 2: Historical results from exploration drilling carried out at Media Luna West in 2012 and 2013
| Drill Hole | From (m) |
To (m) |
Core Length1 (m) |
Au (gpt) |
Ag (gpt) |
Cu (%) |
AuEq2 (gpt) |
| MLW-02 | 676.26 | 713.56 | 37.30 | 4.08 | 2.1 | 0.00 | 4.11 |
| 752.09 | 761.14 | 9.05 | 10.31 | 2.2 | 0.04 | 10.41 | |
| MLW-03A | 808.62 | 812.69 | 4.07 | 7.74 | 6.7 | 0.27 | 8.26 |
| MLW-04 | 721.68 | 742.00 | 20.32 | 4.61 | 32.4 | 1.40 | 7.26 |
| MLW-05 | 834.43 | 836.70 | 2.27 | 58.47 | 9.5 | 0.19 | 58.89 |
| MLW-09 | 340.09 | 343.09 | 3.00 | 0.01 | 362.0 | 0.04 | 4.20 |
| MLW-18 | 724.59 | 728.29 | 3.70 | 6.95 | 2.6 | 0.05 | 7.06 |
| MLW-22 | 568.76 | 573.14 | 4.38 | 1.20 | 104.9 | 4.87 | 10.29 |
| SS-06 | 676.66 | 691.30 | 14.64 | 7.88 | 11.0 | 0.48 | 8.77 |
| Notes to Table: | ||
| 1) | Intercepts are reported as core length (not true width/thickness). Core lengths reflect drilling core recovery. | |
| 2) | The gold equivalent grade calculation used is as follows: AuEq (gpt) = Au (gpt) + Ag (gpt) * 0.0114 + Cu (%) * 1.6212 and use the same metal prices ($1,550/oz Au, $20/oz Ag, and $3.50/lb Cu) and metallurgical recoveries (85% Au, 75% Ag, and 89% Cu) used in the Mineral Resource estimate for EPO. | |
Table 3: Results from the 2023 exploration drilling program at Media Luna West
| Final | Intercept | |||||||||||||||
| Drill Hole | UTM-E | UTM-N | Elevation | Hole | Mother | Azimuth | Dip | Depth | From | To | Core Length | Au | Ag | Cu | AuEq | Lithology |
| (m) | (m) | (m) | Type | Hole | (°) | (°) | (m) | (m) | (m) | (m) | (gpt) | (gpt) | (%) | (gpt) | ||
| ML23-953 | 421001.42 | 1984593.62 | 987.24 | CD | 32.1 | -56.9 | 637.10 | 477.02 | 477.76 | 0.74 | 4.35 | 8.4 | 0.02 | 4.47 | Skarn composite 1 | |
| CD | 560.68 | 561.51 | 0.83 | 0.19 | 45.7 | 0.02 | 2.94 | Skarn composite 2 | ||||||||
| CD | 563.97 | 565.00 | 1.03 | 0.07 | 82.1 | 1.80 | 3.92 | Skarn composite 3 | ||||||||
| ML23-965 | 420994.49 | 1984591.06 | 987.49 | CD | 356.7 | -56.9 | 822.70 | 686.15 | 693.00 | 6.85 | 1.63 | 12.7 | 0.48 | 2.55 | Dyke | |
| CD | 712.06 | 715.95 | 3.89 | 2.04 | 0.8 | 0.02 | 2.09 | Skarn composite 1 | ||||||||
| CD | 727.35 | 730.31 | 2.96 | 4.42 | 0.9 | 0.04 | 4.50 | Skarn composite 2 | ||||||||
| CD | 747.47 | 748.00 | 0.53 | 9.40 | 4.0 | 0.00 | 9.45 | Skarn composite 3 | ||||||||
| ML23-970 | 421495.19 | 1984836.82 | 1155.20 | CD | 313.6 | -65.9 | 407.70 | Mother hole | ||||||||
| ML23-970A | 421495.19 | 1984836.82 | 1155.20 | CD | ML23-970 | 609.75 | 559.00 | 564.00 | 5.00 | 2.81 | 26.8 | 0.31 | 3.62 | Skarn composite 1 | ||
| ML23-974 | 421494.55 | 1984836.40 | 1155.11 | CD | 305.3 | -63.0 | 646.30 | No significant values | ||||||||
| ML23-979 | 421113.24 | 1985079.67 | 1190.69 | CD | 317.1 | -89.0 | 470.35 | Mother hole | ||||||||
| ML23-979A | 421113.24 | 1985079.67 | 1190.69 | CD | ML23-979 | 554.50 | No significant values/ Finished | |||||||||
| ML23-979B | 421113.24 | 1985079.67 | 1190.69 | CD | ML23-979 | 796.55 | No significant values | |||||||||
| ML23-986 | 421112.83 | 1985080.14 | 1190.67 | CD | 320.6 | -88.4 | 165.50 | Mother hole | ||||||||
| ML23-986A | 421112.83 | 1985080.14 | 1190.67 | CD | ML23-986 | 869.65 | 784.53 | 798.63 | 14.10 | 27.50 | 27.9 | 1.20 | 29.76 | Skarn composite 1 |
| Notes to Table | ||
| 1) | Intercepts are core lengths and do not represent true thickness of mineralized zones. | |
| 2) | Core lengths subject to rounding. | |
| 3) | Torex is not aware of any drilling, sampling, recovery, or other factors that could materially affect the accuracy or reliability of the data. | |
| 4) | Gold equivalent (“AuEq”) grades use the same metal prices ($1,550/oz gold (“Au”), $20/oz silver (“Ag”) and $3.50/lb copper (“Cu”)) and metallurgical recoveries (85% Au, 75% Ag and 89% Cu) used in the Mineral Resource estimate for the EPO deposit (AuEq (gpt) = Au (g/t) + Ag (gpt) * 0.0114 + Cu (%) * 1.6212). | |
Table 4: Results from historical drilling at Media Luna West carried out in 2012 and 2013
| Final | Intercept | |||||||||||||||
| Drill Hole | UTM-E | UTM-N | Elevation | Hole | Mother | Azimuth | Dip | Depth | From | To | Core Length | Au | Ag | Cu | AuEq | Lithology |
| (m) | (m) | (m) | Type | Hole | (°) | (°) | (m) | (m) | (m) | (m) | (gpt) | (gpt) | (%) | (gpt) | ||
| MLW-01 | 421168.22 | 1985017.68 | 1183.46 | CD | 130.0 | -75.0 | 857.60 | No significant values | ||||||||
| MLW-02 | 421168.81 | 1985018.20 | 1183.44 | CD | 220.0 | -75.0 | 838.15 | 676.26 | 713.56 | 37.30 | 4.08 | 2.1 | 0.00 | 4.11 | Skarn composite 1 | |
| CD | 721.52 | 732.92 | 11.40 | 2.98 | 0.7 | 0.00 | 2.99 | Skarn composite 2 | ||||||||
| CD | 752.09 | 761.14 | 9.05 | 10.31 | 2.2 | 0.04 | 10.41 | Skarn composite 3 | ||||||||
| MLW-03 | 421033.42 | 1985188.70 | 1192.67 | CD | 220.0 | -75.0 | 809.00 | No significant values | ||||||||
| MLW-03A | 421033.25 | 1985192.12 | 1192.73 | CD | 220.0 | -75.0 | 926.65 | 802.09 | 803.20 | 1.11 | 21.79 | 16.7 | 0.24 | 22.37 | Skarn composite 1 | |
| CD | 808.62 | 812.69 | 4.07 | 7.74 | 6.7 | 0.27 | 8.26 | Skarn composite 2 | ||||||||
| CD | 869.00 | 870.21 | 1.21 | 0.92 | 92.7 | 2.73 | 6.40 | Skarn composite 3 | ||||||||
| MLW-04 | 421035.07 | 1985190.41 | 1192.74 | CD | 120.0 | -70.0 | 841.20 | 498.00 | 501.00 | 3.00 | 0.01 | 245.0 | 0.03 | 2.84 | Limestone | |
| CD | 721.68 | 742.00 | 20.32 | 4.61 | 32.4 | 1.40 | 7.26 | Skarn composite 1 | ||||||||
| MLW-05 | 421034.46 | 1985191.99 | 1192.74 | CD | 0.0 | -90.0 | 930.20 | 834.43 | 836.70 | 2.27 | 58.47 | 9.5 | 0.19 | 58.89 | Skarn composite 1 | |
| CD | 853.31 | 854.61 | 1.30 | 0.18 | 45.0 | 1.71 | 3.47 | Skarn composite 2 | ||||||||
| MLW-06 | 421367.04 | 1985127.02 | 1188.13 | CD | 40.0 | -76.0 | 543.00 | No significant values | ||||||||
| MLW-09 | 421246.98 | 1985352.88 | 1340.43 | CD | 0.0 | -90.0 | 899.40 | 340.09 | 343.09 | 3.00 | 0.01 | 362.0 | 0.04 | 4.20 | Limestone | |
| MLW-11 | 421421.10 | 1984992.84 | 1186.07 | CD | 220.0 | -70.0 | 691.50 | 27.82 | 28.93 | 1.11 | 0.08 | 893.0 | 0.19 | 10.55 | Limestone | |
| MLW-14 | 421422.02 | 1984997.76 | 1186.16 | CD | 0.0 | -90.0 | 614.00 | No significant values | ||||||||
| MLW-17 | 420870.81 | 1984641.45 | 985.56 | CD | 0.0 | -90.0 | 860.00 | No significant values | ||||||||
| MLW-18 | 421017.13 | 1984523.61 | 1017.60 | CD | 0.0 | -90.0 | 797.70 | 724.59 | 728.29 | 3.70 | 6.95 | 2.6 | 0.05 | 7.06 | Skarn composite 1 | |
| CD | 746.97 | 751.85 | 4.88 | 0.09 | 48.1 | 1.32 | 2.77 | Limestone | ||||||||
| CD | 754.68 | 756.38 | 1.70 | 0.12 | 109.2 | 2.82 | 5.94 | Limestone | ||||||||
| MLW-20 | 421257.37 | 1984335.97 | 948.83 | CD | 0.0 | -90.0 | 734.70 | No significant values | ||||||||
| MLW-22 | 421336.95 | 1984637.96 | 1090.53 | CD | 0.0 | -90.0 | 611.40 | 568.76 | 573.14 | 4.38 | 1.20 | 104.9 | 4.87 | 10.29 | Skarn composite 1 | |
| SS-06 | 421167.92 | 1985017.02 | 1183.31 | CD | 0.0 | -90.0 | 837.30 | 676.66 | 691.30 | 14.64 | 7.88 | 11.0 | 0.48 | 8.77 | Skarn composite 2 |
| Notes to Table | ||||
| 1) | Intercepts are core lengths and do not represent true thickness of mineralized zones. | |||
| 2) | Core lengths subject to rounding. | |||
| 3) | Torex is not aware of any drilling, sampling, recovery, or other factors that could materially affect the accuracy or reliability of the data. | |||
| 4) | Gold equivalent (“AuEq”) grades use the same metal prices ($1,550/oz gold (“Au”), $20/oz silver (“Ag”) and $3.50/lb copper (“Cu”)) and metallurgical recoveries (85% Au, 75% Ag and 89% Cu) used in the Mineral Resource estimate for the EPO deposit (AuEq (gpt) = Au (g/t) + Ag (gpt) * 0.0114 + Cu (%) * 1.6212). | |||
| 5) | Drill results (excluding those with no significant values) were previously published by Torex Gold in news released filed by the Company on SEDAR (www.sedar.com). The following outlines the press release and date of the original press releases for the corresponding holes: | |||
| a) | October 19, 2012 – Torex makes another ‘South of the River’ discovery – includes drill holes MLW-04 and SS-06 | |||
| b) | December 14, 2012 – Torex drills highest grade gold mineralization to date at Media Luna – includes drill holes MLW-02 and MLW-09 | |||
| c) | February 20, 2013 – Torex continues to intersect high grade gold over significant thickness at Media Luna and Media Luna West – includes drill hole MLW-05 | |||
| d) | September 23, 2013 – Torex continues to extend strike length at Media Luna and Media Luna West – includes drill holes MLW-03A, MLW-11, MLW-18 and MLW-22 | |||
The above references an opinion and is for information purposes only. It is not intended to be investment advice. Seek a licensed professional for investment advice. The author is not an insider or shareholder of any of the companies mentioned above.
If you would like to receive our free newsletter via email, simply enter your email address below & click subscribe.
 Follow us on Twitter
 Become our facebook fan
CONNECT WITH US
Tweets
Tweet with hash tag #miningfeeds or @miningfeeds and your tweets will be displayed across this site.
MOST ACTIVE MINING STOCKS
Daily Gainers
 CMC Metals Ltd. CMC Metals Ltd. |
CMB.V | +900.00% |
 Eden Energy Ltd Eden Energy Ltd |
EDE.AX | +200.00% |
| GoviEx Uranium Inc. |
GXU.V | +42.86% |
| Eagle Nickel Ltd. |
ENL.AX | +41.67% |
| Citigold Corp. Limited |
CTO.AX | +33.33% |
| Mount Burgess Mining NL |
MTB.AX | +33.33% |
| Exalt Resources Limited |
ERD.AX | +31.94% |
| Casa Minerals Inc. |
CASA.V | +30.00% |
| Cariboo Rose Resources Ltd |
CRB.V | +28.57% |
| Belmont Resources Inc. |
BEA.V | +28.57% |


