


Marimaca Copper (TSX:MARI) has shared a revised Mineral Resource Estimate (MRE) for its flagship Marimaca Oxide Deposit (MOD) project located in the Antofagasta region of northern Chile.
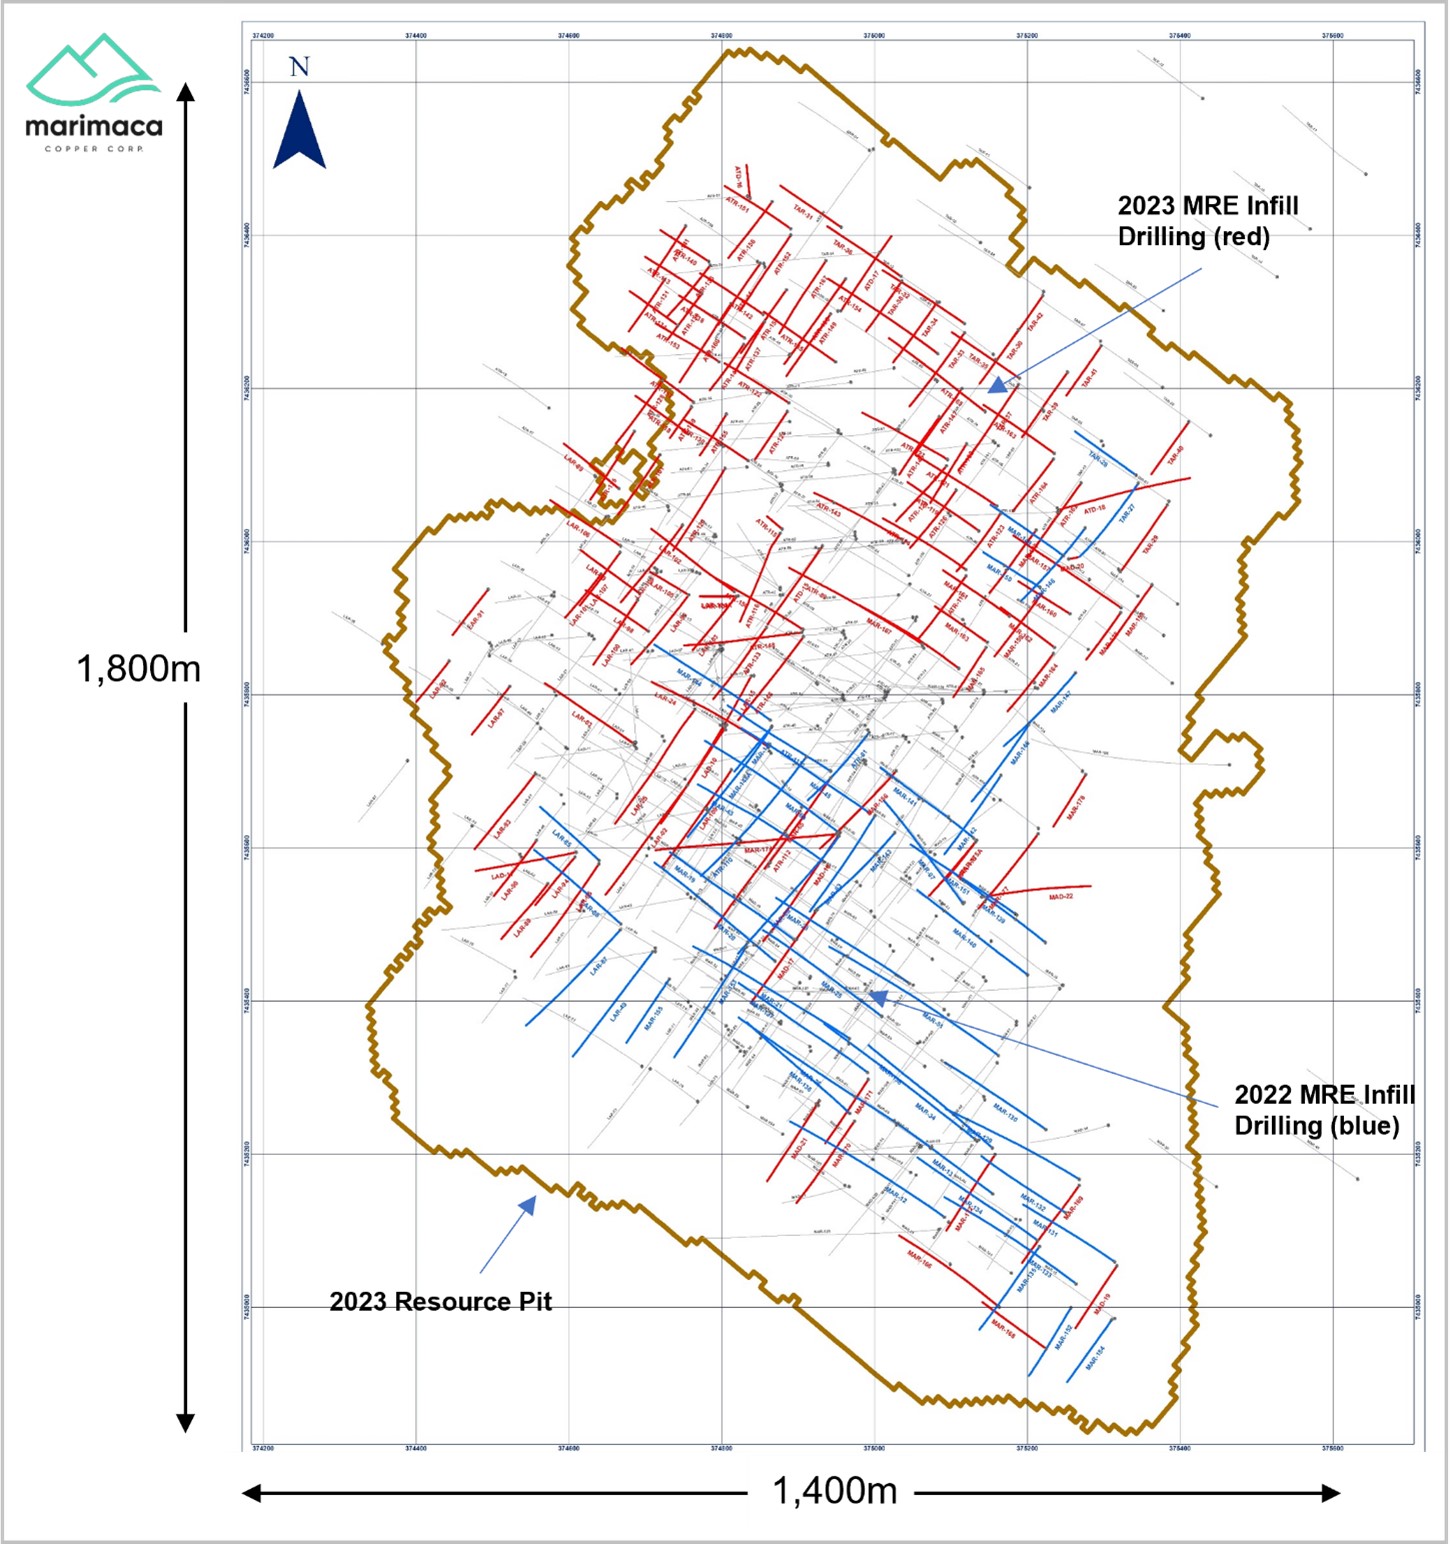
The updated 2023 MRE integrates a substantial 28,374m of fresh drilling data that was collated subsequent to the unveiling of the 2022 MRE in October 2022. Since the MOD’s inception in 2016, a cumulative total of 139,164m of drilling has been completed. The recent drilling data, gathered following the release of the 2022 MRE, mainly focused on enhancing the conversion of Inferred Resources into the Measured and Indicated categories.
The updated MRE adheres strictly to the Definition Standards set by the Canadian Institute of Mining, Metallurgy and Petroleum (CIM) and the National Instrument 43-101 – Standards of Disclosure for Mineral Projects (NI 43-101).
The significant highlights from the MRE include:
- Measured and Indicated Resources totalling 200.3Mt at 0.45% CuT, encapsulating 900kt of contained copper
- Inferred Resources measuring 37.3Mt at 0.38% CuT, encompassing 141kt of contained copper
- A robust 86% of the total resource tonnes of the MOD now fall under the Measured and Indicated categories
- The updated MRE significantly lowers the risk associated with the Marimaca ore body in anticipation of the forthcoming Definitive Feasibility Study (DFS)
- The majority of the recent drilling operations were concentrated in the northern parts of the MOD, which had earlier been associated with lower drilling density
The MOD continues to demonstrate unique characteristics in the 2023 MRE, such as a low strip ratio maintained in the constraining pit shell and all mineral resources captured within a single continuous pit. It marks the final phase of oxide resource definition at the MOD before the planned DFS. The company’s exploration focus will now shift towards the Marimaca sulphide target and the definition of near-mine satellite oxide targets, including Mercedes, Cindy, and Mititus.
The 2023 MRE was compiled by independent consultants NCL Ingeniería y Construcción SpA (NCL) and authenticated by Luis Oviedo, a qualified person independent of Marimaca, as per the terms under NI 43-101. The updated MRE reflects 139,164m of drilling across 554 drill holes completed between 2016 and 2022, with an effective date of May 17, 2023. The same operating cost parameters as the 2022 MRE were used for the Whittle Optimisations, alongside a copper price assumption of US$4.00/lb.
Marimaca has also concluded five extensive phases of metallurgical testing at Marimaca. A sixth phase is currently in progress, which is expected to define the optimized process design flowsheet before the planned DFS. The results from the fifth phase, announced on June 15, 2022, indicate a promising larger proportion of total copper is expected to be recovered in industrial-scale operations.
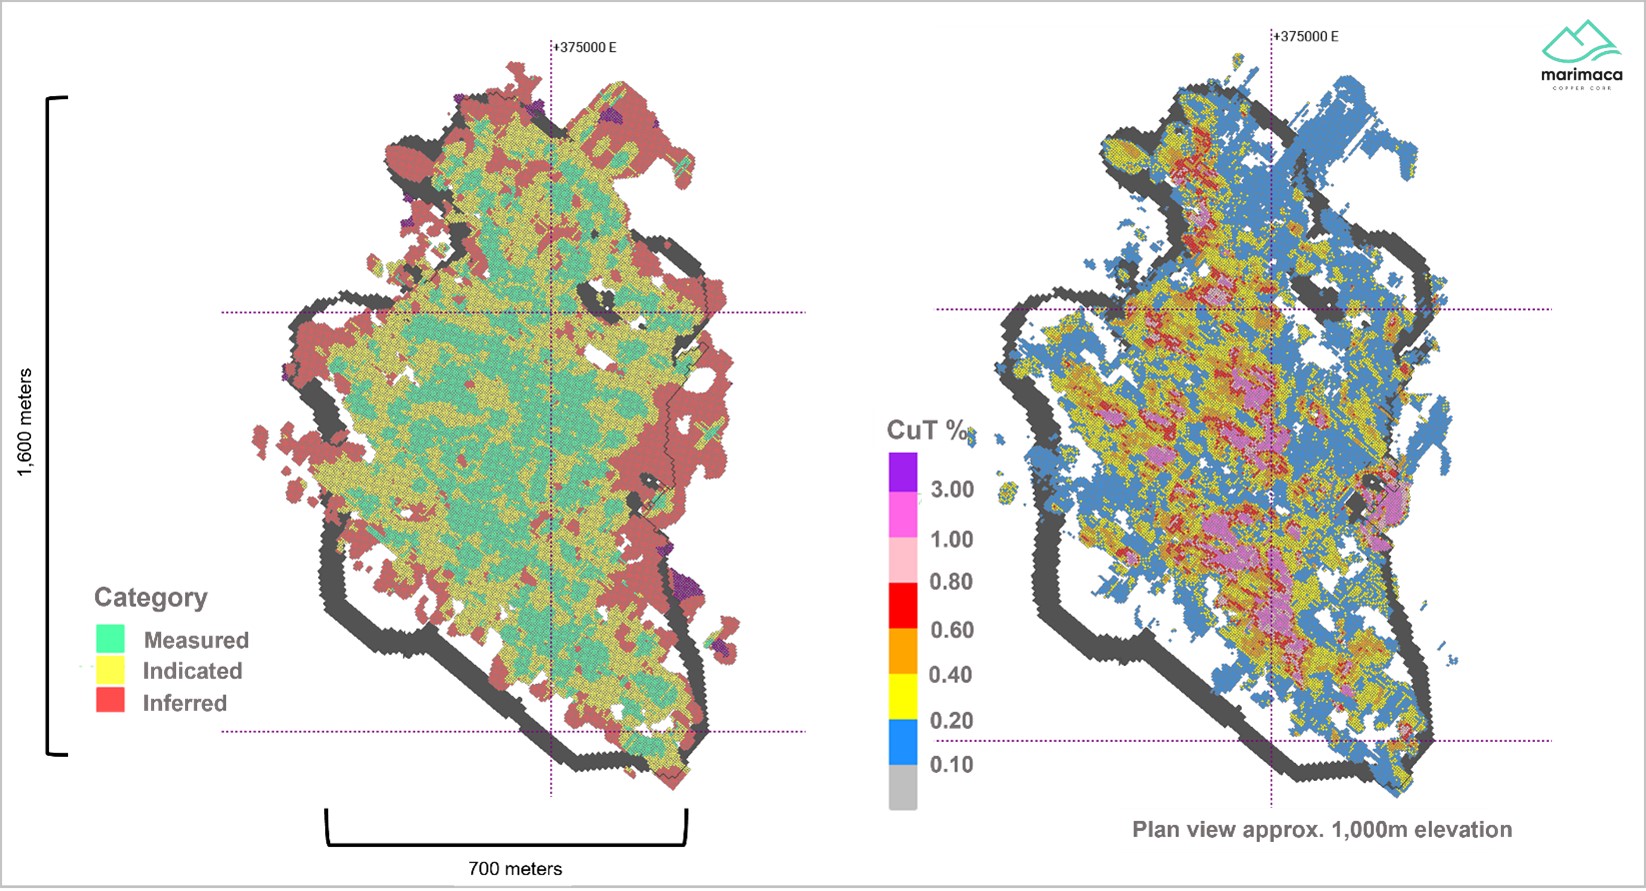
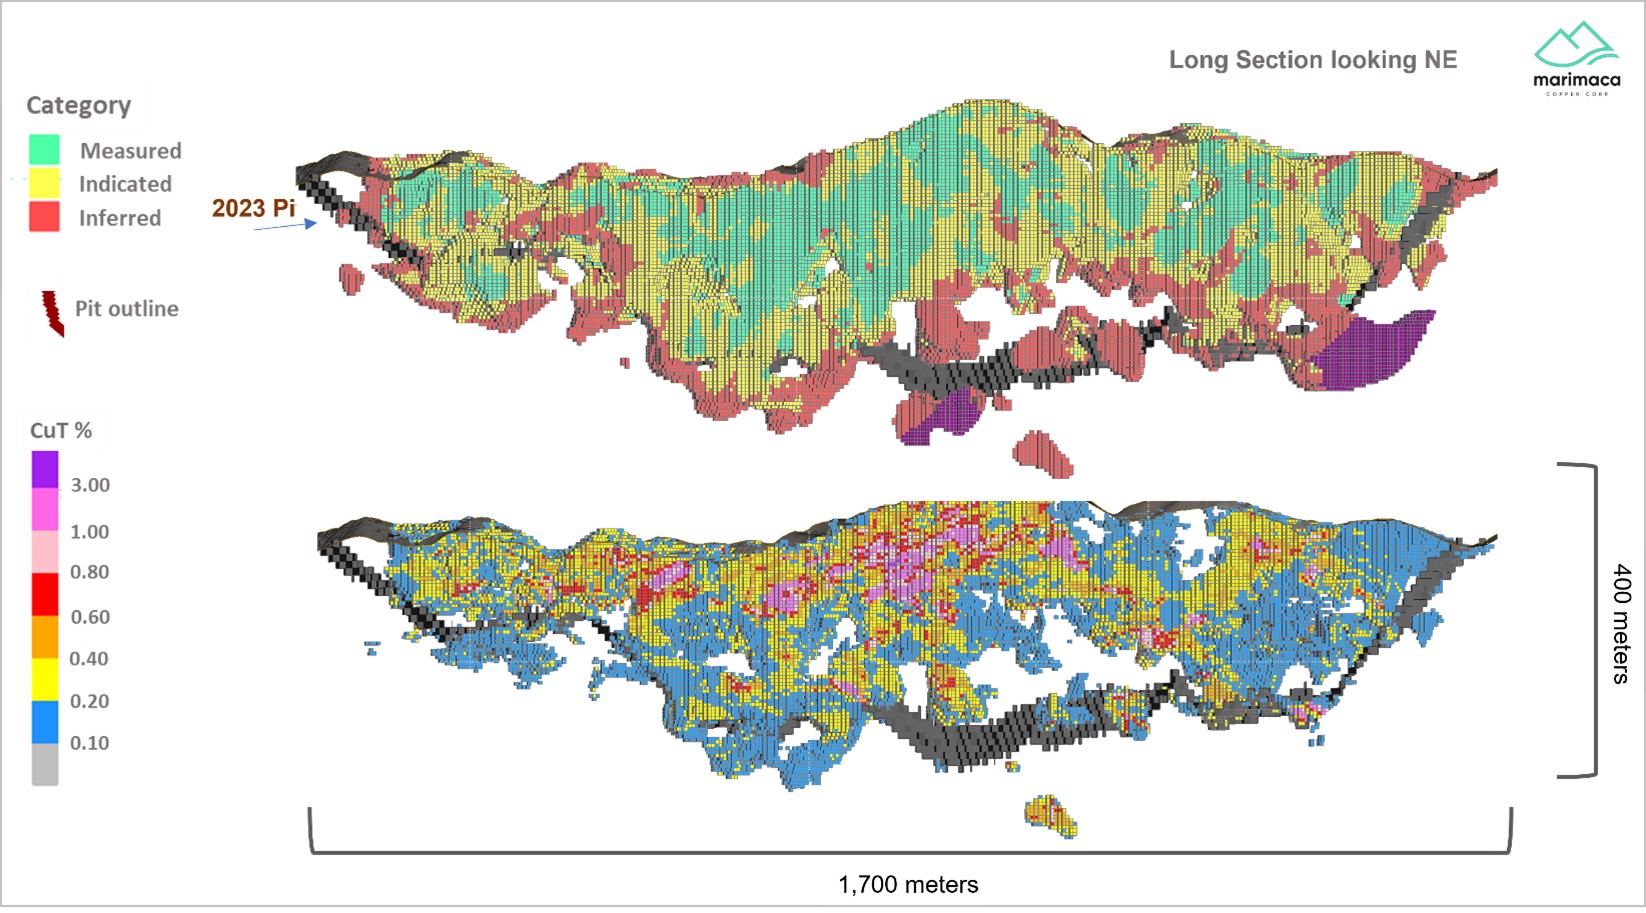
The Marimaca Deposit showcases the continuity of the oxide mineralization across the north-south extent of the deposit, with the mineralization consistently hosted by east-dipping fracture sets. Higher grade zones of oxides, mixed and enriched mineralization, extend at depth beneath the green oxide zones.
Exploration for sulphide mineralization down-dip of the MOD to the east is ongoing, and further results will be made public in the coming months.
Hayden Locke, President & CEO of Marimaca Copper, commented in a press release: “The 2023 MRE represents the culmination of an exceptionally successful two years of infill drilling at the Marimaca Oxide Deposit led by Sergio Rivera and his team. We are very pleased with our conversion ratio of Inferred Resources to Measured and Indicated categories, and today’s result drives significantly improved confidence in the geological model and understanding of the Marimaca ore body.
“The M&I resource estimate at the MOD now stands at approximately 900,000 tonnes of contained metal, and this will support the assessment of a larger operation in terms of copper cathode production and mine life extension during the Definitive Feasibility Study. Despite the significant resource growth demonstrated at Marimaca since 2019, the ore body’s core, unique attributes have been preserved as the deposit has grown – very low strip ratio; a shallow higher-grade core expected to be accessible in the early mining years; and limited pre-stripping or significant cutbacks expected during operation.
“We continue to progress rapidly forward with development workstreams at the MOD including preparation for our permitting submissions and the Feasibility Study. Additionally, the first phase of the 2023 sulphide exploration program has been completed with assays pending and results expected in the near term.”
Results from the updated MRE are as follows:
| Mineral Resource Category and Type | Quantity | CuT | CuS | CuT | CuS |
| (kt) | (%) | (%) | (t) | (t) | |
| Total Measured | 96,954 | 0.49 | 0.28 | 473,912 | 268,628 |
| Total Indicated | 103,358 | 0.41 | 0.21 | 425,797 | 219,690 |
| Total Measured and Indicated | 200,312 | 0.45 | 0.24 | 899,709 | 488,319 |
| Total Inferred | 37,289 | 0.38 | 0.15 | 141,252 | 55,802 |
Table 1. 2023 Mineral Resource Estimate (reported at 0.15% CuT cutoff)
* Pit shell constrained resources with demonstrated reasonable prospects for eventual economic extraction (RPEEE) are generated using series of Lerchs-Grossmann pit shell optimizations completed by NCL
* CuT means total copper and CuS means acid soluble copper. Technical and economic parameters include: copper price US$4.00/lb; base mining cost of US$1.51/t with a mining cost adjustment factor of US$0.04/t-10m bench; Heap Leach “HL” processing cost US$5.94/t (incl. G&A); Run-of-Mine “ROM” processing cost US$1.65/t (incl. G&A); SX-EW processing cost and selling cost US$0.16/lb Cu; heap leach recovery 76% of CuT; ROM recovery 40% of CuT; and 42°-52° pit slope angle
* Mineral resources which are not mineral reserves do not have demonstrated economic viability. Due to the uncertainty which may attach to inferred mineral resources, it cannot be assumed that all or any part of an inferred mineral resource will be upgraded to an indicated or measured mineral resource as a result of continued exploration
| Cut-off grade (% CuT) |
Measured | Indicated | Measured + Indicated | Inferred | |||||||||
| Quantity kt | CuT [%] | CuS [%] | Quantity kt | CuT [%] | CuS [%] | Quantity kt | CuT [%] | CuS [%] | Quantity kt | CuT [%] | CuS [%] | ||
| 0.40 | 44.0 | 0.77 | 0.44 | 37.5 | 0.69 | 0.38 | 81.6 | 0.73 | 0.41 | 12.1 | 0.64 | 0.24 | |
| 0.30 | 60.2 | 0.65 | 0.38 | 55.5 | 0.58 | 0.31 | 115.7 | 0.62 | 0.35 | 18.8 | 0.54 | 0.21 | |
| 0.22 | 77.8 | 0.56 | 0.32 | 77.0 | 0.49 | 0.26 | 154.9 | 0.53 | 0.29 | 27.2 | 0.45 | 0.18 | |
| 0.20 | 83.0 | 0.54 | 0.31 | 83.8 | 0.47 | 0.25 | 166.8 | 0.50 | 0.28 | 30.2 | 0.43 | 0.17 | |
| 0.18 | 88.3 | 0.52 | 0.30 | 91.3 | 0.44 | 0.23 | 179.6 | 0.48 | 0.26 | 33.0 | 0.41 | 0.16 | |
| 0.15 | 97.0 | 0.49 | 0.28 | 103.4 | 0.41 | 0.21 | 200.3 | 0.45 | 0.24 | 37.3 | 0.38 | 0.15 | |
| 0.10 | 113.3 | 0.44 | 0.24 | 127.6 | 0.36 | 0.18 | 241.0 | 0.39 | 0.21 | 46.6 | 0.33 | 0.13 | |
| 0.00 | 146.1 | 0.35 | 0.19 | 178.2 | 0.27 | 0.14 | 324.3 | 0.31 | 0.16 | 72.0 | 0.24 | 0.09 | |
Table 2. Mineral Resource Sensitivity
* Pit shell constrained resources with demonstrated reasonable prospects for eventual economic extraction (RPEEE) are generated using series of Lerchs-Grossmann pit shell optimizations completed by NCL
* CuT means total copper and CuS means acid soluble copper. Technical and economic parameters include: copper price US$4.00/lb; base mining cost of US$1.51/t with a mining cost adjustment factor of US$0.04/t-10m bench; Heap Leach “HL” processing cost US$5.94/t (incl. G&A); Run-of-Mine “ROM” processing cost US$1.65/t (incl. G&A); SX-EW processing cost and selling cost US$0.16/lb Cu; heap leach recovery 76% of CuT; ROM recovery 40% of CuT; and 42°-52° pit slope angle
* Mineral resources which are not mineral reserves do not have demonstrated economic viability. Due to the uncertainty which may attach to inferred mineral resources, it cannot be assumed that all or any part of an inferred mineral resource will be upgraded to an indicated or measured mineral resource as a result of continued exploration
| Mineral Resource Category and Type | Quantity | CuT | CuS | CuT | CuS |
| (kt) | (%) | (%) | (t) | (t) | |
| Measured | |||||
| Brochantite | 31,293 | 0.62 | 0.45 | 194,890 | 141,442 |
| Chrysocolla | 24,252 | 0.44 | 0.33 | 105,594 | 79,863 |
| Wad/Black oxides | 10,727 | 0.29 | 0.15 | 30,599 | 16,116 |
| Mixed | 18,626 | 0.51 | 0.13 | 95,159 | 23,431 |
| Enriched | 12,056 | 0.40 | 0.06 | 47,669 | 7,776 |
| Total Measured | 96,954 | 0.49 | 0.28 | 473,912 | 268,628 |
| Indicated | |||||
| Brochantite | 29,084 | 0.56 | 0.41 | 162,753 | 117,847 |
| Chrysocolla | 13,591 | 0.38 | 0.28 | 51,332 | 37,674 |
| Wad/Black oxides | 19,880 | 0.28 | 0.15 | 56,382 | 29,649 |
| Mixed | 17,193 | 0.41 | 0.11 | 71,109 | 18,654 |
| Enriched | 23,611 | 0.36 | 0.07 | 84,221 | 15,867 |
| Total Indicated | 103,358 | 0.41 | 0.21 | 425,797 | 219,690 |
| Measured and Indicated | |||||
| Brochantite | 60,376 | 0.59 | 0.43 | 357,643 | 259,290 |
| Chrysocolla | 37,843 | 0.41 | 0.31 | 156,927 | 117,536 |
| Wad/Black oxides | 30,607 | 0.28 | 0.15 | 86,981 | 45,765 |
| Mixed | 35,819 | 0.46 | 0.12 | 166,268 | 42,085 |
| Enriched | 35,667 | 0.37 | 0.07 | 131,891 | 23,643 |
| Total Measured and Indicated | 200,312 | 0.45 | 0.24 | 899,709 | 488,319 |
| Inferred | |||||
| Brochantite | 4,950 | 0.46 | 0.32 | 22,892 | 15,710 |
| Chrysocolla | 4,488 | 0.36 | 0.26 | 16,250 | 11,695 |
| Wad/Black oxides | 8,727 | 0.29 | 0.15 | 25,180 | 12,799 |
| Mixed | 5,979 | 0.36 | 0.11 | 21,548 | 6,541 |
| Enriched | 13,145 | 0.42 | 0.07 | 55,381 | 9,057 |
| Total Inferred | 37,289 | 0.38 | 0.15 | 141,252 | 55,802 |
Table 3. 2023 MRE by Mineralization Type
* Pit shell constrained resources with demonstrated reasonable prospects for eventual economic extraction (RPEEE) are generated using series of Lerchs-Grossmann pit shell optimizations completed by NCL
* CuT means total copper and CuS means acid soluble copper. Technical and economic parameters include: copper price US$4.00/lb; base mining cost of US$1.51/t with a mining cost adjustment factor of US$0.04/t-10m bench; Heap Leach “HL” processing cost US$5.94/t (incl. G&A); Run-of-Mine “ROM” processing cost US$1.65/t (incl. G&A); SX-EW processing cost and selling cost US$0.16/lb Cu; heap leach recovery 76% of CuT; ROM recovery 40% of CuT; and 42°-52° pit slope angle
* Mineral resources which are not mineral reserves do not have demonstrated economic viability. Due to the uncertainty which may attach to inferred mineral resources, it cannot be assumed that all or any part of an inferred mineral resource will be upgraded to an indicated or measured mineral resource as a result of continued exploration
| Parameter | 2022 MRE | 2023 MRE |
| Mining cost (US$/t mined) | $1.51 base ($1.76 avg.) | $1.51 base ($1.76 avg.) |
| Mining Cost Adjustment Factor (US$/t-10m bench) | $0.04 | $0.04 |
| Heap Leach Cost (including G&A and mining cost component from pit to Heap Leach) | US$5.94/t processed | US$5.94/t processed |
| Run-of-Mine Cost (including G&A and mining cost component from pit to ROM) | US$1.65/t processed | US$1.65/t processed |
| SX-EW processing cost and selling cost (US$/lb Cu) | $0.16 | $0.16 |
| Heap Leach Recovery (% CuT) | 76% | 76% |
| ROM Recovery (% CuT) | 40% | 40% |
| Pit Slope angle | 42 – 52° | 42 – 52° |
Table 4. Summary of Inputs – 2023 MRE (no changes from 2022 MRE)
The Company intends to file an updated technical report to support the updated 2023 MRE on SEDAR within 45 days of this news release or such earlier time in accordance with NI 43-101.
 Follow us on Twitter
 Become our facebook fan


Comments are closed.