TORONTO, Aug. 10, 2021 (GLOBE NEWSWIRE) — Collective Mining Ltd. (TSXV: CNL) ("Collective" or the “Company”) is pleased to announce that it has received $13.5 million as a result of the exercise of common share purchase warrants of the Company (“Warrants”) following the acceleration of the expiry time of the Warrants. The Warrants had an exercise price of $2.00 and were originally issued on May 20, 2021 following the completion of the Company’s qualifying transaction on the TSX Venture Exchange. The holders of the Warrants had 30 trading from the date of the notice of acceleration to exercise their Warrants. All remaining Warrants were cancelled as of 4:00 p.m. (Toronto time) on August 9, 2021. The Company is now fully funded through at least 2022 with a cash balance of approximately $26 million.
About Collective Mining
Collective is an exploration and development company focused on identifying and exploring prospective gold projects in South America. Collective currently holds an option to earn up to a 100% interest in two projects located in Colombia: (i) the San Antonio project; and (ii) the Guayabales project. The 3,780-hectare San Antonio Project is in a historical gold district in the Caldas department of Colombia. An initial drilling program was recently completed at the project with first assay results anticipated in late Q3, 2021. The 3,333-hectare Guayabales Project is also located in the mining friendly Caldas department of Colombia. The Guayabales Project is currently undergoing aggressive surface exploration and a maiden greenfields drilling program is expected to begin in late Q3, 2021.
Contact Information
Collective Mining Ltd.
Paul Begin, Chief Financial Officer
Tel. (416) 451-2727
FORWARD-LOOKING STATEMENTS
This news release contains certain forward-looking statements, including, but not limited to, statements about the use of proceeds from the exercise of the Warrants, the maiden drill program, including timing of results, and Collective’s future and intentions. Wherever possible, words such as “may”, “will”, “should”, “could”, “expect”, “plan”, “intend”, “anticipate”, “believe”, “estimate”, “predict” or “potential” or the negative or other variations of these words, or similar words or phrases, have been used to identify these forward-looking statements. These statements reflect management’s current beliefs and are based on information currently available to management as at the date hereof.
Forward-looking statements involve significant risk, uncertainties, and assumptions. Many factors could cause actual results, performance, or achievements to differ materially from the results discussed or implied in the forward-looking statements. These factors should be considered carefully, and readers should not place undue reliance on the forward-looking statements. Although the forward-looking statements contained in this news release are based upon what management believes to be reasonable assumptions, Collective cannot assure readers that actual results will be consistent with these forward-looking statements. These forward-looking statements are made as of the date of this news release, and Collective assumes no obligation to update or revise them to reflect new events or circumstances, except as required by law. Neither the TSXV nor its Regulation Services Provider (as that term is defined in the policies of the TSXV) accepts responsibility for the adequacy or accuracy of this news release.

Here are four stocks with buy ranks and strong growth characteristics for investors to consider today, August 10th:
Carter's, Inc. CRI: This designer and marketer of branded childrenswear carries a Zacks Rank #1 (Strong Buy), has witnessed the Zacks Consensus Estimate for its current year earnings increasing 21.1% over the last 60 days.
Carters, Inc. Price and Consensus

Carters, Inc. price-consensus-chart | Carters, Inc. Quote
Carter's has a PEG ratio of 0.65 compared with 1.52 for the industry. The company possesses a Growth Score of B.
Carters, Inc. PEG Ratio (TTM)

Carters, Inc. peg-ratio-ttm | Carters, Inc. Quote
Dow Inc. DOW: This provider of various materials science solutions for consumer care, infrastructure, and packaging markets carries a Zacks Rank #1, has witnessed the Zacks Consensus Estimate for its current year earnings increasing 24.6% over the last 60 days.
Dow Inc. Price and Consensus

Dow Inc. price-consensus-chart | Dow Inc. Quote
Dow has a PEG ratio of 0.27, compared with 0.63 for the industry. The company possesses a Growth Score of B.
Dow Inc. PEG Ratio (TTM)

Dow Inc. peg-ratio-ttm | Dow Inc. Quote
ManpowerGroup Inc. MAN: This provider of workforce solutions and services carries a Zacks Rank #1, has witnessed the Zacks Consensus Estimate for its current year earnings increasing 11.2% over the last 60 days.
ManpowerGroup Inc. Price and Consensus

ManpowerGroup Inc. price-consensus-chart | ManpowerGroup Inc. Quote
ManpowerGroup has a PEG ratio of 0.73, compared with 1.01 for the industry. The company possesses a Growth Score of A.
ManpowerGroup Inc. PEG Ratio (TTM)

ManpowerGroup Inc. peg-ratio-ttm | ManpowerGroup Inc. Quote
Albertsons Companies, Inc. ACI: This company that engages in the operation of food and drug stores carries a Zacks Rank #1, has witnessed the Zacks Consensus Estimate for its current year earnings increasing 14.1% over the last 60 days.
Albertsons Companies, Inc. Price and Consensus

Albertsons Companies, Inc. price-consensus-chart | Albertsons Companies, Inc. Quote
Albertsons Companies has a PEG ratio of 0.91, compared with 1.40 for the industry. The company possesses a Growth Score of A.
Albertsons Companies, Inc. PEG Ratio (TTM)

Albertsons Companies, Inc. peg-ratio-ttm | Albertsons Companies, Inc. Quote
See the full list of top ranked stocks here.
Learn more about the Growth score and how it is calculated here.
Want the latest recommendations from Zacks Investment Research? Today, you can download 7 Best Stocks for the Next 30 Days. Click to get this free report
ManpowerGroup Inc. (MAN) : Free Stock Analysis Report
Dow Inc. (DOW) : Free Stock Analysis Report
Albertsons Companies, Inc. (ACI) : Free Stock Analysis Report
Carters, Inc. (CRI) : Free Stock Analysis Report
To read this article on Zacks.com click here.
CRANBROOK, BC / ACCESSWIRE / August 10, 2021 / Eagle Plains Resources (TSXV:EPL) is pleased to announce that option partner Rockridge Resources Ltd. (ROCK)(RRRLF)(RR0) ("Rockridge") plans for an upcoming field program at the Knife Lake Copper Project located in Saskatchewan, Canada (the "Knife Lake Project" or "Property"). The Knife Lake Project, consisting of 81 claims totaling 55,471 hectares (137,069 acres), is an advanced-stage copper, silver, zinc and cobalt exploration property in Saskatchewan host to the Knife Lake Deposit.
Rockridge holds the exclusive option from Eagle Plains to acquire a 100% interest in the Property that covers the Knife Lake Cu-Zn-Ag-Co VMS deposit (details following). The contiguous claims are located approximately 50 km northwest of Sandy Bay, Saskatchewan. A 357kV powerline runs within 16 km of the Knife Lake Deposit area.
See Knife Lake VMS Project Location Map here
Rockridge will be mobilizing field crews and fully funding this permitted summer/fall 2021 exploration program designed to follow up on the encouraging results from the recent 2021 winter/spring diamond drill and geophysical programs. The upcoming field program will include a helicopter-borne electromagnetic (EM) and horizontal magnetic gradiometer geophysical survey utilizing Geotech Ltd.'s VTEM Plus System. Mineralized drill intersections at the Gilbert Lake target area have proven that VTEM plus is a valuable exploration tool for identifying VMS-style mineralization within prospective stratigraphy on the Property, increasing discovery potential of regional target areas. The upcoming program will expand on the previous survey, utilizing modern geophysical techniques coupled with surficial geochemical data and geological mapping to generate drill-ready regional targets to be tested during Rockridge's planned follow-up diamond drill program later in the year.
Rockridge's CEO, Jonathan Wiesblatt, commented: "Knife Lake is an exciting VMS exploration project in a well-known and highly prospective mining jurisdiction in Canada. Although the Knife Lake deposit was discovered some time ago the areas surrounding the deposit including recently identified regional targets must be followed up on as there are strong indications of additional discoveries to be made nearby. We are excited to get back to work at the Knife Lake Property and are encouraged by the results we received in our earlier exploration programs in the winter and spring of 2021. Each additional program is expected to improve our knowledge of the geology at Knife Lake and should help to advance our company towards new discoveries."
Knife Lake Geology and History
The Knife Lake Deposit is interpreted to be a remobilized VMS deposit. The stratabound mineralized zone is approximately 15m thick and contains copper, silver, zinc, gold and cobalt mineralization which dips 30° to 50° eastward over a known strike-length within Rockridge's claim area of 3,700 metres, and a known average down-dip extension of approximately 300 metres.
See Knife Lake Deposit Map here
The deposit is hosted by felsic to intermediate volcanic and volcaniclastic rocks which have been metamorphosed to upper amphibolite facies. The deposit contains VMS mineralogy which has been significantly modified and partially remobilized during the emplacement of granitic rocks. The mineralization straddles the boundary between two rock units and occurs on both limbs of an interpreted overturned fold.
Rockridge completed twelve holes consisting of 1,053 metres of diamond drilling in the 2019 winter drilling program. This represented the first drilling on the property since 2001 and had two primary objectives: confirm the tenor of mineralization reported by previous operators and expand known zones of mineralization. Highlights from the drill program included previously reported hole KF19003 which intersected net-textured to semi-massive sulphide mineralization from 11.2m to 48.8m downhole. This 37.6 metre interval returned 2.03% Cu, 0.19 g/t Au, 9.88 g/t Ag, 0.36% Zn, and 0.01% Co for an estimated 2.42% CuEq. Additionally, previously reported drill hole KF19001 intersected net-textured to fracture-controlled sulphide mineralization from 7.5 metres to 40.6 metres downhole. This 33.1 metre interval returned 1.28% Cu, 0.12 g/t Au, 4.80 g/t Ag, 0.13% Zn, and 0.01% Co for an estimated 1.49% CuEq.
Compilation and initial modelling indicate potential for expansion of the deposit at depth. The recent drilling focused on resource upgrade as well as infill drilling between historical holes. The program gave Rockridge's technical team valuable insights into the property geology, alteration, and mineralization that will be applied to future regional exploration on the highly prospective and underexplored land package.
The Knife Lake deposit is a near surface VMS deposit starting a few metres below surface and the deposit remains open at depth and along strike for potential resource expansion. Recently Rockridge announced a maiden NI 43-101 resource estimate for the Knife Lake deposit (see the News Release dated August 14th, 2019) which consisted of an indicated resource of 3.8 million tonnes at 1.02% CuEq at a 0.4% CuEq cut-off (3.8 MT at 0.83% Cu, 3.7 g/t Ag, 0.097 g/t Au, 82 ppm Co, 1740.7 ppm Zn). In addition, there is an inferred resource of 7.9 million tonnes at 0.67% CuEq at a 0.4% CuEq cut-off (7.9 MT at 0.53% Cu, 2.4 g/t Ag, 0.084 g/t Au, 53.1 ppm Co, 1454.9 ppm Zn). Refer to the NI 43-101 Technical Report on the Mineral Resource Estimate for the Knife Lake Property, Saskatchewan dated September 27, 2019, filed on Sedar.
Knife Lake Option Agreement Details
To earn a 100% interest in the Knife Lake Project, Rockridge has agreed to make a cash payment to Eagle Plains of $150,000 (complete), issue up to 5,550,000 common shares of Rockridge (2,750,000 shares issued to date) and complete $3,250,000 in exploration expenditures ($1,195,000 to date) over four years. Eagle Plains will retain a 2% net smelter royalty ("NSR") on certain claims which comprise the project area. Under the terms of the agreement Rockridge is designated as the Operator of the project.
Qualified Person
Kerry Bates, P. Geo., a "qualified person" for the purposes of National Instrument 43-101 – Standards of Disclosure for Mineral Projects, and a Geologist employed by TerraLogic Exploration Inc., has reviewed and approved the scientific and technical disclosure in this news release relating to the Knife Lake Project.
About Eagle Plains Resources
Based in Cranbrook, B.C., Eagle Plains continues to conduct research, acquire and explore mineral projects throughout western Canada. The Company is committed to steadily enhancing shareholder value by advancing our diverse portfolio of projects toward discovery through collaborative partnerships and development of a highly experienced technical team. Eagle Plains also holds significant royalty interests in western Canadian projects covering a broad spectrum of commodities. Management's focus is to advance its most promising exploration projects. In addition, Eagle Plains continues to seek out and secure high-quality, unencumbered projects through research, staking and strategic acquisitions. Throughout the exploration process, our mission is to help maintain prosperous communities by exploring for and discovering resource opportunities while building lasting relationships through honest and respectful business practices.
Expenditures from 2011-2020 on Eagle Plains-related projects exceed $22M, most of which was funded by third-party partners. This exploration work resulted in approximately 37,000 m of diamond-drilling and extensive ground-based exploration work facilitating the advancement of numerous projects at various stages of development.
On behalf of the Board of Directors
"Tim J. Termuende"
President and CEO
For further information on EPL, please contact Mike Labach at 1 866 HUNT ORE (486 8673)
Email: mgl@eagleplains.com or visit our website at http://www.eagleplains.com
Cautionary Note Regarding Forward-Looking Statements
Neither the TSX Venture Exchange nor its Regulation Services Provider (as that term is defined in the policies of the TSX Venture Exchange) accepts responsibility for the adequacy or accuracy of this release. This news release may contain forward-looking statements including but not limited to comments regarding the timing and content of upcoming work programs, geological interpretations, receipt of property titles, potential mineral recovery processes, etc. Forward-looking statements address future events and conditions and therefore, involve inherent risks and uncertainties. Actual results may differ materially from those currently anticipated in such statements.
SOURCE: Eagle Plains Resources Ltd.
View source version on accesswire.com:
https://www.accesswire.com/659019/Eagle-Plains-Partner-Rockridge-Resources-Plans-Upcoming-Summer-Exploration-Program-at-the-Knife-Lake-Copper-Project-Saskatchewan
Red Hill Iron Limited (ASX:RHI) shareholders (or potential shareholders) will be happy to see that the Executive Chairman, Joshua Pitt, recently bought a whopping AU$1.0m worth of stock, at a price of AU$4.08. There's no denying a buy of that magnitude suggests conviction in a brighter future, although we do note that proportionally it only increased their holding by 2.0%.
Check out our latest analysis for Red Hill Iron
Red Hill Iron Insider Transactions Over The Last Year
In fact, the recent purchase by Joshua Pitt was the biggest purchase of Red Hill Iron shares made by an insider individual in the last twelve months, according to our records. That implies that an insider found the current price of AU$4.39 per share to be enticing. While their view may have changed since the purchase was made, this does at least suggest they have had confidence in the company's future. If someone buys shares at well below current prices, it's a good sign on balance, but keep in mind they may no longer see value. The good news for Red Hill Iron share holders is that an insider was buying at near the current price. The only individual insider to buy over the last year was Joshua Pitt.
You can see the insider transactions (by companies and individuals) over the last year depicted in the chart below. If you click on the chart, you can see all the individual transactions, including the share price, individual, and the date!

Red Hill Iron is not the only stock that insiders are buying. For those who like to find winning investments this free list of growing companies with recent insider purchasing, could be just the ticket.
Insider Ownership
I like to look at how many shares insiders own in a company, to help inform my view of how aligned they are with insiders. Usually, the higher the insider ownership, the more likely it is that insiders will be incentivised to build the company for the long term. It's great to see that Red Hill Iron insiders own 69% of the company, worth about AU$181m. I like to see this level of insider ownership, because it increases the chances that management are thinking about the best interests of shareholders.
So What Does This Data Suggest About Red Hill Iron Insiders?
The recent insider purchase is heartening. And the longer term insider transactions also give us confidence. But we don't feel the same about the fact the company is making losses. Once you factor in the high insider ownership, it certainly seems like insiders are positive about Red Hill Iron. Looks promising! So while it's helpful to know what insiders are doing in terms of buying or selling, it's also helpful to know the risks that a particular company is facing. For instance, we've identified 3 warning signs for Red Hill Iron (2 can't be ignored) you should be aware of.
But note: Red Hill Iron may not be the best stock to buy. So take a peek at this free list of interesting companies with high ROE and low debt.
For the purposes of this article, insiders are those individuals who report their transactions to the relevant regulatory body. We currently account for open market transactions and private dispositions, but not derivative transactions.
This article by Simply Wall St is general in nature. It does not constitute a recommendation to buy or sell any stock, and does not take account of your objectives, or your financial situation. We aim to bring you long-term focused analysis driven by fundamental data. Note that our analysis may not factor in the latest price-sensitive company announcements or qualitative material. Simply Wall St has no position in any stocks mentioned.
Have feedback on this article? Concerned about the content? Get in touch with us directly. Alternatively, email editorial-team (at) simplywallst.com.
Bob Dimond, Executive Vice President and CFO, to Retire After 33 Years in the Industry
BOISE, Idaho, August 10, 2021–(BUSINESS WIRE)–Albertsons Companies (NYSE: ACI) today announced that Sharon McCollam will join the Company on September 7, 2021, as its President and Chief Financial Officer reporting to Vivek Sankaran, Albertsons Cos. Chief Executive Officer. McCollam will succeed Bob Dimond, who will be retiring and will remain with the Company as an advisor through February 2022 to ensure a seamless transition.
McCollam, 59, retired from Best Buy in 2016 where she served as Executive Vice President, Chief Administrative and Chief Financial Officer. She is broadly recognized as the co-pilot of Best Buy’s Renew Blue transformation, which has been regarded as one of the foremost omni-channel transformations in the retail sector. Prior to Best Buy, McCollam held several transformational leadership positions at Williams-Sonoma, Inc. from 2000 to 2012, including Chief Operating and Chief Financial Officer from 2006 to 2012. Since retiring from Best Buy, McCollam has served as a member of several corporate boards, including companies with a strong consumer, e-commerce, and healthcare presence.
As President and Chief Financial Officer of Albertsons Cos., McCollam will assume several leadership responsibilities, including finance, corporate strategy, information technology, supply chain operations, and property development, and will be involved in all aspects of the Company’s growth and transformation strategy. In addition to her proven financial leadership, McCollam brings broad retail and omni-channel operational expertise that will help accelerate the achievement of the Company’s goals.
"I am thrilled to have Sharon join the Albertsons team," said Vivek Sankaran, Chief Executive Officer. "We are entering the next phase of our transformation, centered on building deeper relationships with customers through data, technology, and connected omni-channel solutions. Sharon has done just this throughout her career, helping to engineer multiple retail transformations, including the spectacular turnaround of Best Buy and the digital transformation at Williams-Sonoma. Sharon is well-known for her expertise in retail operations and digital growth strategies as well as her passion for building customer-centric cultures. I look forward to working closely with her to architect the evolution of our strategy and create value for all of our stakeholders."
Sankaran added, "I would like to thank Bob Dimond for his contributions to Albertsons Cos. over the past seven years. He has established a strong foundation for our finance team and was extremely instrumental in our IPO. Bob helped us deliver consistent financial results, improve our balance sheet, and elevate the level of investment in our business. We wish him the very best in his retirement."
McCollam commented, "I am thrilled to be joining Vivek and the Albertsons leadership team during this exciting time in the Company’s history. Albertsons Cos. is a family of iconic brands that empowers and values its people, obsesses over exceeding the expectations of its customers, communities and associates, and operates at the highest levels of humility and integrity in everything it does. It is thriving because its culture is built on values that its people and communities cherish and want to protect. It is a privilege to be joining this incredibly high-performing team and to be stepping back into such an exceptional opportunity that will allow me to leverage my broad multi-brand, multi-channel, and transformation experience as well as participate in one of the most exciting customer-centric digital transformations in integrated grocery and pharmacy today. I could not be more excited to take on this challenge and create the kind of change that will inspire our associates, our customers, and our shareholders."
About Albertsons Companies
Albertsons Companies is a leading food and drug retailer in the United States. As of June 19, 2021, the Company operated 2,278 retail food and drug stores with 1,725 pharmacies, 399 associated fuel centers, 22 dedicated distribution centers and 20 manufacturing facilities. The Company operates stores across 34 states and the District of Columbia under more than 20 well-known banners including Albertsons, Safeway, Vons, Jewel-Osco, Shaws, Acme, Tom Thumb, Randalls, United Supermarkets, Pavilions, Star Market, Haggen, Carrs, Kings Food Markets and Balducci’s Food Lovers Market. The Company is committed to helping people across the country live better lives by making a meaningful difference, neighborhood by neighborhood. In 2020, along with the Albertsons Companies Foundation, the Company gave $260 million in food and financial support, including approximately $95 million through our Nourishing Neighbors Program to ensure those living in our communities have enough to eat. Albertsons Companies also pledged $5 million to organizations supporting social justice. These efforts have helped millions of people in the areas of hunger relief, education, cancer research and treatment, social justice and programs for people with disabilities and veterans outreach.
View source version on businesswire.com: https://www.businesswire.com/news/home/20210810005341/en/
Contacts
INVESTOR RELATIONS CONTACT:
Melissa Plaisance
Melissa.Plaisance@albertsons.com
MEDIA CONTACT:
Kirby Nardo
Kirby.nardo@albertsons.com
NEW YORK, NY / ACCESSWIRE / August 10, 2021 / The Law Offices of Vincent Wong announce that class actions have commenced on behalf of certain shareholders in the following companies. If you suffered a loss you have until the lead plaintiff deadline to request that the court appoint you as lead plaintiff. There will be no obligation or cost to you.
DraftKings Inc. f/k/a Diamond Eagle Acquisition Corp. (NASDAQ:DKNG)
If you suffered a loss, contact us at:https://www.wongesq.com/pslra-1/draftkings-inc-f-k-a-diamond-eagle-acquisition-corp-loss-submission-form?prid=18424&wire=1
Lead Plaintiff Deadline: August 31, 2021
Class Period: December 23, 2019 – June 15, 2021
Allegations against DKNG include that: (i) SBTech Global Limited ("SBTech"), a company acquired by DraftKings, had a history of unlawful operations; (ii) accordingly, DraftKings' merger with SBTech exposed the Company to dealings in black-market gaming; (iii) the foregoing increased the Company's regulatory and criminal risks with respect to these transactions; (iv) as a result of all the foregoing, the Company's revenues were, in part, derived from unlawful conduct and thus unsustainable; (v) accordingly, the benefits of the Business Combination were overstated; and (vi) as a result, the Company's public statements were materially false and misleading at all relevant times.
Coinbase Global, Inc. (NASDAQ:COIN)
If you suffered a loss, contact us at:https://www.wongesq.com/pslra-1/coinbase-global-inc-loss-submission-form?prid=18424&wire=1
Lead Plaintiff Deadline: September 20, 2021
This lawsuit is on behalf of all persons and entities that purchased or otherwise acquired Coinbase Class A common stock pursuant and/or traceable to the Company's registration statement and prospectus for the resale of up to 114,850,769 shares of its Class A common stock, whereby Coinbase began trading as a public company on or around April 14, 2021.
Allegations against COIN include that: (1) the Company required a sizeable cash injection; (2) the Company's platform was susceptible to service-level disruptions, which were increasingly likely to occur as the Company scaled its services to a larger user base; and (3) as a result of the foregoing Defendants' positive statements about the Company's business, operations, and prospects, were materially misleading and/or lacked a reasonable basis.
Piedmont Lithium Inc. (NASDAQ:PLL)
If you suffered a loss, contact us at:https://www.wongesq.com/pslra-1/piedmont-lithium-inc-loss-submission-form?prid=18424&wire=1
Lead Plaintiff Deadline: September 21, 2021
Class Period: March 16, 2018 – July 19, 2021
Allegations against PLL include that: (1) Piedmont has not, and would not, follow its stated steps or timeline to secure all proper and necessary permits; (2) Piedmont failed to inform relevant people and governmental authorities of its actual plans; (3) Piedmont failed to file proper applications with relevant governmental authorities (including state and local authorities); (4) Piedmont and its lithium business does not have “strong local government support”; and (5) as a result, Defendants' public statements were materially false and/or misleading at all relevant times.

To learn more contact Vincent Wong, Esq. either via email vw@wongesq.com or by telephone at 212.425.1140.
Vincent Wong, Esq. is an experienced attorney who has represented investors in securities litigations involving financial fraud and violations of shareholder rights. Attorney advertising. Prior results do not guarantee similar outcomes.
CONTACT:
Vincent Wong, Esq.
39 East Broadway
Suite 304
New York, NY 10002
Tel. 212.425.1140
Fax. 866.699.3880
E-Mail: vw@wongesq.com
SOURCE: The Law Offices of Vincent Wong
View source version on accesswire.com:
https://www.accesswire.com/659199/SHAREHOLDER-ALERT-DKNG-COIN-PLL-The-Law-Offices-of-Vincent-Wong-Reminds-Investors-of-Important-Class-Action-Deadlines
In this article, we discuss the 10 best EV materials stocks to buy. If you want to skip our detailed analysis of these stocks, go directly to the 5 Best EV Materials Stocks to Buy.
The increase in demand for electric vehicles (EVs) around the world over the past few years has also given a boost to companies that sell products critical to the manufacture of these vehicles. In the mining sector, copper and lithium producing firms deal extensively with the EV industry. In the automotive field, firms that sell transmission and electrical systems have contracts with EV makers. Semiconductor manufacturers have also benefited from the rise in EV sales. According to the International Energy Agency, there were more than 10 million EVs on the roads in 2020.
In June, news publication Forbes reported that a group of EV materials stocks picked by a team of experts at the publication had registered year-to-date gains of 17%, comparing favorably to the 15% year-to-date rise in the industry benchmark S&P 500 over the same time period. Some of the prominent names in the electric vehicle industry presently include Tesla, Inc. (NASDAQ: TSLA), Taiwan Semiconductor Manufacturing Company Limited (NYSE: TSM), NIO Inc. (NYSE: NIO), and Freeport-McMoRan Inc. (NYSE: FCX), among others.
Despite the COVID-19 pandemic, electric vehicle makers had a better-than-expected fiscal year, with Tesla, Inc. (NASDAQ: TSLA) registering a record rally through the lockdown that shattered market records. In 2021, after a slow start to the year, EV sales are back on the growth trajectory, with EV makers like Tesla, Inc. (NASDAQ: TSLA) and NIO Inc. (NYSE: NIO) reporting record deliveries. Investment bank Citigroup claims EV makers delivered 227,000 new energy vehicles in China, a big EV market, in June this year, up 15% month-on-month and 166% year-on-year.
A report on the outlook for the electric vehicle industry by the IEA reveals that in the first quarter of this year, EV sales rose by 140% year-on-year. Most of this growth was attributed to the sales of EVs in China and Europe, accounting for 500,000 and 450,000 total deliveries respectively. If the sales of EVs continue to grow, the agency further notes, EVs could represent 7% of the road vehicle fleet by 2030, compared to the 12% goal (230 million EV vehicles on the road) that a Sustainable Development initiative has envisioned. Nickel and cobalt, two key metals required for the production of EV batteries, as well as copper, used in a variety of EV components, have gradually seen demand rise as the sale and production of EVs accelerates. A report by Glencore, a mining firm, has forecast that the demand for these three metals will jump to 1.1 megaton, 314 kiloton, and 4.1 megaton by 2030. The company predicts that if 10 million EVs are sold every year by 2025, nickel demand will increase by 400 kilotons annually.
EV makers have disrupted the auto industry in much the same way as the rise of fintech has impacted the finance world. The entire hedge fund industry is feeling the reverberations of the changing financial landscape. Its reputation has been tarnished in the last decade, during which its hedged returns couldn’t keep up with the unhedged returns of the market indices. On the other hand, Insider Monkey’s research was able to identify in advance a select group of hedge fund holdings that outperformed the S&P 500 ETFs by more than 124 percentage points since March 2017. Between March 2017 and July 2021 our monthly newsletter’s stock picks returned 186.1%, vs. 100.1% for the SPY. Our stock picks outperformed the market by more than 115 percentage points (see the details here). That’s why we believe hedge fund sentiment is an extremely useful indicator that investors should pay attention to. You can subscribe to our free newsletter on our homepage to receive our stories in your inbox.

Our Methodology
With this context in mind, here is our list of the 10 best EV materials stocks to buy. These were ranked keeping in mind analyst ratings, basic business fundamentals, and hedge fund sentiment.
Best EV Materials Stocks to Buy
10. Nano Dimension Ltd. (NASDAQ: NNDM)
Number of Hedge Fund Holders: 11
Nano Dimension Ltd. (NASDAQ: NNDM) is an Israeli firm that makes and sells additive electronics. It is placed tenth on our list of 10 best EV materials stocks to buy. One of the premier products of the firm is the DragonFly lights-out digital manufacturing system that produces circuit-boards, antennas, and sensors, among other things, for prototyping. The company markets these products to the electric vehicle industry as well. It has a market cap of $1.6 billion and posted $3.4 million in revenue last year.
In earnings results for the first quarter, posted on May 20, Nano Dimension Ltd. (NASDAQ: NNDM) reported a revenue of $0.81 million, up more than 15% compared to the revenue over the same period last year.
Out of the hedge funds being tracked by Insider Monkey, New York-based investment firm Renaissance Technologies is a leading shareholder in Nano Dimension Ltd. (NASDAQ: NNDM) with 6.6 million shares worth more than $57 million.
Just like Tesla, Inc. (NASDAQ: TSLA), Taiwan Semiconductor Manufacturing Company Limited (NYSE: TSM), NIO Inc. (NYSE: NIO), and Freeport-McMoRan Inc. (NYSE: FCX), Nano Dimension Ltd. (NASDAQ: NNDM) is one of the best EV materials stocks to buy.
9. BorgWarner Inc. (NYSE: BWA)
Number of Hedge Fund Holders: 27
BorgWarner Inc. (NYSE: BWA) is a company that provides solutions for electric vehicles globally. It is headquartered in Michigan and is ranked ninth on our list of 10 best EV materials stocks to buy. Some of the products that the firm markets include turbo chargers, timing systems, transmission chains, electric air pumps, among other things. In earnings results for the second quarter, posted on August 4, the firm reported earnings per share of $1.08, beating predictions by $0.28. The revenue over the period was $3.7 billion, up 162% year-on-year.
On June 9, investment advisory Baird maintained an Outperform rating on BorgWarner Inc. (NYSE: BWA) stock and raised the price target to $59 from $53, noting that the firm was a top pick of patient value investors.
Out of the hedge funds being tracked by Insider Monkey, Ohio-based investment firm Diamond Hill Capital is a leading shareholder in BorgWarner Inc. (NYSE: BWA) with 7.9 million shares worth more than $369 million.
In addition to Tesla, Inc. (NASDAQ: TSLA), Taiwan Semiconductor Manufacturing Company Limited (NYSE: TSM), NIO Inc. (NYSE: NIO), and Freeport-McMoRan Inc. (NYSE: FCX), BorgWarner Inc. (NYSE: BWA) is one of the best EV materials stocks to buy.
In its Q4 2020 investor letter, Ariel Investments, an asset management firm, highlighted a few stocks and BorgWarner Inc. (NYSE: BWA) was one of them. Here is what the fund said:
“BorgWarner, Inc. was essentially flat in the quarter, underperforming a strong market. Many believe BWA will be hurt by a transition from gas powered cars to electric vehicles (“EV’s”). The company’s turbochargers and powertrain products rely on intellectual property tied to petroleum-based technology. Although the company has worked hard to increase its market share in the EV powertrain market, particularly with the acquisition of Delphi Technologies, we believe the company does have negative exposure to the rapid conversion to an all EV new car fleet. But we believe that this conversion will be gradual, giving BorgWarner time to alter its product offerings accordingly. We continue to monitor developments closely.”
8. MP Materials Corp. (NYSE: MP)
Number of Hedge Fund Holders: 29
MP Materials Corp. (NYSE: MP) is placed eighth on our list of 10 best EV materials stocks to buy. The firm operates from Nevada and engages in rare earth mining and processing. These rare earth metals are used in a variety of products related to electric vehicles. Some of the rare earths marketed by the firm include neodymium and praseodymium, among others. In earnings results for the second quarter, posted on August 5, the firm reported earnings per share of $0.15, beating expectations by $0.04.
On July 23, investment advisory DA Davidson initiated coverage of MP Materials Corp. (NYSE: MP) stock with a Buy rating and a price target of $45, noting that the firm controlled 15% of the global rare earth supply and was poised for growth.
At the end of the first quarter of 2021, 29 hedge funds in the database of Insider Monkey held stakes worth $2.6 billion in MP Materials Corp. (NYSE: MP), down from 32 in the preceding quarter worth $2.7 billion.
Alongside Tesla, Inc. (NASDAQ: TSLA), Taiwan Semiconductor Manufacturing Company Limited (NYSE: TSM), NIO Inc. (NYSE: NIO), and Freeport-McMoRan Inc. (NYSE: FCX), MP Materials Corp. (NYSE: MP) is one of the best EV materials stocks to buy.
7. Allison Transmission Holdings, Inc. (NYSE: ALSN)
Number of Hedge Fund Holders: 30
Allison Transmission Holdings, Inc. (NYSE: ALSN) is ranked seventh on our list of 10 best EV materials stocks to buy. The firm makes and sells automatic transmissions for commercial vehicles and is based in Indiana. It was founded in 1915 and has a market cap of over $4 billion. The company serves the electric vehicle industry as well, offering a suite of specialty products. On July 28, the firm posted earnings for the second quarter, beating market expectations on earnings per share and revenue.
In March, investment advisory Citi maintained a Neutral rating on Allison Transmission Holdings, Inc. (NYSE: ALSN) stock but raised the price target to $46 from $44, underlining that strong demand would boost machinery stocks in the post-pandemic economy.
At the end of the first quarter of 2021, 30 hedge funds in the database of Insider Monkey held stakes worth $498 million in Allison Transmission Holdings, Inc. (NYSE: ALSN), up from 25 in the previous quarter worth $609 million.
Tesla, Inc. (NASDAQ: TSLA), Taiwan Semiconductor Manufacturing Company Limited (NYSE: TSM), NIO Inc. (NYSE: NIO), and Freeport-McMoRan Inc. (NYSE: FCX) are some of the best EV materials stocks to buy, just like Allison Transmission Holdings, Inc. (NYSE: ALSN).
6. Albemarle Corporation (NYSE: ALB)
Number of Hedge Fund Holders: 31
Albemarle Corporation (NYSE: ALB) is a North Carolina-based firm that makes and sells specialty chemicals. It is placed sixth on our list of 10 best EV materials stocks to buy. The firm is one of the top producers of lithium compounds that are used in electric vehicle batteries. As the demand for EV batteries rises, the demand for lithium compounds has skyrocketed. The firm beat marker expectations on earnings per share in the second quarter. It has a market cap of $26 billion and posted $3 billion in revenue last year.
On August 6, investment advisory Deutsche Bank reiterated a Buy rating on Albemarle Corporation (NYSE: ALB) stock and raised the price target to $245 from $190, noting the strong earnings beat by the firm in the second quarter.
At the end of the first quarter of 2021, 31 hedge funds in the database of Insider Monkey held stakes worth $262 million in Albemarle Corporation (NYSE: ALB), up from 21 the preceding quarter worth $126 million.
Tesla, Inc. (NASDAQ: TSLA), Taiwan Semiconductor Manufacturing Company Limited (NYSE: TSM), NIO Inc. (NYSE: NIO), and Freeport-McMoRan Inc. (NYSE: FCX) are some of the best EV materials stocks to buy, alongside Albemarle Corporation (NYSE: ALB).
Click to continue reading and see 5 Best EV Materials Stocks to Buy.
Suggested Articles:
Disclosure. None. 10 Best EV Materials Stocks to Buy is originally published on Insider Monkey.
Pan American Silver (PAAS) came out with quarterly earnings of $0.22 per share, missing the Zacks Consensus Estimate of $0.33 per share. This compares to earnings of $0.28 per share a year ago. These figures are adjusted for non-recurring items.
This quarterly report represents an earnings surprise of -33.33%. A quarter ago, it was expected that this silver mining company would post earnings of $0.31 per share when it actually produced earnings of $0.18, delivering a surprise of -41.94%.
Over the last four quarters, the company has surpassed consensus EPS estimates just once.
Pan American Silver, which belongs to the Zacks Mining – Silver industry, posted revenues of $382.13 million for the quarter ended June 2021, missing the Zacks Consensus Estimate by 16.40%. This compares to year-ago revenues of $249.51 million. The company has topped consensus revenue estimates just once over the last four quarters.
The sustainability of the stock's immediate price movement based on the recently-released numbers and future earnings expectations will mostly depend on management's commentary on the earnings call.
Pan American Silver shares have lost about 26.1% since the beginning of the year versus the S&P 500's gain of 18%.
What's Next for Pan American Silver?
While Pan American Silver has underperformed the market so far this year, the question that comes to investors' minds is: what's next for the stock?
There are no easy answers to this key question, but one reliable measure that can help investors address this is the company's earnings outlook. Not only does this include current consensus earnings expectations for the coming quarter(s), but also how these expectations have changed lately.
Empirical research shows a strong correlation between near-term stock movements and trends in earnings estimate revisions. Investors can track such revisions by themselves or rely on a tried-and-tested rating tool like the Zacks Rank, which has an impressive track record of harnessing the power of earnings estimate revisions.
Ahead of this earnings release, the estimate revisions trend for Pan American Silver was mixed. While the magnitude and direction of estimate revisions could change following the company's just-released earnings report, the current status translates into a Zacks Rank #3 (Hold) for the stock. So, the shares are expected to perform in line with the market in the near future. You can see the complete list of today's Zacks #1 Rank (Strong Buy) stocks here.
It will be interesting to see how estimates for the coming quarters and current fiscal year change in the days ahead. The current consensus EPS estimate is $0.33 on $458.55 million in revenues for the coming quarter and $1.42 on $1.79 billion in revenues for the current fiscal year.
Investors should be mindful of the fact that the outlook for the industry can have a material impact on the performance of the stock as well. In terms of the Zacks Industry Rank, Mining – Silver is currently in the bottom 4% of the 250 plus Zacks industries. Our research shows that the top 50% of the Zacks-ranked industries outperform the bottom 50% by a factor of more than 2 to 1.
Want the latest recommendations from Zacks Investment Research? Today, you can download 7 Best Stocks for the Next 30 Days. Click to get this free report
Pan American Silver Corp. (PAAS) : Free Stock Analysis Report
To read this article on Zacks.com click here.
Zacks Investment Research
Endeavour Silver (EXK) came out with quarterly earnings of $0.01 per share, missing the Zacks Consensus Estimate of $0.03 per share. This compares to loss of $0.02 per share a year ago. These figures are adjusted for non-recurring items.
This quarterly report represents an earnings surprise of -66.67%. A quarter ago, it was expected that this silver mining company would post earnings of $0.02 per share when it actually produced a loss of $0.03, delivering a surprise of -250%.
Over the last four quarters, the company has surpassed consensus EPS estimates just once.
Endeavour Silver, which belongs to the Zacks Mining – Silver industry, posted revenues of $47.78 million for the quarter ended June 2021, surpassing the Zacks Consensus Estimate by 1.33%. This compares to year-ago revenues of $20.2 million. The company has topped consensus revenue estimates three times over the last four quarters.
The sustainability of the stock's immediate price movement based on the recently-released numbers and future earnings expectations will mostly depend on management's commentary on the earnings call.
Endeavour Silver shares have lost about 11.1% since the beginning of the year versus the S&P 500's gain of 18%.
What's Next for Endeavour Silver?
While Endeavour Silver has underperformed the market so far this year, the question that comes to investors' minds is: what's next for the stock?
There are no easy answers to this key question, but one reliable measure that can help investors address this is the company's earnings outlook. Not only does this include current consensus earnings expectations for the coming quarter(s), but also how these expectations have changed lately.
Empirical research shows a strong correlation between near-term stock movements and trends in earnings estimate revisions. Investors can track such revisions by themselves or rely on a tried-and-tested rating tool like the Zacks Rank, which has an impressive track record of harnessing the power of earnings estimate revisions.
Ahead of this earnings release, the estimate revisions trend for Endeavour Silver was unfavorable. While the magnitude and direction of estimate revisions could change following the company's just-released earnings report, the current status translates into a Zacks Rank #4 (Sell) for the stock. So, the shares are expected to underperform the market in the near future. You can see the complete list of today's Zacks #1 Rank (Strong Buy) stocks here.
It will be interesting to see how estimates for the coming quarters and current fiscal year change in the days ahead. The current consensus EPS estimate is $0.07 on $49.7 million in revenues for the coming quarter and $0.22 on $172.67 million in revenues for the current fiscal year.
Investors should be mindful of the fact that the outlook for the industry can have a material impact on the performance of the stock as well. In terms of the Zacks Industry Rank, Mining – Silver is currently in the bottom 4% of the 250 plus Zacks industries. Our research shows that the top 50% of the Zacks-ranked industries outperform the bottom 50% by a factor of more than 2 to 1.
Want the latest recommendations from Zacks Investment Research? Today, you can download 7 Best Stocks for the Next 30 Days. Click to get this free report
Endeavour Silver Corporation (EXK) : Free Stock Analysis Report
To read this article on Zacks.com click here.
San Diego, California–(Newsfile Corp. – August 10, 2021) – Robbins Geller Rudman & Dowd LLP announces that the Piedmont Lithium class action lawsuit seeks to represent purchasers of Piedmont Lithium Inc. (NASDAQ: PLL) securities between March 16, 2018 and July 19, 2021, inclusive ("Class Period") and charges Piedmont Lithium and certain of its top executives with violations of the Securities Exchange Act of 1934. The Piedmont Lithium class action lawsuit is captioned Skeels v. Piedmont Lithium Inc., No. 21-cv-04161, and was commenced on July 23, 2021 in the Eastern District of New York.
If you wish to serve as lead plaintiff of the Piedmont Lithium class action lawsuit, please provide your information by clicking here. You can also contact attorney J.C. Sanchez of Robbins Geller by calling 800/449-4900 or via e-mail at jsanchez@rgrdlaw.com. Lead plaintiff motions for the Piedmont Lithium class action lawsuit must be filed with the court no later than September 21, 2021.
CASE ALLEGATIONS: The Piedmont Lithium class action lawsuit alleges that, throughout the Class Period, defendants made false and misleading statements and failed to disclose that: (i) Piedmont Lithium has not, and would not, follow its stated steps or timeline to secure all proper and necessary permits; (ii) Piedmont Lithium failed to inform relevant people and governmental authorities of its actual plans; (iii) Piedmont Lithium failed to file proper applications with relevant governmental authorities (including state and local authorities); (iv) Piedmont Lithium and its lithium business does not have "strong local government support"; and (v) as a result, defendants' public statements were materially false and/or misleading at all relevant times.
On July 20, 2021, Reuters published an article entitled "In push to supply Tesla, Piedmont Lithium irks North Carolina neighbors" which reported the following, among other things, regarding Piedmont Lithium's regulatory issues in North Carolina: "The company, however, has not applied for a state mining permit or a necessary zoning variance in Gaston County, just west of Charlotte, despite telling investors since 2018 that it was on the verge of doing so. Five of the seven members of the county's board of commissioners, who control zoning changes, say they may block or delay the project . . . ." On this news, Piedmont Lithium's stock price fell nearly 20%, damaging investors.
THE LEAD PLAINTIFF PROCESS: The Private Securities Litigation Reform Act of 1995 permits any investor who purchased Piedmont Lithium securities during the Class Period to seek appointment as lead plaintiff in the Piedmont Lithium class action lawsuit. A lead plaintiff is generally the movant with the greatest financial interest in the relief sought by the putative class who is also typical and adequate of the putative class. A lead plaintiff acts on behalf of all other class members in directing the Piedmont Lithium class action lawsuit. The lead plaintiff can select a law firm of its choice to litigate the Piedmont Lithium class action lawsuit. An investor's ability to share in any potential future recovery of the Piedmont Lithium class action lawsuit is not dependent upon serving as lead plaintiff.
ABOUT ROBBINS GELLER RUDMAN & DOWD LLP: With 200 lawyers in 9 offices nationwide, Robbins Geller Rudman & Dowd LLP is the largest U.S. law firm representing investors in securities class actions. Robbins Geller attorneys have obtained many of the largest shareholder recoveries in history, including the largest securities class action recovery ever – $7.2 billion – in In re Enron Corp. Sec. Litig. The 2020 ISS Securities Class Action Services Top 50 Report ranked Robbins Geller first for recovering $1.6 billion for investors last year, more than double the amount recovered by any other securities plaintiffs' firm. Please visit https://www.rgrdlaw.com/firm.html for more information.
Attorney advertising.
Past results do not guarantee future outcomes.
Services may be performed by attorneys in any of our offices.
Contact:
Robbins Geller Rudman & Dowd LLP
655 W. Broadway, San Diego, CA 92101
J.C. Sanchez, 800-449-4900
jsanchez@rgrdlaw.com

To view the source version of this press release, please visit https://www.newsfilecorp.com/release/92561
RADNOR, PA / ACCESSWIRE / August 10, 2021 / The law firm of Kessler Topaz Meltzer & Check, LLP reminds investors of Piedmont Lithium Inc. f/k/a Piedmont Lithium Limited (NASDAQ:PLL) ("Piedmont") that a securities fraud class action lawsuit has been filed against Piedmont on behalf of those who purchased or acquired Piedmontsecurities between March 16, 2018 and July 19, 2021, inclusive (the "Class Period").
Lead Plaintiff Deadline: September 21, 2021
Contact: James Maro, Esq. (484) 270-1453
Toll free (844) 887-9500
Piedmont engages in the exploration and development of resource projects. Throughout the Class Period, Piedmont informed investors regarding its plan for completing necessary permitting and zoning activities required to commence mining and processing operations in North Carolina. The truth began to emerge on July 20, 2021. Before market hours, Reuters published an article entitled "In push to supply Tesla, Piedmont Lithium irks North Carolina neighbors" which reported serious issues regarding Piedmont's regulatory status in North Carolina.
The complaint alleges that throughout the Class Period, the defendants made false and/or misleading statements and/or failed to disclose that: (1) Piedmont had not, and would not, follow its stated steps or timeline to secure all proper and necessary permits; (2) Piedmont failed to inform relevant people and governmental authorities of its actual plans; (3) Piedmont failed to file proper applications with relevant governmental authorities (including state and local authorities); (4) Piedmont and its lithium business did not have "strong local government support"; and (5) as a result, the defendants' public statements were materially false and/or misleading at all relevant times.
Piedmont investors may, no later than September 21, 2021, seek to be appointed as a lead plaintiff representative of the class through Kessler Topaz Meltzer & Check, LLP, or other counsel, or may choose to do nothing and remain an absent class member. A lead plaintiff is a representative party who acts on behalf of all class members in directing the litigation. In order to be appointed as a lead plaintiff, the Court must determine that the class member's claim is typical of the claims of other class members, and that the class member will adequately represent the class. Your ability to share in any recovery is not affected by the decision of whether or not to serve as a lead plaintiff.
Kessler Topaz Meltzer & Check, LLP prosecutes class actions in state and federal courts throughout the country involving securities fraud, breaches of fiduciary duties and other violations of state and federal law. Kessler Topaz Meltzer & Check, LLP is a driving force behind corporate governance reform, and has recovered billions of dollars on behalf of institutional and individual investors from the United States and around the world. The firm represents investors, consumers and whistleblowers (private citizens who report fraudulent practices against the government and share in the recovery of government dollars). The complaint in this action was not filed by Kessler Topaz Meltzer & Check, LLP. For more information about Kessler Topaz Meltzer & Check, LLP please visit www.ktmc.com.
CONTACT:
Kessler Topaz Meltzer & Check, LLP
James Maro, Jr., Esq.
280 King of Prussia Road
Radnor, PA 19087
(844) 887-9500 (toll free)
info@ktmc.com
SOURCE: Kessler Topaz Meltzer & Check, LLP
View source version on accesswire.com:
https://www.accesswire.com/659216/CLASS-ACTION-ALERT-Kessler-Topaz-Meltzer-Check-LLP-Reminds-Piedmont-Lithium-Inc-Shareholders-of-Securities-Fraud-Class-Action-Lawsuit
VANCOUVER, BC, Aug. 10, 2021 /CNW/ – The following issues have been halted by IIROC:
Company: Highbank Resources Ltd.
TSX-Venture Symbol: HBK
All Issues: Yes
Reason: At the Request of the Company Pending News
Halt Time (ET): 7:45 AM
IIROC can make a decision to impose a temporary suspension (halt) of trading in a security of a publicly-listed company. Trading halts are implemented to ensure a fair and orderly market. IIROC is the national self-regulatory organization which oversees all investment dealers and trading activity on debt and equity marketplaces in Canada.
SOURCE Investment Industry Regulatory Organization of Canada (IIROC) – Halts/Resumptions

View original content: http://www.newswire.ca/en/releases/archive/August2021/10/c0895.html
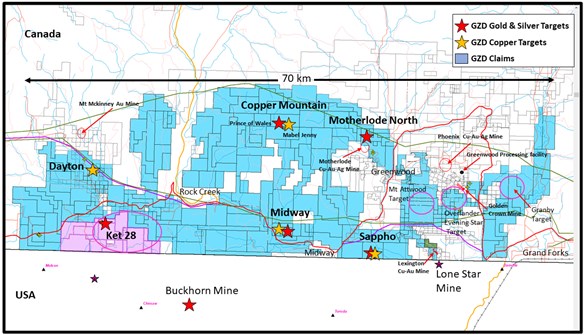
Edmonton, Alberta–(Newsfile Corp. – August 10, 2021) – Grizzly Discoveries Inc. (TSXV: GZD) (OTCQB: GZDIF) (FSE: G6H) ("Grizzly" or the "Company") is pleased to announce that it has entered into an option agreement (the "Option Agreement") with Hi-View Resources Inc. ("Hi-View") for its 80%-owend Ket-28 exploration project in Southeastern BC, Canada.
Under the terms of the Option Agreement, Hi-View will earn a 60% working interest in the property upon completion of the following:
-
Cash payments totaling $500,000 consisting of: (i) $5,000 upon signing of the Option Agreement; (ii) $15,000 upon Hi-View's listing on the CSE; (iii) $50,000 on the first anniversary in order to extend the option; and (iv) further payments totaling $430,000 paid on the first through fifth anniversary dates of Hi-View's listing on the CSE or other recognized stock exchange;
-
Payments totaling 800,000 shares of Hi-View consisting of: (i) 200,000 shares upon Hi-View's listing on the CSE; (ii) 120,000 shares each of the first through fifth anniversary dates of Hi-View's listing upon the CSE or other recognized stock exchange; and
-
Expenditures on the Ket-28 property totaling $1,100,000 consisting of: (i) $100,000 prior to December 31, 2022; (ii) $50,000 prior to the first anniversary date of Hi-View's listing; (iii) $200,000 prior to the second anniversary date of Hi-View's listing; and (iv) $110,000 of spend prior to each of the third through fifth anniversary dates of Hi-View's listing.
About the Ket-28 Property
The Ket-28 claims group is comprised of 16 claims covering 3,432 ha and are part of the Company's larger Greenwood Property located around the town of Greenwood in southeastern BC along the US border.
Historic Drilling at the Ket 28 prospect, located within the Rock Creek claim group of the Greenwood Project, has intersected high grade gold with 52.19 grams per tonne (g/t) Au over 3.35 m core length. Drilling by Grizzly in 2009 and 2010 at the Ket 28 prospect followed up the historic drilling in the mid 1990`s with up to 2.77 g/t Au over 11 m core length and 8.75 g/t Au over 3 m with a higher grade zone of 11.90 g/t Au over 2 m core length.
In 2020, Grizzly completed fifteen drill holes intersecting broad near-surface gold mineralization with key intervals including 1.59 g/t Au over 17.8 m from 43 m, including 7.37 g/t Au over 3.08 m (hole 20KT02), and 0.77 g/t Au over 31 m from 54.5 m, including 1.42 g/t Au over 11.5 m from 61 m (hole 20KT04). More detailed results of the Company's 2020 drill exploration program at Ket 28 were announced by the Company on December 2 and December 21, 2020.
Figure 1: The Grizzly Greenwood Claims and Ket-28 Property (shown in Pink).
To view an enhanced version of Figure 1, please visit:
https://orders.newsfilecorp.com/files/4488/92646_a1948334f4cfeb8d_002full.jpg
Brian Testo, CEO of Grizzly commented, "We are very pleased to be partnering with Hi-View on the Ket-28 property. The planned expenditures and associated exploration work by Hi-View will contribute to a significant advancement in our understanding of the mineralogy at Ket-28. We look forward to work commencing later this year."
The technical content of this news release and the Company's technical disclosure has been reviewed and approved by Michael B. Dufresne, M. Sc., P. Geol., P.Geo., who is the Qualified Person as defined by National Instrument 43-101 Standards of Disclosure for Mineral Projects.
ABOUT GRIZZLY DISCOVERIES INC.
Grizzly is a diversified Canadian mineral exploration company with its primary listing on the TSX Venture Exchange, with 90 million shares issued, focused on developing its over 156,000 acres of precious and base metals properties in southeastern British Columbia. Grizzly is run by a highly experienced junior resource sector management team, who have a track record of advancing exploration projects from early exploration stage through to feasibility stage.
On behalf of the Board,
GRIZZLY DISCOVERIES INC.
Brian Testo, CEO, President
Tel: 780 693 2242
For further information, please visit our website at www.grizzlydiscoveries.com or contact:
Chris Beltgens
Corporate Development
Tel: 604 347 9535
Email: cbeltgens@grizzlydiscoveries.com
Neither the TSX Venture Exchange nor its Regulation Services Provider (as that term is defined in the policies of the TSX Venture Exchange) accepts responsibility for the adequacy or accuracy of this release.
Caution concerning forward-looking information
This press release contains "forward-looking information" and "forward-looking statements" within the meaning of applicable securities laws. This information and statements address future activities, events, plans, developments and projections. All statements, other than statements of historical fact, constitute forward-looking statements or forward-looking information. Such forward-looking information and statements are frequently identified by words such as "may," "will," "should," "anticipate," "plan," "expect," "believe," "estimate," "intend" and similar terminology, and reflect assumptions, estimates, opinions and analysis made by management of Grizzly in light of its experience, current conditions, expectations of future developments and other factors which it believes to be reasonable and relevant. Forward-looking information and statements involve known and unknown risks and uncertainties that may cause Grizzly's actual results, performance and achievements to differ materially from those expressed or implied by the forward-looking information and statements and accordingly, undue reliance should not be placed thereon.
Risks and uncertainties that may cause actual results to vary include but are not limited to the availability of financing; fluctuations in commodity prices; changes to and compliance with applicable laws and regulations, including environmental laws and obtaining requisite permits; political, economic and other risks; as well as other risks and uncertainties which are more fully described in our annual and quarterly Management's Discussion and Analysis and in other filings made by us with Canadian securities regulatory authorities and available at www.sedar.com. Grizzly disclaims any obligation to update or revise any forward-looking information or statements except as may be required by law.
To view the source version of this press release, please visit https://www.newsfilecorp.com/release/92646
Nears Completion of Transformational Green Shift to Tactical Decarbonization
VIRGINIA CITY, Nev., Aug. 10, 2021 (GLOBE NEWSWIRE) — Comstock Mining Inc. (NYSE: LODE) (“Comstock” and the “Company”), an emerging innovator and leader in the sustainable extraction, valorization, and production of high value strategic materials that are essential to meeting the rapidly increasing global demand for clean energy, carbon-neutrality, and natural products, today announced its unaudited financial results for the periods ended June 30, 2021:
Selected Strategic Highlights
-
Net income of $1.9 million for the six months ended June 30, 2021, or $0.05 per basic and diluted share, inclusive of $2.6 million in net gains related to the change in fair value of certain assets.
-
Net increase in shareholders’ equity of $38.5 million for the six months ended June 30, 2021, resulting from restructuring, financing, and investment activities, including total debt elimination and $34.2 million increase in total assets from $43.1 million as of December 31, 2020, to $77.3 million as of June 30, 2021.
-
Solid liquidity, with cash, cash equivalents and restricted cash of $5.3 million, over $20.0 million available under committed investment facilities as of June 30, 2021, and non-dilutive sales efforts underway for non-strategic assets with an expected aggregate cash value of over $25.0 million.
-
Transformational plans are nearing completion, after successfully liquidating non-core assets, eliminating debt, acquiring new technologies, strengthening management, and launching new strategic lines of business.
-
Recently announced lithium-ion battery, industrial hemp, and mercury remediation lines of business are expected to put the Company on track for consolidated annualized revenues exceeding $100,000,000, $300,000,000, and $900,000,000 in 2023, 2024, and 2025, respectively, during the first three full years of operations, not counting the impact of additional pending acquisitions.
“Our transformational efforts have quickened and have been especially impactful during the first half of this year,” said Corrado DeGasperis, Comstock’s Executive Chairman and Chief Executive Officer. “As a result, we have no debt, significant assets and book equity, material non-dilutive sources of cash, a portfolio of cutting-edge clean technologies, and an expanded management team that is laser focused on building an ecosystem of strategic businesses with the capacity for exponential growth and extraordinary financial, natural, and social impacts.”
Focus on Value Creation from Throughput, Revenue, Cash, and Decarbonization
“We are systemically strengthening our organization in ways that sustainably contribute to humanity’s rapidly-escalating demand for increasingly scarce natural resources, including the strategic resources needed to fuel the worldwide surge in, and transition to, clean energy and carbon-neutrality,” added DeGasperis. “To that end, we are targeting a few more commercially viable clean technology transactions that position us for extraordinary growth.”
“Throughput, revenue, cash and decarbonization are the lowest common denominators in each of our existing businesses,” continued DeGasperis. “Our team is focused on that math and the tactical activities that will be necessary to enable rapid and exponential financial, natural and social gains in markets that affect millions, but we are also keenly aware of the costs. We’ve structured each of our acquisitions to minimize dilution, by seeding each line of business with protected uses of our cash and equity, while positioning each line of business with its own cash, equity, and balance sheets, at the project and facility level. We believe that doing so will be an extremely cost-effective way to accelerate and dramatically exceed our pledge to sustainably deliver more than $500 million in shareholder value by 2023. Frankly, we believe our existing platform is already worth multiples of that target based on comparable valuations currently exceeding billions for similar lines of business. Our plans for exceeding those values come down to speed, scale, and leverage, with carbon as the common thread.”
Breakthrough Lithium-Ion Battery Recycling Technologies Enable Extraordinary Increase in Throughput
Comstock previously announced the filing of a Written Determination of Hazardous Waste Recycling (“Application”) by LINICO Corporation (“LiNiCo”), and its state-of-the-art lithium-ion battery (“LIB”) recycling facility (“LIB Recycling Facility”) that has now been designed for increased capacity and yields at a fraction of the capital of the known alternatives. Construction of the first phase of LiNiCo’s new processes will commence at the LIB Recycling Facility upon approval of the Application, with anticipated completion and start-up during the first half of 2022.
About 500,000 tons of expired LIBs containing over $900 million in strategic metals are being landfilled annually. A recent industry report estimated annual growth to more than $26 billion over the next two decades. Once complete, LiNiCo’s first LIB Recycling Facility is expected to scale up to its initial nameplate capacity, exceeding 100,000 tons per year of LIBs over three years, with revenues exceeding $500,000,000, in its third full year.
Renewable Process Solutions, An Engineering Powerhouse
LiNiCo’s capacity breakthroughs are the direct result of our recently acquired engineering, procurement, and construction (“EPC”) company, Renewable Process Solutions, Inc. (“RPS”), and its founder, Mr. Rahul Bobbili.
“Almost instantaneously, RPS and its network of engineering and advanced manufacturing experts integrated themselves into the LiNiCo team, enhancing designs, ensuring quality, reducing capital requirements and shortening lead times,” stated Mr. DeGasperis. “When the RPS engineers began developing breakthrough lithium extraction processes for us in real time, with their existing know-how, we also recognized other compelling synergies.”
RPS and Mr. Bobbili have designed and built 21 advanced renewable fuels production facilities since 2006, and RPS currently provides EPC services for the metals, mining, and renewable fuels industries. RPS also provides advanced equipment manufacturing services through its affiliated manufacturing facilities in the United States and India, at consistently superior qualities and rates. RPS brings Comstock an extraordinary competitive advantage.
Industry Leading, Industrial Scale Hemp Systems
Comstock’s investment in recycling lithium, nickel, and cobalt for cathodes led the Company to identify sources of carbon for use in the production of the graphite needed for LIB anodes, including the possibility of extracting and valorizing carbon from various alternative sources of biomass, such as forestry wastes and industrial hemp.
Industrial hemp is an extraordinary natural resource with tens of thousands of known applications, including food, feed, fuel, and fiber, and an array of emerging applications in batteries, bioplastics, and other renewable alternatives to fossil fuel derived products. Hemp’s ability to produce over 400 natural phytochemicals, such as cannabidiol (“CBD”) and cannabigerol (“CBG”), has also garnered growing attention for the compelling potential of these phytochemicals in health and wellness applications. The corresponding green rush is propelling global demand and sales of industrial hemp products to grow to $6.9 billion worldwide by 2025, according to Hemp Industry Daily.
Comstock and MANA Corporation (“MANA”), acquired a 50% stake in a pre-existing large-scale solvent extraction facility (“Biosciences Facility”) from Lakeview Energy LLC, an experienced agriproducts management company (“Lakeview”), and formed a joint venture with Lakeview to build, operate, and grow the Biosciences Facility.
“We’re proud to have assembled a world class team of industry veterans to rapidly retrofit and commence large scale solvent extraction operations and set a new standard in the industrial hemp industry for quality, compliance, consistency, flexibility and speed at a remarkable scale,” stated Mr. DeGasperis. “Once retrofits are complete in mid-2022, our facility will generate significant free cash flow by servicing a rapidly growing customer base with wholesale hemp products through a suite of custom-tailored hemp extraction, remediation, and refining solutions.”
The Biosciences Facility is expected to scale up to its initial nameplate capacity exceeding 200,000 pounds per day over its first three years, as it extracts, remediates, and refines oil from industrial hemp to generate annualized revenues of over $400,000,000 in its third full year of operations based solely on the small oil fraction of hemp. The remaining biomass is mostly cellulose, with many known co-products that the Company is evaluating for decarbonization synergies, including electrification applications that Company believes have been hiding in plain sight.
Plain Sight Innovations
Comstock has been working closely this year with its research and development partner, Plain Sight Innovations LLC (“PSI”), on several new technologies, including existing and extremely exciting processes for the efficient extraction and valorization of carbon from ubiquitous low-cost sources of feedstock.
“We’re building an ecosystem of strategic extraction and valorization facilities with complimentary feedstocks and products,” continued DeGasperis. “The consumption of any product is powered by its feedstock and, as vast as some feedstock supplies may seem, they are all finite. The world is watching that story unfold in electrification products, with a current focus on the scarcity of lithium and other cathode constituents, and a shared goal of reducing global carbon emissions. However, every cathode in every LIB needs an anode, and the vast majority of anodes are comprised of synthetic graphite, the global supplies of which are nearly all met with carbon intensive fossil fuel derivatives. We see that to be counterproductive, and its exactly the sort of inevitable need that we intend to address with our innovations. We believe that we are positioned ahead of that curve with our carbon and graphite technology developments, and my own extensive experience in building and running carbon and graphite production facilities.”
Comstock believes that the global transition to clean energy, escalating population growth, and accelerating natural resource scarcities are converging into a “perfect storm” of global demand in a broad array of strategic materials, including carbon, metals, and energy – without the corresponding capacity to sustainably meet even a fraction of the demand. The Company is planning and building the capacity to make a material contribution to meeting that demand.
Accelerating Innovation
“Shifting human consumption practices from wasteful and carbon intensive to more profitable, yet sustainable, and carbon neutral or negative requires innovation at unprecedented scales and rates,” added DeGasperis. “Exponential growth requires exponential capacity. We’re designing and deploying our systems for that capacity with our systemic management approach and extensive existing technology portfolio, but we’re still going to need more breakthroughs, speed, and capacity. We strongly believe that breakthrough speed has arrived in the form of quantum computing.”
Classical computing relies on binary states in order to complete logical operations that are either on or off. True or false. One or zero. In contrast, quantum computing is based on physical systems that can be in multiple states simultaneously, with each state having a probability of occurring after measurement. For quantum, that state can simultaneously be black, white, and every shade of grey in between. The distinction is powerful, and it gives quantum computers the potential to process exponentially more operations far more efficiently than classical computers.
The Company invested in Quantum Generative Materials LLC (“GenMat”) to support its development of a proprietary quantum operating system that harnesses emerging quantum computing technologies to accelerate the innovation of breakthrough new materials for use in high-impact applications, including batteries, mining, and decarbonization.
“Quantum computing has the profound potential to resolve urgent challenges of our time, such as global resource scarcity and climate change,” said Mr. DeGasperis. “We’re proud to collaborate with GenMat’s rapidly growing world class team and strategic network of quantum computing professionals and material scientists as they develop exceptional technologies, including specific technologies for direct use in each of our lines of business.”
Comstock and GenMat are focused on applications that accelerate the development of new materials and processes that address resource scarcity by facilitating climate smart mining, electrification, and decarbonization. Consequently, in addition to its investment, Comstock also secured exclusive rights to use GenMat’s quantum technologies in each of those fields of use to complement and enhance its existing operations and planned new business developments.
Triple Bottom Line
DeGasperis concluded: “We are now building a self-sustaining system that develops, builds, scales, and operates systemically-managed, rapidly-scalable, throughput-generating businesses that serve very large, fast-growing markets that enable exponential revenue growth while making globally-meaningful contributions to atmospheric carbon reduction and positive social outcomes. Our plan to do so from here begins with rounding out and deploying our core systems, starting with the completion of some complementary acquisitions and other transactions during the second half of 2021, the completion of construction and the commencement of operations in our lithium-ion battery recycling and industrial hemp extraction facilities in 2022, and the rapid satisfaction of our performance objectives that exceeds our $500,000,000 market value goal well before 2023.”
Conference Call
The Company will host a conference call today, August 10, 2021 at 8:00 a.m. Pacific Time/11:00 a.m. Eastern Time to report Second Quarter results and provide a business update. The Webcast will include a moderated Q&A, after the prepared remarks. Please join the event 10 to 15 minutes prior to the scheduled start time. The link to register in advance for this live Webcast is as follows:
Register in Advance for Our Zoom Webinar
When: August 10, 2021 08:00 AM Pacific Time (US and Canada)
Topic: Comstock Mining Second Quarter 2021 Results and Business Update
Please click the link below to register in advance for this webinar:
https://us02web.zoom.us/webinar/register/WN_AEfv_xN7RoiYEYpzl55gUw
The recording of the Webcast will be available, within 48 hours of the call, on the Company website:
http://www.comstockmining.com/investors/investor-library
About Comstock Mining Inc.
Comstock Mining Inc. (NYSE: LODE) (the “Company”) is an emerging innovator and leader in the sustainable extraction, valorization, and production of scarce natural resources, with a focus on high value strategic materials that are essential to meeting the rapidly increasing global demand for clean energy, carbon-neutrality, and natural products. To learn more, please visit www.comstockmining.com.
Forward-Looking Statements
This press release and any related calls or discussions may include forward-looking statements within the meaning of Section 27A of the Securities Act of 1933, as amended, and Section 21E of the Securities Exchange Act of 1934, as amended. All statements, other than statements of historical facts, are forward-looking statements. The words “believe,” “expect,” “anticipate,” “estimate,” “project,” “plan,” “should,” “intend,” “may,” “will,” “would,” “potential” and similar expressions identify forward-looking statements, but are not the exclusive means of doing so. Forward-looking statements include statements about matters such as: consummation of all pending transactions; project, asset or Company valuations; future industry market conditions; future explorations, acquisitions, investments and asset sales; future performance of and closings under various agreements; future changes in our exploration activities; future estimated mineral resources; future prices and sales of, and demand for, our products; future operating margins; available resources; environmental conservation outcomes; future impacts of land entitlements and uses; future permitting activities and needs therefor; future production capacity and operations; future operating and overhead costs; future capital expenditures and their impact on us; future impacts of operational and management changes (including changes in the board of directors); future changes in business strategies, planning and tactics and impacts of recent or future changes; future employment and contributions of personnel, including consultants; future land sales, investments, acquisitions, joint ventures, strategic alliances, business combinations, operational, tax, financial and restructuring initiatives; the nature and timing of and accounting for restructuring charges and derivative liabilities and the impact thereof; contingencies; future environmental compliance and changes in the regulatory environment; future offerings of equity or debt securities; asset sales and associated costs; future working capital, costs, revenues, business opportunities, debt levels, cash flows, margins, earnings and growth. These statements are based on assumptions and assessments made by our management in light of their experience and their perception of historical and current trends, current conditions, possible future developments and other factors they believe to be appropriate. Forward-looking statements are not guarantees, representations or warranties and are subject to risks and uncertainties, many of which are unforeseeable and beyond our control and could cause actual results, developments and business decisions to differ materially from those contemplated by such forward-looking statements. Some of those risks and uncertainties include the risk factors set forth in our filings with the SEC and the following: counterparty risks; capital markets’ valuation and pricing risks; adverse effects of climate changes or natural disasters; global economic and capital market uncertainties; the speculative nature of gold or mineral exploration, including risks of diminishing quantities or grades of qualified resources; operational or technical difficulties in connection with exploration or mining activities; contests over title to properties; potential dilution to our stockholders from our stock issuances and recapitalization and balance sheet restructuring activities; potential inability to comply with applicable government regulations or law; adoption of or changes in legislation or regulations adversely affecting businesses; permitting constraints or delays; decisions regarding business opportunities that may be presented to, or pursued by, us or others; the impact of, or the non-performance by parties under agreements relating to, acquisitions, joint ventures, strategic alliances, business combinations, asset sales, leases, options and investments to which we may be party; changes in the United States or other monetary or fiscal policies or regulations; interruptions in production capabilities due to capital constraints; equipment failures; fluctuation of prices for gold or certain other commodities (such as silver, zinc, cyanide, water, diesel fuel and electricity); changes in generally accepted accounting principles; adverse effects of terrorism and geopolitical events; potential inability to implement business strategies; potential inability to grow revenues; potential inability to attract and retain key personnel; interruptions in delivery of critical supplies, equipment and raw materials due to credit or other limitations imposed by vendors or others; assertion of claims, lawsuits and proceedings; potential inability to satisfy debt and lease obligations; potential inability to maintain an effective system of internal controls over financial reporting; potential inability or failure to timely file periodic reports with the SEC; potential inability to list our securities on any securities exchange or market; inability to maintain the listing of our securities; and work stoppages or other labor difficulties. Occurrence of such events or circumstances could have a material adverse effect on our business, financial condition, results of operations or cash flows or the market price of our securities. All subsequent written and oral forward-looking statements by or attributable to us or persons acting on our behalf are expressly qualified in their entirety by these factors. Except as may be required by securities or other law, we undertake no obligation to publicly update or revise any forward-looking statements, whether as a result of new information, future events, or otherwise.
Neither this press release nor any related calls or discussions constitutes an offer to sell, the solicitation of an offer to buy or a recommendation with respect to any securities of the Company.
|
Contact Information |
||
|
Comstock Mining Inc. |
Corrado De Gasperis |
Zach Spencer |

Vancouver, British Columbia–(Newsfile Corp. – August 10, 2021) – MAX RESOURCE CORP. (TSXV: MXR) (OTC Pink: MXROF) (FSE: M1D2) ("Max" or the "Company") is pleased to report new assay results, with visible copper mineralization now spanning over 12-square kilometres at the URU zone, located along the 80-kilometre-long CESAR North belt, within Max's 100% owned CESAR copper-silver project in Northeastern Colombia (refer to Figures 1 to 4).
Eight rock samples over widths ranging from 10 to 25-metres returned values of 2.0% copper and above, twenty-one returned values greater than 1.0% copper, with highlight values of 3.9% copper and 37 g/t silver (refer to Table 1).
Rock chip channel results from values of 2.0% copper:
-
3.9% copper and 7 g/t silver over widths of 10-metres;
-
3.0% copper and 6 g/t silver over widths of 10-metres;
-
3.0% copper and 37 g/t silver over widths of 10-metres;
-
2.5% copper and 12 g/t silver over widths of 10-metres;
-
2.4% copper and 12 g/t silver over widths of 10-metres;
-
2.0% copper and 9 g/t silver over widths of 10-metres.
Reported representative grab samples collected over widths of 25-metres returned 2.7% and 2.2% copper (refer to Table 1). In addition, Max is awaiting assay results located along 10-kilometres of strike (refer to the white dots on Figure 2).
"The widespread nature of the copper mineralization over significant widths demonstrates the major-scale potential of the URU zone, that is open in all directions. We look forward to additional URU zone copper assay results due late next month," commented Max CEO, Brett Matich.
"Max's in-country team is continuing its field exploration programs through to end of year," he concluded.

Figure 1. CESAR Copper-Silver Project.
https://www.maxresource.com/images/gallery/MXR_CESAR_31.jpg
To view an enhanced version of Figure 1, please visit:
https://orders.newsfilecorp.com/files/3834/92631_b2bfa146f4d9686f_002full.jpg

Figure 2. CESAR North, URU assays and assays pending locations.
https://www.maxresource.com/images/gallery/MXR_CESAR_32.jpg
To view an enhanced version of Figure 2, please visit:
https://orders.newsfilecorp.com/files/3834/92631_b2bfa146f4d9686f_003full.jpg

Figure 3. 3D model shows the major-scale potential of the URU zone and is open in all directions.
https://www.maxresource.com/images/gallery/MXR_CESAR_33.jpg
To view an enhanced version of Figure 3, please visit:
https://orders.newsfilecorp.com/files/3834/92631_b2bfa146f4d9686f_004full.jpg
The URU copper mineralization is hosted in a stockwork within igneous host rock that crosscuts sediment-hosted stratabound mineralization. Observed minerals include chalcocite, native copper, cuprite and copper oxide. The copper mineralization is often associated with the presence of epidote.
Max interprets the sediment-hosted stratabound copper-silver mineralization in the Cesar Basin to be analogous to both the Central African Copper Belt (CACB) and the Polish Kupferschiefer. Almost 50 percent of the copper known to exist in sediment-hosted deposits is contained in the CACB, including Ivanhoe Mines Ltd (TSX: IVN) 95-billion-pound Kamoa-Kakula copper deposits in the Congo.
Kupferschiefer, the world's largest silver producer and Europe's largest copper source, mining an orebody of 0.5 to 5.5-metres thick at depths of 500m, grading 1.49% copper and 48.6 g/t silver. The silver yield is almost twice the production of the world's second largest silver mine.
Source: Central African Belt Descriptive models, grade-tonnage relations, and databases for the assessment of sediment-hosted copper deposits with emphasis on deposits in the Central Africa Copperbelt, Democratic Republic of the Congo and Zambia by USGS 2010. Kamoa-Kakula by OreWin March 2020. World Silver Survey 2020 and Kupferschiefer Deposits & Prospects in SW Poland, September 27, 2019. Max cautions investors that the presence of copper mineralization of the Central African Copper Belt and the Polish Kupferschiefer are not necessarily indicative of similar mineralization at CESAR.
|
Sample |
Sample Type |
Width (m) |
Copper (%) |
Silver (g/t) |
|
878781 |
Chip channel |
10.0 |
3.9 |
7 |
|
876379 |
Chip channel |
10.0 |
3.0 |
6 |
|
876363 |
Chip channel |
10.0 |
3.0 |
37 |
|
876288 |
Representative grab |
25.0 |
2.7 |
3 |
|
876253 |
Chip channel |
10.0 |
2.5 |
12 |
|
876262 |
Chip channel |
10.0 |
2.4 |
12 |
|
876278 |
Representative grab |
25.0 |
2.2 |
6 |
|
878761 |
Chip channel |
10.0 |
2.0 |
9 |
|
876307 |
Rock Panel |
1.0 x 1.0 |
2.0 |
9 |
|
876531 |
Chip channel |
10.0 |
1.9 |
4 |
|
876350 |
Chip channel |
10.0 |
1.8 |
2 |
|
876530 |
Chip channel |
10.0 |
1.7 |
2 |
|
876398 |
Chip channel |
10.0 |
1.7 |
6 |
|
876380 |
Chip channel |
10.0 |
1.5 |
2 |
|
878769 |
Chip channel |
10.0 |
1.5 |
3 |
|
876294 |
Representative grab |
25.0 |
1.4 |
2 |
|
876528 |
Chip channel |
10.0 |
1.3 |
3 |
|
878790 |
Representative grab |
25.0 |
1.2 |
4 |
|
876518 |
Chip channel |
10.0 |
1.1 |
2 |
|
878770 |
Chip channel |
10.0 |
1.1 |
2 |
|
876520 |
Chip channel |
10.0 |
1.1 |
3 |
|
878784 |
Representative grab |
25.0 |
1.1 |
4 |
|
876515 |
Chip channel |
10.0 |
1.0 |
2 |
Table 1. URU rock chip channel and representative rock grab sample results with values of 1% copper or above. Max cautions investors that grab sampling can be selective and are not necessarily representative of the mineralization.
QUALITY ASSURANCE
All samples were shipped to the ALS Lab sample preparation facility in Medellin, Colombia. Sample pulps are sent to Lima, Peru for analysis. All samples are analyzed using ALS procedure ME-MS41, a four-acid digestion with ICP finish. Over limit copper and silver are determined by ALS procedure OG-62, a four-acid digestion with an AAS finish. ALS Labs is independent from Max. Max is not aware of any other factors that could materially affect the accuracy or reliability of the data referred to herein.
QUALIFIED PERSON
The Company's disclosure of a technical or scientific nature in this news release has been reviewed and approved by Tim Henneberry, P Geo (British Columbia), a member of the Max Resource Advisory Board, who serves as a qualified person under the definition of National Instrument 43-101.
CESAR COPPER-SILVER PROJECT IN COLOMBIA – OVERVIEW
CESAR is located along the 200-kilometre-long Cesar Basin in NE Colombia encompassing widespread highly prospective copper-silver mineralization. This region enjoys major infrastructure resulting from oil & gas and mining operations, including Cerrejon, the largest coal mine in Latin America, now held by global miner Glencore (refer to Figure 5).

Figure 4. CESAR Project location.
https://www.maxresource.com/images/gallery/MXR_CESAR_34.jpg
To view an enhanced version of Figure 4, please visit:
https://orders.newsfilecorp.com/files/3834/92631_b2bfa146f4d9686f_005full.jpg
Due to the district-scale copper-silver prospectivity of the Cesar Basin, Max has implemented a multi-faceted exploration program for 2021:
Advanced Drill Core Analysis and Modelling: ongoing interpretation of seismic sections and analysis of historical drill holes are all being integrated into our structural modelling of the Cesar Basin, in collaboration with Ingeniería Geológica Universidad Nacional de Colombia ("IGUN") in Medellín (January 7, 2021 NR);
Geochemical and Mineralogical: geochemical and mineralogy research programs by the University of Science and Technology ("AGH") of Krakow, Poland. AGH bring their extensive knowledge of KGHM's world renowned Kupferschiefer sediment-hosted copper-silver deposits in Poland to the CESAR project;
Geophysical: Fathom Geophysics is interpreting seismic data, funded by the Company in collaboration with one of the world's leading copper producer;
Proprietary Field Exploration & Techniques: Max's in-country exploration teams continue to target new copper-silver stratabound mineralized zones;
-
CESAR North 80-kilomtre-long-copper-silver zone:
-
In 2020, Max identified the AMS (previously named AM South) and AMN (previously named AM North) stratabound copper-silver zones, collectively spanning over 45-km², highlight values of 0.1 to 34.4% copper and 5.0 to 305.0 g/t silver over intervals ranging 0.1 to 25.0-metres;
-
In March 2021, Max's CONEJO discovery, now spans 3.2-km by 1.6-km and open in all directions. CONEJO returned values greater than 5.0% copper from 23 rock panels varying from 5.0m by 5.0m to 1.0m by 1.0m, 66 rock panel samples returned values over 1.0% copper (March 24, 2021 NR):
-
12.5% copper + 84 g/t silver over 5.0-metre by 5.0-metre
-
10.5% copper + 50 g/t silver over 3.0-metre by 2.0-metre
-
10.4% copper + 95 g/t silver over 5.0-metre by 5.0-metre
-
10.2% copper + 62 g/t silver over 5.0-metre by 5.0-metre
-
10.0% copper + 80 g/t silver over 5.0-metre by 5.0-metre
-
8.7% copper + 89 g/t silver over 5.0-metre by 5.0-metre
-
8.4% copper + 60 g/t silver over 5.0-metre by 5.0-metre
-
7.9% copper + 21 g/t silver over 5.0-metre by 5.0-metre
-
7.7% copper + 84 g/t silver over 5.0-metre by 5.0-metre
-
7.4% copper + 47 g/t silver over 5.0-metre by 5.0-metre
-
-
The 2021 URU discovery is located 30-km south of CONEJO, now expanded to 12-km² and open in all directions. URU appears to have major-scale potential; Thirteen rock samples over widths ranging from 10 to 25-metres returned values of 2.0% copper and above, thirty-seven returned values greater than 1.0% copper, with highlight values of 5.7 % copper and 37 g/t silver:
-
4.3% copper and 8 g/t silver over widths of 10-metres
-
3.9% copper and 7 g/t silver over widths of 10-metres
-
3.6% copper and 12 g/t silver over widths of 10-metres
-
3.0% copper and 6 g/t silver over widths of 10-metres
-
3.0% copper and 37 g/t silver over widths of 10-metres
-
-
Late April 2021, Max identified the SP target, which lies along the mid portion of the CESAR North 80-km belt in line with the four previous copper discoveries URU, CONEJO, AMN and AMS;
-
Exploration continues on CONEJO and the URU zone;
-
In addition, Max has initiated the process of mineral claim approvals and drill permitting;
-
-
CESAR West: Max has identified copper porphyry mineralization along a significant target zone.
ABOUT MAX RESOURCE CORP.
Max Resource Corp. is a copper and precious metals exploration company, engaged in advancing both newly discovered global scale CESAR copper-silver project (100% owned) in Colombia and the newly acquired RT Gold project (100% earn-in) in Peru. Both projects have potential for the discovery of large-scale mineral deposits; both stratabound-type copper-silver in Colombia and high-grade gold porphyry and massive sulfide in Peru.
Max Resource was awarded a Top 10 Ranked Company in the Mining Sector on the TSX Venture 50™ for 2021, achieving a market cap increase of 1,992% and a share price increase of 282% in 2020.
For more information visit: https://www.maxresource.com/
For more information visit: www.tsx.com/venture50
TSX Venture 50™ for 2021 video: MAX Resource Corp. (TSXV: MXR) – 2021 TSX Venture 50 – YouTube
For additional information contact:
Max Resource Corp.
Tim McNulty
E: info@maxresource.com
T: (604) 290-8100
*The Venture 50 ranking is provided by TSX Venture Exchange Inc. ("TSXV") for information purposes only. Neither TMX Group Limited nor any of its affiliated companies guarantees the completeness of this information and are not responsible for any errors or omissions in or any use of, or reliance on, this information. The Venture 50 program is not an invitation to purchase securities listed on TSX Venture Exchange. TSXV and its affiliates do not endorse or recommend any of the referenced securities or issuers, and this information should not be construed as providing any trading, legal, accounting, tax, investment, business, financial or other advice and should not be relied on for such purposes"
Neither TSX Venture Exchange nor its Regulation Services Provider (as that term is defined in the policies of the TSX Venture Exchange) accepts responsibility for the adequacy or accuracy of this release
Except for statements of historic fact, this news release contains certain "forward-looking information" within the meaning of applicable securities law. Forward-looking information is frequently characterized by words such as "plan", "expect", "project", "intend", "believe", "anticipate", "estimate" and other similar words, or statements that certain events or conditions "may" or "will" occur. Forward-looking statements are based on the opinions and estimates at the date the statements are made and are subject to a variety of risks and uncertainties and other factors that could cause actual events or results to differ materially from those anticipated in the forward-looking statements including, but not limited to delays or uncertainties with regulatory approvals, including that of the TSXV. There are uncertainties inherent in forward-looking information, including factors beyond the Company's control. There are no assurances that the commercialization plans for Max Resources Corp. described in this news release will come into effect on the terms or time frame described herein. The Company undertakes no obligation to update forward-looking information if circumstances or management's estimates or opinions should change except as required by law. The reader is cautioned not to place undue reliance on forward-looking statements. Additional information identifying risks and uncertainties that could affect financial results is contained in the Company's filings with Canadian securities regulators, which filings are available at www.sedar.com.
To view the source version of this press release, please visit https://www.newsfilecorp.com/release/92631
President Biden's $1 trillion infrastructure bill did a lot to counter fears of Covid sweeping through China, with oil prices beginning to bounce back.


Chart of the Week

– July fuel demand in India rebounded to its highest since April as New Delhi cleared restrictions and lockdowns, netting a 3% month-on-month increase to a total of 16.83 million tons.
– The rebound might have been even more pronounced, were it not for fuel prices rising to all-time highs, triggered by a chaotic taxation regime.
– In India, petroleum products are not included in the goods and services tax regime, meaning every state can set its own fuel tax levies and they have been on the rise throughout 2021, up 20% year-on-year already.
– Analysts anticipate India surpassing its pre-pandemic consumption readings in Q4-2021, with fuel pricing remaining the primary factor in the extent of demand recovery.
– Crude imports in June-July dropped to average 2014-2015 levels of 3.5 mbpd, but August loadings have surged to a healthy 4.2 mbpd on the back of demand recovery.
Market Movers
– Saudi Aramco (TADAWUL:2222) saw its Q2 results surge as higher oil prices brought its net profit to $25.5 billion, quadrupling year-on-year. Aramco’s capex infrastructure has been increasing q-o-q as the Saudi NOC seeks to ramp up offshore spare production capacity.
– Australian miner BHP (NYSE:BHP) managed to stave off a union strike at the Escondida copper mine in Chile, the world’s largest, though negotiations are still yet to yield results. With copper prices almost 25% up on the year, the strike would see copper skyrocket.
– US electric vehicle producer Tesla (NASDAQ:TSLA) saw its July sales in China plunge by almost 70% month-on-month, despite having dropped the starting price for Model 3 sedans, sapping confidence in future prospects.
Tuesday, August 10, 2021
Oil prices rebounded from last week’s losses as the market seemed to shrug off fears of Chinese lockdowns, with demand strength across the Atlantic overshadowing COVID-related concerns. It is assumed President Biden’s $1 trillion infrastructure bill will boost oil product demand and lift US economic performance in the short-to-mid term, providing much-needed support for prices.
IPCC Report Targets Methane. The landmark report by the UN Intergovernmental Panel on Climate Change calls on the global community to make “strong, rapid and sustained reductions” in methane emissions alongside CO2-related initiatives. Having 80 times the warming power of CO2 per unit of mass, methane nevertheless has a much shorter atmospheric lifetime of some 20 years.
Iran Cuts Electricity Supply to Iraq. Facing unprecedentedly high domestic power demand, Iran has cut electricity exports to Iraq, despite there being a US waiver allowing it. Iran routinely exports some 2GW to its neighbors, but this August its exports dropped more than tenfold, to 150MW.
US Refiner Seeks EV Battery Move. The US’ fourth-largest refiner, Philips 66 (NYSE:PSX), is mulling a larger move towards electric vehicle batteries and EV storage systems as it seeks to leverage its graphite know-how and existing non-fossil retailing solutions.
Cargill Reports Largest-Ever Profit. The largest privately-held US company, the agriculture giant Cargill, recorded the highest-ever net income in its 156-year history with its 2021 fiscal year results, amounting to $4.93 billion. Following a brief one-year pause in COVID-stricken 2020, Cargill resumed making its results public.
China cutting runs as Delta variant hits refining. China’s state-owned oil refiner Sinopec (NYSE:SHI) is cutting run rates by 5-10% across China as strict government-mandated mobility curtailments and restrictive measures slacken its demand nationwide.
Petrobras Wants to Emulate Guyana. The Brazilian state oil company Petrobras (NYSE:PBR) plans to drill two wildcats in the Foz do Amazonas offshore basin, seeking to replicate the drilling success of Guyana and Suriname. Petrobras controls all six blocks in the basin after BP and Total bailed out of the project.
Related: Do Lithium Batteries Pose A Major Fire Hazard?
Rio Tinto Mismanages Supergiant Mongolian Mine. The WSJ reports that an expert group found that the main reason why Rio Tinto’s (NYSE:RIO) largest copper project, the Oyu Tolgoi mine in Mongolia, has seen its initial $5.3 billion budget expand by another $1.5 billion, lies in the mismanagement of the asset. Rio Tinto shares dropped 3% over the week.
ExxonMobil Suspended from US Climate Group. US oil major ExxonMobil (NYSE:XOM) was unseated from the Climate Leadership Council, a group promoting a US federal carbon price, following a leaked recording of a company lobbyist stating the firm is watering down climate measures with the White House.
Billionaire-Backed Startup to Search Greenland for EV Metals. KoBold Metals, a mineral exploration company backed by Bill Gates and Jeff Bezos, signed an agreement with Bluejay Mining (LON:JAY) to join the search for nickel, copper, cobalt and other metals in Greenland’s Disko-Nuussuaq acreage, Reuters reports.
Canada Eyes Asia Pacific Exports. Canada’s Trans Mountain pipeline expansion, with a throughput capacity of 590kbpd, shall be ready by December 2022, allowing Canadian oil producers to export crude to East Asian markets. CNR (TSE:CNR), Suncor (NYSE:SU), Imperial Oil (TSE:IMO), and others have already claimed their stake in the pipeline’s offtake.
Mozambique Retakes Key LNG Port with Rwandan Help. The strategically located Mocimboa da Praia port town was retaken by joint Mozambique-Rwandan forces, presumably taking the first step in restarting the halted 13 mtpa Mozambique LNG project operated by TotalEnergies (NYSE:TTE).
Russia Raises Metals Taxation. Russian President Vladimir Putin announced that his government would increase the mineral extraction tax on metals in 2022, the third time since the start of this year that the Kremlin hikes taxes on metals as it seeks to fill its deficit budget.
Japan Ends 300 Years of Trading Rice Futures. The first commodity exchange in the world, the Japanese Dojima Exchange trading rice futures, will end trading in June 2022 as Japan’s agriculture ministry refused to reissue its license, arguing the traded volumes were too small to maintain trades.
By Tom Kool for Oilprice.com
More Top Reads From Oilprice.com:
Read this article on OilPrice.com
Vancouver, British Columbia–(Newsfile Corp. – August 10, 2021) – ALX Resources Corp. (TSXV: AL) (FSE: 6LLN) (OTC: ALXEF) ("ALX" or the "Company") is pleased to provide an update for its 100%-owned Vixen Gold Project ("Vixen" or the "Project") located in the Red Lake Mining District of Ontario. Vixen consists of three sub-projects totaling 10,614 hectares (26,227 acres), Vixen North, Vixen South and Vixen West, located within the Birch-Uchi greenstone belt approximately 60 kilometres (37 miles) east of Red Lake, Ontario.
Vixen North Exploration Permit
In the fall of 2020, ALX completed a high-resolution helicopter-borne magnetic and VLF-EM survey totaling 475.7 line-kilometres to over a known 3,000 metre-long high magnetic trend and other important structural trends present at Vixen North. Drill targets were subsequently defined by the integration of the airborne survey results with the geochemical results of site visits carried out in 2019 and 2020 (see ALX news release dated October 29, 2020), which led to the filing of an exploration permit application for Vixen North.
In late June 2021, following a positive engagement with local First Nations, ALX received an exploration permit from the Ontario Ministry of Energy, Northern Development and Mines (the "Permit"). The Permit allows for diamond drilling at up to ten locations at Vixen North totaling approximately 1,000 metres (3,280 feet), and is effective until June 28, 2024. The drilling program is designed to be helicopter-supported with a start date to be determined, due to the continuing forest fire emergency and the resulting moratorium on exploration activities in the Red Lake Mining District.
Vixen South Claims Acquisition
In early May 2021, ALX executed an option-to-purchase agreement with arm's-length vendors (the "Vendors") to purchase a 100% interest in a group of claims west of Grace Lake, consisting of nineteen claim units and a single patented claim (the "Claims", see ALX news release dated May 12, 2021). The Claims comprise approximately 384 hectares (949 acres) and are located along the northern edge of the Vixen South claim block.
ALX carried out due diligence on the Claims, which included a site visit in late June 2021 before forest fires effectively closed off access to the Vixen South area. In August 2021, ALX decided to exercise its right to purchase a 100% interest in the Claims in exchange for a total of $40,000 cash and 500,000 common shares of ALX. The Claims remain subject to a 2.5% net smelter returns royalty ("NSR") in favour of the Vendors, which can be purchased in its entirety by ALX for $2.5 million. This transaction is subject to the acceptance of the TSX Venture Exchange.
Click here for maps and photos of the Vixen Gold Project
National Instrument 43-101 Disclosure
The technical information in this news release has been reviewed and approved by Jody Dahrouge, P.Geo., a Director of ALX, who is a Qualified Person in accordance with the Canadian regulatory requirements set out in National Instrument 43-101.
About ALX
ALX is based in Vancouver, BC, Canada and its common shares are listed on the TSX Venture Exchange under the symbol "AL", on the Frankfurt Stock Exchange under the symbol "6LLN" and in the United States OTC market under the symbol "ALXEF". ALX's mandate is to provide shareholders with multiple opportunities for discovery by exploring a portfolio of prospective mineral properties, which include gold, nickel, copper, and uranium projects. The Company uses the latest exploration technologies and holds interests in over 200,000 hectares of prospective lands in Saskatchewan and Ontario, stable Canadian jurisdictions that collectively host the highest-grade uranium mines in the world, and offer a significant legacy of production from gold and base metals mines.
ALX owns 100% interests in the Firebird Nickel Project (now under option to Rio Tinto Exploration Canada Inc., who can earn up to an 80% interest), the Flying Vee Nickel/Gold and Sceptre Gold projects, and can earn up to an 80% interest in the Alligator Lake Gold Project, all located in northern Saskatchewan, Canada. ALX owns, or can earn, up to 100% interests in the Vixen Gold Project, the Electra Nickel Project and the Cannon Copper Project located in historic mining districts of Ontario, Canada, and in the Draco VMS Project in Norway. ALX holds interests in a number of uranium exploration properties in northern Saskatchewan, including a 20% interest in the Hook-Carter Uranium Project, located within the prolific Patterson Lake Corridor, with Denison Mines Corp. (80% interest) operating exploration since 2016, a 40% interest in the Black Lake Uranium Project, a joint venture with UEX Corporation and Orano Canada Inc., and a 100% interest in the Gibbons Creek Uranium Project.
For more information about the Company, please visit the ALX corporate website at www.alxresources.com or contact Roger Leschuk, Manager, Corporate Communications at: PH: 604.629.0293 or Toll-Free: 866.629.8368, or by email: rleschuk@alxresources.com
On Behalf of the Board of Directors of ALX Resources Corp.
"Warren Stanyer"
Warren Stanyer, CEO and Chairman
FORWARD-LOOKING STATEMENTS
Statements in this document which are not purely historical are forward-looking statements, including any statements regarding beliefs, plans, expectations or intentions regarding the future. Forward-looking statements in this news release include references to ALX's exploration projects, prospective for minerals, and the Company's plans to undertake exploration activities at its projects. It is important to note that the Company's actual business outcomes and exploration results could differ materially from those in such forward-looking statements. Risks and uncertainties include that ALX may not be able to fully finance exploration at its projects, including drilling; our initial findings at its projects may prove to be unworthy of further expenditure; commodity prices may not support exploration expenditures at its projects; and economic, competitive, governmental, public health, environmental and technological factors may affect the Company's operations, markets, products and share price. Even if we explore and develop our projects, and even if gold or other metals or minerals are discovered in quantity, the project may not be commercially viable. Additional risk factors are discussed in the Company's Management Discussion and Analysis for the Three Months Ended March 31, 2021, which is available under Company's SEDAR profile at www.sedar.com. Except as required by law, we will not update these forward-looking statement risk factors.
Neither the TSX Venture Exchange nor its Regulation Services Provider (as that term is defined in the policies of the TSX Venture Exchange) accepts responsibility for the adequacy or accuracy of this release.

To view the source version of this press release, please visit https://www.newsfilecorp.com/release/92580
Vancouver, British Columbia–(Newsfile Corp. – August 10, 2021) – Wealth Minerals Ltd. (TSXV: WML) (OTCQB: WMLLF) (SSE: WMLCL) (FSE: EJZN) (the "Company" or "Wealth") announces it has agreed with Gold Springs Resource Corp. ("GRC") (TSX: GRC) to purchase 13,225,198 common shares (each, a "WCU Share") of World Copper Ltd. ("WCU") (TSXV: WCU) held by a subsidiary of GRC, for an aggregate purchase price of $4,364,315. This transaction, at a price of $0.33 per WCU Share, is priced at an approximate 15.4% discount to the August 9, 2021 closing price of WCU at $0.39 per WCU Share.
This opportunistic transaction allows Wealth to capitalize on its familiarity with World Copper's assets to acquire a large block of shares at a substantial discount. Wealth Minerals intends to hold the WCU Shares as an investment; and believes that they will provide significant long-term value for Wealth and its shareholders.
Of the WCU Shares able to be purchased by Wealth, 9,918,898 WCU Shares will remain subject to a TSX Venture Exchange Value Securities Escrow Agreement (the "Escrow Agreement") and will be released from escrow in accordance with the terms thereof (for more details regarding the Escrow Agreement, see WCU's news release of January 18, 2021 available on WCU's SEDAR profile at www.sedar.com).
Wealth may, at its sole discretion, arrange for all or a portion of the WCU Shares to be purchased by Wealth and/or certain eligible purchasers (each such eligible purchaser, a "Substituted Purchaser") under the Escrow Agreement. Wealth and/or the Substituted Purchasers will complete the transaction by no later than October 22, 2021.
About Wealth Minerals Ltd.
Wealth is a mineral resource company with interests in Canada, Mexico and Chile. The Company's main focus is the acquisition and development of lithium projects in South America. To date, the Company has positioned itself to work alongside existing producers in the prolific Atacama salar, where the Company has a substantial license package.
Lithium market dynamics and a rapidly increasing metal price are the result of profound structural issues with the industry meeting anticipated future demand. Wealth is positioning itself to be a major beneficiary of this future mismatch of supply and demand. The Company also maintains and continues to evaluate a portfolio of precious and base metal exploration-stage projects.
For further details on the Company readers are referred to the Company's website (www.wealthminerals.com) and its Canadian regulatory filings on SEDAR at www.sedar.com.
On Behalf of the Board of Directors of
WEALTH MINERALS LTD.
"Hendrik van Alphen"
Hendrik van Alphen
Chief Executive Officer
For further information, please contact:
Marla Ritchie
Phone: 604-331-0096 Ext. 3886 or 604-638-3886
E-mail: info@wealthminerals.com
Media inquiries:
Nancy Thompson, Vorticom, Inc.
Phone: 212-532-2208 or 917-371-4053
Neither TSX Venture Exchange nor its Regulation Services Provider (as that term is defined in the policies of the TSX Venture Exchange) accepts responsibility for the adequacy or accuracy of this news release.
Cautionary Note Regarding Forward-Looking Statements
This news release contains forward-looking statements and forward-looking information (collectively, "forward-looking statements") within the meaning of applicable Canadian and U.S. securities legislation, including the United States Private Securities Litigation Reform Act of 1995. All statements, other than statements of historical fact, included herein including, without limitation, anticipated exploration program results from exploration activities, the Company's expectation that it will be able to enter into agreements to acquire interests in additional mineral properties, the discovery and delineation of mineral deposits/resources/reserves, that the Company will be able to find suitable Substituted Purchasers for the WCU Shares and the anticipated business plans and timing of future activities of the Company, are forward-looking statements. Although the Company believes that such statements are reasonable, it can give no assurance that such expectations will prove to be correct. Forward-looking statements are typically identified by words such as: "believe", "will", "may", "expect", "anticipate", "intend", "estimate", "postulate" and similar expressions, or are those, which, by their nature, refer to future events. The Company cautions investors that any forward-looking statements by the Company are not guarantees of future results or performance, and that actual results may differ materially from those in forward-looking statements as a result of various factors, including, operating and technical difficulties in connection with mineral exploration and development activities, actual results of exploration activities, the estimation or realization of mineral reserves and mineral resources, the timing and amount of estimated future production, the costs of production, capital expenditures, the costs and timing of the development of new deposits, requirements for additional capital, future prices of lithium, changes in general economic conditions, changes in the financial markets and in the demand and market price for commodities, accidents, labour disputes and other risks of the mining industry, delays in obtaining governmental approvals, permits or financing or in the completion of development or construction activities, changes in laws, regulations and policies affecting mining operations, title disputes, the inability of the Company to obtain any necessary permits, consents, approvals or authorizations, the timing and possible outcome of any pending litigation, environmental issues and liabilities, and risks related to joint venture operations, and other risks and uncertainties disclosed in the Company's latest interim Management Discussion and Analysis and filed with certain securities commissions in Canada. All of the Company's Canadian public disclosure filings may be accessed via www.sedar.com and readers are urged to review these materials, including the technical reports filed with respect to the Company's mineral properties.
Readers are cautioned not to place undue reliance on forward-looking statements. The Company undertakes no obligation to update any of the forward-looking statements in this news release or incorporated by reference herein, except as otherwise required by law.

To view the source version of this press release, please visit https://www.newsfilecorp.com/release/92735
1,158 g/t Silver, 9.19% Copper, 2.16% Lead and 9.04% Zinc, over 3.00 meters
100% Owned Keymet Precious & Base Metal Property, New Brunswick
VANCOUVER, BC / ACCESSWIRE / August 10, 2021 / GREAT ATLANTIC ESOURCES CORP. (TSXV:GR) (the "Company" or "Great Atlantic") is pleased to announce it has begun an additional diamond drilling program by the Company, at the Keymet Silver Mine located in Northern New Brunswick.

"Great Atlantic retains a portfolio of 100% owned projects and currently has two of these projects under option. In addition to our option partners, Great Atlantic will also be conducting drilling and exploration programs on some of these assets, while looking further at alternative avenues to unlock their value.
Our main focus, which we are currently drilling, is on our high-grade Gold Resource in central Newfoundland, The Golden Promise Gold property, where we have a high-grade resource and multiple new gold discoveries awaiting their turn for a drill bit. This project is situated in the hottest emerging Gold Belt's in North America" states Chris Anderson CEO
The Keymet exploration program will test numerous target areas in the northwest region of the property. The Company previously discovered high grade gold, silver, copper and zinc in this region, including a drill intercept of 9.04% zinc, 9.19% copper and 1,158 gams per tonne (g/t) silver over 3.00 meters core length and a boulder sample returning 51 grams / tonne (g/t) gold.

Great Atlantic has recently received a permit for 10 drill holes in the Northwest region of the property. Certain holes will target three polymetallic (zinc, copper, lead and silver) vein type occurrences. Other holes will target untested electromagnetic anomalies. One short hole is planned under a gold-bearing outcrop. A 2015 grab sample from this outcrop returned 1.14 grams / tonne (g/t) gold.
The first hole of the program will test the possible extension of the Elmtree Silver Mine vein occurrence southeast of the historic shaft. High grade silver and lead is reported at this occurrence by the New Brunswick Department of Energy and Resource Development.
Drilling is underway at the Elmtree 12 vein system including one hole testing the system deeper. Great Atlantic discovered high grade zinc, copper and silver mineralization at this vein system during 2015 – 2018 drilling programs including:
-
Ky-15-3: 16.68% Zn, 1.11% Cu, 0.44% Pb and 152 g/t Ag over 1.80 meters.
-
Ky-15-4: 8.68% Zn, 0.29% Cu, 0.20% Pb and 44 g/t Ag over 4.28 meters.
-
Ky-17-6: 7.67% Zn, 1.57% Cu, 0.48% Pb and 209 g/t Ag over 4.95 meters.
-
Ky-18-10: 7.91% Zn, 0.53% Cu, 0.21% Pb and 77 g/t Ag over 3.27 meters.
-
Ky-18-12: 8.90% Zn, 3.81% Cu, 0.60% Pb and 157 g/t Ag over 1.20 meters.
-
Ky-18-14: 9.04% Zn, 9.19% Cu, 2.16% Pb and 1,158 g/t Ag over 3.00 meters.
-
Ky-18-14: 12.08% Zn, 0.31% Cu, 0.30% Pb and 59 g/t Ag over 4.50 meters.

Vein hosting high grade zinc, copper and silver in Ky-18-14
Drilling is planned to further test a polymetallic vein discovered by the Company southwest of the Elmtree 12 vein system. Drill hole Ky-17-8 intersected this vein, returning 18.8% zinc, 3.55% copper, 1.16% lead and 576 g/t silver over 1.27 meters core length.

Historic Keymet Silver Mine (1950s)- burnt down and was never recapitalized
Located 8KM away from the previous operating
Nigadoo Mine that operated for over twenty years
David Martin, P.Geo., a Qualified Person as defined by NI 43-101 and VP Exploration for Great Atlantic, is responsible for the technical information contained in this News Release.
Access to the Keymet Property is excellent with paved roads transecting the property, including a provincial highway. The property covers an area of approximately 3,400 hectares and is 100% owned by the Company.
On Behalf of the board of directors
"Christopher R Anderson"
Mr. Christopher R. Anderson "Always be positive, strive for solutions, and never give up"
President CEO Director
Investor Relations:
Andrew Job 1-416-628-1560 ir@greatatlanticresources.com
Office Line 604-488-3900About Great Atlantic Resources Corp.: Great Atlantic Resources Corp. is a Canadian exploration company focused on the discovery and development of mineral assets in the resource-rich and sovereign risk-free realm of Atlantic Canada, one of the number one mining regions of the world. Great Atlantic is currently surging forward building the company utilizing a Project Generation model, with a special focus on the most critical elements on the planet that are prominent in Atlantic Canada, Antimony, Tungsten and Gold.

This press release includes certain statements that may be deemed "forward-looking statements". All statements in this release, other than statements of historical facts, that address future exploration drilling, exploration activities and events or developments that the Company expects, are forward looking statements. Although the Company believes the expectations expressed in such forward-looking statements are based on reasonable assumptions, such statements are not guarantees of future performance and actual results or developments may differ materially from those in forward-looking statements. Factors that could cause actual results to differ materially from those in forward-looking statements include exploitation and exploration successes, continued availability of financing, and general economic, market or business conditions.
Neither TSX Venture Exchange nor its Regulation Services Provider (as that term is defined in the policies of the TSX Venture Exchange) accepts responsibility for the adequacy or accuracy of this release.
Great Atlantic Resource Corp
888 Dunsmuir Street – Suite 888, Vancouver, B.C., V6C 3K4
SOURCE: Great Atlantic Resources Corp.
View source version on accesswire.com:
https://www.accesswire.com/659073/Great-Atlantic-Begins-Diamond-Drill-Program-on-its-Silver-Mine-in-New-Brunswick-Previously
VANCOUVER, British Columbia, Aug. 10, 2021 (GLOBE NEWSWIRE) — Imperial Metals Corporation (the “Company”) (TSX:III) reports financial results for the three and six months ended June 30, 2021, as summarized in this release and discussed in detail in the Management’s Discussion & Analysis. The Company’s financial results are prepared in accordance with International Financial Reporting Standards (“IFRS”). The reporting currency of the Company is the Canadian (“CDN”) Dollar.
QUARTER HIGHLIGHTS
FINANCIAL
Total revenue decreased to $34.2 million in the June 2021 quarter compared to $45.1 million in the 2020 comparative quarter, a decrease of $10.9 million.
In the June 2021 quarter, the Red Chris mine (100% basis) had 3.8 concentrate shipments (2020-5.5 concentrate shipments). Variations in revenue are impacted by the timing and quantity of concentrate shipments, metal prices and exchange rates, and period end revaluations of revenue attributed to concentrate shipments where copper and gold prices will settle at a future date.
The London Metals Exchange cash settlement copper price per pound averaged US$4.40 in the June 2021 quarter compared to US$2.42 in the 2020 comparative quarter. London Bullion Market Association, London gold price per troy ounce averaged US$1,816 in the June 2021 quarter compared to US$1,711 in the 2020 comparative quarter. The average US/CDN Dollar exchange rate was 1.228 in the June 2021 quarter, 11.4% lower than the exchange rate of 1.386 in the 2020 comparative quarter. In CDN Dollar terms the average copper price in the June 2021 quarter was CDN$5.40 per pound compared to CDN$3.35 per pound in the 2020 comparative quarter, and the average gold price in the June 2021 quarter was CDN$2,230 per ounce compared to CDN$2,372 per ounce in the 2020 comparative quarter.
Revenue in the June 2021 quarter decreased by $0.7 million due to a negative revenue revaluation as compared to a $5.8 million positive revenue revaluation in the 2020 comparative quarter. Revenue revaluations are the result of the metal price on the settlement date and/or the current period balance sheet date being higher or lower than when the revenue was initially recorded or the metal price at the last balance sheet date and finalization of contained metal as a result of final assays.
Net loss for the June 2021 quarter was $5.1 million ($0.04 per share) compared to net loss of $0.2 million ($0.00 per share) in the 2020 comparative quarter. The increase in net loss of $4.9 million was primarily due to the following factors:
-
Income from mine operations went from $10.6 million in June 2020 to $1.5 million in June 2021, increasing net loss by $9.1 million.
-
Interest expense went from $0.4 million in June 2020 to $0.5 million in June 2021, increasing net loss by $0.1 million.
-
Foreign exchange gains/losses went from a loss of $1.1 million in June 2020 to a loss of $Nil in June 2021, decreasing net loss by $1.1 million.
-
Taxes went from an expense of $2.6 million in June 2020 to a recovery of $1.9 million in June 2021, decreasing net loss by $4.5 million.
Cash flow was $8.1 million in the June 2021 quarter compared to $16.1 million in the 2020 comparative quarter. Cash flow is a measure used by the Company to evaluate its performance however, it is not a term recognized under IFRS. The Company believes cash flow is useful to investors and it is one of the measures used by management to assess the financial performance of the Company.
Capital expenditures including finance leases were $23.8 million in the June 2021 quarter, an increase from $19.3 million in the 2020 comparative quarter. The June 2021 expenditures included $8.0 million in exploration, $4.4 million for tailings dam construction and $11.4 million on stripping costs and other capital.
At June 30, 2021, the Company had not hedged any copper, gold or US/CDN Dollar exchange. Quarterly revenues will fluctuate depending on copper and gold prices, the US/CDN Dollar exchange rate, and the timing of concentrate sales, which is dependent on concentrate production and the availability and scheduling of transportation.
OPERATIONS
The current impact of the COVID-19 pandemic on our business is described under Significant Events and Liquidity. The Company’s plans for 2021 and beyond could be adversely impacted by the effects of the COVID-19 pandemic. The continuing impact of COVID-19 to travel and other operating restrictions established to curb the spread of COVID-19, could materially and adversely impact the Company’s current plans by causing a temporary closure of the Red Chris mine, suspending planned exploration work, causing an economic slowdown resulting in a decrease in the demand for copper and gold, negatively impacting copper and gold prices, impacting the Company’s ability to transport or market the Company’s concentrate or causing disruptions in the Company’s supply chains.
Red Chris Mine
Metal production for the second quarter of 2021 was 17.6 million pounds copper and 15,450 ounces gold, compared to 26.5 million pounds copper and 22,057 ounces gold produced in the 2020 second quarter.
Imperial’s 30% portion of Red Chris mine second quarter production was 5.3 million pounds copper and 4,635 ounces gold.
|
Three Months Ended June 30* |
Six Months Ended June 30* |
||||
|
2021 |
2020 |
2021 |
2020 |
||
|
Ore milled – tonnes |
2,493,319 |
2,454,626 |
4,656,078 |
4,418,852 |
|
|
Ore milled per calendar day – tonnes |
27,399 |
26,979 |
27,399 |
24,282 |
|
|
Grade % – copper |
0.402 |
0.606 |
0.416 |
0.611 |
|
|
Grade g/t – gold |
0.348 |
0.497 |
0.381 |
0.496 |
|
|
Recovery % – copper |
79.6 |
80.7 |
78.3 |
82.1 |
|
|
Recovery % – gold |
55.4 |
55.1 |
54.8 |
55.4 |
|
|
Copper – 000’s pounds |
17,575 |
26,458 |
33,459 |
48,909 |
|
|
Gold – ounces |
15,450 |
22,057 |
31,300 |
39,484 |
|
* 100% Red Chris mine production
The decrease in metal production in the June 2021 quarter is largely due to lower metal grades, with copper grade decreasing by 33.7% and gold grade decreasing by 30.0% compared to the June 2020 quarter. In 2020, higher grade mill feed was being mined from lower benches in the Phase 4 pushback in the Main Zone. In 2021, ore feed is coming from upper benches of the Phase 5 pushback in the East Zone and stockpiles. However, the metal recovery levels in this quarter were close to the 2020 comparative quarter, with copper recovery down by 1.4% and gold recovery virtually the same.
A newly installed cleaner column was commissioned during the quarter and is now operating. Early results have shown improved gold recovery after the installation.
The portal site excavation has been completed and the exploration decline is progressing, having advanced 70 metres as of July 28, 2021. The East Zone high grade pod is being drilled at a tighter spacing to provide the information required to consider early mining as part of the Red Chris Block Cave Pre-Feasibility Study. Mining of this particularly high-grade section of the East Zone prior to the block cave mining may increase initial cash flow and help fund the development of block caving operations. The study is scheduled to be released by the end of September 2021.
During the second quarter there were up to eight diamond drill rigs in operation completing 26 drill holes for a total of about 30,055 drilled metres. All the holes (except for six geotechnical holes) intersected mineralization. Since the commencement of the Joint Venture in 2019, 137 drill holes for a total of 166,686 metres have been drilled.
Drilling is ongoing at East Ridge to further define the extent and continuity of this zone with ten holes completed and three in progress. The follow up drilling is being completed on a nominal 100 x 100 metre grid to determine the footprint of the mineralization and demonstrate the continuity of the higher-grade mineralization. The East Ridge is open in all directions and has extended the eastern limit of copper and gold mineralization.
On July 2, 2021, the Red Chris Joint Venture received a Notice of Proposed Transfer and Right of First Refusal Offer regarding the sale of an existing 1% Net Smelter Returns Royalty in consideration of US$165.0 million. The Right of First Refusal was not exercised by the Red Chris Joint Venture.
Imperial’s 30% share of exploration, development, and capital expenditures were $23.3 million in the June 2021 quarter compared to $18.7 million in the 2020 comparative quarter.
Mount Polley Mine
Mount Polley operations ceased in May 2019 and the mine remains on care and maintenance status. The mine restart plan prepared in 2019 is being updated to include revised pit designs, results of recent drilling and current metal prices. In addition, the Company has engaged an engineering firm to complete a conceptual study investigating the potential for employing underground mining techniques to extend the operating life of the Mount Polley mine.
The COVID-19 pandemic has had an impact on mine restart timeline. However, the vaccine distribution is anticipated to mitigate this risk. When the revised restart plan has been updated and the Province wide vaccine distribution is complete, the Company will seek to secure financing to fund the restart of the mine.
Site personnel continue to maintain access, fire watch, manage collection, treatment and discharge of site contact water and actively monitor the tailings storage facility. In addition to the normal care and maintenance activities, work has begun on servicing mining equipment to facilitate a quick restart of mining operations, including brake testing on all the haul trucks and preparing the loading and drilling equipment for operations.
Mount Polley has prepared a surplus water management plan and is working with the Williams Lake First Nation, Xatśūll First Nation and the Province to permit the discharge the water that accumulated on site following last year’s nearly double normal site runoff.
For the June 2021 quarter, Mount Polley incurred idle mine costs comprised of $4.1 million in operating costs and $0.7 million in depreciation expense.
Exploration, development, and capital expenditures in the June 2021 quarter were $0.1 million compared to $0.2 million in the 2020 comparative quarter.
Huckleberry Mine
Huckleberry operations ceased in August 2016 and the mine remains on care and maintenance status. A mine restart plan is under development for Huckleberry.
The COVID-19 pandemic has impacted the mine restart timeline. However, the vaccine distribution is anticipated to mitigate this risk. The Company will seek to secure financing to fund restart of the mine, following completion of the Province wide vaccine distribution. The Company anticipates the restart of Huckleberry will follow the start of operations at Mount Polley.
Site personnel continue to focus on maintaining access, water management (treatment and release of mine contact water into Tahtsa Reach), snow removal, maintenance of site infrastructure and equipment, mine permit compliance, updating the life of mine plan, environmental compliance monitoring and monitoring tailings management facilities. A geotechnical drilling program is being completed to gather the information required to update the tailings facility designs for future operations.
For the June 2021 quarter, Huckleberry incurred idle mine costs comprised of $1.3 million in operating costs and $0.2 million in depreciation expense.
Following the quarter end, Huckleberry Mines Ltd. purchased five mineral tenures from ArcWest Exploration Inc.(“ArcWest”). The claims cover 2,526 hectares and are located north of the Huckleberry Mine mining lease. Consideration payable was $50,000 cash and the granting to ArcWest a 1% Net Smelter Returns Royalty.
Ruddock Creek
Subsequent to the quarter end, the Company increased its interest in the Ruddock Creek high grade zinc-lead project to 100% by purchasing the 54.72% interest held by its joint venture partners.
Exploration Update
During the early summer a comprehensive airborne ZTEM survey was completed over the Huckleberry and Whiting Creek properties. At Huckleberry a detailed soil sample program was completed over a prospective area southeast of the East pit. An auger soil sampling program was completed at Whiting Creek over a large swampy area located between two areas of known mineralization.
On Vancouver Island at the Fandora Gold property magnetometer and VLF surveys were completed. A Lidar survey was flown to help guide exploration on the structurally controlled gold veins. A soil sampling program was completed on the newly staked Kilpala property, located on the west side of Nimpkish Lake where copper mineralization was discovered.
The same Lidar airborne survey system was flown over the Porcher Island Gold property, located 35 kilometres southwest of Prince Rupert, to guide exploration on the structurally controlled mineralized systems.
In July, the Company granted PJX Resources Inc. a five-year option to acquire 100% interest in the Estella Property located northeast of Cranbrook, B.C. The property consists of 14 Crown granted mineral claims covering approximately 224 hectares. Consideration payable to Imperial are staged payments totalling $250,000 and the granting of a 2% Net Smelter Returns Royalty.
EARNINGS AND CASH FLOW
Select Quarter Financial Information
|
expressed in thousands of dollars, except share and per share amounts |
Three Months Ended June 30 |
Six Months Ended June 30 |
||||||
|
2021 |
2020 |
2021 |
2020 |
|||||
|
Operations: |
||||||||
|
Total revenues |
$34,215 |
$45,056 |
$67,265 |
$73,021 |
||||
|
Net loss |
$(5,075 |
) |
$(182 |
) |
$(7,617 |
) |
$(7,039 |
) |
|
Net loss per share |
$(0.04 |
) |
$(0.00 |
) |
$(0.06 |
) |
$(0.05 |
) |
|
Diluted loss per share |
$(0.04 |
) |
$(0.00 |
) |
$(0.06 |
) |
$(0.05 |
) |
|
Adjusted net loss (1) |
$(5,111 |
) |
$(310 |
) |
$(7,676 |
) |
$(6,883 |
) |
|
Adjusted net loss per share (1) |
$(0.04 |
) |
$(0.00 |
) |
$(0.06 |
) |
$(0.05 |
) |
|
Adjusted EBITDA (1) |
$8,283 |
$16,224 |
$10,914 |
$18,759 |
||||
|
Cash flow (1)(2) |
$8,102 |
$16,100 |
$10,628 |
$18,525 |
||||
|
Cash flow per share (1)(2) |
$0.06 |
$0.13 |
$0.08 |
$0.14 |
||||
|
Working capital deficiency |
$39,233 |
$36,043 |
$39,233 |
$36,043 |
||||
|
Total assets |
$1,126,405 |
$1,115,389 |
$1,126,405 |
$1,115,389 |
||||
|
Total debt (including current portion) |
$5,252 |
$3,197 |
$5,252 |
$3,197 |
||||
|
(1) |
Refer to Non-IFRS Financial Measures for further details. |
|
(2) |
Cash flow is defined as the cash flow from operations before the net change in non-cash working capital balances, income and mining taxes, and interest paid. Cash flow per share is defined as cash flow divided by the weighted average number of common shares outstanding during the year. |
Select Items Affecting Net Loss (presented on an after-tax basis)
|
Three Months Ended June 30 |
Six Months Ended June 30 |
|||||||
|
expressed in thousands of dollars |
2021 |
2020 |
2021 |
2020 |
||||
|
Net income (loss) before undernoted items |
$(4,652 |
) |
$56 |
$(6,957 |
) |
$(6,120 |
) |
|
|
Interest expense |
(459 |
) |
(366 |
) |
(719 |
) |
(763 |
) |
|
Foreign exchange (gain) loss on debt |
36 |
128 |
59 |
(156 |
) |
|||
|
Net Loss |
$(5,075 |
) |
$(182 |
) |
$(7,617 |
) |
$(7,039 |
) |
NON-IFRS FINANCIAL MEASURES
The Company reports four non-IFRS financial measures: adjusted net income, adjusted EBITDA, cash flow and cash cost per pound of copper produced which are described in detail below. The Company believes these measures are useful to investors because they are included in the measures that are used by management in assessing the financial performance of the Company.
Adjusted net income, adjusted EBITDA, and cash flow are not generally accepted earnings measures and should not be considered as an alternative to net income (loss) and cash flows as determined in accordance with IFRS. As there is no standardized method of calculating these measures, these measures may not be directly comparable to similarly titled measures used by other companies.
Adjusted Net Loss and Adjusted Net Loss Per Share
Adjusted net loss in the June 2021 quarter was $5.1 million ($0.04 per share) compared to an adjusted net loss of $0.3 million ($0.00 per share) in the 2020 comparative quarter. Adjusted net loss shows the financial results excluding the effect of items not settling in the current period and non-recurring items. Adjusted net loss is calculated by removing the gains or loss, resulting from acquisition and disposal of property, mark to market revaluation of derivative instruments not related to the current period, net of tax, unrealized foreign exchange gains or losses on non-current debt, net of tax.
Adjusted EBITDA
Adjusted EBITDA in the June 2021 quarter was $8.3 million compared to $16.2 million in the 2020 comparative quarter. We define Adjusted EBITDA as net income (loss) before interest expense, taxes, depletion, and depreciation, and as adjusted for certain other items.
Cash Flow and Cash Flow Per Share
Cash flow in the June 2021 quarter was $8.1 million compared to $16.1 million in the 2020 comparative quarter. Cash flow per share was $0.06 in the June 2021 quarter compared to $0.13 in the 2020 comparative quarter.
Cash flow and cash flow per share are measures used by the Company to evaluate its performance however they are not terms recognized under IFRS. Cash flow is defined as cash flow from operations before the net change in non-cash working capital balances, income and mining taxes paid, and interest paid. Cash flow per share is the same measure divided by the weighted average number of common shares outstanding during the year.
Cash Cost Per Pound of Copper Produced
Company is primarily a copper producer and therefore calculates this non-IFRS financial measure individually for its three copper mines, Red Chris (30% share), Mount Polley and Huckleberry, and on a composite basis for these mines.
Variations from period to period in the cash cost per pound of copper produced are the result of many factors including: grade, metal recoveries, amount of stripping charged to operations, mine and mill operating conditions, labour and other cost inputs, transportation and warehousing costs, treatment and refining costs, the amount of by-product and other revenues, the US$ to CDN$ exchange rate and the amount of copper produced.
Idle mine costs during the periods when the Huckleberry and Mount Polley mines were not in operation have been excluded from the cash cost per pound of copper produced.
Calculation of Cash Cost Per Pound of Copper Produced
|
expressed in thousands of dollars, except cash cost per pound of copper produced |
Three Months Ended June 30 |
Six Months Ended June 30 |
|||
|
2021 |
2020 |
2021 |
2020 |
||
|
Cash cost of copper produced in US$ |
$11,995 |
$8,030 |
$25,346 |
$17,954 |
|
|
Copper produced – pounds |
5,272 |
7,937 |
10,037 |
14,672 |
|
|
Cash cost per lb copper produced in US$ |
$2.28 |
$1.01 |
$2.53 |
$1.22 |
|
For detailed information, refer to Imperial’s 2021 Second Quarter Report available on imperialmetals.com and sedar.com
About Imperial
Imperial is a Vancouver based exploration, mine development and operating company. The Company, through its subsidiaries, owns a 30% interest in the Red Chris mine, and a 100% interest in both the Mount Polley and Huckleberry copper mines in British Columbia. Imperial also holds 100% interest in the Ruddock Creek lead/zinc property.
Company Contacts
Brian Kynoch | President | 604.669.8959
Darb Dhillon | Chief Financial Officer | 604.669.8959
Cautionary Note Regarding Forward-Looking Statements
Certain information contained in this news release are not statements of historical fact and are “forward-looking” statements. Forward-looking statements relate to future events or future performance and reflect Company management’s expectations or beliefs regarding future events and include, but are not limited to, statements regarding the Company’s expectations with respect to the impact of COVID-19 on the Company’s business and operations; metal pricing and its impact on revaluations of revenue; the preparation of, and timing for, a pre-feasibility study in respect of a block cave mining operation at Red Chris; the potential impacts for increased cash flow from mining certain sections of the East Zone and its impact on the funding of the development of block caving operations; potential development plans and mining methods at Red Chris including the progression of the exploration decline; the potential impact of a newly installed cleaner column on future recovery of gold; the potential acceleration of the timeline to production and cash flows from any underground expansion; the impact of vaccine distribution on mine restart plans at Mount Polley and Huckleberry; financing to fund restart Mount Polley and Huckleberry; the ordering of any restart at Mount Polley and Huckleberry; metal production guidance and estimates; expectations and timing regarding current and future exploration and drilling programs, including the potential for drilling at East Ridge to define the extent and continuity of mineralization; and the impact of exploration at Huckleberry and the Whiting Creek, Fandora Gold, Kilpala and Porcher Island Gold properties.
In certain cases, forward-looking statements can be identified by the use of words such as "plans", "expects" or "does not expect", "is expected", "outlook", "budget", "scheduled", "estimates", "forecasts", "intends", "anticipates" or "does not anticipate", or "believes", or variations of such words and phrases or statements that certain actions, events or results "may", "could", "would", "might" or "will be taken", "occur" or "be achieved" or the negative of these terms or comparable terminology. By their very nature forward-looking statements involve known and unknown risks, uncertainties and other factors which may cause the actual results, performance or achievements of the Company to be materially different from any future results, performance or achievements expressed or implied by the forward-looking statements.
In making the forward-looking statements in this release, the Company has applied certain factors and assumptions that are based on information currently available to the Company as well as the Company’s current beliefs and assumptions. These factors and assumptions and beliefs and assumptions include, the risk factors detailed from time to time in the Company’s interim and annual financial statements and management’s discussion and analysis of those statements, all of which are filed and available for review on SEDAR at www.sedar.com. Although the Company has attempted to identify important factors that could cause actual actions, events or results to differ materially from those described in forward-looking statements, there may be other factors that cause actions, events or results not to be as anticipated, estimated or intended, many of which are beyond the Company’s ability to control or predict. There can be no assurance that forward-looking statements will prove to be accurate, as actual results and future events could differ materially from those anticipated in such statements. Accordingly, readers should not place undue reliance on forward-looking statements and all forward-looking statements in this news release are qualified by these cautionary statements.

Here are five stocks added to the Zacks Rank #1 (Strong Buy) List today:
Albertsons Companies, Inc. ACI: This distributer of fruits, vegetables, canned items and other related goods through food and drug stores in the United States has seen the Zacks Consensus Estimate for its current year earnings increasing 14.1% over the last 60 days.
Albertsons Companies, Inc. Price and Consensus

Albertsons Companies, Inc. price-consensus-chart | Albertsons Companies, Inc. Quote
BellRing Brands, Inc. BRBR: This manufacturer and seller of nutrition products has seen the Zacks Consensus Estimate for its current year earnings increasing 4.7% over the last 60 days.
BellRing Brands, Inc. Price and Consensus

BellRing Brands, Inc. price-consensus-chart | BellRing Brands, Inc. Quote
Carter's, Inc. CRI: This provider of apparel and related products exclusively for babies and young children has seen the Zacks Consensus Estimate for its current year earnings increasing 21.1% over the last 60 days.
Carters, Inc. Price and Consensus

Carters, Inc. price-consensus-chart | Carters, Inc. Quote
Delta Apparel, Inc. DLA: This designer, manufacturer, and marketer of activewear and lifestyle apparel products has seen the Zacks Consensus Estimate for its current year earnings increasing 16.6% over the last 60 days.
Delta Apparel, Inc. Price and Consensus

Delta Apparel, Inc. price-consensus-chart | Delta Apparel, Inc. Quote
WESCO International, Inc. WCC: This provider of electrical products and other industrial MRO supplies and services in North America has seen the Zacks Consensus Estimate for its current year earnings increasing 10% over the last 60 days.
WESCO International, Inc. Price and Consensus

WESCO International, Inc. price-consensus-chart | WESCO International, Inc. Quote
You can see the complete list of today’s Zacks #1 Rank (Strong Buy) stocks here.
Want the latest recommendations from Zacks Investment Research? Today, you can download 7 Best Stocks for the Next 30 Days. Click to get this free report
WESCO International, Inc. (WCC) : Free Stock Analysis Report
Albertsons Companies, Inc. (ACI) : Free Stock Analysis Report
Carters, Inc. (CRI) : Free Stock Analysis Report
Delta Apparel, Inc. (DLA) : Free Stock Analysis Report
BellRing Brands, Inc. (BRBR) : Free Stock Analysis Report
To read this article on Zacks.com click here.
Comstock Mining, Inc. (LODE) came out with a quarterly loss of $0.04 per share versus the Zacks Consensus Estimate of $0.01. This compares to earnings of $0.05 per share a year ago. These figures are adjusted for non-recurring items.
This quarterly report represents an earnings surprise of -500%. A quarter ago, it was expected that this company would post a loss of $0.04 per share when it actually produced earnings of $0.02, delivering a surprise of 150%.
Over the last four quarters, the company has surpassed consensus EPS estimates just once.
Comstock Mining, Inc.Which belongs to the Zacks Mining – Gold industry, posted revenues of $0.06 million for the quarter ended June 2021, missing the Zacks Consensus Estimate by 21.43%. This compares to year-ago revenues of $0.05 million. The company has not been able to beat consensus revenue estimates over the last four quarters.
The sustainability of the stock's immediate price movement based on the recently-released numbers and future earnings expectations will mostly depend on management's commentary on the earnings call.
Comstock Mining, Inc. Shares have added about 181.7% since the beginning of the year versus the S&P 500's gain of 18%.
What's Next for Comstock Mining, Inc.
While Comstock Mining, Inc. Has outperformed the market so far this year, the question that comes to investors' minds is: what's next for the stock?
There are no easy answers to this key question, but one reliable measure that can help investors address this is the company's earnings outlook. Not only does this include current consensus earnings expectations for the coming quarter(s), but also how these expectations have changed lately.
Empirical research shows a strong correlation between near-term stock movements and trends in earnings estimate revisions. Investors can track such revisions by themselves or rely on a tried-and-tested rating tool like the Zacks Rank, which has an impressive track record of harnessing the power of earnings estimate revisions.
Ahead of this earnings release, the estimate revisions trend for Comstock Mining, Inc. Was mixed. While the magnitude and direction of estimate revisions could change following the company's just-released earnings report, the current status translates into a Zacks Rank #3 (Hold) for the stock. So, the shares are expected to perform in line with the market in the near future. You can see the complete list of today's Zacks #1 Rank (Strong Buy) stocks here.
It will be interesting to see how estimates for the coming quarters and current fiscal year change in the days ahead. The current consensus EPS estimate is $0.01 on $0.09 million in revenues for the coming quarter and $0.23 on $0.32 million in revenues for the current fiscal year.
Investors should be mindful of the fact that the outlook for the industry can have a material impact on the performance of the stock as well. In terms of the Zacks Industry Rank, Mining – Gold is currently in the bottom 27% of the 250 plus Zacks industries. Our research shows that the top 50% of the Zacks-ranked industries outperform the bottom 50% by a factor of more than 2 to 1.
Want the latest recommendations from Zacks Investment Research? Today, you can download 7 Best Stocks for the Next 30 Days. Click to get this free report
Comstock Mining, Inc. (LODE) : Free Stock Analysis Report
To read this article on Zacks.com click here.
Zacks Investment Research
OTTAWA, Aug. 10, 2021 (GLOBE NEWSWIRE) — Cornerstone Capital Resources Inc. (“Cornerstone” or “the Company”) (TSXV-CGP) (OTC-CTNXF) (FWB-GWN1) reports that the Board of Directors of the Company has approved the granting of stock options totaling 490,000 options to directors, officers, consultants and employees of the Company effective August 10, 2021. These options have been priced at $4.00 and have an expiry date of August 9, 2026. As per the Company’s Stock Option Plan, these options vest in three equal tranches over an eighteen-month period from the date of issue.
About Cornerstone:
Cornerstone Capital Resources Inc. is a mineral exploration company with a diversified portfolio of projects in Ecuador and Chile, including the Cascabel gold-enriched copper porphyry joint venture in northwest Ecuador. Cornerstone has a 20.8% direct and indirect interest in Cascabel comprised of (i) a direct 15% interest in the project financed through to completion of a feasibility study and repayable at Libor plus 2% out of 90% of its share of the earnings or dividends from an operation at Cascabel, plus (ii) an indirect interest comprised of 6.86% of the shares of joint venture partner and project operator SolGold Plc. Exploraciones Novomining S.A. (“ENSA”), an Ecuadoran company owned by SolGold and Cornerstone, holds 100% of the Cascabel concession. Subject to the satisfaction of certain conditions, including SolGold fully funding the project through to feasibility, SolGold Plc will own 85% of the equity of ENSA and Cornerstone will own the remaining 15% of ENSA.
Further information is available on Cornerstone’s website: www.cornerstoneresources.com and on Twitter. For investor, corporate or media inquiries, please contact:
Investor Relations:
Mario Drolet; Email: Mario@mi3.ca; Tel. (514) 904-1333
Due to anti-spam laws, many shareholders and others who were previously signed up to receive email updates and who are no longer receiving them may need to re-subscribe at http://www.cornerstoneresources.com/s/InformationRequest.asp
Cautionary Notice:
This news release may contain ‘Forward-Looking Statements’ that involve risks and uncertainties, such as statements of Cornerstone’s beliefs, plans, objectives, strategies, intentions and expectations. The words “potential,” “anticipate,” “forecast,” “believe,” “estimate,” “intend”, “trends”, “indicate”, “expect,” “may,” “should,” “could”, “project,” “plan,” or the negative or other variations of these words and similar expressions are intended to be among the statements that identify ‘Forward-Looking Statements.’ Although Cornerstone believes that its expectations reflected in these ‘Forward-Looking Statements’ are reasonable, such statements may involve unknown risks, uncertainties and other factors disclosed in our regulatory filings, viewed on the SEDAR website at www.sedar.com. For us, uncertainties arise from the behaviour of financial and metals markets, predicting natural geological phenomena and from numerous other matters of national, regional, and global scale, including those of an environmental, climatic, natural, political, economic, business, competitive, or regulatory nature. These uncertainties may cause our actual future results to be materially different than those expressed in our Forward-Looking Statements. Although Cornerstone believes the facts and information contained in this news release to be as correct and current as possible, Cornerstone does not warrant or make any representation as to the accuracy, validity or completeness of any facts or information contained herein and these statements should not be relied upon as representing its views after the date of this news release. While Cornerstone anticipates that subsequent events may cause its views to change, it expressly disclaims any obligation to update the Forward-Looking Statements contained herein except where outcomes have varied materially from the original statements.
On Behalf of the Board,
Brooke Macdonald
President and CEO
Neither TSX Venture Exchange nor its Regulation Services Provider (as that term is defined in the policies of the TSX Venture Exchange) accepts responsibility for the adequacy or accuracy of this release.

VANCOUVER, BC / ACCESSWIRE / August 10, 2021 / AZARGA URANIUM CORP. (TSX:AZZ)(OTCQB:AZZUF)(FRA:P8AA) ("Azarga Uranium" or the "Company") has filed its National Instrument 43-101 ("NI 43-101") independent technical report and preliminary economic assessment ("PEA") on its Gas Hills In-situ Recovery Uranium Project in Wyoming, USA (the "Gas Hills Project") following the Company's press release dated 29 June 2021. The Company is now focused on commencing the permitting process and growing the ISR-amenable resources at the Gas Hills Project.
Highlights:
-
Pre-income tax IRR of 116% and NPV of US$120.9 million
-
Post-income tax IRR of 101% and NPV of US$102.6 million
-
6.5 million pounds of U3O8 production over 7 years; steady state production of 1.0 million pounds per year
-
Robust satellite project to Azarga Uranium's flagship Dewey Burdock ISR Uranium Project with low initial capital expenditures estimated at US$26.0 million
-
Direct cash operating costs estimated at US$11.52 per pound of production
Summary of Economics
The base case economic assessment results in a pre-income tax internal rate of return ("IRR") of 116% and a pre-income tax net present value ("NPV") of US$120.9 million when applying an eight percent discount rate. Using the same discount rate, the post-income tax IRR is 101% and the post-income tax NPV is US$102.6 million.
|
Life of Mine Cash Flow Line Items |
|||
|
Units |
Total or average |
US$ per pound of production |
|
|
Uranium production (U3O8) |
Lbs ‘000s |
6,507 |
– |
|
Base case uranium price |
US$/lb |
55.00 |
– |
|
Uranium gross revenue |
US$ ‘000s |
357,885 |
– |
|
Less: surface and mineral royalties |
US$ ‘000s |
629 |
0.10 |
|
Taxable revenue |
US$ ‘000s |
357,256 |
– |
|
Less: property, ad valorem and severance tax |
US$ ‘000s |
22,918 |
3.52 |
|
Net gross sales |
US$ ‘000s |
334,338 |
– |
|
Less: plant and wellfield operating costs Less: resin processing and transport costs |
US$ ‘000s US$ ‘000s |
37,957 16,571 |
5.83 2.55 |
|
Less: product conversion and shipping costs |
US$ ‘000s US$ ‘000s |
2,538 8,896 |
0.39 1.37 |
|
Less: land and administrative support costs |
|||
|
Less: D&D and restoration costs |
US$ ‘000s |
8,966 |
1.38 |
|
Net operating cash flow |
US$ ‘000s |
259,410 |
– |
|
Less: pre-production capital costs |
US$ ‘000s |
2,240 |
0.34 |
|
Less: plant development costs |
US$ ‘000s |
14,126 |
2.17 |
|
Less: wellfield capital development costs Less: transfer pipeline costs |
US$ ‘000s US$ ‘000s |
62,645 6,000 |
9.63 0.92 |
|
Net pre-income tax cash flow |
US$ ‘000s |
174,399 |
– |
|
Less: income taxes |
US$ ‘000s |
24,842 |
3.82 |
|
After tax cash flow |
US$ ‘000s |
149,557 |
– |
The projected cash flows for the Gas Hills Project PEA are positive in the 1st year of production, two years after the commencement of construction. Initial capital expenditures are estimated at US$26.0 million.
Direct cash operating costs are estimated to be US$11.52 per pound of production, royalties and local taxes are estimated to be US$3.62 per pound of production and the total pre-income tax cost of uranium production is estimated to be US$28.20 per pound of production. Income taxes are estimated to be US$3.82 per pound of production and have been calculated on a project basis in accordance with NI 43-101 requirements; therefore, certain tax shelter balances, such as tax loss carry forwards available at the corporate level, have not been considered.
Pre-income tax NPV and IRR Sensitivity to Alternative Uranium Price Scenarios
|
Uranium price scenario |
NPV |
IRR |
|
US$35/lb |
US$34.9m |
44% |
|
US$40/lb |
US$56.4m |
63% |
|
US$45/lb |
US$77.7m |
81% |
|
US$50/lb |
US$98.7m |
98% |
|
US$55/lb (base case) |
US$120.9m |
116% |
|
US$60/lb |
US$141.5m |
132% |
|
US$65/lb |
US$163.5m |
150% |
|
US$70/lb |
US$185.6m |
168% |
Cautionary statement: The results of the Gas Hills Project PEA are preliminary in nature and include inferred mineral resources that are considered too speculative geologically to have the economic considerations applied to them that would enable them to be categorized as mineral reserves. The Gas Hills Project PEA is based on the Company's mineral resource estimate press released on 30 March 2021. Mineral resources that are not mineral reserves do not have demonstrated economic viability. The estimated mineral recovery (80%) used in the Gas Hills Project PEA is based on site-specific laboratory recovery data and industry experience at similar facilities. There can be no assurance that recovery at this level will be achieved. There is no certainty that the Gas Hills Project PEA will be realized.
Project Description
Between 1953 and 1988 many companies explored, developed, and produced uranium in the Gas Hills district, including on lands now controlled by Azarga Uranium. Three uranium mills have operated in the district and two other uranium mills, which operated nearby, were also fed by ore mined from the Gas Hills district. Cumulative production from the Gas Hills district is in excess of 100 million pounds of uranium, mainly from open-pit mining, but also from underground mining and ISR.
Data sources for the estimation of uranium mineral resources for the Gas Hills Project include radiometric equivalent data (eU3O8) for 4,569 drill holes, and eU3O8 and prompt fission neutron logging data for 272 drill holes. The intent of recent drilling between 2007 and 2013 included verification of earlier data for drill holes and exploration.
Metallurgical studies were completed on recovered materials including bulk samples from reverse circulation drilling and cored sections. Bottle roll and column leach tests indicate uranium recoveries of ~90% and sulfuric acid consumption of ~55 pounds per ton treated, which is consistent with past mining results.
The Gas Hills Project PEA contemplates a satellite plant development approach with final processing at a central processing facility to be constructed at Azarga Uranium's Dewey Burdock Project. Construction of the Gas Hills Project will consist primarily of wellfields in four separate resource areas connected by pipelines to a single satellite plant location containing ion exchange equipment used to extract uranium from produced wellfield fluids. Ion exchange resin will be shipped from the Gas Hills Project to the Dewey Burdock Project for uranium stripping and regeneration, with creation of a dried yellowcake product at Dewey Burdock. This concept has been used successfully for decades in numerous ISR uranium operations in Texas and Wyoming. Wellfield extraction methods will utilize a low-pH complexing solution consistent with other successfully licensed ISR uranium facilities in Wyoming and worldwide. Average project flow rate is estimated at 2,400 gallons per minute with an average head grade of 97 parts per million for an annual production capacity of 1.0 million pounds U3O8.
Qualified Person
The NI 43-101 compliant independent technical report and PEA titled "NI 43-101 Technical Report Preliminary Economic Assessment, Gas Hills Uranium Project, Fremont and Natrona Counties, Wyoming, USA", with an effective date of 28 June 2021 (the "Gas Hills PEA") for Azarga Uranium Corp. has been filed on SEDAR at www.sedar.com and Azarga Uranium's website at www.azargauranium.com.
The Gas Hills PEA was independently prepared in accordance with the requirements of NI 43-101 by Western Water Consultants, Inc. dba WWC Engineering, Ray Moores, P.E., a Qualified Person ("QP") as that term is defined under NI 43-101 and Roughstock Mining Services, Steve Cutler, P.G., QP. The disclosure of a scientific and technical nature contained in this press release was approved by Ray Moores, P.E., QP and Steve Cutler, P.G., QP.
About Azarga Uranium Corp.
Azarga Uranium is an integrated uranium exploration and development company that controls ten uranium projects and prospects in the United States of America ("USA") (South Dakota, Wyoming, Utah and Colorado), with a primary focus of developing in-situ recovery uranium projects. The Dewey Burdock in-situ recovery uranium project in South Dakota, USA (the "Dewey Burdock Project"), which is the Company's initial development priority, has received its Nuclear Regulatory Commission License and Class III and Class V Underground Injection Control permits from the Environmental Protection Agency and the Company is in the process of completing other major regulatory permit approvals necessary for the construction of the Dewey Burdock Project.
For more information, please visit www.azargauranium.com.
Follow us on Twitter at @AzargaUranium.
For further information, please contact:
Blake Steele, President and CEO
+1 605 662-8308
E-mail: info@azargauranium.com
Disclaimer for Forward-Looking Information
Certain information and statements in this news release may be considered forward-looking information or forward-looking statements for purposes of applicable securities laws (collectively, "forward-looking statements"), which reflect the expectations of management regarding its disclosure and amendments thereto. Forward-looking statements consist of information or statements that are not purely historical, including any information or statements regarding beliefs, plans, expectations or intentions regarding the future. Such information or statements may include, but are not limited to, statements with respect to the Company's Gas Hills Project PEA, the future financial or operating performance of the Company and its mineral projects, the estimation of mineral resources, the timing and amount of estimated future production and capital, operating and exploration expenditures, the Gas Hills Project PEA contemplating a satellite plant development approach with final processing at a central processing facility to be constructed at Azarga Uranium's Dewey Burdock Project, the Company now focusing on commencing the permitting process and growing the ISR-amenable resources at the Gas Hills Project, and the Company being in the process of completing regulatory permit approvals necessary for the construction of the Dewey Burdock Project. Such statements are subject to risks and uncertainties that may cause actual results, performance or developments to differ materially from those contained in the statements. No assurance can be given that any of the events anticipated by the forward-looking statements will occur or, if they do occur, what benefits Azarga Uranium will obtain from them. These forward-looking statements reflect management's current views and are based on certain expectations, estimates and assumptions, which may prove to be incorrect. A number of risks and uncertainties could cause actual results to differ materially from those expressed or implied by the forward-looking statements, including without limitation: the risk that the Gas Hills Project is not constructed and the estimated economics of the PEA are not realized, the risk that the estimated economics contained in the PEA do not reflect actual project economics, the risk that a central processing facility is not constructed timely or ever at Azarga Uranium's Dewey Burdock Project and therefore the Gas Hills Project PEA cannot be realized, the risk that the Company does not commence the permitting process and or grow the ISR-amenable resources at the Gas Hills Project, the risk that the Company does not complete regulatory permit approvals necessary for the construction of the Dewey Burdock or Gas Hills Project, the risk that such statements may prove to be inaccurate and other factors beyond the Company's control. These forward-looking statements are made as of the date of this news release and, except as required by applicable securities laws, Azarga Uranium assumes no obligation to update these forward-looking statements, or to update the reasons why actual results differed from those projected in the forward-looking statements. Additional information about these and other assumptions, risks and uncertainties are set out in the "Risks and Uncertainties" section in the most recent AIF filed with Canadian security regulators.
The TSX has not reviewed and does not accept responsibility for the adequacy or accuracy of the content of this News Release.
SOURCE: Azarga Uranium Corp.
View source version on accesswire.com:
https://www.accesswire.com/659057/Azarga-Uranium-Files-Robust-Maiden-Pea-for-Gas-Hills-ISR-Uranium-Project
An Emerging Markets Sponsored Commentary
ORLANDO, Fla, Aug. 10, 2021 (GLOBE NEWSWIRE) — We’re pleased today to introduce a new profiled company to our roster of high-quality stories with Consolidated Uranium Inc. ("CUR") (TSXV: CUR) (OTCQB: CURUF), a well-financed international Uranium company with a strategy of consolidating and advancing undervalued uranium projects around the globe.
Most readers are acquainted with the appeal of Uranium, often colloquially referred to as ‘yellowcake.’ For some, the acquaintance may be in international security matters due to the incredible power of uranium in a wide variety of applications.
When the wrong people/governments want it, it makes the news. Think Iran.
But the true importance of Uranium is in the delivery of highly efficient, low carbon, base load power to the masses. In terms of electricity generation, Uranium has no equal.
To this end, Toronto based exploration company Consolidated Uranium is ahead of the curve having recently entered into definitive agreements with Energy Fuels (NYSE American: UUUU) (TSX: EFR) to acquire a portfolio of Uranium projects in the US including three past producing mines in mining friendly Utah. These new projects complement an already robust portfolio of assets, having already acquired or having the right to acquire uranium projects in Australia, Canada and Argentina each with significant past expenditures and attractive characteristics for development acquired from other well-regarded industry players such as Mega Uranium Ltd. and IsoEnergy Ltd.
These acquisitions give Consolidated Uranium a significant position in the Uranium market and the recent surge in Uranium prices, as shown in this recent Uranium chart may explain the Company’s acquisitive nature.
It’s clear, pardon the pun, that the Company is consolidating power at a time when optimism for the future of uranium is growing. This recent article from the venerable Wall Street Journal titled “Uranium Has That Healthy Glow Again,” is compelling:
https://www.wsj.com/articles/uranium-has-that-healthy-glow-again-11616497201
If the author’s conclusion is sound, Consolidated Uranium and the yellowcake sport market merit simultaneous review. Thanks to its recently acquired properties CUR is poised to become a significant producer of Uranium thereby providing investors with leverage to an anticipated further rising of Uranium prices.
About The Emerging Markets Report:
The Emerging Markets Report is owned and operated by Emerging Markets Consulting (EMC), a syndicate of investor relations consultants representing years of experience. Our network consists of stockbrokers, investment bankers, fund managers, and institutions that actively seek opportunities in the micro and small-cap equity markets.
For more informative reports such as this, please sign up at http://www.emergingmarketsllc.com/newsletter.php
Must Read OTC Markets/SEC policy on stock promotion and investor protection
Section 17(b) of the Securities Act of 1933 requires that any person that uses the mails to publish, give publicity to, or circulate any publication or communication that describes a security in return for consideration received or to be received directly or indirectly from an issuer, underwriter, or dealer, must fully disclose the type of consideration (i.e. cash, free trading stock, restricted stock, stock options, stock warrants) and the specific amount of the consideration. In connection therewith, EMC has received the following compensation and/or has an agreement to receive in the future certain compensation, as described below.
We may purchase Securities of the Profiled Company prior to their securities becoming publicly traded, which we may later sell publicly before, during or after our dissemination of the Information, and make profits therefrom. EMC does not verify or endorse any medical claims for any of its client companies.
EMC has been paid $250,000 by Consolidated Uranium Inc. for various marketing services including this report. EMC does not independently verify any of the content linked-to from this editorial. http://emergingmarketsllc.com/disclaimer.php
Emerging Markets Consulting, LLC
Florida Office
390 North Orange Ave STE 2300
Orlando, FL 32801
E-mail: jamespainter@emergingmarketsllc.com
Web: www.emergingmarketsllc.com

NEW YORK and TEL-AVIV, Israel, Aug. 10, 2021 (GLOBE NEWSWIRE) — REE Automotive, Ltd. (NASDAQ: REE) (“REE” or the “Company”), a leader in e-mobility, announced today that the Company will release its second quarter 2021 financial results before the NASDAQ market opens on Tuesday, August 17, 2021. A webcast and conference call will be held on August 17, 2021, at 08:30 a.m. Eastern time to review the Company’s second quarter results, discuss recent developments and conduct a question-and-answer session.
The live webcast and archived replay of the conference call can be accessed via the Events and Presentations page of REE’s Investor Relations website at https://investors.ree.auto/. For those unable to access the webcast or would like to ask questions, the conference call will be accessible domestically or internationally, by dialing 877-407-9039 or 201-689-8470, respectively. Upon dialing in, please provide your details and request to join the REE Automotive Second Quarter 2021 Earnings Conference Call.
About REE
REE is an automotive technology leader creating the cornerstone for tomorrow's zero-emission vehicles. REE’s mission is to empower global mobility companies to build any size or shape of electric or autonomous vehicle – from class 1 through class 6 – for any application and any target market. Our revolutionary, award-winning REEcorner technology packs traditional vehicle drive components (steering, braking, suspension, powertrain and control) into the arch of the wheel, allowing for the industry's flattest EV platform. Unrestricted by legacy thinking, REE is a truly horizontal player, with technology applicable to the widest range of target markets and applications. Fully scalable and completely modular, REE offers multiple customer benefits including complete vehicle design freedom, more space and volume with the smallest footprint, lower TCO, faster development times, ADAS compatibility, reduced maintenance and global safety standard compliance. Headquartered in Tel Aviv, Israel, with subsidiaries in the USA, the UK and Germany. REE has a unique CapEx-light manufacturing model that leverages its Tier 1 partners’ existing production lines. REE’s technology, together with their unique value proposition and commitment to excellence, positions REE to break new ground in e-Mobility. For more information visit https://www.ree.auto.
Contacts
Investor Relations Limor GruberVP Investor Relations, REE Automotive+972-50-5239233investors@ree.auto
MediaKeren ShemeshChief Marketing Officer, REE Automotive+972-54-5814333media@ree.auto
Caution About Forward-Looking StatementsThis communication includes forward-looking statements within the meaning of the Private Securities Litigation Reform Act of 1995. All statements, other than statements of historical facts, may be forward-looking statements. Words such as “may,” “will,” “should,” “likely,” “anticipates,” “expects,” “intends,” “plans,” “projects,” “believes,” “views,” “estimates”, “future”, “allows”, “aims”, “strives” “endeavours” and similar expressions are used to identify these forward-looking statements. These statements include, among other things, the Company’s statements about the Company’s strategic and business plans, relationships or outlook, the impact of trends on and interest in its business, intellectual property or product and its future results. These forward-looking statements are based on REE’s expectations and beliefs concerning future events and involve risks and uncertainties that may cause actual results to differ materially from current expectations. These factors are difficult to predict accurately and may be beyond REE’s control. Forward-looking statements in this communication or elsewhere speak only as of the date made and REE undertakes no obligation to update its forward-looking statements, whether as a result of new information, future developments or otherwise, should circumstances change, except as otherwise required by securities and other applicable laws. In light of these risks and uncertainties, investors should keep in mind that results, events or developments discussed in any forward-looking statement made in this communication may not occur. Uncertainties and risk factors that could affect REE’s future performance and cause results to differ from the forward-looking statements in this release include, but are not limited to: REE’s ability to commercialize its strategic plan; REE’s ability to maintain and advance relationships with current Tier 1 suppliers and strategic partners; development of REE’s advanced prototypes into marketable products; REE’s ability to grow and scale manufacturing capacity through relationships with Tier 1 suppliers; REE’s estimates of unit sales, expenses and profitability and underlying assumptions; REE’s reliance on its UK Engineering Center of Excellence for the design, validation, verification, testing and homologation of its products; REE’s limited operating history; risks associated with plans for REE’s initial commercial production; REE’s dependence on potential suppliers, some of which will be single or limited source; development of the market for commercial EVs; intense competition in the e-mobility space, including with competitors who have significantly more resources; risks related to the fact that the Company is incorporated in Israel and governed by Israeli law; REE’s ability to make continued investments in its platform; the impact of the ongoing COVID-19 pandemic and any other worldwide health epidemics or outbreaks that may arise; the need to attract, train and retain highly-skilled technical workforce; changes in laws and regulations that impact REE; REE’s ability to enforce, protect and maintain intellectual property rights as well as protect itself and defend against actual or potential claims; REE’s ability to retain engineers and other highly qualified employees to further its goals and insulate itself from and defend against any potential or asserted employee claims or legal action; and other risks and uncertainties set forth in the sections entitled “Risk Factors” and “Cautionary Note Regarding Forward-Looking Statements” in REE’s final prospectus relating to its business combination filed with the U.S. Securities and Exchange Commission (the “SEC”) on July 1, 2021 and in subsequent filings with the SEC. While the list of factors discussed above and the list of factors presented in the final prospectus are considered representative, no such list should be considered to be a complete statement of all potential risks and uncertainties. Unlisted factors may present significant additional obstacles to the realization of forward-looking statements.
Building a successful investment portfolio takes skill and hard work, no matter if you're a growth, value, income, or momentum-focused investor.
But what's the best way to find the right combination of stocks? Because funding things like your retirement, your kids' college tuition, or your short- and long-term savings goals will definitely require significant returns.
Enter the Zacks Rank.
What is the Zacks Rank?
A unique, proprietary stock-rating model, the Zacks Rank uses earnings estimate revisions, or changes to a company's earnings expectations, to help investors create a winning portfolio.
There are four main factors behind the Zacks Rank: Agreement, Magnitude, Upside, and Surprise.
Agreement is the extent to which all brokerage analysts are revising their earnings estimates in the same direction. The greater the percentage of analysts revising their estimates higher, the better chance the stock will outperform.
Magnitude is the size of the recent change in the consensus estimate for the current and next fiscal years.
Upside is the difference between the most accurate estimate, which is calculated by Zacks, and the consensus estimate.
Surprise is made up of a company's last few quarters' earnings per share surprises; companies with a positive earnings surprise are more likely to beat expectations in the future.
These four factors are assigned a raw score that's recalculated every night, which is then compiled into the ranking system. Stocks are classified into five groups using this data, ranging from "Strong Buy" to "Strong Sell."
The Power of Institutional Investors
The Zacks Rank also allows individual investors, or retail investors, to benefit from the power of institutional investors.
Institutional investors are responsible for managing the trillions of dollars invested in mutual funds, hedge funds, and investment banks. Research has shown that these investors can and do move the market due to the large amount of money they deal with, and thus, the market tends to move in the same direction as them.
In order to determine the fair value of a company and its shares, institutional investors design valuation models that focus on earnings and earnings estimates. Because if you raise earnings estimates, it then creates a higher fair value for a company and its stock price.
With these changes, institutional investors will act, usually buying stocks with rising estimates and selling those with falling estimates. An increase in earnings expectations can potentially lead to higher stock prices and bigger gains for the investor.
Because it can take a long time for an institutional investor to build a position — sometimes weeks, if not months — retail investors who get in at the first sign of upward revisions have a distinct advantage over these larger investors, and can benefit from the expected institutional buying that will follow.
Not only can the Zacks Rank help you take advantage of trends in earnings estimate revisions, but it can also provide a way to get into stocks that are highly sought after by professionals.
How to Invest with the Zacks Rank
The Zacks Rank is known for transforming investment portfolios. In fact, a portfolio of Zacks Rank #1 (Strong Buy) stocks has beaten the market in 26 of the last 32 years, with an average annual return of +25.41%.
Moreover, stocks with a new #1 (Strong Buy) ranking have some of the biggest profit potential, while those that fell to a #4 (Sell) or #5 (Strong Sell) have some of the worst.
Let's take a look at United States Steel (X), which was added to the Zacks Rank #1 list on July 30, 2021.
Pittsburgh, PA-based United States Steel Corp. is a leading steel manufacturer in the United States and the fifth largest in the world. It produces and sells steel mill products – including flat-rolled and tubular products – in North America and Europe. U.S. Steel has an annual raw steel production capacity of 22 million net tons. The company has been removed from the S&P 500 effective July 1, 2014.
Four analysts revised their earnings estimate upwards in the last 60 days for fiscal 2021. The Zacks Consensus Estimate has increased $6.40 to $11.95 per share. X boasts an average earnings surprise of 25.1%.
Earnings are forecasted to see growth of 355.9% for the current fiscal year, and sales are expected to increase 95.6%.
Even more impressive, X has gained in value over the past four weeks, up 5.6% compared to the S&P 500's gain of 2.3%.
Bottom Line
With a #1 (Strong Buy) ranking, positive trend in earnings estimate revisions, and strong market momentum, United States Steel should be on investors' shortlist.
If you want even more information on the Zacks Ranks, or one of our many other investing strategies, check out the Zacks Education home page.
Discover Today's Top Stocks
Our private Zacks #1 Rank List, based on our quantitative Zacks Rank stock-rating system, has more than doubled the S&P 500 since 1988. Applying the Zacks Rank in your own trading can boost your investing returns on your very next trade. See Today's Zacks #1 Rank List >>
Want the latest recommendations from Zacks Investment Research? Today, you can download 7 Best Stocks for the Next 30 Days. Click to get this free report
United States Steel Corporation (X) : Free Stock Analysis Report
To read this article on Zacks.com click here.
Zacks Investment Research
Lundin Mining Corporation (TSE:LUN) has announced that it will be increasing its dividend on the 15th of September to CA$0.18. This will take the dividend yield to an attractive 3.0%, providing a nice boost to shareholder returns.
View our latest analysis for Lundin Mining
Lundin Mining's Earnings Easily Cover the Distributions
If the payments aren't sustainable, a high yield for a few years won't matter that much. However, Lundin Mining's earnings easily cover the dividend. As a result, a large proportion of what it earned was being reinvested back into the business.
Looking forward, earnings per share is forecast to rise by 37.6% over the next year. Assuming the dividend continues along recent trends, we think the payout ratio could be 36% by next year, which is in a pretty sustainable range.

Lundin Mining Doesn't Have A Long Payment History
The dividend's track record has been pretty solid, but with only 5 years of history we want to see a few more years of history before making any solid conclusions. Since 2016, the first annual payment was US$0.088, compared to the most recent full-year payment of US$0.29. This implies that the company grew its distributions at a yearly rate of about 27% over that duration. It is always nice to see strong dividend growth, but with such a short payment history we wouldn't be inclined to rely on it until a longer track record can be developed.
The Dividend Looks Likely To Grow
Investors could be attracted to the stock based on the quality of its payment history. It's encouraging to see Lundin Mining has been growing its earnings per share at 27% a year over the past five years. A low payout ratio gives the company a lot of flexibility, and growing earnings also make it very easy for it to grow the dividend.
Lundin Mining Looks Like A Great Dividend Stock
In summary, it is always positive to see the dividend being increased, and we are particularly pleased with its overall sustainability. Distributions are quite easily covered by earnings, which are also being converted to cash flows. Taking this all into consideration, this looks like it could be a good dividend opportunity.
It's important to note that companies having a consistent dividend policy will generate greater investor confidence than those having an erratic one. Still, investors need to consider a host of other factors, apart from dividend payments, when analysing a company. For example, we've identified 4 warning signs for Lundin Mining (1 makes us a bit uncomfortable!) that you should be aware of before investing. We have also put together a list of global stocks with a solid dividend.
This article by Simply Wall St is general in nature. It does not constitute a recommendation to buy or sell any stock, and does not take account of your objectives, or your financial situation. We aim to bring you long-term focused analysis driven by fundamental data. Note that our analysis may not factor in the latest price-sensitive company announcements or qualitative material. Simply Wall St has no position in any stocks mentioned.
Have feedback on this article? Concerned about the content? Get in touch with us directly. Alternatively, email editorial-team (at) simplywallst.com.
London stocks kept a foothold in the green Monday, helped by a positive start for August across global equities and gains for the heavily weighted mining sector, following a bullish ratings upgrade by JPMorgan. The bank’s global equity strategy team lifted miners to overweight from neutral, commenting that after a stretch of weakness — 16% off first-quarter highs — “the valuation gap emerging relative to spot prices/earnings provides an opportunity for outperformance.” From the bank’s European mining, metals and steel team, lead analyst Luke Nelson, said earnings to date have confirmed “diversified miners’ capital returns credentials.”
TERRE HAUTE, Ind., Aug. 09, 2021 (GLOBE NEWSWIRE) — Hallador Energy Company (NASDAQ – HNRG) today reported net loss of $3.0 million, ($.10) per share, adjusted EBITDA of $11.3 million.
Brent Bilsland, President and Chief Executive Officer, stated, "We are experiencing one of the strongest and most dramatic market turn arounds we have seen in years. As a result, we have added an additional 500,000 tons of contracted sales during the quarter and expect to ship ~1 million more tons in the last half of 2021 versus the first half, representing a 40% increase in shipments."
Below are highlights for the quarter and first six months of 2021:
-
Additional contracted sales of 500,000 tons added during the quarter.
-
Q2 2021, shipments improved to a 5.6 million-ton annualized pace from a 4.7 million-ton annualized pace in Q1 2021. We expect shipments in the last half of 2021 to run at an ~7.0 million-ton annualized pace.
-
-
Hallador generated $6.4 million in Adjusted Free Cash Flow during the quarter.
-
As of June 30, 2021, our bank debt was $130.1 million, bringing our liquidity to $26.5 million resulting in a leverage ratio of 2.76X, well within our covenant of 3.25X.
-
-
Our entire $10 million PPP Loan was forgiven on July 23, 2021. The forgiveness of the PPP Loan will be recognized during Q3 2021.
-
Solid Sales Position Through 2022
-
We added ~500,000 contracted tons to our position during the quarter and expect to add tons later in the year for 2022 and beyond as markets recover and gas prices continue to increase.
-
|
CONTRACTED |
ESTIMATED |
|||||
|
TONS |
PRICED |
|||||
|
YEAR |
(MILLIONS)* |
PER TON |
||||
|
2021 (Q3- Q4) |
3.6 |
$ |
39.00 |
|||
|
2022 |
5.1 |
$ |
39.25 |
|||
|
8.7 |
||||||
|
____________ |
||||||
The table below represents some of our critical metrics (in thousands except for per ton data):
|
Three Months Ended |
Six Months Ended |
||||||||||||||
|
June 30, |
June 30, |
||||||||||||||
|
2021 |
2020 |
2021 |
2020 |
||||||||||||
|
Net Income (loss) |
$ |
(2,964 |
) |
$ |
254 |
$ |
(3,996 |
) |
$ |
(3,406 |
) |
||||
|
Total Revenues |
$ |
55,638 |
$ |
50,850 |
$ |
102,333 |
$ |
113,333 |
|||||||
|
Tons Sold |
1,403 |
1,244 |
2,577 |
2,770 |
|||||||||||
|
Average Price per Ton |
$ |
38.92 |
$ |
40.57 |
$ |
38.99 |
$ |
40.58 |
|||||||
|
Bank Debt |
$ |
130,113 |
$ |
161,113 |
$ |
130,113 |
$ |
161,113 |
|||||||
|
Operating Cash Flow |
$ |
9,915 |
$ |
918 |
$ |
12,888 |
$ |
17,174 |
|||||||
|
Adjusted EBITDA* |
$ |
11,299 |
$ |
13,175 |
$ |
22,718 |
$ |
27,074 |
|||||||
|
Adjusted Free Cash Flow ** |
$ |
6,429 |
$ |
6,281 |
$ |
11,799 |
$ |
13,094 |
|||||||
|
____________ |
|||||||||||||||
EBITDA, adjusted EBITDA, and adjusted free cash flow should not be considered alternatives to net income, income from operations, cash flows from operating activities or any other measure of financial performance presented in accordance with GAAP. Our method of computing EBITDA, adjusted EBITDA, and adjusted free cash flow may not be the same method used to compute similar measures reported by other companies.
Management believes that the presentation of such additional financial measures provides useful information to investors regarding our performance and results of operations because these measures, when used in conjunction with related GAAP financial measures, (i) provide additional information about our core operating performance and ability to generate and distribute cash flow, (ii) provide investors with the financial and analytical framework upon which management bases financial, operation, compensation, and planning decisions, and (iii) present measurements that investors, rating agencies, and debt holders have indicated are useful in assessing our results.
Reconciliation of GAAP "net income" to non-GAAP "adjusted EBITDA" (in thousands).
|
Three Months Ended |
Six Months Ended |
||||||||||||||
|
June 30, |
June 30, |
||||||||||||||
|
2021 |
2020 |
2021 |
2020 |
||||||||||||
|
Net income (loss) |
$ |
(2,964 |
) |
$ |
254 |
$ |
(3,996 |
) |
$ |
(3,406 |
) |
||||
|
Income tax expense (benefit) |
397 |
(618 |
) |
(1,332 |
) |
(2,794 |
) |
||||||||
|
Loss from Hourglass Sands |
24 |
63 |
104 |
141 |
|||||||||||
|
Income from equity method investments |
(63 |
) |
(1,231 |
) |
(63 |
) |
(1,286 |
) |
|||||||
|
Depreciation, depletion and amortization |
9,715 |
10,215 |
20,022 |
20,838 |
|||||||||||
|
Asset retirement obligations accretion |
373 |
343 |
736 |
676 |
|||||||||||
|
Gain on marketable securities |
— |
— |
— |
(14 |
) |
||||||||||
|
Interest expense |
2,182 |
2,834 |
4,080 |
8,548 |
|||||||||||
|
Other amortization |
1,490 |
1,396 |
2,979 |
2,822 |
|||||||||||
|
Change in fair value of fuel hedges |
(140 |
) |
(398 |
) |
(379 |
) |
913 |
||||||||
|
Stock-based compensation |
285 |
317 |
567 |
636 |
|||||||||||
|
Adjusted EBITDA |
$ |
11,299 |
$ |
13,175 |
$ |
22,718 |
$ |
27,074 |
|||||||
Reconciliation of GAAP "net income" to non-GAAP "adjusted free cash flow" (in thousands).
|
Three Months Ended |
Six Months Ended |
||||||||||||||
|
June 30, |
June 30, |
||||||||||||||
|
2021 |
2020 |
2021 |
2020 |
||||||||||||
|
Net income (loss) |
$ |
(2,964 |
) |
$ |
254 |
$ |
(3,996 |
) |
$ |
(3,406 |
) |
||||
|
Income from equity method investments |
(63 |
) |
(1,231 |
) |
(63 |
) |
(1,286 |
) |
|||||||
|
Deferred income tax expense (benefit) |
397 |
(618 |
) |
(1,332 |
) |
(2,270 |
) |
||||||||
|
Depreciation, depletion and amortization |
9,715 |
10,217 |
20,022 |
20,844 |
|||||||||||
|
Asset retirement obligations accretion |
373 |
343 |
736 |
676 |
|||||||||||
|
Deferred financing costs amortization |
641 |
609 |
1,252 |
1,076 |
|||||||||||
|
Change in fair value of interest rate swaps |
(766 |
) |
(617 |
) |
(1,614 |
) |
1,976 |
||||||||
|
Change in fair value of fuel hedges |
(140 |
) |
(398 |
) |
(379 |
) |
913 |
||||||||
|
Maintenance capex |
(1,049 |
) |
(2,578 |
) |
(3,392 |
) |
(6,048 |
) |
|||||||
|
Stock-based compensation less taxes paid |
285 |
300 |
565 |
619 |
|||||||||||
|
Adjusted Free Cash Flow |
$ |
6,429 |
$ |
6,281 |
$ |
11,799 |
$ |
13,094 |
|||||||
Conference Call
As previously announced our earnings conference call for financial analysts and investors will be held on Tuesday, August 10, 2021 at 2:00 pm eastern time. Dial-in numbers for the live conference call are as follows: Toll-free (888) 347-5317; Canadian Callers Toll-free (855) 669-9657; Conference ID #: Hallador Energy Company HNRG Call.
An audio replay of the conference call will be available for one week. To access the audio replay, dial US Toll-Free (877) 344-7529; Canada Toll-Free (855) 669-9658 and request to be connected to replay access code 10158706.
Hallador is headquartered in Terre Haute, Indiana and through its wholly owned subsidiary, Sunrise Coal, LLC, produces coal in the Illinois Basin for the electric power generation industry. To learn more about Hallador or Sunrise, visit our website at www.halladorenergy.com.
|
Contact: |
Investor Relations |
|
Phone: |
(303) 839-5504 |

If you would like to receive our free newsletter via email, simply enter your email address below & click subscribe.
 Follow us on Twitter
 Become our facebook fan
CONNECT WITH US
Tweets
Tweet with hash tag #miningfeeds or @miningfeeds and your tweets will be displayed across this site.
MOST ACTIVE MINING STOCKS
Daily Gainers
 CMC Metals Ltd. CMC Metals Ltd. |
CMB.V | +900.00% |
 Eden Energy Ltd Eden Energy Ltd |
EDE.AX | +200.00% |
| GoviEx Uranium Inc. |
GXU.V | +42.86% |
| Eagle Nickel Ltd. |
ENL.AX | +41.67% |
| Citigold Corp. Limited |
CTO.AX | +33.33% |
| Mount Burgess Mining NL |
MTB.AX | +33.33% |
| Exalt Resources Limited |
ERD.AX | +31.94% |
| Casa Minerals Inc. |
CASA.V | +30.00% |
| Cariboo Rose Resources Ltd |
CRB.V | +28.57% |
| Belmont Resources Inc. |
BEA.V | +28.57% |


