NEW YORK, July 22, 2021 /PRNewswire/ — OTC Markets Group Inc. (OTCQX: OTCM), operator of financial markets for 11,000 U.S. and global securities, today announced Salazar Resources Ltd. (TSX-V: SRL) (OTCQX: SRLZF), a company focused on creating value and positive change through discovery, exploration and development in Ecuador, has qualified to trade on the OTCQX® Best Market. Salazar Resources Ltd. upgraded to OTCQX from the OTCQB® Venture Market.
Salazar Resources Ltd. begins trading today on OTCQX under the symbol "SRLZF." U.S. investors can find current financial disclosure and Real-Time Level 2 quotes for the company on www.otcmarkets.com.
The OTCQX Market is designed for established, investor-focused U.S. and international companies. To qualify for OTCQX, companies must meet high financial standards, follow best practice corporate governance, and demonstrate compliance with applicable securities laws. Graduating to the OTCQX Market from the OTCQB Market marks an important milestone for companies, enabling them to demonstrate their qualifications and build visibility among U.S. investors.
Fredy E. Salazar, CEO and President, commented: "We are delighted to commence trading on the OTCQX, particularly during a period of significant exploration activity for Salazar in Ecuador, which is widely recognized as one of the world's most exciting and under-explored mining jurisdictions. Our experienced team has a proven track record and an unrivalled understanding of the geology in-country, having played an integral role in the discovery of most of the major projects in Ecuador, including the two newest operating gold and copper mines. We are currently focused on leveraging this knowledge to create value for shareholders by seeking the discovery of the country's next commercial copper-gold asset and have drills turning across our portfolio this year."
About Salazar Resources Ltd.
Salazar Resources is focused on creating value and positive change through discovery, exploration and development in Ecuador. The team has an unrivalled understanding of the geology in-country, and has played an integral role in the discovery of many of the major projects in Ecuador, including the two newest operating gold and copper mines. Salazar Resources has a wholly-owned pipeline of copper-gold exploration projects across Ecuador with a strategy to make another commercial discovery and farm-out non-core assets. The Company actively engages with Ecuadorian communities and together with the Salazar family it co-founded The Salazar Foundation, an independent non-profit organization dedicated to sustainable progress through economic development. The Company already has carried interests in three projects. At its maiden discovery, Curipamba, Salazar Resources has a 25% stake fully carried through to production. A feasibility study is underway and a 2019 PEA generated a base case NPV(8%) of US$288 million. At two copper-gold porphyry projects, Pijili and Santiago, the Company has a 20% stake fully carried through to a construction decision.
About OTC Markets Group Inc.
OTC Markets Group Inc. (OTCQX: OTCM) operates the OTCQX® Best Market, the OTCQB® Venture Market and the Pink® Open Market for 11,000 U.S. and global securities. Through OTC Link® ATS and OTC Link ECN, we connect a diverse network of broker-dealers that provide liquidity and execution services. We enable investors to easily trade through the broker of their choice and empower companies to improve the quality of information available for investors.
To learn more about how we create better informed and more efficient markets, visit www.otcmarkets.com.
OTC Link ATS and OTC Link ECN are SEC regulated ATSs, operated by OTC Link LLC, member FINRA/SIPC.
Subscribe to the OTC Markets RSS Feed
Media Contact:
OTC Markets Group Inc., +1 (212) 896-4428, media@otcmarkets.com


View original content to download multimedia:https://www.prnewswire.com/news-releases/otc-markets-group-welcomes-salazar-resources-ltd-to-otcqx-301338988.html
SOURCE OTC Markets Group Inc.
Vancouver, British Columbia–(Newsfile Corp. – July 22, 2021) – SALAZAR RESOURCES LIMITED (TSXV: SRL) (OTCQX: SRLZF) (FSE: CCG) ("Salazar" or the "Company") is pleased to announce its successful upgrade from the OTCQB® Venture Market to the OTCQX® Best Market under the ticker symbol "SRLZF". Salazar will continue to trade on the TSX Venture Exchange in Canada as its primary listing under the symbol "SRL" and on the Frankfurt Stock Exchange under the symbol "CCG.F".
Fredy E. Salazar, CEO and President, commented, "We are delighted to commence trading on the OTCQX, particularly during a period of significant exploration activity for Salazar in Ecuador, which is widely recognized as one of the world's most exciting and under-explored mining jurisdictions. Our experienced team has a proven track record and an unrivalled understanding of the geology in-country, having played an integral role in the discovery of most of the major projects in Ecuador, including the two newest operating gold and copper mines. We are currently focused on leveraging this knowledge to create value for shareholders by seeking the discovery of the country's next commercial copper-gold asset and have drills turning across our portfolio this year."
"Our previous success has provided Salazar with a 25% fully carried stake in our Curipamba VMS discovery, which is now being advanced by Adventus Mining. We look forward to welcoming new investors to our register during this exciting time in our development."
Investors can find information and trading status on Salazar at www.otcmarkets.com and www.salazarresources.com.
About Salazar
Salazar Resources is focused on creating value and positive change through discovery, exploration and development in Ecuador. The team has an unrivalled understanding of the geology in-country, and has played an integral role in the discovery of many of the major projects in Ecuador. Salazar Resources has a wholly-owned pipeline of copper-gold exploration projects across Ecuador with a strategy to make another commercial discovery and farm-out non-core assets. The Company actively engages with Ecuadorian communities and together with the Salazar family it co-founded The Salazar Foundation, an independent non-profit organization dedicated to sustainable progress through economic development. The Company already has carried interests in three projects. At its maiden discovery, Curipamba, Salazar Resources has a 25% stake fully carried through to production. A feasibility study is underway and a 2019 PEA generated a base case NPV(8%) of US$288 million. At two copper-gold porphyry projects, Pijili and Santiago, the Company has a 20% stake fully carried through to a construction decision.
For further information from Salazar please contact Merlin Marr-Johnson, Executive Vice President and Corporate Secretary at merlin@salazarresources.com or ir@salazarresources.com.
Neither the TSX Venture Exchange nor its Regulation Services Provider (as that term is defined in the policies of the TSX Venture Exchange) accepts responsibility for the adequacy or accuracy of this news release.
This press release contains "forward -looking information" within the meaning of applicable securities laws. Any statements that express or involve discussions with respect to predictions, expectations, beliefs, plans, projections, objectives, assumptions or future events or performance (often, but not always, identified by words or phrases such as "believes", "anticipates", "expects", "is expected", "scheduled", "estimates", "pending", "intends", "plans", "seeks", "forecasts", "targets", or "hopes", or variations of such words and phrases or statements that certain actions, events or results "may", "could", "would", "will", "should" "might", "will be taken", or "occur" and similar expressions) are not statements of historical fact and may be forward-looking statements. Forward-looking information herein includes, but is not limited to, statements that address activities, events, or developments that Salazar expects or anticipates will or may occur in the future. Although Salazar has attempted to identify important factors that could cause actual actions, events or results to differ materially from those described in forward-looking information, there may be other factors that cause actions, events or results not to be as anticipated, estimated or intended. There can be no assurance that such information will prove to be accurate, and actual results and future events could differ materially from those anticipated in such information. Accordingly, readers should not place undue reliance on forward-looking information. Salazar undertake to update any forward-looking information in accordance with applicable securities laws.

To view the source version of this press release, please visit https://www.newsfilecorp.com/release/90907
Fortuna Silver Mines (FSM) has been on a downward spiral lately with significant selling pressure. After declining 22.2% over the past four weeks, the stock looks well positioned for a trend reversal as it is now in oversold territory and there is strong agreement among Wall Street analysts that the company will report better earnings than they predicted earlier.
Guide to Identifying Oversold Stocks
We use Relative Strength Index (RSI), one of the most commonly used technical indicators, for spotting whether a stock is oversold. This is a momentum oscillator that measures the speed and change of price movements.
RSI oscillates between zero and 100. Usually, a stock is considered oversold when its RSI reading falls below 30.
Technically, every stock oscillates between being overbought and oversold irrespective of the quality of their fundamentals. And the beauty of RSI is that it helps you quickly and easily check if a stock's price is reaching a point of reversal.
So, by this measure, if a stock has gotten too far below its fair value just because of unwarranted selling pressure, investors may start looking for entry opportunities in the stock for benefitting from the inevitable rebound.
However, like every investing tool, RSI has its limitations, and should not be used alone for making an investment decision.
Why FSM Could Bounce Back Before Long
The heavy selling of FSM shares appears to be in the process of exhausting itself, as indicated by its RSI reading of 23.09. So, the trend for the stock could reverse soon for reaching the old equilibrium of supply and demand.

This technical indicator is not the only factor that calls for a potential rebound for the stock. There is a fundamental indicator as well. A strong agreement among sell-side analysts covering FSM in raising earnings estimates for the current year has led to an increase in the consensus EPS estimate by 6.3% over the last 30 days. And an upward trend in earnings estimate revisions usually translates into price appreciation in the near term.
Moreover, FSM currently has a Zacks Rank #2 (Buy), which means it is in the top 20% of more than the 4,000 stocks that we rank based on trends in earnings estimate revisions and EPS surprises. This is a more conclusive indication of the stock's potential turnaround in the near term. You can see the complete list of today's Zacks Rank #1 (Strong Buy) stocks here >>>>
Want the latest recommendations from Zacks Investment Research? Today, you can download 7 Best Stocks for the Next 30 Days. Click to get this free report
Fortuna Silver Mines Inc. (FSM) : Free Stock Analysis Report
To read this article on Zacks.com click here.
We often see insiders buying up shares in companies that perform well over the long term. Unfortunately, there are also plenty of examples of share prices declining precipitously after insiders have sold shares. So before you buy or sell Bear Creek Mining Corporation (CVE:BCM), you may well want to know whether insiders have been buying or selling.
What Is Insider Selling?
It is perfectly legal for company insiders, including board members, to buy and sell stock in a company. However, most countries require that the company discloses such transactions to the market.
Insider transactions are not the most important thing when it comes to long-term investing. But logic dictates you should pay some attention to whether insiders are buying or selling shares. As Peter Lynch said, 'insiders might sell their shares for any number of reasons, but they buy them for only one: they think the price will rise'.
Check out our latest analysis for Bear Creek Mining
The Last 12 Months Of Insider Transactions At Bear Creek Mining
In the last twelve months, the biggest single purchase by an insider was when Chief Operating Officer Eric Caba bought CA$88k worth of shares at a price of CA$3.12 per share. So it's clear an insider wanted to buy, even at a higher price than the current share price (being CA$1.41). While their view may have changed since the purchase was made, this does at least suggest they have had confidence in the company's future. We always take careful note of the price insiders pay when purchasing shares. Generally speaking, it catches our eye when insiders have purchased shares at above current prices, as it suggests they believed the shares were worth buying, even at a higher price.
In the last twelve months insiders purchased 48.16k shares for CA$120k. But insiders sold 37.00k shares worth CA$119k. Overall, Bear Creek Mining insiders were net buyers during the last year. The average buy price was around CA$2.49. I'd consider this a positive as it suggests insiders see value at around the current price. The chart below shows insider transactions (by companies and individuals) over the last year. If you click on the chart, you can see all the individual transactions, including the share price, individual, and the date!

Bear Creek Mining is not the only stock insiders are buying. So take a peek at this free list of growing companies with insider buying.
Bear Creek Mining Insiders Bought Stock Recently
We saw some Bear Creek Mining insider buying shares in the last three months. President Anthony Hawkshaw purchased CA$32k worth of shares in that period. We like it when there are only buyers, and no sellers. But in this case the amount purchased means the recent transaction may not be very meaningful on its own.
Insider Ownership of Bear Creek Mining
Many investors like to check how much of a company is owned by insiders. Usually, the higher the insider ownership, the more likely it is that insiders will be incentivised to build the company for the long term. Based on our data, Bear Creek Mining insiders have about 2.5% of the stock, worth approximately CA$4.4m. I generally like to see higher levels of ownership.
So What Do The Bear Creek Mining Insider Transactions Indicate?
Insider purchases may have been minimal, in the last three months, but there was no selling at all. The net investment is not enough to encourage us much. However, our analysis of transactions over the last year is heartening. While we have no worries about the insider transactions, we'd be more comfortable if they owned more Bear Creek Mining stock. In addition to knowing about insider transactions going on, it's beneficial to identify the risks facing Bear Creek Mining. Every company has risks, and we've spotted 4 warning signs for Bear Creek Mining (of which 1 shouldn't be ignored!) you should know about.
If you would prefer to check out another company — one with potentially superior financials — then do not miss this free list of interesting companies, that have HIGH return on equity and low debt.
For the purposes of this article, insiders are those individuals who report their transactions to the relevant regulatory body. We currently account for open market transactions and private dispositions, but not derivative transactions.
This article by Simply Wall St is general in nature. It does not constitute a recommendation to buy or sell any stock, and does not take account of your objectives, or your financial situation. We aim to bring you long-term focused analysis driven by fundamental data. Note that our analysis may not factor in the latest price-sensitive company announcements or qualitative material. Simply Wall St has no position in any stocks mentioned.
Have feedback on this article? Concerned about the content? Get in touch with us directly. Alternatively, email editorial-team (at) simplywallst.com.
Tesla TSLA recently inked a deal with BHP Group BHP to secure the supply of nickel from the latter’s Nickel West mine based in Western Australia.
Per the latest alliance, Tesla and BHP will also collaborate to make the battery supply chain more efficient and sustainable, with key focus on raw material procurement using blockchain and exchange of know-how for battery raw-material production. The companies will also identify supply-chain partners who are most aligned with their vision and battery value chains.
BHP will also join hands with Tesla on energy storage solutions to reduce carbon emissions through the enhanced use of sustainable energy, coupled with battery storage.
Headquartered in Melbourne, Australia, BHP is a leading resources company globally. The mining giant extracts and processes minerals, oil and gas and its products are sold worldwide. The company is a notable producer of major commodities, including iron ore, metallurgical coal, nickel and copper.
Shining Prospects of Nickel Market
Amid the heightening climate-change concerns, development of batteries used to power electric vehicles (EVs) has become crucial in order to decarbonize the global economy. This, in turn, has buoyed the demand of metals, particularly copper and nickel, used in the production of batteries.
Nickel, a core ingredient used in lithium-ion batteries, helps reduce the usage of cobalt, which is much more expensive and has an ambiguous supply chain. Amid the soaring popularity of EVs worldwide, demand for nickel in batteries is projected to jump more than 500% over the next decade. Within the shining future prospects of nickel, BHP claims to be one of the most sustainable and lowest carbon emission nickel producers in the world.
California-based Tesla is the undisputed leader of EVs and battery storage systems, with a vision to accelerate the global transition to green transportation solutions.
With the demand for nickel set to boom in the near future and due to challenges faced in procuring nickel, Tesla CEO Elon Musk has repeatedly expressed his concerns about the future supplies of nickel and has urged miners to increase the production of nickel.
In fact, in order to facilitate in-house production of batteries, Tesla has entered into a series of deals with mining companies for the commodities it needs to make batteries. This includes securing cobalt, another metal used in batteries, from the Swiss miner Glencore and supporting a nickel venture in New Caledonia.
The deal with BHP to procure nickel is in sync with Tesla’s vision of in-house production of batteries, and will boost the EV behemoth’s ability to self-manufacture batteries. The agreement is Tesla’s latest effort to shield itself from future supply crunch of metals needed in battery production. The agreement confirms Tesla will become one of the biggest customers of BHP for sustainable and reliable supply of quality nickel crucial to the EV maker’s growth plans.
BHP has been hinting a deal with Tesla since last year. For BHP, the deal marks a revival for the company’s Nickel West division. The company failed to sell the unit in 2014 and has since then diverted the division to cater to battery makers, rather than conventional customers like the stainless steel industry.
Though details on the deal amount have not been revealed by the companies, Tesla had earlier noted that it anticipates spending more than $1 billion annually on raw material for batteries from Australia.
Tesla — which shares space with auto biggies like General Motors GM and Ford F — currently carries a Zacks Rank #3 (Hold). You can see the complete list of today’s Zacks #1 Rank (Strong Buy) stocks here.
Want the latest recommendations from Zacks Investment Research? Today, you can download 7 Best Stocks for the Next 30 Days. Click to get this free report
Ford Motor Company (F) : Free Stock Analysis Report
BHP Group Limited Sponsored ADR (BHP) : Free Stock Analysis Report
General Motors Company (GM) : Free Stock Analysis Report
Tesla, Inc. (TSLA) : Free Stock Analysis Report
To read this article on Zacks.com click here.
Vancouver, British Columbia–(Newsfile Corp. – July 22, 2021) – EMX Royalty Corporation (NYSE American: EMX) (TSXV: EMX) (FSE: 6E9) (the "Company" or "EMX") is pleased to announce the the execution of an agreement for the sale of its Svärdsjö polymetallic project (the "Project") in Sweden to District Metals Corp. (TSXV: DMX) ("District"). The agreement provides the Company with additional share equity in DMX that brings EMX's ownership of District to 9.9%, annual advance royalty payments, a 2.5% Net Smelter Returns ("NSR") royalty interest in the Project, and other consideration.
The Svärdsjö Project is located in the prolific Bergslagen mining region of southern Sweden, nearby District's Tomtebo and Trollberget polymetallic VMS projects, which are also EMX royalty properties (see Figure 1). The Svärdsjö Project hosts multiple zones of polymetallic (copper-zinc-lead-silver-gold) volcanogenic massive sulfide ("VMS") and carbonate replacement ("CRD") style mineralization and is located in the vicinity of the historic Falun VMS mine and Boliden AB's active Garpenberg mine, one of the largest and most efficient underground polymetallic mines in the world.
Svärdsjö has been the site of historical mining activity for over 500 years, with production continuing through to 1989. Most recently, Boliden AB explored and drilled extensively in the area from 2009 until 2019. Historical production records indicate that much of the production came prior to 1972 and focussed on silver rich copper-zinc-lead mineralization developed as zones of replacement in carbonate host rocks. These styles of mineralization are similar to that seen in the nearby Garpenberg mine. See www.EMXroyalty.com for further information on the Project.
The agreement with District represents another example of EMX's execution of the royalty generation aspect of its business model. Although not available when first recognized during regional assessments, Svärdsjö remained on an EMX "watch list" for several years until coming available in 2020, when EMX quickly moved to secure the opportunity. EMX looks forward to working closely with District to further advance the Project.
Commercial Terms Overview. In accordance with the agreement, District will acquire a 100% interest in the Project subject to the following terms (all dollar amounts in CAD):
-
Upon closing, EMX will transfer the Svärdsjö exploration license to District.
-
Upon closing, EMX will receive $35,000 in cash and 1,400,000 common shares of DMX that increases EMX's equity ownership in DMX to 9.9% (on a non-diluted basis).
-
EMX will receive a 2.5% NSR royalty interest in the Project. On or before the sixth anniversary after closing, DMX has the option to purchase 0.5% of the NSR on the Project by paying EMX $2,000,000.
-
EMX will receive annual advance royalty ("AAR") payments of $25,000 for the Project commencing on the third anniversary of the closing, with the AAR payment increasing by $10,000 per year until reaching $75,000.
-
Payments of $275,000, payable in cash or shares of DMX, will be made to EMX upon the achievement of certain milestones, and District will be responsible for fulfilling work commitments on the Project.
-
To maintain its interest in the Project, within five years of the closing of the transaction, DMX will also: (i) spend a minimum of $1,000,000 on Project work expenditures with a minimum of $150,000 spent each year, and (ii) complete a minimum of 3,500 m of drilling.
-
Closing is subject to approval by the TSX Venture Exchange.
Overview of the Svärdsjö Project. The Project comprises 1,037 hectares within the prolific Bergslagen mining region in southern Sweden. In the Project area, copper-zinc-lead-silver-gold VMS and carbonate replacement style mineralization are associated with mid-Proterozoic age volcanic belts (refer to Figure 1). The Project is situated within a three-hour drive of Stockholm-Arlanda airport and has excellent year-round access, as well as nearby rail and power lines.
Mineralization at Svärdsjö is primarily developed as polymetallic sulfide replacements in dolomitic carbonate units accompanied by skarn minerals. Bodies of mineralization are enveloped within broader alteration zones typical of VMS systems, which in the case of Svärdsjö, provide well documented vectors that can be used to guide further exploration.
Historical production primarily came from three mining areas, which includes Kompanimalmen ("Company Ore"), Mellangruvan ("Middle Mine"), and Norramalmen ("Northern Ore"), with several of the historical zones remaining open and poorly explored at depth. Most recently, exploration between 2009-2019 delineated new lenses of mineralization to the west and southwest of the historical mining areas1. These, and other underexplored areas of the project will be targets for further exploration.
In addition, several additional exploration targets exist on the project, either defined by untested geophysical anomalies, or based upon trends of historical prospects and occurrences.
Notes on nearby mines and deposits. The nearby mines and deposits discussed in this news release provide context for EMX's Project, which occurs in a similar geologic setting, but this is not necessarily indicative that the Project hosts similar mineralization.
Dr. Eric P. Jensen, CPG, a Qualified Person as defined by National Instrument 43-101 and employee of the Company, has reviewed, verified and approved the disclosure of the technical information contained in this news release.
About EMX. EMX is a precious, base and battery metals royalty company. EMX's investors are provided with discovery, development, and commodity price optionality, while limiting exposure to risks inherent to operating companies. The Company's common shares are listed on the NYSE American Exchange and TSX Venture Exchange under the symbol EMX. Please see www.EMXroyalty.com for more information.
For further information contact:
David M. Cole
President and Chief Executive Officer
Phone: (303) 979-6666
Dave@EMXroyalty.com
Scott Close
Director of Investor Relations
Phone: (303) 973-8585
SClose@EMXroyalty.com
Isabel Belger
Investor Relations (Europe)
Phone: +49 178 4909039
IBelger@EMXroyalty.com
Neither the TSX Venture Exchange nor its Regulation Services Provider (as that term is defined in policies of the TSX Venture Exchange) accepts responsibility for the adequacy or accuracy of this release.
Forward-Looking Statements
This news release may contain "forward-looking statements" that reflect the Company's current expectations and projections about its future results. These forward-looking statements may include statements regarding perceived merit of properties, exploration results and budgets, mineral reserves and resource estimates, work programs, capital expenditures, timelines, strategic plans, market prices for precious and base metal, or other statements that are not statements of fact. When used in this news release, words such as "estimate," "intend," "expect," "anticipate," "will", "believe", "potential", "upside" and similar expressions are intended to identify forward-looking statements, which, by their very nature, are not guarantees of the Company's future operational or financial performance, and are subject to risks and uncertainties and other factors that could cause the Company's actual results, performance, prospects or opportunities to differ materially from those expressed in, or implied by, these forward-looking statements. These risks, uncertainties and factors may include, but are not limited to: unavailability of financing, failure to identify commercially viable mineral reserves, fluctuations in the market valuation for commodities, difficulties in obtaining required approvals for the development of a mineral project, increased regulatory compliance costs, expectations of project funding by joint venture partners and other factors.
Readers are cautioned not to place undue reliance on these forward-looking statements, which speak only as of the date of this news release or as of the date otherwise specifically indicated herein. Due to risks and uncertainties, including the risks and uncertainties identified in this news release, and other risk factors and forward-looking statements listed in the Company's MD&A for the year ended March 31, 2021 (the "MD&A"), and the most recently filed Annual Information Form (the "AIF") for the year ended December 31, 2020, actual events may differ materially from current expectations. More information about the Company, including the MD&A, the AIF and financial statements of the Company, is available on SEDAR at www.sedar.com and on the SEC's EDGAR website at www.sec.gov.

Figure 1. Location map, major geologic features and mineral occurrences in the Svärdsjö area.
To view an enhanced version of Figure 1, please visit:
https://orders.newsfilecorp.com/files/1508/90901_9ff7bd9a64f65b9b_002full.jpg
____________________
1 A. Fahlvik, 2018: Hydrothermal alteration and lithogeochemical marker units at the Svärdsjö Zn-Pb-Cu deposit, Bergslagen, Sweden, and their implication for exploration.

To view the source version of this press release, please visit https://www.newsfilecorp.com/release/90901
Vancouver, British Columbia–(Newsfile Corp. – July 22, 2021) – District Metals Corp. (TSXV: DMX) (FSE: DFPP); ("District" or the "Company") is pleased to announce the Company has executed a definitive purchase agreement dated July 20, 2021 (the "Purchase Agreement") with a wholly-owned subsidiary of EMX Royalty Corp. (TSXV: EMX) ("EMX") to acquire 100% ownership of the Svärdsjö Property (Figures 1 and 2) in the prolific Bergslagen District of Sweden, which hosts Boliden's Garpenberg Mine and Lundin Mining's Zinkgruvan Mine. Upon closing the acquisition of the Svärdsjö Property the Company's primary focus will remain on aggressively advancing the highly prospective Tomtebo Property.
Garrett Ainsworth, CEO of District, commented: "Since acquiring our flagship Tomtebo Property in June 2020 our belief in the potential to discover a significant high grade polymetallic deposit in the Bergslagen District has only increased. Over the past year we have been reviewing numerous properties to complement the Tomtebo Property as part of our corporate objective to become a dominant exploration and development company in the Bergslagen District. The addition of the Svärdsjö Property is highly accretive to our property portfolio as it is an advanced stage exploration property with several historic mines and occurrences that show high grade polymetallic targets similar to our Tomtebo Property. It is a pleasure to enter into our second property acquisition in the Bergslagen District with our partner EMX."
Svärdsjö Property Highlights
-
Svärdsjö is an advanced stage exploration property that covers an area of 1,037 ha and is located approximately 200 km northwest from the capital city of Stockholm in Sweden.
-
Boliden's Garpenberg Mine is located 45 km to the southeast, and the historic Falun Mine is located 15 km to the southwest. Lundin's Zinkgruvan Mine is located 200 km to the southwest.
-
Svärdsjö is located 25 km to the north of the Tomtebo Property, and contains similar host rocks, structure, alteration, and mineralization styles as the Garpenberg Mine, Historic Falun Mine, and the Tomtebo Property.
-
Several historic mines, numerous mineralized prospects and multiple untested targets are situated on the Svärdsjö Property.
-
Mining activities date back to the 14th century, and records show that the historic Svärdsjö Mine (1887-1989) produced 1.03 Mt at 112 g/t Ag, 6.0% Zn, 2.7% Pb, 0.6% Cu and 0.4 g/t Au1.
-
Mining at the historical Svärdsjö Mine reached a depth of 390 m where mineralization appears open at depth and along strike. Operations at Boliden's Garpenberg Mine and Lundin Mining's Zinkgruvan Mine are currently at depths of 1400 m and 1300 m, respectively.
-
Boliden conducted extensive exploration work on the Svärdsjö Property from 2009 until 2019. Boliden was not granted an extension to their exploration permit, and EMX claimed the Svärdsjö license area.
The Purchase Agreement
Pursuant to the Purchase Agreement, District will acquire a 100% interest in the Svärdsjö Property upon the following principal terms:
-
At closing of the proposed transaction District will: (i) make a cash payment of $35,000 to EMX; and (ii) issue EMX 1,659,084 common shares of District, representing EMX's increase of equity ownership from 8.0% to 9.9% in District (on a non-diluted basis).
-
To retain the Property, District must: (i) incur $1,000,000 of eligible expenditures on the Svärdsjö Property within five years of the closing of the proposed transaction including at least $150,000 in expenditures per year; and (ii) complete a minimum of 3,500 m of drilling within five years of the closing of the proposed transaction.
-
Upon announcement of each of a mineral resource estimate and preliminary economic assessment, District will pay to EMX a fee of $275,000 and, in the absence of either or both a mineral resource estimate and/or preliminary economic assessment, an aggregate of $550,000 upon a development decision, in each case, in either cash or common shares of District (based on the 20 day volume weighted average trading price of District's common shares on the TSX Venture Exchange).
-
District will reimburse EMX for the mineral license fee for years 2 and 3 that were pre-paid by EMX, which equals approximately $2,500.
-
District will grant EMX a 2.5% net smelter returns royalty on the Svärdsjö Property subject to an option to repurchase up to 0.5% of the royalty for $2,000,000 at any time within six years of the closing of the proposed transaction and in respect of which District will make annual advance royalty payments of $25,000 commencing on the third anniversary of the closing of the proposed transaction, with each payment increasing by $10,000 per year subject to maximum of $75,000 per year.
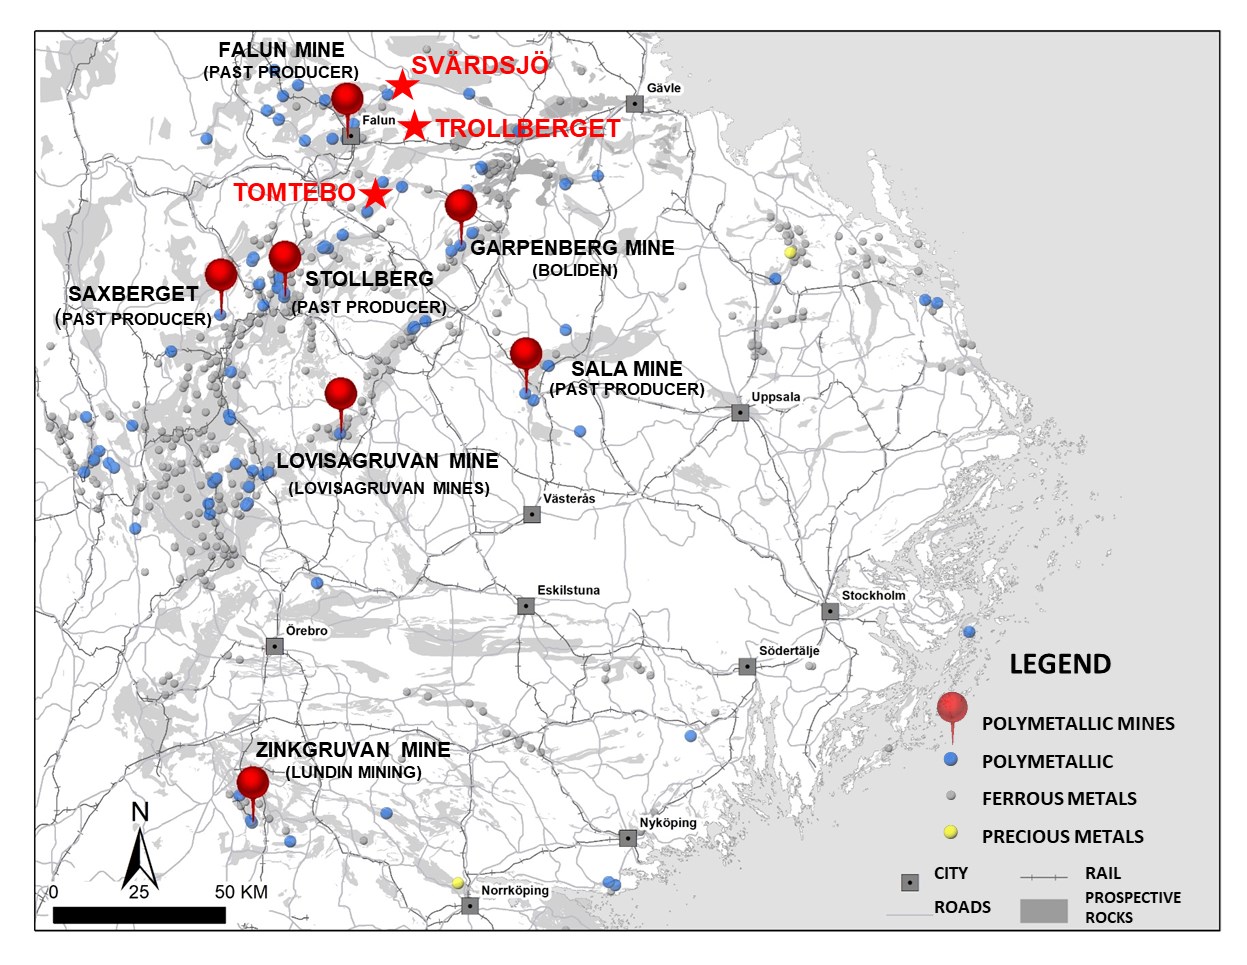
Figure 1: District Metals Mineral Licenses in the Bergslagen Mining District
To view an enhanced version of Figure 1, please visit:
https://orders.newsfilecorp.com/files/7971/90896_13ff27f4a46918c0_002full.jpg.
Note: The nearby mines provide geologic context for District's Properties, but this is not necessarily indicative that the properties host similar tonnages or grades of mineralization.
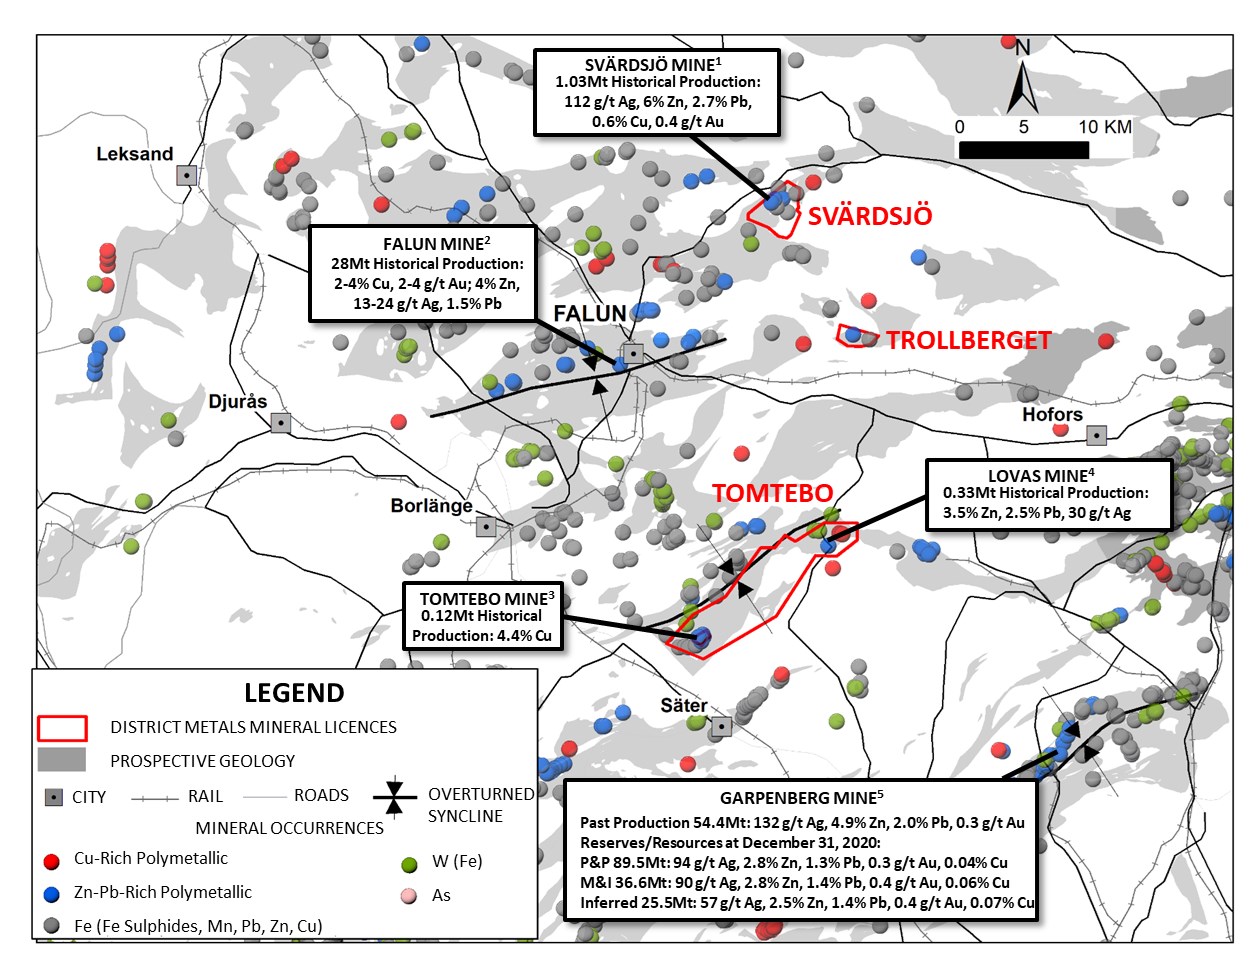
Figure 2: Location Map of Svärdsjö Property
To view an enhanced version of Figure 2, please visit:
https://orders.newsfilecorp.com/files/7971/90896_13ff27f4a46918c0_003full.jpg.
Note: The nearby mines provide geologic context for District's Properties, but this is not necessarily indicative that the properties host similar tonnages or grades of mineralization.
References
1 Sveriges Geologiska Undersökning (SGU) Map Viewer: https://apps.sgu.se/kartvisare/kartvisare-malm-mineral.html
2 Allen, R.L., Lundström, I., Ripa, M., and Christofferson, H., 1996, Facies analysis of a 1.9 Ga, continental margin, back-arc, felsic caldera province with diverse Zn-Pb-Ag-(Cu-Au) sulfide and Fe oxide deposits, Bergslagen region, Sweden: Economic Geology, v. 91, p. 979-1008.
3 Ed. Eilu, Pasi, 2012, Geological Survey of Finland, Special Paper 53, Metallogenic areas in Sweden.
4 Geological Survey of Sweden report grb_097, 1997.
Technical Information
All scientific and technical information in this news release has been prepared by, or approved by Garrett Ainsworth, PGeo, President and CEO of the Company. Mr. Ainsworth is a qualified person for the purposes of National Instrument 43-101 – Standards of Disclosure for Mineral Projects.
Mr. Ainsworth has not verified any of the information regarding any of the properties or projects referred to herein other than the Svärdsjö and Tomtebo Properties. Mineralization on any other properties referred to herein is not necessarily indicative of mineralization on the Svärdsjö or Tomtebo Properties.
About District Metals Corp.
District Metals Corp. is led by industry professionals with a track record of success in the mining industry. The Company's mandate is to seek out, explore, and develop prospective mineral properties through a disciplined science-based approach to create shareholder value and benefit other stakeholders.
The advanced exploration stage Tomtebo Property is located in the Bergslagen Mining District of south-central Sweden is the Company's main focus. Tomtebo comprises 5,144 ha, and is situated between the historic Falun Mine and Boliden's Garpenberg Mine that are located 25 km to the northwest and southeast, respectively. Two historic polymetallic mines and numerous polymetallic showings are located on the Tomtebo Property along an approximate 17 km trend that exhibits similar geology, structure, alteration and VMS/SedEx style mineralization as other significant mines within the district. Mineralization that is open at depth and along strike at the historic mines on the Tomtebo Property has not been followed up on, and modern systematic exploration has never been conducted on the Property.
For further information on the Tomtebo Property, please see the technical report entitled "NI 43-101 Update Technical Report on the Tomtebo Project, Bergslagen Region of Sweden" dated effective October 15, 2020 and amended and restated on February 26, 2021, which is available on SEDAR at www.sedar.com.
On Behalf of the Board of Directors
"Garrett Ainsworth"
President and Chief Executive Officer
(604) 288-4430
Neither TSX Venture Exchange nor its Regulation Services Provider (as that term is defined in policies of the TSX Venture Exchange) accepts responsibility for the adequacy or accuracy of this release.
Cautionary Statement Regarding "Forward-Looking" Information.
This news release contains certain statements that may be considered "forward-looking information" with respect to the Company within the meaning of applicable securities laws. In some cases, but not necessarily in all cases, forward-looking information can be identified by the use of forward-looking terminology such as "plans", "targets", "expects" or "does not expect", "is expected", "an opportunity exists", "is positioned", "estimates", "intends", "assumes", "anticipates" or "does not anticipate" or "believes", or variations of such words and phrases or statements that certain actions, events or results "may", "could", "would", "might", "will" or "will be taken", "occur" or "be achieved" and any similar expressions. In addition, any statements that refer to expectations, predictions, indications, projections or other characterizations of future events or circumstances contain forward-looking information. Statements containing forward-looking information are not historical facts but instead represent management's expectations, estimates and projections regarding future events. Forward-looking statements in this news release relating to the Company include, among other things, statements relating to the Company's intention that, upon closing the acquisition of the Svärdsjö Property, its primary focus will remain on advancing its material property, the highly prospective Tomtebo Property; the Company's belief in the potential to discover a significant high grade polymetallic deposit in the Bergslagen District; the Company's objective to become a dominant exploration and development company in the Bergslagen District; the Company's belief that it has identified high grade polymetallic targets on the Svärdsjö Property which are similar the Tomtebo Property.
These statements and other forward-looking information are based on opinions, assumptions and estimates made by the Company in light of its experience and perception of historical trends, current conditions and expected future developments, as well as other factors that the Company believes are appropriate and reasonable in the circumstances, as of the date of this news release, including, without limitation, assumptions about the reliability of historical data and the accuracy of publicly reported information regarding past and historic mines in the Bergslagen district; the Company's ability to raise sufficient capital to fund planned exploration activities, maintain corporate capacity and satisfy the exploration expenditure requirements required by the definitive purchase agreement between the Company and the vendor of the Tomtebo Property (the "Tomtebo Purchase Agreement") by the times specified therein; and stability in financial and capital markets.
Forward-looking information is necessarily based on a number of opinions, assumptions and estimates that, while considered reasonable by the Company as of the date such statements are made, are subject to known and unknown risks, uncertainties, assumptions and other factors that may cause the actual results, level of activity, performance or achievements to be materially different from those expressed or implied by such forward-looking information, including but not limited to risks associated with the following: the reliability of historic data regarding the Company's properties; the Company's ability to raise sufficient capital to finance planned exploration (including incurring prescribed exploration expenditures required by the Tomtebo Purchase Agreement, failing which the Tomtebo Property will be forfeited without any repayment of the purchase price); the Company's limited operating history; the Company's negative operating cash flow and dependence on third-party financing; the uncertainty of additional funding; the uncertainties associated with early stage exploration activities including general economic, market and business conditions, the regulatory process, failure to obtain necessary permits and approvals, technical issues, potential delays, unexpected events and management's capacity to execute and implement its future plans; the Company's ability to identify any mineral resources and mineral reserves; the substantial expenditures required to establish mineral reserves through drilling and the estimation of mineral reserves or mineral resources; the Company's dependence on one material project, the Tomtebo Property; the uncertainty of estimates used to calculated mineralization figures; changes in governmental regulations; compliance with applicable laws and regulations; competition for future resource acquisitions and skilled industry personnel; reliance on key personnel; title matters; conflicts of interest; environmental laws and regulations and associated risks, including climate change legislation; land reclamation requirements; changes in government policies; volatility of the Company's share price; the unlikelihood that shareholders will receive dividends from the Company; potential future acquisitions and joint ventures; infrastructure risks; fluctuations in demand for, and prices of gold, silver and copper; fluctuations in foreign currency exchange rates; legal proceedings and the enforceability of judgments; going concern risk; risks related to the Company's information technology systems and cyber-security risks; and risk related to the outbreak of epidemics or pandemics or other health crises, including the recent outbreak of COVID-19. For additional information regarding these risks, please see the Company's Annual Information Form, under the heading "Risk Factors", which is available at www.sedar.com. These factors and assumptions are not intended to represent a complete list of the factors and assumptions that could affect the Company. These factors and assumptions, however, should be considered carefully. Although the Company has attempted to identify factors that would cause actual actions, events or results to differ materially from those disclosed in the forward-looking statements or information, there may be other factors that cause actions, events or results not to be as anticipated, estimated or intended. Also, many of such factors are beyond the control of the Company. Accordingly, readers should not place undue reliance on forward-looking statements or information. The forward-looking information is made as of the date of this news release, and the Company assumes no obligation to publicly update or revise such forward-looking information, except as required by applicable securities laws. All scientific and technical information contained in this news release has been prepared by or reviewed and approved by Garrett Ainsworth, PGeo, President and CEO of the Company. Mr. Ainsworth is a qualified person for the purposes of National Instrument 43-101 – Standards of Disclosure for Mineral Projects.

To view the source version of this press release, please visit https://www.newsfilecorp.com/release/90896.
VANCOUVER, British Columbia, July 22, 2021 (GLOBE NEWSWIRE) — Skyharbour Resources Ltd. (TSX-V: SYH) (OTCQB: SYHBF) (Frankfurt: SC1P) (the “Company”) is pleased to announce that partner company Valor Resources Limited (“Valor”) has received the results and interpretation from the airborne magnetic and very low frequency electromagnetic (VLF-EM) geophysical survey completed over the Hook Lake Project in April. The purpose of the survey was to gather data that would help identify areas of shallow structural complexity, known to be favorable for the deposition of uranium in basement lithologies, and determine the geophysical signature of known occurrences.
Hook Lake (Formally North Falcon) Project
https://skyharbourltd.com/_resources/projects/Falcon-Point-Project.jpg
The Hook Lake Project consists of 16 contiguous mining claims covering 25,846 hectares, located 60 km east of the Key Lake Uranium Mine in northern Saskatchewan. Skyharbour signed a Definitive Agreement with Valor Resources on the Hook Lake (previously North Falcon Point) Uranium Project whereby Valor can earn-in 80% of the project through $3,500,000 in total exploration expenditures, $475,000 in total cash payments over three years and an initial share issuance of 233,333,333 shares of Valor.
Highlights:
-
Airborne geophysical survey reinforces size potential of historic uranium occurrences and highlights additional targets across the Hook Lake Project:
-
Both the VLF-EM and Magnetic data confirm extensive NE-SW trending structural features as well as N-S trending structures
-
Data confirms known uranium showings are situated where these structural trends intersect and in close association with shallow VLF-EM conductors
-
The N-S structural features may represent the influence of the Tabbernor Fault System, a major structural feature associated with known uranium deposits in the eastern Athabasca Basin
-
“Heat maps” illustrating structural complexity highlighted additional areas for follow-up work
-
-
Field work set to commence very shortly at the Hook Lake Project to follow up new targets and historic uranium occurrences
-
Work approvals received including approval for drilling
-
Radiometric survey has commenced with coverage of the northeastern third of the Hook Lake Project and will be completed by the end of July
Figure 1: Hook Lake Project – VLF-EM image showing priority target areas
https://www.skyharbourltd.com/_resources/maps/Hook-Lake-VLF-EM.jpg
Valor Executive Chairman, Mr. George Bauk commented: “The survey has confirmed the key targets for immediate follow up and has provided data to verify additional targets for drilling. Significant new geological information has come out of the survey including the N-S structural features, possibly representing the Tabbernor Fault System. These results have exceeded our expectations with the number of target areas to follow up. We have secured all permits that allow us to follow up on the ground, including drilling, which we are targeting for the December quarter. The field crew will be mobilising to site July 23rd, 2021. The company is excited to be commencing field work in Saskatchewan and looks forward to the results of the exploration effort at Hook Lake.”
Airborne Magnetic and VLF-EM Survey:
A project-wide, high-resolution, magnetic and VLF-EM survey was completed in April. The 5,172-line km survey was completed by Precision Geosurveys of Langley, British Columbia, using a fixed wing aircraft at a line spacing of 75m. The purpose of the survey was to gather data that would help identify areas of shallow structural complexity, known to be favorable for the deposition of uranium in basement lithologies, and determine the geophysical signature of known occurrences.
Geophysical Data Interpretation:
The geophysical data confirms extensive and complex structural trends across the property that could indicate structural and/or lithological traps for uranium mineralisation. Both the magnetic and VLF-EM data show a strong NE-SW structural trend similar to that present in other basement-hosted uranium deposits in the eastern Athabasca Basin area. A significant N-S structural trend is also present that has features similar to those associated with the Tabbernor Fault System.
Several of the known in-situ uranium occurrences on the property (Hook Lake, Nob Hill and West Way – see news release dated October 22nd, 2020) are coincident with the intersection of these structural trends. The most significant uranium occurrences within the property also appear to have a close association with shallow VLF-EM conductors (see Figure 1 above). Several other conductors, that have previously seen little exploration and have no known nearby occurrences, also represent excellent prospects for follow-up exploration.
The magnetic data shows the Hook Lake mineralisation, with high grade surface outcrop with reported grades in grab samples up to 68% U3O8, may be part of a larger and broader anomalous zone than originally thought. 3D Inversion of the magnetic data indicates a potential feeder system coming up through the stratigraphy.
Tabbernor Fault System:
The presence of a N-S structural influence similar to that recognised in the Tabbernor Fault System could be an important feature on the Hook Lake property. The Tabbernor Fault System is a wide structural feature that runs N-S for over 1,500 km along Saskatchewan’s eastern provincial border. While there is no direct link between the Tabbernor system and current known uranium deposits, several deposits are associated with a N-S structural component within the sphere of influence of the Tabbernor system. It has been proposed that reactivation of the Tabbernor Fault System coincided with the formation of large uranium deposits in the Athabasca Basin and the Tabbernor system may have controlled deposit location. Deposits exhibiting N-S structural control, with features consistent with the Tabbernor system include Rabbit Lake (Collins Bay B Zone and Eagle Point), Dawn Lake, Midwest and the Sue deposit (reference Davies, J.R. (1998): The origin, structural style, and reactivation history of the Tabbernor fault zone, Saskatchewan, Canada; Masters thesis, McGill University, Montreal, Quebec, 105p.).
Airborne Radiometric Survey:
A high-resolution airborne radiometric survey is being flown over the northeastern third of the Hook Lake Project, which will include the Hook Lake historical high grade uranium occurrence. The survey is being flown by Special Projects Inc. (“SPI”) from Calgary, Alberta. SPI is considered an industry-leading provider of high-resolution airborne radiometric surveying. SPI flew the radiometric survey that delineated Fission Uranium’s PLS boulder field which eventually led to the discovery of the high-grade Triple R uranium deposit.
Any significant new radiometric anomalies generated from this survey will be followed up on ground during the upcoming field program.
Ground Field Work Program:
Valor has received the required work permits to carry out its follow-up ground exploration program on the Hook Lake project. The permits, issued by Saskatchewan Ministry of Environment include Crown Land Work Authorization and Forest Product Permit, Aquatic Habitat Protection Permit, and Temporary Work Camp Permit. They allow Valor to conduct ground exploration, including drilling, until the end of 2022.
Field work is set to commence in the next few days at the Hook Lake Project to follow-up on the historic uranium occurrences and new targets generated from the recently completed magnetic/VLF-EM survey. A field crew supported by a helicopter is being mobilised to the area to carry out a field program which will take 2-3 weeks.
The initial field work program will be conducted by Dahrouge Geological Consulting Ltd. Dahrouge Geological is a North American mineral exploration, consulting, and project management group with offices in Canada and the United States. They provide professional geological, logistical, and project management services to the world’s mining and mineral resource industry including project generation, program design, geophysics, project evaluation, geology & resources, as well as mine engineering and geotechnics. Dahrouge Geological has extensive exploration experience in Saskatchewan’s Athabasca Basin, with a consistent presence in the area since the early 2000’s; this experience and network of contacts makes Dahrouge Geological an ideal team to lead the exploration program on the Hook Lake Project.
About Hook Lake (previously North Falcon Point) Project:
Valor has the right to earn an 80% working interest in the Hook Lake Uranium Project located 60 km east of the Key Lake Uranium Mine in northern Saskatchewan. Covering 25,846 hectares, the 16 contiguous mineral claims host several prospective areas of uranium mineralisation including:
-
Hook Lake / Zone S – High grade surface outcrop with reported grades in grab samples up to 68% U3O8; a bio-geochemical survey carried out over the trenches in 2015 responded positively with along-strike anomalies 2 km to the northeast
-
Nob Hill – Fracture-controlled vein-type uranium mineralisation on surface outcrop with up to 0.130% – 0.141% U3O8 in grab samples; diamond drilling intersected anomalous uranium in several drill holes with values up to 422 ppm U over 0.5 m
-
West Way – Vein type U mineralisation within a NE-trending shear zone; grab samples taken from the surface showing contained variable uranium values including up to 0.475% U3O8 and drilling of the structure intersected the altered shear zone at depth, along with anomalous Cu, Ni, Co, As, V, U, & Pb
-
Grid T – Fracture-hosted secondary uranium mineralisation in sheared calc-silicates and marbles in a 100 m x 20 m zone of anomalous radioactivity with grab samples having up to 800 ppm U
-
Alexander Lake Boulder Field – 30 biotite-quartz-k-feldspar pegmatite boulders NE of Alexander Lake; the best results include 360 ppm U, 1,400 ppm U and 1,600 ppm U respectively
-
Thompson Lake Boulder Field – Numerous radioactive boulders and blocks of pegmatized meta-arkose, pegmatite, and granite; the best value obtained was 738 ppm U from a granite boulder
-
NE Alexander Lake – Several calc-silicate, plagioclase-quartz granulite, quartzite, and meta-arkose boulders with up to 4,800 ppm U, 7,600 ppm Mo and 1,220 ppm Ni
The project area is in close proximity to two all-weather northern highways and grid power. Historical exploration has consisted of airborne and ground geophysics, multi-phased diamond drill campaigns, detailed geochemical sampling and surveys, and ground-based prospecting culminating in an extensive geological database for the project area.
Qualified Person:
The technical information in this news release has been prepared in accordance with the Canadian regulatory requirements set out in National Instrument 43-101 and reviewed and approved by Richard Kusmirski, P.Geo., M.Sc., Skyharbour’s Head Technical Advisor and a Director, as well as a Qualified Person.
About Valor Resources Ltd:
Valor Resources Limited (ASX: VAL) is an exploration company focused on creating shareholder value through acquisitions and exploration activities.
About Skyharbour Resources Ltd.:
Skyharbour holds an extensive portfolio of uranium exploration projects in Canada's Athabasca Basin and is well positioned to benefit from improving uranium market fundamentals with six drill-ready projects covering over 240,000 hectares of land. Skyharbour has acquired from Denison Mines, a large strategic shareholder of the Company, a 100% interest in the Moore Uranium Project which is located 15 kilometres east of Denison's Wheeler River project and 39 kilometres south of Cameco's McArthur River uranium mine. Moore is an advanced stage uranium exploration property with high grade uranium mineralization at the Maverick Zone that returned drill results of up to 6.0% U3O8 over 5.9 metres including 20.8% U3O8 over 1.5 metres at a vertical depth of 265 metres. The Company is actively advancing the project through drill programs.
Skyharbour has a joint-venture with industry-leader Orano Canada Inc. at the Preston Project whereby Orano has earned a 51% interest in the project through exploration expenditures and cash payments. Skyharbour now owns a 24.5% interest in the Project. Skyharbour also has a joint-venture with Azincourt Energy at the East Preston Project whereby Azincourt has earned a 70% interest in the project through exploration expenditures, cash payments and share issuance. Skyharbour now owns a 15% interest in the Project. Preston and East Preston are large, geologically prospective properties proximal to Fission Uranium's Triple R deposit as well as NexGen Energy's Arrow deposit.
The Company also owns a 100% interest in the South Falcon Uranium Project on the eastern perimeter of the Basin, which contains a NI 43-101 inferred resource totaling 7.0 million pounds of U3O8 at 0.03% and 5.3 million pounds of ThO2 at 0.023%. Skyharbour has signed a Definitive Agreement with ASX-listed Valor Resources on the Hooke Lake (previously North Falcon Point) Uranium Project whereby Valor can earn-in 80% of the project through $3,500,000 in total exploration expenditures, $475,000 in total cash payments over three years and an initial share issuance.
Skyharbour's goal is to maximize shareholder value through new mineral discoveries, committed long-term partnerships, and the advancement of exploration projects in geopolitically favourable jurisdictions.
Skyharbour’s Uranium Project Map in the Athabasca Basin:
http://skyharbourltd.com/_resources/maps/SYH-Athabasca-Map.jpg
To find out more about Skyharbour Resources Ltd. (TSX-V: SYH) visit the Company’s website at www.skyharbourltd.com.
SKYHARBOUR RESOURCES LTD.
“Jordan Trimble”
Jordan Trimble
President and CEO
For further information contact myself or:
Riley Trimble
Corporate Development and Communications
Skyharbour Resources Ltd.
Telephone: 604-687-3376
Toll Free: 800-567-8181
Facsimile: 604-687-3119
Email: info@skyharbourltd.com
NEITHER THE TSX VENTURE EXCHANGE NOR ITS REGULATION SERVICES PROVIDER ACCEPTS RESPONSIBILITY FOR THE ADEQUACY OR ACCURACY OF THE CONTENT OF THIS NEWS RELEASE.
This release includes certain statements that may be deemed to be "forward-looking statements". All statements in this release, other than statements of historical facts, that address events or developments that management of the Company expects, are forward-looking statements. Although management believes the expectations expressed in such forward-looking statements are based on reasonable assumptions, such statements are not guarantees of future performance, and actual results or developments may differ materially from those in the forward-looking statements. The Company undertakes no obligation to update these forward-looking statements if management's beliefs, estimates or opinions, or other factors, should change. Factors that could cause actual results to differ materially from those in forward-looking statements, include market prices, exploration and development successes, continued availability of capital and financing, and general economic, market or business conditions. Please see the public filings of the Company at www.sedar.com for further information.

On July 7, Energy Fuels Inc. made its first regular shipment of a rare earth carbonate called monazite from the United States to Europe.
The metal started in a mine in southern Georgia, then was shipped to a Utah processing plant and finally to a rare earth elements separation facility in Estonia.
The 20-ton shipment created a new U.S.-to-Europe rare earth supply chain, and is one of only two current U.S. operations producing and selling processed rare earth metals.
"We didn't even know we had a role to play in the industry until probably a year and a half ago," Curtis Moore, vice president of marketing and corporate development for Energy Fuels, told FreightWaves.
"We learned that there's this mineral called monazite, which is very high in magnetic rare earth elements — that's neodymium, praseodymium, dysprosium and terbium — which are the raw materials you need for these permanent rare earth magnets used in everything from electric cars to fighter jets."
Lakewood, Colorado-based Energy Fuels (NYSE: UUUU), a uranium mining company founded in 1987, is one of several companies making recent moves in the U.S. rare earth market. Another is Lynas Corp. (ASX: LYC), an Australian rare earths company, which recently received a $30.4 million federal grant to open the first rare earths separation facility in the U.S.
"We are currently in the planning phase for our proposed integrated U.S. rare earth processing facility, for both light rare earths and heavy rare earths processing and rare earth specialty materials," Lynas officials said in an email to FreightWaves.
Prior to Energy Fuels' shipment of monazite to Estonia, the U.S. had only one big operational rare earths mine, in Mountain Pass, California. Molycorp, which owned the mine and was the only rare earths producer in the country, went bankrupt and closed in 2015.
Last November, the U.S. Department of Defense supported the resumption of mining at Mountain Pass by funding $9.6 million to MP Materials, a private equity-backed company, to restart excavations. Once mined, the rare earth elements must be sent to China for processing.
Lynas hopes to alter that dynamic.
"Rare earth separation capability has been absent from the U.S. for several years, and our proposed facility will provide a secure, domestic source of high-quality separated rare earth materials," Lynas said.
The small Texas town of Hondo — where Lynas plans to build its separation facility — is 43 miles west of San Antonio. Lynas' proposed facility will receive rare earth processed "feedstock" from the company's Mount Weld mine in western Australia.
"We will follow proper processes and procedures before we finalize our construction plans. Once planning and permitting are completed, we expect the facility could be operational in 2-3 years," Lynas said.
The moves by Energy Fuels and Lynas Corp. come at a time when the Biden administration has made it a priority to rejuvenate the U.S. as a player in the production of rare earth materials, thereby reducing the reliance on China for critical rare earth supplies.
China has dominated mining and production of rare earth since the 1980s, accounting for 80% ($110 million) of U.S. imports in 2020, according to the U.S. Geological Survey.
Processed rare earth metals are a group of 17 elements used in almost all modern technology, including smartphones, X-ray machines, turbine blades, flat-screen TVs and computer monitors, hybrid and electric vehicles, along with U.S. military weapons such as guided-missiles and F-35 fighter jets.
Rare Earth Elements And Their Applications
|
Lanthanum |
Optical glass, hydride batteries |
|
Cerium |
Colored glass (flat-panel displays), auto catalytic converters |
|
Praseodymium |
Strong magnets, metal alloys, specialty glass, lasers |
|
Neodymium |
Permanent magnets |
|
Samarium |
Permanent magnets, nuclear reactor controls rods, lasers |
|
Europium |
Optical fibers, visual displays, lighting |
|
Gadolinium |
Shielding in nuclear reactors, X-ray and MRI systems |
|
Terbium |
Visual displays, fuel cells, lighting |
|
Dysprosium |
Permanent magnets, lighting |
|
Holmium |
Lasers, strong magnets, glass coloring |
|
Erbium |
Glass coloring, fiber optic cables |
|
Thulium |
Lasers, portable X-ray machines |
|
Ytterbium |
Stainless steel, lasers |
|
Lutetium |
Petroleum refining |
|
Yttrium |
Metal alloys, visual displays, lasers, lighting |
|
Scandium |
Metal alloys for aerospace equipment |
|
Promethium |
Portable X-ray devices, batteries |
Rare earth elements are actually not all that rare, they are just difficult and expensive to extract and process. They also need to be found in clusters dense enough to mine. There are an estimated 2.7 million metric tons of rare earth reserves in the U.S. and more than 15 million metric tons in Canada.
China is home to about 40% of the world's rare earth reserves (44 million metric tons), but more importantly has the technology and refining capacity to handle vast quantities of rare earth elements. That dominance creates security concerns for U.S. officials.
"Anything we can do to reduce the global/U.S. dependency of rare earth elements on China is a big deal," Prakash B. Malla, director of research and development at the Thiele Kaolin Co., told FreightWaves.
Sandersville, Georgia-based Thiele Kaolin is a mining and metals exporter that offers kaolin and silica products. Kaolin and silica can be used in paper, ceramics, plastics, paint manufacturing, food additives, and drugs and vitamins.
"In fact, we will want to have our own sources of these elements in the U.S. It is a national security issue," Malla said. "The lack of this would make us a hostage to China and other countries."
Besides China, other sources of rare earth imports for the U.S. in 2020 included Estonia, 5%, and Japan and Malaysia, at 4% each.
Ironically, the U.S. dominated rare earth mining and production for decades, spanning roughly from the 1940s to the late 1980s. One of the major reasons the U.S. outsourced rare earth processing to China was cost, according to several experts.
"Everything really came to an end in the 1980s, across all commodities, because ultimately China had arrived into the market with material that was obviously significant, vast amounts of material across all spectrums," said Lewis Black, president and CEO of Almonty Industries.
Almonty Industries is a Toronto-based global mining company focused primarily on tungsten mining. The company has mining operations in Spain, Portugal and South Korea.
"Cost was a factor, because obviously, the prices the Chinese offered were much lower in the 1980s than in the U.S. And most [U.S.] rare earth metal mining went out of business," Black said.
Black said another reason the U.S. government outsourced rare earth was that processes used throughout the 1940s to 1980s for getting the metals created harmful wastes.
"There was really no urge or enthusiasm to save the mining operations by the U.S. government because these operations, in terms of how they were operated from the 1940s and onward, there were no rules, they just needed the metals," Black said. "So you had all kinds of environmental issues and pollution of rivers and forests. It was a terrible, terrible time. Politically, there was no will to really save that industry."
Aaron Mintzes, senior policy counsel at environmental group Earthworks, said the U.S. still doesn't have the world's best record "when it comes to the regulation of hard rock mining."
"You can tell because of all the exemptions the mining industry enjoys from what we think of as our bedrock environmental laws that don't apply to hard rock mining," Mintzes said.
Some of the exemptions mining companies use are embedded in laws such as the Clean Water and the Resource Conservation and Recovery acts, the latter of which manages wastes, as well as other federal environmental laws, Mintzes said.
He also said there are organizations that work to create international supply chains in an environmentally and socially responsible manner.
"The Initiative for Responsible Mining Assurance (IRMA) is a third-party independent certification system for industrial scale hard rock mines, and soon for mineral processing and for exploratory mining as well," Mintzes said. "The reason why IRMA is different from other certification systems: Mining companies are on the board, labor people are on the board, indigenous people are on the board and mineral purchasers are on the board directing their suppliers to source more responsibly."
Raquel Dominguez, a policy associate at Earthworks, said instead of relying completely on mining, the U.S. could create a "circular economy" for rare earth metals by recycling batteries and focusing on new extraction techniques from existing waste.
"I think it's pretty obvious that in the long term, it makes a lot more environmental, fiscal, human-rights sense to not rely solely on just digging giant holes in the ground," Dominguez said. "It makes a lot more sense to put what we already have into some kind of recycling streams."
Lynas said its proposed plant in Texas, like the company's other global operations, will be designed to produce "ethical and environmentally-responsible products."
"Like other industrial operations, the process will produce by-products. The by-product material does not exhibit hazardous characteristics and will meet US standards," Lynas said.
Malla said recent investments by the U.S. government in rare earth mining — such as Lynas and Mountain Pass — are steps in the right direction.
"The U.S. needs to develop domestic sources of rare earths. Also, we invest in sustainable technologies for extraction, concentration and separation of rare earths," Malla said.
Once operational, Lynas' Hondo facility is expected to produce approximately 5,000 tons annually of light rare earths products, including 1,250 tons annually of the rare earth metals neodymium and praseodymium, which power some of the strongest types of rare earth magnets.
Lynas said the Hondo facility will serve the company's U.S. customers and "support the U.S. government's moves to strengthen the industrial base."
"U.S. industrial users currently source the vast majority of their materials from China producers. Lynas will provide these users with the option to source from a local producer," the company said. "Security of supply is an essential foundation for the renewal of downstream specialty metal making and permanent magnet manufacturing in the U.S."
Moore said Energy Fuels gets its sand ore from a mine in southern Georgia, which contains both the rare earth element monazite and naturally occurring uranium. The monazite sand ore is mined by Chemours (NYSE: CC), and is processed by Energy Fuels in Utah.
"The monazite has uranium and thorium in it. It has been widely recognized as being a very valuable rare earth mineral, but because it was radioactive, it was all going to China, until we came along," Moore said.
Energy Fuels is sending its shipments of rare earth carbonates to a separation facility owned by Neo Performance Materials Inc. (OTCMKTS: NOPMF) in Sillamäe, Estonia.
Moore said the carbonates Energy Fuels mine and process are not dangerous.
"We work with low-level natural radioactive materials, not highly enriched stuff or anything like that. We started processing this monazite at our White Mesa Mill facility in Utah. We were able to produce a nice, intermediate rare earth product, this carbonate," Moore said.
The sand ore mined in Georgia is sent to Energy Fuels' Utah mill to be processed for monazite and uranium. The shipments are picked up by trucks and taken to Salt Lake City. The container is then put on railcars and shipped to the Port of Norfolk in Virginia. Then it is loaded on an ocean vessel and sent to Estonia for separation. The total travel time is about 40 days.
Like Lynas, Energy Fuels is exploring opening a separation facility in the U.S. to cut down on shipping costs and optimize profits. The company has hired a French consulting group to help Energy Fuels explore how to proceed.
"It makes a lot of sense to perform as many refining steps in one location as possible. That way, you're not shipping material all over the place," Moore said. "We're planning to install as many of these steps as possible at the White Mesa Mill in Utah."
Click for more FreightWaves articles by Noi Mahoney.
More articles by Noi Mahoney
AskWaves: What's it like hauling nuclear weapons across the country?
Mexico facing a growing shortage of truck drivers
President of Panama lauds nations' ties in visit to Port Houston
Image by Free-Photos from Pixabay
See more from Benzinga
© 2021 Benzinga.com. Benzinga does not provide investment advice. All rights reserved.
The market expects Peabody Energy (BTU) to deliver a year-over-year increase in earnings on higher revenues when it reports results for the quarter ended June 2021. This widely-known consensus outlook is important in assessing the company's earnings picture, but a powerful factor that might influence its near-term stock price is how the actual results compare to these estimates.
The earnings report, which is expected to be released on July 29, 2021, might help the stock move higher if these key numbers are better than expectations. On the other hand, if they miss, the stock may move lower.
While the sustainability of the immediate price change and future earnings expectations will mostly depend on management's discussion of business conditions on the earnings call, it's worth handicapping the probability of a positive EPS surprise.
Zacks Consensus Estimate
This coal mining company is expected to post quarterly loss of $0.76 per share in its upcoming report, which represents a year-over-year change of +40.2%.
Revenues are expected to be $691 million, up 10.3% from the year-ago quarter.
Estimate Revisions Trend
The consensus EPS estimate for the quarter has been revised 112.9% higher over the last 30 days to the current level. This is essentially a reflection of how the covering analysts have collectively reassessed their initial estimates over this period.
Investors should keep in mind that the direction of estimate revisions by each of the covering analysts may not always get reflected in the aggregate change.
Price, Consensus and EPS Surprise

Earnings Whisper
Estimate revisions ahead of a company's earnings release offer clues to the business conditions for the period whose results are coming out. Our proprietary surprise prediction model — the Zacks Earnings ESP (Expected Surprise Prediction) — has this insight at its core.
The Zacks Earnings ESP compares the Most Accurate Estimate to the Zacks Consensus Estimate for the quarter; the Most Accurate Estimate is a more recent version of the Zacks Consensus EPS estimate. The idea here is that analysts revising their estimates right before an earnings release have the latest information, which could potentially be more accurate than what they and others contributing to the consensus had predicted earlier.
Thus, a positive or negative Earnings ESP reading theoretically indicates the likely deviation of the actual earnings from the consensus estimate. However, the model's predictive power is significant for positive ESP readings only.
A positive Earnings ESP is a strong predictor of an earnings beat, particularly when combined with a Zacks Rank #1 (Strong Buy), 2 (Buy) or 3 (Hold). Our research shows that stocks with this combination produce a positive surprise nearly 70% of the time, and a solid Zacks Rank actually increases the predictive power of Earnings ESP.
Please note that a negative Earnings ESP reading is not indicative of an earnings miss. Our research shows that it is difficult to predict an earnings beat with any degree of confidence for stocks with negative Earnings ESP readings and/or Zacks Rank of 4 (Sell) or 5 (Strong Sell).
How Have the Numbers Shaped Up for Peabody Energy?
For Peabody Energy, the Most Accurate Estimate is the same as the Zacks Consensus Estimate, suggesting that there are no recent analyst views which differ from what have been considered to derive the consensus estimate. This has resulted in an Earnings ESP of 0%.
On the other hand, the stock currently carries a Zacks Rank of #2.
So, this combination makes it difficult to conclusively predict that Peabody Energy will beat the consensus EPS estimate.
Does Earnings Surprise History Hold Any Clue?
While calculating estimates for a company's future earnings, analysts often consider to what extent it has been able to match past consensus estimates. So, it's worth taking a look at the surprise history for gauging its influence on the upcoming number.
For the last reported quarter, it was expected that Peabody Energy would post a loss of $1.48 per share when it actually produced a loss of $0.82, delivering a surprise of +44.59%.
Over the last four quarters, the company has beaten consensus EPS estimates two times.
Bottom Line
An earnings beat or miss may not be the sole basis for a stock moving higher or lower. Many stocks end up losing ground despite an earnings beat due to other factors that disappoint investors. Similarly, unforeseen catalysts help a number of stocks gain despite an earnings miss.
That said, betting on stocks that are expected to beat earnings expectations does increase the odds of success. This is why it's worth checking a company's Earnings ESP and Zacks Rank ahead of its quarterly release. Make sure to utilize our Earnings ESP Filter to uncover the best stocks to buy or sell before they've reported.
Peabody Energy doesn't appear a compelling earnings-beat candidate. However, investors should pay attention to other factors too for betting on this stock or staying away from it ahead of its earnings release.
Want the latest recommendations from Zacks Investment Research? Today, you can download 7 Best Stocks for the Next 30 Days. Click to get this free report
Peabody Energy Corporation (BTU) : Free Stock Analysis Report
To read this article on Zacks.com click here.
The market expects CNX Resources Corporation. (CNX) to deliver a year-over-year increase in earnings on higher revenues when it reports results for the quarter ended June 2021. This widely-known consensus outlook is important in assessing the company's earnings picture, but a powerful factor that might influence its near-term stock price is how the actual results compare to these estimates.
The earnings report, which is expected to be released on July 29, 2021, might help the stock move higher if these key numbers are better than expectations. On the other hand, if they miss, the stock may move lower.
While the sustainability of the immediate price change and future earnings expectations will mostly depend on management's discussion of business conditions on the earnings call, it's worth handicapping the probability of a positive EPS surprise.
Zacks Consensus Estimate
This company is expected to post quarterly earnings of $0.22 per share in its upcoming report, which represents a year-over-year change of +69.2%.
Revenues are expected to be $384.3 million, up 158.2% from the year-ago quarter.
Estimate Revisions Trend
The consensus EPS estimate for the quarter has been revised 2.89% higher over the last 30 days to the current level. This is essentially a reflection of how the covering analysts have collectively reassessed their initial estimates over this period.
Investors should keep in mind that an aggregate change may not always reflect the direction of estimate revisions by each of the covering analysts.
Price, Consensus and EPS Surprise

Earnings Whisper
Estimate revisions ahead of a company's earnings release offer clues to the business conditions for the period whose results are coming out. Our proprietary surprise prediction model — the Zacks Earnings ESP (Expected Surprise Prediction) — has this insight at its core.
The Zacks Earnings ESP compares the Most Accurate Estimate to the Zacks Consensus Estimate for the quarter; the Most Accurate Estimate is a more recent version of the Zacks Consensus EPS estimate. The idea here is that analysts revising their estimates right before an earnings release have the latest information, which could potentially be more accurate than what they and others contributing to the consensus had predicted earlier.
Thus, a positive or negative Earnings ESP reading theoretically indicates the likely deviation of the actual earnings from the consensus estimate. However, the model's predictive power is significant for positive ESP readings only.
A positive Earnings ESP is a strong predictor of an earnings beat, particularly when combined with a Zacks Rank #1 (Strong Buy), 2 (Buy) or 3 (Hold). Our research shows that stocks with this combination produce a positive surprise nearly 70% of the time, and a solid Zacks Rank actually increases the predictive power of Earnings ESP.
Please note that a negative Earnings ESP reading is not indicative of an earnings miss. Our research shows that it is difficult to predict an earnings beat with any degree of confidence for stocks with negative Earnings ESP readings and/or Zacks Rank of 4 (Sell) or 5 (Strong Sell).
How Have the Numbers Shaped Up for CNX Resources Corporation.
For CNX Resources Corporation.The Most Accurate Estimate is higher than the Zacks Consensus Estimate, suggesting that analysts have recently become bullish on the company's earnings prospects. This has resulted in an Earnings ESP of +10.53%.
On the other hand, the stock currently carries a Zacks Rank of #3.
So, this combination indicates that CNX Resources Corporation. Will most likely beat the consensus EPS estimate.
Does Earnings Surprise History Hold Any Clue?
While calculating estimates for a company's future earnings, analysts often consider to what extent it has been able to match past consensus estimates. So, it's worth taking a look at the surprise history for gauging its influence on the upcoming number.
For the last reported quarter, it was expected that CNX Resources Corporation. Would post earnings of $0.28 per share when it actually produced earnings of $0.36, delivering a surprise of +28.57%.
Over the last four quarters, the company has beaten consensus EPS estimates four times.
Bottom Line
An earnings beat or miss may not be the sole basis for a stock moving higher or lower. Many stocks end up losing ground despite an earnings beat due to other factors that disappoint investors. Similarly, unforeseen catalysts help a number of stocks gain despite an earnings miss.
That said, betting on stocks that are expected to beat earnings expectations does increase the odds of success. This is why it's worth checking a company's Earnings ESP and Zacks Rank ahead of its quarterly release. Make sure to utilize our Earnings ESP Filter to uncover the best stocks to buy or sell before they've reported.
CNX Resources Corporation. Appears a compelling earnings-beat candidate. However, investors should pay attention to other factors too for betting on this stock or staying away from it ahead of its earnings release.
Want the latest recommendations from Zacks Investment Research? Today, you can download 7 Best Stocks for the Next 30 Days. Click to get this free report
CNX Resources Corporation. (CNX) : Free Stock Analysis Report
To read this article on Zacks.com click here.
Report Further Outlines Non-Replicable ESG Accomplishments and Strategy
PITTSBURGH, July 22, 2021 /PRNewswire/ — CNX Resources Corp. (NYSE: CNX) today announced the release of its annual Corporate Responsibility Report. The report details company execution in line with the traditional Global Reporting Initiative (GRI) core option, along with additional disclosure standards established by the Task Force on Climate-related Financial Disclosures (TCFD) and Sustainability Accounting Standards Board (SASB). Included in the report is more information about CNX objectives and initiatives undertaken to meet the company's broader environmental, social, and governance (ESG) philosophy: tangible, impactful, and local.
CNX President and Chief Executive Officer Nick DeIuliis commented, "Many in the energy industry and capital markets continue to speak in the abstract and distant future about ESG, sustainability, resiliency, carbon intensity, and the industrial logic of consolidation. CNX pursues a different path: one that prioritizes the development of our extensive existing asset base over further scale, and that focuses on transparency, measurable outcomes, current and nearer term deliverables, and long-termism defined by growing per-share intrinsic value. Our tangible, impactful, and local ESG approach coupled with our non-replicable asset base results in a net carbon negative footprint today, a truly sustainable business model of a low-cost producer that regularly returns capital to shareholders, and the opportunity to pursue exciting new opportunities for further methane capture and abatement. We believe we are the rare combination of tangible, impactful, and local ESG results coupled with low-risk free cash flow per-share generation that presents the best-in-class option for ESG-focused investors."
The following are key highlights of the report:
Environmental and Safety:
-
CNX is net carbon negative for Scope 1 and 2 emissions – unique in the natural gas upstream and midstream sectors;
-
Annual abatement of venting of over 300,000 metric tons of third-party methane (which equates to approximately 7.5 million metric tons of CO2e emissions);
-
Adoption of the TCFD framework and SASB standards;
-
Employee safety Total Recordable Incident Rate (TRIR) of 0.0 in 2020;
-
Contractor safety TRIR of 0.92 in 2020;
-
Recycled 99.6% of produced water in the company's core operating area in 2020; and
-
Management compensation now tied to company's methane intensity footprint.
Social Responsibility:
-
Median compensation package over $150,000 – top among regional public companies;
-
$30 million invested in local communities over last 10 years;
-
New $30 million philanthropic commitment and establishment of CNX Foundation to drive regional progress;
-
Establishment of mentor academy for young adults in local, underserved communities;
-
No layoffs, paid front line worker bonuses, and no acceptance of government assistance during COVID;
-
Half of CEO direct reports are diverse;
-
In 2021, introduction of a cross-training rotation program for diverse employees, comprehensive review of compensation programs with emphasis on pay equity, and diversity and inclusion training of all employees; and
-
CNX targets 33% diverse employee workforce by 2024 and 40% by 2026.
Governance:
-
First to provide multi-year, transparent financial guidance via our 7-year free cash flow generation plan;
-
CEO pay for performance philosophy with 90% of compensation at-risk;
-
Insider ownership at 2.5% of outstanding shares;
-
Stock retention requirements for executive management;
-
Small, focused board of directors with diversity of skills, professions, and gender; and
-
Full board participation in Environment, Safety, and Corporate Responsibility Committee.
To read the full 2020 Corporate Responsibility Report, please visit: https://responsibility.cnx.com/
About CNX Resources Corporation:
CNX Resources Corporation (NYSE: CNX) is the premier independent natural gas development, production, and midstream company, with operations centered in the major shale formations of the Appalachian basin. Our vertically integrated model includes transmission, storage, gathering systems, and water infrastructure that support energy development from wellhead to end user. With the benefit of a more than 155-year legacy and a substantial asset base amassed over many generations, the company deploys a strategy focused on responsibly developing its resources to create long term per-share value for its shareholders, employees, and the communities where it operates. As of December 31, 2020, CNX had 9.55 trillion cubic feet equivalent of proved natural gas reserves. The company is a member of the Standard & Poor's Midcap 400 Index. Additional information may be found at www.cnx.com.


View original content to download multimedia:https://www.prnewswire.com/news-releases/cnx-releases-2020-corporate-responsibility-report-and-announces-industry-leading-net-carbon-negative-position-301338950.html
SOURCE CNX Resources Corporation
As we already know from media reports and hedge fund investor letters, hedge funds delivered their best returns in a decade. Most investors who decided to stick with hedge funds after a rough 2018 recouped their losses by the end of the fourth quarter of 2019. A significant number of hedge funds continued their strong performance in 2020 and 2021 as well. We get to see hedge funds' thoughts towards the market and individual stocks by aggregating their quarterly portfolio movements and reading their investor letters. In this article, we will particularly take a look at what hedge funds think about Albertsons Companies, Inc. (NYSE:ACI).
Hedge fund interest in Albertsons Companies, Inc. (NYSE:ACI) shares was flat at the end of last quarter. This is usually a negative indicator. Our calculations also showed that ACI isn't among the 30 most popular stocks among hedge funds (click for Q1 rankings). At the end of this article we will also compare ACI to other stocks including Vereit Inc (NYSE:VER), Robert Half International Inc. (NYSE:RHI), and Natera Inc (NASDAQ:NTRA) to get a better sense of its popularity.
In today’s marketplace there are plenty of methods investors employ to value stocks. A couple of the most innovative methods are hedge fund and insider trading moves. We have shown that, historically, those who follow the top picks of the top investment managers can beat the market by a healthy amount (see the details here). Also, our monthly newsletter's portfolio of long stock picks returned 206.8% since March 2017 (through May 2021) and beat the S&P 500 Index by more than 115 percentage points. You can download a sample issue of this newsletter on our website .

Stephen Feinberg of Cerberus Capital Management
At Insider Monkey, we scour multiple sources to uncover the next great investment idea. For example, pet market is growing at a 7% annual rate and is expected to reach $110 billion in 2021. So, we are checking out the 5 best stocks for animal lovers. We go through lists like the 15 best Jim Cramer stocks to identify the next Tesla that will deliver outsized returns. Even though we recommend positions in only a tiny fraction of the companies we analyze, we check out as many stocks as we can. We read hedge fund investor letters and listen to stock pitches at hedge fund conferences. You can subscribe to our free daily newsletter on our homepage. With all of this in mind we're going to check out the recent hedge fund action regarding Albertsons Companies, Inc. (NYSE:ACI).
Do Hedge Funds Think ACI Is A Good Stock To Buy Now?
Heading into the second quarter of 2021, a total of 19 of the hedge funds tracked by Insider Monkey were bullish on this stock, a change of 0% from the previous quarter. By comparison, 0 hedge funds held shares or bullish call options in ACI a year ago. So, let's review which hedge funds were among the top holders of the stock and which hedge funds were making big moves.

Among these funds, Cerberus Capital Management held the most valuable stake in Albertsons Companies, Inc. (NYSE:ACI), which was worth $2750.4 million at the end of the fourth quarter. On the second spot was Brigade Capital which amassed $13.1 million worth of shares. Citadel Investment Group, Verdad Advisers, and Citadel Investment Group were also very fond of the stock, becoming one of the largest hedge fund holders of the company. In terms of the portfolio weights assigned to each position Cerberus Capital Management allocated the biggest weight to Albertsons Companies, Inc. (NYSE:ACI), around 76.09% of its 13F portfolio. Verdad Advisers is also relatively very bullish on the stock, designating 3.38 percent of its 13F equity portfolio to ACI.
Because Albertsons Companies, Inc. (NYSE:ACI) has witnessed declining sentiment from the smart money, we can see that there was a specific group of funds that elected to cut their full holdings heading into Q2. It's worth mentioning that Anand Parekh's Alyeska Investment Group cut the largest investment of the 750 funds monitored by Insider Monkey, totaling about $13.5 million in stock. Daniel S. Och's fund, OZ Management, also dumped its stock, about $3.5 million worth. These transactions are intriguing to say the least, as aggregate hedge fund interest stayed the same (this is a bearish signal in our experience).
Let's now review hedge fund activity in other stocks similar to Albertsons Companies, Inc. (NYSE:ACI). We will take a look at Vereit Inc (NYSE:VER), Robert Half International Inc. (NYSE:RHI), Natera Inc (NASDAQ:NTRA), Churchill Downs Incorporated (NASDAQ:CHDN), Kingsoft Cloud Holdings Limited (NASDAQ:KC), Alleghany Corporation (NYSE:Y), and SEI Investments Company (NASDAQ:SEIC). All of these stocks' market caps are closest to ACI's market cap.
[table] Ticker, No of HFs with positions, Total Value of HF Positions (x1000), Change in HF Position VER,27,664502,4 RHI,27,284866,0 NTRA,41,1222395,-5 CHDN,19,413255,-6 KC,16,92226,-4 Y,34,359891,0 SEIC,27,304623,-6 Average,27.3,477394,-2.4 [/table]
View table here if you experience formatting issues.
As you can see these stocks had an average of 27.3 hedge funds with bullish positions and the average amount invested in these stocks was $477 million. That figure was $2808 million in ACI's case. Natera Inc (NASDAQ:NTRA) is the most popular stock in this table. On the other hand Kingsoft Cloud Holdings Limited (NASDAQ:KC) is the least popular one with only 16 bullish hedge fund positions. Albertsons Companies, Inc. (NYSE:ACI) is not the least popular stock in this group but hedge fund interest is still below average. Our overall hedge fund sentiment score for ACI is 30. Stocks with higher number of hedge fund positions relative to other stocks as well as relative to their historical range receive a higher sentiment score. This is a slightly negative signal and we'd rather spend our time researching stocks that hedge funds are piling on. Our calculations showed that top 5 most popular stocks among hedge funds returned 95.8% in 2019 and 2020, and outperformed the S&P 500 ETF (SPY) by 40 percentage points. These stocks gained 23.8% in 2021 through July 16th and surpassed the market again by 7.7 percentage points. Unfortunately ACI wasn't nearly as popular as these 5 stocks (hedge fund sentiment was quite bearish); ACI investors were disappointed as the stock returned 4.8% since the end of March (through 7/16) and underperformed the market. If you are interested in investing in large cap stocks with huge upside potential, you should check out the top 5 most popular stocks among hedge funds as most of these stocks already outperformed the market in 2021.
Get real-time email alerts: Follow Arch Resources Inc. (NYSE:ARCH)
Suggested Articles:
Disclosure: None. This article was originally published at Insider Monkey.
-
Samples collected 285 metres to the north of the High-Grade Zone include 949 g/t silver.
-
The new zone appears to be an extension of the historically mined area.
-
Drilling to start next week: High-Grade Zone and new extension to be drill tested.
Vancouver, British Columbia–(Newsfile Corp. – July 22, 2021) – Mountain Boy Minerals Ltd (TSXV: MTB) (OTCQB: MBYMF) (FSE: M9U) ("Mountain Boy" or the "Company") announces that drilling is set to commence next week on its flagship American Creek property. Drilling will commence near the historic Mountain Boy mine and include testing a newly mapped area that is interpreted to be an extension of that zone.
The American Creek Project is centered on the past-producing Mountain Boy silver (MB-Ag) mine, located 20 kilometres north of Stewart in BC's Golden Triangle.
Recent work included mapping and sampling along the cliffs north of the old mine, an area that had not previously been examined due to the difficult access. Geologists skilled in rock climbing have now traced the structure hosting the High-Grade Zone approximately 400 metres to the north.
Three samples collected from what is interpreted to be a northward extension of the High-Grade Zone were rushed for assay:
-
Subcrop sample C0034056 assayed 456 grams per tonne silver with 2.2% copper and 0.4% zinc.
-
Bedrock sample C0034057 assayed 949 grams per tonne silver with 2.7% lead and 0.3% copper.
-
Bedrock sample C0034058 assayed 1% copper with 0.25% zinc and 20 grams per tonne silver.
These samples were collected from the cliffs 285 metres to the north of the High-Grade zone at approximately the same elevation (Figure 1; trace of the mineralized horizon). Several other samples from along this newly mapped exposure have been sent to the lab.

Figure 1: Trace of the mineralized horizon
To view an enhanced version of this graphic, please visit:
https://orders.newsfilecorp.com/files/5332/90895_3f89736d84486bfb_001full.jpg
Two new drill pads are now constructed in locations that will effectively test the targets. The first pad, located near the previously outlined High-Grade Zone, will test the concept that the high-grade silver mineralization is partially controlled by high angle east-west striking structures that intersect the prominent shallow dipping south striking structure.
A second pad, 310 metres to the north of the first pad, will test the newly found mineralized zone. The holes will be drilled to intersect both the shallow dipping main structure and the high angle cross structures (Figure 2; plan map of drill pads and surface grab samples).

Figure 2: Plan map of drill pads and surface grab samples
To view an enhanced version of this graphic, please visit:
https://orders.newsfilecorp.com/files/5332/90895_3f89736d84486bfb_002full.jpg.
About Mountain Boy Minerals
Mountain Boy has six active projects spanning 604 square kilometres (60,398 hectares) in the prolific Golden Triangle of northern British Columbia.
-
The flagship American Creek project is centered on the historic Mountain Boy silver mine and is just north of the past producing Red Cliff gold and copper mine (in which the Company holds an interest). The American Creek project is road accessible and 20 km from the deep-water port of Stewart.
-
On the BA property, 178 drill holes have outlined a substantial zone of silver-lead-zinc mineralization located 4 km from the highway. Work this year is aimed at extending that zone.
-
Surprise Creek is interpreted to be hosted by the same prospective stratigraphy as the BA property and hosts multiple occurrences of silver, gold and base metals.
-
On the Theia project, work by Mountain Boy and previous explorers has outlined a silver bearing mineralized trend 500 meters long, highlighted by a 2020 grab sample that returned 39 kg per tonne silver (1,100 ounces per ton).
-
Southmore is located in the midst of some of the largest deposits in the Golden Triangle. It was explored in the 1980s through the early 1990s, and largely overlooked until Mountain Boy consolidated the property and confirmed the presence of multiple occurrences of gold, copper, lead and zinc.
-
The Telegraph project, acquired in May 2021, has a similar geological setting to major gold and copper-gold deposits in the Golden Triangle.
Mountain Boy is funded for the coming field season and plans to advance these projects, including drilling on select project(s).
The technical disclosure in this release has been read and approved by Andrew Wilkins, B.Sc., P.Geo., a qualified person as defined in National Instrument 43-101.
On behalf of the Board of Directors:
Lawrence Roulston
President & CEO
For further information, contact:
Nancy Curry
VP Corporate Development
(604) 220-2971
NEITHER TSX VENTURE EXCHANGE NOR ITS REGULATION SERVICES PROVIDER (AS THAT TERM IS DEFINED IN THE POLICIES OF THE TSX VENTURE EXCHANGE) ACCEPTS RESPONSIBILITY FOR THE ADEQUACY OR ACCURACY OF THIS RELEASE.
This news release may contain certain "forward-looking statements." Forward-looking statements involve known and unknown risks, uncertainties, assumptions and other factors that may cause the actual results, performance or achievements of the Company to be materially different from any future results, performance or achievements expressed or implied by the forward-looking statements. Any forward-looking statement speaks only as of the date of this news release and, except as may be required by applicable securities laws, the Company disclaims any intent or obligation to update any forward-looking statement, whether as a result of new information, future events or results or otherwise.

To view the source version of this press release, please visit https://www.newsfilecorp.com/release/90895.
The big shareholder groups in EROAD Limited (NZSE:ERD) have power over the company. Generally speaking, as a company grows, institutions will increase their ownership. Conversely, insiders often decrease their ownership over time. Companies that have been privatized tend to have low insider ownership.
EROAD is not a large company by global standards. It has a market capitalization of NZ$536m, which means it wouldn't have the attention of many institutional investors. Taking a look at our data on the ownership groups (below), it seems that institutions own shares in the company. Let's delve deeper into each type of owner, to discover more about EROAD.
See our latest analysis for EROAD

What Does The Institutional Ownership Tell Us About EROAD?
Many institutions measure their performance against an index that approximates the local market. So they usually pay more attention to companies that are included in major indices.
As you can see, institutional investors have a fair amount of stake in EROAD. This suggests some credibility amongst professional investors. But we can't rely on that fact alone since institutions make bad investments sometimes, just like everyone does. It is not uncommon to see a big share price drop if two large institutional investors try to sell out of a stock at the same time. So it is worth checking the past earnings trajectory of EROAD, (below). Of course, keep in mind that there are other factors to consider, too.

EROAD is not owned by hedge funds. The company's largest shareholder is NMC Investment Trust, with ownership of 16%. The second and third largest shareholders are Australian Ethical Investment Ltd. and Mitsubishi UFJ Kokusai Asset Management Co., Ltd., with an equal amount of shares to their name at 6.7%.
On further inspection, we found that more than half the company's shares are owned by the top 7 shareholders, suggesting that the interests of the larger shareholders are balanced out to an extent by the smaller ones.
While it makes sense to study institutional ownership data for a company, it also makes sense to study analyst sentiments to know which way the wind is blowing. There is a little analyst coverage of the stock, but not much. So there is room for it to gain more coverage.
Insider Ownership Of EROAD
The definition of an insider can differ slightly between different countries, but members of the board of directors always count. Company management run the business, but the CEO will answer to the board, even if he or she is a member of it.
Most consider insider ownership a positive because it can indicate the board is well aligned with other shareholders. However, on some occasions too much power is concentrated within this group.
We can see that insiders own shares in EROAD Limited. In their own names, insiders own NZ$26m worth of stock in the NZ$536m company. This shows at least some alignment. You can click here to see if those insiders have been buying or selling.
General Public Ownership
The general public holds a 38% stake in EROAD. While this size of ownership may not be enough to sway a policy decision in their favour, they can still make a collective impact on company policies.
Private Company Ownership
Our data indicates that Private Companies hold 18%, of the company's shares. It might be worth looking deeper into this. If related parties, such as insiders, have an interest in one of these private companies, that should be disclosed in the annual report. Private companies may also have a strategic interest in the company.
Next Steps:
It's always worth thinking about the different groups who own shares in a company. But to understand EROAD better, we need to consider many other factors. Be aware that EROAD is showing 2 warning signs in our investment analysis , you should know about…
If you are like me, you may want to think about whether this company will grow or shrink. Luckily, you can check this free report showing analyst forecasts for its future.
NB: Figures in this article are calculated using data from the last twelve months, which refer to the 12-month period ending on the last date of the month the financial statement is dated. This may not be consistent with full year annual report figures.
This article by Simply Wall St is general in nature. It does not constitute a recommendation to buy or sell any stock, and does not take account of your objectives, or your financial situation. We aim to bring you long-term focused analysis driven by fundamental data. Note that our analysis may not factor in the latest price-sensitive company announcements or qualitative material. Simply Wall St has no position in any stocks mentioned.
Have feedback on this article? Concerned about the content? Get in touch with us directly. Alternatively, email editorial-team (at) simplywallst.com.
FCX earnings call for the period ending July 30, 2021.
(Bloomberg) — A hard turn to the left in South American politics may come with a silver lining for mining companies in the form of higher prices, according to Freeport-McMoRan Inc. Chief Executive Officer Richard Adkerson.
Policy uncertainty in Peru and Chile, which account for about 40% of global copper production, is supportive of future prices as producers balk on pulling the trigger on investments, he told analysts on a call Thursday. The shifting political winds are part of the challenges that mining companies face in meeting growing demand as the world transitions away from fossil fuels.
Adkerson, a 74-year-old mining veteran, plans to work with the industry in Peru to engage with the incoming government of Pedro Castillo, who has vowed to take a bigger share of the mineral windfall to fight poverty. In Chile, Freeport is holding off on a major expansion as the country debates tax hikes, drafts a new constitution and heads into a presidential election at a time when voters are pushing to address lingering inequalities.
“We really don’t know what the outcome is, bottom line,” Adkerson said. “This is going to be supportive of future copper prices.”
Copper hit a record earlier this year as economies emerged from Covid lockdowns at a time of disrupted supplies and an acceleration of a clean-energy shift that will require much more of the metal used in wiring. The prospect of surging demand comes after years of exploration and development cutbacks when prices were low and as the supply side grapples with rising social and environmental expectations and falling ore quality.
Still, Adkerson offered some hope that the industry will be able to avoid drastic policy changes in Peru, pointing to stability agreements and examples of other candidates moderating their approaches once in office.
On a seperate call Thursday, Newmont Corp. CEO Tom Palmer said the company expects to make a decision by December on a proposed investment at the Yanacocha mine in Peru. Newmont would likely start engaging with the new cabinet over the next six months, and is optimistic of being well received, he said.
More stories like this are available on bloomberg.com
Subscribe now to stay ahead with the most trusted business news source.
©2021 Bloomberg L.P.
Freeport-McMoRan Inc. FCX recorded net income (attributable to common stock) of $1.08 billion or 73 cents per share in second-quarter 2021 compared with the year-ago quarter’s $53 million or 3 cents per share.
Barring one-time items, adjusted earnings per share came in at 77 cents compared with the prior-year quarter’s 3 cents. The figure also surpassed the Zacks Consensus Estimate of 73 cents.
Revenues surged 88.2% year over year to $5,748 million. The top-line figure, however, missed the Zacks Consensus Estimate of $5,852 million. The mining giant benefited from higher realized prices in the reported quarter.
FreeportMcMoRan Inc. Price, Consensus and EPS Surprise

FreeportMcMoRan Inc. price-consensus-eps-surprise-chart | FreeportMcMoRan Inc. Quote
Operational Update
Copper production climbed 19% year over year to 913 million pounds in the second quarter.
Consolidated sales from copper mines increased 22.4% year over year to 929 million pounds. The company sold 305,000 ounces of gold and 22 million pounds of molybdenum during the reported quarter.
Consolidated average unit net cash costs per pound of copper were $1.48 compared with the year-ago quarter’s $1.47 per pound.
Average realized price for copper was $4.34 per pound, up 70.2% year over year. Average realized price per ounce for gold increased 2.6% year over year to $1,794. Average realized price per pound for molybdenum was $13.11, up 24.5% year over year.
Financial Position
Cash and cash equivalents at the end of second quarter were $6,313 million compared with the year-earlier quarter’s $1,465 million. The company’s total debt was $9,695 million compared with the prior-year quarter’s $9,914 million.
Cash generated from operating activities came in at $3,470 million during the six-month period ended Jun 30, 2021 compared with the year-ago period’s $453 million.
Outlook
For 2021, Freeport anticipates consolidated sales volumes to be 3.85 billion pounds of copper.
The company expects gold sales volumes of 1.3 million ounces for 2021. It also estimates sales of 86 million pounds of molybdenum for this year.
For the third quarter, Freeport projects sales volumes to be 1.035 billion pounds of copper, 360,000 ounces of gold and 21 million pounds of molybdenum.
Price Performance
Freeport’s shares have rallied 161.2% in the past year compared with 89.7% rise of the industry.

Image Source: Zacks Investment Research
Zacks Rank & Key Picks
Freeport currently carries a Zacks Rank #3 (Hold).
Better-ranked stocks in the basic materials space include Commercial Metals Company CMC, Nucor Corporation NUE and Cabot Corporation CBT, each flaunting a Zacks Rank #1 (Strong Buy), at present. You can see the complete list of today’s Zacks #1 Rank stocks here.
Commercial Metals has a projected earnings growth rate of 21.9% for fiscal 2021. The company’s shares have rallied around 51.9% in a year’s time.
Nucor has a projected earnings growth rate of 259.9% for the current year. The company’s shares have soared around 130% over the past year.
Cabot has an expected earnings growth rate of around 126% for the current fiscal year. The company’s shares have surged 60% in the past year.
Want the latest recommendations from Zacks Investment Research? Today, you can download 7 Best Stocks for the Next 30 Days. Click to get this free report
FreeportMcMoRan Inc. (FCX) : Free Stock Analysis Report
Nucor Corporation (NUE) : Free Stock Analysis Report
Commercial Metals Company (CMC) : Free Stock Analysis Report
Cabot Corporation (CBT) : Free Stock Analysis Report
To read this article on Zacks.com click here.
Thursday, July 22, 2021
The Zacks Research Daily presents the best research output of our analyst team. Today's Research Daily features new research reports on 16 major stocks, including BHP Group (BHP), Booking Holdings (BKNG), and CVS Health (CVS). These research reports have been hand-picked from the roughly 70 reports published by our analyst team today.
You can see all of today’s research reports here >>>
Q2 Earnings Season Scorecard
Including all of this morning's releases, we now have Q2 results from 103 S&P 500 members or 20.% of the index's total membership. Total earnings for these 103 index members are up +117.6% on +18.9% higher revenues, with 90.3% beating EPS estimates and a record 85.4% beating revenue estimates.
This is a notably improved performance from these 103 index members relative to what we have seen from the same group of companies in other recent periods, with the revenue outperformance notably standing out. Looking at Q2 as a whole, combining the actual results that have come out with estimates for the still to come companies, total S&P 500 earnings are currently expected to be up +72.7% on +19.8% higher revenues. For a detailed look at the Q2 earnings season and expectations for the coming periods, please check out our weekly Earnings Trends report >>>> All Around Earnings Strength
Today's Featured Research Reports
Shares of BHP have outperformed the Zacks Mining – Miscellaneous industry over the past year (+49.4% vs. +33.6%). The Zacks analyst believes that the company will continue to benefit from the rally in iron ore prices aided by strong demand in China. Improved industrial activity has led to a rally in copper prices, which is a positive for the company.
BHP’s efforts to make operations more efficient through the employment of smart technology will lead to a reduction in costs, thereby boosting margins. During fiscal 2021, the company achieved first production at four major development projects. It is currently involved in two major petroleum and potash projects, both of which are under development.
(You can read the full research report on BHP here >>>)
Booking Holdings shares have gained +7.9% over the last six months against the Zacks Internet Commerce industry’s loss of -21.4%. The Zacks analyst believes that steadily improving bookings, on the back of the re-opening of economy, have been benefiting the company.
The company remains optimistic about its highly variable cost structure and strong liquidity position, which it expects will help in navigating through the current crisis. Disruptions in the travel industry due to the pandemic and sluggishness in the agency business are major headwinds for the company.
(You can read the full research report on Booking Holdings here >>>)
Shares of CVS Health have gained +21.9% in the year to date period against the Zacks Retail Pharmacies and Drug Stores industry’s gain of +21.2%. The Zacks analyst is encouraged by the increasing demand for PBM and specialty pharmacy along with significant growth observed in the retail business.
The company’s consumer-centric digital strategy has become more relevant in the current environment as people are using technology more while staying indoors. A weak cough, cold and flu season, however, impacted growth within both Pharmacy Services and Retail/LTC in the first quarter. The repealing of the HIF for 2021 also hampered growth for Health Care Benefits unit.
(You can read the full research report on CVS Health here >>>)
Other noteworthy reports we are featuring today include Infosys (INFY), Chipotle Mexican Grill (CMG) and Exelon (EXC).
Sheraz Mian
Director of Research
Note: Sheraz Mian heads the Zacks Equity Research department and is a well-regarded expert of aggregate earnings. He is frequently quoted in the print and electronic media and publishes the weekly Earnings Trends and Earnings Preview reports. If you want an email notification each time Sheraz publishes a new article, please click here>>>
Want the latest recommendations from Zacks Investment Research? Today, you can download 7 Best Stocks for the Next 30 Days. Click to get this free report
Exelon Corporation (EXC) : Free Stock Analysis Report
Infosys Limited (INFY) : Free Stock Analysis Report
BHP Group Limited Sponsored ADR (BHP) : Free Stock Analysis Report
Chipotle Mexican Grill, Inc. (CMG) : Free Stock Analysis Report
CVS Health Corporation (CVS) : Free Stock Analysis Report
Booking Holdings Inc. (BKNG) : Free Stock Analysis Report
To read this article on Zacks.com click here.
Zacks Investment Research
VANCOUVER, BC / ACCESSWIRE / July 22, 2021 / Infinite Ore Corp. (the "Company") (TSXV:ILI)(OTCQB:ARXRF) is pleased to announce it has identified several new targets of interest from a high resolution geophysical survey on the Jackpot lithium property. The survey, conducted by Novatem Airborne Geophysics, identified several east-west trending structural features oriented parallel to several lithium-rich pegmatite dykes within the Jackpot lithium deposit itself. The Company will mobilize a ground crew to site as soon as possible to investigate these structures with overburden stripping and rock and channel sampling.
J.C. St-Amour, President of Infinite Ore commented, "The resolution of this survey is of better quality than we have previously seen on the property. Therefore, we were able to immediately identify multiple areas of interest for boots on the ground follow up this summer. These lithium bearing dykes tend to come in swarms and bear a strong resemblance to the Jackpot lithium deposit, which we know is mineralized. I am very excited to get the crew in the field to explore these targets. The goal is to identify and properly explore multiple lithium-bearing-granitic dykes to build a sizeable lithium resource on the property. The lithium market remains very robust, and the Jackpot lithium property is well located, as we are surrounded by other explorers which have made significant lithium discoveries. This property is our focus and we are keen to discover its full potential."
The Company's 100% owned Jackpot project is located in close proximity to the Georgia Lake lithium deposit, for which Rock Tech Lithium Inc. recently announced its intent to develop a lithium sulphate production facility in Thunder Bay, Ontario. The Jackpot property contains known pegmatite showings, including two that contain historical resources of 2 million tons at 1.09% Li2O and 750,000 tons at 1.38% Li2O*.
Figure 1: Geophysical map of the Jackpot project.

Qualified Person
The technical content of this news release was approved by Michel Boily, PhD, P.Geo, an Independent Qualified Person as defined by the National Instrument 43-101.
*The estimates presented above are treated as historic information and have not been verified or relied upon for economic evaluation by the Company. These historical mineral resources do not refer to any category of sections 1.2 and 1.3 of the NI-43-101 Instrument such as mineral resources or mineral reserves as stated in the 2010 CIM Definition Standards on Mineral Resources and Mineral Reserves. The explanation lies in the inability by the Company to verify the data acquired by the various historical drilling campaigns. The Company as not done sufficient work yet to classify the historical estimates as current mineral resources or mineral reserves.
About Infinite Ore Corp.
Infinite Ore is a junior mining exploration company focused on seeking and acquiring world-class mineral projects. The Company is focused on its Jackpot lithium project located near Nipigon in Northern Ontario. The company has entered into an LOI to sell its interest in its gold and VMS land package in the Confederation Lake assemblage belt near Red Lake, Ont.
ON BEHALF OF THE BOARD
"J.C. St-Amour"
J.C. St-Amour, President
FOR FURTHER INFORMATION, PLEASE CONTACT:
Telephone: 1-604-683-3995
Toll Free: 1-888-945-4770
Neither the TSX Venture Exchange nor its Regulation Services Provider (as that term is defined in the policies of the TSX Venture Exchange) accepts responsibility for the adequacy or accuracy of this release.
FORWARD LOOKING STATEMENTS: This news release contains forward-looking statements, which relate to future events or future performance and reflect management's current expectations and assumptions. Such forward-looking statements reflect management's current beliefs and are based on assumptions made by and information currently available to the Company. Investors are cautioned that these forward-looking statements are neither promises nor guarantees and are subject to risks and uncertainties that may cause future results to differ materially from those expected. These forward -looking statements are made as of the date hereof and, except as required under applicable securities legislation, the Company does not assume any obligation to update or revise them to reflect new events or circumstances. All the forward-looking statements made in this press release are qualified by these cautionary statements and by those made in our filings with SEDAR in Canada (available at WWW.SEDAR.COM).
SOURCE: Infinite Ore Corp.
View source version on accesswire.com:
https://www.accesswire.com/656600/Infinite-Ore-Identifies-Potential-New-Lithium-Exploration-Targets-From-Geophysics-at-Jackpot-Lithium-Project
For beginners, it can seem like a good idea (and an exciting prospect) to buy a company that tells a good story to investors, even if it completely lacks a track record of revenue and profit. But the reality is that when a company loses money each year, for long enough, its investors will usually take their share of those losses.
So if you're like me, you might be more interested in profitable, growing companies, like Red River Resources (ASX:RVR). Now, I'm not saying that the stock is necessarily undervalued today; but I can't shake an appreciation for the profitability of the business itself. In comparison, loss making companies act like a sponge for capital – but unlike such a sponge they do not always produce something when squeezed.
See our latest analysis for Red River Resources
How Fast Is Red River Resources Growing?
As one of my mentors once told me, share price follows earnings per share (EPS). Therefore, there are plenty of investors who like to buy shares in companies that are growing EPS. Impressively, Red River Resources has grown EPS by 24% per year, compound, in the last three years. If the company can sustain that sort of growth, we'd expect shareholders to come away winners.
Careful consideration of revenue growth and earnings before interest and taxation (EBIT) margins can help inform a view on the sustainability of the recent profit growth. Red River Resources shareholders can take confidence from the fact that EBIT margins are up from 2.3% to 11%, and revenue is growing. That's great to see, on both counts.
You can take a look at the company's revenue and earnings growth trend, in the chart below. Click on the chart to see the exact numbers.

Red River Resources isn't a huge company, given its market capitalization of AU$109m. That makes it extra important to check on its balance sheet strength.
Are Red River Resources Insiders Aligned With All Shareholders?
Like the kids in the streets standing up for their beliefs, insider share purchases give me reason to believe in a brighter future. This view is based on the possibility that stock purchases signal bullishness on behalf of the buyer. However, small purchases are not always indicative of conviction, and insiders don't always get it right.
We haven't seen any insiders selling Red River Resources shares, in the last year. With that in mind, it's heartening that Timothy Stephen Hanlon, the Independent Non-Executive Director of the company, paid AU$35k for shares at around AU$0.24 each.
Should You Add Red River Resources To Your Watchlist?
You can't deny that Red River Resources has grown its earnings per share at a very impressive rate. That's attractive. Not only is that growth rate rather juicy, but the insider buying makes my mouth water. So on this analysis I believe Red River Resources is probably worth spending some time on. However, before you get too excited we've discovered 1 warning sign for Red River Resources that you should be aware of.
The good news is that Red River Resources is not the only growth stock with insider buying. Here's a list of them… with insider buying in the last three months!
Please note the insider transactions discussed in this article refer to reportable transactions in the relevant jurisdiction.
This article by Simply Wall St is general in nature. It does not constitute a recommendation to buy or sell any stock, and does not take account of your objectives, or your financial situation. We aim to bring you long-term focused analysis driven by fundamental data. Note that our analysis may not factor in the latest price-sensitive company announcements or qualitative material. Simply Wall St has no position in any stocks mentioned.
Have feedback on this article? Concerned about the content? Get in touch with us directly. Alternatively, email editorial-team (at) simplywallst.com.
Vancouver, British Columbia–(Newsfile Corp. – July 22, 2021) – Great Atlantic Resources (TSXV: GR) (FSE: PH02) has completed the second hole of its 2021 diamond drill program at its Golden Promise Gold property in Central Newfoundland, with visible gold evident in two quartz veins. The 100% owned Golden Promise Property is 1 of the company's 8 properties, which cover an area of 25,700 hectares, located within the central Newfoundland gold belt. This is a resumption of Phase 2 diamond drilling at the gold bearing Jaclyn Zone, located within the northern region of the Golden Promise Property, which hosts five gold bearing quartz veins systems, being the Jaclyn Main, Jaclyn North, Jaclyn South, Jaclyn East and Jaclyn West Zones.
For more information, please view the InvestmentPitch Media "video" which provides additional information about this news and the company. If this link is not enabled, please visit www.InvestmentPitch.com and enter "Great Atlantic" in the search box.
Cannot view this video? Visit:
http://www.investmentpitch.com/video/1_90veehyw/Great-Atlantic-completes-2nd-drill-hole-intersecting-2-veins-containing-visible-gold
The current Phase 2 drilling will include up to 33 drill holes, totalling approximately 5,000 metres, at the gold bearing Jaclyn Zone with holes planned at the Jaclyn Main Zone and Jaclyn North Zone.
Drill hole GP-21-150, a definition hole, was drilled to a length of 111 metres, within the west region of the Jaclyn Main Zone between 2019 drill holes 138 and 143B, both of which had intersected high grade gold mineralization. Multiple quartz veins were intersected in GP-21-150. Visible gold is evident in a 0.30-meter long (core length) quartz vein intersected between 30.18 and 30.48 metres.
Drill core from GP-21-150 is currently being geologically logged and sampled at the company's secure facility in central Newfoundland prior to being submitted to a certified laboratory for gold assay and multi-element analysis.
Drilling is underway on the third hole GP-21-151, which also a definition hole in the western part of the Jaclyn Main Zone.
The objective of these holes and subsequent holes is to further define the zone and provide information for an updated resource estimate. Most of these holes are planned within the central to west region of the zone, testing above 200 metres vertical depth, with two holes planned in the east part of the Jaclyn Main Zone to test the zone at 200 to 350 metres vertical depth.
Great Atlantic confirmed high-grade gold at the Jaclyn Main Zone during 2019 drilling, including near surface intercepts of 113.07 g/t gold over 0.55 metres and 61.35 g/t gold over 2.04 metres, and 15.8 g/t gold over 2.70 metres, plus an interval of multiple gold bearing veins in one drill hole averaging 2.30 grams per tonne gold over 25.25 metres. The planned drilling at the Jaclyn North Zone will further test the area east of historic drill holes including the area of an approximate 300-metre long zone of gold-bearing quartz vein boulders.
Three drill holes completed by the company during 2020 in this area intersected gold bearing quartz veins and extended the Jaclyn North quartz vein system approximately 260 metres east of historic drilling. The company collected gold bearing quartz boulder samples in this area during 2017, including samples returning 163, 208 and 332 g/t tonne and again in 2020 including samples returning 17.4, 26.7 and 157.6 grams per tonne gold.
The company reported a NI 43-101 compliant inferred resource estimate during late 2018 for the Jaclyn Main Zone of 357,500 tonnes at 10.4 grams per tonne gold for 119,000 ounces uncapped.
The Golden Promise Property is located within a region of recent significant gold discoveries. The property is located within the Exploits Subzone of the Newfoundland Dunnage Zone. Within the Exploits Subzone, the property lies along the north-northwestern fringe of the Victoria Lake Supergroup, a volcano-sedimentary terrane. Recent significant gold discoveries within the Exploits Subzone include those of Marathon Gold Corp. at the Valentine Gold Project, Sokoman Minerals Corp. at the Moosehead Gold Project and New Found Gold Corp. at the Queensway Project.
Viewers are warned that mineralization at the Valentine Gold Project, the Moosehead Gold Project, the Queensway Project, and elsewhere within the Exploits Subzone is not necessarily indicative of mineralization on the company's Golden Promise Property.
Great Atlantic, with a number of properties in the Atlantic provinces, is utilizing a Project Generation model, with a special focus on critical elements which are prominent in Atlantic Canada, such as Antimony, Tungsten and Gold.
For more information, please visit the company's website www.GreatAtlanticResources.com, contact Christopher R. Anderson, President & CEO, at 604-488-3900 or email office@GreatAtlanticResources.com. For Investor Relations contact Andrew Job at 416-628-1560 or IR@GreatAtlanticResources.com.
About InvestmentPitch Media
InvestmentPitch Media leverages the power of video, which together with its extensive distribution, positions a company's story ahead of the 1,000's of companies seeking awareness and funding from the financial community. The company specializes in producing short videos based on significant news releases, research reports and other content of interest to investors.
CONTACT:
InvestmentPitch Media
Barry Morgan, CFO
bmorgan@investmentpitch.com

To view the source version of this press release, please visit https://www.newsfilecorp.com/release/90957
CRANBROOK, BC / ACCESSWIRE / July 22, 2021 / Eagle Plains Resources Ltd. (TSXV:EPL) and Canter Capital Corp. (a private B corporation) have executed a formal agreement whereby Canter holds the exclusive right to earn a 60% interest in EPL's 100%-owned Schott's Lake copper-zinc project by completing $5,000,000 in exploration expenditures, making $500,000 in cash payments and issuing 1,000,000 common shares to Eagle Plains over a four year period. A 2% NSR is reserved for Eagle Plains, which may be reduced to 1% upon payment by Canter of $1M. The claims cover an area of 2,160ha located in northeastern Saskatchewan, 40 km northwest of Flin Flon, Manitoba. Access to the property is gained via winter road and/or float plane.
Eagle Plains has recently completed a ground-based electromagnetic survey over 6.5 line-kms, covering known mineralization and surveying areas interpreted to have high potential. 3-D modelling of existing drill hole data is now underway. The objective of the 2021program is to identify possible down-plunge extensions of the existing deposit and search for similar mineralization elsewhere in the property.
See Schott's Lake property details here.
Schott's Lake Geology and History
The Schott's Lake property hosts metamorphic and intrusive rocks which are dominantly volcanic in origin and associated with an island arc environment. The rocks are folded into an easterly-dipping synform. Mineralization was first discovered in 1953 by Kay Lake Mines. A total of 79 drill holes have been completed for a total of 9516m (31,200') and a historical resource of 1,983,850 tonnes grading 0.61% copper and 1.35% zinc (Aur Resources, 2003-SDMI 0320). Notably, the historical resource did not include precious metal enrichment and/or cobalt. Eagle Plains' management considers these estimates to be historical in nature and cautions that a Qualified Person has not done sufficient work to classify the historical estimates as current mineral resources or mineral reserves in accordance with National Instrument 43-101. These estimates do not comply with current definitions prescribed by National Instrument 43-101 or the Canadian Institute of Mining and are disclosed only as indications of the presence of mineralization and are considered to be a guide for additional work. The historical models and data sets used to prepare these historical estimates are not available to Eagle Plains, nor are any more recent resource estimates or drill information on the Property.
Mineralization at Schott's Lake consists of semi-massive to massive pyrrhotite and pyrite with associated chalcopyrite (copper) and sphalerite (zinc) mineralization. The Schott's Lake deposit is interpreted to be a typical exhalative massive sulphide zone. The mineralized zone has an average thickness of 20.4m, is overturned and lies on the eastern limb of a major north-easterly plunging fold. The deepest mineralized intercept is at a vertical depth of 266 meters with mineralization open to depth.
The following table outlines significant historical drill intercepts:
Table 1- Significant Drill Intercepts-Schotts Lake Project*
|
Hole |
Width |
From |
To |
Cu |
Zn |
|
1 |
16.7 |
unknown |
Unknown |
1.1 |
1.83 |
|
4 |
0.76 |
unknown |
Unknown |
4.3 |
3.3 |
|
13 |
5.8 |
30.4 |
36.2 |
2.5 |
0.17 |
|
35 |
1.7 |
256.8 |
258.5 |
2.07 |
0.01 |
|
65 |
15.8 |
82.3 |
98.1 |
0.38 |
1.84 |
|
66 |
7.6 |
71.6 |
79.2 |
0.96 |
5.48 |
|
67 |
3.0 |
49.1 |
52.1 |
1.71 |
3.48 |
|
68 |
17.9 |
133.8 |
151.7 |
0.85 |
1.53 |
|
69 |
18.3 |
128.2 |
146.5 |
0.53 |
1.09 |
|
70 |
22.7 |
149.7 |
172.4 |
0.54 |
1.96 |
|
75 |
27.4 |
183.5 |
210.9 |
0.35 |
2.25 |
* intercepts in the above table refer to actual drilled thickness in meters and may not represent the true thickness of the intercept
Charles C. Downie, P.Geo., a "qualified person" for the purposes of National Instrument 43-101 – Standards of Disclosure for Mineral Projects, has prepared, reviewed, and approved the scientific and technical disclosure in the news release.
About Eagle Plains Resources
Based in Cranbrook, B.C., Eagle Plains continues to conduct research, acquire and explore mineral projects throughout western Canada. The Company is committed to steadily enhancing shareholder value by advancing our diverse portfolio of projects toward discovery through collaborative partnerships and development of a highly experienced technical team. Eagle Plains also holds significant royalty interests in western Canadian projects covering a broad spectrum of commodities. Management's focus is to advance its most promising exploration projects. In addition, Eagle Plains continues to seek out and secure high-quality, unencumbered projects through research, staking and strategic acquisitions. Throughout the exploration process, our mission is to help maintain prosperous communities by exploring for and discovering resource opportunities while building lasting relationships through honest and respectful business practices.
Expenditures from 2011-2020 on Eagle Plains-related projects exceed $22M, the majority of which was funded by third-party partners. This exploration work resulted in approximately 37,000 m of diamond-drilling and extensive ground-based exploration work facilitating the advancement of numerous projects at various stages of development.
On behalf of the Board of Directors
"Tim J. Termuende"
President and CEO
For further information on EPL, please contact Mike Labach at 1 866 HUNT ORE (486 8673)
Email: mgl@eagleplains.com or visit our website at http://www.eagleplains.com
Cautionary Note Regarding Forward-Looking Statements
Neither the TSX Venture Exchange nor its Regulation Services Provider (as that term is defined in the policies of the TSX Venture Exchange) accepts responsibility for the adequacy or accuracy of this release. This news release may contain forward-looking statements including but not limited to comments regarding the timing and content of upcoming work programs, geological interpretations, receipt of property titles, potential mineral recovery processes, etc. Forward-looking statements address future events and conditions and therefore, involve inherent risks and uncertainties. Actual results may differ materially from those currently anticipated in such statements.
SOURCE: Eagle Plains Resources Ltd.
View source version on accesswire.com:
https://www.accesswire.com/656743/Eagle-Plains-Executes-Option-Agreement-with-Canter-on-Schotts-Lake-Copper-Project-Saskatchewan
Lithium Americas shows rising price performance, earning an upgrade to its IBD Relative Strength Rating from 70 to 82.
LOS ANGELES, July 22, 2021–(BUSINESS WIRE)–Glancy Prongay & Murray LLP ("GPM"), a national investor rights law firm, continues its investigation on behalf of Piedmont Lithium Inc. ("Piedmont" or the "Company") (NASDAQ: PLL) investors concerning the Company and its officers’ possible violations of the federal securities laws.
If you suffered a loss on your Piedmont investments or would like to inquire about potentially pursuing claims to recover your loss under the federal securities laws, you can submit your contact information at https://www.glancylaw.com/cases/piedmont-lithium-inc/. You can also contact Charles H. Linehan, of GPM at 310-201-9150, Toll-Free at 888-773-9224, or via email at shareholders@glancylaw.com to learn more about your rights.
On July 20, 2021, Reuters reported that Piedmont "has not applied for a state mining permit or a necessary zoning variance in Gaston County, just west of Charlotte, despite telling investors since 2018 that it was on the verge of doing so." According to the article, a majority of the board of commissioners said, "they may block or delay the project because Piedmont has not told them what levels of dust, noise and vibrations will occur, nor how water and air quality would be affected."
On this news, the Company’s stock price fell $12.56, or nearly 20%, to close at $50.52 per share on July 20, 2021, thereby injuring investors.
Follow us for updates on LinkedIn, Twitter, or Facebook.
Whistleblower Notice: Persons with non-public information regarding Piedmont should consider their options to aid the investigation or take advantage of the SEC Whistleblower Program. Under the program, whistleblowers who provide original information may receive rewards totaling up to 30 percent of any successful recovery made by the SEC. For more information, call Charles H. Linehan at 310-201-9150 or 888-773-9224 or email shareholders@glancylaw.com.
About GPM
Glancy Prongay & Murray LLP is a premier law firm representing investors and consumers in securities litigation and other complex class action litigation. ISS Securities Class Action Services has consistently ranked GPM in its annual SCAS Top 50 Report. In 2018, GPM was ranked a top five law firm in number of securities class action settlements, and a top six law firm for total dollar size of settlements. With four offices across the country, GPM’s nearly 40 attorneys have won groundbreaking rulings and recovered billions of dollars for investors and consumers in securities, antitrust, consumer, and employment class actions. GPM’s lawyers have handled cases covering a wide spectrum of corporate misconduct including cases involving financial restatements, internal control weaknesses, earnings management, fraudulent earnings guidance and forward looking statements, auditor misconduct, insider trading, violations of FDA regulations, actions resulting in FDA and DOJ investigations, and many other forms of corporate misconduct. GPM’s attorneys have worked on securities cases relating to nearly all industries and sectors in the financial markets, including, energy, consumer discretionary, consumer staples, real estate and REITs, financial, insurance, information technology, health care, biotech, cryptocurrency, medical devices, and many more. GPM’s past successes have been widely covered by leading news and industry publications such as The Wall Street Journal, The Financial Times, Bloomberg Businessweek, Reuters, the Associated Press, Barron’s, Investor’s Business Daily, Forbes, and Money.
This press release may be considered Attorney Advertising in some jurisdictions under the applicable law and ethical rules.
View source version on businesswire.com: https://www.businesswire.com/news/home/20210722005868/en/
Contacts
Glancy Prongay & Murray LLP, Los Angeles
Charles H. Linehan, 310-201-9150 or 888-773-9224
1925 Century Park East, Suite 2100
Los Angeles, CA 90067
www.glancylaw.com
shareholders@glancylaw.com
BENSALEM, Pa., July 22, 2021–(BUSINESS WIRE)–Law Offices of Howard G. Smith continues its investigation on behalf of Piedmont Lithium Inc. ("Piedmont" or the "Company") (NASDAQ: PLL) investors concerning the Company and its officers’ possible violations of federal securities laws.
On July 20, 2021, Reuters reported that Piedmont "has not applied for a state mining permit or a necessary zoning variance in Gaston County, just west of Charlotte, despite telling investors since 2018 that it was on the verge of doing so." According to the article, a majority of the board of commissioners said, "they may block or delay the project because Piedmont has not told them what levels of dust, noise and vibrations will occur, nor how water and air quality would be affected."
On this news, the Company’s stock price fell $12.56, or nearly 20%, to close at $50.52 per share on July 20, 2021, thereby injuring investors.
If you purchased Piedmont securities, have information or would like to learn more about these claims, or have any questions concerning this announcement or your rights or interests with respect to these matters, please contact Howard G. Smith, Esquire, of Law Offices of Howard G. Smith, 3070 Bristol Pike, Suite 112, Bensalem, Pennsylvania 19020 by telephone at (215) 638-4847, toll-free at (888) 638-4847, or by email to howardsmith@howardsmithlaw.com, or visit our website at www.howardsmithlaw.com.
This press release may be considered Attorney Advertising in some jurisdictions under the applicable law and ethical rules.
View source version on businesswire.com: https://www.businesswire.com/news/home/20210722005867/en/
Contacts
Law Offices of Howard G. Smith
Howard G. Smith, Esquire
215-638-4847
888-638-4847
howardsmith@howardsmithlaw.com
www.howardsmithlaw.com
SAN FRANCISCO, CA / ACCESSWIRE / July 22, 2021 / Hagens Berman urges Piedmont Lithium Inc. (NASDAQ:PLL) investors with significant losses to submit your losses now. The firm is investigating possible securities law violations at Piedmont Lithium and certain investors may have valuable claims.
Visit:www.hbsslaw.com/investor-fraud/PLL
Contact An Attorney Now:PLL@hbsslaw.com
844-916-0895
Piedmont Lithium Inc. (PLL) Investigation:
The investigation focuses on Piedmont Lithium's public disclosures concerning its plan to build a large lithium mine in Gaston County, North Carolina.
In past years, Piedmont Lithium has repeatedly assured investors it would be imminently applying for permits and zoning variances to build the mine. The Company further assured investors it was "not aware" of any reason why Gaston County would not approve zoning changes.
Recently, in late September 2020, Piedmont Lithium announced it signed a deal to supply lithium ore sourced from its deposits in North Carolina to electric auto maker Tesla, reportedly conditional upon both companies to start deliveries between July 2022 and July 2023. This news sent the price of the company's American Depositary Shares up over 200% on Sept. 28, 2020.
However, Piedmont Lithium's ability to perform on the Tesla deal came into question on July 20, 2021, when Reuters reported that Piedmont Lithium had not even applied for the necessary mining permit or zoning variances. According to the article, five of the seven members of the Gaston County's board of commissioners, who control zoning changes, say they may block or delay the project because Piedmont has not told them what levels of dust, noise and vibrations will occur, nor how water and air quality would be affected.
This news sent the price of Piedmont ADSs crashing lower on July 20, 2021.
"We're focused on investors' losses and whether Piedmont concealed known building permit and zoning risks posed by the Gaston County mine," said Reed Kathrein, the Hagens Berman partner leading the investigation.
If you invested in Piedmont Lithium and have significant losses, or have knowledge that may assist the firm's investigation, click here to discuss your legal rights with Hagens Berman.
Whistleblowers: Persons with non-public information regarding Piedmont Lithium should consider their options to help in the investigation or take advantage of the SEC Whistleblower program. Under the new program, whistleblowers who provide original information may receive rewards totaling up to 30 percent of any successful recovery made by the SEC. For more information, call Reed Kathrein at 844-916-0895 or email PLL@hbsslaw.com.
Hagens Berman is a national law firm with eight offices in eight cities around the country and over eighty attorneys. The firm represents investors, whistleblowers, workers and consumers in complex litigation. More about the firm and its successes is located at hbsslaw.com. For the latest news visit our newsroom or follow us on Twitter at @classactionlaw.
CONTACT:
Reed Kathrein, 844-916-0895
SOURCE: Hagens Berman Sobol Shapiro LLP
View source version on accesswire.com:
https://www.accesswire.com/656563/PLL-INVESTOR-ALERT-Hagens-Berman-Encourages-Piedmont-Lithium-NASDAQPLL-Investors-to-Contact-Firms-Attorneys-Now-Firm-Investigating-Possible-Securities-Law-Violations
The market expects Great Western Bancorp (GWB) to deliver a year-over-year increase in earnings on higher revenues when it reports results for the quarter ended June 2021. This widely-known consensus outlook is important in assessing the company's earnings picture, but a powerful factor that might influence its near-term stock price is how the actual results compare to these estimates.
The earnings report, which is expected to be released on July 29, 2021, might help the stock move higher if these key numbers are better than expectations. On the other hand, if they miss, the stock may move lower.
While management's discussion of business conditions on the earnings call will mostly determine the sustainability of the immediate price change and future earnings expectations, it's worth having a handicapping insight into the odds of a positive EPS surprise.
Zacks Consensus Estimate
This holding company for Great Western Bank is expected to post quarterly earnings of $0.76 per share in its upcoming report, which represents a year-over-year change of +660%.
Revenues are expected to be $118.46 million, up 25.3% from the year-ago quarter.
Estimate Revisions Trend
The consensus EPS estimate for the quarter has been revised 0.45% lower over the last 30 days to the current level. This is essentially a reflection of how the covering analysts have collectively reassessed their initial estimates over this period.
Investors should keep in mind that an aggregate change may not always reflect the direction of estimate revisions by each of the covering analysts.
Price, Consensus and EPS Surprise

Earnings Whisper
Estimate revisions ahead of a company's earnings release offer clues to the business conditions for the period whose results are coming out. This insight is at the core of our proprietary surprise prediction model — the Zacks Earnings ESP (Expected Surprise Prediction).
The Zacks Earnings ESP compares the Most Accurate Estimate to the Zacks Consensus Estimate for the quarter; the Most Accurate Estimate is a more recent version of the Zacks Consensus EPS estimate. The idea here is that analysts revising their estimates right before an earnings release have the latest information, which could potentially be more accurate than what they and others contributing to the consensus had predicted earlier.
Thus, a positive or negative Earnings ESP reading theoretically indicates the likely deviation of the actual earnings from the consensus estimate. However, the model's predictive power is significant for positive ESP readings only.
A positive Earnings ESP is a strong predictor of an earnings beat, particularly when combined with a Zacks Rank #1 (Strong Buy), 2 (Buy) or 3 (Hold). Our research shows that stocks with this combination produce a positive surprise nearly 70% of the time, and a solid Zacks Rank actually increases the predictive power of Earnings ESP.
Please note that a negative Earnings ESP reading is not indicative of an earnings miss. Our research shows that it is difficult to predict an earnings beat with any degree of confidence for stocks with negative Earnings ESP readings and/or Zacks Rank of 4 (Sell) or 5 (Strong Sell).
How Have the Numbers Shaped Up for Great Western Bancorp?
For Great Western Bancorp, the Most Accurate Estimate is the same as the Zacks Consensus Estimate, suggesting that there are no recent analyst views which differ from what have been considered to derive the consensus estimate. This has resulted in an Earnings ESP of 0%.
On the other hand, the stock currently carries a Zacks Rank of #3.
So, this combination makes it difficult to conclusively predict that Great Western Bancorp will beat the consensus EPS estimate.
Does Earnings Surprise History Hold Any Clue?
Analysts often consider to what extent a company has been able to match consensus estimates in the past while calculating their estimates for its future earnings. So, it's worth taking a look at the surprise history for gauging its influence on the upcoming number.
For the last reported quarter, it was expected that Great Western Bancorp would post earnings of $0.61 per share when it actually produced earnings of $0.93, delivering a surprise of +52.46%.
Over the last four quarters, the company has beaten consensus EPS estimates two times.
Bottom Line
An earnings beat or miss may not be the sole basis for a stock moving higher or lower. Many stocks end up losing ground despite an earnings beat due to other factors that disappoint investors. Similarly, unforeseen catalysts help a number of stocks gain despite an earnings miss.
That said, betting on stocks that are expected to beat earnings expectations does increase the odds of success. This is why it's worth checking a company's Earnings ESP and Zacks Rank ahead of its quarterly release. Make sure to utilize our Earnings ESP Filter to uncover the best stocks to buy or sell before they've reported.
Great Western Bancorp doesn't appear a compelling earnings-beat candidate. However, investors should pay attention to other factors too for betting on this stock or staying away from it ahead of its earnings release.
Want the latest recommendations from Zacks Investment Research? Today, you can download 7 Best Stocks for the Next 30 Days. Click to get this free report
Great Western Bancorp, Inc. (GWB) : Free Stock Analysis Report
To read this article on Zacks.com click here.
OVERLAND PARK, Kan., July 22, 2021–(BUSINESS WIRE)–Compass Minerals (NYSE: CMP), a leading global provider of essential minerals, will release its second-quarter 2021 financial results Wednesday, Aug. 4, 2021 after the markets close. The company’s president and CEO, Kevin Crutchfield, and CFO, Jamie Standen, will discuss these results on a conference call on Thursday, Aug. 5, at 10 a.m. ET.
Access to the conference call will be available at investors.compassminerals.com or by dialing 1-833-921-1662. Callers must provide the conference ID number 5772368. Outside of the U.S. and Canada, callers may dial 1-236-389-2662. An audio replay of the conference call will be available on the company’s website.
About Compass Minerals
Compass Minerals (NYSE: CMP) is a leading global provider of essential minerals focused on safely delivering where and when it matters to help solve nature’s challenges for customers and communities. Its salt products help keep roadways safe during winter weather and are used in numerous other consumer, industrial and agricultural applications. And its plant nutrition business manufactures products that improve the quality and yield of crops, while supporting sustainable agriculture. Additionally, its specialty chemical business serves the water treatment industry and other industrial processes. The company operates 16 production and packaging facilities with more than 2,000 employees throughout the U.S., Canada, Brazil and the U.K. Visit compassminerals.com for more information about the company and its products.
View source version on businesswire.com: https://www.businesswire.com/news/home/20210722006003/en/
Contacts
Media Contact Rick AxthelmSVP and Chief Public Affairs Officer+1.913.344.9198MediaRelations@compassminerals.com
Investor Contact Douglas KrisSenior Director of Investor Relations+1.917.797.4967InvestorRelations@compassminerals.com
Lynas Rare Earths' (ASX:LYC) stock is up by a considerable 17% over the past month. We wonder if and what role the company's financials play in that price change as a company's long-term fundamentals usually dictate market outcomes. Particularly, we will be paying attention to Lynas Rare Earths' ROE today.
Return on equity or ROE is a key measure used to assess how efficiently a company's management is utilizing the company's capital. In short, ROE shows the profit each dollar generates with respect to its shareholder investments.
View our latest analysis for Lynas Rare Earths
How To Calculate Return On Equity?
Return on equity can be calculated by using the formula:
Return on Equity = Net Profit (from continuing operations) ÷ Shareholders' Equity
So, based on the above formula, the ROE for Lynas Rare Earths is:
1.8% = AU$17m ÷ AU$964m (Based on the trailing twelve months to December 2020).
The 'return' is the profit over the last twelve months. One way to conceptualize this is that for each A$1 of shareholders' capital it has, the company made A$0.02 in profit.
What Is The Relationship Between ROE And Earnings Growth?
So far, we've learned that ROE is a measure of a company's profitability. Depending on how much of these profits the company reinvests or "retains", and how effectively it does so, we are then able to assess a company’s earnings growth potential. Assuming all else is equal, companies that have both a higher return on equity and higher profit retention are usually the ones that have a higher growth rate when compared to companies that don't have the same features.
A Side By Side comparison of Lynas Rare Earths' Earnings Growth And 1.8% ROE
As you can see, Lynas Rare Earths' ROE looks pretty weak. Even compared to the average industry ROE of 15%, the company's ROE is quite dismal. In spite of this, Lynas Rare Earths was able to grow its net income considerably, at a rate of 53% in the last five years. We reckon that there could be other factors at play here. Such as – high earnings retention or an efficient management in place.
We then compared Lynas Rare Earths' net income growth with the industry and we're pleased to see that the company's growth figure is higher when compared with the industry which has a growth rate of 29% in the same period.

Earnings growth is a huge factor in stock valuation. What investors need to determine next is if the expected earnings growth, or the lack of it, is already built into the share price. By doing so, they will have an idea if the stock is headed into clear blue waters or if swampy waters await. One good indicator of expected earnings growth is the P/E ratio which determines the price the market is willing to pay for a stock based on its earnings prospects. So, you may want to check if Lynas Rare Earths is trading on a high P/E or a low P/E, relative to its industry.
Is Lynas Rare Earths Making Efficient Use Of Its Profits?
Summary
In total, it does look like Lynas Rare Earths has some positive aspects to its business. Even in spite of the low rate of return, the company has posted impressive earnings growth as a result of reinvesting heavily into its business. The latest industry analyst forecasts show that the company is expected to maintain its current growth rate. Are these analysts expectations based on the broad expectations for the industry, or on the company's fundamentals? Click here to be taken to our analyst's forecasts page for the company.
This article by Simply Wall St is general in nature. It does not constitute a recommendation to buy or sell any stock, and does not take account of your objectives, or your financial situation. We aim to bring you long-term focused analysis driven by fundamental data. Note that our analysis may not factor in the latest price-sensitive company announcements or qualitative material. Simply Wall St has no position in any stocks mentioned.
Have feedback on this article? Concerned about the content? Get in touch with us directly. Alternatively, email editorial-team (at) simplywallst.com.
If you would like to receive our free newsletter via email, simply enter your email address below & click subscribe.
 Follow us on Twitter
 Become our facebook fan
CONNECT WITH US
Tweets
Tweet with hash tag #miningfeeds or @miningfeeds and your tweets will be displayed across this site.
MOST ACTIVE MINING STOCKS
Daily Gainers
 CMC Metals Ltd. CMC Metals Ltd. |
CMB.V | +900.00% |
 Eden Energy Ltd Eden Energy Ltd |
EDE.AX | +200.00% |
| GoviEx Uranium Inc. |
GXU.V | +42.86% |
| Eagle Nickel Ltd. |
ENL.AX | +41.67% |
| Citigold Corp. Limited |
CTO.AX | +33.33% |
| Mount Burgess Mining NL |
MTB.AX | +33.33% |
| Exalt Resources Limited |
ERD.AX | +31.94% |
| Casa Minerals Inc. |
CASA.V | +30.00% |
| Cariboo Rose Resources Ltd |
CRB.V | +28.57% |
| Belmont Resources Inc. |
BEA.V | +28.57% |


