* BHP to supply Tesla from Nickel West operation
* Nickel West to start sulphate output in Sept quarter
* BHP, Tesla to work on energy storage solutions (Adds share price move, detail)
MELBOURNE July 22 (Reuters) – Global miner BHP Group said on Thursday it signed a nickel supply agreement with Tesla Inc and will work with the electric carmaker on lowering carbon emissions in the battery supply chain.
Tesla said in June it expects to spend more than $1 billion a year on battery raw materials from Australia given the country's reliable mining industry and responsible production practices.
Western automakers are also seeking to diversify supply chains to lessen their dependence on China, in line with a U.S. policy to rely on allies to supply metals for electric vehicles.
BHP's nickel division accounts for less than 1% of its earnings, which are dominated by iron ore. Shares in the miner were up 3% at A$51.37 by 0454 GMT.
BHP said the metal will be supplied from its Nickel West operation in Western Australia, which is set to add nickel sulphate – a key battery chemical, and one that has much higher margins than nickel metal – in the September quarter.
Nickel makes batteries energy-dense, allowing cars to run further on a single charge.
BHP and Tesla will also look at end-to-end raw material tracing using blockchain, and work on energy storage solutions, the miner said in a statement.
"Tesla is going to take up available nickel from well-established producers with strong operational credentials as much as it can," said Steven Brown, an independent consultant based in Australia.
"These are logical moves for Tesla at this point of time when there's not a lot of other opportunities."
Nickel West's carbon footprint is around half the size of even the newest producers in top supplier Indonesia, which use an energy-intensive technology to extract nickel from laterite ores, he said. Its waste disposal practices are also seen to be lower risk.
BHP in February signed a deal to secure up to half of its power needs for its Kwinana nickel refinery from a local solar farm, although the rest is powered by the state grid, which uses coal power.
Indonesian producers have said they will initially dispose of their waste on land but there are questions about where their waste will go in the long term, and whether that might mean discharging them into the sea, Brown added.
Indonesia currently accounts for about 30% of nickel supply, according to the International Nickel Study Group (INSG), but Brown expects that to reach 50% by 2025.
Australia was the world's fifth biggest producer of mined nickel last year, according to INSG figures, accounting for about 7% of global supply.
BHP has committed to cutting carbon emissions by 30% by 2030 from 2020 levels with a long-term target of net zero operational emissions by 2050. It is working with customers to lower emissions from the steel-making industry that is among the worlds' heaviest polluters. (Reporting by Melanie Burton and Nikhil Kurian Nainan in Bengaluru; Editing by Subhranshu Sahu and Richard Pullin)
NEW YORK, NY / ACCESSWIRE / July 21, 2021 / Bronstein, Gewirtz & Grossman, LLC is investigating potential claims on behalf of purchasers of Piedmont Lithium Inc. ("Piedmont" or the "Company") (NASDAQ:PLL). Investors who purchased Piedmont shares are encouraged to obtain additional information and assist the investigation by visiting the firm's site: www.bgandg.com/pll.

The investigation concerns whether Piedmont and certain of its officers and/or directors have violated federal securities laws.
In 2020, Piedmont signed a deal to supply Tesla Inc. with lithium sourced from its deposits in North Carolina. Then, on July 20, 2021, Reuters reported that Piedmont "has not applied for a state mining permit or a necessary zoning variance in Gaston County, just west of Charlotte, despite telling investors since 2018 that it was on the verge of doing so." Reuters further reported that "[f]ive of the seven members of the county's board of commissioners, who control zoning changes, say they may block or delay the project because Piedmont has not told them what levels of dust, noise and vibrations will occur, nor how water and air quality would be affected." On this news, Piedmont's stock price fell $12.56 per share, or 19.91%, to close at $50.52 per share on July 20, 2021.
If you are aware of any facts relating to this investigation, or purchased Piedmont shares, you can assist this investigation by visiting the firm's site: www.bgandg.com/pll. You can also contact Peretz Bronstein or his Investor Relations Analyst, Yael Hurwitz of Bronstein, Gewirtz & Grossman, LLC: 212-697-6484.
Bronstein, Gewirtz & Grossman, LLC is a corporate litigation boutique. Our primary expertise is the aggressive pursuit of litigation claims on behalf of our clients. In addition to representing institutions and other investor plaintiffs in class action security litigation, the firm's expertise includes general corporate and commercial litigation, as well as securities arbitration. Attorney advertising. Prior results do not guarantee similar outcomes.
CONTACT:
Bronstein, Gewirtz & Grossman, LLC
Peretz Bronstein or Yael Hurwitz
212-697-6484 | info@bgandg.com
SOURCE: Bronstein, Gewirtz and Grossman, LLC
View source version on accesswire.com:
https://www.accesswire.com/656538/Bronstein-Gewirtz-Grossman-LLC-Notifies-Shareholders-of-Piedmont-Lithium-Inc-PLL-Investigation
Investors are always looking for stocks that are poised to beat at earnings season and Freeport-McMoRan Inc. FCX may be one such company. The firm has earnings coming up pretty soon, and events are shaping up quite nicely for their report.
That is because for Freeport is seeing favorable earnings estimate revision activity as of late, which is generally a precursor to an earnings beat. After all, analysts raising estimates right before earnings — with the most up-to-date information possible — is a pretty good indicator of some favorable trends underneath the surface for FCX in this report.
In fact, the Most Accurate Estimate for the current quarter is currently at 74 cents per share for FCX, compared to a broader Zacks Consensus Estimate of 73 cents per share. This suggests that analysts have very recently bumped up their estimates for FCX, giving the stock a Zacks Earnings ESP of +0.82% heading into earnings season.
FreeportMcMoRan Inc. Price and EPS Surprise

FreeportMcMoRan Inc. price-eps-surprise | FreeportMcMoRan Inc. Quote
Why is this Important?
A positive reading for the Zacks Earnings ESP has proven to be very powerful in producing both positive surprises, and outperforming the market. Our recent 10-year backtest shows that stocks that have a positive Earnings ESP and a Zacks Rank #3 (Hold) or better show a positive surprise nearly 70% of the time, and have returned over 28% on average in annual returns (see more Top Earnings ESP stocks here).
Given that FCX has a Zacks Rank #2 (Buy) and an ESP in positive territory, investors might want to consider this stock ahead of earnings. You can see the complete list of today’s Zacks #1 Rank (Strong Buy) stocks here.
Clearly, recent earnings estimate revisions suggest that good things are ahead for Freeport, and that a beat might be in the cards for the upcoming report.
Want the latest recommendations from Zacks Investment Research? Today, you can download 7 Best Stocks for the Next 30 Days. Click to get this free report
FreeportMcMoRan Inc. (FCX) : Free Stock Analysis Report
To read this article on Zacks.com click here.
Investors are always looking for stocks that are poised to beat at earnings season and Teck Resources Limited TECK may be one such company. The firm has earnings coming up pretty soon, and events are shaping up quite nicely for their report.
That is because Teck is seeing favorable earnings estimate revision activity as of late, which is generally a precursor to an earnings beat. After all, analysts raising estimates right before earnings — with the most up-to-date information possible — is a pretty good indicator of some favorable trends underneath the surface for TECK in this report.
In fact, the Most Accurate Estimate for the current quarter is currently at 54 cents per share for TECK, compared to a broader Zacks Consensus Estimate of 50 cents per share. This suggests that analysts have very recently bumped up their estimates for TECK, giving the stock a Zacks Earnings ESP of +8.15% heading into earnings season.
Teck Resources Limited Price and EPS Surprise

Teck Resources Limited price-eps-surprise | Teck Resources Limited Quote
Why is this Important?
A positive reading for the Zacks Earnings ESP has proven to be very powerful in producing both positive surprises, and outperforming the market. Our recent 10-year backtest shows that stocks that have a positive Earnings ESP and a Zacks Rank #3 (Hold) or better show a positive surprise nearly 70% of the time, and have returned over 28% on average in annual returns (see more Top Earnings ESP stocks here).
Given that TECK has a Zacks Rank #3 and an ESP in positive territory, investors might want to consider this stock ahead of earnings. You can see the complete list of today’s Zacks #1 Rank (Strong Buy) stocks here.
Clearly, recent earnings estimate revisions suggest that good things are ahead for Teck, and that a beat might be in the cards for the upcoming report.
Want the latest recommendations from Zacks Investment Research? Today, you can download 7 Best Stocks for the Next 30 Days. Click to get this free report
Teck Resources Ltd (TECK) : Free Stock Analysis Report
To read this article on Zacks.com click here.
Pit D, A28 Unit, Q1-4 Kimberlite, Naujaat

July 17, 2021: Sample Pit D with white ‘Mega-bags’ filled with the A28 Unit of the Q1-4 kimberlite, Naujaat Diamond Project, Nunavut. The rock will be processed for diamonds later this year once shipped south by sealift in September. The Q1-4 kimberlite is known for its yellow and orangey yellow diamonds.
VANCOUVER, British Columbia, July 21, 2021 (GLOBE NEWSWIRE) — North Arrow Minerals Inc. (TSXV-NAR) (“North Arrow”) reports that the $5.6 million bulk sampling program at its Naujaat Diamond Project, Nunavut is over 50% complete.
Ken Armstrong, President and CEO of North Arrow commented: “Bulk sample collection from the Q1-4 kimberlite at the Naujaat Project is progressing on schedule with field crews having so far delivered over 1,000 tonnes of kimberlite to our laydown near the community of Naujaat. We had targeted a total sample size of between 1,500 to 2,000 tonnes and we now expect to reach the high end of that range. The program has benefited greatly from the prepositioning of sampling supplies in 2020 and our ability to work directly from Naujaat, including the support of 25 local employees.”
The program is on track for completion by the end of August, when the sample will be shipped south in September via annual sealift. Sample processing and diamond recovery is expected to start in the fourth quarter of calendar 2021. Diamonds recovered from the sample are intended to confirm the size distribution and character of an important population of potentially high-value, fancy yellow to orange yellow diamonds found in the Q1-4 deposit.
The program is funded by partner Burgundy Diamond Mines (ASX-BDM), as part of a June 1, 2020 option agreement under which Burgundy may earn a 40% interest in the Naujaat Project by funding the current bulk sample program.
About the Naujaat Project
The Naujaat Project is located near the community of Naujaat, Nunavut. A total of eight kimberlite pipes have been identified within the Project as well as several laterally extensive kimberlite dyke systems. The Q1-4 kimberlite, located just 7 km from the Company’s laydown near the community, is the largest and most diamondiferous of the kimberlites discovered to date and hosts an important, potentially high-value, population of Type IaA – Ib fancy coloured, yellow to orange yellow, diamonds. At 12.5 ha in surface area, Q1-4 hosts an estimated inferred mineral resource of 26.1 million carats total diamond content in 48.8 million tonnes of kimberlite with average +1 DTC total diamond content of 53.6 carats per hundred tonnes (cpht) extending from surface to a depth of 205m. Delineation drilling of Q1-4 suggests significant potential to expand the resource at depth with the deepest drill hole terminating in kimberlite at a depth of 376m. The reader is cautioned that mineral resources are not mineral reserves and do not have demonstrated economic viability. Details on data verification and resource estimation procedures can be found in the May 2013 technical report filed on www.sedar.com as well as posted on North Arrow’s website along with details on subsequent exploration efforts on the Project [here].
The Naujaat Diamond Project exploration program is being conducted under the direction of Kenneth Armstrong, P.Geo. (NWT/NU and ON), President and CEO of North Arrow and a Qualified Person under NI 43-101. Mr. Armstrong has reviewed and approved the technical contents of this press release.
About North Arrow Minerals
North Arrow is a Canadian based exploration company focused on the identification and evaluation of diamond exploration opportunities in Canada. North Arrow’s management, board of directors and advisors have significant successful experience in the global diamond industry. North Arrow’s most advanced diamond project is the Q1-4 diamond deposit at the Naujaat Project (NU), where a $5.6M 2,000 tonne bulk sample is underway. The Company has also discovered and is evaluating kimberlite fields at the Mel (NU) and Pikoo (SK) Projects and is evaluating and exploring for additional kimberlites at the Loki and LDG JV Projects (NWT). The Company also maintains a 100% interest in the Hope Bay Oro Gold Project (NU), located approximately 3 km north of Agnico Eagle’s Doris Gold Mine.
North Arrow Minerals Inc.
/s/ “Kenneth A. Armstrong”
Kenneth Armstrong
President and CEO
For further information, please contact:
Ken Armstrong
Tel: 604-668-8355 or 604-668-8354
Website: www.northarrowminerals.com
Neither the TSX Venture Exchange nor its Regulation Services Provider accepts responsibility
for the adequacy or accuracy of this release.
This news release contains "forward-looking statements" including but not limited to statements with respect to North Arrow’s plans, the estimation of a mineral resource and the success of exploration activities. Forward-looking statements, while based on management's best estimates and assumptions, are subject to risks and uncertainties that may cause actual results to be materially different from those expressed or implied by such forward-looking statements, including but not limited to: risks related to the successful integration of acquisitions; risks related to general economic and market conditions; closing of financing; the timing and content of upcoming work programs; actual results of proposed exploration activities; possible variations in mineral resources or grade; failure of plant, equipment or processes to operate as anticipated; accidents, labour disputes, title disputes, claims and limitations on insurance coverage and other risks of the mining industry; changes in national and local government regulation of mining operations, tax rules and regulations. Although North Arrow has attempted to identify important factors that could cause actual results to differ materially from those contained in forward-looking statements, there may be other factors that cause results not to be as anticipated, estimated or intended. There can be no assurance that such statements will prove to be accurate, as actual results and future events could differ materially from those anticipated in such statements. Accordingly, readers should not place undue reliance on forward-looking statements. North Arrow undertakes no obligation or responsibility to update forward-looking statements, except as required by law.
A photo accompanying this announcement is available at https://www.globenewswire.com/NewsRoom/AttachmentNg/3f99b05a-2958-487a-948a-e4cd9e68b51e
/NOT FOR DISTRIBUTION TO THE UNITED STATES/
TSX Venture Exchange: BSK
Frankfurt Stock Exchange: MAL2
OTCQB Venture Market (OTC): BKUCF
VANCOUVER, BC, July 21, 2021 /CNW/ – Blue Sky Uranium Corp. (TSXV: BSK) (FSE: MAL2) (OTC: BKUCF), ("Blue Sky" or the "Company") is pleased to announce it has closed the 1st tranche of the non-brokered private placement (the "Private Placement") through the issuance of 8,713,750 units at a subscription price of $0.16 per unit for aggregate gross proceeds to the Company of $1,394,200. The Company announced the private placement on July 12, 2021.

Each unit consists of one common share and one transferrable common share purchase warrant (the "Units"). Each warrant will entitle the holder thereof to purchase one additional common share in the capital of the Company at $0.25 per share for two (2) years from the date of issue.
Finder's fees of $35,420 are payable in cash on a portion of the private placement to parties at arm's length to the Company. In addition, 221,375 non-transferable finder's warrants are being issued (the "Finder's Warrants"). Each Finder's Warrant entitles a finder to purchase one common share at a price of $0.25 per share for two (2) years from the date of issue, expiring on July 21, 2023.
Certain insiders of the Company have participated in the Private Placement for $7,200 in Units. Such participation represents a related-party transaction under Multilateral Instrument 61-101 – Protection of Minority Security Holders in Special Transactions ("MI 61-101"), but the transaction is exempt from the formal valuation and minority shareholder approval requirements of MI 61-101 as neither the fair market value of the subject matter of the transaction, nor the consideration paid, exceed 25% of the Company's market capitalization.
The proceeds of the financing will be used for exploration programs on the Company's projects in Argentina and for general working capital.
This financing is subject to regulatory approval and all securities to be issued pursuant to the financing are subject to a four-month hold period expiring on November 21, 2021.
About Blue Sky Uranium Corp.
Blue Sky Uranium Corp. is a leader in uranium discovery in Argentina. The Company's objective is to deliver exceptional returns to shareholders by rapidly advancing a portfolio of surficial uranium deposits into low-cost producers, while respecting the environment, the communities, and the cultures in all the areas in which we work. Blue Sky has the exclusive right to properties in two provinces in Argentina. The Company's flagship Amarillo Grande Project was an in-house discovery of a new district that has the potential to be both a leading domestic supplier of uranium to the growing Argentine market and a new international market supplier. The Company is a member of the Grosso Group, a resource management group that has pioneered exploration in Argentina since 1993.
ON BEHALF OF THE BOARD
"Nikolaos Cacos"
_____________________________________
Nikolaos Cacos, President, CEO and Director
Neither TSX Venture Exchange nor its Regulation Services Provider (as that term is defined in policies of the TSX Venture Exchange) accepts responsibility for the adequacy or accuracy of this release.
The securities being offered have not been, nor will they be registered under the United States Securities Act of 1933, as amended, or state securities laws and may not be offered or sold within the United States or to, or for the account or benefit of, U.S. persons absent U.S. federal and state registration or an applicable exemption from the U.S. registration requirements. This release does not constitute an offer for sale of securities in the United States.
SOURCE Blue Sky Uranium Corp.

View original content to download multimedia: http://www.newswire.ca/en/releases/archive/July2021/21/c5577.html
Calgary, Alberta–(Newsfile Corp. – July 21, 2021) – New Stratus Energy Inc. (TSXV: NSE) ("New Stratus" or the "Corporation") is pleased to announce that it has closed the first tranche of the previously announced brokered private placement led by Canaccord Genuity Corp. (the "Lead Agent"), as lead agent and sole bookrunner, on behalf of a syndicate of agents comprised of Echelon Wealth Partners Inc. and Paradigm Capital Inc. (together with the Lead Agent, the "Agents"). Upon closing of the first tranche, the Corporation issued 29,464,374 units ("Units") of the Corporation at a price of $0.30 per Unit, for gross proceeds of $8.84 million (the "Offering"). Each Unit is comprised of one common share of the Corporation (a "Common Share") and one-half of one Common Share purchase warrant (a "Warrant"). Each whole Warrant is exercisable for one Common Share at an exercise price of $0.45 for a period of 24 months from July 21, 2021. The Corporation expects to close a second and final tranche of the brokered private placement on or about July 29, 2021.
As consideration for services rendered in connection with the Offering, the Corporation paid to the Agents a commission in the amount equal to 8% of the gross proceeds of the Offering.
The Corporation intends to use the net proceeds from the Offering for development and exploration activities on its Colombian block, VMM-18, the evaluation of other opportunities in its core assessment areas of Colombia, Ecuador, Peru and Venezuela, and general corporate purposes.
In accordance with applicable Canadian securities laws, all securities issued pursuant to the Offering will be subject to a four (4) month hold period ending November 22, 2021. The Offering remains subject to final approval from the TSX Venture Exchange.
The securities being offered have not been, nor will they be, registered under the United States Securities Act of 1933, as amended, and may not be offered or sold in the United States or to, or for the account or benefit of, U.S. persons absent registration or an applicable exemption from the registration requirements. This press release shall not constitute an offer to sell or the solicitation of an offer to buy nor shall there be any sale of the securities in any State in which such offer, solicitation or sale would be unlawful.
Contact Information:
Jose Francisco Arata
Chief Executive Officer
jfarata@newstratus.energy
Wade Felesky
President
wfelesky@newstratus.energy
Mario Miranda
Chief Financial Officer
mmiranda@newstratus.energy
Forward-Looking Information
Certain information set forth in this press release constitutes "forward-looking statements" and "forward-looking information" under applicable securities laws. All information other than statements of historical fact are forward-looking statements. Some of the forward-looking statements may be identified by words such as "expects", "anticipates", "believes", "intends", "projects", "plans", and similar expressions. This press release includes certain forward-looking statements concerning the Offering, including the expected closing date for the second tranche, and the use of the net proceeds, as well as management's objectives, strategies, beliefs and intentions. These statements are not guarantees of future performance. Such forward-looking statements necessarily involve known and unknown risks and uncertainties, including, for example, the risks inherent in oil and gas exploration and production activities, volatility in commodity prices, changes in political conditions, competitive risks and the availability of financing. Such risks and uncertainties may cause the Corporation's actual performance and financial results in future periods to differ materially from any projections of future performance or results expressed or implied by such forward-looking statements. There can be no assurance that forward-looking statements will prove to be accurate, as actual results and future events could differ materially from those anticipated in such statements. The Corporation undertakes no obligation to update forward-looking statements if circumstances or management's estimates or opinions should change except as required by applicable securities laws. The reader is cautioned not to place undue reliance on forward-looking statements.
Neither the TSX Venture Exchange nor its Regulation Services Provider (as that term is defined in the policies of the TSX Venture Exchange) accepts responsibility for the adequacy or accuracy of this release.
NOT FOR DISTRIBUTION TO UNITED STATES NEWSWIRE SERVICES OR FOR DISSEMINATION IN THE
UNITED STATES

To view the source version of this press release, please visit https://www.newsfilecorp.com/release/90878
TORONTO, July 21, 2021 /CNW/ – Laurion Mineral Exploration Inc. (TSXV: LME) (OTCPINK: LMEFF) ("LAURION" or the "Corporation") announces that LAURION's management has been in communication with the Northern Development, Mines, Natural Resources and Forestry (MNRF), and received notification that as of July 21, 2021, MNRF issued an industry-wide Emergency Area Order, that mineral exploration activities such as diamond drilling, stripping and trenching, channel sampling, use of metal tracked equipment and rubber-tired equipment, surveys using a generator and road or trail building covering restricted fire zones over specified areas, are prohibited in order to protect public safety and facilitate effective fire suppression.
LAURION reports that its drilling program at the Ishkoday Property has thus been paused due to a very active fire season across Northern Ontario with high temperatures, dry conditions and frequent thunderstorms contributing to multiple large forest fires, and thus temporarily rendering the field environment unsafe for drilling on the Ishkoday Property. LAURION will monitor the situation closely and will safely resume its full exploration and drilling activities immediately after the Emergency Area Order is lifted.
The Ishkoday Property is located 28 km north-east of the town of Beardmore and 220 km north-east of Thunder Bay, Ontario.
The LAURION exploration team has met its planned 2021 exploration planning targets. LAURION has completed 60% of its drill program target of 10,000 m to date and is awaiting further assay results to consolidate, integrate and correlate the assay results into its GIS database and 3D modelling, prior to reporting to its investors. LAURION has fortuitously completed its planned program of stripping, trenching and channel sampling of the A-Zone and MacLeod Zone. The Corporation is also awaiting the final assays of the channel sampling on both of these zones.
During this Emergency Area Order period, LAURION will continue with its exploration program of prospecting and geochemical soil sampling following up on geophysical surveys of anomalies north of the Namewaminikan River, ensuring the safety of its exploration team while cognizant of the dry conditions of the field.
Qualified Person
The technical information in this news release has been prepared in accordance with Canadian regulatory requirements and has been reviewed and approved by Jean Philippe Paiement, P Geo., a consultant to Laurion, and a "qualified person" within the meaning of National Instrument 43-101.
About LAURION
The Corporation is a junior mineral exploration and development company listed on the TSXV under the symbol LME and on the OTCPINK under the symbol LMEFF. LAURION now has 233,473,342 outstanding shares of which approximately 79% are owned and controlled by Insiders who are eligible investors under the "Friends and Family" categories.
LAURION's emphasis is on the development of its flagship project, the 100% owned mid-stage 47 km2 Ishkoday Project, and its gold-silver and gold-rich polymetallic mineralization with a significant upside potential. The mineralization on Ishkoday is open at depth beyond the current core-drilling limit of -200 m from surface, based on the historical mining to a -685 m depth, in the past producing Sturgeon River Mine. The recently acquired Brenbar Property, which is contiguous with the Ishkoday Property, hosts the historic Brenbar Mine and LAURION believes the mineralization to be a direct extension of mineralization from the Ishkoday Property.
Caution Regarding Forward-Looking Information
This press release contains forward-looking statements, which reflect the Corporation's current expectations regarding future events, including with respect to LAURION's business, operations and condition, and management's objectives, strategies, beliefs and intentions. The forward-looking statements involve risks and uncertainties. Actual events and future results, performance or achievements expressed or implied by such forward-looking statements could differ materially from those projected herein including as a result of a change in the trading price of the common shares of LAURION, the interpretation and actual results of current exploration activities, changes in project parameters as plans continue to be refined, future prices of gold and/or other metals, possible variations in grade or recovery rates, failure of equipment or processes to operate as anticipated, the failure of contracted parties to perform, labor disputes and other risks of the mining industry, delays in obtaining governmental approvals or financing or in the completion of exploration, as well as those factors disclosed in the Corporation's publicly filed documents. Investors should consult the Corporation's ongoing quarterly and annual filings, as well as any other additional documentation comprising the Corporation's public disclosure record, for additional information on risks and uncertainties relating to these forward-looking statements. The reader is cautioned not to rely on these forward-looking statements. Subject to applicable law, the Corporation disclaims any obligation to update these forward-looking statements.
NEITHER THE TSX VENTURE EXCHANGE NOR ITS REGULATION SERVICE PROVIDER (AS THAT TERM IS DEFINED IN THE POLICIES OF THE TSX VENTURE EXCHANGE) ACCEPTS RESPONSIBILITY FOR THE ADEQUACY OR ACCURACY OF THE CONTENT OF THIS NEWS RELEASE.
SOURCE Laurion Mineral Exploration Inc.

View original content: http://www.newswire.ca/en/releases/archive/July2021/21/c8113.html
VANCOUVER, British Columbia, July 21, 2021 (GLOBE NEWSWIRE) — Imperial Metals Corporation (the “Company”) (TSX:III) reports Red Chris metal production (100%) for the second quarter of 2021 was 17.6 million pounds copper and 15,451 ounces gold, compared to 15.9 million pounds copper and 15,850 ounces gold produced during the first quarter of 2021. Improved throughput and recovery for the quarter were offset by lower head grades of 0.40% copper and 0.35 g/t gold compared to 0.43% copper and 0.42g/t gold in the first quarter. Imperial’s 30% portion of the first quarter production was 5.3 million pounds copper and 4,635 ounces gold.
The newly installed cleaner column was commissioned during the quarter and is now operating. Early results have shown improved gold recovery over results prior to the installation of this cleaner column cell.
The portal site excavation has been completed and the exploration decline is progressing, having advanced 21 metres as of July 14, 2021. The East Zone high grade pod is being drilled at a tighter spacing to provide the information required to consider “early mining” as part of the Red Chris Block Cave Pre-Feasibility Study. Mining of this particularly high-grade section of the East Zone prior to the block cave mining may increase initial cash flow and help fund the development of block caving operations. The Pre-Feasibility Study is expected to be released by the end of September 2021.
Exploration Update
Drilling continues to expand the higher-grade mineralization at East Ridge, the recently discovered extension of the Red Chris deposit. Drill hole RC700 intersected 366 metres grading 1.1g/t gold and 0.93% copper from a depth of 738 metres, including 146 metres grading 2.1g/t gold and 1.6% copper from a depth of 780 metres. The discovery of such wide zones of high-grade mineralization, which are comparable to some of the better intercepts from the East Zone, clearly illustrates the potential for the East Ridge to develop into an important new development area. Hole RC700 was drilled 100 metres above the previously reported hole RC688. Drill hole RC692 targeted the 100 metre down-plunge projection of mineralization intersected in hole RC684. Hole RC692 successfully intersected 274 metres of 0.40g/t gold and 0.41% copper from 1090 metres to 1364 metres.
Brian Kynoch, President of Imperial Metals Corporation, said “RC700 has yielded the highest grades to date from the East Ridge. This intercept is similar to those encountered in the high-grade pods in the East Zone and shows that this eastern extension of mineralization at Red Chris has the potential to contain high-grade pods similar to those in the East Zone.”
Red Chris – Significant results since June 9, 2021 drilling update:
|
Hole ID |
From (m) |
To (m) |
Width (m) |
Gold (g/t) |
Copper (%) |
|
RC700 |
738 |
1104 |
366 |
1.1 |
0.93 |
|
including |
774 |
1000 |
226 |
1.6 |
1.3 |
|
including |
780 |
926 |
146 |
2.1 |
1.6 |
|
RC692 |
1090 |
1364 |
274 |
0.40 |
0.41 |
|
including |
1242 |
1336 |
94 |
0.61 |
0.49 |
During the second quarter there were up to eight drill rigs in operation, completing 26 drill holes for a total of about 30,055 drilled metres. All the holes, except six geotechnical drill holes, intersected mineralization. Since the commencement of the Joint Venture in 2019, 137 drill holes totalling about 166,686 metres have been drilled.
Drilling is ongoing at East Ridge to further define the extent and continuity of this zone, with ten holes completed and three in progress. The follow up drilling is being completed on a nominal 100 x 100 metre grid to determine the footprint of the mineralization and demonstrate the continuity of the higher-grade mineralization. The East Ridge is open in all directions and has extended the eastern limit of copper and gold mineralization.
Approximately 50,000 metres of growth-related drilling is planned this calendar year.
Jim Miller-Tait, P.Geo., Imperial Metals Vice President Exploration, is the designated Qualified Person as defined by National Instrument 43-101 for the Red Chris exploration program and has reviewed this news release. Red Chris samples for the 2021 drilling reported were analysed at Bureau Veritas Mineral Laboratories in Vancouver. A full QA/QC program using blanks, standards and duplicates was completed for all diamond drilling samples submitted to the labs. Significant assay intervals reported represent apparent widths. Insufficient geological information is available to confirm the geological model and true width of significant assay intervals.
Cross section and plan view maps are available on imperialmetals.com.
About Imperial
Imperial is a Vancouver based exploration, mine development and operating company. The Company, through its subsidiaries, owns a 30% interest in the Red Chris mine, and a 100% interest in both the Mount Polley and Huckleberry copper mines in British Columbia.
Company Contacts
Brian Kynoch | President | 604.669.8959
Darb Dhillon | Chief Financial Officer | 604.488.2658
Jim Miller-Tait | Vice President Exploration | 604.488.2676
Cautionary Note Regarding Forward-Looking Statements
Certain information contained in this news release are not statements of historical fact and are “forward-looking” statements. Forward-looking statements relate to future events or future performance and reflect Company management’s expectations or beliefs regarding future events and include, but are not limited to, statements and inferences regarding the potential for continued improved gold recovery from the newly installed cleaner column, the Company’s expectations and timing with respect to the Red Chris Block Cave Pre-Feasibility Study, current and planned drilling programs at Red Chris, including mining of the East Zone high grade pod and plans to define the extent and continuity of the mineralization in the East Ridge and the potential importance of the East Ridge as a development area, and statements regarding cash flow and the funding of block caving operations.
In certain cases, forward-looking statements can be identified by the use of words such as "plans", "expects" or "does not expect", "is expected", "outlook", "budget", "scheduled", "estimates", "forecasts", "intends", "anticipates" or "does not anticipate", or "believes", or variations of such words and phrases or statements that certain actions, events or results "may", "could", "would", "might" or "will be taken", "occur" or "be achieved" or the negative of these terms or comparable terminology. By their very nature forward-looking statements involve known and unknown risks, uncertainties and other factors which may cause the actual results, performance or achievements of the Company to be materially different from any future results, performance or achievements expressed or implied by the forward-looking statements.
In making the forward-looking statements in this release, the Company has applied certain factors and assumptions that are based on information currently available to the Company as well as the Company’s current beliefs and assumptions. These factors and assumptions and beliefs and assumptions include, the risk factors detailed from time to time in the Company’s interim and annual financial statements and management’s discussion and analysis of those statements, all of which are filed and available for review on SEDAR at www.sedar.com. Although the Company has attempted to identify important factors that could cause actual actions, events or results to differ materially from those described in forward-looking statements, there may be other factors that cause actions, events or results not to be as anticipated, estimated or intended, many of which are beyond the Company’s ability to control or predict. There can be no assurance that forward-looking statements will prove to be accurate, as actual results and future events could differ materially from those anticipated in such statements. Accordingly, readers should not place undue reliance on forward-looking statements and all forward-looking statements in this news release are qualified by these cautionary statements. Such information is given only as of the date of this news release. The Company does not assume any obligation to update its forward-looking information to reflect new information, subsequent events or otherwise, except as required by law.
Breakthrough Lithium-Ion Battery Recycling Technologies Enable Extraordinary Increase in Throughput
VIRGINIA CITY, Nev., July 21, 2021 (GLOBE NEWSWIRE) — Comstock Mining Inc. (the “Company”) (NYSE American: LODE) today announced the filing of a Written Determination of Hazardous Waste Recycling (“Application”) by LINICO Corporation (“LiNiCo”), and its lithium-ion battery (“LIB”) recycling facility located in the Tahoe Reno Industrial (“TRI”) Center in Storey County, Nevada (“TRI Facility”).
The Application and LiNiCo’s final engineering plans are based on the first phase of LiNiCo’s proprietary LIB recycling technologies, which have been designed for extraordinary capacity and yield at a fraction of the capital and operating costs of all known methods. Those technologies are the direct result of Comstock’s recently announced and planned additional technology development, engineering, and materials science acquisitions and other transactions, including Renewable Process Solution (“RPS”) and its CEO and Comstock’s new Chief Process Engineer, Rahul Bobbili.
Construction of the first phase of LiNiCo’s new processes will commence at the TRI Facility upon approval of the Application, with an anticipated completion and start-up during the first half of 2022. Once complete, the TRI Facility is conservatively expected to scale up to its initial nameplate capacity exceeding 100,000 tons per year of LIBs over a period of three years, with annualized revenues exceeding $250,000,000, $410,000,000, and $505,000,000 per year during the TRI Facility’s first, second, and third full years of operations, respectively, as shown in the following excerpt from LiNiCo’s internal projections:
|
2022 |
2023 |
2024 |
2025 |
|||||
|
Throughput (tons per year) |
26,880 |
53,760 |
80,640 |
87,091 |
||||
|
Revenue ($000s per year) |
$ |
90,339 |
$ |
250,814 |
$ |
410,450 |
$ |
505,094 |
Extraordinary Growth
Spent LIBs are widely expected to contain more than $12 billion in recoverable strategic metals by 2025 and $26 billion by 2040, as global mobile device use increases to about 18 billion by 2025, and electric vehicle (“EV”) sales increase to about 138 million units by 2030 from 7.6 million in 2020, according to the International Energy Agency. ARK Invest also recently concluded that EV sales will increase to about 40% of global auto sales within five to six years. Tesla CEO Elon Musk provided a similar estimate, tweeting his view that the industry could produce 30 million EVs per year by 2027. Peter Rawlinson, CEO of Lucid, said in June 2021 that he believes that there is a growing recognition that EVs represent the future of the auto industry. And General Motors recently announced that it will increase spending on electric and autonomous vehicles to $35 billion through 2025, with a target of selling 1,000,000 EVs annually by 2025.
Meeting the increased demand will require about 1.8 million tons per year of lithium carbonate equivalent (“LCE”), or about five times more than the entire lithium mining industry produces today, and more than fifteen times the total LCE used in producing new EVs in 2020. The mining and battery manufacturing industries can scale up to meet that demand, but there are only about 80 million tons of identified lithium resources worldwide, and EV batteries are typically landfilled after eight to ten years of use.
Selective Separation Technologies
“The first phase of our technologies was all about establishing and maximizing market leading throughput in a safe, compliant, and cost-effective manner, with room for modular capacity expansions as global electrification efforts accelerate and the LIB recycling industry inevitably grows,” said LiNiCo’s Chief Executive Officer and Founder, Michael Vogel. “However, in addition to our previously announced Green Li-ion 99.9% pure cathode production technologies, we are also perfecting a series of additional technologies involving remarkable and new approaches to selectively separating strategic commodities from LIBs, starting with high purity LCE products. We designed the TRI Facility layout with those future upgrades and technologies in mind.”
Comstock’s Executive Chairman and Chief Executive Officer, Corrado De Gasperis, added, “We see spent LIBs as a potent form of industrial ore, and – as with any ore, we need the right team, technology, and infrastructure to mine it. Comstock and LiNiCo are rapidly assembling all three, as demonstrated by the extraordinary five-fold leap in the initial throughput of LiNiCo’s first facility, representing the proverbial tip of our rapidly developing and expanding technology spear.”
Addressing Scarcity with Innovation
Comstock believes that the global clean energy transition, escalating population growth, and accelerating natural resource scarcity are converging into a “perfect storm” of global demand in a broad array of strategic materials, including anything involving carbon, metals, energy, and water – without the corresponding global capacity to sustainably meet even a fraction of the demand. Comstock’s strategic focus has consequently shifted to include the development of companies and technologies that facilitate the more efficient use of natural resources by extracting and valorizing critical and inevitably scarce feedstocks.
De Gasperis concluded, “The consumption of any product is powered by feedstock, and as vast as some feedstock supplies may seem, they are all finite. The world is watching that story unfold in electrification products, with a current focus on the scarcity of lithium and other cathode constituents, and a shared goal of reducing global carbon emissions. However, every cathode in every LIB needs an anode, and the vast majority of anodes are comprised of synthetic graphite, the global supplies of which are nearly all met with carbon intensive fossil fuel derivatives. We see that to be counterproductive, and its exactly the sort of inevitable need that we intend to address with innovation. We believe that we’re well positioned ahead of that curve with LiNiCo’s TRI Facility and our technology development efforts.”
About Comstock Mining Inc.
Comstock Mining Inc. (NYSE: LODE) is an emerging innovator and leader in the sustainable extraction, valorization, and production of scarce natural resources, with a focus on high value strategic materials that are essential to meeting the rapidly increasing global demand for clean energy, carbon-neutrality, and natural products. To learn more, please visit www.comstockmining.com.
Comstock was selected to join the Russell Microcap® Index at the conclusion of the 2021 Russell indexes annual reconstitution, effective after the US market opened on June 4, 2021. Membership in the Russell Microcap® Index, which remains in place for one year, means automatic inclusion in the appropriate growth and value style indexes. FTSE Russell determines membership for its Russell indexes primarily by objective, market-capitalization rankings and style attributes.
Forward-Looking Statements
This press release and any related calls or discussions may include forward-looking statements within the meaning of Section 27A of the Securities Act of 1933, as amended, and Section 21E of the Securities Exchange Act of 1934, as amended. All statements, other than statements of historical facts, are forward-looking statements. The words “believe,” “expect,” “anticipate,” “estimate,” “project,” “plan,” “should,” “intend,” “may,” “will,” “would,” “potential” and similar expressions identify forward-looking statements, but are not the exclusive means of doing so. Forward-looking statements include statements about matters such as: consummation of all pending transactions; project, asset or Company valuations; future industry market conditions; future explorations, acquisitions, investments and asset sales; future performance of and closings under various agreements; future changes in our exploration activities; future estimated mineral resources; future prices and sales of, and demand for, our products; future impacts of land entitlements and uses; future permitting activities and needs therefor; future production capacity and operations; future operating and overhead costs; future capital expenditures and their impact on us; future impacts of operational and management changes (including changes in the board of directors); future changes in business strategies, planning and tactics and impacts of recent or future changes; future employment and contributions of personnel, including consultants; future land sales, investments, acquisitions, joint ventures, strategic alliances, business combinations, operational, tax, financial and restructuring initiatives; the nature and timing of and accounting for restructuring charges and derivative liabilities and the impact thereof; contingencies; future environmental compliance and changes in the regulatory environment; future offerings of equity or debt securities; asset sales and associated costs; future working capital, costs, revenues, business opportunities, debt levels, cash flows, margins, earnings and growth. These statements are based on assumptions and assessments made by our management in light of their experience and their perception of historical and current trends, current conditions, possible future developments and other factors they believe to be appropriate. Forward-looking statements are not guarantees, representations or warranties and are subject to risks and uncertainties, many of which are unforeseeable and beyond our control and could cause actual results, developments and business decisions to differ materially from those contemplated by such forward-looking statements. Some of those risks and uncertainties include the risk factors set forth in our filings with the SEC and the following: counterparty risks; capital markets’ valuation and pricing risks; adverse effects of climate changes or natural disasters; global economic and capital market uncertainties; the speculative nature of gold or mineral exploration, including risks of diminishing quantities or grades of qualified resources; operational or technical difficulties in connection with exploration or mining activities; contests over title to properties; potential dilution to our stockholders from our stock issuances and recapitalization and balance sheet restructuring activities; potential inability to comply with applicable government regulations or law; adoption of or changes in legislation or regulations adversely affecting businesses; permitting constraints or delays; decisions regarding business opportunities that may be presented to, or pursued by, us or others; the impact of, or the non-performance by parties under agreements relating to, acquisitions, joint ventures, strategic alliances, business combinations, asset sales, leases, options and investments to which we may be party; changes in the United States or other monetary or fiscal policies or regulations; interruptions in production capabilities due to capital constraints; equipment failures; fluctuation of prices for gold or certain other commodities (such as silver, zinc, cyanide, water, diesel fuel and electricity); changes in generally accepted accounting principles; adverse effects of terrorism and geopolitical events; potential inability to implement business strategies; potential inability to grow revenues; potential inability to attract and retain key personnel; interruptions in delivery of critical supplies, equipment and raw materials due to credit or other limitations imposed by vendors or others; assertion of claims, lawsuits and proceedings; potential inability to satisfy debt and lease obligations; potential inability to maintain an effective system of internal controls over financial reporting; potential inability or failure to timely file periodic reports with the SEC; potential inability to list our securities on any securities exchange or market; inability to maintain the listing of our securities; and work stoppages or other labor difficulties. Occurrence of such events or circumstances could have a material adverse effect on our business, financial condition, results of operations or cash flows or the market price of our securities. All subsequent written and oral forward-looking statements by or attributable to us or persons acting on our behalf are expressly qualified in their entirety by these factors. Except as may be required by securities or other law, we undertake no obligation to publicly update or revise any forward-looking statements, whether as a result of new information, future events, or otherwise.
Neither this press release nor any related calls or discussions constitutes an offer to sell, the solicitation of an offer to buy or a recommendation with respect to any securities of the Company, the fund or any other issuer.
|
Contact information: |
||
|
Comstock Mining Inc. |
Corrado De Gasperis |
Zach Spencer |
NOT FOR DISTRIBUTION TO THE U.S. NEWSWIRE OR FOR DISSEMINATION IN THE UNITED STATES
TORONTO, ON / ACCESSWIRE / July 21, 2021 / Black Iron Inc. ("Black Iron" or the "Company") (TSX:BKI; OTC PINK:BKIRF; FRANKFURT:BIN) is pleased to announce that it has closed its previously announced short form prospectus offering, including the full exercise of the over-allotment option, raising gross proceeds of $11.5 million for the Company through the issuance of 28,750,000 common shares of the Company (collectively, the "Shares") at a price of $0.40 per Share (the "Offering"). The Offering is subject to final approval by the Toronto Stock Exchange (the "TSX").
Canaccord Genuity Corp. acted as agent and sole bookrunner in connection with the Offering
The Company intends to use the net proceeds of the Offering for (a) the completion of an updated Feasibility Study for the Company's Shymanivske Iron Ore Project, (b) the completion of the Ukrainian TEO; (c) the completion of an Environmental and Social Impact Assessment, (d) commencement of the relocation and construction of a new Ukrainian military firing range and ammunition depot to secure access to land required for the Company's Shymanivske Iron Ore Project, and (e) working capital and general corporate purposes, all as described in more detail in the short form prospectus (the "Prospectus") of the Company dated July 16, 2021 and available on SEDAR at www.sedar.com.
Matt Simpson, Chief Executive Officer of the Company, said, "It is great to see such strong level of interest from institutional investors in the Offering and the Shymanivske Iron Ore Project as we continue to move the project forward towards construction."
This news release shall not constitute an offer to sell or the solicitation of an offer to buy nor shall there be any sale of the securities in any jurisdiction in which such offer, solicitation or sale would be unlawful. The securities have not been and will not be registered under the U.S. Securities Act or any applicable state securities laws, and may not be offered or sold to, or for the account or benefit of, persons in the United States or to U.S. persons unless registered under the U.S. Securities Act and applicable state securities laws or an exemption from such registration is available. "United States" and "U.S. persons" shall have the meanings assigned to them in Regulation S under the U.S. Securities Act.
About Black Iron
Black Iron is an iron ore exploration and development company, advancing its 100% owned Shymanivske project located in Kryviy Rih, Ukraine. Full mineral resource details can be found in the NI 43-101 technical report entitled "Preliminary Economic Assessment of the Re-scoped Shymanivske Iron Ore Deposit" published in March 2020 with an effective date of November 21, 2017 (the "PEA") under the Company's profile on SEDAR at www.sedar.com. The Shymanivske project is surrounded by five other operating mines, including Metinvest and ArcelorMittal's iron ore complexes. The PEA is preliminary in nature, and it includes inferred mineral resources that are considered too speculative geologically to have the economic considerations applied to them that would enable them to be categorized as mineral reserves. There is no certainty that the PEA will be realized. Please visit the Company's website at www.blackiron.com for more information.
For more information, please contact:
Matt Simpson
Chief Executive Officer
Black Iron Inc.
info@blackiron.com
Forward-Looking Information
This press release contains forward-looking information. Forward-looking information is based on what management believes to be reasonable assumptions, opinions and estimates of the date such statements are made based on information available to them at that time. Forward-looking information may include, but is not limited to, statements with respect to the intended use of proceedsof the Offering, the Company's ability to obtain final approval from the TSX and the Company's future plans. Generally, forward looking information can be identified by the use of forward-looking terminology such as "plans", "expects" or "does not expect", "is expected", "budget", "scheduled", "estimates", "forecasts", "intends", "anticipates" or "does not anticipate", or "believes", or variations of such words and phrases or state that certain actions, events or results "may", "could", "would", "might" or "will be taken", "occur" or "be achieved". Forward-looking information is subject to known and unknown risks, uncertainties and other factors that may cause the actual results, level of activity, performance or achievements of the Company to be materially different from those expressed or implied by such forward-looking information, including but not limited to: the Company using any proceeds from the Offering in a manner other than as set out herein, the Company not being able to obtain final approval from the TSX with respect to the Offering, general business, economic, competitive, geopolitical and social uncertainties; the actual results of current exploration activities; other risks of the mining industry and the risks described in the annual information form of the Company and the Prospectus. Although the Company has attempted to identify important factors that could cause actual results to differ materially from those contained in forward-looking information, there may be other factors that cause results not to be as anticipated, estimated or intended. There can be no assurance that such information will prove to be accurate, as actual results and future events could differ materially from those anticipated in such statements. Accordingly, readers should not place undue reliance on forward looking information. The Company does not undertake to update any forward-looking information, except in accordance with applicable securities laws. The Company notes that mineral resources are not mineral reserves and do not have demonstrated economic viability.
SOURCE: Black Iron Inc.
View source version on accesswire.com:
https://www.accesswire.com/656453/Black-Iron-Announces-Closing-of-115-Million-Offering
Here are five stocks added to the Zacks Rank #1 (Strong Buy) List today:
APA Corporation APA: This explorer and producer of oil and gas with operations principally in the United States, Egypt and the United Kingdom and exploration activities offshore Suriname, has seen the Zacks Consensus Estimate for its current year earnings increasing 12% over the last 60 days.
APA Corporation Price and Consensus

APA Corporation price-consensus-chart | APA Corporation Quote
Marathon Oil Corporation MRO: This exploration and production company with extensive operations across Africa, Middle East, Europe and North America has seen the Zacks Consensus Estimate for its current year earnings increasing 45.9% over the last 60 days.
Marathon Oil Corporation Price and Consensus

Marathon Oil Corporation price-consensus-chart | Marathon Oil Corporation Quote
Vale S.A. VALE: This mining company engaged in the mining of iron ore and pellets has seen the Zacks Consensus Estimate for its current year earnings increasing 13.6% over the last 60 days.
VALE S.A. Price and Consensus

VALE S.A. price-consensus-chart | VALE S.A. Quote
Brookfield Asset Management Inc. BAM: This alternative asset manager and an investor in real assets has seen the Zacks Consensus Estimate for its current year earnings increasing 0.9% over the last 60 days.
Brookfield Asset Management Inc Price and Consensus

Brookfield Asset Management Inc price-consensus-chart | Brookfield Asset Management Inc Quote
Devon Energy Corporation DVN: This independent energy company engaged in finding and producing oil and natural gas has seen the Zacks Consensus Estimate for its current year earnings increasing 12.6% over the last 60 days.
Devon Energy Corporation Price and Consensus

Devon Energy Corporation price-consensus-chart | Devon Energy Corporation Quote
You can see the complete list of today’s Zacks #1 Rank (Strong Buy) stocks here.
Want the latest recommendations from Zacks Investment Research? Today, you can download 7 Best Stocks for the Next 30 Days. Click to get this free report
Devon Energy Corporation (DVN) : Free Stock Analysis Report
Marathon Oil Corporation (MRO) : Free Stock Analysis Report
APA Corporation (APA) : Free Stock Analysis Report
VALE S.A. (VALE) : Free Stock Analysis Report
Brookfield Asset Management Inc (BAM) : Free Stock Analysis Report
To read this article on Zacks.com click here.
By Ernest Scheyder
GASTON COUNTY, N.C., July 20 (Reuters) – In its quest to build one of the largest lithium mines in the United States, Piedmont Lithium Inc has overlooked one crucial constituency: its North Carolina neighbors.
Piedmont last autumn signed a deal https://www.reuters.com/article/us-piedmont-lithium-deal-tesla-idUSKBN26J03H to supply U.S. electric automaker Tesla Inc with lithium sourced from its deposits in North Carolina, sending the company's stock up tenfold.
Piedmont has also hired investment banks to find investors for its $840 million project, which would include an open-air pit more than 500 feet (152 m) deep and facilities to produce lithium-based electric vehicle (EV) battery chemicals.
The company, however, has not applied for a state mining permit or a necessary zoning variance in Gaston County, just west of Charlotte, despite telling investors since 2018 that it was on the verge of doing so.
Five of the seven members of the county's board of commissioners, who control zoning changes, say they may block or delay the project because Piedmont has not told them what levels of dust, noise and vibrations will occur, nor how water and air quality would be affected.
"Piedmont has sort of put the proverbial cart before the horse," said Tom Keigher, chair of the board of commissioners. "Why in the world would they make this deal with Tesla before they even have approval for the mine?"
Piedmont said it waited to approach officials in order to refine its plans – it published a third iteration last month – and to secure a customer to show that the mine could stay open for its projected 20-year lifespan.
"We finally have a project to debut and really talk about," said Keith Phillips, Piedmont's chief executive officer.
"Maybe it would have been better had (commissioners) been in the loop constantly. We didn't really have the time or resources to do it and we didn't even know what to tell them, until now."
The deteriorating relationship between Piedmont and county leaders reflects broader tension in the United States as resistance to living near a mine clashes with the potential of EVs to mitigate climate change.
Piedmont has already spent $58 million on the project, which would produce about 30,000 tonnes of lithium annually, enough to make about 3 million EVs.
The company originally planned to put its chemical plant in a neighboring county, but now intends to build it near the mine, a step that should reduce truck traffic. Piedmont also plans to crush rock in the mine pit, alleviating dust, and incorporate solar power.
TUESDAY MEETING
In September 2018, Piedmont told investors it expected to obtain permits by the end of 2019. In August 2019, executives said they would apply for permits and rezoning "in the coming months."
Piedmont said both times it was "not aware" of any reason why the county would not approve zoning changes, even though it had yet to present any information to commissioners. In December, Piedmont said it expected to receive local zoning approval before the end of June.
The company said the delays were due in part to weak lithium prices in recent years.
Piedmont had been set to meet with commissioners in March, but canceled with three days' notice, further straining the relationship. Piedmont said it canceled that meeting in order to further refine its plans.
"This has been the worst rollout of a project from a company I've ever seen," said Chad Brown, a commissioner who opposes the mine.
Phillips, Piedmont's CEO, is slated to give a 15-minute presentation to commissioners on Tuesday night, though no vote will be held.
Phillips said he will tell commissioners Piedmont expects to apply for a state mining permit this summer, begin construction in April 2022 and be in production by the second half of 2023.
Piedmont's deal with Tesla involves supplying roughly 53,000 tonnes of spodumene concentrate to the automaker's planned lithium hydroxide chemical plant in Texas starting sometime between July 2022 and July 2023.
Piedmont declined to discuss the Tesla arrangement, but hinted the automaker may not need supply by 2023.
"We're confident in the relationship we have with our customer to be able to manage the supply of lithium when they need it," said David Klanecky, Piedmont's chief operating officer.
Tesla, which has other lithium suppliers, did not respond to requests for comment.
The North Carolina Department of Environmental Quality, which issues mining permits, said it expects an application "in the near future."
State officials added their review process could stretch for more than a year as they solicit comments from at least six other state and federal agencies.
"I'm not even going to accept an application from Piedmont for rezoning until they have their state permit in hand," said Brian Sciba, director of Gaston County's planning and zoning office.
'MINE AROUND MY PROPERTY'
Piedmont, whose stock trades in Australia and began trading on the Nasdaq in the United States earlier this year, owns or controls more than 3,000 acres (12 sq km) in the western corner of rural Gaston County.
While some landowners are prepared to sell if the offer is enticing enough, others say Piedmont has bullied them.
"They told me that if I don't sell, they'll just mine around my property," said Emilie Nelson, whose 14 acres Piedmont has tried to buy since 2017.
Piedmont said it was unaware if one of its contractors made the alleged threat, but did not authorize or condone it.
"We always deal respectfully with folks," said Patrick Brindle, Piedmont's vice president of project management. "And if we weren't those kind of operators, I don't think we would be successful in entering into the number of agreements with landowners that we have."
Landowners said they would prefer Piedmont only build a processing plant and rely on a foreign mine for lithium supply. Livent Corp and Albemarle Corp operate lithium processing plants in the county that source the metal from South America.
Piedmont, which recently bought stakes in Quebec and Ghana lithium projects, said it prefers to mine and process the metal at the Gaston County site.
Piedmont's arrangement with Tesla has done little to impress locals. More than 1,500 have signed a petition asking officials to block the mine.
"There's no doubt the mine would benefit our country and the green energy industry," said Tracy Philbeck, a commissioner. "But it would have a negative impact on our community." (Reporting by Ernest Scheyder; Editing by Amran Abocar and Marguerita Choy)
U.S. Silica Holdings, Inc. SLCA has announced that its Industrial and Specialty Products unit will increase prices for most of its non-contracted silica sand, diatomaceous earth and clay products that are used mainly in applications like glass, foundry, paints, coatings, elastomers, roofing, chemicals, recreation, building products, agricultural, pet litter and other applications.
The increase will be up to 15%, on the basis of the product and grade, with effect from shipments beginning Sep 1, 2021.
The increased prices are requisite to help balance significant cost increases in energy, transportation, materials and manufacturing costs.
Shares of U.S. Silica have skyrocketed 170.9% over a year, outperforming the industry’s rise of 26%. Its earnings growth rate for the current year is pegged at 54.2%.

Image Source: Zacks Investment Research
In its last-quarter earnings call, the company has predicted sustainable long-term growth for 2021 and beyond. It is focused on prioritizing free cash flow, repositioning its Oil & Gas segment and expanding the Industrial and Specialty Products segment.
The company expects The Industrial & Specialty Products segment growth to outpace U.S. GDP. It expects the contribution margin of the segment to increase 5-10% sequentially in the second quarter.
In the Oil & Gas segment, the company expects a strong energy recovery as economic activity rebounds and gains momentum. For the second quarter, the contribution margin is projected to increase 30-35%. The company plans to deliver positive cash flow in 2021 and deleverage its balance sheet.
U.S. Silica Holdings, Inc. Price and Consensus

U.S. Silica Holdings, Inc. price-consensus-chart | U.S. Silica Holdings, Inc. Quote
Zacks Rank & Stocks to Consider
Currently, U.S. Silica carries a Zacks Rank #3 (Hold).
Better-ranked stocks in the basic materials space include Glencore PLC GLNCY and Rio Tinto PLC RIO, each sporting a Zacks Rank #1 (Strong Buy), and BHP Group BHP, carrying a Zacks Rank #2 (Buy). You can see the complete list of today’s Zacks #1 Rank stocks here.
Glencore has a projected earnings growth rate of 296.7% for the current year. The company’s shares have appreciated 74.3% over a year.
Rio Tinto has a projected earnings growth rate of 124.3% for the current year. The company’s shares have rallied 28.5% over a year.
BHP has a projected earnings growth rate of 192.5% for the current year. The company’s shares have grown 35% over a year.
Want the latest recommendations from Zacks Investment Research? Today, you can download 7 Best Stocks for the Next 30 Days. Click to get this free report
BHP Group Limited Sponsored ADR (BHP) : Free Stock Analysis Report
Rio Tinto PLC (RIO) : Free Stock Analysis Report
U.S. Silica Holdings, Inc. (SLCA) : Free Stock Analysis Report
Glencore PLC (GLNCY) : Free Stock Analysis Report
To read this article on Zacks.com click here.
Company invites individual and institutional investors, as well as advisors and analysts, to attend real-time, interactive presentations on VirtualInvestorConferences.com
VANCOUVER, BC, July 20, 2021 /PRNewswire/ — Granite Creek Copper (OTCQB: GCXXF), based in Vancouver, Canada, focused on its flagship Carmacks Copper-Gold-Silver Project in the Minto Copper Belt of Yukon, Canada, today announced that Tim Johnson, President & CEO, will present live at VirtualInvestorConferences.com on July 29th.

DATE: July 29th
TIME: 1:30PM ET
LINK: https://bit.ly/3hGKd6Z
This will be a live, interactive online event where investors are invited to ask the company questions in real-time. If attendees are not able to join the event live on the day of the conference, an archived webcast will also be made available after the event.
It is recommended that investors pre-register and run the online system check to expedite participation and receive event updates.
Learn more about the event at www.virtualinvestorconferences.com.
Recent Company Highlights
-
Currently drilling ~13,000 meter program with assays expected throughout Q3 and Q4
-
Updated 43-101 resource estimate targeted for Q4 based on 2021 drill program
-
Updated 43-101 economic study expected in Q4 or early Q1 2022
About Granite Creek Copper
Granite Creek, a member of the Metallic Group of Companies, is a Canadian exploration company focused on the 176 square kilometer Carmacks copper-gold-silver project in the Minto copper district of Canada's Yukon Territory. The project is on trend with the high-grade Minto copper-gold mine, operated by Minto Explorations Ltd, to the north and features excellent access to infrastructure with the nearby paved Yukon Highway 2, along with grid power within 12 km. More information about Granite Creek Copper can be viewed on the Company's website at www.gcxcopper.com.
About Virtual Investor Conferences®
Virtual Investor Conferences (VIC) is the leading proprietary investor conference series that provides an interactive forum for publicly-traded companies to meet and present directly with investors.
A real-time solution for investor engagement, Virtual Investor Conferences is part of OTC Market Group's suite of investor relations services specifically designed for more efficient Investor Access. Replicating the look and feel of on-site investor conferences, Virtual Investor Conferences combine leading-edge conferencing and investor communications capabilities with a comprehensive global investor audience network.

View original content to download multimedia:https://www.prnewswire.com/news-releases/granite-creek-copper-to-webcast-live-at-virtualinvestorconferencescom-july-29th-301336213.html
SOURCE VirtualInvestorConferences.com
Our extensive research has shown that imitating the smart money can generate significant returns for retail investors, which is why we track nearly 900 active prominent money managers and analyze their quarterly 13F filings. The stocks that are heavily bought by hedge funds historically outperformed the market, though there is no shortage of high profile failures like hedge funds' 2018 losses in Facebook and Apple. Let’s take a closer look at what the funds we track think about BHP Group (NYSE:BBL) in this article.
BHP Group (NYSE:BBL) was in 23 hedge funds' portfolios at the end of March. The all time high for this statistic is 24. BBL has experienced an increase in hedge fund interest lately. There were 18 hedge funds in our database with BBL holdings at the end of December. Our calculations also showed that BBL isn't among the 30 most popular stocks among hedge funds (click for Q1 rankings).
In the financial world there are a large number of tools investors have at their disposal to grade stocks. A pair of the most under-the-radar tools are hedge fund and insider trading indicators. We have shown that, historically, those who follow the top picks of the best fund managers can outperform the broader indices by a solid amount. Insider Monkey's monthly stock picks returned 206.8% since March 2017 and outperformed the S&P 500 ETFs by more than 115 percentage points (see the details here). That's why we believe hedge fund sentiment is a useful indicator that investors should pay attention to.

James Dinan of York Capital Management
At Insider Monkey, we scour multiple sources to uncover the next great investment idea. For example, Chuck Schumer recently stated that marijuana legalization will be a Senate priority. So, we are checking out this under the radar stock that will benefit from this. We go through lists like the 10 best battery stocks to pick the next Tesla that will deliver a 10x return. Even though we recommend positions in only a tiny fraction of the companies we analyze, we check out as many stocks as we can. We read hedge fund investor letters and listen to stock pitches at hedge fund conferences. You can subscribe to our free daily newsletter on our homepage. Now we're going to take a gander at the fresh hedge fund action regarding BHP Group (NYSE:BBL).
Do Hedge Funds Think BBL Is A Good Stock To Buy Now?
Heading into the second quarter of 2021, a total of 23 of the hedge funds tracked by Insider Monkey were bullish on this stock, a change of 28% from the previous quarter. By comparison, 21 hedge funds held shares or bullish call options in BBL a year ago. With the smart money's positions undergoing their usual ebb and flow, there exists a select group of notable hedge fund managers who were upping their stakes substantially (or already accumulated large positions).

According to publicly available hedge fund and institutional investor holdings data compiled by Insider Monkey, Fisher Asset Management, managed by Ken Fisher, holds the most valuable position in BHP Group (NYSE:BBL). Fisher Asset Management has a $413.5 million position in the stock, comprising 0.3% of its 13F portfolio. The second most bullish fund is Farallon Capital, with a $231.5 million position; 1.3% of its 13F portfolio is allocated to the stock. Some other professional money managers that are bullish encompass Peter Rathjens, Bruce Clarke and John Campbell's Arrowstreet Capital, D. E. Shaw's D E Shaw and Israel Englander's Millennium Management. In terms of the portfolio weights assigned to each position Sand Grove Capital Partners allocated the biggest weight to BHP Group (NYSE:BBL), around 3.04% of its 13F portfolio. York Capital Management is also relatively very bullish on the stock, setting aside 2.19 percent of its 13F equity portfolio to BBL.
As industrywide interest jumped, some big names were leading the bulls' herd. Farallon Capital, assembled the largest position in BHP Group (NYSE:BBL). Farallon Capital had $231.5 million invested in the company at the end of the quarter. Orkun Kilic's Berry Street Capital also made a $18.8 million investment in the stock during the quarter. The other funds with brand new BBL positions are James Dinan's York Capital Management, Louis Bacon's Moore Global Investments, and Frank Fu's CaaS Capital.
Let's also examine hedge fund activity in other stocks – not necessarily in the same industry as BHP Group (NYSE:BBL) but similarly valued. We will take a look at Morgan Stanley (NYSE:MS), SAP SE (NYSE:SAP), Amgen, Inc. (NASDAQ:AMGN), HDFC Bank Limited (NYSE:HDB), Bristol Myers Squibb Company (NYSE:BMY), Philip Morris International Inc. (NYSE:PM), and Shopify Inc (NYSE:SHOP). All of these stocks' market caps are closest to BBL's market cap.
[table] Ticker, No of HFs with positions, Total Value of HF Positions (x1000), Change in HF Position MS,79,5285168,13 SAP,19,1473996,5 AMGN,47,1001957,-2 HDB,27,1964796,-4 BMY,81,5037397,-50 PM,48,5494085,-4 SHOP,91,9984457,1 Average,56,4320265,-5.9 [/table]
View table here if you experience formatting issues.
As you can see these stocks had an average of 56 hedge funds with bullish positions and the average amount invested in these stocks was $4320 million. That figure was $1354 million in BBL's case. Shopify Inc (NYSE:SHOP) is the most popular stock in this table. On the other hand SAP SE (NYSE:SAP) is the least popular one with only 19 bullish hedge fund positions. BHP Group (NYSE:BBL) is not the least popular stock in this group but hedge fund interest is still below average. Our overall hedge fund sentiment score for BBL is 41.5. Stocks with higher number of hedge fund positions relative to other stocks as well as relative to their historical range receive a higher sentiment score. This is a slightly negative signal and we'd rather spend our time researching stocks that hedge funds are piling on. Our calculations showed that top 5 most popular stocks among hedge funds returned 95.8% in 2019 and 2020, and outperformed the S&P 500 ETF (SPY) by 40 percentage points. These stocks gained 23.8% in 2021 through July 16th and surpassed the market again by 7.7 percentage points. Unfortunately BBL wasn't nearly as popular as these 5 stocks (hedge fund sentiment was quite bearish); BBL investors were disappointed as the stock returned 5.7% since the end of March (through 7/16) and underperformed the market. If you are interested in investing in large cap stocks with huge upside potential, you should check out the top 5 most popular stocks among hedge funds as most of these stocks already outperformed the market in 2021.
Get real-time email alerts: Follow Bhp Group (NYSE:BBL)
Suggested Articles:
Disclosure: None. This article was originally published at Insider Monkey.
Taking full advantage of the stock market and investing with confidence are common goals for new and old investors, and Zacks Premium offers many different ways to do both.
The research service features daily updates of the Zacks Rank and Zacks Industry Rank, full access to the Zacks #1 Rank List, Equity Research reports, and Premium stock screens, all of which will help you become a smarter, more confident investor.
Zacks Premium includes access to the Zacks Style Scores as well.
What are the Zacks Style Scores?
Developed alongside the Zacks Rank, the Zacks Style Scores are a group of complementary indicators that help investors pick stocks with the best chances of beating the market over the next 30 days.
Each stock is assigned a rating of A, B, C, D, or F based on their value, growth, and momentum characteristics. Just like in school, an A is better than a B, a B is better than a C, and so on — that means the better the score, the better chance the stock will outperform.
The Style Scores are broken down into four categories:
Value Score
For value investors, it's all about finding good stocks at good prices, and discovering which companies are trading under their true value before the broader market catches on. The Value Style Score utilizes ratios like P/E, PEG, Price/Sales, Price/Cash Flow, and a host of other multiples to help pick out the most attractive and discounted stocks.
Growth Score
Growth investors are more concerned with a stock's future prospects, and the overall financial health and strength of a company. Thus, the Growth Style Score analyzes characteristics like projected and historic earnings, sales, and cash flow to find stocks that will see sustainable growth over time.
Momentum Score
Momentum traders and investors live by the saying "the trend is your friend." This investing style is all about taking advantage of upward or downward trends in a stock's price or earnings outlook. Employing factors like one-week price change and the monthly percentage change in earnings estimates, the Momentum Style Score can indicate favorable times to build a position in high-momentum stocks.
VGM Score
If you want a combination of all three Style Scores, then the VGM Score will be your friend. It rates each stock on their combined weighted styles, helping you find the companies with the most attractive value, best growth forecast, and most promising momentum. It's also one of the best indicators to use with the Zacks Rank.
How Style Scores Work with the Zacks Rank
The Zacks Rank, which is a proprietary stock-rating model, employs earnings estimate revisions, or changes to a company's earnings expectations, to make building a winning portfolio easier.
It's highly successful, with #1 (Strong Buy) stocks producing an unmatched +25.41% average annual return since 1988. That's more than double the S&P 500. But because of the large number of stocks we rate, there are over 200 companies with a Strong Buy rank, plus another 600 with a #2 (Buy) rank, on any given day.
This totals more than 800 top-rated stocks, and it can be overwhelming to try and pick the best stocks for you and your portfolio.
That's where the Style Scores come in.
You want to make sure you're buying stocks with the highest likelihood of success, and to do that, you'll need to pick stocks with a Zacks Rank #1 or #2 that also have Style Scores of A or B. If you like a stock that only as a #3 (Hold) rank, it should also have Scores of A or B to guarantee as much upside potential as possible.
As mentioned above, the Scores are designed to work with the Zacks Rank, so any change to a company's earnings outlook should be a deciding factor when picking which stocks to buy.
A stock with a #4 (Sell) or #5 (Strong Sell) rating, for instance, even one with Scores of A and B, will still have a declining earnings forecast, and a greater chance its share price will fall too.
Thus, the more stocks you own with a #1 or #2 Rank and Scores of A or B, the better.
Stock to Watch: CNX Resources Corporation. (CNX)
Founded in 1860, CNX Resources Corporation, an independent oil and gas exploration and production company formed after the separation of CONSOL’s, Exploration and Production (E&P) and Pennsylvania Mining Operations into two independent companies. The natural gas focused company retained the old ticker symbol while the coal focused company retained the name of the old company. As of Dec 31, 2020, the company had 9.55 trillion cubic feet equivalent of proved natural gas reserves up 13% year over year.
CNX is a #3 (Hold) on the Zacks Rank, with a VGM Score of A.
It also boasts a Value Style Score of A thanks to attractive valuation metrics like a forward P/E ratio of 11.24; value investors should take notice.
Two analysts revised their earnings estimate higher in the last 60 days for fiscal 2021, while the Zacks Consensus Estimate has increased $0.02 to $1.11 per share. CNX also boasts an average earnings surprise of 119.6%.
With a solid Zacks Rank and top-tier Value and VGM Style Scores, CNX should be on investors' short list.
Want the latest recommendations from Zacks Investment Research? Today, you can download 7 Best Stocks for the Next 30 Days. Click to get this free report
CNX Resources Corporation. (CNX) : Free Stock Analysis Report
To read this article on Zacks.com click here.
Vale S.A.’s VALE iron ore production for the second quarter of 2021 was 75.7 million tons (Mt), which came in 12% higher than the year-ago quarter and 11.3% higher than the first quarter of 2021. The company’s 2021 iron ore production guidance of 315-335 million tons remains unchanged, but the nickel and copper outlook are under review, as labor stoppages at the Sudbury mine in Ontario and a flood at Voisey's Bay in Labrador hurt output.
The sequential improvement in iron ore production in the quarter was aided by higher volumes from Brucutu, improvement of weather-related conditions in Serra Norte and a strong performance in Serra Leste. Increased productivity in Itabira Complex, higher third-party purchase and wet processing production in Fábrica during the tests to resume beneficiation plant operations contributed to the improvement as well. These gains were partially offset by the interferences caused by the installation and commissioning of the first of four jaspilite crushers in S11D.
Vale’s pellet production was up 13.3% year over year and 27.4% sequentially to 8 Mt in the second quarter. Second-quarter sales volume of iron ore fines and pellets was 74.9 Mt, up 22% year on year and 14% from the first quarter of 2021.
Production of nickel declined 15.3% year over year to 41.5 kt in the June-ended quarter. Compared to the first quarter of 2021, nickel production was down 14.3% due to labor disruption at Sudbury and unscheduled maintenance in Clydach Nickel Refinery. Copper production was 73.5 kt in the quarter, down 13% year over year and 4% down from the first quarter of 2021. The drop in production was due to labor disruption in Sudbury and delays in mining at Voisey’s Bay, partially mitigated by a more robust performance in Salobo owing to the ramp-up of mine maintenance activities and better performance at Sossego operations.
Cobalt production reached 754 metric tons in the quarter, up 34.2% from the prior-year quarter and up 6% from the first quarter of 2021. Manganese ore production totaled 113 kt in the April-June period, 24.2% lower than the prior-year quarter due to adjustments in the mining plan to ensure the safety and sustainability of underground operations at the Urucum mine. On a year-over-year basis, production was up 24.2% primarily due to the end of the rainy season and improved performance at the beneficiation plant in Morro da Mina.
Coal production was 2.1 Mt in the second quarter, up 63% from the prior-year quarter and 92% higher than the year-ago quarter. This was mainly due to improved productivity after the major plant revamp concluded last quarter. The revamp removed important bottlenecks in the processing plants by increasing equipment availability and productivity. Gold production was down 15.8% year over year to 96,000 troy ounces in second-quarter 2021. Compared to the first quarter, gold production was up 11.6%.
Among other developments, Vale has resumed loading activities at ship loader 6 at the Ponta da Madeira Maritime Terminal, in São Luís, Maranhão, after five months of maintenance due to a fire in the equipment. The maintenance of ship loader 6, which involved the substitution of over 60% of its components, did not impact Ponta da Madeira Maritime Terminal’s monthly iron ore shipment schedule for the year.
Vale’s iron ore production guidance for 2021 remains at 315 to 335 Mt. The company stated that it has achieved a production capacity of 330 Mtpy. If sustained, this would allow for an average of 1 Mt per day production in the second half of 2021, due to better weather conditions in the period. Citing uncertainties concerning the labor situation in Ontario, and the ramp-up of the safety and maintenance process implementation in Sossego and Salobo, the company has placed the guidance for nickel and copper for the year under review.
The company’s efforts to improve productivity, introducing more high-quality ore in the market and cutting costs will drive margins. Investment in growth projects and efforts to lower debt will aid growth. Vale will also gain on the rally in iron ore prices this year. Iron ore prices have gained around 40% so far this year and are currently trending at around $220 per ton, fueled by high demand from China amid concerns over supply from the major iron producers. While Vale’s production in the second quarter has improved year on year, it lagged expectations of 78 Mt.
Last week, Rio Tinto plc RIO reported a 9% drop in second-quarter iron ore production to 75.9 Mt due to above average rainfall in the West Pilbara, shutdowns to enable replacement mines to be tied in, processing plant availability and cultural heritage management. Iron ore shipments in the second quarter of 2021 declined 12% year over year to 76.3 Mt. Due to this underperformance, Rio Tinto now expects to ship near the lower end of its range of its previous guidance of 325 Mt to 340 Mt in 2021.
BHP Group’s BHP iron ore production was down 2% year over year to 65.2 Mt in the April-June quarter. On a sequential basis, production improved 9% primarily due to improved performance at Western Australia Iron Ore (WAIO). The company anticipates producing between 249-259 Mt of iron ore in fiscal 2022.
Price Performance

Image Source: Zacks Investment Research
Shares of Vale have surged 86.3% in a year compared with the industry’s rally of 92.7%.
Zacks Rank & Another Stock to Consider
Vale currently carries a Zacks Rank #2 (Buy). You can see the complete list of today’s Zacks #1 Rank (Strong Buy) stocks here.
Another top-ranked stock in the basic materials space is FreeportMcMoRan Inc. FCX. FreeportMcMoRan has a projected earnings growth rate of 475% for the current fiscal year. The company’s shares have soared 142% in the past year.
Want the latest recommendations from Zacks Investment Research? Today, you can download 7 Best Stocks for the Next 30 Days. Click to get this free report
VALE S.A. (VALE) : Free Stock Analysis Report
FreeportMcMoRan Inc. (FCX) : Free Stock Analysis Report
BHP Group Limited Sponsored ADR (BHP) : Free Stock Analysis Report
Rio Tinto PLC (RIO) : Free Stock Analysis Report
To read this article on Zacks.com click here.
WINNEMUCCA, Nev., July 20, 2021 (GLOBE NEWSWIRE) — Paramount Gold Nevada Corp. (NYSE American: PZG) ("Paramount” or “the Company”) announced today that the Malheur County Planning Commission has granted a two year extension through to May 2023 on the Conditional Use Permit (“CUP”) for the proposed Grassy Mountain underground mine (“Grassy Mountain”) located in eastern Oregon.
The Malheur County Planning Commission concluded that the request for an extension of the CUP satisfied all County requirements and was thereby approved.
The CUP from the county is required to start building the Grassy Mountain mine, and along with the Federal permit from the Bureau of Land Management (“BLM”) and the state level permit from the Oregon Department of Geology and Mineral Industries (“DOGAMI”), represent the three principal permits required to build the Grassy Mountain Mine.
During the initial CUP hearing, Paramount Officers and the County Commissioners received ample support for the project from the community given the numerous jobs that will be created and the significant capital that will be invested in a historically under-developed part of the state.
Paramount CEO, Rachel Goldman, commented: “We are encouraged by the ongoing support from Malheur County and the broader community as we continue in our efforts to advance Grassy Mountain into production, and we look forward to building a modern mine that will benefit all of our stakeholders.”
To stay informed of future press releases, subscribe to our E-Alerts Program and to learn more about our projects visit the projects section of our website.
About Paramount Gold Nevada Corp.
Paramount Gold Nevada Corp. is a U.S. based precious metals exploration and development company. Paramount’s strategy is to create shareholder value through exploring and developing its mineral properties and to realize this value for its shareholders in three ways: by selling its assets to established producers; entering joint ventures with producers for construction and operation; or constructing and operating mines for its own account.
Paramount owns 100% of the Grassy Mountain Gold Project which consists of approximately 8,200 acres located on private and BLM land in Malheur County, Oregon. The Grassy Mountain Gold Project contains a gold-silver deposit (100% located on private land) for which results of a positive Feasibility Study have been released and key permitting milestones accomplished.
Paramount owns a 100% interest in the Sleeper Gold Project located in Northern Nevada, the world’s premier mining jurisdiction. The Sleeper Gold Project, which includes the former producing Sleeper mine, totals 2,322 unpatented mining claims (approximately 60 square miles or 15,500 hectares). The Sleeper gold project is host to a large gold deposit (over 4 million ounces of mineralized material) and the Company has completed and released a positive Preliminary Economic Assessment. With higher gold prices, Paramount has begun work to update and improve the economics of the Sleeper project.
Safe Harbor for Forward-Looking Statements
This release and related documents may include "forward-looking statements" and “forward-looking information” (collectively, “forward-looking statements”) pursuant to applicable United States and Canadian securities laws. Paramount’s future expectations, beliefs, goals, plans or prospects constitute forward-looking statements within the meaning of the United States Private Securities Litigation Reform Act of 1995 and other applicable securities laws. Words such as "believes," "plans," "anticipates," "expects," "estimates" and similar expressions are intended to identify forward-looking statements, although these words may not be present in all forward-looking statements. Forward-looking statements included in this news release include, without limitation, statements with respect to the use of proceeds from the Offerings. Forward-looking statements are based on the reasonable assumptions, estimates, analyses and opinions of management made in light of its experience and its perception of trends, current conditions and expected developments, as well as other factors that management believes to be relevant and reasonable in the circumstances at the date that such statements are made, but which may prove to be incorrect. Management believes that the assumptions and expectations reflected in such forward-looking statements are reasonable. Assumptions have been made regarding, among other things: the conclusions made in the feasibility study for the Grassy Mountain Gold Project (the “FS”); the quantity and grade of resources included in resource estimates; the accuracy and achievability of projections included in the FS; Paramount’s ability to carry on exploration and development activities, including construction; the timely receipt of required approvals and permits; the price of silver, gold and other metals; prices for key mining supplies, including labor costs and consumables, remaining consistent with current expectations; work meeting expectations and being consistent with estimates and plant, equipment and processes operating as anticipated. There are a number of important factors that could cause actual results or events to differ materially from those indicated by such forward-looking statements, including, but not limited to: uncertainties involving interpretation of drilling results; environmental matters; the ability to obtain required permitting; equipment breakdown or disruptions; additional financing requirements; the completion of a definitive feasibility study for the Grassy Mountain Gold Project; discrepancies between actual and estimated mineral reserves and mineral resources, between actual and estimated development and operating costs and between estimated and actual production; the global epidemics, pandemics, or other public health crises, including the novel coronavirus (COVID-19) global health pandemic, and the spread of other viruses or pathogens and the other factors described in Paramount’s disclosures as filed with the SEC and the Ontario, British Columbia and Alberta Securities Commissions.
Except as required by applicable law, Paramount disclaims any intention or obligation to update any forward-looking statements as a result of developments occurring after the date of this document.
Paramount Gold Nevada Corp.
Rachel Goldman, Chief Executive Officer
Christos Theodossiou, Director of Corporate Communications
866-481-2233
Twitter: @ParamountNV
Many prominent investors, including Warren Buffett, David Tepper and Stan Druckenmiller, have been cautious regarding the current bull market and missed out as the stock market reached another high in recent weeks. On the other hand, technology hedge funds weren't timid and registered double digit market beating gains. Financials, energy and industrial stocks initially suffered the most but many of these stocks delivered strong returns since November and hedge funds actually increased their positions in these stocks. In this article we will find out how hedge fund sentiment towards CNX Resources Corporation (NYSE:CNX) changed recently.
Is CNX Resources Corporation (NYSE:CNX) a superb investment today? Prominent investors were cutting their exposure. The number of bullish hedge fund bets retreated by 2 recently. CNX Resources Corporation (NYSE:CNX) was in 23 hedge funds' portfolios at the end of the first quarter of 2021. The all time high for this statistic is 38. Our calculations also showed that CNX isn't among the 30 most popular stocks among hedge funds (click for Q1 rankings). There were 25 hedge funds in our database with CNX holdings at the end of December.
Why do we pay any attention at all to hedge fund sentiment? Our research has shown that a select group of hedge fund holdings outperformed the S&P 500 ETFs by 115 percentage points since March 2017 (see the details here). That's why we believe hedge fund sentiment is an extremely useful indicator that investors should pay attention to.

Joel Greenblatt of Gotham Asset Management
At Insider Monkey, we scour multiple sources to uncover the next great investment idea. For example, Chuck Schumer recently stated that marijuana legalization will be a Senate priority. So, we are checking out this under the radar stock that will benefit from this. We go through lists like the 10 best battery stocks to pick the next Tesla that will deliver a 10x return. Even though we recommend positions in only a tiny fraction of the companies we analyze, we check out as many stocks as we can. We read hedge fund investor letters and listen to stock pitches at hedge fund conferences. You can subscribe to our free daily newsletter on our homepage. Now we're going to take a gander at the key hedge fund action encompassing CNX Resources Corporation (NYSE:CNX).
Do Hedge Funds Think CNX Is A Good Stock To Buy Now?
Heading into the second quarter of 2021, a total of 23 of the hedge funds tracked by Insider Monkey were long this stock, a change of -8% from the fourth quarter of 2020. On the other hand, there were a total of 24 hedge funds with a bullish position in CNX a year ago. With the smart money's positions undergoing their usual ebb and flow, there exists an "upper tier" of key hedge fund managers who were boosting their holdings considerably (or already accumulated large positions).

Among these funds, Southeastern Asset Management held the most valuable stake in CNX Resources Corporation (NYSE:CNX), which was worth $434.3 million at the end of the fourth quarter. On the second spot was Aequim Alternative Investments which amassed $29.2 million worth of shares. Arrowstreet Capital, D E Shaw, and AQR Capital Management were also very fond of the stock, becoming one of the largest hedge fund holders of the company. In terms of the portfolio weights assigned to each position Southeastern Asset Management allocated the biggest weight to CNX Resources Corporation (NYSE:CNX), around 9.29% of its 13F portfolio. Quaker Capital Investments is also relatively very bullish on the stock, setting aside 4.43 percent of its 13F equity portfolio to CNX.
Because CNX Resources Corporation (NYSE:CNX) has faced a decline in interest from the aggregate hedge fund industry, it's safe to say that there lies a certain "tier" of money managers that elected to cut their positions entirely in the first quarter. Intriguingly, Ken Griffin's Citadel Investment Group sold off the largest investment of the 750 funds watched by Insider Monkey, worth an estimated $21.9 million in stock, and Matt Smith's Deep Basin Capital was right behind this move, as the fund dumped about $14.1 million worth. These bearish behaviors are interesting, as total hedge fund interest fell by 2 funds in the first quarter.
Let's now take a look at hedge fund activity in other stocks similar to CNX Resources Corporation (NYSE:CNX). These stocks are Arvinas, Inc. (NASDAQ:ARVN), Brinker International, Inc. (NYSE:EAT), Assured Guaranty Ltd. (NYSE:AGO), Shutterstock Inc (NYSE:SSTK), Revolve Group, Inc. (NYSE:RVLV), Vertex, Inc. (NASDAQ:VERX), and Butterfly Network, Inc. (NYSE:BFLY). This group of stocks' market valuations are similar to CNX's market valuation.
[table] Ticker, No of HFs with positions, Total Value of HF Positions (x1000), Change in HF Position ARVN,28,365585,-6 EAT,31,475033,3 AGO,22,192881,5 SSTK,18,207880,-5 RVLV,29,256608,5 VERX,11,40913,0 BFLY,32,299537,32 Average,24.4,262634,4.9 [/table]
View table here if you experience formatting issues.
As you can see these stocks had an average of 24.4 hedge funds with bullish positions and the average amount invested in these stocks was $263 million. That figure was $607 million in CNX's case. Butterfly Network, Inc. (NYSE:BFLY) is the most popular stock in this table. On the other hand Vertex, Inc. (NASDAQ:VERX) is the least popular one with only 11 bullish hedge fund positions. CNX Resources Corporation (NYSE:CNX) is not the least popular stock in this group but hedge fund interest is still below average. Our overall hedge fund sentiment score for CNX is 49.7. Stocks with higher number of hedge fund positions relative to other stocks as well as relative to their historical range receive a higher sentiment score. This is a slightly negative signal and we'd rather spend our time researching stocks that hedge funds are piling on. Our calculations showed that top 5 most popular stocks among hedge funds returned 95.8% in 2019 and 2020, and outperformed the S&P 500 ETF (SPY) by 40 percentage points. These stocks gained 23.8% in 2021 through July 16th and surpassed the market again by 7.7 percentage points. Unfortunately CNX wasn't nearly as popular as these 5 stocks (hedge fund sentiment was quite bearish); CNX investors were disappointed as the stock returned -14.6% since the end of March (through 7/16) and underperformed the market. If you are interested in investing in large cap stocks with huge upside potential, you should check out the top 5 most popular stocks among hedge funds as most of these stocks already outperformed the market in 2021.
Get real-time email alerts: Follow Cnx Resources Corp (NYSE:CNX)
Suggested Articles:
Disclosure: None. This article was originally published at Insider Monkey.
BHP Group BHP released production details for the year ended Jun 30, 2021 and provided guidance for fiscal 2022. Total iron ore production rose 2% to 254 Mt (million tons) in fiscal 2021 courtesy of record production at Western Australia Iron Ore (WAIO). The company met production guidance for iron ore, copper, metallurgical coal, nickel and energy coal. Petroleum production for the 2021 financial year was slightly above guidance.
Production Highlights
In the April-June quarter, BHP’s iron ore production was down 2% year over year to 65.2 Mt. On a sequential basis, production, however, improved 9% primarily due to enhanced performance at WAIO. Brazilian miner, Vale S.A. VALE, reported its iron ore production for the second quarter of 2021 at 75.7 Mt, which came in 12% higher than the year-ago quarter and 11.3% higher than the first quarter of 2021. Last week, Rio Tinto plc RIO reported a 9% drop in second-quarter iron ore production to 75.9 Mt due to above average rainfall in the West Pilbara.
For the year ended Jun 30, 2021, BHP’s total iron ore production improved 2% year over year to a record 253.5 Mt, within the company’s provided guidance of 245 Mt to 255 Mt. WAIO production was up 1% to a record 252 Mt reflecting record production at Jimblebar and Mining Area C, which included first ore from South Flank in May 2021. This performance was impressive considering weather impact, temporary rail labor shortages due to COVID-19 related border restrictions and the planned Mining Area C and South Flank major tie-in activity. Strong operational performance across the supply chain reflected continued improvements in car dumper performance and reliability, and train cycle times.
Total petroleum production was 102.8 MMboe (million barrels of oil equivalent) for the period under review, down 6% year over year. Total copper production was down 5% year over year to 1,635.7 kt in fiscal 2020. Metallurgical coal production dipped 1% to 40.6 Mt, while energy coal production was 19.3 Mt, down 17% year over year. Nickel production was up 11% year over year to 89 kt.
Average realized prices for iron ore, copper and nickel in fiscal 2021 surged 69%, 52% and 17% respectively. Average realized prices for metallurgical coal declined 19%, while of thermal coal rose 2%. Average realized prices for oil (crude and condensate) and Natural gas were up 6% and 8%, respectively, while LNG prices slumped 22%.
Fiscal 2022 Production Guidance
In fiscal 2022, BHP expects to produce between 249 and 259 Mt of iron ore compared with 253.5 Mt produced in fiscal 2021 as WAIO continues to focus on incremental volume growth through productivity improvements. The company’s petroleum production guidance for fiscal 2022 is expected to be 99-106 MMboe. BHP anticipates copper production between 1,590 kt and 1,760 kt in fiscal 2022. Production guidance of Metallurgical coal for fiscal 2022 is at 39-44 Mt, while the same for energy coal is at 13-15 Mt. Nickel production for fiscal 2022 is now expected between 85 kt and 95 kt.
Development Projects on Track
During fiscal 2021, BHP successfully achieved first production at four major development projects, all of which were delivered either on or ahead of schedule and also within budget. The Atlantis Phase 3 petroleum project and the Spence Growth Option copper project achieved first production in the first half of the financial year. During the fiscal fourth quarter, the South Flank iron ore sustaining project in Western Australia, and the Ruby oil and gas project in Trinidad and Tobago achieved first production.
As of Jun 31, 2021, the company had two major projects under development in petroleum (Mad Dog Phase 2) and potash (Jansen mine shafts), with both of these on track. The Jansen Stage 1 project in Canada remains on track for a go or no-go decision in the next two months.
On 28 Jun, 2021, BHP announced that it had signed a Sale and Purchase Agreement with Glencore PLC GLNCY to divest its 33.3 per cent interest in Cerrejón, a non-operated energy coal joint venture in Colombia, for $294 million cash consideration. The transaction is expected to be completed in the second half of fiscal 2022.
BHP’s efforts to make operations more efficient through smart technology adoption across the entire value chain will continue to aid in reducing costs, thereby boosting margins. Focus on lowering debt will fuel growth.
Price Performance

Image Source: Zacks Investment Research
Over the last year, BHP’s shares have gained 35.7%, compared with the industry’s rally of 22.6%.
Zacks Rank
BHP currently carries a Zacks Rank #2 (Buy). You can see the complete list of today’s Zacks #1 Rank (Strong Buy) stocks here.
Want the latest recommendations from Zacks Investment Research? Today, you can download 7 Best Stocks for the Next 30 Days. Click to get this free report
BHP Group Limited Sponsored ADR (BHP) : Free Stock Analysis Report
VALE S.A. (VALE) : Free Stock Analysis Report
Rio Tinto PLC (RIO) : Free Stock Analysis Report
Glencore PLC (GLNCY) : Free Stock Analysis Report
To read this article on Zacks.com click here.
SUDBURY, ON / ACCESSWIRE / July 20, 2021 / Northern Superior Resources ("NorthernSuperior" or the "Company") (TSXV:SUP)(OCTQB:NSUPF) is pleased to announce that it has initiated plans to define the northern and eastern extension of the gold "footprint" associated with the NI 43-101 compliant (640,000 ounce at 1.7 g/t gold inferred) CBSZ gold deposit on its large (30km by 15km, 12,545 hectare), 100% owned Croteau Est gold property, Quebec.
The Company will test the northern and eastern extension potential of the CBSZ with a 2,530m, 220-hole reverse circulation (RC) drill program, scheduled to commence in August. The CBSZ gold deposit is currently defined from only 64 drill holes, 350m maximum depth over a 550m strike length, open at depth and open along strike both to the east and west. Within the CBSZ, gold is hosted in a 75-120m wide, east-west trending sericite-carbonate alteration zone and associated stockwork quartz veins.
In defining the original CBSZ discovery, several trenches exposing the CBSZ returned mineralized bedrock grab samples. Highlighted assays include (see Northern Superior press releases July 20, 2011, November 12, 2013):
-
15.0g/t Au;
-
52.8g/t Au;
-
68.7g/t Au; and
-
58.8g/t Au.
From these same trenches channel samples were also taken, highlighted assay values include (see Northern Superior press releases, October 12, 2011, July 5, 2017):
-
92.57g/t Au over 1m or 12.8g/t Au over 7.8m;
-
14.37g/t Au over 7.5m; and
-
8.49g/t Au over 5.7m.
Gold within the CBSZ is associated with at least 9 high grade gold shoots. Highlighted intersections reported include (see Northern Superior press release November 13, 2017, January 10, 2018):
-
High grade widths of up to 11.06 g/t Au over 9.10m (including 43.75 g/t Au over 2.00m),
-
61.24 g/t Au over 5.95 m(including 705 g/t Au over 0.5 m)
-
High grade mineralization occurring >400 m vertical depth: 7.50 g/t Au over 7.95m (including 56.40 g/t Au over 1.00m) between 489.90m to 497.85m; and
-
Wide mineralized widths of up to 1.99 g/t Au over 34.65m (including 9.46 g/t Au over 2.35m).
All 9 high grade gold shoots are of mineable width and grade, dip to the east and are contiguous, as evidenced by the 96% hit rate experienced in the Company's 2017 core drill program (see Northern Superior Corporate Presentation, www.nsuperior.com). The mineralization was proven to extend directly to surface by projecting the shoots to surface and exposing it. This shoot consisted of two zones of >10g/t Au, 2.5m x 2.0 m and 2.0m x 0.5m, enclosed by a halo of >5g/t Au, 7.0m x 2.5m in turn enclosed by a halo of gold mineralization of >3g/t Au over an area of 8.0m x 3.0m (see Northern Superior press release, November 3, 2014).
Dr. T.F. Morris, President and CEO states: "The CBSZ is a gold deposit consisting of high-grade gold material, existing within a large alteration system open at depth and strike to the east and west. The potential extension of the high-grade shoots at depth remains a compelling target with a supportive geological model as witnessed by our 96 percent success rate with our Phase II 2017 drill program.
However, the Company has evidence that the CBSZ gold footprint extends farther north (at least by 600m) and along strike both east and west beyond what is currently defined, encompassing the tuffaceous sediments and the Croteau North Shear Zone (CNSZ) that are aligned parallel to the CBSZ (Figure 1). This evidence is derived from overburden sampling programs, trenching and core drilling. The same programs also included the CBSZ, thus providing a direct comparison of the various heavy mineral and geochemical signatures between the two data sets.
As such, before launching into a core drill program specific to testing the CBSZ at depth, the Company has designed an RC program to test the viability of a broader gold target north and east of the of the CBSZ (Figure 1)."
"It is important to note that the Croteau Est property is a large 30km by 15km land package and despite having a 640,000 oz 1.7g/t gold inferred resource on a very small portion of its land package, the remainder of this property remains largely under explored. With success from this RC program we see potential to step out further onto our numerous regional targets on the property (see Figure 2)."
The RC Program
The RC program is designed to address three primary issues, the answers to which are necessary in determining the potential economic viability of a larger gold footprint north and east of the CBSZ. These include:
-
Accurately determine the distribution and lithogeochemistry of the three primary lithological units (CBSZ, CNSZ and intervening tuffaceous sediments);
-
Determining if the package of primary lithological units should be considered as an economic target as opposed to just the CBSZ; and
-
Determining the extension of these three units past the Croteau Fault and how both the Croteau Fault and Croteau Deformation Zone may play a role in gold mineralization within this system.
To achieve these goals, the RC program will cover a rectangular area 600m by 1km (Figure 1) consisting of a 50 x 100m spaced grid of approximately 200 RC holes. Each hole will penetrate into the bedrock surface 1.5m. The lower basal till (overburden material lying directly over bedrock) and bedrock chips will be collected. The basal till will be processed for gold grains and geochemical analysis. The lithology and geochemistry of the bedrock chips will be determined.
The area to be drilled includes both the CBSZ and CNSZ and the intervening area of tuffaceous sediments. Also captured is the projected northeast extension of quartz porphyry dykes thought critical to high grade gold mineralization associated with the CBSZ mineral resource. In addition, sections of the Croteau Fault and Croteau Deformation Zone occur within the eastern side of the RC test area (Figure 1).
Within the area to be drilled are anomalous gold grain-in-till, (Figure 3), mobile metal ion (Figure 4) and soil gas hydrocarbon signatures (Figure 5). The size and intensity of these anomalous values will be tested from the results of this program, important in defining specific target areas within the system.
* Reference for Northern Superior's 640,000 ounce Inferred Gold Resource: "Drabble, Mark (B. App. Sci. (Geology), MAIG, MAusIMM); Glacken, Ian (BSc Hons (Geology), FAusIMM (CP), MIMMM, CEng; Kahan, Cervoj (B. App. Sci., MAIG, MAusIMM); Morgan, Rebecca (BSc Hons (Geology), GDip (Mining), MAIG, MAusIMM). October 12, 2015. Technical Report on the Croteau Est Gold Project, Québec September 2015, Mineral Resource Estimate."
Qualified Person
T.F. Morris (PhD, P.Geo., FGAC, ICD.D) is a Qualified Person ("QP") within the meaning of National Instrument 43-101. Dr. Morris has reviewed, and approved information disclosed in this press release.
About Northern Superior Resources Inc.
The Croteau Est gold property is one of three key mineral properties 100% owned by Northern Superior. The Company's two other properties (TPK and Lac Surprise) also represent regional scale exploration opportunities (see Northern Superior Corporate Presentation, www.nsuperior.com).
Northern Superior is a reporting issuer in British Columbia, Alberta, Ontario and Québec, and trades on the TSX Venture Exchange under the symbol SUP, and the OTCQB Venture Market under the symbol NSUPF.
For Further Information
Please refer to Northern Superior news available on the Company's website (www.nsuperior.com) and on SEDAR (www.sedar.com) or contact:
Thomas F. Morris PhD., P.Geo., FGAC , ICD.D
President and CEO
Tel: (705) 525 ‐0992
Fax: (705) 525 ‐7701
e‐mail: info@nsuperior.com
Cautionary Note Regarding Forward-Looking Statements
This Press Release contains forward-looking statements that involve risks and uncertainties, which may cause actual results to differ materially from the statements made. When used in this document, the words "may", "would", "could", "will", "intend", "plan", "anticipate", "believe", "estimate", "expect" and similar expressions are intended to identify forward-looking statements. Such statements reflect our current views with respect to future events and are subject to such risks and uncertainties. Many factors could cause our actual results to differ materially from the statements made, including those factors discussed in filings made by us with the Canadian securities regulatory authorities. Should one or more of these risks and uncertainties, such actual results of current exploration programs, the general risks associated with the mining industry, the price of gold and other metals, currency and interest rate fluctuations, increased competition and general economic and market factors, occur or should assumptions underlying the forward looking statements prove incorrect, actual results may vary materially from those described herein as intended, planned, anticipated, or expected. We do not intend and do not assume any obligation to update these forward-looking statements, except as required by law. Shareholders are cautioned not to put undue reliance on such forward-looking statements.
Neither the TSX Venture Exchange nor its Regulation Services Provider (as that term is defined in the policies of the TSX Venture Exchange) accepts responsibility for the adequacy or accuracy of this release.

Figure 1. Location of the RC grid, defined by the red rectangle 600m north-south by 1km east-west. The drill area captures several key lithological and structural units including the CBSZ and CNSZ and intervening tuffaceous units plus quartz-feldspar porphyry dykes (QFP), the Croteau Fault and Deformation Zone. See text for details.


Figure 2. The CBSZ 43-101 compliant resource occurs at the intersection of the east to west oriented Croteau Bouchard Shear Zone and the northeast to southwest oriented Croteau Fault. There are at least 11 other such opportunities that occur on the Croteau Est property where east-west oriented shear zones are cross-cut by northeast to southwest faults. Gold showings at several of these intersections including Trench 101, Area # 5 and Croteau South emphasize this opportunity.

Figure 3. Gold grain-in-till anomalies derived from surface overburden sampling and basal tills sampled From RC programs. A basal till sample collected immediately down-ice from an exposed high grade shoot yielded 877 gold grains, 844 of which were pristine grains (96%) indicating very close proximity to source. The RC basal till associated with RC hole CRO15-186 yielded 244 gold grains, 172 of which were pristine (70%). This on its own is a very compelling target as the background value for gold grains in this area is close to 1.

Figure 4. Mobile metal ion gold signature (MMI: areas of red). Note the strong MMI anomaly associated with the CBSZ where the QFP dykes occur. This makes the large red MMI anomaly in the northwest part of the RC grid particularly compelling.

Figure 5. Soil gas hydrocarbon gold anomalies (SGH: areas of dark red). Interestingly, the CBSZ does not have a significantly large SGH signature. However, the RC grid contains several very large and strong SGH signatures.
SOURCE: Northern Superior Resources Inc.
View source version on accesswire.com:
https://www.accesswire.com/656136/Northern-Superior-to-Test-Expansion-of-CBSZ-43-101-Compliant-640000-Ounces-Gold-17gt-Gold-Gold-Resource-Croteau-Est-Property-Chapais-Chibougamou-Gold-Camp
Symbol: AZM.TSX Venture
4.21 g/t Au over 39.5 m including 7.86 g/t Au over 14.0 m
3.28 g/t Au over 39.3 m including 9.57 g/t Au over 6.0 m
LONGUEUIL, QC, July 20, 2021 /CNW Telbec/ – Azimut Exploration Inc. ("Azimut" or the "Company") (TSXV: AZM) is pleased to report that it continues to intersect wide, high-grade gold intervals at the Patwon discovery on the Company's 100% owned Elmer Property (the "Property") in the James Bay region of Quebec.
Azimut recently completed a 15,135-metre (67 holes) diamond drilling program. This press release presents the results of (2) holes (813 m) from the program. The results for thirteen (13) other holes totalling 3,856.5 metres were previously reported (see press releases dated May 19 and June 22, 2021), and assay results are pending for the remaining 52 drill holes (15 on Patwon and 37 on new targets) (see press release dated June 2, 2021).
A comprehensive till survey and prospecting phase is underway on the Property. A new 20,000-metre drilling program is being prepared. An overview of the Company's drilling objectives will be provided once the program is finalized.
HIGHLIGHTS (Figures 1 to 8, Photos 1 to 5, Tables 1 to 4)
-
Hole ELM21-092 4.21 g/t Au over 39.5 m
-
Hole ELM21-100 3.28 g/t Au over 39.35 m (from 173.0 m to 212.35 m), including:
-
These new results continue to build a robust mineralized zone, including an impressive central core. This core zone tends to be wider with increasing depths, as suggested by the updated grade x thickness longitudinal section and cross-section L150E (Figures 5 and 8).
-
The mineralized body is currently defined over a strike length of 500 metres and a minimum depth of 450 metres, where the mineralized system remains open with a possible gold grade increase with depth. The average estimated true width is about 35 metres based on previously released results from 44 drill holes. True widths can reach up to 80 metres.
-
The central core extends from surface to a minimum depth of 450 metres, with an estimated true width of 50 metres and a grade x thickness factor ranging from 50 to 412 (based on true widths). This core zone correlates spatially with a vertically dipping felsic intrusion, indicating an excellent possibility for a kilometre-scale vertical extent of the Patwon zone. The core zone seems to widen to the west with depth.
-
Delineation drilling to expand the Patwon zone has been conducted on systematic 50-metre centres. No infill drilling has been undertaken at this stage. Figures 6 to 8 illustrate the progress accomplished since the 996-metre (7 holes) maiden drilling program reported in January 2020.
The Elmer Property comprises 515 claims covering 271.3 km2 over a 35-kilometre strike length. The Property is 285 kilometres north of the town of Matagami, 60 kilometres east of the village of Eastmain, and 5 kilometres west of the paved James Bay Road, a major all-season highway. The region benefits from quality infrastructure, including significant road access, a hydroelectric power grid and airports.
Drilling Contract and Analytical Protocols
The drilling contract was awarded to RJLL Drilling Inc. of Rouyn-Noranda, Quebec. The core diameter is NQ. Core samples are sent to AGAT Laboratories of Mississauga, Ontario. Gold is analyzed by fire assay, with atomic absorption and gravimetric finish for grades above 3.0 g/t Au. Samples are also analyzed for a 48-element suite using ICP. Azimut applies industry-standard QA/QC procedures to the program. Certified reference materials, blanks and field duplicates are included in all drill core batches sent to the laboratory.
Dr. Jean-Marc Lulin, P.Geo., prepared this press release as Azimut's Qualified Person under National Instrument 43-101. The program is managed by François Bissonnette, P.Geo., Operations Manager and Simon Houle, P.Geo., Chief Geologist. Both have reviewed the content of this press release.
About Azimut
Azimut is a mineral exploration company whose core business centres on target generation and partnership development. The Company is actively advancing the Patwon gold discovery on its 100%-owned flagship Elmer Property in the James Bay region.
The Company uses a pioneering approach to big data analytics (the proprietary AZtechMineTM expert system), enhanced by extensive exploration know-how. Azimut maintains rigorous financial discipline, a strong balance sheet and has 81.7 million shares issued and outstanding. Azimut's competitive edge against exploration risk is based on systematic regional-scale data analysis and multiple concurrently active projects.
Cautionary note regarding forward-looking statements
This press release contains forward-looking statements, which reflect the Company's current expectations regarding future events related to the drilling results at the Elmer Property. To the extent that any statements in this press release contain information that is not historical, the statements are essentially forward-looking and are often identified by words such as "consider", "anticipate", "expect", "estimate", "intend", "project", "plan", "potential", "suggest" and "believe". The forward-looking statements involve risks, uncertainties, and other factors that could cause actual results to differ materially from those expressed or implied by such forward-looking statements. There are many factors that could cause such differences, particularly volatility and sensitivity to market metal prices, impact of change in foreign currency exchange rates and interest rates, imprecision in reserve estimates, recoveries of gold and other metals, environmental risks including increased regulatory burdens, unexpected geological conditions, adverse mining conditions, community and non-governmental organization actions, changes in government regulations and policies, including laws and policies, global outbreaks of infectious diseases, including COVID-19, and failure to obtain necessary permits and approvals from government authorities, as well as other development and operating risks. Although the Company believes that the assumptions inherent in the forward-looking statements are reasonable, undue reliance should not be placed on these statements, which only apply as of the date of this document. The Company disclaims any intention or obligation to update or revise any forward-looking statement, whether as a result of new information, future events or otherwise, other than as required to do so by applicable securities laws. The reader is directed to carefully review the detailed risk discussion in our most recent Annual Report filed on SEDAR for a fuller understanding of the risks and uncertainties that affect the Company's business.
Neither TSX Venture Exchange nor its Regulation Services Provider (as that term is defined in the policies of the TSX Venture Exchange) accepts responsibility for the adequacy or accuracy of this release
Table 1 – Key Data on the Patwon Gold Zone, Elmer Property
Eeyou-Istchee James Bay region, Quebec
1) Discovery Milestones
-
2018: Acquisition of the Property through map designation, initial field visit and preliminary assessment (October)
-
2019: Prospecting, channel sampling, maiden drilling program (996 m, 7 holes)
-
2020: Second drilling program (10,515 m, 55 holes)
-
2021: Third drilling program (15,135.5 m, 67 holes)
2) Geological Context
-
Archean La Grande Subprovince
-
Patwon gold zone, 10 km north of Opinaca Subprovince boundary
-
Lower Eastmain greenstone belt with extensive shear zones
-
3-km-thick sequence of felsic volcanics
-
Porphyritic intrusions, mafic volcanics, gabbroic sills, polymictic conglomerates
3) Mineralization
-
Three mineralized quartz vein networks: subparallel to schistosity, subhorizontal and extensional veins
-
Adjacent wall rocks to the quartz veins usually mineralized
-
Pyrite: fine to coarse, disseminated, stringers, semi-massive to massive lenses
-
Frequent visible gold grains
-
Gold-bearing intervals generally show well-distributed values along core
4) Alteration
-
Pervasive silica
-
Sericite, carbonate, chlorite, feldspar, tourmaline
5) Geometry
-
NW-SE mineralized envelope subparallel to schistosity, dipping 70° to 75° to the north
-
Strike length of 500 metres
-
Minimum depth of 450 metres
-
Average estimated true width of 35 metres; true widths can reach up to 80 metres.
-
Consistent, predictable, wide mineralized zone (no internal complexity due to isoclinal folding or crosscutting barren dykes potentially creating internal dilution)
6) Metallurgy
-
Initial tests indicate excellent potential gold recoveries through gravity and cyanide leaching
-
Gold-only system with no deleterious elements like arsenic or bismuth
-
Additional tests in progress
7) Deposit Type and Controls
-
Shear-related orogenic gold-bearing system
-
Intensity of quartz veining may be partly controlled by rheologic contrasts between host lithologies (felsic intrusives, felsic volcanics and mafic rocks) within an extensive shear zone
8) Drilling Strategy and Next Step
-
Patwon gold zone situated on firm ground (no lakes in the vicinity), drillable year-round
-
Delineation drilling to expand the gold zone using systematic 50-metre to 100-metre centres
-
Preliminary design of the next drilling phase comprises 20,000 metres:
9) Additional Data
-
Elmer Drilling Data (locations and composites)
SOURCE Azimut Exploration Inc.

View original content: http://www.newswire.ca/en/releases/archive/July2021/20/c4116.html
Southern Copper (SCCO) is expected to deliver a year-over-year increase in earnings on higher revenues when it reports results for the quarter ended June 2021. This widely-known consensus outlook gives a good sense of the company's earnings picture, but how the actual results compare to these estimates is a powerful factor that could impact its near-term stock price.
The earnings report might help the stock move higher if these key numbers are better than expectations. On the other hand, if they miss, the stock may move lower.
While management's discussion of business conditions on the earnings call will mostly determine the sustainability of the immediate price change and future earnings expectations, it's worth having a handicapping insight into the odds of a positive EPS surprise.
Zacks Consensus Estimate
This miner is expected to post quarterly earnings of $1.09 per share in its upcoming report, which represents a year-over-year change of +220.6%.
Revenues are expected to be $2.55 billion, up 42.6% from the year-ago quarter.
Estimate Revisions Trend
The consensus EPS estimate for the quarter has been revised 2.07% higher over the last 30 days to the current level. This is essentially a reflection of how the covering analysts have collectively reassessed their initial estimates over this period.
Investors should keep in mind that the direction of estimate revisions by each of the covering analysts may not always get reflected in the aggregate change.
Price, Consensus and EPS Surprise

Earnings Whisper
Estimate revisions ahead of a company's earnings release offer clues to the business conditions for the period whose results are coming out. Our proprietary surprise prediction model — the Zacks Earnings ESP (Expected Surprise Prediction) — has this insight at its core.
The Zacks Earnings ESP compares the Most Accurate Estimate to the Zacks Consensus Estimate for the quarter; the Most Accurate Estimate is a more recent version of the Zacks Consensus EPS estimate. The idea here is that analysts revising their estimates right before an earnings release have the latest information, which could potentially be more accurate than what they and others contributing to the consensus had predicted earlier.
Thus, a positive or negative Earnings ESP reading theoretically indicates the likely deviation of the actual earnings from the consensus estimate. However, the model's predictive power is significant for positive ESP readings only.
A positive Earnings ESP is a strong predictor of an earnings beat, particularly when combined with a Zacks Rank #1 (Strong Buy), 2 (Buy) or 3 (Hold). Our research shows that stocks with this combination produce a positive surprise nearly 70% of the time, and a solid Zacks Rank actually increases the predictive power of Earnings ESP.
Please note that a negative Earnings ESP reading is not indicative of an earnings miss. Our research shows that it is difficult to predict an earnings beat with any degree of confidence for stocks with negative Earnings ESP readings and/or Zacks Rank of 4 (Sell) or 5 (Strong Sell).
How Have the Numbers Shaped Up for Southern Copper?
For Southern Copper, the Most Accurate Estimate is lower than the Zacks Consensus Estimate, suggesting that analysts have recently become bearish on the company's earnings prospects. This has resulted in an Earnings ESP of -3.67%.
On the other hand, the stock currently carries a Zacks Rank of #3.
So, this combination makes it difficult to conclusively predict that Southern Copper will beat the consensus EPS estimate.
Does Earnings Surprise History Hold Any Clue?
While calculating estimates for a company's future earnings, analysts often consider to what extent it has been able to match past consensus estimates. So, it's worth taking a look at the surprise history for gauging its influence on the upcoming number.
For the last reported quarter, it was expected that Southern Copper would post earnings of $0.89 per share when it actually produced earnings of $0.99, delivering a surprise of +11.24%.
Over the last four quarters, the company has beaten consensus EPS estimates four times.
Bottom Line
An earnings beat or miss may not be the sole basis for a stock moving higher or lower. Many stocks end up losing ground despite an earnings beat due to other factors that disappoint investors. Similarly, unforeseen catalysts help a number of stocks gain despite an earnings miss.
That said, betting on stocks that are expected to beat earnings expectations does increase the odds of success. This is why it's worth checking a company's Earnings ESP and Zacks Rank ahead of its quarterly release. Make sure to utilize our Earnings ESP Filter to uncover the best stocks to buy or sell before they've reported.
Southern Copper doesn't appear a compelling earnings-beat candidate. However, investors should pay attention to other factors too for betting on this stock or staying away from it ahead of its earnings release.
Want the latest recommendations from Zacks Investment Research? Today, you can download 7 Best Stocks for the Next 30 Days. Click to get this free report
Southern Copper Corporation (SCCO) : Free Stock Analysis Report
To read this article on Zacks.com click here.
SAN DIEGO, July 20, 2021 /PRNewswire/ — Shareholder rights law firm Johnson Fistel, LLP is investigating potential violations of the federal securities laws by Piedmont Lithium Inc. ("Piedmont" or the "Company") (NASDAQ: PLL).
On July 20, 2021, Reuters reported that Piedmont hired investment banks to find investors for an $840 million project in Gaston County, North Carolina, including an open-air pit to produce lithium-based electric vehicle battery chemicals. According to the news release, the Company has not applied for a state mining permit or a required zoning variance in Gaston County, despite telling investors since 2018 that it was on the verge of doing so.
If you have information that could assist in this investigation, including past employees and others, or if you are a Piedmont shareholder and are interested in learning more about the investigation, please contact Jim Baker (jimb@johnsonfistel.com) by email or phone at 619-814-4471. If emailing, please include a phone number.
Additionally, you can [click here to join this action]. There is no cost or obligation to you.
About Johnson Fistel, LLP:
Johnson Fistel, LLP is a nationally recognized shareholder rights law firm with offices in California, New York and Georgia. The firm represents individual and institutional investors in shareholder derivative and securities class action lawsuits. For more information about the firm and its attorneys, please visit http://www.johnsonfistel.com. Attorney advertising. Past results do not guarantee future outcomes.
Contact:
Johnson Fistel, LLP
Jim Baker, 619-814-4471
jimb@johnsonfistel.com
[click here to join this action]

View original content:https://www.prnewswire.com/news-releases/pll-alert-johnson-fistel-investigates-piedmont-lithium-did-you-lose-money-on-your-investment-301337808.html
SOURCE Johnson Fistel, LLP
If you want to know who really controls Mandalay Resources Corporation (TSE:MND), then you'll have to look at the makeup of its share registry. Insiders often own a large chunk of younger, smaller, companies while huge companies tend to have institutions as shareholders. We also tend to see lower insider ownership in companies that were previously publicly owned.
Mandalay Resources is not a large company by global standards. It has a market capitalization of CA$258m, which means it wouldn't have the attention of many institutional investors. In the chart below, we can see that institutional investors have bought into the company. We can zoom in on the different ownership groups, to learn more about Mandalay Resources.
See our latest analysis for Mandalay Resources

What Does The Institutional Ownership Tell Us About Mandalay Resources?
Many institutions measure their performance against an index that approximates the local market. So they usually pay more attention to companies that are included in major indices.
We can see that Mandalay Resources does have institutional investors; and they hold a good portion of the company's stock. This implies the analysts working for those institutions have looked at the stock and they like it. But just like anyone else, they could be wrong. If multiple institutions change their view on a stock at the same time, you could see the share price drop fast. It's therefore worth looking at Mandalay Resources' earnings history below. Of course, the future is what really matters.

Our data indicates that hedge funds own 19% of Mandalay Resources. That's interesting, because hedge funds can be quite active and activist. Many look for medium term catalysts that will drive the share price higher. Looking at our data, we can see that the largest shareholder is Ruffer LLP with 19% of shares outstanding. In comparison, the second and third largest shareholders hold about 19% and 12% of the stock.
A more detailed study of the shareholder registry showed us that 3 of the top shareholders have a considerable amount of ownership in the company, via their 50% stake.
While studying institutional ownership for a company can add value to your research, it is also a good practice to research analyst recommendations to get a deeper understand of a stock's expected performance. There is some analyst coverage of the stock, but it could still become more well known, with time.
Insider Ownership Of Mandalay Resources
The definition of an insider can differ slightly between different countries, but members of the board of directors always count. Company management run the business, but the CEO will answer to the board, even if he or she is a member of it.
I generally consider insider ownership to be a good thing. However, on some occasions it makes it more difficult for other shareholders to hold the board accountable for decisions.
Our most recent data indicates that insiders own some shares in Mandalay Resources Corporation. As individuals, the insiders collectively own CA$3.6m worth of the CA$258m company. Some would say this shows alignment of interests between shareholders and the board. But it might be worth checking if those insiders have been selling.
General Public Ownership
With a 36% ownership, the general public have some degree of sway over Mandalay Resources. While this size of ownership may not be enough to sway a policy decision in their favour, they can still make a collective impact on company policies.
Private Equity Ownership
Private equity firms hold a 11% stake in Mandalay Resources. This suggests they can be influential in key policy decisions. Some might like this, because private equity are sometimes activists who hold management accountable. But other times, private equity is selling out, having taking the company public.
Next Steps:
It's always worth thinking about the different groups who own shares in a company. But to understand Mandalay Resources better, we need to consider many other factors. Take risks for example – Mandalay Resources has 1 warning sign we think you should be aware of.
But ultimately it is the future, not the past, that will determine how well the owners of this business will do. Therefore we think it advisable to take a look at this free report showing whether analysts are predicting a brighter future.
NB: Figures in this article are calculated using data from the last twelve months, which refer to the 12-month period ending on the last date of the month the financial statement is dated. This may not be consistent with full year annual report figures.
This article by Simply Wall St is general in nature. It does not constitute a recommendation to buy or sell any stock, and does not take account of your objectives, or your financial situation. We aim to bring you long-term focused analysis driven by fundamental data. Note that our analysis may not factor in the latest price-sensitive company announcements or qualitative material. Simply Wall St has no position in any stocks mentioned.
Have feedback on this article? Concerned about the content? Get in touch with us directly. Alternatively, email editorial-team (at) simplywallst.com.
Vancouver, British Columbia–(Newsfile Corp. – July 20, 2021) – Forum Energy Metals Corp. (TSXV: FMC) (OTCQB: FDCFF) ("Forum" or "the Company") is pleased to update shareholders with a mid-year review of the Company's current exploration activities and exploration plans for the remainder of 2021 on its copper, uranium, nickel, cobalt and palladium projects in Saskatchewan and Idaho (Figure 1).
Janice Lake Copper/Silver (Rio Tinto Option to Earn 80%)
Rio Tinto Exploration Canada ("RTEC") continues drilling at the 2.6 km Rafuse target, the fourth target drilled by RTEC over a six kilometre strike length. Four holes have been drilled to date following up on the nine hole drill program completed this winter and drilling will continue through the summer. Field crews have been mapping and sampling for the past month in the area of the 3.8% copper boulder discovered in 2020.
Love Lake Nickel/Copper/Palladium (100% Forum)
Forum has received results from the airborne electromagnetic survey announced May 10, 2021 over the Love Lake mafic/ultramafic complex. The Company is finalizing drill targets from the survey as well as targeting the surface copper/nickel/platinum/palladium showings. A 3,000 metre drill program is planned to commence in the first week of August.
Quartz Gulch Cobalt/Copper (100% Forum)
Forum plans a prospecting, mapping and sampling program in late August. This will be the first program conducted on the property since Noranda, previous operators of the Blackbird cobalt mine, completed an exploration program that identified anomalous cobalt in stream sediment samples in 1982.
Wollaston Uranium (100% Forum)
A compilation of the geological, geophysical and drilling data on the property has been completed. A gravity survey announced April 7, 2021 was partially completed due to the early onset of spring. Gravity crews will complete the survey this autumn. Gravity surveys identify areas of alteration associated with uranium mineralization.
Northwest Athabasca JV (39.5% Forum; 28% NexGen; 20% Cameco; 12.5% Orano)
Forum, as Operator is planning to propose a drill program to the joint venture partners for the winter of 2022. The property includes the historical 1.5 million pound Maurice Bay uranium deposit* based on 600,000 tonnes grading 0.6% U3O8 to a depth of 50 metres (Saskatchewan Industry and Resources, Miscellaneous Report 2003-7) in the Western Athabasca Basin.
Forum drilled the property in 2012, 2013 and 2014 which identified a number of shallow zones of uranium mineralization grading up to 5.7% uranium over 8.5 metres. With over twenty drill targets identified, it is clear that a fertile uranium mineralizing system on the property requires further drilling.
Fir Island (Orano Canada Option to Earn 70%)
Forum completed ten holes on the Cathy target during the winter drill program and identified a strong boron halo strengthening to the north. Forum and joint venture partner, Orano will review the drill results with a view to plan a drill program in the winter of 2022.
Other Uranium Projects
Forum has drill ready targets at the 100% owned Highrock, 75% owned Clearwater and 65% owned Costigan projects. Rio Tinto, 60% owner of the Henday project (40% Forum) does not plan any programs for 2021/2022.
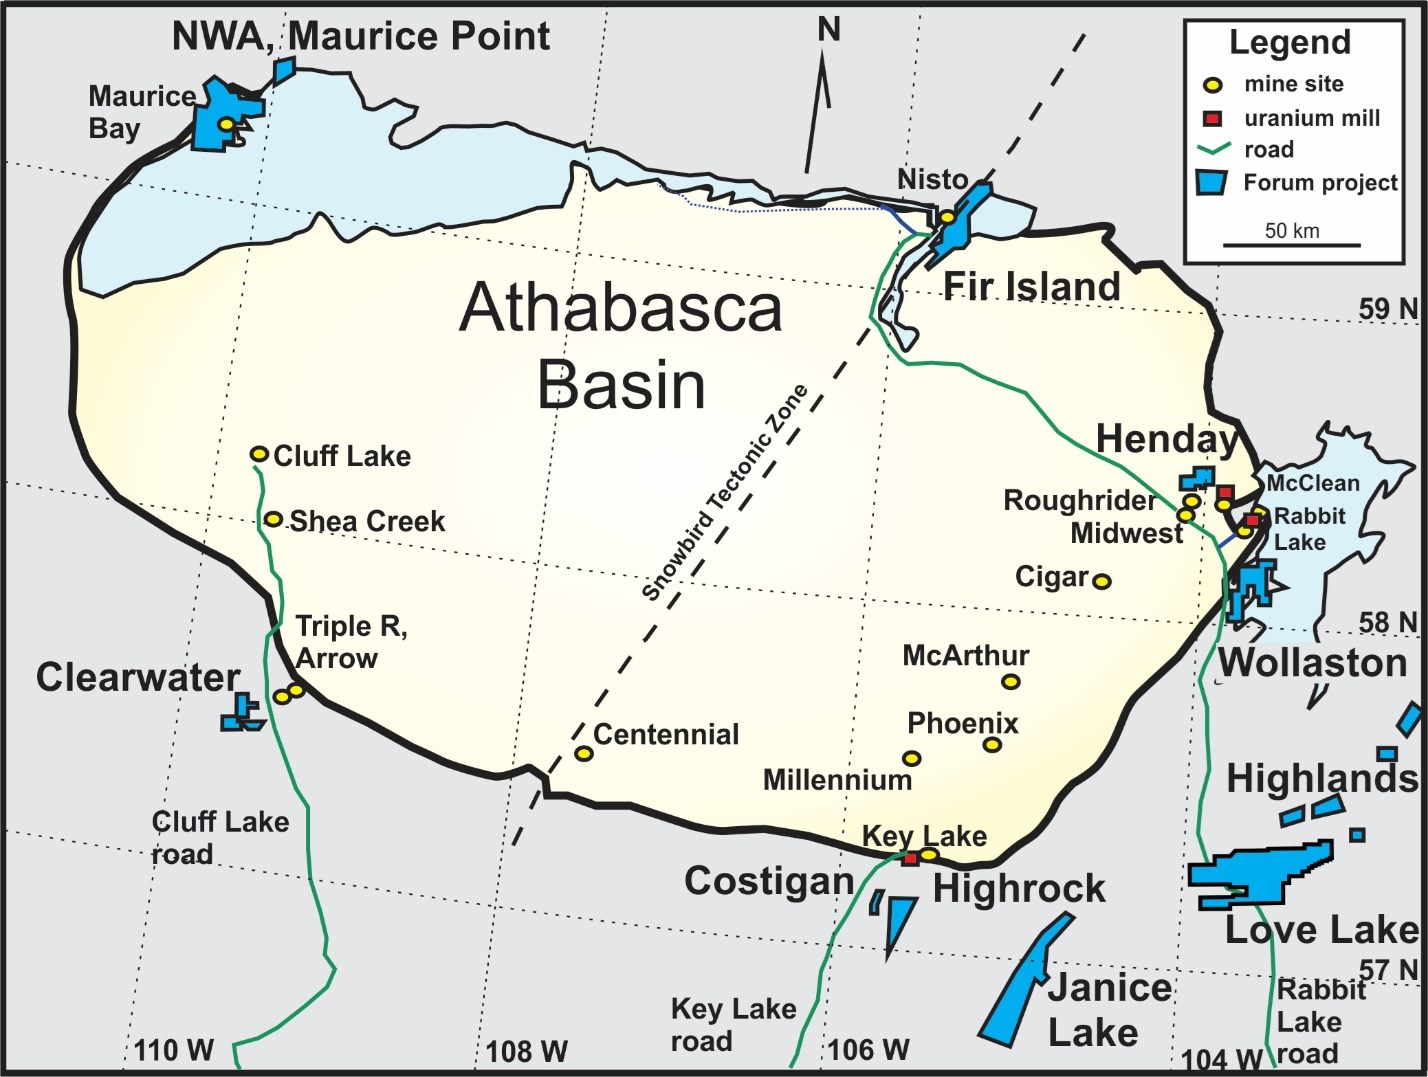
Figure 1: Location of Forum's Copper, Nickel/PGM and Uranium Projects (blue areas), processing facilities (red squares) and roads in the Athabasca Basin, Saskatchewan, Canada
To view an enhanced version of Figure 1, please visit:
https://orders.newsfilecorp.com/files/4908/90694_570e6a7eb43c1af2_003full.jpg
Rick Mazur, P.Geo., Forum's President & CEO and Qualified Person under National Instrument 43-101, has reviewed and approved the contents of this news release.
*The Maurice Bay historical resource estimate was completed prior to the implementation of National Instrument 43-101. Given the extensive exploration work completed by experienced mineral resource companies, and the quality of the historical work completed, the Company believes the historical estimate to be relevant and reliable. However, a qualified person has not completed sufficient work to verify and classify the historical estimate as a current mineral resource, and the Company is not treating the historical estimate as a current mineral resource. Hence, the estimate should not be relied upon. It should be noted that mineral resources, which are not mineral reserves, do not have demonstrated economic viability.
About Forum Energy Metals
Forum Energy Metals Corp. (TSXV: FMC) has three 100% owned energy metal projects being drilled in 2021 by the Company and its major mining company partners Rio Tinto and Orano for copper/silver, uranium and nickel/platinum/palladium in Saskatchewan, Canada's Number One Rated mining province for exploration and development. In addition, Forum has a portfolio of seven drill ready uranium projects and a strategic land position in the Idaho Cobalt Belt. For further information: www.forumenergymetals.com
This press release contains forward-looking statements. Forward-looking statements address future events and conditions and therefore involve inherent risks and uncertainties. Actual results may differ materially from those currently anticipated in such statements.
Forward-looking information is subject to known and unknown risks, uncertainties and other factors that may cause Forum's actual results, level of activity, performance or achievements to be materially different from those expressed or implied by such forward-looking information. Such factors include but are not limited to: uncertainties related to the historical data, the work expenditure commitments; the ability to raise sufficient capital to fund future exploration or development programs; changes in economic conditions or financial markets; changes commodity prices, litigation, legislative, environmental and other judicial, regulatory, political and competitive developments; technological or operational difficulties or an inability to obtain permits required in connection with maintaining or advancing its exploration projects.
ON BEHALF OF THE BOARD OF DIRECTORS
Richard J. Mazur, P.Geo.
President & CEO
Neither the TSX Venture Exchange nor its Regulation Services Provider (as that term is defined in the policies of the TSX Venture Exchange) accepts responsibility for the adequacy or accuracy of this release.
For further information contact:
NORTH AMERICA
Rick Mazur, P.Geo., President & CEO
mazur@forumenergymetals.com
Tel: 778-772-3100
UNITED KINGDOM
Burns Singh Tennent-Bhohi, Director
burnsstb@forumenergymetals.com
Tel: 074-0316-3185
To view the source version of this press release, please visit https://www.newsfilecorp.com/release/90694
VANCOUVER, British Columbia, July 19, 2021 (GLOBE NEWSWIRE) — Fortuna Silver Mines Inc. (NYSE: FSM) (TSX: FVI) reports production results for the second quarter from its three operating mines in the Americas, the San Jose Mine in Mexico, the Caylloma Mine in Peru, and the Lindero Mine in Argentina. The company produced 1,892,822 ounces of silver and 31,048 ounces of gold or 55,953 gold equivalent1 ounces. Silver and gold production for the first six months of 2021 totaled 3,806,577 ounces and 65,603 ounces, respectively, or 115,690 gold equivalent1 ounces. The company is also providing an updated production and cost guidance for 2021 which also incorporates gold production for the second half of the year from the Yaramoko Mine in Burkina Faso.
Second Quarter Consolidated Production
-
Silver production of 1,892,822 ounces; 49 percent increase over Q2 2020
-
Gold production of 31,048 ounces; 337 percent increase over Q2 2020
-
Lead production of 8,143,876 pounds; 20 percent increase over Q2 2020
-
Zinc production of 11,763,866 pounds; 7 percent increase over Q2 2020
Second Quarter Consolidated Operating Highlights
|
Second Quarter 2021 |
Second Quarter 2020 |
||||||||||||
|
Caylloma, |
San Jose, |
Lindero, |
Consolidated |
Caylloma, |
San Jose, |
Lindero, |
Consolidated |
||||||
|
OPERATIONAL FIGURES |
|||||||||||||
|
Tonnes milled |
133,645 |
269,565 |
134,172 |
160,151 |
|||||||||
|
Average tpd milled |
1,536 |
3,029 |
1,525 |
1,799 |
|||||||||
|
Ore placed on pad2 (t) |
1,477,000 |
||||||||||||
|
SILVER3 |
|||||||||||||
|
Grade (g/t) |
76 |
205 |
72 |
220 |
|||||||||
|
Recovery (%) |
82.58 |
91.51 |
78.99 |
90.84 |
|||||||||
|
Production (oz) |
268,428 |
1,624,394 |
1,892,822 |
244,873 |
1,029,049 |
1,273,922 |
|||||||
|
GOLD |
|||||||||||||
|
Grade (g/t) |
0.42 |
1.30 |
0.95 |
0.25 |
1.42 |
||||||||
|
Gold placed on pad2 (oz) |
44,889 |
||||||||||||
|
Recovery (%) |
69.08 |
91.19 |
41.93 |
90.91 |
|||||||||
|
Gold in carbon4 (oz) |
794 |
||||||||||||
|
Dore poured (oz) |
18,726 |
||||||||||||
|
Production (oz) |
1,261 |
10,266 |
19,521 |
31,048 |
445 |
6,654 |
7,099 |
||||||
|
LEAD |
|||||||||||||
|
Grade (%) |
3.09 |
2.77 |
|||||||||||
|
Recovery (%) |
89.53 |
82.81 |
|||||||||||
|
Production (lbs) |
8,143,876 |
8,143,876 |
6,777,010 |
6,777,010 |
|||||||||
|
ZINC |
|||||||||||||
|
Grade (%) |
4.58 |
4.29 |
|||||||||||
|
Recovery (%) |
87.14 |
86.58 |
|||||||||||
|
Production (lbs) |
11,763,866 |
11,763,866 |
10,976,816 |
10,976,816 |
|||||||||
Notes:
-
Gold equivalent production does not include lead or zinc, and is calculated using gold to silver ratio of 1 to 76
-
Lindero tonnes and gold grade are estimated using grade control sampling of blast holes; tonnes are reported to the nearest thousand
-
Metallurgical recovery for silver at the Caylloma Mine is calculated based on silver content in lead concentrate
-
Lindero production includes gold in carbon columns and electrolytic cement
-
Totals may not add due to rounding
Lindero Mine, Argentina
Argentina suffered a surge of COVID-19 during the second quarter of 2021 with the infection rate peaking at 41,000 cases per day. Extended nationwide COVID-19 related travel restrictions continued to limit onsite access to foreign vendor support affecting ramp up activities at Lindero.
The COVID-19 infection rate at Lindero increased during the second quarter and had a significant impact on the operation´s performance as 160 personnel tested positive, representing 18 percent of the workforce. During the quarter, the company intermittently voluntarily suspended onsite operations for a total of 16 days which directly impacted ramp up progress and reduced the amount of ore delivered to the heap leach pad. Strict government mandated travel restrictions have led to disruptions in the hiring and movement of skilled personnel and delays in access to foreign vendor support, which resulted in higher mechanical downtime leading to lower tonnes of processed ore being delivered to the leach pad.
In the second quarter, a total of 1,477,000 tonnes of ore were placed on the leach pad averaging 0.95 g/t gold containing an estimated 44,889 ounces of gold.
Total gold production for the quarter was 19,521 ounces, 73 percent of the plan, comprised of 18,726 ounces in doré and 794 ounces of gold-in-carbon (GIC) inventory.
|
Second Quarter 2021 |
|
|
Ore mined1 (t) |
1,817,000 |
|
Waste mined1 (t) |
1,638,000 |
|
Total mined1 (t) |
3,455,000 |
|
Strip ratio (waste to ore) |
0.90 |
|
Average crushing throughput (tph) |
868 |
|
Ore placed on leach pad1 (t) |
1,477,000 |
|
Ore placed grade1 (g/t) |
0.95 |
|
GIC inventory (oz) |
794 |
|
Doré poured (oz) |
18,726 |
|
Gold produced (oz) |
19,521 |
Note:
1. Lindero tonnes and gold grade are estimated using grade control sampling of blast holes; tonnes are reported to the nearest thousand
Mining
A total of 1,817,000 tonnes of ore were mined in the second quarter of 2021 at a strip ratio of 0.9:1, 20 percent below plan. Mine waste movement increased 34 percent compared to the first quarter of 2021, in line with expectation.
Mine reconciliation and metallurgical performance
Reconciliation of tonnes, grade and gold ounces mined for the second quarter indicate a good correlation with the reserve model with differences of less than five percent for all parameters.
Gold leaching response as well as reagent consumption was within the expected parameters for the granulometric composition and metallurgical types of ore placed on the leach pad.
Processing
In the second quarter of 2021, a total of 1,477,000 tonnes of ore were placed on the leach pad at 0.95 g/t gold, 20 and 10 percent below plan, respectively. All processing activities were impacted negatively by the direct and indirect downtimes related to the surge in COVID-19 cases and government restrictions. Lower grade is explained by the extraction of fewer tonnes from the pit than was planned, resulting in reduced access to higher grade ore than was scheduled, and grade dilution as the operation attempted to selectively mine higher-grade ore from lower-grade ore during this period to offset temporary shortfalls in gold stacked.
Trucked ore from the run of mine and coarse stockpiles placed on the leach pad totaled 801,000 tonnes, 32 percent higher than plan. Trucking of coarse ore to the leach pad was a temporary measure during the first half of the year to offset the lower tonnage of agglomerated ore; resulting in a 15 percent decrease, in respect to plan and guidance, of recoverable gold ounces on the heap during this period.
Primary and secondary crushing averaged 14,870 tonnes per day during the quarter, representing 79 percent of design capacity of 18,750 tonnes per day.
The tertiary-HPGR crusher, agglomeration plant, and stacking system throughput averaged 9,510 tonnes per day in the quarter representing 51 percent of design capacity and a 25 percent increase compared to the previous quarter. In June, ore stacking averaged 12,600 tonnes per day, representing 67 percent of design capacity peaking at 18,390 tonnes per day, 98 percent of design capacity.
The company has worked to address ramp up challenges in the tertiary crushing-agglomeration-stacking circuit with the in-country arrival of specialist support which was delayed due to COVID-19 travel restrictions. The operation expects to complete the planned ADR plant expansion and achieve full production capacity early in the fourth quarter of 2021.
SART plant ramp up work resumed in June at a pregnant solution flow rate of 100 to 150 cubic meters per hour, 25 percent of design capacity, regarded as sufficient to manage soluble copper levels in the ADR plant at this time. The SART plant is expected to achieve design capacity of 400 cubic meters per hour during the second half of the year.
Quality Assurance & Quality Control
Grade control estimates at Lindero are based on blast hole chip samples submitted to Lindero’s on-site laboratory for preparation and assaying for gold, using fire assay with an atomic absorption finish. The QA-QC program includes the blind insertion of certified reference standards and assay blanks at a frequency of approximately 1 per 20 normal samples as well as the submission of duplicate samples for verification of sampling and assay precision levels by an ISO 9001:2000 certified umpire laboratory. ALS Global Laboratory in Mendoza, Argentina prepared the samples for assaying and then forwarded the samples to ALS Global Laboratory in Lima, Peru for assay by standard fire assay methods.
San Jose Mine, Mexico
The San Jose Mine produced 1,624,394 ounces of silver and 10,266 ounces of gold in the second quarter of 2021 with average head grades for silver and gold of 205 g/t and 1.30 g/t, respectively; 4 percent above and in line with plan.
Caylloma Mine, Peru
In the second quarter of 2021, the Caylloma Mine produced 268,428 ounces of silver with an average head grade of 76 g/t, in line with plan.
Gold production was 1,261 ounces, an increase of 183 percent with respect to the second quarter of 2020. Caylloma’s gold production continues to exceed plan with average grades experienced in the second quarter expected to continue throughout the year. The mine geology team has confirmed the continuity of this higher-grade zone as related to the intersection of the Animas NE and Nancy veins with modeling work to define this ore shoot completed.
Lead and zinc production for the second quarter of 2021 was 8,143,876 pounds and 11,763,866 pounds with average head grades for lead and zinc of 3.09% and 4.58%, respectively; 8 percent and 9 percent above plan.
Full Year 2021 Updated Consolidated Production and AISC Guidance
Following the completion of the business combination with Roxgold Inc. on July 2, 2021 (refer to news release dated July 2, 2021, “Fortuna and Roxgold complete combination to create a global premier growth-oriented intermediate gold and silver producer”), the company has updated its consolidated silver and gold production and cost guidance for 2021 (refer to news release dated January 19, 2021, “Fortuna reports 2020 full year production of 11.3 million silver equivalent ounces and issues 2021 guidance”) .
Updated Guidance Highlights
-
Consolidated silver and gold production of 6.8 to 7.6 million ounces and 194 to 223 thousand ounces, respectively for 2021, or 283 to 323 thousand gold equivalent1 ounces, representing a year over year increase of 90 to 116 percent
-
Gold production at the Yaramoko Mine in Burkina Faso for the second half 2021 contributes to the company´s full year guidance, representing 30 to 32 percent of the updated guidance
-
Séguéla gold Project construction decision expected during the third quarter of 2021
-
Due to direct and indirect COVID-19 related disruptions experienced in Argentina, Lindero has reduced its gold production guidance by 31 to 36 percent
Silver and gold production guidance
The company’s updated production and cost guidance set out below for 2021 assumes that operations will continue for the remainder of the year without any major interruptions related to COVID-19.
|
Mine |
Silver |
Gold |
||
|
Original Guidance |
Updated Guidance |
Original Guidance |
Updated Guidance |
|
|
(Moz) |
(Moz) |
(koz) |
(koz) |
|
|
Lindero, Argentina |
– |
– |
140 – 160 |
90 – 110 |
|
San Jose, Mexico |
5.8 – 6.5 |
5.8 – 6.5 |
38 – 42 |
38 – 42 |
|
Caylloma, Peru |
1.0 – 1.1 |
1.0 – 1.1 |
– |
4 – 5 |
|
Yaramoko2, Burkina Faso |
– |
– |
– |
62 – 66 |
|
Consolidated Total |
6.8 – 7.6 |
6.8 – 7.6 |
178 – 202 |
194 – 223 |
AISC3,4 guidance
|
Mine |
Silver |
Gold |
||
|
AISC Original |
AISC Updated |
AISC Original |
AISC Updated |
|
|
(US$/oz Ag Eq) |
(US$/oz Ag Eq) |
(US$/oz Au) |
(US$/oz Au) |
|
|
Lindero5, Argentina |
– |
– |
730 – 860 |
1,010 – 1,190 |
|
San Jose, Mexico |
12.2 – 14.5 |
12.2 – 14.5 |
– |
– |
|
Caylloma, Peru |
19.4 – 23.0 |
19.4 – 23.0 |
– |
– |
|
Yaramoko, Burkina Faso |
– |
– |
– |
990 – 1,150 |
Notes:
-
Silver and gold equivalent production does not include lead or zinc, and is calculated using gold to silver ratio of 1 to 76
-
The Yaramoko Mine gold production and AISC guidance is for the second half of 2021
-
All-in sustaining cost (AISC) is a non-IFRS financial measure, refer to Forward-looking Statements regarding non-IFRS financial measures at the end of this news release; AISC includes production cash cost, commercial and government royalties, mining tax, export duties (as applicable), worker’s participation (as applicable), subsidiary G&A, sustaining capital expenditures, and Brownfields exploration and is estimated at metal prices of US$1,800/oz Au, US$22/oz Ag, US$1,900/t Pb, and US$2,300/t Zn
-
AISC excludes government mining royalty recognized as income tax within the scope of IAS-12
-
Refer to Lindero Mine AISC Guidance section in 2021 Guidance Outlook below
2021 Guidance Outlook
Lindero Mine, Argentina
Production guidance
Lindero´s updated gold production guidance range of between 90 and 110 thousand ounces reflects a decrease of 50,000 ounces with respect to both the lower and upper range of the production guidance disclosed on January 19, 2021. The decrease in production is a consequence of the direct and indirect impacts of the increase in COVID-19 positive cases in Argentina and in the workforce at Lindero, stricter government mandated travel restrictions which have caused delays in the ramp up of activities, and challenges related to attempting to selectively mine and separate higher-grade material, as discussed above for the second quarter results. Operational impacts caused by these factors have been evaluated and their effect considered for the second half of the year.
AISC guidance
Lindero´s updated AISC per ounce of gold between US$1,010 and US$1,190 reflects an increase of 38 percent with respect to both the lower and upper range of the AISC guidance disclosed at the beginning of the year. The increase is a consequence of projected lower gold production and higher sustaining capex related to the expansion of the ADR plant.
San Jose Mine, Mexico
At San Jose, the company reiterates the mine´s production and AISC guidance disclosed on January 19, 2021. COVID-19 related protocols set in place have been reviewed and adjusted to continue mitigating the impacts of positive cases in the workforce. The ongoing vaccination campaign in the state of Oaxaca in addition to the company´s strengthened health procedures are anticipated to contribute to containing the COVID-19 infection rate at the operation.
Caylloma Mine, Peru
At Caylloma, despite registering COVID-19 positive cases in the workforce during the first half of the year, the mine´s performance has exceeded expectations as a result of an efficient allocation of the operation´s resources and coarse ore stockpile management. The company reiterates the mine´s production and AISC guidance disclosed on January 19, 2021, including lead and zinc production of 29 to 32 million pounds and 44 to 49 million pounds, respectively. In addition, gold production of 4 to 5 thousand ounces for the year has been included in the annual consolidated production guidance to take into account the higher-grade zone related to the intersection of the Animas NE and Nancy veins.
Yaramoko Mine, Burkina Faso
There were no major COVID-19 related impacts at the Yaramoko Mine during the second quarter of 2021. Gold production guidance for the second half of the year assumes there will be no significant disruptions of operations associated with COVID-19.
Annual planned mine development meters are projected to increase, driven by a stoping sequence rescheduling associated with lower grades encountered during the second quarter of the year. The increase in development meters is expected to contribute to achieving second half of the year gold production guidance at an estimated AISC per ounce of gold of US$990 to US$1,150.
Séguéla Gold Project, Côte d’Ivoire
At the Séguéla Project, the company expects to commence negotiations on the Project Mining Convention with the government early in the third quarter. At the project site, the accommodation village is projected to be ready for occupancy in the fourth quarter of 2021. Key contracts with plant EPC and bulk earthworks contractors are close to being finalized. In order to not affect the critical path of the project, the Board of Directors of the company has approved an early works budget of US$11.5 million to commence detailed engineering work and procure long lead items such as the SAG mill. The company expects to make a construction decision during the third quarter.
Exploration Outlook
Fortuna continues to advance its robust pipeline of Brownfield and Greenfield exploration projects in West Africa and the Americas. The company will be providing a comprehensive exploration update in the third quarter.
West Africa
Exploration in Côte d’Ivoire during the second half of the year will focus on infilling and extending the new Sunbird discovery at Séguéla, where mineralization has now been delineated over a strike length of more than 1,000 meters. Drilling will also continue the delineation of the high-grade Koula underground inventory, while also following up on the recent high grades intersected in scout reverse circulation drilling at Gabbro North. Further afield, several extensive soil and termite geochemistry anomalies will be tested with aircore drilling at Fortuna’s Kadyoha and Dianra Nord prospects, some 140 kilometers to the north-east of Séguéla.
In Burkina Faso, delineation and step out drilling will continue in the second half of the year at Boussoura after the conclusion of the annual rainy season in August. Drilling will focus on defining the Fofora Main and VC2 deposits, and delineating additional mineralization at VC3 and VC5. Similarly, definition drilling in the second half of the year at Galgouli and exploration drilling of mineralization identified at several nearby prospects will continue. At Yaramoko, activities will continue to support advancing the 109 Zone surface prospect, as well as target testing and delineation across the wider Yaramoko property.
Americas
Fortuna budgeted US$21 million for its 2021 exploration program, consisting of 69,000 meters of surface and underground diamond drilling, supporting ground geophysical programs, and underground development. As of the end of June, the exploration teams had completed a total of 23,400 meters of drilling, 34 percent of plan. The remainder of the planned meters and budget at the mines and two additional Greenfields projects will be realized throughout the second half of 2021 using up to 12 core rigs. Fortuna also maintains a wide-ranging reconnaissance program in Mexico.
Qualified Persons
Amri Sinuhaji, Technical Services Director – Mine Planning for the company, is a Professional Engineer registered with the Association of Professional Engineers and Geoscientists of the Province of British Columbia (#48305) and a Qualified Person as defined by National Instrument 43-101, Standards of Disclosure for Mineral Projects (“NI 43-101”). Mr. Sinuhaji has reviewed and approved the scientific and technical information pertaining to the San Jose, Caylloma and Lindero mines contained in this news release and has verified the underlying data.
Paul Criddle, FAusIMM, Chief Operating Officer, West Africa for the company, is a Qualified Person as defined by NI 43-101, and has reviewed and approved the scientific and technical information pertaining to the Yaramoko Mine, Seguela Project and the West Africa exploration outlook contained in this news release and has verified the underlying data.
David F. Volkert, Vice President of Exploration for the company, is a member of the American Institute of Professional Geologists (CPG #10759) and the Association of Professional Engineers and Geoscientists of British Columbia (P. Geo. #191936) and a Qualified Person as defined by NI 43-101. Mr. Volkert has reviewed and approved the Americas exploration outlook contained in this news release and has verified the underlying data.
About Fortuna Silver Mines Inc.
Fortuna Silver Mines Inc. is a Canadian precious metals mining company with four operating mines in Argentina, Burkina Faso, Mexico and Peru, and an advanced development project in Côte d’Ivoire. Sustainability is integral to all our operations and relationships. We produce gold and silver and generate shared value over the long-term for our shareholders and stakeholders through efficient production, environmental protection, and social responsibility. For more information, please visit our website at www.fortunasilver.com.
ON BEHALF OF THE BOARD
Jorge A. Ganoza
President, CEO, and Director
Fortuna Silver Mines Inc.
Investor Relations:
Carlos Baca | info@fortunasilver.com
Forward-looking Statements
This news release contains forward-looking statements which constitute “forward-looking information” within the meaning of applicable Canadian securities legislation and “forward-looking statements” within the meaning of the “safe harbor” provisions of the Private Securities Litigation Reform Act of 1995 (collectively, “Forward-looking Statements”). All statements included herein, other than statements of historical fact, are Forward-looking Statements and are subject to a variety of known and unknown risks and uncertainties which could cause actual events or results to differ materially from those reflected in the Forward-looking Statements. The Forward-looking Statements in this news release may include, without limitation, statements about the Company’s plans for its mines and mineral properties; the Company’s anticipated performance in 2021; estimated production forecasts and sales for 2021; estimated production costs and all-in sustaining cash costs for 2021; estimated capital expenditures in 2021; estimated Brownfields and Greenfields expenditures in 2021; the success of the Company’s exploration activities at its mines and development projects; the timing of the implementation and completion of sustaining capital investment projects at the Company’s mines; the duration and impacts of COVID-19 on the Company’s production, workforce, business, operations and financial condition; metal price estimates, estimated metal grades in 2021; the estimated amount of ore to be placed on the leach pad at the Lindero Mine in 2021, the grade of gold and the amount of gold estimated to be contained therein; the timing of the commencement of steady state production at the Lindero Mine; the timing of the expansion of the ADR plant at the Lindero Mine; the expansion of the heap leach pad at the Lindero Mine; the timing of the signing key contracts for the Séguéla Project; the timing of a construction decision at the Séguéla Project; the Company’s business strategy, plans and outlook; the merit of the Company’s mines and mineral properties; mineral resource and reserve estimates; production costs; timelines; the future financial or operating performance of the Company; expenditures; approvals and other matters. Often, but not always, these Forward-looking Statements can be identified by the use of words such as “estimated”, “potential”, “open”, “future”, “assumed”, “projected”, “used”, “detailed”, “has been”, “gain”, “planned”, “reflecting”, “will”, “anticipated”, “estimated” “containing”, “remaining”, “to be”, or statements that events, “could” or “should” occur or be achieved and similar expressions, including negative variations.
Forward-looking Statements involve known and unknown risks, uncertainties and other factors which may cause the actual results, performance or achievements of the Company to be materially different from any results, performance or achievements expressed or implied by the Forward-looking Statements. Such uncertainties and factors include, among others, changes in general economic conditions and financial markets; the impact of the COVID-19 pandemic on the Company’s mining operations and construction activities; the duration and impacts of COVID-19 on the Company’s production, workforce, business, operations and financial condition, and the risks relating to a global pandemic, which unless contained could cause a slowdown in global economic growth; uncertainties related to the impacts of COVID-19 which may include: changing market conditions, changing restrictions on the mining industry in the countries in which the Company operates, the ability to operate as a result of government imposed restrictions, including restrictions on travel, the transportation of concentrates and doré, access to refineries, the impact of additional waves of the pandemic or increases of incidents of COVID-19 in the countries in which we operate; the duration of any suspension of operations at the Company’s mines as a result of COVID-19 which may affect production and the Company’ business operations and financial condition; changes in prices for gold, silver and other metals; changes in the prices of key supplies; technological and operational hazards in Fortuna’s mining and mine development activities; risks inherent in mineral exploration; the ability of the current exploration programs to identify and or expand mineral resources, operational risks in exploration and development; delays or changes in plans with respect to exploration or development projects; uncertainties inherent in the estimation of mineral reserves, mineral resources, and metal recoveries; changes to current estimates of mineral reserves and resources; changes to production and cost estimates; governmental and other approvals; changes in government, political unrest or instability in countries where Fortuna is active; fluctuations in currencies and exchange rates; the imposition of capital control in countries in which the Company operates; labor relations issues; as well as those factors discussed under “Risk Factors” in the Company's Annual Information Form. Although the Company has attempted to identify important factors that could cause actual actions, events or results to differ materially from those described in Forward-looking Statements, there may be other factors that cause actions, events or results to differ from those anticipated, estimated or intended.
Forward-looking Statements contained herein are based on the assumptions, beliefs, expectations and opinions of management, including but not limited to the accuracy of the Company’s current mineral resource and reserve estimates; that the Company’s activities will be in accordance with the Company’s public statements and stated goals; that there will be no material adverse change affecting the Company or its properties; that the reconciliation of mineral reserves at the Lindero Mine remains consistent with the mineral reserve model; changes to production estimates (which assume accuracy of projected ore grade, mining rates, recovery timing, and recovery rate estimates and may be impacted by unscheduled maintenance, labour and contractor availability and other operating or technical difficulties); the duration and impacts of COVID-19 on the Company’s production, workforce, business, operations and financial condition, and the risks relating to a global pandemic, which unless contained could cause a slowdown in global economic growth; government mandates in Peru, Mexico, Argentina, Burkina Faso and Côte d’Ivoire with respect to mining operations generally or auxiliary businesses or services required for the Company’s operations; government and the Company’s attempts to reduce the spread of COVID-19 which may affect may aspects of the Company’s operations, including transportation of personnel to and from site, contractor and supplier availability and the ability to sell or deliver concentrate and doré; the expected trends in mineral prices and currency exchange rates; that the Company’s activities will be in accordance with the Company’s public statements and stated goals; that there will be no material adverse change affecting the Company or its properties; that all required approvals will be obtained for the Company’s business and operations; that there will be no significant disruptions affecting operations and such other assumptions as set out herein. Forward-looking Statements are made as of the date hereof and the Company disclaims any obligation to update any Forward-looking Statements, whether as a result of new information, future events or results or otherwise, except as required by law. There can be no assurance that these Forward-looking Statements will prove to be accurate, as actual results and future events could differ materially from those anticipated in such statements. Accordingly, investors should not place undue reliance on Forward-looking Statements.
Cautionary Note to United States Investors Concerning Estimates of Reserves and Resources
Reserve and resource estimates included in this news release have been prepared in accordance with National Instrument 43-101 Standards of Disclosure for Mineral Projects ("NI 43-101") and the Canadian Institute of Mining, Metallurgy, and Petroleum Definition Standards on Mineral Resources and Mineral Reserves. NI 43-101 is a rule developed by the Canadian Securities Administrators that establishes standards for public disclosure by a Canadian company of scientific and technical information concerning mineral projects. Unless otherwise indicated, all mineral reserve and mineral resource estimates contained in the technical disclosure have been prepared in accordance with NI 43-101 and the Canadian Institute of Mining, Metallurgy and Petroleum Definition Standards on Mineral Resources and Reserves.
Canadian standards, including NI 43-101, differ significantly from the requirements of the Securities and Exchange Commission, and mineral reserve and resource information included in this news release may not be comparable to similar information disclosed by U.S. companies.
Non-IFRS Financial Measures
This news release also refers to non-IFRS financial measures, such as production cash cost per tonne of processed ore; total production cost per tonne; all-in sustaining cash cost and all-in cash cost. These measures do not have a standardized meaning or method of calculation, even though the descriptions of such measures may be similar. These performance measures have no meaning under International Financial Reporting Standards (IFRS) and therefore, amounts presented may not be comparable to similar data presented by other mining companies. For additional information regarding non-IFRS measures, including reconciliations to the closest comparable IFRS measures, see "Non-GAAP Financial Measures" in the Fortuna’s annual MD&A, which is available under Fortuna's SEDAR profile at www.sedar.com.
TORONTO, July 20, 2021 (GLOBE NEWSWIRE) — Noront Resources Ltd. (TSXV: NOT) (“Noront” or the “Company”) announces that payment of interest in the amount of $371,700 for the second quarter of 2021 pursuant to a loan agreement between Noront and Wyloo Canada Holdings Pty Ltd. (“Wyloo”) dated February 26, 2013 (the “Loan Agreement”) will be satisfied by delivery of 1,111,945 common shares of the Company (the “Interest Shares”) at an effective price of $0.3343 per Interest Share. The Interest Shares will be subject to a four month hold period, expiring on November 21, 2021, and are subject to receipt of the final approval from the TSX Venture Exchange.
The calculation of the number of Interest Shares issued was based on the volume weighted average trading price of the common shares of the Company during the 20 trading days prior to June 30, 2021.
After giving effect to the issuance of the Interest Shares, there will be 458,268,304 common shares of the Company issued and outstanding.
About Noront Resources
Noront Resources Ltd. is focused on the development of its high-grade Eagle’s Nest nickel, copper, platinum and palladium deposit and the world class chromite deposits including Blackbird, Black Thor, and Big Daddy, all of which are located in the James Bay Lowlands of Ontario in an emerging metals camp known as the Ring of Fire. www.norontresources.com
Neither TSX Venture Exchange nor its Regulation Services Provider (as that term is defined in policies of the TSX Venture Exchange) accepts responsibility for the adequacy or accuracy of this release.
For more information:
Greg Rieveley
greg.rieveley@norontresources.com
(416) 367-1444
TSXV: NEV
VANCOUVER, BC, July 20, 2021 /CNW/ – Nevada Sunrise Gold Corp. ("Nevada Sunrise", or the "Company") (TSXV: NEV) is pleased to announce that its joint venture partner, New Placer Dome Gold Corp. ("New Placer Dome") (TSXV: NGLD) has presented plans for the 2021 resource expansion and exploration program at the Kinsley Mountain Gold Project ("Kinsley Mountain") in Nevada. Nevada Sunrise holds a 20.01% interest in the Kinsley Mountain joint venture, with New Placer Dome, as operator, holding a 79.99% interest.
Kinsley Mountain is located 90 kilometres (56 miles) south of the Long Canyon Mine1, operated by Nevada Gold Mines. Kinsley Mountain hosts Carlin-style gold mineralization under and adjacent to a historical open-pit, run-of-mine heap leach operation, and hosts an Indicated Resource at the Western Flank Zone ("WFZ") of 302,000 ounces of gold grading 6.11 grams/tonne gold (1.54 million tonnes)1.
Building on a successful 2020 campaign, the 2021 Kinsley Mountain exploration program will, subject to financing, comprise resource expansion and drilling on three new discovery areas, and a significantly expanded program of induced polarization ("IP")/resistivity geophysical surveys.
The 2020 Kinsley Mountain reverse circulation ("RC") and diamond drill campaign comprised 49 drill holes totaling 17,970 metres and tested five targets within the greater resource area (Figure 1). Exploration drilling during 2021 is anticipated to build on new mineralized intercepts and expand the current indicated and inferred resources at the WFZ, Main Pit North Oxide and Secret Spot targets (Figure 2).
Highlights of the 2020 Kinsley Drilling include2:
Western Flank – West side resource expansion drilling yields
-
10.22 grams/tonne gold ("g/t Au") gold over 6.1 metres within a broader zone grading
2.63 g/t Au (sulphide) over 38.10 metres in KMR20-017
Western Flank – Central yields second highest-grade Dunderberg shale intercept
-
1 g/t Au (sulphide) over 7.6 metres, including 24.1 g/t Au (sulphide) over 4.6 metres lower zone,
-
9.08 g/t Au (sulphide) over 6.1 metres upper zone in KMR20-026
Main Pit North Oxide Target yields high-grade intercepts 75 m outside current pit shell
-
9.83 g/t Au over 7.6 metres high grade shallow oxide
Secret Spot Target surface oxide New Discovery multiple intercepts including
-
1.77 g/t Au over 25.3 metres in new surface oxide discovery in KMD20-007B
-
3.81 g/t Au over 11.6 metres; including 11.3 g/t Au over 2.9 metres in KMD20-006

IP/resistivity geophysical surveys competed during 2020 at the WFZ and Shale Saddle target areas show a correlation between chargeability and drill confirmed high grade gold sulphide mineralization. Expanded infill IP/resistivity geophysical surveys for 2021 are planned to extend south to the Secret Spot target and north to frontier areas of the under-explored Kinsley North. At Kinsley North, detailed soil geochemical surveys reveal broad arsenic in soil anomalies coincident with north-trending normal and low angle detachment faults coincident with the prospective Pogonip-Notch Peak contact (the same host horizon as Long Canyon1) and Dunderberg shale rocks at depth cut by late northwest trending structures that are important gold mineralization hosts within the Kinsley resource area.
|
1 |
Technical Report on the Kinsley Project, Elko County, Nevada, U.S.A., dated June 21, 2021 with an effective date of May 5, 2021 and prepared by Michael M. Gustin, Ph.D., and Gary L. Simmons, MMSA and filed under New Placer Dome Gold Corp.'s Issuer Profile on SEDAR (www.sedar.com). Long Canyon Mine is not necessarily indicative of mineralization within Kinsley Mountain Project area. |
|
2 |
True widths of the mineralized intervals are interpreted to be between 60-90% of the reported lengths. |

Key Points for 2021 Kinsley Mountain Exploration Program:
-
Continued resource definition and exploration drilling on 3 priority targets;
-
Western Flank Zone – Resource expansion drilling that is open to the west and east, and testing new near-resource targets generated by recent IP/resistivity survey results;
-
Secret Spot – Mapping and drilling to define the new surface oxide gold discovery;
-
Secret Spot – Deep drilling targeting Transverse fault / Secret Canyon shale intersection following up on highest assay results to date at Secret Spot >10 g/t Au returned during 2020 campaign;
-
Main Pit North high-grade oxide discovery continued shallow RC drilling to further delineate near pit mineralization at <150 metres vertical depths; and
-
Expanded IP/resistivity geophysical surveys to cover the Secret Spot target and under-explored Kinsley North targets, in addition to drill testing of Shale Saddle IP anomaly.
Methodology and QA/QC
Assaying was performed by ALS Global ("ALS"), of Vancouver Canada. ALS is an ISO-IEC 17025:2017 and ISO 9001:2015 accredited analytical laboratory that is independent of New Placer Dome, Nevada Sunrise, and their respective Qualified Persons. RC drill samples were subject to crushing to a minimum of 70% passing 2 mm, followed by pulverizing of a 250-gram split to 85% passing 75 microns. Gold determination was via standard 30-gram fire-assay analysis with atomic absorption spectroscopy ("AAS") finish, in addition to 51 element ICP-MS. Samples returning greater than 10 g/t Au are subject to gravimetric finish. Gold values returning greater than 0.1 g/t Au are also subject to leach analysis where the sample is treated with a 0.25% NaCN solution and rolled for an hour. An aliquot of the final leach solution is then centrifuged and analyzed by AAS.
As operator at Kinsley Mountain, New Placer Dome follows industry standard procedures for the work carried out the Project, with a quality assurance/quality control ("QA/QC") program. Blank, duplicate and standard samples were inserted into the sample sequence sent to the laboratory for analysis. New Placer Dome detected no significant QA/QC issues during review of the data. Nevada Sunrise is not aware of any drilling, sampling, recovery or other factors that could materially affect the accuracy or reliability of the data referred to herein.
Qualified Person
The scientific and technical information contained in this news release has been reviewed and approved by Robert M. Allender, Jr., CPG, RG, SME and a Qualified Person for Nevada Sunrise as defined in National Instrument 43-101 – Standards of Disclosure for Mineral Projects. Mr. Allender has examined the information provided by New Placer Dome, which includes the data disclosed underlying the information and opinions contained herein.
About Nevada Sunrise
Nevada Sunrise is a junior mineral exploration company with a strong technical team based in Vancouver, BC, Canada, that holds interests in gold, copper, cobalt and lithium exploration projects located in the State of Nevada, USA.
The Company's key gold asset is a 20.01% interest in a joint venture with New Placer Dome Gold Corp. (TSXV: NGLD) at the Kinsley Mountain Gold Project near Wendover. Kinsley Mountain is a Carlin-style gold project hosting a National Instrument 43-101 compliant gold resource consisting of 418,000 indicated ounces of gold grading 2.63 g/t Au (4.95 million tonnes), and 117,000 inferred ounces of gold averaging 1.51 g/t Au (2.44 million tonnes), at cut-off grades ranging from 0.2 to 2.0 g/t Au 1.
1 Technical Report on the Kinsley Project, Elko County, Nevada, U.S.A., dated June 21, 2021 with an effective date of May 5, 2021 and prepared by Michael M. Gustin, Ph.D., and Gary L. Simmons, MMSA and filed under New Placer Dome Gold Corp.'s Issuer Profile on SEDAR (www.sedar.com). Long Canyon Mine is not necessarily indicative of mineralization within Kinsley Mountain Project area.
Nevada Sunrise has right to earn a 100% interest in the Coronado VMS Project, located approximately 48 kilometers (30 miles) southeast of Winnemucca. The Company owns a 15% interest in the historic Lovelock Cobalt Mine and the Treasure Box copper properties, each located approximately 150 kilometers (100 miles) east of Reno, with Global Energy Metals Corp. (TSXV: GEMC) holding an 85% participating interest.
Nevada Sunrise owns 100% interests in the Jackson Wash and Gemini lithium projects, both of which are located in Esmeralda County. The Company owns Nevada water right Permit 44411, located within the Clayton Valley basin near Silver Peak, Nevada, and water permit 86863, located in the Lida Valley basin, near Lida, Nevada.
FORWARD LOOKING STATEMENTS
This release may contain forward–looking statements. Forward looking statements are statements that are not historical facts and are generally, but not always, identified by the words "expects", "plans", "anticipates", "believes", "intends", "estimates", "projects", "potential" and similar expressions, or that events or conditions "will", "would", "may", "could" or "should" occur and include disclosure of anticipated exploration activities. Although the Company believes the expectations expressed in such forward–looking statements are based on reasonable assumptions, such statements are not guarantees of future performance and actual results may differ materially from those in forward looking statements. Forward–looking statements are based on the beliefs, estimates and opinions of the Company's management on the date such statements were made. The Company expressly disclaims any intention or obligation to update or revise any forward–looking statements whether as a result of new information, future events or otherwise.
Such factors include, among others, risks related to the interpretation and actual results of historical production at Kinsley Mountain, reliance on technical information provided by third parties on any of our exploration properties, including access to historical information on the Kinsley Mountain property as well as specific historical data associated with drill results from the property, technical information received from New Placer Dome Gold Corp., current exploration and development activities; changes in project parameters as plans continue to be refined; current economic conditions; future prices of commodities; possible variations in grade or recovery rates; failure of equipment or processes to operate as anticipated; the failure of contracted parties to perform; failure of New Placer Dome Gold Corp. to complete anticipated work programs; labor disputes and other risks of the mining industry; delays due to pandemic; delays in obtaining governmental approvals, financing or in the completion of exploration, as well as those factors discussed in the section entitled "Risk Factors" in the Company's Management Discussion and Analysis for the Six Months ended March 31, 2021, which is available under Company's SEDAR profile at www.sedar.com.
Although Nevada Sunrise has attempted to identify important factors that could cause actual actions, events or results to differ materially from those described in forward-looking information, there may be other factors that cause actions, events or results not to be as anticipated, estimated or intended. There can be no assurance that such information will prove to be accurate as actual results and future events could differ materially from those anticipated in such statements. Nevada Sunrise disclaims any intention or obligation to update or revise any forward-looking information, whether as a result of new information, future events or otherwise. Accordingly, readers should not place undue reliance on forward-looking information.
Neither TSX Venture Exchange nor its Regulation Services Provider (as that term is defined in the policies of TSX Venture Exchange) accepts responsibility for the adequacy or accuracy of this release. The securities of Nevada Sunrise Gold Corporation have not been registered under the United States Securities Act of 1933, as amended, and may not be offered or sold within the United States or to the account or benefit of any U.S. person.

SOURCE Nevada Sunrise Gold Corporation

View original content to download multimedia: http://www.newswire.ca/en/releases/archive/July2021/20/c6741.html
If you would like to receive our free newsletter via email, simply enter your email address below & click subscribe.
 Follow us on Twitter
 Become our facebook fan
CONNECT WITH US
Tweets
Tweet with hash tag #miningfeeds or @miningfeeds and your tweets will be displayed across this site.
MOST ACTIVE MINING STOCKS
Daily Gainers
 CMC Metals Ltd. CMC Metals Ltd. |
CMB.V | +900.00% |
 Eden Energy Ltd Eden Energy Ltd |
EDE.AX | +200.00% |
| GoviEx Uranium Inc. |
GXU.V | +42.86% |
| Eagle Nickel Ltd. |
ENL.AX | +41.67% |
| Citigold Corp. Limited |
CTO.AX | +33.33% |
| Mount Burgess Mining NL |
MTB.AX | +33.33% |
| Exalt Resources Limited |
ERD.AX | +31.94% |
| Casa Minerals Inc. |
CASA.V | +30.00% |
| Cariboo Rose Resources Ltd |
CRB.V | +28.57% |
| Belmont Resources Inc. |
BEA.V | +28.57% |


