Freeport-McMoRan (FCX) has recently been on Zacks.com's list of the most searched stocks. Therefore, you might want to consider some of the key factors that could influence the stock's performance in the near future.
Shares of this mining company have returned +18.8% over the past month versus the Zacks S&P 500 composite's +0.4% change. The Zacks Mining – Non Ferrous industry, to which Freeport-McMoRan belongs, has gained 22.5% over this period. Now the key question is: Where could the stock be headed in the near term?
While media releases or rumors about a substantial change in a company's business prospects usually make its stock 'trending' and lead to an immediate price change, there are always some fundamental facts that eventually dominate the buy-and-hold decision-making.
Earnings Estimate Revisions
Here at Zacks, we prioritize appraising the change in the projection of a company's future earnings over anything else. That's because we believe the present value of its future stream of earnings is what determines the fair value for its stock.
We essentially look at how sell-side analysts covering the stock are revising their earnings estimates to reflect the impact of the latest business trends. And if earnings estimates go up for a company, the fair value for its stock goes up. A higher fair value than the current market price drives investors' interest in buying the stock, leading to its price moving higher. This is why empirical research shows a strong correlation between trends in earnings estimate revisions and near-term stock price movements.
For the current quarter, Freeport-McMoRan is expected to post earnings of $0.45 per share, indicating a change of +87.5% from the year-ago quarter. The Zacks Consensus Estimate has changed +19.2% over the last 30 days.
For the current fiscal year, the consensus earnings estimate of $2.31 points to a change of +30.5% from the prior year. Over the last 30 days, this estimate has changed +14.9%.
For the next fiscal year, the consensus earnings estimate of $2.7 indicates a change of +16.9% from what Freeport-McMoRan is expected to report a year ago. Over the past month, the estimate has changed +7.1%.
With an impressive externally audited track record, our proprietary stock rating tool — the Zacks Rank — is a more conclusive indicator of a stock's near-term price performance, as it effectively harnesses the power of earnings estimate revisions. The size of the recent change in the consensus estimate, along with three other factors related to earnings estimates, has resulted in a Zacks Rank #3 (Hold) for Freeport-McMoRan.
The chart below shows the evolution of the company's forward 12-month consensus EPS estimate:
12 Month EPS
Revenue Growth Forecast
While earnings growth is arguably the most superior indicator of a company's financial health, nothing happens as such if a business isn't able to grow its revenues. After all, it's nearly impossible for a company to increase its earnings for an extended period without increasing its revenues. So, it's important to know a company's potential revenue growth.
For Freeport-McMoRan, the consensus sales estimate for the current quarter of $5.82 billion indicates a year-over-year change of +1.6%. For the current and next fiscal years, $26.92 billion and $31.07 billion estimates indicate +3.9% and +15.4% changes, respectively.
Last Reported Results and Surprise History
Freeport-McMoRan reported revenues of $5.63 billion in the last reported quarter, representing a year-over-year change of -1.5%. EPS of $0.47 for the same period compares with $0.31 a year ago.
Compared to the Zacks Consensus Estimate of $5.18 billion, the reported revenues represent a surprise of +8.84%. The EPS surprise was +67.86%.
Over the last four quarters, Freeport-McMoRan surpassed consensus EPS estimates three times. The company topped consensus revenue estimates each time over this period.
Valuation
No investment decision can be efficient without considering a stock's valuation. Whether a stock's current price rightly reflects the intrinsic value of the underlying business and the company's growth prospects is an essential determinant of its future price performance.
Comparing the current value of a company's valuation multiples, such as its price-to-earnings (P/E), price-to-sales (P/S), and price-to-cash flow (P/CF), to its own historical values helps ascertain whether its stock is fairly valued, overvalued, or undervalued, whereas comparing the company relative to its peers on these parameters gives a good sense of how reasonable its stock price is.
The Zacks Value Style Score (part of the Zacks Style Scores system), which pays close attention to both traditional and unconventional valuation metrics to grade stocks from A to F (an A is better than a B; a B is better than a C; and so on), is pretty helpful in identifying whether a stock is overvalued, rightly valued, or temporarily undervalued.
Freeport-McMoRan is graded C on this front, indicating that it is trading at par with its peers. Click here to see the values of some of the valuation metrics that have driven this grade.
Bottom Line
The facts discussed here and much other information on Zacks.com might help determine whether or not it's worthwhile paying attention to the market buzz about Freeport-McMoRan. However, its Zacks Rank #3 does suggest that it may perform in line with the broader market in the near term.
Want the latest recommendations from Zacks Investment Research? Today, you can download 7 Best Stocks for the Next 30 Days. Click to get this free report
Freeport-McMoRan Inc. (FCX) : Free Stock Analysis Report
This article originally published on Zacks Investment Research (zacks.com).
-
Freeport has also commenced discussions, including the signing of NDAs and/or MoUs, with several potential strategic partners to advance its 100%-Owned Yandera Copper Project.
-
Copper prices have hit record levels in recent weeks as demand for copper undergoes an unprecedented structural supply deficit driven by the global energy transition.
-
Proximity to Asia, the world's largest copper refiner and consumer, positions the Yandera Copper Project as an attractive potential long-term source of copper supply.
Vancouver, British Columbia–(Newsfile Corp. – January 27, 2026) – Freeport Resources Inc. (TSXV: FRI) (OTCQB: FEERF) (FE: 4XH) (the "Company" or "Freeport Resources") is pleased to announce that it has entered into a Memorandum of Understanding ("MoU") with Kumul Minerals Holdings Limited ("Kumul Minerals"), Papua New Guinea's state-owned mining investment company (the "Parties"), to cooperate on the advancement and strategic development of the Yandera Copper Project located in Papua New Guinea ("PNG").
The MoU establishes a framework for collaboration and information sharing as the Parties evaluate potential pathways to advance Yandera, including coordinated engagement with government stakeholders and a review of strategic options that could support long-term project development. The MoU is non-binding and does not create any obligation for either party to complete a transaction or enter into a definitive agreement.
Freeport Resources retains full ownership and control of the Yandera Copper Project and continues to actively evaluate a range of financing and strategic alternatives to unlock value for shareholders. The Company believes that early, constructive engagement with Kumul Minerals reflects the State's interest in the orderly and transparent development of nationally significant mineral assets and enhances the project's strategic positioning.
"Kumul Minerals plays an important role in representing the State's commercial interests in Papua New Guinea's mining sector and brings valuable institutional insight," said Nathan Chutas, Senior VP Operations, Director and QP. "This MoU supports our efforts to advance Yandera while preserving full flexibility to pursue the most compelling outcomes for the project and its stakeholders." The MoU has an initial term of 90 days, during which the parties may explore potential structures for future cooperation. Any binding arrangements would be subject to further negotiation and the execution of definitive agreements.
Strategic Partners
The Company is also pleased to announce that it has commenced discussions with several potential strategic partners to advance the Yandera Copper Project to Definitive Feasibility Study. Discussions with potential strategic partners have included the signing of NDAs and, in certain instances, signing of non-binding, non-exclusive Memorandums of Understanding agreeing to cooperate in the further advancement, development and strategic planning for the Yandera Copper Project.
Freeport Resources has initiated this strategic outreach process with the objective of advancing the Project and maximizing its value. The Company believes the Project is significantly undervalued based on historical expenditures, current copper prices and the potential for resource expansion.
Gord Friesen, CEO, noted: "Freeport Resources has experienced a material increase in inbound interest relating to its wholly-owned Yandera Copper Project which the Company believes is driven by evolving macro conditions including record setting copper and gold prices coupled with Yandera Copper's strategic location in the Asia-Pacific region. Yandera is one of the world's largest undeveloped copper projects and ranks as the largest advanced, undeveloped copper project in Asia, the world's leading copper refiner and consumer. Over USD $200 million has been expended on the project since 2005, culminating in a comprehensive 2017 Pre-Feasibility Study delineating one of the world's largest undeveloped copper resources.* With the copper price hitting new highs on unprecedented demand, timing for discussions is ideal and we are excited to have commenced discourse with potential strategic partners to advance the project through to a Definitive Feasibility Study and development of the mine. We look forward to updating shareholders as discussions progress."
Yandera's scale and proximity to key Asian markets creates opportunities to secure strategic partnerships and long-term offtake agreements with potential Strategic Investors to support project financing efforts. The Company has entered into discussions with institutional and potential strategic partners seeking exposure to large-scale, long-life copper resources through structured upstream arrangements spanning joint ventures, equity ownership, project financing and offtake arrangements.
Mr. Nathan Chutas, Senior VP Operations, Director and QP of Freeport Resources, stated: "While our discussions to date with interested parties have been positive, there is no guarantee of a transaction being successfully concluded and any binding commitments will require the negotiation and execution of definitive documentation. We will endeavor to keep investors informed in a timely manner of any material developments. Advancing this project will require full support from all levels of government including the Government of Papua New Guinea, the Province of Madang, the district of Usino-Bundi and, last but not least, the community and stakeholders of Yandera. Freeport will continue to work and communicate with community leaders and representatives at all levels of government as talks progress to advance this important project."
Readers are cautioned that the discussions with potential strategic partners are at a preliminary stage and conclusion of any transaction remains subject to the successful completion of due diligence, negotiation of definitive documentation and receipt of any required regulatory approvals.
Freeport Resources would also like to congratulate Hon. Solen Loifa from OUR Party on his appointment as the new Mining Minister of Papua New Guinea. The Company welcomes his appointment and looks forward to working with the new Minister on the advancement of Yandera.
About Kumul Minerals Holdings Limited
Kumul Minerals Holdings Limited is Papua New Guinea's state-owned mineral investment company, responsible for managing the State's equity interests in major resource projects and acting as the government's commercial interface with industry participants. Kumul Minerals focuses on portfolio stewardship, governance, and long-term value creation through partnerships with domestic and international developers. Its early engagement with the Yandera project reflects a mandate to support transparent, commercially sound development aligned with national economic objectives, the interests of stakeholders and the community of Yandera.
About the Yandera Copper Project
Over US$200 million in exploration and development expenditures have been completed to date on Freeport Resources' wholly owned Yandera Copper Project including a 2017 Pre-Feasibility Study, prepared by Worley Parsons. * Using current prices, the estimated historical Measured and Indicated Resource is 727 million tonnes grading 0.45% copper equivalent. The Yandera Copper Project is strategically located within the Bismarck Intrusive Complex of PNG, within the Papuan Fold Belt which is host to premier ore bodies such as Grasberg, Ok Tedi, Porgera, Hidden Valley, Wafi-Golpu and Frieda River. It is hosted within a 245-square kilometre tenement package, in Madang Province.
* Independent Technical Report on the Yandera Project – Pre-Feasibility Study, prepared for Era Resources Inc. and dated effective November 27, 2017. The study was prepared prior to the Company acquiring an interest in the Yandera Project and is derived from historical estimates which the Company is not treating as current. This information is intended to provide readers with context on historical analysis conducted on the Yandera Project, however the Company cautions that a qualified person has not done sufficient work to classify any historical estimates in respect of the Yandera Project as current and any analysis conducted by previous owners of the Project may rely upon assumptions which are no longer reasonable or accurate in the context of the current market. The Company would need to conduct an exploration program, including twinning of historical drill holes in order to verify any historical estimates as current mineral resources. The Company is not aware of any more recent mineral resource estimate for the Yandera Copper Project.
Qualified Person
Dr. Nathan Chutas, PhD, CPG, Senior Vice-President of Operations for Freeport Resources, is a qualified person for the purposes of National Instrument 43-101. Dr. Chutas has reviewed and approved the technical content in this announcement.
About Freeport Resources Inc.
Freeport Resources is a Canadian mineral exploration company with a primary focus on advancing the development of its 100%-owned Yandera copper-gold-molybdenum project, located in Madang Province, Papua New Guinea. The Yandera project is one of the largest undeveloped copper-gold deposits in the world covering approximately 245.5 square kilometers.
Please visit www.freeportresources.com or contact the email address below for more information.
On behalf of the Board,Freeport Resources Inc.Gord Friesen, Chief Executive OfficerT. (236) 334-1660E. gord@freeportresources.comwww.freeportresources.com
Neither the TSX Venture Exchange nor its Regulation Services Provider (as that term is defined in policies of the TSX Venture Exchange) accepts responsibility for the adequacy or accuracy of this release.
This news release may contain certain "Forward-Looking Statements" within the meaning of the United States Private Securities Litigation Reform Act of 1995 and applicable Canadian securities laws. When or if used in this news release, the words "anticipate", "believe", "estimate", "expect", "target", "plan", "forecast", "may", "schedule", "intends" and similar words or expressions identify forward-looking statements or information. Such statements represent the Company's current views with respect to future events and are necessarily based upon a number of assumptions and estimates that, while considered reasonable by the Company, are inherently subject to significant business, economic, competitive, political and social risks, contingencies and uncertainties. Examples of such statements include, but are not limited to, statements with respect to the development of the Yandera Copper Project and the use of proceeds from the Offering. The material factors and assumptions used to develop the forward – looking information contained in this news release include, but are not limited to, key personnel and qualified employees continuing their involvement with the Company; the Company's ability to secure additional financing on reasonable terms; the competitive conditions of the sector in which the Company operates; and laws and any amendments thereto applicable to the Company.
Many uncertainties and factors, both known and unknown, could cause results, performance or achievements to be materially different from the results, performance or achievements that are or may be expressed or implied by such forward-looking statements, including, without limitation, risks relating to the future business plans of the Company; risks related to the exploration and development of the Yandera Copper Project; risks that the Company will not be able to retain its key personnel; and risks that the Company will not be able to secure financing on reasonable terms or at all. The Company does not intend, and does not assume any obligation, to update these forward-looking statements or information to reflect changes in assumptions or changes in circumstances or any other events affecting such statements and information other than as required by applicable laws, rules and regulations.
To view the source version of this press release, please visit https://www.newsfilecorp.com/release/281721
Vancouver, British Columbia–(Newsfile Corp. – January 27, 2026) – Ridgeline Minerals Corp. (TSXV: RDG) (OTCQB: RDGMF) (FSE: 0GC0) ("Ridgeline" or the "Company") is pleased to welcome Mr. Ryan Walchuck to the Board of Directors of the Company. Mr. Duane Lo will resign as a director of the Company and remain in his position as Chief Financial Officer.
Mr. Walchuck is a senior mining finance executive with global experience across complex mining projects, joint ventures, and multi-stakeholder partnerships. He is currently Senior Manager, Business Analysis at Rio Tinto, where he supports strategic investment decisions, capital allocation, and value optimization for projects. Ryan has held senior roles at Rio Tinto and BHP, contributing to major developments including Simandou and Oyu Tolgoi, with a strong focus on joint venture governance, partner alignment, and disciplined capital deployment. His experience spans Africa, Australia, Mongolia, and the Americas. Ryan is a Chartered Accountant and Chartered Business Valuator, bringing strong financial oversight, governance, and shareholder-focused decision-making experience to the Ridgeline Board.
Chad Peters, Ridgeline's President & CEO, commented, "Ryan joins the team at a pivotal time in Ridgeline's growth. With two highly prospective discoveries coming together at Swift and Selena, Ryan's unique skillset will help guide our strategic decision making as we focus on optimizing the value of our joint venture portfolio for our shareholders."
The Company further advises it has granted 150,000 stock options (the "Options") and 100,000 deferred share unites ("DSU's") to Mr. Walchuck in accordance with the Company's incentive stock option plan. The Options are exercisable at $0.24 per share for a period of five years and the DSUs are governed by the Company's DSU Plan and will be subject to applicable securities law hold periods.
About Ridgeline Minerals Corp.Ridgeline Minerals is a discovery focused precious and base metal explorer with a proven management team and a 200 km2 exploration portfolio across seven projects in Nevada, USA. The Company is a hybrid explorer with a mix of 100%-owned exploration assets (Big Blue, Atlas, Bell Creek & Coyote) as well as two earn-in exploration agreements with Nevada Gold Mines at its Swift and Black Ridge projects and a third earn-in with South32 at its Selena project totaling up to US $60 million in partner-funded exploration expenditures. More information about Ridgeline can be found at www.ridgelineminerals.com.
On behalf of the Board "Chad Peters" President & CEO
Further Information:Chad Peters, P.Geo. President, CEO & Director Ridgeline Minerals Corp.+1 775 304 9773cpeters@ridgelineminerals.com
Neither the TSX Venture Exchange nor its Regulation Service Provider (as that term is defined in the policies of the TSX Venture Exchange) accepts responsibility for the adequacy or accuracy of this press release
Cautionary Note regarding Forward-Looking Statements
Statements contained in this press release that are not historical facts are "forward-looking information" or "forward-looking statements" (collectively, "Forward-Looking Information") within the meaning of applicable Canadian securities legislation and the United States Private Securities Litigation Reform Act of 1995. Forward-Looking Information includes, but is not limited to, the assay results for core hole SW24-004 and the potential significance thereof. The words "potential", "anticipate", "meaningful", "significant", "pending", "believe", "estimate", "expect", "may", "will", "project", "plan", "historical", "historic" and similar expressions are intended to be among the statements that identify Forward-Looking Information. Forward-Looking Information involves known and unknown risks, uncertainties and other factors which may cause the actual results to be materially different from any future results expressed or implied by the Forward-Looking Information. In preparing the Forward-Looking Information in this news release, Ridgeline has applied several material assumptions, including, but not limited to, assumptions that the current objectives concerning the Swift project can be achieved and that its other corporate activities will proceed as expected; that general business and economic conditions will not change in a materially adverse manner; and that all requisite information will be available in a timely manner. Forward-Looking Information involves known and unknown risks, uncertainties and other factors which may cause the actual results, performance, or achievements of Ridgeline to be materially different from any future results, performance or achievements expressed or implied by the Forward-Looking Information. Such risks and other factors include, among others, risks related to dependence on key personnel; risks related to unforeseen delays; risks related to historical data that has not been verified by the Company; as well as those factors discussed in Ridgeline's public disclosure record. Although Ridgeline has attempted to identify important factors that could affect Ridgeline and may cause actual actions, events, or results to differ materially from those described in Forward-Looking Information, there may be other factors that cause actions, events or results not to be as anticipated, estimated or intended. There can be no assurance that Forward-Looking Information will prove to be accurate, as actual results and future events could differ materially from those anticipated in such statements. Accordingly, readers should not place undue reliance on Forward-Looking Information. Except as required by law, Ridgeline does not assume any obligation to release publicly any revisions to Forward-Looking Information contained in this news release to reflect events or circumstances after the date hereof or to reflect the occurrence of unanticipated events.
To view the source version of this press release, please visit https://www.newsfilecorp.com/release/281756
As the Australian market enters Week 5 with a notable rise in precious metals and equities, small-cap stocks are drawing attention amid a “risk-on” sentiment that echoes early 2022. In this dynamic environment, identifying promising small caps requires an eye for companies poised to benefit from current economic trends and sector-specific developments.
Top 10 Undiscovered Gems With Strong Fundamentals In Australia
| Name | Debt To Equity | Revenue Growth | Earnings Growth | Health Rating |
|---|---|---|---|---|
| Fiducian Group | NA | 10.00% | 9.57% | ★★★★★★ |
| Joyce | NA | 9.93% | 17.54% | ★★★★★★ |
| Spheria Emerging Companies | NA | -1.31% | 0.28% | ★★★★★★ |
| Euroz Hartleys Group | NA | 1.82% | -25.32% | ★★★★★★ |
| Hearts and Minds Investments | NA | 56.27% | 59.19% | ★★★★★★ |
| Argosy Minerals | NA | -12.81% | -19.89% | ★★★★★★ |
| Focus Minerals | NA | 75.35% | 51.34% | ★★★★★★ |
| AMCIL | NA | 2.99% | 1.18% | ★★★★★☆ |
| Zimplats Holdings | 5.44% | -9.79% | -42.03% | ★★★★★☆ |
| Australian United Investment | 1.90% | 5.23% | 4.56% | ★★★★☆☆ |
Let’s uncover some gems from our specialized screener.
Simply Wall St Value Rating: ★★★★★☆
Overview: Diversified United Investment Limited is a publicly owned investment manager with a market capitalization of A$1.14 billion.
Operations: DUI generates revenue primarily from its investment company segment, amounting to A$46.71 million.
Diversified United Investment (DUI) stands out with its debt-free status, a significant shift from a 9% debt-to-equity ratio five years ago. Earnings have increased by 5% annually over the past five years, although recent growth of 5.4% lagged behind the industry’s 14.4%. Despite this, DUI boasts high-quality earnings and positive free cash flow, providing a stable foundation for future endeavors. However, notable insider selling in the last quarter may raise some eyebrows among investors. With A$39 million in levered free cash flow as of June 2025, DUI’s financial health appears robust amidst industry challenges.
ASX:DUI Debt to Equity as at Jan 2026Metals X
Simply Wall St Value Rating: ★★★★★★
Overview: Metals X Limited is an Australian company focused on tin production, with a market capitalization of A$1.14 billion.
Operations: The primary revenue stream for Metals X comes from its 50% stake in the Renison Tin Operation, generating A$271.38 million.
Metals X, a nimble player in the mining sector, showcases a compelling financial profile with its debt-free status contrasting sharply against its previous 58.3% debt-to-equity ratio five years ago. The company reported a staggering earnings growth of 708%, significantly outpacing the industry average of 10%. Despite this impressive performance, it’s worth noting that their earnings are expected to see an average annual decline of nearly 15% over the next three years. A recent one-off gain of A$38 million has notably impacted their latest financial results, adding complexity to evaluating ongoing profitability.
- Dive into the specifics of Metals X here with our thorough health report.
-
Evaluate Metals X’s historical performance by accessing our past performance report.
ASX:MLX Earnings and Revenue Growth as at Jan 2026Wagners Holding
Simply Wall St Value Rating: ★★★★★☆
Overview: Wagners Holding Company Limited is involved in the production and sale of construction materials and related building products across several international markets, including Australia, the United States, New Zealand, the United Kingdom, Papua New Guinea, and Malaysia, with a market cap of A$742.97 million.
Operations: Wagners Holding generates revenue primarily from Construction Materials (A$257.69 million), Project Services (A$105.71 million), and Composite Fibre Technology (A$68.45 million). The net profit margin is a key indicator to assess financial performance, but specific trends are not provided here.
Wagners Holding, a small player in the Australian market, has shown impressive earnings growth of 120.9% over the past year, outpacing the Basic Materials industry significantly. The company’s net debt to equity ratio stands at a satisfactory 12.6%, having improved from 65.9% five years ago, indicating prudent financial management. Their interest payments are well covered by EBIT at 3.9 times coverage, reflecting robust operational performance. With operations expanding in concrete and quarry sectors and momentum in Composite Fiber Technologies driven by utility investments, Wagners is set for growth despite risks from capital expenditures and regional construction dependency.
ASX:WGN Debt to Equity as at Jan 2026Next Steps
- Navigate through the entire inventory of 64 ASX Undiscovered Gems With Strong Fundamentals here.
- Are any of these part of your asset mix? Tap into the analytical power of Simply Wall St’s portfolio to get a 360-degree view on how they’re shaping up.
- Streamline your investment strategy with Simply Wall St’s app for free and benefit from extensive research on stocks across all corners of the world.
Want To Explore Some Alternatives?
- Explore high-performing small cap companies that haven’t yet garnered significant analyst attention.
- Fuel your portfolio with companies showing strong growth potential, backed by optimistic outlooks both from analysts and management.
- Find companies with promising cash flow potential yet trading below their fair value.
This article by Simply Wall St is general in nature. We provide commentary based on historical data
and analyst forecasts only using an unbiased methodology and our articles are not intended to be financial advice. It does not constitute a recommendation to buy or sell any stock, and does not take account of your objectives, or your
financial situation. We aim to bring you long-term focused analysis driven by fundamental data.
Note that our analysis may not factor in the latest price-sensitive company announcements or qualitative material.
Simply Wall St has no position in any stocks mentioned.
Companies discussed in this article include ASX:DUI ASX:MLX and ASX:WGN.
Have feedback on this article? Concerned about the content? Get in touch with us directly. Alternatively, email editorial-team@simplywallst.com
As the Canadian market navigates a period of steady interest rates and cooling inflation, small-cap stocks have been lagging behind their larger counterparts, creating an intriguing landscape for investors seeking potential opportunities. In this environment, identifying undiscovered gems requires a keen focus on companies with strong fundamentals and promising growth prospects that can thrive despite broader market rotations.
Top 10 Undiscovered Gems With Strong Fundamentals In Canada
| Name | Debt To Equity | Revenue Growth | Earnings Growth | Health Rating |
|---|---|---|---|---|
| Pulse Seismic | NA | 13.62% | 30.86% | ★★★★★★ |
| Itafos | 20.68% | 9.86% | 37.00% | ★★★★★★ |
| Soma Gold | 37.84% | 26.84% | 22.13% | ★★★★★★ |
| Mako Mining | 5.29% | 37.41% | 60.51% | ★★★★★★ |
| Melcor Developments | 47.67% | 8.75% | 12.05% | ★★★★☆☆ |
| Corby Spirit and Wine | 54.56% | 11.67% | -4.04% | ★★★★☆☆ |
| Dundee | 1.46% | -35.04% | 52.59% | ★★★★☆☆ |
| Kiwetinohk Energy | 23.09% | 21.68% | 30.98% | ★★★★☆☆ |
| Golconda Gold | 5.79% | 23.57% | 35.09% | ★★★★☆☆ |
| Grown Rogue International | 37.38% | 28.22% | 14.92% | ★★★★☆☆ |
We’re going to check out a few of the best picks from our screener tool.
Simply Wall St Value Rating: ★★★★★★
Overview: Alphamin Resources Corp. is involved in the production and sale of tin concentrate, with a market capitalization of approximately CA$1.79 billion.
Operations: Alphamin generates revenue primarily from the production and sale of tin concentrate, reporting $574.22 million from its Bisie Tin Mine. The company’s financial performance is highlighted by a net profit margin of 31%.
Alphamin Resources, a notable player in the tin mining sector, has seen its debt to equity ratio decrease from 31.4% to 9% over five years, indicating improved financial health. With a price-to-earnings ratio of 11.1x below the Canadian market average of 17.4x, it presents good value compared to peers. The company reported earnings growth of 29.1% annually over the past five years and recently achieved annual tin production aligned with guidance at 18,576 tonnes for FY2025 despite operational disruptions earlier in the year due to security concerns. Leadership changes are underway as CEO Maritz Smith retires, with CFO Eoin O’Driscoll stepping up as his successor in March 2026.
TSXV:AFM Earnings and Revenue Growth as at Jan 2026Mako Mining
Simply Wall St Value Rating: ★★★★★★
Overview: Mako Mining Corp. is involved in gold mining and exploration operations in Nicaragua, with a market capitalization of CA$870.09 million.
Operations: Mako Mining generates revenue primarily from the production of gold, amounting to $126.93 million.
Mako Mining showcases robust financial health with earnings growing 60.5% annually over five years and a reduced debt-to-equity ratio from 89.1% to 5.3%. The company is trading at a significant discount, valued at 64.3% below its estimated fair value, while maintaining high-quality earnings and positive free cash flow. Recent developments include an updated mineral resource estimate for the Moss Mine Gold Project, revealing substantial gold and silver reserves, enhancing project economics due to unencumbered silver ounces post-bankruptcy acquisition adjustments. With interest payments covered by EBIT at 73.8 times, Mako appears financially sound despite not outpacing industry growth rates recently.
- Take a closer look at Mako Mining’s potential here in our health report.
-
Examine Mako Mining’s past performance report to understand how it has performed in the past.
TSXV:MKO Earnings and Revenue Growth as at Jan 2026Santacruz Silver Mining
Simply Wall St Value Rating: ★★★★★★
Overview: Santacruz Silver Mining Ltd. is involved in acquiring, exploring, developing, producing, and operating mineral properties in Latin America with a market capitalization of CA$1.98 billion.
Operations: Revenue is primarily generated from the Porco, Bolivar, Zimapan, San Lucas, and Caballo Blanco Group segments, with Zimapan contributing $93.41 million and San Lucas $89.89 million. The company’s net profit margin shows variability across periods without consistent trends observed in the data provided.
Santacruz Silver Mining, a nimble player in the metals sector, boasts a price-to-earnings ratio of 24.1x, undercutting the industry average of 27.9x. Despite recent challenges with a net profit margin dipping to 19.5% from last year’s 54.4%, it continues to hold more cash than its total debt, showcasing financial resilience. The company reported silver equivalent production of over 14 million ounces for 2025 but faced an earnings contraction of -57.6%. However, EBIT covers interest payments comfortably at 107 times, suggesting solid operational efficiency amidst significant insider selling recently observed.
- Get an in-depth perspective on Santacruz Silver Mining’s performance by reading our health report here.
-
Assess Santacruz Silver Mining’s past performance with our detailed historical performance reports.
TSXV:SCZ Debt to Equity as at Jan 2026Summing It All Up
- Discover the full array of 49 TSX Undiscovered Gems With Strong Fundamentals right here.
- Shareholder in one or more of these companies? Ensure you’re never caught off-guard by adding your portfolio in Simply Wall St for timely alerts on significant stock developments.
- Streamline your investment strategy with Simply Wall St’s app for free and benefit from extensive research on stocks across all corners of the world.
Ready To Venture Into Other Investment Styles?
- Explore high-performing small cap companies that haven’t yet garnered significant analyst attention.
- Fuel your portfolio with companies showing strong growth potential, backed by optimistic outlooks both from analysts and management.
- Find companies with promising cash flow potential yet trading below their fair value.
This article by Simply Wall St is general in nature. We provide commentary based on historical data
and analyst forecasts only using an unbiased methodology and our articles are not intended to be financial advice. It does not constitute a recommendation to buy or sell any stock, and does not take account of your objectives, or your
financial situation. We aim to bring you long-term focused analysis driven by fundamental data.
Note that our analysis may not factor in the latest price-sensitive company announcements or qualitative material.
Simply Wall St has no position in any stocks mentioned.
Companies discussed in this article include TSXV:AFM TSXV:MKO and TSXV:SCZ.
Have feedback on this article? Concerned about the content? Get in touch with us directly. Alternatively, email editorial-team@simplywallst.com
As the Bank of Canada prepares to meet, investors are closely watching for signs that current interest rates will continue to support the Canadian economy amidst cooling price pressures. In this environment, dividend stocks on the TSX can offer stability and income potential, making them an attractive option for those seeking reliable returns in a market characterized by cautious monetary policy.
Top 10 Dividend Stocks In Canada
| Name | Dividend Yield | Dividend Rating |
| Transcontinental (TSX:TCL.A) | 3.88% | ★★★★★☆ |
| Toronto-Dominion Bank (TSX:TD) | 3.32% | ★★★★★☆ |
| Pulse Seismic (TSX:PSD) | 12.34% | ★★★★★☆ |
| Power Corporation of Canada (TSX:POW) | 3.51% | ★★★★★☆ |
| Olympia Financial Group (TSX:OLY) | 6.21% | ★★★★★☆ |
| National Bank of Canada (TSX:NA) | 3.00% | ★★★★★☆ |
| Great-West Lifeco (TSX:GWO) | 3.79% | ★★★★★☆ |
| Firm Capital Mortgage Investment (TSX:FC) | 8.39% | ★★★★★☆ |
| Canadian Imperial Bank of Commerce (TSX:CM) | 3.41% | ★★★★★☆ |
| Bank of Montreal (TSX:BMO) | 3.56% | ★★★★★☆ |
Click here to see the full list of 19 stocks from our Top TSX Dividend Stocks screener.
We’ll examine a selection from our screener results.
Canadian Imperial Bank of Commerce
Simply Wall St Dividend Rating: ★★★★★☆
Overview: Canadian Imperial Bank of Commerce is a diversified financial institution offering a range of financial products and services to personal, business, public sector, and institutional clients across Canada, the United States, and internationally, with a market cap of CA$117.57 billion.
Operations: Canadian Imperial Bank of Commerce generates revenue from Canadian Personal and Business Banking (CA$10.27 billion), Capital Markets and Direct Financial Services (CA$5.94 billion), U.S. Commercial Banking and Wealth Management (CA$3.04 billion), and Canadian Commercial Banking and Wealth Management (CA$6.74 billion).
Dividend Yield: 3.4%
Canadian Imperial Bank of Commerce offers a stable dividend with a payout ratio of 45%, ensuring dividends are well covered by earnings. Although its current yield of 3.41% is lower than the top Canadian dividend payers, it remains reliable and has grown over the past decade. Recent fixed-income offerings indicate robust financial management, while earnings have shown significant growth, enhancing its capacity to sustain and potentially increase future dividends.
- Click here and access our complete dividend analysis report to understand the dynamics of Canadian Imperial Bank of Commerce.
- Our valuation report unveils the possibility Canadian Imperial Bank of Commerce’s shares may be trading at a discount.
TSX:CM Dividend History as at Jan 2026Suncor Energy
Simply Wall St Dividend Rating: ★★★★☆☆
Overview: Suncor Energy Inc. is an integrated energy company operating in Canada, the United States, and internationally with a market cap of CA$83.97 billion.
Operations: Suncor Energy Inc.’s revenue segments include Oil Sands at CA$25.06 billion, Refining and Marketing at CA$30.57 billion, and Exploration and Production at CA$2.03 billion.
Dividend Yield: 3.4%
Suncor Energy’s dividend is supported by a 53.1% payout ratio and a low cash payout ratio of 36%, indicating strong coverage from earnings and cash flows. Despite recent volatility, dividends have grown over the past decade. Trading at 14.9% below fair value suggests potential upside, though its yield of 3.42% lags behind top Canadian payers. Recent debt financing of $1 billion aims to manage existing liabilities, reflecting prudent financial management amidst fluctuating profit margins.
- Delve into the full analysis dividend report here for a deeper understanding of Suncor Energy.
- Our comprehensive valuation report raises the possibility that Suncor Energy is priced lower than what may be justified by its financials.
TSX:SU Dividend History as at Jan 2026Alphamin Resources
Simply Wall St Dividend Rating: ★★★★☆☆
Overview: Alphamin Resources Corp. and its subsidiaries focus on the production and sale of tin concentrate, with a market capitalization of approximately CA$1.79 billion.
Operations: Alphamin Resources Corp. generates revenue primarily from the production and sale of tin concentrate, amounting to $574.22 million.
Dividend Yield: 5.5%
Alphamin Resources’ dividend is covered by earnings and cash flows, with a payout ratio of 81.9% and a cash payout ratio of 46.2%. Despite being in the top 25% for yield in Canada, its dividend history is unstable due to volatility over its four-year payment period. The company’s P/E ratio of 11.1x suggests good value compared to the Canadian market average. Recent executive changes may impact future strategic direction but production guidance remains positive with an increase expected in tin output for 2026.
- Get an in-depth perspective on Alphamin Resources’ performance by reading our dividend report here.
- Insights from our recent valuation report point to the potential undervaluation of Alphamin Resources shares in the market.
TSXV:AFM Dividend History as at Jan 2026Key Takeaways
- Navigate through the entire inventory of 19 Top TSX Dividend Stocks here.
- Have a stake in these businesses? Integrate your holdings into Simply Wall St’s portfolio for notifications and detailed stock reports.
- Unlock the power of informed investing with Simply Wall St, your free guide to navigating stock markets worldwide.
Interested In Other Possibilities?
- Explore high-performing small cap companies that haven’t yet garnered significant analyst attention.
- Fuel your portfolio with companies showing strong growth potential, backed by optimistic outlooks both from analysts and management.
- Find companies with promising cash flow potential yet trading below their fair value.
This article by Simply Wall St is general in nature. We provide commentary based on historical data
and analyst forecasts only using an unbiased methodology and our articles are not intended to be financial advice. It does not constitute a recommendation to buy or sell any stock, and does not take account of your objectives, or your
financial situation. We aim to bring you long-term focused analysis driven by fundamental data.
Note that our analysis may not factor in the latest price-sensitive company announcements or qualitative material.
Simply Wall St has no position in any stocks mentioned.
Companies discussed in this article include TSX:CM TSX:SU and TSXV:AFM.
This article was originally published by Simply Wall St.
Have feedback on this article? Concerned about the content? Get in touch with us directly. Alternatively, email editorial-team@simplywallst.com
STOCKSTOWATCHTODAY BLOG
In a world dominated by geopolitical uncertainty, tariffs and elevated public debt, it is no surprise that investors have flocked to haven assets like gold. That surge has directly benefited the companies pulling it out of the ground.
surged past the $5,000 milestone Monday, jumping 2.2% to $5,088. The yellow metal has climbed 85% over the past 12 months.
Gold miners, in turn, have picked up the baton. In premarket trading,
was up 5.5% and
climbed 2.9%.
a gold producer that is perhaps best known for mining copper, rose 4% to $62.80. The stock was just a few cents below its record closing high of $62.93, which it hit on May 20, 2008, according to Dow Jones Market Data.
were up 1% to $6 a pound on Monday.
Higher gold prices typically increase mining companies’ revenue and margins. Looking ahead, expectations of a sustained gold rally look set to encourage even greater equity inflows into major miners.
“The combination of a softer dollar, persistent geopolitical tension and ongoing diversification flows away from U.S. assets continues to fuel the [gold] rally,” said Neil Walsh, head of metals at Britannia Global Markets.
With global financial markets already jittery on the back of recent foreign policy interventions by the Trump administration, growing fears of another U.S. government shutdown have amplified gold’s recent gains.
Over the weekend, Democrats threatened to block a federal funding package—which expires on Jan.31—following the fatal shooting of U.S. citizen in Minneapolis by a federal agent. That could lead to a partial shutdown.
As political uncertainty across the world persists, the price of gold— together with the share prices of major mining companies—look set to increase.
Write to Alex Kozul-Wright at alexander.kozul-wright@barrons.com
TORONTO, Jan. 26, 2026 /CNW/ – Bravo Mining Corp. (TSXV: BRVO) (OTCQX: BRVMF) ("Bravo" or the "Company") welcomes the publication of Presidential Decree No. 12,823, signed on January 22, 2026, by President Luiz Inácio Lula da Silva, which formally creates the Export Processing Zone of Barcarena (ZPE Barcarena) in the Municipality of Barcarena, State of Pará. The Decree was published on January 23, 2026 in the Diário Oficial da União, Brazil's Federal Gazette. Link here: DECRETO Nº 12.823
The decree represents the final federal act establishing the ZPE, following its prior approval by Brazil's National Council of Export Processing Zones (CZPE). As previously announced on November 5, 2025, Bravo has been selected to anchor the ZPE Barcarena, becoming the first mineral project ever designated as an anchor tenant of a Brazilian ZPE.
In this context, the publication of the Presidential Decree strengthens Bravo's Alternate Case development scenario as such detailed in our Preliminary Economic Assessment ("PEA", see press release dated on July 7, 2025), which contemplates the use of the ZPE Barcarena fiscal framework to enable local processing and vertical integration of metals potentially produced from the Luanga palladium + platinum + rhodium + gold + nickel project ("Luanga Project" or "Luanga PGM+Au+Ni Project").
The formal creation of the ZPE enhances regulatory certainty around this complementary pathway and reinforces the strategic alignment of the Company's potential development plans with Brazil's national industrial policy and Pará's economic development agenda.
The initiative was led by the Government of the State of Pará, through the Secretariat of Economic Development, Mining and Energy (SEDEME) and the Economic Development Company of Pará (CODEC), in partnership with Bravo, and in coordination with the Brazil's Ministry of Mines and Energy (MME), Federation of Industries of Pará (FIEPA), the State Secretariat for the Environment of Pará (SEMA), and the Municipality of Barcarena.
"The signing of the Presidential Decree formally creating the ZPE Barcarena is a significant milestone for Bravo and materially advances regulatory certainty around our development scenario," said Luís Azevedo, Chairman and CEO of Bravo. "Coming on the heels of the recent closing of our oversubscribed equity financing for net proceeds of ~C$81.8 million, completed amid strong investor demand and an improving PGM price environment, with the 4PGE* basket price now approximately 60% higher than the price used in our PEA, this development further reinforces our confidence in the long-term strategic positioning of the Luanga Project. Together, these milestones highlight both the strength of our asset and the growing alignment between Bravo's development strategy and Brazil's industrial and economic objectives".
*4PGE = Platinum, Palladium, Rhodium and Gold
Barcarena Export Processing Zone (ZPE)
As detailed in the Company's press release dated November 5, 2025, the ZPE Barcarena is located within the Industrial District of Barcarena, at the Port of Vila do Conde in Barcarena, and comprises approximately 271 hectares, strategically positioned near deep-water ports, energy infrastructure, and established industrial logistics corridors.
Under Brazil's ZPE framework, companies operating within the zone benefit from a differentiated regulatory, tax, and customs regime designed to promote industrialization, exports, and value-added processing.
The establishment of the ZPE significantly enhances Bravo's PEA Alternate Scenario (vertical integration) by providing access to a range of structural benefits, including potential capital and operating cost savings through exemptions on imported equipment and supplies, as well as tax-advantaged export treatment from a strategically located industrial hub with direct access to the existing maritime infrastructure.
The ZPE Barcarena is an established industrial district that hosts multiple fertilizer and chemical producers, many of which are constrained by reliance on imported sulphuric acid. This limitation creates a potential local market for sulphuric acid that would be produced as a by-product of the vertical integration smelting process. Consequently, sulphuric acid is an essential component for fertilizer production in Brazil, and Bravo's potential acid by-product may represent an additional revenue stream.
To illustrate the potential of this opportunity, the PEA assumed a sulphuric acid sales credit of US$160/t, while recent market prices have reached approximately US$440/t. At current prices, it has been reported that some major fertilizer producers have temporarily suspended production. Consequently, providing a local source of acid could potentially benefit the local fertilizer producers and Bravo's margins.
Importantly, the Base Case for the Luanga Project, which contemplates concentrate sales only, already exhibits strong standalone economics, providing a solid foundation for the evaluation of additional development alternatives. This highlights the potential project's resilience across a range of scenarios, particularly in the context of prevailing PGM prices and supportive market fundamentals.
While vertical (downstream) integration is typical in the PGM sector, many projects still face constraints related to limited smelting capacity and/or access to processing facilities. In this context, the Barcarena ZPE provides Bravo with additional optionality and strategic flexibility, strengthening the range of complementary development pathways available to the Company. Further, the Barcarana ZPE with access to the Atlantic Ocean provides opportunities for import and re-export of third-party nickel and/or PGM concentrates within the ZPE framework.
About Bravo Mining Corp.
Bravo is a Canadian and Brazil-based mineral exploration and development company focused on advancing its PGM and copper-gold Luanga Project in the Carajás Mineral Province, Pará State, Brazil.
Bravo is one of the most active explorers in Carajás. The team, comprising of local and international geologists, has a proven track record of PGM, nickel, and copper discoveries in the region. They have successfully taken a past IOCG greenfield project from discovery to development and production in the Carajás.
The Luanga Project is situated on mature freehold farming land and benefits from being located close to operating mines and a mining-experienced workforce, with excellent access and proximity to existing infrastructure, including road, rail, and hydroelectric grid power. Bravo's current Environmental, Social and Governance activities include planting more than 50,000 high-value trees in and around the project area and hiring and contracting locally.
Neither TSX Venture Exchange nor its Regulation Services Provider (as that term is defined in policies of the TSX Venture Exchange) accepts responsibility for the adequacy or accuracy of this release.
Forward Looking Statements
This news release contains forward-looking information which is not comprised of historical facts. Forward-looking information is characterized by words such as "potential", "benefit", ''significant ", "supports", "positions", "aims", "is aligned with", variants of these words and other similar words, phrases, or statements that certain events or conditions "could", "may", "should", "will" or "would" occur. Forward-looking information involves risks, uncertainties and other factors that could cause actual events, results, and opportunities to differ materially from those expressed or implied by such forward-looking information. Factors that could cause actual results to differ materially from such forward-looking information include, but are not limited to, unexpected results from exploration programs, changes in the state of equity and debt markets, fluctuations in commodity prices, delays in obtaining required regulatory or governmental approvals, environmental risks, limitations on insurance coverage; and other risks and uncertainties involved in the mineral exploration and development industry. Forward-looking information in this news release is based on the opinions and assumptions of management considered reasonable as of the date hereof, including, but not limited to: whether or not the economic scenarios outlined in the Luanga PEA are supported by any future pre-feasibility and feasibility studies and the timing and result thereof; whether or not the Luanga deposit is developed; whether or not the Barcarena ZPE is utilized for downstream processing of concentrates from the Luanga deposit; whether there will be buyers of acid in proximity to any smelter developed and, if so, under what terms and conditions; whether any third parties would want to use a smelter developed within the Barcarana ZPE and, if so, on what terms and conditions; whether currently higher PGM prices will be sustained and, if so, for how long; that activities will not be adversely disrupted or impeded by regulatory, political, community, economic, environmental and/or healthy and safety risks; that the Luanga Project will not be materially affected by potential supply chain disruptions; and general business and economic conditions will not change in a materially adverse manner. Although the Company believes that the assumptions and factors used in preparing the forward-looking information in this news release are reasonable, undue reliance should not be placed on such information. The Company disclaims any intention or obligation to update or revise any forward-looking information, other than as required by applicable securities laws.
View original content to download multimedia: http://www.newswire.ca/en/releases/archive/January2026/26/c8506.html
Vancouver, British Columbia–(Newsfile Corp. – January 26, 2026) – Wealth Minerals Ltd. (TSXV: WML) (OTCQB: WMLLF) (SSE: WMLCL) (FSE: EJZN) (the "Company" or "Wealth"), announces that further to its news release dated January 12, 2026, due to strong investor demand, has increased the size of its previously announced private placement from up to 12,500,000 million units of the Company to up to 18,750,000 units in the capital of the Company (the "Units") at a subscription price of $0.08 per Unit for gross proceeds of up to $1,500,000. All terms and conditions remain the same as provided in the January 12, 2026 release.
The Company further confirms that there is no undisclosed material information.
Hendrik van Alphen, CEO of Wealth Minerals, stated "The response to our placement announcement has been extremely positive, no doubt due to our recent CEOL news and the favorable lithium market backdrop. After a prolonged lull in the lithium market, the demand for lithium is surging as the world realizes anew that commodities cannot be printed, they must be created in reality. Lithium Carbonate Equivalent now trades above US$23,000 per tonne, up strongly for the past six months and I believe this price strength will continue for some time. The Wealth team is working hard on corporate development and I look forward to sharing with the investor public news of our progress in 2026."
The securities offered have not been and will not be registered under the United States Securities Act of 1933 (the "U.S. Securities Act"), as amended, or any applicable state securities laws and may not be offered or sold in the United States or to "U.S. persons", as such term is defined in Regulation S under the U.S. Securities Act, absent registration or an applicable exemption from the registration requirements. This news release shall not constitute an offer to sell or the solicitation of an offer to buy nor shall there be any sale of the securities in any State in which such offer, solicitation or sale would be unlawful.
Stock Option Grant
Pursuant to the Company's Amended 2004 Incentive Stock Option Plan, the Company has granted incentive stock options to directors, officers, employees and consultants of the Company to purchase up to 8,700,000 common shares in the capital stock of the Company. The options are exercisable on or before January 26, 2028 at a price of $0.10 per share.
About Wealth Minerals Ltd.
Wealth is a mineral resource company with interests Chile. The Company's focus is the acquisition and development of lithium projects in South America. Presently the Company is working to diversify its asset base to include precious metal projects.
The Company opportunistically advances battery metal projects where it has a peer advantage in project selection and initial evaluation. Lithium market dynamics and a rapidly increasing metal price are the result of profound structural issues with the industry meeting anticipated future demand. Wealth is positioning itself to be a major beneficiary of this future mismatch of supply and demand. In parallel with lithium market dynamics, Wealth believes other battery metals will benefit from similar industry trends.
For further details on the Company readers are referred to the Company's website (www.wealthminerals.com) and its Canadian regulatory filings on SEDAR+ at www.sedarplus.ca.
On Behalf of the Board of Directors
WEALTH MINERALS LTD.
"Hendrik van Alphen"Hendrik van AlphenChief Executive Officer
For further information, please contact:Marla Ritchie, Michael Pound or Henk van AlphenPhone: 604-331-0096 or 604-638-3886
For all Investor Relations inquiries, please contact:John LiviakisLiviakis Financial Communications Inc.Phone: 415-389-4670
For all Public Relations inquiries, please contact:Nancy ThompsonVorticom, Inc.Office: 212-532-2208 | Mobile: 917-371-4053
Follow Us: Facebook – https://www.facebook.com/WealthMineralsLtdLinkedin – https://www.linkedin.com/company/wealth-mineralsTwitter – https://www.twitter.com/WealthMinerals
Neither TSX Venture Exchange nor its Regulation Services Provider (as that term is defined in the policies of the TSX Venture Exchange) accepts responsibility for the adequacy or accuracy of this press release, which has been prepared by management.
Cautionary Note Regarding Forward-Looking Statements
This press release contains forward-looking statements and forward-looking information (collectively, "forward-looking statements") within the meaning of applicable Canadian and US securities legislation. All statements, other than statements of historical fact, included herein including, without limitation, statements regarding the anticipated content, commencement, timing and cost of exploration programs, anticipated exploration program results, the discovery and delineation of mineral deposits/resources/reserves, the Company's expectation that it will be able to enter into agreements to acquire interests in additional mineral projects, and the anticipated business plans and timing of future activities of the Company, are forward-looking statements. Although the Company believes that such statements are reasonable, it can give no assurance that such expectations will prove to be correct. Forward-looking statements are typically identified by words such as: believe, expect, anticipate, intend, estimate, postulate and similar expressions, or are those, which, by their nature, refer to future events. The Company cautions investors that any forward-looking statements by the Company are not guarantees of future results or performance, and that actual results may differ materially from those in forward-looking statements as a result of various factors, including, but not limited to, the state of the financial markets for the Company's equity securities, the state of the commodity markets generally, variations in the nature, quality and quantity of any mineral deposits that may be located, variations in the market price of any mineral products the Company may produce or plan to produce, the inability of the Company to obtain any necessary permits, consents or authorizations required, including TSXV acceptance, for its planned activities, the inability of the Company to produce minerals from its properties successfully or profitably, to continue its projected growth, to raise the necessary capital or to be fully able to implement its business strategies, and other risks and uncertainties disclosed in the Company's latest interim Management Discussion and Analysis and filed with certain securities commissions in Canada. All of the Company's Canadian public disclosure filings may be accessed via www.sedar.com and readers are urged to review these materials, including the technical reports filed with respect to the Company's mineral properties.
To view the source version of this press release, please visit https://www.newsfilecorp.com/release/281524
As we enter January 2026, the Australian market is navigating a landscape marked by global economic tensions and fluctuating commodity prices, with gold reaching new highs and the Australian dollar strengthening against the U.S. dollar. In this environment of uncertainty and opportunity, identifying undiscovered gems in the small-cap sector requires a keen eye for companies that demonstrate resilience amidst market volatility and potential for growth despite broader economic challenges.
Top 10 Undiscovered Gems With Strong Fundamentals In Australia
| Name | Debt To Equity | Revenue Growth | Earnings Growth | Health Rating |
|---|---|---|---|---|
| Fiducian Group | NA | 10.00% | 9.57% | ★★★★★★ |
| Joyce | NA | 9.93% | 17.54% | ★★★★★★ |
| Euroz Hartleys Group | NA | 1.82% | -25.32% | ★★★★★★ |
| Hearts and Minds Investments | NA | 56.27% | 59.19% | ★★★★★★ |
| Argosy Minerals | NA | -12.81% | -19.89% | ★★★★★★ |
| Focus Minerals | NA | 75.35% | 51.34% | ★★★★★★ |
| AMCIL | NA | 2.99% | 1.18% | ★★★★★☆ |
| Zimplats Holdings | 5.44% | -9.79% | -42.03% | ★★★★★☆ |
| Australian United Investment | 1.90% | 5.23% | 4.56% | ★★★★☆☆ |
| Reef Casino Trust | 19.84% | 6.96% | 10.88% | ★★★★☆☆ |
Let’s uncover some gems from our specialized screener.
Simply Wall St Value Rating: ★★★★★☆
Overview: Carlton Investments Limited is a publicly owned asset management holding company with a market capitalization of A$937.81 million.
Operations: Carlton Investments generates revenue primarily from the acquisition and long-term holding of shares and units, amounting to A$41.60 million.
Carlton Investments, a relatively small player in the Australian market, shows a promising financial profile. Its debt to equity ratio has decreased from 0.03% to 0.02% over five years, indicating prudent financial management. While earnings growth of 8.7% annually over the past five years is notable, recent performance at just 0.09% trails behind industry peers growing at 14.4%. The company’s interest payments are comfortably covered by EBIT with a coverage ratio of 3390x, highlighting robust operational efficiency and profitability that supports its cash flow positivity and high-quality earnings profile without debt concerns looming large.
- Dive into the specifics of Carlton Investments here with our thorough health report.
-
Explore historical data to track Carlton Investments’ performance over time in our Past section.
ASX:CIN Earnings and Revenue Growth as at Jan 2026GR Engineering Services
Simply Wall St Value Rating: ★★★★★★
Overview: GR Engineering Services Limited offers engineering, process control, automation, and construction services primarily to the mining and mineral processing industries both in Australia and internationally, with a market cap of A$721.61 million.
Operations: GR Engineering Services Limited generates revenue primarily from two segments: Mineral Processing, contributing A$383.09 million, and Oil and Gas, contributing A$95.93 million. The company’s financial performance is significantly influenced by its operations in these sectors.
GR Engineering Services, a nimble player in the engineering sector, showcases robust financial health with its debt-free status and high-quality earnings. Over the past five years, it has achieved an impressive 21.8% annual growth in earnings, though recent performance at 9.7% slightly trails the broader Metals and Mining industry at 10.1%. Trading at a notable discount of 42.2% below estimated fair value suggests potential upside for investors seeking undervalued opportunities. Despite significant insider selling recently, GR Engineering remains attractive due to its positive free cash flow and forecasted revenue growth of 7.8% annually, indicating promising prospects ahead for this Australian gem.
- Click here and access our complete health analysis report to understand the dynamics of GR Engineering Services.
-
Gain insights into GR Engineering Services’ past trends and performance with our Past report.
ASX:GNG Earnings and Revenue Growth as at Jan 2026Kina Securities
Simply Wall St Value Rating: ★★★★☆☆
Overview: Kina Securities Limited operates in Papua New Guinea, offering commercial banking, financial services, fund administration, investment management, and share brokerage with a market capitalization of A$363.28 million.
Operations: Kina Securities Limited generates revenue primarily from its Banking & Finance segment, contributing PGK 441.25 million, and Wealth Management segment, adding PGK 50.19 million.
Kina Securities, a notable player in the financial sector, showcases a compelling profile with its total assets at PGK5.4 billion and equity of PGK680.3 million. The company’s price-to-earnings ratio of 9.2x is favorably below the Australian market average of 21.7x, indicating potential value for investors. Despite challenges such as a high bad loans level at 7.7%, KSL’s earnings have grown significantly by 14.8% over the past year, surpassing industry averages and highlighting its growth trajectory within the banking sector in Australia and Papua New Guinea markets alike.
- Unlock comprehensive insights into our analysis of Kina Securities stock in this health report.
-
Examine Kina Securities’ past performance report to understand how it has performed in the past.
ASX:KSL Earnings and Revenue Growth as at Jan 2026Taking Advantage
- Click here to access our complete index of 64 ASX Undiscovered Gems With Strong Fundamentals.
- Are these companies part of your investment strategy? Use Simply Wall St to consolidate your holdings into a portfolio and gain insights with our comprehensive analysis tools.
- Streamline your investment strategy with Simply Wall St’s app for free and benefit from extensive research on stocks across all corners of the world.
Looking For Alternative Opportunities?
- Explore high-performing small cap companies that haven’t yet garnered significant analyst attention.
- Fuel your portfolio with companies showing strong growth potential, backed by optimistic outlooks both from analysts and management.
- Find companies with promising cash flow potential yet trading below their fair value.
This article by Simply Wall St is general in nature. We provide commentary based on historical data
and analyst forecasts only using an unbiased methodology and our articles are not intended to be financial advice. It does not constitute a recommendation to buy or sell any stock, and does not take account of your objectives, or your
financial situation. We aim to bring you long-term focused analysis driven by fundamental data.
Note that our analysis may not factor in the latest price-sensitive company announcements or qualitative material.
Simply Wall St has no position in any stocks mentioned.
Companies discussed in this article include ASX:CIN ASX:GNG and ASX:KSL.
Have feedback on this article? Concerned about the content? Get in touch with us directly. Alternatively, email editorial-team@simplywallst.com
While "the trend is your friend" when it comes to short-term investing or trading, timing entries into the trend is a key determinant of success. And increasing the odds of success by making sure the sustainability of a trend isn't easy.
Often, the direction of a stock's price movement reverses quickly after taking a position in it, making investors incur a short-term capital loss. So, it's important to ensure that there are enough factors — such as sound fundamentals, positive earnings estimate revisions, etc. — that could keep the momentum in the stock going.
Our "Recent Price Strength" screen, which is created on a unique short-term trading strategy, could be pretty useful in this regard. This predefined screen makes it really easy to shortlist the stocks that have enough fundamental strength to maintain their recent uptrend. Also, the screen passes only the stocks that are trading in the upper portion of their 52-week high-low range, which is usually an indicator of bullishness.
Impala Platinum Holdings Ltd. (IMPUY) is one of the several suitable candidates that passed through the screen. Here are the key reasons why it could be a profitable bet for "trend" investors.
A solid price increase over a period of 12 weeks reflects investors' continued willingness to pay more for the potential upside in a stock. IMPUY is quite a good fit in this regard, gaining 106.2% over this period.
However, it's not enough to look at the price change for around three months, as it doesn't reflect any trend reversal that might have happened in a shorter time frame. It's important for a potential winner to maintain the price trend. A price increase of 31.4% over the past four weeks ensures that the trend is still in place for the stock of this company.
Moreover, IMPUY is currently trading at 99.9% of its 52-week High-Low Range, hinting that it can be on the verge of a breakout.
Looking at the fundamentals, the stock currently carries a Zacks Rank #1 (Strong Buy), which means it is in the top 5% of more than the 4,000 stocks that we rank based on trends in earnings estimate revisions and EPS surprises — the key factors that impact a stock's near-term price movements.
The Zacks Rank stock-rating system, which uses four factors related to earnings estimates to classify stocks into five groups, ranging from Zacks Rank #1 (Strong Buy) to Zacks Rank #5 (Strong Sell), has an impressive externally-audited track record, with Zacks Rank #1 stocks generating an average annual return of +25% since 1988. You can see the complete list of today's Zacks Rank #1 (Strong Buy) stocks here >>>>
Another factor that confirms the company's fundamental strength is its Average Broker Recommendation of #1 (Strong Buy). This indicates that the brokerage community is highly optimistic about the stock's near-term price performance.
So, the price trend in IMPUY may not reverse anytime soon.
In addition to IMPUY, there are several other stocks that currently pass through our "Recent Price Strength" screen. You may consider investing in them and start looking for the newest stocks that fit these criteria.
This is not the only screen that could help you find your next winning stock pick. Based on your personal investing style, you may choose from over 45 Zacks Premium Screens that are strategically created to beat the market.
However, keep in mind that the key to a successful stock-picking strategy is to ensure that it produced profitable results in the past. You could easily do that with the help of the Zacks Research Wizard. In addition to allowing you to backtest the effectiveness of your strategy, the program comes loaded with some of our most successful stock-picking strategies.
Click here to sign up for a free trial to the Research Wizard today.
Want the latest recommendations from Zacks Investment Research? Today, you can download 7 Best Stocks for the Next 30 Days. Click to get this free report
Impala Platinum Holdings Ltd. (IMPUY) : Free Stock Analysis Report
This article originally published on Zacks Investment Research (zacks.com).
VANCOUVER, BC / ACCESS Newswire / January 26, 2026 / Apex Critical Metals Corp. (CSE:APXC)(OTCQX:APXCF)(FWB:KL9) ("Apex" or the "Company"), a Canadian mineral exploration company focused on the identification and development of critical and strategic metals, is pleased to announce that the first drill rig has arrived at site for the Company's inaugural drill program at its 100%-controlled Rift Rare Earth Project, located within the Elk Creek Carbonatite Complex in southeastern Nebraska, U.S.A.
Figure 1. First drill rig arriving and being staged at the first drill pad at the Rift Rare Earth Project, southeastern Nebraska, U.S.A.
The first rig is currently being assembled and commissioned, while site preparation activities, including access routes, drill pad construction, and logistical staging, are underway to support upcoming drilling operations.
The planned Phase I drill program will focus on verifying and expanding on the significant rare earth (REE) mineralization defined by previous operators, with drilling planned to cover 850 metres of north-south strike in the high-priority southeastern portion of the Company's Rift Rare Earth Project. Targeting has been supported by geophysical, geochemical, and historical drilling data that has all been incorporated into a modern 3D geological model. Phase I has been designed to advance the understanding of the Rift Project's rare earth and associated critical mineral potential within one of North America's most prospective carbonatite systems.
Sean Charland, CEO of Apex Critical Metals, commented: "The arrival of our first drill rig at Rift represents a key milestone as we officially embark on a drill campaign that we believe will elevate the awareness of the Rift Rare Earth Project significantly and put the Company in a position to accelerate our path towards a maiden mineral resource with additional follow-up drilling later this year."
Drilling will ramp up with a second drill rig expected to arrive imminently. The Company will provide periodic updates as the program advances.
Grant of Restricted Share Units
The Company also announces that it has granted 750,000 restricted share units ("RSUs") to a director of the Company in accordance with the Company's omnibus equity incentive plan (the "Plan"), which was last approved by the Company's shareholders on February 26, 2025.
The RSUs were granted on January 23, 2026 and will vest as follows: 375,000 RSU's will vest twelve (12) months from the date of the grant and 375,000 RUS's will vest twenty-four (24) months from the date of the grant. Each vested RSU represents the right of the holder to receive one common share of the Company (each, a "Share") in accordance with the terms of the Plan.
The Shares underlying the RSUs are subject to a hold period of four months and one day from the date of issuance of the RSUs.
Qualified Person
The technical content of this news release has been reviewed and approved by Nathan Schmidt, P. Geo., a Qualified Person under NI 43-101 on standards of disclosure for mineral projects. Mr. Schmidt is a Geologist with Dahrouge Geological Consulting Ltd., the consulting firm engaged by Apex Critical Metals Corp. to conduct and oversee all of the Company's exploration work, including the 2026 drill program.
About Apex Critical Metals Corp. (CSE:APXC)(OTCQX:APXCF)(FWB:KL9)
Apex Critical Metals Corp. is a Canadian exploration company focused on advancing rare earth element (REE) and niobium projects that support the growing demand for critical and strategic metals across the United States and Canada. The Company's flagship Rift Project, located within the highly prospective Elk Creek Carbonatite Complex in Nebraska, U.S.A., hosts extensive rare earth rights surrounding one of North America's most advanced niobium-REE deposits. Historical drilling across the complex has reported broad intervals of high-grade REE mineralization, including intercepts such as 155.5 m of 2.70% REO and 68.2 m of 3.32% REO.
In Canada, Apex continues to advance its 100%-owned Cap Project, located 85 kilometres northeast of Prince George, British Columbia. The 2025 drill program confirmed a significant niobium discovery with 0.59% Nb₂O₅ over 36 metres, including 1.08% Nb₂O₅ over 10 metres, within a 1.8-kilometre-long niobium trend. The Cap Project continues to demonstrate strong potential for niobium mineralization within a large and previously unrecognized carbonatite system.
With a growing portfolio of critical mineral projects in both Canada and the United States, Apex Critical Metals is strategically positioned to help strengthen domestic supply chains for the minerals essential to advanced technologies, clean energy, and national security. Apex is publicly listed in Canada on the Canadian Securities Exchange (CSE) under the symbol APXC and quoted on the OTCQX market in the United States under the symbol APXCF, and in Germany on the Borse Frankfurt under the symbol KL9 and/or WKN: A40CCQ. Find out more at www.apexcriticalmetals.com and watch our videos at https://apexcriticalmetals.com/apex-critical-metals-corporate-video/ and make sure to stay in touch by signing up for free news alerts at https://apexcriticalmetals.com/news/news-alerts/, or by following us on X (formerly Twitter), Facebook or LinkedIn.
On Behalf of the Board of Directors
APEX CRITICAL METALS CORP.,
Sean CharlandChief Executive OfficerTel: 604.681.1568Email: info@apexcriticalmetals.com
Neither the Canadian Securities Exchange nor its Regulation Services Provider (as that term is defined in the policies of the CSE) accepts responsibility for the adequacy or accuracy of this release.
CAUTIONARY STATEMENT REGARDING FORWARD-LOOKING INFORMATION:
This news release may contain "forward-looking statements" under applicable Canadian securities legislation. Forward-looking statements consist of statements that are not purely historical, including any statements regarding beliefs, plans, expectations or intentions regarding the future. Forward-looking statements in this news release include (without limitation) statements regarding the Company's planned Phase I drill program and any subsequent drill programs and statements regarding the Company's US-based prospective assets (more particularly described above), including the potential for additional acquisitions and the potential for exploration, and statements regarding the potential for future exploration and drilling to confirm the source of magnetic anomalies. Forward-looking statements are subject to various known and unknown risks and uncertainties that may cause actual results, performance or developments to differ materially from those contained in the statements. Risks that could change or prevent these events, activities or developments from coming to fruition include: the Company's properties are at an early stage of development and no current mineral resources or reserves have been identified by the Company thereof, that we may not be able to fully finance any additional exploration on the Company's properties; that even if we are able to raise capital, costs for exploration activities may increase such that we may not have sufficient funds to pay for such exploration or processing activities; the timing and content of any future work programs; geological interpretations based on drilling that may change with more detailed information; potential process methods and mineral recoveries assumptions based on limited test work and by comparison to what are considered analogous deposits that, with further test work, may not be comparable; testing of our process may not prove successful or samples derived from our properties may not yield positive results, and even if such tests are successful or initial sample results are positive, the economic and other outcomes may not be as expected; the anticipated market demand for REE and other minerals may not be as expected; the availability of labour and equipment to undertake future exploration work and testing activities; geopolitical risks which may result in market and economic instability. There can be no assurance that such statements will prove to be accurate, as actual results and future events could differ materially from those anticipated in such statements. Accordingly, readers should not place undue reliance on forward-looking statements. The forward-looking statements herein are made as of the date hereof, and the Company disclaims any intention or obligation to update or revise any forward-looking statements, whether as a result of new information, future events or otherwise, except as required by law.
SOURCE: Apex Critical Metals Corp.
View the original press release on ACCESS Newswire
The major indexes capped of a second straight stretch of weekly losses as investors digested a wave of geopolitical headlines and navigated what remains an unsettled trading environment to start 2026.
The S&P 500 (^GSPC) barely cracked above the flat line by less than 0.1% on Friday, losing 0.4% in total on the week, and the Dow Jones Industrial Average (^DJI) fell into the red by 0.7% on the week. Despite finishing Friday on a gain of 0.3%, the tech-focused Nasdaq Composite (^IXIC) also fell into the red for the week, shedding roughly 0.1% in total.
The breakout price action for the week came in the natural gas (NG=F) market, where futures spiked 75% in the five trading sessions leading up to Thursday as Winter Storm Fern brings Arctic cold and snow to more than 150 million people across the US.
The biggest headlines last week emerged from the world leaders and business luminaries who gathered in Switzerland for the World Economic Forum in Davos. President Trump and Europe's leaders agreed on the "framework" of a deal over Greenland, but the forum revealed the schism forming between the US and some of its major Western allies.
Currencies have largely taken a back seat to stocks since the post-pandemic market rally took hold and investors focused on earnings growth, AI-driven optimism, and the steady resilience of US equities.
But that may be starting to change, according to Macquarie global FX & rates strategist Thierry Wizman.
"While a Greenland 'deal' solves the immediate problem of tariffs and/or invasion, it doesn't solve the core issue of the seeming mutual alienation of the US from its allies," Wizman wrote in a note to clients on Wednesday.
"It's in that spirit that we can still talk about a fracturing, more dangerous, world, in which the US is less vaunted, the USD loses its reserve currency status, and where the US focuses instead on the Western Hemisphere as its sole and defendable redoubt."
And while the US backed off tariff threats over Greenland, and the EU suspended a package of retaliatory trade measures, investors still appear keen to find safe haven outside of the dollar.
Over the past five days, EUR/USD, the most traded FX pair in the world, has picked up nearly 2% as the euro has strengthened against the dollar.
At the same time, the dollar has fallen more than 2.7% against the Swiss franc, a sign of traders hedging against systemic instability. The dollar also fell roughly 1.8% against the yen as the Japanese currency surged through the end of the week.
Investors will turn their attention ahead to one of the busiest weeks of the year, with the Federal Reserve's January meeting on Wednesday coming alongside a slew of key earnings reports, including releases from four of the "Magnificent Seven" cohort.
Microsoft (MSFT), Meta (META), Tesla (TSLA), and Apple (AAPL) are all queued up to report fourth quarter results — the first three companies report Wednesday after the close, while Apple goes after Thursday's bell — with investor attention likely to remain centered on AI spending and these companies' ambitions in this new paradigm.
On the central banking front, investors are nearly certain the Federal Reserve will hold rates steady in their current range of 3.5%-3.75%. As of Friday, data from the CME Group showed traders assigning a 97% chance the Fed holds rates on Wednesday.
The bigger news for the Fed, most likely, will be any further developments on President Trump's pick for the next Fed chair after Powell finishes his term in the position in May. According to odds on Polymarket as of Friday afternoon, BlackRock's global CIO for fixed income, Rick Rieder, has been rising quickly as a prospect and has become the favorite to earn the nod from Trump.
Former Fed official Kevin Warsh and Trump's top economic advisor, Kevin Hassett, who had long been seen as the leading candidates for the nomination, stood at 33% and 6% odds, respectively, as of Friday afternoon. Speaking with CNBC in Davos, Trump said he thought Rieder was "very impressive."
President Donald Trump, center, holds up a signed Board of Peace charter during the Annual Meeting of the World Economic Forum in Davos, Switzerland, Thursday, Jan. 22, 2026. (AP Photo/Evan Vucci) (ASSOCIATED PRESS)'We cannot ignore valuation debate and timing'
When two of the market's biggest tech giants report earnings on Wednesday, investors will be watching for two things: How much are these companies planning to spend on their AI and cloud computing arms race, and how are they planning to fund it?
Meta CFO Susan Li boosted spending projections from a range of $66 billion-$72 billion to between $70 billion and $72 billion on the company's third quarter call in October, while Microsoft CFO Amy Hood said the company would spend more in 2026 than the $88.2 billion it spent in 2025.
Both companies will report results after the close on Wednesday.
Amazon and Alphabet are expected to report in the first week of February.
To fund this investment, hyperscalers are now issuing so much debt they are changing the landscape of investment-grade credit, Apollo chief economist Torsten Sløk wrote in a note on Friday. The tech sector issued nearly $700 billion in investment-grade debt over the past quarter, closing in on the just-over $800 billion in issuance by the financial sector, which has long led the credit market. (Disclosure: Yahoo Finance is owned by Apollo Global Management.)
While the share of people citing an "AI bubble" is falling, Bank of America strategists Haim Israel and Menka Bajaj wrote in a recent client note that investors can't not consider the risks of bottomless spending and sky-high valuations.
"AI is a fundamental revolution that is about to change everything, but we cannot ignore valuation debate and timing," the strategists wrote.
The tech sector is also having to navigate the fickle winds of public opinion, especially around the data center build-out that is sucking up so much cash. Rising energy costs, heavy water usage, job security, and other concerns have all risen to the forefront, Jefferies strategists wrote in a client note on Friday — with ratepayer electricity bills perhaps chief among them.
"AI investments sit directly in the cross-hairs of the ongoing debate around affordability," the Jefferies strategists wrote.
For the tech companies getting ready to share their first major spending projections of 2026, the question will be: Can that spending be converted into legitimate productivity gains and other real-world benefits, or will it all fall into, as Israel and Bajaj wrote, "mere hype"?
Chairman and CEO of Microsoft Satya Nadella delivers a speech during the World Economic Forum (WEF) Annual Meeting in Davos, Switzerland on January 20, 2026. (Photo by Harun Ozalp/Anadolu via Getty Images) (Anadolu via Getty Images)A 'super-cycle' in the metals market
In a market swirling with geopolitical turmoil — from Venezuela and Iran to Greenland and US-European tensions — metals have continued to dominate conversation, perhaps nowhere more prominently than in gold (GC=F).
Gold prices continued to rise on Monday, surpassing $5,000 an ounce. Futures hit a record on Sunday as analysts began to question the massive rally for the precious metal. Gold had picked up just under 8% last week to top $4,900 per troy ounce for the first time ever on Thursday, prompting Goldman Sachs to raise its year-end price target to $5,400.
Silver (SI=F), too, has kept its rally going as investors flock to flight-to-safety investments, pushing the white metal past $100 per troy ounce. And platinum (PL=F), a diversifier for store-of-value assets, has — like silver — already surged upward by more than 30% this year.
Analysts have pegged the rally to the dollar's weakening position in an increasingly fractious global risk environment, sputtering demand for government debt, and expectations that the Fed is likely to keep easing policy.
"It used to be the case that any eruption of geopolitical tension tended to rally the world around the US dollar," wrote Macquarie's Wizman in a client note on Friday.
"But what is happening now is different. Instead of flocking to the USD, traders flock to gold and its neighbors on the periodic table (e.g., silver, platinum) and defense stocks, and the USD has little to show for its erstwhile vauntedness."
The metals rally has also continued on the industrial side, where a combination of supply chain politics and market fundamentals has kept prices rising.
Copper futures (HG=F), which returned more than 30% in 2025, have picked up nearly 4% in 2026 as data center-driven demand continues.
Spot prices on lithium, crucial to the EV build-out but largely controlled by China, have risen an even stronger 44% on the year, while tin has surged by nearly 30%, according to data from Trading Economics.
And demand is only expected to grow as Big Tech doubles down on its plans for mass build-outs of data centers and other AI infrastructure.
Despite a tough macroeconomic backdrop, writes HSBC metals analyst Jonathan Brandt, most metals prices are at or close to record levels, and "supply constraints and strong demand from energy transition and AI should support most metal markets in 2026."
The metals market, Brandt wrote, is facing a perfect storm of demand for safe-haven assets, trade restrictions and production caps, and underinvestment that left the sector unprepared for this massive demand surge.
"The combination of these factors could lead to a 'super-cycle' in select metals, with prices potentially staying well above the historical average for the foreseeable future."
Construction continues at the Lithium Nevada Corp. mine site Thacker Pass project on April 24, 2023, near Orovada, Nev. (AP Photo/Rick Bowmer) (ASSOCIATED PRESS)Economic and earnings calendarMonday
Economic data: Chicago Fed national activity index, November (-0.21 previously); Durable goods orders, November (+3% expected, -2.2% previously); Dallas Fed manufacturing activity, January (-10.9 previously)
Earnings calendar: Southern Copper (SCCO), Nucor (NUE), Ryanair Holdings (RYAAY), Brown & Brown (BRO), Steel Dynamics (STLD), W.R. Berkley (WRB), Graco Inc. (GGG), AGNC Investment (AGNC), Crane (CR), Western Alliance Bancorporation (WAL)
Tuesday
Economic data: ADP weekly employment change, week ended Jan. 3 (+8,000 previously); FHFA house price index, month-on-month, November (+0.4% previously); Richmond Fed manufacturing index, January (-7 previously); Conference Board consumer confidence, January (90.0 expected, 89.1 previously); Dallas Fed services activity, January (-3.3 previously)
Earnings calendar: UnitedHealth (UNH), RTX (RTX), Boeing (BA), NextEra Energy (NEE), Texas Instruments (TXN), Union Pacific (UNP), HCA Healthcare (HCA), Northrop Grumman (NOC), UPS (UPS), General Motors (GM), Seagate Technology (STX), Sysco (SYY), Kimberly-Clark (KMB), Nextpower (NXT), Invesco (IVZ), American Airlines (AAL)
Wednesday
Economic data: FOMC rate decision, Jan. 28 (no change expected); MBA mortgage applications, week ended Jan. 23 (14.1% previously)
Earnings calendar: Microsoft (MSFT), Meta Platforms (META), Tesla (TSLA), ASML Holdings N.V. (ASML), Lam Research Corporation (LRCX), IBM (IBM), Amphenol (APH), GE Vernova (GEV), Danaher (DHR), AT&T (T), ServiceNow (NOW), Progressive (PGR), Starbucks (SBUX), Automatic Data Processing (ADP), General Dynamics (GD), Waste Management (WM), Elevance Health (ELV), Corning (GLW), MSCI (MSCI), Las Vegas Sands (LVS), Southwest Airlines (LUV), Levi Strauss (LEVI)
Thursday
Economic data: Initial jobless claims, week ended Jan. 24 (200,000 previously); Continuing claims, week ended Jan. 17 (1.85 million previously); Trade balance, November (-$45 billion expected, -$29.4 billion previously); Factory orders, November (-1.3% previously)
Earnings calendar: AAPL (AAPL), Visa (V), Mastercard (MA), Caterpillar (CAT), SAP SE (SAP), Thermo Fisher Scientific (TMO), KLA Corporation (KLAC), Blackstone (BX), Honeywell International (HON), Lockheed Martin (LMT), Stryker (SYK), Parker-Hannifin (PH), Comcast (CMCSA), Sanofi (SNY), Altria (MO), Marsh & McLennan (MSN.DU), Sherwin-Williams (SHW), Trane Technologies (TT), Deutsche Bank (DB), Royal Caribbean (RCL), Sandisk (SNDK), L3Harris Technologies (LHX), Norfolk Southern (NSC), Valero Energy (VLO), Brookfield Infrastructure Partners L.P. (BIP), Deckers Outdoor (DECK)
Friday
Economic data: Producer price index, month-on-month, December (+0.3% expected, +0.2% previously); PPI, ex food and energy, month-on-month, December (+0.3% expected, 0% previously); PPI, year-on-year, December (+3% previously); PPI, ex food and energy, year-on-year, December (+3% previously)
Earnings calendar: Exxon Mobil (XOM), Chevron (CVX), American Express (AXP), Verizon (VZ), Sumitomo Mitsui Financial Group (SMFG), Regeneron Pharmaceuticals (REGN), Aon (AON), Colgate-Palmolive (CL), Canadian National Railway (CNI), Air Products and Chemicals (APD), Imperial Oil (IMO), SoFi Technologies (SOFI), Charter Communications (CHTR), Nomura (NMR), Franklin Resources (BEN), Janus Henderson (JHG)
Click here for in-depth analysis of the latest stock market news and events moving stock prices
Read the latest financial and business news from Yahoo Finance
The Australian market is navigating a period of uncertainty, with mixed unemployment figures and global economic tensions influencing investor sentiment. Amidst this backdrop, identifying promising small-cap stocks can be particularly rewarding, as these companies often possess unique growth potential that may not yet be fully recognized by the broader market.
Top 10 Undiscovered Gems With Strong Fundamentals In Australia
| Name | Debt To Equity | Revenue Growth | Earnings Growth | Health Rating |
|---|---|---|---|---|
| Fiducian Group | NA | 10.00% | 9.57% | ★★★★★★ |
| Joyce | NA | 9.93% | 17.54% | ★★★★★★ |
| Hearts and Minds Investments | NA | 56.27% | 59.19% | ★★★★★★ |
| Euroz Hartleys Group | NA | 1.82% | -25.32% | ★★★★★★ |
| Argosy Minerals | NA | -12.81% | -19.89% | ★★★★★★ |
| Focus Minerals | NA | 75.35% | 51.34% | ★★★★★★ |
| AMCIL | NA | 2.99% | 1.18% | ★★★★★☆ |
| Zimplats Holdings | 5.44% | -9.79% | -42.03% | ★★★★★☆ |
| Australian United Investment | 1.90% | 5.23% | 4.56% | ★★★★☆☆ |
| Reef Casino Trust | 19.84% | 6.96% | 10.88% | ★★★★☆☆ |
We’re going to check out a few of the best picks from our screener tool.
Simply Wall St Value Rating: ★★★★☆☆
Overview: Cobram Estate Olives Limited is involved in the production and marketing of olive oil across Australia, the United States, and internationally, with a market capitalization of approximately A$1.86 billion.
Operations: Cobram Estate Olives generates revenue primarily from its Australian olive oil operations, contributing A$183.82 million, and its US operations with A$64.97 million. The company also records eliminations and corporate adjustments of -A$7.13 million.
Cobram Estate Olives, a notable player in the Australian market, has seen its earnings soar by 168% over the past year, outpacing the food industry average of 56%. Despite this impressive growth, the company carries a high net debt to equity ratio of 72%, although it has improved from 119.5% in five years. Their interest payments are well covered with an EBIT coverage of 8.1 times. Recently, they completed a follow-on equity offering worth A$3.89 million and announced an annual dividend increase to A$0.045 per share, reflecting their strong financial position and commitment to returning value to shareholders.
ASX:CBO Debt to Equity as at Jan 2026Focus Minerals
Simply Wall St Value Rating: ★★★★★★
Overview: Focus Minerals Limited is involved in the exploration and development of gold properties in Western Australia, with a market capitalization of A$1.13 billion.
Operations: Focus Minerals generates revenue primarily from its Coolgardie segment, amounting to A$151.74 million. The company has a market capitalization of A$1.13 billion.
Focus Minerals, an intriguing player in the Australian mining sector, has shown impressive earnings growth of 136% over the past year, outpacing the industry average of 10%. The company operates without debt, eliminating concerns about interest payments and highlighting its financial prudence. Despite this robust earnings performance, Focus Minerals is not yet generating positive free cash flow. However, its high-quality earnings suggest a strong operational foundation. With A$74 million in cash equivalents as of mid-2025 and continued investment in capital expenditure at approximately A$26 million recently, Focus seems positioned for potential future growth within its niche market.
- Navigate through the intricacies of Focus Minerals with our comprehensive health report here.
-
Gain insights into Focus Minerals’ past trends and performance with our Past report.
ASX:FML Earnings and Revenue Growth as at Jan 2026United Overseas Australia
Simply Wall St Value Rating: ★★★★★☆
Overview: United Overseas Australia Ltd, with a market cap of A$1.24 billion, operates in the development and resale of land and buildings across Malaysia, Singapore, Vietnam, and Australia.
Operations: United Overseas Australia Ltd generates revenue primarily from its land development and resale segment, which accounts for A$438.18 million. The investment segment contributes A$257.51 million to the total revenue.
United Overseas Australia, a smaller player in the real estate sector, shows promising financial health with a price-to-earnings ratio of 12.2x, notably below the Australian market average of 21.7x. Over five years, its debt-to-equity ratio rose from 5.5% to 8.8%, yet it holds more cash than total debt, indicating solid financial footing. Despite not surpassing industry earnings growth last year at 27.5%, UOS has maintained high-quality earnings and positive free cash flow throughout this period, suggesting resilience and potential for future stability in its operations within the competitive real estate landscape.
ASX:UOS Debt to Equity as at Jan 2026Next Steps
- Investigate our full lineup of 64 ASX Undiscovered Gems With Strong Fundamentals right here.
- Hold shares in these firms? Setup your portfolio in Simply Wall St to seamlessly track your investments and receive personalized updates on your portfolio’s performance.
- Enhance your investing ability with the Simply Wall St app and enjoy free access to essential market intelligence spanning every continent.
Looking For Alternative Opportunities?
- Explore high-performing small cap companies that haven’t yet garnered significant analyst attention.
- Fuel your portfolio with companies showing strong growth potential, backed by optimistic outlooks both from analysts and management.
- Find companies with promising cash flow potential yet trading below their fair value.
This article by Simply Wall St is general in nature. We provide commentary based on historical data
and analyst forecasts only using an unbiased methodology and our articles are not intended to be financial advice. It does not constitute a recommendation to buy or sell any stock, and does not take account of your objectives, or your
financial situation. We aim to bring you long-term focused analysis driven by fundamental data.
Note that our analysis may not factor in the latest price-sensitive company announcements or qualitative material.
Simply Wall St has no position in any stocks mentioned.
Companies discussed in this article include ASX:CBO ASX:FML and ASX:UOS.
Have feedback on this article? Concerned about the content? Get in touch with us directly. Alternatively, email editorial-team@simplywallst.com
Get insights on thousands of stocks from the global community of over 7 million individual investors at Simply Wall St.
Southern Copper is back in focus after a fresh price target update caught investors’ attention, prompting new questions about what is shaping expectations around the stock. With no prior target to compare against, the change itself becomes the story, centering on how recent commentary is reframing the company’s outlook and risks. Read on to see how you can keep on top of these shifting narratives as they emerge in the future.
Stay updated as the Fair Value for Southern Copper shifts by adding it to your watchlist or portfolio. Alternatively, explore our Community to discover new perspectives on Southern Copper.
Do your thoughts align with the Bull or Bear Analysts? Perhaps you think there's more to the story. Head to the Simply Wall St Community to discover more perspectives or begin writing your own Narrative!
NYSE:SCCO 1-Year Stock Price Chart How This Changes the Fair Value For Southern Copper
- There is a new price target for Southern Copper without a previous figure to compare against, so the adjustment itself is drawing attention rather than any measured change from an earlier level.
- With only the latest target available, you are effectively working with a single reference point for fair value instead of a trend or range built from multiple updates.
- The lack of historical target data means you may want to place more weight on your own assumptions, such as your outlook for copper demand, costs and balance sheet strength, rather than relying heavily on this one figure.
- This new target can still be useful as a yardstick, especially if you track how the market price compares with it over time, and watch for future revisions that either reinforce or challenge the current view.
- Because there is no prior target, it can help to look at how this figure sits relative to your preferred valuation tools, for example by comparing it with ratios such as P/E, P/B or cash flow based estimates you already use for your portfolio.
🔔 Never Miss an Update: Follow The Narrative
Narratives on Simply Wall St let you put a clear story around Southern Copper’s numbers, tying your view on its future revenue, earnings and margins to a fair value estimate. Each Narrative links the company’s story to a financial forecast, then to a fair value you can compare with today’s share price to help with investment decisions. Narratives live on the Community page, are easy to follow, and automatically update as new news or earnings are released.
Head over to the Simply Wall St Community and follow the Narrative on Southern Copper to stay focused on what really matters:
- How the latest price target feeds into your own fair value view for Southern Copper.
- Which assumptions around copper demand, costs and capital needs sit behind different forecasts.
- When changes in news or estimates move the gap between fair value and the current share price.
Follow the original Southern Copper Narrative on Simply Wall St and keep your view aligned with the latest information.
Curious how numbers become stories that shape markets? Explore Community Narratives
This article by Simply Wall St is general in nature. We provide commentary based on historical data
and analyst forecasts only using an unbiased methodology and our articles are not intended to be financial advice. It does not constitute a recommendation to buy or sell any stock, and does not take account of your objectives, or your
financial situation. We aim to bring you long-term focused analysis driven by fundamental data.
Note that our analysis may not factor in the latest price-sensitive company announcements or qualitative material.
Simply Wall St has no position in any stocks mentioned.
Companies discussed in this article include SCCO.
Have feedback on this article? Concerned about the content? Get in touch with us directly. Alternatively, email editorial-team@simplywallst.com
Photographer: Alessandro Cinque/Bloomberg
(Bloomberg) — Global mining stocks have shot to the top of fund managers’ must-have list, as soaring metals demand and tight supplies of key minerals hint at a new supercycle in the sector.
With a nearly 90% gain since the start of 2025, MSCI’s Metals and Mining Index has beaten semiconductors, global banks and the Magnificent Seven cohort of technology stocks by a wide margin. And the rally shows no sign of stalling, as the boom in robotics, electric vehicles and AI data centers spurs metals prices to ever new highs.
Most Read from Bloomberg
- White House Ballroom Architect Reveals New Trump-Requested Features
- NYC’s Mamdani Crushes Snow Day Hopes, But He Yearns for It Too
- Boston’s 18-Inch Snow Deluge to Make Travel Hard to ‘Impossible’
- Tokyo Becoming Colony for the Rich, Pritzker Winner Warns
- New York City’s Worst Highways Can Lead Somewhere Better
That’s particularly true of copper, which is key to the energy transition and has surged 50% over the same period. But analysts are also bullish on a range of other minerals, including aluminum, silver, nickel and platinum. Gold, meanwhile, is expected to continue benefiting from US monetary and fiscal policy concerns, as well as geopolitical risks, even after hitting successive record highs.
The outperformance is a stark reversal from prior years when the sector was out of favor, hit by volatile commodity prices and fears of a growth slowdown in China, the world’s largest metals consumer. But fund managers, who had piled into tech and financial stocks, now appear reassured by Beijing’s pledges to support the economy, including via interest-rate cuts.
“Mining stocks have quietly moved from a boring defensive sleeve to an essential portfolio anchor — one of the few sectors positioned to capture both shifting monetary policy dynamics and an increasingly volatile geopolitical landscape,” said Dilin Wu, a research strategist at Pepperstone Group Ltd. in Melbourne.
A major driver for the change is that commodities such as copper and aluminum have become less correlated to economic cycles. Historically seen as short-cycle trades, dictated by how fast or slow the world economy is growing, they have gradually morphed into structural investments.
In addition, they are benefiting from transition strategies, where investors buy assets such as metals to gain exposure to the AI theme.
Hence, the rush to buy the dip whenever weak data knocks mining stocks. European fund managers now have a net 26% overweight on the sector, according to Bank of America Corp.’s monthly survey. That’s the highest in four years, though still well below the 38% net overweight held in 2008.
And yet, the sector looks pretty undervalued.
The Stoxx 600 Basic Resources index trades at a forward price-to-book ratio of about 0.47 relative to the MSCI World benchmark. That’s an about 20% discount to the long-term 0.59 ratio and well below prior cycle peaks above 0.7.
“This valuation gap persists even as the strategic relevance of natural resources has risen materially,” Morgan Stanley analysts led by Alain Gabriel wrote.
Gabriel also notes companies’ increasing preference for “buy over build.” Various M&A transactions are underway — notably Anglo American Plc’s acquisition of Teck Resources Ltd. and a potential merger between Rio Tinto Plc and Glencore Plc. While the industry’s capital-intensive nature is driving the trend, Morgan Stanley also attributes it to miners’ willingness to pursue scale and portfolio optimization, particularly in copper.
Given this is happening at a time of supply deficits, the backdrop should support higher commodity prices and valuation multiples, Gabriel added.
To be sure, top miners including BHP Group and Rio Tinto still derive the bulk of their earnings from iron ore, which is feeling the effects of the collapse of the last China-led supercycle. That’s motivating a push into copper M&A. Freeport-McMoRan Inc. and Antofagasta Plc are among the few firms offering pure exposure to copper.
For some, the pace of the rally is a reason for caution. BofA downgraded the sector to underweight in Europe, citing risks from negative economic surprises. Nick Ferres, chief investment officer for Vantage Point Asset Management in Singapore, said he’s trimmed gold exposure for now.
“I get concerned when the price of any asset moves non-linear or parabolic, that is why we are a bit cautious at the moment,” Ferres said. “But the miners are very inexpensive. If gold remains elevated, we would re-enter or scale back up on a pullback.”
Bloomberg Intelligence sees copper remaining in deficit this year, with supply shortfalls possibly worse than in 2025. On gold, BI analysts say bullion could push toward $5,000 an ounce, while Goldman Sachs Group Inc. expects it at $5,400 by end-2026 — about 8% above current levels.
“The upside drivers for commodities are now more powerful and more diversified,” said Gerald Gan, chief investment officer at Singapore-based Reed Capital Partners Ltd. “In the coming months, we plan to gradually increase our portfolio exposure to mining stocks.”
–With assistance from Khuleko Siwele, Sagarika Jaisinghani and Mark Burton.
Most Read from Bloomberg Businessweek
- The US Is Losing Top Tech Talent to India in the Wake of Trump’s H-1B Chaos
- An Un-MAGA Proposal to Bring Back American Manufacturing
- What, If Anything, Is Behind Trump’s Greenland Dream?
- Fracking Goes Global
- How AI Weather Models Are Making Better Forecasts
©2026 Bloomberg L.P.
- Freeport-McMoRan Inc. recently reported its fourth-quarter and full-year 2025 results, showing quarterly sales of US$5,633 million and net income of US$406 million, with full-year sales of US$25.92 billion and net income of US$2.20 billion.
- Despite production pressure from the Grasberg mudflow incident, higher copper and gold prices and progress on restoring Indonesian operations supported stronger earnings and reinforced the company’s long-term growth projects in the Americas and Asia.
- We’ll now look at how Grasberg’s recovery progress and better-than-expected earnings shape Freeport-McMoRan’s investment narrative for investors.
Rare earth metals are an input to most high-tech devices, military and defence systems and electric vehicles. The global race is on to secure supply of these critical minerals. Beat the pack to uncover the 32 best rare earth metal stocks of the very few that mine this essential strategic resource.
What Is Freeport-McMoRan's Investment Narrative?
To own Freeport-McMoRan, you really need to believe in its copper and gold footprint and the company’s ability to manage operational shocks without derailing its longer-term project pipeline. The latest results help that case: Q4 and full-year 2025 earnings came in ahead of expectations despite the Grasberg mudflow, thanks in part to stronger commodity prices and disciplined cost control. Management reiterated that Grasberg’s phased restart is on track, which keeps one of the key near-term catalysts intact, even if production volumes are pressured in the interim. At the same time, the legal overhang from the Grasberg-related class action and a richer valuation multiple relative to peers remain front-of-mind risks. The recent pullback in the share price after strong numbers underlines how sensitive the stock still is to these concerns.
However, investors should not ignore the legal and operational uncertainties tied to Grasberg.
Freeport-McMoRan's shares have been on the rise but are still potentially undervalued by 45%. Find out what it's worth.Exploring Other PerspectivesFCX 1-Year Stock Price Chart
Eight fair value views from the Simply Wall St Community span roughly US$36 to just above US$109 per share, showing how differently people are thinking about Freeport-McMoRan. Set against that wide range, the latest earnings beat and ongoing Grasberg recovery efforts could influence how you weigh the production and legal risks discussed earlier. It is worth comparing several of these perspectives before forming your own view on the company’s prospects.
Explore 8 other fair value estimates on Freeport-McMoRan – why the stock might be worth 40% less than the current price!
Build Your Own Freeport-McMoRan Narrative
Disagree with this assessment? Create your own narrative in under 3 minutes – extraordinary investment returns rarely come from following the herd.
- A great starting point for your Freeport-McMoRan research is our analysis highlighting 2 key rewards and 1 important warning sign that could impact your investment decision.
- Our free Freeport-McMoRan research report provides a comprehensive fundamental analysis summarized in a single visual – the Snowflake – making it easy to evaluate Freeport-McMoRan's overall financial health at a glance.
Looking For Alternative Opportunities?
Our top stock finds are flying under the radar-for now. Get in early:
- We've found 13 US stocks that are forecast to pay a dividend yield of over 6% next year. See the full list for free.
- Uncover the next big thing with financially sound penny stocks that balance risk and reward.
- These 9 companies survived and thrived after COVID and have the right ingredients to survive Trump's tariffs. Discover why before your portfolio feels the trade war pinch.
This article by Simply Wall St is general in nature. We provide commentary based on historical data
and analyst forecasts only using an unbiased methodology and our articles are not intended to be financial advice. It does not constitute a recommendation to buy or sell any stock, and does not take account of your objectives, or your
financial situation. We aim to bring you long-term focused analysis driven by fundamental data.
Note that our analysis may not factor in the latest price-sensitive company announcements or qualitative material.
Simply Wall St has no position in any stocks mentioned.
Companies discussed in this article include FCX.
Have feedback on this article? Concerned about the content? Get in touch with us directly. Alternatively, email editorial-team@simplywallst.com
Freeport-McMoRan Inc. (NYSE:FCX) is among the 15 Best Performing Silver Stocks to Buy.
On January 8, 2025, TheFly reported that JPMorgan analyst Bill Peterson maintained an Overweight rating on the shares. It also lifted the price target for Freeport-McMoRan Inc. (NYSE:FCX) to $68 from $58. In a Q4 preview, the company modified ratings and goals for the North America base metals segment. Targets were raised in order to reflect better forward pricing. JPMorgan still prefers copper to aluminum, citing a declining currency and supply interruptions.
On January 13, 2026, Wells Fargo kept its Overweight rating and boosted its price objective for Freeport-McMoRan Inc. (NYSE:FCX) from $55 to $64. The company forecasts a year for copper and aluminum in 2026, noting restricted new supply in the first half of the year. Wells sees the possibility of midyear concessions during USMCA discussions, but it does not anticipate a reversal of Trump’s 50% tariffs on imported steel and aluminum. The corporation identified issues such as substitution and demandless recovery.
The stock is up by 54.98% in the past 12 months, as of January 22, 2026.
Freeport-McMoRan Inc. (NYSE:FCX) mines copper, gold, molybdenum, and silver.
While we acknowledge the potential of FCX as an investment, we believe certain AI stocks offer greater upside potential and carry less downside risk. If you're looking for an extremely undervalued AI stock that also stands to benefit significantly from Trump-era tariffs and the onshoring trend, see our free report on the best short-term AI stock.
READ NEXT: 20 Best Performing Stocks in 2025 and 12 Best Food Stocks to Buy in 2026.
Disclosure: None. This article is originally published at Insider Monkey.
Make better investment decisions with Simply Wall St’s easy, visual tools that give you a competitive edge.
- If you are looking at Freeport-McMoRan and wondering whether the current price still offers value, you are not alone.
- The stock last closed at US$60.41, with returns of 2.9% over 7 days, 16.4% over 30 days, 16.3% year to date and 62.0% over the past year, which naturally raises questions about what is already priced in.
- Recent coverage has highlighted Freeport-McMoRan as a key copper producer, with attention on how its operations position it for long term demand trends linked to electrification and infrastructure. Commentators have also focused on how these themes relate to recent share price moves and investor appetite for commodity exposure.
- Right now, Freeport-McMoRan has a valuation score of 2/6. This reflects how it screens across different checks and sets us up to look at traditional valuation approaches next, before finishing with a more complete way to think about what the stock might be worth.
Freeport-McMoRan scores just 2/6 on our valuation checks. See what other red flags we found in the full valuation breakdown.
Approach 1: Freeport-McMoRan Discounted Cash Flow (DCF) Analysis
A Discounted Cash Flow, or DCF, model looks at the cash Freeport-McMoRan might generate in the future and discounts those projected cash flows back to today, to estimate what the business could be worth right now.
For Freeport-McMoRan, the model used is a 2 Stage Free Cash Flow to Equity approach based on cash flow projections. The company’s last twelve months Free Cash Flow is about $678.0 million. Analyst estimates and subsequent extrapolations in the model suggest Free Cash Flow could reach $9.4b by 2030, with ten year projections provided in millions of dollars and then discounted back to today to reflect the time value of money.
Putting all those discounted cash flows together gives an estimated intrinsic value of US$109.59 per share, compared with the recent share price of US$60.41. On these specific inputs, the DCF output implies the shares trade at a 44.9% discount within this model.
Result: UNDERVALUED
Our Discounted Cash Flow (DCF) analysis suggests Freeport-McMoRan is undervalued by 44.9%. Track this in your watchlist or portfolio, or discover 864 more undervalued stocks based on cash flows.
FCX Discounted Cash Flow as at Jan 2026
Approach 2: Freeport-McMoRan Price vs Earnings
For profitable companies, the P/E ratio is a useful way to think about value because it ties the share price directly to the earnings that each share represents. Investors usually accept a higher or lower P/E depending on what they expect for future earnings growth and how risky they think those earnings are.
Freeport-McMoRan currently trades on a P/E of 39.36x. That sits above both the Metals and Mining industry average P/E of 27.06x and the peer group average of 28.44x, which suggests the market is paying a higher price for each dollar of the company’s earnings than for many peers.
Simply Wall St’s Fair Ratio for Freeport-McMoRan is 25.85x. This is a proprietary estimate of what a “normal” P/E might look like for the company after considering factors such as its earnings growth profile, profit margins, industry, market value and key risks. Because it is tailored to the company’s characteristics, the Fair Ratio can give a more specific reference point than a simple comparison with industry or peer averages.
Comparing the current P/E of 39.36x with the Fair Ratio of 25.85x suggests the shares are trading above this model’s view of fair value.
Result: OVERVALUED
NYSE:FCX P/E Ratio as at Jan 2026
P/E ratios tell one story, but what if the real opportunity lies elsewhere? Discover 1428 companies where insiders are betting big on explosive growth.
Upgrade Your Decision Making: Choose your Freeport-McMoRan Narrative
Earlier we mentioned that there is an even better way to understand valuation, so let us introduce you to Narratives, which are simply the story you believe about a company, translated into numbers like fair value, future revenue, earnings and margins.
A Narrative connects what you think is happening with Freeport-McMoRan’s business to a forecast, and then to an estimated fair value per share, so you are not just reacting to the current price in isolation.
On Simply Wall St, Narratives sit inside the Community page and are designed to be easy to use, so you can see how your view lines up against other investors who are using the same framework.
Each Narrative compares its fair value estimate to today’s share price, which can help you decide whether the gap between value and price is wide enough for you to consider buying, holding or selling.
Because Narratives update automatically when new information like news, earnings releases or company guidance is added, your view can stay current without you rebuilding a model from scratch.
For Freeport-McMoRan, you might see one Narrative with a relatively high fair value and another with a much lower fair value, reflecting different expectations for copper demand, project execution and long term profitability.
Do you think there’s more to the story for Freeport-McMoRan? Head over to our Community to see what others are saying!
NYSE:FCX 1-Year Stock Price Chart
This article by Simply Wall St is general in nature. We provide commentary based on historical data
and analyst forecasts only using an unbiased methodology and our articles are not intended to be financial advice. It does not constitute a recommendation to buy or sell any stock, and does not take account of your objectives, or your
financial situation. We aim to bring you long-term focused analysis driven by fundamental data.
Note that our analysis may not factor in the latest price-sensitive company announcements or qualitative material.
Simply Wall St has no position in any stocks mentioned.
Companies discussed in this article include FCX.
Have feedback on this article? Concerned about the content? Get in touch with us directly. Alternatively, email editorial-team@simplywallst.com
Vancouver, British Columbia–(Newsfile Corp. – January 23, 2026) – Gold Runner Exploration Inc. (CSE: GRUN) (FSE: CE7) ("Gold Runner" or the "Company") is pleased to announce that it has entered into an Option Agreement with the B-ALL Syndicate Ltd. ("B-All" or the "Optionor") to acquire a 100% interest in the Golden Girl Property ("Golden Girl Property", "Golden Girl" or "Property"), from the B-ALL Syndicate.
Chris Wensley, CEO of Gold Runner states, "We are excited to begin exploration on the Golden Girl property located in an underexplored part of British Columbia's renowned Golden Triangle. The excellent work done by the B-ALL Syndicate team who generated the property allows us to get right into it with follow up prospecting and mapping of known high-grade gold targets in preparation for future drilling. This is the same team that generated and staked Goliath Resources (TSXV: GOT), Surebet Discovery and contributed to advancing that discovery to where it is today. The B-ALL Syndicate also generated and staked the Big One discovery that was subsequently optioned to Juggernaut Exploration (TSXV: JUGR), who are actively exploring the project with drilling to commence this summer. We are looking forward to unlocking the full potential of this brand new discovery and bring long term value to our share holders."
Golden Girl is only 17 kilometers (km) from the Snip Mine and 14 km from the Bronson Air Strip, making for cost-effective exploration in the heart of the Golden Triangle of North-Western British Columbia.
Recent exploration, conducted by B-ALL, has identified a large new gold-silver system measuring 12 km by 7 km on the Golden Girl Property. The system features a gold-rich core surrounded by a silver-rich halo. Highlights from the 2024 exploration program include grab samples assaying up to 11.28 g/t Au, 3,262 g/t Ag, 5.37% Cu, 20% Pb, and 14.15% Zn and channel cuts assaying up to 3.74 g/t Au, 2105.45 g/t Ag, 0.88% Cu, 5.48% Pb and 7.42% Zn. Forty-seven (47) samples collected on the Property returned values exceeding 1 g/t AuEq (see table below for samples >1 g/t AuEq).
The Golden Girl property covers an area of 8,471 hectares (ha) located in the Iskut River region of Northwestern British Columbia. This acquisition places the Company in a richly endowed, underexplored geologic terrane in the heart of the Golden Triangle, approximately 17 km from the past-producing Snip Gold Mine, which historically produced approximately 1 million ounces of gold, 390,000 ounces of silver and 249,276 kilograms of copper (at an average 127.5 grams per ton gold over 8 years). Eskay Creek, which lies approximately 60 km east of Golden Girl, produced approximately 3.3 million ounces of gold and 160,000 ounces of silver between 1994 and 2008 (with an estimated 3.3 million ounces of gold, 88 million ounces of silver in reserves). Golden Girl is also located approximately mid-way between Goliath Resources Limited's Gold Digger/Surebet discovery and Juggernaut Exploration Ltd.'s Big One property, almost next door to Newmont's Galore Creek. The reader is reminded that the information provided herein from neighbouring projects and properties is not necessarily indicative of resources and should not be relied upon for the determination of mineralization or potential results of the Company's properties.
To view an enhanced version of this graphic, please visit:https://images.newsfilecorp.com/files/7042/281374_299315b9d415d99a_002full.jpg
High-grade mineralization at Golden Girl occurs in structurally controlled shear zones within sulphide-rich veins, stockwork, and breccias, similar to the nearby Snip Gold Mine. Hydrothermal fluids took advantage of pre-existing structures to deposit gold-silver rich mineralization as well as sulphides such as chalcopyrite, galena and sphalerite associated with quartz-carbonate rich veins. Pervasive alteration associated with fluid infiltration is often observed surrounding the zones of strong gold-silver mineralization.
More than 95% of the Golden Girl property remains unexplored. Rapid glacial retreat and snowpack abatement over the last 35 years have revealed vast areas of new outcrop that have never seen historical surface exploration. The Company is planning additional prospecting, sampling and mapping in areas surrounding the known mineralized showings, as well as detailed work augmented by geophysical survey in areas around the known drill ready targets in preparation for the inaugural drill program.
The Golden Girl Property is strategically located near major regional infrastructure with year-round helicopter access from the Forrest Kerr Road (39 km east), as well as in close proximity to a maintained power line and an active air strip. The project exploration qualifies for the Critical Mineral Exploration Tax Credit (CMETC).
Table 1: Golden Girl Property Samples with assays >1 g/t AuEq.
| Sample ID | Sample Type | Au (g/t) | Ag (g/t) | Cu (%) | Pb (%) | Zn (%) | AuEq (g/t) |
| D751631 | Grab | 5.50 | 3261.82 | 1.09 | 8.78 | 0.45 | 45.16 |
| D751628 | Grab | 8.59 | 1769.68 | 2.86 | 17.40 | 10.60 | 38.39 |
| D751915 | Grab | 0.92 | 2531.45 | 1.89 | 3.40 | 10.40 | 35.12 |
| D751738 | Channel | 3.74 | 2105.45 | 0.88 | 5.48 | 7.42 | 31.66 |
| D751551 | Grab | 11.28 | 1465.23 | 0.23 | 0.51 | 0.41 | 28.14 |
| D751629 | Grab | 1.32 | 1828.17 | 2.10 | 7.18 | 0.27 | 25.60 |
| D751807 | Grab | 0.17 | 1558.66 | 0.37 | 8.07 | 14.15 | 24.06 |
| D751554 | Grab | 0.25 | 1114.15 | 0.63 | 1.22 | 0.09 | 13.66 |
| D751552 | Grab | 5.48 | 644.81 | 0.13 | 0.27 | 0.39 | 13.00 |
| D751735 | Channel | 0.44 | 812.73 | 0.65 | 2.45 | 1.82 | 11.29 |
| D751516 | Channel | 1.80 | 82.99 | 0.05 | 20.00 | 12.30 | 10.89 |
| D751723 | Float | 5.07 | 2.75 | 5.37 | 0.10 | 0.46 | 10.86 |
| D751919 | Chip | 10.51 | 24.31 | 0.01 | 0.06 | 0.11 | 10.84 |
| D751535 | Grab | 3.44 | 369.77 | 0.28 | 5.95 | 1.30 | 9.56 |
| D751617 | Grab | 0.74 | 215.28 | 0.03 | 20.00 | 5.11 | 9.09 |
| D751514 | Channel | 2.52 | 2.75 | 0.18 | 11.95 | 3.42 | 6.39 |
| D751886 | Grab | 0.02 | 337.96 | 0.16 | 1.59 | 4.65 | 5.74 |
| D751664 | Grab | 0.59 | 411.92 | 0.22 | 0.01 | 0.03 | 5.44 |
| D751614 | Chip | 0.23 | 75.70 | 0.02 | 3.46 | 6.69 | 3.89 |
| D751515 | Channel | 0.27 | 90.68 | 0.01 | 6.12 | 3.02 | 3.55 |
| D751543 | Grab | 0.25 | 230.57 | 0.34 | 0.54 | 0.49 | 3.44 |
| D751736 | Channel | 0.22 | 247.74 | 0.13 | 0.84 | 0.10 | 3.34 |
| D751663 | Grab | 0.60 | 127.98 | 0.21 | 2.00 | 1.62 | 3.18 |
| D751659 | Grab | 0.65 | 131.22 | 0.18 | 0.74 | 0.65 | 2.67 |
| D751612 | Chip | 0.08 | 37.65 | 0.02 | 2.93 | 4.30 | 2.47 |
| D751615 | Grab | 0.36 | 83.42 | 0.07 | 2.95 | 0.47 | 2.15 |
| D751906 | Grab | 0.08 | 70.23 | 0.03 | 2.11 | 2.61 | 2.15 |
| D751825 | Grab | 0.22 | 39.98 | 0.07 | 1.58 | 2.27 | 1.77 |
| D751737 | Channel | 1.27 | 33.97 | 0.04 | 0.12 | 0.02 | 1.73 |
| D751534 | Grab | 0.98 | 57.04 | 0.01 | 0.18 | 0.06 | 1.69 |
| D751513 | Talus | 0.13 | 95.98 | 0.02 | 0.59 | 0.65 | 1.55 |
| D751002 | Channel | 0.03 | 2.75 | 0.04 | 5.10 | 1.09 | 1.54 |
| D751508 | Chip | 0.47 | 31.23 | 0.68 | 0.01 | 0.01 | 1.54 |
| D751959 | Chip | 0.03 | 32.57 | 0.03 | 0.12 | 3.43 | 1.50 |
| D751645 | Chip | 0.09 | 73.95 | 0.38 | 0.05 | 0.04 | 1.34 |
| D751646 | Grab | 0.06 | 87.81 | 0.27 | 0.02 | 0.04 | 1.34 |
| D751003 | Channel | 0.02 | 33.09 | 0.01 | 2.41 | 1.17 | 1.28 |
| D751809 | Grab | 0.01 | 11.20 | 1.06 | 0.00 | 0.01 | 1.24 |
| D751547 | Channel | 0.05 | 53.39 | 0.08 | 0.84 | 0.97 | 1.21 |
| D751745 | Float | 0.83 | 6.46 | 0.27 | 0.01 | 0.01 | 1.19 |
| D751883 | Grab | 0.02 | 16.52 | 0.00 | 1.22 | 2.29 | 1.17 |
| D751922 | Float | 0.16 | 15.51 | 0.78 | 0.01 | 0.01 | 1.15 |
| D751899 | Channel | 0.01 | 14.97 | 0.00 | 0.70 | 2.51 | 1.10 |
| D751549 | Channel | 0.04 | 23.75 | 0.01 | 1.24 | 1.65 | 1.09 |
| D751546 | Channel | 0.05 | 41.31 | 0.02 | 0.93 | 1.08 | 1.06 |
| D751608 | Talus | 0.09 | 7.30 | 0.55 | 0.08 | 0.92 | 1.05 |
| D751509 | Grab | 0.25 | 21.33 | 0.50 | 0.01 | 0.01 | 1.02 |
Terms of the Option Agreement
The Terms of the Option Agreement are as follows:
the Company will pay a non-refundable deposit of $250,000 to B-All (the "Escrow Funds") in trust and subject to the approval by the Canadian Securities Exchange ("CSE") (the "Regulatory Approvals") by September 2, 2026, as the initial payment under the Option Agreement, and if such approvals are not obtained by September 2, 2026 the Escrow Funds will be provided to B-All in full as a break fee;
The company will issue to B-All 1,830,000 common shares of the Company at the closing price of the date of execution of the Option Agreement and 1,830,000 common share purchase warrants ("Warrants"), with such Warrants being exercisable within five (5) years from the date of issuance at an exercise price equal to the closing price of the common shares of the Company on the CSE on the day prior to issuance plus $0.01 per Warrant (the common shares and Warrants, shall herein be referred to as, the "Trigger Date Securities"), and the Trigger Date Securities shall be issued in escrow and remain in escrow until receipt of the Regulatory Approvals regarding any necessary approvals for the Option Agreement and if such approvals is not obtained, the Trigger Date Securities shall be cancelled and returned to treasury of the Company;
The Company will incur a minimum of $1,500,000 in exploration expenditures, prior to October 1, 2027;
Upon each of the 1st through 6th anniversaries, the Company will pay $250,000 in cash to B-All no later than the respective anniversary (1st through 6th) of the Regulatory Approvals and issue 1,830,000 common shares at a deemed price equal to the closing price of the Company shares on the CSE on the last trading day prior to such issuance date and 1,830,000 common share purchase warrants (respective "First through Sixth Anniversary Warrants") exercisable within 5 years from the date of issuance at an exercise price equal to the closing price of the shares on the CSE on the last trading day prior to such issuance date plus $0.01 per each respective anniversary warrant;
the Company will incur a minimum of $3,000,000 in total exploration expenditures prior to October 1, 2029;
the Company will issue to B-All, not later than the seventh anniversary of the Regulatory Approvals, 4,000,000 common shares at the closing price of the Company shares on the CSE on the last trading day prior to the date of issuance and 4,000,000 common share purchase warrants ("Seventh Anniversary Warrants") exercisable within 5 years from the date of issuance at an exercise price equal to the closing price of the common shares of the Company on the CSE on the last trading day prior to the date of issuance plus $0.01 per Seventh Anniversary Warrant;
the Company will incur a minimum of $10,000,000 in Exploration Expenditures (including the previous annual expenditure amounts) not later than the seventh anniversary of the Regulatory Approvals (for total exploration expenditures of a minimum of $10,000,000) and filing and registering a work/assessment report under the Mineral Tenure Act for 100% of such exploration expenditures and delivering and filing on SEDAR+, not later than the seventh anniversary of the Regulatory Approval Date, a National Instrument 43-101 Technical Report on the Property (the "Initial NI 43-101 Report") which is based on the results of all exploration expenditures incurred on the Golden Girl Property prior to December 31 of the immediately preceding calendar year and includes a resource estimate of gold equivalent mineral reserves (proven and probable) and gold equivalent mineral resources (measured, indicated and inferred categories) (such resource estimate being herein referred to as the "Initial Resource" and each ounce of gold equivalent reserves and resources set out in the Initial NI 43-101 Report and all other NI 43-101 technical reports published in respect of the Property or part thereof being herein referred to as an "Ounce"), and paying to the Syndicate within five (5) Business Days of the date of such delivery and SEDAR+ filing (in such names and amounts as shall be set out in the Syndicate List most recently provided by the Syndicate), USD $3.00 in respect of each Ounce contained in the Initial Resource.
Having met and satisfied all of the above, Gold Runner will have exercised the Option.
If the option is exercised and the Company acquires the Golden Girl Property, there are additional bonus payments in cash that may be provided by the Company to B-All, based on additional Ounces defined in future National Instrument 43-101 Technical Report filed by the Company, subject to certain extensions.
Upon exercise of the Option, a royalty will be reserved to the Syndicate and the Company will pay the Royalty to the Syndicate (in cash or in kind [i.e. gold] at the option of the Syndicate); provided that the Company shall have the option to reduce the royalty from four percent (4%) to three Percent (3%) by paying USD $2,000,000 to the Syndicate not later than 24 months after the date of exercise of the Option.
The Option Agreement will be filed on SEDAR+ and the full terms of the Option can be found therein on the Company's SEDAR+ profile at www.sedarplus.ca.
Gold Runner CEO, Chris Wensley further states: "We are thrilled to have acquired the Golden Girl Option, and we are excited to begin work to build on the initial high grade poly metallic findings generated by the B-ALL Syndicate with a view to confirming a significant discovery. We are also very pleased to welcome the B-All Syndicate, Goliath Resources (TSXV: GOT), and Juggernaut Exploration (TSXV: JUGR) as significant corner stone shareholders as we move forward together."
Qualified Person
This News Release has been approved by Alan Morris, M.Sc., CPG #10550. Alan J. Morris is a Qualified Person as defined by NI 43-101 and has reviewed the scientific and technical disclosure included in this news release.
About Gold Runner Exploration Inc:
Gold Runner Exploration is an experienced exploration company focused on the exploration of gold and silver properties located in the prolific and Geopolitically stable mining districts of North Western British Columbia and Nevada.
The Rock Creek gold project is Gold Runner's flagship asset, with 74 unpatented lode mining claims wholly owned and controlled by the Company. Emboldened by the results coming out of Rock Creek, the Company strategically expanded the land position with the acquisition of the nearby Dry Creek prospect and the acquisition of the Falcon silver-gold prospect in September 2022. Between the three properties, all targeting similar mineralization and likely the same hydrothermal system, Gold Runner Exploration now holds 239 total claims in close proximity of one another. These three gold prospects are situated in a region with proven "world-class" gold deposits (including Midas, Jerritt Canyon, Betze-Post, Meikle, and Gold Quarry), where the potential of finding large, high-grade gold-silver deposits is favourable.
Gold Runner also holds a 10% carried interest in the Cimarron project located in the San Antonio Mountains of Nye County, Nevada, and comprises 31 unpatented lode mining claims, including control of 6 historically producing claims associated with the historic San Antonio mine. The property is located in the prolific Walker-Lane trend, approximately 44 km south of the "world-class" Round Mountain deposit.
About B-ALL Syndicate Ltd.
The B-ALL Syndicate is a highly specialized geologic team of project generators with a proven track record of success. The Syndicate is focused in unexplored areas of glacial and snowpack retreat providing new opportunity for material discovery in renowned geologic terrain. Projects generated by the same team include Goliath Resources' Surebet discovery on the Golddigger Property, Juggernaut Exploration's Big One discovery as well as multiple additional material discoveries. More information is available at https://www.ball-syndicate.com/.
For further information, please contact:
Chris Wensley, Director, Chief Executive OfficerEmail: info@goldrunnerexploration.comWebsite: www.Goldrunnerexploration.com
Forward-Looking Information
This news release includes certain information that may be deemed "forward-looking information" under applicable securities laws. All statements in this release, other than statements of historical facts, including but not limited to those statements relating to the properties exploration work and its results and potential, interpretations prospecting and exploration activities, geological, geophysical, and geochemical surveys, studies and interpretations of historical exploration and geological information, permitting, licences, environmental laws and regulations, changes in government regulations and laws, obtaining social licence to explore and operate, community engagements, timing of exploration activities, economic, competitive, reliance on third parties, the actual results of operations, and other risks of the natural resources industry, and mineral resource and reserve potential, exploration activities and events or developments that the Company expects is forward-looking information. Although the Company believes the expectations expressed in such statements are based on reasonable assumptions, such statements are not guarantees of future performance and actual results or developments may differ materially from those in the statements. There are certain factors that could cause actual results to differ materially from those in the forward-looking information. These include the results of the Company's due diligence investigations, market prices, exploration successes, continued availability of capital financing, and general economic, market or business conditions, and those additionally described in the Company's filings with the Canadian securities authorities.
Investors are cautioned that any such statements are not guarantees of future performance and actual results or developments may differ materially from those projected in the forward-looking information. For more information on the Company, investors are encouraged to review the Company's public filings at www.sedarplus.ca. The Company disclaims any intention or obligation to update or revise any forward- looking information, whether as a result of new information, future events or otherwise, other than as required by law.
NEITHER THE CANADIAN SECURITIES EXCHANGE NOR ITS REGULATION SERVICES PROVIDER HAS REVIEWED OR ACCEPT RESPONSIBILITY FOR THE ADEQUACY OR ACCURACY OF THIS RELEASE
To view the source version of this press release, please visit https://www.newsfilecorp.com/release/281374
Gold stocks are rallying with several in the IBD 50 near all-time highs as gold nears $5,000 an ounce.
Vancouver, British Columbia–(Newsfile Corp. – January 23, 2026) – Rokmaster Resources Corp. (TSXV: RKR) (OTCQB: RKMSF) (FSE: 1RR1) ("Rokmaster" or "the Company") is pleased to provide an update on the Hanson and Mystery properties within the Nechako Project.
The Nechako Project is located in west-central British Columbia within the prolific Stikine terrane as exemplified by several past producing deposits and advanced development projects in the region (Figure 1). The Project consists of three road-accessible properties (Mystery, Fox-Coconut, and Hanson) which total 26,932 hectares (269 km2) when combined.
Two exploration permits have been approved allowing for diamond drilling on the southern and northern portions of the Hanson Property (Figure 2). These are the last of the permit applications submitted during the past year to be approved for the Nechako Project. There are now five approved drill permits for the Mystery, Fox-Coconut, and Hanson Properties allowing for a flexible exploration strategy going forward. The newly approved exploration permits allow for a total of 30 drillsites on the road-accessible and prospective Hanson Property.
The Company is also pleased to report results of a Re-Os geochronology1 study on mineralized samples from the Mystery Property. In 2025, an outcrop of sericite-altered monzonite hosting quartz-molybdenite-chalcopyrite veinlets was found directly north of the Ford Anomaly (Figure 3). Several grab samples from this showing returned elevated Mo-Cu-Au concentrations in assays. The age of this mineralization, as determined through Re-Os dating of molybdenite, is within the 70 to 84 ma range defined by Carter (1982) for the late Cretaceous Bulkley Suite of post-collisional intrusions. The Bulkley Suite is associated with porphyry Cu-Mo-Au-Ag mineralization at the nearby Huckleberry, Ox, Seel, and Poplar Deposits and well as many porphyry-style occurrences in the region2,3.
The Ford Anomaly is characterized by a large geochemical and geophysical anomaly near the southern contact of the central monzonite stock. The anomaly represents one of the multiple potential centres of a large area of phyllic-altered Kasalka Group volcanic rocks present in sparse outcrops and subcrops throughout the Property. A 2025 high-resolution magnetic survey identified several targets with coincident anomalous surface geochemistry and favorable alteration for follow-up, particularly at the B2 Zone. The B2 Zone represents a significant newly recognized showing of strongly potassic altered andesite hosting vertical sericite-pyrite, pyrite-chalcopyrite, magnetite, and secondary biotite-chlorite veinlets. This zone exhibits elevated Cu-Mo-Au assays across 200 m of outcrop exposure. Comparable alteration and mineralization are observed approximately 800 m to the southeast in the B3 Zone, separated from the B2 Zone by glacial till cover.
John Mirko, President and CEO, comments:
"The whole Nechako Project is now fully permitted for drilling in 2026. We are finalizing data from the 2025 field work to refine drill targets in the Nechako Project. Confirmation of a late Cretaceous age of molybdenite mineralization on the Mystery Property, and its alignment with regional metallogeny, supports our search for major porphyry Cu-(Au±Mo) systems in this fertile and well-established district."
Footnote 1: Re-Os (Rhenium-Osmium) geochronology is a radiometric dating method used to date geological materials and was completed by 1365969 Alberta Ltd. Areas of each sample with molybdenite were identified and removed, then metal-free crushing and grinding methods, combined with magnetic and density separation, were used to prepare a molybdenite-bearing mineral separate. Methods used for molybdenite isotopic analysis are described in detail by Selby & Creaser (2004) and Markey et al. (2007).
Footnote 2: Carter, N.C., 1982. Porphyry copper and molybdenum deposits west-central British Columbia (Bulletin 64). Province of British Columbia, Ministry of Energy, Mines and Petroleum Resources.
Footnote 3: Sharman, L., Lang, J.T. and Chapman, J. eds., 2021. Porphyry deposits of the northwestern Cordillera of North America: A 25-year update. CIM Special Volume 57.
The technical information in this news release has been prepared in accordance with Canadian regulatory requirements as set out in National Instrument 43-101 and reviewed and approved by Eric Titley, P.Geo., who is independent of Rokmaster and who acts as Rokmaster's Qualified Person.
For more information please contact Mr. John Mirko, President & CEO of Rokmaster Resources Corp., jmirko@rokmaster.com, Ph. +1(604)290-4647 or by website: www.rokmaster.com
On Behalf of the Board of Directors of Rokmaster Resources Corp.John Mirko, President & Chief Executive Officer.
Neither TSX Venture Exchange nor its Regulation Services Provider (as that term in defined in the policies of the TSX Venture Exchange) accepts responsibility for the adequacy or accuracy of this press release.
CAUTIONARY NOTE REGARDING FORWARD-LOOKING STATEMENTS: This news release may contain forward-looking information within the meaning of applicable securities laws ("forward-looking statements"). Forward-looking statements are statements that are not historical facts and are generally, but not always, identified by the words "expects," "plans," "anticipates," "believes," "intends," "estimates," 'projects," "potential" and similar expressions, or that events or conditions "will," "would," "may," "could" or "should" occur. These forward-looking statements are subject to a variety of risks and uncertainties which could cause actual events or results to differ materially from those reflected in the forward-looking statements, including, without limitation: closing of the FT Financing; risks related to fluctuations in metal prices; uncertainties related to raising sufficient financing to fund the planned work in a timely manner and on acceptable terms; changes in planned work resulting from weather, logistical, technical or other factors; the possibility that results of work will not fulfill expectations and realize the perceived potential of the Company's properties; risk of accidents, equipment breakdowns and labour disputes or other unanticipated difficulties or interruptions; the possibility of cost overruns or unanticipated expenses in the work program; the risk of environmental contamination or damage resulting from Rokmaster's operations and other risks and uncertainties. Any forward-looking statement speaks only as of the date it is made and, except as may be required by applicable securities laws, the Company disclaims any intent or obligation to update any forward-looking statement, whether as a result of new information, future events or results or otherwise.
To view the source version of this press release, please visit https://www.newsfilecorp.com/release/281375
The Standard & Poor’s 500 index edged down 0.4% this week, led by financial stocks amid some weaker-
On Friday, USA Rare Earth stock hit an important technical milestone, seeing its Relative Strength (RS) Rating jump into the 90-plus percentile with an improvement to 91, up from 86 the day before.
Here Are 3 Keys For Successful Stock Investing
IBD's unique RS Rating measures market leadership by using a 1 (worst) to 99 (best) score that identifies how a stock's price performance over the last 52 weeks matches up against other publicly traded companies.
Over 100 years of market history reveals that the stocks that go on to make the biggest gains tend to have an RS Rating north of 80 at the beginning of a new climb.
Is USA Rare Earth Stock A Buy?
USA Rare Earth stock is now considered extended and out of buy range after clearing a 19.68 buy point in a first-stage cup without handle. See if the stock forms a new pattern or follow-on buying opportunity like a three-weeks tight or pullback to the 50-day or 10-week line.
The rare earth and critical mineral miner posted 0% earnings growth last quarter, while sales growth came in at 0%.
USA Rare Earth stock holds the No. 41 rank among its peers in the Mining-Metal Ores industry group. Cameco, Ero Copper and Freeport-McMoRan are among the top 5 highly rated stocks within the group.
This article was created automatically with Stats Perform's Wordsmith software using data and article templates supplied by Investor's Business Daily. An IBD journalist may have edited the article.
YOU MAY ALSO LIKE:
MarketSurge's Tools Can Help The Individual Investor
IBD Live: A New Tool For Daily Stock Market Analysis
Profit From Short-Term Trends With SwingTrader
How To Research Growth Stocks: Why This IBD Tool Simplifies The Search For Top Stocks
Area of AuRORA Now Measures 1.4 km by 0.8 km
Deposit Remains Open to Expansion
+4 km2 NWG Target Area that Hosts AuRORA Shows More Potential
VANCOUVER, BC / ACCESS Newswire / January 23, 2026 / Amarc Resources Ltd. ("Amarc" or the "Company") (TSXV:AHR)(OTCQB:AXREF) is pleased to announce all remaining assay results from the 2025 expansion drilling at the AuRORA Deposit. The AuRORA Deposit hosts high grade near surface, copper-gold-silver ("Cu-Au-Ag") mineralization that has exceptional vertical and lateral continuity (see Amarc releases January 17, 20 and February 28, 2025) and remains open to further expansion to the north, east, south and southwest. Amarc believes the rare combination of high grade near surface geometry and emerging scale at AuRORA are the hallmarks of a Tier One asset in the making.
Twenty-four core holes (9,687 m) were completed at the AuRORA Deposit in 2025 of which 23 are expansion step-out holes. Eleven of these holes have already been announced and assay data from the remaining 12 expansion holes is provided in this release. These holes show similar host rocks, alteration and mineralization types to those previously reported. Mineralization at AuRORA has now been intercepted over an area of 1.4 km by 0.8 km (Figure 1).
"Amarc remains highly focused on disciplined, discovery-driven growth and on advancing its assets in a manner that maximizes the creation of shareholder value," said Amarc's President and CEO, Dr. Diane Nicolson. "A year ago, Amarc announced the discovery of the exciting new, high grade near surface, gold-rich AuRORA Deposit in the JOY District. AuRORA has rewritten the exploration playbook in the Toodoggone and stands as one of the most important recent porphyry copper-gold discoveries in British Columbia. With the hallmarks of a Tier One asset in the making, AuRORA is integral to bringing rapidly forward the potential of the JOY District and stands to be the key to the emergence of a world-class porphyry copper-gold district in the Toodoggone."
AuRORA Deposit Expanded to the North
Results previously announced in late 2025 from eight holes completed on Sections 8000N, 8100N and 8200N successfully expanded AuRORA +300 m to the north (Figure 1, and Amarc releases November 3 and December 10, 2025). Today, we are announcing drill hole JP25119 located on Section 8300N, which has expanded AuRORA a further +100 m to the north (Figures 1 and 2, and Tables 1 and 3), for a cumulative +400 m northern extension of the deposit in 2025. This sector of the Deposit requires further drilling.
The Cu-Au-Ag mineralization in JP25119 occurs well outside the strong magnetic high that hosts the high grade AuRORA mineralization discovered in 2024. Significant grade intersections (117 m of 0.19% Cu, 0.49 g/t Au and 2.2 g/t Ag including 93 m of 0.20% Cu, 0.54 g/t Au and 2.4 g/t Ag; and 98 m of 0.13% Cu, 0.52 g/t Au and 2.6 g/t Ag, Table 1) in JP25119, occur in rock with a comparatively weak magnetic signature and outside of the main core of Induced Polarization ("IP") chargeability responses. The recognition that mineralization is not restricted to magnetic highs or the strongest IP chargeability responses in the JOY District opens up exciting potential for further discovery and development of a world class porphyry Cu-Au district at JOY.
Also, even further to the north, a single large step out scout hole (JP25120) was completed +500 m to the east-northeast of hole JP25119, and some 350 m north of AuRORA hole JP25103 on Section 8200 N (Figures 1 and 2). This hole, which was targeted on a magnetic high within the comparatively lower contrast area of the NWG Target IP chargeability anomaly, intercepted significant Cu-Au-Ag mineralization at depth (33 m of 0.22% Cu, 0.58 g/t Au and 5.4 g/t Ag; and the last 36 m of the hole returned 0.29% Cu, 0.28 g/t Au and 5.9 g/t Ag, Table 1). This was the last hole underway on JOY in 2025. It was terminated prematurely in strong mineralization due to 2025 drill program demobilization constraints. Additional drilling is required to establish if this hole represents expansion of the AuRORA Deposit to the northeast or is another potential deposit.
AuRORA Deposit Expanded to the East and Southeast
Results from three holes announced in 2025 on Sections 7900N and 7600N successfully expanded AuRORA approximately 200 m to the east and 300 m to the southeast (Figure 1). Today's results are from seven additional drill holes located on Sections 7800N, 7700N, 7600N, 7400N and 7450N (Figures 1, 3 and 4, and Tables 1 and 3), which have cumulatively expanded the AuRORA Deposit from the 2024 discovery drilling 550 m to the east, +500 m to the southeast and 50 m to the south. AuRORA remains open to expansion in each of these directions. This sector of the Deposit requires further drilling.
Like hole JP25119 that extends AuRORA to the north, it should be noted that Cu-Au-Ag mineralization intersected in holes JP25096 (42 m of 0.11% Cu, 0.36 g/t Au and 2.9 g/t Ag; and 80 m of 0.24% Cu, 0.27 g/t Au and 3.2 g/t Ag), JP25097 (134 m of 0.18% Cu, 0.32 g/t Au and 2.8 g/t Ag), JP25102 (38 m of 0.11% Cu, 0.59 g/t Au and 2.4 g/t Ag; and 91 m of 0.18% Cu, 0.31 g/t Au and 4.1 g/t Ag), JP25112 (75 m of 0.31% Cu, 0.22 g/t Au and 7.7 g/t Ag), JP25118 (85 m of 0.23% Cu, 0.20 g/t Au and 4.8 g/t Ag including 22 m of 0.34% Cu, 0.28 g/t Au and 4.7 g/t Ag) and JP25115 (115 m of 0.29% Cu, 0.26 g/t Au and 3.1 g/t Ag) again occurs well outside the strong magnetic high that hosts the AuRORA mineralization discovered in 2024.
Of note in this area of AuRORA, five drill holes have returned significant molybdenum ("Mo") which, like Cu is a Critical Mineral. Long intercepts of 133 to 356 ppm Mo (Table 2) were encountered, for example, hole JP25112 returned 165 m of 0.22% Cu, 0.19 g/t Au, 5.3 g/t Ag and 292 ppm Mo. Further drilling in this sector of the Deposit is required to determine the extent and significance of the Mo mineralization.
AuRORA Deposit Expanded to the Southwest
Results from three holes – JP25087 (66 m of 0.25% Cu, 0.65 g/t Au and 2.7 g/t Ag) on Section 7700N, and JP25088 (75 m of 0.33% Cu, 0.76 g/t Au and 3.6 g/t Ag) and JP25090 (48 m of 0.15% Cu, 0.42 g/t Au and 1.3 g/t Ag) on Section 7600N have expanded AuRORA 125 m to the southwest (Figures 1, 3 and 4, and Table 1). AuRORA remains open to expansion to the southwest. This sector of the Deposit requires further drilling.
New Potential in Northwest Gossan ("NWG") Target
Hole JP25114 drilled 550 m south of the AuRORA Deposit within the NWG Target area (Figures 1 and 4), intercepted promising Au-Ag-Cu mineralization (12 m of 0.40 g/t Au and 0.5 g/t Ag; and 74 m of 0.05% Cu, 0.92 g/t Au and 0.6 g/t Ag). These strongly anomalous Au grades may mimic the anomalous Au concentrations in plumes observed above the Kemess East Cu-Au Porphyry Deposit in the Kemess Mining District 1 located adjacent to the south of the JOY District, where the plumes overlie the main porphyry centres below.
Hole JP25114 was drilled to test rock chip sampling of gossanous outcrop in non-selective samples that returned significant concentrations of Au (20 ppb to 390 ppb) and Ag (0.1 ppm to 0.6 ppm) within the NWG IP chargeability anomaly (Figure 1). It is noted that a similar Au and Ag anomaly exists at surface vertically above the mineralized zone in hole JP25118 on Section 7700N (Figures 1 and 3, and Table 1). This area, and other locations with similar Au and Ag concentrations in surface rock chip samples within the NWG IP chargeability target area require drill testing for additional porphyry Cu-Au centres.
JOY District drilling in 2024 and 2025 now totals 75 drill holes (32,624 m). Of this total, 45 holes (17,586 m) have been completed at AuRORA and 31 holes (14,678 m) were completed across the District. Thirty-five holes (15,381 m) were drilled at JOY in 2025; of these, assay results from 10 holes drilled across the District are now being compiled for release shortly.
Figure 2 (Sections 8400N, 8300N, 8200N and 8100N): AuRORA Deposit Discovery 2025 Step-out Drilling is Discovering More Open-Ended, Continuous Mineralisation
Table 1: AuRORA Porphyry Cu-Au-Ag Deposit Expansion
Sections 8400N, 8300N, 7800N, 7700N, 7600N, 7500N, 7450N and 6900N
|
Section |
Drill Hole |
Incl. |
From (m) |
To (m) |
Int. 1,2,3 (m) |
Au (g/t) |
Cu (%) |
Ag (g/t) |
|
8400N |
JP25120 |
564.00 |
597.00 |
33.00 |
0.58 |
0.22 |
5.4 |
|
|
639.50 |
675.40 |
35.90 |
0.29 |
0.28 |
5.9 |
|||
|
8300N |
JP25119 |
461.00 |
577.65 |
116.65 |
0.49 |
0.19 |
2.2 |
|
|
Incl. |
470.00 |
563.00 |
93.00 |
0.54 |
0.20 |
2.4 |
||
|
602.00 |
700.00 |
98.00 |
0.52 |
0.13 |
2.6 |
|||
|
Incl. |
602.00 |
627.53 |
25.53 |
0.93 |
0.21 |
2.5 |
||
|
7800N |
JP25102 |
308.00 |
346.05 |
38.05 |
0.59 |
0.11 |
2.4 |
|
|
376.70 |
468.00 |
91.30 |
0.31 |
0.18 |
4.1 |
|||
|
7700N |
JP25087 |
78.00 |
243.00 |
165.00 |
0.38 |
0.16 |
1.7 |
|
|
Incl. |
162.00 |
228.00 |
66.00 |
0.65 |
0.25 |
2.7 |
||
|
JP25096 |
182.75 |
225.00 |
42.25 |
0.36 |
0.11 |
2.9 |
||
|
257.00 |
336.50 |
79.50 |
0.27 |
0.24 |
3.2 |
|||
|
JP25118 |
240.00 |
477.00 |
237.00 |
0.19 |
0.15 |
2.9 |
||
|
Incl. |
327.00 |
412.40 |
85.40 |
0.20 |
0.23 |
4.8 |
||
|
Incl. |
422.50 |
444.00 |
21.50 |
0.28 |
0.34 |
4.7 |
||
|
7600N |
JP25088 |
194.00 |
300.00 |
106.00 |
0.62 |
0.27 |
3.1 |
|
|
Incl. |
213.00 |
288.00 |
75.00 |
0.76 |
0.33 |
3.6 |
||
|
JP25090 |
117.00 |
279.40 |
162.40 |
0.22 |
0.10 |
0.9 |
||
|
Incl. |
192.00 |
240.00 |
48.00 |
0.42 |
0.15 |
1.3 |
||
|
JP25097 |
144.00 |
278.45 |
134.45 |
0.32 |
0.18 |
2.8 |
||
|
Incl. |
180.00 |
278.45 |
98.45 |
0.30 |
0.22 |
3.5 |
||
|
and |
180.00 |
231.00 |
51.00 |
0.35 |
0.23 |
3.4 |
||
|
JP25112 |
270.00 |
435.00 |
165.00 |
0.19 |
0.22 |
5.3 |
||
|
Incl. |
360.00 |
435.00 |
75.00 |
0.22 |
0.31 |
7.7 |
||
|
7500N |
JP25092 |
207.00 |
273.00 |
66.00 |
0.12 |
0.12 |
1.7 |
|
|
Incl. |
210.00 |
249.00 |
39.00 |
0.13 |
0.16 |
2.0 |
||
|
7450N |
JP25115 |
213.00 |
289.7 4 |
76.70 |
0.20 |
0.15 |
3.3 |
|
|
303.00 |
417.80 |
114.80 |
0.26 |
0.29 |
3.1 |
|||
|
6900N |
JP25114 5 |
27.00 |
39.00 |
12.00 |
0.40 |
0.00 6 |
0.6 7 |
|
|
96.00 |
169.55 |
73.55 |
0.92 |
0.05 |
0.6 |
Notes to Table 1:
Widths reported are drill widths, such that true thicknesses are unknown.
All assay intervals represent length-weighted averages.
Some figures may not sum exactly due to rounding.
Drill hole JP25115 interval 234-235.2 m comprised broken ground, no core was recovered, and it was therefore averaged at zero grade.
Drilled in Northwest Gossan (NWG) Target.
Value rounded to two decimal places; underlying result for Cu (%) is 0.0049%.
Values rounded to one decimal place; underlying results for Ag (g/t) are 0.55 and 0.62, respectively.
Drill hole JP25101 was lost and redrilled at JP25103 which was previously released.
Table 2: AuRORA Porphyry Cu-Au-Ag Deposit Drill Holes from the
Southeast Area with Significant Mo
|
Drill Hole |
From (m) |
To (m) |
Int. 1,2,3(m) |
Au(g/t) |
Cu(%) |
Ag(g/t) |
Mo(ppm) |
|
JP25098 4 |
223.00 |
289.00 |
66.00 |
0.49 |
0.18 |
4.8 |
133 |
|
JP25102 |
321.00 |
346.05 |
25.05 |
0.65 |
0.14 |
3.1 |
167 |
|
376.70 |
468.00 |
91.30 |
0.31 |
0.18 |
4.1 |
139 |
|
|
JP25112 |
270.00 |
435.00 |
165.00 |
0.19 |
0.22 |
5.3 |
292 |
|
JP25115 |
222.00 |
289.70 |
67.70 |
0.19 |
0.16 |
3.2 |
251 |
|
300.00 |
378.00 |
78.00 |
0.24 |
0.30 |
3.3 |
356 |
|
|
JP25118 |
264.00 |
369.00 |
105.00 |
0.24 |
0.12 |
2.7 |
164 |
Notes to Table 2: 1, 2 and 3, see Table 1
4. Drill Hole JP25098 was previously released.
About Amarc Resources Ltd.
Amarc is a mineral exploration and development company with an experienced and successful management team focused on developing a new generation of long-life, high-value porphyry Cu-Au mines in BC. By combining high-demand projects with dynamic management, Amarc has created a solid platform to create value from its exploration and development-stage assets.
Amarc is advancing the JOY, DUKE and IKE porphyry Cu±Au Districts located in different prolific porphyry regions of northern, central and southern BC, respectively. Each District represents significant potential for the development of multiple and important-scale, porphyry Cu±Au deposits. Importantly, each of the three districts are located in proximity to industrial infrastructure – including power, highways and rail.
Freeport-McMoRan Mineral Properties Canada Inc. ("Freeport"), a wholly owned subsidiary of Freeport-McMoRan Inc. at JOY and Boliden Mineral Canada Ltd. ("Boliden"), an entity within the Boliden Group of companies at DUKE, can earn up to a 70% interest in each District through staged investments of CAD $110 million and CAD $90 million, respectively. Together, this provides Amarc with potentially up to CAD $200 million in non-share dilutive staged funding for these Districts. In addition, Amarc completed self-funded drilling at its Empress Cu-Au Deposit in the IKE District in 2024. Amarc is the operator at the DUKE and IKE Districts.
The CAD $16+ million JOY exploration program expenditures in 2025 were 100% funded by Freeport. As previously announced (Amarc May 29, 2025 and September 4, 2025 releases), Freeport has completed Stage 1 requirements under the May 2021 JOY agreement, earning a 60% interest by spending CAD $35 million, and has elected to proceed to Stage 2to earn a further 10% interest by spending an additional CAD $75 million within 5 years at a rate of no less than CAD $10 million per year. While Freeport is now the Operator of JOY, Aurora Minerals Ltd., the joint venture company is currently owned by Freeport (60%) and Amarc (40%), has appointed Amarc as the primary contractor to continue to manage the JOY exploration programs under a separate Services Agreement.
Amarc's exploration is led by an internationally successful team of experienced geologists specializing in porphyry Cu-Au deposits. Members of this team have been involved in and have tracked porphyry Cu-Au exploration advancements in the Toodoggone region since 1990. Their experience and early recognition of the porphyry potential at the NWG Target in terms of a shallowly overburden covered and underexplored transitional epithermal-porphyry geological setting, led to the discovery of the Au-rich AuRORA porphyry Cu-Au-Ag Deposit.
Amarc is associated with HDI, a diversified, global mining company with a 35-year history of porphyry Cu deposit discovery, development and transaction success. Previous and current HDI projects include some of BC's and the world's most important porphyry deposits – such as Pebble, Mount Milligan, Southern Star, Kemess South, Kemess North, Gibraltar, Prosperity, Xietongmen, Newtongmen, Florence, Casino, Sisson, Maggie, PINE, IKE, DUKE and AuRORA. From its head office in Vancouver, Canada, HDI applies its unique strengths and capabilities to acquire, develop, operate and monetize mineral projects.
Amarc works closely with local governments, Indigenous groups and stakeholders in order to advance its mineral projects responsibly, and in a manner that contributes to sustainable community and economic development. We pursue early and meaningful engagement to ensure our mineral exploration and development activities are well coordinated and broadly supported, address local priorities and concerns, and optimize opportunities for collaboration. In particular, we seek to establish mutually beneficial partnerships with Indigenous groups within whose traditional territories our projects are located, through the provision of jobs, training programs, contract opportunities, capacity funding agreements and sponsorship of community events. All Amarc work programs are carefully planned to achieve high levels of environmental and social performance.
Qualified Person
Mark Rebagliati, P.Eng., a Qualified Person ("QP") as defined by National Instrument 43-101, has reviewed and approved the technical and scientific information in this news release. Mr. Rebagliati is not independent of the Company.
Quality Assurance/Quality Control Program
Amarc drilled HQ (63.5mm) and NQ (47.6mm) size core in 2025 at the JOY project. All drill core was logged, photographed, and cut in half with a diamond saw. Half core samples from the AuRORA Deposit and other drilling across the JOY District were sent to ALS Canada Ltd., Kamloops, Canada, for preparation and to North Vancouver, Canada for analysis. Both facilities are ISO/IEC 17025:2017 accredited. At the laboratory, samples were dried and crushed to 70% passing −2 mm, followed by pulverization of a 250 g split to better than 85% passing 75 microns; however, for AuRORA Deposit samples, a 1,000 g split was pulverized to the same particle-size specification. All samples were analyzed for Au by fire assay fusion of a 30 g sub-sample with an ICP-AES finish, and for 60 elements including Cu, Mo and Ag by a four-acid digestion, multi-element ICP-MS package. In addition, all samples from the AuRORA Deposit were also analyzed for Cu by single element four-acid digestion ICP-AES, for oxidized Cu by quick sulphuric acid / ferric sulphate leach AAS and for soluble Cu by sulphuric acid leach AAS. As part of a comprehensive Quality Assurance/Quality Control ("QAQC") program, Amarc control samples were inserted in each analytical batch of the core samples at the following rates: standards one in 20 regular samples, duplicate sets (half core, coarse reject, and pulp split) one in 20 regular samples and one coarse blank in 20 regular samples. The control sample results were then checked to ensure proper QAQC.
For further details on Amarc Resources Ltd., please visit the Company's website at www.amarcresources.com or contact Dr. Diane Nicolson, President and CEO, at (604) 684-6365 or within North America at 1-800-667-2114, or Kin Communications, at (604) 684-6730, Email: AHR@kincommunications.com .
ON BEHALF OF THE BOARD OF DIRECTORS OF AMARC RESOURCES LTD.
Dr. Diane Nicolson
President and CEO
Neither TSX Venture Exchange nor its Regulation Services Provider (as that term is defined in policies of the TSX Venture Exchange) accepts responsibility for the adequacy or accuracy of this release.
Forward Looking and other Cautionary Information
This news release includes certain statements that may be deemed "forward-looking statements". All such statements, other than statements of historical facts that address exploration plans and plans for enhanced relationships are forward-looking statements. Although the Company believes the expectations expressed in such forward-looking statements are based on reasonable assumptions, such statements are not guarantees of future performance and actual results or developments may differ materially from those in the forward-looking statements. Assumptions used by the Company to develop forward-looking statements include the following: Amarc's projects will obtain all required environmental and other permits and all land use and other licenses, studies and exploration of Amarc's projects will continue to be positive, and no geological or technical problems will occur. Factors that could cause actual results to differ materially from those in forward-looking statements include market prices, potential environmental issues or liabilities associated with exploration, development and mining activities, exploitation and exploration successes, continuity of mineralization, uncertainties related to the ability to obtain necessary permits, licenses and tenure and delays due to third party opposition, changes in and the effect of government policies regarding mining and natural resource exploration and exploitation including the effects of land use plans that may impact activities on or access to properties, exploration and development of properties located within Aboriginal groups asserted territories may affect or be perceived to affect asserted aboriginal rights and title, which may cause permitting delays or opposition by Aboriginal groups, continued availability of capital and financing, and general economic, market or business conditions. Investors are cautioned that any such statements are not guarantees of future performance and actual results or developments may differ materially from those projected in the forward-looking statements. For more information on Amarc Resources Ltd., investors should review Amarc's annual Form 20-F filing with the United States Securities and Exchange Commission at www.sec.gov and its home jurisdiction filings that are available at www.sedarplus.ca.
Table 3: Announced Drill Hole Information
|
Drill Hole |
Easting |
Northing |
Elevation |
Azim (°) |
Dip (°) |
EOH (m) |
|
JP25087 |
622688 |
6347704 |
1411 |
270 |
-67 |
309.0 |
|
JP25088 |
622698 |
6347600 |
1444 |
90 |
-65 |
375.0 |
|
JP25090 |
622693 |
6347602 |
1445 |
270 |
-60 |
279.4 |
|
JP25092 |
622884 |
6347505 |
1421 |
90 |
-60 |
297.4 |
|
JP25096 |
623037 |
6347699 |
1395 |
90 |
-56 |
364.5 |
|
JP25097 |
623074 |
6347598 |
1395 |
91 |
-60 |
314.3 |
|
JP25102 |
623497 |
6347805 |
1609 |
270 |
-81 |
521.2 |
|
JP25112 |
623322 |
6347599 |
1453 |
90 |
-61 |
553.0 |
|
JP25114 |
623123 |
6346917 |
1553 |
90 |
-55 |
486.0 |
|
JP25115 |
623303 |
6347442 |
1418 |
91 |
-71 |
486.0 |
|
JP25118 |
623301 |
6347700 |
1492 |
90 |
-70 |
504.0 |
|
JP25119 |
622610 |
6348301 |
1362 |
270 |
-75 |
700.0 |
|
JP25120 |
623059 |
6348417 |
1609 |
90 |
-85 |
675.4 |
Note: Collar locations are in UTM NAD83, Zone 9N coordinates.
Figure 1 (Drill Plan Map): AuRORA Deposit Discovery High Grade Near Surface, Exceptional Continuity, Deposit Continues to be Open to Expansion
Figure 2 (Sections 8400N, 8300N, 8200N and 8100N): AuRORA Deposit Discovery 2025 Step-out Drilling is Discovering More Open-Ended, Continuous Mineralization
Figure 3 (Sections 8000N, 7900N, 7800N and 7700N): AuRORA Deposit Discovery 2025 Step-Out Drilling is Discovering More Open-Ended, Continuous Mineralization
Figure 4 (Sections 7600N, 7500N, 7450N and 6900N): AuRORA Deposit Discovery 2025 Step-Out Drilling is Discovering More Open-Ended, Continuous Mineralization
1 Rebagliati, C.M., Duuring, P., Dickinson, J.M., and McKinley, B., and Fagan, A.J., 2020, Geology and exploration of the Jurassic porphyry-style Cu-Au-Ag±Mo mineralization in the Kemess-Pine area of the Toodoggone District of British Columbia, Canada, in: updated CIM Special Volume 57, Society of Exploration Geologists, pp. 253-266.
SOURCE: Amarc Resources Ltd.
View the original press release on ACCESS Newswire
Investors in FMC Corporation FMC need to pay close attention to the stock based on moves in the options market lately. That is because the Feb. 20, 2026 $35 Put had some of the highest implied volatility of all equity options today.
What is Implied Volatility?
Implied volatility shows how much movement the market is expecting in the future. Options with high levels of implied volatility suggest that investors in the underlying stocks are expecting a big move in one direction or the other. It could also mean there is an event coming up soon that may cause a big rally or a huge sell-off. However, implied volatility is only one piece of the puzzle when putting together an options trading strategy.
What do the Analysts Think?
Clearly, options traders are pricing in a big move for FMC shares, but what is the fundamental picture for the company? Currently, FMC is a Zacks Rank #3 (Hold) in the Agriculture – Operations industry that ranks in the Top 22% of our Zacks Industry Rank. Over the last 60days, one analyst has increased the earnings estimates for the current quarter, while three have dropped their estimates. The net effect has taken our Zacks Consensus Estimate for the current quarter from $1.23 per share to $1.21 in that period.
Given the way analysts feel about FMC right now, this huge implied volatility could mean there’s a trade developing. Oftentimes, options traders look for options with high levels of implied volatility to sell premium. This is a strategy many seasoned traders use because it captures decay. At expiration, the hope for these traders is that the underlying stock does not move as much as originally expected.
Want the latest recommendations from Zacks Investment Research? Today, you can download 7 Best Stocks for the Next 30 Days. Click to get this free report
FMC Corporation (FMC) : Free Stock Analysis Report
This article originally published on Zacks Investment Research (zacks.com).
Toronto, Ontario–(Newsfile Corp. – January 23, 2026) – Wallbridge Mining Company Limited (TSX: WM) (OTCQB: WLBMF) ("Wallbridge" or the "Company") is pleased to announce that it will be exhibiting at the Vancouver Resource Investment Conference (VRIC) in Vancouver, BC, Canada on January 25th and 26th. Wallbridge welcomes conference attendees to visit Booth 1123 for an update on the Company's plans for 2026.
A corporate presentation will be given by Brian Penny, Wallbridge's CEO on Sunday, January 25th at 1:30 pm in Workshop 1.
The Vancouver Resource Investment Conference (VRIC) will take place on January 25th-26th, 2026, at the Vancouver Convention Centre West, 1055 Canada Place, Vancouver: Exhibition Hall A-C on the lower level.
This year's conference will have 300 mining companies exhibiting and is expected to welcome 9,000 attendees including investors and industry leaders.
For more information and/or to register for the conference please visit:
https://cambridgehouse.com/vancouver-resource-investment-conference
Upcoming Marketing: Q1 2026
Vancouver Resource Investment Conference, Vancouver, CanadaJanuary 25-26, 2026
BMO Global Metals and Mining Conference, Hollywood, USFebruary 23-26, 2026
PDAC Convention, Toronto, CanadaMarch 1-4, 2026
John Tumazos Very Independent Research, Virtual ConferenceMarch 2026
About Wallbridge Mining
Wallbridge is focused on creating value through the exploration and sustainable development of gold projects in Quebec's Abitibi region while respecting the environment and communities where it operates. The Company holds a contiguous mineral property position totaling 598 km2 that extends approximately 82 km along the Detour-Fenelon gold trend. The property is host to the Company's flagship PEA stage Fenelon Gold Project, and its earlier exploration stage Martiniere Gold Project, as well as numerous greenfield gold projects.
For further information please visit the Company's website at https://wallbridgemining.com/ or contact:
Wallbridge Mining Company Limited
Brian Penny, CPA, CMACEOTel: (416) 716-8346Email: bpenny@wallbridgemining.com
Tania Barreto, CPIRDirector, Investor RelationsEmail: tbarreto@wallbridgemining.comM: +1 289 819 3012
Cautionary Note Regarding Forward-Looking Information
The information in this document may contain forward-looking statements or information (collectively, "FLI") within the meaning of applicable Canadian securities legislation. FLI is based on expectations, estimates, projections and interpretations as at the date of this document.
All statements, other than statements of historical fact, included herein are FLI that involve various risks, assumptions, estimates and uncertainties. Generally, FLI can be identified by the use of statements that include, but are not limited to, words such as "seeks", "believes", "anticipates", "plans", "continues", "budget", "scheduled", "estimates", "expects", "forecasts", "intends", "projects", "predicts", "proposes", "potential", "targets" and variations of such words and phrases, or by statements that certain actions, events or results "may", "will", "could", "would", "should" or "might", "be taken", "occur" or "be achieved."
FLI in this document may include, but is not limited to: the continuity of and expansion potential of the Martiniere gold system; the growth potential and continuity of mineralization of the Detour Fenelon Gold Trend Properties in general, including Martiniere, Fenelon, Casault and Grasset Gold; the value creation potential of the Company; and the significance of historic exploration activities and results.
FLI is designed to help you understand management's current views of its near- and longer-term prospects, and it may not be appropriate for other purposes. FLI by their nature are based on assumptions and involve known and unknown risks, uncertainties and other factors which may cause the actual results, performance, or achievements of the Company to be materially different from any future results, performance or achievements expressed or implied by such FLI. Although the FLI contained in this document is based upon what management believes, or believed at the time, to be reasonable assumptions, the Company cannot assure shareholders and prospective purchasers of securities of the Company that actual results will be consistent with such FLI, as there may be other factors that cause results not to be as anticipated, estimated or intended, and neither the Company nor any other person assumes responsibility for the accuracy and completeness of any such FLI. Except as required by law, the Company does not undertake, and assumes no obligation, to update or revise any such FLI contained in this document to reflect new events or circumstances. Unless otherwise noted, this document has been prepared based on information available as of the date of this document. Accordingly, you should not place undue reliance on the FLI, or information contained herein.
Furthermore, should one or more of the risks, uncertainties or other factors materialize, or should underlying assumptions prove incorrect, actual results may vary materially from those described in FLI.
Assumptions upon which FLI is based, without limitation, include: the results of exploration activities, the Company's financial position and general economic conditions; the ability of exploration activities to accurately predict mineralization; the accuracy of geological modelling; the ability of the Company to complete further exploration activities; the legitimacy of title and property interests in the Company's mineral properties; the accuracy of key assumptions, parametre or methods used to estimate the mineral resource estimates and in the preliminary economic assessment; the ability of the Company to obtain required approvals; geological, mining and exploration technical problems; failure of equipment or processes to operate as anticipated; the evolution of the global economic climate; metal prices; foreign exchange rates; environmental expectations; community and non-governmental actions; and, the Company's ability to secure required funding. Risks and uncertainties about Wallbridge's business are discussed in the disclosure materials filed with the securities regulatory authorities in Canada, which are available at www.sedarplus.ca.
Cautionary Notes to United States Investors
Wallbridge prepares its disclosure in accordance with NI 43-101 which differs from the requirements of the U.S. Securities and Exchange Commission (the "SEC"). Terms relating to mineral properties, mineralization and estimates of mineral reserves and mineral resources and economic studies used herein are defined in accordance with NI 43-101 under the guidelines set out in CIM Definition Standards on Mineral Resources and Mineral Reserves, adopted by the Canadian Institute of Mining, Metallurgy and Petroleum Council on May 19, 2014, as amended. NI 43-101 differs significantly from the disclosure requirements of the SEC generally applicable to US companies. As such, the information presented herein concerning mineral properties, mineralization and estimates of mineral reserves and mineral resources may not be comparable to similar information made public by U.S. companies subject to the reporting and disclosure requirements under the U.S. federal securities laws and the rules and regulations thereunder.
To view the source version of this press release, please visit https://www.newsfilecorp.com/release/281388
OVERLAND PARK, Kan., January 23, 2026–(BUSINESS WIRE)–Compass Minerals (NYSE: CMP), a leading global provider of essential minerals, will release its first-quarter fiscal 2026 results on Wednesday, Feb. 4, 2026, after the markets close. The company’s president and CEO, Edward C. Dowling Jr., and CFO, Peter Fjellman, will discuss these results on a conference call on Thursday, Feb. 5, 2026, at 9:30 a.m. ET.
Access to the conference call will be available via webcast at investors.compassminerals.com or by dialing 1-800-715-9871. Callers must provide the conference ID number 7896827. Outside of the U.S. and Canada, callers may dial 1-646-307-1963. An audio replay of the conference call will be available on the company’s website.
About Compass Minerals
Compass Minerals (NYSE: CMP) is a leading global provider of essential minerals focused on safely delivering where and when it matters to help solve nature’s challenges for customers and communities. The company’s salt products help keep roadways safe during winter weather and are used in numerous other consumer, industrial, chemical and agricultural applications. Its plant nutrition products help improve the quality and yield of crops while supporting sustainable agriculture. Compass Minerals operates 12 production and packaging facilities with more than 1,800 employees throughout the U.S., Canada and the U.K. Visit compassminerals.com for more information about the company and its products.
View source version on businesswire.com: https://www.businesswire.com/news/home/20260122825573/en/
Contacts
Investor Contact Brent CollinsVice President, Treasurer & Investor Relations+1.913.344.9111InvestorRelations@compassminerals.com
Media Contact Kevin GabrielSenior Director, Corporate Affairs+1.913.344.9265MediaRelations@compassminerals.com
This article first appeared on GuruFocus.
-
Adjusted EBITDA: Nearly $10 billion for 2025, similar to 2024 levels.
-
Consolidated Unit Net Cash Cost: $1.65 per pound for 2025, within 3% of guidance.
-
Copper Sales: Impacted by approximately 10% due to the Grasberg incident.
-
Fourth Quarter Operating Income (US Business): 3.5 times the level of the 2024 fourth quarter.
-
US Production Increase: Up 5% versus both the year-ago fourth quarter and for the year 2025 versus 2024.
-
South America Copper Sales: 1.1 billion pounds for 2025, with similar expectations for 2026.
-
South America Unit Net Cash Costs: $2.57 per pound for the fourth quarter.
-
2026 Copper Sales Guidance: Adjusted slightly for timing between 2025 and 2026.
-
2026 Unit Net Cash Costs: Expected to average $1.75 per pound.
-
Capital Expenditures for 2025: $3.9 billion, $0.5 billion below plan.
-
2026 and 2027 Capital Expenditures Forecast: Approximately $4.3 billion to $4.5 billion.
-
Discretionary Projects Capital Expenditure: $1.4 billion in 2025, expected to be $1.6 billion to $1.7 billion per year in 2026 and 2027.
-
Cash Returns to Shareholders: $5.7 billion distributed through dividends and share purchases.
Release Date: January 22, 2026
For the complete transcript of the earnings call, please refer to the full earnings call transcript.
Positive Points
-
Freeport-McMoRan Inc (NYSE:FCX) reported strong fourth-quarter results, with copper sales and net unit cash costs slightly better than adjusted guidance for 2025.
-
The company demonstrated resilience by overcoming challenges, such as the Grasberg incident, and achieved meaningful progress on several initiatives.
-
Freeport-McMoRan Inc (NYSE:FCX) is well-positioned for substantial cash flow generation, supporting investments in profitable growth and shareholder returns.
-
The company is adopting innovation, automation, and new technologies to enhance reliability, efficiencies, and overall operational performance.
-
Freeport-McMoRan Inc (NYSE:FCX) has a robust profile of organic growth options, with major projects in the Americas providing optionality for future growth.
Negative Points
-
The Grasberg incident impacted annual copper volumes by approximately 10% compared to the plan for 2025.
-
Unit cash costs in South America are expected to remain high, averaging $2.58 per pound in 2026 due to labor and energy costs.
-
The company faces challenges in scaling its leach initiative and achieving targeted cost reductions in the US operations.
-
Freeport-McMoRan Inc (NYSE:FCX) is dealing with cost inflation and labor challenges, particularly in the US, which could impact project execution.
-
The restart of certain production blocks at Grasberg is contingent on successful execution of infrastructure repairs and risk management initiatives.
Q & A Highlights
Q: Does the guidance for the outer years include the leaching reaching around 800 million pounds in 2028? A: Kathleen Quirk, President and CEO, stated that the outlook includes between 250 million and 300 million pounds in 2026, with no further expansion included beyond that. The potential to reach 2 billion pounds in the US includes the Bagdad expansion and leach program, but these are not included in the 2027/2028 guidance.
Q: Why are unit cash costs in South America moving higher, and how should we think about costs there over the next few years? A: Kathleen Quirk explained that the forecasted net cash cost in South America is around $2.58 per pound for 2026, similar to the fourth quarter of 2025. The increase is mainly due to labor and energy costs, as well as a weaker dollar.
Q: How does Freeport plan to reduce US costs to $2.50 per pound by 2027? A: Kathleen Quirk mentioned that the target assumes successful scaling of the leach opportunity and driving efficiencies within the US business. The focus is on adding volumes at a low incremental cost and improving operational efficiencies.
Q: Can you elaborate on the focus on America's copper champion and the impact of copper tariffs? A: Kathleen Quirk highlighted the leach initiatives as a low-cost opportunity to add significant volumes. The focus is on leveraging existing infrastructure and relationships to add production at low incremental costs, independent of potential copper tariffs.
Q: What are the latest updates on the Bagdad 2x project, including timing, CapEx, and factors for approval? A: Kathleen Quirk stated that the team is working on engineering and securing fixed pricing for the project, with a decision expected mid-year. The project requires a $4 average copper price to justify investment, and factors such as workforce setup and operational efficiency are also considered.
Q: Are there any updates or lessons learned from the Grasberg Block Cave (GBC) incident? A: Mark Johnson, COO of Freeport-McMoRan Indonesia, confirmed that the plan from November is on track, with mud removal nearly complete and infrastructure repairs progressing. The start-up of PB 2 and PB 3 is expected in the first half of the second quarter of 2026.
Q: Is there potential to bring forward PB 1S or open other areas if PB 1C cannot restart? A: Kathleen Quirk stated that the focus is on restoring production in 2026, with PB 1S expected to start mid-2027. Mark Johnson added that options like developing PB 1 North or increasing production from Deep MLZ are being considered if PB 1C cannot restart.
Q: What are Freeport's thoughts on recycling opportunities and substitution in light of rising copper prices? A: Kathleen Quirk mentioned the circular project in Spain for processing scrap and noted that while substitution and thrifting occur, copper's superior conductivity remains compelling, especially for data centers and other applications.
For the complete transcript of the earnings call, please refer to the full earnings call transcript.
PHOENIX, January 22, 2026–(BUSINESS WIRE)–Freeport (NYSE: FCX) today announced that it has posted its fourth-quarter and year ended 2025 financial and operating results press release on the Investor Relations page of its website at https://investors.fcx.com/investors/news-releases.
As previously indicated on its website, FCX will host a conference call today with securities analysts at 10:00 a.m. Eastern Time to discuss quarterly and year end results. The conference call will be webcast on the Internet along with slides. Interested parties may listen to the conference call live and view the slides on the Investor Relations page of FCX’s website at https://investors.fcx.com/investors/presentations. A replay of the webcast will be available through Friday, February 20, 2026.
FREEPORT: Foremost in Copper
FCX is a leading international metals company with the objective of being foremost in copper. Headquartered in Phoenix, Arizona, FCX operates large, long-lived, geographically diverse assets with significant proven and probable reserves of copper, gold and molybdenum. FCX is one of the world’s largest publicly traded copper producers.
FCX’s portfolio of assets includes the Grasberg minerals district in Indonesia, one of the world’s largest copper and gold deposits; and significant operations in the U.S. and South America, including the large-scale Morenci minerals district in Arizona and the Cerro Verde operation in Peru.
By supplying responsibly produced copper, FCX is proud to be a positive contributor to the world well beyond its operational boundaries. Additional information about FCX is available on FCX's website at fcx.com.
View source version on businesswire.com: https://www.businesswire.com/news/home/20260121517105/en/
Contacts
Financial Contact:David P. Joint(504) 582-4203
Media Contact:Linda S. Hayes(602) 366-7824
If you would like to receive our free newsletter via email, simply enter your email address below & click subscribe.
 Follow us on Twitter
 Become our facebook fan
CONNECT WITH US
Tweets
Tweet with hash tag #miningfeeds or @miningfeeds and your tweets will be displayed across this site.
MOST ACTIVE MINING STOCKS
Daily Gainers
 CMC Metals Ltd. CMC Metals Ltd. |
CMB.V | +900.00% |
 Eden Energy Ltd Eden Energy Ltd |
EDE.AX | +200.00% |
| GoviEx Uranium Inc. |
GXU.V | +42.86% |
| Eagle Nickel Ltd. |
ENL.AX | +41.67% |
| Citigold Corp. Limited |
CTO.AX | +33.33% |
| Mount Burgess Mining NL |
MTB.AX | +33.33% |
| Exalt Resources Limited |
ERD.AX | +31.94% |
| Casa Minerals Inc. |
CASA.V | +30.00% |
| Cariboo Rose Resources Ltd |
CRB.V | +28.57% |
| Belmont Resources Inc. |
BEA.V | +28.57% |


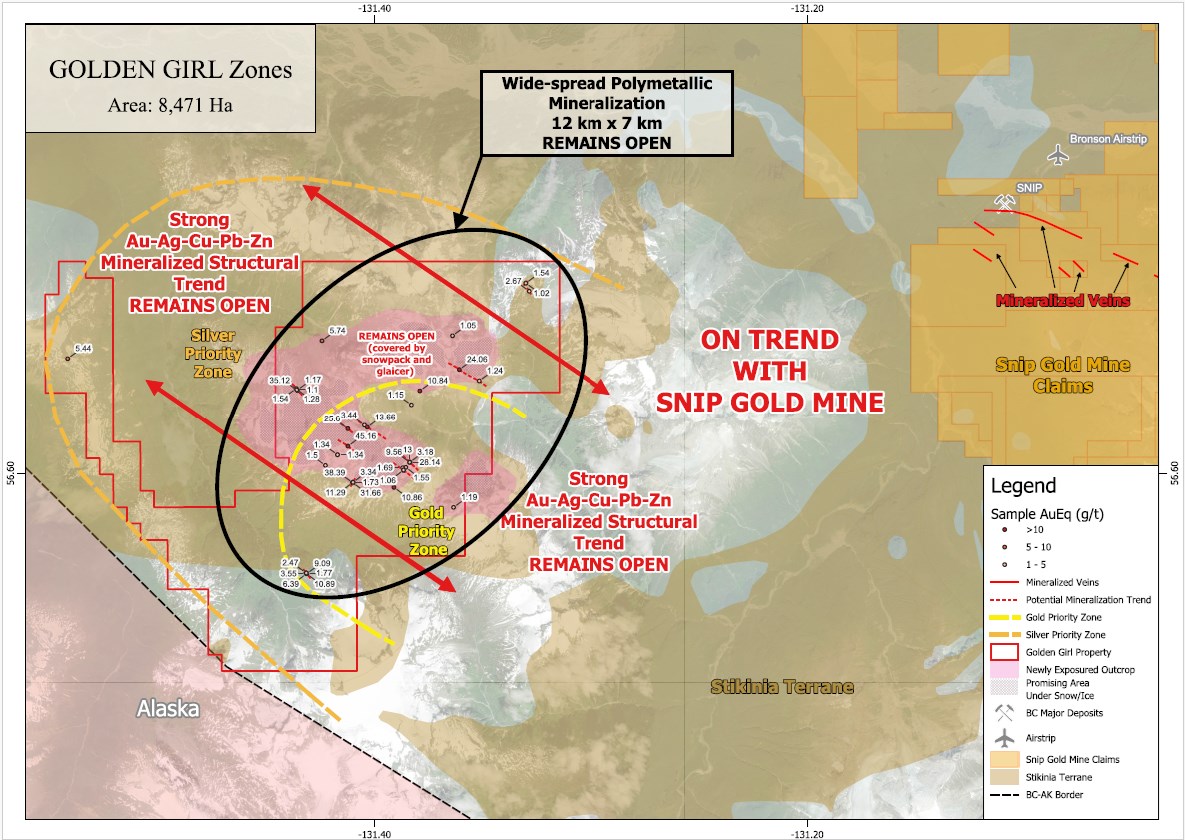
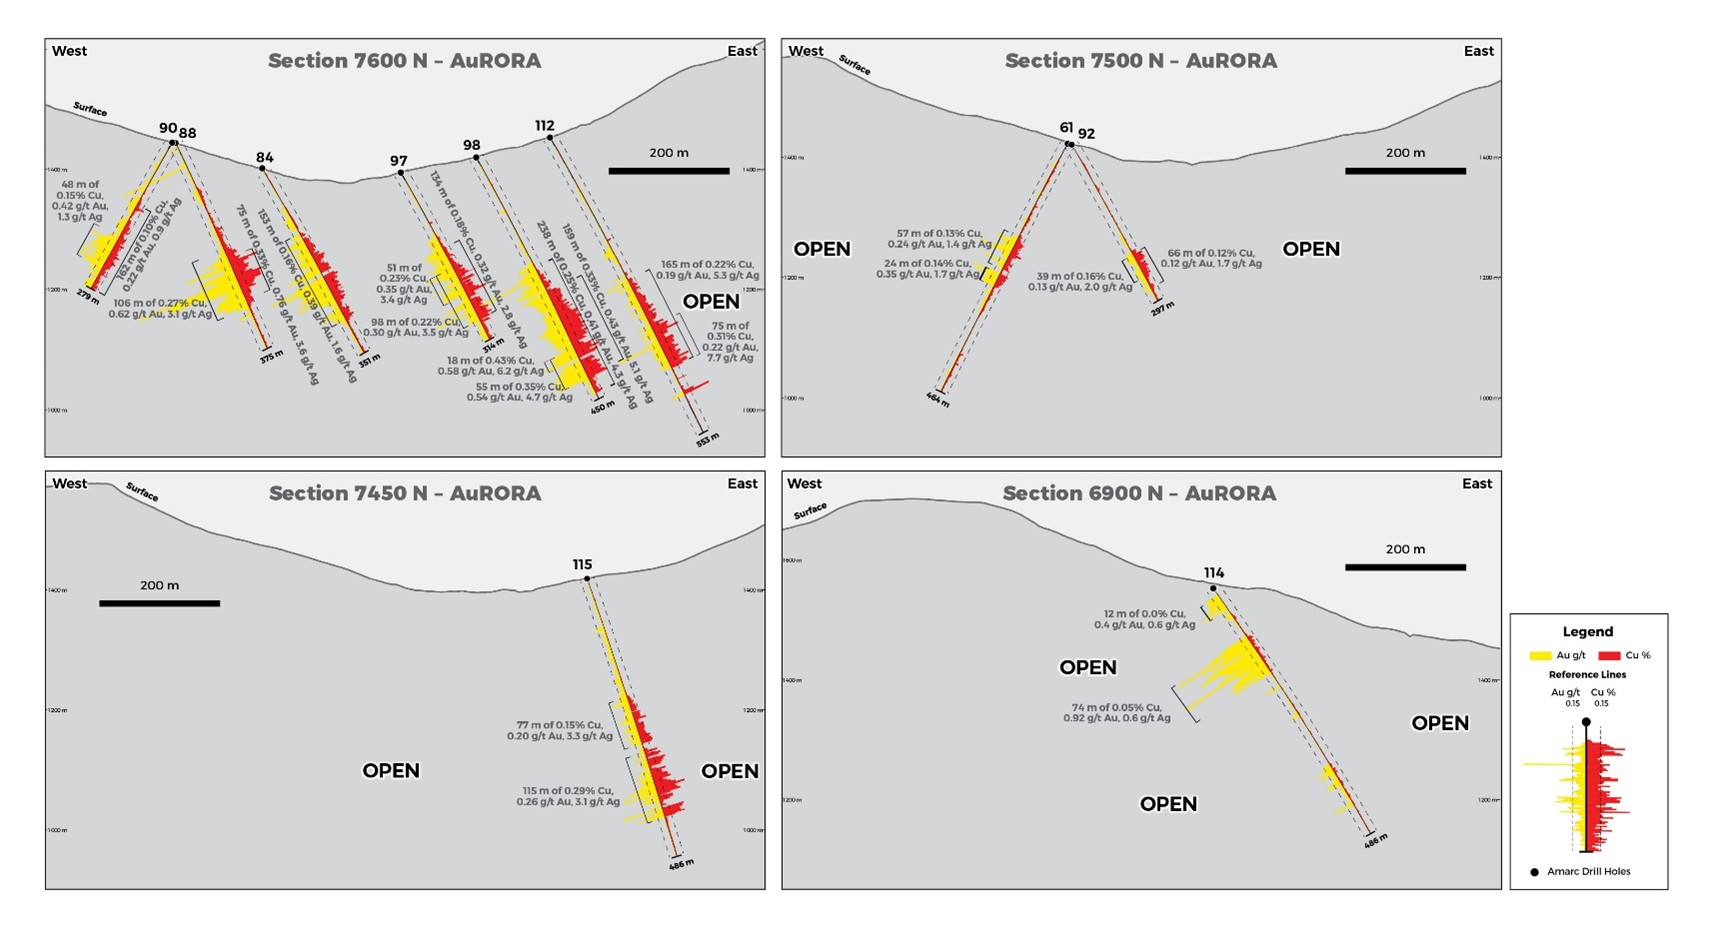
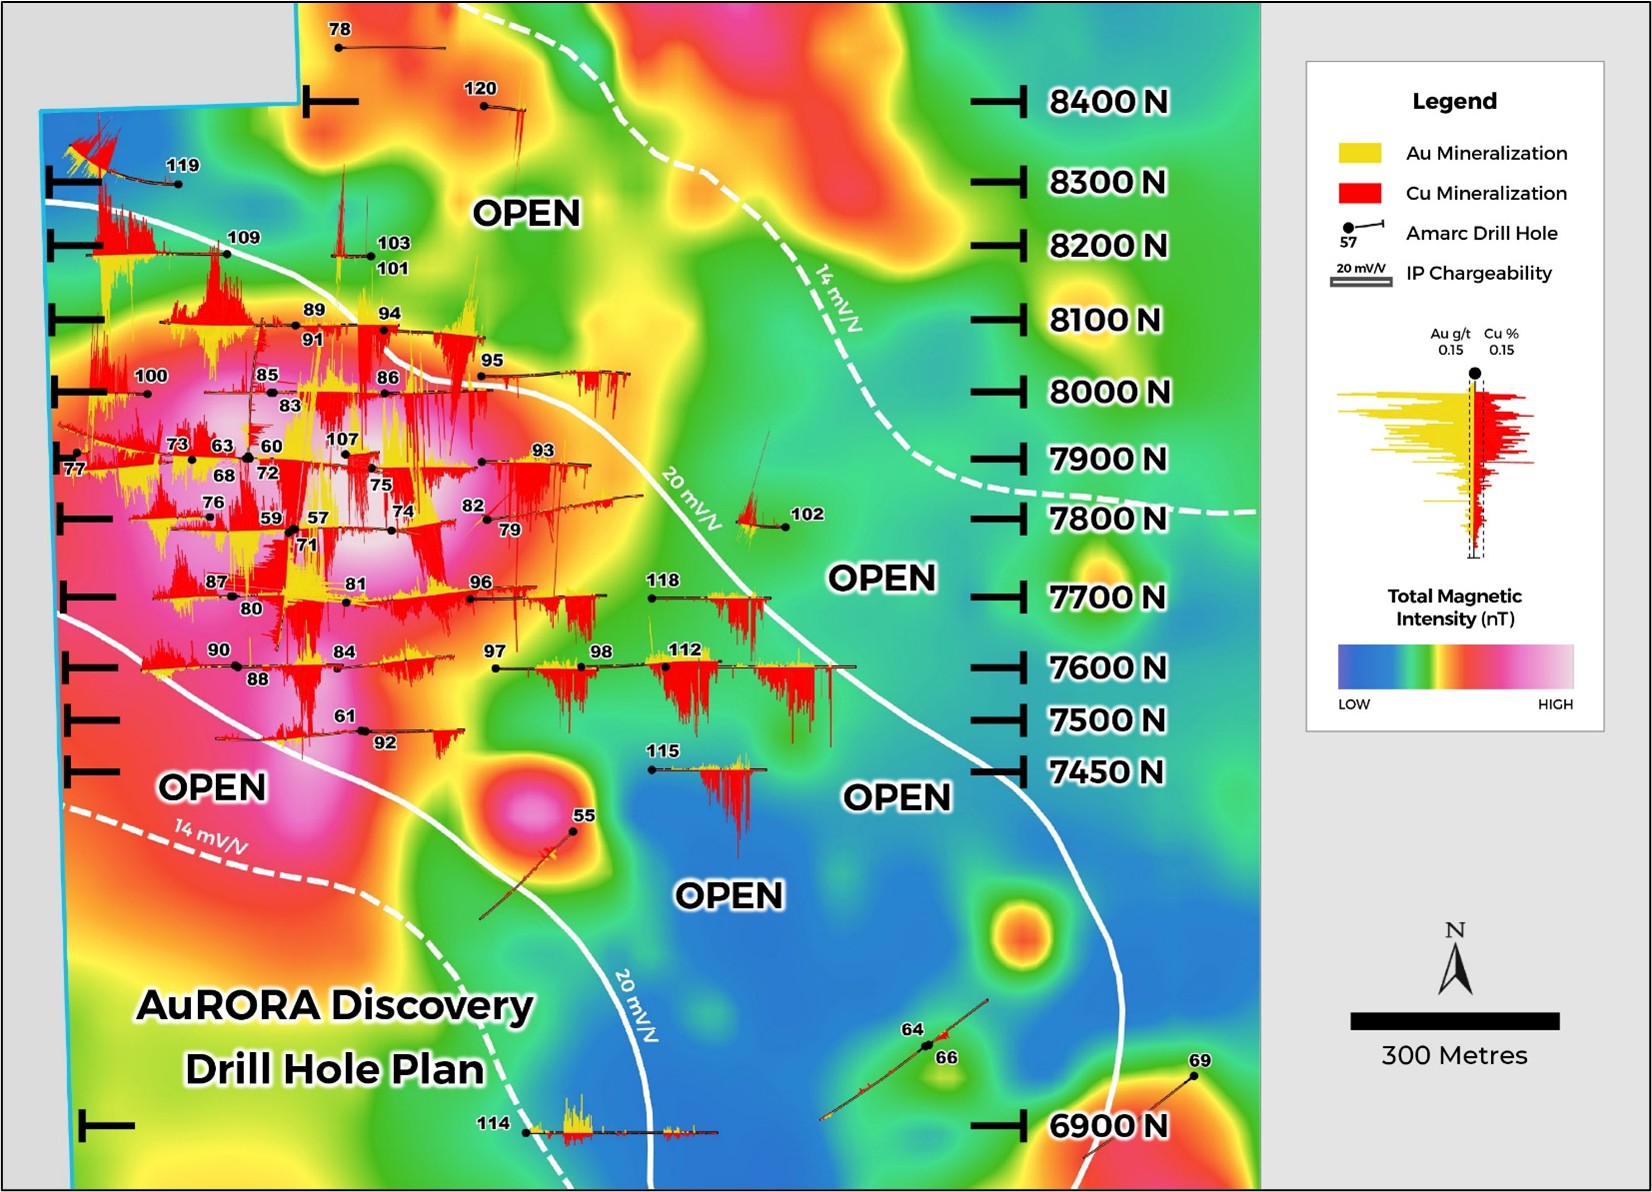
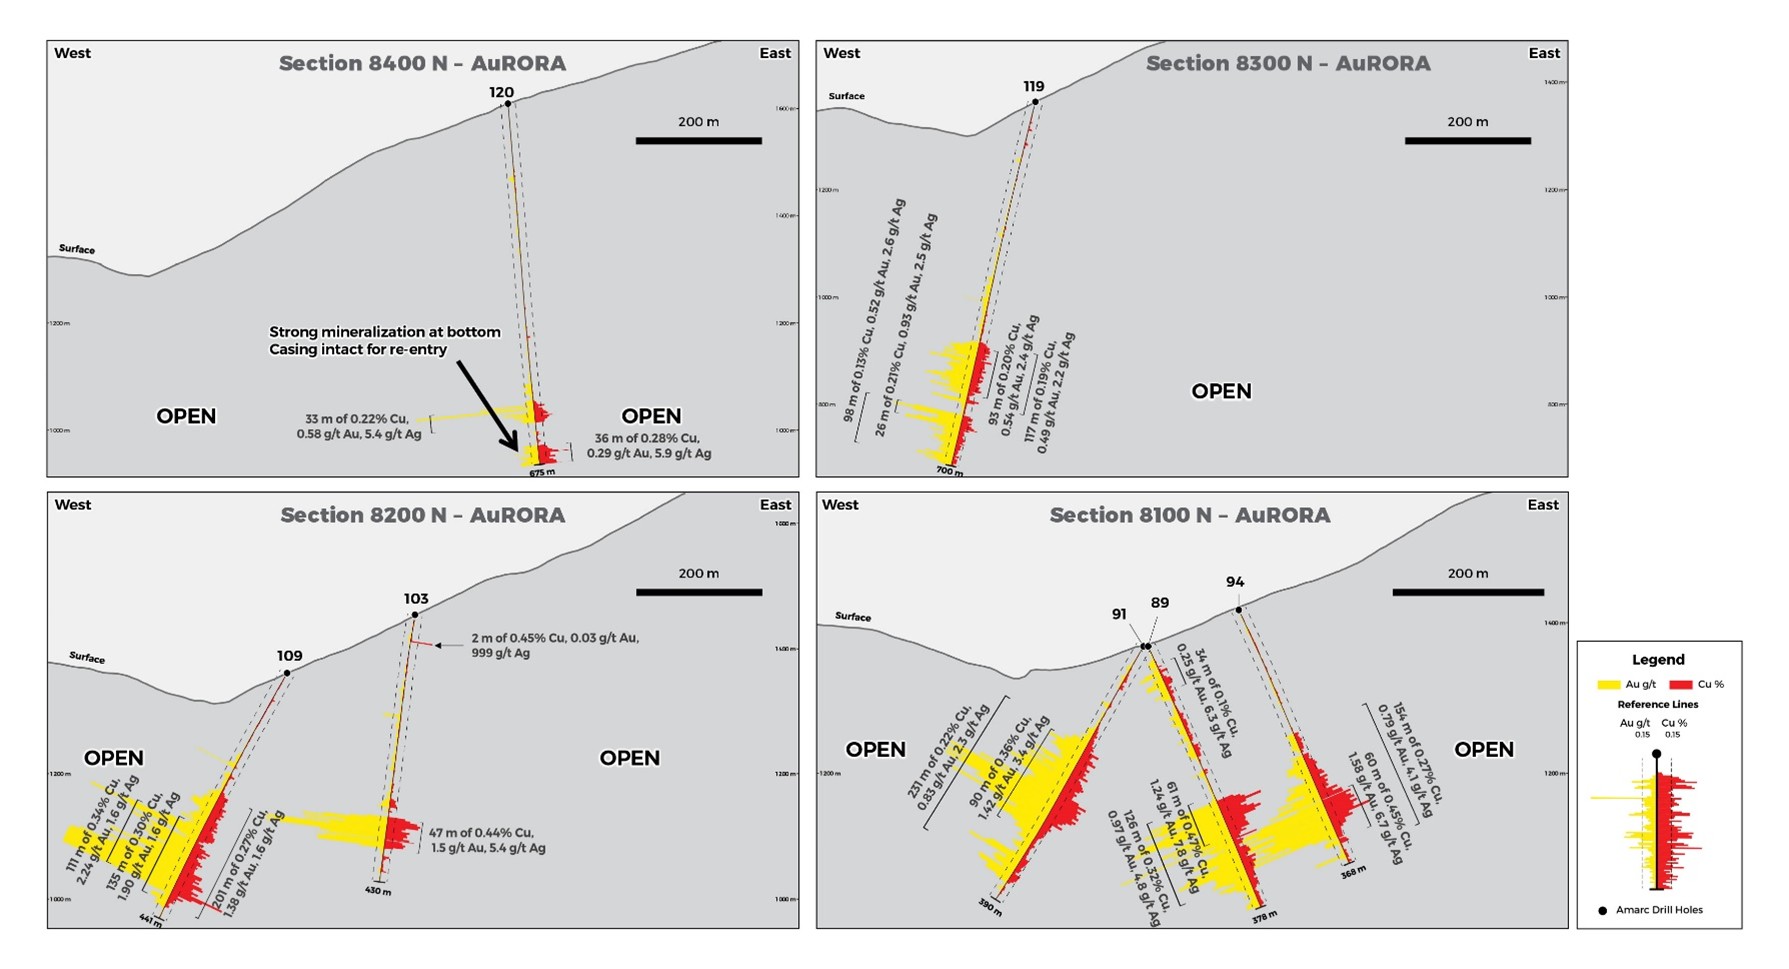
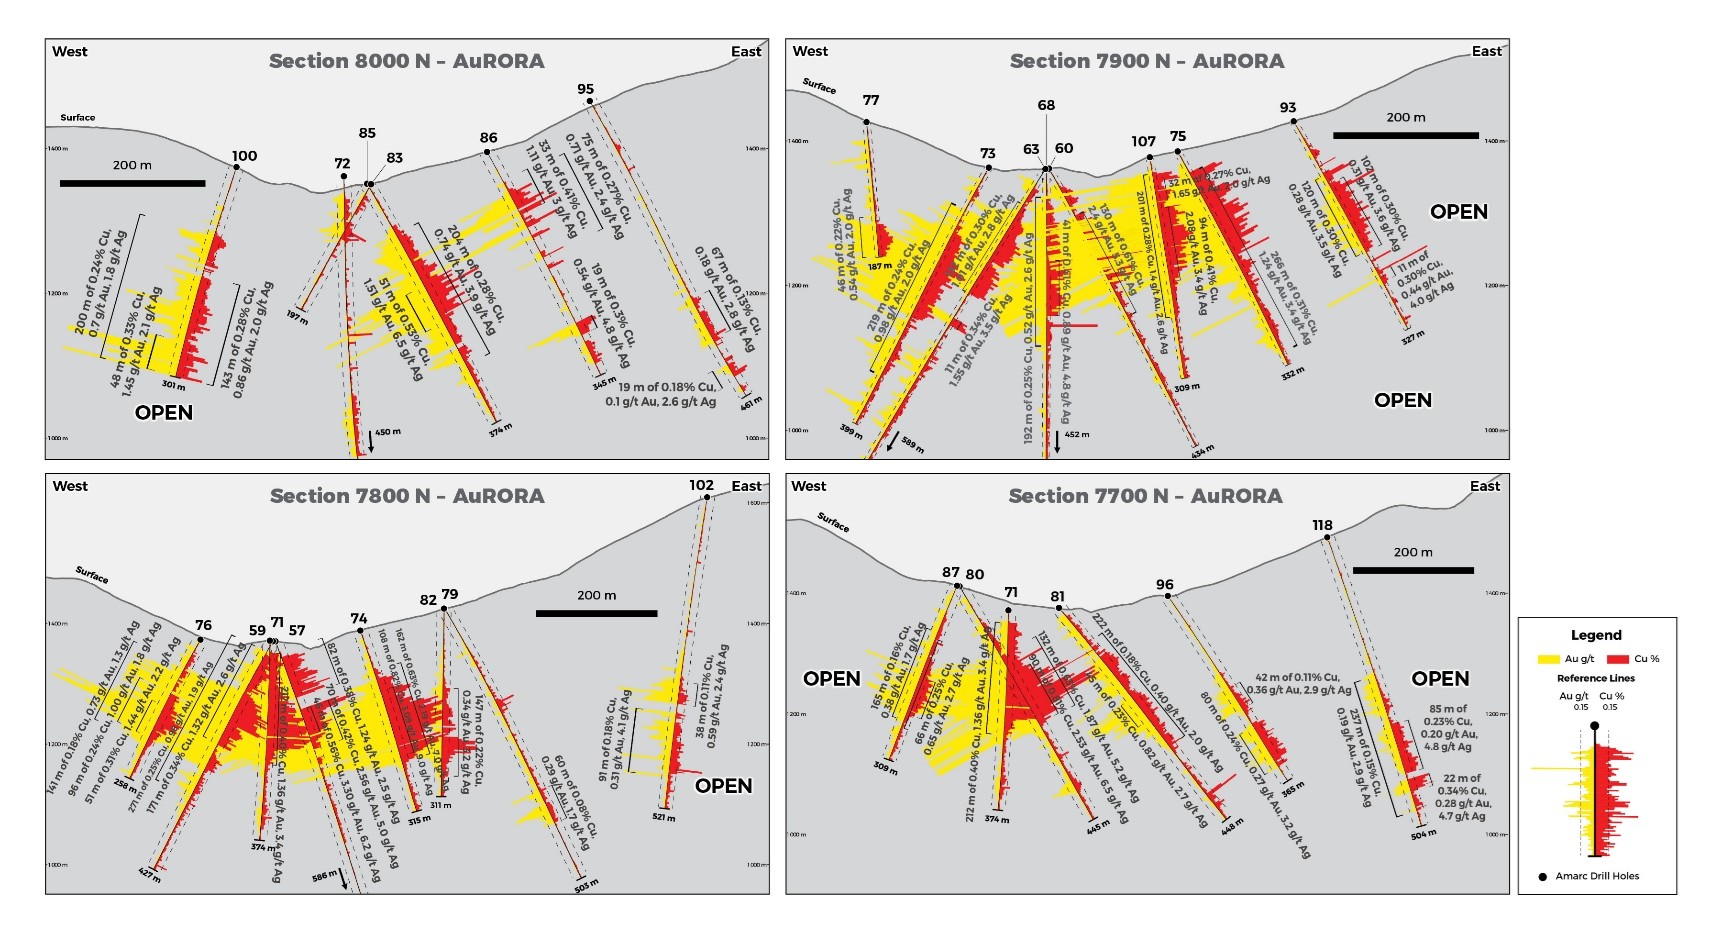