PHOENIX (AP) — PHOENIX (AP) — Freeport-McMoRan Inc. (FCX) on Thursday reported fourth-quarter profit of $406 million.
The Phoenix-based company said it had net income of 28 cents per share. Earnings, adjusted for non-recurring costs, were 47 cents per share.
The results exceeded Wall Street expectations. The average estimate of eight analysts surveyed by Zacks Investment Research was for earnings of 28 cents per share.
The mining company posted revenue of $5.63 billion in the period, also topping Street forecasts. Six analysts surveyed by Zacks expected $5.18 billion.
For the year, the company reported profit of $2.2 billion, or $1.52 per share. Revenue was reported as $25.92 billion.
_____
This story was generated by Automated Insights (http://automatedinsights.com/ap) using data from Zacks Investment Research. Access a Zacks stock report on FCX at https://www.zacks.com/ap/FCX
Freeport-McMoRan (FCX) came out with quarterly earnings of $0.47 per share, beating the Zacks Consensus Estimate of $0.28 per share. This compares to earnings of $0.31 per share a year ago. These figures are adjusted for non-recurring items.
This quarterly report represents an earnings surprise of +67.98%. A quarter ago, it was expected that this mining company would post earnings of $0.41 per share when it actually produced earnings of $0.5, delivering a surprise of +21.95%.
Over the last four quarters, the company has surpassed consensus EPS estimates three times.
Freeport-McMoRan, which belongs to the Zacks Mining – Non Ferrous industry, posted revenues of $5.63 billion for the quarter ended December 2025, surpassing the Zacks Consensus Estimate by 8.84%. This compares to year-ago revenues of $5.72 billion. The company has topped consensus revenue estimates four times over the last four quarters.
The sustainability of the stock's immediate price movement based on the recently-released numbers and future earnings expectations will mostly depend on management's commentary on the earnings call.
Freeport-McMoRan shares have added about 19.3% since the beginning of the year versus the S&P 500's gain of 0.4%.
What's Next for Freeport-McMoRan?
While Freeport-McMoRan has outperformed the market so far this year, the question that comes to investors' minds is: what's next for the stock?
There are no easy answers to this key question, but one reliable measure that can help investors address this is the company's earnings outlook. Not only does this include current consensus earnings expectations for the coming quarter(s), but also how these expectations have changed lately.
Empirical research shows a strong correlation between near-term stock movements and trends in earnings estimate revisions. Investors can track such revisions by themselves or rely on a tried-and-tested rating tool like the Zacks Rank, which has an impressive track record of harnessing the power of earnings estimate revisions.
Ahead of this earnings release, the estimate revisions trend for Freeport-McMoRan was mixed. While the magnitude and direction of estimate revisions could change following the company's just-released earnings report, the current status translates into a Zacks Rank #3 (Hold) for the stock. So, the shares are expected to perform in line with the market in the near future. You can see the complete list of today's Zacks #1 Rank (Strong Buy) stocks here.
It will be interesting to see how estimates for the coming quarters and the current fiscal year change in the days ahead. The current consensus EPS estimate is $0.48 on $5.88 billion in revenues for the coming quarter and $2.32 on $26.78 billion in revenues for the current fiscal year.
Investors should be mindful of the fact that the outlook for the industry can have a material impact on the performance of the stock as well. In terms of the Zacks Industry Rank, Mining – Non Ferrous is currently in the top 8% of the 250 plus Zacks industries. Our research shows that the top 50% of the Zacks-ranked industries outperform the bottom 50% by a factor of more than 2 to 1.
Centrus Energy Corp. (LEU), another stock in the same industry, has yet to report results for the quarter ended December 2025.
This company is expected to post quarterly earnings of $1.43 per share in its upcoming report, which represents a year-over-year change of -55.3%. The consensus EPS estimate for the quarter has been revised 0.3% lower over the last 30 days to the current level.
Centrus Energy Corp.'s revenues are expected to be $145.54 million, down 4% from the year-ago quarter.
Want the latest recommendations from Zacks Investment Research? Today, you can download 7 Best Stocks for the Next 30 Days. Click to get this free report
Freeport-McMoRan Inc. (FCX) : Free Stock Analysis Report
Centrus Energy Corp. (LEU) : Free Stock Analysis Report
This article originally published on Zacks Investment Research (zacks.com).
Freeport-McMoRan blew past fourth-quarter earnings estimates Thursday amid higher copper prices and better-than-expected sales volume. However, the mining giant trimmed its outlook for 2026 copper sales. FCX stock rose in early Thursday stock market action as the copper futures price eased to a three-week low.
"Freeport is strongly positioned for the future as a leading producer of copper with large scale, geographically diverse operations and an exciting portfolio of growth projects to provide additional supplies of copper to a growing market," CEO Kathleen Quirk said in an earnings statement.
Copper Price
The near-term copper futures contract slipped 0.5% to $5.74 a pound, after eclipsing $6 for the first time earlier this month. Copper prices have surged partly due to expectations that President Donald Trump will announce tariffs on raw copper imports in coming months. Supply has tightened after a series of copper mining industry setbacks, including a tragic disaster a Freeport's Grasberg mine in Indonesia.
Eli Lilly, Google Flash New Buying Opportunities
Freeport-McMoRan Earnings
Freeport posted Q4 adjusted earnings per share of 47 cents, up 52% from a year ago, defying forecasts for an 8% year-over-year decline, according to the FactSet consensus. Adjusted earnings excluded $763 million in pretax expenses, mostly tied to the Grasberg disaster and recovery. Revenue fell 1.5% to $5.633 billion, easily beating $5.294 billion estimates.
Freeport sold 3.6 billion pounds of copper on the year, topping the reduced outlook for 3.5 million pounds issued on Nov. 18, when the company detailed its plan for restarting its Grasberg mine.
For 2026, Freeport now expects 3.4 billion pounds in copper sales, down from the Nov. 18 outlook of 3.45 billion pounds. Copper sales are expected to rebound to 4.1 billion pounds in 2027, unchanged from the prior outlook.
Freeport introduced a 2028 outlook for 4.2 billion pounds in copper sales.
FCX Stock
FCX stock gave up a brief gain, reversing to a fractional loss early Thursday. Through Wednesday, FCX had surged 47.5% since Nov. 26, when it broke clear of its 50-day moving average, flashing an early entry opportunity.
In the same industry group, Southern Copper is part of the IBD Leaderboard portfolio of elite stocks.
Be sure to read IBD's The Big Picture column after each trading day to get the latest on the prevailing stock market trend and what it means for your trading decisions.
YOU MAY ALSO LIKE:
GE Aerospace In Buy Zone After Strong Earnings, Outlook
These Are The Best 5 Stocks To Buy Now Or Get Ready To
Why This IBD Tool Simplifies The Search For Top Stocks
How To Invest: Rules For When To Buy And Sell Stocks In Bull And Bear Markets
Thursday, January 22nd, 2026Ahead of today’s opening bell, Thursday morning Weekly Jobless Claims are out, and they continue to portray a labor market cruising along at a healthy low rate of unemployment claims. Initial Jobless Claims came in at an even +200K, 8K below expectations and a tick up from the slightly upwardly revised +199K the previous week. Our trailing four-week average on new jobless claims is now +202K, -15K lower per week than the previous four weeks.Continuing Claims, reported a week in arrears from new claims, reached 1.85 million in today’s print, down from the 1.884 million reported a week ago. Since the string of 1.9+ million longer-term jobless claims per week, which lasted from Memorial Day to Thanksgiving last year, today’s tally is the second-lowest we’ve seen. More good news for strength in the labor market.
Q3 GDP Revised Up to +4.4%
Also out this morning is the revision to Q3 Gross Domestic Product (GDP), which climbed 10 basis points (bps) to +4.4% — the highest single quarter since +4.7% back in Q3 of 2023. Exports, investments and inventories all came up on the revision, slightly augmented by lower consumer spending in the quarter.
Earnings Reports Ahead of the Bell: GE, PG & More
GE Aerospace GE posted a healthy +9.3% earnings beat in its Q4 report out ahead of today’s open. Earnings of $1.57 per share easily surpassed the $1.44 in the Zacks consensus. Revenues also outperformed estimates, $11.87 billion, for a +5.38% positive surprise. Yet slowing revenue growth is bringing some bearish sentiment to the stock as a result, and shares are down -3% — basically erasing the company’s year-to-date gains so far. For more on GE’s earnings, click here.Procter & Gamble PG shares are up +1.6% at this hour of the pre-market on mixed results in the company’s fiscal Q2. Earnings beat the Zacks consensus by a penny to $1.88, while revenues were short of estimates by -0.36% to $22.21 billion. Sales are up slightly, from $21.88 billion a year ago, even as signs of weaker spending in the U.S. were cited. For more on PG’s earnings, click here.Abbott Labs ABT, meanwhile, is down -7.2% so far this morning, as the drug-maker reached the earnings estimate of $1.50 per share exactly, though came up -2.76% shy of revenue projections to $11.46 billion in the quarter. Shares are now trading in the negative going back to this time last year. For more on ABT’s earnings, click here.Metals miner Freeport-McMoRan FCX posted perhaps the most impressive Q4 results ahead of the opening bell this morning, reporting earnings of 47 cents per share versus 28 cents estimated, on $5.63 billion in revenues, which outpaced the $5.18 billion analysts were expecting. Shares are up slightly, but this is off majorly impressive performances year to date (+19%) and over the past year (+55%).After today’s close, we’ll see new earnings releases from major companies as disparate as Intel INTC to Intuitive Surgical ISRG to Capital One COF. Heading into earnings results, all three of these companies are currently carrying Zacks Rank #3 (Hold) ratings.Questions or comments about this article and/or author? Click here>>
Want the latest recommendations from Zacks Investment Research? Today, you can download 7 Best Stocks for the Next 30 Days. Click to get this free report
GE Aerospace (GE) : Free Stock Analysis Report
Intel Corporation (INTC) : Free Stock Analysis Report
Abbott Laboratories (ABT) : Free Stock Analysis Report
Freeport-McMoRan Inc. (FCX) : Free Stock Analysis Report
Procter & Gamble Company (The) (PG) : Free Stock Analysis Report
Capital One Financial Corporation (COF) : Free Stock Analysis Report
Intuitive Surgical, Inc. (ISRG) : Free Stock Analysis Report
This article originally published on Zacks Investment Research (zacks.com).
Freeport-McMoRan (FCX) reported $5.63 billion in revenue for the quarter ended December 2025, representing a year-over-year decline of 1.5%. EPS of $0.47 for the same period compares to $0.31 a year ago.
The reported revenue compares to the Zacks Consensus Estimate of $5.18 billion, representing a surprise of +8.84%. The company delivered an EPS surprise of +67.98%, with the consensus EPS estimate being $0.28.
While investors closely watch year-over-year changes in headline numbers — revenue and earnings — and how they compare to Wall Street expectations to determine their next course of action, some key metrics always provide a better insight into a company's underlying performance.
Since these metrics play a crucial role in driving the top- and bottom-line numbers, comparing them with the year-ago numbers and what analysts estimated about them helps investors better project a stock's price performance.
Here is how Freeport-McMoRan performed in the just reported quarter in terms of the metrics most widely monitored and projected by Wall Street analysts:
- Sales in thousands of ounces – Gold – Consolidated basis: 80.00 Koz compared to the 55.09 Koz average estimate based on four analysts.
- Total Net Cash Cost Per Pound of Copper: $2.22 versus $2.45 estimated by four analysts on average.
- Sales in thousands of Ounces – Gold – Indonesia: 75.00 Koz compared to the 49.47 Koz average estimate based on three analysts.
- Sales in thousands of Ounces – Gold – North America: 5.00 Koz versus 5.65 Koz estimated by three analysts on average.
- Sales in millions of pounds – Copper – Indonesia – Grasberg: 112.00 Mlbs versus 20.43 Mlbs estimated by three analysts on average.
- Revenues- Indonesia: $960 million versus the three-analyst average estimate of $303.61 million. The reported number represents a year-over-year change of -57.3%.
- Revenues- Molybdenum: $220 million compared to the $297.1 million average estimate based on three analysts. The reported number represents a change of +24.3% year over year.
- Revenues- South America copper mines: $1.62 billion versus the three-analyst average estimate of $1.47 billion. The reported number represents a year-over-year change of +34.2%.
- Revenues- North America copper mines: $2.1 billion compared to the $1.9 billion average estimate based on three analysts. The reported number represents a change of +30.4% year over year.
- Revenues- Rod & Refining: $1.77 billion compared to the $1.66 billion average estimate based on two analysts. The reported number represents a change of +20.9% year over year.
- Revenues- Atlantic Copper Smelting & Refining: $820 million compared to the $725.1 million average estimate based on two analysts. The reported number represents a change of +20.8% year over year.
- Revenues- Corporate, other & eliminations: $-1.86 billion compared to the $-1.39 billion average estimate based on two analysts. The reported number represents a change of +12% year over year.
View all Key Company Metrics for Freeport-McMoRan here>>>
Shares of Freeport-McMoRan have returned +16.7% over the past month versus the Zacks S&P 500 composite's +0.7% change. The stock currently has a Zacks Rank #3 (Hold), indicating that it could perform in line with the broader market in the near term.
Want the latest recommendations from Zacks Investment Research? Today, you can download 7 Best Stocks for the Next 30 Days. Click to get this free report
Freeport-McMoRan Inc. (FCX) : Free Stock Analysis Report
This article originally published on Zacks Investment Research (zacks.com).
Ahead of today’s opening bell, Thursday morning Weekly Jobless Claims are out, and they continue to portray a labor market cruising along at a healthy low rate of unemployment claims. Initial Jobless Claims came in at an even +200K, 8K below expectations and a tick up from the slightly upwardly revised +199K the previous week. Our trailing four-week average on new jobless claims is now +202K, -15K lower per week than the previous four weeks.
Continuing Claims, reported a week in arrears from new claims, reached 1.85 million in today’s print, down from the 1.884 million reported a week ago. Since the string of 1.9+ million longer-term jobless claims per week, which lasted from Memorial Day to Thanksgiving last year, today’s tally is the second-lowest we’ve seen. More good news for strength in the labor market.
Q3 GDP Revised Up to +4.4%
Also out this morning is the revision to Q3 Gross Domestic Product (GDP), which climbed 10 basis points (bps) to +4.4% — the highest single quarter since +4.7% back in Q3 of 2023. Exports, investments and inventories all came up on the revision, slightly augmented by lower consumer spending in the quarter.
Earnings Reports Ahead of the Bell: GE, PG & More
GE Aerospace GE posted a healthy +9.3% earnings beat in its Q4 report out ahead of today’s open. Earnings of $1.57 per share easily surpassed the $1.44 in the Zacks consensus. Revenues also outperformed estimates, $11.87 billion, for a +5.38% positive surprise. Yet slowing revenue growth is bringing some bearish sentiment to the stock as a result, and shares are down -3% — basically erasing the company’s year-to-date gains so far.
Procter & Gamble PG shares are up +1.6% at this hour of the pre-market on mixed results in the company’s fiscal Q2. Earnings beat the Zacks consensus by a penny to $1.88, while revenues were short of estimates by -0.36% to $22.21 billion. Sales are up slightly, from $21.88 billion a year ago, even as signs of weaker spending in the U.S. were cited.
Abbott Labs ABT, meanwhile, is down -7.2% so far this morning, as the drug-maker reached the earnings estimate of $1.50 per share exactly, though came up -2.76% shy of revenue projections to $11.46 billion in the quarter. Shares are now trading in the negative going back to this time last year.
Metals miner Freeport-McMoRan FCX posted perhaps the most impressive Q4 results ahead of the opening bell this morning, reporting earnings of 47 cents per share versus 28 cents estimated, on $5.63 billion in revenues, which outpaced the $5.18 billion analysts were expecting. Shares are up slightly, but this is off majorly impressive performances year to date (+19%) and over the past year (+55%).
After today’s close, we’ll see new earnings releases from major companies as disparate as Intel INTC to Intuitive Surgical ISRG to Capital One COF. Heading into earnings results, all three of these companies are currently carrying Zacks Rank #3 (Hold) ratings.
Want the latest recommendations from Zacks Investment Research? Today, you can download 7 Best Stocks for the Next 30 Days. Click to get this free report
GE Aerospace (GE) : Free Stock Analysis Report
Intel Corporation (INTC) : Free Stock Analysis Report
Abbott Laboratories (ABT) : Free Stock Analysis Report
Freeport-McMoRan Inc. (FCX) : Free Stock Analysis Report
Procter & Gamble Company (The) (PG) : Free Stock Analysis Report
Capital One Financial Corporation (COF) : Free Stock Analysis Report
Intuitive Surgical, Inc. (ISRG) : Free Stock Analysis Report
This article originally published on Zacks Investment Research (zacks.com).
Freeport-McMoRan Inc. FCX recorded net income of $406 million or 28 cents per share for the fourth quarter of 2025, up around 48.2% from $274 million or 19 cents in the year-ago quarter.
Barring one-time items, adjusted earnings per share were 47 cents, topping the Zacks Consensus Estimate of 28 cents.
Revenues fell roughly 1.5% year over year to $5,633 million. The figure surpassed the Zacks Consensus Estimate of $5,175.4 million. Although volumes declined, the company witnessed a sharp increase in copper and gold prices in the reported quarter.
Freeport-McMoRan Inc. Price, Consensus and EPS Surprise
Freeport-McMoRan Inc. price-consensus-eps-surprise-chart | Freeport-McMoRan Inc. Quote
FCX's Operational Highlights
Copper production fell around 38.5% year over year to 640 million pounds in the reported quarter.
Consolidated sales also fell approximately 28.5% year over year, reaching 709 million pounds of copper. The downside primarily resulted from reduced production in Indonesia. The company sold 80,000 ounces of gold in the quarter, down around 77.1% year over year. FCX also sold 22 million pounds of molybdenum, up 22.2% year over year.
Consolidated average unit net cash costs per pound of copper were $2.22, up from $1.66 a year ago. The figure was lower than our estimate of $2.47.
The average realized copper price was $5.33 per pound, up around 28.4% year over year. The figure outpaced our estimate of $4.75 per pound. The average realized price per ounce for gold rose around 55.2% year over year to $4,078. The figure topped our estimate of $4,000.
Freeport's Financial Position
Cash and cash equivalents at the end of the quarter were $3,824 million, down around 2.5% year over year. The company’s total debt was $9,379 million, up 4.8% year over year.
Cash flows provided by operations were around $693 million in the reported quarter, down 51% year over year.
FCX's Guidance
For full-year 2026, consolidated sales volumes are projected to be around 3.4 billion pounds of copper, 0.8 million ounces of gold, and 90 million pounds of molybdenum. This includes an estimated 640 million pounds of copper, 60,000 ounces of gold, and 22 million pounds of molybdenum expected to be sold in the first quarter.
FCX also noted that it remains on track to start a phased restart of the Grasberg Block Cave underground mine beginning in second-quarter 2026.
Freeport's Price Performance
Shares of FCX have risen 57.4% over the past year compared with the industry’s 70.8% growth.
Image Source: Zacks Investment Research
FCX’s Zacks Rank & Key Picks
FCX currently carries a Zacks Rank #3 (Hold).
Some better-ranked stocks in the basic materials space are Royal Gold, Inc. RGLD, Coeur Mining, Inc. CDE and Southern Copper Corporation SCCO.
Royal Gold is scheduled to report fourth-quarter results on Feb. 18. The Zacks Consensus Estimate for RGLD’s fourth-quarter earnings is pegged at $2.66 per share. RGLD’s earnings beat the Zacks Consensus Estimate in three of the last four quarters and missed the same in one, with the average surprise being 4%. Royal Gold currently flaunts a Zacks Rank #1 (Strong Buy). You can see the complete list of today’s Zacks #1 Rank stocks here.
Coeur Mining is slated to report fourth-quarter results on Feb. 18. The Zacks Consensus Estimate for fourth-quarter earnings is pegged at 33 cents per share. CDE’s earnings beat the Zacks Consensus Estimate in two of the last four quarters and missed in the other two, with the average surprise being 107%. Coeur Mining flaunts a Zacks Rank #1 at present.
Southern Copper is expected to report fourth-quarter results on Feb. 11. The Zacks Consensus Estimate for fourth-quarter earnings is pegged at $1.44 per share. SCCO carries a Zacks Rank #2 (Buy) at present. Southern Copper’s earnings beat the consensus estimate in three of the last four quarters and missed once, with the average surprise being 6.32%.
Want the latest recommendations from Zacks Investment Research? Today, you can download 7 Best Stocks for the Next 30 Days. Click to get this free report
Freeport-McMoRan Inc. (FCX) : Free Stock Analysis Report
Southern Copper Corporation (SCCO) : Free Stock Analysis Report
Coeur Mining, Inc. (CDE) : Free Stock Analysis Report
Royal Gold, Inc. (RGLD) : Free Stock Analysis Report
This article originally published on Zacks Investment Research (zacks.com).
Freeport-McMoRan posts revenue of $5.63 billion for the fourth quarter, well ahead of Wall Street’s call for $5.29 billion.
Rio Tinto Group RIO and Southern Copper Corporation SCCO are both familiar names operating in the Zacks Mining – Miscellaneous industry. As rivals, the companies are focused on the extraction of minerals including copper, zinc etc and pursuing growth through exploration activities, mine expansions and strategic partnerships.Both companies operate through capital-intensive mining businesses that require long-term project development, regulatory approvals and hefty investment in infrastructure and technology. Let’s take a closer look at their fundamentals, growth prospects and challenges.
The Case for RIO
Rio Tinto is benefiting from rising copper production, driven by strong operational performance across its assets. Per the production results, the company’s consolidated copper output increased 5% year over year in the fourth quarter of 2025.RIO’s growth pipeline is progressing at a steady pace. In December 2025, the company achieved its first copper production at the Johnson Camp mine in Arizona using its proprietary Nuton technology. This marks a significant milestone, as Nuton enables cleaner, faster and more efficient copper recovery at an industrial scale.The Johnson Camp deployment includes the design and delivery of a heap leach technology package, targeting approximately 30,000 tons of refined copper over a four-year demonstration period. Through Nuton, RIO aims to deliver the lowest-carbon copper production footprint in the United States at this site.Also, the company is actively collaborating with U.S. customers to strengthen the domestic copper supply. Its total copper production in 2025 reached 883 kilotonne (kt), up 11% on a year-over-year basis.In the fourth quarter, RIO’s iron ore operations in the Pilbara facility showed improvement, with shipments rising 7% from the previous year. The aluminum production also delivered encouraging results. RIO’s aluminum output rose 2% in the quarter, on a year-over-year basis, as refinery and smelter operations improved.Several major growth projects of the company are progressing as well. In December 2025, RIO’s Rhodes Ridge joint venture approved a $191 million feasibility study to develop one of the world’s major undeveloped iron ore deposits in Western Australia, aiming for an initial annual production of 40-50 million tons. The study is expected to conclude in 2029. Also, in October 2025, at the Simandou iron ore project in Guinea, the first ore was loaded and transported, marking the start of commissioning across the mine, rail and port infrastructure.Despite the overall solid performance, the company faced some challenges during the quarter. Weather-related disruptions earlier in 2025 affected iron ore volumes. Planned maintenance activities at some copper mining projects temporarily reduced output, while cost pressures from inflation and higher sustaining capital spending impacted margins.
The Case for SCCO
Southern Copper is gaining from its strategy of moving forward with its development and exploration projects. The long-awaited Tia Maria project, located in Arequipa, Peru, with an annual capacity of 120,000 tons of SX- EW copper cathodes, is expected to start in 2027. This project will use state-of-the-art SX-EW technology with the highest international environmental standards.In Mexico, El Pilar, which is expected to start in 2028, will contribute around 36,000 tons of copper cathodes annually. This operation will use highly cost-efficient and environmentally friendly SX-EW technology. By 2030, El Arco in Mexico is expected to become operational. It is a world-class copper deposit located in the central part of the Baja California peninsula with ore reserves of more than 1,230 million tons with an average ore grade of 0.40% and 141 million tons of leach material with an average ore grade of 0.27%. The project includes an open-pit mine with a combined 120 ktpd concentrator and 28 ktpy SX-EW operations.Peru’s Los Chancas project is slated to add 130,000 tons of copper starting in 2031. This will be followed by Michiquillay in 2032 with an expected 225,000 tons of copper. Michiquillay is expected to become one of Peru's largest copper mines with an expected mine life of more than 25 years. Backed by the above-mentioned projects and investments, SCCO expects production to steadily build toward 1,084,000 tons by the end of this decade. Growth is projected to accelerate from 2031 onward, with copper output envisioned to reach 1,536,000 tons by 2034.However, Southern Copper’s total operating costs rose 5.8% year over year in the first nine months of 2025 due to an increase in other costs of sales, including workers’ participation, repairing materials (mainly heavy equipment spare parts), inventory variance and exchange rate variance.Also, high labor costs, along with ongoing inflation for repair materials, operating materials, inventory consumption, operation contractors and services, will likely continue to weigh on SCCO’s margins.
How Does the Zacks Consensus Estimate Compare for RIO & SCCO?
The Zacks Consensus Estimate for RIO’s 2026 sales implies a year-over-year increase of 6.2%, while the same for earnings per share (EPS) indicates growth of 5.7%. The company’s EPS estimates have increased 10.1% over the past 60 days for 2026.
Image Source: Zacks Investment Research
The Zacks Consensus Estimate for SCCO’s 2026 sales and EPS implies year-over-year growth of 10.2% and 17.8%, respectively. The company’s EPS estimates for 2026 have increased 8.1% over the past 60 days.
Image Source: Zacks Investment Research
Price Performance and Valuation of RIO & SCCO
In the past three months, RIO’s shares have risen 25.8%, while SCCO stock has surged 43.4%.
Image Source: Zacks Investment Research
Rio Tinto is trading at a forward 12-month price-to-earnings ratio of 12.55X while Southern Copper’s forward earnings multiple sits at 29.64X.
Image Source: Zacks Investment Research
Final Take
Rio Tinto and Southern Copper are both well-positioned to benefit from long-term growth in the copper market, supported by strong asset bases and expanding production pipelines. RIO’s near-to-midterm outlook is strengthened by rising copper output, progress at the Nuton-led Johnson Camp project and diversified exposure across iron ore and aluminum, while Southern Copper’s long-term growth is driven by a robust portfolio of large-scale projects scheduled to come online over the next decade.However, Rio Tinto’s strong earnings estimates and an attractive valuation make it a better pick for investors than SCCO currently. While RIO sports a Zacks Rank #1 (Strong Buy), Southern Copper currently has a Zacks Rank #2 (Buy). You can see the complete list of today’s Zacks #1 Rank stocks here.
Want the latest recommendations from Zacks Investment Research? Today, you can download 7 Best Stocks for the Next 30 Days. Click to get this free report
Rio Tinto PLC (RIO) : Free Stock Analysis Report
Southern Copper Corporation (SCCO) : Free Stock Analysis Report
This article originally published on Zacks Investment Research (zacks.com).
For Immediate Release
Chicago, IL – January 22, 2026 – Zacks.com announces the list of stocks featured in the Analyst Blog. Every day the Zacks Equity Research analysts discuss the latest news and events impacting stocks and the financial markets. Stocks recently featured in the blog include: Ero Copper Corp. ERO, BHP Group Ltd. BHP, Rio Tinto PLC RIO and Southern Copper Corp. SCCO.
Here are highlights from Wednesday’s Analyst Blog:
After Gold & Silver, Is Copper Set for a Big Run? 4 Stocks to Buy
Gold had a blockbuster year in 2025, rising more than 60%. Silver did even better, surging over 150%. That momentum has carried into 2026, with both metals hitting fresh highs as geopolitical tensions push investors toward safe-haven assets. But with gold and silver at record levels, many investors are wondering if they missed the boat.
While precious metals still have more room to run, another metal is looking like the next big opportunity. Copper, often called the backbone of the global economy, is quietly stepping into the spotlight. The red metal rose around 40% last year, with prices set to strengthen as new demand drivers kick in.
After gold and silver’s historic runs, it’s copper’s turn to shine red hot. Investing in copper stocks like Ero Copper Corp., BHP Group Ltd., Rio Tinto PLC and Southern Copper Corp. could be a smart way to play the trend.
The Red Metal’s Moment
One early spark for copper’s rally came last year, when U.S. companies rushed to stockpile supplies after President Donald Trump threatened tariffs on copper imports. Even though those tariffs were later put on hold, the buying frenzy drained inventories and tightened supplies across global markets. At the same time, disruptions at major mines in countries like Chile, Peru and Indonesia limited output growth, keeping the market under pressure.
Demand trends are just as powerful. Copper is essential to electric vehicles, power grids, renewable energy systems and industrial machinery. It is also becoming a critical input for the fast-growing AI economy. Massive data centers used for artificial intelligence and cloud computing require enormous amounts of copper for wiring, power transmission and cooling systems. Some hyperscale facilities consume tens of thousands of tons on their own.
China, the world’s largest copper consumer and manufacturer, is also moving aggressively to secure long-term supplies. This adds another layer of demand to an already tight market.
Demand is growing faster than supply, and experts say this is a lasting shortage rather than a temporary supply squeeze.
With a weakening U.S. dollar, rising investor interest, strong demand and supply crunch, copper is increasingly being viewed as both a growth play and a hedge.
Copper Stocks to Own in 2026
Ero Copper is a Brazil-focused mining company producing copper and gold. It runs two copper mines—Caraíba in Bahia and Tucumã in Pará—and a gold mine, Xavantina, in Mato Grosso. In the third quarter of 2025, copper production hit a record 16,664 tonnes of concentrate at a low cash cost of $2 per pound, driven by stronger output at Tucumã and steady production at Caraíba.
The company expects fourth-quarter 2025 production to have received a boost from higher plant throughput and richer mining blocks at Tucumã. Beyond its operating mines, Ero Copper is advancing the Furnas Copper-Gold Project in Carajás Province, aiming for a 60% stake through an agreement with Vale. Low costs, rising output and expansion projects make ERO well-positioned to benefit from the copper rally.
The Zacks Consensus Estimate for ERO’s 2026 sales and EPS implies year-over-year growth of 38% and 100%, respectively. Over the past seven days, EPS estimates for 2026 have risen by 38 cents. The stock sports a Zacks Rank #1 (Strong Buy). You can see the complete list of today’s Zacks #1 Rank stocks here.
BHP is a global natural resource giant based in Australia, producing copper, iron ore, nickel, coal and potash. Copper now makes up 39% of BHP’s EBITDA, one of the highest among diversified miners. The company has a strong growth pipeline, targeting around 2 million tons of copper production per year by the 2030s.
Key assets include Escondida and Pampa Norte in Chile, Antamina, and joint ventures like Vicuña Corp. in Argentina and Chile, plus a 45% stake in the Resolution Copper Project in the United States. In October 2025, BHP announced a $550 million investment to expand its Olympic Dam operations in Australia, setting the stage for an even larger output by the mid-2030s. With these projects, BHP is well-positioned to benefit from rising copper demand.
The Zacks Consensus Estimate for BHP’s fiscal 2026 EPS implies year-over-year growth of 23%. Over the past 60 days, EPS estimates for fiscal 2026 have risen by 33 cents. The stock sports a Zacks Rank #1.
Rio Tinto is a U.K.-based mining giant producing copper, aluminum, gold, iron ore, diamonds, and uranium. Its copper portfolio includes the Kennecott mine in Utah and a 66% stake in Oyu Tolgoi in Mongolia, one of the world’s largest copper and gold deposits, set to be the fourth-largest copper mine globally by 2030.
Rio Tinto is also developing growth projects like Resolution Copper in the United States and the Winu copper-gold project in Australia, in partnership with Sumitomo Metal Mining. Talks of a potential Glencore acquisition could create the world’s largest mining company and add significant copper and cobalt production. With strong existing assets and growth projects, Rio Tinto is well-positioned to benefit from the global copper rally.
The Zacks Consensus Estimate for RIO’s 2026 sales and EPS implies year-over-year growth of 6% each. Over the past 60 days, EPS estimates for 2026 have risen by 65 cents. The stock sports a Zacks Rank #1.
Southern Copper holds the largest copper reserves in the industry and operates top-tier mines in investment-grade countries like Mexico and Peru. The company has a $15 billion capital investment plan this decade, with $10.3 billion focused on Peru, the world’s second-largest copper producer.
Key projects include Tía María, which is expected to produce 120,000 tons of copper cathodes annually, Los Chancas, set to produce 130,000 tons of copper and 7,500 tons of molybdenum starting 2030-2031, and Michiquillay, set to become one of Peru’s largest copper mines with 225,000 tons of copper per year plus gold, silver and molybdenum. With a track record of low-cost production and large-scale growth projects, SCCO is well-positioned to benefit from rising copper demand.
The Zacks Consensus Estimate for Southern Copper’s 2026 sales and EPS implies year-over-year growth of 10% and 18%, respectively. Over the past 30 days, EPS estimates for 2026 have risen by 6 cents. The stock carries a Zacks Rank #2 (Buy).
Free: Instant Access to Zacks' Market-Crushing Strategies
Since 2000, our top stock-picking strategies have blown away the S&P's +7.7% average gain per year. Amazingly, they soared with average gains of +48.4%, +50.2% and +56.7% per year.
Today you can tap into those powerful strategies – and the high-potential stocks they uncover – free. No strings attached.
Get all the details here >>
support@zacks.com
https://www.zacks.com
Past performance is no guarantee of future results. Inherent in any investment is the potential for loss. This material is being provided for informational purposes only and nothing herein constitutes investment, legal, accounting or tax advice, or a recommendation to buy, sell or hold a security. No recommendation or advice is being given as to whether any investment is suitable for a particular investor. It should not be assumed that any investments in securities, companies, sectors or markets identified and described were or will be profitable. All information is current as of the date of herein and is subject to change without notice. Any views or opinions expressed may not reflect those of the firm as a whole. Zacks Investment Research does not engage in investment banking, market making or asset management activities of any securities. These returns are from hypothetical portfolios consisting of stocks with Zacks Rank = 1 that were rebalanced monthly with zero transaction costs. These are not the returns of actual portfolios of stocks. The S&P 500 is an unmanaged index. Visit https://www.zacks.com/performance for information about the performance numbers displayed in this press release.
Want the latest recommendations from Zacks Investment Research? Today, you can download 7 Best Stocks for the Next 30 Days. Click to get this free report
BHP Group Limited Sponsored ADR (BHP) : Free Stock Analysis Report
Rio Tinto PLC (RIO) : Free Stock Analysis Report
Southern Copper Corporation (SCCO) : Free Stock Analysis Report
Ero Copper Corp. (ERO) : Free Stock Analysis Report
This article originally published on Zacks Investment Research (zacks.com).
Coeur Mining, Inc. CDE reported third-quarter 2025 revenues of about $555 million, up from roughly $314 million a year earlier and $481 million in the prior quarter, translating to nearly 77% year-over-year growth. This surge was largely fueled by substantially higher realized precious-metal prices, with gold averaging $3,148 per ounce and silver $38.93 per ounce, directly boosting overall sales value.
Revenues also benefited from record production and higher sales volumes, as the company sold 114,495 ounces of gold and 5.0 million ounces of silver, reflecting improved output and robust operational performance across its North American mines. CDE’s production totaled 111,364 ounces of gold and 4.8 million ounces of silver, both reflecting year-over-year and sequential increases.
Performance was further supported by newly integrated and expanded assets, especially the Las Chispas mine acquired through SilverCrest, alongside solid contributions from established operations, including Palmarejo, Rochester, Kensington and Wharf. U.S. sites accounted for about 55% of total revenues for the quarter.
Among peers, Southern Copper Corporation SCCO reported revenues of about $3.38 billion in the third quarter of 2025, up 15% year over year and marking a record quarter, driven by higher realized gold and silver prices of $3,455.5 and $39.56, respectively. Southern Copper's growth was driven by higher prices for copper, silver, and molybdenum, while gold as a by-product also contributed amid elevated precious metal prices. Higher by-product production and efficient cost management allowed Southern Copper to convert these favorable conditions into strong top-line results.
Lundin Mining Corporation LUNMF posted revenues of approximately $1,007 million in the third quarter of 2025, up 16% year over year, driven by higher realized metal prices and strong sales volumes. Lundin Mining benefited from a realized copper price of around $4.61 per pound and a realized gold price of about $3,889 per ounce, which significantly boosted the value of its core sales. Revenue growth for Lundin Mining was further supported by robust output from copper-focused operations, with additional contributions from gold and nickel by-products, helping lift the overall top line despite minor timing effects at certain mines.
The Zacks Rundown for CDE
Shares of CDE have skyrocketed 266% over the past year compared with the industry’s 71.4% growth.
Image Source: Zacks Investment Research
From a valuation perspective, CDE is currently trading at a forward 12-month price-to-sales of 5.48X, higher than the industry’s average of 5.05X. It carries a Value Score of D.
Image Source: Zacks Investment Research
The Zacks Consensus Estimate for 2025 and 2026 earnings implies year-over-year growth of 356% and 117%, respectively.
Image Source: Zacks Investment Research
The consensus estimate for fiscal 2025 and 2026 EPS has been trending upward over the past 30 days.
Image Source: Zacks Investment Research
Zacks Investment Research CDE currently carries a Zacks Rank of #1 (Strong Buy). You can see the complete list of today’s Zacks #1 Rank here.
Want the latest recommendations from Zacks Investment Research? Today, you can download 7 Best Stocks for the Next 30 Days. Click to get this free report
Southern Copper Corporation (SCCO) : Free Stock Analysis Report
Coeur Mining, Inc. (CDE) : Free Stock Analysis Report
Lundin Mining Corp. (LUNMF) : Free Stock Analysis Report
This article originally published on Zacks Investment Research (zacks.com).
Southern Copper (SCCO) stock's valuation is stretched and its copper production is expected to fall this year and the next, UBS said in a Tuesday note.
The company's stock is currently priced about 80% higher than other copper stocks and has historically traded at around a 50% premium to peers, leading UBS analysts to believe that Southern Copper is stretched, according to the note.
The analysts said the premium could decrease with Southern Copper's production set to decline around 5% year over year in 2026 and 2027 to its lowest level in 12 years. The main drivers of the production decline are the falling ore grades and the forecasted delay to the start-up of the Tia Maria project to 2028 rather than 2027 as announced, the analysts said. They added that progress at the company's other key projects in Mexico and Peru is proceeding slower than expected.
The analysts retained a positive view on copper in 2026 and 2027 as they expect prices to be buoyed by supply shortages and robust demand. However, they see the possibility of prices consolidating in the near term due to the speed and magnitude of the recent price spike.
UBS downgraded the company's stock to sell from neutral and adjusted the price target to $148 from $143.
Goliath Resources Limited (GOT.V) entered Thursday into an agreement to amend its existing property option agreement with The J2 Syndicate and J2 Syndicate Holdings Ltd. to "fast track" its ownership in the Golddigger Property located in the Golden Triangle, B.C. that hosts the high-grade Surebet gold discovery to 100%, from 40%. It will also reduce the Net Smelter Returns held by the syndicate from 3% to 2% for consideration including the issuance of 3 million Goliath common shares to the syndicate (no warrants) not later than March 15, 2026. The proposed transaction is subject to TSXV approval.
The company in a statement said other significant amendments to the existing property option agreement include: Goliath is to publish a Maiden Resource Estimate (MRE) on the Golddigger Property or before June, 1 2030, and on every 3 year anniversary of June 1, 2030, thereafter vs. the requirement in the original agreement to publish the MRE by June 1, 2027, and every 3 year anniversary thereafter.
Goliath will pay the Syndicate US$1 for every gold equivalent ounce over 4 million gold equivalant ounces in the MRE vs. the requirement in the original agreement to pay the Syndicate US$1.0 million plus US$1 for every gold equivalent ounce over 2 million gold equivalent ounces; also, should there be a change of control of Goliath prior to Goliath publishing a MRE, the acquirer would generally assume Goliath's obligations under the amended agreement although the requirement to deliver an Initial Resource Report (MRE) would be changed from June 1, 2030, to the third anniversary of the date of completion of the Change of Control transaction and the payment exemption for the first 4 million gold equivalent ounces in the MRE would be removed.
The company's key strategic cornerstone shareholders include Crescat Capital, a Global Commodity Group (Singapore), McEwen Inc. (NYSE and TSX: MUX), Waratah Capital Advisors, Rob McEwen, Eric Sprott and Larry Childress.
Shares in GOT fell 4.2% in Canada yesterday.
Goliath Resources Limited
TORONTO, Jan. 22, 2026 (GLOBE NEWSWIRE) — Goliath Resources Limited (TSX-V: GOT) (OTCQB: GOTRF) (Frankfurt: B4IF) (the "Company" or "Goliath") is very pleased to announce that it has entered into an agreement to amend its existing property option agreement with The J2 Syndicate and J2 Syndicate Holdings Ltd. (the “Syndicate”) to fast track its ownership in the Golddigger Property located in the Golden Triangle, B.C. that hosts the high-grade Surebet gold discovery from 49% to 100% and to reduce the Net Smelter Returns (“NSR”) held by the Syndicate from 3% to 2% for consideration including the issuance of 3,000,000 Goliath common shares to the Syndicate (no warrants) not later than March 15, 2026. The contemplated transaction is subject to TSXV approval.
Other significant amendments to the existing property option agreement include:
-
Goliath is to publish a Maiden Resource Estimate (MRE) on the Golddigger Property or before June, 1 2030 and on every 3 year anniversary of June 1,2030 thereafter vs. the requirement in the original agreement to publish the MRE by June 1, 2027 and every 3 year anniversary thereafter;
-
Goliath will pay the Syndicate US$1 for every gold equivalent ounce over 4,000,000 gold equivalant ounces in the MRE vs. the requirement in the original agreement to pay the Syndicate US $1.0 million plus US$1 for every gold equivalent ounce over 2,000,000 gold equivalent ounces; and
-
Should there be a change of control of Goliath prior to Goliath publishing a MRE, the Acquirer would generally assume Goliath’s obligations under the amended agreement although the requirement to deliver an Initial Resource Report (MRE) would be changed from June 1, 2030 to the third anniversary of the date of completion of the Change of Control transaction and the payment exemption for the first 4,000,000 gold equivalent ounces in the MRE would be removed.
About Goliath Resources Limited
Goliath Resources is an explorer of precious metals projects in the highly prospective Golden Triangle of Northwestern British Columbia. All of its projects are in high quality geological settings and geopolitical safe jurisdictions amenable to mining in Canada. Goliath is a member and active supporter of CASERM which is an organization that represents a collaborative venture between Colorado School of Mines and Virginia Tech. Goliath recently completed its largest drill campaign to date for a total of 64,364 meters in 2025. It is fully funded for a similiar sized drill program in 2026. A total of 110 holes have assays pending for gold equivalent results from its 2025 drill program. The Company’s key strategic cornerstone shareholders include Crescat Capital, a Global Commodity Group (Singapore), McEwen Inc. (NYSE: MUX) (TSX: MUX), Waratah Capital Advisors, Rob McEwen, Eric Sprott and Larry Childress.
For more information please contact:
Goliath Resources Limited
Mr. Roger Rosmus Founder and CEO Tel: +1.416.488.2887roger@goliathresources.comwww.goliathresourcesltd.com
This press release contains statements that constitute “forward-looking information” (“forward-looking information”) within the meaning of the applicable Canadian securities legislation. All statements, other than statements of historical fact, are forward-looking information and are based on expectations, estimates and projections as at the date of this news release. Any statement that discusses predictions, expectations, beliefs, plans, projections, objectives, assumptions, future events or performance (often but not always using phrases such as “expects”, or “does not expect”, “is expected”, “anticipates” or “does not anticipate”, “plans”, “budget”, “scheduled”, “forecasts”, “estimates”, “believes” or “intends” or variations of such words and phrases or stating that certain actions, events or results “may” or “could”, “would”, “might” or “will” be taken to occur or be achieved) are not statements of historical fact and may be forward-looking information. Forward-looking statements in this news release include statements regarding the Consolidation Proposal (including the completion of the Consolidation Proposal on the terms and timeline as announced or at all and the timing to implement the Consolidation Proposal), and the Company’s ability to obtain all regulatory approvals, including the approval of the Exchange. In disclosing the forward-looking information contained in this press release, the Company has made certain assumptions. Although the Company believes that the expectations reflected in such forward-looking information are reasonable, it can give no assurance that the expectations of any forward-looking information will prove to be correct. Known and unknown risks, uncertainties, and other factors which may cause the actual results and future events to differ materially from those expressed or implied by such forward-looking information. Such factors include but are not limited to: compliance with extensive government regulations; domestic and foreign laws and regulations adversely affecting the Company’s business and results of operations; and general business, economic, competitive, political and social uncertainties. Accordingly, readers should not place undue reliance on the forward-looking information contained in this press release. Except as required by law, the Company disclaims any intention and assumes no obligation to update or revise any forward-looking information to reflect actual results, whether as a result of new information, future events, changes in assumptions, changes in factors affecting such forward-looking information or otherwise.
Neither the TSX Venture Exchange nor its Regulation Services Provider (as that term is defined in the policies of the TSX Venture Exchange) accepts responsibility for the adequacy or accuracy of this release.
Freeport-McMoRan Inc. FCX recorded net income of $406 million or 28 cents per share for the fourth quarter of 2025, up around 48.2% from $274 million or 19 cents in the year-ago quarter.
Barring one-time items, adjusted earnings per share were 47 cents, topping the Zacks Consensus Estimate of 28 cents.
Revenues fell roughly 1.5% year over year to $5,633 million. The figure surpassed the Zacks Consensus Estimate of $5,175.4 million. Although volumes declined, the company witnessed a sharp increase in copper and gold prices in the reported quarter.
Freeport-McMoRan Inc. Price, Consensus and EPS Surprise
Freeport-McMoRan Inc. price-consensus-eps-surprise-chart | Freeport-McMoRan Inc. Quote
FCX's Operational Highlights
Copper production fell around 38.5% year over year to 640 million pounds in the reported quarter.
Consolidated sales also fell approximately 28.5% year over year, reaching 709 million pounds of copper. The downside primarily resulted from reduced production in Indonesia. The company sold 80,000 ounces of gold in the quarter, down around 77.1% year over year. FCX also sold 22 million pounds of molybdenum, up 22.2% year over year.
Consolidated average unit net cash costs per pound of copper were $2.22, up from $1.66 a year ago. The figure was lower than our estimate of $2.47.
The average realized copper price was $5.33 per pound, up around 28.4% year over year. The figure outpaced our estimate of $4.75 per pound. The average realized price per ounce for gold rose around 55.2% year over year to $4,078. The figure topped our estimate of $4,000.
Freeport's Financial Position
Cash and cash equivalents at the end of the quarter were $3,824 million, down around 2.5% year over year. The company’s total debt was $9,379 million, up 4.8% year over year.
Cash flows provided by operations were around $693 million in the reported quarter, down 51% year over year.
FCX's Guidance
For full-year 2026, consolidated sales volumes are projected to be around 3.4 billion pounds of copper, 0.8 million ounces of gold, and 90 million pounds of molybdenum. This includes an estimated 640 million pounds of copper, 60,000 ounces of gold, and 22 million pounds of molybdenum expected to be sold in the first quarter.
FCX also noted that it remains on track to start a phased restart of the Grasberg Block Cave underground mine beginning in second-quarter 2026.
Freeport's Price Performance
Shares of FCX have risen 57.4% over the past year compared with the industry’s 70.8% growth.
Image Source: Zacks Investment Research
FCX’s Zacks Rank & Key Picks
FCX currently carries a Zacks Rank #3 (Hold).
Some better-ranked stocks in the basic materials space are Royal Gold, Inc. RGLD, Coeur Mining, Inc. CDE and Southern Copper Corporation SCCO.
Royal Gold is scheduled to report fourth-quarter results on Feb. 18. The Zacks Consensus Estimate for RGLD’s fourth-quarter earnings is pegged at $2.66 per share. RGLD’s earnings beat the Zacks Consensus Estimate in three of the last four quarters and missed the same in one, with the average surprise being 4%. Royal Gold currently flaunts a Zacks Rank #1 (Strong Buy). You can see the complete list of today’s Zacks #1 Rank stocks here.
Coeur Mining is slated to report fourth-quarter results on Feb. 18. The Zacks Consensus Estimate for fourth-quarter earnings is pegged at 33 cents per share. CDE’s earnings beat the Zacks Consensus Estimate in two of the last four quarters and missed in the other two, with the average surprise being 107%. Coeur Mining flaunts a Zacks Rank #1 at present.
Southern Copper is expected to report fourth-quarter results on Feb. 11. The Zacks Consensus Estimate for fourth-quarter earnings is pegged at $1.44 per share. SCCO carries a Zacks Rank #2 (Buy) at present. Southern Copper’s earnings beat the consensus estimate in three of the last four quarters and missed once, with the average surprise being 6.32%.
Want the latest recommendations from Zacks Investment Research? Today, you can download 7 Best Stocks for the Next 30 Days. Click to get this free report
Freeport-McMoRan Inc. (FCX) : Free Stock Analysis Report
Southern Copper Corporation (SCCO) : Free Stock Analysis Report
Coeur Mining, Inc. (CDE) : Free Stock Analysis Report
Royal Gold, Inc. (RGLD) : Free Stock Analysis Report
This article originally published on Zacks Investment Research (zacks.com).
PHILADELPHIA, Jan. 22, 2026 /PRNewswire/ — FMC Corporation (NYSE: FMC) announced today that its 2026 Annual Meeting of Stockholders will be held via live webcast on Tuesday, April 28, 2026, at 2:00 p.m. ET. The board of directors established the close of business on Friday, February 27, 2026, as the record date for determining stockholders entitled to receive notice of and vote at the annual meeting.
Further information regarding the annual meeting will be set forth in the proxy statement and other proxy materials. Instructions for accessing the webcast will be available on the company's Investor Relations website at https://investors.fmc.com.
About FMC
FMC Corporation is a global agricultural sciences company dedicated to helping growers produce food, feed, fiber and fuel for an expanding world population while adapting to a changing environment. FMC's innovative crop protection solutions – including biologicals, crop nutrition, digital and precision agriculture – enable growers and crop advisers to address their toughest challenges economically while protecting the environment. FMC is committed to discovering new herbicide, insecticide and fungicide active ingredients, product formulations and pioneering technologies that are consistently better for the planet. Visit fmc.com to learn more and follow us on LinkedIn®.
Cautionary Note Regarding Forward-Looking Statements
Statement under the Safe Harbor Provisions of the Private Securities Litigation Reform Act of 1995: FMC and its representatives may from time to time make written or oral statements that are "forward-looking" and provide other than historical information, including statements contained in this press release, in FMC's other filings with the SEC, and in reports or letters to FMC stockholders.
In some cases, FMC has identified these forward-looking statements by such words or phrases as "outlook," "will," "will likely result," "is confident that," "expect," "expects," "should," "could," "may," "will continue to," "believe," "believes," "anticipates," "predicts," "forecasts," "estimates," "projects," "potential," "intends" or similar expressions identifying "forward-looking statements" within the meaning of the Private Securities Litigation Reform Act of 1995, including the negative of those words or phrases. Such forward-looking statements are based on management's current views and assumptions regarding future events, future business conditions and the outlook for the company based on currently available information. The forward-looking statements involve known and unknown risks, uncertainties and other factors that may cause actual results to be materially different from any results, levels of activity, performance or achievements expressed or implied by any forward-looking statement. These statements are qualified by reference to the risk factors included in Part I, Item 1A of our Annual Report on Form 10-K for the year ended December 31, 2024 (the "2024 Form 10-K"), the section captioned "Forward-Looking Information" in Part II of the 2024 Form 10-K and to similar risk factors and cautionary statements in all other reports and forms filed with the Securities and Exchange Commission ("SEC"). Such factors may be updated from time to time in our periodic filings with the SEC, which are accessible on the SEC's website at www.sec.gov. FMC cautions readers not to place undue reliance on any such forward-looking statements, which speak only as of the date made. Forward-looking statements are qualified in their entirety by the above cautionary statement.
FMC undertakes no obligation, and specifically disclaims any duty, to update or revise any forward-looking statements to reflect events or circumstances arising after the date of such statements or to reflect the occurrence of anticipated events, except as otherwise required by law.
This press release may contain certain "non-GAAP financial terms" which are defined on our website www.fmc.com/investors. Such terms include adjusted EBITDA, adjusted earnings, free cash flow, organic revenue growth and return on invested capital. In addition, we have also provided on our website reconciliations of non-GAAP terms to the most directly comparable GAAP term.
Media contact: Nicole Canning +1.215.299.5916Nicole.Canning@fmc.com
Investor contact: Curt Brooks 215-299-6137Curt.Brooks@fmc.com
View original content to download multimedia:https://www.prnewswire.com/news-releases/fmc-corporation-announces-date-of-2026-annual-meeting-of-stockholders-302666946.html
Investors interested in stocks from the Mining – Miscellaneous sector have probably already heard of Norsk Hydro ASA (NHYDY) and Anglo American (NGLOY). But which of these two stocks presents investors with the better value opportunity right now? Let's take a closer look.
Everyone has their own methods for finding great value opportunities, but our model includes pairing an impressive grade in the Value category of our Style Scores system with a strong Zacks Rank. The proven Zacks Rank puts an emphasis on earnings estimates and estimate revisions, while our Style Scores work to identify stocks with specific traits.
Norsk Hydro ASA has a Zacks Rank of #1 (Strong Buy), while Anglo American has a Zacks Rank of #2 (Buy) right now. Investors should feel comfortable knowing that NHYDY likely has seen a stronger improvement to its earnings outlook than NGLOY has recently. But this is just one factor that value investors are interested in.
Value investors analyze a variety of traditional, tried-and-true metrics to help find companies that they believe are undervalued at their current share price levels.
Our Value category highlights undervalued companies by looking at a variety of key metrics, including the popular P/E ratio, as well as the P/S ratio, earnings yield, cash flow per share, and a variety of other fundamentals that have been used by value investors for years.
NHYDY currently has a forward P/E ratio of 9.08, while NGLOY has a forward P/E of 32.75. We also note that NHYDY has a PEG ratio of 0.26. This popular metric is similar to the widely-known P/E ratio, with the difference being that the PEG ratio also takes into account the company's expected earnings growth rate. NGLOY currently has a PEG ratio of 3.16.
Another notable valuation metric for NHYDY is its P/B ratio of 1.58. Investors use the P/B ratio to look at a stock's market value versus its book value, which is defined as total assets minus total liabilities. By comparison, NGLOY has a P/B of 2.13.
Based on these metrics and many more, NHYDY holds a Value grade of A, while NGLOY has a Value grade of C.
NHYDY sticks out from NGLOY in both our Zacks Rank and Style Scores models, so value investors will likely feel that NHYDY is the better option right now.
Want the latest recommendations from Zacks Investment Research? Today, you can download 7 Best Stocks for the Next 30 Days. Click to get this free report
Norsk Hydro ASA (NHYDY) : Free Stock Analysis Report
Anglo American (NGLOY) : Free Stock Analysis Report
This article originally published on Zacks Investment Research (zacks.com).
Vancouver, British Columbia–(Newsfile Corp. – January 22, 2026) – Sego Resources Inc. (TSXV: SGZ) ("Sego" or "the Company") is pleased to report that the Company will have a booth at VRIC on January 25 and January 26, 2026.
We will be at Booth 1030 and will have maps and polished drill core available from Diamond Drill Holes 69 and 71. The core from DDH 69 will display clearly the potassic alteration and DDH 71 core will display phyllic alteration.
We will also have maps available of the complete areas of interest.
About the Project
Sego is 100% owner of the Miner Mountain Project, an alkalic copper-gold porphyry and gold exploration project located near Princeton, British Columbia. The property is 2,056 hectares in size and is 15 kilometres north of the Copper Mountain Mine operated by Hudbay Minerals Inc. Sego has a Memorandum of Understanding with the Upper Similkameen Indian Band on whose Traditional Territory the Miner Mountain Project is situated. Sego has received an Award of Excellence for its reclamation work on the Miner Mountain Project.
For further information, please contact: J. Paul Stevenson, CEO (604) 682-2933, email: ceo@segoresources.com
Neither the TSX Venture Exchange nor its Regulation Services Provider (as that term is defined in the policies of the TSX Venture Exchange) accepts responsibility for the adequacy or accuracy of this release. No regulatory authority has approved or disapproved the information contained in this news release.
This release includes certain statements that may be deemed "forward-looking statements". All statements in this release, other than statement of historical facts that address future production, reserve potential, exploration drilling, exploitation activities and events or developments that the Company expects re forward-looking statements. Although the Company believes the expectations expressed in such forward-looking statements are based on reasonable assumptions, statements are not guarantees of future performance and actual results or developments may differ materially from the forward-looking statements. Factors that could cause actual results to differ materially from those in forward-looking statements include market prices, exploitation and exploration successes, continued availability of capital and financing, general economic, market or business conditions. Investors are cautioned that any such statements are not guarantees of future performance and those actual results or developments may differ materially from those projected in the forward-looking statements.
To view the source version of this press release, please visit https://www.newsfilecorp.com/release/281295
DENVER, CO / ACCESS Newswire / January 22, 2026 / Solitario Resources Corp. ("Solitario" or the "Company") (NYSE American:XPL)(TSX:SLR) is pleased to announce that it has acquired the Bright Angel copper-gold project in Colorado. At Bright Angel, mineralized porphyry stockwork contains significant values of gold and copper, with minor silver values. Mineralization has been traced over an area approximately 750 meters long and up to 600 meters wide. Both gold and copper are trading at all-time highs, with copper being designated as a critical metal by the U.S. government.
Bright Angel was originally discovered and drilled in the late 1960's by a private party. Anaconda Copper leased the property in 1970 and drilled eleven core holes, maintaining the lease for ten years. The property has sat idle for the past 50 years until Solitario acquired the rights to earn 100% interest in the minerals from a private entity in September 2025.
To date, Solitario has completed a surface reconnaissance rock sampling program and has initiated drill hole permitting. Results of the surface sampling program have been highly encouraging with consistently anomalous to strong values of gold and copper (see table below and sample map here). Solitario has submitted a Notice of Intent to the U.S. Forest Service to commence an exploration drilling program at Bright Angel and is currently working on submitting a Plan of Operations.
Chris Herald, President and CEO of Solitario, stated: "With gold and copper prices at all-time highs, we are extremely excited about the potential of our newly acquired Bright Angel gold-copper property. Our geologic evaluation of Bright Angel is that it is an alkaline pipe-like porphyry system characterized by potentially high grades for both gold and copper with deep roots. We are focused on obtaining a drilling permit and testing this exceptional target, hopefully in late-2026.
The importance of this type of gold-copper deposit is now well-known, in large part due to Newcrest Mining's (now Newmont) world-class Cadia – Ridgeway copper-gold pipe-like porphyry deposits discovered in the mid-1990's. The Cadia – Ridgeway gold/copper endowment is estimated to be in excess of 20 million ounces of gold and 10 billion pounds of copper. The lateral footprint of alkaline copper/gold pipe-like porphyry systems are rather small, generally limited to several hundred meters in diameter, but often extending to depths greater than 1,000 meters. Another important attribute is that these deposits often occur in clusters."
|
Chris Herald, President and CEO, will present at the 2026 Metals Investor Forum in Vancouver, British Columbia, Canada on January 23 at 5:20 pm PST. The in-person live presentation will not be webcast. Mr. Herald plans to present an overview of Solitario's exploration plans for the Golden Crest gold project – Ponderosa area, Cat Creek molybdenum-rhenium project, Bright Angel copper-gold property, and its Florida Canyon and Lik zinc projects. |
History of Project
Drilling at Bright Angel began in the late-1960's when its initial owner completed 186 very shallow (~16 meters) and widely spaced drill holes. Twelve of the more mineralized holes were deepened to depths of up to 200 meters. Two of the holes reportedly intersected significant grades of gold and copper but are not reported here as Solitario is unable to verify the historic drill hole assay results. However, Solitario's surface rock sampling (see table below and sample map here) produced gold/copper grades consistent with the grades in the upper 20 meters of the reported historic drill holes. Drilling will be required to confirm drill hole grades reported in the historic files.
Anaconda Copper, formerly one of the largest mining companies in the world, leased the property in 1970 and drilled 11 widely spaced core holes ranging in depth from 270 to 783 meters. Anaconda's exploration program focused upon testing for a classic large-scale mushroom-shaped, calc-alkaline copper porphyry system common in the Arizona and Chilean copper belts. Calc-alkaline copper systems tend to be laterally extensive, often well over 1,000 meters in diameter. These copper systems are generally gold poor.
Anaconda intersected thick sections of 0.1% to 0.3% Cu in six of their core holes but generally did not assay for gold as gold price was fixed at $38 per ounce at that time and its exploration priority was a primary copper resource. Anaconda concluded that the Bright Angel porphyry was not a calc-alkaline porphyry system but continued to hold the lease for 10 years before exiting the mineral exploration business, when the property was dropped.
Solitario Surface Sampling
During late-fall, Solitario collected 27 select surface grab samples from an area approximately 750 meters x 600 meters. Results are presented in the Table below. This work confirmed widespread gold and copper mineralization in both porphyry intrusive rocks and skarn.
|
Surface Rock Assays |
||||||||
|
Sample # |
Cu % |
Au ppm |
Ag ppm |
Sample # |
Cu % |
Au ppm |
Ag ppm |
|
|
TBST-1 |
0.38 |
1.16 |
2.17 |
5942 |
0.43 |
0.07 |
0.47 |
|
|
TBST-2 |
0.044 |
0.04 |
0.3 |
5943 |
0.09 |
0.08 |
1.49 |
|
|
TBST-3 |
0.57 |
0.14 |
0.96 |
5944 |
0.73 |
0.35 |
4.95 |
|
|
TBST-4 |
0.85 |
0.74 |
1.35 |
5945 |
0.53 |
0.13 |
3.59 |
|
|
TBST-5 |
1.12 |
2.15 |
1.56 |
5946 |
0.15 |
0.31 |
1.47 |
|
|
TBST-6 |
1.17 |
0.37 |
3.04 |
5947 |
0.06 |
0.15 |
1.01 |
|
|
TBST-7 |
3.22 |
0.29 |
15 |
5948 |
3.30 |
0.37 |
27.00 |
|
|
TBST-8 |
8.45 |
0.67 |
38.8 |
5949 |
0.26 |
0.31 |
1.50 |
|
|
TBST-9 |
3.97 |
0.16 |
38 |
5950 |
0.57 |
0.10 |
0.62 |
|
|
5937 |
0.03 |
0.27 |
1.27 |
5951 |
0.02 |
0.02 |
0.24 |
|
|
5938 |
0.19 |
0.03 |
0.18 |
5952 |
0.34 |
0.09 |
1.08 |
|
|
5939 |
0.22 |
0.09 |
0.67 |
5953 |
1.00 |
0.12 |
8.88 |
|
|
5940 |
0.43 |
0.12 |
0.56 |
4747 |
0.00 |
0.03 |
0.17 |
|
|
5941 |
0.49 |
0.09 |
0.58 |
|||||
Plans are also underway to conduct a drone magnetic survey and possibly an Induced Polarization geophysical survey in the upcoming field season.
Sample Type, Sampling Methodology, Chain of Custody, Quality Control and Assurance
The reported Bright Angel rock assays are all select surface rock grab/float samples and were generally not collected from a bedrock source. However, these samples are thought to be derived from the underlying bedrock in the immediate area. Rock samples are reconnaissance select grab samples that display alteration, usually with silicification and silica-filled fractures +/- sulfide and copper mineralization. The significance of these results is limited to determining whether copper, gold, or trace elements usually associated with copper and gold, are present within the sampled rocks. These assay results should not be considered as representative of, nor verify economically mineable mineralization.
Samples were analyzed by ALS Laboratories in Reno, Nevada, a laboratory accredited in accordance with the standards of ISO 17025:2017. ALS is independent from Solitario. The samples were collected by Solitario geologists and submitted directly to ALS through secure chain of custody protocols or an independent sample preparation laboratory prior to being shipped to ALS. All activities prior to shipment were directly supervised by Solitario geologists. The samples were crushed and pulverized, and sample pulps were analyzed using industry standard fire assay and Inductively Coupled Plasma – Mass Spectrometry (ICP-MS) analytical methods.
Qualified Person
The scientific and technical information contained in this news release has been reviewed and approved by Walter Hunt, a qualified person as defined by Canadian instrument NI 43-101, Standards of Disclosure for Mineral Projects.
About Solitario
Solitario is a natural resource exploration company focused on high-quality Tier-1 gold, copper, zinc and critical metals (molybdenum and rhenium) projects. Solitario's 100%-owned Golden Crest properties in South Dakota constitute strategic land holdings (31,500 acres) along the western and southwestern extensions of the Homestake-Wharf mining district that has produced approximately 52 million ounces of gold. Golden Crest is scheduled for a major drilling campaign in 2026.
In addition to its Bright Angel and Golden Crest projects, Solitario holds a 100% interest in the Cat Creek critical minerals project (molybdenum-rhenium) in Colorado. Solitario also has a 50% joint venture interest (Teck Resources 50%) in the high-grade Lik zinc deposit in Alaska and a 39% joint venture interest (Nexa Resources 61%) in the high-grade Florida Canyon zinc project in Peru. Both Florida Canyon and Lik represent advanced exploration projects with over $110 million spent collectively on the properties. Solitario is carried to production on its Florida Canyon project through its joint venture arrangement with Nexa.
The Company is traded on the NYSE American ("XPL") and on the Toronto Stock Exchange ("SLR"). Solitario's Management and Directors hold approximately 8.0% (excluding options) and Newmont Corporation owns 9.3% of the Company's 90.9 million shares outstanding. Solitario's cash balance and marketable securities stand at approximately US$7.6 million. Additional information about Solitario is available online at www.solitarioresources.com.
Solitario has a long history of committed Environmental, Social and Responsible Governance ("ESG") of its business. We realize ESG issues are also important to investors, employees, and all stakeholders, including communities in which we work. We are committed to conducting our business in a manner that supports positive environmental and social initiatives and responsible corporate governance. Importantly, we work with joint venture partners that not only value the importance of ESG issues in the conduct of their business on our joint venture projects but are leaders in the industry in this important segment of our business.
For More Information Please Contact:
|
Christopher Herald, President and CEO |
303-534-1030 Ext. 1 |
Cautionary Statement Regarding Forward Looking Information
This press release contains forward-looking statements within the meaning of the U.S. Securities Act of 1933 and the U.S. Securities Exchange Act of 1934, and as defined in the United States Private Securities Litigation Reform Act of 1995 (and the equivalent under Canadian securities laws), that are intended to be covered by the safe harbor created by such sections. Forward-looking statements are statements that are not historical facts. They are based on the beliefs, estimates and opinions of the Company's management on the date the statements are made and address activities, events or developments that Solitario expects or anticipates will or may occur in the future, and are based on current expectations and assumptions. Technical data from the Bright Angel project was derived primarily from historic Anaconda files thought to be accurate, but have not verified by QAQC quality controls as defined by NI 43-101, Standards of Disclosure for Mineral Projects. Forward-looking statements involve numerous risks and uncertainties. Consequently, there can be no assurances that such statements will prove to be accurate and actual results and future events could differ materially from those anticipated in such statements. Such forward-looking statements include, without limitation, statements regarding the Company's expectation of the projected timing and outcome of engineering studies; expectations regarding the receipt of all necessary permits and approvals to implement a mining plan, if any, at any of its mineral properties. Important factors that could cause actual results to differ materially from those in the forward-looking statements include, among others, risks relating to risks that Solitario's and its joint venture partners' exploration and property advancement efforts will not be successful; risks relating to fluctuations in the price of gold, silver, copper, zinc, lead, and molybdenum; the inherently hazardous nature of mining-related activities; uncertainties concerning reserve and resource estimates; availability of outside contractors, and other activities; uncertainties relating to obtaining approvals and permits from governmental regulatory authorities; the possibility that environmental laws and regulations will change over time and become even more restrictive; and availability and timing of capital for financing the Company's exploration and development activities, including uncertainty of being able to raise capital on favorable terms or at all; as well as those factors discussed in Solitario's filings and reports with the U.S. Securities and Exchange Commission (the "SEC"), including Solitario's latest Annual Report on Form 10-K and its other SEC filings (and Canadian filings) including, without limitation, its latest Quarterly Report on Form 10-Q. The Company does not intend to publicly update any forward-looking statements, whether as a result of new information, future events, or otherwise, except as may be required under applicable securities laws.
SOURCE: Solitario Resources Corp.
View the original press release on ACCESS Newswire
Southern Copper (SCCO) closed at $184.06 in the latest trading session, marking a -1.18% move from the prior day. This move lagged the S&P 500's daily gain of 1.16%. Meanwhile, the Dow experienced a rise of 1.21%, and the technology-dominated Nasdaq saw an increase of 1.18%.
Coming into today, shares of the miner had gained 25.83% in the past month. In that same time, the Basic Materials sector gained 8.74%, while the S&P 500 lost 0.42%.
The investment community will be closely monitoring the performance of Southern Copper in its forthcoming earnings report. The company's earnings per share (EPS) are projected to be $1.44, reflecting a 42.57% increase from the same quarter last year. At the same time, our most recent consensus estimate is projecting a revenue of $3.6 billion, reflecting a 29.28% rise from the equivalent quarter last year.
For the annual period, the Zacks Consensus Estimates anticipate earnings of $5.3 per share and a revenue of $13.15 billion, signifying shifts of +22.4% and 0%, respectively, from the last year.
Investors might also notice recent changes to analyst estimates for Southern Copper. These revisions typically reflect the latest short-term business trends, which can change frequently. As a result, upbeat changes in estimates indicate analysts' favorable outlook on the business health and profitability.
Based on our research, we believe these estimate revisions are directly related to near-term stock moves. To exploit this, we've formed the Zacks Rank, a quantitative model that includes these estimate changes and presents a viable rating system.
The Zacks Rank system, ranging from #1 (Strong Buy) to #5 (Strong Sell), possesses a remarkable history of outdoing, externally audited, with #1 stocks returning an average annual gain of +25% since 1988. Over the past month, there's been a 1.01% rise in the Zacks Consensus EPS estimate. Southern Copper is currently a Zacks Rank #2 (Buy).
Digging into valuation, Southern Copper currently has a Forward P/E ratio of 29.81. For comparison, its industry has an average Forward P/E of 27.86, which means Southern Copper is trading at a premium to the group.
We can additionally observe that SCCO currently boasts a PEG ratio of 1.56. The PEG ratio is akin to the commonly utilized P/E ratio, but this measure also incorporates the company's anticipated earnings growth rate. The Mining – Non Ferrous industry currently had an average PEG ratio of 0.71 as of yesterday's close.
The Mining – Non Ferrous industry is part of the Basic Materials sector. This industry currently has a Zacks Industry Rank of 16, which puts it in the top 7% of all 250+ industries.
The Zacks Industry Rank assesses the vigor of our specific industry groups by computing the average Zacks Rank of the individual stocks incorporated in the groups. Our research shows that the top 50% rated industries outperform the bottom half by a factor of 2 to 1.
Keep in mind to rely on Zacks.com to watch all these stock-impacting metrics, and more, in the succeeding trading sessions.
Want the latest recommendations from Zacks Investment Research? Today, you can download 7 Best Stocks for the Next 30 Days. Click to get this free report
Southern Copper Corporation (SCCO) : Free Stock Analysis Report
This article originally published on Zacks Investment Research (zacks.com).
Gold had a blockbuster year in 2025, rising more than 60%. Silver did even better, surging over 150%. That momentum has carried into 2026, with both metals hitting fresh highs as geopolitical tensions push investors toward safe-haven assets. But with gold and silver at record levels, many investors are wondering if they missed the boat.
While precious metals still have more room to run, another metal is looking like the next big opportunity. Copper, often called the backbone of the global economy, is quietly stepping into the spotlight. The red metal rose around 40% last year, with prices set to strengthen as new demand drivers kick in.
After gold and silver’s historic runs, it’s copper’s turn to shine red hot. Investing in copper stocks like Ero Copper Corp. ERO, BHP Group Limited BHP, Rio Tinto PLC RIO and Southern Copper Corporation SCCO could be a smart way to play the trend.
The Red Metal’s Moment
One early spark for copper’s rally came last year, when U.S. companies rushed to stockpile supplies after President Donald Trump threatened tariffs on copper imports. Even though those tariffs were later put on hold, the buying frenzy drained inventories and tightened supplies across global markets. At the same time, disruptions at major mines in countries like Chile, Peru and Indonesia limited output growth, keeping the market under pressure.
Demand trends are just as powerful. Copper is essential to electric vehicles, power grids, renewable energy systems and industrial machinery. It is also becoming a critical input for the fast-growing AI economy. Massive data centers used for artificial intelligence and cloud computing require enormous amounts of copper for wiring, power transmission and cooling systems. Some hyperscale facilities consume tens of thousands of tons on their own.
China, the world’s largest copper consumer and manufacturer, is also moving aggressively to secure long-term supplies. This adds another layer of demand to an already tight market.
Demand is growing faster than supply, and experts say this is a lasting shortage rather than a temporary supply squeeze.
With a weakening U.S. dollar, rising investor interest, strong demand and supply crunch, copper is increasingly being viewed as both a growth play and a hedge.
Copper Stocks to Own in 2026
Ero Copper is a Brazil-focused mining company producing copper and gold. It runs two copper mines—Caraíba in Bahia and Tucumã in Pará—and a gold mine, Xavantina, in Mato Grosso. In the third quarter of 2025, copper production hit a record 16,664 tonnes of concentrate at a low cash cost of $2 per pound, driven by stronger output at Tucumã and steady production at Caraíba.
The company expects fourth-quarter 2025 production to have received a boost from higher plant throughput and richer mining blocks at Tucumã. Beyond its operating mines, Ero Copper is advancing the Furnas Copper-Gold Project in Carajás Province, aiming for a 60% stake through an agreement with Vale. Low costs, rising output and expansion projects make ERO well-positioned to benefit from the copper rally.
The Zacks Consensus Estimate for ERO’s 2026 sales and EPS implies year-over-year growth of 38% and 100%, respectively. Over the past seven days, EPS estimates for 2026 have risen by 38 cents. The stock sports a Zacks Rank #1 (Strong Buy). You can see the complete list of today’s Zacks #1 Rank stocks here.
BHP is a global natural resource giant based in Australia, producing copper, iron ore, nickel, coal and potash. Copper now makes up 39% of BHP’s EBITDA, one of the highest among diversified miners. The company has a strong growth pipeline, targeting around 2 million tons of copper production per year by the 2030s.
Key assets include Escondida and Pampa Norte in Chile, Antamina, and joint ventures like Vicuña Corp. in Argentina and Chile, plus a 45% stake in the Resolution Copper Project in the United States. In October 2025, BHP announced a $550 million investment to expand its Olympic Dam operations in Australia, setting the stage for an even larger output by the mid-2030s. With these projects, BHP is well-positioned to benefit from rising copper demand.
The Zacks Consensus Estimate for BHP’s fiscal 2026 EPS implies year-over-year growth of 23%. Over the past 60 days, EPS estimates for fiscal 2026 have risen by 33 cents. The stock sports a Zacks Rank #1.
Rio Tinto is a U.K.-based mining giant producing copper, aluminum, gold, iron ore, diamonds, and uranium. Its copper portfolio includes the Kennecott mine in Utah and a 66% stake in Oyu Tolgoi in Mongolia, one of the world’s largest copper and gold deposits, set to be the fourth-largest copper mine globally by 2030.
Rio Tinto is also developing growth projects like Resolution Copper in the United States and the Winu copper-gold project in Australia, in partnership with Sumitomo Metal Mining. Talks of a potential Glencore acquisition could create the world’s largest mining company and add significant copper and cobalt production. With strong existing assets and growth projects, Rio Tinto is well-positioned to benefit from the global copper rally.
The Zacks Consensus Estimate for RIO’s 2026 sales and EPS implies year-over-year growth of 6% each. Over the past 60 days, EPS estimates for 2026 have risen by 65 cents. The stock sports a Zacks Rank #1.
Southern Copper holds the largest copper reserves in the industry and operates top-tier mines in investment-grade countries like Mexico and Peru. The company has a $15 billion capital investment plan this decade, with $10.3 billion focused on Peru, the world’s second-largest copper producer.
Key projects include Tía María, which is expected to produce 120,000 tons of copper cathodes annually, Los Chancas, set to produce 130,000 tons of copper and 7,500 tons of molybdenum starting 2030-2031, and Michiquillay, set to become one of Peru’s largest copper mines with 225,000 tons of copper per year plus gold, silver and molybdenum. With a track record of low-cost production and large-scale growth projects, SCCO is well-positioned to benefit from rising copper demand.
The Zacks Consensus Estimate for Southern Copper’s 2026 sales and EPS implies year-over-year growth of 10% and 18%, respectively. Over the past 30 days, EPS estimates for 2026 have risen by 6 cents. The stock carries a Zacks Rank #2 (Buy).
Want the latest recommendations from Zacks Investment Research? Today, you can download 7 Best Stocks for the Next 30 Days. Click to get this free report
BHP Group Limited Sponsored ADR (BHP) : Free Stock Analysis Report
Rio Tinto PLC (RIO) : Free Stock Analysis Report
Southern Copper Corporation (SCCO) : Free Stock Analysis Report
Ero Copper Corp. (ERO) : Free Stock Analysis Report
This article originally published on Zacks Investment Research (zacks.com).
Gold Fields Limited’s GFI shares hit a fresh 52-week high of $53.31 yesterday, before retracing slightly to close the session at $52.89.
GFI has shot up 227.7% over the past year. The company has also outperformed the Zacks Mining-Gold industry’s 148.1% rise over the same time frame. The rally has been driven primarily by gold prices surging to fresh highs yesterday on concerns over a U.S.-EU trade war and mounting tensions over Greenland, boosting safe-haven demand, further supported by a weaker U.S. dollar.
Image Source: Zacks Investment Research
Let’s take a look at the factors that are driving GFI stock.
GFI Gains From Strong Production and Strategic Growth
Gold Fields delivered a strong third-quarter 2025 performance, with group attributable gold-equivalent production of 621,000 ounces, up 6% quarter on quarter and 22% year on year, led by the ramp-up at Salares Norte in Chile, which produced 112,200 ounces, a 53% quarterly increase. Commercial production, improved throughput and recoveries were achieved alongside cost discipline, with All-in Sustaining Costs (AISC) down 10% quarter on quarter to $1,557/oz and All-in Costs (AIC) down 11% to $1,835/oz. Australian assets Gruyere and St Ives remained steady, while South Deep in South Africa benefited from improved underground access and operational optimization.
Gold Fields’ growth strategy combines organic project development and strategic acquisitions to enhance scale and portfolio quality. Key highlights include the Salares Norte project in Chile, which reached commercial production in 2025 and is ramping up throughput and recoveries, and the 2024 acquisition of Osisko Mining, giving full ownership of the Windfall project in Quebec, targeting 300,000 ounces annually at an AISC of $758/oz with FID expected in the first quarter of 2026.
In Australia, Gold Fields completed its A$3.7 billion acquisition of Gold Road Resources, securing full ownership of the Gruyere mine, producing 350,000 ounces annually. South Deep in South Africa continues to optimize production, while St Ives in Australia contributed 184,500 ounces in the first half of 2025, supported by new open pits.
GFI’s Zacks Rank & Key Picks
GFI currently carries a Zacks Rank #3 (Hold).
Some better-ranked stocks in the Basic Materials space are Centerra Gold Inc. CGAU, Agnico Eagle Mines Limited AEM, and Harmony Gold Mining Company Limited HMY.
At present, CGAU and AEM sport a Zacks Rank #1 (Strong Buy), while HMY carries a Zacks Rank #2 (Buy). You can see the complete list of today’s Zacks #1 Rank stocks here.
The Zacks Consensus Estimate for CGAU’s current fiscal-year earnings is pinned at 98 cents per share, indicating a 38.03% year-over-year increase. Its earnings beat the Zacks Consensus Estimate in three of the trailing four quarters while missing once, with the average surprise being 21.63%. Its shares have popped around 198.7% over the past year.
The Zacks Consensus Estimate for AEM’s current-year earnings stands at $7.93 per share, implying an 87.5% year-over-year increase. Its earnings beat the Zacks Consensus Estimates in each of the trailing four quarters, with the average earnings surprise being 11.63%. AEM’s shares have rallied roughly 134.3% over the past year.
The Zacks Consensus Estimate for HMY’s current-year earnings is pegged at $2.68 per share, indicating a year-over-year rise of 111%. HMY’s shares have gained 120.1% over the past year.
Want the latest recommendations from Zacks Investment Research? Today, you can download 7 Best Stocks for the Next 30 Days. Click to get this free report
Agnico Eagle Mines Limited (AEM) : Free Stock Analysis Report
Gold Fields Limited (GFI) : Free Stock Analysis Report
Harmony Gold Mining Company Limited (HMY) : Free Stock Analysis Report
Centerra Gold Inc. (CGAU) : Free Stock Analysis Report
This article originally published on Zacks Investment Research (zacks.com).
Taranis Has One of the Best Silver Projects in British Columbia!
ESTES PARK, CO / ACCESS Newswire / January 20, 2026 / Taranis Resources Inc. ("Taranis" or the "Company") (TSX.V:TRO)(OTCQB:TNREF) is pleased to announce a major expansion of its flagship project in the historic Silver Cup Mining District located in southeast British Columbia. With the acquisition of new Mineral Tenures south and east of the "Thor" silver, gold, base metals, and critical minerals deposit, Taranis now controls upwards of 6,000 hectares in one of British Columbia's premier past producing silver districts. This expansion unites the five historical, past-producing mines of "Thor" into a continuous mineralized body and has now added at least five more historic mines, including four past producers, under Taranis' stewardship.
Taranis' Core Exploration Philosophy
In British Columbia's shifting legal landscape where the meaning and legitimacy of mineral ownership is now actively up for debate, Taranis' commitment to productive stewardship, labour, and value creation offers a compelling model for responsible and equitable land use. In today's rapidly evolving theatre of mineral exploration, it is important to define Management's perspective on not just technical, management and financial matters, but also on land use, and the many interactions with government that are required to conduct meaningful exploration in British Columbia.
The Silver Cup District, known since the 1890's for its high-grade silver and gold, is once again poised for resurgence. Taranis' systematic exploration and diamond drilling at the Thor Project have established a robust Mineral Resource, with recent drilling in 2025 identifying the Borr Zone – interpreted as the down-dip extension of the main deposit at Thor. The initial drill hole in this new zone intersected 5.25 meters of 26.2 g/t silver, 0.163 g/t gold, and 3.55% combined lead and zinc, underscoring exploration potential outside of known mineral deposits. (see Taranis News Release, October 27, 2025).
Taranis is now allocating more resources to its newly acquired clusters of historic mines, each with similar historical underground workings, and the potential to host additional Mineral Resources. These areas, untouched by modern exploration for a century, are strategic areas of growth for Taranis to generate value for its shareholders and for the broader community as formerly underutilized and idle lands are worked once more.
Taranis' Commitment to Productive Stewardship
Taranis holds Mineral Tenures solely to discover and define new Mineral Resources, not to extract rent, displace others, or speculate on future metal price increases. Management and our shareholders understand that while mining is by its nature an extractive activity, it is necessary for today's standard of living. Exploration and mining can be done responsibly. For two decades, Taranis has focused all of our available capital on exploration and resource growth, seeking objective facts about the Silver Cup district's mineral endowment that could eventually lead to developing a mine. We have successfully permitted a 10,000 tonne Bulk Sample that will help better define the quality of the Mineral Resource at Thor, and better define the economics of commercial development of the expanding Mineral Resource.
The Value of Labour and Stewardship in Property Rights
Taranis' approach to exploration and development is grounded in the principle that property rights of any kind should only be earned and kept through labour, investment, and responsible stewardship. By transforming idle ground into productive assets, Taranis creates tangible value for shareholders and the wider community. The company's pioneering work in the Silver Cup District – being the first to drill, explore, and develop these lands in almost 100 years – embodies the idea that ownership is not just a matter of legal title, but of active engagement and improvement.
Theories of property rights based on labour and improvement have been both foundational and controversial. Regardless, many of these concepts have historically been entrenched in the Mineral Tenure system in British Columbia, including the idea that registration of physical work on Mineral tenures should be available in lieu of payment to maintain mining claims. While some critiques highlight the risk of justifying dispossession or exploitation, Taranis believes that legitimate ownership arises from productive stewardship and the creation of value through work. We affirm that all people deserve the fruits of their labour, and are skeptical to claims of property based solely on first possession or inherited privilege – principles that can disadvantage communities, those that seek to grow the economy, and which overlook or actively undermine contributions of those who develop and work on the land.
In the current climate of shifting property paradigms in British Columbia, Taranis' model – rooted in active labour, stewardship, community benefit and participation – stands as a practical and ethical framework for resource development.
Administrative and Reconciliation Challenges to Mineral Exploration
The uncertainties associated with mineral exploration in British Columbia are vast. The historic domains of geological and financial risk are now overshadowed by regulatory uncertainty, and this has led to dramatic drops in exploration investment in the province in the past six years. As an example, Taranis acquired additional claims to the south and east of the new mine clusters on July 1, 2025. These Mineral Tenures were sent out for First Nations Consultation on August 28, 2025, under the newly created Mineral Claims Consultation Framework ("MCCF"). The Ministry of Critical Minerals indicated that Mineral Tenure consultations should last 90-120 days. However, as of 120+ days, Taranis has not received any comments as outlined under the MCCF. On December 26, 2025, the company contacted the Chief Gold Commissioner's Office for an explanation, but no response has been received from any level of government.
Taranis recognizes the importance of reconciliation with First Nations and supports British Columbia's efforts to address the complicated issues involved. At the same time, the company has a duty to its shareholders and the business community to disclose when critical regulatory benchmarks are missed. The lack of timely administrative clarity threatens to undermine both reconciliation and economic progress in the province, and Taranis calls for transparent, predictable processes that honour tradition while enabling responsible mineral resource development.
Brownfield Exploration – Integrating Modern Exploration Science with History
The Silver Cup Mining District is one of British Columbia's oldest silver mining areas. Historic mines such as Silver Cup, True Fissure, Great Northern and Blue Bell (Thor), Meridian/Eva, Spider, Triune, Nettie L, have operated in the district producing primarily silver. The lack of access and transportation in the area and the rugged terrain still makes exploration of the area extremely challenging. The many past producing mines are surrounded by areas of overburden and rockslide cover making exploration challenging – but at the same time offering exploration opportunities to make substantive virgin discoveries. Exploration diamond drilling technology did not even exist when most of these mines were developed. In the Company's Management opinion, integrating modern exploration methods with the certainty of historical information, provides a robust base to enable discovery.
2025 Ajax Mine Dump Sampling
A new Mineral Tenure acquired during a prior expansion of the Thor Property (See Taranis News Release dated 01/20/2025) serves to demonstrate the exploration potential outside of the Thor deposit. The Ajax Mine was accessed by helicopter in the fall of 2025 and cursory evaluation showed that it has remained idle and unworked since shortly after World War II. Historic reports throughout the Silver Cup district often ignored gold content, focusing on silver and avoiding zinc due to a price penalty at the smelter for zinc-heavy ores. Taranis sampled dump material from two adits and found anomalous gold content in all samples. Silver and base metals were not analyzed, but strong tetrahedrite, chalcopyrite, and sphalerite mineralization was observed. In the table below, we have outlined some of the gold values that are found in the previously mined material, and the reader is reminded that grab samples are selective and not representative of average grade or true metal content.
2025 Ajax Mine Dump Sampling Table
|
Sample Number |
Au (g/t) |
Grab Sample Description |
Location (UTM Zone 11N, WGS84) |
|
379751 |
1.14 |
Massive pyrite heavily oxidized on outside (hematite) |
Middle Adit Portal Dump (468447E, 5614845N) |
|
379752 |
0.02 |
Vuggy quartz-carbonate (siderite?) with iron oxide |
Middle Adit Portal Dump (468447E, 5614845N) |
|
379753 |
0.65 |
Quartz-sulfide breccia with tetrahedrite and carbonate clasts. |
Middle Adit Portal Dump (468447E, 5614845N) |
|
379754 |
0.15 |
Quartz-Carbonate rocks with quartz veins and balance of groundmass carbonate, minor pyrite. |
Middle Adit Portal Dump (468447E, 5614845N) |
|
379755 |
0.93 |
Heavily weathered quartz carbonate rocks (hematite). Pitted and vuggy due to weathering. |
Middle Adit Portal Dump (468447E, 5614845N) |
|
379756 |
0.01 |
Massive pyrite with fragments of white quartz |
Middle Adit Portal Dump (468447E, 5614845N) |
|
379757 |
0.23 |
Quartz sulfide breccia with abundant sphalerite and tetrahedrite. Abundant quartz fragments. |
Middle Adit Portal Dump (468447E, 5614845N) |
|
379758 |
19.90 |
Quartz-pyrite vein with pyrite). Extensive vugging similar to SIF at Thor. |
Upper Adit Portal Dump (468469E, 5614828N) |
|
379759 |
0.39 |
Massive sphalerite var. marmatite |
Upper Adit Portal Dump (468469E, 5614828N) |
|
379760 |
1.62 |
Vuggy quartz-sulfide breccia. Minor pyrite, similar to SIF material at Thor. |
Upper Adit Portal Dump (468469E, 5614828N) |
Comments
Most significant mineral deposits occur in clusters, and the Silver Cup Mining District contains many old groups of mines exploited in the early 1900's. Taranis continues to consolidate land in the district, transforming the area into a district-scale opportunity now totaling over 6,000 hectares. Despite the rugged terrain, Taranis has developed an exploration toolbox that makes it uniquely qualified to add valuable Mineral Resources throughout the re-emerging area.
Responsible and meaningful exploration in British Columbia by ‘junior exploration companies' is a complicated process that historically has been driven by technical and financial decisions. A third aspect, Mineral Tenure procurement and subsequent use, and access to those lands, has now taken a front row seat. Much the same as exploration companies report drilling results, resource companies now need to publicly address regulatory and ownership issues stemming from countervailing claims and titles. An individual company's perspective on these issues is arguably more important than reporting on exploration programs, because without a path forward to develop those mineral lands – exploration results are meaningless and work programs in general are stalled by a regulatory system that is paralyzed by competing interests.
Taranis' unique position as the only major explorer systematically advancing the Silver Cup Mining District is not just a strategic advantage – it is an important philosophical one. In a time when the foundations of property rights are being reconsidered, Taranis has chosen to be a living example of how active labor, stewardship, and community benefit can and should define legitimate ownership and responsible resource development in British Columbia.
Qualified Person
Exploration activities at Thor were overseen by John Gardiner (P. Geo.), President and CEO of Taranis Resources Inc., and a Qualified Person under Canadian National Instrument 43-101. Mr. Gardiner is the principal of John J. Gardiner & Associates, LLC, operating in British Columbia under Firm Permit Number 1002256. Mr. Gardiner has reviewed and approved the comments contained within this News Release.
Quality Control and Laboratory Methods
All samples for the Thor project were securely delivered to Actlabs in Kamloops, British Columbia. Analytical work was completed at both the Kamloops and Ancaster, Ontario locations. Actlabs is ISO 17025 accredited. Grab samples were sawed in half and analyzed for gold by 30g Fire Assay / Atomic Absorption Spectrophotometry ("AAS"). Overlimit gold values were quantified using gravimetric methods.
Taranis currently has 102,421,487 shares issued and outstanding (119,972,613 shares on a fully-diluted basis).
TARANIS RESOURCES INC.Per: John J. Gardiner (P. Geo.), President and CEO
For further information contact:John J. Gardiner681 Conifer LaneEstes Park, Colorado 80517Cell: (720) 209-3049johnjgardiner@earthlink.net
NEITHER THE TSX VENTURE EXCHANGE NOR ITS REGULATION SERVICES PROVIDER (AS THAT TERM IS DEFINED IN THE POLICIES OF THE TSX VENTURE EXCHANGE) ACCEPTS RESPONSIBILITY FOR THE ADEQUACY OR ACCURACY OF THIS NEWS RELEASE.
This News Release may contain forward-looking statements based on assumptions and judgments of management regarding future events or results that may prove to be inaccurate as a result of factors beyond its control, and actual results may differ materially from expected results.
SOURCE: Taranis Resources, Inc.
View the original press release on ACCESS Newswire
Freeport-McMoRan Inc. FCX is slated to report fourth-quarter 2025 results before the opening bell on Jan. 22. While higher unit costs and weaker volumes are likely to have impacted FCX’s performance, it is expected to have benefited from favorable copper prices.The Zacks Consensus Estimate for fourth-quarter earnings has been revised upward in the past 60 days. The consensus estimate for earnings is pegged at 28 cents per share, suggesting a 9.7% year-over-year decline. The Zacks Consensus Estimate for revenues currently stands at $5.05 billion, indicating a 11.7% decline on a year-over-year basis.
Zacks Investment Research
Image Source: Zacks Investment Research
FCX beat the Zacks Consensus Estimate for earnings in three of the last four quarters and reported in-line results once. It has a trailing four-quarter earnings surprise of 17.1% on average.
Zacks Investment Research
Image Source: Zacks Investment Research
Q4 Earnings Whispers for FCX Stock
Our proven model predicts an earnings beat for FCX this time around. The combination of a positive Earnings ESP and a Zacks Rank #1 (Strong Buy), 2 (Buy) or 3 (Hold) increases the chances of an earnings beat. You can uncover the best stocks to buy or sell before they’re reported with our Earnings ESP Filter. That is just the case here.FCX has an Earnings ESP of +6.05% and a Zacks Rank #3. You can see the complete list of today’s Zacks #1 Rank stocks here.
Factors Shaping FCX’s Q4 Results
Freeport’s fourth-quarter results are expected to have reflected favorable copper prices. Prices of copper have been volatile yet mostly favorable last year due to global economic and trade uncertainties. COMEX copper, for the most part, remained above $5 per pound in the fourth quarter of 2025 and gained around 18% in the quarter. Copper prices have gained momentum this year, underpinned by robust demand from China and the United States. Structural tailwinds, including electric vehicles (EVs), renewable energy projects, data-center growth and grid modernization, continue to boost copper consumption. Meanwhile, worries about tightening supply amid rising EV and infrastructure demand have lifted the red metal. Supply risks have also grown amid worries over lower output and potential disruptions at major global mining operations. Prices of the red metal are currently hovering near $6 per pound. Our estimate for the fourth-quarter average realized copper price for FCX is $4.75 per pound, which indicates a year-over-year rise of 14.5%.FCX’s results are likely to have been unfavorably impacted by lower sales volumes due to the Grasberg mine incident. Freeport’s outlook for copper sales volumes in the fourth quarter assumes minimal contribution from its Indonesian operations due to the mine incident. FCX expects copper sales volumes of 635 million pounds, indicating a 35% sequential and a 36% year-over-year decline. The company has also issued weaker guidance for gold sales volume of 60,000 ounces, suggesting significant sequential and year-over-year decreases. Lower sales volumes are expected to have weighed on its top line in the fourth quarter.Higher unit costs are also likely to have affected the company’s performance in the December quarter. FCX saw an increase in its average unit net cash cost per pound of copper in the third quarter of 2025 to $1.40 from $1.13 in the prior quarter, marking a roughly 24% spike. The increase was fueled by a decline in copper sales volumes. Lower expected sales volumes are likely to have led to higher costs in the fourth quarter. Higher costs are likely to weigh on the company's margins.
FCX Stock’s Price Performance and Valuation
FCX’s shares have gained 45.7% in a year, underperforming the Zacks Mining – Non Ferrous industry’s 62.4% rise and the S&P 500’s increase of 17.3%. Its peers, Southern Copper Corporation SCCO and BHP Group Limited BHP, have rallied 83.4% and 29.4%, respectively, over the same period.
FCX’s One-year Price PerformanceZacks Investment Research
Image Source: Zacks Investment Research
From a valuation standpoint, Freeport is currently trading at a forward 12-month earnings multiple of 25.3X, a roughly 1.1% premium to the peer group average of 25.02X. FCX is trading at a premium to BHP Group and at a discount to Southern Copper. Freeport currently has a Value Score of B. BHP Group has a Value Score of C, while Southern Copper has a Value Score of D.
FCX’s P/E F12M Vs. Industry, SCCO & BHPZacks Investment Research
Image Source: Zacks Investment Research
Investment Thesis for FCX Stock
Freeport is well-placed with high-quality copper assets and remains focused on strong execution and advancing its organic growth opportunities. It is expected to gain from progress in exploration activities that will boost production capacity. FCX also has a strong liquidity position and generates substantial cash flows, which allow it to finance its growth projects, pay down debt and drive shareholder value. Backed by strong financial health, the company's dividend is perceived to be safe and reliable. The strength in copper prices should also support its profitability and drive cash flow generation. Freeport, however, faces headwinds from higher costs, which may eat into its margins. Weaker copper volumes due to the Grasberg mine incident are also likely to weigh on its performance.
Final Thoughts: Hold Onto FCX Shares
FCX is poised to gain from progress in expansion activities that will boost production capacity. Robust financial health allows FCX to invest in growth projects and drive shareholder value. Despite these positives, a weaker sales volume outlook and higher expected unit costs warrant caution. Holding onto the FCX stock will be prudent for investors who already own it, awaiting more clarity on the company’s prospects following its forthcoming earnings release.
Want the latest recommendations from Zacks Investment Research? Today, you can download 7 Best Stocks for the Next 30 Days. Click to get this free report
Freeport-McMoRan Inc. (FCX) : Free Stock Analysis Report
BHP Group Limited Sponsored ADR (BHP) : Free Stock Analysis Report
Southern Copper Corporation (SCCO) : Free Stock Analysis Report
This article originally published on Zacks Investment Research (zacks.com).
We came across a bullish thesis on Southern Copper Corporation on X.com by @TheValueist. In this article, we will summarize the bulls’ thesis on SCCO. Southern Copper Corporation's share was trading at $174.37 as of January 13th. SCCO’s trailing and forward P/E were 37.65 and 34.84 respectively according to Yahoo Finance.
Karpenkov Denis/Shutterstock.com
Southern Copper Corporation (SCCO) represents a uniquely positioned, high-quality copper producer with vertically integrated operations in Peru and Mexico, combining large-scale open-pit mining with smelting and refining capabilities. The company benefits from a multi-decade reserve base of over 112 billion pounds of copper, supporting a robust growth pipeline anchored by projects like Tia Maria, Los Chancas, Michiquillay, and El Arco.
Its product mix is copper-dominant but strategically leverages byproducts such as zinc, silver, and molybdenum, which in Q3 2025 drove net cash costs down to $0.42/lb, substantially below peer levels, highlighting SCCO’s low-cost, high-margin profile. Despite a temporary decline in copper production, record EBITDA of $1.975 billion and net income of $1.108 billion underscore the company’s resilience and price leverage in a tight global copper market. Strategic decisions, such as prioritizing zinc and silver output at Buenavista, demonstrate operational flexibility to maximize value per tonne of ore rather than just copper tonnage, stabilizing short-term profitability.
While the near-term production trajectory is a trough in 2026–2027, the ramp-up from 2028 onwards, driven by Tia Maria and other large-scale projects, provides a compelling multi-year growth bridge. SCCO’s strong cash flow generation supports an attractive dividend yield, and management’s long-tenured operating experience, coupled with active bench development, provides continuity and execution credibility.
Although minority investors face structural governance and related-party risks, the combination of low-cost production, high byproduct leverage, and a visible growth pipeline positions SCCO for substantial upside should commodity prices remain elevated and project execution proceed smoothly. With net debt under control and capital allocation disciplined, SCCO offers a bullish risk/reward profile, making it an attractive investment for those seeking premium copper exposure with high operational resilience.
Previously, we covered a bullish thesis on Hudbay Minerals Inc. (HBM) by Unemployed Value Degen in December 2024, which highlighted HBM’s operational efficiency, copper and gold diversification, and disciplined capital allocation. HBM’s stock price has appreciated by 152.63% since our coverage due to stable commodity prices and debt reduction. TheValueist shares a similar bullish view on Southern Copper Corporation (SCCO) but emphasizes SCCO’s scale, vertical integration, byproduct-driven low costs, and long-term growth pipeline.
Southern Copper Corporation is not on our list of the 30 Most Popular Stocks Among Hedge Funds. As per our database, 36 hedge fund portfolios held SCCO at the end of the third quarter which was 45 in the previous quarter. While we acknowledge the potential of SCCO as an investment, we believe certain AI stocks offer greater upside potential and carry less downside risk. If you're looking for an extremely undervalued AI stock that also stands to benefit significantly from Trump-era tariffs and the onshoring trend, see our free report on the best short-term AI stock.
READ NEXT: 30 Stocks That Should Double in 3 Years and 11 Hidden AI Stocks to Buy NOW
Disclosure: None.
Goliath Resources (GOT.V) reported Tuesday the latest high-grade intersections from the 2025 drill campaign at the Surebet discovery within its Golddigger property in British Columbia.
Assays include 19.13 grams per ton gold over 6.10 meters and 10.58 g/t gold over 8.30 m.
The company said its drilling significantly expanded the extent of gold mineralization in all five main zones, which remain open.
Goliath said it is awaiting gold equivalent results from the final 110 drill holes of the program.
"The Surebet high-grade gold discovery continues to grow during every new season of drilling," founder and chief executive officer Roger Rosmus said.
The company said its 2026 drill program will mainly focus on expanding the five main mineralized zones.
"We are in the best financial position the company has ever been in as we are fully funded for our 2026 drilling campaign and are looking forward to expanding on the tremendous Surebet high-grade gold discovery," Rosmus said.
At Surebet, 110 Holes From 2025 Are Pending Assays For Gold Equivalent Results
Infographic 1
Infographic 1
Infographic 2
Infographic 2
Infographic 3
Infographic 3
Infographic 4
Infographic 4
Infographic 5
Infographic 5
Infographic 6
Infographic 6
Infographic 7
Infographic 7
Infographic 8
Infographic 8
Infographic 9
Infographic 9
Infographic 10
Infographic 10
Infographic 11
Infographic 11
Infographic 12
Infographic 12
Infographic 13
Infographic 13
Infographic 14
Infographic 14
Infographic 15
Infographic 15
Infographic 16
Infographic 16
Infographic 17
Infographic 17
Infographic 18
Infographic 18
- This news release includes the final 70 holes completed during the 2025 drilling campaign that were assayed for Gold Only. Assays are still pending for 110 drill holes from 2025 for multi-element gold equivalent (AuEq) results. These results will be released in the near future once all assays have been received, compiled and interpreted.
- 100% of the drill holes completed to date, have all intersected gold mineralization clearly demonstrating the remarkable continuity, grades, and widths in 5 Main Gold-Rich Zones comprising 46 mineralized lodes that remain open for expansion.
- Of the holes drilled during the 2025 campaign, 83 out of 110 holes (or 76%) contained visible gold to the naked eye (VG-NE).
- The fully funded 2026 drill program will be mainly focused on expanding the 5 Main Mineralized Zones. Data compilation and interpretation is underway which will be used to vector in on the indicated Motherlode causative intrusive source to this extensive high grade gold system with widespread VG-NE.
DRILL HIGHLIGHTS:
All intercepts below are approximately true width, and these assays reflect gold only (The gold equivalent (AuEq) values in all 110 drill hole intervals will be adjusted accordingly and announced, once the Silver, Copper, Lead and Zinc values are received, compiled and interpreted):
GD-25-319
- Drill hole GD-25-319 intersected 19.13 g/t Au over 6.10 meters, including 22.86 g/t Au over 5.10 meters, including 29.09 g/t Au over 4.00 meters in quartz-sulphide veins, part of the Golden Gate Zone, containing multiple occurrences of gold visible to the naked eye (VG-NE); see image below.
- An accompanying infographic is available at: https://www.globenewswire.com/NewsRoom/AttachmentNg/d53fca16-084f-4c73-b55d-cc763f7dc1cf
GD-25-405
- Drill hole GD-25-405 intersected 10.58 g/t Au over 8.30 meters, including 14.04 g/t Au over 6.25 meters including 15.50 g/t Au over 5.60 meters from a quartz-sulphide breccia, part of the Bonanza Zone, containing multiple occurrences of VG-NE; see image below.
- Additional intervals include 3.25 meters of 2.47 g/t Au in quartz-sulphide veins part of the Surebet Zone.
- An accompanying infographic is available at: https://www.globenewswire.com/NewsRoom/AttachmentNg/8720c217-d2a4-43f9-a325-fd23e851781e
GD-25-312
- Drill hole GD-25-312 intersected 10.56 g/t Au over 3.70 meters from a gold-rich quartz-sulphide breccia interval, part of the Surebet Zone; see image below.
- An accompanying infographic is available at: https://www.globenewswire.com/NewsRoom/AttachmentNg/75322c0e-33ed-4b26-af06-9266777a064d
GD-25-345
- Drill hole GD-25-345 intersected 4.47 g/t Au over 6.00 meters including 6.68 g/t Au over 4.00 meters, including 7.93 g/t Au over 3.36 meters from a series of quartz-sulphide veins, part of the Golden Gate Zone, containing multiple occurrences of VG-NE as well as semi-massive to massive sphalerite and pyrrhotite; see image below.
- Additional separate intervals include 3.92 g/t Au over 3.79 meters part of the Whopper Zone and 3.83 g/t Au over 3.78 meters.
- An accompanying infographic is available at:https://www.globenewswire.com/NewsRoom/AttachmentNg/c1952d21-c3bf-49bd-9244-ea34a64454ae
GD-25-330
- Drill hole GD-25-330 intersected 7.48 g/t Au over 3.55 meters from an interval with quartz-sulphide veins, part of the Golden Gate Zone, containing VG-NE; see image below.
- An accompanying infographic is available at: https://www.globenewswire.com/NewsRoom/AttachmentNg/21f04898-eb56-495f-90d0-01b60a3c42fa
GD-25-326
- Drill hole GD-25-326 intersected 8.57 g/t Au over 3.00 meters from a quartz-sulphide vein and breccia interval part of the Surebet Zone; see image below.
- An accompanying infographic is available at: https://www.globenewswire.com/NewsRoom/AttachmentNg/e6116782-0b51-4ab5-8419-85e4e9608a48
GD-25-401
- Drill hole GD-25-401 intersected 4.89 g/t Au over 5.00 meters, within 2.96 g/t Au over 8.89 meters, part of the Surebet Zone, from a brecciated and strongly calc-silicate altered section; see image below.
- Additional intervals include 3.0 g/t Au over 4.11 meters part of the Surebet Zone, as well as 2.4 g/t Au over 3.1 meters, part of the Golden Gate Zone.
- An accompanying infographic is available at:https://www.globenewswire.com/NewsRoom/AttachmentNg/dcc469ca-c7a9-43fe-84c9-730be45980b6
GD-25-349
- Drill hole GD-25-349 intersected 5.50 g/t Au over 4.00 meters, including 7.34 g/t Au over 3.00 meters from a series of quartz-sulphide veins, part of the Bonanza Zone; see image below.
- An accompanying infographic is available at:https://www.globenewswire.com/NewsRoom/AttachmentNg/14b248cf-d785-433a-a3d0-1a7f60a87902
GD-25-367
- Drill hole GD-25-367 intersected 7.10 g/t Au over 3.00 meters from an interval of quartz-sulphide veining, part of the Golden Gate Zone, containing multiple occurrences of VG-NE; see image below.
- Three accompanying infographics are available at:https://www.globenewswire.com/NewsRoom/AttachmentNg/185756f2-4751-492d-8214-1e0fba442757https://www.globenewswire.com/NewsRoom/AttachmentNg/96889faf-4590-4dea-b065-d53b13f46558https://www.globenewswire.com/NewsRoom/AttachmentNg/7c9c67d8-b016-4419-a0de-63d0ffb0caea
- Assay results from the recently completed 64,364 meters of drilling have significantly expanded the extent of the high-grade gold mineralization at the Surebet Discovery that remains open for expansion laterally and at depth. The updated model for the Surebet system, which includes all the 2025 gold assay results, consists of 5 extensive mineralized zones comprising 46 gold-rich lodes as well as gold-rich Eocene-aged RIRG dykes:
- The Bonanza Zone has a strike of 1.8 km NW-SE and 1.1 km NE-SW containing 5 lodes up to 19 meters thick with a combined thickness of up to 27 meters and intercepts up to 13.53 g/t AuEq (12.10 g/t Au and 54.13 g/t Ag) over 11.00 meters (drill hole GD-22-100) and remains open for expansion.
- An accompanying infographic is available at: https://www.globenewswire.com/NewsRoom/AttachmentNg/33eb4b9c-9f92-45d4-b243-7e7879570957
- The Bonanza Zone has a strike of 1.8 km NW-SE and 1.1 km NE-SW containing 5 lodes up to 19 meters thick with a combined thickness of up to 27 meters and intercepts up to 13.53 g/t AuEq (12.10 g/t Au and 54.13 g/t Ag) over 11.00 meters (drill hole GD-22-100) and remains open for expansion.
-
- The Surebet Zone has a strike of 1.2 km NW-SE and 930 meters NE-SW containing 9 lodes up to 19 meters thick with a combined thickness of up to 30 meters and intercepts up to 21.08 g/t AuEq (18.95 g/t Au and 95.31 g/t Ag) over 23.00 m (drill hole GD-23-157) and remains open for expansion to the SW.
- An accompanying infographic is available at: https://www.globenewswire.com/NewsRoom/AttachmentNg/1ca40f5d-7221-4f92-94b8-d12e6bc5510c
- The Golden Gate Zone has a strike of 1.3 km E-W and 820 meters N-S containing 18 lodes up to 14 meters with a combined thickness of up to 49 meters and with intercepts up to 34.52 g/t AuEq (34.47 g/t Au and 3.96 g/t Ag) over 39.00 m (drill hole GD-24-260) and remains open for expansion.
- An accompanying infographic is available at: https://www.globenewswire.com/NewsRoom/AttachmentNg/a9a1d076-f66d-402c-98f9-bf75f159f738
- The Whopper Zone has a strike of 800 meters N-S and 450 meters E-W containing 12 lodes up to 6 meters thick with a combined thickness of up to 30 meters and intercepts up to 32.67 g/t AuEq (32.56 g/t Au and 8.92 g/t Ag) over 4.00 m (drill hole GD-24-262) and remains open for expansion.
- An accompanying infographic is available at: https://www.globenewswire.com/NewsRoom/AttachmentNg/b957c9e3-1419-42e7-9f52-a7a6f109c725
- The Surebet Zone has a strike of 1.2 km NW-SE and 930 meters NE-SW containing 9 lodes up to 19 meters thick with a combined thickness of up to 30 meters and intercepts up to 21.08 g/t AuEq (18.95 g/t Au and 95.31 g/t Ag) over 23.00 m (drill hole GD-23-157) and remains open for expansion to the SW.
-
- The Eldorado Zone has a strike of 680 meters E-W and 700 meters N-S containing 2 lodes up to 5 meters thick with a combined thickness of up to 7 meters and intercepts up to 7.91 g/t AuEq (7.44 g/t Au and 22.40 g/t Ag) over 7.15 m (drill hole GD-23-221) and remains open for expansion.
- An accompanying infographic is available at: https://www.globenewswire.com/NewsRoom/AttachmentNg/7c82f75a-f5c4-4396-a6b9-5fee42d08602
- The gold-rich Eocene-aged dykes extend for up to 1.4 km N-S and a vertical relief of up to 890 meters with widths up to 25 meters and intercepts up to 12.03 g/t AuEq (11.84 g/t Au and 15.61 g/t Ag) over 10.00 meters (drill hole GD-22-58) and remain open for expansion.
- An accompanying infographic is available at:https://www.globenewswire.com/NewsRoom/AttachmentNg/7c731f15-97e6-44f5-8017-e81c063d77a7
- The Eldorado Zone has a strike of 680 meters E-W and 700 meters N-S containing 2 lodes up to 5 meters thick with a combined thickness of up to 7 meters and intercepts up to 7.91 g/t AuEq (7.44 g/t Au and 22.40 g/t Ag) over 7.15 m (drill hole GD-23-221) and remains open for expansion.
UPDATED 3D MODEL VIDEO (CLICK HERE)
- 100% of the drill holes completed to date on the Surebet Discovery have intersected substantial quartz-sulphide mineralization. In 2025, VG-NE was observed in 83 drill holes out of 110 (or 76%).
- 355 out of 386 representing 92% drilled to date at the Surebet Discovery contain VG-NE (see heat map below).
- An accompanying infographic is available at:https://www.globenewswire.com/NewsRoom/AttachmentNg/df7e0fc8-3add-4db6-906c-26d54f8bfeed
- The remarkable continuity, widths and grades demonstrated by drilling in multiple lodes shows this extensive 1.8 km2 gold system continues to demonstrate strong potential to become one of the most significant gold discoveries in British Columbia’s Golden Triangle in many years. The strong results received to date will help vector in on drilling targets that remain open with excellent expansion potential.
- High-grade gold has been identified in three distinct rock packages discovered to date at the Surebet Discovery. This includes the gently dipping gold-rich stacked quartz-sulphide breccias/stockwork veins; the gold-rich intermediate to felsic Eocene-aged dykes; and the recently discovered broad gold-rich zones of calc-silicate altered breccia. All mineralized rock types contain substantial amounts of VG-NE (from fine-grained to coarse-grained gold) and remain open for expansion. This confirms the presence of a Motherlode magmatic source nearby, a causative intrusion responsible for the extensive 1.8 km2 high-grade gold system at Surebet.
TORONTO, Jan. 20, 2026 (GLOBE NEWSWIRE) — Goliath Resources Limited (TSX-V: GOT) (OTCQB: GOTRF) (FSE: B4IF) (the “Company” or “Goliath”) is pleased to report assay results (gold only) for the remaining holes from the 2025 drill campaign at the Surebet Discovery on its 100% controlled Golddigger Property (the “Property”), Golden Triangle, British Columbia. Highlights include drill hole GD-25-319 which intersected 19.13 g/t Au over 6.10 meters as well as drill hole GD-25-405 which intersected 10.58 g/t Au over 8.30 meters. Every drill hole completed so far, including all 110 holes from the 2025 season, has successfully intersected gold mineralization. These results confirm predictable continuity, grade, and width across 5 Gold-Rich Zones and 46 Distinct Lodes, all of which remain open for expansion. The fully funded 2026 drill program will focus on expanding the 5 Main Mineralized Zones, testing the Motherlode causative intrusive source, and build toward a future resource.
Dr. Quinton Hennigh, Geologic & Technical Advisor to Crescat Capital, a strategic investor in Goliath, states: “The consistent reporting of thick high-grade gold intercepts from Surebet is remarkable. Yet again, we see in this news release several more holes that demonstrate the strong predictability of this lode system. Visible gold in core consistently delivers strong assays. While we have to remain patient to see the gold equivalent results from the final 110 drill holes, the confidence around the continuity of these lodes, their thickness and grade is growing with every release. Goliath is doing a great job to continually update the geologic model, with the assistance from the Colorado School of Mines, to show the remarkable Surebet gold discovery.”
Mr. Roger Rosmus, Founder & CEO of Goliath states: “The Surebet high-grade gold discovery continues to grow during every new season of drilling. To date, we have discovered a series of stacked gently dipping high-grade gold veins analogous to the Pogo mine in Alaska. In addition, we have started to drill into a series of vertical Eocene-aged RIRG dykes were emplaced roughly the same as the stack veins. We have yet to find the limits of the stacked veins and RIRG dykes, which all remain open, or the source of where they come from, but we are excited about using them to vector into the Motherlode source. What is outstanding about the various high-grade gold mineralization is the vast distribution VG-NE over a large area, which makes the Surebet discovery unique. Another intriguing aspect of the VG-NE is that at the top of the system it is fine-grained and sporadic and as we drill deeper into the system it becomes abundant and course-grained. Which has us excited about following it toward the source. We have two sets of stacked veins (the Surebet series and Bonanza series) that dip in opposite directions but come together at the Hinge Zone. It is becoming clearer, especially through our 2025 drilling campaign, that the Hinge Zone has the potential to be a starter zone for underground high-grade gold bulk mining. Our team, including key people at the Colorado School of Mines, are excited about the advanced geological studies to help us prepare for the 2026 drilling season. We are in the best financial position the company has ever been in as we are fully funded for our 2026 drilling campaign and are looking forward to expanding on the tremendous Surebet high-grade gold discovery.”
Assay results from the recently concluded 64,364-meter drill program have significantly expanded the high-grade footprint of the Surebet Discovery, which remains open for further growth. An updated geological model incorporating all 2025 data identifies 5 primary mineralized Zones: Bonanza, Surebet, Golden Gate, Whopper, and Eldorado. Collectively these Zones comprise 46 gold-rich lodes and associated Eocene-aged RIRG dykes.
Table 1: Five main modelled gold rich zones and dykes.
| Zone | Number of lodes | Dimensions | Key Intercept | Status |
| Bonanza | 5 | 1.8 km x 1.1 km x 19 m | 13.53 g/t AuEq over 11 m | Remains Open |
| Surebet | 9 | 1.2 km x 930 m x 19 m | 21.08 g/t AuEq over 23 m | Remains Open |
| Golden Gate | 18 | 1.3 km x 820 m x 14 m | 34.52 g/t AuEq over 39 m | Remains Open |
| Whopper | 12 | 800 m x 450 m x 6 m | 32.67 g/t AuEq over 4 m | Remains Open |
| Eldorado | 2 | 680 m x 700 m x 5 m | 7.91 g/t AuEq over 7.15 m | Remains Open |
| Gold-rich dykes | 1.4 km x 890 m x 25 m | 12.03 g/t AuEq over 10 m | Remains Open |
Reported assay results from the 2025 drill campaign have yielded several high-grade gold intercepts across the Golden Gate, Bonanza, and Surebet Zones, characterized by frequent occurrences of VG-NE, as well as substantial sulphide mineralization. Highlights include drill hole GD-25-319 which intersected 19.13 g/t Au over 6.10 meters, including 22.86 g/t Au over 5.10 meters, including 29.09 g/t Au over 4.00 meters from the Golden Gate Zone. Drill hole GD-25-405 which intersected 10.58 g/t Au over 8.30 meters, including 14.04 g/t Au over 6.25 meters including 15.50 g/t Au over 5.60 meters from the Bonanza Zone, and drill hole GD-25-312 which intersected 10.56 g/t Au over 3.70 meters from the Surebet Zone. The gold grades, coupled with VG-NE within substantial quartz-sulphide veins, stockworks, and breccias, which are mineralized with sphalerite, pyrrhotite, and chalcopyrite, highlight the potential for further expansion. These intercepts are approximately true width, and the assays reflect gold only. Multi-element gold equivalent grades for all drill holes will be released once all assays have been received, compiled and interpreted in the near future. See Table 2 below for a full list of assay results for all the remaining holes of the 2025 drill campaign.
High-grade gold has been identified in three distinct rock packages discovered to date at the Surebet Discovery. This includes the gently dipping gold-rich stacked quartz-sulphide breccias/stockwork veins; the gold-rich intermediate to felsic gold-Rich dykes; and the recently discovered broad gold-rich zones of calc-silicate altered breccia. All mineralized rock types contain substantial amounts of VG-NE (from fine-grained to coarse-grained gold) and remain open for expansion. This confirms the presence of a Motherlode magmatic source nearby, a causative intrusion responsible for the extensive 1.8 km2 high-grade gold system at Surebet.
The remarkable continuity, widths and grades encountered across multiple lodes underscore the significance of this 1.8 km2 gold system which has strong potential to become one of the most significant gold discoveries in British Columbia’s Golden Triangle in many years. Success to date has effectively vectored toward several open targets, providing a strong foundation for further expansion in the 2026 drilling campaign.
Surebet Discovery Highlights
- Assay results are still pending for 110 holes from the 2025 exploration campaign for the gold equivalent (AuEq) values, that will be announced once received, compiled and interpreted.
- 83 out of 110 holes (or 76%) drilled in 2025 contain VG-NE, 100% of holes drilled to date at the Surebet Discovery have intersected substantial quartz-sulphide mineralization. See news releases dated: November 17, 2025, October 27, 2025, September 22, 2025, September 8, 2025, August 26, 2025, and July 28, 2025.
- 60 out of 64 holes (or 94%) drilled in 2024 contain VG-NE up to 11.5 mm (7/16 inches) in size, all of which returned high-grade gold. See news releases dated: July 7, 2025, June 23, 2025, January 7, 2025, January 13, 2025, February 10, 2025, February 18, 2025, February 27, 2025, December 12, 2024 and July 30, 2024.
- 92% of the holes (355 out of 386) drilled to date at Surebet contain VG-NE (see heat map above).
- The best hole drilled to date is GD-24-260 previously reported from the Bonanza Zone assayed 34.52 g/t AuEq (34.47 Au and 3.96 Ag) over 39.00 meters, including 132.93 g/t AuEq (132.78 Au and 12.98 Ag) over 10.00 meters, and 166.04 g/t AuEq (165.84 Au and 16.07 Ag) over 8.00 meters (see news release dated January 13, 2025). ). More details on the QA/QC protocol can be found in the section titled “QA/QC Protocol” below.
- The best hole drilled to date from the RIRG Eocene-aged dykes is GD-22-58 that assayed 12.03 g/t AuEq (11.84 g/t Au and 15.61 g/t Ag) over 10.00 meters including 19.91 g/t AuEq (19.62 g/t Au and 25.61 g/t Ag) over 6.00 meters, including 23.82 g/t AuEq (23.47 g/t Au and 30.54 g/t Ag) over 5.00 meters, plus a second separate interval down hole of 8.59 g/t AuEq (8.35 g/t Au and 20.74 g/t Ag) over 5.00 meters (see news release dated March 13, 2025). ). More details on the QA/QC protocol can be found in the section titled “QA/QC Protocol” below.
- The best hole drilled to date from the third distinct rock package consisting of calc-silicate altered breccia is drill hole GD-25-337, which intersected 10.60 g/t Au over 22.82 meters, including 15.19 g/t Au over 15.71 meters, including two separate intervals consisting of 37.28 g/t Au or 1.20 oz/t Au over 3.36 meters and 36.11 or 1.16 oz/t Au over 3.08 meters. The intercept is approximately true width, and these assays reflect gold only (AuEq value in the interval will be adjusted accordingly once Ag, Cu, Pb and Zn are received and interpreted). More details on the QA/QC protocol can be found in the section titled “QA/QC Protocol” below.
- Multiple gently dipping gold-mineralized stacked veins have been identified every year on the Surebet high-grade gold discovery. Recent discoveries include gold-rich RIRG dykes, Goldilocks Zones where the veins and vertical dykes crosscut (which are characterized by having high-grade gold in two temperature regimes) and recently discovered high-grade gold in a third distinct rock package characterized by calc-silicate altered breccia, which increases potential tonnage and gold content of the high-grade gold system at the Surebet Discovery.
- The footprint of the mineralization discovered to date at Surebet is 1.8 km2 and remains open in all directions.
- Thanks to the mountainous topography, mineralization in the veins is exposed on the surface for 2.1 km of strike (1.0 km on the south slope and 1.1 km on the north slope) with a vertical relief of 700 meters.
- A study completed by the Colorado School of Mines confirms a new interpretation of the ore forming process of high-grade gold mineralization at Surebet and outlines a common magmatic source for the high-grade gold system, now in three distinct rock packages. Which gives the Surebet untapped discovery potential to increase tonnage and gold content in the various known rock packages. Until this study, researchers and explorers in the Golden Triangle had not recognized the high-grade gold discovery potential in the Eocene-aged RIRG dykes (see news release March 13, 2025), which is showing the potential that these discoveries could be a geological breakthrough in the Golden Triangle of British Columbia.
- Goliath has drilled over 156,000 meters with over 600 pierce points in the Surebet Discovery located at the Golddigger property between 2021 and 2025.
- The Surebet Discovery has predictable continuity and good metallurgy with gold recoveries of 92.2% from gravity and flotation at a 327-micrometer crush including 48.8% free gold recovery from gravity alone (no cyanide required to recover the gold). The metallurgy completed to date shows a benign rock composition without deleterious elements (see news release March 1, 2023).
- Based on positive grassroots exploration and drill results in recent years, Goliath significantly increased its land package from 66,608 hectares to 91,518 hectares (226,146 acres) and now controls 56 kilometers of key terrain of the Red Line geologic trend providing for additional discovery potential.
- The Golddigger Property is located on tidewater with a barge route to Prince Rupert (190 km south) and close to infrastructure including the town of Kitsault adjacent to a permitted mine site on private property.
Table 2: Gold-only assay results from remaining 70 drill holes from 2025.
| Hole ID | From (m) | To (m) | Interval (m) | Au (g/t) | |
| GD-25-319 | Interval | 484.00 | 487.00 | 3.00 | 1.90 |
| Interval | 485.00 | 486.00 | 1.00 | 5.65 | |
| Interval | 510.00 | 527.00 | 17.00 | 1.07 | |
| Including | 510.00 | 523.00 | 13.00 | 1.31 | |
| Including | 516.05 | 523.00 | 6.95 | 1.97 | |
| Including | 516.05 | 522.10 | 6.05 | 2.23 | |
| Interval | 564.10 | 570.20 | 6.10 | 19.13 | |
| Including | 565.10 | 570.20 | 5.10 | 22.86 | |
| Including | 565.10 | 569.10 | 4.00 | 29.09 | |
| GD-25-405 | Interval | 84.00 | 87.25 | 3.25 | 2.47 |
| Interval | 165.70 | 174.00 | 8.30 | 10.58 | |
| including | 166.75 | 173.00 | 6.25 | 14.04 | |
| including | 166.75 | 172.35 | 5.60 | 15.50 | |
| including | 166.75 | 170.50 | 3.75 | 21.09 | |
| GD-25-312 | Interval | 390.30 | 394.00 | 3.70 | 10.56 |
| GD-25-345 | Interval | 3.09 | 6.87 | 3.78 | 3.83 |
| Interval | 354.36 | 358.15 | 3.79 | 3.92 | |
| Interval | 615.00 | 621.00 | 6.00 | 4.47 | |
| including | 616.00 | 620.00 | 4.00 | 6.68 | |
| including | 616.00 | 619.36 | 3.36 | 7.93 | |
| GD-25-330 | Interval | 533.00 | 536.55 | 3.55 | 7.48 |
| Interval | 534.14 | 535.48 | 1.34 | 19.51 | |
| GD-25-326 | Interval | 299.00 | 302.00 | 3.00 | 8.57 |
| GD-25-401 | Interval | 38.07 | 46.96 | 8.89 | 2.96 |
| including | 39.00 | 44.00 | 5.00 | 4.89 | |
| Interval | 57.00 | 61.11 | 4.11 | 3.00 | |
| including | 57.00 | 60.00 | 3.00 | 3.41 | |
| Interval | 431.75 | 434.85 | 3.10 | 2.40 | |
| GD-25-349 | Interval | 85.00 | 89.00 | 4.00 | 5.50 |
| Including | 86.00 | 89.00 | 3.00 | 7.34 | |
| Interval | 95.38 | 99.00 | 3.62 | 1.11 | |
| GD-25-367 | Interval | 388.00 | 393.00 | 5.00 | 2.69 |
| Interval | 523.00 | 526.00 | 3.00 | 7.10 | |
| GD-25-407 | Interval | 253.83 | 257.09 | 3.26 | 5.85 |
| GD-25-395 | Interval | 302.00 | 319.00 | 17.00 | 1.11 |
| Including | 306.00 | 318.00 | 12.00 | 1.51 | |
| Including | 309.49 | 316.15 | 6.66 | 2.16 | |
| Including | 311.90 | 316.15 | 4.25 | 3.03 | |
| GD-25-332 | Interval | 416.00 | 422.00 | 6.00 | 3.02 |
| including | 417.00 | 421.00 | 4.00 | 4.49 | |
| including | 417.00 | 420.00 | 3.00 | 5.90 | |
| GD-25-389 | Interval | 125.00 | 135.00 | 10.00 | 1.16 |
| including | 125.90 | 129.00 | 3.10 | 2.43 | |
| Interval | 155.00 | 163.00 | 8.00 | 1.83 | |
| including | 159.00 | 162.00 | 3.00 | 4.62 | |
| GD-25-393 | Interval | 385.00 | 390.00 | 5.00 | 3.78 |
| Including | 386.80 | 390.00 | 3.20 | 5.89 | |
| GD-25-382 | Interval | 4.73 | 16.00 | 11.27 | 1.44 |
| Including | 7.00 | 16.00 | 9.00 | 1.72 | |
| Including | 10.00 | 16.00 | 6.00 | 2.41 | |
| Including | 10.00 | 14.00 | 4.00 | 3.13 | |
| Interval | 65.00 | 71.00 | 6.00 | 1.05 | |
| Including | 66.00 | 70.00 | 4.00 | 1.56 | |
| Interval | 99.11 | 103.00 | 3.89 | 1.48 | |
| GD-25-396 | Interval | 127.15 | 130.97 | 3.82 | 4.01 |
| including | 244.00 | 247.19 | 3.19 | 2.47 | |
| GD-25-305 | Interval | 259.03 | 263.00 | 3.97 | 2.51 |
| Interval | 547.53 | 553.00 | 5.47 | 1.25 | |
| Including | 547.53 | 550.85 | 3.32 | 1.69 | |
| Interval | 585.00 | 596.00 | 11.00 | 1.30 | |
| Including | 588.00 | 595.02 | 7.02 | 1.93 | |
| Including | 588.00 | 592.97 | 4.97 | 2.59 | |
| Including | 589.11 | 592.97 | 3.86 | 3.27 | |
| GD-25-323 | Interval | 309.54 | 314.00 | 4.46 | 1.38 |
| Including | 310.17 | 314.00 | 3.83 | 1.59 | |
| Interval | 588.80 | 592.50 | 3.70 | 3.71 | |
| GD-25-334 | Interval | 397.00 | 408.00 | 11.00 | 1.24 |
| including | 404.00 | 407.00 | 3.00 | 3.91 | |
| GD-25-366 | Interval | 62.05 | 66.00 | 3.95 | 3.34 |
| Interval | 483.00 | 486.00 | 3.00 | 3.87 | |
| GD-25-381 | Interval | 265.00 | 269.00 | 4.00 | 3.32 |
| including | 265.00 | 268.00 | 3.00 | 4.33 | |
| GD-25-390 | Interval | 187.75 | 193.00 | 5.25 | 2.38 |
| including | 188.80 | 192.00 | 3.20 | 3.87 | |
| GD-25-335 | Interval | 236.00 | 240.00 | 4.00 | 2.79 |
| including | 236.00 | 239.00 | 3.00 | 3.71 | |
| Interval | 258.00 | 270.00 | 12.00 | 1.06 | |
| including | 262.05 | 270.00 | 7.95 | 1.32 | |
| GD-25-327 | Interval | 25.00 | 26.00 | 1.00 | 2.11 |
| Interval | 107.00 | 111.00 | 4.00 | 2.99 | |
| Including | 108.00 | 111.00 | 3.00 | 3.98 | |
| Interval | 275.00 | 282.00 | 7.00 | 1.52 | |
| Including | 276.00 | 282.00 | 6.00 | 1.77 | |
| Including | 276.00 | 281.00 | 5.00 | 2.09 | |
| Including | 277.00 | 280.00 | 3.00 | 3.12 | |
| GD-25-368 | Interval | 592.00 | 597.88 | 5.88 | 2.03 |
| Including | 592.00 | 596.69 | 4.69 | 2.54 | |
| GD-25-342 | Interval | 28.85 | 38.00 | 9.15 | 1.04 |
| Including | 31.00 | 38.00 | 7.00 | 1.25 | |
| Including | 34.00 | 38.00 | 4.00 | 1.30 | |
| Including | 35.00 | 38.00 | 3.00 | 1.66 | |
| Interval | 249.10 | 252.10 | 3.00 | 2.05 | |
| Interval | 250.25 | 251.25 | 1.00 | 6.11 | |
| GD-25-316 | Interval | 204.00 | 208.00 | 4.00 | 1.08 |
| Interval | 356.96 | 363.65 | 6.69 | 1.70 | |
| Including | 357.82 | 362.50 | 4.68 | 2.39 | |
| Interval | 365.85 | 369.00 | 3.15 | 1.24 | |
| GD-25-337 | Interval | 138.50 | 148.50 | 10.00 | 1.09 |
| Interval | 52.00 | 55.00 | 3.00 | 2.29 | |
| GD-25-375 | including | 216.21 | 220.00 | 3.79 | 2.39 |
| GD-25-363 | Interval | 313.46 | 320.00 | 6.54 | 1.63 |
| Including | 314.09 | 319.00 | 4.91 | 2.15 | |
| Including | 314.09 | 318.00 | 3.91 | 2.63 | |
| GD-25-329 | Interval | 215.91 | 224.02 | 8.11 | 1.01 |
| Including | 215.91 | 221.00 | 5.09 | 1.45 | |
| Including | 215.91 | 219.00 | 3.09 | 1.91 | |
| Interval | 317.00 | 322.12 | 5.12 | 1.95 | |
| Including | 317.00 | 321.00 | 4.00 | 2.49 | |
| Including | 318.00 | 321.00 | 3.00 | 3.29 | |
| GD-25-357 | Interval | 215.00 | 223.00 | 8.00 | 1.05 |
| Including | 217.00 | 223.00 | 6.00 | 1.26 | |
| Interval | 347.00 | 350.00 | 3.00 | 2.26 | |
| Interval | 348.00 | 349.00 | 1.00 | 6.72 | |
| GD-25-308 | Interval | 335.00 | 338.00 | 3.00 | 1.09 |
| Interval | 405.00 | 408.00 | 3.00 | 1.55 | |
| GD-25-301 | Interval | 301.00 | 305.00 | 4.00 | 2.26 |
| Including | 302.00 | 305.00 | 3.00 | 3.00 | |
| Interval | 415.00 | 419.00 | 4.00 | 2.47 | |
| Interval | 535.24 | 542.13 | 6.89 | 1.16 | |
| Including | 535.24 | 541.05 | 5.81 | 1.33 | |
| Including | 537.39 | 541.05 | 3.66 | 1.66 | |
| GD-25-394 | Interval | 118.00 | 121.85 | 3.85 | 1.02 |
| GD-25-403 | Interval | 254.02 | 258.00 | 3.98 | 2.35 |
| Interval | 255.00 | 256.05 | 1.05 | 8.70 | |
| GD-25-303 | Interval | 488.00 | 493.00 | 5.00 | 1.09 |
| Including | 488.00 | 491.00 | 3.00 | 1.31 | |
| Interval | 526.00 | 529.00 | 3.00 | 1.09 | |
| Interval | 532.00 | 536.04 | 4.04 | 1.21 | |
| Including | 532.00 | 535.00 | 3.00 | 1.25 | |
| GD-25-386 | Interval | 293.34 | 297.60 | 4.26 | 1.26 |
| Including | 294.38 | 297.60 | 3.22 | 1.66 | |
| Interval | 300.85 | 301.95 | 1.10 | 2.60 | |
| Including | 324.79 | 329.00 | 4.21 | 1.97 | |
| Including | 324.79 | 328.02 | 3.23 | 2.49 | |
| GD-25-352 | Interval | 338.00 | 343.00 | 5.00 | 1.74 |
| Interval | 374.00 | 377.02 | 3.02 | 1.98 | |
| Interval | 375.00 | 376.00 | 1.00 | 5.92 | |
| GD-25-351 | Interval | 418.00 | 423.00 | 5.00 | 1.44 |
| Including | 420.00 | 423.00 | 3.00 | 2.05 | |
| Interval | 511.00 | 514.00 | 3.00 | 1.79 | |
| Interval | 512.00 | 513.00 | 1.00 | 5.22 | |
| GD-25-344 | Interval | 215.82 | 220.94 | 5.12 | 1.59 |
| Including | 216.80 | 220.94 | 4.14 | 1.96 | |
| Including | 217.62 | 220.94 | 3.32 | 2.38 | |
| GD-25-399 | Interval | 58.50 | 61.50 | 3.00 | 2.71 |
| Interval | 59.00 | 60.50 | 1.50 | 5.34 | |
| GD-25-333 | Interval | 6.00 | 9.00 | 3.00 | 2.53 |
| Interval | 7.00 | 8.00 | 1.00 | 7.54 | |
| GD-25-306 | Interval | 135.00 | 141.00 | 6.00 | 1.25 |
| Including | 135.00 | 139.00 | 4.00 | 1.62 | |
| Interval | 281.70 | 282.35 | 0.65 | 1.47 | |
| GD-25-325 | Interval | 40.10 | 41.00 | 0.90 | 1.67 |
| Interval | 454.40 | 458.85 | 4.45 | 1.11 | |
| Including | 456.70 | 460.00 | 3.30 | 1.34 | |
| Interval | 576.00 | 579.00 | 3.00 | 2.44 | |
| Interval | 577.20 | 578.00 | 0.80 | 8.95 | |
| GD-25-371 | Interval | 545.10 | 549.00 | 3.90 | 0.68 |
| GD-25-406 | Interval | 122.00 | 125.00 | 3.00 | 1.70 |
| Interval | 137.00 | 143.00 | 6.00 | 1.20 | |
| Including | 139.00 | 142.00 | 3.00 | 2.20 | |
| GD-25-400 | Interval | 10.00 | 16.00 | 6.00 | 1.18 |
| Interval | 125.00 | 131.00 | 6.00 | 1.02 | |
| GD-25-331 | Interval | 146.00 | 151.00 | 5.00 | 1.00 |
| Including | 148.00 | 151.00 | 3.00 | 1.26 | |
| GD-25-361 | Interval | 303.80 | 310.08 | 6.28 | 1.06 |
| Including | 307.00 | 310.08 | 3.08 | 1.49 | |
| Interval | 315.00 | 318.00 | 3.00 | 1.08 | |
| Interval | 540.00 | 544.05 | 4.05 | 1.28 | |
| Interval | 542.00 | 542.85 | 0.85 | 5.72 | |
| GD-25-391 | Interval | 467.00 | 481.00 | 14.00 | 0.45 |
| GD-25-314 | Interval | 138.00 | 141.00 | 3.00 | 2.12 |
| GD-25-322 | Interval | 28.00 | 29.00 | 1.00 | 1.39 |
| Interval | 166.00 | 169.00 | 3.00 | 1.08 | |
| GD-25-309 | Interval | 296.03 | 299.07 | 3.04 | 1.72 |
| Interval | 296.92 | 298.00 | 1.08 | 4.80 | |
| GD-25-341 | Interval | 205.86 | 210.00 | 4.14 | 1.20 |
| Including | 205.86 | 209.00 | 3.14 | 1.51 | |
| Interval | 205.86 | 206.82 | 0.96 | 4.75 | |
| Interval | 394.00 | 399.00 | 5.00 | 1.04 | |
| Including | 395.00 | 398.03 | 3.03 | 1.68 | |
| GD-25-348 | Interval | 217.43 | 222.05 | 4.62 | 1.09 |
| Including | 217.43 | 221.12 | 3.69 | 1.34 | |
| Interval | 916.50 | 919.80 | 3.30 | 1.12 | |
| Interval | 917.52 | 918.73 | 1.21 | 2.98 | |
| GD-25-379 | Interval | 288.00 | 291.74 | 3.74 | 1.15 |
| Interval | 494.00 | 497.88 | 3.88 | 1.02 | |
| Interval | 496.00 | 497.00 | 1.00 | 3.71 | |
| Interval | 531.20 | 532.30 | 1.10 | 2.26 | |
| GD-25-346 | Interval | 220.88 | 225.00 | 4.12 | 1.03 |
| Including | 221.84 | 225.00 | 3.16 | 1.33 | |
| GD-25-315 | Interval | 224.00 | 227.00 | 3.00 | 1.22 |
| Interval | 225.00 | 226.00 | 1.00 | 3.52 | |
| GD-25-364 | Interval | 253.80 | 256.65 | 2.85 | 1.26 |
| Interval | 254.80 | 255.65 | 0.85 | 4.05 | |
| GD-25-339 | Interval | 635.75 | 639.00 | 3.25 | 1.09 |
| Interval | 636.48 | 637.32 | 0.84 | 3.95 | |
| GD-25-388 | Interval | 101.00 | 102.15 | 1.15 | 2.14 |
| GD-25-397 | Interval | 184.00 | 188.00 | 4.00 | 0.86 |
| GD-25-336 | Interval | 224.00 | 225.00 | 1.00 | 1.20 |
| Interval | 229.00 | 232.00 | 3.00 | 1.09 | |
| Interval | 230.00 | 231.00 | 1.00 | 3.11 | |
| GD-25-384 | Interval | 422.00 | 423.00 | 1.00 | 1.79 |
| Interval | 547.00 | 548.00 | 1.00 | 1.20 | |
| GD-25-402 | Interval | 196.00 | 197.25 | 1.25 | 2.44 |
| GD-25-338 | Interval | 426.00 | 429.00 | 3.00 | 0.80 |
| GD-25-369 | Interval | 667.00 | 671.00 | 4.00 | 0.70 |
| GD-25-409 | Interval | 124.00 | 127.00 | 3.00 | 0.79 |
| GD-25-307 | Interval | 304.78 | 305.66 | 0.88 | 2.64 |
| Interval | 410.36 | 411.51 | 1.15 | 1.94 | |
| Interval | 410.36 | 411.51 | 1.15 | 1.94 | |
| GD-25-392 | Interval | 93.57 | 94.80 | 1.23 | 1.09 |
| GD-25-404 | Interval | 183.00 | 186.00 | 3.00 | 0.44 |
| GD-25-340 | Interval | 367.45 | 370.47 | 3.02 | 0.36 |
| GD-25-347 | Interval | 334.00 | 335.00 | 1.00 | 1.70 |
| GD-25-353 | Interval | 292.96 | 294.00 | 1.04 | 1.07 |
| GD-25-320 | Interval | 216.00 | 219.00 | 3.00 | 0.48 |
| GD-25-408 | Interval | 111.00 | 115.08 | 4.08 | 0.25 |
| GD-25-310 | Interval | 150.00 | 151.00 | 1.00 | 1.08 |
| GD-25-304 | Interval | 255.00 | 256.00 | 1.00 | 0.69 |
Table 4: Collar information for drill holes reported in this news release.
| Hole ID | CRS | Easting (m) | Northing (m) | Elevation (m) | Azimuth (deg) | Dip (deg) | Length (m) |
| GD-25-301 | NAD83 / UTM zone 9N | 457445 | 6162773 | 1513 | 168 | 58 | 702 |
| GD-25-303 | NAD83 / UTM zone 9N | 457364 | 6162754 | 1508 | 157 | 61 | 676 |
| GD-25-304 | NAD83 / UTM zone 9N | 457214 | 6162332 | 1220 | 320 | 55 | 308 |
| GD-25-305 | NAD83 / UTM zone 9N | 457447 | 6162774 | 1513 | 155 | 54 | 687 |
| GD-25-306 | NAD83 / UTM zone 9N | 457214 | 6162332 | 1220 | 342 | 59 | 346 |
| GD-25-307 | NAD83 / UTM zone 9N | 456927 | 6163020 | 1651 | 152 | 72 | 678 |
| GD-25-308 | NAD83 / UTM zone 9N | 457364 | 6162756 | 1509 | 160 | 67 | 705 |
| GD-25-309 | NAD83 / UTM zone 9N | 456710 | 6162964 | 1638 | 295 | 89 | 612 |
| GD-25-310 | NAD83 / UTM zone 9N | 457214 | 6162332 | 1219 | 28 | 62 | 509 |
| GD-25-312 | NAD83 / UTM zone 9N | 457365 | 6162756 | 1509 | 150 | 71 | 681 |
| GD-25-314 | NAD83 / UTM zone 9N | 457018 | 6162591 | 1387 | 80 | 70 | 593 |
| GD-25-315 | NAD83 / UTM zone 9N | 457218 | 6162331 | 1219 | 63 | 63 | 486 |
| GD-25-316 | NAD83 / UTM zone 9N | 456927 | 6163020 | 1651 | 150 | 76 | 723 |
| GD-25-319 | NAD83 / UTM zone 9N | 457365 | 6162754 | 1505 | 141 | 62 | 629 |
| GD-25-320 | NAD83 / UTM zone 9N | 457215 | 6162328 | 1219 | 170 | 70 | 367 |
| GD-25-322 | NAD83 / UTM zone 9N | 457214 | 6162332 | 1219 | 250 | 70 | 594 |
| GD-25-323 | NAD83 / UTM zone 9N | 456927 | 6163020 | 1652 | 90 | 80 | 620 |
| GD-25-325 | NAD83 / UTM zone 9N | 457365 | 6162755 | 1509 | 128 | 88 | 669 |
| GD-25-326 | NAD83 / UTM zone 9N | 457236 | 6162867 | 1586 | 23 | 80 | 734 |
| GD-25-327 | NAD83 / UTM zone 9N | 457016 | 6162593 | 1388 | 5 | 65 | 459 |
| GD-25-329 | NAD83 / UTM zone 9N | 457444 | 6162778 | 1515 | 330 | 80 | 685 |
| GD-25-330 | NAD83 / UTM zone 9N | 457326 | 6162856 | 1582 | 206 | 73 | 681 |
| GD-25-331 | NAD83 / UTM zone 9N | 457815 | 6162506 | 1144 | 194 | 83 | 360 |
| GD-25-332 | NAD83 / UTM zone 9N | 456927 | 6163020 | 1653 | 10 | 75 | 708 |
| GD-25-333 | NAD83 / UTM zone 9N | 457365 | 6162757 | 1509 | 127 | 71 | 798 |
| GD-25-334 | NAD83 / UTM zone 9N | 457236 | 6162741 | 1490 | 128 | 66 | 696 |
| GD-25-335 | NAD83 / UTM zone 9N | 457015 | 6162587 | 1387 | 180 | 60 | 498 |
| GD-25-336 | NAD83 / UTM zone 9N | 456710 | 6162961 | 1639 | 315 | 75 | 606 |
| GD-25-337 | NAD83 / UTM zone 9N | 457813 | 6162507 | 1145 | 244 | 62 | 370 |
| GD-25-338 | NAD83 / UTM zone 9N | 457445 | 6162774 | 1514 | 173 | 69 | 621 |
| GD-25-339 | NAD83 / UTM zone 9N | 457236 | 6162865 | 1586 | 120 | 70 | 792 |
| GD-25-340 | NAD83 / UTM zone 9N | 456861 | 6162631 | 1451 | 300 | 55 | 405 |
| GD-25-341 | NAD83 / UTM zone 9N | 456927 | 6163020 | 1652 | 310 | 75 | 615 |
| GD-25-342 | NAD83 / UTM zone 9N | 457815 | 6162511 | 1146 | 336 | 70 | 350 |
| GD-25-344 | NAD83 / UTM zone 9N | 457319 | 6162857 | 1585 | 265 | 77 | 705 |
| GD-25-345 | NAD83 / UTM zone 9N | 457366 | 6162757 | 1509 | 120 | 52 | 822 |
| GD-25-346 | NAD83 / UTM zone 9N | 456863 | 6162632 | 1452 | 340 | 45 | 471 |
| GD-25-347 | NAD83 / UTM zone 9N | 456710 | 6162961 | 1639 | 270 | 65 | 442 |
| GD-25-348 | NAD83 / UTM zone 9N | 457413 | 6163252 | 1733 | 115 | 65 | 1001 |
| GD-25-349 | NAD83 / UTM zone 9N | 457817 | 6162512 | 1145 | 50 | 65 | 756 |
| GD-25-351 | NAD83 / UTM zone 9N | 457235 | 6162738 | 1489 | 170 | 57 | 723 |
| GD-25-352 | NAD83 / UTM zone 9N | 457038 | 6162952 | 1604 | 42 | 76 | 847 |
| GD-25-353 | NAD83 / UTM zone 9N | 456864 | 6162633 | 1453 | 7 | 56 | 501 |
| GD-25-357 | NAD83 / UTM zone 9N | 456865 | 6162628 | 1451 | 135 | 65 | 525 |
| GD-25-361 | NAD83 / UTM zone 9N | 457191 | 6163128 | 1712 | 160 | 85 | 699 |
| GD-25-363 | NAD83 / UTM zone 9N | 457411 | 6163251 | 1733 | 175 | 68 | 901 |
| GD-25-364 | NAD83 / UTM zone 9N | 457464 | 6163017 | 1633 | 230 | 80 | 795 |
| GD-25-366 | NAD83 / UTM zone 9N | 457399 | 6162901 | 1606 | 211 | 69 | 705 |
| GD-25-367 | NAD83 / UTM zone 9N | 457235 | 6162864 | 1585 | 213 | 74 | 651 |
| GD-25-368 | NAD83 / UTM zone 9N | 457485 | 6163165 | 1706 | 250 | 77 | 690 |
| GD-25-369 | NAD83 / UTM zone 9N | 457319 | 6162859 | 1585 | 310 | 85 | 738 |
| GD-25-371 | NAD83 / UTM zone 9N | 457190 | 6163130 | 1712 | 40 | 86 | 681 |
| GD-25-375 | NAD83 / UTM zone 9N | 457486 | 6163164 | 1706 | 250 | 85 | 747 |
| GD-25-379 | NAD83 / UTM zone 9N | 457189 | 6163129 | 1712 | 268 | 85 | 614 |
| GD-25-381 | NAD83 / UTM zone 9N | 457511 | 6163074 | 1660 | 115 | 66 | 360 |
| GD-25-382 | NAD83 / UTM zone 9N | 457591 | 6162372 | 1119 | 215 | 45 | 160 |
| GD-25-384 | NAD83 / UTM zone 9N | 457233 | 6162865 | 1585 | 255 | 78 | 674 |
| GD-25-386 | NAD83 / UTM zone 9N | 457512 | 6163073 | 1660 | 129 | 56 | 459 |
| GD-25-388 | NAD83 / UTM zone 9N | 457879 | 6162621 | 1179 | 270 | 65 | 498 |
| GD-25-389 | NAD83 / UTM zone 9N | 457849 | 6162680 | 1209 | 170 | 70 | 483 |
| GD-25-390 | NAD83 / UTM zone 9N | 457488 | 6163166 | 1707 | 70 | 80 | 792 |
| GD-25-391 | NAD83 / UTM zone 9N | 457465 | 6163019 | 1634 | 286 | 76 | 618 |
| GD-25-392 | NAD83 / UTM zone 9N | 457757 | 6162595 | 1200 | 280 | 55 | 423 |
| GD-25-393 | NAD83 / UTM zone 9N | 457322 | 6162859 | 1585 | 5 | 68 | 702 |
| GD-25-394 | NAD83 / UTM zone 9N | 457594 | 6162372 | 1119 | 168 | 55 | 345 |
| GD-25-395 | NAD83 / UTM zone 9N | 457402 | 6162902 | 1606 | 105 | 65 | 801 |
| GD-25-396 | NAD83 / UTM zone 9N | 457758 | 6162596 | 1201 | 284 | 75 | 274 |
| GD-25-397 | NAD83 / UTM zone 9N | 457850 | 6162683 | 1211 | 20 | 75 | 412 |
| GD-25-399 | NAD83 / UTM zone 9N | 457760 | 6162596 | 1201 | 356 | 64 | 288 |
| GD-25-400 | NAD83 / UTM zone 9N | 457598 | 6162374 | 1119 | 147 | 83 | 309 |
| GD-25-401 | NAD83 / UTM zone 9N | 457881 | 6162620 | 1179 | 210 | 80 | 600 |
| GD-25-402 | NAD83 / UTM zone 9N | 457972 | 6162658 | 1175 | 292 | 48 | 249 |
| GD-25-403 | NAD83 / UTM zone 9N | 457467 | 6163017 | 1633 | 147 | 83 | 600 |
| GD-25-404 | NAD83 / UTM zone 9N | 457848 | 6162684 | 1211 | 325 | 55 | 348 |
| GD-25-405 | NAD83 / UTM zone 9N | 457763 | 6162595 | 1200 | 82 | 75 | 312 |
| GD-25-406 | NAD83 / UTM zone 9N | 457973 | 6162657 | 1174 | 281 | 71 | 246 |
| GD-25-407 | NAD83 / UTM zone 9N | 457399 | 6162904 | 1608 | 350 | 82 | 395 |
| GD-25-408 | NAD83 / UTM zone 9N | 457972 | 6162655 | 1177 | 230 | 60 | 219 |
| GD-25-409 | NAD83 / UTM zone 9N | 457883 | 6162622 | 1178 | 60 | 75 | 302 |
About Golddigger Property
The Golddigger Property is 100% controlled and covers an area of 91,518 hectares in a highly prospective geological setting of the Eskay Rift, within 3 kilometers of the Red Line in the Golden Triangle of British Columbia. This area, in close proximity to the Red Line, has hosted some of Canada’s greatest gold mines including Eskay Creek, Premier and Snip. Other significant and well-known deposits in the Golden Triangle include Brucejack, Copper Canyon, Galore Creek, Granduc, KSM, Red Chris, and Schaft Creek. Goliath controls 56 kilometers of the Red Line which is a geologic contact between Triassic age Stuhini rocks and Jurassic age Hazelton rocks used as key markers when exploring for gold-copper-silver mineralization.
The Surebet discovery has predictable continuity and good metallurgy with gold recoveries from gravity and flotation at a 327-micrometer crush of 92.2% including 48.8% free gold from gravity alone (no cyanide required to recover the gold). The metallurgy completed to date shows no deleterious elements are present (see news release dated March 1, 2023).
The Property is in a well positioned location in close proximity to the communities of Alice Arm and Kitsault where there is a permitted mill site on private property. It is situated on tide water with direct barge access to Prince Rupert (190 kilometers via the Observatory inlet/Portland inlet). The town of Kitsault is accessible by road (190 kilometers from Terrace, 300 kilometers from Prince Rupert) and has a barge landing, dock, and infrastructure capable of housing at least 300 people, including high-tension power.
Additional infrastructure in the area includes the Dolly Varden Silver Mine Road (only 7 kilometers to the East of the Surebet discovery) with direct road access to Alice Arm barge landing (18 kilometers to the south of the Surebet discovery) and high-tension power (25 kilometers to the east of Surebet discovery). The city of Terrace (population 16,000) provides access to railway, major highways, and airport with supplies (food, fuel, lumber, etc.), while the town of Prince Rupert (population 12,000) is located on the West Coast of British Columbia and houses an international container seaport also with direct access to railway and an airport.
About CASERM (Center to Advance the Science of Exploration to Reclamation in Mining)
Goliath Resources is a paying member and active supporter of the Center to Advance the Science of Exploration to Reclamation in Mining (CASERM), which is one of the world’s largest research centers in the mining sector. CASERM is a collaborative research venture between Colorado School of Mines and Virginia Tech that is supported by a consortium of mining and exploration companies, analytical instrumentation and software companies, and federal agencies aiming to transform the way geoscience data is acquired and used across the mining value chain. The center forms part of the I-UCRC program of the National Science Foundation. Research focuses on the integration of diverse geoscience data to improve decision making across the mine life cycle, beginning with the exploration for subsurface resources continuing through mine operation as well as closure and environmental remediation. Over the past three years, Goliath Resources’ membership in CASERM has allowed a high level of research to be performed on the Surebet Discovery.
Independent Trading Group Engaged As Market Maker
Goliath has engaged the services of Independent Trading Group (“ITG”) to provide market-making services in accordance with TSX Venture Exchange TSXV, CSE, Cboe Canada policies subject to regulatory approval. ITG will trade shares of the Company on the TSXV and all other trading venues with the objective of maintaining a reasonable market and improving the liquidity of the Company's common shares.
Under the agreement, ITG will receive compensation of CAD$6,000 per month, payable monthly in advance. The agreement is for an initial term of one month and will renew for additional one-month terms unless terminated. The agreement may be terminated by either party with 30 days' notice. There are no performance factors contained in the agreement and ITG will not receive shares or options as compensation. ITG and the Company are unrelated and unaffiliated entities and at the time of the agreement, neither ITG nor its principals have an interest, directly or indirectly, in the securities of the Company.
About Independent Trading Group
Independent Trading Group (ITG) Inc. is a Toronto based CIRO dealer-member that specializes in market making, liquidity provision, agency execution, ultra-low latency connectivity, and bespoke algorithmic trading solutions. Established in 1992, with a focus on market structure, execution and trading, ITG has leveraged its own proprietary technology to deliver high quality liquidity provision and execution services to a broad array of public issuers and institutional investors.
RSU Grant
The Company has granted an aggregate of 3,165,000 restricted share units to officers and directors of the Company, which will vest equally over three years, with first vesting occurring after one year. Also, a total of 75,000 restricted share units granted to a consultant which will vest in one year. All restricted share units are subject to the Company's omnibus equity incentive plan.
Qualified Person
Rein Turna P. Geo is the qualified person as defined by National Instrument 43-101, for Goliath Resource Limited projects, and supervised the preparation of, and has reviewed and approved, the technical information in this release. Mr. Turna is an Independent Director of the Company.
About Goliath Resources Limited
Goliath Resources is an explorer of precious metals projects in the highly prospective Golden Triangle of Northwest-ern British Columbia. All of its projects are in high quality geological settings and geopolitical safe jurisdictions amenable to mining in Canada. Goliath is a member and active supporter of CASERM which is an organization that represents a collaborative venture between Colorado School of Mines and Virginia Tech. In 2025, Goliath completed its largest drill campaign to date for a total of 64,364 meters. It is fully funded for a similar sized drill program in 2026. Assay results are still pending for 110 holes from the 2025 exploration campaign for the gold equivalent (AuEq) values, that will be announced once received, compiled and interpreted. The Company’s key strategic cornerstone shareholders include Crescat Capital, a Global Commodity Group (Singapore), McEwen Inc. (NYSE: MUX) (TSX: MUX), Waratah Capital Advisors, Rob McEwen, Eric Sprott and Larry Childress.
For more information please contact:
Goliath Resources Limited Mr. Roger Rosmus Founder and CEO Tel: +1.416.488.2887roger@goliathresources.com www.goliathresourcesltd.com
Disclaimer
The reader is cautioned that grab samples are spot samples which are typically, but not exclusively, constrained to mineralization. Grab samples are selective in nature and collected to determine the presence or absence of mineralization and are not intended to be representative of the material sampled.
QA/QC Protocol
Oriented HQ-diameter or NQ-diameter diamond drill core from the drill campaign is placed in core boxes by the drill crew contracted by the Company. Core boxes are transported by helicopter to the staging area and then transported by truck to the core shack. The core is then re-orientated, meterage blocks are checked, meter marks are labelled, Recovery and RQD measurements taken, and primary bedding and secondary structural features including veins, dykes, cleavage, and shears are noted and measured. The core is then described and transcribed in MX DepositTM. Drill holes were planned using Leapfrog GeoTM and QGISTM software and data from the 2017-2024 exploration campaigns. Drill core containing quartz breccia, stockwork, veining and/or sulphide(s), or notable alteration is sampled in lengths of 0.5 to 1.5 meters. Core samples are cut lengthwise in half: one-half remains in the box and the other half is inserted in a clean plastic bag with a sample tag. The bagged samples are then weighed and secured with a zip tie. Certified reference materials (CRMs), blanks and duplicates are added in the sample stream at a rate of 10%. To ensure analytical anonymity, CRM identification labels are removed prior to submission to the laboratory. Additional out-of-sequence blanks are introduced immediately following core samples that contain VG-NE or high-grade sulphide mineralization.
Grab, channels, chip and talus samples were collected by foot with helicopter assistance. Prospective areas included, but were not limited to, proximity to MINFile locations, placer creek occurrences, regional soil anomalies, and potential gossans based on high-resolution satellite imagery. The rock grab and chip samples were extracted using a rock hammer, or hammer and chisel to expose fresh surfaces and to liberate a sample of anywhere between 0.5 to 5.0 kilograms. All sample sites were flagged with biodegradable flagging tape and marked with the sample number. All sample sites were recorded using hand-held GPS units (accuracy 3-10 meters) and sample ID, easting, northing, elevation, type of sample (outcrop, subcrop, float, talus, chip, grab, etc.) and a description of the rock were recorded on all-weather paper. Samples are then inserted in a clean plastic bag with a sample tag for transport and shipping to the geochemistry lab. QA/QC samples including blanks, certified reference materials, and duplicate samples are inserted regularly into the sample sequence at a rate of 10%.
All samples are transported in rice bags sealed with numbered security tags. The rice bags are transported from the core shacks to the MSALABS facilities in Terrace, BC. MSALABS is certified with both AC89-IAS and ISO/IEC Standard 17025:2017. The core samples undergo preparation via drying, crushing to ~70% of the material passing a 2 mm sieve and riffle splitting. The sample splits are weighed and transferred into three plastic jars, each containing between 300 g and 500 g of crushed sample material. A 250 g split is pulverized to ensure at least 85% of the material passes through a 75 µm sieve. The crushed samples are transported to the MSALABS PhotonAssayTM facility in Prince George, where gold concentrations are quantified via photon assay analysis (method CPA-Au1). Samples that result in gold concentrations ≥5 ppm are analyzed to extinction. Photon assay uses high-energy X-rays (photons) to excite atomic nuclei within the jarred samples, inducing the emission of secondary gamma rays, which are measured to quantify gold concentrations. The assays from all jars are combined on a weight-averaged basis. Multielement analyses are carried at the MSALABS facilities in Surrey, BC, where 250 g of pulverized splits are analyzed via ICF6xx and IMS-230 methods. The IMS-230 method uses 4-acid digestion (a combination of hydrochloric, nitric, perchloric and hydrofluoric acids) followed by inductively coupled plasma emission spectrometry to quantify concentrations of 48 elements. Samples with over-limit results for Ag, Cu, Pb and Zn undergo ore-grade analysis via the ICF-6xx method (where ‘xx’ denotes the target metal). This method employs 4-acid digestion followed by inductively coupled plasma emission spectrometry.
Widths are reported in drill core lengths and the true widths are estimated to be 80-90% and Gold Equivalent (AuEq) metal values are calculated using: Au 2797.16 USD/oz, Ag 31.28 USD/oz, Cu 4.25 USD/lbs, Pb 1955.58 USD/ton and Zn 2750.50 USD/ton on January 31st, 2025. There is potential for economic recovery of gold, silver, copper, lead, and zinc from these occurrences based on other mining and exploration projects in the same Golden Triangle Mining Camp where Goliath’s project is located such as the Homestake Ridge Gold Project (Auryn Resources Technical Report, Updated Mineral Resource Estimate and Preliminary Economic Assessment on the Homestake Ridge Gold Project, prepared by Minefill Services Inc. Bothell, Washington, dated May 29, 2020). Here, AuEq values were calculated using 3-year running averages for metal price, and included provisions for metallurgical recoveries, treatment charges, refining costs, and transportation. Recoveries for Gold were 85.5%, Silver at 74.6%, Copper at 74.6% and Lead at 45.3%. It will be assumed that Zinc can be recovered with the Copper at the same recovery rate of 74.6%. The quoted reference of metallurgical recoveries is not from Goliath’s Golddigger Project, Surebet Zone mineralization, and there is no guarantee that such recoveries will ever be achieved, unless detailed metallurgical work such as in a Feasibility Study can be eventually completed on the Golddigger Project.
Neither the TSX Venture Exchange nor its Regulation Services Provider (as that term is defined in the policies of the TSX Venture Exchange), nor the OTCQB Venture Market accepts responsibility for the adequacy or accuracy of this release.
Certain statements contained in this press release constitute forward-looking information. These statements relate to future events or future performance. The use of any of the words "could", "intend", "expect", "believe", "will", "projected", "estimated" and similar expressions and statements relating to matters that are not historical facts are intended to identify forward-looking information and are based on Goliath’s current belief or assumptions as to the outcome and timing of such future events. Actual future results may differ materially. In particular, this release contains forward-looking information relating to, among other things, the ability of the Company to complete financings and its ability to build value for its shareholders as it develops its mining properties. Various assumptions or factors are typically applied in drawing conclusions or making the forecasts or projections set out in forward-looking information. Those assumptions and factors are based on information currently available to Goliath. Although such statements are based on management's reasonable assumptions, there can be no assurance that the proposed transactions will occur, or that if the proposed transactions do occur, will be completed on the terms described above.
The forward-looking information contained in this release is made as of the date hereof and Goliath is not obligated to update or revise any forward-looking information, whether as a result of new information, future events or otherwise, except as required by applicable securities laws. Because of the risks, uncertainties and assumptions contained herein, investors should not place undue reliance on forward-looking information. The foregoing statements expressly qualify any forward-looking information contained herein.
This announcement does not constitute an offer, invitation, or recommendation to subscribe for or purchase any securities and neither this announcement nor anything contained in it shall form the basis of any contract or commitment. In particular, this announcement does not constitute an offer to sell, or a solicitation of an offer to buy, securities in the United States, or in any other jurisdiction in which such an offer would be illegal.
The securities referred to herein have not been and will not be will not be registered under the United States Securities Act of 1933, as amended (the “U.S. Securities Act”), or any state securities laws and may not be offered or sold within the United States or to or for the account or benefit of a U.S. person (as defined in Regulation S under the U.S. Securities Act) unless registered under the U.S. Securities Act and applicable state securities laws or an exemption from such registration is available.
The global Gold market is poised for growth, driven by economic volatility boosting investment demand, technological innovations enhancing mining efficiency, and increasing gold use in technology. The rising middle class in emerging economies also fuels jewelry demand, while geopolitical and economic shifts influence overall market dynamics.
Gold Market
Gold Market
Dublin, Jan. 20, 2026 (GLOBE NEWSWIRE) — The "Gold – Global Strategic Business Report" report has been added to ResearchAndMarkets.com's offering.The global market for Gold was sized at 4.7 Thousand Tonnes in 2024 and is projected to reach 6.3 Thousand Tonnes by 2030, growing at a CAGR of 5.1% from 2024 to 2030. This comprehensive report provides an in-depth analysis of market trends, drivers, and forecasts, helping you make informed business decisions.
Historically, gold has played a central role in many economies and has been used as a stable foundation for monetary systems. Even today, countries hold large reserves of gold as a safeguard to stabilize national economies and as a hedge against inflation or economic uncertainty. This precious metal is mined in several countries, with China, Australia, Russia, and the United States being the largest producers. The process of mining gold can be intensive and complex, involving extensive exploration, excavation, and processing.
What Drives the Growth of the Gold Market?The growth in the gold market is driven by several factors. Economic volatility and uncertainty often lead investors to gold as a safe store of value, pushing up its price and demand. Technological advancements that lower the cost of gold extraction and processing also contribute to market growth by sustaining its supply at lower costs.
Moreover, the expansion of the middle class in emerging economies boosts demand for gold jewelry and ornaments, further propelling the market. Additionally, as new uses for gold in technology and medicine are developed, its industrial demand continues to expand. Global trade policies and geopolitical tensions can also impact the gold market, influencing investor behavior and gold prices.How Are Technological Advancements Impacting Gold Production and Use?Technological advancements have significantly transformed the methods of extracting and processing gold, increasing efficiency and environmental sustainability. Modern techniques in gold mining include bio-mining, which uses microbial processes to extract gold from ore and reduce the environmental impact associated with traditional extraction methods such as cyanide leaching.
In gold refining, advancements have streamlined processes to reduce waste and improve the purity of the final product. Technology has also expanded the use of gold beyond adornment and currency into applications such as electronics, where gold's excellent conductivity makes it valuable for use in high-end connectors and circuit boards, and healthcare, where it is used in diagnostic procedures and treatments.What Are the Current Market Dynamics Influencing Gold Demand?The demand for gold is influenced by various factors that make it unique compared to other commodities. It is driven not only by its practical uses in jewelry and technology but also by its role as an investment vehicle. During times of economic uncertainty, gold is often seen as a 'safe haven' investment due to its intrinsic value and historical reliability.
This has been evident during economic downturns, where an increase in investment demand for gold often offsets the declines in its industrial and jewelry use. Additionally, the growing middle class in emerging markets has spurred demand for gold jewelry, particularly in countries like China and India, where gold is deeply woven into the cultural fabric. Central bank policies, inflation rates, and currency stability also significantly affect gold prices and investment demand.
Report Features:
- Comprehensive Market Data: Independent analysis of annual sales and market forecasts in US$ Million from 2024 to 2030.
- In-Depth Regional Analysis: Detailed insights into key markets, including the U.S., China, Japan, Canada, Europe, Asia-Pacific, Latin America, Middle East, and Africa.
- Company Profiles: Coverage of players such as AngloGold Ashanti, Barrick Gold Corporation, Furukawa Co., Ltd., Gabriel Resources Ltd., Harmony Gold Mining Company Limited and more.
- Complimentary Updates: Receive free report updates for one year to keep you informed of the latest market developments.
Key Insights:
- Market Growth: Understand the significant growth trajectory of the Gold Jewelry segment, which is expected to reach 3 Thousand Tonnes by 2030 with a CAGR of a 5.6%. The Gold Bars & Coins segment is also set to grow at 4.5% CAGR over the analysis period.
- Regional Analysis: Gain insights into the U.S. market, valued at 1.2 Thousand Tonnes in 2024, and China, forecasted to grow at an impressive 7.6% CAGR to reach 1.4 Thousand Tonnes by 2030. Discover growth trends in other key regions, including Japan, Canada, Germany, and the Asia-Pacific.
Report Scope
- Segments: Type (Jewelry, Bars & Coins, ETFs & Similar Products, Central Banks & Other Investments, Technology).
- Geographic Regions/Countries:World; United States; Canada; Japan; China; Europe (France; Germany; Italy; United Kingdom; Spain; Russia; and Rest of Europe); Asia-Pacific (Australia; India; South Korea; and Rest of Asia-Pacific); Latin America (Argentina; Brazil; Mexico; and Rest of Latin America); Middle East (Iran; Israel; Saudi Arabia; United Arab Emirates; and Rest of Middle East); and Africa.
Key Attributes:
| Report Attribute | Details |
| No. of Pages | 513 |
| Forecast Period | 2024 – 2030 |
| Estimated Market Value in 2024 | 4.7 Thousand Tonnes |
| Forecasted Market Value by 2030 | 6.3 Thousand Tonnes |
| Compound Annual Growth Rate | 5.1% |
| Regions Covered | Global |
Key Topics Covered: MARKET OVERVIEW
- Trade Shocks, Uncertainty, and the Structural Rewiring of the Global Economy
- How Trump's Tariffs Impact the Market? The Big Question on Everyone's Mind
- Global Economic Update
- Gold – Global Key Competitors Percentage Market Share in 2025 (E)
- Competitive Market Presence – Strong/Active/Niche/Trivial for Players Worldwide in 2025 (E)
MARKET TRENDS & DRIVERS
- Advances in Mining Technology Propel Growth in Gold Market
- Increasing Demand for Gold as an Investment Expands Addressable Market Opportunity
- Technological Innovations in Gold Extraction Generate Demand for Efficient Mining Solutions
- Growth in Jewelry and Luxury Goods Sector Drives Adoption of Gold
- Rising Focus on Sustainable and Ethical Sourcing Strengthens Business Case for Responsible Gold Mining
- Adoption of Gold in Electronics and Technology Spurs Growth in Market
- Advances in Gold Recycling and Recovery Sustain Growth in Secondary Markets
- Integration with Digital and Blockchain Technologies Drives Market Expansion
- Innovations in Gold-Based Nanomaterials Propel Growth in Medical and Industrial Applications
FOCUS ON SELECT PLAYERS:Some of the 366 companies featured in this Gold market report include:
- AngloGold Ashanti
- Barrick Gold Corporation
- Furukawa Co., Ltd.
- Gabriel Resources Ltd.
- Harmony Gold Mining Company Limited
- Jinshan Gold
- Johnson Matthey PLC
- Kinross Gold Corporation
- New Gold Inc.
- New mont Mining Corporation
- Tertiary Minerals PLC
- Vedanta Resources PLC
- Zijin Mining Group
For more information about this report visit https://www.researchandmarkets.com/r/28zwga
About ResearchAndMarkets.comResearchAndMarkets.com is the world's leading source for international market research reports and market data. We provide you with the latest data on international and regional markets, key industries, the top companies, new products and the latest trends.
Attachment
CONTACT:
CONTACT: ResearchAndMarkets.com
Laura Wood,Senior Press Manager
press@researchandmarkets.com
For E.S.T Office Hours Call 1-917-300-0470
For U.S./ CAN Toll Free Call 1-800-526-8630
For GMT Office Hours Call +353-1-416-8900
TORONTO, Jan. 20, 2026 /CNW/ – Bravo Mining Corp. (TSXV: BRVO) (OTCQX: BRVMF) ("Bravo" or the "Company") announces that it has closed the previously announced public offering (the "Offering") of common shares of the Company (the "Common Shares"). Pursuant to the Offering, the Company has issued 19,607,500 Common Shares at a price of C$4.40 per Common Share for gross proceeds of C$86,273,000, which includes the exercise in full of the over-allotment option granted to the Underwriters (as defined below). The Offering was co-led by BMO Capital Markets and National Bank Capital Markets on behalf of a syndicate that included Beacon Securities Limited and Canaccord Genuity Corp. (collectively, the "Underwriters").
In connection with the Offering, the Company has paid the Underwriters a cash commission in the aggregate amount of $4,313,650 equal to 5.0% of the gross proceeds of the Offering.
The Offering was made by way of a prospectus supplement dated January 15, 2026 to the Company's existing Canadian base shelf prospectus dated December 22, 2025, in the United States on a private placement basis pursuant to exemptions from the registration requirements of the United States Securities Act of 1933, as amended (the "U.S. Securities Act"), and in certain other jurisdictions outside of Canada and the United States.
The Common Shares have not been and will not be registered under the U.S. Securities Act and may not be offered or sold in the United States absent registration or an applicable exemption from the registration requirements under the U.S. Securities Act and applicable state securities laws. This news release shall not constitute an offer to sell or the solicitation of an offer to buy nor shall there be any sale of any securities in any jurisdiction in which such offer, solicitation or sale would be unlawful.
About Bravo Mining Corp.
Bravo is a Canadian and Brazil-based mineral exploration and development company focused on advancing its PGM and copper-gold Luanga Project in the Carajás Mineral Province, Pará State, Brazil.
Bravo is one of the most active explorers in Carajás. The team, comprising of local and international geologists, has a proven track record of PGM, nickel, and copper discoveries in the region. They have successfully taken a past IOCG greenfield project from discovery to development and production in the Carajás.
The Luanga Project is situated on mature freehold farming land and benefits from being located close to operating mines and a mining-experienced workforce, with excellent access and proximity to existing infrastructure, including road, rail, and hydroelectric grid power. Bravo's current Environmental, Social and Governance activities include planting more than 50,000 high-value trees in and around the project area and hiring and contracting locally.
Neither TSX Venture Exchange nor its Regulation Services Provider (as that term is defined in policies of the TSX Venture Exchange) accepts responsibility for the adequacy or accuracy of this release.
View original content to download multimedia: http://www.newswire.ca/en/releases/archive/January2026/20/c7613.html
Freeport-McMoRan Inc. FCX remains focused on strong execution while progressing its organic growth initiatives. Its expansion projects are geared toward increasing production capacity, supported by a robust financial position.FCX has completed the evaluation of a large-scale expansion at El Abra in Chile to define a large sulfide resource that could potentially support a major mill project similar to the large-scale concentrator at Cerro Verde, with an estimated resource of approximately 20 billion recoverable pounds of copper. FCX is also conducting pre-feasibility studies (expected to be completed in 2026) in the Safford/Lone Star operations in Arizona to define a significant sulfide expansion opportunity. It also has expansion opportunities at Bagdad in Arizona to more than double the concentrator capacity of the operation. Also, PT Freeport Indonesia (PT-FI) substantially completed the construction of the new greenfield smelter in Eastern Java during 2024, with the start-up of operations having commenced in the second quarter of 2025. The first production of copper anode was achieved in July 2025. PT-FI is also developing the Kucing Liar ore body within the Grasberg district with a targeted ramp-up to commence before 2030. Gold production also started at the new precious metals refinery in late 2024. Plans are in place to transition PT-FI’s existing energy source from coal to natural gas, which is expected to significantly reduce greenhouse gas emissions at Grasberg.FCX’s organic growth pipeline, designed to expand capacity and output, positions itself well to benefit from future demand growth. Effective execution of these projects will strengthen its ability to drive shareholder value.Among FCX’s peers, Southern Copper Corporation SCCO has a strong pipeline of world-class copper greenfield projects and various other promising opportunities. Southern Copper’s capital investment program for this decade is more than $15 billion, with the major portion earmarked for Peru. Southern Copper continues to build its presence in Peru as the country is the second-largest producer of copper. BHP Group Limited BHP continues to strengthen its portfolio, focusing on commodities, including copper. BHP continues to reshape its portfolio toward commodities such as copper and potash, allocating nearly 70% of its medium-term capital expenditure to these areas. This strategy positions BHP to benefit from decarbonization, electrification, population growth and rising living standards in emerging markets. BHP’s project pipeline could add 2 Mtpa of attributable copper output by the 2030s.
The Zacks Rundown for FCX
Shares of Freeport-McMoRan have increased 29.9% in the past six months against the Zacks Mining – Non Ferrous industry’s growth of 63.9%.
Image Source: Zacks Investment Research
From a valuation standpoint, FCX is currently trading at a forward 12-month earnings multiple of 25.32, a modest 1.2% premium to the industry average of 25.02X. It carries a Value Score of B.
Image Source: Zacks Investment Research
The Zacks Consensus Estimate for FCX’s 2025 and 2026 earnings implies a year-over-year rise of 4.7% and 48.1%, respectively. The EPS estimates for 2025 and 2026 have been trending higher over the past 60 days.
Image Source: Zacks Investment Research
FCX stock currently carries a Zacks Rank #3 (Hold). You can see the complete list of today’s Zacks #1 Rank (Strong Buy) stocks here.
Want the latest recommendations from Zacks Investment Research? Today, you can download 7 Best Stocks for the Next 30 Days. Click to get this free report
Freeport-McMoRan Inc. (FCX) : Free Stock Analysis Report
BHP Group Limited Sponsored ADR (BHP) : Free Stock Analysis Report
Southern Copper Corporation (SCCO) : Free Stock Analysis Report
This article originally published on Zacks Investment Research (zacks.com).
If you would like to receive our free newsletter via email, simply enter your email address below & click subscribe.
 Follow us on Twitter
 Become our facebook fan
CONNECT WITH US
Tweets
Tweet with hash tag #miningfeeds or @miningfeeds and your tweets will be displayed across this site.
MOST ACTIVE MINING STOCKS
Daily Gainers
 CMC Metals Ltd. CMC Metals Ltd. |
CMB.V | +900.00% |
 Eden Energy Ltd Eden Energy Ltd |
EDE.AX | +200.00% |
| GoviEx Uranium Inc. |
GXU.V | +42.86% |
| Eagle Nickel Ltd. |
ENL.AX | +41.67% |
| Citigold Corp. Limited |
CTO.AX | +33.33% |
| Mount Burgess Mining NL |
MTB.AX | +33.33% |
| Exalt Resources Limited |
ERD.AX | +31.94% |
| Casa Minerals Inc. |
CASA.V | +30.00% |
| Cariboo Rose Resources Ltd |
CRB.V | +28.57% |
| Belmont Resources Inc. |
BEA.V | +28.57% |


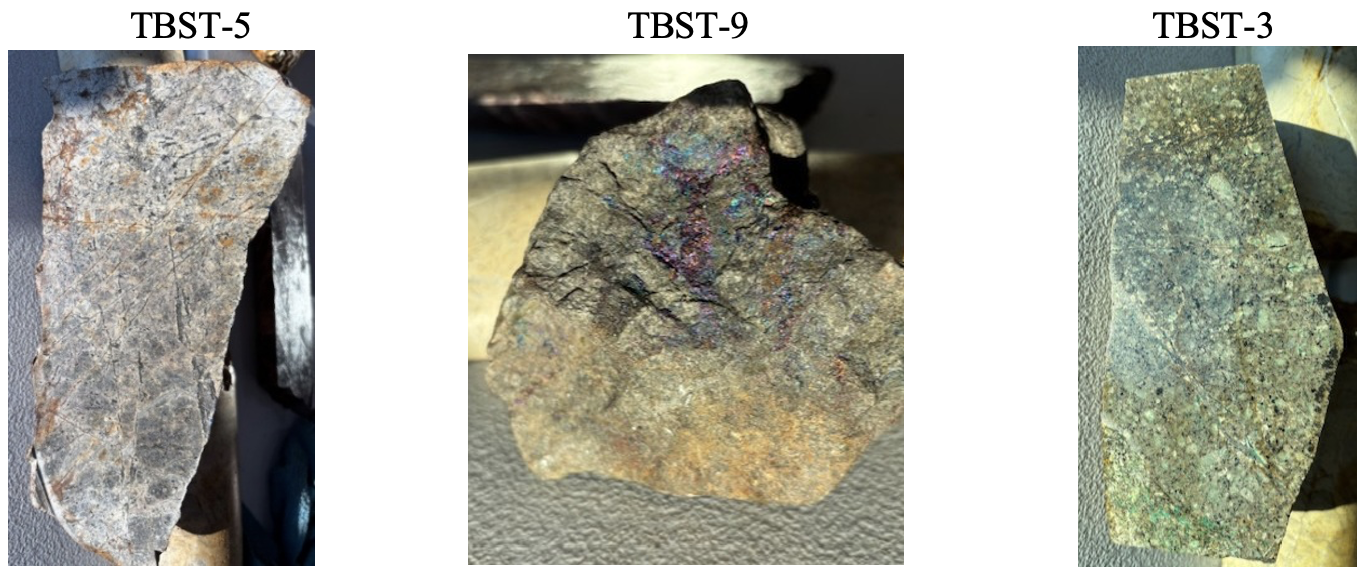