Never miss an important update on your stock portfolio and cut through the noise. Over 7 million investors trust Simply Wall St to stay informed where it matters for FREE.
Recent Performance Context for Lundin Mining
Lundin Mining (TSX:LUN) has drawn fresh attention after a period of strong share performance, with the stock showing gains over the past week, month, and past 3 months that outpaced its single day decline.
For investors tracking longer trends, total returns over the past year and past 3 years are very large multiples of the starting value. The past 5 years also show a sizeable gain, putting the current CA$34.22 share price into sharper focus.
See our latest analysis for Lundin Mining.
The recent 60.28% three-month share price return on Lundin Mining, together with a very large one-year total shareholder return of 178.33%, suggests momentum has been building into the current CA$34.22 level despite a one-day share price decline of 1.10%.
If you are scanning for other opportunities in the resources space, this could be a good moment to broaden your search with fast growing stocks with high insider ownership.
With Lundin Mining now at CA$34.22 and trading above the average analyst price target of CA$30.14, the key question is whether recent momentum leaves upside on the table or if the market is already pricing in future growth.
Most Popular Narrative: 21% Overvalued
With Lundin Mining last closing at CA$34.22 against a narrative fair value of about CA$28.28, the gap between price and modelled worth is clear and sets up an interesting valuation debate.
The fair value estimate has risen slightly from US$27.52 to US$28.28, reflecting a modest adjustment to the model inputs.
The net profit margin has risen slightly from 15.98% to 16.67%, suggesting a somewhat higher assumed earnings efficiency over time.
Curious what justifies paying up for Lundin Mining here? The narrative leans heavily on future profitability, modest growth assumptions, and a premium earnings multiple. Want to see how those ingredients are combined into that fair value?
Result: Fair Value of $28.28 (OVERVALUED)
Have a read of the narrative in full and understand what’s behind the forecasts.
However, the heavy tilt to South American copper and the ongoing Candelaria legal overhang could easily challenge today’s upbeat profitability assumptions.
Find out about the key risks to this Lundin Mining narrative.
Build Your Own Lundin Mining Narrative
If you look at the numbers and reach a different conclusion, or simply want to test your own assumptions against the data, you can build a personalised Lundin Mining narrative in just a few minutes, starting with Do it your way.
A great starting point for your Lundin Mining research is our analysis highlighting 1 key reward and 1 important warning sign that could impact your investment decision.
Looking for more investment ideas?
If Lundin Mining has caught your attention, do not stop here. You could miss opportunities that better match your goals and risk comfort.
- Scan for potential value by checking out these 868 undervalued stocks based on cash flows that trade at prices below what their cash flows might suggest.
- Ride big technology shifts by reviewing these 24 AI penny stocks that are tied to artificial intelligence themes.
- Add income-focused ideas to your watchlist by assessing these 12 dividend stocks with yields > 3% offering yields above 3%.
This article by Simply Wall St is general in nature. We provide commentary based on historical data
and analyst forecasts only using an unbiased methodology and our articles are not intended to be financial advice. It does not constitute a recommendation to buy or sell any stock, and does not take account of your objectives, or your
financial situation. We aim to bring you long-term focused analysis driven by fundamental data.
Note that our analysis may not factor in the latest price-sensitive company announcements or qualitative material.
Simply Wall St has no position in any stocks mentioned.
Companies discussed in this article include LUN.TO.
Have feedback on this article? Concerned about the content? Get in touch with us directly. Alternatively, email editorial-team@simplywallst.com
Track your investments for FREE with Simply Wall St, the portfolio command center trusted by over 7 million individual investors worldwide.
- If you are looking at Lundin Mining and wondering whether the current share price offers value or stress, this article walks through what the numbers actually say about the stock.
- The share price closed at C$34.22, with returns of 9.9% over 7 days, 22.6% over 30 days, 15.2% year to date and 178.3% over the past year, which naturally raises questions about what is already priced in.
- Recent attention on Lundin Mining has centred on the stock’s strong share price performance and how it fits into investor interest in materials companies more broadly. These moves have put valuation front and centre for anyone trying to decide whether to initiate or adjust a position.
- Against this backdrop, Lundin Mining currently scores 0 out of 6 on our valuation checks for being undervalued. In what follows, we look at what different valuation methods say about the stock and then finish with a way to tie those models into a more complete view of value.
Lundin Mining scores just 0/6 on our valuation checks. See what other red flags we found in the full valuation breakdown.
Approach 1: Lundin Mining Discounted Cash Flow (DCF) Analysis
The Discounted Cash Flow model takes estimates of future cash flows and discounts them back to today to reach an implied value for the company on a per share basis.
For Lundin Mining, the model used is a 2 Stage Free Cash Flow to Equity approach based on cash flow projections. The latest twelve month free cash flow is $471.03 million. Analyst estimates and extrapolations suggest free cash flow of $743.55 million in 2026 and $402 million in 2030, with interim years including both positive and negative projected figures. Beyond the analyst horizon, Simply Wall St extrapolates additional years of free cash flow using its own assumptions.
When all of these projected cash flows are discounted back to today, the model arrives at an estimated intrinsic value of $16.37 per share. Compared to the current share price of C$34.22, the DCF output implies the stock is 109.1% overvalued based on these inputs and assumptions.
Result: OVERVALUED
Our Discounted Cash Flow (DCF) analysis suggests Lundin Mining may be overvalued by 109.1%. Discover 868 undervalued stocks or create your own screener to find better value opportunities.
LUN Discounted Cash Flow as at Jan 2026
Approach 2: Lundin Mining Price vs Earnings
For profitable companies, the P/E ratio is a useful gauge because it links what you pay for each share to the earnings that business is currently generating. Investors usually look for a P/E level that reflects both how quickly earnings might change over time and how risky those earnings are, with higher expected growth or lower risk often justifying a higher P/E, and the opposite also being true.
Lundin Mining is currently trading on a P/E of 99.20x. That sits well above the Metals and Mining industry average of 25.01x and the peer group average of 22.31x. Simply Wall St’s Fair Ratio for Lundin Mining is 25.53x, which is its proprietary estimate of what a reasonable P/E could be for this company given factors such as earnings growth profile, profit margins, industry, market cap and identified risks.
The Fair Ratio is more tailored than a simple comparison with peers or the industry average, because it adjusts for company specific characteristics rather than assuming every business in the group deserves the same multiple. Comparing Lundin Mining’s current 99.20x P/E to the Fair Ratio of 25.53x indicates that the shares are trading well above what this framework suggests.
Result: OVERVALUED
TSX:LUN P/E Ratio as at Jan 2026
P/E ratios tell one story, but what if the real opportunity lies elsewhere? Discover 1440 companies where insiders are betting big on explosive growth.
Upgrade Your Decision Making: Choose your Lundin Mining Narrative
Earlier we mentioned that there is an even better way to understand valuation. On Simply Wall St’s Community page you can use Narratives, where you set a story for Lundin Mining that ties your view on its projects, risks and metals cycles to specific forecasts for revenue, earnings and margins. This then produces a Fair Value you can compare with the current price. It updates automatically when news or earnings land and can look very different from other investors’ views. For example, one investor might build a bullish Lundin Mining Narrative closer to the upper analyst price target of about C$21.08, while another might anchor their assumptions nearer the C$14.04 lower target.
Do you think there’s more to the story for Lundin Mining? Head over to our Community to see what others are saying!
TSX:LUN 1-Year Stock Price Chart
This article by Simply Wall St is general in nature. We provide commentary based on historical data
and analyst forecasts only using an unbiased methodology and our articles are not intended to be financial advice. It does not constitute a recommendation to buy or sell any stock, and does not take account of your objectives, or your
financial situation. We aim to bring you long-term focused analysis driven by fundamental data.
Note that our analysis may not factor in the latest price-sensitive company announcements or qualitative material.
Simply Wall St has no position in any stocks mentioned.
Companies discussed in this article include LUN.TO.
Have feedback on this article? Concerned about the content? Get in touch with us directly. Alternatively, email editorial-team@simplywallst.com
Vancouver, British Columbia–(Newsfile Corp. – January 16, 2026) – Elemental Royalty Corporation (TSXV: ELE) (NASDAQ: ELE) ("Elemental" or the "Company") is pleased to announce the execution of a definitive option and earn-in agreement (the "Agreement") covering three exploration licenses in the Bor Mining District of Serbia to a wholly owned subsidiary of BHP Group Limited ("BHP"). The three exploration-stage projects are currently held by Elemental's wholly owned Serbian subsidiary Magma Resources doo ("Magma") and BHP will have the option to acquire Magma in exchange for cash payments and by satisfying work commitments. Elemental will retain 2% NSR royalties on the projects as well as other considerations (see discussion of Commercial Terms below).
The Projects nicely complement Elemental's other royalty interests in the Bor District, which include the Brestovac, Brestovac West, and Jasikovo East-Durlan Potok properties (see Figure 1). Brestovac is one of Elemental's flagship royalties, covering Zijin Mining Group Co., Ltd's producing Čukaru Peki copper-gold mine and recently discovered Malka Golaja copper-gold deposit. Zijin has been rapidly expanding its Čukaru Peki operations, increasing capacity at its current mill while continuing to add infrastructure for the development of the "Lower Zone" porphyry copper-gold deposit. Zijin's published mineral resources and reserves for Čukaru Peki have also continued to grow rapidly, as shown in Zijin's recent annual reports. The Lenovac projects, included in the BHP Agreement, cover the extension of the geologic trend that hosts the Čukaru Peki and Malka Golaja copper-gold deposits to the south.
Commercial Terms Overview. (all terms in USD)Pursuant to the Agreement, BHP can acquire and retain a 100% interest in Magma and the Projects by satisfying each of the following conditions: (a) making a payment of $200,000 to the Company on the six-month anniversary of the Agreement, (b) annual payments of $200,000 to the Company on every anniversary of the Agreement until the earn-in is complete, and (c) completing $5,000,000 in cumulative exploration expenditures on the Projects within five years.
Upon BHP's option exercise and earn-in, Elemental will retain a 2% NSR royalty interest on each Project. BHP may buy back up to a total of half a percent (0.5%) of the royalty in quarter percent (0.25%) increments; 0.25% can be purchased for $5,000,000 before the eighth anniversary of the agreement and 0.25% can be purchased for $5,000,000 before the 11th anniversary of the agreement. BHP will also make annual advance royalty payments of $200,000 to the Company until the commencement of commercial production.
Overview of the Projects.The Bor Mining District in eastern Serbia has been one of Europe's largest copper producers for over a century, where historic and current mining operations have been developed within a cluster of porphyry Cu-Au, high-sulfidation epithermal and skarn systems (including Bor, Veliki Krivelj, Majdanpek and Čukaru Peki; see Figure 1). The Elemental projects (the "Projects") were originally acquired in 2023 and 2024 and are positioned along trend of Zijin Mining's Bor and Čukaru Peki operations. Although there are still near-surface deposits being identified in the area, several recent discoveries have been made at relatively deep levels (such as Zijin's Čukaru Peki and Dundee Precious Metals' Čoka Rakita deposits) and require deep drilling. BHP's deep-sensing geophysical capabilities and existing regional interest make them an ideal exploration partner for the Projects.
Elemental has acquired over 150 square kilometres of mineral rights along trend of the major copper and gold deposits within the Bor Mining District (see Figure 1). Previous exploration in the Bor District has typically targeted Upper Cretaceous andesite units, which host the majority of the epithermal and porphyry systems at the Bor Copper Complex and Čukaru Peki mine. However, new discoveries such as Dundee Precious Metals' Čoka Rakita skarn deposit highlights that the different geologic settings and older Jurassic and Paleozoic host rocks are also prospective for additional discoveries. The Elemental Projects include both the traditionally prospective Upper Cretaceous andesite units of the Timok Magmatic Complex, as well as deeper host rock packages where several recent discoveries have been made.
The Lenovac North and South licenses lie directly south of the Zijin's Brestovac license, which hosts the Čukaru Peki and the recently discovered Malka Golaja copper-gold deposits. Elemental's Lenovac licenses cover the southern extension of this trend where a regional fault displaces the trend of mineralization and favorable host rocks to the southwest. The licenses are largely comprised of prospective Cretaceous volcanic and sedimentary units with some areas of Miocene cover.
The Durlan Istok license is located to the southeast of Zijin's Majdanpek porphyry copper-gold mine and east of Čoka Marin, a high-grade polymetallic volcanogenic/epithermal deposit. The Durlan Istok license contains the stratigraphic sections that hosts Čoka Marin and the Čoka Rakita skarn further to the southwest.
Comments on adjacent or nearby Districts, Mines, and Deposits.The districts, mines, and deposits discussed in this news release provide context for Elemental's projects, which occur in similar geologic settings, but this is not necessarily indicative that the Company's projects host similar tonnages or grades of mineralization.
North American Investor RelationsElemental has retained the services of Renmark Financial Communications Inc. to handle its investor relations activities in North America. In consideration of the services to be provided, the monthly fees incurred by Elemental will be a cash consideration of up to C$9,000, starting January 1, 2026, for a period of seven months ending on July 31, 2026, and monthly thereafter. Renmark Financial Communications does not have any interest, directly or indirectly, in Elemental or its securities, or any right or intent to acquire such an interest.
David M. ColeCEO and Director
For more information, please contact:
|
David M. Cole |
|
|
CEO |
|
|
Tara Vivian-Neal |
|
|
Investor Relations |
(TSXV: ELE) (NASDAQ: ELE) | ISIN: CA28620K1066 | CUSIP: 28620K
About Elemental Royalty Corporation.Elemental Royalty is a new mid-tier, gold-focused streaming and royalty company with a globally diversified portfolio of 16 producing assets and more than 200 royalties, anchored by cornerstone assets and operated by world-class mining partners. Formed through the merger of Elemental Altus and EMX, the Company combines Elemental Altus's track record of accretive royalty acquisitions with EMX's strengths in royalty generation and disciplined growth. This complementary strategy delivers both immediate cash flow and long-term value creation, supported by a best-in-class asset base, diversified production, and sector-leading management expertise.
Elemental Royalty trades on the TSX Venture Exchange under the ticker symbol "ELE", and on the NASDAQ Stock Market under the ticker symbol "ELE".
Neither the TSX Venture Exchange nor its Regulation Services Provider (as that term is defined in policies of the TSX Venture Exchange) accepts responsibility for the adequacy or accuracy of this release.
Qualified PersonDr. Eric P. Jensen, CPG, a Qualified Person as defined by National Instrument 43-101 and employee of the Company, has reviewed, verified and approved the disclosure of the technical information contained in this news release.
Cautionary note regarding forward-looking statementsThis news release contains certain "forward looking statements" and certain "forward-looking information" as defined under applicable Canadian securities laws. Forward-looking statements and information can generally be identified by the use of forward-looking terminology such as "may", "will", "should", "expect", "intend", "estimate", "anticipate", "believe", "continue", "plans" or similar terminology.
Forward-looking statements and information include, but are not limited to, the Company's ability to deliver a materially increased revenue profile with a lower cost of capital, the future growth, development and focus of the Company, and the acquisition of new royalties and streams. Forward-looking statements and information are based on forecasts of future results, estimates of amounts not yet determinable and assumptions that, while believed by management to be reasonable, are inherently subject to significant business, economic and competitive uncertainties and contingencies.
Forward-looking statements and information are subject to various known and unknown risks and uncertainties, many of which are beyond the ability of Elemental Royalty to control or predict, that may cause Elemental Royalty' actual results, performance or achievements to be materially different from those expressed or implied thereby, and are developed based on assumptions about such risks, uncertainties and other factors set out herein, including but not limited to: the impact of general business and economic conditions, the absence of control over the mining operations from which Elemental Royalty will receive royalties, risks related to international operations, government relations and environmental regulation, the inherent risks involved in the exploration and development of mineral properties; the uncertainties involved in interpreting exploration data; the potential for delays in exploration or development activities; the geology, grade and continuity of mineral deposits;; the possibility that future exploration, development or mining results will not be consistent with Elemental Royalty' expectations; accidents, equipment breakdowns, title matters, labour disputes or other unanticipated difficulties or interruptions in operations; fluctuating metal prices; unanticipated costs and expenses; uncertainties relating to the availability and costs of financing needed in the future; the inherent uncertainty of production and cost estimates and the potential for unexpected costs and expenses, commodity price fluctuations; currency fluctuations; regulatory restrictions, including environmental regulatory restrictions; liability, competition, loss of key employees and other related risks and uncertainties. For a discussion of important factors which could cause actual results to differ from forward-looking statements, refer to the annual information form of Elemental Royalty for the year ended December 31, 2024. Elemental Royalty undertakes no obligation to update forward-looking statements and information except as required by applicable law. Such forward-looking statements and information represents management's best judgment based on information currently available. No forward-looking statement or information can be guaranteed, and actual future results may vary materially. Accordingly, readers are advised not to place undue reliance on forward-looking statements or information.
Figure 1. Elemental Royalty interests and projects in the Bor Mining District of Serbia.
To view an enhanced version of this graphic, please visit:https://images.newsfilecorp.com/files/8358/280566_3dabfe0184c6bbcd_001full.jpg
To view the source version of this press release, please visit https://www.newsfilecorp.com/release/280566
As the U.S. stock market navigates a landscape of mixed bank earnings and fluctuating economic data, major indices have recently edged lower, while gold and silver reach new heights. In such an environment, identifying stocks that may be trading below their intrinsic value can present potential opportunities for investors seeking to capitalize on market inefficiencies.
Top 10 Undervalued Stocks Based On Cash Flows In The United States
| Name | Current Price | Fair Value (Est) | Discount (Est) |
| Workiva (WK) | $84.75 | $166.67 | 49.2% |
| WesBanco (WSBC) | $34.58 | $68.86 | 49.8% |
| UMB Financial (UMBF) | $123.30 | $243.75 | 49.4% |
| Motorcar Parts of America (MPAA) | $13.60 | $26.25 | 48.2% |
| Krystal Biotech (KRYS) | $282.01 | $555.39 | 49.2% |
| Investar Holding (ISTR) | $27.62 | $53.60 | 48.5% |
| Horizon Bancorp (HBNC) | $17.65 | $34.30 | 48.5% |
| Fifth Third Bancorp (FITB) | $49.02 | $95.11 | 48.5% |
| Dime Community Bancshares (DCOM) | $31.13 | $60.91 | 48.9% |
| Aptiv (APTV) | $82.61 | $163.62 | 49.5% |
We’ll examine a selection from our screener results.
Overview: The Kroger Co. operates as a food and drug retailer in the United States with a market cap of approximately $39.53 billion.
Operations: Kroger generates revenue primarily through its retail operations, amounting to $147.23 billion.
Estimated Discount To Fair Value: 22.2%
Kroger’s stock appears undervalued based on discounted cash flow analysis, trading over 20% below its estimated fair value of US$80.33. Despite slower revenue growth expectations compared to the market, Kroger’s earnings are forecasted to grow significantly at 29.7% annually, outpacing the broader market. Recent strategic moves include a significant share buyback plan and expanded delivery partnerships with Uber Eats and Instacart, potentially enhancing customer reach and operational efficiency amidst ongoing legal challenges and regulatory scrutiny.
- Upon reviewing our latest growth report, Kroger’s projected financial performance appears quite optimistic.
- Click to explore a detailed breakdown of our findings in Kroger’s balance sheet health report.
KR Discounted Cash Flow as at Jan 2026Lazard
Overview: Lazard, Inc. is a financial advisory and asset management firm with operations across the Americas, Europe, the Middle East, Africa, and the Asia Pacific, holding a market cap of approximately $4.92 billion.
Operations: Lazard, Inc. generates revenue primarily from its Financial Advisory segment at $1.81 billion and Asset Management segment at $1.22 billion.
Estimated Discount To Fair Value: 30.3%
Lazard’s stock is trading over 20% below its estimated fair value of US$77.11, highlighting potential undervaluation based on cash flows. While the company faces unstable dividend history and high debt levels, its earnings are projected to grow significantly at 29.9% annually, surpassing market averages. Recent leadership appointments in the Global Industrials Group may bolster strategic advisory capabilities across key sectors, potentially supporting revenue growth forecasts of 12.5% per year amidst a competitive landscape.
- Insights from our recent growth report point to a promising forecast for Lazard’s business outlook.
- Navigate through the intricacies of Lazard with our comprehensive financial health report here.
LAZ Discounted Cash Flow as at Jan 2026Sociedad Química y Minera de Chile
Overview: Sociedad Química y Minera de Chile S.A. is a global producer and seller of specialty plant nutrients and iodine derivatives, with a market cap of approximately $23.76 billion.
Operations: The company generates revenue from several segments, including Lithium and Derivatives at $2.08 billion, Iodine and Derivatives at $996.40 million, Specialty Plant Nutrition at $957.03 million, Potassium at $182.60 million, and Industrial Chemicals at $74.26 million.
Estimated Discount To Fair Value: 10.5%
Sociedad Química y Minera de Chile trades at US$79.58, about 10.5% below its fair value estimate of US$88.93, suggesting potential undervaluation based on cash flows. Despite high debt levels and a dividend not well covered by earnings, the company has returned to profitability with earnings projected to grow significantly at 28.6% annually, outpacing market averages. Recent strategic alliances in China may enhance long-term growth prospects amidst steady production and sales guidance for 2025.
- Our comprehensive growth report raises the possibility that Sociedad Química y Minera de Chile is poised for substantial financial growth.
- Dive into the specifics of Sociedad Química y Minera de Chile here with our thorough financial health report.
SQM Discounted Cash Flow as at Jan 2026Seize The Opportunity
- Discover the full array of 185 Undervalued US Stocks Based On Cash Flows right here.
- Are any of these part of your asset mix? Tap into the analytical power of Simply Wall St’s portfolio to get a 360-degree view on how they’re shaping up.
- Simply Wall St is your key to unlocking global market trends, a free user-friendly app for forward-thinking investors.
Contemplating Other Strategies?
- Explore high-performing small cap companies that haven’t yet garnered significant analyst attention.
- Diversify your portfolio with solid dividend payers offering reliable income streams to weather potential market turbulence.
- Fuel your portfolio with companies showing strong growth potential, backed by optimistic outlooks both from analysts and management.
This article by Simply Wall St is general in nature. We provide commentary based on historical data
and analyst forecasts only using an unbiased methodology and our articles are not intended to be financial advice.
It does not constitute a recommendation to buy or sell any stock, and does not take account of your objectives, or your
financial situation. We aim to bring you long-term focused analysis driven by fundamental data.
Note that our analysis may not factor in the latest price-sensitive company announcements or qualitative material.
Simply Wall St has no position in any stocks mentioned.
Companies discussed in this article include KR LAZ and SQM.
This article was originally published by Simply Wall St.
Have feedback on this article? Concerned about the content? Get in touch with us directly. Alternatively, email editorial-team@simplywallst.com
Morgan Stanley (MS)
Morgan Stanley (MS) jumped nearly 6% on Thursday and rose again in pre-market trading on Friday after reporting upbeat fourth-quarter results, which exceeded Wall Street expectations on the back of strong revenue from wealth management.
Fourth-quarter net income rose to $4.40bn, or $2.68 per share, from $3.71bn, or $2.22 per share, a year ago. Revenue increased to $17.89bn from $16.22bn a year ago.
The wealth management unit posted $8.4bn in net revenue in the most recent quarter, up from $7.5bn a year earlier. For the full year, the division generated a record $31.8bn in net revenue.
Total client assets in the wealth and investment management business climbed to $9.3tn, fuelled by more than $350 billion in net new assets.
“Morgan Stanley delivered outstanding performance in 2025,” Ted Pick, the bank’s chief executive and chairman, said in a statement. “Our performance reflects multi-year investments which have contributed to growth and momentum across the integrated firm.”
Morgan Stanley shares have gained more than 43% over the past 12 months.
Anglo American (AAL.L)
London’s listed miners were among the worst performers in the city this morning, with the likes of Anglo American down as much as 1.8% after opening.
It comes as copper prices are down around 2% morning amid reports that Chinese regulators have ordered exchanges to remove servers operated by high-frequency traders from their datacentres.
The Shanghai Futures Exchange, a major metals trading platform, has told brokers they need to get equipment for high-speed clients out by the end of the month, according to a report by Bloomberg. Other clients will need to do so by the end of April, it reported.
Endeavour Mining (EDV.L), Rio Tinto (RIO.L), Antofagasta (ANTO.L), and Glencore (GLEN.L) also lost ground in London on Friday.
Read more: Stocks that are trending today
Genus (GNS.L)
Shares in the biotech business Genus surged as much as 10% this morning, to the top of the FTSE 250 (^FTMC), up around 8% at the time of writing, as it beat expectations for its half-year trading update.
The animal genetics company has forecasted about £50m in actual currency for its adjusted pre-tax profit.
The London-listed business said it had performed strongly in the six months to 31 December, and expects adjusted pre-tax profits to come in around £50m in actual currency, ahead of internal forecasts.
Last September, the company struck a deal to accelerate its 49%-owned porcine joint venture with BCA in China. Genus confirmed that it had received approval from the relevant authorities in China, trigging the $7.5m milestone payment.
Analysts at the broker Peel Hunt credited its earnings beat to strong performance in its pig breeding business.
The Basingstoke-based firm helps farmers breed animals with certain traits such as disease resistance and faster growth. It operates in more than 25 countries, with research laboratories in Wisconsin.
BAE Systems (BA.L)
BAE Systems rose on Friday, up 1.6% at the time of writing, along with other defence-related firms such as Babcock (BAB.L) and Rolls-Royce (RR.L).
It came as Nato personnel from a number of European countries landed in Greenland for an exercise after Trump seeks to own the country, which is a semi-autonomous part of Denmark.
He doubled down on his bid to bring Greenland under US control, telling reporters in the Oval Office, "we need Greenland for national security". Although he did not rule out the use of force, he said late on Wednesday that he thought something could be worked out with Denmark.
"The problem is there's not a thing that Denmark can do about it if Russia or China wants to occupy Greenland, but there's everything we can do. You found that out last week with Venezuela."
Speaking to reporters on Thursday, White House press secretary Karoline Leavitt said she didn't think the deployment of additional European troops to Greenland would impact the president's decision-making process on the Arctic territory. She added: "Nor does it impact his goal of the acquisition of Greenland at all."
Neil Wilson, UK investor strategist at Saxo Markets, said it was "hardly a show of force, but a reminder of what's at stake here".
Download the Yahoo Finance app, available for Apple and Android.
The FTSE 100 (^FTSE) and European stocks had moved lower on Friday, while tech was a bright spot among US indices, as a volatile week comes to a close.
Chipmakers TSMC (TSM) and Nvidia (NVDA) eyed more gains, thanks in part to a US-Taiwan trade deal that promises a $250bn boost to American chip and tech manufacturing.
On Thursday, shares in TSMC popped following a strong quarterly report that revived AI enthusiasm to buoy related stocks more widely.
Meanwhile in Europe, commodities prices have been on a rollercoaster this week as investors looked to precious metals to retreat from risk.
"Copper has been signalling strong economic growth in 2026 — in nominal terms at least," said Neil Wilson, UK investor strategist at Saxo Markets.
"Apparently, China has moved to clamp down on some high frequency traders at the Shanghai Futures Exchange, which has knocked prices down from record highs, while nickel and tin were also lower."
The world has also been watching to see if president Donald Trump will make orders to send troops to Iran amid widespread and violent anti-government protests. While he said earlier in the week that he had been told the killing had stopped, more than 2,400 people have lost their lives in the unrest, according to human rights groups.
Oil prices were higher on Friday afternoon as the chance of increased US presence in Iran cooled, with brent crude futures (BZ=F) trading up more than 1% and West Texas Intermediate (CL=F) rising 1.1%.
Market movers
-
The FTSE 100 (^FTSE) pulled back from all-time highs, dragged 0.1% lower by commodity stocks as precious metal prices lost momentum.
-
Miners Antofagasta (ANTO.L), Glencore (GLEN.L), Anglo American (AAL.L) and Rio Tinto (RIO.L) were among the top fallers in the index by the closing bell
-
Germany's DAX (^GDAXI) dipped 0.3% as its consumer price index data came in in line with expectations.
-
The CAC 40 (^FCHI) in Paris dropped 0.8%.
-
The pan-European STOXX 600 (^STOXX) lost 0.1%.
-
The pound rose slightly against the dollar (GBPUSD=X) to trade below the $1.34 mark.
-
The tech-heavy Nasdaq Composite (^IXIC) was just above the flatline, while the S&P 500 (^GSPC) added nearly 0.1%. The Dow Jones Industrial Average (^DJI) nudged 0.1% lower after stocks reversed a two-day losing streak on Thursday.
Download the Yahoo Finance app, available for Apple and Android.
Southern Copper (SCCO) has been one of the most searched-for stocks on Zacks.com lately. So, you might want to look at some of the facts that could shape the stock's performance in the near term.
Shares of this miner have returned +27.4% over the past month versus the Zacks S&P 500 composite's +1.6% change. The Zacks Mining – Non Ferrous industry, to which Southern Copper belongs, has gained 26.4% over this period. Now the key question is: Where could the stock be headed in the near term?
Although media reports or rumors about a significant change in a company's business prospects usually cause its stock to trend and lead to an immediate price change, there are always certain fundamental factors that ultimately drive the buy-and-hold decision.
Revisions to Earnings Estimates
Rather than focusing on anything else, we at Zacks prioritize evaluating the change in a company's earnings projection. This is because we believe the fair value for its stock is determined by the present value of its future stream of earnings.
Our analysis is essentially based on how sell-side analysts covering the stock are revising their earnings estimates to take the latest business trends into account. When earnings estimates for a company go up, the fair value for its stock goes up as well. And when a stock's fair value is higher than its current market price, investors tend to buy the stock, resulting in its price moving upward. Because of this, empirical studies indicate a strong correlation between trends in earnings estimate revisions and short-term stock price movements.
For the current quarter, Southern Copper is expected to post earnings of $1.44 per share, indicating a change of +42.6% from the year-ago quarter. The Zacks Consensus Estimate has changed -1.3% over the last 30 days.
The consensus earnings estimate of $5.3 for the current fiscal year indicates a year-over-year change of +22.4%. This estimate has changed +1.8% over the last 30 days.
For the next fiscal year, the consensus earnings estimate of $6.25 indicates a change of +17.8% from what Southern Copper is expected to report a year ago. Over the past month, the estimate has changed +1.8%.
Having a strong externally audited track record, our proprietary stock rating tool, the Zacks Rank, offers a more conclusive picture of a stock's price direction in the near term, since it effectively harnesses the power of earnings estimate revisions. Due to the size of the recent change in the consensus estimate, along with three other factors related to earnings estimates, Southern Copper is rated Zacks Rank #3 (Hold).
The chart below shows the evolution of the company's forward 12-month consensus EPS estimate:
12 Month EPS
Projected Revenue Growth
While earnings growth is arguably the most superior indicator of a company's financial health, nothing happens as such if a business isn't able to grow its revenues. After all, it's nearly impossible for a company to increase its earnings for an extended period without increasing its revenues. So, it's important to know a company's potential revenue growth.
In the case of Southern Copper, the consensus sales estimate of $3.62 billion for the current quarter points to a year-over-year change of +30.1%. The $13.17 billion and $14.49 billion estimates for the current and next fiscal years indicate changes of +15.2% and +10%, respectively.
Last Reported Results and Surprise History
Southern Copper reported revenues of $3.38 billion in the last reported quarter, representing a year-over-year change of +15.2%. EPS of $1.35 for the same period compares with $1.15 a year ago.
Compared to the Zacks Consensus Estimate of $3.04 billion, the reported revenues represent a surprise of +11.09%. The EPS surprise was +8%.
Over the last four quarters, Southern Copper surpassed consensus EPS estimates three times. The company topped consensus revenue estimates each time over this period.
Valuation
No investment decision can be efficient without considering a stock's valuation. Whether a stock's current price rightly reflects the intrinsic value of the underlying business and the company's growth prospects is an essential determinant of its future price performance.
Comparing the current value of a company's valuation multiples, such as its price-to-earnings (P/E), price-to-sales (P/S), and price-to-cash flow (P/CF), to its own historical values helps ascertain whether its stock is fairly valued, overvalued, or undervalued, whereas comparing the company relative to its peers on these parameters gives a good sense of how reasonable its stock price is.
The Zacks Value Style Score (part of the Zacks Style Scores system), which pays close attention to both traditional and unconventional valuation metrics to grade stocks from A to F (an A is better than a B; a B is better than a C; and so on), is pretty helpful in identifying whether a stock is overvalued, rightly valued, or temporarily undervalued.
Southern Copper is graded D on this front, indicating that it is trading at a premium to its peers. Click here to see the values of some of the valuation metrics that have driven this grade.
Bottom Line
The facts discussed here and much other information on Zacks.com might help determine whether or not it's worthwhile paying attention to the market buzz about Southern Copper. However, its Zacks Rank #3 does suggest that it may perform in line with the broader market in the near term.
Want the latest recommendations from Zacks Investment Research? Today, you can download 7 Best Stocks for the Next 30 Days. Click to get this free report
Southern Copper Corporation (SCCO) : Free Stock Analysis Report
This article originally published on Zacks Investment Research (zacks.com).
Rio Tinto Group RIO reported solid growth in iron ore production in the third quarter of 2025. During the quarter, Pilbara iron ore shipments reached 84.3 million tons, increasing 6% from the previous quarter. The company’s total Pilbara iron ore production stood at 84.1 million tons, reflecting robust output despite weather-related disruptions earlier in the year.The robust performance was primarily supported by Rio Tinto’s Pilbara operations in Western Australia. The Gudai-Darri project achieved its highest-ever quarterly production in the third quarter, operating at a run rate of 51 million tons per annum, while shipments rose on a sequential basis despite planned maintenance and infrastructure works. The successful rollout of the new Pilbara Blend product strategy also contributed to improved product mix, with lower SP10 volumes as planned.Also, several major growth projects of the company are progressing. In December 2025, RIO’s Rhodes Ridge joint venture approved a $191 million feasibility study to develop one of the world’s major undeveloped iron ore deposits in Western Australia, aiming for an initial annual production of 40-50 million tons. The study is expected to conclude in 2029. In October 2025, at the Simandou iron ore project in Guinea, the first ore was loaded and transported, marking the start of commissioning across the mine, rail and port infrastructure.The strong quarterly performance, supported by record output at the Gudai-Darri facility and improved system efficiency across the Pilbara, highlights Rio Tinto’s operational strength in iron ore. Major growth projects, such as Rhodes Ridge and Simandou, are advancing steadily, positioning the company well for long-term growth.
Snapshot of RIO’s Peers
Among its major peers, Vale S.A.’s VALE Iron Solutions segment generated net operating revenues of around $8.42 billion in the third quarter of 2025, which marked 5.7% growth from last year’s comparable quarter. Vale’s total iron ore shipments were up 5% from the year-ago quarter. Vale’s average realized iron ore fines price increased 4% year over year to $94.40 per ton.Its other peer, BHP Group Limited BHP, produced a record 263 Mt of iron ore in fiscal 2025. This came within BHP Group’s guidance of 255-265.5 Mt and was up 1% year over year. Production at BHP Group’s Western Australia Iron Ore was a record of 257 Mt (290 Mt on a 100% basis).
RIO's Price Performance, Valuation & Estimates
Shares of Rio Tinto have gained 43.8% in the past six months compared with the industry’s growth of 27.3%.
Image Source: Zacks Investment Research
From a valuation standpoint, RIO is trading at a forward price-to-earnings ratio of 12.13X, below the industry’s average of 17.56X. Rio Tinto carries a Value Score of B.
Image Source: Zacks Investment Research
The Zacks Consensus Estimate for RIO’s 2026 earnings has been on the rise over the past 60 days.
Image Source: Zacks Investment Research
Rio Tinto currently sports a Zacks Rank #1 (Strong Buy). You can see the complete list of today’s Zacks #1 Rank stocks here.
Want the latest recommendations from Zacks Investment Research? Today, you can download 7 Best Stocks for the Next 30 Days. Click to get this free report
BHP Group Limited Sponsored ADR (BHP) : Free Stock Analysis Report
VALE S.A. (VALE) : Free Stock Analysis Report
Rio Tinto PLC (RIO) : Free Stock Analysis Report
This article originally published on Zacks Investment Research (zacks.com).
An updated edition of the November 25, 2025 article.Nuclear energy is gaining renewed recognition as a vital solution for meeting the world’s rising demand for clean electricity. As utilities transition toward low-carbon power sources, nuclear plants stand out for their ability to provide reliable, carbon-free generation. Unlike solar and wind, which are dependent on weather conditions, nuclear power delivers stable, round-the-clock output. The recent restart of a previously shuttered U.S. nuclear facility underscores the sector’s revival and reflects growing investor interest in nuclear energy stocks.The nuclear energy sector is gaining traction as updated regulations and R&D advance microreactors and small modular reactors. Growing 24/7 clean energy demand from AI data centers, manufacturing reshoring, and electric vehicles is driving new opportunities, while government efforts to bolster domestic uranium supply further support the industry’s momentum.Nuclear power plant operators began the year on a strong footing. Meta Platforms META has entered into long-term nuclear power agreements with Vistra Corp. VST, TerraPower and Oklo Inc. OKLO to secure up to 6.6 gigawatts of nuclear capacity by 2035. Previously, META also signed a long-term agreement with Constellation Energy to procure 1.12 GW of clean nuclear power.With this increasing importance, nuclear energy-related stocks, such as NextEra Energy NEE, Vistra and Oklo, are becoming attractive investment options. Unlike other clean energy sources affected by intermittency, nuclear power plants provide a consistent and stable energy output, operating around the clock except during planned maintenance intervals.Compared with other clean energy sources, nuclear power requires significantly less land to generate the same amount of clean electricity. Additionally, while all traditional energy sources produce waste, nuclear energy stands apart for its highly regulated, secure and systematic approach to waste management and storage. Increasing adoption of electric vehicles, rising demand from the power grids and development of large artificial intelligence-powered data centers are increasing the importance of nuclear power plants.Nuclear Energy stocks have huge potential in the energy space and can offer significant growth opportunities for investors. Our Nuclear Energy Screen makes it easier for investors to locate high-potential stocks at any given time. Apart from the stocks mentioned above, investors can also explore stocks like Ameren Corporation AEE and BHP Group Limited BHP for a stable return in the nuclear energy space.Ready to uncover more transformative thematic investment ideas? Explore 36 cutting-edge investment themes with Zacks Thematic Investing Screens and discover your next big opportunity.NextEra Energy operates several nuclear generation units through its subsidiary, NextEra Energy Resources. NEE’s nuclear assets form a cornerstone of its clean energy strategy, delivering steady, carbon-free baseload power that complements its leading wind and solar portfolio. This diverse generation mix strengthens grid reliability and underpins sustainable long-term earnings growth.Ongoing investments in the upkeep and modernization of its nuclear facilities ensure top-tier operational performance, safety and regulatory adherence. These plants offer long service lives, low operating costs and protection from swings in fossil fuel prices.Last year, NextEra Energy announced two major agreements with Google aimed at strengthening U.S. nuclear leadership and supplying the rising energy needs of AI with clean, reliable nuclear power.This Zacks Rank #2 (Buy) company has a very disciplined capital investment plan, targeting more than $74 billion through 2029, which is expected to fund the expansion of its renewable and storage capacity. You can see the complete list of today’s Zacks #1 Rank (Strong Buy) stocks here.Vistra Corp. offers a strong long-term investment case, supported by its diversified generation portfolio and expanding leadership in nuclear energy. The acquisition of Energy Harbor meaningfully scaled its nuclear capacity, while long-term power purchase agreements, including a 2,600 megawatt (MW), 20-year nuclear supply deals with Meta, position the company to capitalize on growing demand for reliable, clean power from data centers and AI-driven infrastructure.Vistra’s six nuclear reactors have received a license extension, ensuring continued reliable generation of emission-free electricity in key markets. These six nuclear reactors have the capacity to generate more than 6,500 MW of emission-free energy, enough to power about 3.25 million homes.This Zacks Rank #3 (Hold) stock has a comprehensive hedging program, which lessens the impact of short-term price fluctuations. Oklo Inc.’s small-scale nuclear reactors are gaining traction as an effective solution to address the rapidly growing energy demands of industries like data centers. These small modular reactors are based on liquid-metal-cooled, metal-fueled fast-reactor technology. Oklo has deliberately selected this established technology to lower technical risk, prioritizing systems with proven performance over untested designs.OKLO also signed a long-term power supply agreement with META. Per the agreement, OKLO will supply nearly 1.2 gigawatts to meet the energy demand from Meta’s large-scale data centers. This Zacks Rank #3 stock has developed the Aurora Powerhouse reactor, having a maximum power generation capacity of 75 MW.
Want the latest recommendations from Zacks Investment Research? Today, you can download 7 Best Stocks for the Next 30 Days. Click to get this free report
Ameren Corporation (AEE) : Free Stock Analysis Report
NextEra Energy, Inc. (NEE) : Free Stock Analysis Report
BHP Group Limited Sponsored ADR (BHP) : Free Stock Analysis Report
Vistra Corp. (VST) : Free Stock Analysis Report
Meta Platforms, Inc. (META) : Free Stock Analysis Report
Oklo Inc. (OKLO) : Free Stock Analysis Report
This article originally published on Zacks Investment Research (zacks.com).
This article first appeared on GuruFocus.
Rio Tinto (NYSE:RIO) and BHP (NYSE:BHP) are coming together for one of their biggest collaborations in years, agreeing to jointly tap up to 200 million tonnes of iron ore in Western Australia's Pilbara region.
The two miners signed non binding agreements to look at developing neighboring deposits and sharing infrastructure across their Yandicoogina and Yandi operations. Instead of spending heavily on new projects, the focus is on getting more out of what's already there, including potentially developing Rio Tinto's Wunbye deposit and processing ore from BHP's Yandi Lower Channel through Rio's existing wet plants.
- Warning! GuruFocus has detected 9 Warning Signs with RIO.
- Is RIO fairly valued? Test your thesis with our free DCF calculator.
Executives from both companies framed the move as a practical response to rising costs and declining ore grades across the Pilbara. Rio Tinto iron ore chief Matthew Holcz said the partnership allows both sides to unlock extra production with minimal capital spending, while BHP's Tim Day called it a clear example of productivity gains through cooperation.
The Pilbara remains one of the world's most important iron ore regions, supplying steelmakers across Asia. The tie up also builds on a 2023 agreement that opened up mining along a shared boundary that was previously off limits, showing how rivals are finding common ground as industry pressures grow.
Coeur Mining, Inc. CDE has gained 235.7% over the past year compared with the Zacks Mining-Non Ferrous industry’s 85.9% increase and the S&P 500’s 20% rise.
Among its peers, Southern Copper Corporation SCCO and Lundin Mining Corporation LUNMF have risen 85.1% and 188.1%, respectively.
Price Performance CDE vs. Industry, S&P 500, SCCO & LUNMFZacks Investment Research
Image Source: Zacks Investment Research
Technical indicators show that CDE has been trading above its 50-day and 200-day simple moving averages (SMA). The 50-day SMA is reading higher than the 200-day SMA, indicating a bullish trend.
Zacks Investment Research
Image Source: Zacks Investment Research
Let’s look at the CDE’s fundamentals to analyze the stock better.
CDE’s Multi-Mine Strength Drives Strong Q3
Coeur Mining reported consolidated revenues of roughly $555 million for the third quarter of 2025, which represented a substantial 77 % year-over-year increase. This jump was driven by higher realized metal prices, increased sales volumes and balanced contributions from each of the company’s five wholly owned North American gold and silver operations.
Coeur Mining’s diversified North American portfolio, which spans the Las Chispas silver-gold mine in Sonora, the Palmarejo gold-silver complex in Chihuahua, the Rochester silver-gold mine in Nevada, the Kensington gold operation in Alaska and the Wharf gold mine in South Dakota, was a key driver of its strong quarterly results. The company noted that revenue contributions were evenly spread across these five assets, with Palmarejo generating about 23%, Kensington 22%, Rochester 20%, Wharf 18% and Las Chispas roughly 17% of total third-quarter revenues.
This balanced operational mix allowed Coeur Mining to fully capitalize on higher metal prices and robust production levels across multiple regions, leading to better operational execution, reduced reliance on any single asset and reinforced the company’s overall growth trajectory across its North American footprint.
Cash Surge and Deleveraging Fuel Coeur Mining’s Momentum
The company’s financial transformation underpins a more resilient business model, deleveraging rapidly while still funding growth and returning capital. Coeur Mining ended the third quarter with a significantly strengthened financial footing, holding $266.3 million in cash and equivalents, more than double its previous quarter's balance.
Coeur Mining generated $237.7 million in cash flow from operating activities during the third quarter, a strong increase from $206.95 million in the previous quarter. This robust operating cash flow forms a foundation for Coeur’s capital deployment strategy, supporting capex, debt repayment and its shareholder return initiatives.
CDE repaid more than $228 million of debt during the first nine months of 2025, reducing its total debt to $363.5 million and bringing its net-leverage ratio down to a very conservative 0.1X.
Coeur Mining invested $49 million in capital expenditures in the third quarter, of which about 70% was allocated to sustaining capex and 30% toward development projects. On the exploration front, the company spent $30 million, with $25 million expensed and $5 million capitalized, signaling a dual focus on reserve maintenance and future growth.
The cash cushion not only provides flexibility for further expansion but also reduces risk in a volatile commodity price environment.
CDE’s Growth Projects Set Up Next Revenue Expansion
The Rochester silver-gold mine in Nevada remains one of Coeur Mining’s most important growth engines. A major expansion project completed over the past few years has significantly increased the mine’s throughput capacity, with the new Stage VI leach pad and enhanced crushing circuit now in commercial production.
Coeur Mining’s acquisition of Las Chispas brought a high-grade, low-cost silver-gold asset into its portfolio early in 2025, contributing meaningfully to production and top-line results, including in the third quarter. Las Chispas’ strong performance has enhanced the overall production mix and cash flow and is expected to continue supporting revenue growth as the asset is fully integrated and optimized.
Coeur Mining is executing one of its largest exploration programs to date, with substantial drilling underway at Palmarejo, Kensington, Wharf, Rochester and Las Chispas, aimed at extending mine lives, improving grades and expanding reserves. The company announced a commitment of $67-$77 million for the same.
At the Silvertip project in British Columbia, Coeur Mining has more than tripled its land position and is undertaking expanded drilling programs aimed at increasing understanding of this polymetallic deposit. Early indicators suggest the potential for significant future resource additions.
What CDE’s Estimate Revisions Indicate
The Zacks Consensus Estimate for 2025 and 2026 for CDE has been revised lower and higher, respectively, over the past 60 days.
Zacks Investment Research
Image Source: Zacks Investment Research
The Zacks Consensus Estimate for CDE’s 2025 earnings is currently pegged at 76 cents per share, suggesting year-over-year growth of 322.2%.
Zacks Investment Research
Image Source: Zacks Investment Research
Coeur Trading Above Industry
Coeur Mining is currently trading at a forward 12-month price-to-sales multiple of 4.96X, above the industry’s average of 4.84X.
Zacks Investment Research
Image Source: Zacks Investment Research
The forward 12-month price-to-sales multiples for Southern Copper and Lundin Mining are 10.14X and 5.16X, respectively. CDE, SCCO and LUNMF currently have a Value Score of D, each.
Final Thought: Buy CDE Shares
Coeur Mining is transitioning into a breakout phase marked by accelerating revenue, surging cash flow and one of the industry’s fastest deleveraging cycles. Balanced contributions from strong-performing mines and a cash balance that has more than doubled in the last reported quarter signal a business firing on all cylinders. Rochester’s ramp-up, Las Chispas’ high-grade boost and a large exploration push position Coeur Mining for meaningful production and cash-flow growth, reinforced by better fundamentals, rising metal prices and a much stronger balance sheet. CDE is emerging as one of the most compelling high-upside plays in the North American mining sector, a standout pick for investors looking for powerful leverage to the next surge in gold and silver.
CDE currently carries a Zacks Rank of #1 (Strong Buy) You can see the complete list of today’s Zacks #1 Rank stocks here.
Want the latest recommendations from Zacks Investment Research? Today, you can download 7 Best Stocks for the Next 30 Days. Click to get this free report
Southern Copper Corporation (SCCO) : Free Stock Analysis Report
Coeur Mining, Inc. (CDE) : Free Stock Analysis Report
Lundin Mining Corp. (LUNMF) : Free Stock Analysis Report
This article originally published on Zacks Investment Research (zacks.com).
Southern Copper (SCCO) closed the most recent trading day at $182.97, moving +1.5% from the previous trading session. This change outpaced the S&P 500's 0.26% gain on the day. Meanwhile, the Dow experienced a rise of 0.6%, and the technology-dominated Nasdaq saw an increase of 0.25%.
Heading into today, shares of the miner had gained 27.44% over the past month, outpacing the Basic Materials sector's gain of 8.62% and the S&P 500's gain of 1.57%.
The upcoming earnings release of Southern Copper will be of great interest to investors. The company is expected to report EPS of $1.44, up 42.57% from the prior-year quarter. Alongside, our most recent consensus estimate is anticipating revenue of $3.62 billion, indicating a 30.11% upward movement from the same quarter last year.
Regarding the entire year, the Zacks Consensus Estimates forecast earnings of $5.3 per share and revenue of $13.17 billion, indicating changes of +22.4% and 0%, respectively, compared to the previous year.
It's also important for investors to be aware of any recent modifications to analyst estimates for Southern Copper. Such recent modifications usually signify the changing landscape of near-term business trends. Therefore, positive revisions in estimates convey analysts' confidence in the business performance and profit potential.
Based on our research, we believe these estimate revisions are directly related to near-term stock moves. To take advantage of this, we've established the Zacks Rank, an exclusive model that considers these estimated changes and delivers an operational rating system.
The Zacks Rank system, ranging from #1 (Strong Buy) to #5 (Strong Sell), possesses a remarkable history of outdoing, externally audited, with #1 stocks returning an average annual gain of +25% since 1988. Within the past 30 days, our consensus EPS projection has moved 1.83% higher. Southern Copper presently features a Zacks Rank of #3 (Hold).
From a valuation perspective, Southern Copper is currently exchanging hands at a Forward P/E ratio of 28.85. This represents a premium compared to its industry average Forward P/E of 27.92.
Investors should also note that SCCO has a PEG ratio of 1.51 right now. Comparable to the widely accepted P/E ratio, the PEG ratio also accounts for the company's projected earnings growth. The Mining – Non Ferrous was holding an average PEG ratio of 0.74 at yesterday's closing price.
The Mining – Non Ferrous industry is part of the Basic Materials sector. With its current Zacks Industry Rank of 20, this industry ranks in the top 9% of all industries, numbering over 250.
The Zacks Industry Rank evaluates the power of our distinct industry groups by determining the average Zacks Rank of the individual stocks forming the groups. Our research shows that the top 50% rated industries outperform the bottom half by a factor of 2 to 1.
Don't forget to use Zacks.com to keep track of all these stock-moving metrics, and others, in the upcoming trading sessions.
Want the latest recommendations from Zacks Investment Research? Today, you can download 7 Best Stocks for the Next 30 Days. Click to get this free report
Southern Copper Corporation (SCCO) : Free Stock Analysis Report
This article originally published on Zacks Investment Research (zacks.com).
Thursday, January 15, 2026The Zacks Research Daily presents the best research output of our analyst team. Today's Research Daily features new research reports on 16 major stocks, including American Express Co. (AXP), Intuitive Surgical, Inc. (ISRG) and Booking Holdings Inc. (BKNG), as well as two micro-cap stocks Daily Journal Corp. (DJCO) and Star Group, L.P. (SGU). The Zacks microcap research is unique as our research content on these small and under-the-radar companies is the only research of its type in the country.These research reports have been hand-picked from the roughly 70 reports published by our analyst team today.You can see all of today’s research reports here >>>Ahead of Wall StreetThe daily 'Ahead of Wall Street' article is a must-read for all investors who would like to be ready for that day's trading action. The article comes out before the market opens, attempting to make sense of that morning's economic releases and how they will affect that day's market action. You can read this article for free on our home page and can actually sign up there to get an email notification as this article comes out each morning.You can read today's AWS here >>> Pre-Markets Positive on Healthy Economic PrintsToday's Featured Research ReportsAmerican Express’ shares have outperformed the Zacks Financial – Miscellaneous Services industry over the past six months (+15.4% vs. -16%). The company is benefiting from sustained revenue growth driven by new product launches, strategic partnerships and a rebound in travel and entertainment spending. Revenues rose 9% YoY in the first nine months of 2025. Strong cash generation and disciplined capital returns underscore its financial strength. Its ROE of 33.4% lies above the industry average. It returned $2.9 billion in 3Q alone, through dividends and buybacks. Its focus on increasing tech-savvy customers positions it for long-term growth. However, persistently rising expenses continue to weigh on margins. Loan loss provisions remain elevated due to macro uncertainty. It is less agile in capitalizing on emerging non-card-based payment trends. AXP carries a heavy debt load, which induces the incurrence of high interest expenses. As such, the stock warrants a cautious stance.(You can read the full research report on American Express here >>>)Shares of Intuitive Surgical’s have gained +6.6% over the past six months against the Zacks Medical – Instruments industry’s gain of +11.6%. The company delivered a strong third-quarter, beating revenue and EPS estimates. The da Vinci 5 system gained momentum with 240 U.S. placements, raising its installed base to 929, alongside approvals in Europe and Japan for phased rollout. Utilization surpassed the Xi platform, supported by force feedback and Case Insights, while rising trade-ins highlighted upgrade demand. Global procedures grew 19% year over year, with 16% growth in the U.S. and 24% OUS, driven by benign general and non-urology surgeries in India, Korea, and distributor markets. System placements totaled 427, showing strong demand. However, gross margin slipped on higher costs and tariffs, while OUS markets remain pressured by budget constraints. Medicaid policy uncertainty is a risk, but ISRG raised 2025 growth guidance to 17–17.5% and margins to 67–67.5%.(You can read the full research report on Intuitive Surgical here >>>)Booking’s shares have gained +7.1% over the past year against the Zacks Internet – Commerce industry’s gain of +11.1%. The company benefits from its global footprint, strong brands and growing shift toward direct-channel bookings, which support margins and customer loyalty. Expansion into alternative accommodations, transport and attractions, alongside the Connected Trip strategy and increased GenAI integration, boosts engagement and cross-selling. Strong liquidity, solid cash generation and deep partner relationships further reinforce its position. Additionally, its focus on automating partner tools and traveler interactions enhances operational efficiency and satisfaction. However, softness in U.S. travel trends, elevated marketing spend and rising competitive pressure pose challenges. Its limited domestic presence may also restrict growth as affordability trends impact pricing power, and it faces strong competition from online travel agencies.(You can read the full research report on Booking here >>>)Shares of Daily Journal have outperformed the Zacks Publishing – Newspapers industry over the past six months (+61.8% vs. +35.5%). This microcap company with a market capitalization of $894.14 million has its shareholder value anchored by a $493 million marketable securities portfolio, which delivered $134.3 million in unrealized gains in FY25. Despite the passing of Charles Munger, the board continues to conservatively manage these assets, providing liquidity without external capital needs. Journal Technologies is accelerating, with FY25 revenues rising 32% YoY to $69.9 million and pretax income rising to $12.7 million, fueled by demand for e-filing and milestone-based contracts. The company’s capital-light model, $500.4 million in working capital, and positive $13.3 million operating cash flow support reinvestment. While growth is robust, risks include government revenue timing, rising competition in justice tech, and legal ad revenue headwinds from legislative changes. Underutilized real estate also weighs on efficiency. DJCO trades at 4.57X EV/sales and 2.29X P/B, below sector medians. (You can read the full research report on Daily Journal here >>>)Star Group’s shares have gained +9.4% over the past six months against the Zacks Electronics – Miscellaneous Products industry’s gain of +25.9%. This microcap company with a market capitalization of $403.63 million is a consolidator in a fragmented Northeast/Mid-Atlantic heating oil and propane market, using tuck-in M&A to build route density, lift efficiency and strengthen margins. Management has shown an ability to protect profitability through pricing discipline, cost control and effective integration, while expanding HVAC services to diversify revenues, deepen customer relationships and provide a counter-seasonal earnings buffer. Capital allocation remains shareholder-friendly, yet flexible, and selective tech/AI adoption should improve service productivity and retention over time. Key risks center on persistent customer attrition and limited organic growth, weather-driven earnings volatility, rising fixed costs and financing burden tied to acquisitions, tighter cash-flow flexibility amid seasonal working-capital swings, and longer-term regulatory and electrification pressures in core markets.(You can read the full research report on Star Group here >>>)Other noteworthy reports we are featuring today include Southern Copper Corp. (SCCO), Fastenal Co. (FAST) and Take-Two Interactive Software, Inc. (TTWO).Mark VickerySenior EditorNote: Sheraz Mian heads the Zacks Equity Research department and is a well-regarded expert of aggregate earnings. He is frequently quoted in the print and electronic media and publishes the weekly Earnings Trends and Earnings Preview reports. If you want an email notification each time Sheraz publishes a new article, please click here>>>
Today's Must Read
AmEx (AXP) Aided by Strong Card Member Spending Amid High Costs
Intuitive Surgical's (ISRG) da Vinci System Helps Offset Risks
Booking Holdings Benefits From Strong Leisure Travel Demand
Featured Reports
High Prices Aid Southern Copper (SCCO), Lower Production AilThe Zacks analyst believes Southern Copper is poised well to gain on high copper and silver prices and its expansion actions. However lower production levels due to lower grades might impair results.
Sales Boosting Initiatives Aid Fastenal (FAST) Amid High CostsPer the Zacks analyst, Fastenal's prospects are gaining from accretive sales boosting initiatives and cost control efforts. However, a tepid macro scenario, high costs and seasonality return hurt.
TEVA's New Drugs and Generic Stability Are Reviving GrowthThe Zacks analyst believes newer drugs, Austedo and Ajovy as well as a stable generics business are reviving its top-line growth.
CardFree Acquisition Aids Fiserv (FISV) Amid High CompletionPer the Zacks Analyst, Fiserv's CardFree buyout improves Clover's capabilities to support small businesses as they grow into larger merchants. Rising competition from other players is an overhang.
SWP Demand, Buyouts, AUM Aid SEI Investments (SEIC), High Costs AilPer the Zacks analyst, rising demand for the SWP, solid assets under management balance, strategic buyouts and global presence will support SEI Investments' growth, while mounting expenses are a woe.
Expanding Customer Base, Steady Investment Aid Spire (SR)Per the Zacks analyst, Spire is seeing stronger demand from its increasing customer base. Infrastructure investments are enhancing service capacity and supporting improved profitability.
Product Refreshes Aid Sonos (SONO) Amid Weak Macro BackdropPer the Zacks analyst, Sonos is poised to gain from new product launches in the global audio market, while cautious consumer discretionary spending amid a weak macroeconomic environment is a woe.
New Upgrades
Strong Portfolio Aids Take Two (TTWO) Amid Stiff CompetitionPer the Zacks analyst, Take-Two's popular franchises including NBA 2K26 and Grand Theft Auto V is helping it to counter stiff competition from the likes of EA and Activision Blizzard.
Rapid Project Execution and Volume Growth Aids Cenovus Energy (CVE)Per the Zacks analyst, CVE's rapid project executions are expected to accelerate future cash flows. Its targeted upstream production growth through 2028 should further enhance profitability.
Diversified Business and SMBs Expansions Aid BILL Holdings (BILL)Per the Zacks Analyst, BILL Holdings is likely to gain from its diversified business model, expansions into the SMB ecosystem and the adoption of its AI-powered financial operations platform.
New Downgrades
Home Depot (HD) Pressured by Weak Discretionary Unit and High CostsPer Zacks analyst, Home Depot sees softness in big-ticket and discretionary categories. It witnesses margin pressures driven by operating expense deleverage and costs related to the GMS acquisition.
China's slowdown and tariff risks hurt Philips (PHG) prospectsPer the Zacks analyst, Philips suffers from a sharp China slowdown and tariff uncertainties, which are affecting segment growth and limiting near-term upside.
Bath and Body Works (BBWI) Faces Demand Weakness and Margin PressurePer the Zacks analyst, BBWI continues to grapple with broad demand softness, heavier promotions and tariff pressures, signaling prolonged margin and growth challenges.
Want the latest recommendations from Zacks Investment Research? Today, you can download 7 Best Stocks for the Next 30 Days. Click to get this free report
Fastenal Company (FAST) : Free Stock Analysis Report
American Express Company (AXP) : Free Stock Analysis Report
Intuitive Surgical, Inc. (ISRG) : Free Stock Analysis Report
Take-Two Interactive Software, Inc. (TTWO) : Free Stock Analysis Report
Southern Copper Corporation (SCCO) : Free Stock Analysis Report
Star Group, L.P. (SGU): Free Stock Analysis Report
Daily Journal Corp. (S.C.) (DJCO): Free Stock Analysis Report
Booking Holdings Inc. (BKNG) : Free Stock Analysis Report
This article originally published on Zacks Investment Research (zacks.com).
Investors interested in Mining – Miscellaneous stocks are likely familiar with Nexa Resources S.A. (NEXA) and Teck Resources Ltd (TECK). But which of these two companies is the best option for those looking for undervalued stocks? Let's take a closer look.
We have found that the best way to discover great value opportunities is to pair a strong Zacks Rank with a great grade in the Value category of our Style Scores system. The Zacks Rank is a proven strategy that targets companies with positive earnings estimate revision trends, while our Style Scores work to grade companies based on specific traits.
Currently, Nexa Resources S.A. has a Zacks Rank of #2 (Buy), while Teck Resources Ltd has a Zacks Rank of #3 (Hold). This system places an emphasis on companies that have seen positive earnings estimate revisions, so investors should feel comfortable knowing that NEXA is likely seeing its earnings outlook improve to a greater extent. However, value investors will care about much more than just this.
Value investors are also interested in a number of tried-and-true valuation metrics that help show when a company is undervalued at its current share price levels.
The Style Score Value grade factors in a variety of key fundamental metrics, including the popular P/E ratio, P/S ratio, earnings yield, cash flow per share, and a number of other key stats that are commonly used by value investors.
NEXA currently has a forward P/E ratio of 10.74, while TECK has a forward P/E of 28.43. We also note that NEXA has a PEG ratio of 0.31. This figure is similar to the commonly-used P/E ratio, with the PEG ratio also factoring in a company's expected earnings growth rate. TECK currently has a PEG ratio of 0.57.
Another notable valuation metric for NEXA is its P/B ratio of 1.25. The P/B ratio is used to compare a stock's market value with its book value, which is defined as total assets minus total liabilities. For comparison, TECK has a P/B of 1.34.
Based on these metrics and many more, NEXA holds a Value grade of A, while TECK has a Value grade of D.
NEXA sticks out from TECK in both our Zacks Rank and Style Scores models, so value investors will likely feel that NEXA is the better option right now.
Want the latest recommendations from Zacks Investment Research? Today, you can download 7 Best Stocks for the Next 30 Days. Click to get this free report
Nexa Resources S.A. (NEXA) : Free Stock Analysis Report
Teck Resources Ltd (TECK) : Free Stock Analysis Report
This article originally published on Zacks Investment Research (zacks.com).
How much a stock's price changes over time is important for most investors, since price performance can both impact your investment portfolio and help you compare investment results across sectors and industries.
Another factor that can influence investors is FOMO, or the fear of missing out, especially with tech giants and popular consumer-facing stocks.
What if you'd invested in Teck Resources Ltd (TECK) ten years ago? It may not have been easy to hold on to TECK for all that time, but if you did, how much would your investment be worth today?
Teck Resources Ltd's Business In-Depth
With that in mind, let's take a look at Teck Resources Ltd's main business drivers.
Vancouver, Canada-based Teck Resources is committed to mining and mineral development with business units focused on copper and zinc. Teck is also a leading producer of lead and a significant producer of specialty metals such as germanium, indium and cadmium. It also produces gold dore and silver. Teck also produces industrial products and fertilizers, which are recovered from its zinc and lead smelting operations in Trail, B.C.
Teck Resources divested its Steelmaking Coal business or Elk Valley Resources (“EVR”) in July 2024. The company categorized it as discontinued operations and restated the revenue and EPS (in CAD) for all quarters of 2023 and for 2024.
Teck Resources is a significant copper producer in the Americas, with four operating mines in Canada, Chile and Peru, and development projects in North and South America. Its main projects are Highland Valley Copper in Canada and Antamina, Quebrada Blanca and Carmen de Andacollo in South America.
Teck Resources is one of the world's largest producers of mined zinc, with three operating mines in the United States and Peru, and it owns one of the world's largest fully integrated zinc and lead smelting and refining facilities located in Canada. Teck produces zinc concentrate from Red Dog Operations in Alaska. In addition to marketing its zinc concentrate around the world, the company’s concentrate team also purchases concentrate from other mines for processing at the Trail operations complex in British Columbia.Teck Resources recently announced a structure in two regional business units – The North America business and The Latin America (LATAM) business.
The North America business unit, includes Highland Valley Copper, Red Dog and Trail operations, and the Galore Creek, Schaft Creek, and New Range copper projects. The LATAM unit, includes Carmen de Andacollo and Quebrada Blanca operations, Teck’s interest in Antamina, and the Zafranal, San Nicolas, and NuevaUnión copper growth projects.In September 2025, Teck Resources entered the merger agreement with Anglo American to form the Anglo Teck group. The new company will boast an industry-leading portfolio, consisting of six world-class copper assets, and premium iron ore and zinc operations.
Bottom Line
Anyone can invest, but building a successful investment portfolio takes a combination of a few things: research, patience, and a little bit of risk. So, if you had invested in Teck Resources Ltd a decade ago, you're probably feeling pretty good about your investment today.
According to our calculations, a $1000 investment made in January 2016 would be worth $17,335.55, or a gain of 1,633.55%, as of January 15, 2026, and this return excludes dividends but includes price increases.
Compare this to the S&P 500's rally of 260.42% and gold's return of 313.45% over the same time frame.
Going forward, analysts are expecting more upside for TECK.
Teck Resources reported third-quarter 2025 copper output of around 104,100 tons, a 9.5% decline year over year due to lower-than-expected results at QB and HVC. Ongoing TMF development work is expected to impact production at QB. The company lowered the 2025 copper production guidance to 415,000-465,000 tons, suggesting a 1% dip at the midpoint. Also, due to the outage of the shiploader at QB's port facility, net cash unit costs at QB are expected to be higher than before. Copper prices have gained lately on supply concerns amid solid demand. The long-term prospects for copper remain positive, supported by the clean energy transition trend. Teck Resources entered into a merger agreement with Anglo American plc to form the Anglo Teck group, with a combined annual copper production of 1.2 million tons.
The stock has jumped 17.92% over the past four weeks. Additionally, no earnings estimate has gone lower in the past two months, compared to 6 higher, for fiscal 2025; the consensus estimate has moved up as well.
Want the latest recommendations from Zacks Investment Research? Today, you can download 7 Best Stocks for the Next 30 Days. Click to get this free report
Teck Resources Ltd (TECK) : Free Stock Analysis Report
This article originally published on Zacks Investment Research (zacks.com).
Vancouver, British Columbia–(Newsfile Corp. – January 15, 2026) – Corcel Exploration Inc. (CSE: CRCL) (OTCQB: CRLEF) (the "Company" or "Corcel") today announced that Grant Tanaka has been appointed Chief Financial Officer of the Company to replace Kyle Nazareth. Corcel thanks Mr. Nazareth for his contributions and dedication to the Company and wishes him continued success in his future endeavors.
Mr. Tanaka brings over 15 years of financial leadership experience in the mining industry. Grant is the Chief Financial Officer of Vizsla Royalties Corp. and Vizsla Copper Corp. and was a Director, Finance Operations, of Ma'aden Gold & Base Metals Co. Prior to this, he held senior financial positions at Teck Resources Limited, New Gold Inc., Copper Mountain Mining Corporation, and Bisha Mining Share Company, an operating subsidiary of Nevsun Resources Ltd. He has experience at both the corporate and operational levels, having worked throughout North America, Africa and the Middle East in gold, base metals and coal operations.
"We are excited to welcome Grant as our new Chief Financial Officer," commented Corcel CEO, Jon Ward. "Grant brings strong financial leadership and public company experience that will be instrumental as we continue to advance our exploration strategy and position the Company for future growth."
Stock Option Grant
Corcel has granted a total of 2,220,000 stock options ("Options") to directors, officers, employees and consultants of the Company, with each Option exercisable at a price of $0.265 to acquire one common share of the Company until January 15, 2031 and having vested immediately.
About Corcel Exploration Inc.
Corcel is a mineral resource company engaged in the acquisition and exploration of precious and base metals properties throughout North America. The Company has entered a long-term lease agreement to acquire the Yuma King Copper-Gold project in Arizona, which spans a district-scale land position of 3,200 hectares comprising 515 unpatented federal mining claims in the Ellsworth Mining District, including the past-producing Yuma Mine which saw underground production of copper, lead, gold and silver between 1940 and 1963. The Company also holds an option to acquire a 100% undivided right, title, and interest in and to the Peak gold exploration project and holds a 100% interest in the Willow copper project. For more information, please visit our website at https://corcelexploration.com/.
For further information contact:
Jon Ward, CEOEmail: info@corcelexploration.comTel: (604) 355-0303
Caution Regarding Forward-Looking Information
This news release contains "forward‐looking information" and "forward-looking statements" under applicable Canadian and U.S. securities laws (collectively, "forward‐looking statements"). These statements relate to future events or the Company's future performance, business prospects or opportunities that are based on forecasts of future results, estimates of amounts not yet determinable and assumptions of management made in light of management's experience and perception of historical trends. Assumptions may prove to be incorrect and actual results and future events may differ materially from those anticipated. Any statements that express or involve discussions with respect to predictions, expectations, beliefs, plans, projections, objectives or future events or performance (often, but not always, using words or phrases such as "seek", "anticipate", "plan", "continue", "estimate", "expect", "may", "will", "project", "predict", "forecast", "potential", "target", "intend", "could", "might", "should", "believe" and similar expressions) are not statements of historical fact and may be "forward‐looking statements".
Forward-looking statements are subject to known and unknown risks, uncertainties and other factors that may cause actual results to materially differ from those expressed or implied by such forward-looking statements, including but not limited to: material adverse changes, unexpected changes in laws, rules or regulations, or their enforcement by applicable authorities; the failure of parties to contracts with the company to perform as agreed; social or labour unrest; changes in commodity prices; and the failure of exploration programs or studies to deliver anticipated results or results that would justify and support continued exploration, studies, development or operations. Although the Company has attempted to identify important factors that could cause actual results to differ materially from those contained in forward-looking statements, there may be other factors that cause results not to be as anticipated, estimated or intended. The Company believes that the expectations reflected in these forward‐looking statements are reasonable, but no assurance can be given that these expectations will prove to be correct and such forward‐looking statements included herein should not be unduly relied upon. These statements speak only as of the date hereof. The Company does not intend, and does not assume any obligation, to update these forward-looking statements, except as required by applicable laws.
Neither the Canadian Securities Exchange nor the Market Regulator (as that term is defined in the policies of the Canadian Securities Exchange) accepts responsibility for the adequacy or accuracy of this release.
To view the source version of this press release, please visit https://www.newsfilecorp.com/release/280478
Toronto, Ontario–(Newsfile Corp. – January 15, 2026) – Forsys Metals Corp. (TSX: FSY) (FSE: F2T) (NSX: FSY) ("Forsys" or the "Company") is pleased to announce further drilling results from its extension and exploration drilling program at the Valencia deposit (under ML 149), part of the Company's Norasa Uranium project ("Norasa"1).
The drilling program's objective is to expand mineral resources within and adjacent to the Valencia main pit. A further 960 metres ("m") of processed downhole gamma survey results and 8,519 ICP assay results have been logged and processed since the Company's September 2, 2025 news release. The results obtained on mineralised intercepts for the Valencia main and satellite deposits are reported below (Table 1).
Uranium intercepts have been logged, both in the infill drilling and in the resource extension drilling programs. The drilling is intended to improve the definition of the orebody, providing additional information for pit optimisation and mine planning.
Forsys' Country Director, Pine van Wyk, commented: "We are further encouraged by these results from both the Valencia Main deposit and its surrounding satellite targets. The extension and exploration drilling program has concluded and ongoing drilling has identified resource extention potential, while also improving our geological understanding of the deposit and confidence in the mineral resource."
Highlights
Widths are reported as drill hole intersection lengths. True width is estimated to be approximately 75% of the downhole width.
Highlights are as follows:
- Valencia Main Pit: Infill drilling has focused on the Valencia Main deposit, aiming to expand the Valencia Main resource and upgrade the resource classification. Infill drilling had the objective to move the resource into the Indicated and Measured categories (Figure 1). Since 2024, 17,532 m has been completed in 209 drill holes at Valencia Main. Results received since September 2, 2025 include drillhole VA24-127 with 64 m from surface to 64 m depth averaging 333 ppm U3O8. These new results continue to highlight the strong potential to enhance both tonnage and grade at Valencia.
- Valencia South: Drilling tested the down-plunge extension to the south of the Valencia Main deposit with the objective of increasing and upgrading the Indicated resource in this portion of the Valencia main deposit. Encouraging results have been obtained so far. Recent drilling includes borehole VA25-289 intersecting 32 m averaging 168 ppm eU3O8 from 90 m to 122 m followed by three more intersects of 7 m averaging 156 ppm eU3O8, 13 m grading 419 ppm U3O8 and 53.9 m grading 385 ppm U3O8, between 212 m and 304 m depth, the latter two intercepts being laboratory assays (ICP-MS).
- Valencia West: Results have been obtained at Valencia West (Figures 1 and 2) where seven boreholes have been completed since February 2025 for a total of 1,067 m. ICP assay results received since September 2025 include the following highlights: 315 ppm U3O8 over a 9.01 m interval in drillhole VA25-288 and 5 m grading 682 ppm U3O8 in borehole VA25-292. The drilling intersected additional uranium mineralization down dip, along strike and near surface, establishing a link with the Valencia Main resource. The drill spacing is believed to be sufficient for this zone to be classified within the existing Indicated Resource, potentially extending the Valencia Main pit by approximately 150 m to the west.
- The Jolie Zone satellite mineralization is located about 600 m north of the Valencia Main resource. 24 boreholes totalling 3,505 m have been completed since February 2025. Drilling identified two sub-parallel mineralised intrusions, approximately 50 m from each other. Assay results received since September 2025 include 263 ppm U3O8 over a 5 m interval and a further 736 ppm U3O8 over 11 m in drillhole VA25-273. Interpretation of these results indicates a continuity of mineralization, which is significant since it enhances the potential foradditional mineral resources. Mineralization is inferred over a strike length of approximately 350 metres at the Jolie Zone.
- The Valencia East satellite deposit generated encouraging results from the recent drill campaign. 35 boreholes, totalling 3,838 m, have been drilled since 2024, including both infill and extension drilling of the historical resource (Figure 1). Assay results received since September 2025 include two intersections in drillhole VA25-302 which returned 207 ppm U3O8 over a 9 m interval, followed by 30.6 m grading 186 ppm U3O8.. Borehole VA25-284 intersected 241 ppm U3O8 over a 22 m width from 75 m, and VA25-298 intersected 612 ppm U3O8 over a 7m width from 120 m. The aim of the infill drilling is to upgrade the Valencia East resource to the Indicated category. Extension drilling has identified additional mineralization along strike and down dip. See Figure-2 below.
Figure-1: Overview of Valencia infill and exploration drilling, showing the metres x ppm U3O8 for the 2024 to 2025 drill results.
To view an enhanced version of this graphic, please visit:https://images.newsfilecorp.com/files/12099/280438_85b8502a546f08b2_003full.jpg
Figure-2: Cross section, 75m wide through Valencia East, showing the borehole grades and current Resource Model grade bins. Borehole VA25-302 indicates elevated grades with respect to the 2024 Resource Block Model, while grades in boreholes VA25-284, VA25-298 and VA25-302 all indicate potential for additional resources to the SE of the 2024 model.
To view an enhanced version of this graphic, please visit:https://images.newsfilecorp.com/files/12099/280438_85b8502a546f08b2_004full.jpg
Table-1: 2025 drill campaign; comprehensive drillhole results update since the Company's September 2, 2025 news release (final results as at December 15, 2025); Widths are reported as drill hole intersection lengths. True width is estimated to be approximately 75% of the downhole width. Infill Drilling is for Valencia Main and West.
| Target | BHID | From (m) | To (m) | Width (m) | eU3O8 (ppm) | U3O8 (ppm) |
| Valencia West | VA24-068 | 49 | 52 | 3 | 98 | 104 |
| Valencia West | VA24-069 | 77 | 81 | 4 | 219 | 380 |
| Valencia West | VA24-070 | 50 | 54 | 4 | 197 | 252 |
| Valencia West | VA24-071 | 66 | 70 | 4 | 57 | |
| Valencia West | VA24-073 | 109 | 143.74 | 34.74 | 162 | 177 |
| Valencia Infill | VA24-074 | 43 | 91 | 48 | 256 | 256 |
| Valencia Infill | VA24-075 | 15 | 17 | 2 | 50 | 57 |
| Valencia Infill | VA24-076 | 23 | 53 | 30 | 142 | 129 |
| Valencia Infill | VA24-080 | 45 | 79 | 34 | 279 | 257 |
| Valencia Infill | VA24-082 | 0 | 1 | 1 | 53 | |
| Valencia West | VA24-083A | 158 | 208 | 50 | 193 | 185 |
| Valencia Infill | VA24-085 | 56 | 70 | 14 | 508 | 548 |
| Valencia Infill | VA24-086 | 35 | 66 | 31 | 292 | 277 |
| Valencia Infill | VA24-088 | 33 | 34 | 1 | 138 | 146 |
| Valencia Infill | VA24-089 | 32 | 63 | 31 | 317 | 329 |
| Valencia Infill | VA24-090 | 15 | 63 | 48 | 179 | 182 |
| Valencia Infill | VA24-091 | 22 | 49 | 27 | 132 | 145 |
| Jolie | VA24-098 | 101 | 125 | 24 | 137 | 171 |
| Jolie | VA24-098A | 53 | 57 | 4 | 146 | 133 |
| Jolie | VA24-099 | 57 | 125 | 68 | 120 | 143 |
| Jolie | VA24-099 | 152 | 159 | 7 | 142 | 205 |
| Jolie | VA24-100 | 100 | 105 | 5 | 148 | 116 |
| Jolie | VA24-101 | 58 | 62 | 4 | 74 | 111 |
| Valencia Infill | VA24-102 | 9 | 56 | 47 | 149 | |
| Valencia Infill | VA24-104 | 54 | 69 | 15 | 144 | 132 |
| Valencia Infill | VA24-105 | 32 | 36 | 4 | 93 | 103 |
| Valencia Infill | VA24-107 | 17 | 40 | 23 | 185 | 187 |
| Valencia Infill | VA24-109 | 0 | 68 | 68 | 104 | 83 |
| Valencia Infill | VA24-113 | 16 | 60 | 44 | 141 | 162 |
| Valencia Infill | VA24-114 | 10 | 12 | 2 | 77 | 52 |
| Valencia Infill | VA24-115 | 4 | 58 | 54 | 163 | 159 |
| Valencia Infill | VA24-116 | 34 | 65 | 31 | 178 | 176 |
| Valencia Infill | VA24-117 | 63 | 69 | 6 | 128 | 160 |
| Valencia Infill | VA24-118 | 5 | 27 | 22 | 261 | 303 |
| Valencia Infill | VA24-119 | 9 | 59 | 50 | 174 | 172 |
| Valencia Infill | VA24-120 | 11 | 34 | 23 | 113 | 106 |
| Valencia Infill | VA24-120 | 43 | 60 | 17 | 158 | 129 |
| Valencia Infill | VA24-121 | 19 | 65 | 46 | 111 | 118 |
| Valencia Infill | VA24-122 | 25 | 40 | 15 | 133 | 98 |
| Valencia Infill | VA24-123 | 64 | 71 | 7 | 140 | 150 |
| Valencia Infill | VA24-124 | 24 | 30 | 6 | 222 | 187 |
| Valencia Infill | VA24-125 | 18 | 72 | 54 | 88 | 107 |
| Valencia Infill | VA24-126 | 46 | 49 | 3 | 283 | 322 |
| Valencia Infill | VA24-127 | 0 | 64 | 64 | 360 | 333 |
| Valencia Infill | VA24-128 | 18 | 27 | 9 | 238 | 187 |
| Valencia Infill | VA24-128 | 38 | 61 | 23 | 279 | 318 |
| Valencia Infill | VA24-130 | 18 | 43 | 25 | 82 | 103 |
| Valencia Infill | VA24-131 | 0 | 1 | 1 | 58 | |
| Valencia Infill | VA24-133 | 46 | 49 | 3 | 103 | 97 |
| Valencia Infill | VA24-135 | 33 | 55 | 22 | 169 | 168 |
| Valencia Infill | VA24-136 | 43 | 52 | 9 | 118 | 146 |
| Valencia Infill | VA24-137 | 6 | 8 | 2 | 73 | 51 |
| Valencia Infill | VA24-138 | 14 | 20 | 6 | 239 | 116 |
| Valencia Infill | VA24-140 | 46 | 70 | 24 | 112 | 108 |
| Valencia Infill | VA24-141 | 36 | 76 | 40 | 136 | 152 |
| Valencia Infill | VA24-142 | 66 | 75 | 9 | 243 | 238 |
| Valencia Infill | VA24-146 | 9 | 73 | 64 | 137 | 146 |
| Valencia Infill | VA24-150 | 16 | 19 | 3 | 136 | 178 |
| Valencia Infill | VA24-151 | 20 | 27 | 7 | 186 | 280 |
| Valencia Infill | VA24-151 | 36 | 44 | 8 | 169 | 259 |
| Valencia Infill | VA24-152 | 24 | 39 | 15 | 113 | 110 |
| Valencia Infill | VA24-152 | 83 | 92 | 9 | 216 | 228 |
| Valencia Infill | VA24-158 | 69 | 92 | 23 | 106 | 118 |
| Valencia Infill | VA24-159 | 49 | 89 | 40 | 307 | 340 |
| Valencia Infill | VA24-160 | 27 | 43 | 16 | 108 | 110 |
| Valencia Infill | VA24-160 | 69 | 84 | 15 | 213 | |
| Valencia Infill | VA24-161 | 42 | 67 | 25 | 165 | 174 |
| Valencia Infill | VA24-163 | 47 | 56 | 9 | 129 | 160 |
| Valencia Infill | VA24-164 | 47 | 53 | 6 | 185 | 133 |
| Valencia Infill | VA24-165 | 24 | 80 | 56 | 89 | 89 |
| Valencia Infill | VA24-166 | 23 | 31 | 8 | 137 | 170 |
| Valencia Infill | VA24-166 | 68 | 89 | 21 | 143 | 135 |
| Valencia Infill | VA24-167 | 16 | 42 | 26 | 141 | 137 |
| Valencia Infill | VA24-168 | 66 | 84 | 18 | 116 | 114 |
| Valencia Infill | VA24-169 | 16 | 38 | 22 | 92 | 101 |
| Valencia Infill | VA24-170 | 43 | 69 | 26 | 234 | 267 |
| Valencia Infill | VA24-171 | 50 | 59 | 9 | 83 | 76 |
| Valencia Infill | VA24-172 | 25 | 56 | 31 | 217 | |
| Valencia Infill | VA24-173 | 13 | 40 | 27 | 311 | 372 |
| Valencia Infill | VA24-174 | 9 | 75 | 66 | 217 | 239 |
| Valencia Infill | VA24-175 | 46 | 91 | 45 | 99 | |
| Valencia Infill | VA24-176 | 17 | 38 | 21 | 100 | 88 |
| Valencia Infill | VA24-177 | 7 | 80 | 73 | 97 | 88 |
| Valencia Infill | VA24-178 | 52 | 69 | 17 | 133 | 125 |
| Valencia Infill | VA24-179 | 24 | 76 | 52 | 125 | 104 |
| Valencia Infill | VA24-180 | 40 | 80 | 40 | 98 | 108 |
| Valencia Infill | VA24-181 | 63 | 94 | 31 | 127 | |
| Valencia Infill | VA24-182 | 48 | 93 | 45 | 189 | 157 |
| Valencia Infill | VA24-184 | 21 | 54 | 33 | 113 | 132 |
| Valencia Infill | VA24-185 | 60 | 62 | 2 | 135 | 125 |
| Valencia | VA24-186 | 57 | 93 | 36 | 161 | 155 |
| Valencia | VA24-186 | 121 | 145 | 24 | 283 | 292 |
| Jolie | VA24-194 | 58 | 71 | 13 | 158 | 188 |
| Jolie | VA24-195 | 29 | 43 | 14 | 137 | 137 |
| Jolie | VA24-195 | 144 | 180 | 36 | 167 | 155 |
| Jolie | VA24-196 | 132 | 143 | 11 | 92 | 96 |
| Jolie | VA24-197 | 70 | 75 | 5 | 64 | 58 |
| Jolie | VA24-198 | 31 | 50 | 19 | 130 | 161 |
| Valencia Main | VA24-PQ13 | 1 | 42.61 | 41.61 | 145 | |
| Valencia | VA25-270 | 63 | 96 | 33 | 94 | 112 |
| Valencia West | VA25-271 | 108 | 110 | 2 | 129 | 149 |
| Jolie | VA25-272 | 75 | 83 | 8 | 117 | 142 |
| Jolie | VA25-273 | 97 | 102 | 5 | 228 | 263 |
| Jolie | VA25-273 | 143 | 154 | 11 | 629 | 736 |
| Jolie | VA25-274 | 31 | 50 | 19 | 102 | 142 |
| Jolie | VA25-275 | 12 | 66 | 54 | 75 | 99 |
| Jolie | VA25-275 | 93 | 97 | 4 | 272 | 277 |
| Jolie | VA25-276 | 13 | 19 | 6 | 258 | 301 |
| Jolie | VA25-276 | 75 | 79 | 4 | 265 | 394 |
| Valencia | VA25-277 | 29 | 36 | 7 | 136 | 119 |
| Valencia | VA25-278 | 9 | 54 | 45 | 104 | 108 |
| Valencia | VA25-278 | 82 | 100 | 18 | 135 | |
| Valencia | VA25-279 | 57 | 90 | 33 | 81 | 119 |
| Valencia East | VA25-280 | 16 | 19 | 3 | 63 | 57 |
| Valencia East | VA25-281 | 19 | 38 | 19 | 169 | 173 |
| Valencia East | VA25-281 | 96 | 101 | 5 | 120 | 143 |
| Valencia East | VA25-282 | 53 | 60 | 7 | 101 | 113 |
| Valencia East | VA25-283 | 68 | 74 | 6 | 144 | 189 |
| Valencia East | VA25-283 | 115 | 120 | 5 | 191 | 108 |
| Valencia East | VA25-284 | 75 | 97 | 22 | 171 | 241 |
| Jolie | VA25-285 | 83 | 95 | 12 | 83 | 109 |
| Valencia West | VA25-286 | 75 | 78 | 3 | 108 | 131 |
| Valencia West | VA25-287 | 91 | 109 | 18 | 120 | 104 |
| Valencia West | VA25-288 | 182.92 | 191.93 | 9.01 | 276 | 315 |
| Valencia S | VA25-289 | 90 | 122 | 32 | 168 | |
| Valencia S | VA25-289 | 212 | 219 | 7 | 156 | |
| Valencia S | VA25-289 | 225 | 238 | 13 | 341 | 419 |
| Valencia S | VA25-289 | 250 | 303.9 | 53.9 | 348 | 385 |
| Valencia S | VA25-291 | 75 | 76 | 1 | 58 | |
| Valencia West | VA25-292 | 81 | 86 | 5 | 581 | 682 |
| Valencia West | VA25-293 | 86 | 90.8 | 4.8 | 102 | 112 |
| Valencia West | VA25-294 | 83.8 | 87 | 3.2 | 164 | 163 |
| Valencia East | VA25-295 | 58 | 81 | 23 | 198 | 234 |
| Valencia East | VA25-296 | 81 | 85 | 4 | 284 | |
| Valencia East | VA25-297 | 86 | 93 | 7 | 244 | 273 |
| Valencia East | VA25-298 | 92 | 97 | 5 | 191 | 239 |
| Valencia East | VA25-298 | 120 | 127 | 7 | 456 | 612 |
| Valencia East | VA25-300 | 106 | 113 | 7 | 254 | 207 |
| Valencia East | VA25-300 | 147 | 160 | 13 | 129 | 114 |
| Valencia East | VA25-301 | 96 | 102 | 6 | 220 | 179 |
| Valencia East | VA25-301 | 126 | 132 | 6 | 375 | 325 |
| Valencia East | VA25-302 | 93 | 102 | 9 | 78 | 207 |
| Valencia East | VA25-302 | 142 | 172.6 | 30.6 | 133 | 186 |
| Valencia East | VA25-303 | 107.4 | 111.11 | 3.71 | 298 | 316 |
| Valencia East | VA25-303 | 151.97 | 167.8 | 15.83 | 287 | 250 |
| Valencia East | VA25-304 | 127 | 128 | 1 | 67 | 169 |
| Valencia East | VA25-305 | 86 | 94 | 8 | 201 | 222 |
| Valencia East | VA25-306 | 34 | 48 | 14 | 113 | 123 |
| Valencia East | VA25-307 | 68 | 75 | 7 | 190 | 189 |
| Valencia East | VA25-307 | 89 | 117 | 28 | 90 | 90 |
| Valencia East | VA25-307 | 123 | 132 | 9 | 98 | 104 |
| Valencia Main | VA25-PQ14 | 20 | 96.64 | 76.64 | 130 | 150 |
The above table lists all mineral intercept results obtained since the Company's September 2, 2025 news release. Drill collar positions are guided by field mapping and the current geological model. Interval widths are presented per downhole measurements; True widths of mineralized intrusions are expected to deviate from the reported widths. Drilling orientations are planned to intersect mineralization at high angles, as far as is possible, depending on terrain and accessibility of drill positions.
Quality Assurance and Quality Control ("QAQC")
Recent (2024 to date) Sampling and Assays
- Samples were taken from the diamond drill cores and RC chips for geochemical assay guided by radiometric downhole logging. The samples are sent to SGS Laboratories in South Africa, for sample preparation and ICP analyses. QAQC included regular internal and external check tests on a continuous basis in each of the sample batches processed.
- Forsys employs a QAQC program with Certified Reference Materials (CRMs), blanks, coarse duplicates, and pulp duplicates inserted into each batch of samples. The QAQC insert rate comprises 4 % CRMs using three CRM types with different grades of U3O8; 4 % blanks and 8 % to 10 % duplicates. RC sample batches have a field duplicate split at the drill rig; and pulp duplicates split at prescribed intervals at the laboratory. Core samples have coarse cruch duplicates, and pulp duplicates, each split at the laboratory.
External Check Assay Laboratory
Four percent of the samples sent to SGS are also submitted for check analyses to UIS Laboratories (UIS) in South Africa; UIS serves as the independent accredited laboratory. The sample results are further validated by comparison with the downhole radiometric scans.
Qualified Persons Statement for Mineral Resource The information in this release that relates to the Interim Drilling Results for the Norasa Project is based on information compiled or reviewed by Dr Guy Freemantle of The MSA Group (Pty) Ltd., Johannesburg, South Africa. The MSA Group are independent consultants to the Norasa Project, Namibia. Dr Freemantle holds a Bachelor of Science in Geology (2006) and Doctor of Philosophy in Geology (2017) both at the University of the Witwatersrand. He is a member of the Society of Economic Geologists (892905) and current Africa region VP; a Fellow of the Geological Society of South Africa (965392); and is registered with SACNASP (Registration 117527). Dr Freemantle has practiced his profession continuously for 16 years and has sufficient experience and knowledge that is relevant to the style of mineralization and type of deposits under consideration as well as to the activity that is being undertaken to fulfil requirements of a Qualified Person as per NI 43-101. Dr Freemantle consents to this release in the form and context in which it appears.
About Forsys Metals Corp.Forsys Metals Corp. (TSX: FSY) (FSE: F2T) (NSX: FSY) is an emerging uranium developer focused on advancing its wholly owned Norasa Uranium Project, located in the politically and uranium friendly jurisdiction of Namibia, Africa. The Norasa Uranium Project is comprised of the Valencia Uranium deposit (ML-149) and the nearby Namibplaas Uranium deposit (EPL-3638). Further information is available at the Company website www.forsysmetals.com.
On behalf of the Board of Directors of Forsys Metals Corp. Richard Parkhouse, Investor Relations. For additional information, please contact:
Pine van Wyk, Country Director, Forsysemail: pine@forsysmetals.com
Richard Parkhouse, Investor Relationsemail: rparkhouse@forsysmetals.com email: info@forsysmetals.com
Forward-Looking Statement
Certain information contained in this press release constitutes "forward-looking information", within the meaning of Canadian legislation. Generally, these forward-looking statements can be identified by the use of forward-looking terminology such as "plans", "expects" or "does not expect", "is expected", "budget", "scheduled", "estimates", "forecasts", "intends", "anticipates" or "does not anticipate", or "believes", or variations of such words and phrases or state that certain actions, events or results "may", "could", "would", "might" or "will be taken", "occur", "be achieved" or "has the potential to". Forward-looking statements contained in this press release are qualified in their entirety by the inherent risks and uncertainties surrounding future expectations. Among those factors which could cause actual results to differ materially are the following: market conditions and other risk factors listed from time to time in our reports filed with Canadian securities regulators on SEDAR+ at www.sedarplus.ca. The forward-looking statements included in this press release are made as of the date of this press release and Forsys Metals Corp disclaim any intention or obligation to update or revise any forward-looking statements, whether as a result of new information, future events or otherwise, except as expressly required by applicable securities legislation.
1 The Norasa Uranium Project ("Norasa") is wholly owned by the Company's 100% subsidiary Valencia Uranium (Pty) Ltd. ("Valencia Uranium") and comprises the Valencia uranium deposits (held under ML-149) ("Valencia") and the Namibplaas uranium deposit (under EPL-3638, application for ML-251) ("Namibplaas"), located in the Erongo region of Namibia.
2 Assay results are denoted U3O8, while grades calculated from downhole gamma are represented by eU3O8.
To view the source version of this press release, please visit https://www.newsfilecorp.com/release/280438
Goliath Resources Limited
TORONTO, Jan. 15, 2026 (GLOBE NEWSWIRE) — Goliath Resources Limited (TSX-V: GOT) (OTCQB: GOTRF) (Frankfurt: B4IF) (the "Company" or "Goliath") is pleased to announce the results of its annual and special meeting of shareholders held January 14, 2026 (the “Meeting). All items of business tabled at the Meeting were approved by the requisite majorities, including:
-
Roger Rosmus, Graham Warren, Wayne Isaacs and Rein Turna were re-elected as directors of the Company;
-
McGovern Hurley LLP was re-appointed as the auditor of the Company;
-
The omnibus equity incentive plan (the “Plan”) was re-approved for use by the Company;
-
Certain amendments to the Plan were approved by the disinterested shareholders of the Company; and
-
The consolidation of the outstanding common shares of the Company on the basis of one (new) for up to seven (old) Common Shares (the “Consolidation”) was approved.
Despite the approval of the shareholders of the Consolidation at the Meeting, the Board of Directors of the Company has exercised its discretion and determined not to proceed with the Consolidation.
The Meeting materials, including the management information circular dated November 30, 2025 (the “Circular”), are available under the Company’s profile on www.SEDARPLUS.ca and on the Company’s website at https://goliathresourcesltd.com/.
About Goliath Resources Limited
Goliath Resources is an explorer of precious metals projects in the highly prospective Golden Triangle of Northwestern British Columbia. All of its projects are in high quality geological settings and geopolitical safe jurisdictions amenable to mining in Canada. Goliath is a member and active supporter of CASERM which is an organization that represents a collaborative venture between Colorado School of Mines and Virginia Tech. Goliath recently completed its largest fully funded drill campaign to date for a total of 64,364 meters in 2025. It has assays pending for 70 gold only holes and 110 gold equivalent holes. It is fully funded for a similar sized drill program in 2026. The Company’s key strategic cornerstone shareholders include Crescat Capital, a Global Commodity Group (Singapore), McEwen Inc. (NYSE: MUX) (TSX: MUX), Waratah Capital Advisors, Rob McEwen, Eric Sprott and Larry Childress.
For more information please contact:
Goliath Resources Limited
Mr. Roger Rosmus Founder and CEO Tel: +1.416.488.2887roger@goliathresources.comwww.goliathresourcesltd.com
Neither the TSX Venture Exchange nor its Regulation Services Provider (as that term is defined in the policies of the TSX Venture Exchange) accepts responsibility for the adequacy or accuracy of this release.
Centerra Gold, Inc.’s CGAU shares hit a fresh 52-week high of $16.44 yesterday, before retracing slightly to close the session at $15.96.
CGAU has shot up 173.3% over the past year. The company has also outperformed the Zacks Mining-Gold industry’s 157% rise over the same time frame. Its rally has been driven primarily by higher gold prices, which have boosted margins, while steady production and better cost control have strengthened earnings visibility.
Image Source: Zacks Investment Research
Let’s take a look at the factors that are driving CGAU stock.
CGAU Boosted by Strong Q3 and Expansion Plans
Centerra Gold delivered a strong third-quarter performance, with revenues of $395.2 million, up 22% year over year, supported by higher prices of $3,178 per ounce for gold and $3.73 per pound for copper. The company produced 81,773 ounces of gold and 13.4 million pounds of copper, with stable operations, improved ore grades at Öksüt and effective plant management at Mount Milligan driving performance.
The company advanced several strategic growth initiatives. In September 2025, Centerra filed a Pre-Feasibility Study (PFS) for Mount Milligan, confirming a life-of-mine extension to 2045, a significant increase in mineral reserves, and planned throughput enhancements through plant upgrades and permitting activities extending into 2026–2027. In Nevada, the Goldfield project progressed with a technical study in August 2025, demonstrating strong economics and potential as a future production contributor.
On the development front, Centerra is moving ahead with the restart of the Thompson Creek mine and the Langeloth facility, with a feasibility-driven plan approved and ramp-up activities underway, targeting first production in the second half of 2027. Additionally, the company strengthened its exploration portfolio through a strategic equity investment in Midland Exploration in July 2025, supporting early-stage resource development and long-term growth potential.
CGAU’s Zacks Rank & Other Key Picks
CGAU currently sports a Zacks Rank #1 (Strong Buy).
Other top-ranked stocks in the Basic Materials space include Royal Gold Inc. RGLD, DPM Metals Inc. DPMLF and Harmony Gold Mining Company Limited HMY.
At present, RGLD and DPMLF sport a Zacks Rank #1, while HMY carries a Zacks Rank #2 (Buy). You can see the complete list of today’s Zacks #1 Rank stocks here.
The Zacks Consensus Estimate for RGLD’s current fiscal-year earnings is pinned at $8.04 per share, indicating a 53% year-over-year increase. Its earnings beat the Zacks Consensus Estimate in three of the trailing four quarters while missing once, with the average surprise being 4%. Its shares have popped around 83.6% over the past year.
The Zacks Consensus Estimate for DPMLF’s current-year earnings stands at $2.27 per share, implying a 76% year-over-year increase. Its earnings beat the Zacks Consensus Estimates in each of the trailing four quarters, with the average earnings surprise being 13%. DPMLF’s shares have rallied roughly 127.2% over the past year.
The Zacks Consensus Estimate for HMY’s current-year earnings is pegged at $2.68 per share, indicating a year-over-year rise of 111.02%. HMY’s shares have gained 129.2% over the past year.
Want the latest recommendations from Zacks Investment Research? Today, you can download 7 Best Stocks for the Next 30 Days. Click to get this free report
Harmony Gold Mining Company Limited (HMY) : Free Stock Analysis Report
Royal Gold, Inc. (RGLD) : Free Stock Analysis Report
DPM Metals Inc. (DPMLF) : Free Stock Analysis Report
Centerra Gold Inc. (CGAU) : Free Stock Analysis Report
This article originally published on Zacks Investment Research (zacks.com).
Why Sociedad Química y Minera de Chile (NYSE:SQM) is on investors’ radar
Sociedad Química y Minera de Chile (NYSE:SQM) has drawn attention after a strong share price move, with the stock up 2.7% over the past day and 10.8% over the past week.
Over the past month the stock shows a 28.0% return, while the past 3 months add up to an 87.2% gain. This makes recent performance a key focus for investors assessing what is driving sentiment.
See our latest analysis for Sociedad Química y Minera de Chile.
Looking beyond the recent jump, the stock shows building momentum, with an 87.2% 3 month share price return and a 106.6% 1 year total shareholder return. This points to a sharp shift in how the market is pricing Sociedad Química y Minera de Chile’s prospects and risks.
If SQM’s move has you thinking about what else is on the move, this could be a good moment to widen your search with fast growing stocks with high insider ownership.
With SQM up strongly over the past year and trading at a small intrinsic discount of about 6%, the key question is whether the recent optimism leaves any mispricing or if the market already reflects future growth.
Most Popular Narrative: 35.4% Overvalued
Compared with the narrative fair value of about US$61.44, Sociedad Química y Minera de Chile’s last close at US$83.18 implies a rich valuation that leans heavily on future execution.
Strong demand growth in electric vehicles (EVs) and renewable energy storage, particularly in China and Europe, is driving a sustained recovery in lithium prices and providing visible upside to SQM’s revenues and margins as sales volumes are guided to increase by at least 10% in 2025.
Curious what kind of revenue and margin profile could justify a higher future earnings base and still assume a lower P/E multiple than many peers? The narrative sets out a detailed earnings path, specific margin expansion, and a discount rate that together underpin that fair value. The tension between ambitious growth and a compressed future multiple is where the real story sits.
Result: Fair Value of $61.44 (OVERVALUED)
Have a read of the narrative in full and understand what’s behind the forecasts.
However, lithium price volatility and the unresolved Codelco joint venture terms could still upend these assumptions, potentially shifting earnings power and the valuation story quite quickly.
Find out about the key risks to this Sociedad Química y Minera de Chile narrative.
Another View: DCF Points in a Different Direction
While the narrative fair value of about US$61.44 suggests Sociedad Química y Minera de Chile is overvalued at US$83.18, our DCF model paints a different picture, with fair value at roughly US$88.76 and the shares trading at a 6.3% discount. Which set of assumptions do you find more realistic?
Look into how the SWS DCF model arrives at its fair value.
SQM Discounted Cash Flow as at Jan 2026
Simply Wall St performs a discounted cash flow (DCF) on every stock in the world every day (check out Sociedad Química y Minera de Chile for example). We show the entire calculation in full. You can track the result in your watchlist or portfolio and be alerted when this changes, or use our stock screener to discover 884 undervalued stocks based on their cash flows. If you save a screener we even alert you when new companies match – so you never miss a potential opportunity.
Build Your Own Sociedad Química y Minera de Chile Narrative
If you see the data differently or simply prefer to test your own assumptions, you can put together a full narrative in just a few minutes with Do it your way.
A great starting point for your Sociedad Química y Minera de Chile research is our analysis highlighting 3 key rewards and 2 important warning signs that could impact your investment decision.
Looking for more investment ideas?
If SQM has caught your eye, do not stop there; broaden your watchlist with a few focused stock ideas that could sharpen your next move.
-
Spot opportunities in smaller names by scanning these 3531 penny stocks with strong financials that pair lower share prices with more robust financial profiles.
-
Position yourself in the AI shift by checking out these 25 AI penny stocks targeting companies tied to artificial intelligence themes.
-
Hunt for value by reviewing these 884 undervalued stocks based on cash flows that screen for stocks pricing in less optimistic cash flow assumptions.
This article by Simply Wall St is general in nature. We provide commentary based on historical data and analyst forecasts only using an unbiased methodology and our articles are not intended to be financial advice. It does not constitute a recommendation to buy or sell any stock, and does not take account of your objectives, or your financial situation. We aim to bring you long-term focused analysis driven by fundamental data. Note that our analysis may not factor in the latest price-sensitive company announcements or qualitative material. Simply Wall St has no position in any stocks mentioned.
Companies discussed in this article include SQM.
Have feedback on this article? Concerned about the content? Get in touch with us directly. Alternatively, email editorial-team@simplywallst.com
Key Insights
- The projected fair value for FMC is US$26.28 based on 2 Stage Free Cash Flow to Equity
- Current share price of US$15.14 suggests FMC is potentially 42% undervalued
- The US$21.21 analyst price target for FMC is 19% less than our estimate of fair value
Today we will run through one way of estimating the intrinsic value of FMC Corporation (NYSE:FMC) by taking the expected future cash flows and discounting them to their present value. This will be done using the Discounted Cash Flow (DCF) model. There's really not all that much to it, even though it might appear quite complex.
Remember though, that there are many ways to estimate a company's value, and a DCF is just one method. If you want to learn more about discounted cash flow, the rationale behind this calculation can be read in detail in the Simply Wall St analysis model.
The Model
We are going to use a two-stage DCF model, which, as the name states, takes into account two stages of growth. The first stage is generally a higher growth period which levels off heading towards the terminal value, captured in the second 'steady growth' period. To begin with, we have to get estimates of the next ten years of cash flows. Where possible we use analyst estimates, but when these aren't available we extrapolate the previous free cash flow (FCF) from the last estimate or reported value. We assume companies with shrinking free cash flow will slow their rate of shrinkage, and that companies with growing free cash flow will see their growth rate slow, over this period. We do this to reflect that growth tends to slow more in the early years than it does in later years.
A DCF is all about the idea that a dollar in the future is less valuable than a dollar today, so we discount the value of these future cash flows to their estimated value in today's dollars:
10-year free cash flow (FCF) estimate
| 2026 | 2027 | 2028 | 2029 | 2030 | 2031 | 2032 | 2033 | 2034 | 2035 | |
| Levered FCF ($, Millions) | US$285.0m | US$354.1m | US$295.0m | US$330.0m | US$338.8m | US$348.4m | US$358.7m | US$369.6m | US$381.2m | US$393.2m |
| Growth Rate Estimate Source | Analyst x5 | Analyst x4 | Analyst x1 | Analyst x1 | Est @ 2.65% | Est @ 2.84% | Est @ 2.96% | Est @ 3.05% | Est @ 3.11% | Est @ 3.16% |
| Present Value ($, Millions) Discounted @ 12% | US$254 | US$281 | US$208 | US$207 | US$190 | US$174 | US$159 | US$146 | US$134 | US$123 |
("Est" = FCF growth rate estimated by Simply Wall St)Present Value of 10-year Cash Flow (PVCF) = US$1.9b
After calculating the present value of future cash flows in the initial 10-year period, we need to calculate the Terminal Value, which accounts for all future cash flows beyond the first stage. The Gordon Growth formula is used to calculate Terminal Value at a future annual growth rate equal to the 5-year average of the 10-year government bond yield of 3.3%. We discount the terminal cash flows to today's value at a cost of equity of 12%.
Terminal Value (TV)= FCF2035 × (1 + g) ÷ (r – g) = US$393m× (1 + 3.3%) ÷ (12%– 3.3%) = US$4.5b
Present Value of Terminal Value (PVTV)= TV / (1 + r)10= US$4.5b÷ ( 1 + 12%)10= US$1.4b
The total value is the sum of cash flows for the next ten years plus the discounted terminal value, which results in the Total Equity Value, which in this case is US$3.3b. The last step is to then divide the equity value by the number of shares outstanding. Relative to the current share price of US$15.1, the company appears quite undervalued at a 42% discount to where the stock price trades currently. Remember though, that this is just an approximate valuation, and like any complex formula – garbage in, garbage out.
NYSE:FMC Discounted Cash Flow January 15th 2026 Important Assumptions
The calculation above is very dependent on two assumptions. The first is the discount rate and the other is the cash flows. You don't have to agree with these inputs, I recommend redoing the calculations yourself and playing with them. The DCF also does not consider the possible cyclicality of an industry, or a company's future capital requirements, so it does not give a full picture of a company's potential performance. Given that we are looking at FMC as potential shareholders, the cost of equity is used as the discount rate, rather than the cost of capital (or weighted average cost of capital, WACC) which accounts for debt. In this calculation we've used 12%, which is based on a levered beta of 1.958. Beta is a measure of a stock's volatility, compared to the market as a whole. We get our beta from the industry average beta of globally comparable companies, with an imposed limit between 0.8 and 2.0, which is a reasonable range for a stable business.
View our latest analysis for FMC
SWOT Analysis for FMCStrength
- Debt is well covered by .
Weakness
- Interest payments on debt are not well covered.
- Dividend is low compared to the top 25% of dividend payers in the Chemicals market.
Opportunity
- Expected to breakeven next year.
- Has sufficient cash runway for more than 3 years based on current free cash flows.
- Good value based on P/S ratio and estimated fair value.
- Significant insider buying over the past 3 months.
Threat
- Debt is not well covered by operating cash flow.
- Paying a dividend but company is unprofitable.
Next Steps:
Whilst important, the DCF calculation ideally won't be the sole piece of analysis you scrutinize for a company. DCF models are not the be-all and end-all of investment valuation. Rather it should be seen as a guide to "what assumptions need to be true for this stock to be under/overvalued?" For example, changes in the company's cost of equity or the risk free rate can significantly impact the valuation. Why is the intrinsic value higher than the current share price? For FMC, we've compiled three additional items you should look at:
PS. The Simply Wall St app conducts a discounted cash flow valuation for every stock on the NYSE every day. If you want to find the calculation for other stocks just search here.
Have feedback on this article? Concerned about the content? Get in touch with us directly. Alternatively, email editorial-team (at) simplywallst.com.This article by Simply Wall St is general in nature. We provide commentary based on historical data and analyst forecasts only using an unbiased methodology and our articles are not intended to be financial advice. It does not constitute a recommendation to buy or sell any stock, and does not take account of your objectives, or your financial situation. We aim to bring you long-term focused analysis driven by fundamental data. Note that our analysis may not factor in the latest price-sensitive company announcements or qualitative material. Simply Wall St has no position in any stocks mentioned.
How much a stock's price changes over time is important for most investors, since price performance can both impact your investment portfolio and help you compare investment results across sectors and industries.
FOMO, or the fear of missing out, also plays a role in investing, particularly with tech giants and popular consumer-facing stocks.
What if you'd invested in Southern Copper (SCCO) ten years ago? It may not have been easy to hold on to SCCO for all that time, but if you did, how much would your investment be worth today?
Southern Copper's Business In-Depth
With that in mind, let's take a look at Southern Copper's main business drivers.
Phoenix, AZ-based Southern Copper Corporation engages in mining, exploring, smelting, and refining copper and other minerals. The company conducts exploration activities in Argentina, Chile, Ecuador, Mexico and Peru.
Southern Copper has the largest copper reserves in the industry and operates high-quality, world-class assets in investment grade countries, such as Mexico and Peru.
Southern Copper reports results under three reportable segments. Each consist of a groups of mines with similar economic characteristics, type of products, processes and support facilities, regulatory environments as well as employee bargaining contracts.Peruvian operations (around 36% of the company's revenues) includes the Toquepala and Cuajone mine complexes and the smelting and refining plants, industrial railroad and port facilities that service both mines. The Peruvian operations produce copper, with significant by-product production of molybdenum, silver and other materials.Mexican Open-Pit (58% of revenues) includes La Caridad and Buenavista mine complexes, the smelting and refining plants and support facilities, which service both mines. The Mexican open pit operations produce copper, with significant by-product production of molybdenum, silver and other materials.Mexican underground operations (6% of revenues) (IMMSA unit) includes five underground mines that produce zinc, lead, copper, silver and gold, a coal mine which produces coal and coke, and several industrial processing facilities for zinc, copper and silver.
The geographic breakdown of the company’s sales is as follows – Americas (50% of revenues), Europe (32%) and Asia (18%).Approximately 80% of the company’s revenue come from the sale of copper, 6% from molybdenum and 10% from silver and zinc.
Bottom Line
Putting together a successful investment portfolio takes a combination of research, patience, and a little bit of risk. For Southern Copper, if you bought shares a decade ago, you're likely feeling really good about your investment today.
According to our calculations, a $1000 investment made in January 2016 would be worth $7,775.00, or a gain of 677.50%, as of January 14, 2026, and this return excludes dividends but includes price increases.
Compare this to the S&P 500's rally of 268.40% and gold's return of 309.27% over the same time frame.
Analysts are anticipating more upside for SCCO.
Southern Copper's performance is set to benefit from ongoing strength in metal prices. Increased output of silver, zinc and molybdenum is expected to largely offset a modest decline in copper production, although elevated operating costs remain a concern. Copper demand continues to be robust, supported by U.S. infrastructure spending and the global shift toward clean energy. An anticipated supply deficit should provide additional price support. The recent designation of copper and silver as critical minerals further highlights their strategic importance. Backed by extensive copper reserves and more than $15 billion in investments across Peru and Mexico over the decade, Southern Copper is well positioned for long-term growth. Its initiatives to reduce debt are also encouraging. The earnings estimates for the company have moved up lately.
Shares have gained 24.31% over the past four weeks and there have been 2 higher earnings estimate revisions for fiscal 2025 compared to none lower. The consensus estimate has moved up as well.
Want the latest recommendations from Zacks Investment Research? Today, you can download 7 Best Stocks for the Next 30 Days. Click to get this free report
Southern Copper Corporation (SCCO) : Free Stock Analysis Report
This article originally published on Zacks Investment Research (zacks.com).
OTTAWA, ON, Jan. 14, 2026 /CNW/ – Northern Shield Resources Inc. ("Northern Shield" or the "Company") (TSXV: NRN) is pleased to announce that a large area of mineralization has been exposed at the Creston Copper target, on the Company's 100% owned Root & Cellar Property ("Root & Cellar" or the "Property"), Burin Peninsula, southeastern Newfoundland. The Property hosts 5 epithermal gold-silver-(tellurium) zones over a 6-kilometre strike-length, and a large, associated polymetallic porphyry copper-molybdenite-silver-tellurium-gold system.
This new area of mineralization, covering approximately 50 m x 30 m, has been exposed as quarrying continues in one of several aggregate quarries on the Property (Fig 1). Mineralization consists of variable concentrations of pyrite-galena (lead sulphide) -sphalerite (lead-zinc) bearing quartz veinlets, fractures and breccia fillings with minor chalcopyrite, chalcocite, molybdenite and other sulphide minerals hosted in a diatreme breccia and rhyolite dikes that cut the breccia (Fig 2). This zone is adjacent to a recently discovered hydrothermal breccia vent and 50 m from breccia-hosted copper mineralization with grades up to 1.2% Cu, originally discovered by a prospector (see Company news release May 21, 2019). Copper mineralization, +/- molybdenite, gold, silver and tellurium with grades, from previously collected rock grab samples, include 8.5% Cu, 1.1% Mo, 0.13 g/t Au and 54 g/t Ag and 60 ppm Te, (see Company news release April 19, 2023), are exposed in 4 of the 5 aggregate quarries on the Property over a strike-length of 570 metres. The zone, which continues to the northeast, follows a magnetic trend coincident with copper-molybdenite-anomalous soil samples.
Assay results from the new rock grab samples are pending.
Induced polarization (IP) and/or magneto-telluric (MT) geophysical surveys over the expanded Creston target area are out for tender.
"We are excited by the rapid changes in geology and mineralization and the zone of lead-zinc veins and breccias. This is the largest area of mineralization exposed to date at the Creston target and its position adjacent to the copper mineralization is consistent with the outer zone of Cu-Mo-Ag (Au-Te) porphyry systems and is most encouraging. We have been discovering increasingly substantial mineralization since intensifying our focus on the Creston target last summer, and we are eager to see the results of the geophysical surveys." – Ian Bliss, President and CEO, Northern Shield
Technical information in this news release was reviewed and approved by Christine Vaillancourt, P. Geo., the Company's Chief Geologist and a Qualified Person under National Instrument 43-101.
About Northern Shield Resources
Northern Shield Resources Inc. is a Canadian-based company, a leader in generating high-quality exploration targets, that views greenfield exploration as an opportunity to find a mineable, near surface deposit at relatively low cost. We implement a model driven exploration approach to reduce the risk associated with early-stage projects for ourselves, our shareholders, and the environment. This approach led us to option the Root & Cellar Property from a Newfoundland prospector, who discovered the copper mineralization, and then to its advancement to the large gold-silver-tellurium and porphyry copper/moly system that it has become.
Forward-Looking Statements Advisory
This news release contains statements concerning the exploration plans, results and potential for epithermal gold deposits, and other mineralization at the Company's Root & Cellar Property , geological, geophysical and geometrical analyses of the properties and comparisons of the properties to known epithermal gold deposits and other expectations, plans, goals, objectives, assumptions, information or statements about future, conditions, results of exploration or performance that may constitute forward-looking statements or information under applicable securities legislation. Such forward-looking statements or information are based on a number of assumptions, which may prove to be incorrect.
Although Northern Shield believes that the expectations reflected in such forward-looking statements or information are reasonable, undue reliance should not be placed on forward looking statements because Northern Shield can give no assurance that such expectations will prove to be correct. Forward-looking statements or information are based on current expectations, estimates and projections that involve a number of risks and uncertainties which could cause actual results to differ materially from those anticipated by Northern Shield and described in the forward looking statements or information. These risks and uncertainties include, but are not limited to, risks associated with geological, geometrical and geophysical interpretation and analysis, the ability of Northern Shield to obtain financing, equipment, supplies and qualified personnel necessary to carry on exploration and the general risks and uncertainties involved in mineral exploration and analysis.
The forward-looking statements or information contained in this news release are made as of the date hereof and Northern Shield undertakes no obligation to update publicly or revise any forward looking statements or information, whether as a result of new information, future events or otherwise, unless so required by applicable securities laws.
Neither TSX Venture Exchange nor its Regulation Services Provider (as that term is defined in policies of the TSX Venture Exchange) accepts responsibility for the adequacy or accuracy of this release.
Figure 1. Map showing location of recently exposed lead-zinc +/- molybdenite veins relative to copper mineralization and hydrothermal vent breccia. Locations are draped over analytical signature of the total magnetic intensity and satellite image. Figure 1b. Gossanous blocks of rock from the lead-zinc zone. (CNW Group/Northern Shield Resources Inc.)Figure 2a. Quartz-pyrite stockwork veining associated with strong potassium alteration of rhyolite and, Figure 2b, B-type vein (?) with pyrite along centreline, strong potassic altered margins and minor galena or molybdenite. Figure 2c. Crackled brecciated rhyolite with sphalerite-filled fractures (zinc sulphide) and pyrite veins. (CNW Group/Northern Shield Resources Inc.)Figure 2d, Galena (?)-pyrite +/- sphalerite vein within rhyolite dyke and diatreme breccia (2e&f). (CNW Group/Northern Shield Resources Inc.)
Cision
View original content to download multimedia: http://www.newswire.ca/en/releases/archive/January2026/14/c5812.html
Momentum investing is all about the idea of following a stock's recent trend, which can be in either direction. In the "long context," investors will essentially be "buying high, but hoping to sell even higher." And for investors following this methodology, taking advantage of trends in a stock's price is key; once a stock establishes a course, it is more than likely to continue moving in that direction. The goal is that once a stock heads down a fixed path, it will lead to timely and profitable trades.
While many investors like to look for momentum in stocks, this can be very tough to define. There is a lot of debate surrounding which metrics are the best to focus on and which are poor quality indicators of future performance. The Zacks Momentum Style Score, part of the Zacks Style Scores, helps address this issue for us.
Below, we take a look at Southern Copper (SCCO), which currently has a Momentum Style Score of B. We also discuss some of the main drivers of the Momentum Style Score, like price change and earnings estimate revisions.
It's also important to note that Style Scores work as a complement to the Zacks Rank, our stock rating system that has an impressive track record of outperformance. Southern Copper currently has a Zacks Rank of #2 (Buy). Our research shows that stocks rated Zacks Rank #1 (Strong Buy) and #2 (Buy) and Style Scores of "A or B" outperform the market over the following one-month period.
You can see the current list of Zacks #1 Rank Stocks here >>>
Set to Beat the Market?
In order to see if SCCO is a promising momentum pick, let's examine some Momentum Style elements to see if this miner holds up.
A good momentum benchmark for a stock is to look at its short-term price activity, as this can reflect both current interest and if buyers or sellers currently have the upper hand. It's also helpful to compare a security to its industry; this can show investors the best companies in a particular area.
For SCCO, shares are up 14.68% over the past week while the Zacks Mining – Non Ferrous industry is up 8.87% over the same time period. Shares are looking quite well from a longer time frame too, as the monthly price change of 24.31% compares favorably with the industry's 24.1% performance as well.
While any stock can see its price increase, it takes a real winner to consistently beat the market. That is why looking at longer term price metrics — such as performance over the past three months or year — can be useful as well. Shares of Southern Copper have increased 35.89% over the past quarter, and have gained 82.89% in the last year. In comparison, the S&P 500 has only moved 4.96% and 20.67%, respectively.
Investors should also pay attention to SCCO's average 20-day trading volume. Volume is a useful item in many ways, and the 20-day average establishes a good price-to-volume baseline; a rising stock with above average volume is generally a bullish sign, whereas a declining stock on above average volume is typically bearish. SCCO is currently averaging 1,353,884 shares for the last 20 days.
Earnings Outlook
The Zacks Momentum Style Score encompasses many things, including estimate revisions and a stock's price movement. Investors should note that earnings estimates are also significant to the Zacks Rank, and a nice path here can be promising. We have recently been noticing this with SCCO.
Over the past two months, 2 earnings estimates moved higher compared to none lower for the full year. These revisions helped boost SCCO's consensus estimate, increasing from $5.15 to $5.27 in the past 60 days. Looking at the next fiscal year, 3 estimates have moved upwards while there have been no downward revisions in the same time period.
Bottom Line
Taking into account all of these elements, it should come as no surprise that SCCO is a #2 (Buy) stock with a Momentum Score of B. If you've been searching for a fresh pick that's set to rise in the near-term, make sure to keep Southern Copper on your short list.
Want the latest recommendations from Zacks Investment Research? Today, you can download 7 Best Stocks for the Next 30 Days. Click to get this free report
Southern Copper Corporation (SCCO) : Free Stock Analysis Report
This article originally published on Zacks Investment Research (zacks.com).
PERTH, Australia, January 14, 2026–(BUSINESS WIRE)–Rio Tinto and BHP have agreed to work together to extract up to 200 million tonnes of iron ore at their neighbouring Yandicoogina and Yandi iron ore operations in the Pilbara.
Under two non-binding Memoranda of Understanding (MOUs), the companies will explore the potential for:
- Collaboration on the development of Rio Tinto’s Wunbye deposit; and
- BHP to supply its Yandi Lower Channel Deposit ore to Rio Tinto for processing at its existing wet plants under agreed commercial terms.
These new opportunities build on a 2023 agreement between Rio Tinto and BHP to mine the Mungadoo Pillar, which allowed mining of ore from the shared tenure boundary that was previously inaccessible.
Rio Tinto Iron Ore Chief Executive Matthew Holcz said: "By working smarter, we can better leverage existing infrastructure to unlock additional production with minimal capital requirements.
"Together we will extend the life of these operations, create additional value, and further support Western Australian jobs and local communities."
BHP WA Iron Ore Asset President Tim Day said: "This is a clear example of productivity in action – unlocking new opportunities by making the most of our existing resources.
"By sharing our expertise and infrastructure we will create new value and deliver benefit to our people, partners, customers and communities."
Rio Tinto and BHP have agreed to progress a conceptual study followed by an order of magnitude study. Subject to a final investment decision, first ore from both deposits is anticipated early next decade.
Any potential implementation would be subject to regulatory and joint venture approvals, and engagement with Traditional Owners.
View source version on businesswire.com: https://www.businesswire.com/news/home/20260114415776/en/
Contacts
Please direct all enquiries to media.enquiries@riotinto.com
Media Relations, United KingdomMatthew KlarM +44 7796 630 637 David OuthwaiteM +44 7787 597 493
Media Relations, Australia Matt Chambers M +61 433 525 739Alyesha AndersonM +61 434 868 118Rachel Pupazzoni M +61 438 875 469Bruce Tobin M +61 419 103 454
Media Relations, Canada Simon Letendre M +1 514 796 4973Malika Cherry M +1 418 592 7293Vanessa Damha M +1 514 715 2152
Media Relations, US & Latin America Jesse Riseborough M +1 202 394 9480
Investor Relations, United Kingdom Rachel Arellano M +44 7584 609 644David Ovington M +44 7920 010 978Laura Brooks M +44 7826 942 797Weiwei Hu M +44 7825 907 230
Investor Relations, Australia Tom Gallop M +61 439 353 948Eddie Gan-OchM +61 477 599 714
Rio Tinto plc 6 St James’s SquareLondon SW1Y 4ADUnited KingdomT +44 20 7781 2000Registered in EnglandNo. 719885
Rio Tinto Limited Level 43, 120 Collins StreetMelbourne 3000AustraliaT +61 3 9283 3333Registered in AustraliaABN 96 004 458 404
Category: Pilbara
Vancouver, British Columbia–(Newsfile Corp. – January 14, 2026) – Dynasty Gold Corp. (TSXV: DYG) (FSE: D5G1) (OTC Pink: DGDCF) ("Dynasty" or the "Company") is pleased to report the discovery of near-surface gold mineralization in all three step-out holes, 1.5 km from the Pelham Resource, in the previously untested new South-Pelham Zone (see Figure 1). The recent drill program tested an IP chargeability anomaly coincident with bedrock sulphide occurrences and areas with anomalous gold values within trenches related to previous exploration by Teck Resources Limited ("Teck") in 2007 and 2008. The drill holes intersected multiple zones of disseminated pyrite with associated gold mineralization at downhole depths ranging from 27.5 to 201 meters (see Table 1), similar to the mineralization in the Pelham Zone. Mineralization is open to expansion in multiple directions. The correlation of gold mineralization with Fe-sulphide minerals and IP chargeability anomalies in both the Pelham and South-Pelham zones provides encouragement for drill testing of the many other IP anomalies that lie along a 2.5km north-south trend within the central property area.
The Company also tested the metallic screening process for high gold assays on previously analyzed core samples. The metallic screened assay for one 1.5m core sample from a 2022 drill hole core yielded a gold value of 81.5 g/t (120-121.5m in DP22-03), which is 42% higher compared to the original 57.3 g/t assay. Additional testing will be carried out on the high-grade samples from the Pelham zone. More assay results are expected in the coming weeks.
Ivy Chong, President and CEO, commented, "The 2025 exploration objectives were to discover additional zones of mineralization both similar and proximal to the Pelham zone. This initial near-surface discovery in the South Pelham zone is highly encouraging as all three holes, for which assay results have been received, intersected mineralization within the first 50 meters of surface, confirming the widespread mineralization in this part of the property. It paves the way for additional drilling in 2026 to unlock the Thundercloud value beyond the Pelham Zone."
Drill hole TC25-01 was positioned approximately 100 meters southeast of TC24-06 to test whether the mineralization in that hole was indicated by the projected southwestward extension of the IP chargeability anomaly. Hole TC25-03, positioned 100 meters southeast of TC25-01, was designed to test high-sulphide bedrock occurrences discovered earlier in the 2025 summer mapping program where a rock chip sample returned 2.35 g/t gold (5334204E, 547037N). The high-sulphide outcrops are located within IP chargeability anomalies. TC25-03 is interpreted to have intersected the down-dip extension of the sulphide occurrences. TC25-04, positioned approximately 300 meters southeast of TC25-03, targeted Teck's trench T1 (2007); this hole confirmed widespread pyrite occurrences and anomalous gold mineralization in this area (see Figure 1).
Figure 1. Location of 2025 Phase 1 Drill Holes near high-sulfide showings
To view an enhanced version of this graphic, please visit:https://images.newsfilecorp.com/files/7227/280332_f6f01334c4614b6f_001full.jpg
Hole TC25-01 (-45.5° inclination) intersected a wide zone of 10 to 25% disseminated to stringer, and fracture-fill pyrite at a downhole depth from 40.6 to 46.6 meters, assaying 1.37 g/t over 6 meters. The mineralization is hosted within a mixed sequence of altered mafic volcanic and derived fine-grained sedimentary rocks characterized by distinctively coloured, hematitic alteration and silicification. The heavily pyritized zone is flanked by adjacent intervals containing 1 to 5% pyrite, giving an overall mineralized width of 13.0 meters (36.3m to 49.6m), assaying 0.68 g/t.
Hole TC25-03 (-46° inclination) confirmed further easterly, down-dip extension of the sulphide zone, with a 9-meter interval, between 38.0 and 47.0 meters, at 0.54 g/t gold. Mineralization is characterized by patchy, 5-10% disseminated and fracture-fill pyrite, with localized concentrations up to 15%. The host rock sequence is composed of mixed mafic volcanic and volcaniclastic to sedimentary rocks, showing similar tan to slightly maroon hematitic staining with overprinting silicification. The upper limit of the mineralized zone is defined by a quartz-porphyry intrusive contact. However, a 1.5-meter section of the porphyry between 41.0 and 42.5 meters contains 1-2% pyrite and assayed at 2.16 g/t gold.
A second sulphide-rich zone, 10.7 meters wide, occurs between 87.0- and 97.6-meters depth and has similar-style pyrite mineralization, with subordinate pyrrhotite and chalcopyrite, within silicified and carbonate-altered mafic volcanic rocks.
Hole TC25-04 (-45° inclination), the furthest south, located 300 meters south of Holes TC-25-03, targeted an outlying, or second IP chargeability anomaly and a former trench site where historical grab sample assay results of up to 0.596 g/t gold were obtained. The deeper part of the drill-hole tested an area below a cluster of historical soil geochemical anomalies with analytical values of up to 0.5 g/t gold, as reported by Teck in 2008. Core from this drill-hole contained numerous, narrow to broad zones of silicification containing low to moderate amounts of pyrite mineralization (2-7%), with localized concentrations of up to 20% pyrite over narrow widths (2-20cm), throughout most of its length.
Table 1. 2025 Thundercloud Drill Intercepts Highlights (and Metallic Screen Assay)
| Hole Number | Zone | East_NAD83 | North_NAD83 | From (m) | To (m) | Interval (m) | Au (g/t) |
| DP22-03 | Pelham | 534264 | 5471423 | 120 | 121.5 | 1.5 | 81.5 |
| TC25-01 | S. Pelham | 534211 | 5470442 | 0 | 36.6 | 36.6 | Not Assayed |
| 36.6 | 49.6 | 13 | 0.68 | ||||
| Including: | 40.6 | 46.6 | 6 | 1.37 | |||
| TC25-03 | S. Pelham | 534279 | 5470390 | 0 | 38.0 | 38 | Not Assayed |
| 38.0 | 47.0 | 9 | 0.57 | ||||
| Including: | 41.0 | 42.5 | 1.5 | 2.16 | |||
| TC25-04 | S. Pelham | 534380 | 5470147 | 0 | 27.5 | 27.5 | Not Assayed |
| 27.5 | 30.5 | 3 | 0.74 | ||||
| Including: | 27.5 | 29.0 | 1.5 | 1.83 | |||
| 30.5 | 72.85 | 42.35 | Not Assayed | ||||
| And | 112.2 | 127.93 | 15.73 | 0.54 | |||
| Including: | 112.2 | 118 | 5.8 | 1.00 | |||
| 112.2 | 116.7 | 4.5 | 1.26 | ||||
| 113.4 | 114.9 | 1.5 | 1.28 | ||||
| 115.4 | 116.7 | 1.3 | 2.45 | ||||
| 119.04 | 120.54 | 1.5 | 1.28 | ||||
| And | 140.9 | 142.73 | 1.83 | 0.95 | |||
| And | 199.6 | 201.2 | 1.6 | 1.54 |
Core recovery was close to 100%. True width is unknown.
Drill core that was not assayed but is contiguous to gold value samples will be cut and sampled.
Quality Assurance & Quality Control
Core was logged, sample intervals selected, and sawn at the property site under the supervision of the Company's consulting geologist. Samples were securely transported and personally delivered to Actlab in Dryden, Ontario, for Au-AA23 gold fire assays and ME-ICP61 multi-element packages for minor element analyses. OREAS standards, blanks, and duplicates were inserted into the sample stream to verify the comparative accuracy of the gold assays received. Following standard crush and grind sample preparation, samples were analyzed for gold by fire-assay methods and multi-element geochemical analysis using a 4-acid-dissolution.
The technical content of this press release has been reviewed and approved by Peter Holbek, MSc., P.Geo, an independent consultant to the Company and a "Qualified Person" ("QP") as defined in National Instrument 43-101 – Standards of Disclosure for Mineral Projects.
About Dynasty Gold Corp.
Dynasty Gold Corp. is a Canadian mineral exploration company currently focused on gold exploration in North America. Its 100%-owned Thundercloud property is situated within the Archean Manitou-Stormy Lakes Greenstone Belt, in northwestern Ontario. The Company is currently drilling to expand the NI 43-101 gold resource. A NI 43-101 Resource Estimate Report can be found on the Company's and SEDAR websites. The 100% owned Golden Repeat gold project in the Midas gold camp in Elko County, Nevada shares similar geological features as the Midas Gold mine and is surrounded by a number of large-scale operating mines. For more information, please visit the Company's website at www.dynastygoldcorp.com.
ON BEHALF OF THE BOARD OF DYNASTY GOLD CORP.
"Ivy Chong"_____________Ivy Chong, President & CEO
For additional information please contact:Vancouver Office:Ivy ChongPhone: 604.633.2100Email: ichong@dynastygoldcorp.com
This press release contains certain "forward-looking statements" that involve a number of risks and uncertainties. There can be no assurance that such statements will prove to be accurate and actual results and future events could differ materially from those anticipated in such statements. The TSX Venture Exchange has not reviewed and does not accept responsibility for the adequacy or accuracy of this release.
To view the source version of this press release, please visit https://www.newsfilecorp.com/release/280332
Goliath Resources Limited
TORONTO, Jan. 14, 2026 (GLOBE NEWSWIRE) — Goliath Resources Limited (TSX-V: GOT) (OTCQB: GOTRF) (FSE: B4IF) (the “Company” or “Goliath”) is focused on further expanding its new high-grade gold Surebet Discovery at its 100% controlled Golddigger Property that covers an area of 91,518 hectares in a highly prospective geological setting of the Eskay Rift, within 3 kilometers of the Red Line in the Golden Triangle of British Columbia. This area, in close proximity to the Red Line, has hosted some of Canada’s greatest gold mines including Eskay Creek, Premier and Snip. Other significant and well-known deposits in the Golden Triangle include Brucejack, Copper Canyon, Galore Creek, Granduc, KSM, Red Chris, and Schaft Creek. Goliath controls 56 kilometers of the Red Line which is a geologic contact between Triassic age Stuhini rocks and Jurassic age Hazelton rocks used as key markers when exploring for gold-copper-silver mineralization.
Goliath has completed over 150,000 meters of diamond drilling to date. It has confirmed a 1.8 square kilometer area that hosts multiple highly mineralized stacked zones containing high-grade gold grades that remains open. The Surebet discovery has predictable continuity and good metallurgy with gold recoveries from gravity and flotation at a 327-micrometer crush of 92.2% including 48.8% free gold from gravity alone (no cyanide required to recover the gold). The metallurgy completed to date shows no deleterious elements are present (see news release dated March 1, 2023).
AME Roundup 2026
To learn more about Goliath’s exciting new discovery, we would like to cordially invite you to visit us at our AME Roundup Core Shack, Booth # 1026C on Monday, January 26, 2026 – Tuesday, January 27, 2026 (9:00 AM – 4:00 PM). The event is being held at the Exhibit Hall – Vancouver Convention Centre East Building (1055 Canada Place, Vancouver, B.C.).
In case you are unable to see us at the core shack, please visit us at AME Roundup Booth #1104 as Goliath will also be exhibiting all 4 days Monday, January 26, 2026 – Wednesday, January 28, 2026 (9:00 AM – 4:00 PM) and Thursday, January 29, 2023 (9:00 AM – 2:30 PM).
Other Mining Conferences – Vancouver, January 2026
Vancouver Resource Investment Conference (VRIC), Goliath’s Booth #131. The event is being held at the Vancouver Convention Centre West Building (1055 Canada Place, Vancouver, B.C.) Sunday, January 25 – Monday, January 26, 2026 (8:30 AM – 6:00 PM). Roger Rosmus, Founder & CEO will be providing a corporate presentation on Sunday, January 25 (11:00 AM) at Workshop # 1.
Metals Investor Forum Vancouver, Goliath has a booth for the two day event and Roger Rosmus, Founder & CEO will be presenting Friday, January 23, 2026, during Session 1 at 10:00 AM. The event is being held at the Fairmont Pacific Rim (1038 Canada Place, Vancouver, B.C.) on Friday, January 23 – Saturday, January 24 (8:40 AM – 6:00 PM).
About the AME Roundup Conference
The AME Roundup is a dynamic four-day trade show featuring key players in mineral exploration, development, mining and reclamation. Among the hundreds of exhibitors under the sails in the Vancouver Convention Centre East, you will find prospectors and entrepreneurs, junior explorers and international mining companies, Indigenous groups, governments, universities, not-for-profits and an incredible collection of service and supply companies. For tickets and more information please visit: https://roundup.amebc.ca/
About the Vancouver Resource Investment Conference
The Vancouver Resource Investment Conference (VRIC) is the World’s Premier Mining Investment Event at a time when Gold & Silver are breaking records. The event will host 120 keynote speakers, 300 mining companies and over 12,000 attending investors. VRIC brings together the dealmakers, analysts, and operators shaping the future of precious metals — right when capital is surging back into the sector. For tickets and more information please visit: https://cambridgehouse.com/vancouver-resource-investment-conference
About the Metals Investor Forum Vancouver
Join 55 leading companies and 13 powerhouse keynote speakers at one of the most anticipated events of the year. Writers include: Eric Coffin (HRA Advisories), Joe Mazumdar (Exploration Insights), Jeff Clark (Paydirt Prospector), Brien Lundin (Gold Newsletter), Robert Sinn (Goldfinger Capital), Garrett Goggin (Golden Portfolio), Brian Leni (Junior Stock Review), John Kaiser (Kaiser Research Online), Chen Lin (What is Chen Buying? What is Chen Selling?), Peter Krauth (The Silver Stock Investor), and Greg McCoach (The Mining Speculator) for an exclusive, value-packed event. For tickets and more information please visit: https://metalsinvestorforum.com/metals-investor-forum-vancouver-jan-2026/
About the Golddigger Property
The Golddigger Property is 100% controlled and covers an area of 91,518 hectares in a highly prospective geological setting of the Eskay Rift, within 3 kilometers of the Red Line in the Golden Triangle of British Columbia. This area, in close proximity to the Red Line, has hosted some of Canada’s greatest gold mines including Eskay Creek, Premier and Snip. Other significant and well-known deposits in the Golden Triangle include Brucejack, Copper Canyon, Galore Creek, Granduc, KSM, Red Chris, and Schaft Creek. Goliath controls 56 kilometers of the Red Line which is a geologic contact between Triassic age Stuhini rocks and Jurassic age Hazelton rocks used as key markers when exploring for gold-copper-silver mineralization.
The Surebet discovery has predictable continuity and good metallurgy with gold recoveries from gravity and flotation at a 327-micrometer crush of 92.2% including 48.8% free gold from gravity alone (no cyanide required to recover the gold). The metallurgy completed to date shows no deleterious elements are present (see news release dated March 1, 2023).
The Property is in a well positioned location in close proximity to the communities of Alice Arm and Kitsault where there is a permitted mill site on private property. It is situated on tide water with direct barge access to Prince Rupert (190 kilometers via the Observatory inlet/Portland inlet). The town of Kitsault is accessible by road (190 kilometers from Terrace, 300 kilometers from Prince Rupert) and has a barge landing, dock, and infrastructure capable of housing at least 300 people, including high-tension power.
Additional infrastructure in the area includes the Dolly Varden Silver Mine Road (only 7 kilometers to the East of the Surebet discovery) with direct road access to Alice Arm barge landing (18 kilometers to the south of the Surebet discovery) and high-tension power (25 kilometers to the east of Surebet discovery). The city of Terrace (population 16,000) provides access to railway, major highways, and airport with supplies (food, fuel, lumber, etc.), while the town of Prince Rupert (population 12,000) is located on the West Coast of British Columbia and houses an international container seaport also with direct access to railway and an airport.
About CASERM (Center to Advance the Science of Exploration to Reclamation in Mining) Goliath Resources is a paying member and active supporter of the Center to Advance the Science of Exploration to Reclamation in Mining (CASERM), which is one of the world’s largest research centers in the mining sector. CASERM is a collaborative research venture between Colorado School of Mines and Virginia Tech that is supported by a consortium of mining and exploration companies, analytical instrumentation and software companies, and federal agencies aiming to transform the way geoscience data is acquired and used across the mining value chain. The center forms part of the I-UCRC program of the National Science Foundation. Research focuses on the integration of diverse geoscience data to improve decision making across the mine life cycle, beginning with the exploration for subsurface resources continuing through mine operation as well as closure and environmental remediation. Over the past three years, Goliath Resources’ membership in CASERM has allowed a high level of research to be performed on the Surebet Discovery.
Qualified Person
Rein Turna P. Geo is the qualified person as defined by National Instrument 43-101, for Goliath Resource Limited projects, and supervised the preparation of, and has reviewed and approved, the technical information in this release. Mr. Turna is an Independent Director of the Company.
About Goliath Resources Limited
Goliath Resources is an explorer of precious metals projects in the highly prospective Golden Triangle of Northwestern British Columbia. All of its projects are in high quality geological settings and geopolitical safe jurisdictions amenable to mining in Canada. Goliath is a member and active supporter of CASERM which is an organization that represents a collaborative venture between Colorado School of Mines and Virginia Tech. Goliath completed its largest fully funded drill campaign to date for a total of 64,364 meters in 2025. Assays are pending for gold only on 70 holes and 110 holes pending for gold equivalent assays. It is fully funded for a similar sized drill program in 2026. The Company’s key strategic cornerstone shareholders include Crescat Capital, a Global Commodity Group (Singapore), McEwen Inc. (NYSE: MUX) (TSX: MUX), Waratah Capital Advisors, Rob McEwen, Eric Sprott and Larry Childress.
For more information please contact: Goliath Resources Limited Mr. Roger Rosmus Founder and CEO Tel: +1-416-488-2887roger@goliathresources.com www.goliathresourcesltd.com
Neither the TSX Venture Exchange nor its Regulation Services Provider (as that term is defined in the policies of the TSX Venture Exchange), nor the OTCQB Venture Market accepts responsibility for the adequacy or accuracy of this release.
Certain statements contained in this press release constitute forward-looking information. These statements relate to future events or future performance. The use of any of the words "could", "intend", "expect", "believe", "will", "projected", "estimated" and similar expressions and statements relating to matters that are not historical facts are intended to identify forward-looking information and are based on Goliath’s current belief or assumptions as to the outcome and timing of such future events. Actual future results may differ materially. In particular, this release contains forward-looking information relating to, among other things, the ability of the Company to complete financings and its ability to build value for its shareholders as it develops its mining properties. Various assumptions or factors are typically applied in drawing conclusions or making the forecasts or projections set out in forward-looking information. Those assumptions and factors are based on information currently available to Goliath. Although such statements are based on management's reasonable assumptions, there can be no assurance that the proposed transactions will occur, or that if the proposed transactions do occur, will be completed on the terms described above.
The forward-looking information contained in this release is made as of the date hereof and Goliath is not obligated to update or revise any forward-looking information, whether as a result of new information, future events or otherwise, except as required by applicable securities laws. Because of the risks, uncertainties and assumptions contained herein, investors should not place undue reliance on forward-looking information. The foregoing statements expressly qualify any forward-looking information contained herein.
This announcement does not constitute an offer, invitation, or recommendation to subscribe for or purchase any securities and neither this announcement nor anything contained in it shall form the basis of any contract or commitment. In particular, this announcement does not constitute an offer to sell, or a solicitation of an offer to buy, securities in the United States, or in any other jurisdiction in which such an offer would be illegal.
The securities referred to herein have not been and will not be will not be registered under the United States Securities Act of 1933, as amended (the “U.S. Securities Act”), or any state securities laws and may not be offered or sold within the United States or to or for the account or benefit of a U.S. person (as defined in Regulation S under the U.S. Securities Act) unless registered under the U.S. Securities Act and applicable state securities laws or an exemption from such registration is available.
European equities traded in the US as American depositary receipts were heading slightly higher late
Ontario is fast-tracking Canada Nickel Co.‘s proposed open-pit nickel mine under its streamlined permitting review known as One Project, One Process.
The Crawford Nickel Project — a proposed open-pit nickel mine north of Timmins, Ont., with two potential ore-processing plants and new electrical infrastructure — is the only project that both the Ontario and federal governments have endorsed for potential fast-track permitting.
Canada Nickel is hoping to begin construction of the mine by the end of 2026, with a timeline that has first nickel production around the end of 2028. The company has marketed itself as an alternative to Indonesian nickel miners, which supply more than 61 per cent of the metal globally, and has received investments from several major miners, including Toronto-based Agnico Eagle Mines Ltd.
“Today’s announcement strengthens our commitment to commencing construction by yearend,” Canada Nickel chief executive Mark Selby said.
Ontario announced its One Project, One Process permit framework in the fall, saying it would cut permitting times for selected projects in half by appointing a team at the Ministry of Energy and Mines to act as a single point of contact for all provincial permits and Indigenous consultations.
Canada Nickel is the second project selected for the framework after Frontier Lithium Inc.’s proposed mine near Red Lake, Ont., was selected in October.
“In 2026, our government is going full tilt to unlock one of the world’s largest nickel deposits that will supercharge our economy and help end China’s critical mineral dominance,” Minister of Energy and Mines Stephen Lecce said in a release.
In November, the Crawford project was among the second tranche of projects that Tim Hodgson, federal minister of energy and natural resources, referred to the newly created Major Projects Office (MPO) for further review.
The MPO provides a single point of contact for permitting review and includes an Indigenous Advisory Council, which Natural Resources Canada said in a press release will “ensure that reconciliation, partnership and Indigenous economic participation are embedded in the way major projects are advanced in Canada.”
Selby said he has been consulting with nearby Indigenous groups for years on the Crawford Lake project, and his company has already signed support agreements with the Mattagami, Matachewan and Flying Post First Nations.
It also struck an agreement with the Taykwa Tagamou Nation, which holds converted notes that can be exercised for equity in the project.
The project also gained attention because it is located in an established mining district that already has major infrastructure in place.
With nickel demand rising as a result of growing electric vehicle and battery demand, Canada Nickel has raised tens of millions of dollars to explore for nickel, discovering 9.2 million tonnes of measured and indicated nickel in total.
-
Mark Selby: Canada has to act before the critical minerals window closes
-
The man behind nation-building nickel project has spent decades waiting for this moment
Based on the company’s studies, Crawford could become the world’s third-largest nickel sulphide operation and have a proposed mine life of 41 years.
Canada Nickel still needs to raise money to pay for mine construction and other facilities, but it has received investments, including from major miners. In 2023, London-based Anglo-American PLC — which is in the process of merging with Vancouver-based Teck Resources Ltd. to form Anglo Teck — invested $24 million for a 9.9 per cent stake.
• Email: gfriedman@postmedia.com
IAMGOLD Corporation IAG shares hit a fresh 52-week high of $18.07 yesterday, before retracing slightly to close the session at $17.8.
IAG has shot up 220.1% over the past year. The company has also outperformed the Zacks Mining-Gold industry’s 146.5% rise over the same time frame. The rally has been driven primarily by higher gold prices, record production at Cote Gold, improved cost efficiency across its West African operations, debt reduction and growing investor optimism.
Zacks Investment Research
Image Source: Zacks Investment Research
Let’s take a look at the factors that are driving IAG stock.
Production Expansion Drives IAG’s Momentum
IAMGOLD’s production and revenue results reflected a mix of strong growth at Cote Gold and operational challenges at Westwood and Essakane. Total attributable gold production rose 9.8% year over year to 190,000 ounces, driven largely by the Cote Gold ramp-up, which delivered 75,000 attributable ounces (106,000 ounces on a 100% basis), up roughly 83% from 41,000 ounces in the third quarter of 2024 as the mine progressed toward design capacity.
By contrast, Westwood’s production declined 28% to 23,000 ounces due to lower grades and transitional mining, while Essakane’s attributable output fell 8% to 92,000 ounces amid grade variability. Despite the uneven asset-level performance, revenues surged 61% year over year to $706.7 million from $438.9 million, supported by higher realized gold prices averaging $3,492 per ounce and increased sales volumes, with the ramp-up at Cote Gold making a significant contribution to the top-line growth.
In 2025, IAMGOLD advanced key projects and strategic initiatives to bolster growth. Cote Gold reached sustained nameplate capacity, improving production and costs with incremental investments like added crushing capacity. The company expanded its Quebec pipeline by acquiring Northern Superior Resources and Mines d’Or Orbec, consolidating multiple deposits into the Nelligan Mining Complex. Ongoing drilling at Nelligan and Monster Lake continues to enhance resource potential, while debt repayment strengthens the balance sheet and financial flexibility as IAMGOLD moves into a higher-production phase.
IAG’s Zacks Rank & Key Picks
IAG currently carries a Zacks Rank #3 (Hold).
Some better-ranked stocks in the Basic Materials space are Royal Gold Inc. RGLD, DPM Metals Inc. DPMLF and Harmony Gold Mining Company Limited HMY.
At present, RGLD and DPMLF sport a Zacks Rank #1 (Strong Buy), while HMY carries a Zacks Rank #2 (Buy). You can see the complete list of today’s Zacks #1 Rank stocks here.
The Zacks Consensus Estimate for RGLD’s current fiscal-year earnings is pinned at $8.04 per share, indicating a 53% year-over-year increase. Its earnings beat the Zacks Consensus Estimate in three of the trailing four quarters while missing once, with the average surprise being 4%. Its shares have popped around 82.9% over the past year.
The Zacks Consensus Estimate for DPMLF’s current-year earnings stands at $2.27 per share, indicating a 76% year-over-year increase. Its earnings beat the Zacks Consensus Estimate in each of the trailing four quarters, with the average earnings surprise being 13%. DPMLF’s shares have rallied roughly 124.1 over the past year.
The Zacks Consensus Estimate for HMY’s current-year earnings is pegged at $2.68 per share, indicating a year-over-year rise of 111%. HMY’s shares have gained 136.2% over the past year.
Want the latest recommendations from Zacks Investment Research? Today, you can download 7 Best Stocks for the Next 30 Days. Click to get this free report
Harmony Gold Mining Company Limited (HMY) : Free Stock Analysis Report
Iamgold Corporation (IAG) : Free Stock Analysis Report
Royal Gold, Inc. (RGLD) : Free Stock Analysis Report
DPM Metals Inc. (DPMLF) : Free Stock Analysis Report
This article originally published on Zacks Investment Research (zacks.com).
If you would like to receive our free newsletter via email, simply enter your email address below & click subscribe.
 Follow us on Twitter
 Become our facebook fan
CONNECT WITH US
Tweets
Tweet with hash tag #miningfeeds or @miningfeeds and your tweets will be displayed across this site.
MOST ACTIVE MINING STOCKS
Daily Gainers
 CMC Metals Ltd. CMC Metals Ltd. |
CMB.V | +900.00% |
 Eden Energy Ltd Eden Energy Ltd |
EDE.AX | +200.00% |
| GoviEx Uranium Inc. |
GXU.V | +42.86% |
| Eagle Nickel Ltd. |
ENL.AX | +41.67% |
| Citigold Corp. Limited |
CTO.AX | +33.33% |
| Mount Burgess Mining NL |
MTB.AX | +33.33% |
| Exalt Resources Limited |
ERD.AX | +31.94% |
| Casa Minerals Inc. |
CASA.V | +30.00% |
| Cariboo Rose Resources Ltd |
CRB.V | +28.57% |
| Belmont Resources Inc. |
BEA.V | +28.57% |


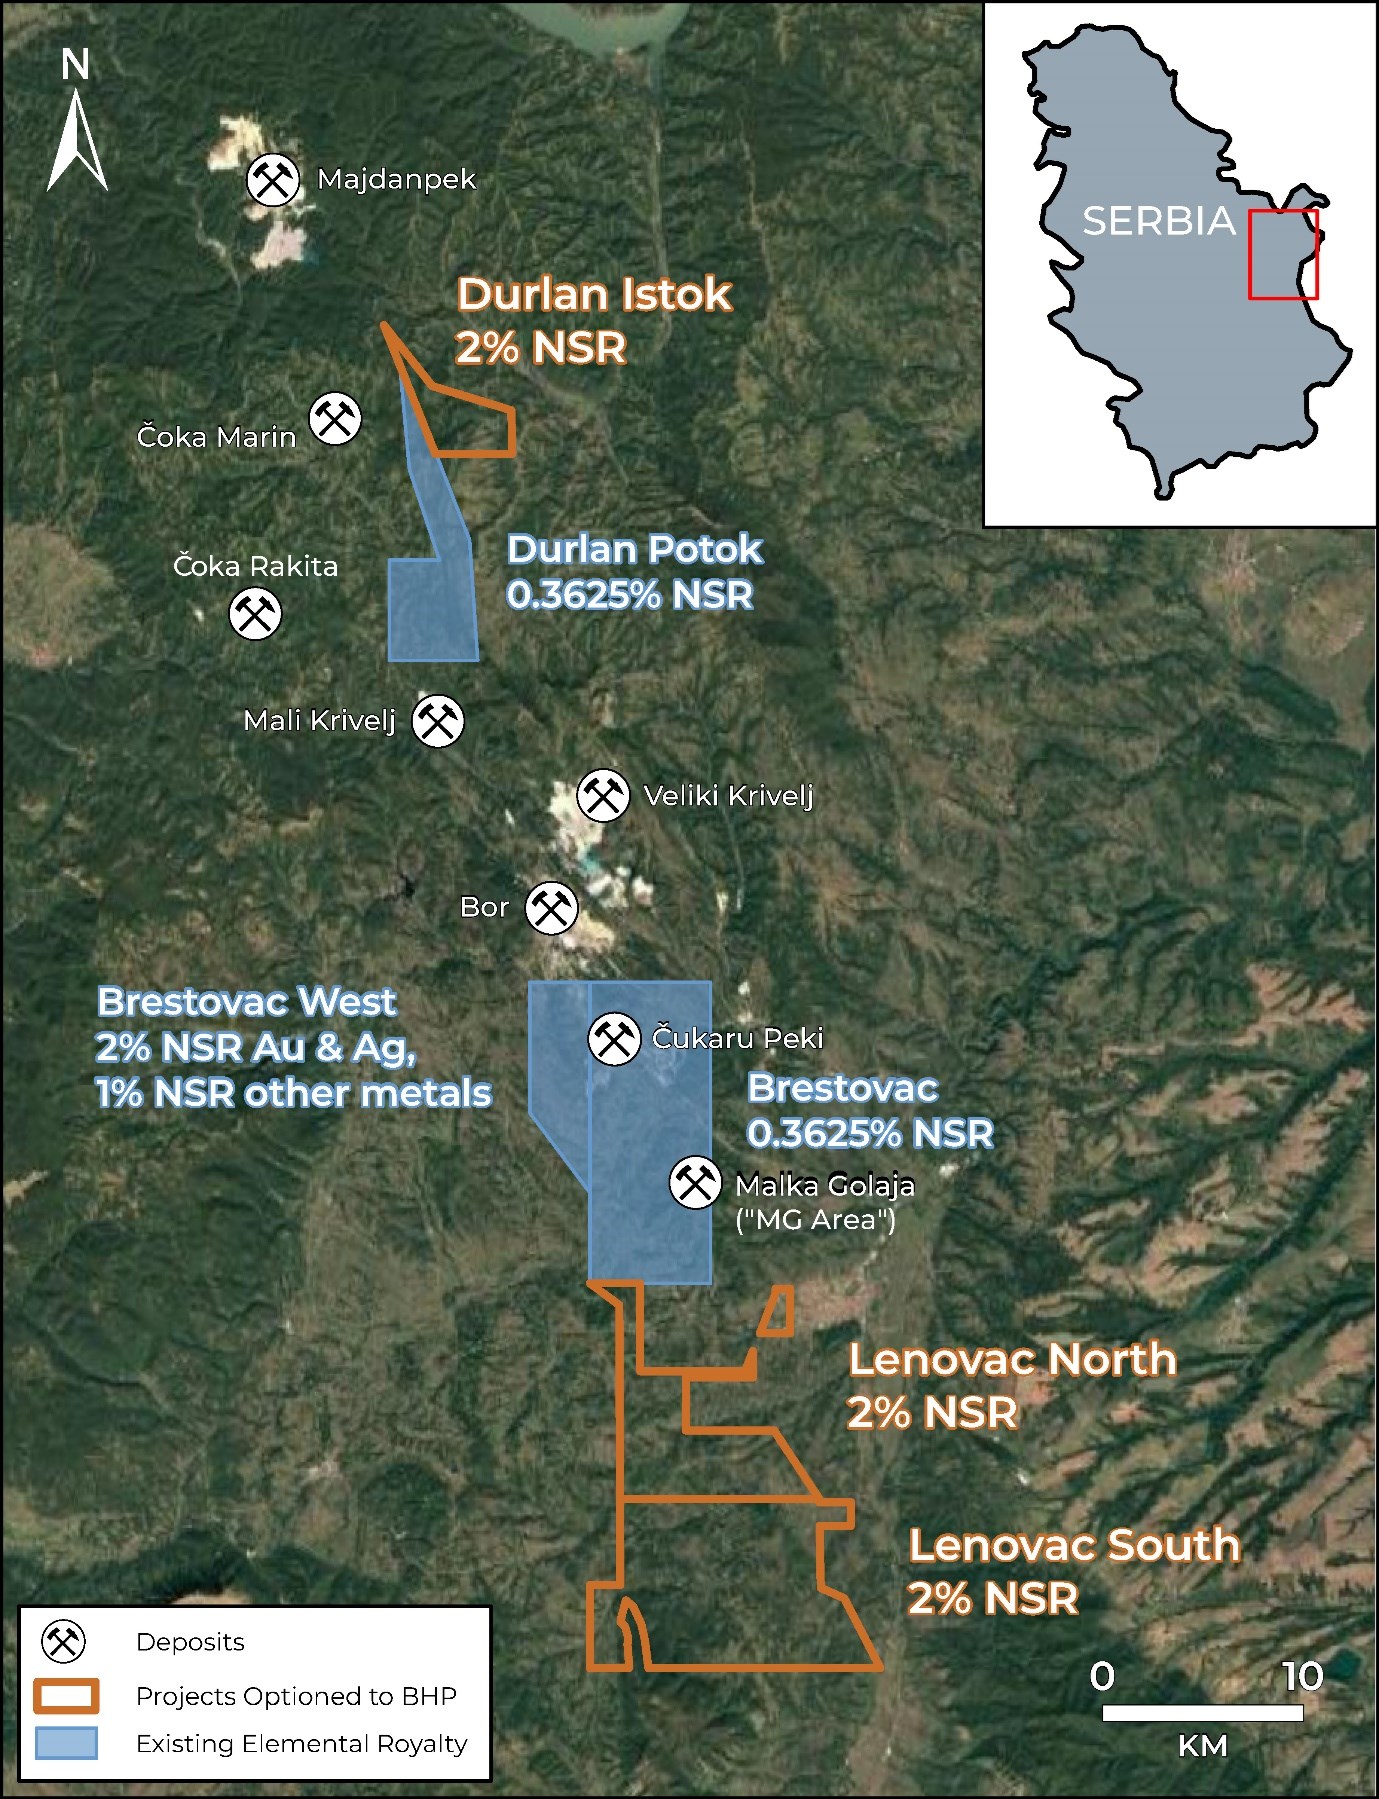
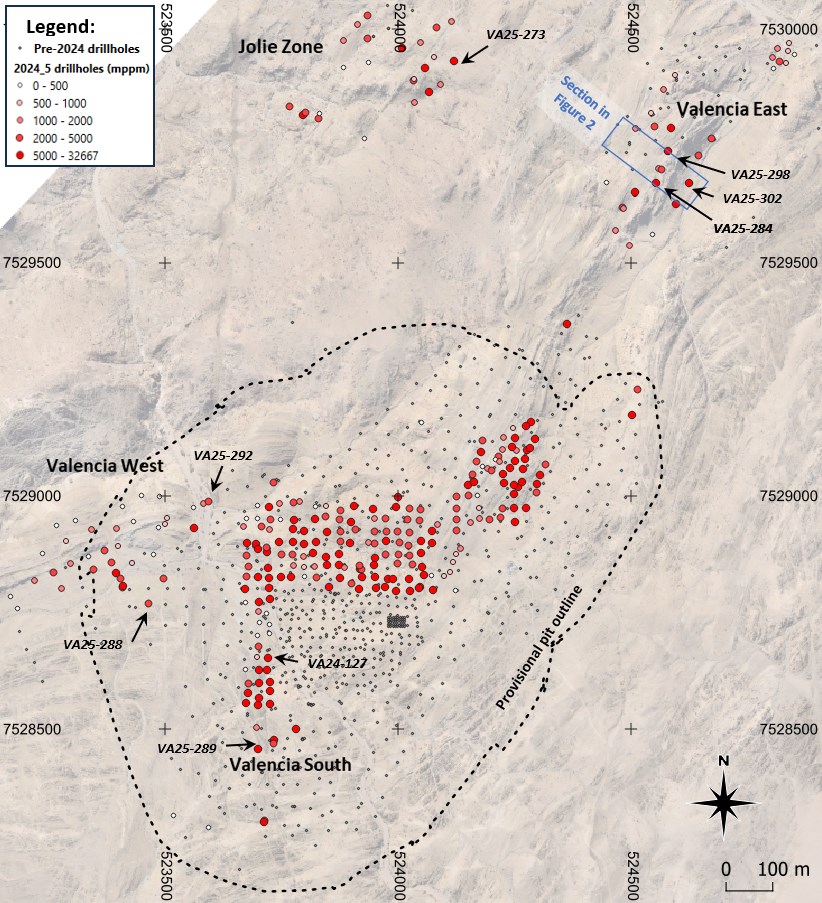
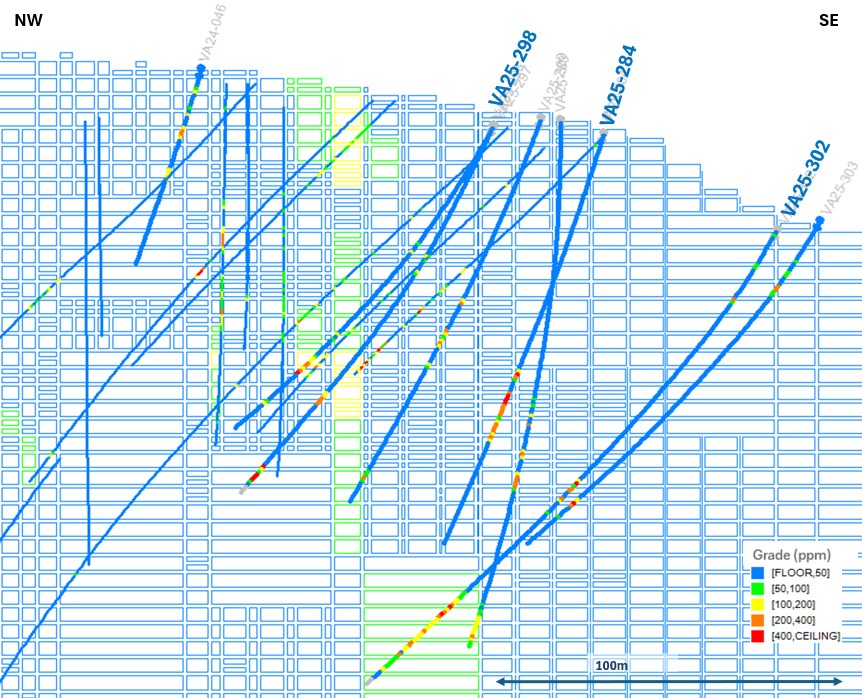
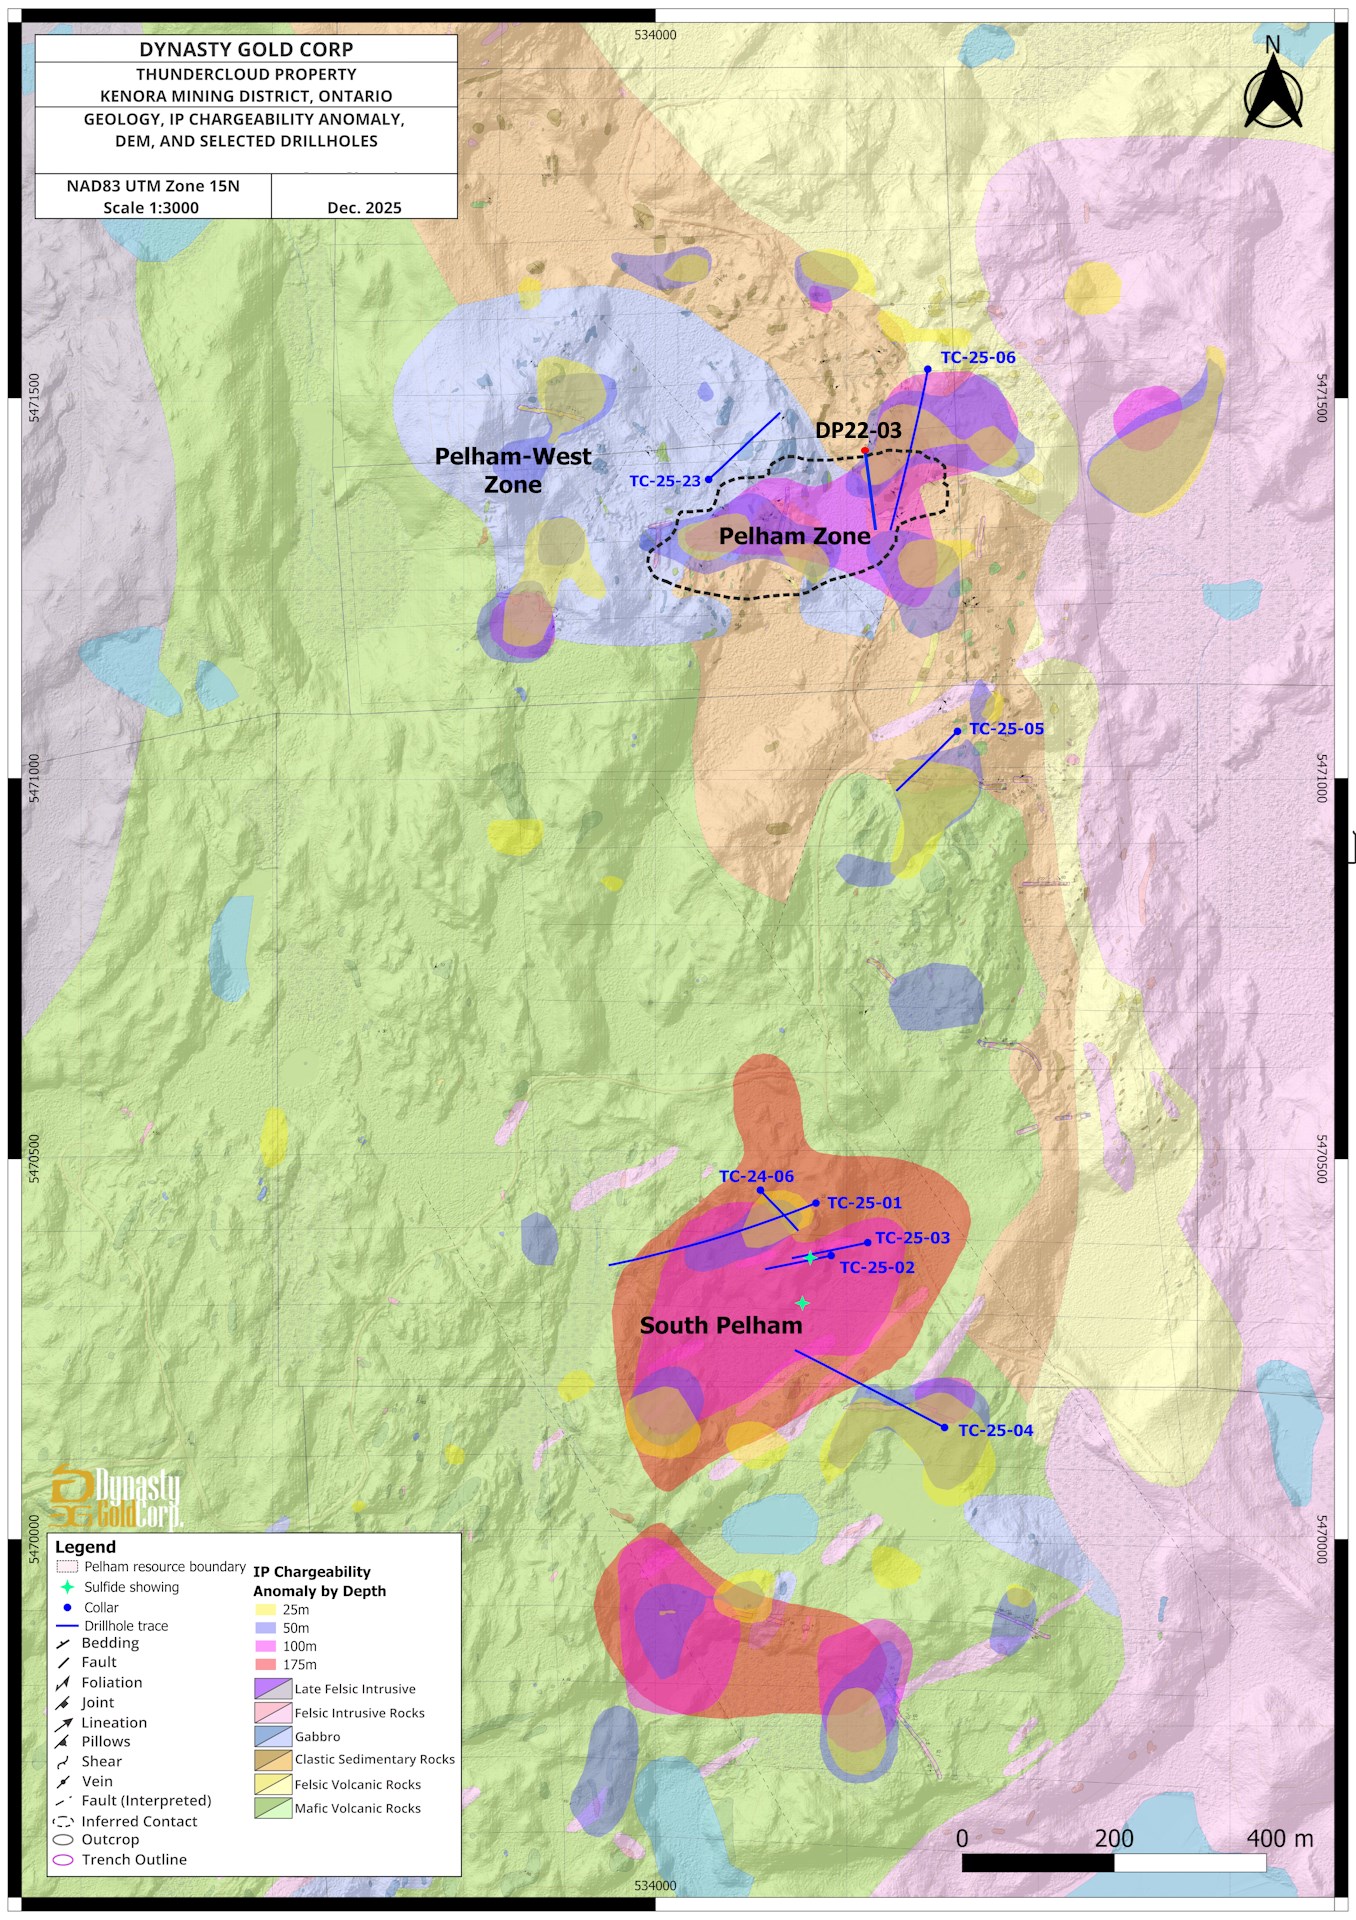