It is usually uneventful when a single insider buys stock. However, When quite a few insiders buy shares, as it happened in AusQuest Limited's (ASX:AQD) case, it's fantastic news for shareholders.
While we would never suggest that investors should base their decisions solely on what the directors of a company have been doing, we do think it is perfectly logical to keep tabs on what insiders are doing.
Check out our latest analysis for AusQuest
AusQuest Insider Transactions Over The Last Year
The Non-Executive Director Christopher Ellis made the biggest insider purchase in the last 12 months. That single transaction was for AU$400k worth of shares at a price of AU$0.021 each. That means that even when the share price was higher than AU$0.016 (the recent price), an insider wanted to purchase shares. Their view may have changed since then, but at least it shows they felt optimistic at the time. To us, it's very important to consider the price insiders pay for shares. Generally speaking, it catches our eye when insiders have purchased shares at above current prices, as it suggests they believed the shares were worth buying, even at a higher price.
While AusQuest insiders bought shares during the last year, they didn't sell. The chart below shows insider transactions (by companies and individuals) over the last year. By clicking on the graph below, you can see the precise details of each insider transaction!

There are plenty of other companies that have insiders buying up shares. You probably do not want to miss this free list of growing companies that insiders are buying.
Insider Ownership
Many investors like to check how much of a company is owned by insiders. A high insider ownership often makes company leadership more mindful of shareholder interests. It appears that AusQuest insiders own 33% of the company, worth about AU$4.3m. While this is a strong but not outstanding level of insider ownership, it's enough to indicate some alignment between management and smaller shareholders.
So What Do The AusQuest Insider Transactions Indicate?
The fact that there have been no AusQuest insider transactions recently certainly doesn't bother us. But insiders have shown more of an appetite for the stock, over the last year. Overall we don't see anything to make us think AusQuest insiders are doubting the company, and they do own shares. In addition to knowing about insider transactions going on, it's beneficial to identify the risks facing AusQuest. Our analysis shows 5 warning signs for AusQuest (3 shouldn't be ignored!) and we strongly recommend you look at them before investing.
But note: AusQuest may not be the best stock to buy. So take a peek at this free list of interesting companies with high ROE and low debt.
For the purposes of this article, insiders are those individuals who report their transactions to the relevant regulatory body. We currently account for open market transactions and private dispositions, but not derivative transactions.
This article by Simply Wall St is general in nature. We provide commentary based on historical data and analyst forecasts only using an unbiased methodology and our articles are not intended to be financial advice. It does not constitute a recommendation to buy or sell any stock, and does not take account of your objectives, or your financial situation. We aim to bring you long-term focused analysis driven by fundamental data. Note that our analysis may not factor in the latest price-sensitive company announcements or qualitative material. Simply Wall St has no position in any stocks mentioned.
Have feedback on this article? Concerned about the content? Get in touch with us directly. Alternatively, email editorial-team (at) simplywallst.com.
NEW YORK, October 08, 2021–(BUSINESS WIRE)–Distribution Announcement
The Trustees of Mesabi Trust (NYSE:MSB) declared a distribution of One Dollar and forty-two cents ($1.42) per Unit of Beneficial Interest payable on November 20, 2021 to Mesabi Trust Unitholders of record at the close of business on October 30, 2021. This compares to a distribution of thirty-six cents ($0.36) per Unit for the same period last year.
The One Dollar and six cents ($1.06) per Unit increase in the current distribution, as compared to the distribution announced by the Trust at the same time last year, is primarily attributable to the Trust’s receipt of total royalty payments of $19,495,040 on July 30, 2021 from Cleveland-Cliffs Inc. ("Cliffs"), the parent company of Northshore Mining Company ("Northshore"), which was higher than the total royalty payments of $4,349,830 received by the Trust from Cliffs in July 2020. The increase in the royalty received by the Trust for the second calendar quarter of 2021, as compared to the royalty received for the second calendar quarter of 2020, is primarily attributable to higher prices for iron ore products reflected in the second quarter 2021 royalty calculations, and higher volume of shipments during the second quarter 2021, compared with shipments in the second quarter 2020. The Trust’s distribution announcement today also reflects that the Trust’s most recent balance sheet includes a contract liability, which represents, among other things, iron ore that had not yet been shipped by Northshore, but for which the Trust has received a royalty payment based on an initial estimated price. See Mesabi Trust’s Quarterly Report on Form 10-Q, Note 2 (regarding "Contract asset and contract liability"), for the fiscal quarter ended July 30, 2021 (filed September 13, 2021). Finally, the Trust’s announcement today also reflects the Trustees’ assessment that Mesabi Trust will have sufficient reserves available to make such a distribution while also maintaining an appropriate level of unallocated reserves in order for the Trust to be positioned to meet current and future expenses, and present and future liabilities (whether fixed or contingent), that may arise.
Quarterly royalty payments from Northshore for iron ore shipments during the third calendar quarter, which are payable to Mesabi Trust under the royalty agreement, are due on October 30, 2021, together with the quarterly royalty report. After receiving the quarterly royalty report, Mesabi Trust plans to file a summary of the quarterly royalty report with the Securities and Exchange Commission in a Current Report on Form 8-K.
Forward-Looking Statements
This press release contains certain forward-looking statements with respect to iron ore pellet production, iron ore pricing and adjustments to pricing, shipments by Northshore in 2021, royalty (including bonus royalty) amounts, timing of quarterly royalty payments and quarterly royalty reports, and other matters, which statements are intended to be made under the safe harbor protections of the Private Securities Litigation Reform Act of 1995, as amended. Actual production, prices, price adjustments, and shipments of iron ore pellets, as well as actual royalty payments (including bonus royalties) could differ materially from current expectations due to inherent risks and uncertainties such as general adverse business and industry economic trends, uncertainties arising from war, terrorist events, potential future impacts of the coronavirus (COVID-19) pandemic, and other global events, higher or lower customer demand for steel and iron ore, decisions by mine operators regarding curtailments or idling of production lines or entire plants, announcements and implementation of trade tariffs, environmental compliance uncertainties, difficulties in obtaining and renewing necessary operating permits, higher imports of steel and iron ore substitutes, processing difficulties, consolidation and restructuring in the domestic steel market, indexing features in Cliffs Pellet Agreements resulting in adjustments to royalties payable to Mesabi Trust and other factors. Further, substantial portions of royalties earned by Mesabi Trust are based on estimated prices that are subject to quarterly and final adjustments, which can be positive or negative, and are dependent in part on multiple price and inflation index factors under customer agreements to which Mesabi Trust is not a party and that are not known until after the end of a contract year. Although the Mesabi Trustees believe that any such forward-looking statements are based on reasonable assumptions, such statements are subject to risks and uncertainties, which could cause actual results to differ materially. Additional information concerning these and other risks and uncertainties is contained in the Trust’s filings with the Securities and Exchange Commission, including its Annual Report on Form 10-K and Quarterly Reports on Form 10-Q. Mesabi Trust undertakes no obligation to publicly update or revise any of the forward-looking statements made herein to reflect events or circumstances after the date hereof.
View source version on businesswire.com: https://www.businesswire.com/news/home/20211008005570/en/
Contacts
Mesabi Trust SHR Unit
Deutsche Bank Trust Company Americas
904-271-2520
There's no doubt that money can be made by owning shares of unprofitable businesses. For example, although software-as-a-service business Salesforce.com lost money for years while it grew recurring revenue, if you held shares since 2005, you'd have done very well indeed. But while history lauds those rare successes, those that fail are often forgotten; who remembers Pets.com?
So should Vital Metals (ASX:VML) shareholders be worried about its cash burn? For the purposes of this article, cash burn is the annual rate at which an unprofitable company spends cash to fund its growth; its negative free cash flow. First, we'll determine its cash runway by comparing its cash burn with its cash reserves.
See our latest analysis for Vital Metals
How Long Is Vital Metals' Cash Runway?
A company's cash runway is the amount of time it would take to burn through its cash reserves at its current cash burn rate. As at June 2021, Vital Metals had cash of AU$35m and no debt. Looking at the last year, the company burnt through AU$16m. Therefore, from June 2021 it had 2.2 years of cash runway. Arguably, that's a prudent and sensible length of runway to have. The image below shows how its cash balance has been changing over the last few years.

How Is Vital Metals' Cash Burn Changing Over Time?
Vital Metals didn't record any revenue over the last year, indicating that it's an early stage company still developing its business. So while we can't look to sales to understand growth, we can look at how the cash burn is changing to understand how expenditure is trending over time. In fact, it ramped its spending strongly over the last year, increasing cash burn by 134%. It's fair to say that sort of rate of increase cannot be maintained for very long, without putting pressure on the balance sheet. Admittedly, we're a bit cautious of Vital Metals due to its lack of significant operating revenues. We prefer most of the stocks on this list of stocks that analysts expect to grow.
How Easily Can Vital Metals Raise Cash?
Given its cash burn trajectory, Vital Metals shareholders may wish to consider how easily it could raise more cash, despite its solid cash runway. Companies can raise capital through either debt or equity. Many companies end up issuing new shares to fund future growth. We can compare a company's cash burn to its market capitalisation to get a sense for how many new shares a company would have to issue to fund one year's operations.
Since it has a market capitalisation of AU$229m, Vital Metals' AU$16m in cash burn equates to about 7.0% of its market value. That's a low proportion, so we figure the company would be able to raise more cash to fund growth, with a little dilution, or even to simply borrow some money.
Is Vital Metals' Cash Burn A Worry?
On this analysis of Vital Metals' cash burn, we think its cash burn relative to its market cap was reassuring, while its increasing cash burn has us a bit worried. Cash burning companies are always on the riskier side of things, but after considering all of the factors discussed in this short piece, we're not too worried about its rate of cash burn. On another note, we conducted an in-depth investigation of the company, and identified 4 warning signs for Vital Metals (3 are potentially serious!) that you should be aware of before investing here.
Of course, you might find a fantastic investment by looking elsewhere. So take a peek at this free list of companies insiders are buying, and this list of stocks growth stocks (according to analyst forecasts)
This article by Simply Wall St is general in nature. We provide commentary based on historical data and analyst forecasts only using an unbiased methodology and our articles are not intended to be financial advice. It does not constitute a recommendation to buy or sell any stock, and does not take account of your objectives, or your financial situation. We aim to bring you long-term focused analysis driven by fundamental data. Note that our analysis may not factor in the latest price-sensitive company announcements or qualitative material. Simply Wall St has no position in any stocks mentioned.
Have feedback on this article? Concerned about the content? Get in touch with us directly. Alternatively, email editorial-team (at) simplywallst.com.
With the third-quarter earnings season commencing shortly for most sectors, investors will look to add stocks to their respective portfolios, which have the potential to surpass earnings expectations in the to-be-reported quarter. Generally, an earnings outperformance results in stock price appreciation.
The task of selecting appropriate stocks from a plethora of options available in the stock market at a given point of time is anything but easy. The current scenario of the Delta-variant induced uncertainty made the task even more daunting. The procedure becomes further difficult when one tries to select a winning portfolio without proper guidance.
Time for Some Broker Advice?
In view of these unprecedented times and economic constraints, it is in the best interest of investors to be guided by the experts in the field. The concerned experts are brokers. Brokers, irrespective of their types (sell-side, buy-side or independent), undertake a thorough research of the stocks that they cover.
They have at their disposal a lot more information on a company and its prospects than individual investors. To attain their objective, they go through minute details of the publicly available financial documents apart from attending company conference calls and other presentations. Broker opinion should thus act as a valuable guide for investors while deciding their course of action (buy, sell or hold) on a particular stock.
Direction of Earnings Estimates Serves as a Proper Pointer
As brokers meticulously follow the stocks in their coverage, they revise their earnings estimates after carefully examining the pros and the cons of an event for the concerned company. Naturally, their estimate revisions serve as an important pointer regarding the price of a stock.
To take care of the earnings performance, we designed a screen based on improving broker recommendations and upward estimate revisions over the last four weeks.
Do not Ignore the Top Line
However, designing a strategy based solely on the bottom line is unlikely to lead to a winning approach. Actually, according to many market watchers, a revenue beat is more creditable for a company than a mere earnings outperformance. To address top-line concerns, we included in our screen the price/sales ratio, which serves as a strong complementary valuation metric.
Screening Criteria
# (Up- Down Rating)/ Total (4 weeks) =Top #75: This gives the list of top 75 companies that have witnessed net upgrades over the last 4 weeks.
% change in Q (1) est. (4 weeks) = Top #10: This gives the top 10 stocks that have witnessed earnings estimate revisions over the past 4 weeks for the upcoming quarter.
To ensure that the strategy is a winning one, covering all bases, we have added the following screening parameters:
Price-to-Sales = Bot%10: The lower the ratio the better, companies meeting this criteria are in bottom 10% of our universe of over 7,700 stocks with respect to this ratio.
Price greater than 5: A stock trading below $5 will not likely create significant interest for most investors.
Average Daily Volume greater than 100,000 shares over the last 20 trading days: Volume has to be significant to ensure that these are easily traded.
Market value ($ mil) = Top #3000: This gives us stocks that are the top 3000 if one judges by market capitalization.
Com/ADR/Canadian= Com: This eliminates the ADR and Canadian stocks.
Here are five of the 10 stocks that made it through the screen:
C.H. Robinson Worldwide CHRW, currently carrying a Zacks Rank #3 (Hold), operates as an asset-light logistics company. This Minnesota-based freight broker is being aided by the improving freight scenario in the United States. The company has an impressive track record with respect to earnings, which surpassed the Zacks Consensus Estimate in each of the last four quarters, the average being 14.5%.
ArcBest Corporation ARCB provides freight transportation services and solutions. Improving freight conditions in the United States bode well for this presently Zacks Rank #1 (Strong Buy) player. Solid customer demand and higher market rates are supporting growth at ArcBest. The stock has witnessed the Zacks Consensus Estimate for current-quarter earnings being revised 29.8% upward over the past 60 days. You can see the complete list of today’s Zacks #1 Rank stocks here.
AutoNation AN, currently sporting a Zacks Rank of 1, is an automotive retailer in the United States. The stock has seen the Zacks Consensus Estimate for current-year earnings move 7.3% north over the past 60 days. The company is benefiting from factors like its diversified product mix and cost-containment efforts.
Based in Houston, TX, Phillips 66's PSX operations incorporate refining, midstream, marketing and specialties, and chemicals. The company, currently carrying a Zacks Rank of 3, is strongly positioned to gain from rising demand for midstream assets in the United States. It has an impressive history with respect to earnings, which surpassed the Zacks Consensus Estimate in three of the last four quarters (missing the mark in the remaining one). The average beat is 28.6%.
Peabody Energy BTU: St Louis, MO-based Peabody Energy engages in the coal-mining business and has both thermal and metallurgical operations to manage. Revival in the domestic and international coal markets augurs well for this currently Zacks Rank #2 (Buy) stock that outperformed on earnings in each of the last four quarters, the average being 48%.
You can get the rest of the stocks on this list by signing up now for your 2-week free trial to the Research Wizard and start using this screen in your own trading. Further, you can also create your own strategies and test them first before taking the investment plunge.
The Research Wizard is a great place to begin. It's easy to use. Everything is in plain language. And it's very intuitive. Start your Research Wizard trial to day. And the next time you read an economic report, open up the Research Wizard, plug your finds in, and see what gems come out.
Click here to sign up for a free trial to the Research Wizard today.
Disclosure: Officers, directors and/or employees of Zacks Investment Research may own or have sold short securities and/or hold long and/or short positions in options that are mentioned in this material. An affiliated investment advisory firm may own or have sold short securities and/or hold long and/or short positions in options that are mentioned in this material
Disclosure: Performance information for Zacks’ portfolios and strategies are available at: https://www.zacks.com/performance.
Want the latest recommendations from Zacks Investment Research? Today, you can download 7 Best Stocks for the Next 30 Days. Click to get this free report
Peabody Energy Corporation (BTU) : Free Stock Analysis Report
C.H. Robinson Worldwide, Inc. (CHRW) : Free Stock Analysis Report
AutoNation, Inc. (AN) : Free Stock Analysis Report
Phillips 66 (PSX) : Free Stock Analysis Report
ArcBest Corporation (ARCB) : Free Stock Analysis Report
To read this article on Zacks.com click here.
TORONTO, Oct. 08, 2021 (GLOBE NEWSWIRE) — Forsys Metals Corp. (TSX: FSY) (FSE: F2T) (NSX: FSY) (“Forsys” or the “Company”) is pleased to announce that Richard Parkhouse has been appointed as Executive Director responsible for Investor Relations with immediate effect.
CEO, Mark Frewin, stated that, “Richard has significant experience and background in investor relations from his past career in investment banking and asset management and is perfectly placed to spearhead this role.”
With its fully permitted Valencia Mining Licence, Forsys is intent on capitalizing on the recent positive market sentiment in the uranium sector, by updating its feasibility study and advancing the development of its wholly-owned Norasa Uranium Project in Namibia. In connection with this goal Forsys is focused on enhancing its investor communication strategies.
Also, Richard will be attending the annual Red Cloud Octoberfest virtual Conference from Monday October 18th to Wednesday October 20, 2021 where he will be presenting “The Forsys Corporate Opportunity” on Tuesday 19th October at 11am ET and will be available on October 19th for 1×1 meetings between 9am ET and 5pm ET.
Investors register: https://www.redcloudfs.com/oktoberfest2021/
About Forsys Metals Corp.
Forsys Metals Corp. is a uranium focused development company with 100% ownership of the Norasa project that comprises the Valencia and Namibplaas uranium projects in Namibia, Africa a politically stable and mining friendly jurisdiction. Information regarding current National Instrument 43-101 compliant Resource and Reserves at Valencia and Namibplaas are available on the Company website forsysmetals.com.
On behalf of the Board of Directors of Forsys Metals Corp. Richard Parkhouse, Director, Investor Relations.
For additional information please contact:
Richard Parkhouse
Director, Investor Relations
email: rparkhouse@forsysmetals.com
email: info@forsysmetals.com
Phone: +44 (0) 7730 493432

TORONTO, Oct. 08, 2021 (GLOBE NEWSWIRE) — First Quantum Minerals Ltd. (“FQM” or the “Company”) (TSX: FM) will release third quarter 2021 financial and operating results on Tuesday, October 26, 2021 after the close of the Toronto Stock Exchange. The Company will host a conference call and webcast to discuss the results on Wednesday, October 27, 2021 at 9:00 am (ET).
|
Conference call and webcast details: |
||
|
Toll-free North America: |
1-800-952-5114 |
|
|
Toronto Local and International: |
416-406-0743 |
|
|
Toll-free UK: |
00-80042228835 |
|
|
Passcode: |
3445838# |
|
|
Webcast: |
||
|
Conference call replay: |
||
|
Toll-free North America: |
1-800-408-3053 |
|
|
Toronto Local and International: |
905-694-9451 |
|
|
Passcode: |
2396459# |
|
The conference call replay will be available from October 27, 2021 until 11:59pm ET on November 10, 2021.
For further information, visit our website at www.first-quantum.com or contact:
Bonita To, Director, Investor Relations
(416) 361-3400 Toll-free: 1 (888) 688-6577
E-Mail: info@fqml.com

VANCOUVER, BC / ACCESSWIRE / October 8, 2021 /Resolve Ventures Inc.("Resolve" or the "Company") (TSXV:RSV) is pleased to announce commencement of Phase 1 of the 2021 exploration programs at the Company's Gravity Jack Property located in the New Westminster Mining Division, near Boston Bar, British Columbia, Canada.
Historic exploration of historic magnetite – copper skarns returned highlight values of 2% copper and 61% iron over 12.9 metres. These skarns have received minimal exploration utilizing modern exploration methods and the Company feels they are high priority targets.
The three-part Phase 1 work program will focus on the skarns, and also over the remainder of the 10 square kilometre property and consist of:
-
Heliborne high-resolution magnetic ("MAG") survey flown over the entire of the property
-
Stream sediment geochemical sampling over the entire property
-
Reconnaissance level prospecting and mapping, focusing on anomalies from MAG survey.
The MAG survey has been contracted to Ridgeline Exploration Services Inc. ("Ridgeline") based in Kelowna, BC. The survey is scheduled to consist of 1428 line kms at 150 metre line spacings flown in a NE direction, with 1500 metre tie lines flown in the NW direction. The instrumentation will be a GEM systems GSMP-35A(B) magnetometer. Ridgeline is a wholly owned subsidiary of Goldspot Discoveries Corp. The Phase I program is being managed by contract geoscientist Raymond Wladichuk, P.Geo. (waldosciences.com).
Clive Massey, Resolve Ventures CEO and President commented, "We are extremely pleased to commence exploration on the Gravity Jack Property with airborne and ground surveys. Recent exploration has focused on magnetite-copper skarns where historical highlight values of 2% copper and 61% iron across 12.9 metres, along with local silver highlight values of 68.57 g/t were obtained from massive magnetite, pyrite, pyrrhotite, chalcopyrite and hematite. The detailed airborne magnetics survey is designed to trace the magnetite copper skarn mineralization along strike and search for repeats."
About the Gravity Jack Property
Gravity Jack Property is located in the New Westminster Mining Division, and is approximately 13km northeast of Boston Bar, British Columbia, Canada. The property surface area totals 10,050 hectares (Ha). The property is prospective for Scandium, Copper, Gold, Silver, and Tungsten. Historically, minimal work has been done on the property with the exception of high-grade skarn occurrences reported in the 1960's.
About the Company
Resolve is a Vancouver based publicly listed exploration company trading on the TSXV. The Company is led by a highly skilled management and technical team with numerous previous successes in the junior mining sector.
For further information on the Company, visit www.resolveventures.com or call (604) 644-6794.
Qualified Persons
Mr. R. Tim Henneberry, P.Geo., a member of the Company's Advisory Board and registered in the Provinces of British Columbia is the "Qualified Person" under National Instrument 43-101 Standards of Disclosure for Mineral Projects ("NI 43-101") and is responsible for the technical contents of this news release and has approved the disclosure of the technical information contained herein.
ON BEHALF OF THE BOARD OF DIRECTORS
"Clive Massey"
Clive H. Massey
President & CEO
For further information, please contact:
Investor Relations
Phone: (604) 644-6794
Neither the TSX Venture Exchange nor their Regulation Services Provider (as that term is defined in the policies of the TSX Venture Exchange) accepts responsibility for the adequacy or accuracy of this release.
Forward-Looking Statements:
Certain statements included in this news release are forward-looking statements. These statements reflect management's current estimates, beliefs, intentions, and expectations and they are based on assumptions; they are not guarantees of future performance. Forward-looking statements in this news release include statements that reflect the Company's expectation that it will take the steps to earn the Option on the Gravity Jack Property. The Company cautions that all forward-looking statements are inherently uncertain, and that actual performance may be affected by a number of material factors, many of which are beyond the Company's control. Such factors include, among other things: risks and uncertainties relating to the Company's ability to earn the Option, including the Company's ability to raise capital in order to incur exploration expenditures; and other risks and uncertainties, including those described in the Company's filings on SEDAR.com. Accordingly, actual and future events, conditions and results may differ materially from the estimates, beliefs, intentions, and expectations expressed or implied in the forward-looking information. Except as required under applicable securities legislation, the Company undertakes no obligation to publicly update or revise forward-looking information.
SOURCE: Resolve Ventures Inc.
View source version on accesswire.com:
https://www.accesswire.com/667299/Resolve-Ventures-Announces-Exploration-Program-on-the-Gravity-Jack-Property
BRISBANE, Australia, Oct. 08, 2021 (GLOBE NEWSWIRE) — Orocobre Limited (ASX: ORE, TSX: ORL) (“Orocobre” or “the Company”) will release the September Quarterly Production Report on Friday 22 October 2021. Managing Director and CEO, Mr. Martín Pérez de Solay will conduct a live webcast briefing at 10am AEST (Brisbane), 11am AEDT (Sydney, Melbourne). The webcast briefing will be available via Orocobre’s website www.orocobre.com. Written questions may be submitted via the webcast.
An archive copy of the briefing and Q&A session will subsequently be made available on the Company website.
Rick Anthon
Joint Company Secretary
For more information please contact:
Andrew Barber
Chief Investor Relations Officer
Orocobre Limited
T: +61 7 3871 3985
M: +61 418 783 701
E: abarber@orocobre.com
W: www.orocobre.com
Twitter: https://twitter.com/OrocobreLimited
LinkedIn: https://www.linkedin.com/company/orocobre-limited
Facebook: https://www.facebook.com/OrocobreLimited/
Instagram: https://www.instagram.com/orocobre/
YouTube: https://www.youtube.com/OrocobreLimited
Click here to subscribe to the Orocobre e-Newsletter

Val-d'Or, Quebec–(Newsfile Corp. – October 8, 2021) – Abitibi Royalties Inc. (TSXV: RZZ) (OTCQX: ATBYF) ("Abitibi Royalties") and Golden Valley Mines and Royalties Ltd. (TSXV: GZZ) (OTCQX: GLVMF) ("Golden Valley" and together with Abitibi Royalties, the "Companies") are pleased to announce that they have each publicly filed and commenced the sending of their respective management information circulars (the "Circulars") and related materials for their special meetings (the "Meetings") to be held on October 29, 2021 to approve the previously announced plans of arrangement (the "Arrangements").
Pursuant to the Arrangements, among other things, Gold Royalty Corp. (NYSE American: GROY) ("Gold Royalty") will acquire:
-
all of the outstanding common shares of Abitibi Royalties (the "Abitibi Shares") in exchange for 4.6119 common shares of Gold Royalty (the "Gold Royalty Shares") for each Abitibi Share; and
-
all of the outstanding common shares of Golden Valley (the "Golden Valley Shares") in exchange for 2.1417 Gold Royalty Shares for each Golden Valley Share.
The Companies are also pleased to announce that they have each obtained interim orders of the British Columbia Supreme Court, which provide for, among other things, the holding of the Meetings under applicable corporate legislation.
The Arrangements are subject to customary conditions applicable to such transactions, including receipt of requisite court, shareholder and stock exchange approvals. Each Arrangement is also conditional on completion of the other Arrangement. If all necessary approvals are obtained and the conditions to each Arrangement are met or waived, it is currently anticipated that the Arrangements will be completed in November 2021.
Benefits of the Arrangements
The anticipated benefits of the Arrangements to the Companies' respective shareholders, include, among other things:
-
Significant Premium. The share exchange ratio represents significant premiums of 22% and 86% to Abitibi Royalties and Golden Valley shareholders, respectively, based on the 20-day volume-weighted average price of each party's shares as of September 3, 2021, being the last trading date prior to the announcement of the Arrangements.
-
Creation of a Leading Growth and Americas-Focused Precious Metals Royalty Company. The transaction creates a new, sizable Americas-focused royalty company. The combined company is expected to have over 190 royalties across the production, development and exploration stages in various jurisdictions in the Americas.
-
Ability to Participate in Future Potential Growth of the Combined Entity. By receiving Gold Royalty Shares under the Arrangements, Abitibi Royalties and Golden Valley shareholders will have meaningful ownership in a leading growth and Americas-focused precious metals royalty company with continued exposure to the royalty portfolio of the combined company through ownership of Gold Royalty Shares. Abitibi Royalties and Golden Valley shareholders will each also have increased exposure to royalties that are in production, currently under development, in the feasibility or preliminary economic assessment stage and on numerous key exploration projects. Additionally, given the increased scale and diversification, it is expected that Gold Royalty will be positioned for a re-rate by attracting enhanced multiples that are generally applicable to larger companies.
-
Enhanced Balance Sheet and Access to Capital. The combined company will have approximately US$52.9 million in cash and cash equivalents, restricted cash and marketable securities and no debt (pro forma as of June 30, 2021), greater access to equity and debt capital markets and the critical mass to drive significant growth through acquisitions.
-
Expanded Québec Presence and Increased Diversification. The combined company will have an expanded presence in Québec through Gold Royalty's royalties on properties managed by Monarch Mining Corporation and Wallbridge Mining Company Limited. In addition, the transaction presents the opportunity for Abitibi Royalties and Golden Valley shareholders to participate in a royalty portfolio that includes royalties in Nevada and other jurisdictions of the Americas.
-
Increased Liquidity and Simplification of Ownership. The Gold Royalty Shares are listed on the NYSE American which is expected to enhance the market visibility and exposure of the combined companies. The transactions will also simplify the ownership structure of Abitibi Royalties and Golden Valley by eliminating the overhang from the existing ownership structure.
The directors, senior officers and certain shareholders of the Companies, holding in the aggregate approximately 65.4% and 38.0%, respectively, of the issued and outstanding common shares of each of Abitibi Royalties (including Golden Valley) and Golden Valley, have entered into voting support agreements with Gold Royalty dated September 6, 2021, pursuant to which they have agreed to vote their shares in favour of the respective Arrangements at the applicable Meetings and against any resolution or transaction that would prevent or delay the completion of such Arrangement. Of such shares, approximately 31.4% and 11.2% of the outstanding shares of Abitibi Royalties and Golden Valley, respectively, are subject to "hard" lock-up support and voting agreements, pursuant to which the obligations of the shareholder continue for a period of 6 months from the date thereof and do not terminate in the event the underlying arrangement agreement is terminated in accordance with its terms.
Recommendation of the Boards of Directors
The boards of directors of each of Abitibi Royalties and Golden Valley, each on the unanimous recommendation of a special committee comprised of its independent directors, unanimously recommend that shareholders vote FOR the applicable Arrangement.
Meeting Materials
Shareholders of each of the Companies should refer to the applicable Circular and related materials for detailed instructions on how to vote and participate at the Meeting. The Circulars also contain important information regarding the Arrangements and underlying agreements. The Circulars and related materials are available on each respective Company's profile at www.sedar.com. Each of the Companies urges shareholders to review such materials prior to voting at the Meetings.
The Meetings
The Golden Valley Meeting is scheduled for 12:00 p.m. (Eastern time) on October 29, 2021 and the Abitibi Royalties Meeting is scheduled for 1:00 p.m. (Eastern time) on October 29, 2021. The Meetings will each be held at 2864, chemin Sullivan, Val-d'Or, Québec, and will also be held by telephone conference call. Given the continuing impact of the COVID-19 pandemic, considerations regarding the health and safety of employees and stakeholders as well as public health guidelines to limit gatherings of people, shareholders are encouraged to attend the Meetings by telephone conference. Shareholders who wish to attend the meetings must follow the instructions set out in the respective Circulars.
Your Vote is Important
Whether or not you plan to attend the applicable Meeting, the Companies each encourage their respective shareholders to vote promptly. Please complete the form of proxy or voting instruction form enclosed with the Circulars and return it to the Companies' transfer agent, Odyssey Trust Company, as soon as possible, and in any event no later than: (i) 12:00 p.m. (Eastern time) on October 27, 2021, in the case of the Golden Valley Meeting; and (ii) 1:00 p.m. (Eastern time) on October 27, 2021, in the case of the Abitibi Royalties Meeting.
Registered shareholders can vote at the respective Meetings prior to such deadlines by returning their completed form of proxy by mail to Suite 350, 409 Granville Street, Vancouver, British Columbia V6C 1T2, Attention: Proxy Department; or by facsimile: 1-800-517-4553; or by voting through the Internet following the instructions on the form of proxy.
Non-registered shareholders, being shareholders whose shares are not registered in their own name should follow the instructions set forth in the voting instruction form sent to them by their broker or other financial institution in order to vote their shares at the applicable Meeting.
If you have any questions regarding the submission of your proxy, please contact Odyssey Trust Company, at its North American toll-free number: 1-888-290-1175.
About Abitibi Royalties Inc.
Abitibi Royalties Inc. owns various royalties at the Canadian Malartic Mine near Val-d'Or, Québec. In addition, Abitibi Royalties is building a portfolio of royalties on early-stage properties near producing mines and generating mineral projects for option or sale.
About Golden Valley Mines and Royalties Ltd.
Golden Valley Mines and Royalties Ltd. is focused on project and royalty generation and continues to evaluate opportunities to enhance its mining exploration property portfolio. Golden Valley is able to grow its current assets by way of partner-funded option/joint ventures and through its shareholdings in related-entities.
For additional information, please contact:
Abitibi Royalties Inc.
Ian Ball, President & CEO
Tel.: 1-888-392-3857
Email: info@abitibiroyalties.com
Golden Valley Mines and Royalties Ltd.
Glenn Mullan, President & CEO
Tel.: 1-819-824-2808 ext.204
Email: glenn.mullan@goldenvalleymines.com
Cautionary Statement on Forward-Looking Information:
Certain of the information contained in this news release constitutes 'forward-looking information' and 'forward-looking statements' within the meaning of applicable Canadian and U.S. securities laws ("forward-looking statements") and involve known and unknown risks, uncertainties and other factors that may cause each of the Companies' and/or Gold Royalty's actual results, performance and achievements to be materially different from the results, performance or achievements expressed or implied therein. Such forward-looking statements, including but not limited to statements relating to the proposed Arrangements; the conditions to closing of each of the Arrangements; and the anticipated timing thereof; and the anticipated timing, benefits and effects of the completion of the Arrangements, involve risks, uncertainties and other factors which may cause the actual results to be materially different from those expressed or implied by such forward-looking statements. Such factors include, among others, obtaining required shareholder, stock exchange and regulatory approvals, exercise of any termination rights under the underlying arrangement agreements, any inability to satisfy the other conditions therein, material adverse effects on the business, properties and assets of the Companies; and any inability of the parties to realize the benefits of the proposed transactions. Although the Companies have each attempted to identify important factors that could cause actual results to differ materially from those contained in forward-looking statements, there may be other factors that cause results not to be as anticipated, estimated or intended. There can be no assurance that such statements will prove to be accurate, as actual results and future events could differ materially from those anticipated in such statements. Accordingly, readers should not place undue reliance on forward-looking statements. Neither of the Companies undertakes to update any forward-looking statements, except in accordance with applicable securities laws.
Neither TSX Venture Exchange nor its Regulation Services Provider (as that term is defined in policies of the TSX Venture Exchange) accepts responsibility for the adequacy or accuracy of this release.


To view the source version of this press release, please visit https://www.newsfilecorp.com/release/99030
Vancouver, British Columbia–(Newsfile Corp. – October 8, 2021) – Playfair's (TSXV: PLY) (FSE: P1J1) (OTC Pink: PLYFF) extensive drill program on its large (201 square kilometers) 100% RKV Copper Project in South Central Norway has successfully completed four short holes totaling 154.6 metres to test the Rødalen target identified by using a combination of Artificial Intelligence (CARDS) and Mobile Metal Ion (MMI) geochemistry. The drill is now being moved to Storboren, the second of seven targets to be tested.
Local geological supervision is provided by Promin (a Trondheim-based consultancy). All four holes intersected a previously unknown amphibolite unit containing sulphides, including narrow widths of massive sulphides at the contact with the quartz-mica-schist country rock at Rødalen. Copper mineralization at the nearby historic mines of Røstvangen and Kvikne is closely associated with amphibolite.

Figure 1: NQ drillcore with sulphides in first hole at Rødalen
To view an enhanced version of Figure 1, please visit:
https://orders.newsfilecorp.com/files/7302/98944_playfair1.jpg

Figure 2: NQ drillcore with sulphides in first hole at Rødalen
To view an enhanced version of Figure 2, please visit:
https://orders.newsfilecorp.com/files/7302/98944_playfair2.jpg
Samples are being cut and prepared for analysis. Playfair will consider future exploration at Rødalen once analytical results have been received.
The man portable drill team is being supervised by Canadian drillers (No Limit Diamond Drilling) for Arctic Drilling (based in Finnmark). Local "Muskelgutta" (Muscle Guys) have risen to the challenge of moving the man portable drill. Local community support is greatly appreciated.

Figure 3: "Muskelgutta": Olav Pedersen, Thomas Løkken, Glenn Tonning Ryn, Marius Wagenius and Magnus Kveberg
To view an enhanced version of Figure 3, please visit:
https://orders.newsfilecorp.com/files/7302/98944_playfair3.jpg

Figure 4: "Muskelgutta": Olav Pedersen, Thomas Løkken, Glenn Tonning Ryn, Marius Wagenius and Magnus Kveberg
To view an enhanced version of Figure 4, please visit:
https://orders.newsfilecorp.com/files/7302/98944_playfair4.jpg
In keeping with Playfair's intent to minimise the impact of its exploration on the natural environment Playfair is using a lightweight drilling machine which can be disassembled and hand-carried to the drill sites. Although lightweight the drill is capable of drilling to 150m depth using BQ sized rods (36.5 mm or 1.437 inches core diameter) and to 100m depth using NQ sized rods (47.8mm or 1.872 inches core diameter).
All seven drill targets show compelling coherent MMI Cu anomalies with multiple MMI Cu values greater than 6,000 ppb. The highest value recorded was 53,300 ppb MMI Cu.
A short MMI Report by SGS states that values greater than 6,000 ppb MMI Cu, "Are likely to be associated with weathering copper sulphides."
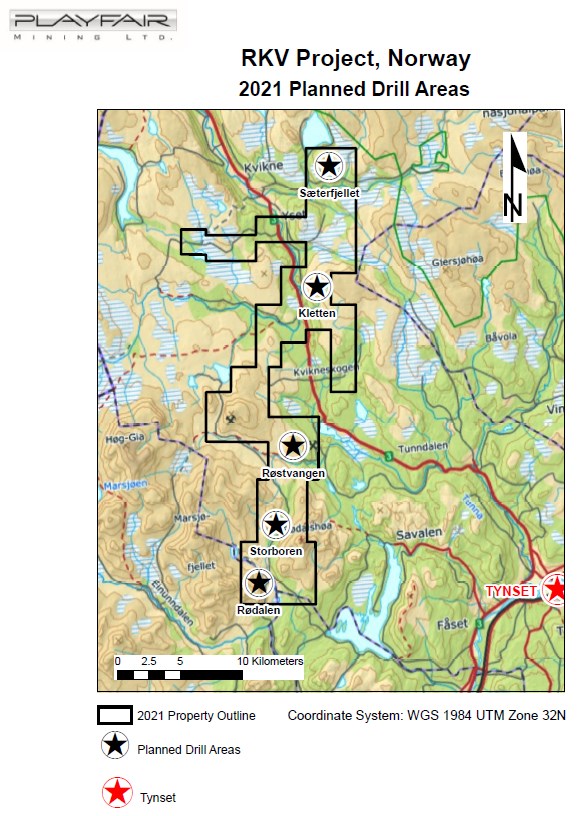
RKV Project, Norway – 2021 Planned Drill Areas
To view an enhanced version of this graphic, please visit:
https://orders.newsfilecorp.com/files/7302/98944_ec4d4cb424626bea_006full.jpg

RKV Copper Project, Norway – Drill Targets
To view an enhanced version of this graphic, please visit:
https://orders.newsfilecorp.com/files/7302/98944_ec4d4cb424626bea_007full.jpg
Overall management and execution of Playfair's RKV drilling program is provided by Ronacher McKenzie Geoscience Inc., an independent consulting group, who, as part of their supervision, will ensure that appropriate quality assurance/quality control (QA/QC) protocols are in place. RMG follows the Canadian Institute of Mining, Metallurgy and Petroleum's (CIM) Best Practices.
In Norway, Reidar Gaupås, Playfair's representative, continues to assist Playfair within the local community and enhance Playfair's profile in Norway.
Promin AS, a Trondheim-based consultancy with extensive experience in the Norwegian Mining industry, provides logistical support and experienced geologists. Helge Rushfeldt has assisted greatly in the start-up of the drill program. Kjell Nilsen, one of Norway's most experienced field geologists who discovered Nussir, Norway's largest known copper deposit, and Jonas Dombrowski are directly supervising the drilling, core logging and analysis.
Arctic Drilling AS, a Norwegian drilling company based in Kautokeino, will carry out the drilling assisted by Canadian drillers (No Limit Diamond Drilling) who are familiar with the man portable drill and will train Arctic Drilling personnel in the operation of this drill.
The drill targets are MMI (Mobile Metal Ion) copper anomalies discovered by sampling target areas generated by Windfall Geotek using their proprietary Computer Aided Resources Detection System (CARDS).
The seven drill targets were previously described: Storboren (November 07, 2019, and December 05, 2019, News Releases), Sæterfjellet, (January 06, 2021, News Release), Kletten North and Kletten South (January 28, 2021, News Release), Røstvangen Northeast and Røstvangen Southwest (February 17, 2021, News Release) and Rødalen (March 11, 2021, News Release).
A presentation on the drilling plans can be found at this direct link or on Playfair's website.
The technical contents of this release were approved by Greg Davison, PGeo, a qualified person as defined by National Instrument 43-101.
The road to a cleaner environment includes electric vehicles. Electric vehicles need copper, nickel, and cobalt. There is no green future without minerals.
For further information visit our website at www.playfairmining.com or contact:
Donald G. Moore
CEO and Director
Phone: 604-377-9220
Email: dmoore@wascomgt.com
D. Neil Briggs
Director
Phone: 604-562-2578
Email: nbriggs@wascomgt.com
Forward-Looking Statements: This Playfair Mining Ltd News Release may contain certain "forward-looking" statements and information relating to Playfair which are based on the beliefs of Playfair management, as well as assumptions made by and information currently available to Playfair management. Such statements reflect the current risks, uncertainties and assumptions related to certain factors including, without limitations, exploration and development risks, expenditure and financing requirements, title matters, operating hazards, metal prices, political and economic factors, competitive factors, general economic conditions, relationships with vendors and strategic partners, governmental regulation and supervision, seasonality, technological change, industry practices, and one-time events. Should any one or more of these risks or uncertainties materialize or change, or should any underlying assumptions prove incorrect, actual results and forward-looking statements may vary materially from those described herein.

To view the source version of this press release, please visit https://www.newsfilecorp.com/release/98944

Yields of up to 15pc are on offer next year as FTSE 100 dividends return to record levels, rewarding investors who make early moves to capture 2022’s top payouts.
Total payments could reach £85.1bn, just behind the £85.2bn record paid out in 2018, according to the stockbroker AJ Bell, as profits and economies rebound after the pandemic.
Analysts are predicting British blue-chip stocks will build on a strong recovery in dividends this year. Payouts from FTSE 100 companies are forecast to reach £84.1bn in 2021, a rise of 37pc from £61.4bn in 2020.
Dividends from some of the London stock market’s biggest payers this year have sent their yields soaring.
Shares in miners Rio Tinto and Evraz yield almost 18pc, based on payouts for their 2021 financial year and current share prices, according to AJ Bell. Rival BHP Group yields 11.3pc.
While dividends from miners have ballooned, investors haven’t left it too late to cash in, according to experts. More than half of Rio Tinto’s 17.8pc yield is forecast to come from a bumper final dividend expected to be paid in April. Similarly, half of Evraz’s $1.48 dividend predicted for its 2021 financial year has yet to be paid.
The FTSE 100’s trio of top dividend payers are meanwhile forecast to continue to offer high payouts next year. Analysts have estimated 2022 yields of 14.9pc for Evraz, 12.4pc for Rio Tinto and 12.2pc for BHP.
Is this too good to be true? Ian Williams, the manager of the Charteris Premium Income fund, said he did not think so. Mr Williams, who holds around a third of his portfolio in mining stocks, said he expected double-digit yield forecasts to come good, despite a slump in the iron ore price from its summer high amid waning Chinese demand.
“Even if commodity prices fall, mining companies are so profitable they can still pay high dividends,” he said.
“Rio Tinto takes iron ore out of the ground for around $20 a ton. Prices have fallen by almost half since July to $118 a ton, so even after a crash it can still afford to pay shareholders.”
Mr Williams argued that miners could continue to raise their dividends in the future as they rode a wave of higher demand for metals as governments and companies pushed to decarbonise the economy.
“You can’t have decarbonisation without metals. Electric cars use four times as much copper as their petrol equivalents – demand for the metal could rise more in the next 10 years than it has done in the past 2,000,” he said.
“Rare earth” metals will also be in demand thanks to their use in the lithium-ion batteries used to power electric cars. Mr Williams highlighted Polymetal International, forecast to yield 9.8pc next year, as a major miner of these metals.
However, other investors warned that chasing the high yields offered by mining stocks was dangerous. Laura Foll of the fund group Janus Henderson said: “Be wary of relying solely on the yield to value shares.”
She added that Rio Tinto and BHP’s high forecast dividends depended on the prices of a narrow basket of metals.
Ms Foll highlighted shares in rival miner Anglo American, which she owns in her funds, as an alternative. Expected to yield 6.6pc next year, she argued that the stock’s dividend was more reliable as the company made money from a large basket of commodities, including copper, diamonds, iron ore and nickel.
Shares in banks also offered good dividend prospects, she said. Lenders have resumed payouts after the Bank of England scrapped restrictions imposed at the start of the pandemic, and their dividends are expected to grow. Lloyds Banking Group and NatWest, which Ms Foll owns, are forecast to yield 5.6pc and 4.7pc respectively next year.
Simon Gergel, manager of the £660m Merchants Trust, also cautioned on the outlook for miners’ dividends. He said payouts from Rio Tinto and BHP would fall next year should the iron ore price remain at its current level.
He recommended tobacco companies as an alternative source of dividends as their profits were more predictable. British American Tobacco and Imperial Brands are forecast to yield 8.5pc and 9.2pc next year, and the former has raised its payout in each of the past 23 years.
TORONTO, Oct. 08, 2021 (GLOBE NEWSWIRE) — (TSXV: TVC) Three Valley Copper Corp. (“Three Valley Copper” or the “Company”) announces that it has granted 234,075 Deferred Share Units (DSUs) to directors and 49,938 Restricted Share Units (RSUs) to the CEO pursuant to its long-term incentive plan.
The Company intends to grant DSUs quarterly to its directors, with each grant representing one-half of each director’s board retainer, payable in cash or common shares of the Company, upon the holder ceasing to be a director of the Company. The 234,075 DSUs granted reflect the total of owed to directors for the quarters ending March 31, 2021, June 30, 2021 and September 30, 2021.
The RSUs granted to the CEO represent 20% of the base compensation of the CEO and are payable in common shares of the Company on exercise, and vest on January 1 of the second calendar year after the date of grant. The Company intends to grant additional RSUs representing 20% of the base compensation of the CEO on a quarterly basis.
About Three Valley Copper
Three Valley Copper, headquartered in Toronto, Ontario, Canada is focused on growing copper production from, and further exploration of, its primary asset, Minera Tres Valles. Located in Salamanca, Chile, MTV is 91.1% owned by the Company and MTV's main assets are the Minera Tres Valles mining complex and its 46,000 hectares of exploratory lands. For more information about the Company, please visit www.threevalleycopper.com.
For further information:
Michael Staresinic
Chief Executive Officer
T: (416) 943-7107
E: mstaresinic@threevalleycopper.com
Renmark Financial Communications Inc.
Joshua Lavers: jlavers@renmarkfinancial.com
T: (416) 644-2020 or (212) 812-7680
www.renmarkfinancial.com
Source: Three Valley Copper.
Neither the TSX Venture Exchange nor its Regulation Services Provider (as that term is defined in the policies of the TSX Venture Exchange) accepts responsibility for the adequacy or accuracy of this news release.

NOT FOR DISTRIBUTION TO UNITED STATES NEWS WIRE SERVICES OR FOR DISSEMINATION IN THE UNITED STATES
VANCOUVER, British Columbia, Oct. 08, 2021 (GLOBE NEWSWIRE) — Ranchero Gold Corp. (formerly, Melior Resources Inc.) (TSXV: “RNCH”) (the “Company”) is pleased to announce that it has completed its previously announced reverse-takeover transaction (the “Transaction”) with the private entity Ranchero BC Holding Corp. (formerly Ranchero Gold Corp.) (“Ranchero”). In accordance with the terms of the Transaction, the Company has acquired all of the issued and outstanding securities of Ranchero by way of a three-cornered amalgamation in accordance with the terms and conditions of the amalgamation agreement dated February 17, 2021, as amended, between Melior Resources Inc., Ranchero and 1274169 B.C. Ltd. The Transaction constituted a reverse takeover of the Company by Ranchero pursuant to Policy 5.2 of the Corporate Finance Manual of the TSX Venture Exchange (the “TSXV”), as following the closing of the Transaction, the former shareholders of Ranchero own a majority of the outstanding common shares of the Company.
The Company has filed a filing statement dated September 30, 2021 (the “Filing Statement”) on SEDAR under its profile relating to the Transaction. In connection with the Filing Statement, the Company also filed a technical report regarding the Santa Daniela property titled “CSA NI 43-101 Technical Report on the Santa Daniela Gold Project, Municipios of Sahuaripa and Yecora, Sonora, Mexico” with an effective date of August 24, 2020 (the “Technical Report”). Investors are encouraged to review the Filing Statement and Technical Report, which provide detailed information about the Transaction, the Company and the Santa Daniela property.
The common shares of the Company are expected to commence trading on the TSXV on or about October 18, 2021 under the new trading symbol “RNCH”. The Transaction remains subject to the final acceptance of the TSXV.
Name Change and Consolidation
Prior to the completion of the Transaction, the Company changed its name to “Ranchero Gold Corp.” and consolidated its common shares (the “Consolidation”) on the basis of 32.6764 pre-Consolidation common shares for one post-Consolidation common share of the Company. Letters of transmittal providing instructions on exchanging pre-Consolidation share certificates for post-Consolidation share certificates or Direct Registration System (DRS) Statements to be issued in the name of “Ranchero Gold Corp.” will be mailed by TSX Trust Company to the Company’s registered shareholders. Registered shareholders are encouraged to send their share certificates, together with their letter of transmittal, to TSX Trust Company in accordance with the instructions in the letter of transmittal. Beneficial shareholders holding common shares in the capital of the Company through an intermediary should be aware that the intermediary may have different procedures for processing the Consolidation and are encouraged to contact their respective intermediaries in this regard. No fractional common shares will be issued as a result of the Consolidation. Where the Consolidation would otherwise result in an entitlement to a fractional common share, the number of post-Consolidation shares issued will be rounded up or down to the nearest whole number of common shares.
An aggregate of 57,862,322 common shares of the Company were issued pursuant to the Transaction. Following the completion of the Transaction, the Company has an aggregate of approximately 65,737,322 common shares issued and outstanding. The CUSIP number of the common shares of the Company has been changed to 75189P109 and its ISIN has been changed to CA75189P1099.
Debt Settlement and Success Fee
As a condition to closing of the Transaction, the Company settled its debt of approximately C$35.5 million owing to Pala Investments Limited (“Pala”) through the conversion of approximately C$32.0 million of the outstanding indebtedness into an aggregate of 6,449,759 common shares of the Company, on a post-Consolidation basis, and Pala forgave the remaining indebtedness of approximately C$3.5 million pursuant to the terms of a debt settlement agreement between Pala and the Company.
As Pala was a control person of the Company prior to the Transaction, the debt settlement was a related party transaction pursuant to Multilateral Instrument 61-101 – Protection of Minority Security Holders in Special Transactions (“MI 61-101”). The Company relied on the financial hardship exemptions from valuation and minority approval contained in sections 5.5(g) and 5.7(e) of MI 61-101. The debt settlement was unanimously approved by the board of directors of the Company. Prior to the debt settlement and Transaction, Pala owned 47.3% of the issued and outstanding shares of the Company, and following the debt settlement and Transaction, Pala owns approximately 11.6% of the issued and outstanding shares of the Company.
The Company also issued an aggregate of 510,154 common shares of the Company, on a post-Consolidation basis, to LACG Capital Inc. (“LACG”) in consideration for LACG’s assistance in introducing Ranchero to the Company.
The common shares of the Company issued to Pala and LACG are subject to a hold period expiring on February 8, 2022, and the shares issued to Pala are also subject to a TSXV Form 5D – Escrow Agreement.
Concurrent Financing
Ranchero previously completed a private placement of an aggregate of 9,561,613 subscription receipts, at a price of $0.55 per subscription receipt, to raise aggregate gross proceeds of $5,258,887 (the “Concurrent Financing”). Haywood Securities Inc. (the “Agent”) acted as the agent and bookrunner to locate purchasers in the Concurrent Financing on a best-efforts agency basis. Immediately prior to the closing of the Transaction, each subscription receipt issued in the Concurrent Financing was converted one common share of Ranchero, which was immediately exchanged for one common share of the Company pursuant to the Transaction. The gross proceeds of the Concurrent Financing less certain deductions and 50% of the cash fee payable to the Agent, applicable taxes and expenses of the Agent incurred in connection with the Concurrent Financing were released from escrow concurrently with the completion of the Transaction. The Company issued an aggregate of 319,093 broker warrants (the “Broker Warrants”) in exchange for the broker warrants that were previously issued by Ranchero to the Agent and the finders of the Concurrent Financing. Each Broker Warrant entitles the holder thereof to acquire one common share of the Company at an exercise price of $0.55 until October 7, 2023.
Shareholder Approval
In accordance with the policies of the TSXV, the Company obtained the written consent of shareholders of the Company holding greater than 50% of the issued and outstanding common shares of the Company to the Consolidation and the Transaction.
Board of Directors and Management
Following completion of the Transaction, the board of directors of the Company has been reconstituted to consist of Martyn Buttenshaw, Gustavo Mazón, Steven Ristorcelli and William Pincus. Management of the Company has been reconstituted to consist of William Pincus as President and CEO and Ranbir Sall as CFO and Corporate Secretary.
On behalf of the board of directors of the Company:
William Pincus
President, Chief Executive Officer and Director
For further information, please contact:
William Pincus
President, Chief Executive Officer and Director
+1 303 589 3734
This news release does not constitute an offer to sell and is not a solicitation of an offer to buy any securities in the United States. The securities of the Company have not been and will not be registered under the United States Securities Act of 1933, as amended (the “U.S. Securities Act”) or any state securities laws and may not be offered or sold within the United States or to U.S. Persons unless registered under the U.S. Securities Act and applicable state securities laws unless pursuant to an exemption from such registration.
Neither the TSX Venture Exchange nor its Regulation Services Provider (as that term is defined in the policies of the TSX Venture Exchange) accepts responsibility for the adequacy or accuracy of this release.
Cautionary Note Regarding Forward Looking Statements
This news release contains certain forward-looking statements. Any statements that express or involve discussions with respect to predictions, expectations, beliefs, plans, projections, objectives, assumptions or future events or performance (often, but not always, using words or phrases such as “expects” or “does not expect”, “is expected”, “anticipates” or “does not anticipate” “plans”, “estimates” or “intends” or stating that certain actions, events or results “ may”, “could”, “would”, “might” or “will” be taken, occur or be achieved) are not statements of historical fact and may be “forward-looking statements”. Forward-looking statements contained in this news release include, but are not limited to, the final acceptance of the TSXV to the Transaction.
Forward-looking statements are subject to a variety of risks and uncertainties which could cause actual events or results to materially differ from those reflected in the forward-looking statements. These risks and uncertainties include, but are not limited to: risks related to regulatory approval, including the approval of the TSXV. There can be no assurance that forward-looking statement will prove to be accurate, and actual results and future events could differ materially from those anticipate in such statements. The Company undertakes no obligation to update forward-looking statements if circumstances or management’s estimates or opinions should change except as required by applicable securities laws. The reader is cautioned not to place undue reliance on forward-looking statements.

Coal as a fuel source was losing its dominance globally, primarily due to rising awareness about emissions and its impact on climate change. Coal was a major source of fuel in electricity generation, and other heavy industries like steel and cement but the increasing usage of clean burning natural gas as well as renewable sources of energy to generate electricity has pushed back coal as a fuel source. The outbreak of COVID-19 last year and the resultant decline in commercial and industrial activities have further lowered demand for coal on a global scale.
Nonetheless, things have started to change in favor of the coal industry, as is quite evident from the Zacks Coal industry’s surge of 275% in the past 12 months compared with the Zacks S&P 500 composite’s 28.4% rally. Increasing medical knowledge to effectively deal with the virus and rollout of vaccines on a global scale have restarted economic activities, creating a demand for electricity. With prices of natural gas remaining high, coal has again become a preferred source of fuel for utility operators.
The World Steel Association in its Short Range Outlook for 2021 and 2022 forecasts that steel demand will grow 5.8% in 2021 and reach 1,874.0 million tons (Mt). It is projected to see further growth of 2.7% and touch 1,924.6 Mt in 2022. Metallurgical coal (met coal) is the primary source of carbon used in steelmaking. An increase in steel production will also increase the demand for met coal globally.
Per the U.S. Energy Information Administration release, coal production in the United States will increase 12.3% year over year to 601 million short tons (MMst) in 2021. Coal production is expected to increase further by 47 MMst in 2022 and reach 648 MMs. Coal exports from the United States are expected to increase from 69.1 MMst in 2020 to 90.5 MMst in 2021 and 94 MMst in 2022.
Peabody Energy Corporation BTU, which currently carries a Zacks Rank #2 (Buy), and other companies that have exposure to thermal coal and met coal are well poised to benefit from the revival in domestic and international coal markets. You can see the complete list of today’s Zacks #1 Rank (Strong Buy) stocks here.
The expected increase in U.S. met coal exports in the 2021-2022 time period is going to benefit other coal stocks such as Arch Resources Inc. ARCH, Ramaco Resources METC and CONSOL Energy Inc. CEIX. While Arch Resources and Ramaco sport a Zacks Rank #1, CONSOL Energy has a Zacks Rank of 2 at present.
Steel, cement, and other coal-intensive industries in European and Asian countries are expected to restart operations in full steam backed by government stimulus, and rising demand due to the opening up of economic activities.
All the coal stocks mentioned above have outperformed the Zacks S&P 500 composite in the past six months.
Price Performance (Six months)

Image Source: Zacks Investment Research
The Zacks Consensus Estimate for 2021 earnings of Peabody Energy, Arch Resources, Ramaco Resources, and CONSOL Energy has moved up 358%, 148%, 153.2%, and 53.1%, respectively, in the past 90 days.
Want the latest recommendations from Zacks Investment Research? Today, you can download 7 Best Stocks for the Next 30 Days. Click to get this free report
Peabody Energy Corporation (BTU) : Free Stock Analysis Report
Arch Resources Inc. (ARCH) : Free Stock Analysis Report
Ramaco Resources, Inc. (METC) : Free Stock Analysis Report
Consol Energy Inc. (CEIX) : Free Stock Analysis Report
To read this article on Zacks.com click here.
(Adds details on comments about Chile, China, United States)
Oct 8 (Reuters) – Freeport-McMoRan Inc Chief Executive Richard Adkerson said on Friday he was encouraged by a recent conversation with Peruvian President Pedro Castillo about taxation and corruption in the world's second-largest copper producing country.
Castillo, a member of a Marxist-Leninist party, swept into office last summer on promises to increase mining industry taxes https://www.reuters.com/world/americas/perus-castillo-says-pm-has-resigned-two-months-into-his-administration-2021-10-06. He has also hinted at nationalizing Peru's natural gas sector, a key mining industry supplier.
Adkerson said he and Castillo held a "listening session" as part of last month's United Nations General Assembly. While the two did not discuss specific policies, Adkerson said he advised Castillo to fight corruption and also craft a tax regime that allows mining companies to remain in the country.
"We're very concerned about the political situation that's emerged in Peru. What we are doing is to see if we can find a way to work forward cooperatively," Adkerson told an FT mining conference. "I was encouraged by this initial conversation."
Separately, Adkerson said Freeport would pause investment decisions in Chile while that country debates raising copper royalty rates https://www.reuters.com/article/chile-copper/royalty-bill-will-put-chiles-private-miners-out-of-business-trade-group-says-idUSL1N2PW1QR.
Adkerson also said Chinese copper demand remains strong despite recent debt concerns https://www.reuters.com/article/china-evergrande-debt-property-bonds/update-1-building-default-fears-pummel-chinese-property-firms-idUSL8N2R433Z. "I still have a lot of confidence in China's macroeconomic situation for the long term," he said.
In the United States, one of Freeport's major growth regions https://www.reuters.com/article/us-usa-mining-freeport-mcmoran-idCAKBN2AP2CW, Adkerson said he does not expect President Joe Biden's administration to prioritize mine development over environmental and social concerns.
Some in the mining industry have encouraged Biden to approve more mines, regardless of community objections, but Reuters reported earlier this year https://www.reuters.com/article/usa-biden-mining-idCNL2N2NC32W that Biden will rely on ally countries for EV metal supplies.
"You're not going to have a (U.S.) government that steps in and puts a priority for metals above these other objectives. It's all got to be worked out together," Adkerson said.
(Reporting by Ernest Scheyder Editing by Chris Reese and Nick Zieminski)
There's no doubt that money can be made by owning shares of unprofitable businesses. For example, biotech and mining exploration companies often lose money for years before finding success with a new treatment or mineral discovery. But while the successes are well known, investors should not ignore the very many unprofitable companies that simply burn through all their cash and collapse.
Given this risk, we thought we'd take a look at whether Havilah Resources (ASX:HAV) shareholders should be worried about its cash burn. For the purposes of this article, cash burn is the annual rate at which an unprofitable company spends cash to fund its growth; its negative free cash flow. Let's start with an examination of the business' cash, relative to its cash burn.
Check out our latest analysis for Havilah Resources
Does Havilah Resources Have A Long Cash Runway?
You can calculate a company's cash runway by dividing the amount of cash it has by the rate at which it is spending that cash. Havilah Resources has such a small amount of debt that we'll set it aside, and focus on the AU$5.9m in cash it held at January 2021. Importantly, its cash burn was AU$2.9m over the trailing twelve months. That means it had a cash runway of about 2.0 years as of January 2021. That's decent, giving the company a couple years to develop its business. Depicted below, you can see how its cash holdings have changed over time.

How Is Havilah Resources' Cash Burn Changing Over Time?
In our view, Havilah Resources doesn't yet produce significant amounts of operating revenue, since it reported just AU$167k in the last twelve months. As a result, we think it's a bit early to focus on the revenue growth, so we'll limit ourselves to looking at how the cash burn is changing over time. Notably, its cash burn was actually down by 57% in the last year, which is a real positive in terms of resilience, but uninspiring when it comes to investment for growth. Havilah Resources makes us a little nervous due to its lack of substantial operating revenue. We prefer most of the stocks on this list of stocks that analysts expect to grow.
Can Havilah Resources Raise More Cash Easily?
There's no doubt Havilah Resources' rapidly reducing cash burn brings comfort, but even if it's only hypothetical, it's always worth asking how easily it could raise more money to fund further growth. Issuing new shares, or taking on debt, are the most common ways for a listed company to raise more money for its business. Commonly, a business will sell new shares in itself to raise cash and drive growth. By looking at a company's cash burn relative to its market capitalisation, we gain insight on how much shareholders would be diluted if the company needed to raise enough cash to cover another year's cash burn.
Havilah Resources' cash burn of AU$2.9m is about 5.1% of its AU$57m market capitalisation. Given that is a rather small percentage, it would probably be really easy for the company to fund another year's growth by issuing some new shares to investors, or even by taking out a loan.
Is Havilah Resources' Cash Burn A Worry?
It may already be apparent to you that we're relatively comfortable with the way Havilah Resources is burning through its cash. In particular, we think its cash burn relative to its market cap stands out as evidence that the company is well on top of its spending. And even its cash runway was very encouraging. After taking into account the various metrics mentioned in this report, we're pretty comfortable with how the company is spending its cash, as it seems on track to meet its needs over the medium term. Taking a deeper dive, we've spotted 5 warning signs for Havilah Resources you should be aware of, and 2 of them make us uncomfortable.
Of course, you might find a fantastic investment by looking elsewhere. So take a peek at this free list of interesting companies, and this list of stocks growth stocks (according to analyst forecasts)
This article by Simply Wall St is general in nature. We provide commentary based on historical data and analyst forecasts only using an unbiased methodology and our articles are not intended to be financial advice. It does not constitute a recommendation to buy or sell any stock, and does not take account of your objectives, or your financial situation. We aim to bring you long-term focused analysis driven by fundamental data. Note that our analysis may not factor in the latest price-sensitive company announcements or qualitative material. Simply Wall St has no position in any stocks mentioned.
Have feedback on this article? Concerned about the content? Get in touch with us directly. Alternatively, email editorial-team (at) simplywallst.com.
All monetary amounts are expressed in Canadian Dollars, unless otherwise indicated.
TORONTO and FUJIAN, China, Oct. 8, 2021 /CNW/ – Zijin Mining Group Co., Ltd. ("Zijin") (SSE: 601899) (SEHK: 2899) and Neo Lithium Corp. ("Neo Lithium" or the "Company") (TSXV: NLC) (OTCQX: NTTHF) (FSE: NE2) are pleased to announce that they have entered into a definitive agreement (the "Arrangement Agreement"), pursuant to which Zijin has agreed to acquire all of the outstanding shares of Neo Lithium (the "Transaction") at a price of C$6.50 per share (the "Offer Price") in cash. The Offer Price represents a premium of approximately 36% over Neo Lithium's 20-day volume-weighted average price ("VWAP") as at October 8, 2021 on the TSX Venture Exchange ("TSXV"). The total cash consideration for all of the outstanding equity of Neo Lithium is approximately C$960 million.
Waldo A. Perez, President and Chief Executive Officer of Neo Lithium, stated:
"After a thorough strategic process, we are very pleased to provide this all-cash premium offer to our shareholders from a leading global mining company. This is the result of the collective work of our premier lithium brine exploration team, starting from initial discovery in late 2015 to defining one of the largest and highest-grade lithium brine deposits in the world, and culminating in this premium offer in just six years. We believe that it is now time for our project to proceed to the construction and production phases with Zijin, a leader with a track record of developing assets in a responsible manner respecting the interests of local employees, communities and authorities."
Chen Jinghe, Chairman of Zijin, stated:
"Neo Lithium's 3Q lithium brine project in Catamarca, Argentina is one of the largest and highest-grade projects of its kind in the world. We would like to express our high respect for the management and professional team who discovered and successfully explored this project. The 3Q project represents an important addition to Zijin's growing global asset mix and it is a good choice for Zijin to enter the field of new energy minerals. Thanks to the professional team's efforts and input in the early stage of the project, we are confident that together with Zijin's strong financial resources and mining know-how, we will develop this excellent asset into one of the world's leading lithium carbonate producing mines. In accordance with Zijin's co-development aspirations, we will continue to work closely with local communities and government authorities so that all relevant stakeholders can benefit from the project's successful development".
Zijin is committed to retaining the current management and professional team at LIEX S.A., Neo Lithium's local operating subsidiary, as well as making contributions to economic and social developments for Catamarca province, Argentina, as it moves forward to advance the development of the 3Q project.
Benefits to Neo Lithium Shareholders
-
Immediate and significant premium of approximately 36% to the 20-day VWAP on the TSXV
-
All-cash offer that is not subject to a financing condition
-
Strong deal certainty with a highly credible and leading global mining company as purchaser
-
Voting support agreements entered into with all directors and senior officers of Neo Lithium who hold shares
-
Removes future dilution, commodity, construction, production and execution risk with next phase of 3Q project
Transaction Summary
The Transaction will be completed pursuant to a Plan of Arrangement under the Business Corporations Act (Ontario). The Transaction will be subject to the approval of at least 66-⅔% of the votes cast by shareholders. In addition to shareholder approval, the Transaction is also subject to the receipt of certain government, regulatory, court and stock exchange approvals, including approval by relevant authorities in the People's Republic of China and Investment Canada Act approval, and other closing conditions customary in transactions of this nature.
The Arrangement Agreement includes, among other things, a customary non-solicitation covenant on the part of Neo Lithium (including fiduciary out provisions) and a right for Zijin to match any competing offer that constitutes a superior proposal. Under certain circumstances, Zijin would be entitled to a US$35 million termination fee and Neo Lithium would be entitled to a US$35 million reverse termination fee.
Neo Lithium Board of Directors Recommendations
The Transaction has been unanimously approved by the board of directors of Neo Lithium following the unanimous recommendation of a special committee of independent directors of Neo Lithium (the "Special Committee"). Cormark Securities has provided an opinion to the board of directors of Neo Lithium and to the Special Committee, stating that, based upon and subject to the assumptions, limitations and qualifications set forth therein, the consideration offered to the Neo Lithium shareholders pursuant to the Transaction is fair, from a financial point of view, to the Neo Lithium shareholders. The Cormark Securities fairness opinion was provided on a fixed fee basis and is not contingent on the outcome of the Transaction.
Timing
Full details of the Transaction will be included in Neo Lithium's management information circular, which is expected to be mailed to shareholders in November 2021 with the shareholders meeting expected to take place in December 2021. Shareholders are urged to read the information circular once available as it will contain additional important information concerning the Transaction. The Arrangement Agreement will also be filed on SEDAR. The Transaction is expected to close in the first half of 2022.
Advisors and Counsel
Paradigm Capital is acting as financial advisor to Zijin and Torys LLP is acting as Zijin's legal counsel.
BofA Securities is acting as financial advisor to Neo Lithium. Cormark Securities provided an independent fairness opinion to the Neo Lithium board of directors and the Special Committee. Fasken Martineau DuMoulin LLP is acting as legal counsel to Neo Lithium and the Special Committee.
About Neo Lithium Corp.
Neo Lithium Corp. has quickly become a prominent name in lithium brine development by virtue of its high quality 3Q project and experienced team. Neo Lithium is rapidly advancing its 100% owned 3Q project – a unique high-grade lithium brine lake and salar complex in Latin America's "Lithium Triangle".
The 3Q project is located in Catamarca Province, the largest lithium producing area in Argentina covering approximately 35,000 ha including a salar complex of approximately 16,000 ha.
Additional information regarding Neo Lithium Corp. is available on SEDAR at www.sedar.com under the Company's profile and at its website at www.neolithium.ca, including various pictures of ongoing work at the project.
About Zijin
Formed in 1993 and based in Fujian, China, Zijin is one of the largest mining companies in China as well as a leading global gold and copper producer. It manages an extensive portfolio, primarily consisting of gold, copper, zinc, and other metals through investments in China and twelve overseas countries across Europe, Central Asia, Africa, Oceania and South America. Listed on the Shanghai Stock Exchange and the Hong Kong Stock Exchange, Zijin has a market capitalization of approximately US$40 billion.
Neither the TSX Venture Exchange nor its Regulation Services Provider (as that term is defined in the policies of the TSX Venture Exchange) accepts responsibility for the adequacy or accuracy of this press release.
Cautionary Statements Regarding Forward-Looking Statements
Forward-Looking Statements — Certain information set forth in this news release may contain forward-looking statements. Such statements include but are not limited to, statements as to the benefits of the Transaction to the Company's shareholders, the anticipated meeting date and mailing of the information circular in respect of the meeting, timing for completion of the Transaction and receiving the required regulatory and court approvals, expectations regarding how Zijin will continue operations and benefit the region, advancing the 3Q project, the economic effect of the 3Q project, and future plans and objectives of the Company and Zijin. Generally, forward-looking statements can be identified by the use of words such as "plans", "expects" or "is expected", "scheduled", "estimates" "intends", "anticipates", "believes", or variations of such words and phrases, or statements that certain actions, events or results "can", "may", "could", "would", "should", "might" or "will", occur or be achieved, or the negative connotations thereof. These forward-looking statements are subject to numerous risks and uncertainties, certain of which are beyond the control of the Company, which could cause the actual results, performance or achievements of the Company and/or Zijin to be materially different from the future results, performance or achievements expressed or implied by such statements. These risks include, without limitation, risks related to obtaining regulatory and court approvals for the Transaction, political and regulatory risks associated with mining and exploration activities, including environmental regulation, risks and uncertainties relating to the interpretation of drill and sample results, risks related to the uncertainty of cost and time estimation and the potential for unexpected delays, costs and expenses, risks related to metal price fluctuations, the market for lithium products, and other risks and uncertainties related to the Company's prospects, properties and business detailed elsewhere in the Company's disclosure record. Although the Company believes its expectations are based upon reasonable assumptions and has attempted to identify important factors that could cause actual actions, events or results to differ materially from those described in forward-looking statements, there may be other factors that cause actions, events or results not to be as anticipated, estimated or intended and undue reliance should not be placed on forward-looking statements.
SOURCE Neo Lithium Corp.

View original content: http://www.newswire.ca/en/releases/archive/October2021/08/c5442.html
Every investor in BCI Minerals Limited (ASX:BCI) should be aware of the most powerful shareholder groups. Institutions often own shares in more established companies, while it's not unusual to see insiders own a fair bit of smaller companies. I generally like to see some degree of insider ownership, even if only a little. As Nassim Nicholas Taleb said, 'Don’t tell me what you think, tell me what you have in your portfolio.
BCI Minerals is not a large company by global standards. It has a market capitalization of AU$246m, which means it wouldn't have the attention of many institutional investors. Our analysis of the ownership of the company, below, shows that institutions own shares in the company. We can zoom in on the different ownership groups, to learn more about BCI Minerals.
Check out our latest analysis for BCI Minerals

What Does The Institutional Ownership Tell Us About BCI Minerals?
Institutions typically measure themselves against a benchmark when reporting to their own investors, so they often become more enthusiastic about a stock once it's included in a major index. We would expect most companies to have some institutions on the register, especially if they are growing.
As you can see, institutional investors have a fair amount of stake in BCI Minerals. This implies the analysts working for those institutions have looked at the stock and they like it. But just like anyone else, they could be wrong. It is not uncommon to see a big share price drop if two large institutional investors try to sell out of a stock at the same time. So it is worth checking the past earnings trajectory of BCI Minerals, (below). Of course, keep in mind that there are other factors to consider, too.

BCI Minerals is not owned by hedge funds. Looking at our data, we can see that the largest shareholder is Australian Capital Equity Pty Ltd. with 39% of shares outstanding. In comparison, the second and third largest shareholders hold about 4.1% and 3.1% of the stock. In addition, we found that Alwyn Vorster, the CEO has 0.9% of the shares allocated to their name.
On further inspection, we found that more than half the company's shares are owned by the top 6 shareholders, suggesting that the interests of the larger shareholders are balanced out to an extent by the smaller ones.
While studying institutional ownership for a company can add value to your research, it is also a good practice to research analyst recommendations to get a deeper understand of a stock's expected performance. There are a reasonable number of analysts covering the stock, so it might be useful to find out their aggregate view on the future.
Insider Ownership Of BCI Minerals
The definition of an insider can differ slightly between different countries, but members of the board of directors always count. Management ultimately answers to the board. However, it is not uncommon for managers to be executive board members, especially if they are a founder or the CEO.
Most consider insider ownership a positive because it can indicate the board is well aligned with other shareholders. However, on some occasions too much power is concentrated within this group.
I can report that insiders do own shares in BCI Minerals Limited. It has a market capitalization of just AU$246m, and insiders have AU$17m worth of shares, in their own names. Some would say this shows alignment of interests between shareholders and the board, though I generally prefer to see bigger insider holdings. But it might be worth checking if those insiders have been selling.
General Public Ownership
With a 43% ownership, the general public have some degree of sway over BCI Minerals. While this size of ownership may not be enough to sway a policy decision in their favour, they can still make a collective impact on company policies.
Private Company Ownership
We can see that Private Companies own 41%, of the shares on issue. Private companies may be related parties. Sometimes insiders have an interest in a public company through a holding in a private company, rather than in their own capacity as an individual. While it's hard to draw any broad stroke conclusions, it is worth noting as an area for further research.
Next Steps:
While it is well worth considering the different groups that own a company, there are other factors that are even more important. Take risks for example – BCI Minerals has 4 warning signs (and 2 which are a bit unpleasant) we think you should know about.
If you would prefer discover what analysts are predicting in terms of future growth, do not miss this free report on analyst forecasts.
NB: Figures in this article are calculated using data from the last twelve months, which refer to the 12-month period ending on the last date of the month the financial statement is dated. This may not be consistent with full year annual report figures.
This article by Simply Wall St is general in nature. We provide commentary based on historical data and analyst forecasts only using an unbiased methodology and our articles are not intended to be financial advice. It does not constitute a recommendation to buy or sell any stock, and does not take account of your objectives, or your financial situation. We aim to bring you long-term focused analysis driven by fundamental data. Note that our analysis may not factor in the latest price-sensitive company announcements or qualitative material. Simply Wall St has no position in any stocks mentioned.
Have feedback on this article? Concerned about the content? Get in touch with us directly. Alternatively, email editorial-team (at) simplywallst.com.
The external fund manager backed by Berkshire Hathaway's Charlie Munger, Li Lu, makes no bones about it when he says 'The biggest investment risk is not the volatility of prices, but whether you will suffer a permanent loss of capital.' When we think about how risky a company is, we always like to look at its use of debt, since debt overload can lead to ruin. We note that Toro Energy Limited (ASX:TOE) does have debt on its balance sheet. But the more important question is: how much risk is that debt creating?
What Risk Does Debt Bring?
Debt is a tool to help businesses grow, but if a business is incapable of paying off its lenders, then it exists at their mercy. If things get really bad, the lenders can take control of the business. However, a more common (but still painful) scenario is that it has to raise new equity capital at a low price, thus permanently diluting shareholders. Of course, plenty of companies use debt to fund growth, without any negative consequences. The first thing to do when considering how much debt a business uses is to look at its cash and debt together.
See our latest analysis for Toro Energy
What Is Toro Energy's Net Debt?
You can click the graphic below for the historical numbers, but it shows that Toro Energy had AU$10.0m of debt in June 2021, down from AU$15.0m, one year before. But on the other hand it also has AU$12.4m in cash, leading to a AU$2.38m net cash position.

How Healthy Is Toro Energy's Balance Sheet?
According to the last reported balance sheet, Toro Energy had liabilities of AU$10.8m due within 12 months, and liabilities of AU$5.8k due beyond 12 months. On the other hand, it had cash of AU$12.4m and AU$223.5k worth of receivables due within a year. So it can boast AU$1.76m more liquid assets than total liabilities.
This state of affairs indicates that Toro Energy's balance sheet looks quite solid, as its total liabilities are just about equal to its liquid assets. So while it's hard to imagine that the AU$109.1m company is struggling for cash, we still think it's worth monitoring its balance sheet. Succinctly put, Toro Energy boasts net cash, so it's fair to say it does not have a heavy debt load! When analysing debt levels, the balance sheet is the obvious place to start. But it is Toro Energy's earnings that will influence how the balance sheet holds up in the future. So when considering debt, it's definitely worth looking at the earnings trend. Click here for an interactive snapshot.
Since Toro Energy doesn't have significant operating revenue, shareholders must hope it'll sell some fossil fuels, before it runs out of money.
So How Risky Is Toro Energy?
We have no doubt that loss making companies are, in general, riskier than profitable ones. And we do note that Toro Energy had an earnings before interest and tax (EBIT) loss, over the last year. And over the same period it saw negative free cash outflow of AU$6.4m and booked a AU$6.5m accounting loss. But at least it has AU$2.38m on the balance sheet to spend on growth, near-term. Even though its balance sheet seems sufficiently liquid, debt always makes us a little nervous if a company doesn't produce free cash flow regularly. The balance sheet is clearly the area to focus on when you are analysing debt. However, not all investment risk resides within the balance sheet – far from it. We've identified 4 warning signs with Toro Energy (at least 1 which doesn't sit too well with us) , and understanding them should be part of your investment process.
Of course, if you're the type of investor who prefers buying stocks without the burden of debt, then don't hesitate to discover our exclusive list of net cash growth stocks, today.
This article by Simply Wall St is general in nature. We provide commentary based on historical data and analyst forecasts only using an unbiased methodology and our articles are not intended to be financial advice. It does not constitute a recommendation to buy or sell any stock, and does not take account of your objectives, or your financial situation. We aim to bring you long-term focused analysis driven by fundamental data. Note that our analysis may not factor in the latest price-sensitive company announcements or qualitative material. Simply Wall St has no position in any stocks mentioned.
Have feedback on this article? Concerned about the content? Get in touch with us directly. Alternatively, email editorial-team (at) simplywallst.com.
MELBOURNE (Reuters) – BHP Group, the world's largest listed mining company, announced on Thursday that from the end of January all workers and visitors entering its workplaces in Australia will need to be fully vaccinated against COVID-19.
Those requirements will be introduced earlier for some sites in high risk areas, such as Mt Arthur coal mine in New South Wales state, BHP said in a statement.
Australia has struggled since mid-year to contain an outbreak of the highly infectious Delta variant of COVID-19.
It is now pushing to increase vaccination rates so that cities can begin lowering their lockdowns.
“The science is clear that widespread vaccination saves lives," BHP Minerals Australia President Edgar Basto said in a statement.
"We recognise the path forward is through widespread vaccination in Australia and we are looking at a range of practical ways to support that while protecting communities and workforces," he said.
The Mining and Energy Union said that it did not support BHP’s decision to mandate vaccines and that it was working through the legal implications of the decision.
"We have strongly advocated to government and industry that COVID-19 vaccinations should be voluntary for mineworkers," it said in a statement.
Western Australia, where BHP runs its iron ore operations, and which has remained mostly coronavirus free, said earlier this week that it would require all employees that work with natural resources to have a first COVID-19 shot from December.
That was to help protect vulnerable Indigenous communities as the country begins opening up, it said.
Australia's coronavirus numbers are relatively low, with some 120,000 cases and 1,381 deaths. The country's double dose vaccination rate has climbed to around 47%.
(Reporting by Melanie Burton; Editing by Simon Cameron-Moore)
If we want to find a stock that could multiply over the long term, what are the underlying trends we should look for? In a perfect world, we'd like to see a company investing more capital into its business and ideally the returns earned from that capital are also increasing. This shows us that it's a compounding machine, able to continually reinvest its earnings back into the business and generate higher returns. With that in mind, we've noticed some promising trends at Fresnillo (LON:FRES) so let's look a bit deeper.
What is Return On Capital Employed (ROCE)?
Just to clarify if you're unsure, ROCE is a metric for evaluating how much pre-tax income (in percentage terms) a company earns on the capital invested in its business. The formula for this calculation on Fresnillo is:
Return on Capital Employed = Earnings Before Interest and Tax (EBIT) ÷ (Total Assets – Current Liabilities)
0.18 = US$1.0b ÷ (US$5.9b – US$430m) (Based on the trailing twelve months to June 2021).
Therefore, Fresnillo has an ROCE of 18%. By itself that's a normal return on capital and it's in line with the industry's average returns of 18%.
Check out our latest analysis for Fresnillo

Above you can see how the current ROCE for Fresnillo compares to its prior returns on capital, but there's only so much you can tell from the past. If you'd like to see what analysts are forecasting going forward, you should check out our free report for Fresnillo.
What Does the ROCE Trend For Fresnillo Tell Us?
Fresnillo is displaying some positive trends. Over the last five years, returns on capital employed have risen substantially to 18%. The company is effectively making more money per dollar of capital used, and it's worth noting that the amount of capital has increased too, by 36%. The increasing returns on a growing amount of capital is common amongst multi-baggers and that's why we're impressed.
What We Can Learn From Fresnillo's ROCE
A company that is growing its returns on capital and can consistently reinvest in itself is a highly sought after trait, and that's what Fresnillo has. And since the stock has fallen 46% over the last five years, there might be an opportunity here. With that in mind, we believe the promising trends warrant this stock for further investigation.
Fresnillo does have some risks, we noticed 2 warning signs (and 1 which is a bit concerning) we think you should know about.
For those who like to invest in solid companies, check out this free list of companies with solid balance sheets and high returns on equity.
This article by Simply Wall St is general in nature. We provide commentary based on historical data and analyst forecasts only using an unbiased methodology and our articles are not intended to be financial advice. It does not constitute a recommendation to buy or sell any stock, and does not take account of your objectives, or your financial situation. We aim to bring you long-term focused analysis driven by fundamental data. Note that our analysis may not factor in the latest price-sensitive company announcements or qualitative material. Simply Wall St has no position in any stocks mentioned.
Have feedback on this article? Concerned about the content? Get in touch with us directly. Alternatively, email editorial-team (at) simplywallst.com.
Vancouver, British Columbia–(Newsfile Corp. – October 7, 2021) – MAX RESOURCE CORP. (TSXV: MXR) (OTC Pink: MXROF) (FSE: M1D2) ("Max" or the "Company") is pleased to report new assay results expanding the URU zone from 12-km² to over 48-km², located along the CESAR North 80km-long belt, within the wholly-owned CESAR project in NE Colombia (refer to Figure 3).
Highlights
– 14.8% copper and 132 g/t silver outcrop over 1.5m x 0.8m panel (876798)
– 6.5% copper and 6 g/t silver outcrop over widths of 1.0m chip channel (876931)
– 5.6% copper and 87 g/t silver outcrop over 1.0m by 1.0m panel (879972)
– 4.0% copper and 42 g/t silver outcrop over 1.0m by 1.0m panel (879975)
– 3.7% copper and 14 g/t silver outcrop over widths of 5.0m chip channel (876486)
– 2.9% copper and 7 g/t silver outcrop over widths of 10.0m representative (876460)
– 2.1% copper and 3 g/t silver outcrop over widths of 10.0m representative (876478)
– 2.0% copper and 20 g/t silver outcrop over widths of 10.0m representative (876922)
-
URU's continuous copper-silver mineralization now spans over 48-km², extending along strike over 12-km and down dip over 4-km from the elevation of 1200m down to 410m, and is open along strike and down dip (refer Figure 1, 2 and 4).
-
Eighteen rock samples collected over widths ranging from 1.0 to 10.0m returned values in excess of 2.0% copper. Thirty-two returned values greater than 1.0% copper. Highlight values are 14.8 % copper and 132 g/t silver (refer to Table 1).
"The URU 48-km² zone remains open in all directions and potentially represents a zone of major proportions when compared to the world class Kupferschiefer and the Central African Belt deposits," commented Max CEO, Brett Matich.
"In addition, MAX is conducting on-going exploration at the other four zones (CONEJO, SP, AMN, AMS, refer to Figure 3) within the CESAR North 80-kilometre-long-copper-silver belt of significant regional potential," he continued.
"The world's transition to clean energy can only be accomplished with copper to build power grids, solar and wind farms, electric vehicles which typically require upwards of 180 pound of copper per vehicle. Copper's rapidly declining reserve base necessitates the need for new major discoveries of copper, positioning Max to take advantage of the copper shortfalls with the potential district size of the CESAR discoveries," he concluded.

Figure 1. 14.8% copper + 132 g/t silver 1.5m x 0.8m (876798) Figure 2. 2.9% copper over 10.0m (876460)
https://www.maxresource.com/images/gallery/MXR_CESAR-Copper-Silver_News_38.jpg
To view an enhanced version of Figures 1 and 2, please visit:
https://orders.newsfilecorp.com/files/3834/98870_d9df5268f4f6ba2e_002full.jpg
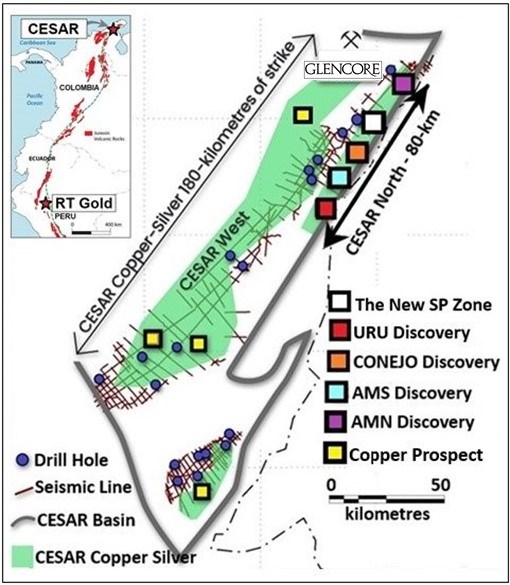
Figure 3. CESAR project location
https://www.maxresource.com/images/gallery/MXR_CESAR-Copper-Silver_News_39.jpg
To view an enhanced version of Figure 3, please visit:
https://orders.newsfilecorp.com/files/3834/98870_d9df5268f4f6ba2e_003full.jpg
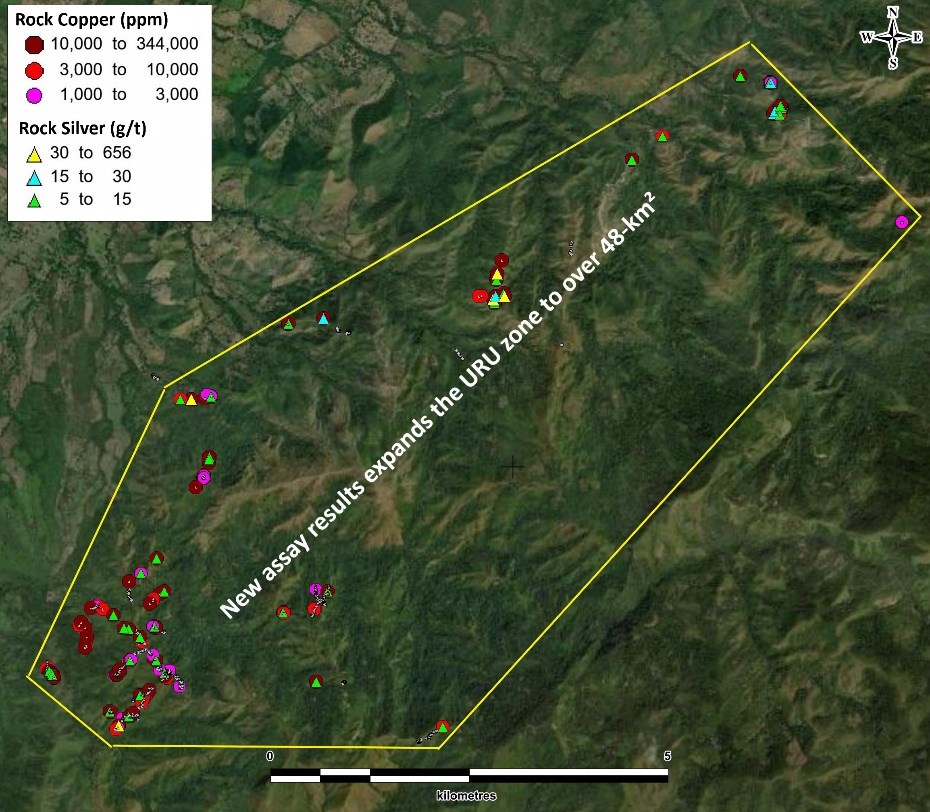
Figure 4. URU 48-km² zone and open in all directions
https://www.maxresource.com/images/gallery/MXR_CESAR-Copper-Silver_News_40.jpg
To view an enhanced version of Figure 4, please visit:
https://orders.newsfilecorp.com/files/3834/98870_d9df5268f4f6ba2e_004full.jpg
Visible mineralization reports the presence of chalcocite, native copper and copper oxides. Two types of mineral events have been observed. On type is hosted in a stockwork within igneous host rock and is associated with the presence of epidote and the second type is sediment-hosted stratiform copper silver mineralization of Kupferschiefer type. The stratiform type is cross cut by the mineralized stockwork associated with igneous rocks.
|
Copper |
Silver |
Width |
Sample # |
|
14.8% |
132 g/t |
1.5m x 0.8m – Panel |
876798 |
|
6.7% |
68 g/t |
0.3m – Chip Channel |
876935 |
|
6.5% |
6 g/t |
1.0m – Chip Channel |
876931 |
|
5.6% |
87 g/t |
1.0m x 1.0m – Panel |
879972 |
|
5.4% |
133 g/t |
0.5m – Chip Channel |
876755 |
|
4.2% |
105 g/t |
0.5m – Chip Channel |
876757 |
|
4.0% |
42 g/t |
1.0m x 1.0m – Panel |
879975 |
|
3.7% |
14 g/t |
5.0m – Chip Channel |
876486 |
|
3.7% |
1 g/t |
0.3m – Chip Channel |
878273 |
|
3.6% |
36 g/t |
1.0m x 1.0m – Panel |
879974 |
|
3.6% |
37 g/t |
1.0m x 1.0m – Panel |
879969 |
|
3.5% |
8 g/t |
0.7m – Chip Channel |
870022 |
|
3.1% |
7 g/t |
3.0m – Chip Channel |
876488 |
|
2.9% |
7 g/t |
10.0m – Representative |
876460 |
|
2.6% |
10 g/t |
0.5m – Chip Channel |
876605 |
|
2.6% |
16 g/t |
1.0m – Chip Channel |
876572 |
|
2.6% |
7 g/t |
1.0m x 1.0m – Panel |
876472 |
|
2.5% |
6 g/t |
0.7m – Chip Channel |
870008 |
|
2.5% |
4 g/t |
0.2m – Chip Channel |
876907 |
|
2.4% |
5 g/t |
3.0m – Chip Channel |
876491 |
|
2.4% |
3 g/t |
0.5m – Chip Channel |
870017 |
|
2.1% |
6 g/t |
1.8m – Chip Channel |
876575 |
|
2.1% |
6 g/t |
1.8m – Chip Channel |
876574 |
|
2.1% |
3 g/t |
10.0m – Representative |
876478 |
|
2.1% |
12 g/t |
1.0m x 1.0m – Panel |
879967 |
|
2.1% |
19 g/t |
1.0m x 1.0m – Panel |
879970 |
|
2.0% |
9 g/t |
1.0m x 1.0m – Panel |
879968 |
|
2.0% |
20 g/t |
10.0m – Representative |
876922 |
|
1.8% |
18 g/t |
10.0m – Representative |
876930 |
|
1.8% |
9 g/t |
1.0m x 1.0m – Panel |
879973 |
|
1.6% |
8 g/t |
0.6m – Chip Channel |
879959 |
|
1.6% |
5 g/t |
1.0m x 1.0m – Panel |
876477 |
|
1.6% |
2 g/t |
1.0m – Chip Channel |
876611 |
|
1.6% |
18 g/t |
1.0m – Chip Channel |
879954 |
|
1.6% |
2 g/t |
0.3m – Chip Channel |
876901 |
|
1.5% |
1 g/t |
3.0m – Chip Channel |
876487 |
|
1.5% |
1 g/t |
2.0m x 1.0m – Panel |
876915 |
|
1.5% |
14 g/t |
1.3m – Chip Channel |
879956 |
|
1.4% |
1 g/t |
1.0m x 1.0m – Panel |
876475 |
|
1.4% |
18 g/t |
0.5m – Chip Channel |
879951 |
|
1.4% |
3 g/t |
10.0m – Representative |
876481 |
|
1.3% |
50 g/t |
0.5m – Chip Channel |
876752 |
|
1.3% |
10 g/t |
1.0m x 1.0m – Panel |
876971 |
|
1.3% |
5 g/t |
2.0m x 2.0m – Panel |
876622 |
|
1.3% |
1 g/t |
5.0m – Chip Channel |
876482 |
|
1.2% |
6 g/t |
0.7m – Chip Channel |
870025 |
|
1.2% |
6 g/t |
0.2m – Chip Channel |
876469 |
|
1.1% |
3 g/t |
10.0m – Representative |
876479 |
Table 1. Rock assay results that returned over 1.0% copper. Max cautions investors that panel and representative grab sampling can be selective and are not necessarily representative of the mineralization.
Max interprets the sediment-hosted stratabound copper-silver mineralization in the Cesar basin to be analogous to both the Central African Copper Belt (CACB) to the south and the Polish Kupferschiefer to the north. Almost 50% of the copper known to exist in sediment-hosted deposits is contained in the CACB, including Ivanhoe Mines Ltd (TSX: IVN) 95-billion-pound Kamoa-Kakula copper deposits in the Congo.
Kupferschiefer, the world's largest silver producer and Europe's largest copper source, is a mining orebody ranging from 0.5 to 5.5m thick at depths of 500m, grading 1.49% copper and 48.6 g/t silver. The silver yield is almost twice the production of the world's second largest silver mine.
Source: Central African Belt Descriptive models, grade-tonnage relations, and databases for the assessment of sediment-hosted copper deposits with emphasis on deposits in the Central Africa Copperbelt, Democratic Republic of the Congo and Zambia by USGS 2010. Kamoa-Kakula by OreWin March 2020. World Silver Survey 2020 and Kupferschiefer Deposits & Prospects in SW Poland, September 27, 2019. Max cautions investors that the presence of copper mineralization of the Central African Copper Belt and the Polish Kupferschiefer are not necessarily indicative of similar mineralization at CESAR.
QUALITY ASSURANCE
All CESAR rock chip samples are shipped to ALS Lab's sample preparation facility in Medellin, Columbia. Sample pulps are then sent to Lima, Peru, for analysis. All samples are analyzed using ALS procedure ME-MS41, a four-acid digestion with inductively coupled plasma finished. Over-limit copper and silver are determined by ALS procedure OG-62, a four-acid digestion with an atomic absorption spectroscopy finish. ALS Labs is independent from Max.
Max uses standard chip and channel sampling where possible, but also relies on composite grab sampling. Max considers composite grab samples to be representative but cautions investors that individual grab samples can be selective and may not be representative of continuous mineralization at CESAR.
QUALIFIED PERSON
The Company's disclosure of a technical or scientific nature in this news release has been reviewed and approved by Tim Henneberry, P Geo (British Columbia), a member of the Max Resource Advisory Board, who serves as a qualified person under the definition of National Instrument 43:101.
CESAR COPPER-SILVER PROJECT IN COLOMBIA – OVERVIEW
CESAR lies along the copper-silver rich 200-kilometre-long Cesar Basin in northeastern Colombia. This region enjoys major infrastructure resulting from oil & gas and mining operations, including Cerrejon, the largest coal mine in Latin America, now held by global miner Glencore (refer to Figure 5).
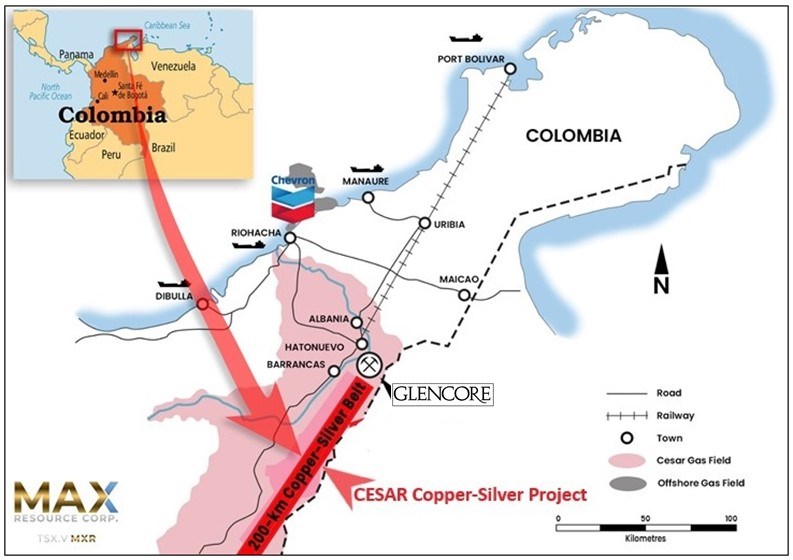
Figure 5. CESAR Project location.
https://www.maxresource.com/images/gallery/MXR_CESAR-Copper-Silver_News_41.jpg
To view an enhanced version of Figure 5, please visit:
https://orders.newsfilecorp.com/files/3834/98870_d9df5268f4f6ba2e_005full.jpg
Due to the district-scale and copper-silver prospectivity of the Cesar Basin, Max has implemented a multi-faceted exploration program for 2021:
Advanced Drill Core Analysis and Modelling: ongoing interpretation of seismic sections and analysis of historical drill holes are all being integrated into our structural modelling of the Cesar Basin, in collaboration with Ingeniería Geológica Universidad Nacional de Colombia ("IGUN") in Medellín (January 7, 2021 NR).
Geochemical and Mineralogical: research programs by the University of Science and Technology ("AGH") of Krakow, Poland. AGH bring their extensive knowledge of KGHM's world renowned Kupferschiefer sediment-hosted copper-silver deposits in Poland to the CESAR project.
Geophysical: Fathom Geophysics is interpreting seismic data, funded by the Company in collaboration with one of the world's leading copper producers.
Proprietary Field Exploration & Techniques: Max's in-country exploration teams continue to target new copper-silver stratabound mineralized zones.
CESAR North 80-kilometre-long-copper-silver zone:
-
In 2020, Max discovered both the copper-silver rich AMS (previously named AM South) zone and the AMN (previously named AM North) zone 40-km north, collectively spanning over 45-km². Highlight values of 0.5 to 34.4% copper and 5 to 305 g/t silver range over outcrop intervals ranging 0.1 to 25.0m;
-
In March 2021, Max's announced the CONEJO discovery, now spanning 3.2-km by 1.6-km and open in all directions. CONEJO returned values greater than 5.0% copper from 23 rock panels varying from 5.0m by 5.0m to 1.0m by 1.0m. In addition, 66 rock panel samples returned values over 1.0% copper (March 24, 2021 NR):
-
12.5% copper + 84 g/t silver over 5.0m by 5.0m
-
10.5% copper + 50 g/t silver over 3.0m by 2.0 m
-
10.4% copper + 95 g/t silver over 5.0m by 5.0m
-
10.2% copper + 62 g/t silver over 5.0m by 5.0m
-
10.0% copper + 80 g/t silver over 5.0m by 5.0m
-
8.7% copper + 89 g/t silver over 5.0m by 5.0m
-
8.4% copper + 60 g/t silver over 5.0m by 5.0m
-
7.9% copper + 21 g/t silver over 5.0m by 5.0m
-
7.7% copper + 84 g/t silver over 5.0m by 5.0m
-
7.4% copper + 47 g/t silver over 5.0m by 5.0m
-
-
The 2021 URU discovery is located 30-km south of CONEJO, now expanded to 48-km² and open in all directions. URU appears to have major-scale potential; Thirteen rock samples over widths ranging from 10 to 25.0m returned values of 2.0% copper and above, thirty-seven returned values greater than 1.0% copper, with highlight values of 5.7 % copper and 37 g/t silver:
-
4.3% copper and 8 g/t silver outcrop over widths of 10.0m
-
3.9% copper and 7 g/t silver outcrop over widths of 10.0m
-
3.6% copper and 12 g/t silver outcrop over widths of 10.0m
-
3.0% copper and 6 g/t silver outcrop over widths of 10.0m
-
3.0% copper and 37 g/t silver outcrop over widths of 10.0m
-
-
By late April 2021, at CESAR North 80-km belt MAX had identified five copper discoveries URU, CONEJO, SP, AMN and AMS;
-
The new SP discovery target September 2021 spans over 1.6-kilometres and is open in all directions. The reconnaissance composite grab sampling over a 25.0m outcrop averaging 4.8% copper and 51 g/t silver is considered very significant, as it indicates the presence of a higher copper and silver grades within the 25.0m interval.
-
Exploration continues on the CONEJO and URU zones;
-
In addition, Max has initiated the process of mineral claim approvals and drill permitting;
-
CESAR West: Max has identified copper porphyry-style mineralization.
ABOUT MAX RESOURCE CORP.
Max Resource Corp. is a copper and precious metals exploration company, engaged in advancing both the newly discovered district-scale CESAR copper-silver project (100% owned) in Colombia and the newly acquired RT Gold project (100% earn-in) in Peru. Both projects have potential for the discovery of large-scale mineral deposits; both stratabound-type copper-silver in Colombia and high-grade gold porphyry and massive sulfide in Peru.
Max Resource was awarded a Top 10 Ranked Company in the Mining Sector on the TSX Venture 50™ for 2021, achieving a market cap increase of 1,992% and a share price increase of 282% in 2020.
For more information visit: https://www.maxresource.com/
For more information visit: www.tsx.com/venture50
TSX Venture 50™ for 2021 video: MAX Resource Corp. (TSXV: MXR) – 2021 TSX Venture 50 – YouTube
For additional information contact:
Max Resource Corp.
Tim McNulty
E: info@maxresource.com
T: (604) 290-8100
*The Venture 50 ranking is provided by TSX Venture Exchange Inc. ("TSXV") for information purposes only. Neither TMX Group Limited nor any of its affiliated companies guarantees the completeness of this information and are not responsible for any errors or omissions in or any use of, or reliance on, this information. The Venture 50 program is not an invitation to purchase securities listed on TSX Venture Exchange. TSXV and its affiliates do not endorse or recommend any of the referenced securities or issuers, and this information should not be construed as providing any trading, legal, accounting, tax, investment, business, financial or other advice and should not be relied on for such purposes"
Neither TSX Venture Exchange nor its Regulation Services Provider (as that term is defined in the policies of the TSX Venture Exchange) accepts responsibility for the adequacy or accuracy of this release
Except for statements of historic fact, this news release contains certain "forward-looking information" within the meaning of applicable securities law. Forward-looking information is frequently characterized by words such as "plan", "expect", "project", "intend", "believe", "anticipate", "estimate" and other similar words, or statements that certain events or conditions "may" or "will" occur. Forward-looking statements are based on the opinions and estimates at the date the statements are made and are subject to a variety of risks and uncertainties and other factors that could cause actual events or results to differ materially from those anticipated in the forward-looking statements including, but not limited to delays or uncertainties with regulatory approvals, including that of the TSXV. There are uncertainties inherent in forward-looking information, including factors beyond the Company's control. There are no assurances that the commercialization plans for Max Resources Corp. described in this news release will come into effect on the terms or time frame described herein. The Company undertakes no obligation to update forward-looking information if circumstances or management's estimates or opinions should change except as required by law. The reader is cautioned not to place undue reliance on forward-looking statements. Additional information identifying risks and uncertainties that could affect financial results is contained in the Company's filings with Canadian securities regulators, which filings are available at www.sedar.com.
To view the source version of this press release, please visit https://www.newsfilecorp.com/release/98870
ENDEAVOUR TO ANNOUNCE ITS Q3 2021 RESULTS ON 11 NOVEMBER 2021
London, 7 October 2021 – Endeavour Mining plc (LSE:EDV, TSX:EDV, OTCQX:EDVMF) will release its Q3 2021 financial results on Thursday 11 November, before the LSE market open.
Management will host a conference call and webcast on the same day, Thursday 11 November, at 8:30 am ET / 1:30 pm GMT to discuss the Company's financial results.
The conference call and webcast are scheduled at:
5:30am in Vancouver
8:30am in Toronto and New York
1:30pm in London
9:30pm in Hong Kong and Perth
The webcast can be accessed through the following link:
https://edge.media-server.com/mmc/p/wc2s3hwk
Analysts and investors are also invited to participate and ask questions using the dial-in numbers below:
International: +44 (0) 207 192 8338
North American toll-free: +1 877 870 9135
UK toll-free: +44 (0) 800 279 6619
Confirmation Code: 3980665
The conference call and webcast will be available for playback on Endeavour's website.
Click here to add a Webcast reminder to your Outlook Calendar
CONTACT INFORMATION
|
Martino De Ciccio VP – Strategy & Investor Relations |
Brunswick Group LLP in London Carole Cable, Partner Vincic Advisors in Toronto John Vincic, Principal +1 (647) 402 6375 |
Neither the Toronto Stock Exchange nor the Investment Industry Regulatory Organization of Canada accepts responsibility for the adequacy or accuracy of this release.
Attachment

BRISBANE, Australia, Oct. 07, 2021 (GLOBE NEWSWIRE) — Orocobre Limited (ASX: ORE, TSX: ORL) (Orocobre or the Company), advises that its 2021 Annual General Meeting (AGM) will be held at 11.00am AEST on Tuesday 30 November 2021. In the interests of safety for shareholders, employees and the broader community during the COVID-19 pandemic, the 2021 AGM will be held virtually, rather than at a physical location.
Shareholders will be provided with information on how to participate in the AGM when the Notice of Meeting is released this month. The Notice of Meeting will also be available on the ASX Company Announcements Platform and Orocobre’s website at: https://www.orocobre.com.
The closing time for receipt of director nominations for any candidates other than those recommended by the Board is 5.00pm AEST, Tuesday 19 October 2021.
This announcement has been approved by:
Rick Anthon
Joint Company Secretary
For more information please contact:
Andrew Barber
Chief Investor Relations Officer
Orocobre Limited
T: +61 7 3720 9088
M: +61 418 783 701
E: abarber@orocobre.com
W: www.orocobre.com
Twitter: https://twitter.com/OrocobreLimited
LinkedIn: https://www.linkedin.com/company/orocobre-limited
Facebook: https://www.facebook.com/OrocobreLimited/
Instagram: https://www.instagram.com/orocobre/
YouTube: https://www.youtube.com/OrocobreLimited
Click here to subscribe to the Orocobre e-Newsletter

VANCOUVER, BC / ACCESSWIRE / October 7, 2021 / Tinka Resources Limited ("Tinka" or the "Company") (TSXV:TK)(BVL:TK)(OTCQB:TKRFF) is pleased to announce initial high grade copper-gold surface sampling results from the Silvia NW target, one of several prospective areas within the Company's 100%-owned Silvia Project which was recently acquired (see news release dated July 12, 2021). Silvia NW is located in the Huanuco region of central Peru, 30 km from the Company's flagship Ayawilca project and 90 km along strike south of the Antamina copper mine (see Figure 1).
Silvia NW is prospective for copper-gold skarn mineralization along a 3 km x 1 km trend that has seen minimal exploration and no drilling. Tinka's detailed sampling at "Area A", one of three mineralized zones at Silvia NW (see Figure 2), has discovered high-grade copper-gold mineralization associated with apparently continuous outcrops of skarn covering an area of approximately 400 metres by 100 metres, open in all directions. Widespread scree intermittently covers the outcrops and has limited the lateral extent of this early sampling (see Figures 3, 4 & 5).
Highlights of sampling from Area A at Silvia NW:
-
A total of 108 trench and rock chip samples were collected over a 400 m x 100 m area of semi-continuous skarn:
-
Average grade of all samples is 0.79% copper & 0.60 g/t gold (1.24% CuEQ*);
-
Copper ranges between 0.01% to 12.31% Cu, and gold ranges between 0.01 g/t to 18.60 g/t Au;
-
-
There is a strong positive correlation between copper and gold;
-
Copper occurs as chalcopyrite with chalcocite and covellite (and minor copper oxides) in green garnet-magnetite skarn associated with quartz feldspar porphyry (QFP) dikes – mineralization occurs in both limestone ("exoskarn") and QFP ("endoskarn");
-
Skarn mineralization is open in all directions under shallow scree cover;
-
Rock samples are representative, non-selective, trench or continuous rock chip samples (1-2m wide) covering various rock types including skarn, QFP and limestone;
-
Exploration is continuing at Area A, B and C along the 3 km northeast-southwest trend.
Dr. Graham Carman, Tinka's President and CEO, stated: "We are very excited to announce the discovery of high grade copper-gold mineralization in our initial sampling at Silvia NW, located in an underexplored Andean region of central Peru close to our flagship Ayawilca project. We believe that these initial sampling results, covering a surface area of approximately 400 m x 100 m, show the outstanding potential for a large and high-grade skarn deposit that has previously not been recognized. The high levels of gold associated with the copper mineralization is a big positive, as gold significantly increases the potential value of the mineralization. The skarn remains open in all directions."
"We believe that we could be seeing the early indications of a high potential, high quality copper-gold prospect at Silvia NW. Exploration is continuing at target Areas B and C with mapping and detailed sampling along the 3 km trend, where additional skarn bodies have been reported in both areas."
"In addition to our current exploration activities, Tinka continues to advance its outstanding Ayawilca zinc-silver project which we believe is one of the best undeveloped zinc projects in the Americas. A Mineral Resource estimation update was recently released (see news release dated September 27, 2021). A Preliminary Economic Assessment (PEA) for the Ayawilca deposit will be disclosed within weeks."
* Copper Equivalent (CuEQ) is calculated assuming 100% recovery of copper and gold using a Gold Conversion Factor of 0.751, calculated from a nominal copper price of US$3.30/lb and a gold price of US$1,700/oz.
Geology and Sampling Results at Area A
Tinka's exploration activities at Silvia NW have concentrated to date on detailed mapping and sampling of skarns at Area A, located at the southwestern end of the target area (Figure 2). The skarns are hosted by the Cretaceous Jumasha Formation, a thick (> 2km) sequence of limestones that form a major part of the fold and thrust belt in central Peru and host to several major skarn deposits in Peru (including Antamina). The limestone at Area A has been intruded by quartz feldspar porphyry dikes and sills (QFP) which appear to control the copper-gold skarn mineralization.
Skarn occurs both in the limestone (as exoskarn) and in QFP (as endoskarn) over an apparently continuous area of approximately 400 metres x 100 metres (see Figure 3). There is widespread scree cover in-between outcrops of skarn limiting outcrop (Figures 4 & 5). Tinka geologists believe that the skarn mineralization could continue over a larger area beneath the scree on the lower slopes and floor of the valley. On the edges of the outcropping skarn zones, limestones show minor to weak skarn development and are weakly mineralized or unmineralized. Limestone outside of the skarn zones have developed localised hornfels and minor skarn veining.
The skarns are dominated by green garnets with or without magnetite and other calc-silicates (Figure 6). Sulphides in the outcrops are common (typically partially oxidised) and dominated by chalcopyrite and pyrite with minor covellite, chalcocite, and malachite.
Table 1 below highlights the copper-gold trench sampling results presented in this release (also highlighted in Figure 3) along with selected other metals. Table 2 is a summary of the surface samples by rock type. Zinc, along with silver, is anomalous in many of the samples while arsenic is not significant.
Table 1. Highlights of surface sampling at Area A presented in this release
|
Sample type |
No. Samples |
Length m |
Cu % |
Au g/t |
Ag g/t |
Zn % |
As ppm |
CuEQ %* |
|
Trench & Chip |
21 |
30 X 10 m area |
1.56 |
1.12 |
14.20 |
0.50 |
189.0 |
2.40 |
|
including |
1 |
1.00 |
12.31 |
18.60 |
82.00 |
0.16 |
870.0 |
26.28 |
|
including |
1 |
1.00 |
1.87 |
1.24 |
12.20 |
0.34 |
621.0 |
2.80 |
|
Trench |
1 |
2.00 |
3.79 |
2.49 |
31.50 |
3.97 |
69.6 |
5.66 |
|
Trench |
3.50 |
0.31 |
0.19 |
2.35 |
3.67 |
60.6 |
0.45 |
|
|
Trench |
3 |
6.00 |
1.88 |
0.38 |
7.13 |
0.07 |
30.6 |
2.16 |
|
Trench |
1 |
1.00 |
0.55 |
0.78 |
2.90 |
0.70 |
95.8 |
1.14 |
|
Trench |
17 |
34.00 |
0.42 |
0.19 |
2.44 |
0.20 |
23.2 |
0.56 |
|
including |
2 |
4.00 |
1.04 |
0.48 |
2.55 |
0.03 |
36.8 |
1.40 |
|
Trench |
8 |
16.00 |
0.50 |
0.28 |
6.76 |
0.27 |
50.4 |
0.70 |
|
including |
1 |
2.00 |
0.90 |
1.43 |
22.20 |
0.25 |
50.6 |
1.98 |
|
Trench |
1 |
0.60 |
1.25 |
0.45 |
6.90 |
2.98 |
73.0 |
1.59 |
|
Trench |
1 |
1.00 |
1.21 |
2.93 |
8.50 |
3.73 |
31.0 |
3.41 |
|
Chip |
1 |
0.50 |
0.88 |
0.49 |
5.30 |
0.16 |
1.5 |
1.25 |
|
Trench |
1 |
2.00 |
1.30 |
0.57 |
7.50 |
5.85 |
37.0 |
1.73 |
|
Chip |
1 |
0.70 |
1.49 |
10.80 |
11.00 |
5.31 |
60.8 |
9.60 |
* Copper Equivalent (CuEQ) is calculated assuming 100% recovery of copper and gold using a Gold Conversion Factor of 0.751, calculated from a nominal copper price of US$3.30/lb and a gold price of US$1,700/oz.
Table 2. Summary of sampling at Area A by rock type
|
Average by Rock Type |
|||||||
|
No. Samples |
Cu % |
Au g/t |
Ag g/t |
Zn % |
As ppm |
CuEQ % |
|
|
Area A |
|||||||
|
Endo Skarn |
66 |
1.09 |
0.83 |
8.73 |
0.79 |
83.18 |
1.71 |
|
Exo Skarn |
16 |
0.81 |
0.59 |
5.50 |
1.31 |
78.48 |
1.25 |
|
Limestone |
7 |
0.01 |
0.01 |
0.20 |
0.07 |
19.74 |
0.02 |
|
QFP |
19 |
0.03 |
0.02 |
0.40 |
0.02 |
13.07 |
0.05 |
|
TOTAL Area A |
108 |
0.79 |
0.60 |
6.20 |
0.69 |
66.00 |
1.24 |
* Copper Equivalent (CuEQ) is calculated assuming 100% recovery of copper and gold using a Gold Conversion Factor of 0.751, calculated from a nominal copper price of US$3.30/lb and a gold price of US$1,700/oz.
Notes on sampling and assaying
Trenches were dug up to a depth of 1 metre, where possible, across areas of outcrop (partially weathered) to test the grade of skarn and adjacent limestones and intrusions. Trench samples are continuous samples collected with hammer and chisel over 1 to 2 metre intervals. In areas of sporadic outcrop, samples are taken as semi-continuous rock chips. Tinka believes that the samples are representative of the outcrop and non-selective. Samples were bagged and labelled in the field. Samples were sent to Certimin laboratory in Lima where samples were dried, crushed to 90% passing 2mm, then 1 kg pulverized to 85% passing 75 microns. Gold was analysed by fire assay on 30 g (method G0108) and multi-element analysis by ICP using multi-acid digestion (method G0176). Gold assays above 10 g/t Au were re-assayed by a high-grade fire assay method and a gravimetric finish (method G0014). Copper assays over 1% Cu were re-assayed by atomic absorption (method G0039). Standards and blanks were not inserted by Tinka but were inserted at the laboratory.
Figure 1 – Location of Silvia NW target area with selected mining claims in central Peru

Figure 2 – Simplified geological map of Silvia NW highlighting Areas A, B & C

Figure 3 – Highlights of copper-gold trenching and rock chip results at Area A

Figure 4 – Photo of Area A highlighting copper-gold skarn outcrops (darker shade) and scree, viewing SE

Figure 5 – Photo of Area A highlighting copper-gold skarn outcrops (darker shade) and scree, viewing South

Figure 6 – Photograph of Exoskarn from Area A. Green garnets are pervasive throughout the rock, while copper is observed as turquoise-coloured malachite replacing chalcopyrite

The Qualified Person, Dr. Graham Carman, Tinka's President and CEO, and a Fellow of the Australasian Institute of Mining and Metallurgy, has reviewed and verified the technical contents of this release.
On behalf of the Board,
"Graham Carman"
Dr. Graham Carman, President & CEO
Further Information:
www.tinkaresources.com
Mariana Bermudez
1.604.685.9316
info@tinkaresources.com
About Tinka Resources Limited
Tinka is an exploration and development company with its flagship property being the 100%-owned Ayawilca zinc-silver-tin project in central Peru. The Ayawilca Zinc Zone deposit has an estimated Indicated Mineral Resource of 19.0 Mt grading 7.15% Zn, 16.8 g/t Ag & 0.2% Pb and an Inferred mineral resource of 47.9 Mt grading 5.4% Zn, 20.0 g/t Ag & 0.4% Pb (dated August 30, 2021 – see news release dated September 27, 2021). The Ayawilca Tin Zone has an estimated Inferred Mineral Resource of 8.4 Mt grading 1.02% Sn (also dated August 30, 2021). An NI 43-101 report will be released in November 2021.
Tinka holds 46,000 hectares of mining claims in central Peru, one of the largest holders of mining claims in the belt. Tinka is actively exploring for copper-gold skarn mineral deposits at its 100%-owned Silvia project.
Forward-Looking Statements: Certain information in this news release contains forward-looking statements and forward-looking information within the meaning of applicable securities laws (collectively "forward-looking statements"). All statements, other than statements of historical fact are forward-looking statements. Forward-looking statements are based on the beliefs and expectations of Tinka as well as assumptions made by and information currently available to Tinka's management. Such statements reflect the current risks, uncertainties and assumptions related to certain factors including, without limitations: timing of planned work programs and results varying from expectations; delay in obtaining results; changes in equity markets; uncertainties relating to the availability and costs of financing needed in the future; equipment failure, unexpected geological conditions; imprecision in resource estimates or metal recoveries; success of future development initiatives; competition and operating performance; environmental and safety risks; the Company's expectations regarding the Ayawilca Project PEA; the political environment in which the Company operates continuing to support the development and operation of mining projects; risks related to negative publicity with respect to the Company or the mining industry in general; the threat associated with outbreaks of viruses and infectious diseases, including the novel COVID-19 virus; delays in obtaining or failure to obtain necessary permits and approvals from local authorities; community agreements and relations; and, other development and operating risks. Should any one or more of these risks or uncertainties materialize, or should any underlying assumptions prove incorrect, actual results may vary materially from those described herein. Although Tinka believes that assumptions inherent in the forward-looking statements are reasonable, forward-looking statements are not guarantees of future performance and accordingly undue reliance should not be put on such statements due to the inherent uncertainty therein. Except as may be required by applicable securities laws, Tinka disclaims any intent or obligation to update any forward-looking statement.
Neither the TSX Venture Exchange nor its Regulation Services Provider (as that term is defined in the policies of the TSX Venture Exchange) accepts responsibility for the adequacy or accuracy of this news release
SOURCE: Tinka Resources Limited
View source version on accesswire.com:
https://www.accesswire.com/667120/Tinka-Discovers-High-Grade-Copper-and-Gold-at-Silvia-Project–Surface-Samples-Up-to-123-Copper-and-186-GT-Gold
TORONTO, ON / ACCESSWIRE / October 7, 2021 / Bold Ventures Inc. (TSXV:BOL) (the "Company" or "Bold") is pleased to report that its geological team has mobilized to the Traxxin Gold Project. Having inspected historical trenching on the claims, specific locations are being cleaned, mapped and sampled. Prospecting will focus on areas adjacent to and south of the Main Zone (see project details and maps here). Geological mapping and sampling of these areas of interest will follow.
A downhole geophysical survey is in the planning stage to further define the depth extent and character of the structurally controlled gold mineralization occurring at and below the Main Zone. This survey will utilize the four diamond drill holes completed by Bold in January of this year (see Bold news release dated April 12, 2021).
In conjunction with this work, the historical geophysical surveys have been reviewed with a goal to improve the understanding of the relationship between the geophysical signature and the known gold mineralization. As a result, test surveys will be carried out prior to any additional survey work. This will assist in determining the optimal survey system and coverage to identify possible gold-bearing horizons more clearly. Current geological interpretation indicates that multiple shear zones occur subparallel to the Main Zone. The character, orientation, continuity, and intensity of the shearing remains a focus of the exploration effort.
Additionally, a study of polished thin section samples from historical drill core has been initiated. This is designed to improve the technical team's understanding of the mineralogical relationships with the gold mineralization encountered at the property. The work is being carried out under the supervision of Professor James Mungall, PhD, Carleton University who is a member of Bold's Advisory Board.
Additional exploration work will be planned as the results from the current work are received and evaluated. For a view of the technical merits of the Traxxin Gold Project and our other properties please visit our website at www.boldventuresinc.com.
The technical and scientific disclosures in this news release have been reviewed and approved by Gerald D. White, B.Sc., P.Geo., a qualified person (QP) under National Instrument 43-101.
Traxxin Extension Joint Venture
In April 2017, Lac des Mille Lacs First Nation (LDMLFN) and Bold entered into a joint venture to explore the northeastern extension of the Traxxin Gold discovery. Pursuant to the Traxxin Extension Joint Venture Agreement, LDMLFN has the right to earn a 50% interest in the Traxxin Gold Property from Bold by paying to Bold 50% of the cash option payments, 50% of the expenditure requirements and reimbursing Bold for 50% of the value of the shares issued pursuant to the Option. If the Option is earned and both parties maintain their interest in the Traxxin Gold Property, Bold and LDMLFN will form a joint venture for the further exploration and development of the Traxxin Gold Property.
About Bold Ventures Inc.
The Company explores for Gold and Base Metals in Canada. Bold is exploring properties located within active gold camps of Northern Ontario. Bold also holds significant assets located within and around the emerging multi-metals district dubbed the Ring of Fire region, located in the James Bay Lowlands of Northern Ontario.
As a result of the current COVID-19 virus concerns, the Company's management and contractors are following public guidelines and taking recommended steps to protect the health and safety of all personnel while carrying out operations. As a result of the COVID-19 pandemic giving rise to local and national anti-virus measures, the scheduling of activities is subject to change. COVID-19 impacts may affect timing and availability of goods and services for the foreseeable future.
For additional information about Bold Ventures and our projects please visit www.boldventuresinc.com or contact us at 416-864-1456 or email us at info@boldventuresinc.com.
"David B Graham"
David Graham
President and CEO
Neither TSX Venture Exchange nor its Regulation Services Provider (as that term is defined in the policies of the TSX Venture Exchange) accepts responsibility for the adequacy or accuracy of this release.
Cautionary Note Regarding Forward-Looking Statements: This Press Release contains forward-looking statements that involve risks and uncertainties, which may cause actual results to differ materially from the statements made. When used in this document, the words "may", "would", "could", "will", "intend", "plan", "anticipate", "believe", "estimate", "expect" and similar expressions are intended to identify forward-looking statements. Such statements reflect our current views with respect to future events and are subject to such risks and uncertainties. Many factors could cause our actual results to differ materially from the statements made, including those factors discussed in filings made by us with the Canadian securities regulatory authorities. Should one or more of these risks and uncertainties, such actual results of current exploration programs, the general risks associated with the mining industry, the price of gold and other metals, currency and interest rate fluctuations, increased competition and general economic and market factors, occur or should assumptions underlying the forward looking statements prove incorrect, actual results may vary materially from those described herein as intended, planned, anticipated, or expected. We do not intend and do not assume any obligation to update these forward-looking statements, except as required by law. Shareholders are cautioned not to put undue reliance on such forward-looking statements.
SOURCE: Bold Ventures Inc.
View source version on accesswire.com:
https://www.accesswire.com/667146/Bold-Ventures-Commences-Field-Work-at-the-Traxxin-Gold-Project
Value investing is easily one of the most popular ways to find great stocks in any market environment. After all, who wouldn’t want to find stocks that are either flying under the radar and are compelling buys, or offer up tantalizing discounts when compared to fair value?
One way to find these companies is by looking at several key metrics and financial ratios, many of which are crucial in the value stock selection process. Let’s put The Mosaic Company MOS stock into this equation and find out if it is a good choice for value-oriented investors right now, or if investors subscribing to this methodology should look elsewhere for top picks:
PE Ratio
A key metric that value investors always look at is the Price to Earnings Ratio, or PE for short. This shows us how much investors are willing to pay for each dollar of earnings in a given stock, and is easily one of the most popular financial ratios in the world. The best use of the PE ratio is to compare the stock’s current PE ratio with: a) where this ratio has been in the past; b) how it compares to the average for the industry/sector; and c) how it compares to the market as a whole.
On this front, Mosaic has a trailing twelve months PE ratio of 15.1, as you can see in the chart below:

Image Source: Zacks Investment Research
This level actually compares pretty favorably with the market at large, as the PE for the S&P 500 stands at about 24.64. If we focus on the long-term PE trend, Mosaic’s current PE level puts it below its midpoint over the past five years.

Image Source: Zacks Investment Research
However, the stock’s PE compares unfavorably with the Zacks Basic Materials sector’s trailing twelve months PE ratio, which stands at 11.7. At the very least, this indicates that the stock is relatively undervalued right now, compared to its peers.

Image Source: Zacks Investment Research
We should also point out that Mosaic has a forward PE ratio (price relative to this year’s earnings) of just 7.86, so it is fair to say that a slightly more value-oriented path may be ahead for Mosaic stock in the near term too.
P/S Ratio
Another key metric to note is the Price/Sales ratio. This approach compares a given stock’s price to its total sales, where a lower reading is generally considered better. Some people like this metric more than other value-focused ones because it looks at sales, something that is far harder to manipulate with accounting tricks than earnings.
Right now, Mosaic has a P/S ratio of about 1.48. This is lower than the S&P 500 average, which comes in at 4.92 right now. Also, as we can see in the chart below, this is below the highs for this stock in particular over the past few years.

Image Source: Zacks Investment Research
If anything, MOS is in the lower end of its range in the time period from a P/S metric, suggesting some level of undervalued trading—at least compared to historical norms.
Broad Value Outlook
In aggregate,Mosaic currently has a Zacks Value Score of A, putting it into the top 20% of all stocks we cover from this look. This makes Mosaic a solid choice for value investors.
What About the Stock Overall?
Though Mosaic might be a good choice for value investors, there are plenty of other factors to consider before investing in this name. In particular, it is worth noting that the company has a Growth Score of F and a Momentum Score of C. This gives MOS a Zacks VGM score — or its overarching fundamental grade — of A. (You can read more about the Zacks Style Scores here >>)
Meanwhile, the company’s recent earnings estimates have been encouraging. The current year has seen five estimates go higher in the past sixty days compared to three lower, while the full year 2021 estimate has seen three upward revision compared to one downward in the same time period.
This has had a positive impact on the consensus estimate though as the current year consensus estimate has risen by 19.7% in the past two months, while the full year 2021 estimate has improved by 1.4%. You can see the consensus estimate trend and recent price action for the stock in the chart below:
The Mosaic Company Price and Consensus

The Mosaic Company price-consensus-chart | The Mosaic Company Quote
Despite this positive trend, the stock has a Zacks Rank #3 (Hold), which indicates expectations of in-line performance from the company in the near term.
Bottom Line
Mosaic is an inspired choice for value investors, as it is hard to beat its incredible line up of statistics on this front. A strong industry rank (among top 16% of more than 250 industries) further instils our confidence. In fact, over the past two years, the Zacks Fertilizers industry has clearly outperformed the market at large, as you can see below:

Image Source: Zacks Investment Research
So, despite a Zacks Rank #3, we believe that bullish analyst sentiment and favorable industry factors make this value stock a compelling pick.
Want the latest recommendations from Zacks Investment Research? Today, you can download 7 Best Stocks for the Next 30 Days. Click to get this free report
The Mosaic Company (MOS) : Free Stock Analysis Report
To read this article on Zacks.com click here.
It is hard to get excited after looking at Capstone Mining's (TSE:CS) recent performance, when its stock has declined 12% over the past month. But if you pay close attention, you might gather that its strong financials could mean that the stock could potentially see an increase in value in the long-term, given how markets usually reward companies with good financial health. Particularly, we will be paying attention to Capstone Mining's ROE today.
Return on Equity or ROE is a test of how effectively a company is growing its value and managing investors’ money. Put another way, it reveals the company's success at turning shareholder investments into profits.
See our latest analysis for Capstone Mining
How Is ROE Calculated?
Return on equity can be calculated by using the formula:
Return on Equity = Net Profit (from continuing operations) ÷ Shareholders' Equity
So, based on the above formula, the ROE for Capstone Mining is:
22% = US$206m ÷ US$936m (Based on the trailing twelve months to June 2021).
The 'return' is the yearly profit. One way to conceptualize this is that for each CA$1 of shareholders' capital it has, the company made CA$0.22 in profit.
What Is The Relationship Between ROE And Earnings Growth?
Thus far, we have learned that ROE measures how efficiently a company is generating its profits. Depending on how much of these profits the company reinvests or "retains", and how effectively it does so, we are then able to assess a company’s earnings growth potential. Assuming everything else remains unchanged, the higher the ROE and profit retention, the higher the growth rate of a company compared to companies that don't necessarily bear these characteristics.
Capstone Mining's Earnings Growth And 22% ROE
First thing first, we like that Capstone Mining has an impressive ROE. Additionally, the company's ROE is higher compared to the industry average of 14% which is quite remarkable. As a result, Capstone Mining's exceptional 63% net income growth seen over the past five years, doesn't come as a surprise.
As a next step, we compared Capstone Mining's net income growth with the industry, and pleasingly, we found that the growth seen by the company is higher than the average industry growth of 32%.

Earnings growth is an important metric to consider when valuing a stock. The investor should try to establish if the expected growth or decline in earnings, whichever the case may be, is priced in. By doing so, they will have an idea if the stock is headed into clear blue waters or if swampy waters await. If you're wondering about Capstone Mining's's valuation, check out this gauge of its price-to-earnings ratio, as compared to its industry.
Is Capstone Mining Efficiently Re-investing Its Profits?
Capstone Mining doesn't pay any dividend currently which essentially means that it has been reinvesting all of its profits into the business. This definitely contributes to the high earnings growth number that we discussed above.
Summary
Overall, we are quite pleased with Capstone Mining's performance. In particular, it's great to see that the company is investing heavily into its business and along with a high rate of return, that has resulted in a sizeable growth in its earnings. That being so, a study of the latest analyst forecasts show that the company is expected to see a slowdown in its future earnings growth. To know more about the company's future earnings growth forecasts take a look at this free report on analyst forecasts for the company to find out more.
This article by Simply Wall St is general in nature. We provide commentary based on historical data and analyst forecasts only using an unbiased methodology and our articles are not intended to be financial advice. It does not constitute a recommendation to buy or sell any stock, and does not take account of your objectives, or your financial situation. We aim to bring you long-term focused analysis driven by fundamental data. Note that our analysis may not factor in the latest price-sensitive company announcements or qualitative material. Simply Wall St has no position in any stocks mentioned.
Have feedback on this article? Concerned about the content? Get in touch with us directly. Alternatively, email editorial-team (at) simplywallst.com.
VANCOUVER, BC, Oct. 7, 2021 /CNW/ – Blue Sky Uranium Corp. (TSXV: BSK) (FSE: MAL2) (OTC: BKUCF), "Blue Sky" or the "Company") announces that it intends to implement a warrant exercise incentive program (the "Incentive Program"). The Company has applied for TSX Venture Exchange (the "TSXV") approval for the Incentive Program.
As announced on October 23, 2019, the Company completed a private placement offering of 5,793,333 units ("Units") at a subscription price of $0.15 per Unit. Each unit was comprised of one common share and one common share purchase warrant for two years at $0.25 from the date of issuance (the "Placement Warrants"). All of the Placement Warrants remain outstanding expiring October 23, 2021 (the "Expiry Date").
The Incentive Program will commence on the date of receipt of conditional acceptance by the TSXV and will expire at 4:00 p.m. (Vancouver time) on the Expiry Date (the "Incentive Period"). If the Placement Warrant holder exercises the Placement Warrants, the Placement Warrant holder will receive one additional warrant (an "Incentive Warrant") in consideration of the exercise of each Placement Warrant. Each Incentive Warrant will be exercisable to acquire one common share of the Company at a price of $0.35 per share for a period of three years from the date of issuance. The Company believes this will give existing Placement Warrant holders the right incentive to exercise their Placement Warrants. The Incentive Warrants and any shares issued upon the exercise of the Incentive Warrants will be subject to a hold period expiring four months plus one day after the date of distribution of the Incentive Warrants.
In the event a Placement Warrant holder determines not to participate in the Incentive Program, then the Placement Warrants will expire on October 23, 2021.
A portion of the Placement Warrants, eligible for participation in the Incentive Program, are held by insiders of the Company. Participation by any such insiders in the Incentive Program may constitute a related party transaction pursuant to Multilateral Instrument 61-101 – Special Transactions ("MI 61-101"). The Company is exempt from the formal valuation requirement pursuant to subsections 5.5(a) and (b) of MI 61-101, and from the minority approval requirement pursuant to subsection 5.7(1)(a) of MI 61-101
The Company is not aware of any potential new insider position that would be created upon the exercise of the Placement Warrants nor Incentive Warrants.
There are no guarantees of TSXV approval and the Company will provide further details on the manner by which Placement Warrant holders may exercise their Placement Warrants under the Incentive Program if TSXV approval is granted.
The Company intends to use the proceeds from the exercise of any Placement Warrants for working capital and exploration on its properties in Argentina.
About Blue Sky Uranium Corp.
Blue Sky Uranium Corp. is a leader in uranium discovery in Argentina. The Company's objective is to deliver exceptional returns to shareholders by rapidly advancing a portfolio of surficial uranium deposits into low-cost producers, while respecting the environment, the communities, and the cultures in all the areas in which we work. Blue Sky has the exclusive right to properties in two provinces in Argentina. The Company is a member of the Grosso Group, a resource management group that has pioneered exploration in Argentina since 1993.
ON BEHALF OF THE BOARD
"Nikolaos Cacos"
______________________________________
Nikolaos Cacos, President, CEO and Director
Neither TSX Venture Exchange nor its Regulation Services Provider (as that term is defined in policies of the TSX Venture Exchange) accepts responsibility for the adequacy or accuracy of this release.
FORWARD LOOKING STATEMENTS: Certain statements contained in this press release may constitute forward-looking statements under Canadian securities legislation. Generally, forward-looking information can be identified by the use of forward-looking terminology such as "expects" or "it is expected", or variations of such words and phrases or statements that certain actions, events or results "will" occur. This document contains statements about expected or anticipated future events and/or financial results that are forward-looking in nature and as a result, are subject to certain risks and uncertainties, such as general economic, market and business conditions, regulatory processes and actions, technical issues, new legislation, competitive conditions, the uncertainties resulting from potential delays or changes in plans, the occurrence of unexpected events and the Company's ability to execute and implement its future plans. The actual events may differ materially from those projected in the forward-looking statements. When relying on forward-looking statements to make decisions, investors and others should carefully consider the foregoing factors and other uncertainties and should not place undue reliance on such forward-looking statements. The Company does not undertake to update any forward looking statements, except as may be required by applicable securities laws.

View original content:https://www.prnewswire.com/news-releases/blue-sky-uranium-announces-warrant-exercise-incentive-program-301395660.html
SOURCE Blue Sky Uranium Corp.

View original content: http://www.newswire.ca/en/releases/archive/October2021/07/c9443.html
Vancouver, British Columbia–(Newsfile Corp. – October 7, 2021) – Orestone Mining Corp. (TSXV: ORS) (FSE: WKN: O2R1) is pleased to announce that following the release of results from the recent drilling campaign (Orestone Press Release Dated June 17, 2021), the Company contracted Peter E. Walcott & Associates Limited to carry out a Magneto Telluric (MT) geophysical survey at the Captain gold-copper project near Fort St James, North Central British Columbia.
Previous drilling at Captain has defined a tabular, sericite altered zone that is 500 metres thick along a strike length of 800 metres with a width in excess of 1000 metres, (500m x 800m x1000m) which is open to the east. Within this zone, potassic-phyllic altered latite volcanics host calc-alkaline style gold-copper mineralization.
The MT survey, consisted of a 2 kilometres long line oriented southwest-northeast over the interpreted eastern extension of the mineralized zone referred to above, a frequency of 1Hz was used with readings taken on a 100 metre spacing. The survey outlined a large, pronounced low resistivity / high conductivity anomaly over 800 metres in width starting at a depth of 300-400 metres, extending to a depth of over 900 metres, which is open to depth. This conductive body is inferred to be the sulphide rich mineralizing intrusive which altered and mineralized the volcanic section to the west in the area of previous drilling.

MT Section Captain Property
To view an enhanced version of this graphic, please visit:
https://orders.newsfilecorp.com/files/4752/98868_53b34f5e14502a74_001full.jpg
"We are excited to see this very intense resistivity low of 12 to 30 omh which indicates a highly conductive sulphide rich target that we interpret as the core of the intrusive system. All of the mineralized drill intercepts on the Captain Project to date indicate that a gold enriched calc-alkaline style gold-copper intrusive porphyry system is present. This MT geophysical survey further validates and confirms our target model and we anticipate that the next phase of drilling will begin shortly," stated David Hottman, CEO and Director of Orestone Mining Corp.
The Company is well financed to continue exploring at Captain; additional information will be released as available.
MT geophysical surveying is a deep seeking electro-magnetic method, penetrating up to a depth of 1000 metres or more, which measures resistivity to identify structures and rock types. MT surveys are typically employed for defining deep structures, geothermal systems, and targeting deep mineralized systems such as porphyry deposits which typically exhibit electrical resistivity contrasts at depths of up to several kilometres. Examples of large buried porphyry deposits associated with such strong resistivity lows are the Resolution Mine in Arizona, Collahuasi and El Salvador mines in Chile and the Pebble deposit in Alaska.
The 100 percent owned Captain gold-copper project encompasses 37 square kilometres and hosts a large porphyry system located 41 kilometres north of Fort St. James and 30 kilometres south of the Mt. Milligan copper-gold mine in North Central British Columbia. The Captain Project features relatively flat terrain, moderate tree cover and an extensive network of logging and Forest Service roads suitable for exploration year around. To stay informed of the latest corporate activities please click here to provide consent and receive news and updates. For more information, please visit Orestone's website at www.orestone.ca.
Quality assurance/quality control procedures
Orestone Mining has implemented a rigorous quality assurance/quality control program to ensure best practices in work programs by the company and contractors including sampling and analysis of diamond drill core as well as geophysical surveys and other work done on the property.
Gary Nordin, P.Geo, a Director of the Company, is a qualified person as defined by National Instrument 43-101. Mr. Nordin has reviewed and approved the technical information in this press release.
ON BEHALF OF ORESTONE MINING CORP.
David Hottman
CEO
For further information contact: David Hottman at 604-629-1929
info@orestone.ca
407 – 325 Howe Street, Vancouver, BC V6C 1Z7, Canada
Phone: 604-629-1929
Fax: 604-629-1930
www.orestone.ca
Neither the TSX Venture Exchange nor its Regulation Services Provider (as that term is defined in the policies of the TSX Venture Exchange) accepts responsibility for the adequacy or accuracy of this News Release. This news release has been prepared by management and no regulatory authority has approved or disapproved the information contained herein.
To view the source version of this press release, please visit https://www.newsfilecorp.com/release/98868
If you would like to receive our free newsletter via email, simply enter your email address below & click subscribe.
 Follow us on Twitter
 Become our facebook fan
CONNECT WITH US
Tweets
Tweet with hash tag #miningfeeds or @miningfeeds and your tweets will be displayed across this site.
MOST ACTIVE MINING STOCKS
Daily Gainers
 CMC Metals Ltd. CMC Metals Ltd. |
CMB.V | +900.00% |
 Eden Energy Ltd Eden Energy Ltd |
EDE.AX | +200.00% |
| GoviEx Uranium Inc. |
GXU.V | +42.86% |
| Eagle Nickel Ltd. |
ENL.AX | +41.67% |
| Citigold Corp. Limited |
CTO.AX | +33.33% |
| Mount Burgess Mining NL |
MTB.AX | +33.33% |
| Exalt Resources Limited |
ERD.AX | +31.94% |
| Casa Minerals Inc. |
CASA.V | +30.00% |
| Cariboo Rose Resources Ltd |
CRB.V | +28.57% |
| Belmont Resources Inc. |
BEA.V | +28.57% |


