Vancouver, British Columbia–(Newsfile Corp. – October 4, 2021) – Philippine Metals Inc. (TSXV: PHI) (the "Company") announces that a total of 150,000 incentive stock options have been granted to an independent director of the Company pursuant to the Company's stock option plan. The options have an effective grant date of September 29, 2021 and are exercisable on or before July 7, 2022 at a price of $0.075 per share.
ON BEHALF OF THE BOARD
"Craig T. Lindsay"
Chief Executive Officer
For additional information, please contact:
Craig Lindsay
Tel: (604) 218-0550
Email: craig@agcap.ca
Neither TSX Venture Exchange nor its Regulation Services Provider (as defined in the policies of the TSX Venture Exchange) accepts responsibility for the adequacy or accuracy of this release.

To view the source version of this press release, please visit https://www.newsfilecorp.com/release/98535
If we want to find a potential multi-bagger, often there are underlying trends that can provide clues. Typically, we'll want to notice a trend of growing return on capital employed (ROCE) and alongside that, an expanding base of capital employed. Ultimately, this demonstrates that it's a business that is reinvesting profits at increasing rates of return. However, after investigating Sociedad Química y Minera de Chile (NYSE:SQM), we don't think it's current trends fit the mold of a multi-bagger.
Return On Capital Employed (ROCE): What is it?
For those who don't know, ROCE is a measure of a company's yearly pre-tax profit (its return), relative to the capital employed in the business. The formula for this calculation on Sociedad Química y Minera de Chile is:
Return on Capital Employed = Earnings Before Interest and Tax (EBIT) ÷ (Total Assets – Current Liabilities)
0.084 = US$456m ÷ (US$6.0b – US$581m) (Based on the trailing twelve months to June 2021).
Therefore, Sociedad Química y Minera de Chile has an ROCE of 8.4%. In absolute terms, that's a low return but it's around the Chemicals industry average of 9.8%.
View our latest analysis for Sociedad Química y Minera de Chile

Above you can see how the current ROCE for Sociedad Química y Minera de Chile compares to its prior returns on capital, but there's only so much you can tell from the past. If you'd like to see what analysts are forecasting going forward, you should check out our free report for Sociedad Química y Minera de Chile.
What Does the ROCE Trend For Sociedad Química y Minera de Chile Tell Us?
In terms of Sociedad Química y Minera de Chile's historical ROCE movements, the trend isn't fantastic. To be more specific, ROCE has fallen from 11% over the last five years. However, given capital employed and revenue have both increased it appears that the business is currently pursuing growth, at the consequence of short term returns. And if the increased capital generates additional returns, the business, and thus shareholders, will benefit in the long run.
The Bottom Line On Sociedad Química y Minera de Chile's ROCE
In summary, despite lower returns in the short term, we're encouraged to see that Sociedad Química y Minera de Chile is reinvesting for growth and has higher sales as a result. And the stock has done incredibly well with a 127% return over the last five years, so long term investors are no doubt ecstatic with that result. So should these growth trends continue, we'd be optimistic on the stock going forward.
If you want to know some of the risks facing Sociedad Química y Minera de Chile we've found 2 warning signs (1 can't be ignored!) that you should be aware of before investing here.
If you want to search for solid companies with great earnings, check out this free list of companies with good balance sheets and impressive returns on equity.
This article by Simply Wall St is general in nature. We provide commentary based on historical data and analyst forecasts only using an unbiased methodology and our articles are not intended to be financial advice. It does not constitute a recommendation to buy or sell any stock, and does not take account of your objectives, or your financial situation. We aim to bring you long-term focused analysis driven by fundamental data. Note that our analysis may not factor in the latest price-sensitive company announcements or qualitative material. Simply Wall St has no position in any stocks mentioned.
Have feedback on this article? Concerned about the content? Get in touch with us directly. Alternatively, email editorial-team (at) simplywallst.com.
FRANKLIN, Ind., Oct. 04, 2021 (GLOBE NEWSWIRE) — IBC Advanced Alloys Corp. (“IBC” or the “Company”) (TSX-V: IB; OTCQB: IAALF) is pleased to announce it has entered into a new master lease agreement (the “Lease”) among Utica Leaseco LLC and Utica Equipment Finance, LLC (collectively, “Utica”) and certain of the Company’s U.S. subsidiaries (the “Subsidiaries”) in support of the Company’s ongoing expansion and consolidation of its Copper Alloys production facility in Franklin, Indiana.
“This equipment leasing arrangement allows us access to capital necessary to continue to execute on our expansion and consolidation of the Copper Alloys division’s state-of-the-art foundry facility at our North American headquarters in Franklin, Indiana,” said Mark A. Smith, CEO and Chairman of IBC. “Construction of the new facility is well underway now, and we look forward to completing this effort and achieving the cost savings and expanded production capacity it is expected to provide.”
Pursuant to the Lease, the Subsidiaries will grant a security interest in certain equipment located on the Lessees’ premises in exchange for US$900,000 in connection with a capital lease facility for a four-year term. IBC intends to use the proceeds of the Lease to advance the Copper Alloys consolidation and expansion and for working capital purposes.
The Subsidiaries will make lease payments in 51 monthly installments of approximately US$24,389.80, with monthly lease payments increasing by 1.0% for every 0.25% increase to the prime rate of Comerica Bank.
Pursuant to the terms of the Lease, the Subsidiaries will pay aggregate fees and expenses consisting of an approximately US$18,000 origination fee + US$43,200 for legal, appraisal, and title expenses at close, and an annual lease administration fee of US$5,000. The Lease is also subject to an early termination fee ranging from 5%-1% of the total funding amount, which decreases over the term of the Lease. The Lease is further subject to customary terms for similar lease arrangements in the United States manufacturing sector.
For more information on IBC and its innovative alloy products, go here.
On Behalf of the Board of Directors:
"Mark Smith”
Mark Smith P.E., Esq. , Chairman
Contact:
Mark A. Smith, Chairman
Jim Sims, Director of Investor and Public Relations
+1 (303) 503-6203
Email: jsims@policycom.com
Website: www.ibcadvancedalloys.com
@IBCAdvanced $IB $IAALF #Beryllium #Beralcast
About IBC Advanced Alloys Corp.
IBC is a leading beryllium and copper advanced alloys company serving a variety of industries such as defense, aerospace, automotive, telecommunications, precision manufacturing, and others. IBC's Copper Alloys Division manufactures and distributes a variety of copper alloys as castings and forgings, including beryllium copper, chrome copper, and aluminum bronze. IBC's Engineered Materials Division makes the Beralcast® family of alloys, which can be precision cast and are used in an increasing number of defense, aerospace, and other systems, including the F-35 Joint Strike Fighter. IBC has production facilities in Indiana, Massachusetts, Pennsylvania, and Missouri. The Company's common shares are traded on the TSX Venture Exchange under the symbol "IB" and the OTCQB under the symbol "IAALF".
Cautionary Statements
The TSX Venture Exchange has not reviewed and does not accept responsibility for the adequacy of this news release. Neither TSX Venture Exchange nor its Regulation Services Provider (as that term is defined in the policies of the TSX Venture Exchange) accepts responsibility for the adequacy or accuracy of this release.
Certain information contained in this news release may be forward-looking information or forward-looking statements as defined under applicable securities laws. Forward-looking information and forward-looking statements are often, but not always identified by the use of words such as "expect", "anticipate", "believe", "foresee", "could", "estimate", "goal", "intend", "plan", "seek", "will", "may" and "should" and similar expressions or words suggesting future outcomes. This news release includes forward-looking information and statements pertaining to, among other things, the use of proceeds of the Lease. Forward-looking statements involve substantial known and unknown risks and uncertainties, certain of which are beyond the Company's control including: the impact of general economic conditions in the areas in which the Company or its customers operate, including the semiconductor manufacturing and oil and gas industries, risks associated with manufacturing activities, changes in laws and regulations including the adoption of new environmental laws and regulations and changes in how they are interpreted and enforced, increased competition, the lack of availability of qualified personnel or management, limited availability of raw materials, fluctuations in commodity prices, foreign exchange or interest rates, stock market volatility and obtaining required approvals of regulatory authorities. As a result of these risks and uncertainties, the Company's future results, performance or achievements could differ materially from those expressed in these forward-looking statements. All statements included in this press release that address activities, events or developments that the Company expects, believes or anticipates will or may occur in the future are forward-looking statements. These statements are based on assumptions made by the Company based on its experience, perception of historical trends, current conditions, expected future developments and other factors it believes are appropriate in the circumstances.
Please see “Risks Factors” in our Annual Information Form available under the Company’s profile at www.sedar.com, for information on the risks and uncertainties associated with our business. Readers should not place undue reliance on forward-looking information and statements, which speak only as of the date made. The forward-looking information and statements contained in this release represent our expectations as of the date of this release. We disclaim any intention or obligation or undertaking to update or revise any forward-looking information or statements whether as a result of new information, future events or otherwise, except as required under applicable securities laws.

There's no doubt that money can be made by owning shares of unprofitable businesses. For example, although Amazon.com made losses for many years after listing, if you had bought and held the shares since 1999, you would have made a fortune. But the harsh reality is that very many loss making companies burn through all their cash and go bankrupt.
Given this risk, we thought we'd take a look at whether Iron Road (ASX:IRD) shareholders should be worried about its cash burn. In this article, we define cash burn as its annual (negative) free cash flow, which is the amount of money a company spends each year to fund its growth. We'll start by comparing its cash burn with its cash reserves in order to calculate its cash runway.
View our latest analysis for Iron Road
How Long Is Iron Road's Cash Runway?
You can calculate a company's cash runway by dividing the amount of cash it has by the rate at which it is spending that cash. In June 2021, Iron Road had AU$4.8m in cash, and was debt-free. In the last year, its cash burn was AU$3.3m. Therefore, from June 2021 it had roughly 18 months of cash runway. That's not too bad, but it's fair to say the end of the cash runway is in sight, unless cash burn reduces drastically. Depicted below, you can see how its cash holdings have changed over time.

How Is Iron Road's Cash Burn Changing Over Time?
Although Iron Road reported revenue of AU$50k last year, it didn't actually have any revenue from operations. That means we consider it a pre-revenue business, and we will focus our growth analysis on cash burn, for now. Over the last year its cash burn actually increased by 39%, which suggests that management are increasing investment in future growth, but not too quickly. That's not necessarily a bad thing, but investors should be mindful of the fact that will shorten the cash runway. Iron Road makes us a little nervous due to its lack of substantial operating revenue. We prefer most of the stocks on this list of stocks that analysts expect to grow.
How Easily Can Iron Road Raise Cash?
While Iron Road does have a solid cash runway, its cash burn trajectory may have some shareholders thinking ahead to when the company may need to raise more cash. Companies can raise capital through either debt or equity. One of the main advantages held by publicly listed companies is that they can sell shares to investors to raise cash and fund growth. We can compare a company's cash burn to its market capitalisation to get a sense for how many new shares a company would have to issue to fund one year's operations.
Since it has a market capitalisation of AU$139m, Iron Road's AU$3.3m in cash burn equates to about 2.3% of its market value. So it could almost certainly just borrow a little to fund another year's growth, or else easily raise the cash by issuing a few shares.
Is Iron Road's Cash Burn A Worry?
Even though its increasing cash burn makes us a little nervous, we are compelled to mention that we thought Iron Road's cash burn relative to its market cap was relatively promising. While we're the kind of investors who are always a bit concerned about the risks involved with cash burning companies, the metrics we have discussed in this article leave us relatively comfortable about Iron Road's situation. On another note, Iron Road has 3 warning signs (and 1 which is significant) we think you should know about.
If you would prefer to check out another company with better fundamentals, then do not miss this free list of interesting companies, that have HIGH return on equity and low debt or this list of stocks which are all forecast to grow.
This article by Simply Wall St is general in nature. We provide commentary based on historical data and analyst forecasts only using an unbiased methodology and our articles are not intended to be financial advice. It does not constitute a recommendation to buy or sell any stock, and does not take account of your objectives, or your financial situation. We aim to bring you long-term focused analysis driven by fundamental data. Note that our analysis may not factor in the latest price-sensitive company announcements or qualitative material. Simply Wall St has no position in any stocks mentioned.
Have feedback on this article? Concerned about the content? Get in touch with us directly. Alternatively, email editorial-team (at) simplywallst.com.
Looking at Astro Resources NL's (ASX:ARO ) insider transactions over the last year, we can see that insiders were net buyers. That is, there were more number of shares purchased by insiders than there were sold.
While insider transactions are not the most important thing when it comes to long-term investing, logic dictates you should pay some attention to whether insiders are buying or selling shares.
Check out our latest analysis for Astro Resources
The Last 12 Months Of Insider Transactions At Astro Resources
In the last twelve months, the biggest single purchase by an insider was when Non-Executive Chairman Jacob Khouri bought AU$103k worth of shares at a price of AU$0.0052 per share. That means that even when the share price was higher than AU$0.005 (the recent price), an insider wanted to purchase shares. While their view may have changed since the purchase was made, this does at least suggest they have had confidence in the company's future. We always take careful note of the price insiders pay when purchasing shares. As a general rule, we feel more positive about a stock when an insider has bought shares at above current prices, because that suggests they viewed the stock as good value, even at a higher price. Jacob Khouri was the only individual insider to buy during the last year.
You can see the insider transactions (by companies and individuals) over the last year depicted in the chart below. If you want to know exactly who sold, for how much, and when, simply click on the graph below!

There are plenty of other companies that have insiders buying up shares. You probably do not want to miss this free list of growing companies that insiders are buying.
Does Astro Resources Boast High Insider Ownership?
Looking at the total insider shareholdings in a company can help to inform your view of whether they are well aligned with common shareholders. A high insider ownership often makes company leadership more mindful of shareholder interests. It appears that Astro Resources insiders own 33% of the company, worth about AU$6.3m. This level of insider ownership is good but just short of being particularly stand-out. It certainly does suggest a reasonable degree of alignment.
So What Do The Astro Resources Insider Transactions Indicate?
There haven't been any insider transactions in the last three months — that doesn't mean much. But insiders have shown more of an appetite for the stock, over the last year. Insiders do have a stake in Astro Resources and their transactions don't cause us concern. So these insider transactions can help us build a thesis about the stock, but it's also worthwhile knowing the risks facing this company. To help with this, we've discovered 4 warning signs (3 are a bit unpleasant!) that you ought to be aware of before buying any shares in Astro Resources.
Of course, you might find a fantastic investment by looking elsewhere. So take a peek at this free list of interesting companies.
For the purposes of this article, insiders are those individuals who report their transactions to the relevant regulatory body. We currently account for open market transactions and private dispositions, but not derivative transactions.
This article by Simply Wall St is general in nature. We provide commentary based on historical data and analyst forecasts only using an unbiased methodology and our articles are not intended to be financial advice. It does not constitute a recommendation to buy or sell any stock, and does not take account of your objectives, or your financial situation. We aim to bring you long-term focused analysis driven by fundamental data. Note that our analysis may not factor in the latest price-sensitive company announcements or qualitative material. Simply Wall St has no position in any stocks mentioned.
Have feedback on this article? Concerned about the content? Get in touch with us directly. Alternatively, email editorial-team (at) simplywallst.com.
MELBOURNE, October 02, 2021–(BUSINESS WIRE)–Rio Tinto is supporting iron ore rail car manufacturing in Western Australia with a commitment to use local suppliers to build ore rail cars for its Pilbara mining operations.
A tender will soon be released to the local market for an initial purchase of 50 ore rail cars, followed by an ongoing commitment of 10 ore cars a year for the next five years.
The tender will be released through the Rio Tinto Buy Local portal, a resource dedicated to making local suppliers aware of opportunities to partner with Rio Tinto and be part of our supply chain.
Western Australia has been an important part of Rio Tinto’s history for more than 50 years as the company built a world-class iron ore business. In 2020, the company spent AUD$7.5 billion with more than 2,000 local businesses based in Western Australia.
Rio Tinto is also part of the WA Government’s iron ore rail car action group, launched as part of the WA Recovery Plan to develop a competitive iron ore rail car manufacturing industry in Western Australia.
Rio Tinto’s commitment to bring ore rail car manufacturing back to WA supports the action group’s vision to develop WA’s ore rail car manufacturing capability and support the State’s economic recovery.
Rio Tinto Iron Ore chief executive Simon Trott said: "Building Rio Tinto’s ore rail cars here in WA will support local manufacturing and create jobs for West Australians.
"Rio Tinto is proud to lead the way in building iron ore rail cars in WA, in line with the vision of State Government’s iron ore rail car action group.
"I look forward to partnering with local businesses to support and grow the local manufacturing industry in WA.
"Ore cars are a critical part of our mining operations and building capacity to manufacture ore cars locally in WA will deliver significant benefits for Rio Tinto and the WA economy."
Premier Mark McGowan said: "This is a pleasing outcome and I commend Rio Tinto for taking the first step and committing to our local steel manufacturing industry which will support more jobs for Western Australians.
"Rio Tinto’s commitment is a positive result off the back of the State Government’s independent pre-feasibility study, which identified initiatives for the manufacture, refurbishment and maintenance of iron ore railcar wagons.
"This was about securing an ongoing pipeline of work for the long term manufacture of iron ore wagons and critical rail wagon parts, which will deliver jobs and economic benefit for the State into the future.
"Rio Tinto’s purchase of Western Australian made railcars that will be used right here in our State is something I encourage other iron ore companies operating in WA to get on board with and increase local content and local jobs."
riotinto.com
View source version on businesswire.com: https://www.businesswire.com/news/home/20211002005001/en/
Contacts
Please direct all enquiries to Media.enquiries@riotinto.com
Media Relations, Australia
Jonathan Rose
M +61 447 028 913
Matt Chambers
M +61 433 525 739
Jesse Riseborough
M +61 436 653 412
Jamie Macdonald
M +61 467 725 51
Rio Tinto plc
6 St James’s Square
London SW1Y 4AD
United Kingdom
T +44 20 7781 2000
Registered in England
No. 719885
Rio Tinto Limited
Level 7, 360 Collins Street
Melbourne 3000
Australia
T +61 3 9283 3333
Registered in Australia
ABN 96 004 458 404
Category: Pilbara
(Bloomberg) — The global energy crisis is intensifying, hammering the shares of companies that consume a lot of power and sending the stocks of those that produce it soaring.
Most Read from Bloomberg
-
An Unapologetic Old Boys’ Network Is Costing Australia Billions
-
Christmas at Risk as Supply Chain ‘Disaster’ Only Gets Worse
Economic recovery from the pandemic has boosted demand for gas and coal but their supplies have not been able to keep up. With the northern hemisphere winter on the horizon and China — the world’s biggest electricity user — ordering state-owned energy firms to secure supplies at all costs, investors are in a race to pick the winners and losers.
A key measure of international energy producers, led by names including Cabot Oil & Gas Corp. and ConocoPhillips, has rallied almost 10% over the past month. Utilities stocks have gone into reverse, wiping out this year’s gains, with materials companies joining them among the biggest laggards on the MSCI World Index.
“The energy crisis can exist for the next several years. I think a super cycle in energy has started and will continue for several years,” said Sumeet Rohra, a fund manager at Smartsun Capital Pte. in Singapore. “Energy stocks are very well poised to generate big returns.”
China’s factory sector contracted in September for the first time since the pandemic began, thanks to power cuts that have affected regions making up more than two-thirds of the nation’s gross domestic product. The energy crunch has also reportedly halted production at suppliers of global tech giants such as Apple Inc. and Tesla Inc.
Meanwhile, European inventories of natural gas are running low as economies come out of the pandemic lockdown and the White House has expressed concern about the jump in oil prices.
Here is a guide to how the crisis is playing out in equities market:
Energy Producers
Companies that produce gas, oil and coal are set to continue benefiting as winter approaches and demand rises.
Royal Dutch Shell Plc, TotalEnergies SE, Eni SpA, and BP Plc are among big European names that may rally further. In Asia, traders have their eyes on companies including Woodside Petroleum Ltd., Petronas Gas Bhd., Inpex Corp., Oil and Natural Gas Corp. and Reliance Industries Ltd.
“It is not just about a short term supply-demand imbalance,” said Gary Dugan, chief executive officer of the Global CIO Office. “The energy crunch is very concerning as it leads to the worst case scenario for markets — that of stagflation,” he said, referring to a situation in which economic growth stalls while inflation and unemployment rise.
If the current tightness in the gas market endures into next year, then Total could see 2022 earnings boosted by 18% and Eni by 12%, Goldman Sachs Group Inc. analysts including Lilia Peytavin wrote in a note last week.
Bloomberg Intelligence analyst Talon Custer said U.S. exporters of liquefied natural gas, such as Cheniere Energy Inc. and Sempra Energy, appear well positioned in an LNG market that should stay extremely tight through the winter.
Exxon Mobil Corp. said on Sept. 30 that elevated gas prices will boost its third quarter profit by about $700 million.
A three-year-high in oil prices also helps Exxon, and should keep others such as Schlumberger Ltd., ConocoPhillips and Halliburton Co. on the radar of traders.
In contrast, gas distributors such as China Gas Holdings Ltd., Hong Kong and China Gas Co., Kunlun Energy Co, and Indraprastha Gas Ltd. may face margin pressure if they are not allowed to pass on rising input costs.
Amid surging prices of coal, key stocks to watch are Arch Resources Inc. and Peabody Energy Corp. in the U.S., Glencore Plc. in Europe, and China Shenhua Energy Co., China Coal Energy Co., Adaro Energy Tbk, Whitehaven Coal Ltd. as well as Coal India Ltd. in Asia.
Materials & Metals
While rising power prices hurt all users, it is particularly acute for energy-intensive materials and metal companies.
In Asia, these stocks include Aluminum Corporation of China Ltd., Baoshan Iron & Steel Co., Angang Steel Co., China National Chemical Engineering Co. and Zhejiang Longsheng Group Co.
European construction material maker Sika AG also fits the mold, as does steelmaker ArcelorMittal and cement producer Holcim Ltd. In the U.S., steel producer Nucor Corp. and paint maker Sherwin-Williams Co. may be focus.
Bank of America Corp. analysts see input-cost headwinds for Indian cement makers such as UltraTech Cement, Shree Cement Ltd. and companies in the paint sector.
Power Utilities
Many government-backed electricity providers are likely to face margin pressure while those that are less regulated or independent have a better chance profiting from higher electricity prices.
Barclays Plc.’s analysts including Peter Crampton expect further strength in power prices to create winners in less heavily regulated northern Europe. They identified Electricite de France, Engie SA, Fortum Oyj and RWE AG. The analysts expect significant earnings-per-share upgrades, particularly for EDF, and raised their 2021 and 2022 estimates by 82% and 61%, respectively.
The most visible signs of stock market distress so far have been in southern Europe’s heavily regulated utilities. Iberdrola SA and Endesa SA shares are both trading at their lowest levels in more than last year.
In Asia, potential losers include Korea Electric Power Co., Tokyo Electric Power Co. and India’s NTPC Ltd. In the U.S., companies such as Southern Co., American Electric Power Co. and Duke Energy Corp. could face pressure.
Green Stocks
Higher energy prices and efforts to cut carbon emissions are also flowing through into the share prices of renewable power and nuclear stocks.
Bloomberg Intelligence’s Laurent Douillet sees large nuclear and hydro electricity companies as potential winners over those that rely on gas and coal.
READ: China’s Energy Crunch Sends Coal Shares Up, Renewable Firms Down
Key stocks to monitor are Europe’s Scatec ASA, Azelio AB and Orsted A/S, North America’s First Solar Inc. and SolarEdge Technologies Inc., and Asia’s LONGi Green Energy Co., Trina Solar Co., Sungrow Power Supply Co. and Adani Green Energy Ltd.
“There hasn’t been a confluence of so many factors happening at the same time in energy and commodity markets since at least the 1980s,” said Robert Ryan, chief commodity and energy strategist at BCA Research.
Most Read from Bloomberg Businessweek
©2021 Bloomberg L.P.
Vancouver, British Columbia–(Newsfile Corp. – October 1, 2021) – EMX Royalty Corporation (NYSE American: EMX) (TSXV: EMX) (FSE: 6E9) (the "Company", or "EMX") is pleased to announce that it intends to carry out a private placement of up to 5,000,000 units at C$ 3.30 each for gross proceeds of up to C$ 16,500,000. Members of the Sprott Group have agreed to act as finders in connection with the sale of some of the units.
The units will consist of one common share of the Company and one-half of one transferable warrant. Each whole warrant will entitle the purchase for two years of one common share at C$ 4.00 in the first year and C$ 4.50 in the second year.
Eligible finders will be paid a 6.0% cash commission and issued that number of non-transferable compensation warrants equal to 6.0% of the number of units sold to investors introduced by them. Each compensation warrant will entitle the purchase for one year of one common share of the Company for C$ 3.50.
The placement is subject to stock exchange approval.
This news release does not constitute an offer to sell or a solicitation of an offer to buy any of the securities in the United States. The securities have not been and will not be registered under the United States Securities Act of 1933, as amended (the "1933 Act"), or any U.S. state securities laws and may not be offered or sold within the "United States" or to "U.S. Persons" (as such terms are defined in Regulation S under the 1933 Act) unless registered under the 1933 Act and applicable U.S. state securities laws, or an exemption from such registration is available.
About EMX. EMX is a precious, base and battery metals royalty company. EMX's investors are provided with discovery, development, and commodity price optionality, while limiting exposure to risks inherent to operating companies. The Company's common shares are listed on the NYSE American Exchange and TSX Venture Exchange under the symbol EMX, as well as on the Frankfurt exchange under the symbol "6E9". Please see www.EMXroyalty.com for more information.
For further information contact:
David M. Cole
President and Chief Executive Officer
Phone: (303) 979-6666
Dave@EMXroyalty.com
Scott Close
Director of Investor Relations
Phone: (303) 973-8585
SClose@EMXroyalty.com
Isabel Belger
Investor Relations (Europe)
Phone: +49 178 4909039
Ibelger@EMXroyalty.com
Neither the TSX-V nor its Regulation Services Provider (as that term is defined in policies of the TSX-V) accepts responsibility for the adequacy or accuracy of this release.
Forward-Looking Statements
This news release may contain "forward-looking statements" that reflect the Company's current expectations and projections about its future results. These forward-looking statements may include statements regarding completion of the transaction, perceived merits of properties, exploration results and budgets, mineral reserves and resource estimates, work programs, capital expenditures, timelines, strategic plans, market prices for precious and base metal, or other statements that are not statements of fact. When used in this news release, words such as "estimate," "intend," "expect," "anticipate," "will", "believe", "potential", "upside" and similar expressions are intended to identify forward-looking statements, which, by their very nature, are not guarantees of the Company's future operational or financial performance, and are subject to risks and uncertainties and other factors that could cause the Company's actual results, performance, prospects or opportunities to differ materially from those expressed in, or implied by, these forward-looking statements. These risks, uncertainties and factors may include, but are not limited to: unavailability of financing, failure to identify commercially viable mineral reserves, fluctuations in the market valuation for commodities, difficulties in obtaining required approvals for the development of a mineral project, increased regulatory compliance costs, expectations of project funding by joint venture partners and other factors. It is possible EMX may not complete the transaction, as a result of failure to fulfill conditions of closing, unavailability of financing or for other reasons EMX cannot anticipate at this time.
Readers are cautioned not to place undue reliance on these forward-looking statements, which speak only as of the date of this news release or as of the date otherwise specifically indicated herein. Due to risks and uncertainties, including the risks and uncertainties identified in this news release, and other risk factors and forward-looking statements listed in the Company's MD&A for the quarter ended June 30, 2021 and the year ended December 31, 2020 (the "MD&A"), and the most recently filed Revised Annual Information Form (the "AIF") for the year ended December 31, 2020, actual events may differ materially from current expectations. More information about the Company, including the MD&A, the AIF and financial statements of the Company, is available on SEDAR at www.sedar.com and on the SEC's EDGAR website at www.sec.gov.
Not for distribution to United States newswire services or for dissemination in the United States.

To view the source version of this press release, please visit https://www.newsfilecorp.com/release/98219
VANCOUVER, BC / ACCESSWIRE / October 1, 2021 / CMC Metals Ltd. (TSXV:CMB)(FSE:ZM5N)(OTC PINK:CMCZF); (the "Company") is pleased to announce that it has adopted an advance notice policy (the "Advance Notice Policy"), establishing a framework for advance notice of nominations of directors by shareholders of the Company.
The Advance Notice Policy, among other things, seeks to fix a deadline by which holders of record of common shares of the Company must submit director nominations to the Company prior to any annual or certain special meetings of shareholders and sets forth the information required to be provided by a nominee director that a shareholder must include in the notice to the Company for the notice to be in proper written form.
The Advance Notice Policy is intended to, among other things: (i) facilitate an orderly and efficient Annual General or Special Meeting process; (ii) ensure that shareholders receive adequate notice of director nominations and sufficient information regarding all director nominations; and (iii) allow shareholders to cast an informed vote after having been afforded reasonable time for consideration.
The following notice requirements will apply for all Annual General or Special Meetings of shareholders of the Company:
-
In the case of an annual meeting of shareholders, notice of a director nomination must be given to the Company not less than 30 nor more than 65 days prior to the date of the annual meeting of shareholders; provided, however, that in the event that the annual meeting of shareholders is called for a date that is less than 50 days after the date (the "Notice Date") on which the first public announcement of the date of the annual meeting was made, notice by the nominating shareholder may be made not later than the tenth (10th) day following the Notice Date.
-
In the case of a special meeting of shareholders (which is not also an annual meeting) called for the purpose of electing directors (whether or not called for other purposes), notice of a director nomination must be given to the Company no later than the fifteenth (15th) day following the day on which the first public announcement of the date of the special meeting of shareholders was made.
-
The Advance Notice Policy is effective immediately and will be placed before shareholders for ratification and approval at the Company's next annual general and special meeting of shareholders (scheduled for December 7, 2021). In the event that shareholders determine not to ratify the Advance Notice Policy by ordinary resolution, the Advance Notice Policy shall terminate and be void and of no further force and effect following the termination of the Meeting.
A copy of the Advance Notice Policy, in its entirety, is available under the Company's profile at www.sedar.com and included in www.cmcmetals.ca.
About CMC Metals.
CMC Metals Ltd. is a growth stage mineral exploration company focused on opportunities in Yukon, British Columbia and Newfoundland. Our silver-lead-zinc projects include Silver Hart, Blue Heaven and the Rancheria South Properties (Rancheria South, Silverknife and Amy). Our polymetallic projects with gold potential include Logjam, Bridal Veil and Terra Nova.
On behalf of the Board:
John Bossio
John Bossio,
Chairman CMC METALS LTD.
For Further Information and Investor Inquiries:
Kevin Brewer, P. Geo., MBA, B.Sc Hons, Dip. Eng
President, CEO and Director
Tel: (604) 670 0019
kbrewer80@hotmail.com
Suite 110-175 Victory Ship Way
North Vancouver, BC
V7L 0B2
To be added to CMC's news distribution list, please send an email to info@cmcmetals.ca. Also please visit our website at www.cmcmetals.ca for more up-to-date news and information on our projects.
Neither the TSX Venture Exchange nor its Regulation Services Provider (as that term is defined in the policies of the TSX Venture Exchange) accepts responsibility for the adequacy or accuracy of this release.
"This news release may contain certain statements that constitute "forward-looking information" within the meaning of applicable securities law, including without limitation, statements that address the timing and content of upcoming work programs, geological interpretations, receipt of property titles and exploitation activities and developments. In this release disclosure regarding the potential to undertake future work comprise forward looking statements. Forward-looking statements address future events and conditions and are necessarily based upon a number of estimates and assumptions. While such estimates and assumptions are considered reasonable by the management of the Company, they are inherently subject to significant business, economic, competitive and regulatory uncertainties and risks, including the ability of the Company to raise the funds necessary to fund its projects and, accordingly, may not occur as described herein or at all. Actual results may differ materially from those currently anticipated in such statements. Factors that could cause actual results to differ materially from those in forward looking statements include market prices, exploitation and exploration successes, the timing and receipt of government and regulatory approvals, and continued availability of capital and financing and general economic, market or business conditions. Readers are referred to the Company's filings with the Canadian securities regulators for information on these and other risk factors, available at www.sedar.com. Investors are cautioned that forward-looking statements are not guarantees of future performance or events and, accordingly are cautioned not to put undue reliance on forward-looking statements due to the inherent uncertainty of such statements. The forward-looking statements included in this news release are made as of the date hereof and the Company disclaims any intention or obligation to update or revise any forward-looking statements, whether as a result of new information, future events or otherwise, except as expressly required by applicable securities legislation."
SOURCE: CMC Metals Ltd.
View source version on accesswire.com:
https://www.accesswire.com/666369/CMC-Metals-Ltd-Adopts-Advanced-Notice-Policy
NOT FOR DISTRIBUTION IN OR INTO OR TO ANY PERSON LOCATED OR RESIDENT IN AUSTRALIA, JAPAN, SOUTH AFRICA OR ANY OTHER JURISDICTION OR TO ANY PERSON LOCATED OR RESIDENT IN ANY JURISDICTION IN WHICH SUCH DISTRIBUTION IS UNLAWFUL
ENDEAVOUR ANNOUNCES OFFERING OF $500 MILLION SENIOR NOTES DUE 2026
London, 1 October 2021 – Endeavour Mining plc (LSE:EDV, TSX:EDV, OTCQX:EDVMF) (the “Company”, together with its subsidiaries, the “Group”) announces the launch of an offering of fixed rate senior notes due 2026 (the “Notes”) as well as the entry into a new revolving credit facility.
The proceeds of the Notes will be used (i) to repay all amounts outstanding under the Group’s $370 million bridge term loan facility, which was used to retire higher cost debt facilities acquired upon the acquisition of Teranga Gold Corporation (the “Bridge Facility”), (ii) to repay the $130 million drawn under the Group’s existing revolving credit facility (the “Existing RCF”), and (iii) to pay fees and expenses in connection with the offering of the Notes.
The Company has entered into a $500 million revolving credit facility (with a 4-year tenor, which may increase in accordance with its terms up to an aggregate amount of $650 million) with borrowing availability in US dollars for the general corporate purposes of the Company and certain of its subsidiaries. This new revolving credit facility will replace the Bridge Facility and the Existing RCF, which will be cancelled upon completion of any Notes offering.
Effectiveness of the new revolving credit facility is conditioned upon the closing of any Notes offering.
ABOUT ENDEAVOUR MINING PLC
Endeavour is one of the world’s senior gold producers and the largest in West Africa, with operating assets across Senegal, Cote d’Ivoire and Burkina Faso and a strong portfolio of advanced development projects and exploration assets in the highly prospective Birimian Greenstone Belt across West Africa.
A member of the World Gold Council, Endeavour is committed to the principles of responsible mining and delivering sustainable value to its employees, stakeholders and the communities where it operates. Endeavour is listed on the London Stock Exchange and the Toronto Stock Exchange, under the symbol EDV.
For more information, please visit www.endeavourmining.com.
Neither the Toronto Stock Exchange nor the Investment Industry Regulatory Organization of Canada accepts responsibility for the adequacy or accuracy of this press release.
IMPORTANT INFORMATION
This announcement is for informational purposes only and does not constitute an offer to sell or the solicitation of an offer to buy the Notes or the guarantees thereof (the “Guarantees”), nor shall it constitute an offer, solicitation or sale in any jurisdiction in which, or to any person to whom, such offer, solicitation or sale would be unlawful. The Notes and the Guarantees have not been and will not be registered under the U.S. Securities Act of 1933 or the securities laws of any other jurisdiction. Securities may not be offered in the United States absent registration or an exemption from registration. No action has been or will be taken in any jurisdiction in relation to the Notes or the Guarantees to permit a public offering of securities. There is no assurance that any Notes offering will be completed or, if completed, as to the terms on which it is completed.
The Notes and the Guarantees are not intended to be offered, sold or otherwise made available to and should not be offered, sold or otherwise made available to any retail investor in the European Economic Area (“EEA”). For these purposes, a retail investor means a person who is one (or more) of: (i) a retail client as defined in point (11) of Article 4(1) of Directive 2014/65/EU (as amended, “MiFID II”) or (ii) a customer within the meaning of Directive 2016/97/EU, as amended (the “Insurance Distribution Directive”), where that customer would not qualify as a professional client as defined in point (10) of Article 4(1) of MiFID II. Consequently, no key information document required by Regulation (EU) No 1286/2014 (as amended, the “EU PRIIPs Regulation”) for offering or selling the Notes or the Guarantees or otherwise making them available to retail investors in the EEA has been prepared and therefore offering or selling the Notes or the Guarantees or otherwise making them available to any retail investor in the EEA may be unlawful under the EU PRIIPs Regulation.
The Notes and the Guarantees are not intended to be offered, sold or otherwise made available to and should not be offered, sold or otherwise made available to any retail investor in the United Kingdom (the “UK”). For these purposes, a retail investor means a person who is one (or more) of: (i) a retail client as defined in point (8) of Article 2 of Regulation (EU) 2017/565 as it forms part of domestic law in the UK by virtue of the European Union (Withdrawal) Act 2018, as amended (the “EUWA”) or (ii) a customer within the meaning of the provisions of the Financial Services and Markets Act 2000, as amended (the “FMSA”), and any rules or regulations made under the FSMA to implement the Insurance Distribution Directive, where that customer would not qualify as a professional client, as defined in point (8) of Article 2(1) of Regulation (EU) 600/2014 as it forms part of domestic law in the UK by virtue of the EUWA. Consequently, no key information document is required by Regulation (EU) 1286/2914 as it forms part of domestic law in the UK by virtue of the EUWA (the “UK PRIIPs Regulation”) for offering or selling the Notes or otherwise making them available to UK retail investors in the UK has been prepared and therefore offering or selling the notes or otherwise making them available to any UK retail investor in the UK may be unlawful under the UK PRIIPs Regulation.
MiFID II professionals / ECPs-only / No PRIIPs KID – Manufacturer target market (MiFID II product governance) is eligible counterparties and professional clients only (all distribution channels). No EU PRIIPs key information document (“KID”) has been prepared as not available to retail in the EEA.
UK MiFIR professionals / ECPs-only / No UK PRIIPs KID – Manufacturer target market (UK MiFIR product governance) is eligible counterparties and professional clients only (all distribution channels). No UK PRIIPs key information document (“KID”) has been prepared as not available to retail in the UK.
This announcement is being distributed to, and is directed at, only persons who (i) are outside the UK; (ii) are “qualified investors” within the meaning of Article 2 of Regulation (EU) 2017/1129 (the “Prospectus Regulation”) as it forms part of retained EU law in the UK as defined in the EUWA (iii) have professional experience in matters relating to investments falling within the definition of “investment professionals” in Article 19(5) of the Financial Services and Markets Act 2000 (Financial Promotion) Order 2005, as amended (the “Order”), or (iv) are persons who are high net worth bodies corporate, unincorporated associations and partnerships and the trustees of high value trusts, as described in Article 49(2)(a) to (d) of the Order or (iii) are persons to whom this communication may otherwise be lawfully communicated (all such persons together being referred to as “Relevant Persons”). The investments to which this announcement relates are available only to, and any invitation, offer or agreement to subscribe, purchase or otherwise acquire such investments will be available only to or will be engaged in only with, Relevant Persons. Any person who is not a relevant person should not act or rely on this announcement or any of its contents. Persons distributing this announcement must satisfy themselves that it is lawful to do so.
In any EEA Member State this communication is only addressed to and is only directed at “qualified investors” in that Member State within the meaning of Article 2(e) of the Prospectus Regulation.
The distribution of this announcement in certain jurisdictions may be restricted by law and therefore persons in such jurisdictions into which they are released, published or distributed, should inform themselves about, and observe, such restrictions. Any failure to comply with these restrictions may constitute a violation of the laws of any such jurisdiction.
CAUTIONARY NOTE REGARDING FORWARD-LOOKING INFORMATION
This announcement contains “forward-looking statements” within the meaning of applicable securities laws. All statements, other than statements of historical fact, are “forward-looking statements”, including but not limited to, statements with respect to the Group’s intentions with regards to any offering of the Notes and the Guarantees. Generally, these forward-looking statements can be identified by the use of forward-looking terminology such as “will”, “can”, “could”, “would” and similar expressions.
Forward-looking statements, while based on management’s reasonable estimates, projections and assumptions at the date the statements are made, are subject to risks and uncertainties that may cause actual results to be materially different from those expressed or implied by such forward-looking statement. Although the Company has attempted to identify important factors that could cause actual results to differ materially from those contained in forward-looking statements, there may be other factors that cause results not to be as anticipated, estimated or intended. There can be no assurance that such statements will prove to be accurate, as actual results and future events could differ materially from those anticipated in such statements. Accordingly, readers should not place undue reliance on forward-looking statements. Please refer to the Group’s most recent Annual Information Form filed under its profile at www.sedar.com for further information respecting the risks affecting Endeavour and its business.
These forward-looking statements speak only as of the date of this announcement. Except as required by applicable law and regulation, the Company does not undertake any obligation to update or revise any forward-looking statement, whether as a result of new information, future events or otherwise.
CONTACT INFORMATION
|
Endeavour Mining |
Brunswick Group LLP in London Vincic Advisors in Toronto |
Attachment

Here are five stocks added to the Zacks Rank #5 (Strong Sell) List today:
Kirby Corporation KEX operates domestic tank barges. The Zacks Consensus Estimate for its current year earnings has been revised 4.8% downward over the last 30 days.
BHP Group BBL engages in the natural resources business. The Zacks Consensus Estimate for its current year earnings has been revised 22.9% downward over the last 30 days.
AB Electrolux ELUXY manufactures and sells household appliances. The Zacks Consensus Estimate for its current year earnings has been revised 4.3% downward over the last 30 days.
TDK Corporation TTDKY manufactures and sells electronic components. The Zacks Consensus Estimate for its current year earnings has been revised 34.1% downward over the last 30 days.
Weichai Power Co., Ltd. WEICY manufactures and sells diesel engines, automobiles, and other major automobile components. The Zacks Consensus Estimate for its current year earnings has been revised 8.3% downward over the last 30 days.
View the entire Zacks Rank #5 List.
Want the latest recommendations from Zacks Investment Research? Today, you can download 7 Best Stocks for the Next 30 Days. Click to get this free report
Electrolux AB (ELUXY) : Free Stock Analysis Report
BHP Billiton PLC (BBL) : Free Stock Analysis Report
Weichai Power Co. (WEICY) : Free Stock Analysis Report
Kirby Corporation (KEX) : Free Stock Analysis Report
TDK Corp. (TTDKY) : Free Stock Analysis Report
To read this article on Zacks.com click here.
Zacks Investment Research
VANCOUVER, British Columbia, Oct. 01, 2021 (GLOBE NEWSWIRE) — Aton Resources Inc. (AAN: TSX-V) ("Aton" or the "Corporation") announces the following operations and corporate updates.
Operations Update
Aton signed a drilling contract with Energold Drilling Ltd. in June to complete a minimum of 4,250 metres of diamond drilling at the Corporation’s Abu Marawat Concession (see news release dated June 14, 2021). At the time of signing the contract it was expected that drilling would commence in September 2021. Due to export clearance and shipping delays caused by the COVID-19 pandemic, the scheduled delivery date of the drill rig to the port in Egypt is now October 9, 2021. As a result, Aton expects to commence drilling during the month of November 2021. A summary of the drill program is provided below.
The program will commence at Rodruin with 3,350 metres of drilling, with the objective of following up on the successful 2018 reverse circulation percussion drill program, as well as testing for the first time the high-grade veins sampled at surface on the North Ridge, which returned assays of up to 321 g/t Au (see news release dated February 6, 2018). Drilling will also further test and delineate the distribution of the near-surface oxide mineralisation identified on the South Ridge, which returned intercepts including 36m @ 12.47 g/t Au (see news release, dated October 1, 2018) and 20m @ 5.36 g/t Au (see news release, dated December 10, 2018). The program will also follow up on the deeper sulphide mineralisation which returned wide intersections including 61m @ 1.55 g/t Au, 8.9 g/t Ag and 0.86% Zn (see news release dated January 29, 2019).
The drilling program at Hamama will consist of 900 metres of drilling with the objective of delineating additional oxide and transitional resources at the Hamama East and Central areas, which have not been effectively drill tested to date. Channel sampling of surface trenches has indicated the potential for relatively high grade oxide mineralisation, and has returned intercepts including 84m @ 1.13 g/t Au, 49.7 g/t Ag and 7.29% Zn and 42.8m @ 1.28 g/t Au, 55.5 g/t Ag and 10.37% Zn (see news release dated May 3, 2018).
During the last six months the Corporation has completed all the necessary work required to commence the above noted drill program, including the acquisition of capital items, construction of a new camp at the Rodruin project, road construction and drill pad preparation.
Aton’s exploration team has also resumed field activities, continuing with the surface channel sampling program at Rodruin, and have also undertaken further sampling, mapping and ionic leach sampling at the Abu Gaharish prospect. Samples have been dispatched to the ALS Minerals for analysis, and results will be released when they become available.
Corporate Update
Due to other professional commitments, Mr. Bill Koutsouras has resigned from his position as Director and Interim CEO of the Corporation, effective immediately. Mr. Koutsouras will continue to be available to provide ongoing support to the Corporation in the future as an advisor.
Mr. Tonno Vahk will assume the role of Interim CEO, effective immediately and until such time as a permanent CEO is recruited by the Board of Directors. Mr. Vahk has been a director of Aton since 2017 and is a significant shareholder of the Corporation with his current shareholding (held indirectly in OU Hektik) representing 12.97% of the issued and outstanding shares of Aton.
|
About Aton Resources Inc. Aton Resources Inc. (AAN: TSX-V) is focused on its 100% owned Abu Marawat Concession (“Abu Marawat”), located in Egypt’s Arabian-Nubian Shield, approximately 200 km north of Centamin’s world-class Sukari gold mine. Aton has identified numerous gold and base metal exploration targets at Abu Marawat, including the Hamama deposit in the west, the Abu Marawat deposit in the northeast, and the advanced Rodruin exploration prospect in the south of the Concession. Two historic British gold mines are also located on the Concession at Sir Bakis and Semna. Aton has identified several distinct geological trends within Abu Marawat, which display potential for the development of a variety of styles of precious and base metal mineralisation. Abu Marawat is 447.7 km2 in size and is located in an area of excellent infrastructure; a four-lane highway, a 220kV power line, and a water pipeline are in close proximity, as are the international airports at Hurghada and Luxor. |
Qualified Person The technical information contained in this News Release was prepared by Javier Orduña BSc (hons), MSc, MCSM, DIC, MAIG, SEG(M), Exploration Manager of Aton Resources Inc. Mr. Orduña is a qualified person (QP) under National Instrument 43-101 Standards of Disclosure for Mineral Projects. For further information regarding Aton Resources Inc., please visit us at www.atonresources.com or contact: TONNO VAHK Interim CEO |
|
Note Regarding Forward-Looking Statements Some of the statements contained in this release are forward-looking statements. Since forward-looking statements address future events and conditions; by their very nature they involve inherent risks and uncertainties. Actual results in each case could differ materially from those currently anticipated in such statements. Neither TSX Venture Exchange nor its Regulation Services Provider (as that term is defined in policies of the TSX Venture Exchange) accepts responsibility for the adequacy or accuracy of this release. |
|

After a long slumber, bears have finally awakened. Their wrath is being felt across all risk assets, and we’re officially in the midst of the biggest correction in the S&P 500 for the year. Granted, we’re still only down 5% from the peak, but in as low a volatility environment as we’ve seen this year, that qualifies as the worst whack of 2021. And yet, despite the mayhem, I’m sharing three stocks to buy.
When the market backdrop gets as ugly as it is now, I get extremely selective on new trades. Only the best setups make the cut, and even then, I sometimes pass until the S&P 500 starts to show signs of bottoming.
Today’s trio all boast relative strength and uptrends that remain intact. What’s more, they all saw increasing momentum on the last advance, despite a sinking market.
InvestorPlace – Stock Market News, Stock Advice & Trading Tips
That’s the pitch. Here are the picks:
Let’s take a closer look at each chart to chronicle the recent muscle-flexing. Then, we’ll map out a path to profit.
Stocks to Buy: Cameco (CCJ)

Source: The thinkorswim® platform from TD Ameritrade
If you’re going to buy something while the sky is falling, it certainly helps if it doesn’t have a strong correlation to the stock market. Lately, shares of Canadian uranium producer, Cameco Corp, have been moving to the beat of their own drum. Sometimes CCJ stock moves with the S&P 500; sometimes it doesn’t. As a result of the mixed relationship, CCJ has a 10-week correlation to the market near zero.
This is the type of stock I’d be willing to buy in large part because further market weakness doesn’t automatically mean CCJ will suffer. But that’s not all. The price chart looks bullish. We just saw nearly a month of rising prices that took CCJ from $15 to $26. Volume surged, adding legitimacy to the move. And now, we have our first pullback. It’s been deep, yes, but we’re still above the rising 50-day moving average.
I like selling puts to bet CCJ will stay above $17 for the next month.
The Trade: Sell the November $17 naked put for 50 cents.
Uber Technologies (UBER)

Source: The thinkorswim® platform from TD Ameritrade
Three weeks ago, I wouldn’t have touched Uber with a 10-foot pole. But much has changed.
The primary reason for my about-face was the massive gap on Sept. 21 that single-handedly reversed the downtrend. Volume eclipsed 100 million shares, marking the highest volume session of the year. This wasn’t some retail-driven micro-rally but an institutional-led influx.
Given the strength of the ramp, I’m inclined to believe the new uptrend will have staying power. And that makes me a buyer of dips.
Over the past three days, UBER stock has retreated three sessions, ending with a doji on Thursday. This morning’s gap higher is confirming a new upswing is beginning. I would build a directional play in a healthier environment, but to respect the broader market correction, we’re taking the higher probability route with a naked put play.
If you think UBER can stay above $37.50 for the next month, enter the following play.
The Trade: Sell the November $37.50 puts for 50 cents.
Stocks to Buy: Marathon Oil (MRO)

If there’s one sector that has shone brightest during the recent drama, it’s energy. And that makes it an obvious place to look for stocks to buy.
You can thank the strength in crude oil for the sector’s spunk. Oil prices are back to testing major resistance near $75 and haven’t budged in recent days, despite the thrashing suffered by equities.
There are a lot of good-looking energy stocks right now, but I’d suggest taking a good look at Marathon Oil. Its share price is flirting with a major breakout over $14. This zone has provided stiff resistance for the past five months. Once we take it out, I suspect buyers will come running.
Additionally, the cheap price tag of MRO stock makes it a great candidate for selling puts. The margin requirement is low, and the potential return is juicy.
The Trade: Sell the November $12 naked put for 36 cents.
On the date of publication, Tyler Craig did not have (either directly or indirectly) any positions in the securities mentioned in this article. The opinions expressed in this article are those of the writer, subject to the InvestorPlace.com Publishing Guidelines.
For a free trial to the best trading community on the planet and Tyler’s current home, click here!
More From InvestorPlace
The post 3 Stocks to Buy Despite the Market Mayhem appeared first on InvestorPlace.
Just because a business does not make any money, does not mean that the stock will go down. For example, although Amazon.com made losses for many years after listing, if you had bought and held the shares since 1999, you would have made a fortune. But the harsh reality is that very many loss making companies burn through all their cash and go bankrupt.
So should Alliance Resources (ASX:AGS) shareholders be worried about its cash burn? For the purposes of this article, cash burn is the annual rate at which an unprofitable company spends cash to fund its growth; its negative free cash flow. We'll start by comparing its cash burn with its cash reserves in order to calculate its cash runway.
Check out our latest analysis for Alliance Resources
Does Alliance Resources Have A Long Cash Runway?
You can calculate a company's cash runway by dividing the amount of cash it has by the rate at which it is spending that cash. As at June 2021, Alliance Resources had cash of AU$3.3m and no debt. In the last year, its cash burn was AU$3.6m. That means it had a cash runway of around 11 months as of June 2021. That's quite a short cash runway, indicating the company must either reduce its annual cash burn or replenish its cash. You can see how its cash balance has changed over time in the image below.

How Is Alliance Resources' Cash Burn Changing Over Time?
In the last year, Alliance Resources did book revenue of AU$56k, but its revenue from operations was less, at just AU$6.0k. We don't think that's enough operating revenue for us to understand too much from revenue growth rates, since the company is growing off a low base. So we'll focus on the cash burn, today. It's possible that the 13% reduction in cash burn over the last year is evidence of management tightening their belts as cash reserves deplete. Admittedly, we're a bit cautious of Alliance Resources due to its lack of significant operating revenues. So we'd generally prefer stocks from this list of stocks that have analysts forecasting growth.
Can Alliance Resources Raise More Cash Easily?
While Alliance Resources is showing a solid reduction in its cash burn, it's still worth considering how easily it could raise more cash, even just to fuel faster growth. Companies can raise capital through either debt or equity. Many companies end up issuing new shares to fund future growth. By looking at a company's cash burn relative to its market capitalisation, we gain insight on how much shareholders would be diluted if the company needed to raise enough cash to cover another year's cash burn.
Since it has a market capitalisation of AU$34m, Alliance Resources' AU$3.6m in cash burn equates to about 10% of its market value. As a result, we'd venture that the company could raise more cash for growth without much trouble, albeit at the cost of some dilution.
Is Alliance Resources' Cash Burn A Worry?
On this analysis of Alliance Resources' cash burn, we think its cash burn relative to its market cap was reassuring, while its cash runway has us a bit worried. We don't think its cash burn is particularly problematic, but after considering the range of factors in this article, we do think shareholders should be monitoring how it changes over time. On another note, Alliance Resources has 4 warning signs (and 2 which are concerning) we think you should know about.
Of course Alliance Resources may not be the best stock to buy. So you may wish to see this free collection of companies boasting high return on equity, or this list of stocks that insiders are buying.
This article by Simply Wall St is general in nature. We provide commentary based on historical data and analyst forecasts only using an unbiased methodology and our articles are not intended to be financial advice. It does not constitute a recommendation to buy or sell any stock, and does not take account of your objectives, or your financial situation. We aim to bring you long-term focused analysis driven by fundamental data. Note that our analysis may not factor in the latest price-sensitive company announcements or qualitative material. Simply Wall St has no position in any stocks mentioned.
Have feedback on this article? Concerned about the content? Get in touch with us directly. Alternatively, email editorial-team (at) simplywallst.com.
Vancouver, British Columbia–(Newsfile Corp. – October 1, 2021) – Thesis Gold Inc. (TSXV: TAU) (WKN: A2QQ0Y) ("Thesis" or the "Company") is pleased to announce the appointment of Dr. Thomas Mumford as a Director of the Company. In addition, Mr. Xiang has stepped down from the Board of Directors effective September 30, 2021 but will remain as an advisor to the Company.
Dr. Mumford is an exploration geologist with over 15 years experience. He has extensive technical and project management experience in Au, REE, Cu-porphyry, and U deposits. He is a registered professional geologist and professional engineering licensee with Engineers and Geoscientists British Columbia (EGBC), and currently acts as the Vice President, Exploration for Scottie Resources Corp. He is a director for the Association for Mineral Exploration (AME) and has served as a lecturer at Carleton University and British Columbia Institute of Technology. He holds a B.Sc. and M.Sc. from University of New Brunswick, and a Ph.D. from Carleton University which focused on magmatic controls of the Nechalacho REE deposit in the NWT.
"We would like to thank James for his contributions to Thesis over the past year and we look forward to continuing working with him in his new role as an advisor to the Company," Ewan Webster, President and CEO commented.
"I am delighted to welcome Thomas to the board. His extensive exploration experience will be invaluable to the Company as we continue to advance our Ranch Gold project."
The Company is also pleased to announce it has entered into a letter agreement (the "Letter Agreement") dated September 15, 2021 with Steven Scott, pursuant to which the Company acquired British Columbia mineral claim numbers 1074376, 1074335 and 1074333 (the "Acquisition") (Figure 1). The mineral claims are all British Columbia mineral claims that were originally staked and are owned by an arm's length third party, Mr. Scott (the "Vendor"). Under the terms of the Letter Agreement, the Company paid cash consideration the amount of $5,000 plus the cost of transferring the title of the mineral claims to the Company. No finder's fees were paid in connection with the Acquisition.
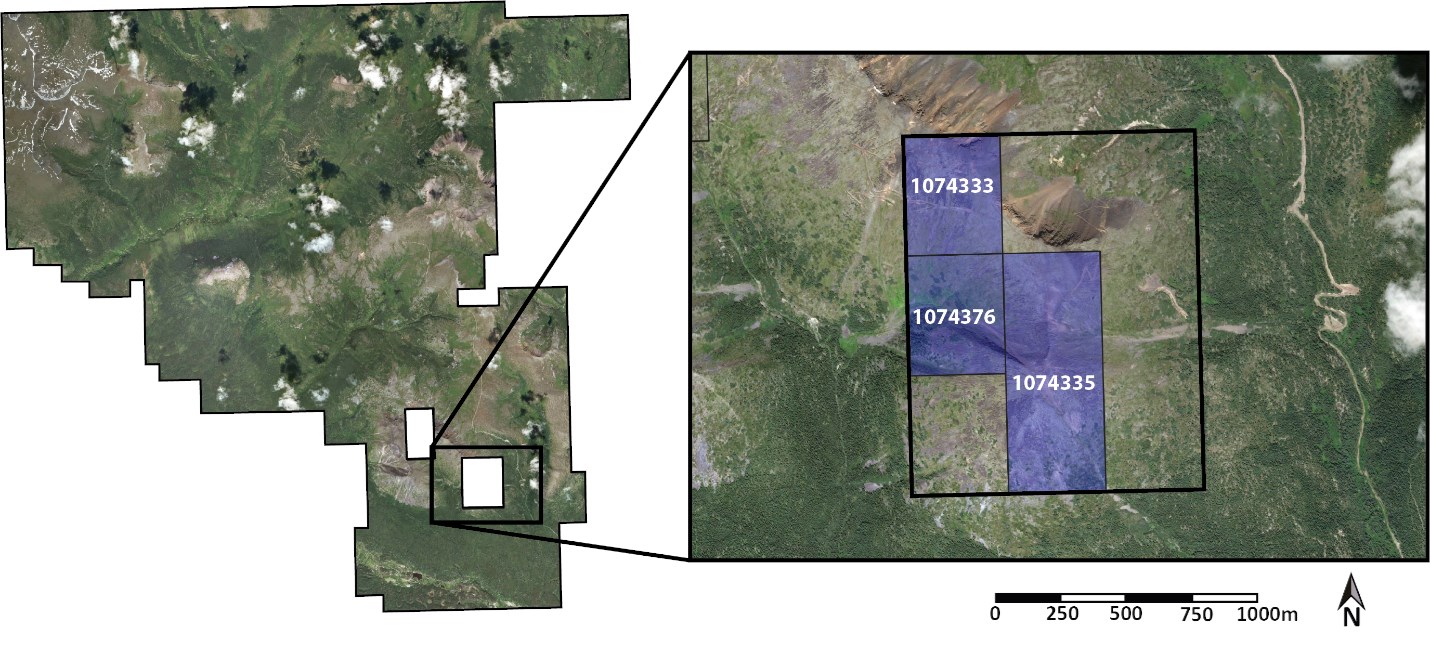
Figure 1: Ranch project outline and inset showing the acquired claims.
To view an enhanced version of Figure 1, please visit:
https://orders.newsfilecorp.com/files/2191/98200_e9261cc5e4b709a0_001full.jpg
On behalf of the Board of Directors
Thesis Gold Inc.
"Ewan Webster"
Ewan Webster Ph.D., P.Geo.
President, CEO and Director
About Thesis Gold Inc.
Thesis Gold is a mineral exploration company focused on proving and developing the resource potential of the 17,832-hectare Ranch Gold Project located in the "Golden Horseshoe" area of northern British Columbia, approximately 300 km north of Smithers, B.C. For further details about the Ranch Gold Project, please refer to the Company's current geological Technical Report dated September 18, 2020 available under the Company's profile on SEDAR at www.sedar.com.
For further information or investor relations inquiries, please contact:
Dave Burwell
Vice President
The Howard Group Inc.
Email: dave@howardgroupinc.com
Tel: 403-410-7907
Toll Free: 1-888-221-0915
Nick Stajduhar
Director
Thesis Gold
Telephone: 780-701-3216
Email: nicks@thesisgold.com
Neither the TSX Venture Exchange nor its Regulation Services Provider (as that term is defined in the policies of the TSX Venture Exchange) accepts responsibility for the adequacy or accuracy of this press release.
Cautionary Statement Regarding Forward-Looking Information
This press release contains "forward-looking information" within the meaning of applicable Canadian securities legislation. Forward-looking information includes, without limitation, statements regarding the use of proceeds from the Company's recently completed financings, and the future plans or prospects of the Company. Generally, forward-looking information can be identified by the use of forward-looking terminology such as "plans", "expects" or "does not expect", "is expected", "budget", "scheduled", "estimates", "forecasts", "intends", "anticipates" or "does not anticipate", or "believes", or variations of such words and phrases or state that certain actions, events or results "may", "could", "would", "might" or "will be taken", "occur" or "be achieved". Forward-looking statements are necessarily based upon a number of assumptions that, while considered reasonable by management, are inherently subject to business, market and economic risks, uncertainties and contingencies that may cause actual results, performance or achievements to be materially different from those expressed or implied by forward-looking statements. Although the Company has attempted to identify important factors that could cause actual results to differ materially from those contained in forward-looking information, there may be other factors that cause results not to be as anticipated, estimated or intended. There can be no assurance that such information will prove to be accurate, as actual results and future events could differ materially from those anticipated in such statements. Accordingly, readers should not place undue reliance on forward-looking information. Other factors which could materially affect such forward-looking information are described in the risk factors in the Company's most recent annual management's discussion and analysis which is available on the Company's profile on SEDAR at www.sedar.com. The Company does not undertake to update any forward-looking information, except in accordance with applicable securities laws.
To view the source version of this press release, please visit https://www.newsfilecorp.com/release/98200
DENVER, CO / ACCESSWIRE / October 1, 2021 / Gold Resource Corporation (NYSE American:GORO) (the "Company") will issue a news release providing a summary of its financial and operating results for the third quarter ended September 30, 2021 on Wednesday, October 27, 2021 after the market close, file its 10Q with the financial and operating results for the period ended September 30, 2021 with EDGAR and host a conference call on Thursday, October 28, 2021 at 11:00 a.m. Eastern Time.
The conference call will be recorded and posted to the Company's website later in the day following the conclusion of the call. Following prepared remarks, Allen Palmiere, President and Chief Executive Officer, Kim Perry, Chief Financial Officer and Alberto Reyes, Chief Operating Officer will host a live question and answer (Q&A) session. There are two ways to join the conference call.
To join the conference via webcast, please click on the following link:
https://www.webcaster4.com/Webcast/Page/2361/43124.
To join the call via telephone please use one of the following dial-in details:
Participant Toll Free: 888-506-0062
International: 973-528-0011
Entry Code: 552947
Please connect to the conference call at least 10 minutes prior to the start time using one of the connection options listed above.
About GRC:
Gold Resource Corporation is a gold and silver producer, developer, and explorer with its operations centered on the Don David Gold Mine in Oaxaca, Mexico. Under the direction of a new board and senior leadership, the Company focus is to unlock the significant upside potential of its existing infrastructure and large land position surrounding the mine, to close our acquisition of Aquila Resources Inc., and to develop the Back Forty Project in Michigan, USA. For more information, please visit GRC's website, located at www.goldresourcecorp.com and read the Company's 10-K for an understanding of the risk factors involved.
Contacts:
Ann Wilkinson
Vice President, Investor Relations and Corporate Affairs
Ann.Wilkinson@GRC-USA.com
www.GoldResourcecorp.com
SOURCE: Gold Resource Corporation
View source version on accesswire.com:
https://www.accesswire.com/666381/Gold-Resource-Corporation-to-Hold-Q3-2021-Conference-Call-on-October-28-2021
Like a puppy chasing its tail, some new investors often chase 'the next big thing', even if that means buying 'story stocks' without revenue, let alone profit. But as Warren Buffett has mused, 'If you've been playing poker for half an hour and you still don't know who the patsy is, you're the patsy.' When they buy such story stocks, investors are all too often the patsy.
If, on the other hand, you like companies that have revenue, and even earn profits, then you may well be interested in Anglo American (LON:AAL). Even if the shares are fully valued today, most capitalists would recognize its profits as the demonstration of steady value generation. In comparison, loss making companies act like a sponge for capital – but unlike such a sponge they do not always produce something when squeezed.
View our latest analysis for Anglo American
How Quickly Is Anglo American Increasing Earnings Per Share?
If a company can keep growing earnings per share (EPS) long enough, its share price will eventually follow. Therefore, there are plenty of investors who like to buy shares in companies that are growing EPS. It certainly is nice to see that Anglo American has managed to grow EPS by 32% per year over three years. As a general rule, we'd say that if a company can keep up that sort of growth, shareholders will be smiling.
I like to take a look at earnings before interest and (EBIT) tax margins, as well as revenue growth, to get another take on the quality of the company's growth. Anglo American shareholders can take confidence from the fact that EBIT margins are up from 18% to 36%, and revenue is growing. That's great to see, on both counts.
The chart below shows how the company's bottom and top lines have progressed over time. Click on the chart to see the exact numbers.

In investing, as in life, the future matters more than the past. So why not check out this free interactive visualization of Anglo American's forecast profits?
Are Anglo American Insiders Aligned With All Shareholders?
Like standing at the lookout, surveying the horizon at sunrise, insider buying, for some investors, sparks joy. This view is based on the possibility that stock purchases signal bullishness on behalf of the buyer. However, small purchases are not always indicative of conviction, and insiders don't always get it right.
It's good to see Anglo American insiders walking the walk, by spending US$153k on shares in just twelve months. And when you consider that there was no insider selling, you can understand why shareholders might believe that lady luck will grace this business. Zooming in, we can see that the biggest insider purchase was by James Rutherford for UK£144k worth of shares, at about UK£24.30 per share.
The good news, alongside the insider buying, for Anglo American bulls is that insiders (collectively) have a meaningful investment in the stock. Notably, they have an enormous stake in the company, worth US$92m. This suggests to me that leadership will be very mindful of shareholders' interests when making decisions!
Does Anglo American Deserve A Spot On Your Watchlist?
For growth investors like me, Anglo American's raw rate of earnings growth is a beacon in the night. On top of that, insiders own a significant stake in the company and have been buying more shares. So it's fair to say I think this stock may well deserve a spot on your watchlist. We should say that we've discovered 3 warning signs for Anglo American (1 is a bit concerning!) that you should be aware of before investing here.
As a growth investor I do like to see insider buying. But Anglo American isn't the only one. You can see a a free list of them here.
Please note the insider transactions discussed in this article refer to reportable transactions in the relevant jurisdiction.
This article by Simply Wall St is general in nature. We provide commentary based on historical data and analyst forecasts only using an unbiased methodology and our articles are not intended to be financial advice. It does not constitute a recommendation to buy or sell any stock, and does not take account of your objectives, or your financial situation. We aim to bring you long-term focused analysis driven by fundamental data. Note that our analysis may not factor in the latest price-sensitive company announcements or qualitative material. Simply Wall St has no position in any stocks mentioned.
Have feedback on this article? Concerned about the content? Get in touch with us directly. Alternatively, email editorial-team (at) simplywallst.com.
Mosaic cleared a short pause Friday, rallying to just below a record high. In a better market, MOS would have been clearly actionable on Friday. Perhaps the best time to buy MOS would have been Sept. 23, as it flashed multiple early buy signals. Other fertilizer makers look strong.
QUEBEC CITY, Oct. 01, 2021 (GLOBE NEWSWIRE) — Stelmine Canada (TSXV: STH) (“Stelmine” or the “Company) is pleased to announce that crews are now mobilizing for diamond drilling at the Company’s 100%-owned Courcy Property in northeastern Quebec to follow up on the discovery of near-surface high-grade gold in “Zone 1” where the last historical drill hole returned 42 metres grading 4.2 g/t Au including 105 g/t over 1.5 metres within a section of 12.3 g/t Au over 13.5 metres. The 42-metre discovery intercept (core interval) started just 12 metres downhole.
The 3,000-metre Phase 1 diamond drilling program at Courcy, scheduled to commence on or about October 5, 2021, will target gold-bearing zones at the core of a folded thrust fault exposing highly deformed and metamorphosed garnet and sulphide-rich iron formations and amphibolites at the hinge point of a broad antiform.
Gold mineralization observed in Zone 1 appears shallow dipping and is associated with a 21-km-long fault zone discovered by Stelmine geologists who followed up SOQUEM’s limited historical work carried out more than a decade ago. SOQUEM drilled just eight shallow holes at Courcy totalling less than 800 metres, all in “Zone 1”, and the last hole returned the very significant 42-metre intercept with the core data reviewed by Stelmine geologists. Over the last 3 years, extensive geological and structural mapping of the area by the Stelmine team has produced a robust geological model for Courcy.
High-Grade Gold 2.4 km South of Discovery Hole
Approximately 2.4 km south of SOQUEM’s 2006 discovery hole, historical channel sampling returned gold values as high as 167 g/t Au over 0.5 metre in one of several prospective zones already outlined at Courcy (“Zone 4”). Extensive exploration of this zone by Stelmine confirms the gold potential with the discovery of new showings.
Courcy lies at the under-explored eastern edge of the 600-km-long Opinaca metasedimentary basin that also hosts Newmont’s Eleonore mine on the western side of the James Bay Territory. Stelmine’s total land package in the Caniapiscau district (Courcy, Mercator plus three other properties) now encompasses more than 800 km2. These properties feature several geological similarities to Eleonore.
Corporate Presentation
Visit www.Stelmine.com for an updated Corporate Presentation, or click on the following link: https://temp.stelmine.com/Stelmine_CorporatePresentation.pdf
Courcy Video
Visit www.Stelmine.com for a video on Courcy featuring Dr. Normand Goulet, also a Stelmine director, or click on the following link: https://www.youtube.com/watch?v=MQWMrEhled8
Qualified Person
The technical information in this news release has been reviewed and approved by Michel Boily, P. Geo, PhD. Mr. Boily is the qualified person responsible for the scientific and technical information contained herein under National Instrument 43-101 standards.
About Stelmine Canada
Stelmine is a junior mining exploration company pioneering a new gold district (Caniapiscau) east of James Bay in the under-explored eastern part of the Opinaca metasedimentary basin where the geological context has similarities to the Eleonore mine. Stelmine has 100% ownership of 1,574 claims or 815 km2 in this part of northern Quebec, highlighted by the Courcy and Mercator Projects.
FORWARD LOOKING INFORMATION
Certain information in this press release may contain forward-looking statements, such as statements regarding the expected closing of and the anticipated use of the proceeds from the Offering, acquisition and expansion plans, availability of quality acquisition opportunities, and growth of the Company. This information is based on current expectations and assumptions (including assumptions in connection with obtaining all necessary approvals for the Offering and general economic and market conditions) that are subject to significant risks and uncertainties that are difficult to predict. Actual results might differ materially from results suggested in any forward-looking statements. Risks that could cause results to differ from those stated in the forward-looking statements in this release include those relating to the ability to complete the Offering on the terms described above. The Company assumes no obligation to update the forward-looking statements, or to update the reasons why actual results could differ from those reflected in the forward-looking statements unless and until required by securities laws applicable to the Company. Additional information identifying risks and uncertainties is contained in the Company’s filings with the Canadian securities regulators. The filings are available at www.sedar.com.
CAUTIONARY STATEMENT
Neither the TSX Venture Exchange nor its Regulation Services Provider (as that term is defined in the policies of the TSX Venture Exchange) accepts responsibility for the adequacy or accuracy of this release.
NOT FOR DISSEMINATION IN THE UNITED STATES OR FOR DISTRIBUTION TO U.S.
NEWSWIRE SERVICES AND DOES NOT CONSTITUTE AN OFFER OF THE SECURITIES DESCRIBED HEREIN
For further information, contact:
|
Isabelle Proulx, President and CEO |
Investor Relations: |
|
Email: iproulx@stelmine.com |
MarketSmart Communications Inc. |
|
Tel: 581-998-1222 |
Adrian Sydenham |
|
Toll-free: 1-877-261-4466 |
|
|
Email: info@marketsmart.ca |
Follow us on:
Website : https://temp.stelmine.com
Twitter : https://twitter.com/Stelmine1
LinkedIn : http://www.linkedin.com/company/stelmine-canada-ltd
Facebook: https://www.facebook.com/StelmineCanada/

Whether it’s a business deal, a job, a relationship or your favorite brand of toothpaste at the supermarket; nobody likes to just settle for something. It means we’re accepting less than the best… usually because it’s easy.
And when it comes to investing, it means we’re making less money than we could. If you want to invest in Growth AND Value… you should be able to do it! And Zacks can help.
We’ve got a screen that not only helps you find big growth rates and low valuations, but also adds the power of the Zacks Rank. This screen is ingeniously titled: Growth & Value Plus Zacks Rank #1. Below are three stocks that recently passed the test.
The Gap Inc. GPS
The name of the company may be The Gap Inc. (GPS), but the real powerhouse these days is Old Navy. And active women’s apparel brand Athleta is also starting to gain some traction. These two brands led to a strong fiscal second quarter performance in late August, which included a raised full-year outlook.
GPS is a premier international specialty retailer with more than 3,800 stores worldwide. It’s four segments are Gap Global, Old Navy Global, Banana Republic Global and Other (which includes the aforementioned Athleta brand). As part of the retail – apparel & shoes space, the company is in the Top 16% of the Zacks Industry Rank. Shares have climbed approximately 14% so far in 2021.
Earnings per share in its fiscal second quarter came to 70 cents, which trounced the Zacks Consensus Estimate by nearly 50%. Net sales of $4.2 billion inched past our expectation of $4.17 billion and jumped 29% year over year. Most impressively though, the result improved 5% over the same time in 2019, which was pre-covid.
Same-store sales were up 3% year over year and a solid 12% from two years ago.
Those annoying Old Navy commercials must really work, because net sales at that segment jumped 21% in the quarter with comps up 18% against 2019. Moving forward, Old Navy has big hopes for its inclusive shopping experience BODEQUALITY, which is part of its Power Plan 2023 for long-term sustainable growth.
Net sales at Athleta soared 35% with comps up 27% from 2019. GPS is also working to transform Banana Republic through various factors including product assortment. Sales were still down in the quarter, but improved from the first quarter 2021.
GPS has worked hard to better its marketing efforts, improve its brand management and enhance its technology. These factors paid off so much that the company raised its full-year outlook. It now expects adjusted EPS of between $2.10 and $2.25 with net sales growing about 30% versus 2020.
The Zacks Consensus Estimate for this fiscal year (ending January 2022) is now $2.21, which marks a 24.2% improvement over the past 60 days. Next fiscal year (ending January 2023) is now seen at $2.65, an advance of 20.5% over the same amount of time and suggests a year-over-year improvement of 20%.

Image Source: Zacks Investment Research
The Mosaic Company MOS
At a time of artificial intelligence, 5G, the Internet of Things, blockchain and dozens of other technologies; it seems weird that something like fertilizers could be considered “hot”. And yet, this space is in the top 6% of the Zacks Industry Rank, as agriculture trends are expected to be strong moving forward.
One of the biggest names in the space is The Mosaic Company (MOS), a leading producer and marketer of concentrated phosphate and potash crop nutrients. Shares are up over 60% so far this year, and the company expects the second half of 2021 to be one of its best periods in over a decade.
In the second quarter, MOS reported earnings per share of $1.17, which beat the Zacks Consensus Estimate by more than 15%. It was the fifth straight quarter with a positive surprise. The average beat over the past four quarters is just under 43%, but that’s skewed a bit by a triple digit surprise in the fourth quarter.
Net sales of $2.8 billion actually fell a little short of our expectations, but still jumped 37% year over year as stronger pricing offset the lower volumes. Net sales in Phosphates rose 54%, while sales in Potash advanced 19%. Volumes in both segments declined.
Looking forward, MOS sees a $90-$100 per ton improvement in average realized price in the Phosphates segment sequentially in the third quarter, while the Potash segment should have a $25-$35 per ton improvement.
The Zacks Consensus Estimate for this year is up to $4.86, which has surged 47.7% over the past two months. Expectations for next year are at $4.68, which suggests a year-over-year decline. However, analysts have raised their expectations by approximately 43% in 60 days, so there’s a lot of room for improvement before December 2022 rolls around.

Image Source: Zacks Investment Research
Best Buy BBY
It’s scary to think where this country would’ve been in this pandemic without technology. It allowed millions of people to work from home and students to learn from home during an unprecedented shutdown. We were able to stay in close contact with loved ones in quarantine. And technology provided gaming and streaming options to keep the family occupied so you can have just a few sweet moments of solitude before resuming your government-mandated house arrest with those lovely people.
Throughout all these circumstances, Best Buy (BBY) was there with the consumer electronics necessary to keep things going when Covid locked things up. The dependence on technology led to 14 straight quarters of positive surprises for the company, including a more than 56% beat in its recently reported fiscal second quarter.
BBY is part of the Retail – Consumer Electronics space, which means it’s in the top 13% of the Zacks Industry Rank. The company has been focused on developing its omni-channel capabilities, improving the supply chain and cost-containment efforts. It’s really been paying off!
Earnings per share reached $2.98 in its fiscal second quarter, which trounced the Zacks Consensus Estimate by more than $1.
Enterprise revenues jumped nearly 20% to $11.85 billion, compared to our expectation of $11.6 billion. Enterprise comp sales increased by the same percentage. Key drivers in the quarter were computing, mobile phones, home theater, appliances and services.
Best of all though, BBY expects continued customer demand and solid momentum. In fact, it now sees enterprise comparable sales increasing between 9% and 11% for fiscal 2022, compared to the previous outlook of 3% to 6%.
The Zacks Consensus Estimate for this fiscal year (ending January 2022) is up to $9.95, which has advanced 16.9% in just two months. The expectation for next year (ending January 2023) is only at $9.54, which is up 9.3% in two months but down year over year. However, there’s plenty of time for that to improve as consumers are unlikely to throw their computers, TVs and gaming systems away in the future.

Image Source: Zacks Investment Research
Want the latest recommendations from Zacks Investment Research? Today, you can download 7 Best Stocks for the Next 30 Days. Click to get this free report
Best Buy Co., Inc. (BBY) : Free Stock Analysis Report
The Gap, Inc. (GPS) : Free Stock Analysis Report
The Mosaic Company (MOS) : Free Stock Analysis Report
To read this article on Zacks.com click here.
Vancouver, British Columbia–(Newsfile Corp. – October 1, 2021) – Comstock Metals Ltd. (TSXV: CSL) ("Comstock" or the "Company") is pleased to announce that it is has closed previously disclosed proposed non-brokered private placement of units ("Units") and flow-through units ("FT Units") (see press release dated September 28, 2021) for aggregate gross proceeds of $388,900.
The Company issued an aggregate of 1,715,000 FT Units and 2,225,000 Units pursuant to the offerings. Each Unit was priced at $0.09 and consists of one common share in the capital of the Company (a "Share") and one common share purchase warrant (a "Warrant"). Each Warrant entitles the holder thereof to purchase one additional common share of the Company (a "Warrant Share") at an exercise price of $0.12 per Warrant Share for a period of 24 months from the closing of the offerings. Each FT Unit was priced at $0.11 and consists of one flow-through common share in the capital of the Company (a "FT Share") and one Warrant. The expiry date of the Warrants is subject to an acceleration provision that provides that if the closing price of the Company's common shares is equal to or greater than $0.24 for a period of 10 consecutive trading days, the Company has the right to accelerate the expiry date of the Warrants by giving written notice to the holders of the Warrants with the revised expiry date being 30 days from the date of the notice to the warrant holders. The acceleration of the Warrant expiry date may not be triggered prior to February 2, 2022.
The Company will use the gross proceeds of the offering of FT Units for eligible exploration expenditures, which will constitute "Canadian Exploration Expenses" ("CEE") that are "Flow-Through mining expenditures," as defined in the Income Tax Act (Canada) which can be renounced to purchasers of the FT Units for the 2021 taxation year in the aggregate amount of not less than the total amount of the gross proceeds raised from the flow-through offering. The CEE shall be incurred no later than December 31, 2022.
The proceeds from the offering of Units will be used to fund exploration on the Company's Preview SW gold deposit (with a focus on Comstock's Preview North zone) located in Saskatchewan, Canada and for general working capital.
The offerings were offered on a non-brokered private placement basis in certain provinces of Canada and such other jurisdictions as the Company may determine in its sole discretion and will be subject to a statutory hold period ending on February 2, 2022. The Company paid finder's fees totalling $13,398 and issued 125,300 broker warrants as compensation to a finder that assisted with the offerings. Each broker warrant entitles the holder thereof to acquire one common share at a price of $0.09 per share at any time on or before October 1, 2023.
The securities issued under the offerings have not been, and will not be, registered under the U.S. Securities Act or any U.S. state securities laws.
Pursuant to the offering, the Company issued securities to certain purchasers that are considered to be "related parties" (within the meaning of Multilateral Instrument 61-101 – Protection of Minority Security Holders in Special Transactions ("MI 61-101")), making the Offering a "related party transaction" (within the meaning of MI 61-101) (the "Related Party Subscriptions"). The Company was exempt from obtaining a formal valuation for, and minority approval of, the Related Party Subscriptions pursuant to Section 5.5(b) and 5.7(1)(a) of MI 61-101, respectively.
Steven H. Goldman's wife's company subscribed for a total of 1,000,000 Units pursuant to the offering. Mr. Goldman is an officer and director of the Company and a "related party" of the Company (within the meaning of MI 61-101). Mr. Goldman now beneficially owns, or exercises control or direction over, 3,006,626 common shares (or, approximately 10.27% of the issued and outstanding common shares or approximately 14.39% of the issued and outstanding common shares on a partially diluted basis) (including all options and warrants owned or controlled by Mr. Goldman).
Arnold Tenney's spouse subscribed for a total of 450,000 FT Units pursuant to the offering. Mr. Tenney is a director of the Company and a "related party" of the Company (within the meaning of MI 61-101). Mr. Tenney now beneficially owns, or exercises control or direction over, 871,666 common shares (or, approximately 3.0% of the issued and outstanding common shares or approximately 5.2% of the issued and outstanding common shares on a partially diluted basis) (including all options and warrants owned or controlled by Mr. Tenney).
The material change report to be filed in connection with the Private Placement will be filed less than 21 days prior to the closing of the offerings. The shorter period was necessary in order to permit the Company to close the Private Placement in a timeframe consistent with usual market practice for transactions of this nature.
Early Warning Report
Steven Goldman and his wife Nancy Carroll, acting jointly (collectively the "Goldmans"), announced that they have filed an updated early warning report related to their participation in the offering of Units
Upon completion of the offering, the Goldmans beneficially owns and has control of 3,006,626 common shares of the Issuer, as well as common share purchase warrants to acquire a further 1,000,000 common shares and options to acquire 410,000 common shares, which represents approximately 14.39% of the issued and outstanding common shares as calculated in accordance with National Instrument 62-104 Take-Over Bids and Insider Bids.
The Units were acquired for investment purposes only by the Goldmans. The Goldmans' view of the Company and the investment may change, depending on market and other conditions, or as future circumstances may dictate, from time to time. The Goldmans, on an individual or joint basis, may increase or dispose of some or all of their ownership in the Issuer or each may continue to hold its current position.
This news release is being issued in accordance with National Instrument 62-103 – The Early Warning System and Related Take-Over Bid and Insider Reporting Issues in connection with the filing of an early warning report dated October 1, 2021. A copy of the early warning report relating to the Goldmans' participation in the Offering will be available under the Issuer's profile on the System for Electronic Document Analysis and Review ("SEDAR") at www.sedar.com.
This press release shall not constitute an offer to sell or the solicitation of an offer to buy nor shall there be any sale of the securities in any state in which such offer, solicitation or sale would be unlawful. The securities being offered have not been, nor will they be, registered under the United States Securities Act of 1933, as amended (the "1933 Act") and may not be offered or sold to, or for the account or benefit of, persons in the United States or "U.S. persons" (as such term is defined in Regulation S under the 1933 Act) absent registration or an applicable exemption from the registration requirements of the 1933 Act any application state securities laws.
About Comstock Metals Ltd.
Comstock Metals is advancing the Preview SW Gold Project, a resource-stage gold project in the La Ronge district of Saskatchewan. The Preview SW deposit hosts indicated mineral resources containing 158,300 ounces of gold (2.61 million tonnes grading 1.89 g/t Au) and inferred mineral resources containing 270,800 ounces of gold (5.70 million tonnes grading 1.48 g/t Au), both based on a 0.50 g/t Au cut-off grade1. During 2017 and 2018, Comstock completed diamond drilling campaigns targeting the Preview North zone and the Preview SW deposit comprising 24 holes totaling 4,700 metres. Several additional, relatively untested targets remain on the Property, including the A, B, C, and Clearwater zones (Map 2).
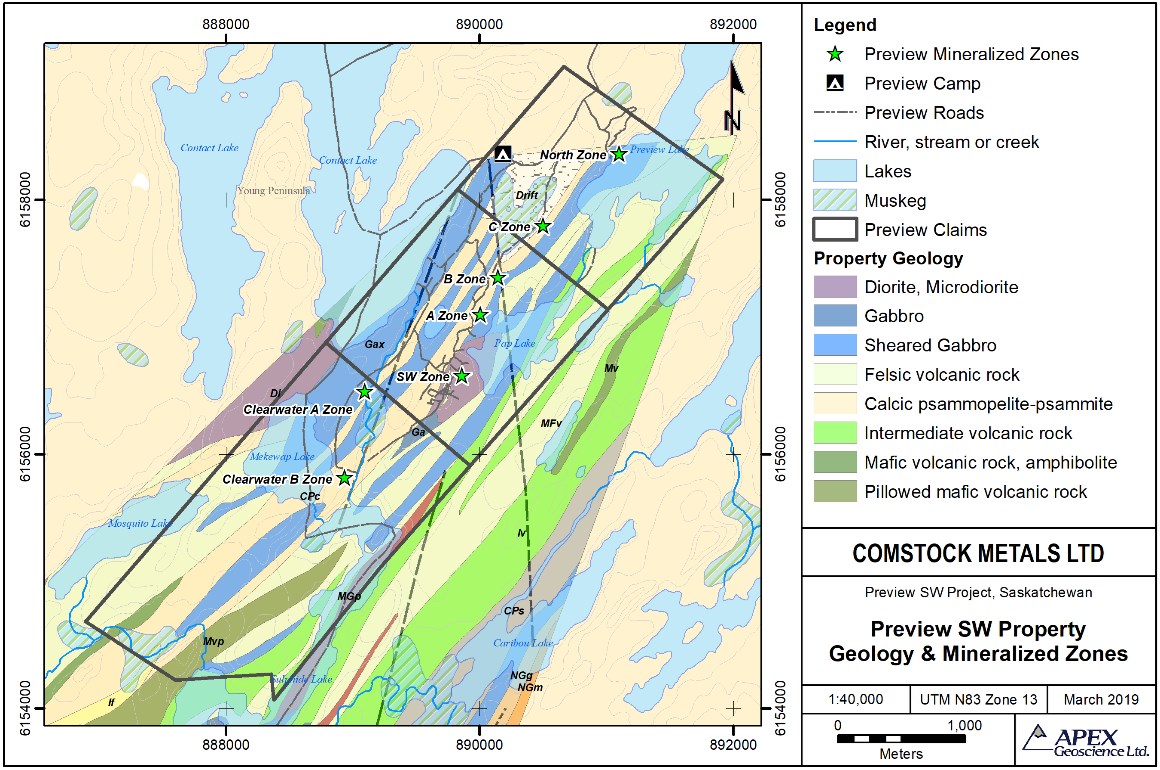
Map 2. Preview SW Property Map Showing Drilled Gold Zones
For further details, see the Company's website at www.comstock-metals.com
To view an enhanced version of Map 2, please visit:
https://orders.newsfilecorp.com/files/7078/98357_a04cd07e34589a55_001full.jpg
Qualified Persons
The scientific and technical information contained in this news release as it relates to the Preview SW Gold Project has been reviewed and approved by Kristopher J. Raffle, P.Geo. (BC) Principal and Consultant of APEX Geoscience Ltd. of Edmonton, AB and a "Qualified Person" as defined in National Instrument 43-101 – Standards of Disclosure for Mineral Projects. Mr. Raffle verified the data disclosed which includes a review of the analytical and test data underlying the information and opinions contained therein.
Forward-Looking Statements
This news release includes forward-looking information and statements, which may include, but are not limited to, information and statements regarding or inferring the future business, operations, financial performance, prospects, and other plans, intentions, expectations, estimates, and beliefs of the Company. Such statements include statements regarding the use of proceeds resulting from the financing. Forward-looking information and statements involve and are subject to assumptions and known and unknown risks, uncertainties, and other factors which may cause actual events, results, performance, or achievements of the Company to be materially different from future events, results, performance, and achievements expressed or implied by forward-looking information and statements herein. The assumptions on which the forward-looking statements contained herein rely include the ability to complete the proposed financing and receipt of regulatory approval. Although the Company believes that any forward-looking information and statements herein are reasonable, in light of the use of assumptions and the significant risks and uncertainties inherent in such information and statements, there can be no assurance that any such forward-looking information and statements will prove to be accurate, and accordingly readers are advised to rely on their own evaluation of such risks and uncertainties and should not place undue reliance upon such forward-looking information and statements. Any forward-looking information and statements herein are made as of the date hereof, and except as required by applicable laws, the Company assumes no obligation and disclaims any intention to update or revise any forward-looking information and statements herein or to update the reasons that actual events or results could or do differ from those projected in any forward-looking information and statements herein, whether as a result of new information, future events or results, or otherwise, except as required by applicable laws.
For more information about Comstock Metals Ltd., please refer to Comstock Metals' website at www.comstock-metals.com or contact:
Steven H. Goldman
President, CEO and Director
COMSTOCK METALS LTD.
Cell Phone: (416) 917-1533
Email: s.goldman@goldmanhine.com
Neither TSX Venture Exchange nor its Regulation Services Provider (as that term is defined in the policies of the TSX Venture Exchange) accepts responsibility for the adequacy or accuracy of this Release.
NOT FOR DISTRIBUTION IN THE UNITED STATES OR TO U.S. NEWSWIRE SERVICES
1 The Company has filed on SEDAR the 43-101 Technical Report, Preview SW Gold Project, La Ronge, Saskatchewan, prepared for Comstock Metals Ltd. by Ronald G. Simpson, P.Geo., Geosim Services Inc. Effective date September 27, 2016.

To view the source version of this press release, please visit https://www.newsfilecorp.com/release/98357
Investors interested in stocks from the Mining – Miscellaneous sector have probably already heard of Teck Resources Ltd (TECK) and Wheaton Precious Metals Corp. (WPM). But which of these two companies is the best option for those looking for undervalued stocks? Let's take a closer look.
We have found that the best way to discover great value opportunities is to pair a strong Zacks Rank with a great grade in the Value category of our Style Scores system. The Zacks Rank favors stocks with strong earnings estimate revision trends, and our Style Scores highlight companies with specific traits.
Teck Resources Ltd and Wheaton Precious Metals Corp. are sporting Zacks Ranks of #1 (Strong Buy) and #3 (Hold), respectively, right now. Investors should feel comfortable knowing that TECK likely has seen a stronger improvement to its earnings outlook than WPM has recently. But this is just one piece of the puzzle for value investors.
Value investors also try to analyze a wide range of traditional figures and metrics to help determine whether a company is undervalued at its current share price levels.
Our Value category highlights undervalued companies by looking at a variety of key metrics, including the popular P/E ratio, as well as the P/S ratio, earnings yield, cash flow per share, and a variety of other fundamentals that have been used by value investors for years.
TECK currently has a forward P/E ratio of 7.88, while WPM has a forward P/E of 25.04. We also note that TECK has a PEG ratio of 0.24. This popular figure is similar to the widely-used P/E ratio, but the PEG ratio also considers a company's expected EPS growth rate. WPM currently has a PEG ratio of 5.01.
Another notable valuation metric for TECK is its P/B ratio of 0.76. Investors use the P/B ratio to look at a stock's market value versus its book value, which is defined as total assets minus total liabilities. By comparison, WPM has a P/B of 2.85.
These metrics, and several others, help TECK earn a Value grade of B, while WPM has been given a Value grade of D.
TECK is currently sporting an improving earnings outlook, which makes it stick out in our Zacks Rank model. And, based on the above valuation metrics, we feel that TECK is likely the superior value option right now.
Want the latest recommendations from Zacks Investment Research? Today, you can download 7 Best Stocks for the Next 30 Days. Click to get this free report
Teck Resources Ltd (TECK) : Free Stock Analysis Report
Wheaton Precious Metals Corp. (WPM) : Free Stock Analysis Report
To read this article on Zacks.com click here.
The S&P 500 wrapped up its worst quarter since March 2020 and the first monthly drop since January. After hitting a peak in early September, the U.S. stocks were caught in brutal trading thanks to a string of woes.
These included concerns over accelerating coronavirus infections, renewed inflation fears, signs of a slowdown in China, potential for high corporate tax rates and fading fiscal stimulus. Concerns over the financial contagion of the potential failure of China’s Evergrande property group and the debates over the debt limit in Washington also made investors jittery. But these worries eased with China Evergrande’s deal for some of its looming debt payments as well as the House passing a bill to avert government shutdown.
In the FOMC meeting that concluded on Sep 22, the Federal Reserve Chair Jerome Powell signaled the tapering of bond buying as soon as November, followed by interest rate hikes as early as next year. Meanwhile, Powell warned of higher inflation that will likely remain in the coming months (read: ETFs to Bet On as Fed Turns Hawkish, Signals Tapering).
The benchmark was down 4.8% and is now 5.1% below its all-time high set on Sep. 2. Of the 11 sectors, 10 suffered losses in September, thanks to a 7.4% monthly drop in materials stocks. Energy was the best performer of the month, gaining more than 9%.
Against such a backdrop, the proxy version of the S&P 500 Index, SPDR S&P 500 ETF Trust SPY plunged 5% last month. Let’s take a closer look at the fundamentals of SPY and its best stocks:
Inside the SPY
The ETF holds 505 stocks in its basket with each accounting for no more than 6.1% of the assets. This suggests a nice balance across each security and prevents heavy concentration. The fund is widely spread across sectors with information technology, healthcare, consumer discretionary, financials and communication services accounting for a double-digit allocation each. It has AUM of $399.3 billion and charges 9 bps in fees per year (see: all the Large Cap Blend ETFs here).
The product trades in heavy volume of around 54.3 million shares a day on average, ensuring higher liquidity with a tight bid/ask spread, leading to lower trading costs for investors. SPY has a Zacks ETF Rank #2 (Buy) with a Medium risk outlook. Though most stocks in the fund’s portfolio also plunged last month, we have highlighted six stocks from different sectors that are in deep green and have a Zacks Rank #1 (Strong Buy), 2 (Buy) or 3 (Hold):
You can see the complete list of today’s Zacks #1 Rank stocks here.
Best-Performing Stocks of SPY
CF Industries Holdings Inc. CF: It is the global leader in transforming natural gas into nitrogen products. The stock rallied 24.6% last month and has an estimated earnings growth rate of 25.2% for this year. It has a Zacks Rank #3 (read: ETFs to Tap on Soaring Natural Gas Price).
SVB Financial Group SIVB: This diversified financial services company offers a diverse set of banking and financial products and services to clients across the United States. The stock has risen 15.6% and has an estimated earnings growth rate of 34.6% for this year. It has a Zacks Rank #3.
Expedia Group Inc. EXPE: It is an online travel company, empowering business and leisure travelers through technology with the tools and information they need to efficiently research, plan, book and experience travel. The stock climbed 13.7% last month and has an estimated earnings growth rate of 91.9% for this year. It has a Zacks Rank #3 (read: 5 Top ETF Stories of Nine Months of 2021).
The Mosaic Company MOS: It is one of the world's leading crop nutrition companies with a focus on potash and phosphate, two of three most vital nutrients. It jumped 10.6% in September and has an estimated earnings growth rate of 471.8% for this year. Mosaic has a Zacks Rank #1.
Quanta Services Inc. PWR: This is a leading specialized contracting services company, delivering infrastructure solutions to the electric power, oil and gas and communications industries. It has gained 10.1% and has an estimated earnings growth rate of 19.9% for this year. The stock has a Zacks ETF Rank #2.
Caesars Entertainment Inc. CZR: This casino-entertainment company is engaged in development of new resorts, expansions and acquisitions. The stock was up 10% last month and has an estimated earnings growth rate of 87.9% for this year. The stock has a Zacks ETF Rank #3.
Want the latest recommendations from Zacks Investment Research? Today, you can download 7 Best Stocks for the Next 30 Days. Click to get this free report
Quanta Services, Inc. (PWR) : Free Stock Analysis Report
Expedia Group, Inc. (EXPE) : Free Stock Analysis Report
CF Industries Holdings, Inc. (CF) : Free Stock Analysis Report
The Mosaic Company (MOS) : Free Stock Analysis Report
SPDR S&P 500 ETF (SPY): ETF Research Reports
SVB Financial Group (SIVB) : Free Stock Analysis Report
Caesars Entertainment, Inc. (CZR) : Free Stock Analysis Report
To read this article on Zacks.com click here.
Zacks Investment Research
Here are four stocks with buy rank and strong momentum characteristics for investors to consider today, October 1st:
RCM Technologies, Inc. RCMT: This provider of business and technology solutions has a Zacks Rank #1 (Strong Buy) and witnessed the Zacks Consensus Estimate for its current year earnings increasing 28% over the last 60 days.
RCM Technologies, Inc. Price and Consensus

RCM Technologies, Inc. price-consensus-chart | RCM Technologies, Inc. Quote
RCM Technologies’ shares gained 17.9% over the last one month compared with the S&P 500’s growth of 4.8%. The company possesses a Momentum Score of A.
RCM Technologies, Inc. Price

RCM Technologies, Inc. price | RCM Technologies, Inc. Quote
Capital Bancorp, Inc. CBNK: This provider of various banking products and services has a Zacks Rank #1 and witnessed the Zacks Consensus Estimate for its current year earnings increasing 21.1% over the last 60 days.
Capital Bancorp, Inc. Price and Consensus

Capital Bancorp, Inc. price-consensus-chart | Capital Bancorp, Inc. Quote
Capital Bancorp’s shares gained 3.7% over the last one month. The company possesses a Momentum Score of A.
Capital Bancorp, Inc. Price

Capital Bancorp, Inc. price | Capital Bancorp, Inc. Quote
Teck Resources Limited TECK: This company that engages in exploring for, acquiring, developing, and producing natural resources has a Zacks Rank #1 and witnessed the Zacks Consensus Estimate for its current year earnings increasing 24.4% over the last 60 days.
Teck Resources Ltd Price and Consensus

Teck Resources Ltd price-consensus-chart | Teck Resources Ltd Quote
Teck Resources’ shares gained 4.3% over the last one month. The company possesses a Momentum Score of A.
Teck Resources Ltd Price

Teck Resources Ltd price | Teck Resources Ltd Quote
Ramaco Resources, Inc. METC: This producer and seller of metallurgical coal has a Zacks Rank #1 and witnessed the Zacks Consensus Estimate for its current year earnings increasing 88.9% over the last 60 days.
Ramaco Resources, Inc. Price and Consensus

Ramaco Resources, Inc. price-consensus-chart | Ramaco Resources, Inc. Quote
Ramaco Resources’ shares gained 27.6% over the last one month. The company possesses a Momentum Score of A.
Ramaco Resources, Inc. Price

Ramaco Resources, Inc. price | Ramaco Resources, Inc. Quote
See the full list of top ranked stocks here
Learn more about the Momentum score and how it is calculated here.
Want the latest recommendations from Zacks Investment Research? Today, you can download 7 Best Stocks for the Next 30 Days. Click to get this free report
Capital Bancorp, Inc. (CBNK) : Free Stock Analysis Report
Teck Resources Ltd (TECK) : Free Stock Analysis Report
Ramaco Resources, Inc. (METC) : Free Stock Analysis Report
RCM Technologies, Inc. (RCMT) : Free Stock Analysis Report
To read this article on Zacks.com click here.
For many, the main point of investing in the stock market is to achieve spectacular returns. While the best companies are hard to find, but they can generate massive returns over long periods. To wit, the Energy Fuels Inc. (TSE:EFR) share price has soared 345% over five years. This just goes to show the value creation that some businesses can achieve. In more good news, the share price has risen 30% in thirty days.
With that in mind, it's worth seeing if the company's underlying fundamentals have been the driver of long term performance, or if there are some discrepancies.
Check out our latest analysis for Energy Fuels
With just US$1,679,000 worth of revenue in twelve months, we don't think the market considers Energy Fuels to have proven its business plan. So it seems shareholders are too busy dreaming about the progress to come than dwelling on the current (lack of) revenue. For example, they may be hoping that Energy Fuels finds fossil fuels with an exploration program, before it runs out of money.
As a general rule, if a company doesn't have much revenue, and it loses money, then it is a high risk investment. There is almost always a chance they will need to raise more capital, and their progress – and share price – will dictate how dilutive that is to current holders. While some such companies do very well over the long term, others become hyped up by promoters before eventually falling back down to earth, and going bankrupt (or being recapitalized). Of course, if you time it right, high risk investments like this can really pay off, as Energy Fuels investors might know.
Energy Fuels had cash in excess of all liabilities of US$53m when it last reported (June 2021). That's not too bad but management may have to think about raising capital or taking on debt, unless the company is close to breaking even. With the share price up 54% per year, over 5 years , the market is seems hopeful about the potential, despite the cash burn. The image below shows how Energy Fuels' balance sheet has changed over time; if you want to see the precise values, simply click on the image.

In reality it's hard to have much certainty when valuing a business that has neither revenue or profit. Given that situation, many of the best investors like to check if insiders have been buying shares. It's usually a positive if they have, as it may indicate they see value in the stock. You can click here to see if there are insiders buying.
A Different Perspective
We're pleased to report that Energy Fuels shareholders have received a total shareholder return of 287% over one year. That's better than the annualised return of 35% over half a decade, implying that the company is doing better recently. In the best case scenario, this may hint at some real business momentum, implying that now could be a great time to delve deeper. I find it very interesting to look at share price over the long term as a proxy for business performance. But to truly gain insight, we need to consider other information, too. Take risks, for example – Energy Fuels has 4 warning signs we think you should be aware of.
Energy Fuels is not the only stock insiders are buying. So take a peek at this free list of growing companies with insider buying.
Please note, the market returns quoted in this article reflect the market weighted average returns of stocks that currently trade on CA exchanges.
This article by Simply Wall St is general in nature. We provide commentary based on historical data and analyst forecasts only using an unbiased methodology and our articles are not intended to be financial advice. It does not constitute a recommendation to buy or sell any stock, and does not take account of your objectives, or your financial situation. We aim to bring you long-term focused analysis driven by fundamental data. Note that our analysis may not factor in the latest price-sensitive company announcements or qualitative material. Simply Wall St has no position in any stocks mentioned.
Have feedback on this article? Concerned about the content? Get in touch with us directly. Alternatively, email editorial-team (at) simplywallst.com.
Calgary, Alberta–(Newsfile Corp. – October 1, 2021) – New Stratus Energy Inc. (TSXV: NSE) ("New Stratus" or the "Corporation") is pleased to announce that Greg Bay was elected to the Corporation's board of directors at the annual general meeting held on September 16, 2021. Mr. Bay is Managing Partner and Founder of Cypress Capital Management Ltd., a Canadian boutique money manager affiliated with AGF Management Ltd.
The Corporation also announces the grant of incentive stock options to acquire a total of 3,500,000 common shares of the Corporation to various directors, officers and consultants of the Corporation pursuant to the Corporation's stock option plan and subject to any regulatory approval. Each stock option, vests immediately and is exercisable at a price of $0.30 per share for a period of five years from the grant date.
Contact Information:
Jose Francisco Arata
Chief Executive Officer
jfarata@newstratus.energy
Wade Felesky
President
wfelesky@newstratus.energy
Mario Miranda
Chief Financial Officer
mmiranda@newstratus.energy
Neither the TSX Venture Exchange nor its Regulation Services Provider (as that term is defined in policies of the TSX Venture Exchange) accepts responsibility for the adequacy or accuracy of this release.
NOT FOR DISTRIBUTION TO UNITED STATES NEWSWIRE SERVICES OR FOR DISSEMINATION IN THE
UNITED STATES

To view the source version of this press release, please visit https://www.newsfilecorp.com/release/98297.
Detroit is seeing some stiff competition these days – and not just from Japan and Korea. The economy is shifting toward green tech, and new automotive companies are popping up to take advantage of the newly opened electric vehicle (EV) and battery playing field. Just as a century and more ago there were scores of auto makers competing to build the best combustion engine cars, and scores of designs in the game, ranging from external combustion steam cars to rotary engine motorcycles, so today the EV field presents a wide open front for new companies to innovate and find the best designs for mass market electrically powered cars.
The trick now, for investors, is to find the companies that look like winners as the EV sector expands, grows, and matures. It may be too early to tell which EV makers are going to hang in for the long haul and dominate the market a century from now – or even if electric cars will still be on the road in the distant future. But the data tools on the TipRanks platform have helped us pick out three companies that look like winners in the near- to mid-term, over the next 12 months. These are companies with low-cost shares to entice investors, and – according to the Wall Street stock experts – the potential to double or more in that time. Here are the details.
EV Stocks Under $10:
REE Automotive (REE)
We’ll start with REE automotive, a unique automotive design company that uses high tech to redesign the critical area of a car – the space between the chassis and the wheel – integrating critical vehicle components such as brakes, steering, and electric drive motors into modular configurations, effectively building the car specifically for its target application and market.
All of that sounds like a mouthful, but what it means is, REE’s design allows for more passenger space and more cargo space on a fully-flat, electrically powered vehicle platform. The design is intended facilitate both production and use of the fully assembled electric vehicles.
Earlier this year, REE announced its intention to go public via a SPAC merger, with the blank check company 10X Capital Venture Acquisition Corporation. The move, completed on July 22, saw the REE ticker start on the NASDAQ and brought the company some $288 million in new capital. Since then, the merger has disappointed; REE’s market cap has slipped from $3.1 billion to the current $1.8 billion.
Although the stock has slipped since the SPAC transaction, REE had several notable successes in the first half of the year. The company secured collaborations with four cutting edge, high-tech automotive manufacturers around the world, agreements that will enable REE and its partners to work together on building out new EV and battery technologies. The company also secured vital sections of its supply chain system, in preparation for starting mass production of its flat platform chassis EVs in 2023.
Finally, in a move that shows production and commercialization will be focused in the US, REE on July 23 announced that its US headquarters will be located in Austin, Texas. The Lone Star State has been the epicenter of US job creation recently, and has built a reputation as a business-friendly locale.
Cowen analyst Jeffrey Osborne initiated his coverage of REE with a Buy rating and a $15 price target that suggests a powerful 160% one-year upside.
Backing his stance, Osborne writes, “We are constructive on REE's modular EV chassis approach trimming the time and investment required in building new platforms. Its REEcorner and REEboard aim to serve as building blocks for modular EV production. We are positive on its capability to provide mission-specific vehicles as in our view it opens several doors to optimization, particularly in the commercial vehicle market. REE's flat chassis will enable space optimization, yielding lesser trips via volume maximization… The light and medium commercial vehicle markets are ripe for electrification given their "return to base" operation as well as focus on total cost of ownership (TCO), and we view REE as potentially well-positioned to unlock value.” (To watch Osborne’s track record, click here.)
This newly public stock has 3 positive ratings on file, for a Strong Buy analyst consensus. The shares are priced at $5.77 and their $16.67 average price target is even more bullish than Osborne allows, implying an upside of 189% in the year ahead. (See REE’s stock analysis at TipRanks.)

ElectraMeccanica Vehicles Corporation (SOLO)
Next up, ElectraMeccanica, takes a nearly opposite approach to the EV market. This company has put together the Solo, a single-seat, three-wheeled EV designed specifically for the short range urban commute. The Solo features small size, a 100-mile rage, and an 80 mph top speed. This small one-seater has a door on either side of body, or easy ingress/egress, and boot at the rear. The vehicle emphasizes the size and maneuverability needed to fit into tight urban spaces.
The Solo is being marketed to urban residents as a solution for short-distance driving, as well as to rental fleets and delivery companies. In the delivery role, the ‘cargo’ version of the car has an enlarged trunk, and targets ‘last mile’ delivery – a niche for which electric vehicles are well suited. While ElectraMeccanica’s Solo is not yet in production for delivery, the company plans to start shipping to customers by the end of the year – and is now taking reservations on the car, for $250.
ElectraMeccanica is also moving to expand its product line, with two additional all-electric vehicles. Both are styled along more traditional ‘car’ lines than the Solo. The Electric Roadster and sporty Tofino both offer higher performance, in speed and range per charge, than the Solo, and it is reflected in pricing. Where the Solo starts at $18,500, the Roadster is predicted to have a $150,000 price tag when it hits showrooms.
The company is continuing work on its Arizona manufacturing facility, where production vehicles will be assembled and the engineers will have facilities for technical research. When up and running, the facility will fill 235,000 square feet, employ up to 500 people, and turn out 20,000 Solo vehicles annually.
5-star analyst Craig Irwin, of Roth Capital, notes this company’s progress toward full production and delivery, as well as its sound balance sheet. He writes, “Electra Meccanica made healthy progress towards ramping commercial production and deliveries during 2Q21, with first SOLO deliveries now likely later this quarter. Construction of the company's Mesa, AZ facility is making rapid progress, and should drive substantial cost savings that enable the steep deliveries ramp expected in 2023. We expect the $250m cash position to provide adequate funding through facility completion and working capital to support near-term growth. We would be buyers for improving longer-term growth visibility.” (To watch Irwin’s track record, click here.)
These comments back a Buy rating, and the $12.25 price target implies a robust 12-month upside potential of 252%. Irwin’s is the only SOLO review posted during the past 3 months. The stock is currently trading at $3.48 per share. (See ElectraMeccanica’s stock analysis at TipRanks.)

Ideanomics (IDEX)
Let’s wrap up this list with Ideanomics, a company that lives in both the EV battery and the fintech sectors. As a financial tech company, Ideanomics works to make capital available for group purchase discounts on commercial EVs, battery backs, and power usage. Financial services are both powered and secured by AI tech and blockchain encryption.
Even though the EV market is new, companies are ramping it up, buying vehicle fleets and establishing infrastructure. These are activities well within the purview of Ideanomics to incentivize and fund. The company’s stated goals are to increase confidence in the electrification of the vehicle sector, and to provide a transparent and profitable financial service to expand and buy into EVs.
This company’s Mobile Energy Global division, its EV segment, has been moving to expand in recent months. The company has a network of subsidiaries involved in EVs, in charging infrastructure, and in energy production, which it describes all together as ‘the three pillars’ of the EV sector. Ideanomics controls the only electric tractor manufacturer in the US, Solectrac, and its Wave wireless high-power charging network helps maintain the largest fully electric mass transit bus fleet in the US. And, at the end of August, Ideanomics acquired VIA Motors in a 100% stock transaction. Utah-based VIA produces Class 2, 3, 4, and 5 size electric trucks for short-haul and mid-mile delivery runs.
In 2Q21, Ideanomics’ revenue grew sequentially for the sixth quarter in a row, reaching $33.2 million, coming in slightly ahead of the consensus estimate. Gross profit came in at $9.3 million. The company has a full war chest to fund further activities, with $396 million in cash on hand as of June 30.
In coverage of this stock, Roth’s Craig Irwin notes that Ideanomics has multiple paths to profitability, in part due to smart acquisitions. The analyst writes of this company, “Ideanomics reported strong 2Q21 progress with revenue ahead of our estimates. The quarter's results marked first revenue contribution from the US Hybrid and Solectrac acquisitions, supplementing continued strong revenue production at Timeos. The company's WAVE inductive charging business now reports a pipeline of over $100m, suggesting this group could be one of the fastest growing in 2022.”
In line with his comments, Irwin rates the stock as a Buy with a $7 price target to suggest an upside of a hefty 191% from the current share price of $2.40.
Ideanomics is another name going under Wall Street's radar right now and there are currently no other reviews on record. (See Ideanomics’ stock analysis at TipRanks.)

To find good ideas for stocks trading at attractive valuations, visit TipRanks’ Best Stocks to Buy, a newly launched tool that unites all of TipRanks’ equity insights.
Disclaimer: The opinions expressed in this article are solely those of the featured analysts. The content is intended to be used for informational purposes only. It is very important to do your own analysis before making any investment.
In yesterday’s Market360, I introduced you to Eric Fry, the master of “global macro” investing. Today, I’m going to hand the mic over to Eric so he can show you how he was able to make a stunning 1,018% return on Freeport-McMoRan Inc. (NYSE:FCX).
Eric, take it away!
Back in late 2019, I chose Freeport-McMoRan Inc. (NYSE:FCX) as my pick in the InvestorPlace.com Best Stocks for 2020 contest.
InvestorPlace – Stock Market News, Stock Advice & Trading Tips

Source: Coldmoon Photoproject/Shutterstock.com
And with 99% returns in 2020, the global copper giant came in No. 1 among the picks from InvestorPlace’s top analysts… giving me bragging rights at company cocktail parties for at least the next few years. I’ll admit, Louis was a close second. His pick, PennyMac Financial Services Inc. (NYSE:PFSI), earned a 94% return in 2020.
So, why did I pick Freeport-McMoRan?
I’ll start by saying that Freeport-McMoRan is a unique company. The terms “artificial intelligence” and “copper miner” do not obviously relate to one another, but with Freeport-McMoRan, they absolutely do.
One of the world’s largest copper producers, this company has been testing an artificial intelligence, or “machine learning,” model, at its Bagdad copper mine in Arizona.
This machine learning model uses data from sensors around the mine to “tailor” the ore processing method to each of the seven distinct types of ore that come from it.
This test has been a remarkable success, so the company is now rolling out its new technology across all of its operations in the Americas.
By doing so, this company expects to increase its annual copper production by a hefty 5%.
Boosting Production
The machine learning program is just one of three major initiatives Freeport-McMoRan said would boost its copper production by 30% in 2020.
The other two production drivers were:
-
A ramp up in Freeport’s new underground mining operations at its massive Grasberg mine in Indonesia.
-
The company’s new Lone Star copper development in Arizona is going into production.
Combined, I predicted that these three initiatives would produce a significant jump in earnings, even with no change in current copper or gold prices. At a minimum, I said at the time, the company should have earned about $0.55 a share in 2020 and $1.40 in 2021. (We now know that the company is on track to more than double my initial earnings estimate for 2021.)
I predicted those results would give Freeport’s stock a price-to-earnings ratio of 24 in 2020, which would then fall to just nine times earnings in 2021. Remember, though, these earnings estimates assumed no change in copper prices during the next 12 months.
But that’s not what I assumed.
I believed then that the price of copper was on the verge of a major upside move that would carry it above the five-year high of the $3.32 a pound mark it hit in late 2017.
Copper’s price did just that in late 2020. And it now stands at around $4.19 per pound.
Not surprisingly, Freeport’s share price has also made a big move along with the price of copper. It’s up more than 150% since I made it my pick in the InvestorPlace.com Best Stocks for 2020 contest.
And I don’t think copper — or FCX’s — big move up is done yet.
Five main factors will power this big move. Three of them are the “usual suspects,” while two are unusual ones.
First, the usual ones:
-
Copper supply is falling short of copper demand, which is creating a deficit in the market.
-
The copper deficit is likely to grow much larger over the coming decade.
-
The Federal Reserve has recently stated its intention to hold interest rates low throughout 2020, which should ignite commodity prices.
In addition to these bullish forces, copper prices could gain a tailwind from two nontraditional factors:
-
Improving international trade relations, especially between the United States and China.
-
The global boom in electric vehicles and energy storage.
Let’s take a closer look at each of these five factors…
Fueling Up for the Copper Rally
First, Federal Reserve Chairman Jerome Powell is pursuing an “easier” monetary policy than most investors had been expecting during the last couple of years. Generally speaking, “easy money” monetary policies tend to produce periods of rising commodity prices.
Supply deficits are a second factor that could push copper prices higher. For most of the last few years, the global supply of refined copper has been falling slightly short of demand. But according to most forecasts for the copper industry, the current supply deficit will not merely persist during the next few years; it will grow much larger.

Source: InvestorPlace
Thanks to this supply deficit, coupled with the Fed’s low interest rates, Freeport’s earnings and cash-flow results are likely to keep surprising on the upside.
Electric Vehicles
But remember, Freeport also produces nearly 1 million ounces of gold per year and 92 million pounds of molybdenum (a metal that’s highly resistant to corrosion). So if either of those metals took a major swing to the upside, Freeport would benefit as well.
That said, copper is the major driver of the company’s profitability. So let’s take a closer look at the two unusual “one-off” factors that could spur strong copper demand… and a rising copper price.
First, the Trump-era trade war between the United States and China is in the past. As normalized trade continues between the U.S. and China, economic growth could gain a tailwind that boosts demand for essential commodities like copper.
Importantly, China is the world’s largest importer of refined copper. So if the Chinese economy gains renewed vitality, the copper market will notice. And let’s not forget that China is also the world’s largest producer of electric vehicles, which are “copper hogs.”

Source: InvestorPlace
Electric vehicles require about four times as much copper as internal combustion vehicles. Therefore, as EVs continue to gain market share, they will absorb a growing slice of the global copper supply.
The Bottom Line
When I first wrote about FCX in late 2019, I expected the stock to produce triple-digit gains in 2020. And I was pretty darn close. That final gain was 99%.
In 2021, the stock rose nearly 108%. And it’s tacked on another 26% gains so far this year.
Like I said before, add it all up and it’s soared more than 150% since I made it my pick in the InvestorPlace.com Best Stocks for 2020 contest
That’s a great return.
However, I’m pleased to say that over the time period, members of my elite trading service have done even better — and it’s all thanks to my escape velocity strategy. Freeport has been the gift that keeps on giving for members of my Speculator service. They’ve taken triple-digit and even quadruple-digit profits several times over the past couple of years on various FCX positions.
Since I recommended an escape velocity-charged position on Freeport to members of The Speculator in March 2020, we’ve closed out portions of it for 407.9%… 775.6%… 1,378.7%… and 1,506.7% gains.
Add it all up — and their total gains are 1,017%!
And it’s all thanks to the escape velocity strategy that Louis and I share.
Next Tuesday, Oct. 5, at 7 p.m. Eastern, during a special Escape Velocity Event Louis and I are holding, we’ll explain how escape velocity works and how you can make big returns using this strategy, too. If you haven’t reserved your spot yet, I encourage you to do so now.
Simply click this link and we’ll save a seat for you. Louis and I hope to see you there!
Sincerely,
Louis Navellier
The Editor hereby discloses that as of the date of this email, the Editor, directly or indirectly, owns the following securities that are the subject of the commentary, analysis, opinions, advice, or recommendations in, or which are otherwise mentioned in, the essay set forth below:
PennyMac Financial Services Inc. (PFSI)
Louis Navellier, who has been called “one of the most important money managers of our time,” has broken the silence in this shocking “tell all” video… exposing one of the most shocking events in our country’s history… and the one move every American needs to make today.
The post How Eric Fry Made a Quadruple-Digit Return on a Copper Mine appeared first on InvestorPlace.
(Reuters) -Australia's Fortescue Metals Group Ltd said on Friday it had restarted operations at its Solomon Hub site in Western Australia, a day after a worker died at the site, adding that its cost and output forecasts for fiscal 2022 remained unchanged.
The world's No.4 iron ore miner was forced to temporarily halt work at Solomon Hub after a worker lost his life following a ground collapse on Thursday, prompting an investigation by the state's mining department and police.
The pause also partly led to a spike in iron ore prices on Thursday.
"Ore processing activity has recommenced and mining activity is progressively resuming. Fortescue continues to work closely with all relevant authorities on the incident investigation," the miner said in a statement.
The Solomon Hub comprises of the Firetail, Kings Valley and Queens Valley mines, which together have a production capacity of 75 million tonnes of iron ore a year.
(Reporting by Shashwat Awasthi; Editing by Rashmi Aich and Ramakrishnan M.)
VANCOUVER, BC / ACCESSWIRE / September 30, 2021 / Klondike Gold Corp. (TSXV:KG)(FRA:LBDP)(OTC PINK:KDKGF) ("Klondike Gold" or the "Company") is announces that it plans to raise up to $3,500,000 in aggregate of flow-through funds (the "Flow-Through Placement") and non-flow-through funds (the "Non-Flow-Through Placement) by way of a non-brokered private placement (the "Financing").
The Flow-Through Placement will consist of the sale of flow-through shares at a price of $0.20 per flow-through unit with each unit consisting of one common share and one-half of one share purchase warrant.
The Non-Flow-Through Placement will consist of the sale of units at a price of $0.175 per unit, with each unit consisting of one common share and one-half of one share purchase warrant.
Each warrant will entitle the holder to purchase one common share at a price of $0.25 per common share for a period of 2 years from closing (the "Warrants").
A finder's fee on the gross proceeds of the Financing may be paid.
The Financing may close in tranches. The Company intends to use the proceeds from the Financing to continue exploration and development of the Company's Yukon properties, as well as for general working capital.
The securities issued in connection with the Financing are subject to TSX Venture Exchange approval and all securities will be subject to a four month statutory hold period after the date of closing.
ON BEHALF OF KLONDIKE GOLD CORP.
"Peter Tallman"
President and CEO
(604) 609-6138
E-mail: info@klondikegoldcorp.com
Website: www.klondikegoldcorp.com
Neither the TSX Venture Exchange nor its Regulation Services Provider (as that term is defined in the policies of the TSX Venture Exchange) accepts responsibility for the adequacy or accuracy of this release.
Disclaimer for Forward-Looking Information
"This press release contains "forward-looking information" and "forward-looking statements" within the meaning of applicable securities laws. This information and statements address future activities, events, plans, developments and projections. All statements, other than statements of historical fact, constitute forward-looking statements or forward-looking information. Such forward-looking information and statements are frequently identified by words such as "may," "will," "should," "anticipate," "plan," "expect," "believe," "estimate," "intend" and similar terminology, and reflect assumptions, estimates, opinions and analysis made by management of Klondike in light of its experience, current conditions, expectations of future developments and other factors which it believes to be reasonable and relevant. Forward-looking information and statements involve known and unknown risks and uncertainties that may cause Klondike's actual results, performance and achievements to differ materially from those expressed or implied by the forward-looking information and statements and accordingly, undue reliance should not be placed thereon.
Risks and uncertainties that may cause actual results to vary include but are not limited to the availability of financing; fluctuations in commodity prices; changes to and compliance with applicable laws and regulations, including environmental laws and obtaining requisite permits; political, economic and other risks; as well as other risks and uncertainties which are more fully described in our annual and quarterly Management's Discussion and Analysis and in other filings made by us with Canadian securities regulatory authorities and available at www.sedar.com. Klondike disclaims any obligation to update or revise any forward-looking information or statements except as may be required."
SOURCE: Klondike Gold Corp.
View source version on accesswire.com:
https://www.accesswire.com/666188/Klondike-Gold-Announces-3500000-Private-Placement
If you would like to receive our free newsletter via email, simply enter your email address below & click subscribe.
 Follow us on Twitter
 Become our facebook fan
CONNECT WITH US
Tweets
Tweet with hash tag #miningfeeds or @miningfeeds and your tweets will be displayed across this site.
MOST ACTIVE MINING STOCKS
Daily Gainers
 CMC Metals Ltd. CMC Metals Ltd. |
CMB.V | +900.00% |
 Eden Energy Ltd Eden Energy Ltd |
EDE.AX | +200.00% |
| GoviEx Uranium Inc. |
GXU.V | +42.86% |
| Eagle Nickel Ltd. |
ENL.AX | +41.67% |
| Citigold Corp. Limited |
CTO.AX | +33.33% |
| Mount Burgess Mining NL |
MTB.AX | +33.33% |
| Exalt Resources Limited |
ERD.AX | +31.94% |
| Casa Minerals Inc. |
CASA.V | +30.00% |
| Cariboo Rose Resources Ltd |
CRB.V | +28.57% |
| Belmont Resources Inc. |
BEA.V | +28.57% |


