Vancouver, British Columbia–(Newsfile Corp. – July 27, 2026) – Golden Arrow Resources Corporation (TSXV: GRG) (FSE: G6A) (OTCQB: GARWF), ("Golden Arrow" or the "Company") announced that it has mailed and filed a management information circular and related materials (the "Meeting Materials") for its annual general and special meeting (the "Meeting") of the holders of common shares of the Company (the "Shareholders") to be held on August 21, 2026, in connection with, among other things, the proposed sale of the copper assets at the San Pietro Copper-Gold-Iron Cobalt project (the "San Pietro Project") to Capstone Copper Corp. ("Capstone") and a wholly-owned subsidiary of Capstone, announced on June 23, 2026 (the "Transaction").
"Management is strongly in favour of the Transaction and believes it delivers significant value to Golden Arrow Shareholders, while better positioning the Company to focus on its highest-potential gold opportunities. We encourage Shareholders to vote in favour of the Transaction," stated Nikolaos Cacos, Golden Arrow President & CEO.
Information about the Meeting
The Meeting will be held at 3500 – 1133 Melville Street, Vancouver, British Columbia, on August 21, 2026 at 8:30 a.m. (Vancouver time).
The Meeting Materials contain important information regarding the Transaction, how Shareholders can participate and vote at the Meeting, the background that led to the Transaction and the reasons for the unanimous determinations of the board of directors of the Company (the "Board") that the Transaction is in the best interests of the Company and is fair to Shareholders. Shareholders should carefully review all of the Meeting Materials as they contain important information concerning the Transaction and the rights and entitlements of Shareholders thereunder. The Board unanimously recommends that Shareholders vote in favour of the Transaction.
The Meeting Materials have been filed by the Company on SEDAR+ and are available under the Company's profile at www.sedarplus.ca. The Meeting Materials are also available on the Company's website at https://goldenarrowresources.com.
Subject to obtaining approval of the Transaction at the Meeting, and the satisfaction of the other customary conditions to completion of the Transaction contained in the share purchase agreement, dated June 22, 2026, including certain regulatory approvals, all as more particularly described in the Meeting Materials, the Transaction is expected to close in late-August 2026.
About Golden Arrow:
Golden Arrow is a mineral exploration company with a successful track record of creating value by making precious and base metal discoveries and advancing them into exceptional deposits. Golden Arrow is actively exploring a portfolio of projects in Chile and Argentina. The Company is an affiliated company of the Grosso Group, a resource focussed management organization that provides operational support to its affiliated companies as they advance quality resource projects.
ON BEHALF OF THE BOARD
"Nikolaos Cacos"
Mr. Nikolaos Cacos, President and CEO
For further information, please contact:
Corporate CommunicationsTel: 1-604-687-1828 Toll-Free: 1-800-901-0058
Email: info@goldenarrowresources.com
Neither the TSXV nor its Regulation Services Provider (as that term is defined in policies of the TSXV) accepts responsibility for the adequacy or accuracy of this release.
This news release may contain forward-looking statements. Forward-looking statements address future events and conditions and therefore involve inherent risks and uncertainties. All statements, other than statements of historical fact, that address activities, events or developments the Company believes, expects or anticipates will or may occur in the future, including, without limitation, statements about: the characteristics of the Transaction; timing of the Meeting; Golden Arrow's plans for, and the future prospects of, its mineral properties; and the Company's business strategy, plans and outlooks and the future financial or operating performance of the Company are forward-looking statements.
Forward-looking statements are based on a number of assumptions believed by management to be reasonable at the time such statements are made, including assumptions regarding the receipt of required Shareholder and regulatory approvals, satisfaction of the conditions to closing of the Transaction, and the ability of the parties to complete the Transaction in accordance with its terms.
Forward-looking statements are subject to a number of risks and uncertainties that may cause the actual results of the Company to differ materially from those discussed in the forward-looking statements and, even if such actual results are realized or substantially realized, there can be no assurance that they will have the expected consequences to, or effects on, the Company. Factors that could cause actual results or events to differ materially from current expectations include, among other things: the risk that the Transaction may not be completed on the terms currently contemplated, or at all; risks relating to the failure to obtain Shareholder approval; the possibility that the parties do not satisfy the closing conditions under the share purchase agreement; risks and uncertainties related to the ability to obtain, amend, or maintain licenses, permits, or surface rights; risks associated with obtaining necessary regulatory approvals (including the TSX-V's final approval); risks associated with technical difficulties in connection with exploration activities; and the possibility that future exploration, development or mining results will not be consistent with the Company's expectations. Actual results may differ materially from those currently anticipated in such statements. Readers are encouraged to refer to the Company's public disclosure documents for a more detailed discussion of factors that may impact expected future results.
The forward-looking statements contained in this news release are made as of the date hereof and the Company does not undertake any obligation to update or revise any forward-looking statements except as required by applicable securities laws.
To view the source version of this press release, please visit https://www.newsfilecorp.com/release/306530
Melbourne, Australia and Vancouver, British Columbia–(Newsfile Corp. – June 30, 2026) – Mithril Silver and Gold Limited (TSXV: MSG) (ASX: MTH) (OTCQB: MTIRF) ("Mithril" or the "Company") is pleased to announce an upgraded Mineral Resource Estimate (MRE) for the Target 1 deposit at its flagship Copalquin Project in Durango State, Mexico.
After approximately 60,000 metres of drilling, 204 drill holes for an overall Target 1 discovery cost of less than US$20 per ounce of gold equivalent (AuEq), Mithril has developed a high quality and predictive geological model that clearly defines the controls on mineralisation, resulting in high resource confidence and continuity.
Unlike a purely geological estimate, the upgraded MRE has been constrained using preliminary mining shapes and incorporates expected mining dilution, providing a more realistic representation of the material that could ultimately form a mine plan. By accounting for practical mining conditions at the resource stage, the estimate provides a stronger foundation for future mine planning, engineering studies and economic evaluation, and represents an important step in de-risking the Target 1 as it advances toward development.
Highlights
- Significant resource upgrade with total constrained and diluted Indicated and Inferred resources of 343 koz gold + 8.479 Moz silver (464 koz AuEq) and 103 koz gold + 3.398 Moz silver (151 koz AuEq), respectively. Indicated totals 3.391 Mt grading 3.15 g/t gold and 77.8 g/t silver (diluted) and Inferred totals 1.436 Mt grading 2.23 g/t gold and 73.6 g/t silver (diluted). See Table 2 for full details
- 196% increase in higher-confidence indicated gold and silver compared to previous MRE.
- 75% of total gold and silver now classified as indicated
- Resource constrained within preliminary underground mining shapes and incorporates expected mining dilution, providing a more realistic basis for future engineering and economic studies
- High confidence resource, remains open along strike and at depth with multiple opportunities for expansion
- Overall Target 1 MRE discovery cost of less than US$20 per ounce AuEq from approximately 60,000 metres of drilling in 204 drill holes
- Geological insights from Target 1 are being applied across multiple high-grade targets within the broader Copalquin epithermal system
The following Table 1 provides the highlighted base case for undiluted mineralisation reporting within the underground mining shapes (mine stope optimiser – MSO) at a cut-off grade of 1.5 g/t AuEq plus sensitivities to gold prices.
The MRE for Target 1 (Table 2) was generated from the highlighted base case in Table 1 assuming bulk underground mining method (long hole open stoping – LHOS) with mining widths averaging approximately 4 metres as presented on a diluted basis in Table 2. The MSO work identified areas where more selective underground mining methods such as cut and fill (higher cost than LHOS) could be utilised to reduce dilution and increase mined grades. The difference between the undiluted grade of 6.85 g/t AuEq (Table 1 Indicated base case) and the diluted grade of 4.26 g/t AuEq (Table 2, Total Indicate Target 1 MRE) reflects this conservative mining dilution assumption whereby lower grade mineralisation surrounding the high grade core would be extracted within geometry of a minable shape adding more tonnes and ounces at a lower average grade. More detailed mining study work will fully assess the mining methods across the Target 1 MRE.
"This resource upgrade is about much more than adding ounces. We now have a resource where three-quarters of the contained metal sits in the higher-confidence Indicated category, constrained within practical underground mining shapes and incorporating expected mining dilution," said John Skeet, Managing Director and CEO. "That gives us a resource that is directly applicable to mine planning rather than simply a geological inventory. Combined with a discovery cost of less than US$20 per gold equivalent ounce and an underlying predictive geological model that continues to identify new mineralisation, we believe Target 1 has become one of the highest-quality pre-development underground gold-silver resources in Mexico."
Webinar – Join Mithril management for live online seminar reviewing the most recent MRE and company update.
Date and Time: Pacific Time June 30, 2026 3:30pm, Aust Eastern Time, July 1, 2026 8:30 am
Where: https://6ix.com/event/mithril-silver-and-gold-copalquin-project-update
Table 1 Gold price sensitivity to constraining shapes, reported at 1.5 g/t AuEq cut-off (constrained and undiluted)
| Au Prices | Classification | Tonnes | Gold | Silver | Gold Eq. | Gold | Silver | Gold Eq. |
| (USD) | (kt) | (g/t) | (g/t) | (g/t) | (koz) | (koz) | (koz) | |
| 2,700 | Ind | 1,888 | 5.28 | 126.1 | 7.08 | 321 | 7,654 | 430 |
| Inf | 831 | 3.46 | 113.7 | 5.08 | 92 | 3,038 | 136 | |
| 3,000 | Ind | 1,941 | 5.18 | 124.2 | 6.96 | 323 | 7,752 | 434 |
| Inf | 863 | 3.39 | 111.7 | 4.98 | 94 | 3,099 | 138 | |
| 3,300 | Ind | 1,990 | 5.10 | 122.4 | 6.85 | 326 | 7,832 | 438 |
| Inf | 900 | 3.32 | 109.1 | 4.87 | 96 | 3,155 | 141 | |
| 3,500 | Ind | 2,038 | 5.01 | 120.9 | 6.74 | 329 | 7,922 | 442 |
| Inf | 923 | 3.27 | 107.5 | 4.81 | 97 | 3,189 | 143 | |
| 4,000 | Ind | 2,074 | 4.96 | 119.7 | 6.67 | 330 | 7,984 | 445 |
| Inf | 949 | 3.23 | 105.9 | 4.74 | 98 | 3,233 | 145 |
Notes to Table 1:
- The Table presents the results of a sensitivity analysis by varying gold prices on AuEq block model values and reports an undiluted tonnage, grade and metal content contained within the mining shapes. The scenarios as presented are not considered statement of mineral resources or reserves, and do not have demonstrated economic viability.
- AuEq calculated using metal prices of USD $3,300/oz Au and $50/oz Ag where AuEq g/t = Au g/t + (Ag g/t x (Au price/Ag price) x (Ag recovery/Au recovery)) with metallurgical recoveries of 96% Au and 91% Ag from metallurgical test work on Target 1 composite samples1. An AuEq cut-off grade of 1.5 g/t was selected after applying 95% mining recovery and 5% dilution factors to the metal price and recovery values.
Table 2 Upgraded Copalquin Target 1 Mineral Resource Estimate (underground mining shape constrained & diluted)
| Target 1 Area | Class | Tonnes | Gold | Silver | Gold Eq. | Gold | Silver | Gold Eq. |
| (kt) | (g/t) | (g/t) | (g/t) | (koz) | (koz) | (koz) | ||
| El Refugio | Ind | 2,557 | 3.38 | 73.7 | 4.44 | 278 | 6,061 | 365 |
| Inf | 1,217 | 2.17 | 82.1 | 3.35 | 85 | 3,214 | 131 | |
| La Soledad | Ind | 834 | 2.43 | 90.2 | 3.72 | 65 | 2,418 | 100 |
| Inf | 219 | 2.54 | 26.1 | 2.92 | 18 | 184 | 21 | |
| Total | Ind | 3,391 | 3.15 | 77.8 | 4.26 | 343 | 8,479 | 464 |
| Inf | 1,436 | 2.23 | 73.6 | 3.28 | 103 | 3,398 | 151 |
Notes to Table 2:
- Diluted to a minimum 2 m shape width with a 92% mining recovery.
- Metallurgical recoveries of 96% for Au and 91% for Ag, from metallurgical test work on Target 1 composite samples 1 Longhole Open Stope mining with a total Mining+Processing+General and Administration (G&A) cost of $97.00 per tonne of material processed.
Resource Update Details
The Copalquin Target 1 resource model was prepared under the supervision of Sims Resources LLC (Independent QP) in accordance with the CIM Definition Standards (2014) and Estimation of Mineral Resource and Mineral Reserve Best Practice guidelines (2019), which are materially identical to the JORC Code (2012).
The estimate incorporates results from 204 diamond drill holes totaling approximately 60,568 metres, including 127 drill holes totalling approximately 42,861 metres completed since the previous resource estimate. The recent drilling was primarily focused on:
- Increasing drill density within the core of the deposit to improve resource confidence;
- Extending known mineralised shoots along strike and down plunge;
- Testing interpreted extensions of high-grade structures; and
- Improving the geological model through enhanced structural understanding and dyke mapping.
The resource estimate has been prepared as a major de-risking milestone to serve as a valuable stepping stone towards future development of a mineable resource supported by an economic study. Application of the mine stope optimization process to constrain the block model by mining shapes has achieved several goals including the evaluation of realistic minimum mining widths on the deposit, evaluation of the continuity of the mineralisation along potential underground development levels and has provided understanding of a potential extractable grade that incorporates the mineralised dilution envelope surrounding the high grade core of the deposit.
An evaluation of gold price sensitivity on the mining shape constraints, on a diluted basis indicates a narrow band of output scenarios across a wide range of metal prices (Table 3). Evaluating the sensitivity scenarios on an undiluted basis (Table 1) reveals the high-grade core of the deposit that is driving the mining shapes.
With 95% of the undiluted and high grade core of the block model being captured by the mining shape constraints, there is opportunity to drill the remaining 5% of the block model to refine mineralisation boundaries for potential inclusion to future constrained mineral resource estimates.
Table 3 Gold price sensitivity to constraining shapes, reported using all contained blocks (diluted)
| Au Price | Classification | Tonnes | Gold | Silver | Gold Eq. | Gold | Silver | Gold Eq. |
| (USD) | (kt) | (g/t) | (g/t) | (g/t) | (koz) | (koz) | (koz) | |
| 2,700 | Ind | 2,939 | 3.52 | 85.9 | 4.75 | 333 | 8,114 | 449 |
| Inf | 1,187 | 2.53 | 83.4 | 3.72 | 97 | 3,183 | 142 | |
| 3,000 | Ind | 3,130 | 3.35 | 82.3 | 4.53 | 338 | 8,283 | 456 |
| Inf | 1,291 | 2.39 | 79.1 | 3.52 | 99 | 3,285 | 146 | |
| 3,300* | Ind | 3,391 | 3.15 | 77.8 | 4.26 | 343 | 8,479 | 464 |
| Inf | 1,436 | 2.23 | 73.6 | 3.28 | 103 | 3,398 | 151 | |
| 3,500 | Ind | 3,718 | 2.92 | 72.9 | 3.96 | 349 | 8,711 | 474 |
| Inf | 1,588 | 2.07 | 68.5 | 3.05 | 106 | 3,498 | 156 | |
| 4,000 | Ind | 4,149 | 2.67 | 67.2 | 3.63 | 356 | 8,965 | 484 |
| Inf | 1,815 | 1.88 | 62.4 | 2.77 | 110 | 3,640 | 162 |
Notes to Table 3:
Geological Description of Copalquin Target 1
The Copalquin project is targeting low sulfidation epithermal silver-gold mineralisation hosted in volcanic and subvolcanic rocks of Mexico's Sierra Madre Occidental. Mapping and diamond drilling activities have identified widespread quartz veining and stockworks surrounded by haloes of argillic (illite/smectite) alteration. Veins have formed as both low-angle semi-continuous lenses parallel to the contact between granodiorite and andesite and as tabular veins in high-angle normal faults with prominent east-west, and northwest-southeast orientations. Vein and breccia thickness has been observed locally up to 30 metres wide with average widths on the order of 0.5 to 4 metres. Semi-continuous mineralisation has been intersected by drilling along a northeast trending zone from El Gallo to Refugio, Cometa, Los Pinos, Los Reyes, La Montura to Constancia and Santa Cruz, totalling almost 7 kilometres in length. A sub-parallel trend in the southern area from southwest of Apomal (Target 5) to San Manuel and to Las Brujas-El Peru provides additional exploration potential up to 6km.
Drilling at the Target 1 area has been centred on the El Refugio and La Soledad areas. Channel sampling of two small historical mine workings in these areas confirmed high grade gold and silver mineralisation was contained in pillars and mine walls. Drilling activities initiated by Mithril in 2020 confirmed broad mineralisation in these zones.
A geological model for the Target 1 area, including mineralised veins, alteration haloes, non-mineralised host rock, and post-mineral dikes, was developed in Leapfrog Geo using interval selections completed on all core drillholes available. Interval selections consider qualitative logging data, gold and silver assays, and multi-element geochemistry. Surface and underground mapping, trench sampling, and soil samples were also used to validate the interpretation but were not used in estimation. High-grade mineralised domains were modelled using a 1 g/t AuEq cutoff and were restricted to modelled vein solids derived from the lithology model. A variable orientation search strategy was applied to accurately reflect undulations in modelled veins, with search orientations driven by the nearest vein midpoint surface. Post mineral dikes cut and displace mineralised veins in several areas, disrupting vein continuity and gold-silver mineralisation. These post-mineral dikes were assigned a grade of 0.0 g/t for both gold and silver to avoid over-estimation of mineralised material. An average bulk density of 2.56 t/m3 (+/- 0.014) has been applied to the mineralised volumes based on 247 measurements in quartz breccia collected by Mithril geologists.
Block Model Estimation Methodology
Geologic and estimation domains were constructed using Leapfrog Geo v.2026.1.1, including input from geochemical analyses completed in ioGAS v.8.3. Geostatistical evaluations and Exploratory Data Analysis ("EDA"), including topcut selection, declustering, and variography were completed using Snowden Supervisor v.9.2. Resource estimation was prepared using Leapfrog EDGE v.2026.1.1.
A single, non-rotated 2.5×2.5×2.5m block model was prepared for this resource estimate and for use in underground Mineable Shape Optimization. Gold and silver grades from diamond drill core samples were interpolated into the block model using inverse distance cubed ("ID3") estimation techniques. Search ellipse orientation and radii were selected based on variogram models for mineralised estimation domains, with variable search orientation applied according to the nearest vein midpoint surface in the Target 1 mineralised quartz vein and breccia model. Blocks were classified under the categories of "Indicated" and "Inferred" mineral resources, in accordance with the 2014 Canadian Institute of Mining, Metallurgy and Petroleum Standards for Mineral Resources and Mineral Reserves, Definitions and Guidelines, May 2014 (the "CIM Definition Standards"), which are materially identical to those used in the JORC Code (2012). The "Measured" resource category was not used in this estimate because no modern mining has been undertaken at the Project and it is therefore not possible to reconcile the estimate against production or tightly spaced data such as grade control drilling.
Mineral resources ("Mineral Resources") were reported below the most recent light detection and ranging ("LiDAR") topographic surface and are contained within economically constrained stope shapes generated using Datamine's Mineable Shape Optimizer ("MSO"). Historical mine workings were assigned a density of 0.0 g/cm3 to ensure exclusion of mined blocks from the Mineral Resource Estimate.
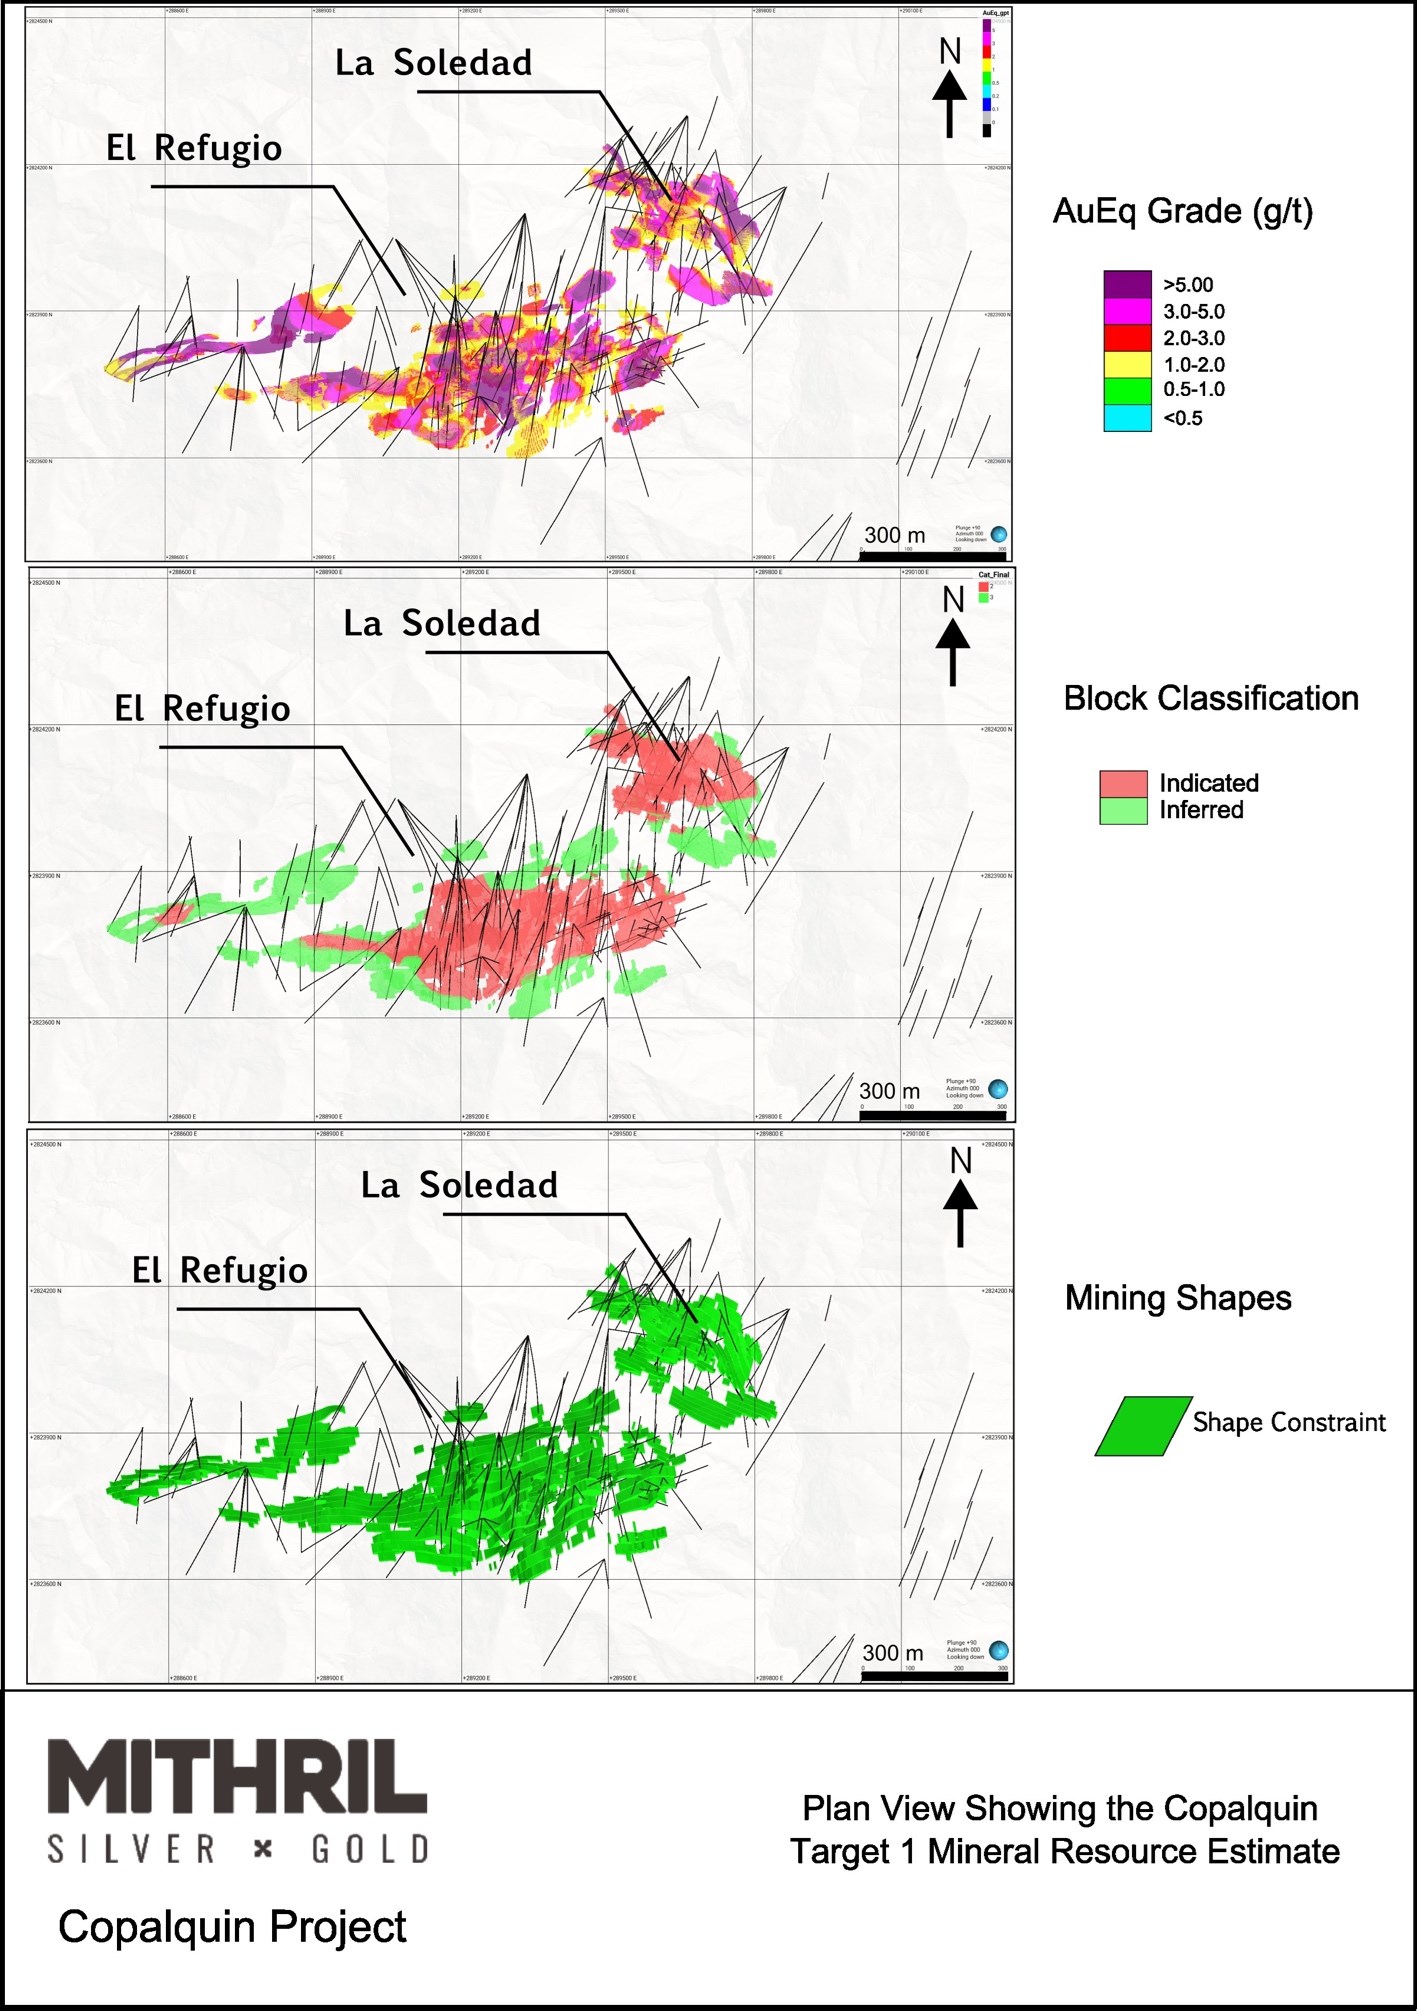
Figure 1: Series of plan view maps of the Mineral Resource Estimate showing: a) AuEq grade (g/t), b) block classification, and c) mining shapes used to constrain the block model
To view an enhanced version of this graphic, please visit:https://images.newsfilecorp.com/files/11657/303420_f43a72d644e83990_001full.jpg
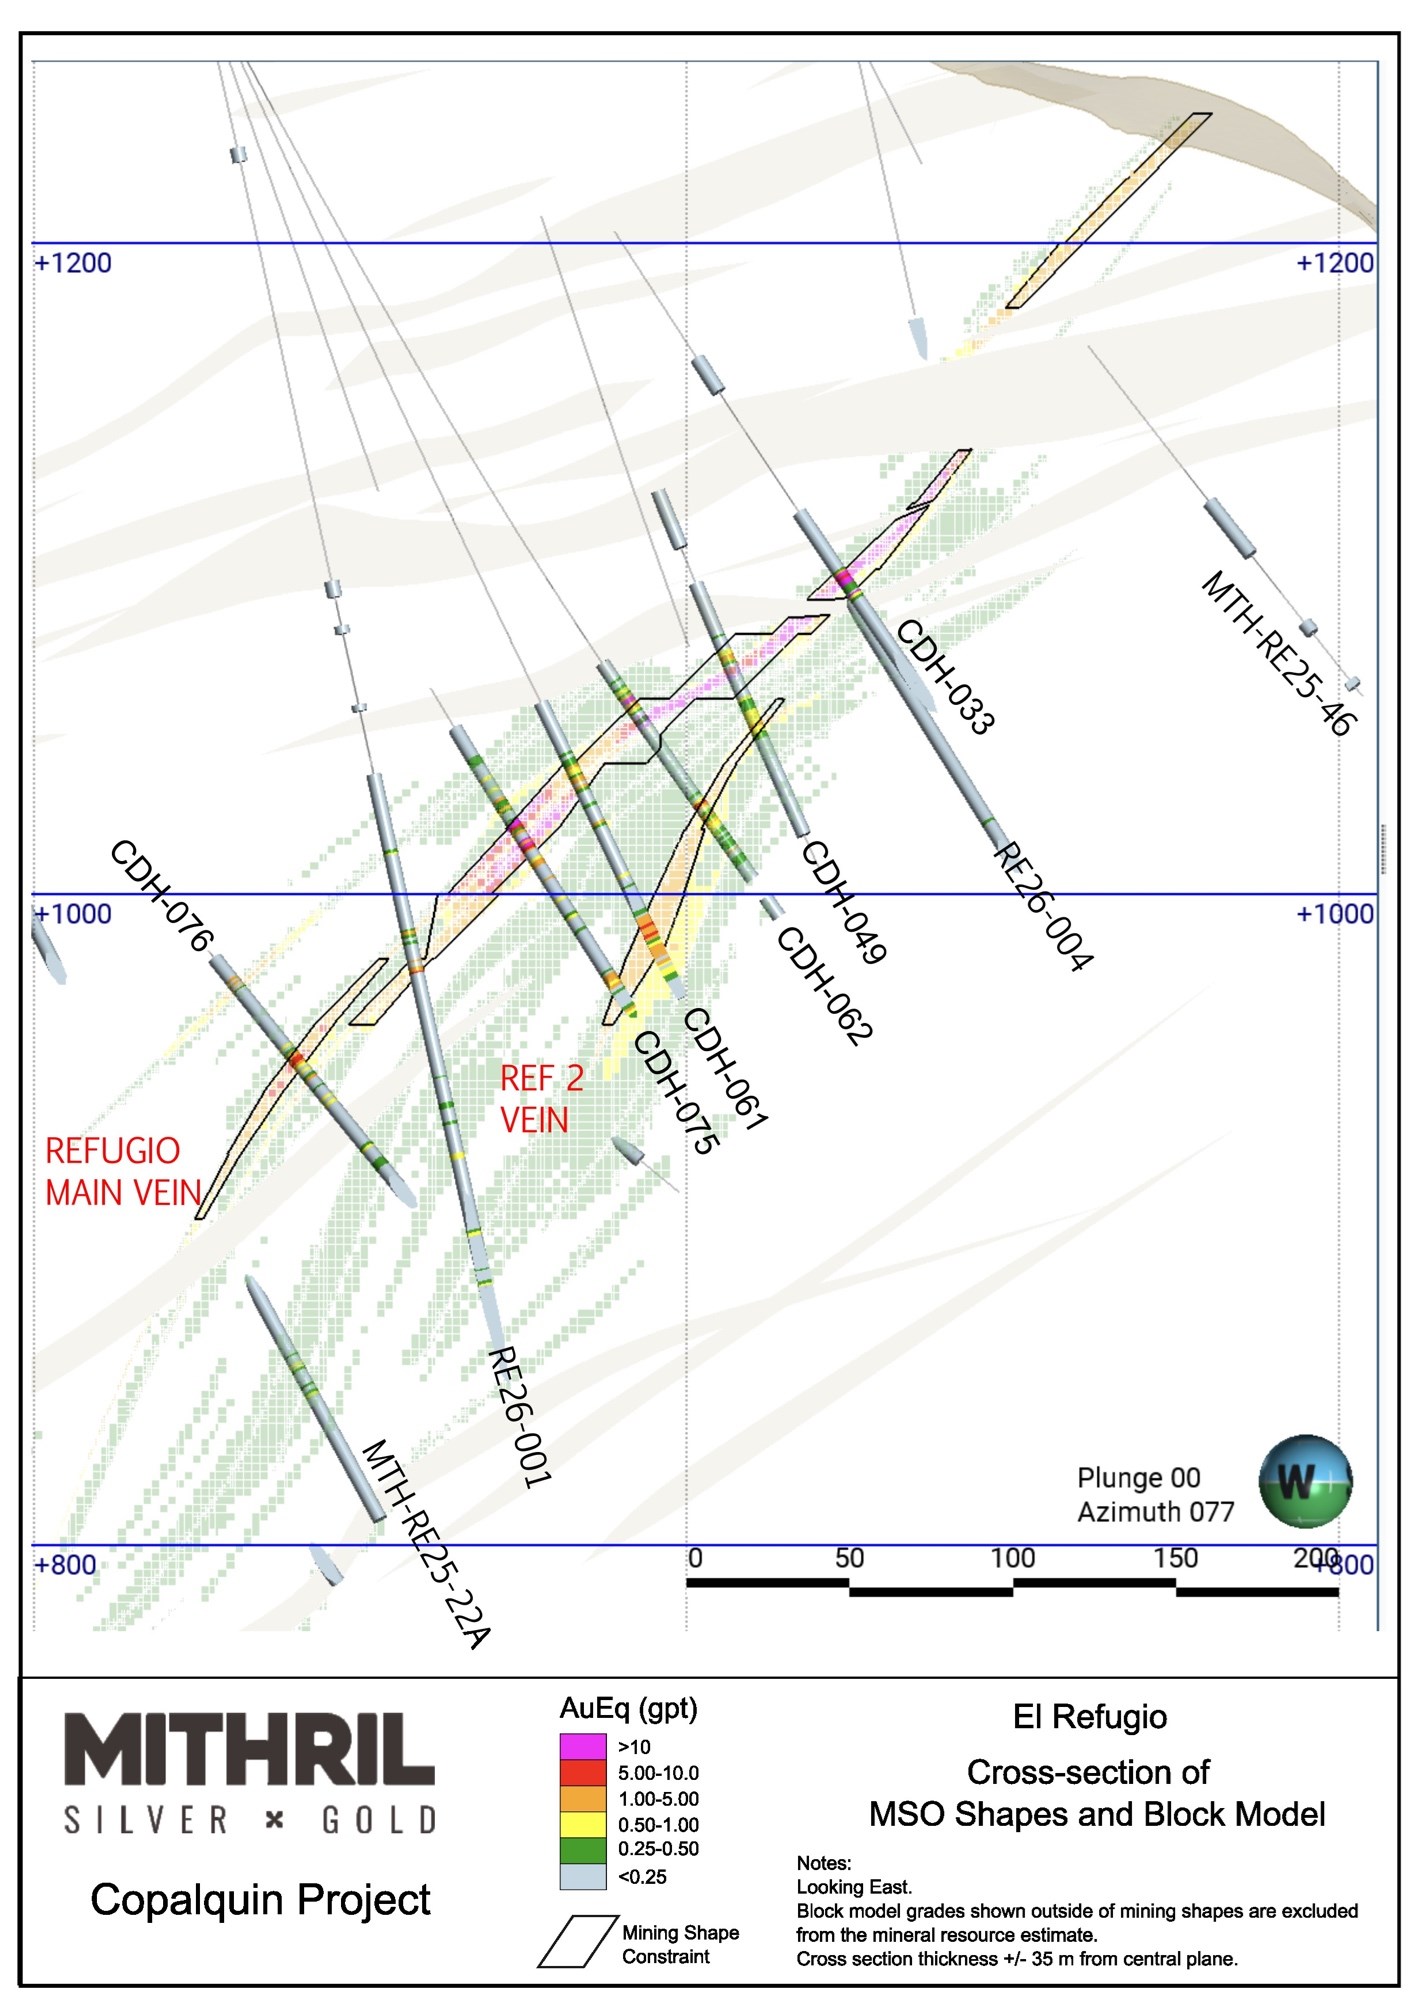
Figure 2: Cross- section view of El Refugio, looking east, showing the mineralised block model and the mining shape constraints used in the Mineral Resource Estimate
To view an enhanced version of this graphic, please visit:https://images.newsfilecorp.com/files/11657/303420_f43a72d644e83990_002full.jpg
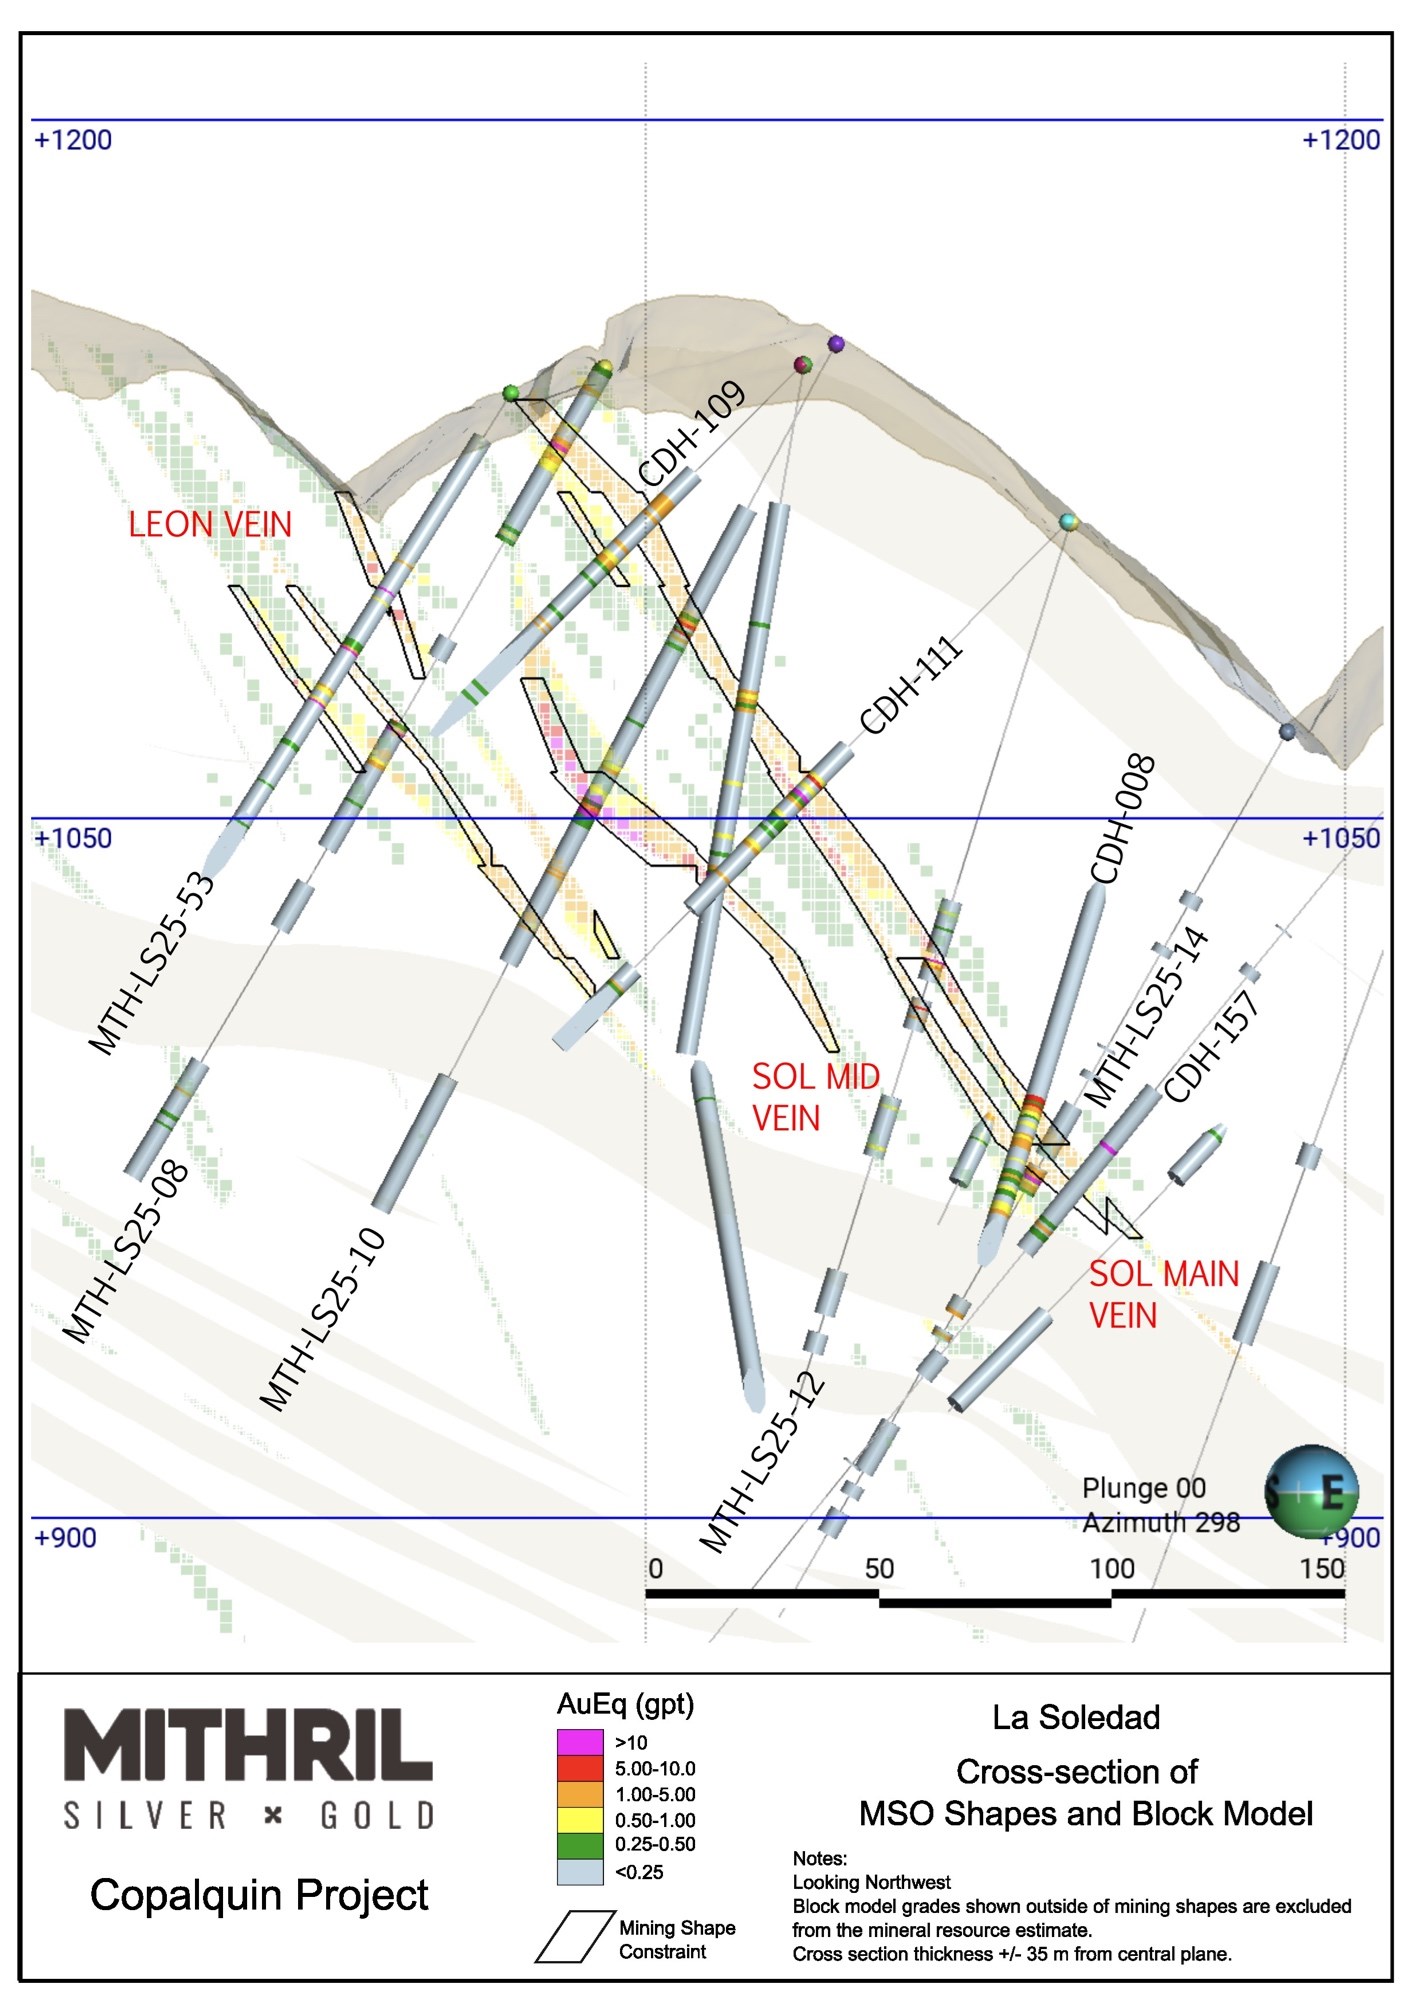
Figure 3: Cross- section view of La Soledad, looking northwest, showing the mineralised block model and the mining shape constraints used in the Mineral Resource Estimate
To view an enhanced version of this graphic, please visit:https://images.newsfilecorp.com/files/11657/303420_f43a72d644e83990_003full.jpg
Advancing the Copalquin District
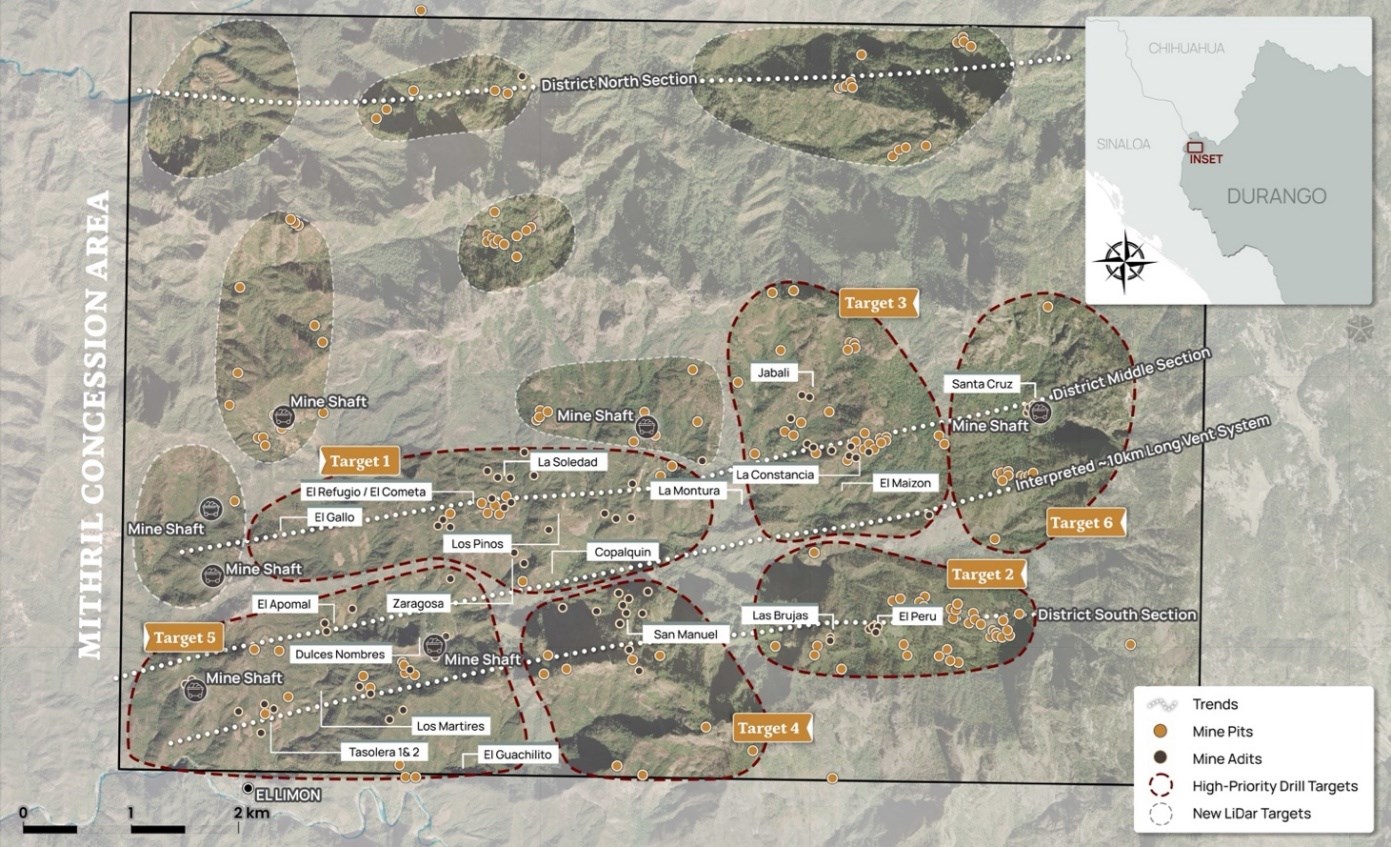
Target 1 represents only one of numerous mineralised targets identified within the broader Copalquin District. The Company continues to advance exploration activities across the district, including ongoing drilling at Targets 3 and 5 (Figure 5), where recent results have demonstrated the potential for additional high-grade silver and gold discoveries.
With the updated Target 1 resource now completed, Mithril intends to continue advancing engineering, metallurgical and development studies while pursuing resource growth opportunities across the district.
Two drills are currently active: one following up at Target 5 area and one testing the priority structural targets, with Target 1 westerly step out drilling to follow. Fully funded for further 12,000 metres of drilling for the remainder of 2026 aiming to progress Target 5 to an initial resource, expand Target 1 and progress the district geology model.
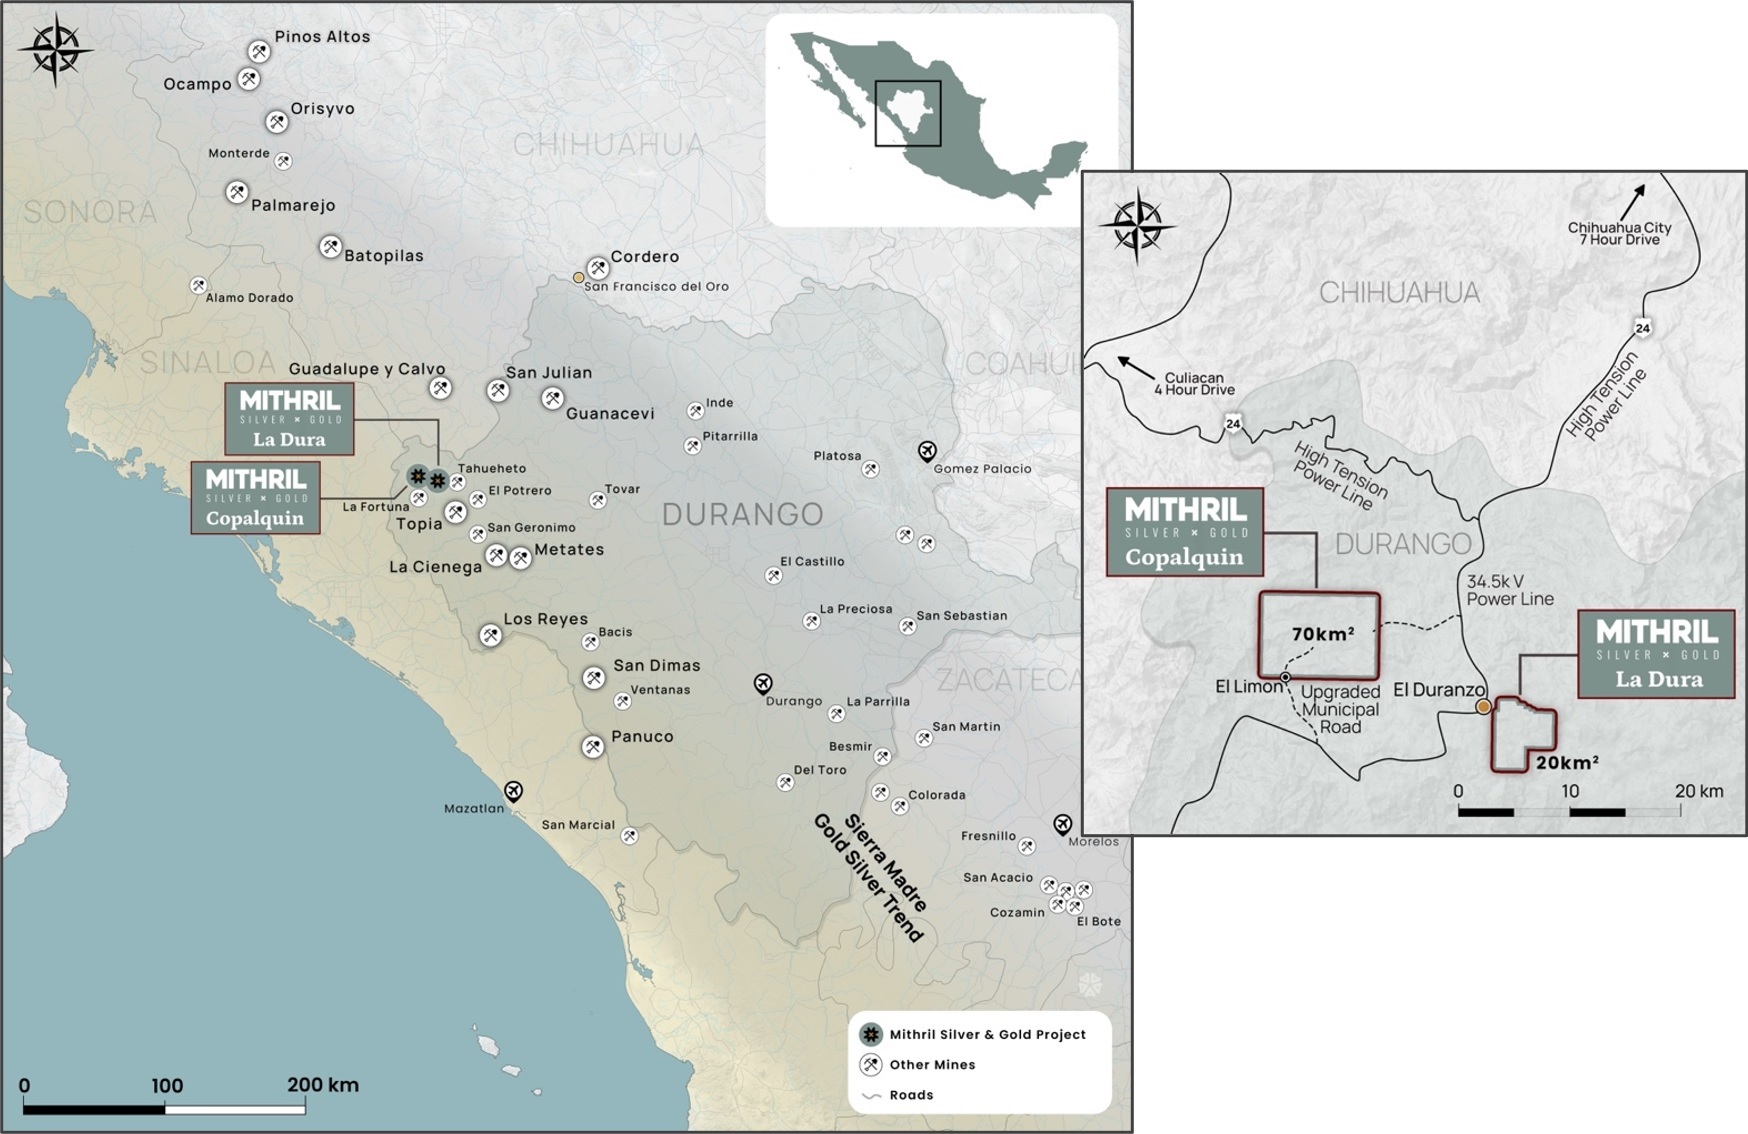
Figure 4: Mithril's Copalquin and La Dura property locations in Durango State, Mexico
To view an enhanced version of this graphic, please visit:https://images.newsfilecorp.com/files/11657/303420_303420mithrilfigurefour.jpg
Figure 5: LiDAR identified historic workings across the 70km2 district. Current drilling locations at Target 1, Target 3 and Target 5 with ongoing mapping and sampling plus recently completed aerial magnetic survey (report pending)
To view an enhanced version of this graphic, please visit:https://images.newsfilecorp.com/files/11657/303420_f43a72d644e83990_006full.jpg
ABOUT THE COPALQUIN SILVER GOLD PROJECT
The Copalquin mining district is located in Durango State, Mexico and covers an entire mining district of 70km2 containing several dozen historic silver and gold mines and workings, ten of which had notable production. The district is within the Sierra Madre Gold Silver Trend which extends north-south along the western side of Mexico and hosts many gold and silver districts.
Multiple mineralisation events, young intrusives thought to be system-driving heat sources, widespread alteration together with extensive surface vein exposures and dozens of historic mine workings, identify the Copalquin mining district as a major epithermal centre for gold and silver mineralisation.
Within 15 months of drilling in the Copalquin District, Mithril delivered a maiden JORC mineral resource estimate (the "2021 MRE", see ASX release 17 November 2021)) at the first of several target areas (Target 1), demonstrating the high-grade gold and silver resource potential for the district. The Upgraded Target 1 Mineral Resource Estimate (effective date June 29, 2026) presented in this release has completely revised and supersedes the 2021 MRE which may no longer be relied upon.
Mithril continues to advance exploration work on the Copalquin project with two active drill rigs, and field programs that are continuously expanding the mapping coverage from approximately 23 square kilometres completed to date of the 70 square kilometres of surfaces area within the concession.
A mining study (conceptual) and metallurgical test work supports the development of the El Refugio-La Soledad resource with conventional underground mining methods indicated as being appropriate and with high silver-gold recovery to produce metal on-site with conventional processing. The average vein width is approximately 4.0 metres.
Mithril is currently exploring in the Copalquin District to expand the resource footprint, to demonstrate its multi-million-ounce gold and silver potential. Mithril has an exclusive option to purchase 100% interest in the Copalquin mining concessions by paying US$10M on or any time before 7 August 2028.
-ENDS-
Released with the authority of the Board.
For further information contact:
| John SkeetManaging Director and CEOjskeet@mithrilsilvergold.com +61 435 766 809 | NIKLI COMMUNICATIONSCorporate Communicationsliz@mithrilsilvergold.com nicole@mithrilsilvergold.com |
The Australian Securities Exchange has not reviewed and does not accept responsibility for the accuracy or adequacy of this release.
Neither TSX Venture Exchange nor its Regulation Services Provider (as that term is defined in policies of the TSX Venture Exchange) accepts responsibility for the adequacy or accuracy of this release.
Competent Persons Statement (JORC), and Qualified Persons (NI 43-101) Statement
The information in this announcement that relates to metallurgical test results, mineral processing and project development and study work has been compiled, reviewed and approved by Mr John Skeet who is Mithril's CEO and Managing Director. Mr Skeet is a Fellow of the Australasian Institute of Mining and Metallurgy. This is a Recognised Professional Organisation (RPO) under the Joint Ore Reserves Committee (JORC) Code and Acceptable Foreign Association under NI 43-101.
Mr Skeet has sufficient experience of relevance to the styles of mineralisation and the types of deposits under consideration, and to the activities undertaken, to qualify as a Competent Person (non-independent) as defined in the 2012 Edition of the Joint Ore Reserves Committee (JORC) Australasian Code for Reporting of Exploration Results, Mineral Resources and Ore Reserves, and as a Qualified Person (non-independent) as defined by NI 43-101. Mr Skeet consents to the inclusion in this report of the matters based on information in the form and context in which it appears. The Australian Securities Exchange has not reviewed and does not accept responsibility for the accuracy or adequacy of this release.
The information in this announcement that relates to sampling techniques, sample data, exploration results and geological interpretation for Mithril's Mexican project, has been compiled, reviewed and approved by Mr James Barr who is Mithril's Vice President – Exploration. Mr Barr is a registered member and Professional Geologist (P.Geo.) of the Engineers and Geoscientists of British Columbia. This is a Recognised Professional Organisation (RPO) under the Joint Ore Reserves Committee (JORC) Code and recognized Canadian Professional Association under NI 43-101.
Mr Barr has sufficient experience of relevance to the styles of mineralisation and the types of deposits under consideration, and to the activities undertaken, to qualify as a Competent Person (non-independent) as defined in the 2012 Edition of the Joint Ore Reserves Committee (JORC) Australasian Code for Reporting of Exploration Results, Mineral Resources and Ore Reserves, and as a Qualified Person (non-independent) as defined by NI 43-101. Mr Barr consents to the inclusion in this report of the matters based on information in the form and context in which it appears.
The information in this announcement that relates to Mineral Resources has been compiled, reviewed and approved by Mr John Sims, a Certified Registered Geologist (CPG) with the American Institute of Professional Geologists (AIPG). This is a Recognised Professional Organisation (RPO) under the Joint Ore Reserves Committee (JORC) Code and Acceptable Foreign Association under NI 43-101.
Mr Sims is acting as the Competent Person (independent), as defined in the 2012 Edition of the Joint Ore Reserves Committee (JORC) Australasian Code for Reporting of Exploration Results, Mineral Resources and Ore Reserves, and as the Qualified Person (independent) as defined by NI 43-101, for the reporting of the Upgraded Copalquin Target 1 Mineral Resource Estimate, with effective date of June 29, 2026. A site visit was carried out by Mr Sims, between 5 May 2025 and 7 May 2025 to observe the drilling, logging, sampling and assay database. Mr Sims has reviewed and approved the contents of this report, and consents to the inclusion in this report of the matters based on information in the form and context in which it appears.
The relevant sections of "JORC Code, 2012 Edition – Table 1" as defined by the Joint Ore Reserves Committee (JORC) Code are incorporated into this Public Report.
A NI 43-101 Technical Report entitled "Technical Report and Upgraded Mineral Resource Estimate for the Copalquin Target 1 Area, Durango, Mexico" will be filed on SEDAR+ within 45 days of this news release.
Sample Analytical Procedures and Quality Assurance/Quality Control:
Drill core logging, sample collection, chain of custody, preparation and assaying of drilling samples from the Copalquin project are done with strict adherence to a Quality Assurance/Quality Control (QA/QC) protocol.
All drill core is logged and sampled by Mithril geologists. Samples lengths are selected to respect important geological contacts, to a minimum length of 0.50m. Drill core is cut longitudinally in half along an oriented drill core line. One half of the core is retained for company record, and the opposing half is sent for laboratory analysis.
All samples are delivered to ALS Minerals for preparation in Chihuahua City, Chihuahua, Mexico for preparation, then internally delivered to ALS Minerals located in North Vancouver, British Columbia, Canada, for analysis and reporting.
Samples are prepared using ALS Minerals Prep-31 crushing (70% passing 2mm), splitting and pulverizing (85% passing 75um, 250g). All samples are submitted for 34 element trace ICP-AES analysis using a four-acid digestion (ME-ICP61), and for 30g gold fire assay with atomic adsorption analysis (Au-AA23). Samples exceeding silver grades of 100 ppm are sent for ore grade analysis (Ag-OG62), and samples with silver grades exceeding 1,500 ppm are sent for fire assay and gravimetric determination (Ag-GRA21). Samples with gold grades exceeding 10 ppm are send for fire assay and gravimetric determination (Au-GRA21). Samples with copper, lead or zinc grades exceeding 10,000 ppm are sent for overlimit analysis using four acid digestion and ICP-AES detection (OG61).
Standards and blanks are inserted at a rate of one per every 25 samples and one per every 40 samples, respectively. Laboratory pulp duplicates are selected by Mithril geologists and requested with each batch of samples.
Analytical certificates are imported directly to the Company's database and reviewed for quality assurance by independent and internal company geologists prior to approved.
JORC Code, 2012 Edition – Table 1
Section 1 Sampling Techniques and Data
| Criteria | JORC Code explanation | Commentary |
| Sampling techniques |
|
|
| Drilling techniques |
|
|
| Drill sample recovery |
|
|
| Logging |
|
|
| Sub-sampling techniques and sample preparation |
|
|
| Quality of assay data and laboratory tests |
|
|
| Verification of sampling and assaying |
|
|
| Location of data points |
|
|
| Data spacing and distribution |
|
|
| Orientation of data in relation to geological structure |
|
|
| Sample security |
|
|
| Audits or reviews |
|
|
Section 2 Reporting of Exploration Results
| Criteria | JORC Code explanation | Commentary | |||||||||||
| Mineral tenement and land tenure status |
|
|
|||||||||||
| No. | Concession | Concession Title number | Area (Ha) | Location | |||||||||
| 1 | LA SOLEDAD | 52033 | 6 | Tamazula, Durango, Mexico | |||||||||
| 2 | EL COMETA | 164869 | 36 | Tamazula, Durango, Mexico | |||||||||
| 3 | SAN MANUEL | 165451 | 36 | Tamazula, Durango, Mexico | |||||||||
| 4 | COPALQUIN | 178014 | 20 | Tamazula, Durango, Mexico | |||||||||
| 5 | EL SOL | 236130 | 6,000 | Tamazula, Durango and Badiraguato, Sinaloa, México | |||||||||
| 6 | EL CORRAL | 236131 | 907.3243 | Tamazula, Durango and Badiraguato, Sinaloa, México | |||||||||
| Exploration done by other parties |
|
|
|||||||||||
| Geology |
|
|
|||||||||||
| Drill hole Information |
|
|
|||||||||||
| Data aggregation methods |
|
|
|||||||||||||
| AuRaw | silverraw | Length(m) | Au*length | silver*length | |||||||||||
| 7.51 | 678 | 0.5 | 3.755 | 339 | |||||||||||
| 11.85 | 425 | 0.55 | 6.5175 | 233.75 | |||||||||||
| 0 | 0 | 0 | 0 | 0 | |||||||||||
| 0.306 | 16 | 1 | 0.306 | 16 | |||||||||||
| 0.364 | 31.7 | 1 | 0.364 | 31.7 | |||||||||||
| 3.15 | 241 | 0.5 | 1.575 | 120.5 | |||||||||||
| 10.7 | 709 | 0.5 | 5.35 | 354.5 | |||||||||||
| 15.6 | 773 | 0.5 | 7.8 | 386.5 | |||||||||||
| From | To | Length | Aug/t | silverg/t | |||||||||||
| 4.55 | 25.667 | 1481.9 | 91.95 | 96.5 | 4.55 | 5.64 | 325.7 | ||||||||
|
|||||||||||||||
| Relationship between mineralisation widths and intercept lengths |
|
|
|||||||||||||
| Diagrams |
|
|
|||||||||||||
| Balanced reporting |
|
|
|||||||||||||
| Other substantive exploration data |
|
|
|||||||||||||
| Further work |
|
|
|||||||||||||
Section 3 Estimation and Reporting of Mineral Resources
| Criteria | JORC Code explanation | Commentary |
| Database integrity |
|
|
| Site visits |
|
|
| Geological interpretation |
|
|
| Dimensions |
|
|
| Estimation and modelling techniques |
|
|
| Moisture |
|
|
| Cut-off parameters |
|
|
| Mining factors or assumptions |
|
|
| Metallurgical factors or assumptions |
|
|
| Environmental factors or assumptions |
|
|
| Bulk density |
|
|
| Classification |
|
|
| Audits or reviews |
|
|
| Discussion of relative accuracy/ confidence |
|
|
1 See ASX announcement dated 25 February 2022, "Further Excellent Metallurgy Results – Copalquin District, Mexico"
2 See ASX announcement dated 25 February 2022, "Further Excellent Metallurgy Results – Copalquin District, Mexico"
To view the source version of this press release, please visit https://www.newsfilecorp.com/release/303420
Just because a business does not make any money, does not mean that the stock will go down. For example, although Amazon.com made losses for many years after listing, if you had bought and held the shares since 1999, you would have made a fortune. But the harsh reality is that very many loss making companies burn through all their cash and go bankrupt.
So should Mithril Silver and Gold (ASX:MTH) shareholders be worried about its cash burn? For the purposes of this article, cash burn is the annual rate at which an unprofitable company spends cash to fund its growth; its negative free cash flow. The first step is to compare its cash burn with its cash reserves, to give us its 'cash runway'.
How Long Is Mithril Silver and Gold's Cash Runway?
A company's cash runway is the amount of time it would take to burn through its cash reserves at its current cash burn rate. In March 2026, Mithril Silver and Gold had AU$11m in cash, and was debt-free. In the last year, its cash burn was AU$16m. So it had a cash runway of approximately 8 months from March 2026. To be frank, this kind of short runway puts us on edge, as it indicates the company must reduce its cash burn significantly, or else raise cash imminently. Depicted below, you can see how its cash holdings have changed over time.
ASX:MTH Debt to Equity History June 7th 2026
See our latest analysis for Mithril Silver and Gold
How Is Mithril Silver and Gold's Cash Burn Changing Over Time?
Mithril Silver and Gold didn't record any revenue over the last year, indicating that it's an early stage company still developing its business. So while we can't look to sales to understand growth, we can look at how the cash burn is changing to understand how expenditure is trending over time. During the last twelve months, its cash burn actually ramped up 87%. While this spending increase is no doubt intended to drive growth, if the trend continues the company's cash runway will shrink very quickly. Mithril Silver and Gold makes us a little nervous due to its lack of substantial operating revenue. We prefer most of the stocks on this list of stocks that analysts expect to grow.
How Easily Can Mithril Silver and Gold Raise Cash?
Given its cash burn trajectory, Mithril Silver and Gold shareholders should already be thinking about how easy it might be for it to raise further cash in the future. Companies can raise capital through either debt or equity. One of the main advantages held by publicly listed companies is that they can sell shares to investors to raise cash and fund growth. By comparing a company's annual cash burn to its total market capitalisation, we can estimate roughly how many shares it would have to issue in order to run the company for another year (at the same burn rate).
Since it has a market capitalisation of AU$52m, Mithril Silver and Gold's AU$16m in cash burn equates to about 32% of its market value. That's fairly notable cash burn, so if the company had to sell shares to cover the cost of another year's operations, shareholders would suffer some costly dilution.
How Risky Is Mithril Silver and Gold's Cash Burn Situation?
Mithril Silver and Gold is not in a great position when it comes to its cash burn situation. Although we can understand if some shareholders find its cash burn relative to its market cap acceptable, we can't ignore the fact that we consider its increasing cash burn to be downright troublesome. After looking at that range of measures, we think shareholders should be extremely attentive to how the company is using its cash, as the cash burn makes us uncomfortable. Separately, we looked at different risks affecting the company and spotted 6 warning signs for Mithril Silver and Gold (of which 3 can't be ignored!) you should know about.
Of course, you might find a fantastic investment by looking elsewhere. So take a peek at this free list of companies with significant insider holdings, and this list of stocks growth stocks (according to analyst forecasts)
Have feedback on this article? Concerned about the content? Get in touch with us directly. Alternatively, email editorial-team (at) simplywallst.com.This article by Simply Wall St is general in nature. We provide commentary based on historical data and analyst forecasts only using an unbiased methodology and our articles are not intended to be financial advice. It does not constitute a recommendation to buy or sell any stock, and does not take account of your objectives, or your financial situation. We aim to bring you long-term focused analysis driven by fundamental data. Note that our analysis may not factor in the latest price-sensitive company announcements or qualitative material. Simply Wall St has no position in any stocks mentioned.
Vancouver, British Columbia–(Newsfile Corp. – May 19, 2026) – Golden Arrow Resources Corporation (TSXV: GRG) (FSE: G6A) (OTCQB: GARWF), ("Golden Arrow" or the "Company") announces that it has adopted semi-annual financial reporting ("SAR") pursuant to Coordinated Blanket Order 51-933 – Exemptions to Permit Semi-Annual Reporting for Certain Venture Issuers (the "Blanket Order") issued by the British Columbia Securities Commission on March 19, 2026.
The Blanket Order allows eligible venture issuers listed on the TSX Venture Exchange (the "TSXV") to voluntarily move from a quarterly to a semi-annual financial reporting framework. By adopting SAR, the Company aims to reduce the administrative and financial burden associated with quarterly reporting.
The Company's fiscal year ends on December 31. Under the SAR pilot program, the Company will no longer file interim financial reports and related Management's Discussion & Analysis ("MD&A") for its three-month and nine-month interim periods. The initial interim period for which the Company will not file is the three-month period ended March 31, 2026.
The Company will continue to file audited annual financial statements and MD&A (due 120 days after December 31) and unaudited six-month financial statements and MD&A (due 60 days after June 30).
The Company remains committed to timely disclosure and will continue to report all material changes and significant developments as required under National Instrument 51-102 – Continuous Disclosure Obligations and the policies of the TSXV.
This news release is being issued and filed pursuant to the Blanket Order.
About Golden Arrow:
Golden Arrow is a mining exploration company with a successful track record of creating value by making precious and base metal discoveries and advancing them into exceptional deposits.
Golden Arrow is actively exploring its flagship property, the advanced San Pietro iron oxide-copper-gold-cobalt project in Chile, and a portfolio that includes nearly 125,000 hectares of prospective properties in Argentina.
The Company is a member of the Grosso Group, a resource management group that has pioneered exploration in Argentina since 1993.
ON BEHALF OF THE BOARD
"Nikolaos Cacos"_______________________________
Mr. Nikolaos Cacos, President and CEO
For further information, please contact:
Corporate CommunicationsTel: 1-604-687-1828 Toll-Free: 1-800-901-0058Email: info@goldenarrowresources.com
Neither the TSXV nor its Regulation Services Provider (as that term is defined in policies of the TSXV) accepts responsibility for the adequacy or accuracy of this release.
Certain statements contained in this news release constitute forward-looking statements within the meaning of Canadian securities legislation. All statements included herein, other than statements of historical fact, are forward-looking statements and include, without limitation, statements about the Company's adoption of semi-annual financial reporting. Often, but not always, these forward-looking statements can be identified by the use of words such as "estimate", "estimates", "estimated", "potential", "open", "future", "assumed", "projected", "used", "detailed", "has been", "gain", "upgraded", "offset", "limited", "contained", "reflecting", "containing", "remaining", "to be", "periodically", or statements that events, "could" or "should" occur or be achieved and similar expressions, including negative variations.
Forward-looking statements involve known and unknown risks, uncertainties and other factors which may cause the actual results, performance or achievements of the Company to be materially different from any results, performance or achievements expressed or implied by forward-looking statements. Such uncertainties and factors include, among others, whether the Company will continue to meet the SAR pilot program eligibility criteria; changes in general economic conditions and financial markets; the Company or any joint venture partner not having the financial ability to meet its exploration and development goals; risks associated with the results of exploration and development activities, estimation of mineral resources and the geology, grade and continuity of mineral deposits; unanticipated costs and expenses; and such other risks detailed from time to time in the Company's quarterly and annual filings with securities regulators and available under the Company's profile on SEDAR+ at www.sedarplus.ca. Although the Company has attempted to identify important factors that could cause actual actions, events or results to differ materially from those described in forward-looking statements, there may be other factors that cause actions, events or results to differ from those anticipated, estimated or intended.
Forward-looking statements contained herein are based on the assumptions, beliefs, expectations and opinions of management, including but not limited to: that the Company will continue to meet the SAR pilot program eligibility criteria; that the Company's stated goals and the planned exploration and development activities at its properties will be achieved; that there will be no material adverse change affecting the Company or its properties; and such other assumptions as set out herein. Forward-looking statements are made as of the date hereof and the Company disclaims any obligation to update any forward-looking statements, whether as a result of new information, future events or results or otherwise, except as required by law. There can be no assurance that forward-looking statements will prove to be accurate, as actual results and future events could differ materially from those anticipated in such statements. Accordingly, investors should not place undue reliance on forward-looking statements.
To view the source version of this press release, please visit https://www.newsfilecorp.com/release/297660
Vancouver, British Columbia–(Newsfile Corp. – April 23, 2026) – Golden Arrow Resources Corporation (TSXV: GRG) (FSE: G6A) (OTCQB: GARWF) ("Golden Arrow" or the "Company") announces the appointment of Ignacio Celorrio as a director of the Company. Mr. Celorrio serves as President of Desarrollo de Recursos S.A. a wholly owned subsidiary of the Company.
Ignacio Celorrio is a highly respected figure in the Latin Americas mining industry, currently serving as Executive Vice-President of Legal, Government, and External Affairs at Lithium Argentina. He also co-chairs the Martinez de Hoz/Rueda law firm mining department, one of the leading law firms in Argentina. With over 25 years of professional experience, Ignacio has established himself as a trusted legal advisor, specialising in mining law, administrative law, energy law, and corporate regulations. His career has spanned Argentina, Canada, and Australia, working closely with governments, NGOs, and private stakeholders to shape the future of mining and energy development. A former president of Lithium Americas' LATAM division, he has participated in the structuring, construction and commissioning of the Cauchari Olaroz project in Jujuy (Argentina), which as of 2026 is the largest lithium project in Argentina. Ignacio has been a Director of the Argentine Mining Chamber for more than fifteen years and a member of many other mining LATAM institutions. In addition to his extensive professional experience, he has a solid academic background from the Universidad Católica Argentina, the Universidad Austral and the Law School of the University of Buenos Aires.
Niko Cacos, Golden Arrow President & CEO stated, "On behalf of the Board of Directors, I am pleased to extend a warm welcome to Ignacio as Golden Arrow's newest board member. He has been an important part of the team in Argentina for many years, where his counsel has helped the Company successfully acquire and monetize assets. His extensive experience in the Latin America mining sector and strong legal and strategic background will continue to have an invaluable positive impact as we create new opportunities for shareholder value."
About Golden Arrow:
Golden Arrow is a mining exploration company with a successful track record of creating value by making precious and base metal discoveries and advancing them into exceptional deposits.
Golden Arrow is actively exploring its flagship property, the advanced San Pietro iron oxide-copper-gold-cobalt project in Chile, and a portfolio that includes nearly 125,000 hectares of prospective properties in Argentina.
The Company is a member of the Grosso Group, a resource management group that has pioneered exploration in Argentina since 1993.
ON BEHALF OF THE BOARD
"Nikolaos Cacos"
_______________________________Mr. Nikolaos Cacos, President and CEO
For further information, please contact:
Corporate CommunicationsTel: 1-604-687-1828 Toll-Free: 1-800-901-0058Email: info@goldenarrowresources.com
Neither the TSXV nor its Regulation Services Provider (as that term is defined in policies of the TSXV) accepts responsibility for the adequacy or accuracy of this release.
To view the source version of this press release, please visit https://www.newsfilecorp.com/release/293898
Vancouver, British Columbia–(Newsfile Corp. – April 22, 2026) – Golden Arrow Resources Corporation (TSXV: GRG) (FSE: G6A) (OTCQB: GARWF) ("Golden Arrow" or the "Company") announces the retirement of Joseph Grosso as Chair & Director of the Company, effective April 21, 2026. In recognition of his visionary leadership of Golden Arrow, Mr. Grosso has been given the honorary title of Director Emeritus. Mr. Grosso will continue to serve Golden Arrow and its shareholders as an advisor.
Mr. Grosso spearheaded Golden Arrow's success from the Company's inception. He has been a stalwart supporter and widely-recognized contributor to the continued expansion of mineral exploration in Argentina and he has done so with mindfulness of the communities and environment in which the Company works. Mr. Grosso formed Golden Arrow originally to capitalize on the Gualcamayo property royalty. That transaction supported the exploration and discovery of Chinchillas, a major silver deposit in northern Argentina. After successfully selling Chinchillas, Joe endorsed the expansion of the Company into Chile, leading to another significant deposit discovery at the current flagship San Pietro copper-gold project.
Niko Cacos, Golden Arrow President & CEO, stated, "Under Joe's guidance, the Company built a pipeline of projects that has repeatedly resulted in significant discoveries and transactions, and which continues to flourish. Joe's leadership has sustained the Company and led to success even during some of the toughest markets, including through the Covid-19 pandemic and financial crisis. Most importantly, he has built a team both here in Canada and in South America who are committed to continuing his legacy of exploration, discovery and value creation. Joe remains a large shareholder who is dedicated to the Company's future, and we look forward to his contributions as a Senior Advisor while we all wish him the very best in retirement."
About Golden Arrow:
Golden Arrow is a mining exploration company with a successful track record of creating value by making precious and base metal discoveries and advancing them into exceptional deposits.
Golden Arrow is actively exploring its flagship property, the advanced San Pietro iron oxide-copper-gold-cobalt project in Chile, and a portfolio that includes nearly 125,000 hectares of prospective properties in Argentina.
The Company is a member of the Grosso Group, a resource management group that has pioneered exploration in Argentina since 1993.
ON BEHALF OF THE BOARD
"Nikolaos Cacos"
_______________________________Mr. Nikolaos Cacos, President and CEO
For further information, please contact:
Corporate CommunicationsTel: 1-604-687-1828 Toll-Free: 1-800-901-0058Email: info@goldenarrowresources.com
Neither the TSXV nor its Regulation Services Provider (as that term is defined in policies of the TSXV) accepts responsibility for the adequacy or accuracy of this release.
To view the source version of this press release, please visit https://www.newsfilecorp.com/release/293752
Just because a business does not make any money, does not mean that the stock will go down. For example, biotech and mining exploration companies often lose money for years before finding success with a new treatment or mineral discovery. Nonetheless, only a fool would ignore the risk that a loss making company burns through its cash too quickly.
Given this risk, we thought we'd take a look at whether Mithril Silver and Gold (ASX:MTH) shareholders should be worried about its cash burn. For the purpose of this article, we'll define cash burn as the amount of cash the company is spending each year to fund its growth (also called its negative free cash flow). Let's start with an examination of the business' cash, relative to its cash burn.
When Might Mithril Silver and Gold Run Out Of Money?
A cash runway is defined as the length of time it would take a company to run out of money if it kept spending at its current rate of cash burn. In September 2025, Mithril Silver and Gold had AU$18m in cash, and was debt-free. Looking at the last year, the company burnt through AU$14m. That means it had a cash runway of around 16 months as of September 2025. While that cash runway isn't too concerning, sensible holders would be peering into the distance, and considering what happens if the company runs out of cash. You can see how its cash balance has changed over time in the image below.
ASX:MTH Debt to Equity History December 29th 2025
Check out our latest analysis for Mithril Silver and Gold
How Is Mithril Silver and Gold's Cash Burn Changing Over Time?
Mithril Silver and Gold didn't record any revenue over the last year, indicating that it's an early stage company still developing its business. Nonetheless, we can still examine its cash burn trajectory as part of our assessment of its cash burn situation. The skyrocketing cash burn up 181% year on year certainly tests our nerves. It's fair to say that sort of rate of increase cannot be maintained for very long, without putting pressure on the balance sheet. Admittedly, we're a bit cautious of Mithril Silver and Gold due to its lack of significant operating revenues. So we'd generally prefer stocks from this list of stocks that have analysts forecasting growth.
Can Mithril Silver and Gold Raise More Cash Easily?
While Mithril Silver and Gold does have a solid cash runway, its cash burn trajectory may have some shareholders thinking ahead to when the company may need to raise more cash. Issuing new shares, or taking on debt, are the most common ways for a listed company to raise more money for its business. One of the main advantages held by publicly listed companies is that they can sell shares to investors to raise cash and fund growth. By comparing a company's annual cash burn to its total market capitalisation, we can estimate roughly how many shares it would have to issue in order to run the company for another year (at the same burn rate).
Mithril Silver and Gold has a market capitalisation of AU$115m and burnt through AU$14m last year, which is 12% of the company's market value. Given that situation, it's fair to say the company wouldn't have much trouble raising more cash for growth, but shareholders would be somewhat diluted.
So, Should We Worry About Mithril Silver and Gold's Cash Burn?
On this analysis of Mithril Silver and Gold's cash burn, we think its cash burn relative to its market cap was reassuring, while its increasing cash burn has us a bit worried. We don't think its cash burn is particularly problematic, but after considering the range of factors in this article, we do think shareholders should be monitoring how it changes over time. Separately, we looked at different risks affecting the company and spotted 6 warning signs for Mithril Silver and Gold (of which 3 don't sit too well with us!) you should know about.
Of course Mithril Silver and Gold may not be the best stock to buy. So you may wish to see this free collection of companies boasting high return on equity, or this list of stocks with high insider ownership.
Have feedback on this article? Concerned about the content? Get in touch with us directly. Alternatively, email editorial-team (at) simplywallst.com.This article by Simply Wall St is general in nature. We provide commentary based on historical data and analyst forecasts only using an unbiased methodology and our articles are not intended to be financial advice. It does not constitute a recommendation to buy or sell any stock, and does not take account of your objectives, or your financial situation. We aim to bring you long-term focused analysis driven by fundamental data. Note that our analysis may not factor in the latest price-sensitive company announcements or qualitative material. Simply Wall St has no position in any stocks mentioned.
Halifax, Nova Scotia–(Newsfile Corp. – December 11, 2025) – GoGold Resources Inc. (TSX: GGD) (OTCQX: GLGDF) ("GoGold", "the Company") announces the financial results for the year ending September 30, 2025, with Parral revenue doubling, generating a record $72.5 million (all amounts are in U.S. dollars) from the sale of 2.1 million silver equivalent ounces.
"Parral had a banner year for us, producing record revenues of $73 million, driving cash flows from operations of $26 million and net income of $17 million. In 2025, we realized a silver selling price of $33/oz, so with silver prices currently above $55/oz the outlook for 2026 is very strong," said Brad Langille, President and CEO. "With our $143 million CAD bought deal financing completed last month, we currently have over $240 million USD in cash, and no debt. With our strong balance sheet, and our feasibility study estimating capital costs of $227 million for the construction of Los Ricos South, we are substantially de-risked for the execution phase of the project in 2026. Another substantial advantage for our Company is the flexibility to aggressively advance Los Ricos North towards feasibility and permitting as we are constructing the South. We believe that this aggressive plan will realize maximum shareholder value from these historically strong commodity prices."
Highlights for the year ending September 30, 2025:
- Cash of $141.1 million USD
- Revenue of $72.5 million on the sale of 2.1 million silver equivalent ounces at an average realized price per ounce of $33.80 USD
- Net income of $17.3 million
- Production of 2,150,192 silver equivalent ounces, consisting of 851,102 silver ounces, 12,289 gold ounces, 476 copper tonnes, 609 zinc tonnes
- Adjusted cash cost per silver equivalent ounce of $18.35
- Adjusted all in sustaining cost per silver equivalent ounce of $23.72
Following are tables showing summarized financial information and key performance indicators:
| Summarized Consolidated Financial Information | Three months ended Sep 30 | Year ended Sep 30 | ||
| (in thousands USD, except per share amounts) | 2025 | 2024 | 2025 | 2024 |
| Revenue | $ 18,095 | $ 10,406 | $ 72,503 | $ 36,503 |
| Cost of sales, including depreciation | 9,212 | 7,139 | 43,959 | 24,313 |
| Operating income | 5,204 | 4,021 | 17,089 | 5,622 |
| Net income | 5,893 | 719 | 17,331 | 1,580 |
| Basic net income per share | 0.018 | 0.002 | 0.048 | 0.005 |
| Cash flow from (used in) operations | 5,391 | (1,371) | 25,650 | (11,263) |
| Key Performance Indicators1 | Three months ended Sep 30 | Year ended Sep 30 | ||
| (in thousands USD, except per ounce amounts) | 2025 | 2024 | 2025 | 2024 |
| Total tonnes stacked | 416,560 | 363,695 | 1,612,142 | 1,587,360 |
| Silver equivalent ounces sold | 435,522 | 362,314 | 2,144,938 | 1,406,660 |
| Adjusted AISC per silver equivalent ounce2 | $ 27.60 | $ 23.26 | $ 23.72 | $ 24.15 |
| Adjusted Cash cost per silver equivalent ounce2 | $ 18.95 | $ 17.71 | $ 18.35 | $ 17.62 |
| Realized silver price | $ 41.55 | $ 28.64 | $ 33.80 | $ 25.95 |
1Key performance indicators are unaudited non-GAAP measures, see reconciliation in MD&A.2Gold, copper and zinc are converted using average market prices.
This news release should be read in conjunction with the consolidated financial statements for the year ended September 30, 2025, notes to the financial statements, and management's discussion and analysis for the year ended September 30, 2025, which have been filed on SEDAR and are available on the Company's website. The Company's annual information form has also been filed and is available on SEDAR and the Company's website.
Technical information contained in this news release with respect to GoGold has been reviewed and approved by Mr. Bob Harris, P.Eng., who is a qualified person for the purposes of NI 43-101.
About GoGold ResourcesGoGold Resources (TSX: GGD) is a Canadian-based silver and gold producer focused on operating, developing, exploring and acquiring high quality projects in Mexico. The Company operates the Parral Tailings mine in the state of Chihuahua and has the Los Ricos South and Los Ricos North exploration projects in the state of Jalisco. Headquartered in Halifax, NS, GoGold is building a portfolio of low cost, high margin projects. For more information visit gogoldresources.com.
For further information please contact:
Steve Low, Corporate DevelopmentGoGold Resources Inc.T: 416 855 0435Email : steve@gogoldresources.comOr visit : www.gogoldresources.com
CAUTIONARY STATEMENT:The securities described herein have not been, and will not be, registered under the United States Securities Act of 1933, as amended (the "U.S. Securities Act"), or any state securities laws, and may not be offered or sold within the United States or to, or for the benefit of, U.S. persons (as defined in Regulation S under the U.S. Securities Act) except in compliance with the registration requirements of the U.S. Securities Act and applicable state securities laws or pursuant to exemptions therefrom. This release does not constitute an offer to sell or a solicitation of an offer to buy of any of GoGold's securities in the United States.
This news release may contain "forward-looking information" as defined in applicable Canadian securities legislation. All statements other than statements of historical fact, included in this release, including, without limitation, statements regarding the Parral tailings project, the Los Ricos project, future operating margins, future production and processing, and future plans and objectives of GoGold, constitute forward-looking information that involve various risks and uncertainties. Forward-looking information is based on a number of factors and assumptions which have been used to develop such information but which may prove to be incorrect, including, but not limited to, assumptions in connection with the continuance of GoGold and its subsidiaries as a going concern, general economic and market conditions, mineral prices, the accuracy of mineral resource estimates, and the performance of the Parral project There can be no assurance that such information will prove to be accurate and actual results and future events could differ materially from those anticipated in such forward-looking information.
Important factors that could cause actual results to differ materially from GoGold's expectations include exploration and development risks associated with the GoGold's projects, the failure to establish estimated mineral resources or mineral reserves, volatility of commodity prices, variations of recovery rates, and global economic conditions. For additional information with respect to risk factors applicable to GoGold, reference should be made to GoGold's continuous disclosure materials filed from time to time with securities regulators, including, but not limited to, GoGold's Annual Information Form. The forward-looking information contained in this release is made as of the date of this release.
Cautionary non-GAAP Measures and Additional GAAP MeasuresNote that for purposes of this section, GAAP refers to IFRS. The Company believes that investors use certain non-GAAP and additional GAAP measures as indicators to assess mining companies. They are intended to provide additional information and should not be considered in isolation or as a substitute for measures of performance prepared with GAAP. Non-GAAP and additional GAAP measures do not have a standardized meaning prescribed under IFRS and therefore may not be comparable to similar measures presented by other companies.
Additional GAAP measures that are presented on the face of the Company's consolidated statements of comprehensive income include "Operating income (loss)". These measures are intended to provide an indication of the Company's mine and operating performance. Per ounce measures are calculated by dividing the relevant mining and processing costs and total costs by the tonnes of ore processed in the period. "Adjusted cash costs per ounce" and "Adjusted all-in sustaining costs per ounce" are used in this analysis and are non-GAAP terms typically used by mining companies to assess the level of gross margin available to the Company by subtracting these costs from the unit price realized during the period. These non-GAAP terms are also used to assess the ability of a mining company to generate cash flow from operations. There may be some variation in the method of computation of these metrics as determined by the Company compared with other mining companies. In this context, "Adjusted cash costs per ounce" reflects the cash operating costs allocated from in-process and dore inventory associated with ounces of silver and gold sold in the period. "Adjusted cash costs per ounce" may vary from one period to another due to operating efficiencies, grade of material processed and silver/gold recovery rates in the period. "Adjusted all-in sustaining costs per ounce" include total cash costs, exploration, corporate and administrative, share based compensation and sustaining capital costs. For a reconciliation of non-GAAP and GAAP measures, please refer to the Management Discussion and Analysis dated December 10, 2025 for the year ended September 30, 2025, as presented on SEDAR.
To view the source version of this press release, please visit https://www.newsfilecorp.com/release/277622
-
GoGold Resources Inc. recently completed a composite units offering, raising C$125.00 million by issuing 47,170,000 equity/derivative units at C$2.65 each, including a C$0.13 per-unit discount.
-
This sizeable capital raise strengthens the company’s funding base and could influence how investors assess its future project pipeline and development plans.
-
We’ll now examine how this large composite units financing shapes GoGold Resources’ investment narrative, particularly around capital allocation and growth ambitions.
These 13 companies survived and thrived after COVID and have the right ingredients to survive Trump's tariffs. Discover why before your portfolio feels the trade war pinch.
What Is GoGold Resources' Investment Narrative?
To own GoGold Resources, you need to believe that its improving profitability and growing silver equivalent production at Los Ricos can eventually justify a premium valuation, despite relatively modest forecast revenue growth. The recent C$125.0 million composite units financing, on top of this year’s earlier C$75.0 million equity raise, materially reshapes the near term picture: funding risk around advancing Los Ricos South and broader exploration has eased, but dilution has increased and the bar for returns on this new equity is now higher. Short term catalysts still hinge on how efficiently management converts this fresh capital into progress against the feasibility study, production growth and resource expansion, especially given the high price to earnings multiple and low forecast return on equity. The financing strengthens the balance sheet, but also sharpens scrutiny on capital allocation.
However, the recent capital raises introduce a risk that some shareholders may be underestimating. According our valuation report, there's an indication that GoGold Resources' share price might be on the expensive side.
Exploring Other PerspectivesTSX:GGD Community Fair Values as at Dec 2025
Three Simply Wall St Community fair value views span from C$2.20 to a very large C$80.00, underlining how far opinions diverge. Set this against the latest dilution and funding boost, and you can see why many will want to compare multiple viewpoints before deciding how GoGold’s risk and reward profile fits into their portfolio thinking.
Explore 3 other fair value estimates on GoGold Resources – why the stock might be a potential multi-bagger!
Build Your Own GoGold Resources Narrative
Disagree with existing narratives? Create your own in under 3 minutes – extraordinary investment returns rarely come from following the herd.
-
A great starting point for your GoGold Resources research is our analysis highlighting 3 key rewards and 2 important warning signs that could impact your investment decision.
-
Our free GoGold Resources research report provides a comprehensive fundamental analysis summarized in a single visual – the Snowflake – making it easy to evaluate GoGold Resources' overall financial health at a glance.
Curious About Other Options?
Markets shift fast. These stocks won't stay hidden for long. Get the list while it matters:
-
Rare earth metals are the new gold rush. Find out which 37 stocks are leading the charge.
-
Find companies with promising cash flow potential yet trading below their fair value.
-
Uncover the next big thing with financially sound penny stocks that balance risk and reward.
This article by Simply Wall St is general in nature. We provide commentary based on historical data and analyst forecasts only using an unbiased methodology and our articles are not intended to be financial advice. It does not constitute a recommendation to buy or sell any stock, and does not take account of your objectives, or your financial situation. We aim to bring you long-term focused analysis driven by fundamental data. Note that our analysis may not factor in the latest price-sensitive company announcements or qualitative material. Simply Wall St has no position in any stocks mentioned.
Companies discussed in this article include GGD.TO.
Have feedback on this article? Concerned about the content? Get in touch with us directly. Alternatively, email editorial-team@simplywallst.com
GoGold Resources (TSX:GGD) just closed a CAD 125 million composite units offering at CAD 2.65 per unit, a move that both strengthens its balance sheet and raises questions about future project plans.
See our latest analysis for GoGold Resources.
The timing of this financing lines up with a powerful run, with GoGold Resources posting a year to date share price return of around 121 percent and a 1 year total shareholder return of roughly 124 percent, suggesting momentum is still very much in play.
If that kind of momentum has your attention, it could also be worth exploring fast growing stocks with high insider ownership as you look for other fast moving opportunities with aligned insiders.
Yet even after this financing fueled rally, analysts still see upside to their price targets. This leaves investors to ask: Is GoGold Resources undervalued today, or is the market already pricing in its next leg of growth?
Most Popular Narrative Narrative: 96.7% Undervalued
Compared with the last close at CA$2.66, the most widely followed narrative argues that GoGold Resources could be worth many multiples of today’s price under bullish precious metal scenarios.
At $100 silver, the estimated stock price could reach around $46.47/share, making it a compelling high risk, high reward opportunity for silver investors.
Investors may be curious how a mid cap miner gets mapped to those kinds of levels, and what production ramp, margins, and cash flow multiples are included in that view. The narrative’s model stacks future ounces, cost curves, and fully diluted share counts into one aggressive roadmap. Want to see exactly which growth milestones and metal price assumptions drive that upside math, and how Los Ricos reshapes the picture? Dive in to unpack the full valuation story behind those targets.
Result: Fair Value of $80 (UNDERVALUED)
Have a read of the narrative in full and understand what’s behind the forecasts.
However, that upside depends on timely permits and disciplined financing. Delays, cost creep, or heavy dilution could sharply reduce the projected rewards.
Find out about the key risks to this GoGold Resources narrative.
Another View: Market Multiples Flash a Warning
While the narrative model leans heavily toward upside, GoGold’s current 68.5x price to earnings ratio looks stretched against the Canadian metals and mining industry at 21.2x, peers at 48.4x, and a fair ratio of 19.6x. This points to meaningful valuation risk if sentiment cools.
See what the numbers say about this price — find out in our valuation breakdown.
TSX:GGD PE Ratio as at Dec 2025
Build Your Own GoGold Resources Narrative
If you see the numbers differently or want to stress test your own assumptions, you can build a complete narrative in minutes: Do it your way.
A great starting point for your GoGold Resources research is our analysis highlighting 3 key rewards and 2 important warning signs that could impact your investment decision.
Looking for more investment ideas?
Before you move on, explore your next opportunities with targeted screeners that surface stocks for further research before they reach a wider audience.
- Focus on dependable payers using these 15 dividend stocks with yields > 3% supported by yields that can help strengthen your portfolio’s cash flow.
- Filter for companies developing machine learning and data-driven platforms with these 26 AI penny stocks.
- Search for attractively priced opportunities through these 907 undervalued stocks based on cash flows that are evaluated using cash flow metrics.
This article by Simply Wall St is general in nature. We provide commentary based on historical data
and analyst forecasts only using an unbiased methodology and our articles are not intended to be financial advice. It does not constitute a recommendation to buy or sell any stock, and does not take account of your objectives, or your
financial situation. We aim to bring you long-term focused analysis driven by fundamental data.
Note that our analysis may not factor in the latest price-sensitive company announcements or qualitative material.
Simply Wall St has no position in any stocks mentioned.
Companies discussed in this article include GGD.TO.
Have feedback on this article? Concerned about the content? Get in touch with us directly. Alternatively, email editorial-team@simplywallst.com
Source: Getty Images
Written by Jitendra Parashar at The Motley Fool Canada
The Tax-Free Savings Account (TFSA) is one of the few investment tools in Canada where you get to keep all your gains — no taxes on dividends, interest, or capital appreciation. Whether you’re aiming for early retirement or simply building long-term wealth, buying high-quality stocks early at lower prices could give your TFSA portfolio a serious edge.
In this article, I’ll cover three of the best, growth-oriented Canadian stocks you can buy right now to create a powerful TFSA portfolio for peace of mind and outstanding long-term returns.
GoGold Resources stock
Among the top stocks for TFSA, GoGold Resources (TSX:GGD) stands out for its consistent progress and strong project base. This Halifax-based company primarily focuses on developing and operating gold and silver projects across the Americas, with its Parral Tailings and Los Ricos properties being the backbone of its production growth.
Currently trading at $2.68 per share with a market cap near $1.2 billion, GoGold stock has jumped by 141% so far in 2025 due partly to renewed optimism in silver and gold prices, which helped it recover from earlier market volatility.
The company continues to advance its Los Ricos South and Los Ricos North developments, supported by strong drilling results and a growing resource base. Its recent technical updates point to increasing project scale and improving economics, giving investors confidence in its next growth phase.
For TFSA investors, GoGold stock aligns well with the idea of holding assets backed by real value and strong long-term growth potential.
Collective Mining stock
Now, let’s talk about Collective Mining (TSX:CNL), a Toronto-headquartered exploration firm that’s setting a new benchmark for early-stage exploration success. The company is advancing its Guayabales and San Antonio projects in Caldas, Colombia, and its recent drilling success has fueled growing investor interest.
Trading at around $15.63 per share with a market cap close to $1.4 billion, Collective stock has skyrocketed by 162% so far in 2025. In mid-October, the company reported visual mineralization at both projects, followed by assay results from its Apollo system — including a drill intercept of 486 metres at 2.01 grams per tonne gold equivalent.
Backed by a team that previously built and sold Continental Gold for US$2 billion, this company has strong technical and financial credibility. With US$145 million in cash, it plans up to 100,000 metres of new drilling in 2026, with a focus on expanding its high-grade Ramp Zone and further testing new targets.
For TFSA investors seeking early-stage exposure to the mining sector with scalable upside, Collective Mining looks like a great stock that could offer powerful long-term, tax-free returns.
Lightspeed Commerce stock
Rounding out this list of top stocks for TFSA is Lightspeed Commerce (TSX:LSPD), a Canadian tech stock that’s showing real progress in its turnaround. Headquartered in Montreal, the company provides a unified platform for payments, point-of-sale, and e-commerce, serving businesses in more than 100 countries. After rallying 23% over the last eight months, LSPD stock currently trades at $15.73 per share with a market cap of $2.2 billion.
In the second quarter of its fiscal 2026 (three months ended in September), Lightspeed’s revenue jumped 15% year-over-year to US$319 million. Its gross profit margins also improved during the quarter to 42% with the help of cost controls and stronger pricing.
Encouraged by these results, Lightspeed raised its full-year outlook, now expecting at least 12% revenue growth and US$70 million in adjusted earnings before interest, taxes, depreciation, and amortization for fiscal 2026. As it continues scaling globally, LSPD looks well-positioned as one of the top stocks for TFSA portfolios looking for growth beyond traditional sectors.
The post 3 of the Best Stocks TFSA Investors Can Buy Now appeared first on The Motley Fool Canada.
Should you invest $1,000 in Collective Mining right now?
Before you buy stock in Collective Mining, consider this:
The Motley Fool Stock Advisor Canada analyst team identified what they believe are the 15 best stocks for investors to buy now… and Collective Mining wasn’t one of them. The 15 stocks that made the cut could potentially produce monster returns in the coming years.
Consider MercadoLibre, which we first recommended on January 8, 2014 … if you invested $1,000 in the “eBay of Latin America” at the time of our recommendation, you’d have $21,105.89!*
Now, it’s worth noting Stock Advisor Canada’s total average return is 95%* – a market-crushing outperformance compared to 72%* for the S&P/TSX Composite Index. Don’t miss out on our top 15 list, available when you join Stock Advisor Canada.
#start_btn6 {
background:#0e6d04 none repeat scroll;color:#fff;font-size:1.2em;font-family:’Montserrat’, sans-serif;font-weight:600;height:auto;margin:30px 0;max-width:350px;text-align:center;width:auto;}
#start_btn6 a {
color:#fff;display:block;padding:20px;padding-right:1em;padding-left:1em;}
#start_btn6 a:hover {
background:#FFE300 none repeat scroll;color:#000;}
@media (max-width:480px) {
div#start_btn6 {
font-size:1.1em;max-width:320px;}
}
margin_bottom_5 {margin-bottom:5px;}
margin_top_10 {margin-top:10px;}
* Returns as of November 17th, 2025
More reading
Fool contributor Jitendra Parashar has no position in any of the stocks mentioned. The Motley Fool recommends Lightspeed Commerce. The Motley Fool has a disclosure policy.
2025
3,034 g/t AgEq over 21.3m including 1.4m of 41,110 g/t AgEq from the Eagle Zone
Halifax, Nova Scotia–(Newsfile Corp. – September 9, 2025) – GoGold Resources Inc. (TSX: GGD) (OTCQX: GLGDF) ("GoGold", "the Company") is pleased to announce first assay results have been received from its near-mine 2025 exploration program conducted on the Eagle and Abra (Main) Zones of the Silver-gold Los Ricos South Project located in Jalisco, Mexico. Drill targeting was based on reconstruction of the historical Cinco Minas Mine and a new IP geophysics survey conducted this year. Assay results from geotechnical holes in the Eagle Zone are also discussed.
"We're pleased with these initial results of our near-mine exploration program. The objective was to drill some scouting exploration holes deeper than our current Resource and south of the current Resource in a faulted off section of the vein. We were successful in hole 318 as it demonstrated strong mineralization continues deeper below our current Resources. Also, a highlight of the drilling was hole 324 which not only located the faulted off section of the vein outside of the Resource but yielded strong gold and silver grades and widths. Another significant hole is hole 337, located in Cerro Colorado which is south of known mineralization and could represent a new ore shoot which we will target with further drilling," said Brad Langille, President and CEO. "Hole LRSGT-23-001 was drilled for geotechnical purposes within the current Resource area, but after publication. This is confirmatory of the high grade and large widths of the Eagle Zone."
Highlights from the drilling program include the following:
-
Hole LRSGT-23-001: 41,110 g/t total silver equivalent over 1.42 m from 131.20 to 132.62 m, consisting of 28,094 g/t silver and 173.6 g/t gold within a longer interval of 21.25 m grading 3,034 g/t total silver equivalent from 129.15 to 150.40 m consisting of 2,077 g/t silver and 12.76 g/t gold drilled in the Eagle Zone for geotechnical purposes after the Resource was published and is within the current Resource area (see Figures 1 and 4).
-
Hole LRGG-24-318: 904 g/t total silver equivalent over 0.75 m from 698.10 to 698.85 m, consisting of 401 g/t silver and 6.7 g/t gold within a longer interval of 10.72 m grading 215 g/t total silver equivalent from 691.18 to 701.90 m consisting of 123 g/t silver and 1.2 g/t gold in the Abra Zone for exploration purposes outside of the current Resource area (see Figures 1 and 3).
-
Hole LRGG-24-324: 1,034 g/t total silver equivalent over 1.39 m from 231.50 to 232.89 m, consisting of 477 g/t silver and 7.4 g/t gold within a longer interval of 23.05 m grading 234 g/t total silver equivalent from 227.10 to 250.15 m consisting of 123 g/t silver and 1.49 g/t gold in the South Abra Zone for exploration purposes outside of the current Resource area (see Figures 1 and 3).
-
Hole LRGG-24-337: 849 g/t total silver equivalent over 1.50 m from 33.50 to 35.00 m, consisting of 43.8 g/t silver and 10.7 g/t gold within a longer interval of 9.45 m grading 303 g/t total silver equivalent from 27.55 to 37.00 m consisting of 21.7 g/t silver and 3.75 g/t gold in the Cerro Colorado Zone for exploration purposes outside of the current Resource area (see Figures 1 and 3).
Table 1: Drill Hole Results
|
Hole ID |
Area / Vein |
From |
To |
Length1 |
Au |
Ag |
AuEq2 |
AgEq2 |
|
(m) |
(m) |
(m) |
(g/t) |
(g/t) |
(g/t) |
(g/t) |
||
|
LRGG-24-318 |
Los Ricos Vein |
691.18 |
701.90 |
10.72 |
1.234 |
122.7 |
2.87 |
215.2 |
|
including |
698.10 |
698.85 |
0.75 |
6.700 |
401.0 |
12.05 |
903.5 |
|
|
LRGG-25-321 |
Los Ricos Vein |
222.50 |
234.00 |
11.50 |
0.640 |
78.8 |
1.69 |
126.8 |
|
including |
222.50 |
227.60 |
5.10 |
0.893 |
80.1 |
1.96 |
147.0 |
|
|
LRGG-25-322 |
Los Ricos Vein |
310.66 |
318.00 |
7.34 |
0.202 |
130.1 |
1.94 |
145.3 |
|
including |
313.50 |
318.00 |
4.50 |
0.258 |
182.5 |
2.69 |
201.9 |
|
|
LRGG-25-324 |
Los Ricos Vein |
227.10 |
250.15 |
23.05 |
1.491 |
122.6 |
3.13 |
234.4 |
|
including |
231.50 |
232.89 |
1.39 |
7.417 |
477.4 |
13.78 |
1,033.7 |
|
|
LRGG-25-325 |
Los Ricos Vein |
237.50 |
238.50 |
1.00 |
0.440 |
97.0 |
1.73 |
130.0 |
|
LRGG-25-327 |
Los Ricos Vein |
452.00 |
495.45 |
43.45 |
0.218 |
54.0 |
0.94 |
70.4 |
|
including |
469.65 |
470.65 |
1.00 |
0.025 |
656.0 |
8.77 |
657.9 |
|
|
LRGG-25-328 |
Los Ricos Vein |
235.00 |
257.04 |
22.04 |
0.181 |
41.9 |
0.74 |
55.5 |
|
including |
256.50 |
257.04 |
0.54 |
1.940 |
346.0 |
6.55 |
491.5 |
|
|
LRGG-25-330 |
Los Ricos Vein |
314.65 |
315.15 |
0.50 |
0.460 |
206.0 |
3.21 |
240.5 |
|
LRGG-25-333 |
Los Ricos Vein |
183.30 |
185.40 |
2.10 |
0.832 |
36.9 |
1.32 |
99.3 |
|
LRGG-25-334 |
Los Ricos Vein |
230.50 |
231.65 |
1.15 |
1.061 |
48.4 |
1.71 |
127.9 |
|
and |
241.70 |
242.70 |
1.00 |
1.344 |
236.4 |
4.50 |
337.2 |
|
|
LRGG-25-335 |
Los Lamas Vein |
251.20 |
252.15 |
0.95 |
1.850 |
137.0 |
3.68 |
275.8 |
|
and |
262.70 |
267.25 |
4.55 |
0.395 |
71.0 |
1.34 |
100.6 |
|
|
LRGG-25-336 |
Cerro Col. Vein |
12.30 |
23.61 |
11.31 |
0.814 |
20.9 |
1.09 |
82.0 |
|
including |
17.10 |
22.58 |
5.48 |
0.950 |
26.5 |
1.30 |
97.7 |
|
|
LRGG-25-337 |
Cerro Col. Vein |
27.55 |
37.00 |
9.45 |
3.754 |
21.7 |
4.04 |
303.3 |
|
including |
33.50 |
35.00 |
1.50 |
10.740 |
43.8 |
11.32 |
849.3 |
|
|
LRGG-25-339 |
Cerro Col. Vein |
4.15 |
6.40 |
2.25 |
0.723 |
49.0 |
1.38 |
103.2 |
|
The following holes are geotechnical holes drilled after Resource was published, and are within current Resource area: |
||||||||
|
LRSGT-23-001 |
Los Ricos Vein |
129.15 |
150.40 |
21.25 |
12.76 |
2,077.0 |
40.46 |
3,034.2 |
|
including |
131.20 |
132.62 |
1.42 |
173.55 |
28,094.0 |
548.14 |
41,110.2 |
|
|
GT-PFS-23-001 |
Los Ricos Vein |
133.85 |
139.00 |
5.15 |
0.71 |
173.9 |
3.03 |
227.1 |
|
including |
134.90 |
136.28 |
1.38 |
1.86 |
334.4 |
6.32 |
474.0 |
|
|
GT-PFS-23-003 |
Los Ricos Vein6 |
120.68 |
146.67 |
25.99 |
0.86 |
89.1 |
2.05 |
153.5 |
|
including6 |
122.95 |
130.50 |
7.55 |
3.09 |
286.0 |
6.90 |
517.8 |
|
|
including6 |
122.95 |
129.59 |
6.64 |
3.27 |
313.0 |
7.45 |
558.5 |
|
|
GT-PFS-23-004 |
Los Ricos Vein |
60.00 |
92.10 |
32.10 |
3.18 |
292.1 |
7.08 |
531.0 |
|
including |
64.00 |
65.60 |
1.60 |
20.11 |
2,792.5 |
57.35 |
4,300.9 |
|
|
GT-PFS-23-005 |
Los Ricos Vein6 |
66.30 |
93.60 |
27.30 |
0.36 |
45.8 |
0.97 |
72.8 |
|
including6 |
75.00 |
80.60 |
5.60 |
0.94 |
77.1 |
1.97 |
147.7 |
|
|
GT-PFS-23-OP4 |
Los Ricos Vein6 |
101.15 |
115.40 |
11.80 |
2.62 |
289.1 |
6.48 |
485.8 |
|
including6 |
106.25 |
115.40 |
6.70 |
4.60 |
489.9 |
11.13 |
834.5 |
|
|
GT-PFS-23-OP5 |
Los Ricos Vein |
40.00 |
54.90 |
14.90 |
0.37 |
58.9 |
1.16 |
87.0 |
|
Including |
46.20 |
47.20 |
1.00 |
1.09 |
170.0 |
3.36 |
251.8 |
|
|
GT-PFS-23-005 |
Los Ricos Vein6 |
66.30 |
93.60 |
27.30 |
0.36 |
45.8 |
0.97 |
72.8 |
|
including |
46.20 |
47.20 |
1.00 |
1.09 |
170.0 |
3.36 |
251.8 |
|
1. Not true width.2. Silver Equivalent ("AgEq") ratios are based on a silver to gold price ratio of 75:1 (Au:Ag) at 100% metal recoveries.3. Holes LRGG-25-319, 320, 323, 326, 329, 329, 331, 332, 338 did not intercept material mineralization and are excluded.4. Hole GT-PFS-23-002 intercepted strong mineralization but was drilled along vein for geotechnical purposes and is excluded from the results above.5. Holes GT-PFS-23-006, 007, 008, 009, 010, 011 and GT-PFS-23-OP1, OP2, OP3 were drilled for geotechnical purposes and were not sampled.6. Excluding voids.
Summary
In early 2025, the exploration team began a new IP survey to extend the coverage south of the El Abra deposit to the Cerro Colorado deposit (see Figure 2). The new data, combined with the 2022 IP survey, provides continuous detailed information along the El Abra structure over a strike length of 7km. Based on a re-evaluation of historical data and the new IP geophysics, a systematic step-out drilling program to test the down dip, the southern strike extension of the Abra Zone towards Los Lamas, and the Cerro Colorado deposit was started in January 2025.
The goal of this drilling is to extend the known mineral occurrence at the south end of the historically mined Cinco Minas one kilometer to the Los Llamas Zone all the way to the south at Cerro Colorado, a total strike length of 3.5km. The drill holes in this release were not included in the initial Mineral Resource Estimate ("MRE") for Los Ricos South released on January 6, 2025.
Figure 1: 2025 Exploration Drilling – Los Ricos Plan View
To view an enhanced version of this graphic, please visit:https://images.newsfilecorp.com/files/1683/265564_3f2cf4ad74ba2a00_001full.jpg
Figure 2: 2025 IP Survey – Plan View
Induced polarization is industry standard in exploring for low sulfidation epithermal deposits, and particularly resistivity shows a pronounced break between the El Pochete and Eje Volcanics, the known host of the Los Ricos Vein System. This break can be traced for a total of 7km from the north of Eagle to the far south of Cerro Colorado.
Figure 2: 2025 IP Survey – Plan View
To view an enhanced version of this graphic, please visit:https://images.newsfilecorp.com/files/1683/265564_3f2cf4ad74ba2a00_002full.jpg
This prospective break, along with a refreshed look at historical mining records, show the area to be prospective to the south of the Abra Zone and down dip of the current FS designed stopes.
Figure 3: Longitudinal Section – Near Mine Drilling
To view an enhanced version of this graphic, please visit:https://images.newsfilecorp.com/files/1683/265564_3f2cf4ad74ba2a00_003full.jpg
Assay results from drill hole LRGG-24-318 show the high grade Abra Zone extends 250m down dip of the deepest Feasibility Study designed stopes, offering excellent expansion potential. Whereas, assay results from LRGG-25-324 show an extension of the Abra Zone 150m south of the last historical mining activity. There remains over 500m of prospective ground untested between DDH 324 and the Los Llamas Zone, believed to be a continuation of the Abra Zone.
Geotechnical Drilling
Based on the recommendations from WSP (retained for the 2024 Feasibility Study) the Company completed additional geotechnical drill holes for the proposed Open Pit and Underground Mine Plans. Holes were completed either, 1) crossing the zone, 2) entirely in FW, 3) entirely in HW or 4) drilled down the vein/HW (e.g., GT_PFS_23_002). Only holes that crossed the Zone were sampled. Geotechnical holes were used for both Resource Definition and geotechnical purposes and confirm the presence of the high-grade Abra and Eagle Zones. These drill holes were not utilized in the updated MRE dated January 16, 2025.
Figure 4: Cross Section – Geotechnical Drilling for Resource
To view an enhanced version of this graphic, please visit:https://images.newsfilecorp.com/files/1683/265564_3f2cf4ad74ba2a00_004full.jpg
Table 2: Drill Hole Locations
|
Hole ID |
Easting |
Northing |
Elevation |
Length |
Azimuth |
Dip |
Type |
|
LRSGT-23-001 |
609992 |
2328411 |
1260 |
257 |
50 |
-45 |
Geotechnical |
|
GT-PFS-23-OP1 |
610528 |
2327672 |
1282 |
170 |
245 |
-50 |
Geotechnical |
|
GT-PFS-23-OP2 |
610828 |
2327753 |
1423 |
150 |
45 |
-70 |
Geotechnical |
|
GT-PFS-23-OP3 |
610666 |
2327951 |
1472 |
151 |
45 |
-70 |
Geotechnical |
|
GT-PFS-23-OP4 |
610292 |
2328052 |
1308 |
115 |
310 |
-60 |
Geotechnical |
|
GT-PFS-23-OP5 |
610339 |
2328166 |
1349 |
101 |
45 |
-70 |
Geotechnical |
|
GT_PFS_23_001 |
610528 |
2327676 |
1283 |
252 |
90 |
-65 |
Geotechnical |
|
GT_PFS_23_002 |
610775 |
2327544 |
1259 |
201 |
30 |
-80 |
Geotechnical |
|
GT_PFS_23_003 |
610439 |
2327744 |
1274 |
250 |
65 |
-65 |
Geotechnical |
|
GT_PFS_23_004 |
610321 |
2327972 |
1288 |
220 |
30 |
-80 |
Geotechnical |
|
GT_PFS_23_005 |
610386 |
2327909 |
1294 |
151 |
65 |
-65 |
Geotechnical |
|
GT_PFS_23_006 |
610665 |
2327949 |
1471 |
442 |
240 |
-55 |
Geotechnical |
|
GT_PFS_23_007 |
610828 |
2327753 |
1423 |
421 |
230 |
-60 |
Geotechnical |
|
GT_PFS_23_008 |
610188 |
2328372 |
1313 |
251 |
310 |
-70 |
Geotechnical |
|
GT_PFS_23_009 |
610253 |
2328508 |
1384 |
351 |
250 |
-70 |
Geotechnical |
|
GT_PFS_23_010 |
610089 |
2328587 |
1298 |
248 |
210 |
-50 |
Geotechnical |
|
GT_PFS_23_011 |
610747 |
2327839 |
1455 |
452 |
240 |
-70 |
Geotechnical |
|
LRGG-24-318 |
609926 |
2327320 |
1253 |
785 |
50 |
-55 |
Exploration |
|
LRGG-25-319 |
610865 |
2327392 |
1235 |
123 |
50 |
-50 |
Exploration |
|
LRGG-25-320 |
610782 |
2327286 |
1212 |
220 |
50 |
-50 |
Exploration |
|
LRGG-25-321 |
610706 |
2327215 |
1151 |
342 |
50 |
-50 |
Exploration |
|
LRGG-25-322 |
610653 |
2327186 |
1150 |
389 |
50 |
-50 |
Exploration |
|
LRGG-25-323 |
610707 |
2327220 |
1152 |
373 |
50 |
-50 |
Exploration |
|
LRGG-25-324 |
610735 |
2327183 |
1152 |
390 |
50 |
-50 |
Exploration |
|
LRGG-25-325 |
610666 |
2327251 |
1153 |
319 |
50 |
-50 |
Exploration |
|
LRGG-25-326 |
610593 |
2327071 |
1149 |
597 |
50 |
-60 |
Exploration |
|
LRGG-25-327 |
610449 |
2327355 |
1208 |
635 |
50 |
-80 |
Exploration |
|
LRGG-25-328 |
610741 |
2327164 |
1151 |
387 |
50 |
-50 |
Exploration |
|
LRGG-25-329 |
610742 |
2327123 |
1142 |
385 |
50 |
-45 |
Exploration |
|
LRGG-25-330 |
610733 |
2327184 |
1153 |
361 |
50 |
-55 |
Exploration |
|
LRGG-25-331 |
610732 |
2327183 |
1153 |
360 |
50 |
-59 |
Exploration |
|
LRGG-25-332 |
610732 |
2327183 |
1153 |
430 |
50 |
-66 |
Exploration |
|
LRGG-25-333 |
610733 |
2327184 |
1153 |
351 |
50 |
-46 |
Exploration |
|
LRGG-25-334 |
611456 |
2326517 |
1096 |
361 |
50 |
-47 |
Exploration |
|
LRGG-25-335 |
611456 |
2326516 |
1096 |
350 |
50 |
-60 |
Exploration |
|
LRGG-25-336 |
612127 |
2326018 |
1041 |
71 |
50 |
-45 |
Exploration |
|
LRGG-25-337 |
612118 |
2326012 |
1039 |
85 |
50 |
-82 |
Exploration |
|
LRGG-25-338 |
612164 |
2325942 |
1018 |
66 |
50 |
-45 |
Exploration |
|
LRGG-25-339 |
612182 |
2325970 |
1029 |
44 |
50 |
-45 |
Exploration |
Procedure, Quality Assurance / Quality Control and Data Verification
The diamond drill core (HQ size) is geologically logged, photographed and marked for sampling. When the sample lengths are determined, the full core is sawn with a diamond blade core saw with one half of the core being bagged and tagged for assay. The remaining half portion is returned to the core trays for storage and/or for metallurgical test work.
The sealed and tagged sample bags are transported to the ALS Chemex facility in Zacatecas, Mexico. ALS Chemex crushes the samples and prepares 200-300 gram pulp samples with ninety percent passing Tyler 150 mesh (106μm). The pulps are assayed for gold using a 30-gram charge by fire assay (Code AA23) and over limits greater than 10 grams per tonne are re-assayed using a gravimetric finish (Code ME-GRAV21). Silver and multi-element analysis is completed using total digestion (Code ME-ICP61 Total Digestion ICP). Over limits greater than 100 grams per tonne silver are re-assayed using a gravimetric finish (ME-GRA21).
Quality assurance and quality control ("QA/QC") procedures monitor the chain-of-custody of the samples and includes the systematic insertion and monitoring of appropriate reference materials (certified standards, blanks and duplicates) into the sample strings. The results of the assaying of the QA/QC material included in each batch are tracked to ensure the integrity of the assay data. All results stated in this announcement have passed GoGold's QA/QC protocols.
Qualified PersonDavid R. Duncan, P. Geo., V.P. Exploration of the Corporation, is the Qualified Person for GoGold as defined under National Instrument 43-101. Mr. Duncan has reviewed and approved the scientific and technical information in this press release.
Los Ricos District Exploration Projects
The Company's two development projects at its Los Ricos Property are in Jalisco state, Mexico. The Los Ricos South Project began in March 2019 and an initial Mineral Resource was announced on July 29, 2020, which disclosed a Measured & Indicated Mineral Resource of 63.7 million ounces AgEq grading 199 g/t AgEq contained in 10.0 million tonnes, and an Inferred Mineral Resource of 19.9 million ounces AgEq grading 190 g/t AgEq contained in 3.3 million tonnes. An initial PEA on the project was announced on January 20, 2021, indicating an NPV5% of US$295M. On January 16, 2025, the company announced a feasibility study which included a front-end engineering design which outlined an NPV5% of US$355M.
The Los Ricos North Project was launched in March 2020 and an initial Mineral Resource was announced on December 7, 2021, which disclosed an Indicated Mineral Resource of 87.8 million ounces AgEq grading 122 g/t AgEq contained in 22.3 million tonnes, and an Inferred Mineral Resource of 73.2 million ounces AgEq grading 111 g/t AgEq contained in 20.5 million tonnes. An initial PEA on the project was announced on May 17, 2023, indicating an NPV5% of US$413M.
About GoGold ResourcesGoGold Resources (TSX: GGD) is a Canadian-based silver and gold producer focused on operating, developing, exploring and acquiring high quality projects in Mexico. The Company operates the Parral Tailings mine in the state of Chihuahua and has the Los Ricos South and Los Ricos North exploration and development projects in the state of Jalisco. Headquartered in Halifax, NS, GoGold is building a portfolio of low cost, high margin projects. For more information visit gogoldresources.com.
For further information please contact:
Steve Low, Corporate DevelopmentGoGold Resources Inc. T: 416 855 0435
Email : steve@gogoldresources.comOr visit : www.gogoldresources.com
CAUTIONARY STATEMENT:The securities described herein have not been, and will not be, registered under the United States Securities Act of 1933, as amended (the "U.S. Securities Act"), or any state securities laws, and may not be offered or sold within the United States or to, or for the benefit of, U.S. persons (as defined in Regulation S under the U.S. Securities Act) except in compliance with the registration requirements of the U.S. Securities Act and applicable state securities laws or pursuant to exemptions therefrom. This release does not constitute an offer to sell or a solicitation of an offer to buy of any of GoGold's securities in the United States.
This news release may contain "forward-looking information" as defined in applicable Canadian securities legislation. All statements other than statements of historical fact, included in this release, including, without limitation, statements regarding the Parral tailings project, the Los Ricos project, future operating margins, future production and processing, and future plans and objectives of GoGold, constitute forward-looking information that involve various risks and uncertainties. Forward-looking information is based on a number of factors and assumptions which have been used to develop such information but which may prove to be incorrect, including, but not limited to, assumptions in connection with the continuance of GoGold and its subsidiaries as a going concern, general economic and market conditions, mineral prices, the accuracy of mineral resource estimates, and the performance of the Parral project There can be no assurance that such information will prove to be accurate and actual results and future events could differ materially from those anticipated in such forward-looking information.
Important factors that could cause actual results to differ materially from GoGold's expectations include exploration and development risks associated with the GoGold's projects, the failure to establish estimated mineral resources or mineral reserves, volatility of commodity prices, variations of recovery rates, and global economic conditions. For additional information with respect to risk factors applicable to GoGold, reference should be made to GoGold's continuous disclosure materials filed from time to time with securities regulators, including, but not limited to, GoGold's Annual Information Form. The forward-looking information contained in this release is made as of the date of this release.
To view the source version of this press release, please visit https://www.newsfilecorp.com/release/265564
TSX Venture Exchange (TSX-V): GRGFrankfurt Stock Exchange (FSE): G6AOTCQB Venture Market (OTCQB): GARWF
www.goldenarrowresources.com • info@goldenarrowresources.com
VANCOUVER, BC, Sept. 2, 2025 /CNW/ – Golden Arrow Resources Corporation (TSXV: GRG) (FSE: G6A) (OTCQB: GARWF), ("Golden Arrow" or the "Company") is pleased to report the results of its summer exploration program at the promising new Noemi target at the San Pietro IOCG Project, Chile ("San Pietro" or the "Project") (see Figure 1). Within Noemi, additional mapping and sampling have expanded the understanding of a previously identified structural system that hosts significant gold and anomalous copper (Figure 2). Mineralization occurs mainly in veins and veinlets within breccias and was also found in veinlets within the surrounding host rocks.
Highlights of the program include:
-
24 of 50 new samples returned results of greater than 1 g/t Au
-
Chip channel samples across the main structure include:
-
10.0m averaging 1.88 g/t Au
-
8.0m averaging 1.66 g/t Au
-
10.5m averaging 1.82 g/t Au
-
-
Main structural zone mapped over 1 kilometre in strike, with an average width of 25 metres and a maximum width of 40 metres at surface.
Outcrops are sparse in the area, and the main breccia system remains open under surface cover in all four directions, and untested at depth. Additional subparallel structures were identified and sampled where outcrop allowed, up to 300 metres from the main structure. These returned multiple samples with significant gold, including the high value of the program at 5.67 g/t Au in a 0.30 m wide structure.
Brian McEwen, Golden Arrow VP Exploration and Development stated, "Our initial impressions of Noemi were that it looked interesting for its potential to add resources similar to Rincones and Colla. What we did not expect was to also find this extensive gold-rich system, which is already impressing us with its width and grades but also in the continuity it is demonstrating. What we have identified so far has been through very limited sampling within what is a large area that has the potential to host a significant amount of gold and copper. We are very excited with the results to date, and we are going to continue exploration to delineate drill targets as a priority for our next exploration drilling campaign. Discoveries like Noemi makes us appreciate the size and potential for multiple deposits at San Pietro."
An excavator is being mobilized to Noemi to complete trenching and facilitate detailed mapping and sampling of this zone and testing for extensions in areas currently under cover. The breccia-hosted gold and copper mineralization at Noemi related to tourmaline alteration is believed to be related to the mineralized system identified at the Lolita Norte target that outcrops 3 kilometres to the west, with similar orientation and mineralization (Figure 1); see News Release dated May 14, 2025). Additional historic workings for gold and indications of other similar north-south gold structures occur in several locations further west within the San Pietro property. The field team will be continuing to evaluate these additional prospects as part of its ongoing exploration of the entire western part of the project, which has seen very limited work to date.
Exploration Program Details
The Noemi target area covers roughly a 2 kilometre by 3 kilometre area located approximately 7 kilometres south of the Rincones resource (approximately centred on the target name shown in Figure 1). The main geological units mapped in the Noemi area are fine grained andesites, tuffs and volcaniclastic rocks intruded by a microdiorite with some areas of substantial gravel cover.
The Noemi target is characterized by a scapolite-actinolite-magnetite alteration assemblage associated with IOCG-style copper mineralization. In addition, an earlier stage alteration assemblage characterized by tourmaline is associated with a north-south structural system identified within an area of approximately 1 kilometre by 750m area (yellow outline in Figure 1 with details in Figure 2). This system includes a wide brecciated zone with veins and veinlets filled with tourmaline-quartz-calcite-jarosite and minor barite, specularite and minor chrysocolla. Four rock chip channel samples previously collected across the southern part of this system, along 800 metres of strike, returned significant gold-copper values such as 3.0 m with 4.19 g/t Au and 2.08% Cu (see News Release dated May 14, 2025).
These results prompted the summer follow-up program of more detailed mapping and chip channel sampling of the southern part of the system and the immediate surrounding area. Outcrops are limited, but the team was able to clear and sample wider areas. The main mineralized corridor is now mapped over approximately 1 kilometer north-south, dipping steeply westward, with an average width of 25 metres including a maximum width of 40 metres at surface. Within the corridor, tourmaline replacement has undergone later brecciation, incorporating carbonates, barite, and jarosite (former pyrite) associated with gold mineralization. Table 1 includes the summary gold and copper geochemical results of 50 new samples which include 48 chip channels plus 2 individual samples from the discard piles of historic small workings. Most samples were anomalous in gold, with nearly half the samples assaying over 1 g/t Au. The weighted average for the 39 samples that fall within the breccia corridor is 1.52 g/t Au, however, it is also notable that many samples of host rock to the structure are also well mineralized. As shown in Figure 2, several continuous chip channel samples with significant grades of gold resulted in three long intervals, including: 10.0m averaging 1.88 g/t Au, 8.0m averaging 1.66 g/t Au, and 10.5m averaging 1.82 g/t Au (which includes 3 of 4 samples taken from host rock). Copper results varied with 14 samples returning assays greater than 0.1% Cu.
The team also explored the areas around the main structure in more detail. These areas are also mostly alluvium-covered, but additional subparallel structures approximately 150 to 300 metres west of the main structure were found to outcrop sporadically. Most samples were mineralized, including a high value of 5.67 g/t Au from a 0.30 m wide structure (see Figure 2).
The main mineralized breccia vein system that has been mapped and sampled may continue to the north and south, but it is obscured by surface cover at both ends. At the north end there are old historic workings, and a small hand trench was dug in the alluvium approximately 90 metres north of this location. The trench encountered what appears to be the same breccia vein structure and a sample assayed 1.05 g/t Au over 2.5m. Future work will continue to explore the extents in both directions.
Table 1. Gold and Copper from Surface Sampling Results (see Figure 2 for sample locations)
|
Sample |
Type |
Width (m) |
Au (g/t) |
Cu (%) |
|
CD001635 |
vein/breccia |
2.50 |
0.98 |
<0.01 |
|
CD001636 |
vein/breccia |
0.25 |
0.23 |
<0.01 |
|
CD001637 |
host rock |
0.50 |
0.04 |
<0.01 |
|
CD001638 |
vein/breccia |
0.40 |
0.16 |
<0.01 |
|
CD001639 |
vein/breccia |
0.55 |
0.14 |
<0.01 |
|
CD001640 |
vein/breccia |
1.50 |
1.69 |
<0.01 |
|
CD001641 |
vein/breccia |
0.60 |
1.81 |
0.03 |
|
CD001642 |
vein/breccia |
3.00 |
0.20 |
0.01 |
|
CD001643 |
vein/breccia |
3.20 |
0.20 |
0.02 |
|
CD001644 |
host rock |
3.00 |
0.54 |
0.01 |
|
CD001645 |
vein/breccia |
3.00 |
0.40 |
<0.01 |
|
CD001646 |
vein/breccia |
0.50 |
0.44 |
0.01 |
|
CD001648 |
vein/breccia |
0.30 |
5.67 |
0.02 |
|
CD001649 |
vein/breccia |
0.65 |
0.07 |
<0.01 |
|
CD001650 |
dump* |
– |
0.05 |
<0.01 |
|
CD001651 |
vein/breccia |
0.45 |
2.02 |
<0.01 |
|
CD001652 |
host rock |
0.55 |
1.21 |
0.01 |
|
CD001653 |
vein/breccia |
0.55 |
1.09 |
0.24 |
|
CD001654 |
host rock |
2.00 |
0.57 |
0.02 |
|
CD001655 |
vein/breccia |
1.70 |
0.10 |
<0.01 |
|
CD001656 |
vein/breccia |
0.60 |
0.24 |
0.11 |
|
CD001658 |
vein/breccia |
0.45 |
0.11 |
<0.01 |
|
CD001659 |
vein/breccia |
0.80 |
0.52 |
<0.01 |
|
CD001660 |
vein/breccia |
0.70 |
0.08 |
0.01 |
|
CD001661 |
vein/breccia |
2.30 |
1.42 |
0.15 |
|
CD001662 |
host rock |
3.50 |
0.11 |
0.02 |
|
CD001663 |
vein/breccia |
0.90 |
1.39 |
0.06 |
|
CD001664 |
dump* |
– |
2.02 |
0.27 |
|
CD001665 |
vein/breccia |
2.50 |
1.82 |
0.02 |
|
CD001666 |
vein/breccia |
2.50 |
1.51 |
0.01 |
|
CD001667 |
vein/breccia |
3.00 |
1.66 |
<0.01 |
|
CD001668 |
vein/breccia |
3.00 |
2.72 |
0.14 |
|
CD001669 |
vein/breccia |
4.00 |
1.45 |
0.25 |
|
CD001670 |
vein/breccia |
3.00 |
1.61 |
0.15 |
|
CD001672 |
vein/breccia |
3.50 |
0.71 |
<0.01 |
|
CD001673 |
vein/breccia |
2.00 |
1.41 |
0.03 |
|
CD001674 |
host rock |
3.00 |
2.83 |
0.17 |
|
CD001675 |
host rock |
2.00 |
0.40 |
0.01 |
|
CD001676 |
vein/breccia |
3.50 |
2.72 |
0.41 |
|
CD001677 |
host rock |
2.00 |
0.13 |
<0.01 |
|
CD001678 |
vein/breccia |
1.50 |
2.15 |
0.13 |
|
CD001679 |
vein/breccia |
1.00 |
0.13 |
<0.01 |
|
CD001680 |
host rock |
2.00 |
0.14 |
0.02 |
|
CD001682 |
vein/breccia |
0.50 |
0.37 |
0.01 |
|
CD001683 |
vein/breccia |
2.80 |
2.65 |
0.25 |
|
CD001684 |
host rock |
2.20 |
2.11 |
1.00 |
|
CD001685 |
vein/breccia |
0.70 |
3.23 |
0.66 |
|
CD001686 |
vein/breccia |
1.50 |
0.95 |
0.09 |
|
CD001687 |
vein/breccia |
0.60 |
4.06 |
0.47 |
|
CD001688 |
vein/breccia** |
2.50 |
1.05 |
0.09 |
|
*Individual samples taken from discard dumps of historic small miner workings. ** sampled from hand trench |
||||
Methodology & QA/QC
Chip channel samples at Noemi were collected by the technical team. Samples were shipped to ALS Laboratory in Copiapo, Chile by a contract truck service. Sample preparation and gold analysis by Fire Assay and reading by atomic absorption on 30 gm sample by method Au-AA23 was completed at the ALS facility in Santiago de Chile. Multi-element package by ICP-OES reading following a four-acid digestion by method ME-ICP61 was performed at ALS facilities in Lima, Peru. Samples with over limits in copper (+ 10,000 ppm) were re-assayed by ore grade method Cu-OG62 that includes four acid digestion and ICP-OES reading. The Company follows industry standard procedures for the work carried out on the San Pietro Project, with a quality assurance/quality control ("QA/QC") program. Blank and standard samples were inserted in each batch of samples sent to the laboratory for analysis. Golden Arrow detected no significant QA/QC issues with material effect on the data.
Qualified Persons
The exploration programs are designed by the Company's geological staff and results are reviewed, verified (including sampling, analytical and test data) and compiled under the supervision of Brian McEwen, P.Geol., VP Exploration and Development to the Company. Mr. McEwen is a Qualified Person as defined in National Instrument 43-101 and has reviewed and approved the contents of the news release.
About the San Pietro Project
The San Pietro Project targets the discovery of multiple copper-gold-iron oxide ("IOCG") plus cobalt deposits on over 21,000 hectares located approximately 100 kilometres north of Copiapó in the Atacama Region of Chile. To date, Golden Arrow has completed an initial Mineral Resource Estimate for the Rincones and Colla deposits that includes 2,470 Mlbs of contained Cu and 770,000 oz contained Au (492 Mt with an average grade of 0.23% Cu, 0.05 g/t Au, 99 g/t Co and 14.43% Fe; NI 43-101 Technical Report filed on SEDAR+).
Situated between and adjacent to Capstone Copper's Manto Verde Mine property and Santo Domingo Project, San Pietro is in the centre of a new copper-iron-cobalt district within an active, well-developed mining region that is home to all the major IOCG deposits in Chile.
Golden Arrow operates San Pietro through its 75%-owned Chilean subsidiary, New Golden Explorations Inc. ("NGE").
About Golden Arrow:
Golden Arrow is a mining exploration company with a successful track record of creating value by making precious and base metal discoveries and advancing them into exceptional deposits.
Golden Arrow is actively exploring its flagship property, the advanced San Pietro iron oxide-copper-gold-cobalt project in Chile, and a portfolio that includes nearly 125,000 hectares of prospective properties in Argentina.
The Company is a member of the Grosso Group, a resource management group that has pioneered exploration in Argentina since 1993.
ON BEHALF OF THE BOARD
"Nikolaos Cacos"_______________________________Mr. Nikolaos Cacos, President and CEO
Neither the TSXV nor its Regulation Services Provider (as that term is defined in policies of the TSXV) accepts responsibility for the adequacy or accuracy of this release.
This news release may contain forward-looking statements. Forward-looking statements address future events and conditions and therefore involve inherent risks and uncertainties. All statements, other than statements of historical fact, that address activities, events or developments the Company believes, expects or anticipates will or may occur in the future, including, without limitation; statements about the potential mineralization and future exploration plans of the Noemi target and San Pietro project; the Company's business strategy, plans and outlooks; the future financial or operating performance of the Company are forward-looking statements.
Forward-looking statements are subject to a number of risks and uncertainties that may cause the actual results of the Company to differ materially from those discussed in the forward-looking statements and, even if such actual results are realized or substantially realized, there can be no assurance that they will have the expected consequences to, or effects on, the Company. Factors that could cause actual results or events to differ materially from current expectations include, among other things: risks and uncertainties related to the ability to obtain, amend, or maintain licenses, permits, or surface rights; risks associated with obtaining necessary regulatory approvals (including the TSXV's approval); risks associated with technical difficulties in connection with exploration activities; and the possibility that future exploration, development or mining results will not be consistent with the Company's expectations. Actual results may differ materially from those currently anticipated in such statements. Readers are encouraged to refer to the Company's public disclosure documents for a more detailed discussion of factors that may impact expected future results. The Company undertakes no obligation to publicly update or revise any forward-looking statements, unless required pursuant to applicable laws.
Cision
View original content to download multimedia:https://www.prnewswire.com/news-releases/golden-arrow-reports-exciting-new-gold-results-from-the-noemi-target-at-the-san-pietro-project-chile-302542599.html
SOURCE Golden Arrow Resources Corporation
Cision
View original content to download multimedia: http://www.newswire.ca/en/releases/archive/September2025/02/c0693.html
As the Canadian market navigates through a landscape marked by rising goods inflation and a slightly elevated unemployment rate, investors are increasingly focusing on small-cap stocks that may offer unique opportunities amid these economic conditions. In such an environment, identifying companies with strong fundamentals and growth potential can be crucial for those looking to uncover undiscovered gems in Canada.
Top 10 Undiscovered Gems With Strong Fundamentals In Canada
|
Name |
Debt To Equity |
Revenue Growth |
Earnings Growth |
Health Rating |
|---|---|---|---|---|
|
Pulse Seismic |
NA |
13.84% |
33.31% |
★★★★★★ |
|
Mako Mining |
6.32% |
19.64% |
64.11% |
★★★★★★ |
|
TWC Enterprises |
3.89% |
13.21% |
11.52% |
★★★★★★ |
|
Majestic Gold |
9.90% |
11.70% |
9.35% |
★★★★★★ |
|
Pinetree Capital |
0.21% |
62.25% |
64.39% |
★★★★★★ |
|
Heliostar Metals |
NA |
106.15% |
25.32% |
★★★★★★ |
|
Itafos |
25.35% |
11.38% |
45.32% |
★★★★★★ |
|
BMTC Group |
NA |
-4.13% |
-8.71% |
★★★★★☆ |
|
Corby Spirit and Wine |
57.06% |
9.84% |
-5.44% |
★★★★☆☆ |
|
Dundee |
2.02% |
-35.84% |
57.23% |
★★★★☆☆ |
Let’s explore several standout options from the results in the screener.
Simply Wall St Value Rating: ★★★★★★
Overview: GoGold Resources Inc. focuses on the exploration, development, and production of silver, gold, and copper mainly in Mexico with a market capitalization of CA$824.89 million.
Operations: GoGold Resources generates revenue primarily from the production and sale of silver, gold, and copper. The company operates in Mexico and has a market capitalization of CA$824.89 million.
GoGold Resources, a nimble player in the mining sector, recently reported impressive earnings for Q3 2025, with sales reaching US$17.71 million compared to US$10.36 million last year. The company turned its fortunes around with a net income of US$8.21 million from a previous net loss of US$0.48 million, highlighting its profitability boost this year without any debt burden over the past five years. With high-quality earnings and free cash flow positivity, GoGold also produced 555,500 silver equivalent ounces last quarter, showcasing robust operational performance and potential for continued growth in the competitive metals industry.
-
Click to explore a detailed breakdown of our findings in GoGold Resources’ health report.
-
Examine GoGold Resources’ past performance report to understand how it has performed in the past.
TSX:GGD Debt to Equity as at Aug 2025Total Energy Services
Simply Wall St Value Rating: ★★★★★★
Overview: Total Energy Services Inc. is an energy services company operating in Canada, the United States, Australia, and internationally with a market capitalization of CA$446.23 million.
Operations: Total Energy Services generates revenue from four primary segments: Compression and Process Services (CA$466.41 million), Contract Drilling Services (CA$332.82 million), Well Servicing (CA$114.23 million), and Rentals and Transportation Services (CA$77.62 million).
Total Energy Services, a notable player in energy services, has seen its earnings grow by 55.7% over the past year, outpacing the industry average. The company’s debt to equity ratio has impressively decreased from 47.6% to 17.2% over five years, showcasing effective financial management. With free cash flow remaining positive and interest payments well-covered at 13 times EBIT, Total Energy is financially robust. Recent Q2 results show sales of CA$250 million and net income of CA$17 million; these figures reflect solid performance despite challenges like U.S. market pressures and high capital expenditures for equipment upgrades and acquisitions like Saxon.
TSX:TOT Debt to Equity as at Aug 2025ShaMaran Petroleum
Simply Wall St Value Rating: ★★★★☆☆
Overview: ShaMaran Petroleum Corp., along with its subsidiaries, is involved in oil and gas exploration and production, with a market cap of CA$602.50 million.
Operations: ShaMaran Petroleum generates revenue primarily from oil and gas production activities. The company’s financial performance is influenced by fluctuations in production volumes and market prices for oil and gas. Operating costs, including exploration expenses, significantly impact its profitability.
ShaMaran Petroleum, a small cap player in the oil sector, has shown notable progress recently. The company’s average net daily oil production surged 88% to 22.7 Mbopd in Q2 2025 compared to the same period last year, while sales jumped from US$22.63 million to US$35.39 million. Though earnings are forecasted to decline by an average of 19.2% annually over the next three years, ShaMaran’s debt-to-equity ratio has impressively reduced from a staggering 5638% five years ago to a more manageable 63.6%. Despite these improvements, interest coverage remains low at just 1.5 times EBIT, suggesting room for financial optimization moving forward.
-
Take a closer look at ShaMaran Petroleum’s potential here in our health report.
-
Gain insights into ShaMaran Petroleum’s past trends and performance with our Past report.
TSXV:SNM Earnings and Revenue Growth as at Aug 2025Turning Ideas Into Actions
-
Click this link to deep-dive into the 44 companies within our TSX Undiscovered Gems With Strong Fundamentals screener.
-
Hold shares in these firms? Setup your portfolio in Simply Wall St to seamlessly track your investments and receive personalized updates on your portfolio’s performance.
-
Invest smarter with the free Simply Wall St app providing detailed insights into every stock market around the globe.
Ready For A Different Approach?
-
Explore high-performing small cap companies that haven’t yet garnered significant analyst attention.
-
Fuel your portfolio with companies showing strong growth potential, backed by optimistic outlooks both from analysts and management.
-
Find companies with promising cash flow potential yet trading below their fair value.
This article by Simply Wall St is general in nature. We provide commentary based on historical data and analyst forecasts only using an unbiased methodology and our articles are not intended to be financial advice. It does not constitute a recommendation to buy or sell any stock, and does not take account of your objectives, or your financial situation. We aim to bring you long-term focused analysis driven by fundamental data. Note that our analysis may not factor in the latest price-sensitive company announcements or qualitative material. Simply Wall St has no position in any stocks mentioned.
Companies discussed in this article include TSX:GGD TSX:TOT and TSXV:SNM.
Have feedback on this article? Concerned about the content? Get in touch with us directly. Alternatively, email editorial-team@simplywallst.com
Explore GoGold Resources's Fair Values from the Community and select yours
What trends should we look for it we want to identify stocks that can multiply in value over the long term? Amongst other things, we'll want to see two things; firstly, a growing return on capital employed (ROCE) and secondly, an expansion in the company's amount of capital employed. Basically this means that a company has profitable initiatives that it can continue to reinvest in, which is a trait of a compounding machine. Speaking of which, we noticed some great changes in GoGold Resources' (TSE:GGD) returns on capital, so let's have a look.
Return On Capital Employed (ROCE): What Is It?
If you haven't worked with ROCE before, it measures the 'return' (pre-tax profit) a company generates from capital employed in its business. The formula for this calculation on GoGold Resources is:
Return on Capital Employed = Earnings Before Interest and Tax (EBIT) ÷ (Total Assets – Current Liabilities)
0.037 = US$13m ÷ (US$388m – US$22m) (Based on the trailing twelve months to June 2025).
Therefore, GoGold Resources has an ROCE of 3.7%. Even though it's in line with the industry average of 4.2%, it's still a low return by itself.
View our latest analysis for GoGold Resources
TSX:GGD Return on Capital Employed August 7th 2025
Above you can see how the current ROCE for GoGold Resources compares to its prior returns on capital, but there's only so much you can tell from the past. If you'd like to see what analysts are forecasting going forward, you should check out our free analyst report for GoGold Resources .
So How Is GoGold Resources' ROCE Trending?
GoGold Resources has recently broken into profitability so their prior investments seem to be paying off. Shareholders would no doubt be pleased with this because the business was loss-making five years ago but is is now generating 3.7% on its capital. And unsurprisingly, like most companies trying to break into the black, GoGold Resources is utilizing 293% more capital than it was five years ago. We like this trend, because it tells us the company has profitable reinvestment opportunities available to it, and if it continues going forward that can lead to a multi-bagger performance.
In Conclusion…
Long story short, we're delighted to see that GoGold Resources' reinvestment activities have paid off and the company is now profitable. Since the stock has only returned 30% to shareholders over the last five years, the promising fundamentals may not be recognized yet by investors. Given that, we'd look further into this stock in case it has more traits that could make it multiply in the long term.
On the other side of ROCE, we have to consider valuation. That's why we have a FREE intrinsic value estimation for GGD on our platform that is definitely worth checking out.
If you want to search for solid companies with great earnings, check out this free list of companies with good balance sheets and impressive returns on equity.
Have feedback on this article? Concerned about the content? Get in touch with us directly. Alternatively, email editorial-team (at) simplywallst.com.This article by Simply Wall St is general in nature. We provide commentary based on historical data and analyst forecasts only using an unbiased methodology and our articles are not intended to be financial advice. It does not constitute a recommendation to buy or sell any stock, and does not take account of your objectives, or your financial situation. We aim to bring you long-term focused analysis driven by fundamental data. Note that our analysis may not factor in the latest price-sensitive company announcements or qualitative material. Simply Wall St has no position in any stocks mentioned.
Halifax, Nova Scotia–(Newsfile Corp. – August 6, 2025) – GoGold Resources Inc. (TSX: GGD) (OTCQX: GLGDF) ("GoGold", "the Company") announces the financial results for the quarter ending June 30, 2025, with the Parral tailings reprocessing project generating revenue of $17.7 million (all amounts are in U.S. dollars) from the sale of 527,933 silver equivalent ounces.
"Parral continued to generate significant cash flow for the Company during the quarter, driving operating cash flow of $7 million which is exceeding our spending at Los Ricos and corporate costs. Our revenues for the year to date are more than double that of last year, which has helped us generate operating cash flows of over $20 million US over the last nine months," said Brad Langille, President and CEO. "With our strong cash flow generation and our cash position of $139 million we are well capitalized as we anticipate a permit for our Los Ricos South project."
Highlights for the quarter ending June 30, 2025:
-
Cash of $139 million USD, an increase of $61 million during the quarter including the $57 million financing
-
Cash flow from operations of $7.2 million
-
Revenue of $17.7 million on the sale of 555,933 silver equivalent ounces at an average realized price per ounce of $33.54
-
Production of 555,500 silver equivalent ounces, consisting of 201,616 silver ounces, 3,100 gold ounces, 128 copper tonnes, 140 zinc tonnes
-
Net income of $8.2 million
-
Cash cost per silver equivalent ounce of $17.21
-
All in sustaining cost per silver equivalent ounce of $22.78
Following are tables showing summarized financial information and key performance indicators:
|
Summarized Consolidated Financial Information |
Three months ended June 30 |
|
Nine months ended June 30 |
||||||||||
|
(in thousands USD, except per share amounts) |
2025 |
2024 |
|
2025 |
2024 |
||||||||
|
Revenue |
$ |
17,707 |
$ |
10,358 |
|
$ |
54,408 |
$ |
26,097 |
||||
|
Cost of sales, including depreciation |
10,174 |
4,590 |
|
34,760 |
17,173 |
||||||||
|
Operating income (loss) |
4,629 |
3,600 |
|
12,079 |
1,869 |
||||||||
|
Net income |
8,214 |
(483 |
) |
|
11,436 |
864 |
|||||||
|
Basic net income per share |
0.022 |
(0.002 |
) |
|
0.033 |
0.003 |
|||||||
|
Cash flow provided by (used in) operations |
7,245 |
(2,157 |
) |
|
20,264 |
(9,819 |
) |
||||||
|
Key Performance Indicators1 |
Three months ended June 30 |
Nine months ended June 30 |
||||||||||
|
(in thousands USD, except per ounce amounts) |
2025 |
2024 |
2025 |
2024 |
||||||||
|
Total tonnes stacked |
402,906 |
425,804 |
1,195,583 |
1,223,665 |
||||||||
|
Silver equivalent ounces sold |
527,933 |
365,119 |
1,709,416 |
1,044,346 |
||||||||
|
Realized silver price |
$ |
33.54 |
$ |
28.37 |
$ |
31.83 |
$ |
24.99 |
||||
|
Adjusted AISC per silver equivalent ounce2 |
$ |
22.78 |
$ |
24.59 |
$ |
22.73 |
$ |
24.47 |
||||
|
Adjusted Cash cost per silver equivalent ounce2 |
$ |
17.21 |
$ |
18.54 |
$ |
18.20 |
$ |
17.59 |
||||
1Key performance indicators are unaudited non-GAAP measures, see reconciliation in MD&A.2Gold, copper and zinc are converted using average market prices.
This news release should be read in conjunction with the interim condensed consolidated financial statements for the quarter ended June 30, 2025, notes to the financial statements, and management's discussion and analysis for the quarter ended June 30, 2025, which have been filed on SEDAR+ and are available on the Company's website.
Technical information contained in this news release with respect to GoGold has been reviewed and approved by Mr. Bob Harris, P.Eng., who is a qualified person for the purposes of NI 43-101.
About GoGold ResourcesGoGold Resources (TSX: GGD) is a Canadian-based silver and gold producer focused on operating, developing, exploring and acquiring high quality projects in Mexico. The Company operates the Parral Tailings mine in the state of Chihuahua and has the Los Ricos South and Los Ricos North exploration and development projects in the state of Jalisco. Headquartered in Halifax, NS, GoGold is building a portfolio of low cost, high margin projects. For more information visit gogoldresources.com.
For further information please contact:
Steve Low, Corporate DevelopmentGoGold Resources Inc.T: 416 855 0435
Email : steve@gogoldresources.comOr visit : www.gogoldresources.com
CAUTIONARY STATEMENT:The securities described herein have not been, and will not be, registered under the United States Securities Act of 1933, as amended (the "U.S. Securities Act"), or any state securities laws, and may not be offered or sold within the United States or to, or for the benefit of, U.S. persons (as defined in Regulation S under the U.S. Securities Act) except in compliance with the registration requirements of the U.S. Securities Act and applicable state securities laws or pursuant to exemptions therefrom. This release does not constitute an offer to sell or a solicitation of an offer to buy of any of GoGold's securities in the United States.
This news release may contain "forward-looking information" as defined in applicable Canadian securities legislation. All statements other than statements of historical fact, included in this release, including, without limitation, statements regarding the Parral tailings project, the Los Ricos project, future operating margins, future production and processing, and future plans and objectives of GoGold, constitute forward looking information that involve various risks and uncertainties. Forward-looking information is based on a number of factors and assumptions which have been used to develop such information but which may prove to be incorrect, including, but not limited to, assumptions in connection with the continuance of GoGold and its subsidiaries as a going concern, general economic and market conditions, mineral prices, the accuracy of mineral resource estimates, and the performance of the Parral project There can be no assurance that such information will prove to be accurate and actual results and future events could differ materially from those anticipated in such forward-looking information.
Important factors that could cause actual results to differ materially from GoGold's expectations include exploration and development risks associated with the GoGold's projects, the failure to establish estimated mineral resources or mineral reserves, volatility of commodity prices, variations of recovery rates, and global economic conditions. For additional information with respect to risk factors applicable to GoGold, reference should be made to GoGold's continuous disclosure materials filed from time to time with securities regulators, including, but not limited to, GoGold's Annual Information Form. The forward-looking information contained in this release is made as of the date of this release.
Cautionary non-GAAP Measures and Additional GAAP MeasuresNote that for purposes of this section, GAAP refers to IFRS. The Company believes that investors use certain non-GAAP and additional GAAP measures as indicators to assess mining companies. They are intended to provide additional information and should not be considered in isolation or as a substitute for measures of performance prepared with GAAP. Non-GAAP and additional GAAP measures do not have a standardized meaning prescribed under IFRS and therefore may not be comparable to similar measures presented by other companies.
Additional GAAP measures that are presented on the face of the Company's consolidated statements of comprehensive income include "Operating income (loss)". These measures are intended to provide an indication of the Company's mine and operating performance. Per ounce measures are calculated by dividing the relevant mining and processing costs and total costs by the tonnes of ore processed in the period. "Adjusted cash costs per ounce" and "Adjusted all-in sustaining costs per ounce" are used in this analysis and are non-GAAP terms typically used by mining companies to assess the level of gross margin available to the Company by subtracting these costs from the unit price realized during the period. These non-GAAP terms are also used to assess the ability of a mining company to generate cash flow from operations. There may be some variation in the method of computation of these metrics as determined by the Company compared with other mining companies. In this context, "Adjusted cash costs per ounce" reflects the cash operating costs allocated from in-process and dore inventory associated with ounces of silver and gold sold in the period. "Adjusted cash costs per ounce" may vary from one period to another due to operating efficiencies, grade of material processed and silver/gold recovery rates in the period. "Adjusted all-in sustaining costs per ounce" include total cash costs, exploration, corporate and administrative, share based compensation and sustaining capital costs. For a reconciliation of non-GAAP and GAAP measures, please refer to the Management Discussion and Analysis dated August 5, 2025 for the period ended June 30, 2025, as presented on SEDAR+.
To view the source version of this press release, please visit https://www.newsfilecorp.com/release/261384
TSX Venture Exchange (TSX-V): GRGFrankfurt Stock Exchange (FSE): G6AOTCQB Venture Market (OTCQB): GARWF
VANCOUVER, BC, May 14, 2025 /PRNewswire/ – Golden Arrow Resources Corporation (TSXV: GRG) (FSE: G6A) (OTCQB: GARWF), ("Golden Arrow" or the "Company") is pleased to report on recent activities and results that underscore the potential for new discoveries, particularly with a focus on gold, at the San Pietro Copper-Gold-Iron oxide-Cobalt Project ("IOCG"), Chile ("San Pietro" or the "Project"). This includes the first sampling results from two exciting new targets (Noemi and Lolita Norte) and the addition of new concession package (Cerro Sur) with highly prospective gold-copper results from historic drilling (see Figure 1).
Golden Arrow Resources Corporation logo (CNW Group/Golden Arrow Resources Corporation)
-
The Noemi target (Figure 2) demonstrates the hallmarks of IOCG deposits like the Rincones & Colla deposits, 7km to the southeast along a structural trend, including,
-
High magnetic anomalies coincident with specularite, quartz, carbonate and copper oxides in potassic-altered breccias and veins up to 3 metres wide with multiple anomalous rock chip samples including 1.4 m averaging 3.41% Cu and 0.26 g/t Au.
-
-
Prominent north-south breccia veins offer large gold targets at both Noemi and Lolita Norte:
-
800 metres of strike returned 4 significant gold-copper values in rock chip channel samples, such as 3.0 m averaging 4.19 g/t Au and 2.08 % Cu at the Florencia structure, Noemi target.
-
A similar structure at Lolita Norte target (Figure 3) is believed to be the continuation of an historically mined vein system; new sampling confirmed gold and copper along 1.9km of strike.
-
-
The newly acquired 1,500-hectare Cerro Sur concession package expands the discovery potential at San Pietro. There is diamond-drilled core remaining on site from historic targets, and summary assay results for over 4,600m of drilling for gold and copper that include:
-
Intercepts from 0.1 g/t Au to as high as 27.9 g/t Au, with a best reported interval of 6 metres averaging 4 g/t Au
-
Single intercepts from 0.1% Cu to as much as 62 metres averaging 0.25% Cu.
-
Brian McEwen, Golden Arrow VP Exploration and Development stated, "Results from our 2024 exploration program continue to demonstrate that San Pietro has a huge amount of remaining discovery potential. The results from Noemi and Lolita Norte are very promising, and the amount of gold is particularly encouraging. The Cerro Sur acquisition adds a big opportunity as there has been a lot of work done by some major companies in the past and our preliminary review of the information supports the potential for more gold and copper discoveries. We are continuing our systematic exploration in these areas and throughout the more than 50% of the property that remains untested. We are refining targets for a Phase 3 drill program which will be designed to expand resources at our Rincones and Colla deposits and identify new deposits at San Pietro."
Additional detailed mapping and sampling is on-going at Noemi and Lolita Norte to delineate targets for future drilling. At Cerro Sur, the Company plans to relog and retest any viable remaining drill core to create a modern database for the area. Additional field work is also being planned.
Exploration Program Details
In 2024 the Golden Arrow team continued surface exploration throughout the large San Pietro property, concurrent with the resource delineation drilling program at the Rincones and Colla targets. The first detailed geological mapping was completed in the south and southwestern parts of San Pietro as well as a 1500-hectare ground magnetics survey and the new Noemi and Lolita Norte target areas were delineated (see Figure 1 project map including Figure 2 and 3 detail map locations).
Noemi
Noemi covers an area of approximately 2 by 3 kilometres located approximately 7 kilometers south of the Rincones resource area. The main geological units mapped are fine andesites, tuffs and volcaniclastic rocks intruded by a microdiorite, and in some areas there is gravel cover. There is an early stage of alteration of scapolite-actinolite-magnetite crosscut by NW to N-S trending shear zones. These zones include breccias and veins up to 3 metres wide, with specularite, quartz, carbonate and copper oxides and a potassic feldspar-chlorite-epidote alteration. These structures are anomalous in gold and copper with values in rock chip channel samples of up to 1.4 m with 3.41% Cu and 0.26 g/t Au (see Figure 2). Several of these areas are coincident with strong magnetic anomalies. The coincidence of the appropriate lithologies with good alteration, copper-gold structures and high magnetic anomalies indicates potential for new IOCG deposit discoveries similar to the Rincones deposit.
Also of particular interest within the Noemi target is a prominent north-south breccia vein of quartz-tourmaline-specularite-carbonate-jarosite. This structure ("Florencia") outcrops in 2 sections (north and south). In the south section the vein has a width of 1 to 3 metres but reaches up to 8 metres with the adjacent veinlets. Four rock chip channel samples collected across the structure, along 800 metres of strike, returned significant gold-copper values such as 3.0 m with 4.19 g/t Au and 2.08% Cu (Figure 2).
Lolita Norte
Three kilometres west of the Noemi the team identified a second high-priority target, called Lolita Norte.
A similar structure to Florencia was identified and mapped for more than 1.9 kilometres with the possibility that it continues to the north under the gravel cover. It is believed to be the northern extension of the Lolita-Madura gold vein system which was exploited as part of a private underground gold mining operation in the 1980´s, the remains of which are situated approximately 2.5 kilometres to the south, off the San Pietro concessions. [Proximity to a mineral resource, deposit, or mine does not indicate that mineralization will occur on Golden Arrow's property, and if mineralization does occur, that it will occur in sufficient quantity or grade that would result in an economic extraction scenario.]
The mineralization at Lolita Norte is similar to Florencia with gold and copper in a quartz-tourmaline-carbonate vein and breccia structure with a width of 1 to 8 metres. In this case the host rock is granodiorite that is part of the Sierra Mercedita Pluton. The team completed the first stage of reconnaissance of this target, collecting 61 rock chip samples from the veins and old small miner workings (Figure 3). Well-mineralized samples occurred throughout the entire length of the structure, and in some cases the host granite carried similar mineralization to the veins. For instance, rock chip samples from an "underground breccia" (taken from old workings approximately 15 m deep) included a vein sample assayed at 0.75 m averaging 0.35 g/t Au with sampling of the adjacent granite returning 1.5 m averaging 0.20 g/t Au and 1.0 m averaging 0.64 g/t Au.
Cerro Sur Acquisition
Cerro Sur is comprised of 1,500 hectares of mining exploration concessions adjacent to the western border of the San Pietro Project (Figure 1). The Cerro Sur concessions recently became publicly available and Golden Arrow's Chilean subsidiary, New Golden Explorations Inc. ("NGE"), secured a 100% interest via the Chilean government application process. Verbal accounts suggest that as much as 10,000 metres of drilling has been completed at the project in the past. The third-party historic summary report currently available (the "Summary") provides information from several exploration programs prior to 2018 with work completed by major companies that included geological mapping, surface sampling, trenching and geophysical surveys (magnetometry and TEM) and testing for copper and gold by diamond drilling of 4,695 metres in 17 holes. Golden Arrow's Qualified Person has not verified the information in the Summary and no details on methodology or QA/QC were included, therefore this information is considered "anecdotal" at this stage and only indicative of the potential of the project. Drill core from the project is available and an initial review indicates that it is mostly intact, although it has not been confirmed that it all, and only, coincides with the holes reported in the Summary. NGE plans to relog, resample and re-assay the core as much as possible to validate the historic data and create a robust database.
The Cerro Sur project is located within the Atacama Fault System ("AFS"). The north-south lying AFS includes a wide zone of deformation that controls the mineralization and alteration at San Pietro and other nearby IOCG deposits. This includes the Mantoverde IOCG deposit and mine complex which is located less than 10km to the southwest of Cerro Sur, and is one of several deposit models used for exploration at San Pietro (see NI 43-101 Technical Report filed on SEDAR+). The Summary for Cerro Sur suggests that the underlying volcanic basement rocks are the Jurassic aged La Negra Formation, which is the same group at least partly assigned to the rocks that underly at Manto Verde. Locally these are overlain by granitic rocks from the Upper Cretaceous aged Sierra Merceditas Pluton, which is also mapped at the Lolita target area (see above). Along a six kilometre north-south section of the Merceditas Fault and its related structures (a subsidiary of the AFS), several veins and stockworks with gold and copper have been identified. The copper is associated with shear zones containing magnetite that can be associated with an IOCG model, while the gold mineralization might be related to an epithermal episode associated with the intrusive.
The Summary indicates that five targets were tested by diamond drilling of across several of the steeply dipping mineralized structures. Twelve holes reported anomalous copper and/or gold intervals. Anomalous intervals occurred from 0 to as much as 335 metres downhole and many holes reported multiple intervals. For copper, notable intervals ranged from single (1 metre or less) intercepts of >0.1% Cu to as much as 62 metres averaging 0.25% Cu. For gold, notable single intercepts ranged from 0.1 g/t Au to as high as 27.9 g/t Au, with the longest reported interval of 6 metres averaging 4 g/t Au.
Methodology & QA/QC
Rock chip samples at Noemi and Lolita Norte targets were collected by the NGE technical team. Samples were shipped to ALS Laboratory in Copiapo, Chile by a contract truck service. Sample preparation and gold analysis by Fire Assay and reading by atomic absorption on 30 gm sample by method Au-AA23 was completed at the ALS facility in Santiago de Chile. Multi-element package by ICP-OES reading following a four-acid digestion by method ME-ICP61 was performed at ALS facilities in Lima, Peru. Samples with over limits in copper (+ 10,000 ppm) were re-assayed by ore grade method Cu-OG62 that includes four acid digestion and ICP-OES reading. The Company follows industry standard procedures for the work carried out on the San Pietro Project, with a quality assurance/quality control ("QA/QC") program. Blank and standard samples were inserted in each batch of samples sent to the laboratory for analysis. Golden Arrow detected no significant QA/QC issues with material effect on the data.
Qualified Persons
The exploration programs are designed by the Company's geological staff and results are reviewed, verified (including sampling, analytical and test data) and compiled under the supervision of Brian McEwen, P.Geol., VP Exploration and Development to the Company. Mr. McEwen is a Qualified Person as defined in National Instrument 43-101 and has reviewed and approved the contents of the news release.
About the San Pietro Project
The San Pietro Project targets the discovery of multiple copper-gold-iron oxide ("IOCG") plus cobalt deposits on over 21,000 hectares located approximately 100 kilometres north of Copiapó in the Atacama Region of Chile. To date, Golden Arrow has completed an initial Mineral Resource Estimate for the Rincones and Colla deposits that includes 2,470 Mlbs of contained Cu and 770,000 oz contained Au (492 Mt with an average grade of 0.23% Cu, 0.05 g/t Au, 99 g/t Co and 14.43% Fe; NI 43-101 Technical Report filed on SEDAR+).
Situated between and adjacent to Capstone Copper's Manto Verde Mine property and Santo Domingo Project, San Pietro is in the centre of a new copper-iron-cobalt district within an active, well-developed mining region that is home to all the major IOCG deposits in Chile.
Golden Arrow operates San Pietro through its 75%-owned Chilean subsidiary, New Golden Explorations Inc. ("NGE").
About Golden Arrow:
Golden Arrow is a mining exploration company with a successful track record of creating value by making precious and base metal discoveries and advancing them into exceptional deposits.
Golden Arrow is actively exploring its flagship property, the advanced San Pietro iron oxide-copper-gold-cobalt project in Chile, and a portfolio that includes nearly 125,000 hectares of prospective properties in Argentina.
The Company is a member of the Grosso Group, a resource management group that has pioneered exploration in Argentina since 1993.
ON BEHALF OF THE BOARD
"Joseph Grosso" _______________________________
Mr. Joseph Grosso, Executive Chairman, President and CEO
Neither the TSXV nor its Regulation Services Provider (as that term is defined in policies of the TSXV) accepts responsibility for the adequacy or accuracy of this release.
This news release may contain forward-looking statements. Forward-looking statements address future events and conditions and therefore involve inherent risks and uncertainties. All statements, other than statements of historical fact, that address activities, events or developments the Company believes, expects or anticipates will or may occur in the future, including, without limitation, statements about the terms of the Amending Agreement, the exercise of the Amended Option and the timing thereof, the TSXV's approval of the Transaction; the gross proceeds under the Private Placement, the Company's plans for its mineral properties; the Company's business strategy, plans and outlooks; the future financial or operating performance of the Company are forward-looking statements.
Forward-looking statements are subject to a number of risks and uncertainties that may cause the actual results of the Company to differ materially from those discussed in the forward-looking statements and, even if such actual results are realized or substantially realized, there can be no assurance that they will have the expected consequences to, or effects on, the Company. Factors that could cause actual results or events to differ materially from current expectations include, among other things: risks and uncertainties related to the ability to obtain, amend, or maintain licenses, permits, or surface rights; risks associated with obtaining necessary regulatory approvals (including the TSXV's approval); risks associated with technical difficulties in connection with mining activities; and the possibility that future exploration, development or mining results will not be consistent with the Company's expectations. Actual results may differ materially from those currently anticipated in such statements. Readers are encouraged to refer to the Company's public disclosure documents for a more detailed discussion of factors that may impact expected future results. The Company undertakes no obligation to publicly update or revise any forward-looking statements, unless required pursuant to applicable laws.
Cision
View original content to download multimedia:https://www.prnewswire.com/news-releases/golden-arrow-reports-gold-and-copper-at-new-exploration-targets-and-expands-concessions-at-san-pietro-copper-gold-project-chile-302454665.html
SOURCE Golden Arrow Resources Corporation
Halifax, Nova Scotia–(Newsfile Corp. – May 7, 2025) – GoGold Resources Inc. (TSX: GGD) (OTCQX: GLGDF) ("GoGold", "the Company") announces the financial results for the quarter ending March 31, 2025, with Parral generating revenue of $17.6 million (all amounts are in U.S. dollars) from the sale of 555,511 silver equivalent ounces.
"Parral continued to generate significant cash flow for the Company during the quarter, providing operating cash flow of $5 million which is exceeding our spending at Los Ricos and corporate costs, and increased our cash balance by $2 million at quarter end," said Brad Langille, President and CEO. "With our bought deal financing completed in April, this gives us an approximately $135 million cash balance today putting us in a very strong financial position to execute on Los Ricos South."
Highlights for the quarter ending March 31, 2025:
-
Cash of $78.3 million USD, an increase of $2.0 million during the quarter
-
Cash flow from operations of $5.1 million
-
Revenue of $17.6 million on the sale of 555,511 silver equivalent ounces at an average realized price per ounce of $31.70
-
Production of 555,479 silver equivalent ounces, consisting of 210,289 silver ounces, 3,279 gold ounces, 155 copper tonnes, 160 zinc tonnes
-
Cash cost per silver equivalent ounce of $17.85
-
All in sustaining cost per silver equivalent ounce of $22.98
Following are tables showing summarized financial information and key performance indicators:
|
Summarized Consolidated Financial Information |
Three months ended Mar 31 |
|
Six months ended Mar 31 |
||||||||||
|
(in thousands USD, except per share amounts) |
2025 |
2024 |
|
2025 |
2024 |
||||||||
|
Revenue |
$ |
17,602 |
$ |
8,940 |
|
$ |
36,700 |
$ |
15,739 |
||||
|
Cost of sales, including depreciation |
11,067 |
6,517 |
|
24,585 |
12,584 |
||||||||
|
Operating income (loss) |
3,780 |
(123 |
) |
|
7,449 |
(1,732 |
) |
||||||
|
Net income |
3,357 |
1,268 |
|
3,220 |
1,463 |
||||||||
|
Basic net income per share |
0.010 |
0.004 |
|
0.010 |
0.005 |
||||||||
|
Cash flow provided by (used in) operations |
5,145 |
(4,637 |
) |
|
13,012 |
(7,665 |
) |
||||||
|
Key Performance Indicators1 |
Three months ended Mar 31 |
|
Six months ended Mar 31 |
||||||||||
|
(in thousands USD, except per ounce amounts) |
2025 |
2024 |
|
2025 |
2024 |
||||||||
|
Total tonnes stacked |
377,516 |
423,977 |
|
792,677 |
797,861 |
||||||||
|
Silver equivalent ounces sold |
555,511 |
374,140 |
|
1,181,483 |
679,227 |
||||||||
|
Realized silver price |
$ |
31.70 |
$ |
23.90 |
|
$ |
31.06 |
$ |
23.17 |
||||
|
Adjusted AISC per silver equivalent ounce2 |
$ |
22.98 |
$ |
24.20 |
|
$ |
22.70 |
$ |
24.40 |
||||
|
Adjusted Cash cost per silver equivalent ounce2 |
$ |
17.85 |
$ |
17.29 |
|
$ |
18.64 |
$ |
17.08 |
||||
1Key performance indicators are unaudited non-GAAP measures, see reconciliation in MD&A.2Gold, copper and zinc are converted using average market prices.
This news release should be read in conjunction with the interim condensed consolidated financial statements for the quarter ended March 31, 2025, notes to the financial statements, and management's discussion and analysis for the quarter ended March 31, 2025, which have been filed on SEDAR+ and are available on the Company's website.
Technical information contained in this news release with respect to GoGold has been reviewed and approved by Mr. Bob Harris, P.Eng., who is a qualified person for the purposes of NI 43-101.
About GoGold ResourcesGoGold Resources (TSX: GGD) is a Canadian-based silver and gold producer focused on operating, developing, exploring and acquiring high quality projects in Mexico. The Company operates the Parral Tailings mine in the state of Chihuahua and has the Los Ricos South and Los Ricos North exploration and development projects in the state of Jalisco. Headquartered in Halifax, NS, GoGold is building a portfolio of low cost, high margin projects. For more information, visit gogoldresources.com.
For further information, please contact:
Steve Low, Corporate DevelopmentGoGold Resources Inc. T: 416 855 0435
Email: steve@gogoldresources.comOr visit: www.gogoldresources.com
CAUTIONARY STATEMENT:The securities described herein have not been, and will not be, registered under the United States Securities Act of 1933, as amended (the "U.S. Securities Act"), or any state securities laws, and may not be offered or sold within the United States or to, or for the benefit of, U.S. persons (as defined in Regulation S under the U.S. Securities Act) except in compliance with the registration requirements of the U.S. Securities Act and applicable state securities laws or pursuant to exemptions therefrom. This release does not constitute an offer to sell or a solicitation of an offer to buy of any of GoGold's securities in the United States.
This news release may contain "forward-looking information" as defined in applicable Canadian securities legislation. All statements other than statements of historical fact, included in this release, including, without limitation, statements regarding the Parral tailings project, the Los Ricos project, future operating margins, future production and processing, and future plans and objectives of GoGold, constitute forward looking information that involve various risks and uncertainties. Forward-looking information is based on a number of factors and assumptions which have been used to develop such information but which may prove to be incorrect, including, but not limited to, assumptions in connection with the continuance of GoGold and its subsidiaries as a going concern, general economic and market conditions, mineral prices, the accuracy of mineral resource estimates, and the performance of the Parral project There can be no assurance that such information will prove to be accurate and actual results and future events could differ materially from those anticipated in such forward-looking information.
Important factors that could cause actual results to differ materially from GoGold's expectations include exploration and development risks associated with the GoGold's projects, the failure to establish estimated mineral resources or mineral reserves, volatility of commodity prices, variations of recovery rates, and global economic conditions. For additional information with respect to risk factors applicable to GoGold, reference should be made to GoGold's continuous disclosure materials filed from time to time with securities regulators, including, but not limited to, GoGold's Annual Information Form. The forward-looking information contained in this release is made as of the date of this release.
Cautionary Non-GAAP Measures and Additional GAAP Measures Note that for purposes of this section, GAAP refers to IFRS. The Company believes that investors use certain non-GAAP and additional GAAP measures as indicators to assess mining companies. They are intended to provide additional information and should not be considered in isolation or as a substitute for measures of performance prepared with GAAP. Non-GAAP and additional GAAP measures do not have a standardized meaning prescribed under IFRS and therefore may not be comparable to similar measures presented by other companies.
Additional GAAP measures that are presented on the face of the Company's consolidated statements of comprehensive income include "Operating income (loss)". These measures are intended to provide an indication of the Company's mine and operating performance. Per ounce measures are calculated by dividing the relevant mining and processing costs and total costs by the tonnes of ore processed in the period. "Adjusted cash costs per ounce" and "Adjusted all-in sustaining costs per ounce" are used in this analysis and are non-GAAP terms typically used by mining companies to assess the level of gross margin available to the Company by subtracting these costs from the unit price realized during the period. These non-GAAP terms are also used to assess the ability of a mining company to generate cash flow from operations. There may be some variation in the method of computation of these metrics as determined by the Company compared with other mining companies. In this context, "Adjusted cash costs per ounce" reflects the cash operating costs allocated from in-process and dore inventory associated with ounces of silver and gold sold in the period. "Adjusted cash costs per ounce" may vary from one period to another due to operating efficiencies, grade of material processed and silver/gold recovery rates in the period. "Adjusted all-in sustaining costs per ounce" include total cash costs, exploration, corporate and administrative, share based compensation and sustaining capital costs. For a reconciliation of non-GAAP and GAAP measures, please refer to the Management Discussion and Analysis dated May 6, 2025 for the period ended March 31, 2025, as presented on SEDAR+.
To view the source version of this press release, please visit https://www.newsfilecorp.com/release/251054
The Canadian market has been navigating a landscape of heightened volatility, driven by global trade tensions and fluctuating tariffs. Amid this uncertainty, investors are increasingly looking beyond established giants to explore the potential of smaller companies. Penny stocks, often representing newer or smaller enterprises, continue to offer intriguing opportunities for those seeking affordability paired with growth potential.
Top 10 Penny Stocks In Canada
|
Name |
Share Price |
Market Cap |
Financial Health Rating |
|
Westbridge Renewable Energy (TSXV:WEB) |
CA$0.61 |
CA$61.7M |
★★★★★★ |
|
NTG Clarity Networks (TSXV:NCI) |
CA$1.63 |
CA$68.71M |
★★★★★☆ |
|
Orezone Gold (TSX:ORE) |
CA$1.09 |
CA$562M |
★★★★★☆ |
|
Amerigo Resources (TSX:ARG) |
CA$1.70 |
CA$280.75M |
★★★★★☆ |
|
Hemisphere Energy (TSXV:HME) |
CA$1.73 |
CA$167.33M |
★★★★★☆ |
|
Alvopetro Energy (TSXV:ALV) |
CA$4.57 |
CA$166.42M |
★★★★★★ |
|
PetroTal (TSX:TAL) |
CA$0.60 |
CA$549.3M |
★★★★★☆ |
|
McCoy Global (TSX:MCB) |
CA$2.58 |
CA$70.12M |
★★★★★★ |
|
Findev (TSXV:FDI) |
CA$0.46 |
CA$13.18M |
★★★★★★ |
|
BluMetric Environmental (TSXV:BLM) |
CA$1.14 |
CA$42.09M |
★★★★★★ |
Click here to see the full list of 931 stocks from our TSX Penny Stocks screener.
Here’s a peek at a few of the choices from the screener.
Simply Wall St Financial Health Rating: ★★★★★★
Overview: Avino Silver & Gold Mines Ltd. focuses on the acquisition, exploration, and development of mineral properties in Mexico with a market cap of CA$388.95 million.
Operations: The company generates revenue primarily from its Metals & Mining segment, specifically in Gold & Other Precious Metals, totaling $66.18 million.
Market Cap: CA$388.95M
Avino Silver & Gold Mines Ltd. has shown substantial growth, with earnings increasing by a very large 1394.5% over the past year, reflecting strong operational performance in its Metals & Mining segment. The company reported revenues of US$66.18 million for 2024 and net income surged to US$8.1 million from US$0.542 million the previous year, indicating improved profitability and efficient debt management with cash reserves of approximately $26 million at year-end 2024. With ongoing development at La Preciosa and a robust balance sheet, Avino is positioned to leverage its resources for future growth while maintaining low volatility in stock performance.
TSX:ASM Financial Position Analysis as at Apr 2025GoGold Resources
Simply Wall St Financial Health Rating: ★★★★★★
Overview: GoGold Resources Inc. is involved in the exploration, development, and production of silver, gold, and copper mainly in Mexico with a market cap of CA$579.20 million.
Operations: The company generates revenue from its Metals & Mining segment focused on Gold & Other Precious Metals, amounting to $48.80 million.
Market Cap: CA$579.2M
GoGold Resources Inc. has recently become profitable, with its short-term assets of $110.3 million comfortably covering both short and long-term liabilities, while maintaining a debt-free status. The company completed a CAD 75 million equity offering to support its Los Ricos South Project in Mexico, which boasts an after-tax NPV of USD 355 million and an IRR of 28% based on recent feasibility studies. Despite low return on equity at 0.4%, GoGold’s seasoned management team is steering the company towards projected earnings growth of over 40% annually, leveraging strong asset positioning and strategic project developments.
TSX:GGD Revenue & Expenses Breakdown as at Apr 2025Probe Gold
Simply Wall St Financial Health Rating: ★★★★★★
Overview: Probe Gold Inc. is a precious metal exploration company focused on acquiring, exploring, and developing gold properties in Canada, with a market cap of CA$367.02 million.
Operations: Probe Gold Inc. does not report any revenue segments as it is primarily engaged in the exploration and development of gold properties in Canada.
Market Cap: CA$367.02M
Probe Gold Inc., with a market cap of CA$367.02 million, remains pre-revenue as it focuses on gold exploration and development in Canada. The company is debt-free and has not experienced significant shareholder dilution over the past year. Recent capital raised through private placements enhances its cash runway beyond nine months, supporting continued project advancement. Notably, Probe’s Novador project in Quebec shows promising drilling results and favorable environmental geochemistry assessments, indicating non-acid-generating materials that lower infrastructure costs. Analysts anticipate a potential stock price increase of 87.5%, though profitability is not expected within the next three years due to ongoing exploration activities.
TSX:PRB Financial Position Analysis as at Apr 2025Turning Ideas Into Actions
-
Discover the full array of 931 TSX Penny Stocks right here.
-
Ready To Venture Into Other Investment Styles? Explore 22 top quantum computing companies leading the revolution in next-gen technology and shaping the future with breakthroughs in quantum algorithms, superconducting qubits, and cutting-edge research.
This article by Simply Wall St is general in nature. We provide commentary based on historical data and analyst forecasts only using an unbiased methodology and our articles are not intended to be financial advice. It does not constitute a recommendation to buy or sell any stock, and does not take account of your objectives, or your financial situation. We aim to bring you long-term focused analysis driven by fundamental data. Note that our analysis may not factor in the latest price-sensitive company announcements or qualitative material. Simply Wall St has no position in any stocks mentioned.
Companies discussed in this article include TSX:ASM TSX:GGD and TSX:PRB.
Have feedback on this article? Concerned about the content? Get in touch with us directly. Alternatively, email editorial-team@simplywallst.com
Halifax, Nova Scotia–(Newsfile Corp. – April 9, 2025) – GoGold Resources Inc. (TSX: GGD) (OTCQX: GLGDF) ("GoGold", "the Company") is pleased to report production for the quarter ending March 31, 2025 of 555,479 silver equivalent ounces, consisting of 210,289 silver ounces, 3,279 gold ounces, 117 tonnes of copper, and 157 tonnes of zinc.
"Parral has delivered strong stable quarterly production, with expected similar cash flows from the operation as the previous quarter. This cash flow generated from Parral allows us to fund additional exploration at Los Ricos South as we await our anticipated mining permit," said Brad Langille, President and CEO. "The recently completed equity financing, together with the robust Parral cash flow, not only strengthens our balance sheet for the upcoming mine build at Los Ricos South, but also allows us flexibility to advance Los Ricos North and explore around our mine reserves as we approach the execution phase at Los Ricos South. We believe this plan will ultimately generate the most value creation for the company."
Figure 1: Quarterly Production SummaryTo view an enhanced version of this graphic, please visit:https://images.newsfilecorp.com/files/1683/247855_1.jpg
Table 1: Quarterly Production Summary
|
Quarter Ended |
Dec 2023 |
Mar 2024 |
Jun 2024 |
Sep 2024 |
Dec 2024 |
Mar 2025 |
|
Silver Production (oz) |
109,016 |
138,657 |
138,708 |
167,001 |
226,343 |
210,289 |
|
Gold Production (oz) |
1,848 |
2,184 |
2,436 |
2,232 |
3,213 |
3,279 |
|
Copper Production (tonnes) |
95 |
93 |
148 |
132 |
121 |
117 |
|
Zinc Production (tonnes) |
– |
92 |
125 |
100 |
161 |
157 |
|
Silver Equivalent Production (oz)1 |
300,260 |
375,745 |
400,236 |
406,150 |
551,337 |
555,479 |
"Silver equivalent production" include gold ounces and copper tons produced and converted to a silver equivalent based on a ratio of the average market metal price for each period. The gold:silver ratio for each of the periods presented were: Dec 2023 – 85, Mar 2024 – 93, Jun 2024 – 86, Sep 2024 – 88, Dec 2024 – 90, Mar 2025 – 90. The copper:silver ratios were: Dec 2023 – 356, Mar 2024 – 365, Jun 2024 – 346, Sep 2024 – 320, Dec 2024 – 299, Mar 2025 – 318. The zinc:silver ratios were: Mar 2024 – 104, Jun 2024 – 98, Sep 2024 – 94, Dec 2024 – 97, Mar 2025 – 89.
Mr. Robert Harris, P.Eng. is the qualified person as defined by National Instrument 43-101 and is responsible for the technical information of this release related to Parral.
About GoGold ResourcesGoGold Resources (TSX: GGD) is a Canadian-based silver and gold producer focused on operating, developing, exploring and acquiring high quality projects in Mexico. The Company operates the Parral Tailings mine in the state of Chihuahua and has the Los Ricos South and Los Ricos North exploration and development projects in the state of Jalisco. Headquartered in Halifax, NS, GoGold is building a portfolio of low cost, high margin projects. For more information visit gogoldresources.com.
For further information please contact:
Steve Low, Corporate DevelopmentGoGold Resources Inc.T: 416 855 0435
Email: steve@gogoldresources.comOr visit: www.gogoldresources.com
CAUTIONARY STATEMENT:The securities described herein have not been, and will not be, registered under the United States Securities Act of 1933, as amended (the "U.S. Securities Act"), or any state securities laws, and may not be offered or sold within the United States or to, or for the benefit of, U.S. persons (as defined in Regulation S under the U.S. Securities Act) except in compliance with the registration requirements of the U.S. Securities Act and applicable state securities laws or pursuant to exemptions therefrom. This release does not constitute an offer to sell or a solicitation of an offer to buy of any of GoGold's securities in the United States.
This news release may contain "forward-looking information" as defined in applicable Canadian securities legislation. All statements other than statements of historical fact, included in this release, including, without limitation, statements regarding the Parral tailings project, the Los Ricos project, future operating margins, future production and processing, and future plans and objectives of GoGold, constitute forward looking information that involve various risks and uncertainties. Forward-looking information is based on a number of factors and assumptions which have been used to develop such information but which may prove to be incorrect, including, but not limited to, assumptions in connection with the continuance of GoGold and its subsidiaries as a going concern, general economic and market conditions, mineral prices, the accuracy of mineral resource estimates, and the performance of the Parral project There can be no assurance that such information will prove to be accurate and actual results and future events could differ materially from those anticipated in such forward-looking information.
Important factors that could cause actual results to differ materially from GoGold's expectations include exploration and development risks associated with the GoGold's projects, the failure to establish estimated mineral resources or mineral reserves, volatility of commodity prices, variations of recovery rates, and global economic conditions. For additional information with respect to risk factors applicable to GoGold, reference should be made to GoGold's continuous disclosure materials filed from time to time with securities regulators, including, but not limited to, GoGold's Annual Information Form. The forward-looking information contained in this release is made as of the date of this release.
To view the source version of this press release, please visit https://www.newsfilecorp.com/release/247855
GoGold Resources Inc.
NOT FOR DISTRIBUTION TO U.S. NEWSWIRE SERVICES OR FOR RELEASE,PUBLICATION, DISTRIBUTION OR DISSEMINATION DIRECTLY, OR INDIRECTLY, INWHOLE OR IN PART, IN OR INTO THE UNITED STATES.
HALIFAX, Nova Scotia, March 19, 2025 (GLOBE NEWSWIRE) — GoGold Resources Inc. (TSX: GGD) (OTCQX: GLGDF) (“GoGold” or the “Company”) has announced today that it has entered into an agreement with a syndicate of underwriters led by BMO Capital Markets (collectively the “Underwriters”), under which the Underwriters have agreed to buy on bought deal basis 41,210,000 common shares (the “Common Shares”), at a price of C$1.82 per Common Share for gross proceeds of approximately C$75 million (the “Offering”). The Company has granted the Underwriters an option, exercisable at the offering price for a period of 30 days following the closing of the Offering, to purchase up to an additional 15% of the Offering to cover over-allotments, if any. The offering is expected to close on or about April 4, 2025 and is subject to GoGold receiving all necessary regulatory approvals.
The net proceeds of the offering will be used for the development of the Company’s Los Ricos South project, for exploration activities at both Los Ricos South and North projects, and for general corporate purposes.
The Common Shares will be offered by way of a short form prospectus in all of the provinces of Canada, other than Quebec, and may also be offered by way of private placement in the United States. The securities offered have not been registered under the U.S. Securities Act of 1933, as amended, and may not be offered or sold in the United States absent registration or an applicable exemption from the registration requirements. This press release shall not constitute an offer to sell or the solicitation of an offer to buy nor shall there be any sale of the securities in any jurisdiction in which such offer, solicitation or sale would be unlawful.
About GoGold ResourcesGoGold Resources (TSX: GGD) is a Canadian-based silver and gold producer focused on operating, developing, exploring and acquiring high quality projects in Mexico. The Company operates the Parral Tailings mine in the state of Chihuahua and has the Los Ricos South and Los Ricos North exploration and development projects in the state of Jalisco. Headquartered in Halifax, NS, GoGold is building a portfolio of low cost, high margin projects. For more information visit gogoldresources.com.For further information please contact:Steve Low, Corporate DevelopmentGoGold Resources Inc. T: 416 855 0435
Email : steve@gogoldresources.comOr visit : www.gogoldresources.com
CAUTIONARY STATEMENT CAUTIONARY STATEMENT: The securities described herein have not been, and will not be, registered under the United States Securities Act of 1933, as amended (the “U.S. Securities Act”), or any state securities laws, and may not be offered or sold within the United States or to, or for the benefit of, U.S. persons (as defined in Regulation S under the U.S. Securities Act) except in compliance with the registration requirements of the U.S. Securities Act and applicable state securities laws or pursuant to exemptions therefrom. This release does not constitute an offer to sell or a solicitation of an offer to buy of any of GoGold’s securities in the United States. This news release may contain "forward-looking information" as defined in applicable Canadian securities legislation. All statements other than statements of historical fact, included in this release, including, without limitation, statements regarding the Parral tailings project, the Los Ricos project, future operating margins, future production and processing, and future plans and objectives of GoGold, constitute forward looking information that involve various risks and uncertainties. Forward-looking information is based on a number of factors and assumptions which have been used to develop such information but which may prove to be incorrect, including, but not limited to, assumptions in connection with the continuance of GoGold and its subsidiaries as a going concern, general economic and market conditions, mineral prices, the accuracy of mineral resource estimates, and the performance of the Parral project There can be no assurance that such information will prove to be accurate and actual results and future events could differ materially from those anticipated in such forward-looking information. Important factors that could cause actual results to differ materially from GoGold's expectations include exploration and development risks associated with GoGold’s projects, the failure to establish estimated mineral resources or mineral reserves, volatility of commodity prices, variations of recovery rates, and global economic conditions. For additional information with respect to risk factors applicable to GoGold, reference should be made to GoGold's continuous disclosure materials filed from time to time with securities regulators, including, but not limited to, GoGold's Annual Information Form. The forward-looking information contained in this release is made as of the date of this release.
As we move through the early months of the year, Canadian markets are navigating a complex landscape marked by persistent inflation and solid corporate earnings. Amid these crosscurrents, investors are increasingly looking for opportunities that balance potential growth with financial stability. While penny stocks might seem like a term from another era, they continue to offer intriguing possibilities, particularly when these smaller or newer companies demonstrate strong fundamentals. In this article, we explore three such penny stocks on the TSX that could provide promising prospects for those seeking to uncover hidden value in today’s market conditions.
Top 10 Penny Stocks In Canada
|
Name |
Share Price |
Market Cap |
Financial Health Rating |
|
Alvopetro Energy (TSXV:ALV) |
CA$4.875 |
CA$176.94M |
★★★★★★ |
|
Findev (TSXV:FDI) |
CA$0.52 |
CA$14.9M |
★★★★★★ |
|
Mandalay Resources (TSX:MND) |
CA$4.75 |
CA$442.31M |
★★★★★★ |
|
PetroTal (TSX:TAL) |
CA$0.70 |
CA$638.07M |
★★★★★★ |
|
NamSys (TSXV:CTZ) |
CA$1.19 |
CA$30.36M |
★★★★★★ |
|
East West Petroleum (TSXV:EW) |
CA$0.04 |
CA$4.07M |
★★★★★★ |
|
Orezone Gold (TSX:ORE) |
CA$0.90 |
CA$416.12M |
★★★★★☆ |
|
New Gold (TSX:NGD) |
CA$4.28 |
CA$3.26B |
★★★★★☆ |
|
Foraco International (TSX:FAR) |
CA$2.03 |
CA$196.4M |
★★★★★☆ |
|
DIRTT Environmental Solutions (TSX:DRT) |
CA$1.15 |
CA$222.42M |
★★★★☆☆ |
Click here to see the full list of 933 stocks from our TSX Penny Stocks screener.
Let’s review some notable picks from our screened stocks.
Simply Wall St Financial Health Rating: ★★★★☆☆
Overview: Inflection Resources Ltd. is involved in the exploration and evaluation of mineral properties in New South Wales and Queensland, Australia, with a market cap of CA$24.27 million.
Operations: Inflection Resources Ltd. currently does not report any revenue segments.
Market Cap: CA$24.27M
Inflection Resources Ltd., with a market cap of CA$24.27 million, is pre-revenue and currently unprofitable, reporting a net loss of CA$2.9 million for the year ended September 30, 2024. Despite having no debt and short-term assets covering liabilities, it faces auditor concerns about its ability to continue as a going concern due to less than one year of cash runway. Recent drilling updates from projects in New South Wales indicate promising mineralization potential in collaboration with AngloGold Ashanti but highlight the company’s high share price volatility and financial instability challenges.
CNSX:AUCU Debt to Equity History and Analysis as at Feb 2025GoGold Resources
Simply Wall St Financial Health Rating: ★★★★★★
Overview: GoGold Resources Inc. is involved in the exploration, development, and production of silver, gold, and copper mainly in Mexico with a market cap of CA$526.25 million.
Operations: The company generates revenue from its Metals & Mining segment, specifically focusing on gold and other precious metals, amounting to $48.80 million.
Market Cap: CA$526.25M
GoGold Resources, with a market cap of CA$526.25 million, has transitioned to profitability over the past year in the metals and mining sector. The company reported first-quarter sales of US$19.1 million, up from US$6.8 million a year ago, though it posted a slight net loss of US$0.136 million for the quarter due to large one-off items impacting financial results. With no debt and strong short-term assets exceeding liabilities, GoGold’s recent feasibility study at its Los Ricos South Project suggests potential growth in underground mining operations, supported by experienced management and board appointments enhancing strategic direction.
TSX:GGD Debt to Equity History and Analysis as at Feb 2025Orogen Royalties
Simply Wall St Financial Health Rating: ★★★★★★
Overview: Orogen Royalties Inc. is a mineral exploration company active in Canada, the United States, Mexico, Argentina, and Kenya with a market cap of CA$308.52 million.
Operations: The company generates revenue primarily from its mineral exploration activities, amounting to CA$7.33 million.
Market Cap: CA$308.52M
Orogen Royalties, with a market cap of CA$308.52 million, has experienced financial fluctuations recently, reporting a net loss of CA$0.36 million for Q3 2024 compared to a profit the previous year. Despite this, the company benefits from its debt-free status and strong short-term assets exceeding liabilities. Recent developments include significant expansion at its Navidad gold-silver target in Mexico, where Orogen holds a cash-flowing 2% NSR royalty. The company’s management and board are seasoned with average tenures over three years, though profitability challenges persist amid large one-off losses impacting earnings stability.
-
Take a closer look at Orogen Royalties’ potential here in our financial health report.
-
Explore Orogen Royalties’ analyst forecasts in our growth report.
TSXV:OGN Financial Position Analysis as at Feb 2025Key Takeaways
-
Explore the 933 names from our TSX Penny Stocks screener here.
-
Shareholder in one or more of these companies? Ensure you’re never caught off-guard by adding your portfolio in Simply Wall St for timely alerts on significant stock developments.
-
Streamline your investment strategy with Simply Wall St’s app for free and benefit from extensive research on stocks across all corners of the world.
Contemplating Other Strategies?
-
Explore high-performing small cap companies that haven’t yet garnered significant analyst attention.
-
Jump on the AI train with fast growing tech companies forging a new era of innovation.
-
Find companies with promising cash flow potential yet trading below their fair value.
This article by Simply Wall St is general in nature. We provide commentary based on historical data and analyst forecasts only using an unbiased methodology and our articles are not intended to be financial advice. It does not constitute a recommendation to buy or sell any stock, and does not take account of your objectives, or your financial situation. We aim to bring you long-term focused analysis driven by fundamental data. Note that our analysis may not factor in the latest price-sensitive company announcements or qualitative material. Simply Wall St has no position in any stocks mentioned.
Companies discussed in this article include CNSX:AUCU TSX:GGD and TSXV:OGN.
Have feedback on this article? Concerned about the content? Get in touch with us directly. Alternatively, email editorial-team@simplywallst.com
GoGold Resources Inc.'s (TSE:GGD) robust earnings report didn't manage to move the market for its stock. Our analysis suggests that shareholders have noticed something concerning in the numbers.
View our latest analysis for GoGold Resources
TSX:GGD Earnings and Revenue History February 20th 2025How Do Unusual Items Influence Profit?
To properly understand GoGold Resources' profit results, we need to consider the US$2.7m gain attributed to unusual items. While we like to see profit increases, we tend to be a little more cautious when unusual items have made a big contribution. When we analysed the vast majority of listed companies worldwide, we found that significant unusual items are often not repeated. Which is hardly surprising, given the name. We can see that GoGold Resources' positive unusual items were quite significant relative to its profit in the year to December 2024. As a result, we can surmise that the unusual items are making its statutory profit significantly stronger than it would otherwise be.
That might leave you wondering what analysts are forecasting in terms of future profitability. Luckily, you can click here to see an interactive graph depicting future profitability, based on their estimates.
Our Take On GoGold Resources' Profit Performance
As we discussed above, we think the significant positive unusual item makes GoGold Resources' earnings a poor guide to its underlying profitability. For this reason, we think that GoGold Resources' statutory profits may be a bad guide to its underlying earnings power, and might give investors an overly positive impression of the company. On the bright side, the company showed enough improvement to book a profit this year, after losing money last year. The goal of this article has been to assess how well we can rely on the statutory earnings to reflect the company's potential, but there is plenty more to consider. So if you'd like to dive deeper into this stock, it's crucial to consider any risks it's facing. While conducting our analysis, we found that GoGold Resources has 1 warning sign and it would be unwise to ignore it.
This note has only looked at a single factor that sheds light on the nature of GoGold Resources' profit. But there is always more to discover if you are capable of focussing your mind on minutiae. For example, many people consider a high return on equity as an indication of favorable business economics, while others like to 'follow the money' and search out stocks that insiders are buying. So you may wish to see this free collection of companies boasting high return on equity, or this list of stocks with high insider ownership.
Have feedback on this article? Concerned about the content? Get in touch with us directly. Alternatively, email editorial-team (at) simplywallst.com.This article by Simply Wall St is general in nature. We provide commentary based on historical data and analyst forecasts only using an unbiased methodology and our articles are not intended to be financial advice. It does not constitute a recommendation to buy or sell any stock, and does not take account of your objectives, or your financial situation. We aim to bring you long-term focused analysis driven by fundamental data. Note that our analysis may not factor in the latest price-sensitive company announcements or qualitative material. Simply Wall St has no position in any stocks mentioned.
VANCOUVER, BC, Jan. 31, 2025 /CNW/ – (TSX: LUN) (Nasdaq Stockholm: LUMI) Lundin Mining Corporation ("Lundin Mining" or the "Company") reports the following updated share capital and voting rights, in accordance with the Swedish Financial Instruments Trading Act:
The number of issued and outstanding shares of the Company has increased by 93,674,455 to 867,777,426 common shares with voting rights as of January 31, 2025. The increase in the number of issued and outstanding shares from January 1, 2025 to date is the result of shares issued in connection with the Filo Corp. acquisition (see press release dated January 15, 2025 entitled "Lundin Mining Completes Joint Acquisition of Filo with BHP and 50% Sale of Josemaria to Form Vicuña Corp."), and the exercise of employee stock options or the vesting of employee share units, offset by any share buy backs completed under the normal course issuer bid.
About Lundin Mining
Lundin Mining is a diversified Canadian base metals mining company with operations or projects in Argentina, Brazil, Chile, and the United States of America, primarily producing copper, gold and nickel. In December 2024 the Company announced the sale of its European assets to Boliden. The transaction is expected to close in mid-2025 subject to customary conditions and regulatory approvals.
The information in this release is subject to the disclosure requirements of Lundin Mining under the Swedish Financial Instruments Trading Act. The information was submitted for publication, through the agency of the contact persons set out below on January 31, 2025 at 14:30 Pacific Time.
Lundin Mining Announces Updated Share Capital and Voting Rights (CNW Group/Lundin Mining Corporation)
SOURCE Lundin Mining Corporation
Cision
View original content to download multimedia: http://www.newswire.ca/en/releases/archive/January2025/31/c8898.html
TSX Venture Exchange (TSX-V): GRGFrankfurt Stock Exchange (FSE): G6AOTCQB Venture Market (OTCQB): GARWF
VANCOUVER, BC, Jan. 29, 2025 /PRNewswire/ – Golden Arrow Resources Corporation (TSXV: GRG) (FSE: G6A) (OTCQB: GARWF), ("Golden Arrow" or the "Company") is pleased to report results from the final two holes of the Phase 2 drill program at the San Pietro Copper-Gold-Iron-Cobalt Project in Chile ("San Pietro" or the "Project"). These two holes (SP-DDH-39 and SP-DDH-40) together with two of the previously reported holes from the program (SP-DDH-29 and SP-DDH-38) confirm a broad extension of the Rincones target up to 400 metres to the south (see Figure 1). Each of the four holes has now reported intervals of between 180 and 310 metres that average over 0.2% Cu and 0.03 g/t Au as well as significant cobalt and iron. This southern Rincones area is expected to have significant positive impact on the Mineral Resource Estimate ("MRE") that is currently underway. Furthermore, the area remains sparsely drilled and open for expansion, particularly towards the Colla target located approximately 600 metres further to the south-southeast.
Golden Arrow Resources Corporation logo (CNW Group/Golden Arrow Resources Corporation)
Results of the final two holes are highlighted by:
-
180m averaging 0.21% Cu, 0.07 g/t Au, 95 g/t Co and 12.9% Fe starting at 276.73m depth in hole SP-DDH-39, in an undrilled area 280m south of SP-DDH-38 and 220m along trend from SP-DDH-29
-
Pervasive mineralization from 75 m depth to nearly the end of the hole at 541 metres in SP-DDH-40, including 224 m averaging 0.20% Cu, 0.03 g/t Au, 63 g/t Co and 11.6% Fe starting at 317.05 metres
-
Geologic modelling indicates continuity of mineralization of this hole with SP-DDH-38 and earlier holes along section (see Figure 2).
-
Brian McEwen, VP Exploration and Development for Golden Arrow, commented, "Phase 2 drilling has definitely finished on a high note. We are going into our first resource estimate knowing that the infill program we designed has successfully confirmed what we had expected after our preliminary work: stronger mineralization and better continuity than many previous interpretations. We believe this will translate into an MRE that shows our investors and stakeholders that we have again discovered a substantial deposit with strong upside and value-creation potential. Phase 2 might be done but we can't wait to get back out into the field to keep drilling and building Rincones, potentially all the way to Colla, as well as continuing to make new discoveries at our many targets throughout the massive project area, including some exciting prospects that were newly identified in 2024."
The Phase 2 drill program was executed in 2024, including an additional 24 holes, or 8292 metres of drilling on the Rincones advanced exploration target and 2 holes with a total of 607 metres drilled at the early-stage Colla target. Mineralization at the project is hosted in magnetite-rich mantos that are highly magnetic, as well as structurally-related specularite breccias and veins. In late 2024 the Company completed a new detailed ground magnetic survey over the Rincones and Colla targets to further delineate the targets and prioritize areas for the next phase of drill testing. In addition, since 2023 company geologists have been engaged in detailed geologic mapping throughout the nearly 20,000 hectares of concessions, work which had not been undertaken by previous operators. The 2024 mapping and surface sampling program in the southern project area identified new prospective targets, including Noemi and Lolita N (Figure 1), and a ground magnetics survey covering 1500 hectares was completed late in the year. Data from the surveys is still being processed.
Table 1. Summary of New Intervals, Phase 2 Drilling[Cu Grade >0.20% or Co Grade >200 g/t or Au Grade >0.2 g/t or Fe Grade >30%]
|
Hole |
From (m) |
To (m) |
Interval (m) |
Cu (%) |
Au (g/t) |
Co (g/t) |
Fe (%) |
|
|
Rincones Target |
||||||||
|
SP-DDH-39 |
200.00 |
202.30 |
2.30 |
0.35 |
0.05 |
77 |
10.9 |
|
|
231.00 |
236.00 |
5.00 |
0.14 |
0.13 |
335 |
4.0 |
||
|
276.73 |
456.85 |
180.12 |
0.21 |
0.07 |
95 |
12.9 |
||
|
includes |
323.70 |
337.55 |
13.85 |
0.31 |
0.04 |
98 |
17.5 |
|
|
& |
371.00 |
456.85 |
85.85 |
0.28 |
0.11 |
106 |
13.8 |
|
|
includes |
451.72 |
456.85 |
5.13 |
0.90 |
0.52 |
431 |
15.2 |
|
|
SP-DDH-40 |
49.00 |
53.32 |
4.32 |
0.02 |
0.04 |
294 |
15.7 |
|
|
75.00 |
149.03 |
74.03 |
0.20 |
0.04 |
119 |
14.7 |
||
|
279.00 |
283.54 |
4.54 |
0.30 |
0.03 |
156 |
28.1 |
||
|
317.05 |
541.22 |
224.17 |
0.20 |
0.03 |
63 |
11.6 |
||
|
includes |
329.00 |
341.00 |
12.00 |
0.49 |
0.05 |
106 |
14.3 |
|
|
& |
381.87 |
386.67 |
4.80 |
2.15 |
0.30 |
167 |
33.8 |
|
|
& |
473.00 |
477.10 |
4.10 |
1.13 |
0.06 |
128 |
21.1 |
|
|
Note: Intervals are downhole length. See hole descriptions in text for additional details. |
||||||||
Drill Hole Details
The San Pietro Project hosts multiple targets with strong Iron oxide-Copper-Gold and Cobalt mineralization (see Figure 1). This mineralization is typically found within a pile of fine to porphyritic andesites that exhibit widespread potassic feldspar alteration. The mineralization is often associated with areas where a superimposed quartz-scapolite alteration is more intense and there is a development of brecciation with specularite and massive replacement of magnetite.
SP-DDH-39 was collared 220 metres to the northwest of, and drilled parallel to, SP-DDH-29 which intersected 310.85m averaging 0.19% Cu, 0.06 g/t Au, 127 g/t Co and 12.2% Fe starting at 186.4m depth, as reported on October 31, 2024. The new hole tested for mineralization along the general northwest structural trend from SP-DDH-29 corresponding to a set of subparallel specularite breccias trending from east-west to northwest. The first 322 metres of the hole were dominated by a porphyritic andesite, which is less permeable to the development of fracturing and the entry of mineralized solutions. From 322 metres to the end of hole at 509 metres, the SP-DDH-39 shows a package of fine porphyritic andesites. These host a series of veinlets and crackle breccias with chalcopyrite-pyrite and specularite including a higher-grade structure at 452 metres with a halo of disseminated magnetite. In addition, near the contact between the porphyritic and fine andesites at 276 to 322 metres depth several mineralized structures were developed.
SP-DDH-40 filled in the area between the main Rincones target area and the step-out hole SP-DDH-38 (155 metres southwest) which recently reported 283 metres averaging 0.23% Cu, 0.04 g/t Au, 101 g/t Co and 15.5% Fe from 83 metres depth (see January 21, 2025 news release). From 130 metres to the end of the hole at 548 metres, the fine porphyritic andesite hosts a series of zones with veinlets and crackle breccias filled with chalcopyrite-pyrite. Additionally in this hole there are a series of sub horizontal magnetite replacement mantos of 5 to 8 metres wide with >30% of total iron, and in some cases with high Cu-Au mineralization, as demonstrated in the 4.80 metres interval with 2.15% Cu, 0.3 g/t Au and 33.8% Fe starting at 381.87 metres deep. The cross-section in Figure 2 demonstrates the modeled units and continuity with SP-DDH-38, as well as neighbouring holes SP-DDH-11 and SP-DDH-05 (reported on July 12, 2023).
Table 2. Drill Hole Collar Information[PSAD 56 / UTM Zone 19 S]
|
Hole |
Easting |
Northing |
Elevation (m) |
Azimuth (˚) |
(˚) |
Final Depth (m) |
|
SP-DDH-39 |
390572 |
7071002 |
1003 |
20 |
-60 |
509 |
|
SP-DDH-40 |
390653 |
7071424 |
997 |
20 |
-60 |
548 |
Methodology & QA/QC
This drilling campaign was completed by Sociedad de Servicios Andinos SpA of Copiapó, Chile, using diamond drill producing HQ-sized core. The Golden Arrow field team, supervised by senior geologists, photographed and logged the entire length of core for each drillhole, as well as measured it for recovery and marked it for sampling. Pieces of whole core approximately 10 to 15 cm long were selected and measured for specific gravity on average every 20 metres and targeting all different lithologies. Subsequently, the core was cut in half with an electric saw. One half was labelled, bagged and sent for analysis and the other half retained onsite. After completing the sampling of each hole, the samples were shipped to ALS Laboratory in Copiapo, Chile by a contract truck service. Sample preparation and gold analysis by Fire Assay and reading by atomic absorption on 30 gm sample by method Au-AA23 was completed at the ALS facility in Santiago de Chile. Multi-element package by ICP-OES reading following a four-acid digestion by method ME-ICP61 was performed at ALS facilities in Lima, Peru. Samples with over limits in copper (+ 10,000 ppm) were re-assayed by ore grade method Cu-OG62 that includes four acid digestion and ICP-OES reading. The Company follows industry standard procedures for the work carried out on the San Pietro Project, with a quality assurance/quality control ("QA/QC") program. Blank and standard samples were inserted in each batch of samples sent to the laboratory for analysis. Golden Arrow detected no significant QA/QC issues with material effect on the data. The trajectory of all the holes drilled at San Pietro during this Phase 2 were measured using the gyroscope equipment "Champ Navigator" that assures no interference from the magnetite in the ground. Additionally, all the core was orientated using the "Champ Ori" core orientator to measure the azimuth and dip of structures.
About the San Pietro IOCG Project
The San Pietro Project covers approximately 20,000 hectares, 100 kilometres north of Copiapo. Situated between and adjacent to Capstone Copper's Manto Verde Mine property and Santo Domingo Project, San Pietro is in the centre of a potential new copper-iron-cobalt district within an active, well-developed mining region that is home to all the major iron oxide-copper-gold ("IOCG") deposits in Chile.
The Project is hosted by andesite units in a Cretaceous-aged volcano-sedimentary sequence associated with intrusive rocks including granodiorites and diorites of similar age. The Project is located east of the Atacama Fault system, a major north-south regional structure, which was instrumental in controlling the emplacement of the ore deposits in the area.
Mineralization at San Pietro is typical of an IOCG system, with the addition of cobalt, and occurs in mantos, breccias and veins within a zone of alteration characterized by an association of actinolite, epidote, chlorite and scapolite. The mantos are replacement of andesite by magnetite and sulphides, with a roughly southeast strike and a gentle dip to the SW. Breccias and veins crosscut the mantos, are often subvertical, and filled with specularite and sulphides.
Qualified Persons
The exploration programs are designed by the Company's geological staff and results are reviewed, verified (including sampling, analytical and test data) and compiled under the supervision of Brian McEwen, P.Geol., VP Exploration and Development to the Company. Mr. McEwen is a Qualified Person as defined in National Instrument 43-101 and has reviewed and approved the contents of the news release.
About Golden Arrow:
Golden Arrow Resources Corporation is a mining exploration company with a successful track record of creating value by making precious and base metal discoveries and advancing them into exceptional deposits.
Golden Arrow is actively exploring its flagship property, the advanced San Pietro iron oxide-copper-gold-cobalt project in Chile, and a portfolio that includes nearly 125,000 hectares of prospective properties in Argentina.
The Company is a member of the Grosso Group, a resource management group that has pioneered exploration in Argentina since 1993.
ON BEHALF OF THE BOARD
"Joseph Grosso"
_______________________________
Mr. Joseph Grosso, Executive Chairman, President and CEO
Neither the TSXV nor its Regulation Services Provider (as that term is defined in policies of the TSXV) accepts responsibility for the adequacy or accuracy of this release.
This news release contains forward-looking statements. Generally, forward-looking statements can be identified by the use of terminology such as "anticipate", "will", "expect", "may", "continue", "could", "estimate", "forecast", "plan", "potential" and similar expressions. Forward-looking statements address future events and conditions and therefore involve inherent risks and uncertainties. All statements, other than statements of historical fact, that address activities, events or developments management of the Company believes, expects or anticipates will or may occur in the future, including, without limitation, statements about the Company's plans for its mineral properties; the Company's business strategy, plans and outlooks; the future financial or operating performance of the Company; and future exploration and operating plans are forward-looking statements.
Forward-looking statements are subject to a number of risks and uncertainties that may cause the actual results of the Company to differ materially from those discussed in the forward-looking statements and, even if such actual results are realized or substantially realized, there can be no assurance that they will have the expected consequences to, or effects on, the Company. Accordingly, readers should not place undue reliance on the forward-looking statements. Factors that could cause actual results or events to differ materially from current expectations include, among other things: risks and uncertainties related to the ability to obtain, amend, or maintain licenses, permits, or surface rights; risks associated with technical difficulties in connection with exploration activities; the possibility that future exploration. There may be other factors that cause results or events to not be as anticipated. Actual results may differ materially from those currently anticipated in such statements. Readers are encouraged to refer to the Company's Management's Discussion and Analysis for a more detailed discussion of factors that may impact expected future results. The forward-looking statements contained in this press release are made as of the date hereof or the dates specifically referenced in this press release, where applicable. The Company undertakes no obligation to publicly update or revise any forward-looking statements, unless required pursuant to applicable laws. All forward-looking statements contained in this press release are expressly qualified by this cautionary statement.
We advise U.S. investors that the SEC's mining guidelines strictly prohibit information of this type in documents filed with the SEC. U.S. investors are cautioned that mineral deposits on adjacent properties are not indicative of mineral deposits on our properties.
Cision
View original content to download multimedia:https://www.prnewswire.com/news-releases/golden-arrow-reports-a-strong-finish-to-phase-2-drilling-including-224m–0-2-copper-at-san-pietro-project-chile-302362816.html
SOURCE Golden Arrow Resources Corporation
As the Canadian market navigates a landscape of fluctuating bond yields and evolving interest rate expectations, investors are keenly observing how these factors might influence stock valuations. Penny stocks, though often considered a niche investment category, continue to offer intriguing opportunities for growth, particularly within smaller or newer companies. By focusing on those with strong financial health and potential for long-term growth, investors can uncover promising prospects in this often overlooked segment of the market.
Top 10 Penny Stocks In Canada
|
Name |
Share Price |
Market Cap |
Financial Health Rating |
|
Silvercorp Metals (TSX:SVM) |
CA$4.53 |
CA$976.85M |
★★★★★★ |
|
Mandalay Resources (TSX:MND) |
CA$4.14 |
CA$401.93M |
★★★★★★ |
|
Pulse Seismic (TSX:PSD) |
CA$2.43 |
CA$122.01M |
★★★★★★ |
|
Findev (TSXV:FDI) |
CA$0.50 |
CA$14.32M |
★★★★★★ |
|
PetroTal (TSX:TAL) |
CA$0.73 |
CA$651.02M |
★★★★★★ |
|
Foraco International (TSX:FAR) |
CA$2.33 |
CA$222.46M |
★★★★★☆ |
|
NamSys (TSXV:CTZ) |
CA$1.11 |
CA$32.24M |
★★★★★★ |
|
East West Petroleum (TSXV:EW) |
CA$0.035 |
CA$3.62M |
★★★★★★ |
|
Hemisphere Energy (TSXV:HME) |
CA$1.85 |
CA$179.61M |
★★★★★☆ |
|
Tornado Infrastructure Equipment (TSXV:TGH) |
CA$1.00 |
CA$137.56M |
★★★★★☆ |
Click here to see the full list of 936 stocks from our TSX Penny Stocks screener.
Let’s review some notable picks from our screened stocks.
Simply Wall St Financial Health Rating: ★★★★★★
Overview: GoGold Resources Inc. focuses on the exploration, development, and production of silver, gold, and copper primarily in Mexico with a market cap of CA$467.93 million.
Operations: The company generates revenue from its Metals & Mining segment, specifically in Gold & Other Precious Metals, amounting to $36.50 million.
Market Cap: CA$467.93M
GoGold Resources has shown a significant turnaround, becoming profitable with net income of US$1.58 million for the year ended September 2024, up from a loss the previous year. The company reported sales of US$36.5 million and maintains a strong balance sheet with short-term assets exceeding both short- and long-term liabilities. A recent feasibility study for its Los Ricos South Project suggests potential operational advancements, enhancing its mining capabilities in Mexico. Despite low return on equity at 0.6% and earnings impacted by one-off gains, GoGold remains debt-free with experienced management steering growth prospects forward.
TSX:GGD Debt to Equity History and Analysis as at Jan 2025McCoy Global
Simply Wall St Financial Health Rating: ★★★★★★
Overview: McCoy Global Inc. provides equipment and technologies for tubular running operations to enhance wellbore integrity and data collection in the energy industry, with a market cap of CA$73.39 million.
Operations: The Energy Products & Services segment generated CA$71.99 million in revenue.
Market Cap: CA$73.39M
McCoy Global Inc. operates without debt, enhancing its financial stability in the penny stock space. Despite a decline in quarterly sales to CA$15.84 million and net income to CA$0.516 million, the company remains profitable with high-quality earnings and a stable balance sheet, as short-term assets cover both short- and long-term liabilities. The management team’s experience supports operational consistency, although recent profit margins have decreased from 16.3% to 10.1%. McCoy trades below estimated fair value and has forecasted revenue growth of 9.03% annually, but its dividend sustainability remains questionable given limited free cash flow coverage.
-
Click to explore a detailed breakdown of our findings in McCoy Global’s financial health report.
-
Explore McCoy Global’s analyst forecasts in our growth report.
TSX:MCB Debt to Equity History and Analysis as at Jan 2025Tree Island Steel
Simply Wall St Financial Health Rating: ★★★★★★
Overview: Tree Island Steel Ltd. manufactures and sells steel wire and fabricated steel wire products in Canada, the United States, and internationally, with a market cap of CA$77.79 million.
Operations: The company’s revenue is primarily derived from its Steel Wire Products Industry segment, which generated CA$208.93 million.
Market Cap: CA$77.79M
Tree Island Steel Ltd. operates in the steel wire products industry with a market cap of CA$77.79 million, facing challenges due to its current unprofitability and negative return on equity of -2.07%. Despite this, the company maintains financial stability with no debt and short-term assets exceeding both short- and long-term liabilities. Recent strategic moves include a share repurchase program and consistent dividend payouts, although dividends are not well-covered by earnings or free cash flow. The board’s average tenure of 15.6 years suggests seasoned oversight amidst ongoing efforts to reduce losses over time by 10.3% annually over the past five years.
TSX:TSL Financial Position Analysis as at Jan 2025Summing It All Up
-
Navigate through the entire inventory of 936 TSX Penny Stocks here.
-
Already own these companies? Link your portfolio to Simply Wall St and get alerts on any new warning signs to your stocks.
-
Simply Wall St is a revolutionary app designed for long-term stock investors, it’s free and covers every market in the world.
Want To Explore Some Alternatives?
-
Explore high-performing small cap companies that haven’t yet garnered significant analyst attention.
-
Jump on the AI train with fast growing tech companies forging a new era of innovation.
-
Find companies with promising cash flow potential yet trading below their fair value.
This article by Simply Wall St is general in nature. We provide commentary based on historical data and analyst forecasts only using an unbiased methodology and our articles are not intended to be financial advice. It does not constitute a recommendation to buy or sell any stock, and does not take account of your objectives, or your financial situation. We aim to bring you long-term focused analysis driven by fundamental data. Note that our analysis may not factor in the latest price-sensitive company announcements or qualitative material. Simply Wall St has no position in any stocks mentioned.
Companies discussed in this article include TSX:GGD TSX:MCB and TSX:TSL.
Have feedback on this article? Concerned about the content? Get in touch with us directly. Alternatively, email editorial-team@simplywallst.com
TSX Venture Exchange (TSX-V): GRGFrankfurt Stock Exchange (FSE): G6AOTCQB Venture Market (OTCQB): GARWF
VANCOUVER, BC, Jan. 21, 2025 /PRNewswire/ – Golden Arrow Resources Corporation (TSXV: GRG) (FSE: G6A) (OTCQB: GARWF), ("Golden Arrow" or the "Company") is pleased to report the latest results from the San Pietro Project in Chile, where drilling of the southern extension of the Rincones target returned the best copper interval to date: 283 metres averaging 0.23% Cu, 0.04 g/t Au, 101 g/t Co and 15.5% Fe from 83 metres depth in SP-DDH-38. This includes two intervals with notably higher grades of copper (75 metres averaging 0.33% Cu and 11.55 metres averaging 0.51% Cu) and a 9.35 metre interval averaging 0.74% Cu, 0.43 g/t Au, 254 g/t Co and 38.6% Fe.
Golden Arrow Resources Corporation logo (CNW Group/Golden Arrow Resources Corporation)
SP-DDH-29 was the first hole to test for a southern extension of the Rincones target. It stepped out nearly 400 metres from previously drill-defined mineralization and intersected 310.85 m averaging 0.19% Cu, 0.06 g/t Au, 127 g/t Co and 12.2% Fe starting at 186.4m depth, as reported on October 31, 2024. Excited by these results and the potential to continue to expand Rincones to the south towards the Colla target, the team designated the final three holes of the Phase 2 drill program to further test the area and provide data that could potentially be included in the upcoming Mineral Resource Estimate ("MRE"). As seen in Figure 1, this new hole SP-DDH-38 was collared approximately 250 metres south of the main Rincones target area, in the untested area centered 420 metres northwest of SP-DDH-29. New drill hole SP-DDH-39 was drilled another 250 metres south from SP-DDH-38, and along the NW-SE trend of mineralization intersected in hole 29. SP-DDH-40 was drilled to infill between SP-DDH-38 and the main Rincones mineralization (Figure 2). Final assays for holes -39 and -40 are the last results pending from the program.
Brian McEwen, VP Exploration and Development for Golden Arrow, commented, "Hole 38 is helping define the so far sparsely-tested and yet significant southern extension that adds to the central area of thick continuous mineralization at Rincones. Phase 2 has now drilled nine holes with intervals of more than 100 metres of significant copper, including the two that are over 280 metres, and four that grade over 0.4% copper, and we still have two high-potential holes left to report. The Company remains on-track to complete our first MRE for the project in the coming weeks and I strongly believe it will just be scratching the surface of what this project has to offer."
Two additional holes reported here returned intervals with over 100 metres of mineralization. SP-DDH-37 was an infill hole in the centre of Rincones, and returned 130 metres averaging 0.23% Cu, 0.05 g/t Au, 69g/t Co and 13.4% Fe from 250 m depth, including 15.30 metres averaging 0.96% Cu, 0.31 g/t Au, 179 g/t Co and 28.5% Fe. Mineralization at the western side of the target was also expanded, where hole SP-DDH-35 stepped out 135 metres and intercepted 102 metres averaging 0.25% Cu, 0.04 g/t Au, 185 g/t Co and 14.7% Fe from 186 metres depth in hole SP-DDH-35, including 10.30 metres averaging 0.51% Cu, 0.05 g/t Au,137 g/t Co and 13.4% Fe.
The new holes reported in Table 1 are part of the now-complete Phase 2 diamond drilling campaign at the San Pietro Iron Oxide-Copper-Gold-Cobalt ("IOCG") Project in Chile ("San Pietro" or the "Project") announced on April 24, 2024. Final assays from the last two holes are pending.
Table 1. Summary of New Intervals, Phase 2 Drilling[Cu Grade >0.20% or Co Grade >200 g/t or Au Grade >0.2 g/t or Fe Grade >30%]
|
Hole |
From (m) |
To (m) |
Interval(m) |
Cu (%) |
Au (g/t) |
Co (g/t) |
Fe (%) |
|
|
Rincones Target |
||||||||
|
138.00 |
141.85 |
3.85 |
0.38 |
0.22 |
154 |
11.6 |
||
|
186.00 |
288.00 |
102.00 |
0.25 |
0.04 |
185 |
14.7 |
||
|
SP-DDH-35 |
includes |
230.00 |
240.30 |
10.30 |
0.51 |
0.05 |
137 |
13.4 |
|
317.83 |
336.65 |
18.82 |
0.06 |
0.03 |
202 |
13.6 |
||
|
SP-DDH-36 |
6.00 |
12.00 |
6.00 |
0.17 |
0.06 |
221 |
23.3 |
|
|
54.00 |
74.00 |
20.00 |
0.20 |
0.02 |
57 |
8.3 |
||
|
128.00 |
134.00 |
6.00 |
0.45 |
0.07 |
602 |
23.5 |
||
|
SP-DDH-37 |
23.00 |
57.00 |
34.00 |
0.55 |
0.24 |
163 |
51.0 |
|
|
127.00 |
139.00 |
12.00 |
0.23 |
0.02 |
40 |
11.5 |
||
|
146.50 |
150.00 |
3.50 |
0.25 |
0.03 |
33 |
15.4 |
||
|
250.00 |
380.00 |
130.00 |
0.23 |
0.05 |
69 |
13.4 |
||
|
includes |
250.00 |
265.30 |
15.30 |
0.96 |
0.31 |
179 |
28.5 |
|
|
SP-DDH-38 |
83.00 |
366.00 |
283.00 |
0.23 |
0.04 |
101 |
15.5 |
|
|
includes |
110.65 |
120.00 |
9.35 |
0.74 |
0.43 |
254 |
38.6 |
|
|
& includes |
138.00 |
149.55 |
11.55 |
0.51 |
0.05 |
80 |
12.5 |
|
|
& includes |
280.00 |
355.00 |
75.00 |
0.33 |
0.05 |
183 |
21.5 |
|
|
Note: Intervals are downhole length. See hole descriptions in text for additional details. |
||||||||
San Pietro Phase 2 Drill Program Details
The San Pietro Project hosts multiple targets with strong Iron oxide-Copper-Gold and Cobalt mineralization (see Figure 1). This mineralization is typically found within a pile of fine to porphyritic andesites that exhibit widespread potassic feldspar alteration. The mineralization is often associated with areas where a superimposed quartz-scapolite alteration is more intense and there is a development of brecciation and massive replacement of magnetite.
In 2023, the Company completed a Phase 1 drill program of approximately 4000 metres of diamond drilling in 13 holes to add to the database of ~34,000 metres of historic drilling at San Pietro. Strongly mineralized intervals were intercepted at all targets tested as reported in company news releases on June 13, June 27 and July 12, 2023.
The Company focused this Phase 2 drill program mainly on the Rincones advanced exploration target with the goal of completing an initial Mineral Resource Estimate. In addition, 2 holes (SP-DDH-25 and SP-DDH-34) with a total of 607 metres were drilled at the nearby Colla target.
SP-DDH-35 stepped out 135 metres west of historic reverse circulation ("RC") hole RARC-015, which included a 142-metre interval averaging 0.32% Cu, 92 g/t Co, 0.05 g/t Au and 10.5% Fe starting at 54 metres downhole (azimuth 0˚ & dip -65˚). A similar long, well-mineralized interval in SP-DDH-35 (see Table 1) was hosted in a series of subvertical crackle breccias and veinlets plus several 1-to-3-metre-wide, east-west trending subvertical breccias filled with specularite-chalcopyrite-pyrite. These structures were also intercepted in the holes east and west of SP-DDH-35.
SP-DDH-36 was drilled in the north-central part of Rincones where it intercepted east-west trending crackle breccias with specularite-chalcopyrite-pyrite, dipping 70° to 89° the north. Mineralization was modest, similar to an adjacent historic RC hole.
SP-DDH-37 tested a gap in the central part of Rincones approximately 145 metres southeast of SP-DDH-12, which returned the best overall interval of the Phase 1 program: 64.2 m averaging 0.86% Cu, 0.20 g/t Au, 196 g/t Co and 25.9% Fe starting at 42.8 metres depth (see News Release from July 12, 2023). A second interval of 75.0 metres averaging 0.23% Cu, 0.03 g/t Au and 67 g/t Co starting at 243 metres depth was also reported. SP-DDH-37 successfully identified similar mineralized zones in the gap tested. Immediately below 23 metres of gravels, SP-DDH-37 started with a series of magnetite replacement mantos striking northwest and dipping 66° to the southwest. These hosted copper and iron oxides in veinlets in a fine porphyritic andesite, with a 34 metre interval averaging 0.55% Cu, 0.24 g/t Au, 163 g/t Co and 51% Fe. These mantos correlate with those intercepted in hole SP-DDH-12. Starting at 250 metres depth, SP-DDH-37 intercepted another series of magnetite mantos, 3 to 5 metres wide, with veinlets and disseminations of chalcopyrite and pyrite plus zones of breccias filled with specularite and chalcopyrite. This lower zone returned a long (130 metres) well-mineralized interval, including over 15 metres with nearly a percent copper and 0.3 g/t Au as well as significant cobalt and iron (see Table 1).
SP-DDH-38 expanded the southern extension of the Rincones mineralization, as first identified in hole SP-DDH-29 that returned 310.85 metres averaging 0.19% Cu, 0.06 g/t Au, 127 g/t Co and 12.2% Fe starting at 186.4 metres depth (see News Release dated October 31, 2024). Mineralization was pervasive throughout nearly 300 metres of downhole depth, (see Table 1) hosted in porphyritic andesites with crackle breccias. In the first half of the 283-metre reported interval, the crackle breccias are filled with magnetite-chalcopyrite-pyrite and in the second half with specularite-chalcopyrite-pyrite. Additionally, 3 magnetite mantos were intercepted downhole. These were approximately 10 metres in width with east-west strike, dipping to the south and hosted disseminated and fracture-controlled chalcopyrite-pyrite mineralization.
Table 2. Drill Hole Collar Information[PSAD 56 / UTM Zone 19 S]
|
Hole |
Easting |
Northing |
Elevation (m) |
Azimuth (˚) |
Dip (˚) |
Final Depth (m) |
|
SP-DDH-35 |
390561 |
7071720 |
1003 |
20 |
-60 |
368 |
|
SP-DDH-36 |
391283 |
7071902 |
940 |
0 |
-60 |
200 |
|
SP-DDH-37 |
391036 |
7071653 |
952 |
20 |
-60 |
389 |
|
SP-DDH-38 |
390598 |
7071282 |
1000 |
20 |
-60 |
374 |
Methodology & QA/QC
This drilling campaign was completed by Sociedad de Servicios Andinos SpA of Copiapó, Chile, using diamond drill producing HQ-sized core. The Golden Arrow field team, supervised by senior geologists, photographed and logged the entire length of core for each drillhole, as well as measured it for recovery and marked it for sampling. Pieces of whole core approximately 10 to 15 cm long were selected and measured for specific gravity on average every 20 metres and targeting all different lithologies. Subsequently, the core was cut in half with an electric saw. One half was labelled, bagged and sent for analysis and the other half retained onsite. After completing the sampling of each hole, the samples were shipped to ALS Laboratory in Copiapo, Chile by a contract truck service. Sample preparation and gold analysis by Fire Assay and reading by atomic absorption on 30 gm sample by method Au-AA23 was completed at the ALS facility in Santiago de Chile. Multi-element package by ICP-OES reading following a four-acid digestion by method ME-ICP61 was performed at ALS facilities in Lima, Peru. Samples with over limits in copper (+ 10,000 ppm) were re-assayed by ore grade method Cu-OG62 that includes four acid digestion and ICP-OES reading. The Company follows industry standard procedures for the work carried out on the San Pietro Project, with a quality assurance/quality control ("QA/QC") program. Blank and standard samples were inserted in each batch of samples sent to the laboratory for analysis. Golden Arrow detected no significant QA/QC issues with material effect on the data. The trajectory of all the holes drilled at San Pietro during this Phase 2 were measured using the gyroscope equipment "Champ Navigator" that assures no interference from the magnetite in the ground. Additionally, all the core was orientated using the "Champ Ori" core orientator to measure the azimuth and dip of structures.
About the San Pietro IOCG Project
The San Pietro Project covers approximately 20,000 hectares, 100 kilometres north of Copiapo. Situated between and adjacent to Capstone Copper's Manto Verde Mine property and Santo Domingo Project, San Pietro is in the centre of a potential new copper-iron-cobalt district within an active, well-developed mining region that is home to all the major iron oxide-copper-gold ("IOCG") deposits in Chile.
The Project is hosted by andesite units in a Cretaceous-aged volcano-sedimentary sequence associated with intrusive rocks including granodiorites and diorites of similar age. The Project is located east of the Atacama Fault system, a major north-south regional structure, which was instrumental in controlling the emplacement of the ore deposits in the area.
Mineralization at San Pietro is typical of an IOCG system, with the addition of cobalt, and occurs in mantos, breccias and veins within a zone of alteration characterized by an association of actinolite, epidote, chlorite and scapolite. The mantos are replacement of andesite by magnetite and sulphides, with a roughly southeast strike and a gentle dip to the SW. Breccias and veins crosscut the mantos, are often subvertical, and filled with specularite and sulphides.
Qualified Persons
The exploration programs are designed by the Company's geological staff and results are reviewed, verified (including sampling, analytical and test data) and compiled under the supervision of Brian McEwen, P.Geol., VP Exploration and Development to the Company. Mr. McEwen is a Qualified Person as defined in National Instrument 43-101 and has reviewed and approved the contents of the news release.
About Golden Arrow:
Golden Arrow Resources Corporation is a mining exploration company with a successful track record of creating value by making precious and base metal discoveries and advancing them into exceptional deposits.
Golden Arrow is actively exploring its flagship property, the advanced San Pietro iron oxide-copper-gold-cobalt project in Chile, and a portfolio that includes nearly 125,000 hectares of prospective properties in Argentina.
The Company is a member of the Grosso Group, a resource management group that has pioneered exploration in Argentina since 1993.
ON BEHALF OF THE BOARD
"Joseph Grosso"
_______________________________Mr. Joseph Grosso, Executive Chairman, President and CEO
Neither the TSXV nor its Regulation Services Provider (as that term is defined in policies of the TSXV) accepts responsibility for the adequacy or accuracy of this release.
This news release contains forward-looking statements. Generally, forward-looking statements can be identified by the use of terminology such as "anticipate", "will", "expect", "may", "continue", "could", "estimate", "forecast", "plan", "potential" and similar expressions. Forward-looking statements address future events and conditions and therefore involve inherent risks and uncertainties. All statements, other than statements of historical fact, that address activities, events or developments management of the Company believes, expects or anticipates will or may occur in the future, including, without limitation, statements about the Company's plans for its mineral properties; the Company's business strategy, plans and outlooks; the future financial or operating performance of the Company; and future exploration and operating plans are forward-looking statements.
Forward-looking statements are subject to a number of risks and uncertainties that may cause the actual results of the Company to differ materially from those discussed in the forward-looking statements and, even if such actual results are realized or substantially realized, there can be no assurance that they will have the expected consequences to, or effects on, the Company. Accordingly, readers should not place undue reliance on the forward-looking statements. Factors that could cause actual results or events to differ materially from current expectations include, among other things: risks and uncertainties related to the ability to obtain, amend, or maintain licenses, permits, or surface rights; risks associated with technical difficulties in connection with exploration activities; the possibility that future exploration. There may be other factors that cause results or events to not be as anticipated. Actual results may differ materially from those currently anticipated in such statements. Readers are encouraged to refer to the Company's Management's Discussion and Analysis for a more detailed discussion of factors that may impact expected future results. The forward-looking statements contained in this press release are made as of the date hereof or the dates specifically referenced in this press release, where applicable. The Company undertakes no obligation to publicly update or revise any forward-looking statements, unless required pursuant to applicable laws. All forward-looking statements contained in this press release are expressly qualified by this cautionary statement.
We advise U.S. investors that the SEC's mining guidelines strictly prohibit information of this type in documents filed with the SEC. U.S. investors are cautioned that mineral deposits on adjacent properties are not indicative of mineral deposits on our properties.
Cision
View original content to download multimedia:https://www.prnewswire.com/news-releases/golden-arrow-drills-283-metres-averaging-0-23-copper-and-expands-southern-rincones-target-area-at-san-pietro-project-chile-302355829.html
SOURCE Golden Arrow Resources Corporation
There are a few key trends to look for if we want to identify the next multi-bagger. Ideally, a business will show two trends; firstly a growing return on capital employed (ROCE) and secondly, an increasing amount of capital employed. Put simply, these types of businesses are compounding machines, meaning they are continually reinvesting their earnings at ever-higher rates of return. So on that note, GoGold Resources (TSE:GGD) looks quite promising in regards to its trends of return on capital.
Understanding Return On Capital Employed (ROCE)
For those who don't know, ROCE is a measure of a company's yearly pre-tax profit (its return), relative to the capital employed in the business. The formula for this calculation on GoGold Resources is:
Return on Capital Employed = Earnings Before Interest and Tax (EBIT) ÷ (Total Assets – Current Liabilities)
0.011 = US$3.2m ÷ (US$312m – US$15m) (Based on the trailing twelve months to September 2024).
So, GoGold Resources has an ROCE of 1.1%. Even though it's in line with the industry average of 1.4%, it's still a low return by itself.
Check out our latest analysis for GoGold Resources
TSX:GGD Return on Capital Employed January 20th 2025
In the above chart we have measured GoGold Resources' prior ROCE against its prior performance, but the future is arguably more important. If you'd like to see what analysts are forecasting going forward, you should check out our free analyst report for GoGold Resources .
What Does the ROCE Trend For GoGold Resources Tell Us?
The fact that GoGold Resources is now generating some pre-tax profits from its prior investments is very encouraging. Shareholders would no doubt be pleased with this because the business was loss-making five years ago but is is now generating 1.1% on its capital. In addition to that, GoGold Resources is employing 288% more capital than previously which is expected of a company that's trying to break into profitability. This can tell us that the company has plenty of reinvestment opportunities that are able to generate higher returns.
In Conclusion…
To the delight of most shareholders, GoGold Resources has now broken into profitability. Since the stock has returned a solid 70% to shareholders over the last five years, it's fair to say investors are beginning to recognize these changes. Therefore, we think it would be worth your time to check if these trends are going to continue.
GoGold Resources does have some risks though, and we've spotted 1 warning sign for GoGold Resources that you might be interested in.
While GoGold Resources may not currently earn the highest returns, we've compiled a list of companies that currently earn more than 25% return on equity. Check out this free list here.
Have feedback on this article? Concerned about the content? Get in touch with us directly. Alternatively, email editorial-team (at) simplywallst.com.This article by Simply Wall St is general in nature. We provide commentary based on historical data and analyst forecasts only using an unbiased methodology and our articles are not intended to be financial advice. It does not constitute a recommendation to buy or sell any stock, and does not take account of your objectives, or your financial situation. We aim to bring you long-term focused analysis driven by fundamental data. Note that our analysis may not factor in the latest price-sensitive company announcements or qualitative material. Simply Wall St has no position in any stocks mentioned.
Has closed the non-brokered private placement offering as announced on November 12, 2024 and increased on December 2, 2024, through the issuance of 5,000,000 units at a subscription price of $0.05 per unit in this 3rd and final tranche for aggregate gross proceeds to the Company of $250,000. In total, the Company has closed on 15,650,000 Units for aggregate gross proceeds of $782,500. Golden Arrow Resources Corporation shares V.GRG are trading down $0.01 at $0.05.
Read:
-
The Immunotherapy Boom: What It Means for the Future of Cancer Treatment
-
Cash-Flowing Colombian Oil Producer has Plans for 2025 Growth
-
From Crisis to Opportunity: How Advances in Immunotherapy Are Shaping the Oncology Sector
-
New Vaccine Technologies Lead the Charge as Global Immunization Efforts Evolve
-
The Race for Quantum Security: How Governments and Tech Giants Are Preparing for the Threat
/NOT FOR DISTRIBUTION TO THE UNITED STATES/
TSX Venture Exchange (TSX-V): GRGFrankfurt Stock Exchange (FSE): G6AOTCQB Venture Market (OTCQB): GARWF
www.goldenarrowresources.com • info@goldenarrowresources.com
VANCOUVER, BC, Dec. 24, 2024 /CNW/ – Golden Arrow Resources Corporation (TSXV: GRG) (FSE: G6A) (OTCQB: GARWF), ("Golden Arrow" or the "Company") is pleased to announce it has closed the non-brokered private placement offering (the "Offering") as announced on November 12, 2024 and increased on December 2, 2024, through the issuance of 5,000,000 units at a subscription price of $0.05 per unit (a "Unit" or "Units") in this 3rd and final tranche (the "Final Tranche") for aggregate gross proceeds to the Company of $250,000. In total, the Company has closed on 15,650,000 Units for aggregate gross proceeds of $782,500.
Golden Arrow Resources Corporation logo (CNW Group/Golden Arrow Resources Corporation)
Each Unit consists of one common share and one warrant (a "Warrant"). Each Warrant will entitle the holder thereof to purchase one additional common share in the capital of the Company at $0.08 per share for three years from the date of issue, expiring on December 24, 2027 for this Final Tranche.
In total, finder's fees of $22,750 are payable in cash on a portion of the private placement to parties at arm's length to the Company. In addition, 455,000 non-transferable finder's warrants are issuable (the "Finder's Warrants"). Each Finder's Warrant entitles a finder to purchase one common share at a price of $0.05 per share for three years from the date of issue, expiring on December 24, 2027 for this Final Tranche.
No insiders participated in this Final Tranche.
The Company's flagship San Pietro IOCG Project in Chile is funded to support a resource delineation program through the recently announced option agreement (see News Release dated January 12, 2024). The proceeds of this Offering will provide funds for general working capital.
This Offering is subject to regulatory approval and all securities to be issued pursuant to the Offering are subject to a four-month hold period under applicable Canadian securities laws expiring on April 24, 2025 for this Final Tranche.
About Golden Arrow:
Golden Arrow Resources Corporation is a mining exploration company with a successful track record of creating value by making precious and base metal discoveries and advancing them into exceptional deposits.
Golden Arrow is actively exploring its flagship property, the advanced San Pietro iron oxide-copper-gold-cobalt project in Chile, and a portfolio that includes nearly 125,000 hectares of prospective properties in Argentina.
The 100%-held San Pietro Project covers nearly 18,500 hectares, approximately 100 kilometres north of Copiapo in the centre of a potential new copper-cobalt region within an active mining district that is home to all the major iron oxide-copper-gold ("IOCG") deposits in Chile. San Pietro hosts multiple targets with strong IOCG+cobalt mineralization, and the Company is working to delineate its first mineral resource for the project in 2025.
The Company is a member of the Grosso Group, a resource management group that has pioneered exploration in Argentina since 1993.
ON BEHALF OF THE BOARD
"Joseph Grosso"
_______________________________Mr. Joseph Grosso, Executive Chairman, President and CEO
Neither TSX Venture Exchange nor its Regulation Services Provider (as that term is defined in policies of the TSX Venture Exchange) accepts responsibility for the adequacy or accuracy of this release.
The securities being offered have not been, nor will they be registered under the United States Securities Act of 1933, as amended, or state securities laws and may not be offered or sold within the United States or to, or for the account or benefit of, U.S. persons absent U.S. federal and state registration or an applicable exemption from the U.S. registration requirements. This release does not constitute an offer for sale of securities in the United States.
SOURCE Golden Arrow Resources Corporation
Cision
View original content to download multimedia: http://www.newswire.ca/en/releases/archive/December2024/24/c3960.html
If you would like to receive our free newsletter via email, simply enter your email address below & click subscribe.
 Follow us on Twitter
 Become our facebook fan
CONNECT WITH US
Tweets
Tweet with hash tag #miningfeeds or @miningfeeds and your tweets will be displayed across this site.
MOST ACTIVE MINING STOCKS
Daily Gainers
 Midlands Minerals Corp. Midlands Minerals Corp. |
MEX.V | +66.88% |
| GoviEx Uranium Inc. |
GXU.V | +42.86% |
 Mount Burgess Mining NL Mount Burgess Mining NL |
MTB.AX | +33.33% |
| Sunridge Gold Corp. |
SGC.V | +30.77% |
| Casa Minerals Inc. |
CASA.V | +30.00% |
| Radisson Mining Resources Inc. |
RDS.V | +25.74% |
| International Lithium Corp. |
ILC.V | +25.00% |
| Poseidon Nickel Limited |
POS.AX | +25.00% |
| Richmond Minerals Inc. |
RMD.V | +23.53% |
| Encounter Resources Ltd. |
ENR.AX | +20.00% |