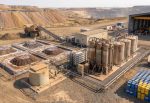
First Majestic Silver Corp. AG recently announced that total production in second-quarter 2021 reached 6.4 million silver equivalent ounces comprising 3.3 million ounces of silver and a record 46,545 ounces of gold. Compared to the first quarter, silver and gold production increased 13% and 95%, respectively. This was owing to a 14% increase in silver equivalent production from its three operating Mexican mines (Santa Elena, San Dimas and La Encantada) and the inclusion of production from the Jerritt Canyon operation in May and June. On a year-over-year basis, silver and gold production were up 83% and 195%, respectively.
On Apr 30, 2021, First Majestic completed the acquisition of the Jerritt Canyon Gold Mine in Nevada from Sprott Mining. It is one of the state's most prominent gold mines and marks the company’s first major investment outside of Mexico. First Majestic has been developing a long-term mine and exploration plan for the operation and has identified numerous projects that will be implemented over the next 12 to 24 months to improve production and reduce costs at the mine and processing plant.
Since First Majestic has taken control of the Jerritt Canyon mine in April, it has produced 18,762 ounces of gold. In second quarter, the La Encantada mine processed 242,839 tons of ore and produced 840,541 ounces of silver. San Dimas produced 1,868,031 ounces of silver and 19,227 ounces of gold. Santa Elena produced 565,453 ounces of silver and 8,453 ounces of gold. The company processed total ore of 826,213 tons during the quarter, which reflected a sequential increase of 35% due to the acquisition of Jerritt Canyon and a 26% increase in production rates at Santa Elena. Consolidated silver and gold grades averaged 137 g/t and 1.80 g/t, in the quarter compared with 166 g/t and 1.26 g/t, respectively, in the first quarter.
Other Updates
During the quarter, the Liquid Natural Gas ("LNG") facility at Santa Elena successfully reached full capacity. Santa Elena is now the First Majestic’s second operation that has been fully converted from diesel to low-cost LNG power.
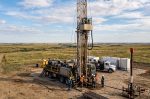
As of Jun 30, 2021, 26 exploration drill rigs were active across the company’s mines and projects comprising 13 rigs at San Dimas, six at Santa Elena, five at Jerritt Canyon and two at La Encantada.
Hikes 2021 Production Outlook
First Majestic expects total production in 2021 to be 25.7-27.5 million silver equivalent ounces consisting of 13.0-13.8 million ounces of silver and 181,000-194,000 ounces of gold. This is higher than its previous production guidance of 20.6 to 22.9 million silver equivalent ounces primarily due to the addition of the Jerritt Canyon mine.
For the second half of 2021, total production is expected to range between 14.8 and 16.4 million silver equivalent ounces consisting of 6.7 to 7.6 million ounces of silver and 111,000 to 124,000 ounces of gold. The mid-point of the guidance indicates a 44% increase from the first half of 2021.
Annual cash costs are now expected to be within the range of $12.52 to $12.96 per ounce, up from the prior projection of $9.52 to $10.10 per ounce, primarily due to the addition of the Jerritt Canyon operation and higher development costs at Santa Elena. Annual all-in sustaining costs are now expected to be $17.86-$18.63 per ounce, compared with the previous guidance of $14.81 to $15.99 per ounce.
First Majestic has updated its 2021 capital budget to $205.3 million to include the Jerritt Canyon operation, and reallocation of capital for development and exploration across its operations. This is 22% higher than its original 2021 capital budget.
Share Price Performance

Image Source: Zacks Investment Research
In a year’s time, First Majestic’s shares have gained 33.1% compared with the industry’s growth of 10.1%.
Zacks Rank & Stocks to Consider
First Majestic carries a Zacks Rank #3 (Hold).
Some better-ranked stocks in the basic materials space are Nucor Corporation NUE, Olin Corporation OLN and Commercial Metals Company CMC, all of which currently flaunt a Zacks Rank #1 (Strong Buy). You can see the complete list of today’s Zacks #1 Rank stocks here.
Nucor has a projected earnings growth rate of around 381.6% for the current year. The company’s shares have soared 129% in a year.
Olin has an expected earnings growth rate of around 506.7% for the current year. The company’s shares have skyrocketed 249% in the past year.
Commercial Metals has an projected earnings growth rate of around 22% for the current year. The company’s shares have appreciated 49% in the past year.
Want the latest recommendations from Zacks Investment Research? Today, you can download 7 Best Stocks for the Next 30 Days. Click to get this free report
First Majestic Silver Corp. (AG) : Free Stock Analysis Report
Nucor Corporation (NUE) : Free Stock Analysis Report
Commercial Metals Company (CMC) : Free Stock Analysis Report
Olin Corporation (OLN) : Free Stock Analysis Report
To read this article on Zacks.com click here.
TORONTO, July 14, 2021 (GLOBE NEWSWIRE) — Mandalay Resources Corporation ("Mandalay" or the "Company") (TSX: MND, OTCQB: MNDJF) announced today its production and sales results for the second quarter of 2021.
Second Quarter 2021 Production Highlights:
-
Solid quarterly production at each site, with further production improvements expected in the coming quarters;
-
Consolidated saleable gold equivalent production of 28,843 ounces – fourth consecutive quarter of increased production; and
-
Consolidated 28,115 ounces of gold equivalent sold – second highest quarterly amount in three years (since Q2 2018).
Dominic Duffy, President and CEO of Mandalay, commented:
“Mandalay Resources continued to deliver strong reliable results with a consolidated 28,843 saleable production ounces of gold equivalent during the second quarter – the Company’s highest result since Q4 2017 – and marked a fourth consecutive quarter of increased production. The 57,519 ounces of gold equivalent produced through June puts the Company firmly on track to meet our 105,000 – 117,000 production guidance for 2021, with further increases expected in the coming quarters.”
Mr. Duffy continued, “Costerfield achieved another solid quarter with grades and production performance tracking well within guidance, with the site producing 14,818 ounces of saleable gold equivalent. We are targeting higher levels of gold production from Costerfield in both the third and fourth quarters of the year as stope tonnage ramps up in Youle, which on average is higher grade than development ore.”
Mr. Duffy added, “At Björkdal, Q2 2021 production of 10,941 saleable gold ounces was in line with the previous quarter. The processing plant had to manage through several weeks of differing ore blends, which unfortunately resulted in lower recoveries. These small batches of ore mix have been minimized and we expect more stable results coming out of the mill going forward. The site continues to develop to the extremities of the Aurora zone and is currently advancing development along lower levels where the average grade is higher. We anticipate stope production in the deeper levels will begin in the second half of the year, which will lift the overall gold production from Björkdal.
Cerro Bayo produced 3,084 ounces of saleable gold equivalent from the processing of the low-grade waste dumps in the quarter which helped boost the consolidated production.”
Mr. Duffy concluded, “We are also announcing that Belinda Labatte has resigned from her position as Chief Development Officer at Mandalay Resources. Belinda has agreed to remain on in a consultancy capacity for a 12-month period in order to help the Company as required to complete the closure efforts at Lupin and outstanding corporate development activities. We thank Belinda for her tireless contributions and wish her all the best for her future endeavors.”
Saleable Production for the Quarter Ended June 30, 2021:
-
In the second quarter of 2021, the Company produced a total of 22,707 ounces of gold, 858 tonnes of antimony and 87,062 ounces of silver representing a total of 28,843 ounces of gold equivalent, versus 21,603 ounces of gold and 946 tonnes of antimony in the second quarter of 2020, representing a total of 24,752 ounces of gold equivalent.
-
Production at Björkdal was 10,941 ounces of gold in the second quarter of 2021 as compared to 11,250 ounces of gold in the second quarter of 2020.
-
Production at Costerfield was 9,959 ounces of gold and 858 tonnes of antimony in the second quarter of 2021 versus 10,353 ounces gold and 946 tonnes antimony in the second quarter of 2020.
-
Production at Cerro Bayo was 1,807 ounces of gold and 87,062 ounces of silver in the second quarter of 2021 versus no production in the second quarter of 2020.
Saleable Production for the Six Months Ended June 30, 2021:
-
The Company produced a total of 46,368 ounces gold, 1,690 tonnes antimony and 130,761 ounces of silver, representing a total of 57,519 ounces of gold equivalent production, versus 42,973 ounces gold and 2,054 tonnes of antimony in the corresponding six months of 2020, representing a total of 50,429 ounces of gold equivalent.
-
Production at Björkdal was 22,796 ounces gold.
-
Production at Costerfield was 21,041 ounces gold and 1,690 tonnes antimony.
-
Production at Cerro Bayo was 2,531 ounces of gold and 130,761 ounces of silver.
Table 1 – Second Quarter and Six Months Saleable Production for 2021 and 2020
|
Metal |
Source |
Three months ended |
Three months ended |
Six months ended |
Six months ended |
|
Gold (oz) |
Björkdal |
10,941 |
11,250 |
22,796 |
22,000 |
|
Costerfield |
9,959 |
10,353 |
21,041 |
20,973 |
|
|
Cerro Bayo |
1,807 |
– |
2,531 |
– |
|
|
Total |
22,707 |
21,603 |
46,368 |
42,973 |
|
|
Antimony (t) |
Costerfield |
858 |
946 |
1,690 |
2,054 |
|
Silver (oz) |
Cerro Bayo |
87,062 |
– |
130,761 |
– |
|
Average quarterly prices: |
|||||
|
Gold US$/oz |
1,814 |
1,709 |
|||
|
Antimony US$/t |
10,272 |
5,688 |
|||
|
Silver US$/oz |
26.61 |
– |
|||
|
Total Gold Eq. (oz)(1) |
|||||
|
Björkdal |
10,941 |
11,250 |
22,796 |
22,000 |
|
|
Costerfield |
14,818 |
13,502 |
30,276 |
28,429 |
|
|
Cerro Bayo |
3,084 |
– |
4,447 |
– |
|
|
Total |
28,843 |
24,752 |
57,519 |
50,429 |
-
Quarterly gold equivalent ounces (“Au Eq. oz”) produced is calculated by multiplying the saleable quantities of gold (“Au”), silver (“Ag”) and antimony (“Sb”) in the period by the respective average market prices of the commodities in the period, adding the amounts to get a “total contained value based on market price”, and then dividing that total contained value by the average market price of Au in the period. Average Au and Ag prices in the periods are calculated as the average of the daily LME PM fixes in the period, with price on weekend days and holidays taken of the last business day; average Sb price in the period is calculated as the average of the daily average of the high and low Rotterdam warehouse prices for all days in the period, with price on weekend days and holidays taken from the last business day. The source for Au and Ag prices is www.transamine.com, and Sb price is www.metalbulletin.com.
Sales for the Second Quarter Ended June 30, 2021:
-
In the second quarter of 2021, the Company sold a total of 23,147 ounces of gold, 644 tonnes of antimony and 90,024 ounces of silver, representing a total of 28,115 ounces of gold equivalent, versus 21,811 ounces of gold and 933 tonnes of antimony in the second quarter of 2020, representing a total of 24,916 ounces of gold equivalent.
-
Björkdal sold 12,132 ounces of gold in the second quarter of 2021 versus 11,290 ounces of gold in the second quarter of 2020.
-
Costerfield sold 9,287 ounces of gold and 644 tonnes of antimony in the second quarter of 2021 versus 10,521 ounces of gold and 933 tonnes of antimony in the second quarter of 2020.
-
Cerro Bayo sold 1,728 ounces of gold and 90,024 ounces of silver in the second quarter of 2021 versus no sales in the second quarter of 2020.
Sales for the Six Months Ended June 30, 2021:
-
The Company sold 47,747 ounces gold, 1,616 tonnes antimony and 90,024 ounces of silver, representing a total of 57,828 ounces of gold equivalent, versus 42,743 ounces gold and 1,793 tonnes antimony in the first six months of 2020, representing a total of 49,192 ounces of gold equivalent.
-
Björkdal sold 24,208 ounces gold.
-
Costerfield sold 21,811 ounces gold and 1,616 tonnes antimony.
-
Cerro Bayo sold 1,728 ounces gold and 90,024 ounces silver in the first six months of 2021 versus no sales in the similar period in 2020.
Table 2 – Second Quarter and Six Months Sales for 2021 and 2020
|
Metal |
Source |
Three months ended |
Three months ended |
Six months ended |
Six months ended |
|
Gold (oz) |
Björkdal |
12,132 |
11,290 |
24,208 |
23,055 |
|
Costerfield |
9,287 |
10,521 |
21,811 |
19,688 |
|
|
Cerro Bayo |
1,728 |
– |
1,728 |
– |
|
|
Total |
23,147 |
21,811 |
47,747 |
42,743 |
|
|
Antimony (t) |
Costerfield |
644 |
933 |
1,616 |
1,793 |
|
Silver (oz) |
Cerro Bayo |
90,024 |
– |
90,024 |
– |
|
Average quarterly prices: |
|||||
|
Gold US$/oz |
1,814 |
1,709 |
|||
|
Antimony US$/t |
10,272 |
5,688 |
|||
|
Silver US$/oz |
26.61 |
– |
|||
|
Total Gold Eq. (oz)1 |
|||||
|
Björkdal |
12,132 |
11,290 |
24,208 |
23,055 |
|
|
Costerfield |
12,934 |
13,626 |
30,571 |
26,137 |
|
|
Cerro Bayo |
3,049 |
– |
3,049 |
– |
|
|
Total |
28,115 |
24,916 |
57,828 |
49,192 |
-
Quarterly Au Eq. oz sold is calculated by multiplying the saleable quantities of Au, and Sb in the period by the respective average market prices of the commodities in the period, adding the amounts to get a “total contained value based on market price”, and then dividing that total contained value by the average market price of Au for the period. The source for Au and Ag prices is www.transamine.com, and Sb price is www.metalbulletin.com, with price on weekend days and holidays taken of the last business day.
For Further Information:
Dominic Duffy
President and Chief Executive Officer
Edison Nguyen
Manager, Analytics and Investor Relations
Contact:
647.260.1566
About Mandalay Resources Corporation:
Mandalay Resources is a Canadian-based natural resource company with producing assets in Australia (Costerfield gold-antimony mine) and Sweden (Björkdal gold mine), with projects in Chile and Canada under care and maintenance, closure or development status. The Company is focused on growing its production profile and reducing costs to generate significant positive cashflow.
Mandalay’s mission is to create shareholder value through the profitable operation of both its Costerfield and Björkdal mines. Currently, the Company’s main objective is to continue mining the high-grade Youle vein at Costerfield, which continues to supply high-grade ore, and also focus on extending Youle’s Mineral Reserves at depth. At Björkdal, the Company will aim to increase production from the Aurora zone in the coming years, in order to maximize profit margins from the mine.
Forward-Looking Statements:
This news release contains "forward-looking statements" within the meaning of applicable securities laws, including statements regarding the Company’s production of gold, antimony and silver for the 2021 fiscal year. Readers are cautioned not to place undue reliance on forward-looking statements. Actual results and developments may differ materially from those contemplated by these statements depending on, among other things, changes in commodity prices and general market and economic conditions. The factors identified above are not intended to represent a complete list of the factors that could affect Mandalay. A description of additional risks that could result in actual results and developments differing from those contemplated by forward-looking statements in this news release can be found under the heading “Risk Factors” in Mandalay’s annual information form dated March 30, 2021, a copy of which is available under Mandalay’s profile at www.sedar.com. In addition, there can be no assurance that any inferred resources that are discovered as a result of additional drilling will ever be upgraded to proven or probable reserves. Although Mandalay has attempted to identify important factors that could cause actual actions, events or results to differ materially from those described in forward-looking statements, there may be other factors that cause actions, events or results not to be as anticipated, estimated or intended. There can be no assurance that forward-looking statements will prove to be accurate, as actual results and future events could differ materially from those anticipated in such statements. Accordingly, readers should not place undue reliance on forward-looking statements.
Image source: The Motley Fool. First Majestic Silver Corp (NYSE: AG)Q2 2021 Earnings CallJul 14, 2021, 11:00 a.m. ETContents: Prepared Remarks Questions and Answers Call Participants Prepared Remarks: OperatorThank you for standing by.
Even when a business is losing money, it's possible for shareholders to make money if they buy a good business at the right price. For example, biotech and mining exploration companies often lose money for years before finding success with a new treatment or mineral discovery. But while history lauds those rare successes, those that fail are often forgotten; who remembers Pets.com?
So should Sabina Gold & Silver (TSE:SBB) shareholders be worried about its cash burn? In this article, we define cash burn as its annual (negative) free cash flow, which is the amount of money a company spends each year to fund its growth. The first step is to compare its cash burn with its cash reserves, to give us its 'cash runway'.
See our latest analysis for Sabina Gold & Silver
How Long Is Sabina Gold & Silver's Cash Runway?
A company's cash runway is the amount of time it would take to burn through its cash reserves at its current cash burn rate. As at March 2021, Sabina Gold & Silver had cash of CA$72m and no debt. In the last year, its cash burn was CA$40m. So it had a cash runway of approximately 21 months from March 2021. Notably, analysts forecast that Sabina Gold & Silver will break even (at a free cash flow level) in about 3 years. Essentially, that means the company will either reduce its cash burn, or else require more cash. You can see how its cash balance has changed over time in the image below.

How Is Sabina Gold & Silver's Cash Burn Changing Over Time?
Because Sabina Gold & Silver isn't currently generating revenue, we consider it an early-stage business. Nonetheless, we can still examine its cash burn trajectory as part of our assessment of its cash burn situation. With the cash burn rate up 40% in the last year, it seems that the company is ratcheting up investment in the business over time. That's not necessarily a bad thing, but investors should be mindful of the fact that will shorten the cash runway. Clearly, however, the crucial factor is whether the company will grow its business going forward. So you might want to take a peek at how much the company is expected to grow in the next few years.
How Easily Can Sabina Gold & Silver Raise Cash?
While Sabina Gold & Silver does have a solid cash runway, its cash burn trajectory may have some shareholders thinking ahead to when the company may need to raise more cash. Issuing new shares, or taking on debt, are the most common ways for a listed company to raise more money for its business. Many companies end up issuing new shares to fund future growth. By comparing a company's annual cash burn to its total market capitalisation, we can estimate roughly how many shares it would have to issue in order to run the company for another year (at the same burn rate).
Sabina Gold & Silver has a market capitalisation of CA$567m and burnt through CA$40m last year, which is 7.1% of the company's market value. That's a low proportion, so we figure the company would be able to raise more cash to fund growth, with a little dilution, or even to simply borrow some money.
How Risky Is Sabina Gold & Silver's Cash Burn Situation?
On this analysis of Sabina Gold & Silver's cash burn, we think its cash burn relative to its market cap was reassuring, while its increasing cash burn has us a bit worried. One real positive is that analysts are forecasting that the company will reach breakeven. Cash burning companies are always on the riskier side of things, but after considering all of the factors discussed in this short piece, we're not too worried about its rate of cash burn. Separately, we looked at different risks affecting the company and spotted 4 warning signs for Sabina Gold & Silver (of which 1 is a bit concerning!) you should know about.
Of course, you might find a fantastic investment by looking elsewhere. So take a peek at this free list of interesting companies, and this list of stocks growth stocks (according to analyst forecasts)
This article by Simply Wall St is general in nature. It does not constitute a recommendation to buy or sell any stock, and does not take account of your objectives, or your financial situation. We aim to bring you long-term focused analysis driven by fundamental data. Note that our analysis may not factor in the latest price-sensitive company announcements or qualitative material. Simply Wall St has no position in any stocks mentioned.
Have feedback on this article? Concerned about the content? Get in touch with us directly. Alternatively, email editorial-team (at) simplywallst.com.
TORONTO, July 14, 2021 /CNW/ – Adventus Mining Corporation ("Adventus") (TSXV: ADZN) (OTCQX: ADVZF) and Salazar Resources Limited ("Salazar") (TSXV: SRL) (collectively the "Partners") are pleased to announce that a binding letter of intent has been issued for the purchase of a worker housing facility for the future construction of the El Domo project in Ecuador.
In anticipation of the El Domo feasibility study completion in the fourth quarter of 2021 (the "Feasibility Study"), the Partners are continuing to advance detailed planning for the final engineering design and mine construction commencement beginning in 2022. The opportunity to advance-purchase construction camp facilities aligns with the El Domo development strategy and will provide housing for personnel during the construction and commissioning phases of the mine. The camp is a previously-owned facility, having most recently been used for the construction of a bridge near the Fruta del Norte mine in southeastern Ecuador.

The El Domo Feasibility Study continues to progress on budget and on schedule for completion in the fourth quarter of 2021. Adventus' Vice President of Projects, Dustin Small, commented, "We are very encouraged by the work completed on the Feasibility Study to date, and look forward to sharing the final results later this year. We are putting in significant effort now to enable Adventus to be in a position to immediately proceed with the execution phase of the project upon successful completion of the study."
Following finalization of the purchase contract expected in July, the camp facilities will be disassembled and warehoused in Quito until such time as it is required for the construction of the mine. The labour strategy for the construction phase of the project is to maximize the employment of skills and labour in the communities surrounding the El Domo deposit and greater Curipamba project area in central Ecuador. This approach was chosen to develop and support the local economy, and also provides logistical benefits to the project such as minimizing the camp size required to house non-local members of the workforce.
Following are some highlights of the work completed on the Feasibility Study to date:
-
Environment & Social Impact Assessment ("ESIA") contract awarded – The contract to prepare the ESIA for the project has been awarded to Ecuadorian environmental engineering consultant Cardno Entrix, who have been involved in the only three large scale mining ESIAs in Ecuador to date. Work on the ESIA commenced in June and is expected to be completed in September for submission to the government of Ecuador. As the primary permitting requirement for the project, this is a major step towards the ability to begin construction in 2022.
-
Community consultations – In May, the first round of official community consultations were held about the upcoming construction and operational phases of the El Domo project, with a second consultation planned shortly. The first consultation was very well attended by over 300 community members in 11 different communities, and it was confirmed that employment opportunities and water management are the two most important topics from those who were in attendance.
-
Mineral Resource estimate update – An update to the mineral resource estimate is currently underway and is expected to be completed in July. This will allow finalization of the Feasibility Study life of mine plan, the maiden estimate of Mineral Reserves, and the open pit design. With this engineering work in hand, final mine fleet size will be determined, and the Partners will engage with mining contractors who have affirmed interest for a long-term mining contract for life of mine operations.
-
Metallurgical test work program nearing completion – The Feasibility Study metallurgical test work program has been underway since February and is anticipated to be completed in August. The latest program is focused on variability test work and confirmation of metallurgical performance using fresh ore from the recently completed infill drilling program at El Domo.
-
Process plant design is complete – The process plant design proceeded in parallel with the metallurgical test work program and is now complete. Based on the test work results to date, it is very unlikely that any significant changes will be required. The facility is expected to have a design throughput capacity of 1,850 tonnes per day, and will be designed to produce three payable concentrates – copper, zinc, and lead.
-
Mine site infrastructure – The majority of mine site infrastructure layout design has been completed, including the access road, haul roads, administration facilities, maintenance shops, warehousing, and power distribution system. Engineering work on the proposed tailings and surface water management facilities is in progress, which is expected to be completed in August.
-
Early contractor engagement program – The Partners have engaged with several well-established Ecuadorian construction contractors to involve them early in the project, who in turn have provided exceptionally strong support by means of cost estimation, constructability reviews, labour/workforce strategy, and execution planning. Establishing these relationships early will help to streamline the transition from study to construction while also providing more certainty on both cost and schedule estimates for the Feasibility Study.
-
Geotechnical drilling complete – All geotechnical drilling for the Feasibility Study has been completed, and the results are being used in the engineering design. No further drilling is required to complete the Feasibility Study.
-
Execution plan development – A detailed project execution plan is under development that goes beyond the typical requirements for a feasibility study. The Partners are taking this approach to allow for a quick transition into execution once the Feasibility Study is complete and a construction decision is approved by the Adventus board. The Partners also intend to implement a detailed operational readiness program to ensure preparedness for eventual mine operations.
Qualified Persons
The technical and scientific information of this news release has been reviewed and approved as accurate by Mr. Dustin Small, P.Eng., Vice President of Projects for Adventus, a non-Independent Qualified Person, as defined by NI 43-101.
The previously published NI 43-101 Technical Report summarizing the results of the El Domo PEA is available on SEDAR with an effective date of June 14, 2019. A summary of the PEA results is also available in a news release dated May 2, 2019.
About Adventus
Adventus Mining Corporation is an Ecuador focused copper-gold exploration and development company. Its strategic shareholders include Altius Minerals Corporation, Greenstone Resources LP, Wheaton Precious Metals Corp., and the Nobis Group of Ecuador. Adventus is advancing the El Domo copper-gold project through a feasibility study, while exploring the broader Curipamba district. In addition, Adventus is engaged in a country-wide exploration alliance with its partners in Ecuador, which has incorporated the Pijili and Santiago copper-gold porphyry projects to date. Adventus also controls an exploration project portfolio in Ireland with South32 Limited as funding partner as well as an investment portfolio of equities in several exploration companies. Adventus is based in Toronto, Canada, and is listed on the TSX Venture Exchange under the symbol ADZN and trades on the OTCQX under the symbol ADVZF.
About Salazar
Salazar Resources Limited is focused on creating value and positive change through discovery, exploration, and development in Ecuador. The team has an unrivalled understanding of the geology in-country and has played an integral role in the discovery of many of the major projects in Ecuador, including the two newest operating gold and copper mines. Salazar Resources has a wholly owned pipeline of copper-gold exploration projects across Ecuador with a strategy to make another commercial discovery and farm-out non-core assets. The Company actively engages with Ecuadorian communities and together with the Salazar family it co-founded The Salazar Foundation, an independent non-profit organization dedicated to sustainable progress through economic development. The Company already has carried interests in three projects. At its maiden discovery, Curipamba, Salazar Resources has a 25% stake fully carried through to production. At two copper-gold porphyry projects, Pijili and Santiago, the Company has a 20% stake fully carried through to a construction decision.
Neither the TSX Venture Exchange nor its Regulation Services Provider (as that term is defined in the policies of the TSX Venture Exchange) accepts responsibility for the adequacy or accuracy of this news release.
This press release contains "forward -looking information" within the meaning of applicable Canadian securities laws. Any statements that express or involve discussions with respect to predictions, expectations, beliefs, plans, projections, objectives, assumptions or future events or performance (often, but not always, identified by words or phrases such as "believes", "anticipates", "expects", "is expected", "scheduled", "estimates", "pending", "intends", "plans", "forecasts", "targets", or "hopes", or variations of such words and phrases or statements that certain actions, events or results "may", "could", "would", "will", "should" "might", "will be taken", or "occur" and similar expressions) are not statements of historical fact and may be forward-looking statements.
Forward-looking information herein includes, but is not limited to, statements that address activities, events or developments that Adventus and Salazar expect or anticipate will or may occur in the future. Although Adventus and Salazar have attempted to identify important factors that could cause actual actions, events or results to differ materially from those described in forward-looking information, there may be other factors that cause actions, events or results not to be as anticipated, estimated or intended. There can be no assurance that such information will prove to be accurate, and actual results and future events could differ materially from those anticipated in such information. Accordingly, readers should not place undue reliance on forward-looking information. Adventus and Salazar undertake to update any forward-looking information except in accordance with applicable securities laws.

SOURCE Adventus Mining Corporation

View original content to download multimedia: http://www.newswire.ca/en/releases/archive/July2021/14/c9938.html
GOLDEN, Colo., July 13, 2021 (GLOBE NEWSWIRE) — Golden Minerals Company (“Golden Minerals”, “Golden” or the “Company”) (NYSE American and TSX: AUMN) is pleased to report payable production for the second quarter 2021 of 3,634 gold equivalent ounces (“AuEq””) consisting of 3,452 gold ounces and 12,323 silver ounces from the first full quarter of production at its Rodeo gold-silver mine located in Durango State, Mexico. Compared to the first quarter 2021, payable AuEq production increased by 2,075 ounces or 133%. Gold equivalents are calculated at the realized metals prices shown below. Average Au grade processed during the second quarter increased to 3.6 g/t Au from 3.0 g/t in the first quarter 2021.
Golden Minerals’ President and Chief Executive Officer, Warren Rehn, added, “We are very pleased to report the first full quarter of production data from Rodeo. We completed the planned ramp-up of production during the second quarter, and after the regrind mill was installed at the end of April, plant throughput averaged over 500 tonnes per day in May and June combined. The Company remains on track to achieve our production guidance of between 12,000-14,000 oz gold and 25,000-30,000 oz silver for full year 2021.”
|
Rodeo Operations Statistics (in thousands, |
Three Months |
Three Months |
Six Months |
||||
|
Total tonnes mined (1) |
164,954 |
171,905 |
336,859 |
||||
|
Total tonnes in stockpiles awaiting processing (2) |
9,215 |
5,108 |
9,215 |
||||
|
Total tonnes in low grade stockpiles (3) |
49,552 |
26,410 |
49,552 |
||||
|
Tonnes processed |
38,814 |
18,791 |
57,605 |
||||
|
Tonnes per day processed |
427 |
209 |
318 |
||||
|
Gold grade processed (grams per tonne) |
3.6 |
3.0 |
3.4 |
||||
|
Silver grade processed (grams per tonne) |
10.0 |
14.3 |
11.4 |
||||
|
Plant recovery – gold (%) |
78.0 |
84.3 |
80.0 |
||||
|
Plant recovery – silver (%) |
83.9 |
86.6 |
84.8 |
||||
|
Payable gold produced in dore (ounces) |
3,452 |
1,390 |
4,841 |
||||
|
Payable silver produced in dore (ounces) |
12,323 |
11,289 |
23,612 |
||||
|
Payable gold equivalent produced in dore (ounces) (4) |
3,634 |
1,559 |
5,186 |
||||
|
Gold sold in dore (ounces) |
3,064 |
909 |
3,973 |
||||
|
Silver sold in dore (ounces) |
11,225 |
9,698 |
20,923 |
||||
|
Gold equivalent sold in dore (ounces) (4) |
3,230 |
1,054 |
4,284 |
||||
|
Realized price, before refining and selling costs |
|||||||
|
Gold (dollar per ounce) |
1,843 |
1,721 |
1,815 |
||||
|
Silver (dollar per ounce) |
27.20 |
25.76 |
26.53 |
||||
(1) Includes all mined material transported to the plant, stockpiled or designated as waste
(2) Includes mined material stockpiled at the mine or transported to the plant awaiting processing in the plant
(3) Material grading between 2 g/t (current cut-off grade) and 1 g/t Au held for possible future processing
(4) Gold equivalents based on realized $ Au and $ Ag price
Production began at Rodeo in January 2021, with a second ball mill installed and operating at the end of April which enabled the Company to easily exceed its targeted processing rate of 450 tonnes per day (“tpd”). As production ramped up in the second quarter, the Company saw a temporary drop in gold recovery from 84% in Q1 to 78% in Q2 related primarily to higher than planned throughput, which in turn yielded slightly coarser grind and lower gold recovery. The Company believes it will be able to improve gold recovery as it targets 550 tpd throughput and optimizes the operation of the leach and extraction circuits at the plant during the third quarter. Target recovery for gold as indicated in metallurgical test results is 85%.
About Golden Minerals
Golden Minerals is a growing gold and silver producer based in Golden, Colorado. The Company is primarily focused on producing gold and silver from its Rodeo Mine and advancing its Velardeña Properties in Mexico and, through partner funded exploration, its El Quevar silver property in Argentina, as well as acquiring and advancing selected mining properties in Mexico, Nevada and Argentina.
Forward-Looking Statements
This press release contains forward-looking statements within the meaning of Section 27A of the Securities Act of 1933, as amended and Section 21E of the Securities Exchange Act of 1934, as amended, and applicable Canadian securities legislation, including statements regarding projections related to production at the Rodeo operation for the full year 2021 and expectations regarding future improvements in gold recoveries. These statements are subject to risks and uncertainties, including the overall impact of the COVID-19 pandemic, including the potential future re-suspension of non-essential activities in Mexico, including mining; lower than anticipated revenue or higher than anticipated costs at the Rodeo mine; declines in general economic conditions; changes in political conditions, in tax, royalty, environmental and other laws in the United States, Mexico or Argentina and other market conditions; and fluctuations in silver and gold prices. Golden Minerals assumes no obligation to update this information. Additional risks relating to Golden Minerals may be found in the periodic and current reports filed with the SEC by Golden Minerals, including the Company’s Annual Report on Form 10-K for the year ended December 31, 2020.
For additional information please visit http://www.goldenminerals.com/ or contact:
Golden Minerals Company
Karen Winkler, Director of Investor Relations
(303) 839-5060
SOURCE: Golden Minerals Company
VANCOUVER, BC, July 13, 2021 /PRNewswire/ – Pan American Silver Corp. (NASDAQ: PAAS) (TSX: PAAS) ("Pan American") will announce its unaudited results for the second quarter of 2021 after market close on Tuesday, August 10, 2021.
Pan American will host a conference call and webcast to discuss the second quarter 2021 results:
|
Date: |
Wednesday, August 11, 2021 |
|
Time: |
11:00 am ET (8:00 am PT) |
|
Dial-in numbers: |
1-800-319-4610 (toll-free in Canada and the U.S.) |
|
+1-604-638-5340 (international participants) |
The live webcast, presentation slides and the Q2 2021 report will be available at panamericansilver.com. An archive of the webcast will also be available for three months.
About Pan American Silver
Pan American owns and operates silver and gold mines located in Mexico, Peru, Canada, Argentina and Bolivia. We also own the Escobal mine in Guatemala that is currently not operating. As the world's second largest primary silver producer with the largest silver reserve base globally, we provide enhanced exposure to silver in addition to a diversified portfolio of gold producing assets. Pan American has a 27-year history of operating in Latin America, earning an industry-leading reputation for corporate social responsibility, operational excellence and prudent financial management. We are headquartered in Vancouver, B.C. and our shares trade on NASDAQ and the Toronto Stock Exchange under the symbol "PAAS".
Learn more at panamericansilver.com.

View original content:https://www.prnewswire.com/news-releases/pan-american-silver-to-announce-second-quarter-2021-unaudited-results-on-august-10-conference-call-and-webcast-on-august-11-301333029.html
SOURCE Pan American Silver Corp.
Point Roberts, Washington and Delta, British Columbia–(Newsfile Corp. – July 13, 2021) – Investorideas.com, a global investor news source covering mining and metals stocks, releases today's edition of Exploring Mining Podcast, featuring an exclusive interview with the President, Chairman and CEO of Aurcana Silver Corporation (TSXV: AUN) (OTCQX: AUNFF).
Listen to the podcast:
https://www.investorideas.com/Audio/Podcasts/2021/071221-Mining.mp3
Listen to Exploring Mining podcast on iTunes Apple podcasts
Listen to Exploring Mining on Spotify
Investorideas caught up with Kevin Drover, President, Chairman and CEO of Aurcana Silver Corporation (TSXV: AUN) (OTCQX: AUNFF), who explained that the company's flagship Revenue-Virginius polymetallic mine in Ouray, Colorado is making significant headway with great expectations in the coming months.
"We're well on our way to getting ourselves back into production," he said. "We're looking at right around the end of this month for starting back again and being cash flow positive in September. And of course, one of the things that we were all waiting for here is our underground mine development – to be able to access our ore body, or in our particular case, it's a vein system."
Aurcana recently reported results of the first assays after accessing the Virginius Vein. Drover explained how they exceeded the company's expectations.
"We are very pleasantly surprised that the grades are quite good," he said. "We're looking at an average grade on the vein of about 38 ounces per tonne and the vein width is at 2.5 feet. In this particular area of the vein we were expecting about a 1.4 foot width and I think about 24 ounces per tonne of silver, so it's very good to see those higher assays and we're quite excited. Within that 2.5 feet, we also have about 0.6 feet of almost 86 ounces per tonne, so very high grade material."
Drover also affirmed the company's robust cash position, at present.
"[Our] cash position as of today is about $23 million," he said. "We certainly expect that we will not have to go back to the market for any further funding. It looks like we have a very good cushion of somewhere around $12-$15 million."
Drover outlined Aurcana's roadmap toward full production of 270 short tonnes per day (stpd), by this September.
"We're looking at putting first ore through the mill in late July and ramping up production through the month of August," he said. "We said we'd be between 110-115 tonnes per day during the month of August and being at full production – as per our feasibility study – of 270 tonnes per day in September. And at the same time in September, we expect to be cash flow positive as well."
As well as Revenue-Virginius, Drover noted that Aurcana looks forward to activating its Shafter silver project, in Presidio County, southwest Texas.
"Beyond that, we're looking at organic growth," he said. "And of course, in 2023 we hope to have the Shafter project come online and add an additional 2.50-3 million ounces and get us into that mid-tier producer status."
ABOUT AURCANA SILVER CORPORATION http://www.aurcana.com/
Aurcana Silver Corporation owns the Revenue Mine, in Colorado, and the Shafter-Presidio Silver Project in Texas, US. The primary mineral resource at both the Shafter-Presidio Project and the Revenue Mine is silver. Both are fully permitted for production.
The Investorideas.com podcasts are also available on iTunes, Spotify, Tunein, Stitcher, Spreaker.com, iHeartRadio and Google Play Music.
Visit the Podcast page at Investorideas.com:
https://www.investorideas.com/Audio/
Research mining stocks at Investorideas.com with our mining stocks directory at Investorideas.com https://www.investorideas.com/Gold_Stocks/Stocks_List.asp
About Investorideas.com – News that Inspires Big Investing Ideas
Investorideas.com publishes breaking stock news, third party stock research, guest posts and original articles and podcasts in leading stock sectors. Learn about investing in stocks and get investor ideas in cannabis, crypto, AI and IoT, mining, sports biotech, water, renewable energy, gaming and more. Investor Idea's original branded content includes podcasts and columns : Crypto Corner , Play by Play sports and stock news , Investor Ideas Potcasts Cannabis News and Stocks on the Move podcast , Cleantech and Climate Change , Exploring Mining , Betting on Gaming Stocks Podcast and the AI Eye Podcast.
Disclaimer/Disclosure: Investorideas.com is a digital publisher of third party sourced news, articles and equity research as well as creates original content, including video, interviews and articles. Original content created by Investorideas is protected by copyright laws other than syndication rights. Our site does not make recommendations for purchases or sale of stocks, services or products. Nothing on our sites should be construed as an offer or solicitation to buy or sell products or securities. All investing involves risk and possible losses. This site is currently compensated for news publication and distribution, social media and marketing, content creation and more. Disclosure is posted for each compensated news release, content published /created if required but otherwise the news was not compensated for and was published for the sole interest of our readers and followers. Contact management and IR of each company directly regarding specific questions. More disclaimer info: https://www.investorideas.com/About/Disclaimer.asp. Learn more about publishing your news release and our other news services on the Investorideas.com newswire https://www.investorideas.com/News-Upload/ and tickertagstocknews.com.
Global investors must adhere to regulations of each country. Please read Investorideas.com privacy policy: https://www.investorideas.com/About/Private_Policy.asp
Disclosure: Aurcana Silver Corporation is a featured company on Investorideas.com
Follow us on Twitter https://twitter.com/Investorideas
Follow us on Facebook https://www.facebook.com/Investorideas
Follow us on YouTube https://www.youtube.com/c/Investorideas
Download our Mobile App for iPhone and Android
Join our Investor Club https://www.investorideas.com/membership/
Contact Investorideas.com to be a guest or sponsor this podcast
800-665-0411

To view the source version of this press release, please visit https://www.newsfilecorp.com/release/90000
TORONTO, July 13, 2021 (GLOBE NEWSWIRE) — McEwen Mining Inc. (NYSE: MUX) (TSX: MUX) reports consolidated production for Q2 2021 was 31,700 gold ounces and 611,800 silver ounces, or 40,800 gold equivalent ounces(1)(“GEOs”), compared to 19,200 GEOs in Q2 2020. Overall production from our operations is on track with our previously announced 2021 production guidance.
Consolidated Production Summary
|
Q1 |
Q2 |
H1 |
2021 |
||||
|
2020 |
2021 |
2020 |
2021 |
2020 |
2021 |
||
|
Gold (oz) |
29,200 |
23,300 |
15,700 |
31,700 |
44,900 |
55,000 |
110,500-127,900 |
|
Silver (oz) |
553,200 |
493,200 |
359,400 |
611,800 |
912,600 |
1,105,000 |
2,300,000-2,450,000 |
|
GEOs(1) |
36,100 |
30,600 |
19,200 |
40,800 |
55,300 |
71,400 |
141,000-160,400 |
Gold Bar Mine, Nevada (100%)
During the quarter, Gold Bar produced 14,100 GEOs, compared to 6,100 GEOs in Q2 2020.
Black Fox Mine, Timmins, Canada (100%)
Black Fox produced 7,100 GEOs during the period, compared to 2,200 GEOs for Q2 2020. Mining at Black Fox has begun transitioning to the Froome deposit, where a progressive ramp-up is planned through Q3, with commercial production expected in Q4.
San José Mine, Santa Cruz, Argentina (49%(2))
During Q2, San José produced 9,300 gold ounces and 607,000 silver ounces, for a total of 18,300 GEOs, compared to 9,000 GEOs in Q2 2020. The Company received $2.5 million in dividends during the quarter.
El Gallo Project, Sinaloa, Mexico (100%)
In Q2, El Gallo produced 1,300 GEOs from residual leaching of the heap leach pad.
Financial Results
Operating costs for the quarter ended June 30, 2021 will be released with our 10-Q Quarterly Financial Statements. Liquid assets(3) as of June 30, 2021 were approximately $44 million.
Notes:
(1) 'Gold Equivalent Ounces' are calculated based on a gold to silver price ratio of 94:1 for Q1 2020, 104:1 for Q2 2020, 68:1 for Q1 2021, and 68:1 for Q2 2021.
(2) The San José Mine is 49% owned by McEwen Mining Inc. and 51% owned and operated by Hochschild Mining plc.
(3) The term liquid assets used in this report is a non-GAAP financial measure. We report this measure to better understand our liquidity in each reporting period. Liquid assets are calculated as the sum of the Balance Sheet line items of cash and cash equivalents, restricted cash and investments, plus ounces of doré held in precious metals inventories valued at the London PM Fix spot price at the corresponding period.
Technical Information
The technical content of this news release has been reviewed and approved by Peter Mah, P.Eng., COO of McEwen Mining and a Qualified Person as defined by Canadian Securities Administrators National Instrument 43-101 "Standards of Disclosure for Mineral Projects."
Reliability of Information Regarding San José
Minera Santa Cruz S.A., the owner of the San José Mine, is responsible for and has supplied to the Company all reported results from the San José Mine. McEwen Mining’s joint venture partner, a subsidiary of Hochschild Mining plc, and its affiliates other than MSC do not accept responsibility for the use of project data or the adequacy or accuracy of this release.
CAUTION CONCERNING FORWARD-LOOKING STATEMENTS
This news release contains certain forward-looking statements and information, including "forward-looking statements" within the meaning of the Private Securities Litigation Reform Act of 1995. The forward-looking statements and information expressed, as at the date of this news release, McEwen Mining Inc.'s (the "Company") estimates, forecasts, projections, expectations or beliefs as to future events and results. Forward-looking statements and information are necessarily based upon a number of estimates and assumptions that, while considered reasonable by management, are inherently subject to significant business, economic and competitive uncertainties, risks and contingencies, and there can be no assurance that such statements and information will prove to be accurate. Therefore, actual results and future events could differ materially from those anticipated in such statements and information. Risks and uncertainties that could cause results or future events to differ materially from current expectations expressed or implied by the forward-looking statements and information include, but are not limited to, effects of the COVID-19 pandemic, fluctuations in the market price of precious metals, mining industry risks, political, economic, social and security risks associated with foreign operations, the ability of the corporation to receive or receive in a timely manner permits or other approvals required in connection with operations, risks associated with the construction of mining operations and commencement of production and the projected costs thereof, risks related to litigation, the state of the capital markets, environmental risks and hazards, uncertainty as to calculation of mineral resources and reserves, and other risks. Readers should not place undue reliance on forward-looking statements or information included herein, which speak only as of the date hereof. The Company undertakes no obligation to reissue or update forward-looking statements or information as a result of new information or events after the date hereof except as may be required by law. See McEwen Mining's Annual Report on Form 10-K for the fiscal year ended December 31, 2020, and other filings with the Securities and Exchange Commission, under the caption "Risk Factors", for additional information on risks, uncertainties and other factors relating to the forward-looking statements and information regarding the Company. All forward-looking statements and information made in this news release are qualified by this cautionary statement.
The NYSE and TSX have not reviewed and do not accept responsibility for the adequacy or accuracy of the contents of this news release, which has been prepared by the management of McEwen Mining Inc.
ABOUT MCEWEN MINING
McEwen Mining is a diversified gold and silver producer and explorer focused in the Americas with operating mines in Nevada, Canada, Mexico and Argentina.
|
CONTACT INFORMATION: |
||
|
Investor Relations: Mihaela Iancu ext. 320 |
Website: www.mcewenmining.com Facebook: facebook.com/mcewenmining Twitter: twitter.com/mcewenmining Instagram: instagram.com/mcewenmining |
150 King Street West |
Figure 1

Map depicting select mineralized zones at Plata in relation to the Plata Thrust Fault and the Aho Zone
TORONTO, July 13, 2021 (GLOBE NEWSWIRE) — Honey Badger Silver Inc. (TSX-V: TUF) (“Honey Badger Silver” or the “Company”) is pleased to announce that it will be initiating a work program at its newly-acquired, 100%-owned, 5,690 hectare Plata Silver Property (“Plata”) located in east-central Yukon.
The Plata Silver Property lies within the Tintina Gold Belt and displays a number of similarities to the world-class Keno Hill Silver Mining Camp, Canada’s second largest primary producer of silver with production from approximately thirty-five vein deposits between 1913 and 1989.
Plata Property Highlights:
-
Historic surface trenching and shallow drilling has identified thirty-two (32) known mineralized zones, comprising high-grade silver, gold, lead and zinc-bearing veins and stockwork zones;
-
Several areas of the property were mined historically for high-grade silver and yielded 9,020 kg (290,000 oz) of silver from a reported 2,041 tonnes of hand sorted material, equivalent to a recovered silver grade of approximately 4,420 grams per tonne (g/t) silver.
Historic drilling to date has demonstrated potential for continuous mineralization over a strike length of nearly 800 metres at the Aho Zone (Figure 1). This zone is a semi-continuous mineralized system developed within the plane of the Plata Thrust Fault that extends intermittently over a total strike length of 800 metres and to a maximum of 580 metres downdip and remains open to extension along strike and downdip.
Plata Phase 1 Program
The primary objective of the Phase 1 program planned for this summer is to complete detailed mapping and rock and channel sampling at several priority target zones at Plata in order to better understand structural controls of silver mineralization. This will provide valuable insight for eventual drill hole targeting.
The secondary objective of the Phase 1 program will be to better define the full extent of mineralization at Plata. Towards this end, soil grids will be completed in previously unsampled areas to more thoroughly define anomalous geochemical zones and trends.
The Company has engaged Archer, Cathro & Associates (1981) Limited, the established leader in Yukon mineral discoveries, to oversee the work program.
About the Plata Silver Property
Historic exploration at the Plata Silver Property from 1969 to 2011 identified thirty-two (32) known mineralized zones, extending over a 2.5 kilometre area, hosting narrow high-grade silver, gold, lead and zinc-bearing veins and stockworks. Mineralization at Plata is believed to be associated with hydrothermal fluids related to the Tombstone intrusive suite and bears similarities to the prolific Keno Hill Silver Mining Camp, Canada’s second largest primary producer of silver with production from approximately thirty-five (35) vein deposits between 1913 and 1989.
High priority target areas at Plata include:
-
P-4 Zone: The P-4 Zone has undergone more extensive drilling relative to other targets at Plata and demonstrates continuous mineralization over 200 metres of strike length that remains open in all directions. Average grades and widths from fourteen (14) core drill holes in 1987 were 1.9 metres grading 337 g/t silver, 3.65 g/t gold, 1.59% lead and 1.7% zinc.
-
P-3 Zone: At the P-3 Zone, rock samples have returned extremely high gold assays (up to 78.3 g/t) and chip sampling returned 1.96 metres grading 2,383 g/t silver, 9.85 g/t gold and 7% lead.
-
P-6 Zone: Drilling in 2011 confirmed the continuity of significant polymetallic silver mineralization at depth and laterally over a strike length of 150 metres. Highlighted drill intercepts include 1.0 metre grading 1,655 g/t silver and 1.09% zinc, and 6.63 metres grading 164 g/t tonne silver and 2.34% zinc. Veining mapped at surface and anomalous soil geochemistry suggest the P-6 structure may extend for 500 metres to the northwest.
-
P-2 Zone: Detailed trenching of the P-2 Zone returned a weighted average of 812 g/t silver, 24.48% lead and 17.02% zinc across an average width of 1.93 metres for a strike length of 85 metres. Drill holes targeting the P-2 Zone yielded intercepts of up to 1,060 g/t silver and 3.86% zinc over 0.87 metres and 110 g/t silver and 39.77% zinc over 0.93 metres.
Importantly, drilling from 2008 to 2011 has demonstrated that the P-3 and P-4 veins are part of a larger, semi-continuous, mineralized system referred to as the Aho Zone, which is developed within the plane of the Plata Thrust Fault and varies from 0.3 to 3.0 metres in width. This zone extends intermittently over a total strike length of 800 metres and to a maximum of 580 metres downdip and remains open to extension along strike and downdip (Figure 1).
Technical information in this news release has been approved by Heather Burrell, P.Geo., a geologist with Archer, Cathro & Associates (1981) Limited and qualified person for the purpose of National Instrument 43-101.
For more information, please visit our new website at http://www.honeybadgersilver.com.
Or contact: Ms. Christina Slater at cslater@honeybadgersilver.com.
About Honey Badger Silver Inc.
Honey Badger Silver is a Canadian silver company based in Toronto, Ontario focused on the acquisition, development, and integration of accretive transactions of silver ounces. The company is led by a highly experienced leadership team with a track record of value creation backed by a skilled technical team. With a dominant land position in Ontario’s historic Thunder Bay Silver District and advanced projects in the southeast and south-central Yukon, Honey Badger Silver is positioning to be a top tier silver company.
The Company’s common shares trade on the TSX Venture Exchange under the symbol “TUF”.
Neither TSX Venture Exchange nor its Regulation Services Provider (as that term is defined in policies of the TSX Venture Exchange) accepts responsibility for the adequacy or accuracy of this release.
This News Release contains forward-looking statements. In some cases, you can identify forward-looking statements by terminology such as “may”, “should”, “expects”, “plans”, “anticipates”, “believes”, “estimates”, “predicts”, “potential” or “continue” or the negative of these terms or other comparable terminology. These statements are only predictions and involve known and unknown risks, uncertainties and other factors that may cause our or our industry’s actual results, levels of activity, performance or achievements to be materially different from any future results, levels of activity, performance or achievements expressed or implied by these forward-looking statements.
Although the Company believes that the assumptions and factors used in preparing the forward-looking information in this news release are reasonable, undue reliance should not be placed on such information, which only applies as of the date of this news release. The Company disclaims any intention or obligation to update or revise any forward-looking information, whether as a result of new information, future events or otherwise, other than as required.
Figure 1: Map depicting select mineralized zones at Plata in relation to the Plata Thrust Fault and the Aho Zone is available at https://www.globenewswire.com/NewsRoom/AttachmentNg/18c1d482-4acb-4608-bf86-03b27c21e5cc
COEUR D'ALENE, Idaho, July 13, 2021–(BUSINESS WIRE)–Hecla Mining Company (NYSE:HL) today announced its preliminary silver and gold production for the second quarter of 2021.1
HIGHLIGHTS
-
Silver production of 3.5 million ounces, an increase of 4% due to full production at Lucky Friday.
-
Gold production of 59,139 ounces, a decrease of 1%.
-
Zinc production decreased 4% due to lower grades at Greens Creek and lead production increased 29% due to Lucky Friday production.
-
Production of all metals was higher than the first quarter of 2021.
-
Silver equivalent production of 10.1 million ounces or gold equivalent production of 148,161 ounces.2
-
Quarter-end cash position of approximately $181 million.
"With steady growth in silver production at the Lucky Friday Mine and solid operating performance from our Greens Creek Mine, we achieved our second highest quarterly silver production since 2016," said Hecla’s President and CEO, Phillips S. Baker, Jr. "This strong performance combined with steady prices delivered an increase of approximately $41 million in cash, the fifth consecutive quarter of increasing cash reserves and one of the highest increases in Hecla’s history. With the Company’s U.S. vaccination rate higher than the U.S. average including Greens Creek at a nearly 90% vaccination rate, and Casa Berardi vaccinations increasing, we expect to build on these results."
OPERATIONS
Greens Creek
At the Greens Creek Mine, 2.6 million ounces of silver and 12,859 ounces of gold were produced. The decrease in silver production compared to the second quarter of 2020 was due to lower grades resulting from mine sequencing. The mill operated at an average of 2,362 tons per day (tpd).
Casa Berardi
At the Casa Berardi Mine, 31,332 ounces of gold were produced. The increase in gold ounces compared to the second quarter of 2020 was due to higher mill throughput, partially offset by lower grades. The mill operated at an average of 4,117 tpd.
-
See cautionary statement regarding preliminary statements at the end of this release.
-
Silver and gold equivalent calculation based on average actual prices for each metal in the first quarter as follows: $26.70 for Ag, $1,816 for Au, $0.96 for Pb, and $1.32 for Zn.
Lucky Friday
At the Lucky Friday Mine, 913,294 ounces of silver were produced in the quarter, an increase of 95% compared to the second quarter of 2020 due to the return to full production in the fourth quarter of 2020. The mill operated at an average of 906 tpd.
Nevada Operations
At the Nevada operations, 14,947 ounces of gold and 45,125 ounces of silver were produced from processing previously stockpiled ore, including oxide material processed at the Midas mill and a bulk sample of refractory material processed at a third-party facility. With the completion of processing the oxide material, the Fire Creek Mine and Midas mill were placed on care and maintenance during the quarter. In the second half of 2021, approximately 10,000 tons of refractory material is expected to be processed as a test at a third-party autoclave facility. Development for the Hatter Graben deposit at Hollister and exploration at Midas are ongoing.
PRODUCTION SUMMARY
|
Second Quarter Ended |
Six Months Ended |
|||||||
|
June 30, 2021 |
June 30, 2020 |
June 30, 2021 |
June 30, 2020 |
|||||
|
PRODUCTION |
Increase/ (Decrease) |
Increase/ (Decrease) |
||||||
|
Silver |
3,524,782 |
3,403,781 |
4 |
% |
6,984,227 |
6,649,250 |
5 |
% |
|
Gold |
59,139 |
59,982 |
(1 |
)% |
111,143 |
118,774 |
(6 |
)% |
|
Lead |
11,541 |
8,977 |
29 |
% |
22,245 |
14,870 |
50 |
% |
|
Zinc |
17,211 |
17,855 |
(4 |
)% |
33,318 |
30,702 |
9 |
% |
|
Greens Creek – Silver |
2,558,447 |
2,753,919 |
(7 |
)% |
5,143,317 |
5,529,626 |
(7 |
)% |
|
Greens Creek – Gold |
12,859 |
13,104 |
(2 |
)% |
26,125 |
25,377 |
3 |
% |
|
Lucky Friday – Silver |
913,294 |
469,537 |
95 |
% |
1,777,194 |
565,285 |
214 |
% |
|
San Sebastian – Silver |
– – |
158,842 |
N/A |
– – |
505,467 |
N/A |
||
|
San Sebastian – Gold |
– – |
1,331 |
N/A |
– – |
4,133 |
N/A |
||
|
Casa Berardi – Gold |
31,332 |
30,756 |
2 |
% |
67,522 |
57,508 |
17 |
% |
|
Nevada Operations – Silver (oz) 1 |
45,125 |
15,988 |
182 |
% |
45,125 |
37,443 |
21 |
% |
|
Nevada Operations – Gold (oz) 1 |
14,947 |
14,791 |
1 |
% |
17,495 |
31,756 |
(45 |
)% |
-
At the Nevada operations, stockpiled ore milled in the second quarter of 2021.
STRENGTHENING THE BALANCE SHEET
Cash and cash equivalents are expected to be approximately $181 million as of June 30, 2021, with the revolving line of credit undrawn.
ABOUT HECLA
Founded in 1891, Hecla Mining Company (NYSE:HL) is the largest silver producer in the United States. In addition to operating mines in Alaska, Idaho, and Quebec, Canada, the Company owns a number of exploration and pre-development projects in world-class silver and gold mining districts throughout North America.
Cautionary Statements Regarding Estimates and Forward-Looking Statements
All measures of the Company's second quarter 2021 operating and financial results and conditions contained in this release are preliminary and reflect the Company’s expected results as of the date of this release. Actual reported second quarter 2021 results are subject to management's final review as well as review by the Company's independent registered accounting firm and may vary significantly from current expectations because of a number of factors, including, without limitation, additional or revised information and changes in accounting standards or policies or in how those standards are applied.
Statements made or information provided in this news release that are not historical facts are "forward-looking statements" within the meaning of the Private Securities Litigation Reform Act of 1995 and "forward-looking information" within the meaning of Canadian securities laws. Words such as "may", "will", "should", "expects", "intends", "projects", "believes", "estimates", "targets", "anticipates" and similar expressions are used to identify these forward-looking statements. Forward-looking statements in this news release may include, without limitations, in the second half of 2021, approximately 10,000 tons of refractory material is expected to be processed as a test at a third-party autoclave facility. The material factors or assumptions used to develop such forward-looking statements or forward-looking information include that the Company’s plans for development and production will proceed as expected and will not require revision as a result of risks or uncertainties, whether known, unknown or unanticipated, to which the Company’s operations are subject.
Forward-looking statements involve a number of risks and uncertainties that could cause actual results to differ materially from those projected, anticipated, expected, or implied. These risks and uncertainties include, but are not limited to, metals price volatility, volatility of metals production and costs, litigation, regulatory and environmental risks, operating risks, project development risks, political risks, labor issues, ability to raise financing and exploration risks and results. Refer to the Company's Form 10-K and 10-Q reports for a more detailed discussion of factors that may impact expected future results. The Company undertakes no obligation and has no intention of updating forward-looking statements other than as may be required by law.
Category: Press Release
View source version on businesswire.com: https://www.businesswire.com/news/home/20210713005343/en/
Contacts
Russell Lawlar
Sr. Vice President – CFO and Treasurer
Jeanne DuPont
Senior Communications Coordinator
800-HECLA91 (800-432-5291)
Investor Relations
Email: hmc-info@hecla-mining.com
Website: www.hecla-mining.com
The latest 13F reporting period has come and gone, and Insider Monkey is again at the forefront when it comes to making use of this gold mine of data. We at Insider Monkey have plowed through 866 13F filings that hedge funds and well-known value investors are required to file by the SEC. The 13F filings show the funds' and investors' portfolio positions as of March 31st. In this article we look at what those investors think of Pan American Silver Corp. (NASDAQ:PAAS).
Is PAAS a good stock to buy? Hedge fund interest in Pan American Silver Corp. (NASDAQ:PAAS) shares was flat at the end of last quarter. This is usually a negative indicator. Our calculations also showed that PAAS isn't among the 30 most popular stocks among hedge funds (click for Q1 rankings). The level and the change in hedge fund popularity aren't the only variables you need to analyze to decipher hedge funds' perspectives. A stock may witness a boost in popularity but it may still be less popular than similarly priced stocks. That's why at the end of this article we will examine companies such as YETI Holdings, Inc. (NYSE:YETI), BlackLine, Inc. (NASDAQ:BL), and Terminix Global Holdings, Inc. (NYSE:TMX) to gather more data points.
In the eyes of most market participants, hedge funds are seen as slow, old financial vehicles of the past. While there are more than 8000 funds trading at present, Our experts choose to focus on the elite of this group, about 850 funds. It is estimated that this group of investors manage the lion's share of the smart money's total capital, and by keeping track of their best investments, Insider Monkey has unsheathed a few investment strategies that have historically surpassed the market. Insider Monkey's flagship short hedge fund strategy outstripped the S&P 500 short ETFs by around 20 percentage points a year since its inception in March 2017. Also, our monthly newsletter's portfolio of long stock picks returned 206.8% since March 2017 (through May 2021) and beat the S&P 500 Index by more than 115 percentage points. You can download a sample issue of this newsletter on our website .

Richard Driehaus of Driehaus Capital
At Insider Monkey, we scour multiple sources to uncover the next great investment idea. For example, economists warn of inflation flare up. So, we are checking out this backdoor gold play that has hit peak gains of 718% in a little over a year. We go through lists like the 10 best battery stocks to pick the next Tesla that will deliver a 10x return. Even though we recommend positions in only a tiny fraction of the companies we analyze, we check out as many stocks as we can. We read hedge fund investor letters and listen to stock pitches at hedge fund conferences. You can subscribe to our free daily newsletter on our homepage. With all of this in mind we're going to take a glance at the latest hedge fund action encompassing Pan American Silver Corp. (NASDAQ:PAAS).
Do Hedge Funds Think PAAS Is A Good Stock To Buy Now?
At the end of March, a total of 27 of the hedge funds tracked by Insider Monkey held long positions in this stock, a change of 0% from the fourth quarter of 2020. Below, you can check out the change in hedge fund sentiment towards PAAS over the last 23 quarters. So, let's review which hedge funds were among the top holders of the stock and which hedge funds were making big moves.

When looking at the institutional investors followed by Insider Monkey, David Greenspan's Slate Path Capital has the most valuable position in Pan American Silver Corp. (NASDAQ:PAAS), worth close to $103.5 million, accounting for 6.7% of its total 13F portfolio. The second largest stake is held by Sprott Asset Management, led by Eric Sprott, holding a $91.8 million position; 5.5% of its 13F portfolio is allocated to the company. Other members of the smart money that hold long positions include Richard Driehaus's Driehaus Capital, Renaissance Technologies and Ken Griffin's Citadel Investment Group. In terms of the portfolio weights assigned to each position Slate Path Capital allocated the biggest weight to Pan American Silver Corp. (NASDAQ:PAAS), around 6.72% of its 13F portfolio. Brightlight Capital is also relatively very bullish on the stock, dishing out 5.93 percent of its 13F equity portfolio to PAAS.
Since Pan American Silver Corp. (NASDAQ:PAAS) has experienced a decline in interest from hedge fund managers, it's easy to see that there were a few hedgies that elected to cut their full holdings by the end of the first quarter. It's worth mentioning that Peter Rathjens, Bruce Clarke and John Campbell's Arrowstreet Capital said goodbye to the largest position of all the hedgies followed by Insider Monkey, totaling about $56.6 million in stock, and Hugh Sloane's Sloane Robinson Investment Management was right behind this move, as the fund dropped about $22.1 million worth. These transactions are important to note, as aggregate hedge fund interest stayed the same (this is a bearish signal in our experience).
Let's also examine hedge fund activity in other stocks similar to Pan American Silver Corp. (NASDAQ:PAAS). We will take a look at YETI Holdings, Inc. (NYSE:YETI), BlackLine, Inc. (NASDAQ:BL), Terminix Global Holdings, Inc. (NYSE:TMX), Sana Biotechnology, Inc. (NASDAQ:SANA), BWX Technologies Inc (NYSE:BWXT), Reynolds Consumer Products Inc. (NASDAQ:REYN), and Silicon Laboratories (NASDAQ:SLAB). This group of stocks' market valuations are closest to PAAS's market valuation.
[table] Ticker, No of HFs with positions, Total Value of HF Positions (x1000), Change in HF Position YETI,30,159366,11 BL,24,271832,1 TMX,27,456007,-3 SANA,15,158923,15 BWXT,16,154661,-3 REYN,19,153098,1 SLAB,18,142253,0 Average,21.3,213734,3.1 [/table]
View table here if you experience formatting issues.
As you can see these stocks had an average of 21.3 hedge funds with bullish positions and the average amount invested in these stocks was $214 million. That figure was $352 million in PAAS's case. YETI Holdings, Inc. (NYSE:YETI) is the most popular stock in this table. On the other hand Sana Biotechnology, Inc. (NASDAQ:SANA) is the least popular one with only 15 bullish hedge fund positions. Pan American Silver Corp. (NASDAQ:PAAS) is not the most popular stock in this group but hedge fund interest is still above average. Our overall hedge fund sentiment score for PAAS is 72. Stocks with higher number of hedge fund positions relative to other stocks as well as relative to their historical range receive a higher sentiment score. This is a slightly positive signal but we'd rather spend our time researching stocks that hedge funds are piling on. Our calculations showed that top 5 most popular stocks among hedge funds returned 95.8% in 2019 and 2020, and outperformed the S&P 500 ETF (SPY) by 40 percentage points. These stocks gained 24% in 2021 through July 9th and beat the market again by 6.7 percentage points. Unfortunately PAAS wasn't nearly as popular as these 5 stocks and hedge funds that were betting on PAAS were disappointed as the stock returned -4.9% since the end of March (through 7/9) and underperformed the market. If you are interested in investing in large cap stocks with huge upside potential, you should check out the top 5 most popular stocks among hedge funds as many of these stocks already outperformed the market since 2019.
Get real-time email alerts: Follow Pan American Silver Corp (NASDAQ:PAAS)
Suggested Articles:
Disclosure: None. This article was originally published at Insider Monkey.
Follow Insider Monkey on Twitter
Vancouver, British Columbia–(Newsfile Corp. – July 13, 2021) – IMPACT Silver Corp. (TSXV: IPT) ("IMPACT" or the "Company") is pleased to announce that it has completed Phase 1 of the Veta Negra drill program located 3.4 km northwest of IMPACT's 535 tonne per day Guadalupe processing plant in the Royal Mines of Zacualpan District, Mexico.
"These results confirm what we have known for the last two years of open pit production at Veta Negra. There is a significant mineralization and prospective grades at shallow depths and expansion potential to the north and south around Veta Negra area. Given the encouraging Phase 1 drill results, we look forward to results from the planned Phase 2 program to start later this month," President and CEO of IMPACT Silver, Fred Davidson, commented.
Veta Negra Drilling
Seven holes (MPZ-308-20 to MPZ-314-20) were drilled with IMPACT's Diamec rig to test the near surface mineralization below and to the north of the operating open pit for a total of 530 meters. Results are listed below:
|
Hole ID |
From (m) |
To (m) |
Interval (m) |
Ag(g/t) |
Au (g/t) |
Pb % |
Zn % |
|
MPZ-308-20 |
29.10 |
51.37 |
21.22 |
91.90 |
0.070 |
0.08 |
0.20 |
|
MPZ-309-20 |
33.80 |
44.40 |
10.60 |
85.29 |
0.039 |
0.46 |
0.74 |
|
MPZ-309-20 |
37.72 |
39.60 |
1.88 |
275.96 |
0.069 |
0.34 |
0.96 |
|
MPZ-310-20 |
37.50 |
41.22 |
3.72 |
57.85 |
0.119 |
0.43 |
0.52 |
|
MPZ-312-20 |
6.90 |
14.17 |
7.27 |
152.08 |
0.059 |
0.15 |
0.20 |
|
MPZ-313-20 |
1.40 |
20.35 |
18.95 |
64.21 |
0.043 |
0.04 |
0.29 |
|
MPZ-313-20 |
12.12 |
26.00 |
13.88 |
72.48 |
0.059 |
0.07 |
0.33 |
|
MPZ-313-20 |
50.55 |
54.80 |
4.25 |
165.64 |
0.240 |
0.34 |
0.71 |
|
MPZ-313-20 |
71.00 |
73.30 |
2.30 |
98.87 |
0.358 |
0.37 |
0.91 |
|
MPZ-314-20 |
17.00 |
28.15 |
11.15 |
52.00 |
0.018 |
0.07 |
0.12 |
|
MPZ-314-20 |
47.25 |
51.68 |
4.43 |
52.26 |
0.020 |
0.14 |
0.55 |
|
MPZ-314-20 |
70.32 |
73.92 |
3.60 |
171.47 |
0.059 |
0.20 |
0.52 |
Thirteen holes (Z21-01 to Z21-10 and Z21-12 to Z21-13) were drilled for a total of 1,406m with IMPACT's recently purchased man portable hydraulic rig to test the mineralization to depth on approximately 50 meter step outs. Results are listed below:
|
Hole ID |
From (m) |
To (m) |
Interval (m) |
Ag(g/t) |
Au (g/t) |
Pb % |
Zn % |
|
Z21-01 |
139.05 |
141.15 |
2.10 |
90.47 |
0.075 |
0.37 |
1.38 |
|
Z21-02 |
71.45 |
74.30 |
2.85 |
49.25 |
0.046 |
0.04 |
0.06 |
|
Z21-05 |
2.65 |
12.45 |
9.80 |
211.28 |
0.085 |
0.31 |
0.31 |
|
Z21-05 |
28.55 |
30.15 |
1.60 |
263.22 |
0.128 |
0.47 |
1.40 |
|
Z21-05 |
37.55 |
51.40 |
13.85 |
186.95 |
0.984 |
1.22 |
2.45 |
|
Z21-05 |
72.50 |
73.26 |
0.76 |
64.23 |
0.080 |
0.51 |
2.37 |
|
Z21-06 |
0.00 |
7.40 |
7.40 |
110.00 |
0.050 |
0.09 |
0.14 |
|
Z21-08 |
0.00 |
4.50 |
4.50 |
70.93 |
0.013 |
0.05 |
0.14 |
|
Z21-09 |
75.00 |
76.50 |
1.50 |
51.33 |
0.097 |
0.09 |
0.44 |
|
Z21-10 |
0.00 |
9.85 |
9.85 |
52.18 |
0.002 |
0.00 |
0.10 |
|
Z21-12 |
6.50 |
13.00 |
6.50 |
38.63 |
0.068 |
0.12 |
0.11 |
|
Z21-13 |
51.00 |
52.00 |
1.00 |
79.75 |
0.145 |
0.04 |
0.09 |
|
Z21-13 |
82.00 |
83.50 |
1.50 |
53.89 |
0.067 |
0.07 |
0.49 |
The Veta Negra vein system was mined historically as both an open pit and from underground. Two north-northwest trending parallel veins enclosed by stockwork mineralized host rock are currently being mined by IMPACT over widths averaging 14 metres in the open pit. Mineralization is trucked from Veta Negra to the Guadalupe processing plant and blended with mineral from the Guadalupe and San Ramon mining operations.
IMPACT's man portable hydraulic rig is presently drilling in the San Ramon Mine area testing the southern extension of the Inmaculada Vein system. A Phase 2 drill program is planned to test the Veta Negra vein systems to the north of hole MPZ-309-20 and south of hole Z21-05.
ABOUT IMPACT SILVER
IMPACT Silver Corp. is a successful silver-gold explorer-producer with two processing plants on adjacent districts within its 100% owned mineral concessions covering 211km2 in central Mexico with excellent infrastructure and labor force. Over the past 15 years, IMPACT has produced over 10 million ounces of silver, generating revenues of over $202 million, with no long-term debt. At the Royal Mines of Zacualpan Silver District, three underground silver mines and one open pit mine feed the central Guadalupe processing plant. To the south, in the Mamatla District, the Capire Project includes a 200 tpd processing pilot plant adjacent to an open pit silver mine with a mineral resource of over 4.5 million oz silver, 48 million lbs zinc and 21 million lbs lead (see IMPACT news release dated January 18, 2016 for details). Company engineers are reviewing Capire for potential restart of operations in light of current elevated silver prices. With 15 years of exploration successes leading to production cash flows, IMPACT has shown the Zacualpan Silver-Gold District to be endowed with many high grade silver-gold zones and has placed multiple zones into commercial production.
Additional information about IMPACT and its operations can be found on the Company website at www.IMPACTSilver.com. Follow us on Twitter @IMPACT_Silver and LinkedIn at https://www.linkedin.com/company/impactsilver

Drill Location Map: Veta Negra
To view an enhanced version of this graphic, please visit:
https://orders.newsfilecorp.com/files/4729/90098_1d9e9894443cdb49_001full.jpg
Qualified Person and NI 43-101 Disclosure
Wojtek Jakubowski, P.Geo. is a "qualified person" within the meaning of NI 43-101 and has approved the technical information contained in this news release.
On behalf of IMPACT Silver Corp.
"Frederick W. Davidson"
President & CEO
For more information, please contact:
Jerry Huang
CFO | Investor Relations
(604) 681 0172 or inquiries@impactsilver.com
(778) 887 6489 Direct
Neither TSX Venture Exchange nor its Regulation Services Provider (as that term is defined in the policies of the TSX Venture Exchange) accepts responsibility for the adequacy or accuracy of this release.
Forward-Looking and Cautionary Statements
This IMPACT News Release may contain certain "forward-looking" statements and information relating to IMPACT that is based on the beliefs of IMPACT management, as well as assumptions made by and information currently available to IMPACT management. Forward-looking information is often, but not always, identified by the use of words such as "seek", "anticipate", "plan", "continue", "planned", "expect", "project", "predict", "potential", "targeting", "intends", "believe", "potential", and similar expressions, or describes a "goal", or variation of such words and phrases or state that certain actions, events or results "may", "should", "could", "would", "might" or "will" be taken, occur or be achieved. Such statements include, but are not limited to, statements with respect to the expected use of proceeds of the Private Placement.
Such forward-looking information involves known and unknown risks and assumptions, including with respect to, without limitations, exploration and development risks, expenditure and financing requirements, title matters, operating hazards, metal prices, political and economic factors, competitive factors, general economic conditions, relationships with vendors and strategic partners, governmental regulation and supervision, seasonality, technological change, industry practices, and one-time events. Should any one or more risks or uncertainties materialize or change, or should any underlying assumptions prove incorrect, actual results and forward-looking statements may vary materially from those described herein. IMPACT does not assume the obligation to update any forward-looking statement.
The Company's decision to place a mine into production, expand a mine, make other production related decisions or otherwise carry out mining and processing operations, is largely based on internal non-public Company data and reports based on exploration, development and mining work by the Company's geologists and engineers. The results of this work are evident in the discovery and building of multiple mines for the Company and in the track record of mineral production and financial returns of the Company since 2006. Under NI 43-101 the Company is required to disclose that it has not based its production decisions on NI 43-101 compliant mineral resource or reserve estimates, preliminary economic assessments or feasibility studies, and historically such projects have increased uncertainty and risk of failure.
705-543 Granville Street Telephone 604 664-7707
Vancouver, BC, Canada V6C 1X8
www.impactsilver.com
Twitter
LinkedIn

To view the source version of this press release, please visit https://www.newsfilecorp.com/release/90098
In this article we will take a look at the 15 best gold mining stocks to invest in. You can skip our detailed analysis of the mining industry’s outlook for 2021 and some of the major growth catalysts for mining stocks, and go directly to the 5 Best Gold Mining Stocks to Invest In.
Gold has always been seen as one of the most valuable and profitable commodities by long-term investors. The weakening of the dollar and uncertainties regarding traditional stocks result in the escalation of gold prices and in turn, gold stocks. For example, between 1998 and 2008, the gold prices grew manifold, reaching nearly $2,000 per ounce in 2012. Gold investments work as an exceptional hedge against inflation, especially when the national currency is declining.
According to a report by McKinsey & Company, the gold industry has delivered a 33% return to the shareholders in 2020. Despite the rise in prices and solid earnings, the gold mining industry did face the repercussions of the pandemic in 2020, putting over 8 million ounces of gold production in grave peril. However, the gold mining industry is recovering from the after-effects of the pandemic and is expected to rise 5.5% in 2021. According to Mining.com, gold production is projected to grow at a CAGR of 2.9% at over 124.1 million ounces by 2024. The growth rate of mining can certainly accelerate the precious metals and gold prices, resulting in some fruitful investments.
World Gold Council reports that in 2020, China remained the biggest producer of gold, accounting for over 11% of the total global production, followed by Russia and Australia. However, some of the major gold mining companies are headquartered in Canada, including Barrick Gold Corporation (NYSE: GOLD), Agnico Eagle Mines Limited (NYSE: AEM), Alamos Gold Inc. (NYSE: AGI), Franco-Nevada Corporation (NYSE: FNV), etc. These companies, along with some other gold mining giants, are expected to generate over $50 billion in 2021, compared with $38 billion in 2020, according to the analysts at McKinsey. In 2020, Barrick Gold Corporation (NYSE: GOLD) generated over $12 billion in revenues, with gold revenue soaring by 27%. Similarly, Freeport-McMoRan Inc. (NYSE: FCX), one of the largest mining companies, generated $14.2 billion in 2020.
Bank of America BofA expects the gold stocks to gain in 2021 due to growing production and net gold output. According to BofA, Newmont Corporation (NYSE: NEM) will reach 6.5 million ounces of gold production in 2021 and the bank included the stock in its top gold picks. The company is also added to the bank’s high-conviction buy list. Moreover, the share price of Newmont Corporation (NYSE: NEM) also gained over 55% in the past five years.
In addition to Newmont Corporation (NYSE: NEM), BofA also highlighted Agnico Eagle Mines Limited (NYSE: AEM) and Kinross Gold Corporation (NYSE: KGC) as ‘Buy’ and raised their price targets.

Image by Tshekiso Tebalo from Pixabay
In light of these, let's analyze our list of the 15 best gold mining stocks to invest in. We took into account hedge fund sentiment, analysts' ratings, long-term growth potential and fundamentals while choosing these stocks.
Best Gold Mining Stocks to Invest In
15. New Gold Inc. (NYSE: NGD)
Number of Hedge Fund Holders: 14
New Gold Inc. (NYSE: NGD) is a Canada-based mining company that specializes in the operation, exploration, and development of gold and other precious metals. The company ranks fifteenth on our list of the best gold mining stocks to invest in.
New Gold Inc. (NYSE: NGD) reported a strong first quarter with net earnings of $8 million and an EPS of $0.01. The revenue was recorded at $164.9 million, up from $142.3 million during the same period last year. The company produced 96,026 ounces and sold over 91,800 ounces of gold in Q1. The gold revenue stood at $112.4 million, compared with $98 million in the prior-year quarter. According to the company, the increased activity at Rainy River and New Afton will drive stronger financial results in 2021, in-line with its estimates.
In May, National Bank raised its price target to $4 on the stock, rating it as ‘Outperform’.
As of Q1 2021, 14 hedge funds tracked by Insider Monkey have positions in New Gold Inc. (NYSE: NGD), up from 12 in the previous quarter. The total value of these stakes is $70 million. Renaissance Technologies is the leading shareholder of the company with 17.7 million shares, worth $27.3 million.
Like Hecla Mining Company (NYSE: HL), Wheaton Precious Metals Corp. (NYSE: WPM), Freeport-McMoRan Inc. (NYSE: FCX), Newmont Corporation (NYSE: NEM), Barrick Gold Corporation (NYSE: GOLD), Agnico Eagle Mines Limited (NYSE: AEM) and Franco-Nevada Corporation (NYSE: FNV), New Gold Inc. (NYSE: NGD) is one of the best gold mining stocks to buy now.
14. AngloGold Ashanti Limited (NYSE: AU)
Number of Hedge Fund Holders: 14
AngloGold Ashanti Limited (NYSE: AU) is a gold mining company with headquarters in Johannesburg, South Africa. The company is the third-largest gold producer in the world with the production of 3.047 million ounces of gold in 2020.
In Q1 2021, AngloGold Ashanti Limited (NYSE: AU) reported a 42% year-over-year growth in headline earnings at $203 million or $0.48 per share. The revenue for the quarter stood at $979 million, up from $905 million during the same period last year. The gold production saw a 7% decline at 588,000 ounces, accounting for $956 million of the total revenue. The company’s strong numbers are driven by higher gold prices and the accelerated redevelopment project of its Obuasi mine in Ghana, which resulted in production growth by 53% year-over-year. These current earnings are in line with its 2021 guidance. AngloGold Ashanti Limited (NYSE: AU) expects gold production to reach $3.4 million ounces per year by 2025.
Earlier in March, Renaissance Capital raised its price target on AU stock to ZAR 450, ranking it as ‘Buy’.
At the end of Q1 2021, 14 hedge funds tracked by Insider Monkey have positions in AngloGold Ashanti Limited (NYSE: AU), worth $319 million.
Like Barrick Gold Corporation (NYSE: GOLD), Alamos Gold Inc. (NYSE: AGI), and Hecla Mining Company (NYSE: HL), AngloGold Ashanti Limited (NYSE: AU) is one of the best gold mining stocks to invest in.
13. Gold Fields Limited (NYSE: GFI)
Number of Hedge Fund Holders: 15
Gold Fields Limited (NYSE: GFI) is a gold mining company based in South Africa. The company has nine operating mines in Australia, West Africa, South Africa, Peru, and Chile. The South Deep gold mine is one the largest gold mines in the world with reserves of over 81.4 million ounces of gold. The company ranks thirteenth on our list of the best gold mining stocks to invest in.
In Q1 2021, the revenue is driven by the company’s production level and sales from gold. Gold Fields Limited (NYSE: GFI) generated over $1.7 billion in revenue, presenting 14% year-over-year growth. The company produced 541,000 ounces of gold, showing 0.7% growth from the prior-year quarter. The gold production is in line with 2021 guidance of 2.3 to 2.35 million ounces. In the past year, the stock has delivered a 36% As of June, 5 analysts from WSJ rank the GFI stock as a ‘Buy’ with a price target of $12.2.
At the end of Q1 2021, 15 hedge funds tracked by Insider Monkey have positions in Gold Fields Limited (NYSE: GFI), worth $323 million. AQR Capital Management is the leading shareholder of the company with 12.4 million shares, worth $117 million.
Like Agnico Eagle Mines Limited (NYSE: AEM), Newmont Corporation (NYSE: NEM), and Franco-Nevada Corporation (NYSE: FNV), Gold Fields Limited (NYSE: GFI) is one of the best gold mining stocks to invest in.
12. Hecla Mining Company (NYSE: HL)
Number of Hedge Fund Holders: 16
Hecla Mining Company (NYSE: HL) is an American mining company that specializes in gold, silver, and other precious metals. The company has the largest reserve in the U.S. and produces a third of the country’s silver. Its operating mines are located in Alaska, Idaho, and Quebec, Canada.
In Q1 2021, Hecla Mining Company (NYSE: HL) reported a net income of $30.6 million, with an EPS of $0.06, beating the market consensus of $0.04. The company managed to generate the second-highest revenue in 130 years at $210 million, presenting 54% year-over-year growth. Sales from gold generated over $101 million, up from $90 million in the prior-year quarter, whereas revenue from silver stood at $77.7 million. In Q1, Hecla Mining Company (NYSE: HL) also increased its quarterly dividend by 28.4% at $0.0112 per share. The HL stock saw its all-time low in March 2020 due to the global market cash but recovered quickly, gaining over 124% in the past year. In June, RBC Capital maintained its price target of $10 on HL stock, ranking it as a ‘Buy’.
At the end of Q1 2021, we see that number of hedge funds having positions in Hecla Mining Company (NYSE: HL) increased to 16, compared with 10 in the previous quarter. The total value of these stakes is $39.7 million.
Like Barrick Gold Corporation (NYSE: GOLD), Alamos Gold Inc. (NYSE: AGI), and Wheaton Precious Metals Corp. (NYSE: WPM), Hecla Mining Company (NYSE: HL) is one of the best gold mining stocks to invest in.
11. Sibanye Stillwater Limited (NYSE: SBSW)
Number of Hedge Fund Holders: 16
Sibanye Stillwater Limited (NYSE: SBSW) is a mining company based in South Africa that mainly deals in gold, platinum, and palladium. The company is the largest producer of platinum and the third-largest producer of gold. In 2020, the company produced over 0.98 million ounces of gold with reserves of over 15.5 million ounces of gold. It ranks eleventh on our list of the best gold mining stocks to invest in.
In Q1 2021, Sibanye Stillwater Limited (NYSE: SBSW) reported strong earnings, presenting a 78% growth, compared with the same period last year. The revenue was recorded at $1.3 billion. The average prices for four platinum group metals PGM showed a 59% year-over-year growth, whereas the gold price grew by 8% in Q1.
The company produced over 249,392 ounces of gold, accounting for $92 million of the revenue. In 2021, Sibanye Stillwater Limited (NYSE: SBSW) expects the PM output to reach approximately 680,000 ounces from operations in the U.S. The stock’s performance has also remained consistent over the years, soaring by 87% in the past year. The company’s dividend policy states a payment of 25% to 35% of earnings to shareholders. Recently, RBC Capital raised its price target to $28, rating it as an 'Outperform'.
Like Hecla Mining Company (NYSE: HL), Wheaton Precious Metals Corp. (NYSE: WPM), Freeport-McMoRan Inc. (NYSE: FCX), Newmont Corporation (NYSE: NEM), Barrick Gold Corporation (NYSE: GOLD), Agnico Eagle Mines Limited (NYSE: AEM) and Franco-Nevada Corporation (NYSE: FNV), Sibanye Stillwater Limited (NYSE: SBSW) is one of the best gold mining stocks to buy now.
At the end of Q1 2021, 16 hedge funds tracked by Insider Monkey have positions in Sibanye Stillwater Limited (NYSE: SBSW), worth $272 million. AQR Capital Management is the biggest shareholder of the company with 5.2 million shares, worth $93.5 million.
Desert Lion Capital released its Q1 2021 investor letter and mentioned Sibanye Stillwater Limited (NYSE: SBSW) and other stocks. Here is what the firm has to say:
“Sibanye is a South African gold and platinum group metals (“PGM”) producer with mines in South Africa and the U.S. Established in 2012, it has since become one of South Africa’s largest gold producers and the largest PGM producer in the world. Sibanye also operate a PGM recycling facility and own a majority interest in DRDGOLD, a specialist in the recovery of gold and other precious metals from open pit tailings.
The investment thesis incorporates the following logic:
If central banks globally are going to continue printing money unabated, precious metals prices should rise.
The drive for cleaner and greener is accelerating. The market for platinum, palladium and rhodium is structurally attractive.
The company is generally mischaracterized. Ask around, and one will find that most people still refer to Sibanye as “a South African gold miner” with “lots of debt from that Stillwater acquisition.” (Click here to see the full text)
10. Royal Gold, Inc. (NASDAQ: RGLD)
Number of Hedge Fund Holders: 17
Royal Gold, Inc. (NASDAQ: RGLD) is an American metal stream and royalty company that mainly partners with operators in building their portfolio containing precious metal assets. The company deals in gold, silver, nickel, copper, cobalt, etc. Royal Gold, Inc. (NASDAQ: RGLD) has recently come in a $100 million contract with Ero Gold for gold production in its mine in Brazil. The company ranks tenth on our list of the best gold mining stocks to invest in.
In Q3 FY21, Royal Gold, Inc. (NASDAQ: RGLD) reported a net income of $55.2 million, up from $44.3 million during the same period last year. The EPS for the quarter stood at $0.84, beating the market estimate by $0.05. The revenue also saw 5% year-over-year growth at $142 million. The company generated 68% of the revenue from gold and 12% from silver. In Q3, Royal Gold, Inc. (NASDAQ: RGLD) also increased its dividend by 7% at $0.30 per share. The RGLD stock soared by 6.6% in the past six months and 5.7% year to date. Earlier in March, JP Morgan initiated its coverage of Royal Gold, Inc. (NASDAQ: RGLD) and ranked the stock ‘Overweight’ with a price target of $143.
At the end of Q1 2021, 17 hedge funds tracked by Insider Monkey have positions in Royal Gold, Inc. (NASDAQ: RGLD), worth $237 million.
Like Hecla Mining Company (NYSE: HL), Wheaton Precious Metals Corp. (NYSE: WPM), Freeport-McMoRan Inc. (NYSE: FCX), Newmont Corporation (NYSE: NEM), Barrick Gold Corporation (NYSE: GOLD), Agnico Eagle Mines Limited (NYSE: AEM) and Franco-Nevada Corporation (NYSE: FNV), Royal Gold, Inc. (NASDAQ: RGLD) is one of the best gold mining stocks to buy now.
Argosy Investors recently released its Q1 2021 investor letter and mentioned Royal Gold, Inc. (NASDAQ: RGLD) in it. Here is what the firm has to say:
“Gold royalties business achieve 2 objectives for us: 1) It’s a good business model with strong returns through the gold price cycle; and 2) it provides some protection from inflation, should it materialize due to the increasingly loose fiscal and monetary policy decisions the United States (and other developed market economies) is making.
I don’t want to stay on my soapbox for too long, but this is the first time in history that I’m aware of politicians openly stating that debt levels don’t matter, even in the long term. In 2019, the government spent $4.4 trillion. Of those expenditures, $0.4 trillion was spent making interest payments on existing debt at the time of $16.9 trillion. The interest rate on that debt was 2.4%. Debt for 2021 is projected to increase to $22.5 trillion, and then to $33 trillion by the end of the decade." (Click here to see the full text)
9. Franco-Nevada Corporation (NYSE: FNV)
Number of Hedge Fund Holders: 20
Franco-Nevada Corporation (NYSE: FNV) is a royalty and streaming company that specializes in gold mining. It has its headquarters in Toronto, Canada. In 2020, the company sold over 521,564 ounces of gold, which accounted for 91% of the total revenue. It ranks ninth on our list of the best gold mining stocks to invest in.
In Q1 2021, Franco-Nevada Corporation (NYSE: FNV) posted strong results, largely driven by mines’ expansion and exploration successes. The net income of the company presented 47% year-over-year growth at $160 million. The EPS for the quarter stood at $0.84, beating the market estimate by $0.03. The revenue also showed 38% growth, compared with Q1 2020 at $308.9 million. The sales from 107,500 ounces of gold accounted for $190 million, equivalent to 85% of the total revenue. Franco-Nevada Corporation (NYSE: FNV) also reported a 15.4% increase in the quarterly dividend to $0.30 per share. The company guided a 25% growth in revenue by 2026. After seeing its low in March 2020, the FNV stock has bounced back and gained over 11% in the past year. The stock has delivered a 6.46% return to shareholders in the past year. In May, National Bank raised its price target on FNV stock to $200, with a 'Sector Perform' rating.
At the end of Q1 2021, 20 hedge funds tracked by Insider Monkey have positions in Franco-Nevada Corporation (NYSE: FNV), worth $933 million. With 4.8 million shares, worth $606 million, Renaissance Technologies is the biggest shareholder of the company.
Like Alamos Gold Inc. (NYSE: AGI), Hecla Mining Company (NYSE: HL), and Newmont Corporation (NYSE: NEM), Franco-Nevada Corporation (NYSE: FNV) is one of the best gold mining stocks to invest in.
8. Alamos Gold Inc. (NYSE: AGI)
Number of Hedge Fund Holders: 22
Alamos Gold Inc. (NYSE: AGI) is a Canada-based gold producer with three operating mines in Canada and Mexico. The company has ongoing projects in the U.S., Turkey, Mexico, and Canada. As of December 2020, Alamos Gold Inc. (NYSE: AGI) has over 9.8 million ounces of mineral reserves, with gold reserves accounting for 3.3 million ounces.
In Q1 2021, Alamos Gold Inc. (NYSE: AGI) reported strong earnings, meeting the company’s guidance. The net earnings for the quarter stood at $49 million, up from $29 million during the same period last year. The EPS met the market consensus at $0.13. The company beat on revenue by $5.92 million at $227 million, presenting 28.5% year-over-year growth.
In Q1, Alamos Gold Inc. (NYSE: AGI) produced 125,000 ounces of gold, up 14% during the same period last year. In 2021, the company expects gold production to reach 470,000 to 510,000 ounces. Moreover, $208 million was paid to shareholders through dividends and repurchases. In May, National Bank raised its price target on AGI stock to $14.25, keeping an 'Outperform' rating.
Since 2018, Alamos Gold Inc. (NYSE: AGI) has reported a 400% growth in dividends and declared a quarterly dividend of $0.025 per share. In Q1 2021, the number of hedge funds having stakes in Alamos Gold Inc. (NYSE: AGI) increased to 22 from 17 in the previous quarter. The total value of these stakes is $267.9 million.
Like Hecla Mining Company (NYSE: HL), Wheaton Precious Metals Corp. (NYSE: WPM), Freeport-McMoRan Inc. (NYSE: FCX), Newmont Corporation (NYSE: NEM), Barrick Gold Corporation (NYSE: GOLD), Agnico Eagle Mines Limited (NYSE: AEM) and Franco-Nevada Corporation (NYSE: FNV), Alamos Gold Inc. (NYSE: AGI) is one of the best gold mining stocks to buy now.
7. Kirkland Lake Gold Ltd. (NYSE: KL)
Number of Hedge Fund Holders: 25
Kirkland Lake Gold Ltd. (NYSE: KL) is a gold mining company headquartered in Toronto, Canada. The company has operations in Canada and Australia. It is one of the largest gold mining companies which produced 1.3 million ounces of gold in 2020. The company ranks seventh on our list of the best gold mining stocks to invest in.
In Q1 2021, Kirkland Lake Gold Ltd. (NYSE: KL) reported net earnings of $167.8 million or $0.63 per share. The revenue for the quarter stood at $551.8 million. The gold production exceeded the guidance of 290,000 ounces and was recorded at 302,847 ounces. The strong earnings are driven by additional drilling at Detour Lake and enhanced exploration activities after Covid-19.
In 2021, the company’s production target is between 1.3 to 1.4 million ounces. In Q1, Kirkland Lake Gold Ltd. (NYSE: KL) returned $96.6 million to shareholders, $50.3 million of which was paid in dividends. Earlier in May, RBC Capital set a price target of $43 on KL stock, ranking it as a ‘Buy’. In 2021, the company’s production target is between 1.3 to 1.4 million ounces.
At the end of Q1 2021, 25 hedge funds tracked by Insider Monkey have positions in Kirkland Lake Gold Ltd. (NYSE: KL), worth $401 million. Renaissance Technologies is the biggest shareholder of the company with shares worth $108 million.
Like Hecla Mining Company (NYSE: HL), Wheaton Precious Metals Corp. (NYSE: WPM), Freeport-McMoRan Inc. (NYSE: FCX), Newmont Corporation (NYSE: NEM), Barrick Gold Corporation (NYSE: GOLD), Agnico Eagle Mines Limited (NYSE: AEM), Alamos Gold Inc. (NYSE: AGI) and Franco-Nevada Corporation (NYSE: FNV), Kirkland Lake Gold Ltd. (NYSE: KL) is one of the best gold mining stocks to buy now.
6. Kinross Gold Corporation (NYSE: KGC)
Number of Hedge Fund Holders: 27
Kinross Gold Corporation (NYSE: KGC) is another Canadian gold and silver mining company. It has mines and projects in several countries, including, Russia, the U.S., Chile, Brazil, Ghana, etc. In 2020, the company produced over 2.4 million ounces of gold, right in line with its guidance, successfully mitigating the effects of the pandemic.
In Q1 2021, Kinross Gold Corporation (NYSE: KGC) reported solid earnings with a 15% year-over-year growth in net income at $192.8 million. The EPS met the market estimate of $0.15. The company produced 558,777 ounces of gold, in line with 2021 guidance. Revenue also presented an 11% growth from Q1 2020 at $986.5 million.
Credit Suisse raised the price target on the stock to $8, asserting that Kinross Gold Corporation (NYSE: KGC) can benefit from the stocks repurchase in 2021 and ranked the stock as ‘Outperform’. The company announced a quarterly dividend of $0.03 per share.
At the end of Q1 2021, 27 hedge funds tracked by Insider Monkey have positions in Kinross Gold Corporation (NYSE: KGC). The total value of these stakes is $444 million. .
Like Hecla Mining Company (NYSE: HL), Wheaton Precious Metals Corp. (NYSE: WPM), Freeport-McMoRan Inc. (NYSE: FCX), Newmont Corporation (NYSE: NEM), Barrick Gold Corporation (NYSE: GOLD), Agnico Eagle Mines Limited (NYSE: AEM), Alamos Gold Inc. (NYSE: AGI) and Franco-Nevada Corporation (NYSE: FNV), Kinross Gold Corporation (NYSE: KGC) is one of the best gold mining stocks to buy now.
Click to continue reading and see the 5 Best Gold Mining Stocks to Invest In.
Suggested Articles:
Disclosure. None. 15 Best Gold Mining Stocks to Invest In was originally published on Insider Monkey.
Vancouver, British Columbia–(Newsfile Corp. – July 13, 2021) – First Majestic Silver Corp. (TSX: FR) (NYSE: AG) (FSE: FMV) ("First Majestic" or the "Company") announces that total production in the second quarter of 2021 from the Company's four producing operations, the San Dimas Silver/Gold Mine, the Santa Elena Silver/Gold Mine, the La Encantada Silver Mine and the recently acquired Jerritt Canyon Gold Mine, reached 6.4 million silver equivalent ounces consisting of 3.3 million ounces of silver and 46,545 ounces of gold. The Company's financial results for the second quarter of 2021 are scheduled to be released on Monday, August 16, 2021.
SECOND QUARTER HIGHLIGHTS
-
Total Production: The Company produced 6.4 million silver equivalent ounces consisting of 3.3 million ounces of silver and 46,545 ounces of gold, representing an increase of 13% and 95%, respectively, compared to the previous quarter primarily due to a 14% increase in silver equivalent production from the three operating Mexican mines and the inclusion of production from the Jerritt Canyon operation effective April 30, 2021.
-
LNG Power at Santa Elena: The Liquified Natural Gas ("LNG") facility at Santa Elena successfully reached full capacity after completing final ramp-up procedures in early May. Santa Elena is now the Company's second operation that has been fully converted from diesel to low-cost LNG power.
-
Stockpiling at Ermitaño: During the quarter, the Company began extracting low-grade mineralized material from the development of the test stope area from the Ermitaño deposit. As of July 5th, approximately 18,200 tonnes of mineralized material grading 2.2 g/t gold and 39 g/t silver have been placed in surface stockpiles. Over the next six months, an additional 40,000 to 50,000 tonnes of material is expected to be stockpiled on surface in anticipation of future processing at the Santa Elena processing plant in the first quarter of 2022.
-
Jerritt Canyon Acquisition Completed – Early Exploration Success: During the quarter, the Company completed the acquisition of the Jerritt Canyon Gold Mine adding a fourth producing operation to its growing portfolio of assets. Post-closing of the acquisition, drill hole WT-151 intersected 76.2 metres of 1.65 g/t gold, including 7.6 metres of 4.63 g/t gold, at Waterpipe II. This area of the property is developing into a target with open pit potential. Over the next six to 12 months, the Company has planned an aggressive exploration program to follow-up and test more than 25 near-mine and greenfield targets.
-
26 Active Drill Rigs: The Company completed a total of 53,608 metres in exploration drilling across the Company's mines during the quarter. At the end of the quarter, a total of 26 exploration drill rigs were active consisting of 13 rigs at San Dimas, five at Jerritt Canyon, six rigs at Santa Elena and two rigs at La Encantada.
"The second quarter marked a major milestone for First Majestic," stated Keith Neumeyer, President & CEO. "The acquisition of Jerritt Canyon not only gave us a new quarterly record in gold production, but it represents the Company's first major investment outside of Mexico. The overall integration process of this new mine is going well and has included several site management changes designed to grow this important operation to production levels not seen for over 15 years. Similar to our turnaround story of San Dimas, we are planning to bring significant improvements to Jerritt Canyon but it will require time and investments to complete. Lastly, the exploration potential across Jerritt Canyon's land package is extremely high for large, new discoveries and we are already planning to drill multiple exciting targets, such as Waterpipe II, over the next several quarters."
|
PRODUCTION TABLE |
Q2 |
Q2 |
Y/Y |
Q1 |
Q/Q |
|
2021 |
2020 |
Change |
2021 |
Change |
|
|
Ore processed/tonnes milled |
826,213 |
333,559 |
148% |
614,245 |
35% |
|
Silver ounces produced |
3,274,026 |
1,834,575 |
78% |
2,908,024 |
13% |
|
Gold ounces produced |
46,545 |
15,764 |
195% |
23,873 |
95% |
|
Silver equivalent ounces produced |
6,435,023 |
3,505,376 |
84% |
4,540,296 |
42% |
QUARTERLY REVIEW
Total ore processed during the quarter at the Company's mines amounted to 826,213 tonnes, representing a 35% increase compared to the previous quarter. The increase in tonnes processed was primarily due to the acquisition of the Jerritt Canyon operation on April 30, 2021 and a 26% increase in production rates at Santa Elena resulting from continued improvements in underground ore deliveries.
Consolidated silver and gold grades in the quarter averaged 137 g/t and 1.80 g/t, respectively. Gold grades increased significantly by 43% when compared to the prior quarter due to the addition of Jerritt Canyon and higher gold grades at Santa Elena and San Dimas in the quarter.
Consolidated silver and gold recoveries averaged 90% and 91%, respectively, during the quarter.
MINE BY MINE PRODUCTION TABLE
|
Mine |
Ore |
Tonnes |
Ag Grade |
Au Grade |
Ag |
Au |
Ag Oz |
Au Oz |
AgEq Oz |
|
San Dimas |
202,382 |
2,224 |
301 |
3.07 |
95% |
96% |
1,868,031 |
19,227 |
3,176,725 |
|
Jerritt Canyon |
146,611 |
2,365 |
– |
4.03 |
– |
84% |
– |
18,762 |
1,270,398 |
|
Santa Elena |
234,381 |
2,576 |
81 |
1.17 |
93% |
96% |
565,453 |
8,453 |
1,140,398 |
|
La Encantada |
242,839 |
2,669 |
138 |
0.02 |
78% |
90% |
840,541 |
102 |
847,502 |
|
Total |
826,213 |
9,079 |
137 |
1.80 |
90% |
91% |
3,274,026 |
46,545 |
6,435,023 |
*Jerritt Canyon production was over a 62 day period from April 30, 2021 to June 30, 2021.
*Certain amounts shown may not add exactly to the total amount due to rounding differences.
*The following prices were used in the calculation of silver equivalent ounces: Silver: $26.26 per ounce, Gold: $1,794 per ounce.
At the San Dimas Silver/Gold Mine:
-
San Dimas produced 1,868,031 ounces of silver and 19,227 ounces of gold representing an increase of 9% and 10%, respectively, compared to the prior quarter for total production of 3,176,725 silver equivalent ounces.
-
The mill processed a total of 202,382 tonnes with average silver and gold grades of 301 g/t and 3.07 g/t, respectively.
-
Silver and gold recoveries during the quarter averaged 95% and 96%, respectively.
-
The Central Block and Sinaloa Graben areas contributed approximately 62% and 28%, respectively, of the total production during the quarter. In addition, the Tayoltita, El Cristo and West Block areas contributed approximately 10% of total production in the quarter.
-
A total of 13 drill rigs, consisting of two surface rigs and 11 underground rigs, were active at the end of the quarter.
At the Jerritt Canyon Gold Mine:
-
Since taking control of Jerritt Canyon on April 30, 2021, the operation produced 18,762 ounces of gold during the months of May and June.
-
The mill processed a total of 146,611 tonnes with an average gold grade and recovery of 4.03 g/t and 84%, respectively. Increased ore development rates and lower ore grade from development activities resulted in higher tonnage with lower average ore grades processed in the plant. In the second half of the 2021, production rates at Jerritt Canyon are expected to average 2,250 tpd with estimated average gold grades of 5.30 g/t.
-
The SSX and Smith mines contributed approximately 51% and 28%, respectively, of the total production during the quarter. In addition, numerous surface areas contributed approximately 21% of total production during the quarter.
-
The Company has identified over 25 exploration drill targets that are currently permitted to drill or in the process of permitting. A key focus will be on the Waterpipe II area that has developed into a target with open pit potential. In June, drill hole WT-151 intersected 76.2 metres of 1.65 g/t gold, including 7.6 metres of 4.63 g/t gold, at Waterpipe II. Over the next six to 12 months, the Company has planned an aggressive exploration program to follow-up and test these high-priority, near-mine and greenfield targets.
-
During the quarter, the Company received permitting to lift tailings storage facility #2 ("TSF2"). Initial lift preparation and construction activities began in June with completion expected in the fourth quarter. The lift will provide over two years of additional deposition storage for tailing material at the site.
-
A total of five drill rigs, consisting of two surface rigs and three underground rigs, were active at the end of the quarter.
At the Santa Elena Silver/Gold Mine:
-
During the quarter, Santa Elena produced 565,453 ounces of silver and 8,453 ounces of gold representing an increase of 25% and 34%, respectively, compared to the prior quarter for total production of 1,140,398 silver equivalent ounces.
-
The mill processed a total of 234,381 tonnes consisting of 166,969 tonnes of underground ore and 67,412 tonnes from the existing heap leach pad. Underground production rates returned to normal operating levels following multiple improvements made in mining methods at the Main, Alejandra de Bajo and America veins.
-
Silver and gold grades from underground ore averaged 100 g/t and 1.39 g/t, respectively, while silver and gold grades from the heap leach pad averaged 33 g/t and 0.62 g/t, respectively.
-
Silver and gold recoveries averaged 93% and 96%, respectively, during the quarter.
-
Santa Elena's new LNG power plant reached designed operating rates in early May and is now supplying full power requirements to the Santa Elena operation. This conversion from diesel to LNG is expected to significantly reduce energy costs and greenhouse gas emissions in the second half of the year.
-
At the Ermitaño project near Santa Elena, the Company completed 1,618 metres of underground development during the quarter. Extraction of low-grade mineralized material from the development of the test stope area from the Ermitaño orebody began in the quarter with approximately 18,200 tonnes of mineralized material grading 2.2 g/t gold and 39 g/t silver being placed in surface stockpiles. Over the next six months, an additional 40,000 to 50,000 tonnes of material is expected to be stockpiled on surface in anticipation of future processing at the Santa Elena processing plant in the first quarter of 2022. In addition, construction supporting surface facilities and infrastructure, and the main access road connecting the new mine to the Santa Elena processing plant commenced.
-
A total of six drill rigs, consisting of three surface rigs and three underground rigs, were active at the end of the quarter.
At the La Encantada Silver Mine:
-
During the quarter, La Encantada processed 242,839 tonnes of ore and produced 840,541 ounces of silver, representing a 14% increase in ounces compared to the prior quarter.
-
Silver grades and recoveries during the quarter averaged 138 g/t and 78%, respectively.
-
The La Prieta and San Javier caving areas contributed approximately 73% and 3%, respectively, of the total production during the quarter. In addition, previously mined "Chorros" areas contributed approximately 24% of total production during the quarter.
-
A total of two drill rigs, consisting of one surface rig and one underground rig, were active at the end of the quarter.
-
Optimization of plant facilities and improvements to the La Encantada camp advanced during the second quarter, including work on installation of an additional LNG generator and LNG storage tanks.
JERRITT CANYON OPTIMIZATION PLANS
Given its extensive 40-year production history in Nevada, Jerritt Canyon is one of the state's most prominent gold mines. However, the operation has suffered from a lack of investment in exploration and development in recent years. First Majestic is planning to deploy capital towards exploration, underground development and plant optimization at the operation with the objective of increasing production rates, reducing costs and extending mine life of the asset.
Since the acquisition announcement in January 2021, First Majestic has been developing a long-term mine and exploration plan for the future of the operation. The Company has identified numerous projects that will be implemented over the next 12 to 24 months to improve production and reduce costs at the mine and processing plant, including:
-
Connect the two underground Smith and SSX producing mines with an underground development drift which will be used for future ore haulage and exploration activities
-
Obtain permit for potential pushbacks of past-producing open pits for future mill feed
-
Test over 25 high-priority exploration targets, both near-mine and greenfield
-
Evaluate ore purchase/toll milling opportunities with third parties to fill roaster excess capacity
-
Execute roaster debottleneck study for future expansion
-
Optimize water treatment plant for mine dewatering prioritization
-
Complete lift upgrade of TFS2 and develop a long-term TSF plan
It should be noted that many of the anticipated benefits from these modifications are not yet reflected in the forecasted operating results below and are expected to take several quarters to materialize.
OUTLOOK
Following the acquisition of the Jerritt Canyon operation, the Company has revised its annual production guidance to incorporate the following operational adjustments:
-
The addition of approximately 72,000 to 79,000 ounces of gold (or 5.1 to 5.6 million silver equivalent ounces) production in 2021 from Jerritt Canyon. On an annualized rate, Jerritt Canyon is projected to produce 104,000 to 110,000 ounces of gold (or 7.9 to 8.4 million silver equivalent ounces) without taking into account any of the anticipated benefits from the Company's optimization plans.
-
At San Dimas, plant throughput is expected to increase 8% to an average of 2,400 tpd in the second half of 2021 compared to 2,220 tpd in the first half of 2021. Silver and gold grades are expected to improve and average 342 g/t silver and 3.55 g/t gold in the second half of 2021 compared to 293 g/t silver and 2.95 g/t gold in the first half of 2021.
-
At Santa Elena, plant throughput is expected to increase 16% to an average of 2,700 tpd in the second half of 2021 compared to 2,319 tpd in the first half of 2021. Blended silver and gold grades from the heap leach pad together with fresh underground ore are expected to increase and average 95 g/t silver and 1.07 g/t gold in the second half of 2021 compared to 82 g/t silver and 1.14 g/t gold in the first half of 2021.
-
At La Encantada, plant throughput is expected to increase 5% to an average of 2,750 tpd in the second half of 2021 compared to 2,609 tpd in the first half of 2021. Silver grades are expected to average 146 g/t silver in the second half of 2021 compared to 134 g/t silver in the first half of 2021.
As a result of these operational modifications, total production in 2021 is expected to increase to a range of 25.7 to 27.5 million silver equivalent ounces consisting of 13.0 to 13.8 million ounces of silver and 181,000 to 194,000 ounces of gold. This compares to the previous annual production guidance of 20.6 to 22.9 million silver equivalent ounces consisting of 12.5 to 13.9 million ounces of silver and 100,000 to 112,000 ounces of gold.
The Company is also providing guidance for the second half of 2021 on a mine-by-mine basis below. Cash costs and AISC are on a per payable silver equivalent ounce. Metal price and foreign currency assumptions for calculating silver equivalent ounces were updated to the following: $25.00/oz for silver (previously $22.50/oz), $1,800/oz for gold (unchanged), MXN:USD 20:1 (unchanged). As result of the lower silver-to-gold ratio used in the updated guidance, the Company has reduced its estimated 2021 production by 0.9 million silver equivalent ounces.
GUIDANCE FOR SECOND HALF 2021
|
Silver Oz (M) |
Gold Oz (k) |
Silver Eqv Oz (M) |
Cash Cost |
AISC |
|
|
Silver: |
($ per AgEq oz) |
($ per AgEq oz) |
|||
|
San Dimas, Mexico |
4.0 – 4.5 |
43 – 48 |
7.1 – 7.9 |
7.39 – 7.84 |
10.43 – 11.21 |
|
Santa Elena, Mexico |
1.2 – 1.4 |
14 – 16 |
2.3 – 2.5 |
14.07 – 14.91 |
17.72 – 18.97 |
|
La Encantada, Mexico |
1.5 – 1.7 |
– |
1.5 – 1.7 |
13.29 – 14.08 |
15.57 – 16.60 |
|
Mexico Consolidated: |
6.7 – 7.6 |
57 – 64 |
10.9 – 12.1 |
9.81 – 11.29 |
14.86 – 16.86 |
|
Gold: |
($ per AuEq oz) |
($ per AuEq oz) |
|||
|
Jerritt Canyon, USA |
– |
54 – 60 |
3.9 – 4.3 |
1,365 – 1,447 |
1,816 – 1,949 |
|
Total Production |
($ per AgEq oz) |
($ per AgEq oz) |
|||
|
Consolidated |
6.7 – 7.6 |
111 – 124 |
14.8 – 16.4 |
12.20 – 13.60 |
17.57 – 19.53 |
*Certain amounts shown may not add exactly to the total amount due to rounding differences.
* Cash Costs and AISC are non-GAAP measures. Consolidated AISC includes general and administrative cost estimates and non-cash costs of $1.31 to $1.41 per payable silver equivalent ounce.
*Jerritt Canyon Gold's AISC includes the impact of $12.3 million investment in the TSF2 expansion lift, or $206 to $230 per AuEq ounce.
In the second half of 2021, the Company expects total production of between 14.8 to 16.4 million silver equivalent ounces consisting of 6.7 to 7.6 million ounces of silver and 111,000 to 124,000 ounces of gold. This represents a 44% increase to the midpoint of guidance when compared to 10.8 million silver equivalent ounces produced in the first half of 2021.
A mine-by-mine breakdown of the revised full year 2021 production guidance is included in the table below and assumes the same metal prices and foreign currency assumptions as stated previously.
GUIDANCE FOR FULL YEAR 2021
|
Silver Oz (M) |
Gold Oz (k) |
Silver Eqv Oz (M) |
Cash Cost |
AISC |
|
|
Silver: |
($ per AgEq oz) |
($ per AgEq oz) |
|||
|
San Dimas, Mexico |
7.6 – 8.1 |
80 – 85 |
13.2 – 14.0 |
8.51 – 8.82 |
12.04 – 12.56 |
|
Santa Elena, Mexico |
2.3 – 2.4 |
29 – 31 |
4.3 – 4.6 |
15.74 – 16.29 |
19.97 – 20.77 |
|
La Encantada, Mexico |
3.1 – 3.3 |
– |
3.1 – 3.3 |
13.39 – 13.78 |
15.73 – 16.25 |
|
Mexico Consolidated: |
13.0 – 13.8 |
109 – 115 |
20.6 – 21.9 |
10.75 – 11.12 |
15.77 – 16.43 |
|
Gold: |
($ per AuEq oz) |
($ per AuEq oz) |
|||
|
Jerritt Canyon, USA |
– |
72 – 79 |
5.1 – 5.6 |
1,381 – 1,443 |
1,785 – 1,881 |
|
Total Production |
($ per AgEq oz) |
($ per AgEq oz) |
|||
|
Consolidated |
13.0 – 13.8 |
181 – 194 |
25.7 – 27.5 |
12.52 – 12.96 |
17.86 – 18.63 |
*Certain amounts shown may not add exactly to the total amount due to rounding differences.
* Cash Costs and AISC are non-GAAP measures. Consolidated AISC includes general and administrative cost estimates and non-cash costs of $1.26 to $1.32 per payable silver ounce.
*Jerritt Canyon Gold's AISC includes the impact of the $12.3 million investment in the TSF2 expansion lift, or $157 to $170 per AuEq ounce.
Annual cash costs are now expected to be within the range of $12.52 to $12.96 per ounce, compared to the previous guidance of $9.52 to $10.10 per ounce, primarily due to the addition of the Jerritt Canyon operation and higher development costs at Santa Elena. In addition, annual all-in sustaining costs are now expected to be within a range of $17.86 to $18.63 per ounce, compared to the previous guidance of $14.81 to $15.99 per ounce. Many of the anticipated cost benefits at Jerritt Canyon are not yet reflected in the forecasted operating results above and is expected to take several quarters to materialize.
REVISED CAPITAL BUDGET
The Company has updated its 2021 capital budget to include the Jerritt Canyon operation as well as the reallocation of capital for development and exploration across its operations. As a result, total capital investments for 2021 are now estimated at $205.3 million, consisting of $84.2 million for sustaining requirements and $121.1 million for expansionary projects. This represents a 22% increase compared to the original 2021 capital budget of $168.4 million primarily due to the inclusion of the Jerritt Canyon operation and additional investments in underground development at Santa Elena. The revised budget includes $92.2 million to be spent on underground development, $52.9 million towards property, plant and equipment, $35.1 million in exploration and $25.2 million towards corporate projects. On a mine-by-mine basis, capital expenditures in the second half of 2021 are estimated to be $23.0 million at San Dimas, $34.4 million at Jerritt Canyon, $36.6 million at Santa Elena (includes $22.7 million at Ermitaño) and $6.1 million at La Encantada.
|
Revised 2021 Capital Budget ($millions) |
Sustaining |
Expansionary |
Total |
|
Underground Development |
47.1 |
45.1 |
92.2 |
|
Exploration |
0.5 |
34.6 |
35.1 |
|
Property, Plant and Equipment |
33.7 |
19.2 |
52.9 |
|
Corporate Projects |
3.0 |
22.2 |
25.2 |
|
Total |
$84.2 |
$121.1 |
$205.3 |
*Certain amounts shown may not add exactly to the total amount due to rounding differences.
Under the revised 2021 budget, the Company is now expecting to complete a total of 50,495 metres of underground development, representing a 7% increase compared to the original budget of 47,000 metres. In addition, the Company is now planning to complete a total of approximately 217,600 metres of exploration drilling in 2021, representing a 18% increase compared to the original budget of 184,150 metres, primarily due the addition of approximately 52,800 metres of exploration drilling planned at Jerritt Canyon.
APPOINTMENT OF NEW DIRECTOR
The Board of Directors have appointed Colette Rustad as a Director of the Company effective July 1, 2021.
Ms. Rustad is an international financial expert with over 30 years of diverse financial and operational experience, including mergers and acquisitions, project construction, risk management and advisory expertise in the mining, financial services, energy and technology sectors.
She currently serves as a director of the Sanford Housing Society, previously served as a director for Terrane Metals and held executive positions at Barrick Africa, VP & CFO; Goldcorp Inc, Senior Vice-President Treasurer and Controller; EY Toronto, Senior Manager and Alio Gold, EVP & CFO. She is a Chartered Professional Accountant (CA) and has a Bachelor of Commerce from the University of Calgary and completed the Advanced Management Program from the Wharton Graduate School of Business, University of Pennsylvania.
CONFERENCE CALL
The Company will be holding a conference call and webcast tomorrow, Wednesday, July 14, 2021 at 8am PDT (11 am EDT).
To participate in the conference call, please dial the following:
Toll Free Canada & USA: 1-800-319-4610
Outside of Canada & USA: 1-604-638-5340
Toll Free Germany: 0800 180 1954
Toll Free UK: 0808 101 2791
Participants should dial in 10 minutes prior to the conference. Click on WEBCAST on the First Majestic homepage as a simultaneous audio webcast of the conference call will be posted at www.firstmajestic.com.
The conference call will be recorded and you can listen to an archive of the conference by calling:
Canada & USA Toll Free: 1-800-319-6413
Outside Canada & USA: 1-604-638-9010
Access Code: 7343 followed by the # sign
The replay will be available approximately one hour after the conference and will available for 7 days following the conference. The replay will also be available on the Company's website for one month.
Q2 EARNINGS AND DIVIDEND ANNOUNCEMENT
The Company is planning to release its second quarter 2021 unaudited financial results, and to announce the second quarter dividend payment, and shareholder record and payable dates on Monday, August 16, 2021.
ABOUT THE COMPANY
First Majestic is a publicly traded mining company focused on silver and gold production in Mexico and the United States and is aggressively pursuing the development of its existing mineral property assets. The Company presently owns and operates the San Dimas Silver/Gold Mine, the Santa Elena Silver/Gold Mine, the La Encantada Silver Mine and the Jerritt Canyon Gold Mine.
FOR FURTHER INFORMATION contact info@firstmajestic.com, visit our website at www.firstmajestic.com or call our toll-free number 1.866.529.2807.
FIRST MAJESTIC SILVER CORP.
"signed"
Keith Neumeyer, President & CEO
Cautionary Note Regarding Forward Looking Statements
This press release contains "forward‐looking information" and "forward-looking statements" under applicable Canadian and U.S. securities laws (collectively, "forward‐looking statements"). These statements relate to future events or the Company's future performance, business prospects or opportunities that are based on forecasts of future results, estimates of amounts not yet determinable and assumptions of management made in light of management's experience and perception of historical trends, current conditions and expected future developments. Forward-looking statements include, but are not limited to, statements with respect to: the Company's business strategy; future planning processes; commercial mining operations; cash flow; budgets; the timing and amount of estimated future production; ore grades; recovery rates; mine plans and mine life; integration of operations; the future price of silver and other metals; costs of production; costs and timing of development at the Company's projects; reduction of costs and emissions as a result of adoption of LNG power; capital projects and exploration activities and the possible results thereof; optimization plans at the Jerritt Canyon mine and the anticipated benefits thereof. Assumptions may prove to be incorrect and actual results may differ materially from those anticipated. Consequently, guidance cannot be guaranteed. As such, investors are cautioned not to place undue reliance upon guidance and forward-looking statements as there can be no assurance that the plans, assumptions or expectations upon which they are placed will occur. All statements other than statements of historical fact may be forward‐looking statements. Statements concerning proven and probable mineral reserves and mineral resource estimates may also be deemed to constitute forward‐looking statements to the extent that they involve estimates of the mineralization that will be encountered as and if the property is developed, and in the case of measured and indicated mineral resources or proven and probable mineral reserves, such statements reflect the conclusion based on certain assumptions that the mineral deposit can be economically exploited. Any statements that express or involve discussions with respect to predictions, expectations, beliefs, plans, projections, objectives or future events or performance (often, but not always, using words or phrases such as "seek", "anticipate", "plan", "continue", "estimate", "expect", "may", "will", "project", "predict", "forecast", "potential", "target", "intend", "could", "might", "should", "believe" and similar expressions) are not statements of historical fact and may be "forward‐looking statements".
Actual results may vary from forward-looking statements. Forward-looking statements are subject to known and unknown risks, uncertainties and other factors that may cause actual results to materially differ from those expressed or implied by such forward-looking statements, including but not limited to: the duration and effects of the coronavirus and COVID-19, and any other pandemics on our operations and workforce, and the effects on global economies and society, risks related to the integration of acquisitions; actual results of exploration activities; conclusions of economic evaluations; changes in project parameters as plans continue to be refined; commodity prices; variations in ore reserves, grade or recovery rates; actual performance of plant, equipment or processes relative to specifications and expectations; accidents; labour relations; relations with local communities; changes in national or local governments; changes in applicable legislation or application thereof; delays in obtaining approvals or financing or in the completion of development or construction activities; exchange rate fluctuations; requirements for additional capital; government regulation; environmental risks; reclamation expenses; outcomes of pending litigation; limitations on insurance coverage as well as those factors discussed in the section entitled "Description of the Business – Risk Factors" in the Company's most recent Annual Information Form, available on www.sedar.com, and Form 40-F on file with the United States Securities and Exchange Commission in Washington, D.C. Although First Majestic has attempted to identify important factors that could cause actual results to differ materially from those contained in forward-looking statements, there may be other factors that cause results not to be as anticipated, estimated or intended.
The Company believes that the expectations reflected in these forward‐looking statements are reasonable, but no assurance can be given that these expectations will prove to be correct and such forward‐looking statements included herein should not be unduly relied upon. These statements speak only as of the date hereof. The Company does not intend, and does not assume any obligation, to update these forward-looking statements, except as required by applicable laws.

To view the source version of this press release, please visit https://www.newsfilecorp.com/release/90034
VANCOUVER, BC, July 13, 2021 /PRNewswire/ – Silvercorp Metals Inc. ("Silvercorp" or the "Company") (TSX: SVM) (NYSE American: SVM) reports production and sales figures for the first quarter of fiscal year 2022 ended June 30, 2021 ("Q1 Fiscal 2022"). The Company expects to release its Q1 Fiscal 2022 unaudited financial results on Thursday, August 5, 2021 after market close.

In Q1 Fiscal 2022, the Company produced approximately 1.5 million ounces of silver, 1,000 ounces of gold, 15.9 million pounds of lead, and 7.2 million pounds of zinc, and sold approximately 1.6 million ounces of silver, 1,000 ounces of gold, 16.8 million pounds of lead, and 7.3 million pounds of zinc, representing decreases of 12%, 9%, and 20%, respectively, in silver, gold and lead sold, and an increase of 4% in zinc sold over the first quarter of fiscal 2021 ("Q1 Fiscal 2021").
The production decline in the current quarter resulted mainly from the Company's mining contracts renewal negotiations at the Ying Mining District. As reported in the Company's news release dated April 28, 2021, the Company's two-year mining contracts with the eight mining contractors at the Ying Mining District expired on March 31, 2021 and the parties reached a temporary two-month extension. During negotiations, some contract workers took breaks or left due to the uncertainty which caused some disruption to mining activities. When the contracts were renewed for an additional two year term in mid May 2021, it took some time for the contractors to bring back all their workers and ramp the operations back up to full capacity. Notwithstanding the production decline in Q1 Fiscal 2022, the Company expects to increase production in the remaining three quarters and meet its annual guidance to produce between 6.3 – 6.6 million ounces of silver, 65.7 – 68.9 million pounds of lead, and 26.9 – 28.5 million pounds of zinc in Fiscal 2022.
Q1 FISCAL 2022 OPERATING HIGHLIGHTS
-
At the Ying Mining District, ore mined was 142,907 tonnes, down 18% compared to Q1 Fiscal 2021, and ore milled was 155,407 tonnes, down 13% over Q1 Fiscal 2021. Approximately 1.3 million ounces of silver, 1,000 ounces of gold, 13.3 million pounds of lead, and 1.5 million pounds of zinc were produced, representing production decreases of 17% in silver, 9% in gold, 22% in lead, and 21% in zinc over Q1 Fiscal 2021.
-
At the GC Mine, ore mined was 88,328 tonnes, up 10% over Q1 Fiscal 2021, and ore milled was 87,670 tonnes, up 4% over Q1 Fiscal 2021. Approximately 190 thousand ounces of silver, 2.6 million pounds of lead, and 5.7 million pounds of zinc were produced, representing an increase of 1% in zinc production, and decreases of 9% and 17% in silver and lead production over Q1 Fiscal 2021.
-
On a consolidated basis, ore mined was 231,235 tonnes, down 9% over Q1 Fiscal 2021, and ore milled was 243,077 tonnes, down 7% over Q1 Fiscal 2021. Approximately 1.5 million ounces of silver, 1,000 ounces of gold, 15.9 million pounds of lead, and 7.2 million pounds of zinc were produced, down 16%, 9%, 21%, and 4%, respectively, over Q1 Fiscal 2021.
-
On a consolidated basis, the Company sold approximately 1.6 million ounces of silver, 1,000 ounces of gold, 16.8 million pounds of lead, and 7.3 million pounds of zinc, representing decreases of 12%, 9%, and 20%, respectively, in silver, gold and lead sold, and an increase of 4% in zinc sold over Q1 Fiscal 2021.
The operational results for Q1 Fiscal 2022 are summarized as follows:
|
Three months ended June 30, 2021 |
Three months ended June 30, 2020 |
||||||||
|
Ying Mining |
GC |
Consolidated |
Ying Mining |
GC |
Consolidated |
||||
|
Production Data |
|||||||||
|
Ore Mined (tonne) |
142,907 |
88,328 |
231,235 |
174,176 |
80,379 |
254,555 |
|||
|
Ore Milled (tonne) |
155,407 |
87,670 |
243,077 |
177,689 |
84,637 |
262,326 |
|||
|
Head Grades |
|||||||||
|
Silver (gram/tonne) |
279 |
80 |
207 |
293 |
93 |
228 |
|||
|
Lead (%) |
4.2 |
1.5 |
3.2 |
4.6 |
1.9 |
3.7 |
|||
|
Zinc (%) |
0.8 |
3.3 |
1.7 |
0.8 |
3.4 |
1.6 |
|||
|
Recovery Rates |
|||||||||
|
Silver (%) |
94.7 |
84.1 |
93.2 |
94.7 |
82.8 |
93.1 |
|||
|
Lead (%) |
95.7 |
89.3 |
94.6 |
96.2 |
89.8 |
95.1 |
|||
|
Zinc (%) |
59.7 |
89.3 |
80.7 |
63.8 |
87.3 |
79.5 |
|||
|
Metal production |
|||||||||
|
Silver (in thousands of ounces) |
1,283 |
190 |
1,474 |
1,543 |
209 |
1,752 |
|||
|
Gold (in thousands of ounces) |
1.0 |
– |
1.0 |
1.1 |
– |
1.1 |
|||
|
Lead (in thousands of pounds) |
13,278 |
2,600 |
15,878 |
16,941 |
3,136 |
20,077 |
|||
|
Zinc (in thousands of pounds) |
1,519 |
5,679 |
7,198 |
1,920 |
5,613 |
7,533 |
|||
|
Metal sold |
|||||||||
|
Silver (in thousands of ounces) |
1,447 |
195 |
1,642 |
1,672 |
200 |
1,872 |
|||
|
Gold (in thousands of ounces) |
1.0 |
– |
1.0 |
1.1 |
– |
1.1 |
|||
|
Lead (in thousands of pounds) |
14,175 |
2,635 |
16,810 |
17,779 |
3,106 |
20,885 |
|||
|
Zinc (in thousands of pounds) |
1,521 |
5,734 |
7,255 |
2,037 |
4,921 |
6,958 |
|||
Ying Mining District
In Q1 Fiscal 2022, ore mined at the Ying Mining District was 142,907 tonnes, a decrease of 18%, compared to 174,176 tonnes in Q1 Fiscal 2021. Ore milled was 155,407 tonnes, with average head grades of 279 grams per tonne ("g/t") for silver, 4.2% for lead, and 0.8% for zinc, compared to 177,689 tonnes of ore milled with average head grades of 293 g/t for silver, 4.6% for lead, and 0.8% for zinc in Q1 Fiscal 2021. Metals production was approximately 1.3 million ounces of silver, 1,000 ounces of gold, 13.3 million pounds of lead, and 1.5 million pounds of zinc, compared to approximately 1.5 million ounces of silver, 1,100 ounces of gold, 16.9 million pounds of lead, and 1.9 million pounds of zinc in Q1 Fiscal 2021. The decrease was mainly due to the mining disruptions arising from the mining contracts renewal negotiations as discussed above.
GC Mine
In Q1 Fiscal 2022, ore mined at the GC Mine was 88,328 tonnes, an increase of 10% compared to 80,379 tonnes in Q1 Fiscal 2021. Ore milled was 87,670 tonnes, with average head grades of 80 g/t for silver, 1.5% for lead, and 3.3% for zinc, compared to 84,637 tonnes of ore milled with average head grades of 93 g/t for silver, 1.9% for lead and 3.4% for zinc in Q1 Fiscal 2021. Metals production was approximately 190 thousand ounces of silver, 2.6 million pounds of lead, and 5.7 million pounds of zinc, compared to approximately 209 thousand ounces of silver, 3.1 million pounds of lead, and 5.6 million pounds of zinc in Q1 Fiscal 2021.
About Silvercorp
Silvercorp is a profitable Canadian mining company producing silver, lead and zinc metals in concentrates from mines in China. The Company's goal is to continuously create healthy returns to shareholders through efficient management, organic growth and the acquisition of profitable projects. Silvercorp balances profitability, social and environmental relationships, employees' wellbeing, and sustainable development. For more information, please visit our website at www.silvercorp.ca.
CAUTIONARY DISCLAIMER – FORWARD-LOOKING STATEMENTS
Certain of the statements and information in this news release constitute "forward-looking statements" within the meaning of the United States Private Securities Litigation Reform Act of 1995 and "forward-looking information" within the meaning of applicable Canadian provincial securities laws (collectively, "forward-looking statements"). Any statements or information that express or involve discussions with respect to predictions, expectations, beliefs, plans, projections, objectives, assumptions or future events or performance (often, but not always, using words or phrases such as "expects", "is expected", "anticipates", "believes", "plans", "projects", "estimates", "assumes", "intends", "strategies", "targets", "goals", "forecasts", "objectives", "budgets", "schedules", "potential" or variations thereof or stating that certain actions, events or results "may", "could", "would", "might" or "will" be taken, occur or be achieved, or the negative of any of these terms and similar expressions) are not statements of historical fact and may be forward-looking statements. Forward-looking statements relate to, among other things: the price of silver and other metals; the accuracy of mineral resource and mineral reserve estimates at the Company's material properties; the sufficiency of the Company's capital to finance the Company's operations; estimates of the Company's revenues and capital expenditures; estimated production from the Company's mines in the Ying Mining District and the GC Mine; timing of receipt of permits and regulatory approvals; availability of funds from production to finance the Company's operations; and access to and availability of funding for future construction, use of proceeds from any financing and development of the Company's properties.
Forward-looking statements are subject to a variety of known and unknown risks, uncertainties and other factors that could cause actual events or results to differ from those reflected in the forward-looking statements, including, without limitation, risks relating to: social and economic impacts of COVID-19; fluctuating commodity prices; calculation of resources, reserves and mineralization and precious and base metal recovery; interpretations and assumptions of mineral resource and mineral reserve estimates; exploration and development programs; feasibility and engineering reports; permits and licences; title to properties; property interests; joint venture partners; acquisition of commercially mineable mineral rights; financing; recent market events and conditions; economic factors affecting the Company; timing, estimated amount, capital and operating expenditures and economic returns of future production; integration of future acquisitions into the Company's existing operations; competition; operations and political conditions; regulatory environment in China and Canada; environmental risks; foreign exchange rate fluctuations; insurance; risks and hazards of mining operations; key personnel; conflicts of interest; dependence on management; internal control over financial reporting; and bringing actions and enforcing judgments under U.S. securities laws.
This list is not exhaustive of the factors that may affect any of the Company's forward-looking statements. Forward-looking statements are statements about the future and are inherently uncertain, and actual achievements of the Company or other future events or conditions may differ materially from those reflected in the forward-looking statements due to a variety of risks, uncertainties and other factors, including, without limitation, those referred to in the Company's Annual Information Form under the heading "Risk Factors". Although the Company has attempted to identify important factors that could cause actual results to differ materially, there may be other factors that cause results not to be as anticipated, estimated, described or intended. Accordingly, readers should not place undue reliance on forward-looking statements.
The Company's forward-looking statements are based on the assumptions, beliefs, expectations and opinions of management as of the date of this news release, and other than as required by applicable securities laws, the Company does not assume any obligation to update forward-looking statements if circumstances or management's assumptions, beliefs, expectations or opinions should change, or changes in any other events affecting such statements. For the reasons set forth above, investors should not place undue reliance on forward-looking statements.

View original content to download multimedia:https://www.prnewswire.com/news-releases/silvercorp-reports-operational-results-and-the-financial-results-release-date-for-the-first-quarter-of-fiscal-2022-301332971.html
SOURCE Silvercorp Metals Inc
Past exploration confirmed near surface gold-silver deposit open to expansion
Vancouver, British Columbia–(Newsfile Corp. – July 12, 2021) – Inomin Mines Inc. (TSXV: MINE) is pleased to announce the filing of a technical report ("Technical Report"), in accordance with National Instrument 43-101 Standards of Disclosure for Mineral Projects ("NI 43-101"), for the company's La Gitana Gold-Silver property in Mexico.
Highlights
-
Previous core drilling confirmed La Gitana hosts a significant gold-silver deposit
-
Initial 38 holes drilled with grades ranging from 0.25 to 27.8 g/t gold and 5 to 2,330 g/t silver
-
Discovery drill hole intersected 133.5 metres (438 feet) of 1.78 g/t gold and 100.7 g/t silver
-
Gold-silver mineralization is open to the southeast, at depth, and laterally
-
Property prospective for near-surface bulk-tonnage and underground gold-silver deposits
The La Gitana gold-silver property is located in Oaxaca State in southern Mexico. The property is situated within the Oaxaca Gold-Silver Belt, a major northwest trending regional structure hosting several operating precious metals mines and prospects including Gold Resource's Arista and Mirador gold-silver mines, and Fortuna Silver's San Jose gold-silver mine.
La Gitana is an advanced, gold-silver exploration project where exploration, including surface mapping, surface rock sampling, IP-resistivity geophysics, as well as diamond drilling, has delineated a substantial near-surface, low-sulphidation, epithermal gold-silver mineral system. The gold-silver mineralization is open to expansion to the southeast and at depth from drill-tested areas.
Previous drilling programs at La Gitana in 2004 – 2006 by Chesapeake Gold Corp. (TSXV: CKG), intersected gold-silver mineralization in a core zone 400 to 500 metres long, 50 to 150 metres wide and 50 to 300 metres depth, with grades ranging from 0.25 to 27.8 g/t gold and 5 to 2,330 g/t silver.
Gold and silver mineralization is found in high-grade shoots in northwest trending, sub-vertical structures, and as low-grade disseminations within broad zones of quartz stockworks and breccias. The main structure has been traced for more than 1.4 kilometres up to 300 metres wide and a vertical extension of approximately 400 metres. Structures dip steeply between 70° and 90°. Gold and silver are present as electrum and acanthite within epithermal quartz veins.
A second less developed zone is located approximately 300 metres south of the main zone, as defined by soil geochemistry, channel sampling, and minimal drill testing. Mineralization also appears open laterally: to the east surface veins have not been drill tested; to the west is an untested overburden covered area.
The Technical Report authors believe that sufficient exploration has been completed at La Gitana to confirm the existence of a gold-silver deposit. A two phase exploration program including drilling is recommended at La Gitana to determine the scope of the mineralization and complete a preliminary resource calculation.
Initial communication with the local community has been encouraging. The company looks forward to continuing to build a positive working relationship with all stakeholders.
John Gomez, President of Inomin says, "La Gitana provides the opportunity to define and develop a substantial gold-silver deposit. We look forward to advancing the project to create significant benefits for all stakeholders."
The La Gitana technical report and other information on the project is available on Inomin's website www.inominmines.com.
Inomin Mines Director, L. John Peters P.Geo, a qualified person as defined by NI 43-101, has reviewed and approved the technical information in this news release.
About Inomin Mines
Inomin Mines is engaged in the identification, acquisition and exploration of mineral properties, especially gold, silver and nickel projects that display strong potential to host significant mineral resources. Inomin holds the La Gitana and Pena Blanca gold-silver properties in Mexico. The company owns a 100% interest in the Beaver-Lynx sulphide nickel project in south-central British Columbia, and the Fleetwood zinc-copper-gold-silver VMS project in south-west British Columbia. Inomin also owns 100% of the King's Point gold-copper-zinc project in Newfoundland under option to Maritime Resources Corp. Inomin trades on the TSX Venture Exchange under the symbol MINE. For more information visit www.inominmines.com and follow us on Twitter @InominMines.
On behalf of the board of Inomin Mines:
Inomin Mines Inc.
Per: "John Gomez"
President and CEO
For more information please contact:
John Gomez
Tel. 604.566.8703
info@inominmines.com
Forward-Looking Statements: This news release contains certain statements that may be deemed "forward-looking statements". Forward-looking statements are statements that are not historical facts and are generally, but not always, identified by the words "expects", "plans", "anticipates", "believes", "intends", "estimates", "projects", "potential" and similar expressions, or that events or conditions "will", "would", "may", "could" or "should" occur. Although the Company believes the expectations expressed in such forward-looking statements are based on reasonable assumptions, such statements are not guarantees of future performance and actual results or realities may differ materially from those in forward-looking statements. Forward-looking statements are based on the beliefs, estimates and opinions of the Company's management on the date the statements are made. Except as required by law, the Company undertakes no obligation to update these forward-looking statements in the event that management's beliefs, estimates or opinions, or other factors, should change.
Neither TSX Venture Exchange nor its Regulation Services Provider (as that term is defined in the policies of the TSX Venture Exchange) accepts responsibility for the adequacy or accuracy of this release.

To view the source version of this press release, please visit https://www.newsfilecorp.com/release/89918
This news release constitutes a "designated news release" for the purposes of the Company's prospectus supplement dated May 17, 2021 to its short form base shelf prospectus dated January 29, 2021.
TORONTO, July 12, 2021–(BUSINESS WIRE)–Americas Gold and Silver Corporation (TSX: USA) (NYSE American: USAS) ("Americas" or the "Company"), a growing North American precious metals producer, is pleased to provide an exploration update for the Galena Complex and corporate update.
This press release features multimedia. View the full release here: https://www.businesswire.com/news/home/20210712005267/en/

Figure 1: Phase 2 Exploration Targets (Section looking North) (Graphic: Americas Gold and Silver Corporation)
Highlights
-
Phase 1 drilling of the Recapitalization Plan is complete and the results will be incorporated into the updated mineral reserve and resource estimates expected before the end of August 2021.
-
Targeted mineral resource additions through June 2021 of least 50 million ounces of silver, on a 100% basis for the property.
-
Initial 21-hole drill program targeting the downdip extension of the prolific Silver Vein all hit high grade mineralization and is now complete. Highlighted recent drill results include:
-
Hole 55-183: 3,345 g/t silver and 2.8% copper (3,633 g/t silver equivalent [1]) over 3.8 m [2]
including: 13,800 g/t silver and 11.1% copper (14,900 g/t silver equivalent) over 0.5 m -
Hole 55-143: 2,460 g/t silver and 2.1% copper (2,680 g/t silver equivalent) over 4.1 m
including: 7,060 g/t silver and 5.4% copper (7,620 g/t silver equivalent) over 0.6 m -
Hole 55-184: 3,966 g/t silver and 4.0% copper (4,372 g/t silver equivalent) over 2.2 m
including: 7,610 g/t silver and 7.6% copper (8,390 g/t silver equivalent) over 0.5 m
-
-
Phase 2 drill program expected to start in Q3-2021 and will initially target extensions of the three south-east plunging veins at depth (72 Vein, Silver Vein and 360 Complex) from the first of several planned drill stations further east to determine the extent and potential source of these similar vein structures. In addition, the Company will also target the Vulcan Gap, which is located between surface and the 2400-Level.
-
Targeted resource growth from the Phase 2 drilling program is an additional 50 million ounces of silver resources, on a 100% basis for the property.
"The Phase 1 drilling at the Galena Complex has been a tremendous success," stated Americas Gold and Silver President & CEO Darren Blasutti. "I am excited for the results to be incorporated into the updated mineral reserve and resource estimates for the Galena Complex which I believe will continue to showcase the resource potential when capital is allocated to drilling. The recent drilling of the Silver Vein has been remarkable and I believe the Phase 2 drilling will continue to demonstrate the potential of the property at depth."
Galena Update
The Company has completed the Phase 1 drilling program as part of the Galena Complex Recapitalization Plan. The Company’s most recent mineral resource update, which was released in September 2020, already demonstrated the significant exploration potential at the property with Measured and Indicated Resource increasing by 36% and Inferred Resource increasing by 100%.
The Company expects to provide an updated Mineral Resource estimate by the end of August 2021. The Company is confident that based on the continued exploration success, from drilling completed during July 2020 through June 2021, that the resource estimates will increase by the Company’s target for over 50 million ounces of silver, when considering Galena on an 100% basis.
The Company expects 2021 to be a transitional year at the Galena Complex from a production standpoint with continued exploration drilling supporting production growth toward a 2 million silver ounce per year plan by the end of 2022. Longer term, and assuming continued exploration success, the Company is confident that the operation will again reach peak historical annual production levels of approximately 5 million ounces per year.
Continued Exploration Success of Deep Extension of Silver Vein
The initial 21-hole drill program targeting the newly discovered Silver Vein at depth is complete with all holes intersecting mineralization. Most recent high-grade results include:
-
Hole 55-183: 3,345 g/t silver and 2.8% copper (3,633 g/t silver equivalent) over 3.8 m
including: 13,800 g/t silver and 11.1% copper (14,900 g/t silver equivalent) over 0.5 m -
Hole 55-143: 2,460 g/t silver and 2.1% copper (2,680 g/t silver equivalent) over 4.1 m
including: 7,060 g/t silver and 5.4% copper (7,620 g/t silver equivalent) over 0.6 m -
Hole 55-184: 3,966 g/t silver and 4.0% copper (4,372 g/t silver equivalent) over 2.2 m
including: 7,610 g/t silver and 7.6% copper (8,390 g/t silver equivalent) over 0.5 m -
Hole 55-173: 1,747 g/t silver and 2.0% copper (1,968 g/t silver equivalent) over 1.5 m
including: 12,400 g/t silver and 16.2% copper (14,100 g/t silver equivalent) over 0.1 m -
Hole 55-181: 1,185 g/t silver and 1.4% copper (1,330 g/t silver equivalent) over 1.9 m
and: 738 g/t silver and 0.5% lead (790 g/t silver equivalent) over 2.1 m -
Hole 55-186: 2,264 g/t silver and 3.1% copper (2,588 g/t silver equivalent) over 0.5 m
A full table of drill results can be found at:
https://americas-gold.com/site/assets/files/4297/dr20210712.pdf.
Phase 2 Exploration Program
The Phase 2 drill program is expected to start in Q3-2021 with several targets identified. Drilling at depth will continue to focus on the three south-east plunging veins which include the 72 Vein, the Silver Vein and what is believed to be the top of the 360 Complex. Drilling will commence from a newly developed drill station further east on the 5500-Level to continue to test the extension of the Silver Vein at depth following the success of the initial 21-hole drill program. Subsequent drill stations are planned further east on the 5500-Level to continue to target the Silver Vein and 360 Complex. The initial drilling success of the 360 Complex during Phase 1 is believed to be the top of the system with the potential to extend at depth. Phase 2 will include continued exploration in gap areas within this south-east plunging trend to determine continuity and potential sources of these high-grade mineralized vein systems.
In addition to this deeper drilling, the Company will also target the Vulcan Gap, which has been historically underexplored and is located between surface and the 2400-Level.
The goal of Phase 2 drilling is to add significant mine life in known vein systems and to discover new orebodies both at depth and near surface. The Company is targeting an additional 50 million ounces of silver from the Phase 2 drilling program, on a 100% basis for the property.
Service of Statement of Claim
The Company has been served with a statement of claim that was filed in the Ontario Superior Court of Justice (the "Court") to commence a proposed class action lawsuit against the Company and its Chief Executive Officer (the "Action"). Pursuant to the Action, the representative plaintiff seeks damages of C$130 million in relation to the Company’s public disclosure concerning its Relief Canyon mine. Although no assurance can be given with respect to the ultimate outcome, the Company believes that the complaint against it is unfounded and without merit, and it intends to vigorously defend the proceeding. The Company does not believe nor admit that the service of a statement of claim in the Action itself constitutes a material change in the business, operations, or capital of the Company but is disclosing the Action for the purpose of incorporating this information into the Company's prospectus supplement dated May 17, 2021.
About Americas Gold and Silver Corporation
Americas Gold and Silver Corporation is a high-growth precious metals mining company with multiple assets in North America. The Company owns and operates the Relief Canyon mine in Nevada, USA, the Cosalá Operations in Sinaloa, Mexico and manages the 60%-owned Galena Complex in Idaho, USA. The Company also owns the San Felipe development project in Sonora, Mexico. For further information, please see SEDAR or www.americas-gold.com.
Qualified Persons
Niel de Bruin, P.Geo., Director of Geology of the Company and a "qualified person" under National Instrument 43-101, have approved the applicable contents of this news release.
Technical Information
The diamond drilling program used NQ-size core. Americas standard QA/QC practices were utilized to ensure the integrity of the core and sample preparation at the Galena Complex through delivery of the samples to the assay lab. The drill core was stored in a secure facility, photographed, logged and sampled based on lithologic and mineralogical interpretations. Standards of certified reference materials, field duplicates and blanks were inserted as samples shipped with the core samples to the lab.
Analytical work was carried out by American Analytical Services Inc. ("AAS") located in Osburn, Idaho. AAS is an independent, ISO-17025 accredited laboratory. Sample preparation includes a 30-gram pulp sample analyzed by atomic absorption spectrometry ("AA") techniques to determine silver, copper, and lead, using aqua regia for pulp digestion. Samples returning values over 514g/t Ag are re-assayed using fire-assay techniques for silver. Additionally, samples returning values over 23% Pb are re-assayed using titration techniques.
Duplicate pulp samples were sent out quarterly to ALS Global, an independent, ISO-17025 accredited laboratory based in Reno, Nevada to perform an independent check analysis. A conventional AA technique was used for the analysis of silver, copper and lead at ALS Global with the same industry standard procedures as those used by AAS. The assay results listed in this report did not show any significant contamination during sample preparation or sample bias of analysis.
All mining terms used herein have the meanings set forth in National Instrument 43-101 – Standards of Disclosure for Mineral Projects ("NI 43-101"), as required by Canadian securities regulatory authorities. These standards differ significantly from the requirements of the SEC that are applicable to domestic United States reporting companies. Any mineral reserves and mineral resources reported by the Company in accordance with NI 43-101 may not qualify as such under SEC standards. Accordingly, information contained in this news release may not be comparable to similar information made public by companies subject to the SEC’s reporting and disclosure requirements.
Cautionary Statement on Forward-Looking Information:
This news release contains "forward-looking information" within the meaning of applicable securities laws. Forward-looking information includes, but is not limited to, Americas Gold and Silver’s expectations, intentions, plans, assumptions and beliefs with respect to, among other things, estimated and targeted production rates and results for gold, silver and other precious metals, as well as the related costs, expenses and capital expenditures; the recapitalization plan at the Galena Complex, including the replacement of the hoist and associated and expected costs; the outcome of the Action. Often, but not always, forward-looking information can be identified by forward-looking words such as "anticipate", "believe", "expect", "goal", "plan", "intend", "potential’, "estimate", "may", "assume" and "will" or similar words suggesting future outcomes, or other expectations, beliefs, plans, objectives, assumptions, intentions, or statements about future events or performance. Forward-looking information is based on the opinions and estimates of Americas Gold and Silver as of the date such information is provided and is subject to known and unknown risks, uncertainties, and other factors that may cause the actual results, level of activity, performance, or achievements of Americas Gold and Silver to be materially different from those expressed or implied by such forward-looking information. With respect to the business of Americas Gold and Silver, these risks and uncertainties include risks relating to widespread epidemics or pandemic outbreak including the COVID-19 pandemic; the impact of COVID-19 on our workforce, suppliers and other essential resources and what effect those impacts, if they occur, would have on our business, including our ability to access goods and supplies, the ability to transport our products and impacts on employee productivity, the risks in connection with the operations, cash flow and results of the Company relating to the unknown duration and impact of the COVID-19 pandemic; interpretations or reinterpretations of geologic information; unfavorable exploration results; inability to obtain permits required for future exploration, development or production; general economic conditions and conditions affecting the industries in which the Company operates; the uncertainty of regulatory requirements and approvals; fluctuating mineral and commodity prices; the ability to obtain necessary future financing on acceptable terms or at all; the ability to operate the Company’s operations; and risks associated with the mining industry such as economic factors (including future commodity prices, currency fluctuations and energy prices), ground conditions and other factors limiting mine access, failure of plant, equipment, processes and transportation services to operate as anticipated, environmental risks, government regulation, actual results of current exploration and production activities, possible variations in ore grade or recovery rates, permitting timelines, capital and construction expenditures, reclamation activities, labor relations or disruptions, social and political developments and other risks of the mining industry. The potential effects of the COVID-19 pandemic on our business and operations are unknown at this time, including the Company’s ability to manage challenges and restrictions arising from COVID-19 in the communities in which the Company operates and our ability to continue to safely operate and to safely return our business to normal operations. The impact of COVID-19 on the Company is dependent on a number of factors outside of its control and knowledge, including the effectiveness of the measures taken by public health and governmental authorities to combat the spread of the disease, global economic uncertainties and outlook due to the disease, and the evolving restrictions relating to mining activities and to travel in certain jurisdictions in which it operates. Although the Company has attempted to identify important factors that could cause actual results to differ materially from those contained in forward-looking information, there may be other factors that cause results not to be as anticipated, estimated, or intended. Readers are cautioned not to place undue reliance on such information. Additional information regarding the factors that may cause actual results to differ materially from this forward‐looking information is available in Americas Gold and Silver’s filings with the Canadian Securities Administrators on SEDAR and with the SEC. Americas Gold and Silver does not undertake any obligation to update publicly or otherwise revise any forward-looking information whether as a result of new information, future events or other such factors which affect this information, except as required by law. Americas Gold and Silver does not give any assurance (1) that Americas Gold and Silver will achieve its expectations, or (2) concerning the result or timing thereof. All subsequent written and oral forward‐looking information concerning Americas Gold and Silver are expressly qualified in their entirety by the cautionary statements above.
1 Silver equivalent was calculated using metal prices of $20.00/oz silver, $3.00/lb copper and $1.05/lb lead.
2 Meters represent "True Width" which is calculated for significant intercepts only and is based on orientation axis of core across the estimated dip of the vein.
View source version on businesswire.com: https://www.businesswire.com/news/home/20210712005267/en/
Contacts
For more information:
Stefan Axell
VP, Corporate Development & Communications
Americas Gold and Silver Corporation
416-874-1708
Darren Blasutti
President and CEO
Americas Gold and Silver Corporation
416‐848‐9503
Hecla Mining Company (NYSE:HL) shareholders might be concerned after seeing the share price drop 21% in the last month. But that doesn't change the fact that the returns over the last three years have been very strong. Indeed, the share price is up a very strong 106% in that time. It's not uncommon to see a share price retrace a bit, after a big gain. The fundamental business performance will ultimately dictate whether the top is in, or if this is a stellar buying opportunity.
Check out our latest analysis for Hecla Mining
We don't think that Hecla Mining's modest trailing twelve month profit has the market's full attention at the moment. We think revenue is probably a better guide. Generally speaking, we'd consider a stock like this alongside loss-making companies, simply because the quantum of the profit is so low. For shareholders to have confidence a company will grow profits significantly, it must grow revenue.
In the last 3 years Hecla Mining saw its revenue grow at 9.8% per year. That's pretty nice growth. Broadly speaking, this solid progress may well be reflected by the healthy share price gain of 27% per year over three years. It's hard to value pre-profit businesses, but it seems like the market has become a lot more optimistic about this one! Some investors like to buy in just after a company becomes profitable, since that can be a powerful inflexion point.
You can see how earnings and revenue have changed over time in the image below (click on the chart to see the exact values).

We know that Hecla Mining has improved its bottom line lately, but what does the future have in store? You can see what analysts are predicting for Hecla Mining in this interactive graph of future profit estimates.
What About Dividends?
As well as measuring the share price return, investors should also consider the total shareholder return (TSR). The TSR is a return calculation that accounts for the value of cash dividends (assuming that any dividend received was reinvested) and the calculated value of any discounted capital raisings and spin-offs. So for companies that pay a generous dividend, the TSR is often a lot higher than the share price return. In the case of Hecla Mining, it has a TSR of 109% for the last 3 years. That exceeds its share price return that we previously mentioned. And there's no prize for guessing that the dividend payments largely explain the divergence!
A Different Perspective
It's good to see that Hecla Mining has rewarded shareholders with a total shareholder return of 78% in the last twelve months. That's including the dividend. That gain is better than the annual TSR over five years, which is 3%. Therefore it seems like sentiment around the company has been positive lately. In the best case scenario, this may hint at some real business momentum, implying that now could be a great time to delve deeper. It's always interesting to track share price performance over the longer term. But to understand Hecla Mining better, we need to consider many other factors. Case in point: We've spotted 3 warning signs for Hecla Mining you should be aware of.
If you would prefer to check out another company — one with potentially superior financials — then do not miss this free list of companies that have proven they can grow earnings.
Please note, the market returns quoted in this article reflect the market weighted average returns of stocks that currently trade on US exchanges.
This article by Simply Wall St is general in nature. It does not constitute a recommendation to buy or sell any stock, and does not take account of your objectives, or your financial situation. We aim to bring you long-term focused analysis driven by fundamental data. Note that our analysis may not factor in the latest price-sensitive company announcements or qualitative material. Simply Wall St has no position in any stocks mentioned.
Have feedback on this article? Concerned about the content? Get in touch with us directly. Alternatively, email editorial-team (at) simplywallst.com.
Energy Fuels (UUUU) closed at $5.41 in the latest trading session, marking a +1.31% move from the prior day. This move outpaced the S&P 500's daily gain of 1.13%.
Heading into today, shares of the uranium and vanadium miner and developer had lost 22.72% over the past month, lagging the Basic Materials sector's loss of 4.51% and the S&P 500's gain of 2.39% in that time.
UUUU will be looking to display strength as it nears its next earnings release. In that report, analysts expect UUUU to post earnings of -$0.04 per share. This would mark year-over-year growth of 50%. Meanwhile, our latest consensus estimate is calling for revenue of $5.48 million, up 1269.75% from the prior-year quarter.
Looking at the full year, our Zacks Consensus Estimates suggest analysts are expecting earnings of -$0.17 per share and revenue of $18.41 million. These totals would mark changes of +26.09% and +1010.62%, respectively, from last year.
It is also important to note the recent changes to analyst estimates for UUUU. These revisions typically reflect the latest short-term business trends, which can change frequently. As such, positive estimate revisions reflect analyst optimism about the company's business and profitability.
Our research shows that these estimate changes are directly correlated with near-term stock prices. To benefit from this, we have developed the Zacks Rank, a proprietary model which takes these estimate changes into account and provides an actionable rating system.
The Zacks Rank system ranges from #1 (Strong Buy) to #5 (Strong Sell). It has a remarkable, outside-audited track record of success, with #1 stocks delivering an average annual return of +25% since 1988. The Zacks Consensus EPS estimate remained stagnant within the past month. UUUU is currently sporting a Zacks Rank of #3 (Hold).
The Mining – Non Ferrous industry is part of the Basic Materials sector. This industry currently has a Zacks Industry Rank of 45, which puts it in the top 18% of all 250+ industries.
The Zacks Industry Rank gauges the strength of our industry groups by measuring the average Zacks Rank of the individual stocks within the groups. Our research shows that the top 50% rated industries outperform the bottom half by a factor of 2 to 1.
You can find more information on all of these metrics, and much more, on Zacks.com.
Want the latest recommendations from Zacks Investment Research? Today, you can download 7 Best Stocks for the Next 30 Days. Click to get this free report
Energy Fuels Inc (UUUU) : Free Stock Analysis Report
To read this article on Zacks.com click here.
Zacks Investment Research
Does the July share price for IMPACT Silver Corp. (CVE:IPT) reflect what it's really worth? Today, we will estimate the stock's intrinsic value by taking the expected future cash flows and discounting them to their present value. The Discounted Cash Flow (DCF) model is the tool we will apply to do this. There's really not all that much to it, even though it might appear quite complex.
Remember though, that there are many ways to estimate a company's value, and a DCF is just one method. For those who are keen learners of equity analysis, the Simply Wall St analysis model here may be something of interest to you.
See our latest analysis for IMPACT Silver
Crunching the numbers
We're using the 2-stage growth model, which simply means we take in account two stages of company's growth. In the initial period the company may have a higher growth rate and the second stage is usually assumed to have a stable growth rate. To begin with, we have to get estimates of the next ten years of cash flows. Seeing as no analyst estimates of free cash flow are available to us, we have extrapolate the previous free cash flow (FCF) from the company's last reported value. We assume companies with shrinking free cash flow will slow their rate of shrinkage, and that companies with growing free cash flow will see their growth rate slow, over this period. We do this to reflect that growth tends to slow more in the early years than it does in later years.
Generally we assume that a dollar today is more valuable than a dollar in the future, and so the sum of these future cash flows is then discounted to today's value:
10-year free cash flow (FCF) forecast
|
2022 |
2023 |
2024 |
2025 |
2026 |
2027 |
2028 |
2029 |
2030 |
2031 |
|
|
Levered FCF (CA$, Millions) |
CA$857.9k |
CA$1.37m |
CA$1.94m |
CA$2.52m |
CA$3.06m |
CA$3.53m |
CA$3.93m |
CA$4.25m |
CA$4.52m |
CA$4.74m |
|
Growth Rate Estimate Source |
Est @ 84.12% |
Est @ 59.35% |
Est @ 42% |
Est @ 29.86% |
Est @ 21.36% |
Est @ 15.41% |
Est @ 11.25% |
Est @ 8.33% |
Est @ 6.29% |
Est @ 4.86% |
|
Present Value (CA$, Millions) Discounted @ 6.4% |
CA$0.8 |
CA$1.2 |
CA$1.6 |
CA$2.0 |
CA$2.2 |
CA$2.4 |
CA$2.5 |
CA$2.6 |
CA$2.6 |
CA$2.5 |
("Est" = FCF growth rate estimated by Simply Wall St)
Present Value of 10-year Cash Flow (PVCF) = CA$20m
After calculating the present value of future cash flows in the initial 10-year period, we need to calculate the Terminal Value, which accounts for all future cash flows beyond the first stage. The Gordon Growth formula is used to calculate Terminal Value at a future annual growth rate equal to the 5-year average of the 10-year government bond yield of 1.5%. We discount the terminal cash flows to today's value at a cost of equity of 6.4%.
Terminal Value (TV)= FCF2031 × (1 + g) ÷ (r – g) = CA$4.7m× (1 + 1.5%) ÷ (6.4%– 1.5%) = CA$99m
Present Value of Terminal Value (PVTV)= TV / (1 + r)10= CA$99m÷ ( 1 + 6.4%)10= CA$53m
The total value, or equity value, is then the sum of the present value of the future cash flows, which in this case is CA$73m. To get the intrinsic value per share, we divide this by the total number of shares outstanding. Relative to the current share price of CA$0.6, the company appears around fair value at the time of writing. The assumptions in any calculation have a big impact on the valuation, so it is better to view this as a rough estimate, not precise down to the last cent.

Important assumptions
We would point out that the most important inputs to a discounted cash flow are the discount rate and of course the actual cash flows. If you don't agree with these result, have a go at the calculation yourself and play with the assumptions. The DCF also does not consider the possible cyclicality of an industry, or a company's future capital requirements, so it does not give a full picture of a company's potential performance. Given that we are looking at IMPACT Silver as potential shareholders, the cost of equity is used as the discount rate, rather than the cost of capital (or weighted average cost of capital, WACC) which accounts for debt. In this calculation we've used 6.4%, which is based on a levered beta of 1.035. Beta is a measure of a stock's volatility, compared to the market as a whole. We get our beta from the industry average beta of globally comparable companies, with an imposed limit between 0.8 and 2.0, which is a reasonable range for a stable business.
Looking Ahead:
Whilst important, the DCF calculation shouldn't be the only metric you look at when researching a company. It's not possible to obtain a foolproof valuation with a DCF model. Rather it should be seen as a guide to "what assumptions need to be true for this stock to be under/overvalued?" For instance, if the terminal value growth rate is adjusted slightly, it can dramatically alter the overall result. For IMPACT Silver, we've compiled three important aspects you should further examine:
-
Risks: Consider for instance, the ever-present spectre of investment risk. We've identified 3 warning signs with IMPACT Silver , and understanding these should be part of your investment process.
-
Other High Quality Alternatives: Do you like a good all-rounder? Explore our interactive list of high quality stocks to get an idea of what else is out there you may be missing!
-
Other Top Analyst Picks: Interested to see what the analysts are thinking? Take a look at our interactive list of analysts' top stock picks to find out what they feel might have an attractive future outlook!
PS. The Simply Wall St app conducts a discounted cash flow valuation for every stock on the TSXV every day. If you want to find the calculation for other stocks just search here.
This article by Simply Wall St is general in nature. It does not constitute a recommendation to buy or sell any stock, and does not take account of your objectives, or your financial situation. We aim to bring you long-term focused analysis driven by fundamental data. Note that our analysis may not factor in the latest price-sensitive company announcements or qualitative material. Simply Wall St has no position in any stocks mentioned.
Have feedback on this article? Concerned about the content? Get in touch with us directly. Alternatively, email editorial-team (at) simplywallst.com.
Howard Marks put it nicely when he said that, rather than worrying about share price volatility, 'The possibility of permanent loss is the risk I worry about… and every practical investor I know worries about.' So it seems the smart money knows that debt – which is usually involved in bankruptcies – is a very important factor, when you assess how risky a company is. As with many other companies Aurcana Silver Corporation (CVE:AUN) makes use of debt. But is this debt a concern to shareholders?
Why Does Debt Bring Risk?
Debt assists a business until the business has trouble paying it off, either with new capital or with free cash flow. Ultimately, if the company can't fulfill its legal obligations to repay debt, shareholders could walk away with nothing. However, a more common (but still painful) scenario is that it has to raise new equity capital at a low price, thus permanently diluting shareholders. By replacing dilution, though, debt can be an extremely good tool for businesses that need capital to invest in growth at high rates of return. When we think about a company's use of debt, we first look at cash and debt together.
Check out our latest analysis for Aurcana Silver
What Is Aurcana Silver's Net Debt?
As you can see below, at the end of March 2021, Aurcana Silver had US$20.7m of debt, up from none a year ago. Click the image for more detail. But on the other hand it also has US$39.1m in cash, leading to a US$18.5m net cash position.

How Strong Is Aurcana Silver's Balance Sheet?
Zooming in on the latest balance sheet data, we can see that Aurcana Silver had liabilities of US$1.54m due within 12 months and liabilities of US$29.0m due beyond that. Offsetting this, it had US$39.1m in cash and US$46.4k in receivables that were due within 12 months. So it actually has US$8.66m more liquid assets than total liabilities.
This surplus suggests that Aurcana Silver has a conservative balance sheet, and could probably eliminate its debt without much difficulty. Succinctly put, Aurcana Silver boasts net cash, so it's fair to say it does not have a heavy debt load! There's no doubt that we learn most about debt from the balance sheet. But it is Aurcana Silver's earnings that will influence how the balance sheet holds up in the future. So when considering debt, it's definitely worth looking at the earnings trend. Click here for an interactive snapshot.
Given its lack of meaningful operating revenue, investors are probably hoping that Aurcana Silver finds some valuable resources, before it runs out of money.
So How Risky Is Aurcana Silver?
Statistically speaking companies that lose money are riskier than those that make money. And the fact is that over the last twelve months Aurcana Silver lost money at the earnings before interest and tax (EBIT) line. Indeed, in that time it burnt through US$36m of cash and made a loss of US$15m. Given it only has net cash of US$18.5m, the company may need to raise more capital if it doesn't reach break-even soon. Overall, its balance sheet doesn't seem overly risky, at the moment, but we're always cautious until we see the positive free cash flow. There's no doubt that we learn most about debt from the balance sheet. However, not all investment risk resides within the balance sheet – far from it. We've identified 2 warning signs with Aurcana Silver (at least 1 which shouldn't be ignored) , and understanding them should be part of your investment process.
Of course, if you're the type of investor who prefers buying stocks without the burden of debt, then don't hesitate to discover our exclusive list of net cash growth stocks, today.
This article by Simply Wall St is general in nature. It does not constitute a recommendation to buy or sell any stock, and does not take account of your objectives, or your financial situation. We aim to bring you long-term focused analysis driven by fundamental data. Note that our analysis may not factor in the latest price-sensitive company announcements or qualitative material. Simply Wall St has no position in any stocks mentioned.
Have feedback on this article? Concerned about the content? Get in touch with us directly. Alternatively, email editorial-team (at) simplywallst.com.
DENVER, CO / ACCESSWIRE / July 8, 2021 / Solitario Zinc Corp. (" Solitario ") (NYSE American:XPL); (TSX:SLR ) is pleased to announce that exploration work has commenced on the Lik zinc project in Alaska. Joint Venture partners Solitario (50%) and Teck American Incorporated (50%), a wholly owned subsidiary of Teck Resources Limited ("Teck"), recently approved a jointly funded budget for the 2021 work program that consists of surface geochemical sampling, induced polarization ("IP") geophysics, and at least 2,000 feet of core drilling to test new exploration concepts and expand resources. Teck is one of the world's largest producers of mined zinc.
The Lik project hosts a potentially open-pitable Indicated Resource of 17.3 million tonnes grading 12.0% zinc equivalent and an additional 2.9 million tonnes of Inferred Resource grading 12.1% zinc-equivalent. Potentially underground mineable mineralization also occurs on the property. The project is situated approximately 14 miles northwest of Teck's operating Red Dog mine, one of the world's largest, highest grade and lowest cost zinc mines.
Chris Herald, President and CEO of Solitario, commented, "This is clearly an exciting new phase in the advancement of the Lik project, including the first exploration drilling program in ten years. It comes at a time of increased zinc demand and elevated zinc prices. The drilling program is focused on expanding the Lik resource in three different areas of the existing deposit, while the surface work targets potential new mineralization on trend to the northeast of the Lik deposit."
To take full advantage of Teck's thirty-five years of successful exploration and operational experience in the world-class Red Dog mining district, Solitario and Teck mutually agreed that Teck will act as project operator for the 2021 program. Geochemical sampling has begun with geophysics expected to begin by mid-July. Core drilling is expected to begin in July/August, pending the receipt of final drill permits. The current-year work will consist of the following components:
-
Systematic geochemical soil sampling over a 2.5-mile trend to the northeast of the Lik deposit expanding recent favorable results.
-
A geophysical program will consist of a new IP survey and will augment geologic and geochemical data in recently identified prospective areas on trend with Lik to the northeast. IP geophysics have been demonstrated to be very effective in locating zinc mineralization in the Red Dog District.
-
Core drilling consisting of at least three holes totaling 2,000 feet (650 meters) will test resource expansion potential in three different parts of the currently defined Lik deposit.
The Lik Zinc-Lead Deposit
The Lik deposit is a large sediment-hosted zinc-lead-silver deposit in the Red Dog mining district. As presently defined, the Lik South deposit has a surface footprint of about 3,600 feet long and about 2,000 feet wide. The Lik South deposit remains open down dip. The Lik North deposit has a surface footprint of about 2,300 feet long and about 1,150 feet wide. The Lik North deposit remains open down-dip and to the north. A total of 125,300 feet of drilling in 229 holes has been completed on the Lik property to date.
About Solitario
Solitario is an emerging zinc exploration and development company traded on the NYSE American ("XPL") and on the Toronto Stock Exchange ("SLR"). Solitario holds 50% joint venture interest in the high-grade, open-pitable Lik zinc deposit in Alaska and a 39% joint venture interest (Nexa Resources holds the remaining 61% interest) on the high-grade Florida Canyon zinc project in Peru. Solitario's Management and Directors hold approximately 9.6% (excluding options) of the Company's 58.4 million shares outstanding. Solitario's cash balance and marketable securities stand at approximately US$6.9 million. Additional information about Solitario is available online at www.solitariozinc.com.
FOR MORE INFORMATION AT SOLITARIO, CONTACT:
|
Valerie Kimball |
Christopher E. Herald |
Cautionary Note to U.S. Investors concerning estimates of Resources: This news release uses the terms "Measured, Indicated and Inferred Resources." The Company advises U.S. investors that while these terms are recognized and required by Canadian regulations, the SEC does not recognize the terms. U.S. investors are cautioned not to assume that any part or all of Measured or Indicated Mineral Resources will ever be converted into Reserves. Inferred Resources have a great amount of uncertainty as to their existence, and great uncertainty as to their economic and legal feasibility. It cannot be assumed that all or any part of an Inferred Mineral Resource will ever be upgraded to a higher category. Under Canadian rules, estimates of Inferred Mineral Resources may not form the basis of feasibility or pre-feasibility studies. U.S. investors are cautioned not to assume that any part or all of a measured, indicated orinferred resource exists, or is economically or legally minable.
Cautionary Statement Regarding Forward Looking Information
This press release contains forward-looking statements within the meaning of the U.S. Securities Act of 1933 and the U.S. Securities Exchange Act of 1934, and as defined in the United States Private Securities Litigation Reform Act of 1995 (and the equivalent under Canadian securities laws),that are intended to be covered by the safe harbor created by such sections. Forward-looking statements are statements that are not historical fact. They are based on the beliefs, estimates and opinions of the Company's management on the date the statements are made and address activities, events or developments that Solitario expects or anticipates will or may occur in the future, and are based on current expectations and assumptions. The Company would like to specifically caution the reader that the Lik preliminary economic assessment ("PEA") that supports the technical feasibility or economic feasibility of the Lik zinc deposit, respectively, including the marketability of the concentrate, mining methods, cost, recoveries of metals and any other technical aspects related to the deposits, are preliminary in nature and there is no certainty that the economic estimates in the PEA will be realized. Forward-looking statements involve a number of risks and uncertainties. Consequently, there can be no assurances that such statements will prove to be accurate and actual results and future events could differ materially from those anticipated in such statements. Such forward-looking statements include, without limitation, statements regarding the Company's expectation of the projected timing and outcome of engineering studies; expectations regarding the receipt of all necessary permits and approvals to implement a mining plan, if any, at Lik or Florida Canyon; the potential for confirming, upgrading and expanding zinc, lead and silver mineralized material; future operating and capital cost estimates may indicate that the stated resources may not be economic; estimates of zinc, lead and silver grades of resources provided are predicted and actual mining grade could be substantially lower; estimates of recovery rates for could be lower than estimated for establishing the cutoff grade; and other statements that are not historical facts could vary significantly from assumptions made in the PEA; risks associated with our partner, Teck Resources Ltd., ability to finance continued development and potential construction of the Lik project could have a materially negative impact on the timing of project development, and such project development may never occur. Although Solitario management believes that its expectations are based on reasonable assumptions, it can give no assurance that these expectations will prove correct. Important factors that could cause actual results to differ materially from those in the forward-looking statements include, among others, risks relating to risks that Solitario's and its joint venture partners' exploration and property advancement efforts will not be successful; risks relating to fluctuations in the price of zinc, lead and silver; the inherently hazardous nature of mining-related activities; uncertainties concerning reserve and resource estimates; availability of outside contractors in connection with Lik, and other activities; uncertainties relating to obtaining approvals and permits from governmental regulatory authorities; the possibility that environmental laws and regulations will change over time and become even more restrictive; and availability and timing of capital for financing the Company's exploration and development activities, including uncertainty of being able to raise capital on favorable terms or at all; as well as those factors discussed in Solitario's filings with the U.S. Securities and Exchange Commission (the " SEC ") including Solitario's latest Annual Report on Form 10-K and its other SEC filings (and Canadian filings) including, without limitation, its latest Quarterly Report on Form 10-Q. The Company does not intend to publicly update any forward-looking statements, whether as a result of new information, future events, or otherwise, except as may be required under applicable securities laws.
SOURCE: Solitario Zinc Corp.
View source version on accesswire.com:
https://www.accesswire.com/654735/Solitario-Zinc-Reports-That-Exploration-Work-Has-Commenced-on-the-Lik-Zinc-Project-Alaska
Geotechnical drill holes

Location of geotechnical drill holes at Grassy Mountain
WINNEMUCCA, Nev., July 08, 2021 (GLOBE NEWSWIRE) — Paramount Gold Nevada Corp. (NYSE American: PZG) ("Paramount” or “the Company”) announced today that assay results from two new core holes at the Company’s proposed high grade underground Grassy Mountain gold mine in eastern Oregon drilled outside the mineral reserve area indicate the potential for additional economic material.
The two holes were initially drilled as part of the geotechnical program for alignment and to support the design of the portal and decline access to the mine. Both holes were drilled outside the boundaries of the current underground reserve, in areas considered as waste rock (see image below).
Drill hole GM19-37 was designed to acquire data related to ground conditions in proximity to the underground decline spiral as well as to provide ground water and permeability data. The hole was drilled to a depth of 831 ft. returning gold grades up to 2.56 g/T. Overall, this hole intersected a true width of 675 ft. grading an average of 0.4 g/T gold and 1.8 g/T Ag.
Drill hole GM19-38 was drilled at the proposed portal location and intercepted gold mineralization of up to 0.98 g/T of gold. The hole was drilled to 100 ft. and intersected a zone of 29 ft. grading 0.6 g/T gold beginning at a depth of 71 ft.
Paramount’s COO Glen van Treek commented, “The significance of these assays is that material with sufficient grade will be stockpiled separately and sent to the mill, rather than being classified as waste, thereby improving overall project economics.”
Based on the September 2020 Feasibility Study, projected processing costs are $28 per ton, suggesting that at current gold prices, any material with grades over 0.55 g/T previously classified as waste, but that needs to be extracted as part of the current mine plan, will be sent to the mill for processing.
“As we approach a construction decision, the updated reserves will be included in a final mine plan accounting for short-term gold and silver prices at that time,” van Treek added.
A photo accompanying this announcement is available at https://www.globenewswire.com/NewsRoom/AttachmentNg/a0b503d6-c79c-43f0-ae3d-2e083ce875b8
NI 43-101 Disclosure
Exploration activities at Grassy Mountain are being conducted by wholly-owned subsidiary Calico Resources USA Corp. personnel under the supervision of Michael McGinnis (CPG 10914) Project Manager and a Qualified Person under National Instrument 43-101, who has reviewed and approved this release. An ongoing quality control/quality assurance protocol is being employed for the program including blank, duplicate and reference standards in every batch of assays.
About Paramount Gold Nevada Corp.
Paramount Gold Nevada Corp. is a U.S. based precious metals exploration and development company. Paramount’s strategy is to create shareholder value through exploring and developing its mineral properties and to realize this value for its shareholders in three ways: by selling its assets to established producers; entering joint ventures with producers for construction and operation; or constructing and operating mines for its own account.
Paramount owns 100% of the Grassy Mountain Gold Project which consists of approximately 8,200 acres located on private and BLM land in Malheur County, Oregon. The Grassy Mountain Gold Project contains a gold-silver deposit (100% located on private land) for which results of a positive Feasibility Study have been released and key permitting milestones accomplished.
Paramount owns a 100% interest in the Sleeper Gold Project located in Northern Nevada, the world’s premier mining jurisdiction. The Sleeper Gold Project, which includes the former producing Sleeper mine, totals 2,322 unpatented mining claims (approximately 60 square miles or 15,500 hectares). The Sleeper gold project is host to a large gold deposit (over 4 million ounces of mineralized material) and the Company has completed and released a positive Preliminary Economic Assessment. With higher gold prices, Paramount has begun work to update and improve the economics of the Sleeper project.
Safe Harbor for Forward-Looking Statements
This release and related documents may include "forward-looking statements" and “forward-looking information” (collectively, “forward-looking statements”) pursuant to applicable United States and Canadian securities laws. Paramount’s future expectations, beliefs, goals, plans or prospects constitute forward-looking statements within the meaning of the United States Private Securities Litigation Reform Act of 1995 and other applicable securities laws. Words such as "believes," "plans," "anticipates," "expects," "estimates" and similar expressions are intended to identify forward-looking statements, although these words may not be present in all forward-looking statements. Forward-looking statements included in this news release include, without limitation, statements with respect to the use of proceeds from the Offerings. Forward-looking statements are based on the reasonable assumptions, estimates, analyses and opinions of management made in light of its experience and its perception of trends, current conditions and expected developments, as well as other factors that management believes to be relevant and reasonable in the circumstances at the date that such statements are made, but which may prove to be incorrect. Management believes that the assumptions and expectations reflected in such forward-looking statements are reasonable. Assumptions have been made regarding, among other things: the conclusions made in the feasibility study for the Grassy Mountain Gold Project (the “FS”); the quantity and grade of resources included in resource estimates; the accuracy and achievability of projections included in the FS; Paramount’s ability to carry on exploration and development activities, including construction; the timely receipt of required approvals and permits; the price of silver, gold and other metals; prices for key mining supplies, including labor costs and consumables, remaining consistent with current expectations; work meeting expectations and being consistent with estimates and plant, equipment and processes operating as anticipated. There are a number of important factors that could cause actual results or events to differ materially from those indicated by such forward-looking statements, including, but not limited to: uncertainties involving interpretation of drilling results; environmental matters; the ability to obtain required permitting; equipment breakdown or disruptions; additional financing requirements; the completion of a definitive feasibility study for the Grassy Mountain Gold Project; discrepancies between actual and estimated mineral reserves and mineral resources, between actual and estimated development and operating costs and between estimated and actual production; the global epidemics, pandemics, or other public health crises, including the novel coronavirus (COVID-19) global health pandemic, and the spread of other viruses or pathogens and the other factors described in Paramount’s disclosures as filed with the SEC and the Ontario, British Columbia and Alberta Securities Commissions.
Except as required by applicable law, Paramount disclaims any intention or obligation to update any forward-looking statements as a result of developments occurring after the date of this document.
Paramount Gold Nevada Corp.
Rachel Goldman, Chief Executive Officer
Christos Theodossiou, Director of Corporate Communications
866-481-2233
Twitter: @ParamountNV
Vancouver, British Columbia–(Newsfile Corp. – July 8, 2021) – Aurcana Silver Corporation (TSXV: AUN) (OTCQX: AUNFF) (FSE: UHY0) has released results of the first assays after accessing the Virginius Vein on the 1800 level at its Revenue-Virginius Mine. The 100% owned Revenue-Virginius Mine, located in southwestern Colorado about 5.5 miles southwest of the town of Ouray, is one of the company's two projects, the other being the 100% owned Shafter-Presidio Silver Project, located 21 miles northeast of Presidio, Texas. Both projects are fully permitted for production, with silver being the primary resource.
For more information, please view the InvestmentPitch Media "video" which provides additional information about this news and the company. If this link is not enabled, please visit www.InvestmentPitch.com and enter "Aurcana" in the search box.
Cannot view this video? Visit:
https://www.youtube.com/watch?v=14hqHotPOto
The initial samples of the Virginius Vein intersection on the 1800 level assayed 38.611 ounces per ton or 1,323.8 grams per tonne of silver equivalent over a vein width of 2.5 feet, including 85.782 ounces per ton or 2,941.1 grams per tonne of silver equivalent over 0.6 feet. These results compare favorably with the reserve grade in this location of 24.7 ounces per ton or 846.8 grams per tonne silver equivalent over 1.4 feet as reported in the 2018 feasibility study, which is available on the company's website.
The company plans to deliver development ore to the process plant this month for commissioning and restart. Ore throughput will be ramped up to 110 short tons per day during August, and then to full production of 270 short tons per day during September. Concentrate shipments are anticipated to begin in early August with Trafigura Trading LLC off-taking 100% of the concentrates. Trafigura will pay 95% of the contained metals value based on the mine site concentrate assays at the time of shipment, with final settlement based on smelter returns.
Management forecasts payable silver equivalent production for the period between August and December 2021 to be in the range of 1,300,000 to 1,600,000 ounces at estimated cash operating costs of between US$10.00 to US$12.00/oz silver after by-product credits.
For more information, please visit the company's website www.aurcana.com or contact Kevin Drover, President & CEO, at 604-331-9333. For Investor Relations contact Gary Lindsey at 720-273-6224 or by email at gary@strata-star.com.
About InvestmentPitch Media
InvestmentPitch Media leverages the power of video, which together with its extensive distribution, positions a company's story ahead of the 1,000's of companies seeking awareness and funding from the financial community. The company specializes in producing short videos based on significant news releases, research reports and other content of interest to investors.
CONTACT:
InvestmentPitch Media
Barry Morgan, CFO
bmorgan@investmentpitch.com

To view the source version of this press release, please visit https://www.newsfilecorp.com/release/89752
Figure 1

Map depicting select mineralized zones at Plata in relation to the Plata Thrust Fault and the Aho Zone
TORONTO, July 08, 2021 (GLOBE NEWSWIRE) — Honey Badger Silver Inc. (TSX-V: TUF) (“Honey Badger Silver” or the “Company”) is pleased to announce that it has engaged Archer, Cathro & Associates (1981) Limited (“Archer Cathro”) to oversee the Phase 1 work program on its 100%-owned 5,690 hectare Plata Silver Property (“Plata”) located in east-central Yukon. Archer Cathro is the established leader in Yukon mineral discoveries.
The Plata Silver Property lies within the Tintina Gold Belt and displays a number of similarities to the world-class Keno Hill Silver Mining Camp, Canada’s second largest primary producer of silver with production from approximately thirty-five vein deposits between 1913 and 1989.
Plata Property Highlights:
-
Historic surface trenching and shallow drilling has identified thirty-two (32) known mineralized zones, comprising high-grade silver, gold, lead and zinc-bearing veins and stockwork zones;
-
Several areas of the property were mined historically for high-grade silver and yielded 9,020 kg (290,000 oz) of silver from a reported 2,041 tonnes of hand sorted material, equivalent to a recovered silver grade of approximately 4,420 grams per tonne (g/t) silver.
Historic drilling to date has demonstrated potential for continuous mineralization over a strike length of nearly 800 metres at the Aho Zone (Figure 1). This zone is a semi-continuous mineralized system developed within the plane of the Plata Thrust Fault that extends intermittently over a total strike length of 800 metres and to a maximum of 580 metres downdip and remains open to extension along strike and downdip.
About the Plata Silver Property
Historic exploration at the Plata Silver Property from 1969 to 2011 identified thirty-two (32) known mineralized zones, extending over a 2.5 kilometre area, hosting narrow high-grade silver, gold, lead and zinc-bearing veins and stockworks. Mineralization at Plata is believed to be associated with hydrothermal fluids related to the Tombstone intrusive suite and bears similarities to the prolific Keno Hill Silver Mining Camp, Canada’s second largest primary producer of silver with production from approximately thirty-five (35) vein deposits between 1913 and 1989.
High priority target areas at Plata include:
-
P-4 Zone: The P-4 Zone has undergone more extensive drilling relative to other targets at Plata and demonstrates continuous mineralization over 200 metres of strike length that remains open in all directions. Average grades and widths from fourteen (14) core drill holes in 1987 were 1.9 metres grading 337 g/t silver, 3.65 g/t gold, 1.59% lead and 1.7% zinc.
-
P-3 Zone: At the P-3 Zone, rock samples have returned extremely high gold assays (up to 78.3 g/t) and chip sampling returned 1.96 metres grading 2,383 g/t silver, 9.85 g/t gold and 7% lead.
-
P-6 Zone: Drilling in 2011 confirmed the continuity of significant polymetallic silver mineralization at depth and laterally over a strike length of 150 metres. Highlighted drill intercepts include 1.0 metre grading 1,655 g/t silver and 1.09% zinc, and 6.63 metres grading 164 g/t tonne silver and 2.34% zinc. Veining mapped at surface and anomalous soil geochemistry suggest the P-6 structure may extend for 500 metres to the northwest.
-
P-2 Zone: Detailed trenching of the P-2 Zone returned a weighted average of 812 g/t silver, 24.48% lead and 17.02% zinc across an average width of 1.93 metres for a strike length of 85 metres. Drill holes targeting the P-2 Zone yielded intercepts of up to 1,060 g/t silver and 3.86% zinc over 0.87 metres and 110 g/t silver and 39.77% zinc over 0.93 metres.
Importantly, drilling from 2008 to 2011 has demonstrated that the P-3 and P-4 veins are part of a larger, semi-continuous, mineralized system referred to as the Aho Zone, which is developed within the plane of the Plata Thrust Fault and varies from 0.3 to 3.0 metres in width. This zone extends intermittently over a total strike length of 800 metres and to a maximum of 580 metres downdip and remains open to extension along strike and downdip (Figure 1).
Plata Phase 1 Program:
The primary objective of the Phase 1 program planned for this summer by Archer Cathro is to complete detailed mapping and rock and channel sampling at a number of priority target zones at Plata in order to better understand structural controls of silver mineralization. This will provide valuable insight for eventual drill hole targeting.
The secondary objective of the Phase 1 program will be to better define the full extent of mineralization at Plata. Towards this end, soil grids will be completed in previously unsampled areas to more thoroughly define anomalous geochemical zones and trends.
Technical information in this news release has been approved by Heather Burrell, P.Geo., a geologist with Archer, Cathro & Associates (1981) Limited and qualified person for the purpose of National Instrument 43-101.
Closing of First Tranche of Flow-Through Private Placement
The Company also announces that it has closed the first tranche of its ongoing non-brokered flow-through private placement (the “FT Offering”) by issuing 1,681,800 Flow Through Shares (‘FT Shares”) at a price of $0.15 per FT Share for gross proceeds of $252,270. The gross proceeds from the Offering will be used to fund the exploration program on the aforenoted Plata silver property and future exploration programs on the Company’s other properties in the Yukon as well as the Thunder Bay District of northern Ontario, which qualify as flow-through shares for purposes of the Income Tax Act (Canada).
The Company expects to close a second and final tranche of the FT Offering shortly.
In connection with the foregoing, the Company paid finders’ fees totalling $17,239 and issued non-transferable purchase warrants entitling the purchase a total of 114,926 common shares of the Company at a price of $0.15 per share for a period of 24 months following the closing. All securities issued in connection with the FT Offering are subject to a hold period of four months plus a day from the closing. The FT Offering remains subject to the final approval of the TSX Venture Exchange.
For more information, please visit our new website at http://www.honeybadgersilver.com.
Or contact: Ms. Christina Slater at cslater@honeybadgersilver.com.
About Honey Badger Silver Inc.
Honey Badger Silver is a Canadian silver company based in Toronto, Ontario focused on the acquisition, development, and integration of accretive transactions of silver ounces. The company is led by a highly experienced leadership team with a track record of value creation backed by a skilled technical team. With a dominant land position in Ontario’s historic Thunder Bay Silver District and advanced projects in the southeast and south-central Yukon, Honey Badger Silver is positioning to be a top tier silver company. The Company’s common shares trade on the TSX Venture Exchange under the symbol “TUF”.
Neither TSX Venture Exchange nor its Regulation Services Provider (as that term is defined in policies of the TSX Venture Exchange) accepts responsibility for the adequacy or accuracy of this release.
This News Release contains forward-looking statements. In some cases, you can identify forward-looking statements by terminology such as “may”, “should”, “expects”, “plans”, “anticipates”, “believes”, “estimates”, “predicts”, “potential” or “continue” or the negative of these terms or other comparable terminology. These statements are only predictions and involve known and unknown risks, uncertainties and other factors that may cause our or our industry’s actual results, levels of activity, performance or achievements to be materially different from any future results, levels of activity, performance or achievements expressed or implied by these forward-looking statements.
Although the Company believes that the assumptions and factors used in preparing the forward-looking information in this news release are reasonable, undue reliance should not be placed on such information, which only applies as of the date of this news release. The Company disclaims any intention or obligation to update or revise any forward-looking information, whether as a result of new information, future events or otherwise, other than as required.
Figure 1: Map depicting select mineralized zones at Plata in relation to the Plata Thrust Fault and the Aho Zone is available at https://www.globenewswire.com/NewsRoom/AttachmentNg/3f0bccd2-cebf-4419-875a-227888c8859f
DENVER, CO / ACCESSWIRE / July 8, 2021 / Gold Resource Corporation (NYSE American:GORO) (the "Company") will issue a news release providing a summary of its financial and operating results for the second quarter ended June 30, 2021 on Wednesday, July 27, 2021 after the market close, file its 10Q with the financial and operating results for the period ended June 30, 2021 with EDGAR and host a conference call on Thursday, July 28, 2021 at 11:00 a.m. Eastern Time.
The conference call will be recorded and posted to the Company's website later in the day following the conclusion of the call. Following prepared remarks, Allen Palmiere, President and Chief Executive Officer, Kim Perry, Chief Financial Officer and Alberto Reyes, Chief Operating Officer will host a live question and answer (Q&A) session. There are two ways to join the conference call.
To join the conference via webcast, please click on the following link: https://www.webcaster4.com/Webcast/Page/2361/42039.
To join the call via telephone please use one of the following dial-in details:
Participant Toll Free: 877-545-0320
Participant International: 973-528-0016
Entry Code: 758194
Please connect to the conference call at least 10 minutes prior to the start time using one of the connection options listed above.
About GRC:
Gold Resource Corporation is a gold and silver producer, developer and explorer with operations in Oaxaca, Mexico. Under the direction of a new board and senior leadership, the focus is to unlock the significant upside potential of its existing infrastructure and large land position surrounding the mine. For more information, please visit GRC's website, located at www.goldresourcecorp.com and read the Company's 10-K for an understanding of the risk factors involved.
Contacts:
Ann Wilkinson
Vice President, Investor Relations and Corporate Affairs
Ann.Wilkinson@GRC-USA.com
www.GoldResourcecorp.com
SOURCE: Gold Resource Corporation
View source version on accesswire.com:
https://www.accesswire.com/654831/Gold-Resource-Corporation-to-Hold-Conference-Call-to-Discuss-Q2-2021-Financial-and-Operating-Results-on-July-28-2021
Silvercorp Metals (TSE:SVM) has had a rough month with its share price down 9.7%. However, stock prices are usually driven by a company’s financials over the long term, which in this case look pretty respectable. In this article, we decided to focus on Silvercorp Metals' ROE.
Return on equity or ROE is an important factor to be considered by a shareholder because it tells them how effectively their capital is being reinvested. In simpler terms, it measures the profitability of a company in relation to shareholder's equity.
Check out our latest analysis for Silvercorp Metals
How To Calculate Return On Equity?
ROE can be calculated by using the formula:
Return on Equity = Net Profit (from continuing operations) ÷ Shareholders' Equity
So, based on the above formula, the ROE for Silvercorp Metals is:
11% = US$61m ÷ US$566m (Based on the trailing twelve months to March 2021).
The 'return' is the income the business earned over the last year. One way to conceptualize this is that for each CA$1 of shareholders' capital it has, the company made CA$0.11 in profit.
Why Is ROE Important For Earnings Growth?
Thus far, we have learned that ROE measures how efficiently a company is generating its profits. Based on how much of its profits the company chooses to reinvest or "retain", we are then able to evaluate a company's future ability to generate profits. Generally speaking, other things being equal, firms with a high return on equity and profit retention, have a higher growth rate than firms that don’t share these attributes.
Silvercorp Metals' Earnings Growth And 11% ROE
At first glance, Silvercorp Metals seems to have a decent ROE. Be that as it may, the company's ROE is still quite lower than the industry average of 15%. However, the moderate 11% net income growth seen by Silvercorp Metals over the past five years is definitely a positive. So, there might be other aspects that are positively influencing earnings growth. For instance, the company has a low payout ratio or is being managed efficiently. However, not to forget, the company does have a decent ROE to begin with, just that it is lower than the industry average. So this also provides some context to the earnings growth seen by the company.
Next, on comparing with the industry net income growth, we found that Silvercorp Metals' reported growth was lower than the industry growth of 29% in the same period, which is not something we like to see.

Earnings growth is a huge factor in stock valuation. It’s important for an investor to know whether the market has priced in the company's expected earnings growth (or decline). This then helps them determine if the stock is placed for a bright or bleak future. What is SVM worth today? The intrinsic value infographic in our free research report helps visualize whether SVM is currently mispriced by the market.
Is Silvercorp Metals Efficiently Re-investing Its Profits?
In Silvercorp Metals' case, its respectable earnings growth can probably be explained by its low three-year median payout ratio of 10% (or a retention ratio of 90%), which suggests that the company is investing most of its profits to grow its business.
Besides, Silvercorp Metals has been paying dividends for at least ten years or more. This shows that the company is committed to sharing profits with its shareholders. Based on the latest analysts' estimates, we found that the company's future payout ratio over the next three years is expected to hold steady at 10%.
Conclusion
Overall, we feel that Silvercorp Metals certainly does have some positive factors to consider. In particular, it's great to see that the company is investing heavily into its business and along with a moderate rate of return, that has resulted in a respectable growth in its earnings. Having said that, on studying current analyst estimates, we were concerned to see that while the company has grown its earnings in the past, analysts expect its earnings to shrink in the future. Are these analysts expectations based on the broad expectations for the industry, or on the company's fundamentals? Click here to be taken to our analyst's forecasts page for the company.
This article by Simply Wall St is general in nature. It does not constitute a recommendation to buy or sell any stock, and does not take account of your objectives, or your financial situation. We aim to bring you long-term focused analysis driven by fundamental data. Note that our analysis may not factor in the latest price-sensitive company announcements or qualitative material. Simply Wall St has no position in any stocks mentioned.
Have feedback on this article? Concerned about the content? Get in touch with us directly. Alternatively, email editorial-team (at) simplywallst.com.
TORONTO, July 08, 2021 (GLOBE NEWSWIRE) — Dundee Precious Metals Inc. (TSX: DPM) (“DPM” or “the Company”) announced strong preliminary production results from both of its mines and the smelter for the three and six months ended June 30, 2021.
“We achieved a new record for gold production in the second quarter as a result of strong performance from our mining operations,” said David Rae, President and Chief Executive Officer. “Our strong gold production, combined with solid smelter performance in Q2, positions us well to achieve our 2021 guidance at each of our operations.”
Production Highlights
Preliminary results for the second quarter and first half of 2021 are provided in the table below:
|
Ore |
Metals contained in |
Payable metals in |
Complex |
|||
|
(Kt) |
Gold |
Copper |
Gold |
Copper |
(Kt) |
|
|
Q2 2021 |
||||||
|
Chelopech |
535,575 |
52,600 |
10.0 |
39,200 |
9.5 |
– |
|
Ada Tepe |
207,034 |
32,500 |
– |
31,200 |
– |
– |
|
Tsumeb |
– |
– |
– |
– |
– |
59,600 |
|
Consolidated |
742,610 |
85,100 |
10.0 |
70,400 |
9.5 |
59,600 |
|
YTD 2021 |
||||||
|
Chelopech |
1,079,178 |
89,500 |
17.2 |
74,800 |
16.7 |
|
|
Ada Tepe |
425,689 |
65,900 |
– |
64,200 |
– |
|
|
Tsumeb |
– |
– |
– |
– |
– |
82,600 |
|
Consolidated |
1,504,866 |
155,400 |
17.2 |
139,000 |
16.7 |
82,600 |
|
2021 full-year guidance(1) |
2,925 – 3,125 |
271 – 317 |
34 – 39 |
243 – 285 |
31 – 36 |
200 – 220 |
(1) As disclosed in Management’s Discussion and Analysis (“MD&A”) for the quarter ended March 31, 2021, issued on May 5, 2021 and available at www.sedar.com and at www.dundeeprecious.com
Chelopech produced 52,600 ounces of gold and 10.0 million pounds of copper during the second quarter. Gold production, which increased significantly compared with the first quarter, was higher than expected as a result of mining higher grade zones and improved recoveries. Payable metals in concentrate sold for Chelopech also increased during the quarter, reflecting higher overall production, partially offset by the timing of pyrite concentrate shipments related to higher than anticipated production in the second half of June.
Ada Tepe continued to deliver strong gold production, producing 32,500 gold ounces in the second quarter, which was in line with the mine plan.
The Tsumeb smelter delivered solid performance during the second quarter, processing 59,600 tonnes of complex concentrate, an increase compared with the first quarter following the completion of the planned Ausmelt furnace maintenance in March.
With strong performance in the first half of the year, the Company is on track to meet its previously issued guidance for 2021 at each of its operations.
Dividend
As previously announced in May 2021, and in line with its disciplined capital allocation framework, DPM will pay a quarterly dividend of US$0.03 per share on July 15, 2021 to shareholders of record as at 5:00 p.m. Toronto local time on June 30, 2021.
Second Quarter 2021 Operating and Financial Results
The Company plans to release its second quarter 2021 operating and financial results after market close on Thursday, July 29, 2021. The news release, MD&A and consolidated financial statements will be posted on SEDAR at www.sedar.com and on the Company’s website at www.dundeeprecious.com.
On Friday, July 30, 2021 at 9 AM EDT, DPM will host a conference call and audio webcast to discuss the results, followed by a question-and-answer session. Participants are encouraged to dial into the call 15 minutes before its scheduled start time or to join via the audio webcast to reduce hold time in advance of the call.
The call-in numbers and webcast details are as follows:
|
Date and Time |
Friday, July 30, 2020 |
|
Webcast link |
|
|
Telephone dial-in |
Toll-free (Canada and US): 1-844-402-0878 |
|
Replay |
Toll-Free (Canada and US): 1-855-859-2056 |
Technical Information
The technical and scientific information in this press release has been reviewed and approved by Ross Overall, B.Sc. (Applied Geology), Corporate Mineral Resource Manager of DPM, who is a Qualified Person as defined under National Instrument 43-101, and not independent of the Company.
About Dundee Precious Metals Inc.
Dundee Precious Metals Inc. is a Canadian-based international gold mining company with operations and projects located in Bulgaria, Namibia and Serbia. The Company’s purpose is to unlock resources and generate value to thrive and growth together. This overall purpose is supported by a foundation of core values, which guides how the Company conducts its business and informs a set of complementary strategic pillars and objectives related to ESG, innovation, optimizing our existing portfolio, and growth. The Company’s resources are allocated in-line with its strategy to ensure that DPM delivers value for all of its stakeholders. DPM’s shares are traded on the Toronto Stock Exchange (symbol: DPM).
For further information please contact:
David Rae
President and Chief Executive Officer
Tel: (416) 365-5092
drae@dundeeprecious.com
Jennifer Cameron
Director, Investor Relations
Tel: (416) 219-6177
jcameron@dundeeprecious.com
Cautionary Note Regarding Forward-Looking Statements
This press release contains “forward looking statements” or “forward looking information” (collectively, “Forward Looking Statements”) that involve a number of risks and uncertainties. Forward Looking Statements are statements that are not historical facts and are generally, but not always, identified by the use of forward looking terminology such as “plans”, “expects”, “is expected”, “budget”, “scheduled”, “estimates”, “forecasts”, “outlook”, “intends”, “anticipates”, “believes”, or variations of such words and phrases or that state that certain actions, events or results “may”, “could”, “would”, “might” or “will” be taken, occur or be achieved, or the negative of any of these terms or similar expressions. The Forward Looking Statements in this press release relate to the Company’s outlook for its 2021 production performance. Forward Looking Statements are based on certain key assumptions and the opinions and estimates of management, as of the date such statements are made, and they involve known and unknown risks, uncertainties and other factors which may cause the actual results, performance or achievements of the Company to be materially different from any other future results, performance or achievements expressed or implied by the Forward Looking Statements. In addition to factors already discussed in this press release, such factors include, among others, risks relating to the Company’s business generally and as magnified by the impact of COVID-19, including, changes to the Company’s supply chain; product shortages; delivery and shipping issues; closures and/or failure of plant, equipment or processes to operate as anticipated; employees and contractors becoming infected with COVID-19; lost work hours; labour force shortages; fluctuations in metal and acid prices, toll rates and foreign exchange rates; possible variations in ore grade and recovery rates; uncertainties inherent with conducting business in foreign jurisdictions where corruption, civil unrest, political instability and uncertainties with the rule of law may impact the Company’s activities; limitation on insurance coverage; accidents, labour disputes and other risks of the mining industry; social and non-government organizations opposition to mining projects and smelting operations; unanticipated title disputes; claims or litigation; cyber attacks; as well as those risk factors discussed or referred to in any other documents (including without limitation the Company’s most recent Annual Information Form) filed from time to time with the securities regulatory authorities in all provinces and territories of Canada and available on SEDAR at www.sedar.com. The reader has been cautioned that the foregoing list is not exhaustive of all factors which may have been used. Although the Company has attempted to identify important factors that could cause actual actions, events or results to differ materially from those described in Forward Looking Statements, there may be other factors that cause actions, events or results not to be anticipated, estimated or intended. There can be no assurance that Forward Looking Statements will prove to be accurate, as actual results and future events could differ materially from those anticipated in such statements. The Company’s Forward Looking Statements reflect current expectations regarding future events and speak only as of the date hereof. Unless required by securities laws, the Company undertakes no obligation to update Forward Looking Statements if circumstances or management’s estimates or opinions should change. Accordingly, readers are cautioned not to place undue reliance on Forward Looking Statements.
VANCOUVER, British Columbia, July 08, 2021 (GLOBE NEWSWIRE) — Endeavour Silver Corp. (TSX: EDR, NYSE: EXK) reports production of 1,073,724 silver ounces (oz) and 11,166 gold oz in Q2, 2021, for silver equivalent (“AgEq”) production of 2.0 million oz at an 80:1 silver:gold ratio. Production continues to outpace the 2021 production guidance of 6.1-7.1 million silver equivalent ounces, totaling 3.9 million AgEq oz for the 6 months ended June 30, 2021.
Quarterly production increased significantly compared to Q2, 2020, when mining operations were temporarily suspended as mandated by the Mexican government to halt the spread of the COVID-19 pandemic from April 2020 to late May 2020.
2021 Second Quarter Highlights
-
Consolidated Production Ahead of Plan: Silver equivalent production at each mine is on track to meet or exceed 2021 production plans.
-
Guanacevi Production Ahead of Plan: Higher throughput and higher grades resulted in production exceeding plan during the quarter and ahead of the annual plan.
-
Bolanitos Production on Plan: Processed tonnes were ahead of plan, offset by slightly lower ore grades than planned during the quarter.
-
El Compas Production on Plan: Processed tonnes were ahead of plan, offset by slightly lower ore grades than planned during the quarter.
-
Metal Sales and Inventories: Sold 1,120,266 oz silver and 9,810 oz gold, held 459,659 oz silver and 1,891 oz gold of bullion inventory and 12,159 oz silver and 944 oz gold in concentrate inventory. Management withheld metal from sale during the price correction over last two weeks of June and plans to sell the withheld metal inventory in anticipation of a precious metal prices rebound in 2021.
-
Sold the El Cubo Assets: Completed the sale of the El Cubo mine in Guanajuato, Mexico to Guanajuato Silver (Formerly named VanGold Mining Corp) for $15 million in cash and share payments, with up to $3 million in contingent payments.
-
Seamless Management Succession Plan: Bradford Cooke stepped down as CEO and assumed the role of Executive Chair of the Company following the AGM on May 12, 2021. Dan Dickson assumed the role of CEO and Christine West was promoted to CFO.
-
Delivered Positive Brownfields Exploration Results at Guanacevi and Bolanitos: Drilling continued to intersect high-grade silver-gold mineralization in the Santa Cruz vein at Guanacevi, and in the Medallito and Belen veins at Bolanitos.
-
Delivered Positive Regional Exploration Result at the Terronera Development Project: Intercepted high-grade silver-gold mineralization in a number of structures near the Terronera vein. The Project Management Team continues to advance the feasibility study, which is expected to be completed during the third quarter of 2021.
Dan Dickson, Endeavour CEO, commented, “I am excited to lead the Endeavour team into the Company’s next chapter. I want to commend our management and employees who have professionally navigated the global pandemic with care and understanding for our fellow workers, business partners and communities. As an organization, our goal is to be a leader in our communities while delivering safe, sustainable production.”
In Q2, Endeavour delivered positive results in operations and exploration and is pushing to advance the Terronera project to a development decision with the completion of the Terronera Feasibility Study in Q3, 2021.”
Mine Operations
Consolidated silver and gold production in Q2, 2021 were both higher than Q2, 2020 due to the suspension of the Guanacevi, Bolanitos and El Compas mines as a result of the COVID-19 pandemic in Q2, 2020. Q2, 2021 production slightly exceeded plan as higher throughput at each operation contributed to the higher production.
Guanacevi throughput exceeded plan and was the highest quarterly throughput since 2014 as operations continued to outperform. Mining the new higher grade El Curse orebodies has led to significantly improved grades and mine plan flexibility. Additionally, supplies of local third-party ores continued to supplement mine production, amounting to 10% of quarterly throughput, and contributed to the higher ore grades.
Bolanitos and El Compas processed tonnes, were all higher compared to plan, partly offset by slightly lower grades due to normal variations in the ore body. It is expected that grades will align with planned grades over the course of the year. As previously disclosed by the Company (see EDR news release dated January 7, 2021), the existing reserve at El Compas is limited and sufficient to continue mining until mid-2021. Management is currently assessing alternatives, including temporary closure.
COVID-19 pandemic remains relevant in Mexico, and at the Company’s business locations, process and protocols remain in place to ensure staff and workers as well as our communities remain as safe as possible. Vaccination programs are advancing in Mexico to allow a return of a new normal in the second half of this year.
Production Highlights for Three Months and Six Months Ended June 30, 2021
|
Three Months Ended June 30 |
Q2 2021 Highlights |
Six Months Ended June 30 |
||||
|
2021 |
2020 |
% Change |
2021 |
2020 |
% Change |
|
|
242,018 |
114,120 |
112% |
Throughput (tonnes) |
451,471 |
313,447 |
44% |
|
1,073,724 |
596,545 |
80% |
Silver ounces produced |
2,121,824 |
1,454,204 |
46% |
|
11,166 |
5,817 |
92% |
Gold ounces produced |
22,275 |
14,293 |
56% |
|
1,062,267 |
590,618 |
80% |
Payable silver ounces produced |
2,098,977 |
1,440,409 |
46% |
|
10,955 |
5,717 |
92% |
Payable gold ounces produced |
21,849 |
14,037 |
56% |
|
1,967,004 |
1,061,905 |
85% |
Silver equivalent ounces produced(1) |
3,903,824 |
2,597,644 |
50% |
|
1,120,266 |
634,839 |
76% |
Silver ounces sold |
1,743,645 |
1,300,339 |
34% |
|
9,810 |
5,218 |
88% |
Gold ounces sold |
20,473 |
12,672 |
62% |
(1) Silver equivalent ounces calculated using 80:1 ratio.
Production Tables for Second Quarter, 2021 by Mine (1)
|
Production |
Tonnes |
Tonnes |
Grade |
Grade |
Recovery |
Recovery |
Silver |
Gold |
|
by mine |
Produced |
per day |
Ag gpt(1) |
Au gpt(1) |
Ag % |
Au % |
Oz |
Oz |
|
Guanaceví |
111,893 |
1,230 |
308 |
0.98 |
84.8% |
87.5% |
939,241 |
3,084 |
|
Bolañitos |
107,912 |
1,186 |
39 |
2.14 |
88.7% |
91.0% |
120,044 |
6,753 |
|
El Compas |
22,213 |
244 |
30 |
2.45 |
67.4% |
76.0% |
14,439 |
1,329 |
|
Consolidated |
242,018 |
2,660 |
163 |
1.63 |
84.9% |
87.9% |
1,073,724 |
11,166 |
(1) gpt = grams per tonne
Production Tables for Six Months Ended June 30, 2021 by Mine (1)
|
Production |
Tonnes |
Tonnes |
Grade |
Grade |
Recovery |
Recovery |
Silver |
Gold |
|
by mine |
Produced |
per day |
Ag gpt(1) |
Au gpt(1) |
Ag % |
Au % |
Oz |
Oz |
|
Guanaceví |
200,525 |
1,102 |
335 |
1.01 |
86.0% |
89.5% |
1,857,458 |
5,827 |
|
Bolañitos |
205,604 |
1,130 |
39 |
2.15 |
87.8% |
91.0% |
226,271 |
12,935 |
|
El Compas |
45,342 |
249 |
39 |
3.30 |
67.0% |
73.0% |
38,095 |
3,513 |
|
Consolidated |
451,471 |
2,481 |
170 |
1.76 |
85.8% |
87.2% |
2,121,824 |
22,275 |
(2) gpt = grams per tonne
Paloma Drill Results
Endeavour drilling has confirmed widespread alteration and low grade gold mineralization at its Paloma project. The Paloma project is a high-sulphidation, epithermal-style hydrothermal system located in the Chilean Miocene deposit belt, 180 kilometers southeast of the city of Calama, 5,000 metres above sea level. Endeavour has an option to acquire up to 70% ownership of 5,100 hectares from Compañía Minera del Pacifico.
To date, Endeavour completed 5,945 metres of diamond drilling in 13 drill holes. Highlights include 0.4 grams per tonne of gold over 46 metres true width, however it is interpreted that the drilling did not reach the core of the system. The exploration team is currently analyzing the drill results to develop the next phase drill program to test for the possibility of higher grade mineralization.
Management Appointment
Endeavour Silver is pleased to announce that Galina Meleger has been promoted to the position of Vice President of Investor Relations effective July 15th, 2021. Galina has been with Endeavour Silver since 2017 and brings extensive knowledge and leadership to her role with a strong understanding of business goals and a global investor network. Galina Meleger has over 15 years’ experience in the resource sector, in the capacity of investor relations, corporate communications and more recently ESG. During 2021, Galina was the recipient of several industry awards including the “Belle Mulligan Award for Leadership in Investor Relations” from CIRI (Canadian Investor Relations Institute) and the “30 under 40” which honors the most talented individuals in the investor relations community from NIRI (National Investor Relations Institute). Galina’s career history includes successful and highly regarded companies, with international listings, including, Newmarket Gold and then subsequently Kirkland Lake Gold, KGHM, and Copper Mountain Mining Corporation.
Release of Second Quarter, 2021 Financial Results and Conference Call
The 2021 Second Quarter Financial Results will be released before market on Tuesday, August 10, 2021 and a telephone conference call will be held the same day at 10:00am PT (1:00pm ET). To participate in the conference call, please dial the numbers below. No pass code is necessary.
Toll-free in Canada and the US: 1-800-319-4610
Local Vancouver: 604-638-5340
Outside of Canada and the US: +604-638-5340
A replay of the conference call will be available by dialing 1-800-319-6413 in Canada and the US (toll-free) or +604-638-9010 outside of Canada and the US. The required pass code is 7318#. The audio replay and a written transcript will be available on the Company’s website at www.edrsilver.com under the Investor Relations, Events section.
Qualified Person and QA/QC – Dale Mah, P.Geo., Vice President Corporate Development of Endeavour Silver, is the Qualified Person who reviewed and approved the technical information contained in this news release. A Quality Control sampling program of reference standards, blanks and duplicates has been instituted to monitor the integrity of all assay results. All samples are split at the local field office and shipped to SGS Labs, where they are dried, crushed, split and 250 gram pulp samples are prepared for analysis. Gold is determined by fire assay with an atomic absorption (AAS) finish and silver by aqua regia digestion with ICP finish, over-limits by fire assay and gravimetric finish.
About Endeavour Silver – Endeavour Silver Corp. is a mid-tier precious metals mining company that owns and operates three high-grade, underground, silver-gold mines in Mexico. Endeavour is currently advancing the Terronera mine project towards a development decision and exploring its portfolio of exploration and development projects in Mexico and Chile to facilitate its goal to become a premier senior silver producer. Our philosophy of corporate social integrity creates value for all stakeholders.
SOURCE Endeavour Silver Corp.
Contact Information:
Galina Meleger, Director, Investor Relations
Toll free: (877) 685-9775
Tel: (604) 640-4804
Email: gmeleger@edrsilver.com
Website: www.edrsilver.com
Follow Endeavour Silver on Facebook, Twitter, Instagram and LinkedIn
Cautionary Note Regarding Forward-Looking Statements
This news release contains “forward-looking statements” within the meaning of the United States private securities litigation reform act of 1995 and “forward-looking information” within the meaning of applicable Canadian securities legislation. Such forward-looking statements and information herein include but are not limited to statements regarding the impact of suspension of mining operations, Endeavour’s anticipated performance in 2021, including production forecasts, cost estimates and metal price estimates, and the timing and results of mine expansion and development and receipt of various permits. The Company does not intend to and does not assume any obligation to update such forward-looking statements or information, other than as required by applicable law.
Forward-looking statements or information involve known and unknown risks, uncertainties and other factors that may cause the actual results, level of activity, performance or achievements of Endeavour and its operations to be materially different from those expressed or implied by such statements. Such factors include, among others, uncertainty of the ultimate impact of the COVID 19 pandemic on operations, changes in national and local governments, legislation, taxation, controls, regulations and political or economic developments in Canada and Mexico; operating or technical difficulties in mineral exploration, development and mining activities; risks and hazards of mineral exploration, development and mining; metal prices; the speculative nature of mineral exploration and development, risks in obtaining necessary licenses and permits, and challenges to the Company’s title to properties; as well as those factors described in the section “risk factors” contained in the Company’s most recent form 40F/Annual Information Form filed with the S.E.C. and Canadian securities regulatory authorities.
Forward-looking statements are based on assumptions management believes to be reasonable, including but not limited to: the continued operation of the Company’s mining operations, the impact of the COVID 19 pandemic on mining operations in Mexico generally, and the Company’s operations specifically, no material adverse change in the market price of commodities, mining operations will operate and the mining products will be completed in accordance with management’s expectations and achieve their stated production outcomes, resource and reserve estimates, metal prices, and such other assumptions and factors as set out herein. Although the Company has attempted to identify important factors that could cause actual results to differ materially from those contained in forward-looking statements or information, there may be other factors that cause results to be materially different from those anticipated, described, estimated, assessed or intended. There can be no assurance that any forward-looking statements or information will prove to be accurate as actual results and future events could differ materially from those anticipated in such statements or information. Accordingly, readers should not place undue reliance on forward-looking statements or information.
If you would like to receive our free newsletter via email, simply enter your email address below & click subscribe.
 Follow us on Twitter
 Become our facebook fan
CONNECT WITH US
Tweets
Tweet with hash tag #miningfeeds or @miningfeeds and your tweets will be displayed across this site.
MOST ACTIVE MINING STOCKS
Daily Gainers
 Midlands Minerals Corp. Midlands Minerals Corp. |
MEX.V | +66.88% |
| GoviEx Uranium Inc. |
GXU.V | +42.86% |
 Mount Burgess Mining NL Mount Burgess Mining NL |
MTB.AX | +33.33% |
| Sunridge Gold Corp. |
SGC.V | +30.77% |
| Casa Minerals Inc. |
CASA.V | +30.00% |
| Radisson Mining Resources Inc. |
RDS.V | +25.74% |
| International Lithium Corp. |
ILC.V | +25.00% |
| Poseidon Nickel Limited |
POS.AX | +25.00% |
| Richmond Minerals Inc. |
RMD.V | +23.53% |
| Encounter Resources Ltd. |
ENR.AX | +20.00% |