Program focused on priority bulk tonnage and high-grade vein targets plus higher-grade resource definition
VANCOUVER, BC / ACCESSWIRE / June 16, 2021 / Rockhaven Resources Ltd. (TSXV:RK) ("Rockhaven") is pleased to announce that crews have mobilized and the 2021 exploration program has begun at its 100%-owned and road accessible Klaza project, located in the Dawson Range Gold Belt of southern Yukon, Canada.
The fully funded program will utilize two diamond drills that will complete 12,000m of drilling focused on both exploration discoveries at high-priority targets and continued definition of existing mineral resources. Priorities for the program include:
-
Discovery focused exploration drilling (7,000m in 34 holes) at both copper-gold-molybdenum porphyry-style bulk tonnage and high-grade gold-silver epithermal targets;
-
Resource definition infill drilling (5,000m in 33 holes) of wider, higher-grade inferred resources for continued conversion into indicated resources;
-
Regional target evaluations at Rusk Creek, Dade, Bear and Nansen Ridge prospects; and,
-
Continued engineering and baseline permitting work.
"We are thrilled to begin 2021 work at Klaza, testing both new epithermal vein and porphyry-style bulk-tonnage exploration prospects as well as defining additional indicated resources through the infill drilling portion of the program," stated Matt Turner, Rockhaven's CEO. "Additionally, environmental baseline studies and engineering work will ramp up as the project advances towards pre-feasibility in 2022."
As detailed in the May 10, 2021, Rockhaven Press Release, the proposed drill program aims to enhance the Klaza project's scale and economics through work on the targets discussed below.
Exploration Drilling
Priority exploration areas include bulk tonnage copper-gold-molybdenum-silver porphyry and high-grade gold-silver epithermal vein targets. The porphyry targets include the Kelly and Etzel/Cyprus Porphyry zones that are highlighted by soil geochemical and geophysical anomalies that each covers an approximate 4km2 area. These targets lie to the southeast of the vein system hosting the Klaza Deposit and exhibit lithogeochemical and alteration signatures consistent with bulk tonnage porphyry-style mineralization. A total of 17 holes are planned to test these zones.
The 2021 drilling will also explore for extensions to known higher-grade gold-silver vein systems, including the high-grade Western BRX, Western Chevron and newly discovered Rusk vein complex. The Rusk Zone is located 3 km south of the Klaza Deposit and was discovered in 2020 when drilling intersected several zones of gold-silver-lead-zinc mineralization over thicknesses of 1-10 m. The program will evaluate the strike extent and grade continuity of the strongest veins. The Western BRX Zone is the highest-grade gold zone identified on the property to date and is only lightly explored to the west of the current mineral resource. The 2021 drilling will test for strike extensions of the vein to the west, where coincident magnetic and VLF-EM anomalies have been defined which are similar to those that mark the main mineralized structures at Klaza, including the Western BRX vein. The Western Chevron Zone is located south of the Western BRX Zone but within the same fault block. This promising target has only been tested by two holes and one trench over a 500m inferred strike length, all of which produced strong gold-silver intercepts.
Klaza Deposit Infill Drilling
Infill drilling of the Klaza Deposit will focus on upgrading inferred resources into indicated resources. At present, 60% of the total mineral resources at Klaza are classified as indicated and 40% as inferred. A total of 5,000m of infill drilling in 33 holes is planned for 2021. This drilling will also support additional metallurgical test work and engineering studies as the Klaza project continues towards pre-feasibility.
Regional Target Evaluations
In addition to the drill program, 2021 work will evaluate four other promising prospects on the Klaza property. Depending on the results, these prospects may be drill tested later in the season. Maps showing details of these prospects can be viewed on the Rockhaven website at www.rockhavenresources.com.
Rusk Creek
The Rusk Creek prospect is located 5km south of the Klaza Deposit and features a broad silver, lead, zinc, copper and molybdenum soil geochemical anomaly that surrounds a pronounced vegetative kill zone. Kill zones are typically caused by an increased metal content in soil. A single historical diamond drill hole, collared well above the main geochemical anomalies and 500m west of the kill zone was weakly mineralized yet cut porphyry-style alteration throughout the length of the hole. A single rock sample collected near the kill zone in 2020 returned 0.7g/t gold, 382g/t silver and 7.73% lead. Additional prospecting, followed by excavator trenching, is planned at this target in 2021.
Dade and Bear Zones
The Dade Zone hosts epithermal mineralization and lies approximately 4km east of the Klaza Deposit. Intermittent exploration work has been completed at the zone with encouraging results, including rock grabs from trace to 73g/t gold, a trench intercept averaging 12.5g/t gold over 6m and a reverse circulation drill intercept that graded 5.3 g/t across 1.5 m.
The Bear Zone is located 2 km southeast of the Dade Zone. Only cursory work has been completed by previous operators, with the best float sample yielding 8.7g/t Au and 58g/t silver. In 2020, soil sampling was completed by Rockhaven over the Bear Zone to verify the target potential and identified an area highly anomalous in gold and arsenic returning peak values of 1140 ppb and 820 ppm, respectively.
Geophysical data, regional geological mapping and analysis of drill logs from the Dade Zone suggest that it and the Bear Zone lie within the same structural corridor. Work in 2021 will include detailed geological mapping, soil geochemical sampling between the Dade and Bear zones and hand trenching at the anomalous 2020 soil samples sites.
Mount Nansen Ridge
The Mount Nansen Ridge prospect is located 2km south of the Klaza Deposit. It hosts a 2.2km long multi-element soil geochemical anomaly that has not been tested by drilling or trenching. Work in 2021 will include detailed prospecting and geological mapping to better understand the source of these anomalous soils and additional soil sampling along the northwesterly projection of the target.
COVID-19 Protocols
In order to safely carry out the 2021 exploration program, Rockhaven has instituted extensive COVID-19 protocols designed to protect the workers at Klaza and the citizens of nearby communities. Rockhaven will continue to follow all recommendations from Yukon's Chief Medical Officer.
Qualified Persons
Technical information in this news release has been approved by Matthew R. Dumala, P.Eng., a geological engineer with Archer, Cathro & Associates (1981) Limited and qualified person for the purpose of National Instrument 43-101.
About Rockhaven
Rockhaven Resources Ltd. is a well-funded explorer focused on the exploration and development of its 100%-owned, camp-scale Klaza Property, which hosts the Klaza Deposit and numerous lightly explored exploration targets. The Klaza Deposit has indicated mineral resources of 4.5Mt containing 686,000 oz gold and 14 million oz silver at grades of 4.8g/t gold and 98g/t silver, and inferred mineral resources of 5.7Mt containing 507,000 oz gold and 13.9 million oz silver at grades of 2.8g/t gold and 76g/t silver. An updated Preliminary Economic Assessment of the Klaza deposit completed in 2020 returned a Post-Tax NPV(5%) of CAD$378 million and an IRR of 37%, using US$1,450/oz gold and US$17/oz silver (see Klaza Property Technical Report with an effective date of July 10, 2020 and titled, "Technical Report and Preliminary Economic Assessment Update for the Klaza Property, Yukon, Canada." which can be viewed at www.sedar.com under the Rockhaven profile or on the Rockhaven website at www.rockhavenresources.com).
Matthew Turner
President, CEO and Director
Rockhaven Resources Ltd.
T:604-687-2522
mturner@rockhavenresources.com
Neither the TSX Venture Exchange nor its Regulation Services Provider (as that term is defined in the policies of the TSX Venture Exchange) accepts responsibility for the adequacy or accuracy of this release.
Information contained in this news release contains forward-looking statements. These statements reflect management's current estimates, beliefs, intentions and expectations; they are not guarantees of future performance. Rockhaven cautions that all forward-looking statements are inherently uncertain and that actual performance may be affected by a number of material factors, many of which are beyond the control of Rockhaven. Such factors include, among other things: risks and uncertainties relating to exploration and development and the results thereof, the ability of Rockhaven to obtain additional financing, the need to comply with environmental and governmental regulations, fluctuations in the prices of commodities, operating hazards and risks, competition and other risks and uncertainties, including those described in Rockhaven's financial statements available under the Rockhaven profile at www.sedar.com. Accordingly, actual and future events, conditions and results may differ materially from the estimates, beliefs, intentions and expectations expressed or implied in the forward-looking information. Except as required under applicable securities legislation, Rockhaven undertakes no obligation to publicly update or revise forward-looking information.
SOURCE: Rockhaven Resources Ltd.
View source version on accesswire.com:
https://www.accesswire.com/651918/Rockhaven-Commences-Drilling-at-its-Klaza-Gold-Silver-Project-Yukon
VANCOUVER, British Columbia, June 15, 2021 (GLOBE NEWSWIRE) — Pretium Resources Inc. (TSX/NYSE: PVG) (“Pretivm” or the “Company”) today announced that it continues to intersect high grade gold mineralization in Phase 2 of the North Block resource expansion drill program at the Brucejack Mine in British Columbia.
Following up on the success of the Phase 1 drill program (see news release dated February 25, 2021) Pretivm initiated a second phase of drilling to test the extension of the North Block Zone to the northwest. The Phase 2 program identified high-grade gold mineralization with five intersections assaying above 1,000 grams per tonne gold. Results include, drill hole VU-2933 which assayed 561.6 grams per tonne gold over 15.0 meters, including 8,400 grams per tonne gold over 1.0 meter. In addition, drill hole VU-2932 assayed 306.6 grams per tonne gold over 19.5 meters, including 5,910 grams per tonne gold over 1.0 meter. High grade gold mineralization was intercepted up to 450 meters from the current resource shell.
“These impressive results confirm high-grade gold mineralization in the North Block Zone and further extend the potential of the Valley of the Kings deposit at Brucejack,” said Jacques Perron, President and Chief Executive Officer of Pretivm. “Based on the success of the second phase, we have initiated a third and fourth phase of the drill program to further delineate the potential of the North Block Zone.”
The North Block Zone is located directly to the north of the Valley of the Kings deposit. The resource expansion exploration program is designed to test for Valley of the Kings style mineralization to the north and at depth. Phase 2 of the program was drilled from the 1150 and 1070 levels in the mine, targeting an area extending up to 450 meters north of the current resource shell. Phase 3 of the program will infill between the existing drill fans and the newly designed Phase 4 of the program will test an area immediately to the northwest of the current drilling.
North Block – Phase 2 Results
Phase 2 of the North Block resource expansion drill program comprised 22,964 meters in 83 drill holes. Drilling from the 1150 level intersected the extension of the Domain 13 Stockwork, which is currently being mined in the Valley of the Kings. Drilling from the 1070 level intersected the recently identified corridor of gold mineralization in the footwall of the Domain 13 structure. This corridor features coarse electrum in northwest oriented quartz-carbonate veins within a broader halo of lower grade gold mineralization.
For a plan and section view of the 2020 North Block Phase 2 program please see the following link: http://ml.globenewswire.com/Resource/Download/a0d0b719-e832-45c0-b1a2-c18be5099170.
Significant drill results are shown below:
-
Hole VU-2933 intersected 561.6 grams per tonne gold over 15.0 meters, including 8,400 grams per tonne gold and 4,900 grams per tonne silver over 1.0 meters.
-
Hole VU-2932 intersected 306.6 grams per tonne gold over 19.5 meters, including 5,910 grams per tonne gold and 3,400 grams per tonne silver over 1.0 meters.
-
Hole VU-2962 intersected 191.6 grams per tonne gold over 14.0 meters, including 1,795 grams per tonne gold and 1,375 grams per tonne silver over 1.0 meters.
-
Hole VU-2859 intersected 31.6 grams per tonne gold over 51.0 meters, including 1,515 grams per tonne gold over 1.0 meters.
-
Hole VU-2967 intersected 61.7 grams per tonne gold over 17.5 meters, including 993 grams per tonne gold over 1.0 meters.
2021 Resource Expansion Drilling and Near-Mine Exploration Program
The resource expansion drill program is currently targeting the North Block Phase 3 and Phase 4 and the 1080 East Zone. In early July, two drills from underground will be repositioned to complete a 13,000-meter resource expansion drill program at Gossan Hill from surface. At the Bridge Zone, 11,000-meters of underground resource expansion drilling is expected to start in late August.
The near-mine exploration program is expected to start in mid-June with two additional drills on surface. The program will focus first on exploration targets at Shore Zone and SG Zone. Then, to follow up on the successful discovery of epithermal style gold mineralization at Hanging Glacier, a 10,000-meter drill program will be initiated in late July (see news release dated December 16, 2020).
In addition to drilling, the near-mine exploration program will include a UAV magnetic survey, MT and IP geophysical surveys, soil sampling and prospecting over the four-kilometer trend from Brucejack to Hanging Glacier.
Stephanie Wafforn, P.Geo., Pretivm’s Resource Manager is the Qualified Person as defined in National Instrument 43-101 Standards of Disclosure for Mineral Projects responsible for the Mineral Resource expansion drill program and the near-mine exploration program and has reviewed and approved the scientific and technical information in this news release related thereto.
Table 1: Selected North Block Phase 2 Results, June 2021 (VU-2762 to VU-2969)(1,2)
|
Hole No. |
Dip/ |
From |
To |
Length |
Gold (g/t) |
Comments |
|
Fan 1070W_L1 |
||||||
|
VU-2856 |
-55/358 |
57.0 |
94.5 |
37.5 |
7.7 |
|
|
Incl |
73.0 |
74.0 |
1.0 |
159.5 |
||
|
VU-2857 |
-45/358 |
0.0 |
12.0 |
12.0 |
6.3 |
|
|
VU-2859 |
-25/358 |
0.0 |
51.0 |
51.0 |
31.6 |
|
|
Incl |
46.0 |
47.0 |
1.0 |
1,515 |
897 gpt Ag |
|
|
VU-2860 |
-15/358 |
112.5 |
135.0 |
22.5 |
20.0 |
|
|
Incl |
116.0 |
117.0 |
1.0 |
155.5 |
||
|
VU-2863 |
16/358 |
131.0 |
132.0 |
1.0 |
469 |
|
|
Fan 1070E_LVL |
||||||
|
VU-2865 |
-55/025 |
1.5 |
24.0 |
22.5 |
60.2 |
|
|
Incl |
19.0 |
21.0 |
2.0 |
643 |
539 gpt Ag |
|
|
And |
151.5 |
156.0 |
4.5 |
12.9 |
||
|
VU-2866 |
-45/025 |
54.0 |
70.5 |
16.5 |
21.1 |
|
|
Incl |
57.0 |
58.5 |
1.5 |
190 |
||
|
VU-2870 |
-5/025 |
227.0 |
229.0 |
2.0 |
56.4 |
|
|
Fan 1070W_L2 |
||||||
|
VU-2925 |
-35/011 |
202.5 |
234.0 |
31.5 |
5.7 |
|
|
Incl |
229.0 |
230.0 |
1.0 |
146 |
||
|
VU-2926 |
-25/011 |
133.5 |
141.0 |
7.5 |
35.8 |
|
|
Incl |
137.5 |
138.5 |
1.0 |
262 |
193 gpt Ag |
|
|
VU-2928 |
-5/011 |
40.0 |
41.0 |
1.0 |
276 |
|
|
VU-2930 |
16/011 |
21.0 |
24.0 |
3.0 |
16.3 |
|
|
Fan 1070_RMK |
||||||
|
VU-2932 |
-55/025 |
97.5 |
117.0 |
19.5 |
306.6 |
|
|
Incl |
115.0 |
116.0 |
1.0 |
5,910 |
3,400 gpt Ag |
|
|
And |
135.5 |
143.5 |
8.0 |
38.9 |
||
|
Incl |
142.5 |
143.5 |
1.0 |
172.5 |
||
|
VU-2933 |
-45/025 |
1.5 |
16.5 |
15.0 |
561.6 |
|
|
Incl |
13.0 |
14.0 |
1.0 |
8,400 |
4,900 gpt Ag |
|
|
And |
89.5 |
90.5 |
1.0 |
201 |
178 gpt Ag |
|
|
VU-2934 |
-35/025 |
67.5 |
85.0 |
17.5 |
8.6 |
|
|
Incl |
84.0 |
85.0 |
1.0 |
128.5 |
159 gpt Ag |
|
|
VU-2935 |
-25/025 |
4.5 |
22.5 |
18.0 |
15.0 |
|
|
Incl |
15.0 |
16.0 |
1.0 |
231 |
||
|
Fan 1070W_L3 |
||||||
|
VU-2961 |
-55/025 |
171.0 |
213.5 |
42.5 |
24.5 |
|
|
Incl |
171.0 |
173.5 |
2.5 |
98.5 |
||
|
Incl |
187.5 |
190.5 |
3.0 |
60.0 |
||
|
Incl |
212.5 |
213.5 |
1.0 |
583 |
417 gpt Ag |
|
|
And |
235.5 |
245.0 |
9.5 |
11.8 |
||
|
VU-2962 |
-45/025 |
222.0 |
236.0 |
14.0 |
191.6 |
|
|
Incl |
222.0 |
223.5 |
1.5 |
424 |
197 gpt Ag |
|
|
Incl |
234.0 |
235.0 |
1.0 |
1,795 |
1,375 gpt Ag |
|
|
VU-2965 |
-15/025 |
66.0 |
69.0 |
3.0 |
750 |
|
|
Incl |
67.0 |
67.6 |
0.6 |
3,560 |
2,130 gpt Ag |
|
|
And |
171.0 |
172.0 |
1.0 |
495 |
443 gpt Ag |
|
|
VU-2966 |
-5/025 |
131.0 |
153.0 |
22.0 |
9.7 |
|
|
Incl |
145.5 |
147.0 |
1.5 |
105 |
||
|
VU-2967 |
5/057 |
115.5 |
133.0 |
17.5 |
61.7 |
|
|
Incl |
132.0 |
133.0 |
1.0 |
993 |
658 gpt Ag |
|
(1) True thickness to be determined.
(2) All samples were submitted for preparation and analysis by ALS Chemex at its facilities in Terrace, B.C. All samples were analyzed using multi-digestion with ICP-MS finish and fire assay with AA finish for gold. Samples over 100 ppm silver were reanalyzed using four acid digestion with an ore grade AA finish. Samples over 1,500 ppm silver were fire assayed with a gravimetric finish. Samples with over 10 ppm gold were fire assayed with a gravimetric finish. One in 20 samples was blank, one in 20 was a standard sample, and one in 20 samples had a sample cut from assay rejects assayed as a field duplicate at ALS Chemex in North Vancouver, B.C. ALS Chemex is independent of Pretivm.
About Pretivm
Pretivm is an intermediate gold producer with the high-grade gold underground Brucejack Mine.
For further information contact:
Troy Shultz
Manager, Investor Relations &
Corporate Communications
Pretium Resources Inc.
Suite 2300, Four Bentall Centre, 1055 Dunsmuir Street
PO Box 49334 Vancouver, BC V7X 1L4
(604) 558-1784
invest@pretivm.com
(SEDAR filings: Pretium Resources Inc.)
Regarding Forward-Looking Information
This news release contains “forward-looking information” and “forward looking statements” within the meaning of applicable Canadian and United States securities legislation (collectively herein referred to as “forward-looking information”), including the “safe harbour” provisions of Canadian provincial securities legislation and the U.S. Private Securities Litigation Reform Act of 1995, Section 21E of the U.S. Securities Exchange Act of 1934, as amended, and Section 27A of the U.S. Securities Act of 1933, as amended. Wherever possible, words such as “plans”, “expects”, “guidance”, “projects”, “assumes”, “budget”, “strategy”, “scheduled”, “estimates”, “forecasts”, “anticipates”, “believes”, “intends”, “modeled”, “targets” and similar expressions or statements that certain actions, events or results “may”, “could”, “would”, “might” or “will” be taken, occur or be achieved, or the negative forms of any of these terms and similar expressions, have been used to identify forward-looking information. Forward-looking information may include, but is not limited to: results, analyses and interpretations of exploration and drilling programs; our mining (including mining methods), expansion, exploration and development activities, including the reverse circulation drill program, our definition, sustaining, expansion and underground exploration drill programs and our grassroots exploration program, and the plans, specifications, targets, results, benefits, costs and timing thereof; expectations around grade of gold and silver production; Brucejack Mine production rate and gold recovery rate; our operational grade control program, including plans with respect to our infill drill program and our local grade control model; grade reconciliation, updated geological interpretation and mining initiatives with respect to the Brucejack Mine; our management, operational plans and strategy; capital, sustaining and operating cost estimates and timing thereof; the future price of gold and silver; our liquidity and the adequacy of our financial resources (including capital resources); our intentions with respect to our capital resources; capital allocation plans; the estimation of mineral resources and mineral resources including any updates thereto; parameters and assumptions used to estimate mineral resources and mineral resources; realization of mineral resource and mineral resource estimates; our estimated life of mine and life of mine plan for the Brucejack Mine; production and processing estimates and estimated rates; estimated economic results of the Brucejack Mine; predicted metallurgical recoveries for gold and silver; geological and mineralization interpretations; development of our Brucejack Mine and timing thereof; timelines and similar statements relating to the economic viability of the Brucejack Mine, including mine life, total tonnes mined and processed and mining operations; updates to our mineral resources and mineral resources and life of mine plan for the Brucejack Mine, and the anticipated effects and timing thereof; timing, receipt, and anticipated effects of, and anticipated capital costs in connection with, approvals, consents and permits under applicable legislation; the effects of the novel coronavirus (2019-nCoV) outbreak as a global pandemic and at the Brucejack Mine, including anticipated operational and financial impacts, and our response and contingency plans; the effectiveness and costs of our COVID-19 management plans including related protocols and procedures. Forward-looking information is subject to a variety of known and unknown risks, uncertainties and other factors that could cause actual results, actions, events, conditions, performance or achievements to materially differ from those expressed or implied by the forward-looking information including, without limitation, those related to: the effect of indebtedness on cash flow and business operations; the effect of a pandemic and particularly the COVID-19 outbreak as a global pandemic on the Company’s business, financial condition and results of operations and the impact of the COVID-19 outbreak on our workforce, suppliers and other essential resources and what effect those impacts, if they occur, would have on our business, financial condition and results of operations; the effects of the COVID-19 outbreak as a global pandemic and at the Brucejack Mine, including anticipated operational and financial impacts and our response and contingency plans; the effectiveness and costs of our COVID-19 management plans, including related protocols and procedures; assumptions regarding expected capital costs, operating costs and expenditures, production schedules, economic returns and other projections; our production, grade of gold, milling recovery, cash flow and cost estimates, including the accuracy thereof; commodity price fluctuations, including gold and silver price volatility; the accuracy of our Mineral Resource and Resource estimates (including with respect to size, grade and mining and milling recoverability) and the geological, operational costs and price assumptions on which they are based; uncertainties relating to inferred Mineral Resources being converted into Measured or Indicated Mineral Resources; our ability to maintain or increase our annual production of gold at the Brucejack Mine or discover, develop or acquire Mineral Resources for production; dependency on the Brucejack Mine for our future operating revenue; the development of our properties and expansion of our operations; our need or ability to raise enough capital to mine, develop, expand or complete further exploration programs on our mineral properties; our ability to generate operating revenues and cash flow in the future; failure of counterparties to perform their contractual obligations; general economic conditions; the inherent risks in the mining industry; the commercial viability of our current and any acquired mineral rights; availability of suitable infrastructure or damage to existing infrastructure; transportation, processing and refining risks; maintaining satisfactory labour relations with employees and contractors; significant governmental regulations, including environmental regulations; non-compliance with permits that are obtained or delay in obtaining or renewing, failure to obtain or renew permits required in the future; increased costs and restrictions on operations due to compliance with health, safety and environmental laws and regulations; compliance with emerging climate change regulation and the detrimental effects of climate change; potential opposition from non-governmental organizations; uncertainty regarding unsettled First Nations rights and title in British Columbia; maintaining our social license to operate; uncertainties related to title to our mineral properties and surface rights; land reclamation and mine closure requirements; our ability to identify and successfully integrate any material properties we acquire; currency exchange rate fluctuations; competition in the mining industry for properties, qualified personnel and management; our ability to attract and retain qualified management and personnel; potential inability to attract development partners or our ability to identify attractive acquisitions; compliance with foreign corrupt practices regulations and anti-bribery laws; changes to rules and regulations, including accounting practices; limitations in our insurance coverage and the ability to insure against certain risks; risks related to ensuring the security and safety of information systems, including cyber security risks; significant growth could place a strain on our management systems; share ownership by our significant shareholders and their ability to influence our operations and governance and, in case of sales of our shares by such significant shareholders, our share price; failure to comply with certain terms of the convertible notes; reputational risks; and certain actions under United States federal securities laws may be unenforceable. This list is not exhaustive of the factors that may affect any of our forward-looking information. Although we have attempted to identify important factors that could cause actual results, actions, events, conditions, performance or achievements to differ materially from those contained in forward-looking information, there may be other factors that cause results, actions, events, conditions, performance or achievements to differ from those anticipated, estimated or intended. Our forward-looking information is based on the assumptions, beliefs, expectations and opinions of management on the date the statements are made, many of which may be difficult to predict and beyond our control. In connection with the forward-looking information contained in this news release, we have made certain assumptions about, among other things: our business and operations and that no significant event will occur outside of our normal course of business and operations (other than as expressly set out herein); planned exploration, development and production activities and the results, costs and timing thereof; future price of gold and silver and other metal prices; the accuracy of our Mineral Resource and Mineral Resource estimates and related information, analyses and interpretations (including with respect to any updates or anticipated updates); the geology and mineralization of the Brucejack Project; operating conditions; capital and operating cost estimates; the results, costs and timing of future exploration and drilling; timelines and similar statements relating to the economic viability of the Brucejack Mine; timing and receipt of governmental, regulatory and third party approvals, consents, licenses and permits; obtaining required renewals for existing approvals, consents, licenses and permits; the geopolitical, economic, permitting and legal climate that we operate in; the adequacy of our financial resources, and our ability to raise any necessary additional capital on reasonable terms; commodity prices; currency exchange rates and interest rates; political and regulatory stability; requirements under applicable laws; market competition; sustained labour stability and availability of equipment; positive relations with local groups; stability in financial capital markets; and the impact of the COVID-19 outbreak. The Company cautions that the foregoing list of assumptions is not exhaustive. Other events or circumstances could cause actual results to differ materially from those estimated or projected and expressed in, or implied by, the forward-looking information contained in this news release. Additional information about the risks and uncertainties concerning forward-looking information and material factors or assumptions on which such forward-looking information is based is provided in our public disclosure documents as filed in Canada on SEDAR at www.sedar.com and in the United States through EDGAR at the Security and Exchange Commission’s (the “SEC”) website at www.sec.gov. Forward-looking information is not a guarantee of future performance. There can be no assurance that forward-looking information will prove to be accurate, as actual results and future events could differ materially from those anticipated in such information. Forward-looking information involves statements about the future and is inherently uncertain, and our actual achievements or other future events or conditions may differ materially from those reflected in the forward-looking information due to a variety of risks, uncertainties and other factors. For the reasons set forth above, readers should not place undue reliance on forward-looking information. We do not assume any obligation to update forward-looking information, whether as a result of new information, future events or otherwise, other than as required by applicable law. Neither the TSX nor the NYSE has approved or disapproved of the information contained herein.
Figure 1

Location of the Avispa Exploration Property Area and major copper mines in northern Chile.
TORONTO, June 15, 2021 (GLOBE NEWSWIRE) — Montero Mining and Exploration Ltd. (TSX-V: MON) (“Montero” or the “Company”) is pleased to announce the commencement of exploration of its 170 km2 Avispa copper molybdenum exploration concessions (Avispa or the “property”) located in the Atacama Desert of northern Chile. The Avispa project is situated within the well-defined north to south trending late Paleocene to early Eocene Cu-Mo porphyry belt of northern Chile that hosts some giant operating porphyry copper mines. The property is located approximately 40 km north of BHP’s Spence Cu-Mo mine and KGHM’s Sierra Gorda Cu-Mo mine which are situated in this belt. Avispa is also 50 km west of Codelco’s Chuquicamata supergiant porphyry copper mine that occurs within the younger late Eocene – early Oligocene porphyry belt (Figure 1). The property is surrounded by major mining companies with exploration and mining concessions including; Codelco in the north and Freeport and Glencor to the south with Antofagasta and SQM to the east and west.
The prospective geology of the Avispa project is below a sequence of cover rocks consisting of gravels and fine-grained clastic sediments intercalated with evaporite deposits of Tertiary age. These sediments are underlain by Paleocene volcanics and Cretaceous monzodiorite and diorite porphyries (Figure 1). The Avispa district was previously the target of some wide-spaced exploration drilling.
Dr. Tony Harwood, President and Chief Executive Officer of Montero commented, “Montero has secured 17,000 hectares in this highly prospective copper district in proximity and in the same geological setting as world class operating copper molybdenum mines. The Avispa exploration program will be the first step in defining drill target areas to test for buried porphyry and porphyry-related copper molybdenum mineral deposits.”
Figure 1 is available at https://www.globenewswire.com/NewsRoom/AttachmentNg/e8736c3f-158a-4086-af95-cf29fd57cb02
Planned Exploration Program
Montero has completed a thorough investigation of historical information on exploration in this highly prospective area and aims to utilize cutting edge exploration technology with the objective of developing drilling targets. The Company has planned an exploration program that includes; geological mapping, surface sampling, ground, and airborne geophysical surveys.
Reconnaissance mapping has shown extensive areas of Tertiary evaporites with intercalated sediments that overlay older volcanic and intrusive rocks hosting the porphyry deposits in the area. The area will be initially mapped and prospected on a scale of 1:10,000. A rock chip and soil sampling program will be undertaken to help define geochemical signatures of any buried mineralization. Our geologists will also sample surface RC stockpiles that have been left next to RC drill holed left by previous companies that has drilled in the area. Geophysical work planned in the future will include airborne magnetics over selected areas of the property to define possible buried porphyry targets and controlling structural features. Targets will be prioritized for reverse circulation drill testing.
Previous companies to have explored Avispa include BHP that conducted limited drilling on the property at 2 km to 3 km spacing as part of a regional exploration program. Montero believes that there is potential for buried porphyry and porphyry-related deposits with smaller footprints than those sought by major companies.
Montero’s Chief Geologist, Marcial Vergara, has reviewed publicly available data on Avispa and has conducted a field visit. Marcial previously worked for Codelco and Anglo American, both major operating copper mining companies in Chile. Montero has adopted a prospect generator model at Avispa where it will de-risk the project and carry out limited exploration while seeking a partner to advance the project through the drill phase. This will provide Montero shareholders with exposure to the copper space while it continues to focus on the gold-silver potential of southern Chile.
Qualified Person's Statement
This press release was reviewed and approved by Mr. Mike Evans, M.Sc. Pr.Sci.Nat. and Sr. Marcial Vergara B.Sc. who are qualified persons for the purpose of National Instrument 43-101. Sr Vergara is based in Santiago and has more than 30 years’ experience in copper exploration experience in Chile.
About Montero
Montero is a junior exploration company focused on finding, exploring, and advancing globally significant gold deposits in Latin America. The Company is in the process of relinquishing its portfolio of battery metal projects in Africa to focus on gold opportunities in Latin America. Montero’s board of directors and management have an impressive track record of successfully discovering and advancing precious metal and copper projects. Montero trades on the TSX Venture Exchange under the symbol MON and has 38,647,485 shares outstanding.
For more information, contact:
Montero Mining and Exploration Ltd.
Dr. Tony Harwood, President and Chief Executive Officer
E-mail: ir@monteromining.com
Tel: +1 416 840 9197 | Fax: +1 866 688 4671
www.monteromining.com
Neither TSX Venture Exchange nor its Regulation Services Provider (as that term is defined in the policies of the TSX Venture Exchange) accepts responsibility for the adequacy or accuracy of this release.
CAUTIONARY STATEMENT REGARDING FORWARD-LOOKING INFORMATION: This news release includes certain "forward-looking information" within the meaning of applicable Canadian securities laws. Forward looking information includes, but is not limited to, statements, projections and estimates with respect to the Share Consolidation. Generally, forward-looking information can be identified by the use of forward-looking terminology such as “plans”, “expects” or “does not expect”, “is expected”, “budget”, “scheduled”, “estimates”, “forecasts”, “intends”, “anticipates” or “does not anticipate”, or “believes”, or variations of such words and phrases or state that certain actions, events or results “may”, “could”, “would”, “might” or “will be taken”, “occur” or “be achieved”. Such information is based on information currently available to Montero and Montero provides no assurance that actual results will meet management's expectations. Forward-looking information by its very nature involves inherent risks and uncertainties that may cause the actual results, level of activity, performance, or achievements of Montero to be materially different from those expressed or implied by such forward-looking information. Actual results relating to, among other things, completion of the agreement, results of exploration, project development, reclamation and capital costs of Montero’s mineral properties, and financial condition and prospects, could differ materially from those currently anticipated in such statements for many reasons such as: an inability to complete the agreement on the terms as announced or at all; changes in general economic conditions and conditions in the financial markets; changes in demand and prices for minerals; litigation, legislative, environmental and other judicial, regulatory, political and competitive developments; technological and operational difficulties encountered in connection with Montero’s activities; and other matters discussed in this news release and in filings made with securities regulators. This list is not exhaustive of the factors that may affect any of Montero’s forward-looking statements. These and other factors should be considered carefully and accordingly, readers should not place undue reliance on forward-looking information. Montero does not undertake to update any forward-looking information, except in accordance with applicable securities laws.
$68 million1 exploration campaign is largest in Company history following up on last year’s record level;
Programs generating meaningful new discoveries and high-return future growth opportunities
CHICAGO, Jun 15, 2021–(BUSINESS WIRE)–Coeur Mining, Inc. ("Coeur" or the "Company") (NYSE: CDE) today provided an update on 2021 exploration programs at its Silvertip mine in British Columbia and Crown exploration property in Nevada. The Company highlighted new drilling results at the recently discovered Southern Silver Zone at Silvertip and at the four mineralized zones within the Crown Block – Daisy, Secret Pass, SNA and C-Horst. Through the first four months of 2021, Coeur drilled approximately 340,300 feet (103,750 meters) at six different locations – a 66% increase compared to the same period in 2020. Coeur anticipates investing $68 million1 in exploration this year, which would make this the largest exploration campaign in Coeur’s history and over 30% higher than last year’s exploration investment.
This press release features multimedia. View the full release here: https://www.businesswire.com/news/home/20210615005189/en/

Silvertip – Plan View (Photo: Business Wire)
Key Highlights2,3
-
New Silvertip zone represents significant near-mine, high-grade resource growth potential – Underground drilling at Silvertip has discovered a new mineralized zone called the Southern Silver Zone, located adjacent to and enveloping the historic 65 Zone manto mineralization. The grade and orientation of the Southern Silver Zone suggest the opportunity for bulk mining, which has the potential to lead to improved project economics. Notable assay results include:
-
Hole 65Z21-485-360-002 returned 21.0 feet (6.4 meters) of 14.4 ounces per ton ("oz/t") (493.7 grams per tonne ("g/t")) silver, 23.7% zinc and 8.7% lead
-
Hole 65Z21-485-360-020 returned 19.0 feet (5.8 meters) of 6.5 oz/t (222.9 g/t) silver, 21.0% zinc and 2.8% lead
-
Hole 65Z21-485-360-026 returned 21.0 feet (6.4 meters) of 18.4 oz/t (630.9 g/t) silver, 14.8% zinc and 10.5% lead, and 23.6 feet (7.2 meters) of 10.0 oz/t (342.9 g/t) silver, 11.7% zinc and 5.1% lead
-
Hole 65Z21-485-DDS1-003 returned 19.0 feet (5.8 meters) of 7.8 oz/t (267.4 g/t) silver, 21.3% zinc and 3.9% lead
-
Continued oxide-gold resource growth potential across all zones at Crown – New drill results at Crown demonstrate meaningful resource growth potential at the Daisy, Secret Pass, SNA and C-Horst zones. Notable assay results, from west to northeast across the zone, include:
Daisy
-
Hole D20-C004 returned 135.0 feet (41.1 meters) of 0.08 oz/t (2.6 g/t) gold
-
Hole D20-C006 returned 71.0 feet (21.6 meters) of 0.10 oz/t (3.5 g/t) gold, 50.0 feet (15.2 meters) of 0.05 oz/t (1.8 g/t) gold and 22.0 feet (6.7 meters) of 0.07 oz/t (2.5 g/t) gold
Secret Pass
-
Hole SP20-C003 returned 275.7 feet (84.0 meters) of 0.03 oz/t (1.1 g/t) gold
-
Hole SP20-C004 returned 55.0 feet (16.8 meters) of 0.13 oz/t (4.4 g/t) gold
-
Hole SP20-C002 returned 139.0 feet (42.4 meters) of 0.04 oz/t (1.2 g/t) gold and 129.0 feet (39.3 meters) of 0.03 oz/t (0.9 g/t) gold
SNA
-
Hole SNA20-C004 returned 32.0 feet (9.8 meters) of 0.03 oz/t (1.0 g/t) gold
C-Horst
-
Hole CH21-055 returned 245.0 feet (74.7 meters) of 0.05 oz/t (1.6 g/t) gold, 65.0 feet (19.8 meters) of 0.01 oz/t (0.4 g/t) gold and 30.0 feet (9.1 meters) of 0.02 oz/t (0.6 g/t) gold
-
Hole CH20-051 returned 335.0 feet (102.1 meters) of 0.03 oz/t (0.9 g/t) gold, 85.0 feet (25.9 meters) of 0.02 oz/t (0.8 g/t) gold and 100.0 feet (30.5 meters) of 0.02 oz/t (0.6 g/t) gold
"We are carrying out our most active exploration campaign in Coeur’s history with up to 22 drill rigs deployed across six sites, with positive results rolling in on a regular basis," said Hans J. Rasmussen, Coeur’s Senior Vice President of Exploration. "This update emphasizes the opportunity for growth at Silvertip and Crown, two of our most recent asset additions in top jurisdictions in-line with our strategy, both of which continue to demonstrate significant upside potential. Drilling at Silvertip continues to show promising results as demonstrated by the most recent assays from Hole 65Z21-485-360-026 at the Southern Silver Zone, which cut roughly 51 feet of massive sulfide mineralization hosted in vertically oriented breccia material. Successful results like these continue to reinforce Silvertip’s status as one of the world’s highest-grade silver-zinc-lead deposits and provide valuable data points as we work towards our goal of ending the year with a compelling business case to justify moving forward with an expansion and restart."
Mr. Rasmussen continued, "At Crown, we are just now beginning to test the true potential of most of the immense district, following the receipt of a 300-acre disturbance permit in late 2020. Importantly, we expect to receive an amended permit during the third quarter to allow us to begin step out drilling to test the growth potential of C-Horst, which was a new discovery in April of last year. We plan to complete an optimized resource and financial model for the entire district by the end of the year, which will lay the foundation for an initial economic assessment that we expect to release around mid-2022, highlighting the potential to combine and optimize a series of open pit, heap leach operations that incorporate all four of the mineralized zones within the Crown Block. Our dominant land position of approximately 35,500 net acres in southern Nevada represents a substantial organic growth opportunity for Coeur, and we are excited to continue working on a plan to develop the district."
For a complete table of all drill results, please refer to the following link: https://www.coeur.com/_resources/pdfs/2021-06-15_Exploration_Update_Appendix_-_Final.pdf. Please see the "Cautionary Statements" section for additional information regarding drill results.
Silvertip2,3
Building on its exploration success in late 2020, Coeur began the year drilling Silvertip with five surface rigs and one underground core rig focusing on resource expansion, while also conducting infill drilling on select areas of the deposit focused on converting existing resources to reserves. Through the first four months of 2021, Coeur drilled approximately 104,400 feet (31,825 meters) compared to roughly 16,700 feet (5,100 meters) during the same period in 2020.
The Company completed an underground development drift in late 2020 to access the 65 Zone, which is located south-southeast of the original Silver Creek mine area. Shortly after drilling from the drift began, Coeur discovered the new Southern Silver Zone which has a different geometry and completely envelops the historic 65 Zone. The Southern Silver Zone represents a new style of mineralization at Silvertip – breccia-type, karst controlled, which are vertically oriented and high grade, in contrast to the horizontal manto-style mineralization in the historic 65 Zone. Intercepts from the deepest holes in the Southern Silver Zone suggest it continues to depths beyond the current drilling, which has identified roughly 1,000 vertical feet (300 meters) of mineralization. As the Company is approaching the source of mineralization, it believes that the Southern Silver Zone may be a feeder structure and other, similar structures may exist as Coeur continues to drill horizontal holes from underground.
Based on encouraging initial results, Coeur mobilized a second underground rig as well as a surface core rig to focus on expanding the Southern Silver Zone. The exploration team on site also began re-evaluating historical core logs and photos with the goal of identifying similar karst-controlled structures and testing for vertically oriented mineralization in other parts of the mine. Three-dimensional modeling of all the geological and geophysical data suggests that the Southern Silver Zone connects the Silver Creek Zone with the Discovery South Zone, representing potential for significant resource growth.
To assist in new drill targeting and gain a better understanding of the regional exploration potential around Silvertip, an airborne Sky Time-Domain Electromagnetic ("SkyTEM") geophysical survey was completed in late March. The new SkyTEM data has the ability to map resistivity features to about 1,000 feet (300 meters) below surface. Based on preliminary review of the SkyTEM data, there appear to be several features that have potential to extend the Discovery, Camp Creek, Tour Ridge and Southern Silver zones as well as the Tiger Terrace target area.
Additionally, the Company recently repurchased an existing net smelter returns royalty ("NSR") at Silvertip for $7.0 million in cash. The terms of the NSR required payment of 1.429% (plus gross up for applicable withholding taxes) of net smelter returns on the first 1,434,000 metric tonnes of mineralized material mined, and 1.00% (plus gross up for applicable withholding taxes) thereafter, from the mining lease that covers the current Silvertip mine resource base and exploration targets described in this press release.
For the remainder of 2021, Coeur expects to focus on:
-
Drilling the southern and northern extensions of the Southern Silver Zone (both from underground and surface), possibly adding a third underground drill rig
-
Expanding the multiple stacked massive sulfide manto horizons at the Discovery North and East zones
-
Testing the extensions of the Camp Creek Zone to the north and south. To the south, the Camp Creek Zone may connect with the Tour Ridge Zone, located just over half a mile (roughly one kilometer) south and where all seven holes cut manto-style mineralization
-
Drilling the first holes at Tiger Terrace where coincident geochemical and geophysical anomalies, as well as geologic setting, suggest the presence of Silvertip-style mineralization
Crown Block2,3
The primary goal of Coeur’s 2021 exploration program at Crown is to build on the success from last year by continuing to focus on resource growth from known mineralization as well as prospective drilling on nearby targets and increasing the footprint of C-Horst, which was discovered in April 2020. Following the receipt of a 300-acre disturbance permit in late 2020, Coeur has begun drilling various targets identified over the past two years. The Company expects to receive an amendment to this permit during the third quarter to allow for drilling of mineralized extensions south of the first C-Horst drill platforms.
Three reverse circulation rigs and one core rig were active at Crown spread among the four mineralized zones (Daisy, Secret Pass, SNA and C-Horst).
Through the first four months of 2021, Coeur drilled approximately 49,400 feet (15,075 meters) at Crown compared to roughly 29,700 feet (9,050 meters) during the same period in 2020. C-Horst was the highest priority target early in the first quarter with up to three reverse circulation rigs drilling from seven permitted platforms. As the quarter progressed, the rigs were moved to other high-priority resource growth targets at Daisy, Secret Pass and SNA. The target mineralization style at Crown is disseminated, oxide-gold hosted in Cambrian to Tertiary rocks, located near the Fluorspar Canyon Fault.
Core drilling during the beginning of the year focused on Secret Pass and C-Horst, which has been useful to identify clay alteration, mineralization textures and fault zones associated with gold mineralization – all of which are not easily visible in the reverse circulation chips. The Company is now studying core samples from all four mineralized zones for metallurgy.
At SNA, step out drilling has discovered a new mineralized zone to the southeast of the original resource. Mineralization was exposed on surface during initial drill pad preparation. Five new drill holes were completed to test the zone, with assays currently pending.
Since SNA is located approximately five miles (eight kilometers) north of the permitted Sterling mine, the geologic team is mapping and sampling the area between SNA and Sterling where there are thought to be multiple drill targets, including historic mines (e.g., Diamond Queen, Goldspar and Mary).
Internal resource and mine modeling have begun focusing on a phased approach to mine the entire district, starting with the shallow resources at SNA and Secret Pass, followed by Daisy and C-Horst.
The Company plans to create an optimized resource and financial model for Crown by the end of the year, which is expected to be the basis for an initial economic assessment that Coeur plans to release around mid-2022.
Coeur expects to have three to four drill rigs focused on Crown for the remainder of 2021, conducting metallurgical core and resource expansion drilling in and around all four of the mineralized zones. Once Coeur receives its amended permit, the Company plans to transition its focus on continuing to grow C-Horst to the south toward SNA.
About Coeur
Coeur Mining, Inc. is a U.S.-based, well-diversified, growing precious metals producer with five wholly-owned operations: the Palmarejo gold-silver complex in Mexico, the Rochester silver-gold mine in Nevada, the Kensington gold mine in Alaska, the Wharf gold mine in South Dakota, and the Silvertip silver-zinc-lead mine in British Columbia. In addition, the Company has interests in several precious metals exploration projects throughout North America.
Cautionary Statements
This news release contains forward-looking statements within the meaning of securities legislation in the United States and Canada, including statements regarding exploration efforts and plans, exploration expenditures, timing of permitting, drill results, growth, extended mine lives, grade, thickness, investments, mine expansion and development plans, expectations regarding Silvertip and the Crown project and resource delineation, expansion, and upgrade or conversion. Such forward-looking statements involve known and unknown risks, uncertainties and other factors which may cause Coeur’s actual results, performance or achievements to be materially different from any future results, performance or achievements expressed or implied by the forward-looking statements. Such factors include, among others, the risk that anticipated additions or upgrades to reserves and resources are not attained, the risk that planned drilling programs may be curtailed or canceled due to budget constraints or other reasons, the risks and hazards inherent in the mining business (including risks inherent in developing large-scale mining projects, environmental hazards, industrial accidents, weather or geologically related conditions), changes in the market prices of gold, silver, zinc and lead and a sustained lower price environment, the uncertainties inherent in Coeur’s production, exploratory and developmental activities, including risks relating to permitting and regulatory delays (including the impact of government shutdowns), ground conditions, grade variability, any future labor disputes or work stoppages, the uncertainties inherent in the estimation of mineral reserves, the potential effects of the COVID-19 pandemic, including impacts to the availability of our workforce, continued access to financing sources, government orders that may require temporary suspension of operations at one or more of our sites and effects on our suppliers or the refiners and smelters to whom the Company markets its production, changes that could result from Coeur’s future acquisition of new mining properties or businesses, the loss of any third-party smelter to which Coeur markets its production, the effects of environmental and other governmental regulations, the risks inherent in the ownership or operation of or investment in mining properties or businesses in foreign countries, Coeur’s ability to raise additional financing necessary to conduct its business, make payments or refinance its debt, as well as other uncertainties and risk factors set out in filings made from time to time with the United States Securities and Exchange Commission, and the Canadian securities regulators, including, without limitation, Coeur’s most recent reports on Form 10-K and Form 10-Q. Actual results, developments and timetables could vary significantly from the estimates presented. Readers are cautioned not to put undue reliance on forward-looking statements. Coeur disclaims any intent or obligation to update publicly such forward-looking statements, whether as a result of new information, future events or otherwise. Additionally, Coeur undertakes no obligation to comment on analyses, expectations or statements made by third parties in respect of Coeur, its financial or operating results or its securities.
Christopher Pascoe, Coeur’s Director, Technical Services and a qualified person under Canadian National Instrument 43-101, approved the scientific and technical information concerning Coeur’s mineral projects in this news release. For a description of the key assumptions, parameters and methods used to estimate mineral reserves and resources, as well as data verification procedures and a general discussion of the extent to which the estimates may be affected by any known environmental, permitting, legal, title, taxation, socio-political, marketing or other relevant factors, Canadian investors should refer to the Technical Reports for each of Coeur’s properties as filed on SEDAR at www.sedar.com.
Notes
The potential quantity and grade for the deposits described herein are conceptual in nature. There is insufficient exploratory work to define a mineral resource and it is uncertain if further exploration will result in the applicable target being delineated as a mineral resource.
-
Reflects midpoint of guidance as published by Coeur on April 28, 2021.
-
For a complete table of all drill results included in this release, please refer to the following link:
https://www.coeur.com/_resources/pdfs/2021-06-15_Exploration_Update_Appendix_-_Final.pdf. -
Rounding of grades, to significant figures, may result in apparent differences.
Conversion Table
|
1 short ton |
= |
0.907185 metric tons |
|
1 troy ounce |
= |
31.10348 grams |
View source version on businesswire.com: https://www.businesswire.com/news/home/20210615005189/en/
Contacts
Coeur Mining, Inc.
104 S. Michigan Avenue, Suite 900
Chicago, Illinois 60603
Attention: Paul DePartout, Director, Investor Relations
Phone: (312) 489-5800
www.coeur.com
Vancouver, British Columbia–(Newsfile Corp. – June 15, 2021) – Contact Gold Corp. (TSXV: C) (OTCQB: CGOLF) (the "Company" or "Contact Gold") is pleased to announce the drilling of a new gold discovery at its Green Springs gold project in White Pine County, Nevada.
Drill Highlights:
-
0.55 g/t oxide Au over 54.86 m in drill hole GS21-31, from a depth of 19.81 metres, including 1.34 g/t Au over 3.05 m
-
1.01 g/t oxide Au over 13.72 m in drill hole GS21-32 from a depth of 24.38 metres, including 2.71 g/t Au over 3.05 m
-
0.87 g/t oxide Au over 13.72 m in drill hole GS21-27 from a depth of 15.24 metres, including 1.5 g/t Au over 4.57 m
Key Points:
-
New gold discovery made at the Tango Target in the northern portion of Green Springs
-
Tango represents a step out of over 500 metres from the next closest drill holes at the Alpha Zone (see news release dated April 14, 2021), and remains open for expansion, particularly to the south and west
-
An additional 15 drill holes drilled at the Tango Target all intercepted intervals of near surface, oxidized gold mineralization over an area of 250 x 500 metres
-
Tango was identified by soil and rock geochemical sampling and was never before drilled; all holes drilled by Contact Gold at Tango intersected significant gold mineralization
-
Road cut sampling and additional detailed mapping are underway to refine targeting ahead of the next phase of drilling
-
Contact Gold has staked an additional 18 claims to the north of the Tango discovery, covering 15.5 Hectares or 36 Acres of prospective ground
"We are ecstatic to have discovered a large new zone of oxidized gold mineralization at Green Springs. Opportunities to generate and drill shallow, new targets that result in new discoveries are becoming increasingly rare in Nevada, especially on the major gold trends," said Matt Lennox-King, President & CEO of Contact Gold. "The Tango discovery, with its large surface footprint, strong oxide grades and thicknesses is a testament to the quality of targets that Vance Spalding, Contact Gold's Vice President of Exploration and his team have generated at Green Springs. We are excited to get back on the ground at Tango and continue growing this exciting new discovery. In the meantime, we are excited to receive results from the newly drilled connector zone, which are the first ever holes into a 500-metre gap between the Mine Trend and Alpha Zone."
The Tango Discovery:
Tango is located 500 metres to the NE of the Alpha Zone, and represents an entirely new gold zone.
-
Tango is hosted at the Devonian limestone/shale contact, host to Kinross's 1.5 Moz Alligator Ridge/Vantage and Saga deposits at the Bald Mountain mine 40 km to the north
-
The Devonian limestone/shale host at Tango and Alpha is underexplored at Green Springs where it underlies the Mississippian limestone/shale contact that was previously exploited along the mine trend
-
Gold mineralization at Tango is mostly hosted within decalcified and variably oxidized and silicified Pilot Shale with minor mineralization in collapse breccia of the underlying Guilmette limestone
-
Northwest and North-South striking, high angle faults control the gold mineralization at Tango
-
Tango is open for expansion, particularly to the south and west
-
Road cut sampling and detailed mapping of the Tango drill road are underway to collect the necessary data to plan the 2nd phase drill program
Contact Gold began the 2021 Green Springs drill program in late February and completed 58 drill holes totalling 7,511 meters. Assays are pending for 36 drill holes, including from the Mine Trend and Connector Target between the Mine Trend and Alpha Zone.

Figure 1 – Plan map of the new Tango discovery, northeast of the Alpha Zone and Mine Trend
To view an enhanced version of Figure 1, please visit:
https://orders.newsfilecorp.com/files/5350/87554_Tango%20Plan%20Map.jpg
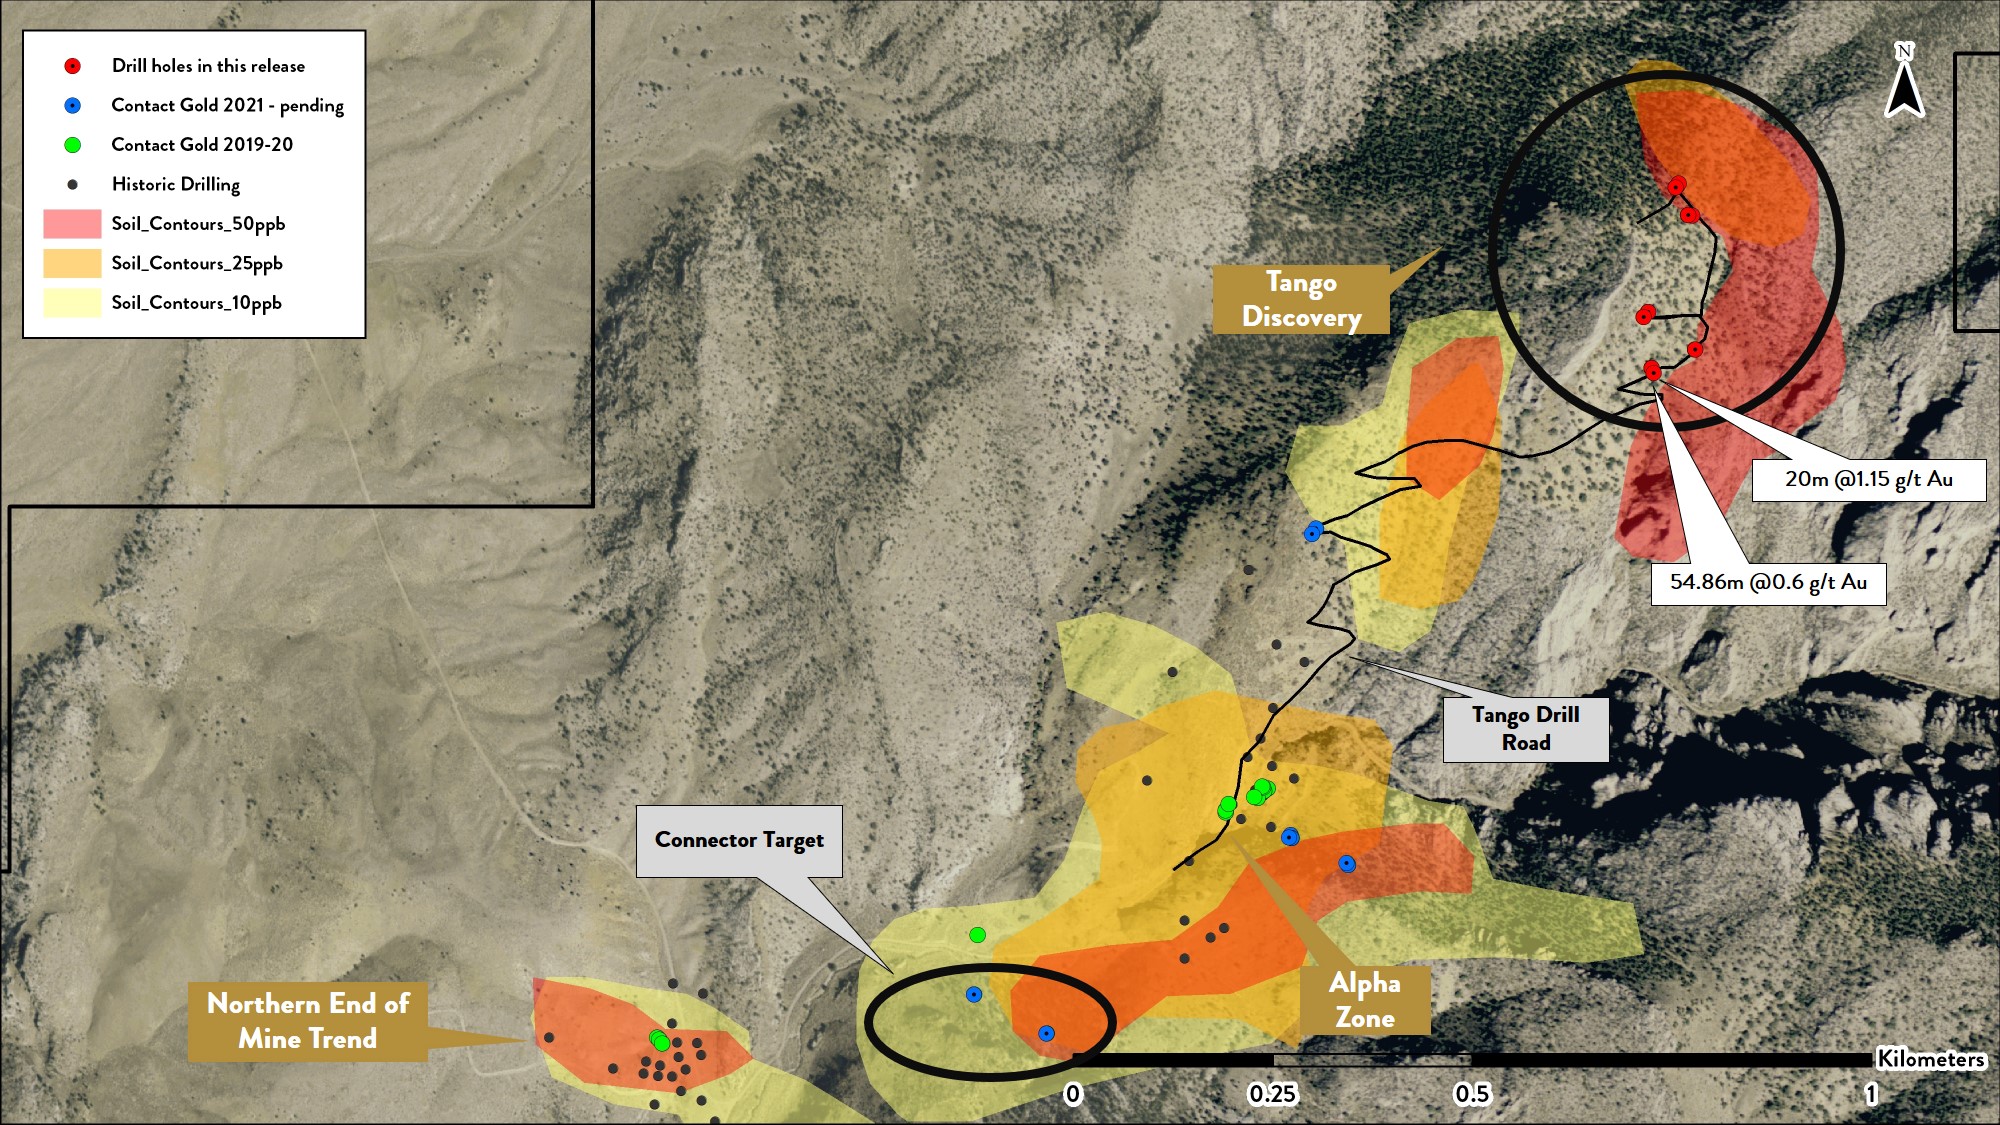
Figure 2 – Plan map of the Tango Target showing discovery drill holes
To view an enhanced version of Figure 2, please visit:
https://orders.newsfilecorp.com/files/5350/87554_Tango%20Detailed%20Map.jpg
2021 Green Springs drill hole results from this news release:
|
Drill |
Zone |
From (m) |
To (m) |
Interval |
Grade |
Oxidation |
|
GS 2124 |
Tango |
12.19 |
16.76 |
4.57 |
0.28 |
Oxide (64% CN Recovery) |
|
GS 2125 |
Tango |
15.24 |
28.96 |
13.72 |
0.40 |
Oxide (71% CN Recovery) |
|
GS 2126 |
Tango |
16.76 |
27.43 |
10.67 |
0.36 |
Oxide (65% CN Recovery) |
|
GS 2127 |
Tango |
15.24 |
28.96 |
13.72 |
0.87 |
Oxide (65% CN Recovery) |
|
including |
19.81 |
24.38 |
4.57 |
1.50 |
Oxide (69% CN Recovery) |
|
|
GS 2128 |
Tango |
9.14 |
36.58 |
27.43 |
0.35 |
Oxide (62% CN Recovery) |
|
GS 2129 |
Tango |
16.76 |
22.86 |
6.10 |
0.42 |
Oxide (70% CN Recovery) |
|
GS 2130 |
Tango |
22.86 |
28.96 |
6.10 |
0.24 |
Oxide (71% CN Recovery) |
|
GS 2131 |
Tango |
19.81 |
74.68 |
54.86 |
0.55 |
Oxide (76% CN Recovery) |
|
including |
38.10 |
41.15 |
3.05 |
1.34 |
Oxide (80% CN Recovery) |
|
|
GS 2132 |
Tango |
24.38 |
38.10 |
13.72 |
1.01 |
Oxide (73% CN Recovery) |
|
including |
28.96 |
32.00 |
3.05 |
2.71 |
Oxide (66% CN Recovery) |
|
|
GS 2133 |
Tango |
30.48 |
39.62 |
9.14 |
0.33 |
Oxide (70% CN Recovery) |
|
GS 2134 |
Tango |
44.20 |
47.24 |
3.05 |
0.25 |
Oxide (71% CN Recovery) |
|
GS 2135 |
Tango |
70.10 |
88.39 |
18.29 |
0.26 |
Oxide (70% CN Recovery) |
|
GS 2136 |
Tango |
28.96 |
35.05 |
6.10 |
0.27 |
Oxide (70% CN Recovery) |
|
GS 2137 |
Tango |
32.00 |
41.15 |
9.14 |
0.32 |
Oxide (80% CN Recovery) |
|
GS 2138 |
Tango |
No reportable intercepts |
||||
|
GS 2139 |
Tango |
3.05 |
15.24 |
12.19 |
0.24 |
Oxide (62% CN Recovery) |
|
GS 2140 |
Tango |
19.81 |
24.38 |
4.57 |
0.19 |
Oxide (77% CN Recovery) |

Figure 3 – Drone photo of the Tango discovery and holes 31 and 32
To view an enhanced version of Figure 3, please visit:
https://orders.newsfilecorp.com/files/5350/87554_Tango%20Drone%20Shot.jpg
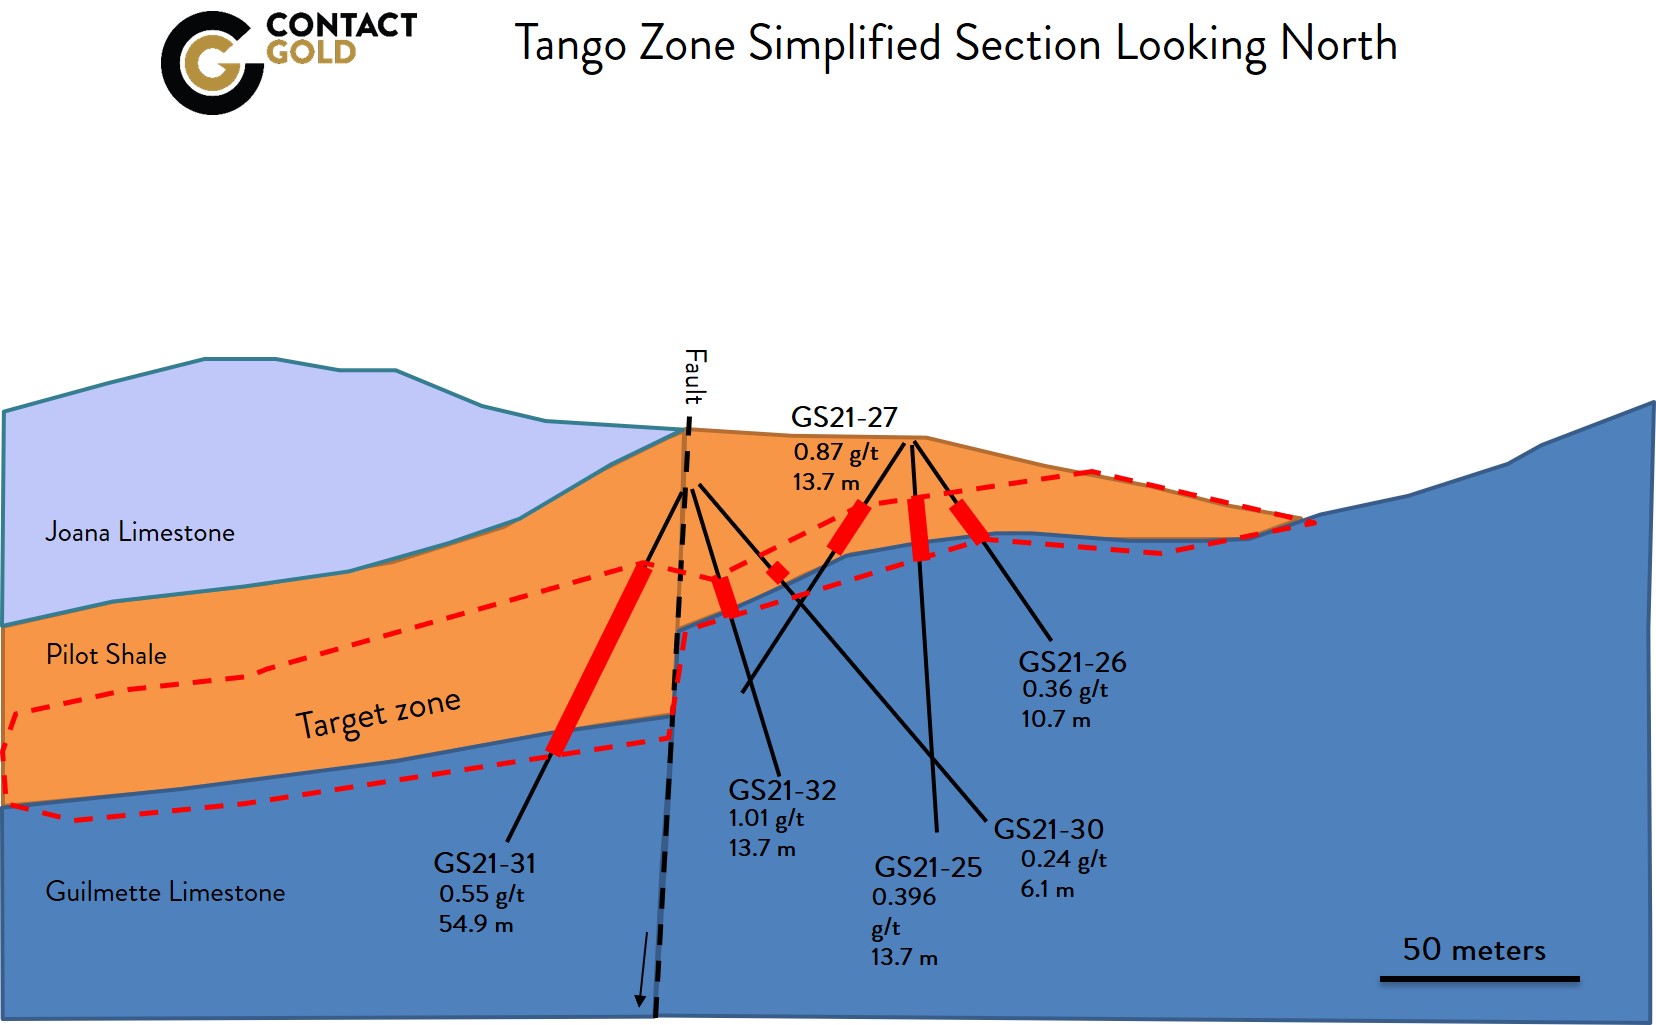
Figure 4 – Cross section through Green Springs holes 31 and 32
To view an enhanced version of Figure 4, please visit:
https://orders.newsfilecorp.com/files/5350/87554_Tango%20Section%2031%2032.jpg
About the Green Springs Project:
Green Springs is located near the southern end of the Cortez Trend of Carlin-type gold deposits in White Pine County, Nevada, east of Fiore Gold's Pan Mine and Gold Rock Project and south of Waterton's Mount Hamilton deposit. The Green Springs property is 18.65 km2 encompassing 3 shallow past producing open pits and numerous targets that were not mined.
Contact Gold signed a purchase option agreement with Ely Gold Royalties ("Ely Gold") to acquire an undivided 100% interest in Green Springs in July 2019. Green Springs is an early-stage exploration property and does not contain any mineral resource estimates as defined by National Instrument 43-101, Standards of Disclosure for Mineral Projects ("NI 43-101"). There has been insufficient exploration to define a mineral resource estimate at Green Springs. Additional information about Green Springs is summarized in the NI 43-101 Technical Report entitled "NI 43-101 Technical Report for the Green Springs Project, White Pine County, Nevada, USA" prepared for Contact Gold, with an effective date of June 12, 2020, and dated August 5, 2020, as prepared by John J. Read, C.P.G; an independent consultant and qualified person under NI 43-101, and can be viewed under Contact Gold's issuer profile on SEDAR at www.sedar.com.
The scientific and technical information contained in this news release has been reviewed and approved by Vance Spalding, CPG, VP Exploration, Contact Gold, who is a "qualified person" within the meaning of NI 43-101. Drill intercepts were calculated using a minimum thickness of 3.05 metres averaging 0.14 ppm gold and allowing inclusion of up to 4.57 metres of material averaging less than 0.14 ppm gold for low grade intervals and higher-grade intervals were calculated using a minimum thickness of 3.05 metres averaging 1.00 ppm gold and allowing inclusion of up to 4.57 metres of assays averaging less than 1.00 ppm gold. Gravimetric assays are used for all Fire Assays above 4.00 ppm gold. Cyanide solubility assays are completed on all Fire Assays greater than 0.1 g/t. True width of drilled mineralization is unknown, but owing to the apparent flat lying nature of mineralization, is estimated to generally be at least 70% of drilled thickness in most cases. The Cyanide recovery percentages are equally averaged by interval, and are not weighted by gold content per interval. Quality Assurance / Quality Control consists of regular insertion of certified reference standards, blanks, and duplicates. All failures are followed up and resolved whenever possible with additional investigation whenever such an event occurs. All assays are completed at Paragon; an ISO 17025:2005 accredited lab. Check assays are completed at a second, reputable assay lab after the program is complete.
About Contact Gold Corp.
Contact Gold is an exploration company focused on making district scale gold discoveries in Nevada. Contact Gold's extensive land holdings are on the prolific Carlin and Cortez gold trends which host numerous gold deposits and mines. Contact Gold's land position comprises approximately 140 km2 of target rich mineral tenure hosting numerous known gold occurrences, ranging from early- to advanced-exploration and resource definition stage.
Additional information about the Company is available at www.contactgold.com.
For more information, please contact: +1 (604) 449-3361
John Glanville – Director Investor Relations
Chris Pennimpede – VP, Corporate Development
E-mail: info@ContactGold.com
Neither the TSXV nor its Regulation Services Provider (as that term is defined in the policies of the TSXV) accepts responsibility for the adequacy of this release. No stock exchange, securities commission or other regulatory authority has approved or disapproved the information contained herein.
Cautionary Note Regarding Forward-Looking Information
This news release contains "forward-looking information" and "forward-looking statements" (collectively, "forward-looking statements") within the meaning of the applicable Canadian securities legislation. All statements, other than statements of historical fact, are forward-looking statements and are based on expectations, estimates and projections as at the date of this news release. Any statement that involves discussions with respect to predictions, expectations, beliefs, plans, projections, objectives, assumptions, future events or performance (often but not always using phrases such as "expects", or "does not expect", "is expected", "anticipates" or "does not anticipate", "plans", "budget", "scheduled", "forecasts", "estimates", "believes" or "intends" or variations of such words and phrases or stating that certain actions, events or results "may" or "could", "would", "might" or "will" be taken to occur or be achieved) are not statements of historical fact and may be forward-looking statements. In this news release, forward-looking statements relate, among other things, to the anticipated exploration activities of the Company on the Green Springs property.
These forward-looking statements are based on reasonable assumptions and estimates of management of the Company at the time such statements were made. Actual future results may differ materially as forward-looking statements involve known and unknown risks, uncertainties and other factors which may cause the actual results, performance or achievements of the Company to materially differ from any future results, performance or achievements expressed or implied by such forward-looking statements. Such factors, among other things, include: impacts arising from the global disruption by the Covid-19 coronavirus outbreak; fluctuations in general macroeconomic conditions; fluctuations in securities markets; fluctuations in spot and forward prices of gold, silver, base metals or certain other commodities; fluctuations in currency markets (such as the Canadian dollar to United States dollar exchange rate); change in national and local government, legislation, taxation, controls, regulations and political or economic developments; risks and hazards associated with the business of mineral exploration, development and mining (including environmental hazards, industrial accidents, unusual or unexpected formations pressures, cave-ins and flooding); inability to obtain adequate insurance to cover risks and hazards; the presence of laws and regulations that may impose restrictions on mining; employee relations; relationships with and claims by local communities and indigenous populations; availability of increasing costs associated with mining inputs and labour; the speculative nature of mineral exploration and development (including the risks of obtaining necessary licenses, permits and approvals from government authorities); and title to properties. Although the forward-looking statements contained in this news release are based upon what management of the Company believes, or believed at the time, to be reasonable assumptions, the Company cannot assure shareholders that actual results will be consistent with such forward-looking statements, as there may be other factors that cause results not to be as anticipated, estimated or intended. Readers should not place undue reliance on the forward-looking statements and information contained in this news release. The Company assumes no obligation to update the forward-looking statements of beliefs, opinions, projections, or other factors, should they change, except as required by law.

To view the source version of this press release, please visit https://www.newsfilecorp.com/release/87554
The Mosaic Company MOS recently announced its sales volumes and revenues for May 2021 by business unit.
The Potash Segment recorded sales volume of 891,000 tons in May, up 10% from 810,000 tons in the year-ago period. Sales revenues were $246 million, up around 40% from $176 million in the prior-year period.
The Mosaic Fertilizantes segment witnessed a roughly 9% decline in sales volume to 790,000 tons from 870,000 tons last year. Sales revenues increased around 30% to $336 million from $259 million recorded last year.
The Phosphates segment recorded sales volume of 553,000 tons, down around 9% from 608,000 tons in 2020. Sales revenues in the segment were $327 million, up around 53% year over year.
Shares of Mosaic have gained 142.9% in the past year compared with 80.4% rise of the industry.

Image Source: Zacks Investment Research
The company, in its last earnings call, noted that it expects strong fundamental trends witnessed in the last three quarters to continue through 2021. Strong crop demand, affordable inputs and favorable weather indicate strong grower economics.
Chinese phosphate exports are expected to remain low in 2021 due to high domestic demand and recent industry restructuring limit supplies available for export.
The company projects $80-$90 per ton improvement in realized prices in the Phosphates segment, sequentially, in the second quarter. In the Potash segment, $20-$30 per ton improvement in realized prices is expected in the second quarter.
The Mosaic Company Price and Consensus

The Mosaic Company price-consensus-chart | The Mosaic Company Quote
Zacks Rank & Key Picks
Mosaic currently has a Zacks Rank #3 (Hold).
Some better-ranked stocks in the basic materials space are Nucor Corporation NUE, Olin Corporation OLN and Cabot Corporation CBT.
Nucor has a projected earnings growth rate of around 260% for the current year. The company’s shares have surged 130.3% in a year. It currently flaunts a Zacks Rank #1 (Strong Buy). You can see the complete list of today’s Zacks #1 Rank stocks here.
Olin has an expected earnings growth rate of around 506.7% for the current year. The company’s shares have skyrocketed 264% in the past year. It currently sports a Zacks Rank #1.
Cabot has an expected earnings growth rate of around 126% for the current fiscal. The company’s shares have surged 59.9% in the past year. It currently carries a Zacks Rank #1.
Zacks Names “Single Best Pick to Double”
From thousands of stocks, 5 Zacks experts each have chosen their favorite to skyrocket +100% or more in months to come. From those 5, Director of Research Sheraz Mian hand-picks one to have the most explosive upside of all.
You know this company from its past glory days, but few would expect that it’s poised for a monster turnaround. Fresh from a successful repositioning and flush with A-list celeb endorsements, it could rival or surpass other recent Zacks’ Stocks Set to Double like Boston Beer Company which shot up +143.0% in a little more than 9 months and Nvidia which boomed +175.9% in one year.
Free: See Our Top Stock and 4 Runners Up >>
Want the latest recommendations from Zacks Investment Research? Today, you can download 7 Best Stocks for the Next 30 Days. Click to get this free report
Nucor Corporation (NUE) : Free Stock Analysis Report
The Mosaic Company (MOS) : Free Stock Analysis Report
Cabot Corporation (CBT) : Free Stock Analysis Report
Olin Corporation (OLN) : Free Stock Analysis Report
To read this article on Zacks.com click here.
Silver futures for July 2021 delivery closed at $28.04 an ounce on Jun 14, gaining 5% so far this year. Annual inflation rate in the United States advanced to 5% in May 2021 from 4.2% in April — above market expectation of 4.7%. Notably, this marked the highest level since August 2008, reflecting the ongoing economic recovery and low base effects due to the pandemic last year.
So far this year, silver prices have averaged around $26.60 per ounce. According to the Silver Institute, silver prices will average around $27.30 this year, registering an impressive 33% year-over-year increase. It anticipates silver prices to reach $32 later in the year. Notably, earlier in February, the white metal had peaked to $31 an ounce — crossing the $30 threshold for the first time since 2013.
Factors Likely to Drive the Silver Rally
Silver’s performance will primarily be driven by demand and supply imbalance. The white metal is benefiting from its safe haven demand, varied industrial use and growing focus on silver-consuming green energy applications. The Silver Institute projects silver demand to grow 15% this year. Major part of the increase will be driven by investment demand, which is expected to go up 26% to 252.8 million ounces (Moz) — the highest level since 2015.
Industrial demand is expected to log year-over-year growth of 8% and hit a record high of 524 Moz, courtesy of reopening of economies and investment in green energy solutions. Surging sales of electric vehicles will also support silver demand. Jewelry fabrication is forecast to increase 24% in 2021 to 184.4 Moz driven by an economic recovery.
Meanwhile, total silver supply is expected to be up 8% this year to 1,056.3 Moz. After being severely impacted by coronavirus-related mine closures last year, mine production is expected to bounce back in 2021 with a projected year-over-year growth of 8.2% to 848.5 Moz with the biggest comebacks from Mexico, Peru and Bolivia. Mexico, particularly is expected to log strong numbers as new projects, such as Cerro Los Gatos, Juanicipio and Capela, ramp-up production rates. Recycling activity is anticipated to higher owing to higher silver prices. Thus, it is apparent that silver is headed for a deficit this year, which will prop up prices.
The long-term outlook for silver remains solid. Given numerous industrial applications for silver, particularly those pertaining to “green” technologies and 5G will continue to support demand for silver in years to come. Demand for silver in solar photovoltaic (PV) cells is surging as countries move toward adopting renewable energy sources. The Silver Institute estimates silver demanded from 5G to more than double to around 16Moz by 2025. By 2030, it will require around 23Moz — a 206% increase from current levels.
In the automobile industry, demand for silver will rise to 88 Moz in five years as the transition from traditional cars and trucks to EVs accelerates. Charging points and charging stations will also call for a massive amount of silver. Silver demand for “printed and flexible electronics” will grow 54% over the next nine years. Overall, with more countries now focusing on lowering carbon emissions, they will need more silver for electric vehicles, charging stations and 5G, and cables connecting new wind turbines and solar farms to the grid.

Image Source: Zacks Investment Research
In a year’s time, the Mining – Silver industry has rallied 59.4%, outperforming the S&P 500’s rally of 40.6%. The industry falls under the broader Basic Materials sector, which gained 54.8% in the same time frame.
4 Silver Stocks to Watch
Fresnillo plc FNLPF: The Mexico-based company primarily explores for silver, gold, lead, and zinc concentrates. Its flagship project is Fresnillo silver mine located in the state of Zacatecas.
The company is investing in a number of projects to increase production and ensure steady growth in future years. Focus on improving operational performance and enhancing efficiency is expected to result in lower costs. Its high quality assets, ample mineral resources, competitive margins and disciplined approach to development will continue to drive growth.
The Zacks Consensus Estimate for the company’s current-year earnings indicates year-over-year growth of 87.5%. The estimates have also moved up 3.7% in 90 days’ time. The company’s shares have gained 27.9% in the past year. It currently carries a Zacks Rank #3 (Hold).
Hecla Mining Company HL: This Coeur d'Alene, ID-based company, together with its subsidiaries discovers, acquires, develops, and produces precious and base metal properties in the United States and internationally.
The company has a diverse asset portfolio in mining friendly jurisdictions. It boasts two of the largest silver mines in the world and two highest-grade large silver mines. It is pursuing acquisition opportunities to complement existing portfolio. The company currently produces about one-third of the silver mined in the United States. This is expected to grow as Lucky Friday Mine in Idaho ramps up. The mine’s production is expected to double again in 2021 and 60% more within four years. The company is also one of the lowest-cost U.S. silver producers.
The Zacks Consensus Estimate for earnings for fiscal 2021 indicates year-over-year improvement of 375%. The estimate has been revised upward by 1.4% over the past 90 days. Shares of the company have soared 186.6% over the past year. The company currently carries a Zacks Rank #3. You can see the complete list of today’s Zacks #1 Rank (Strong Buy) stocks here.
Buenaventura Mining Company Inc. BVN: Based in Lima, Peru, the company engages in exploration, mining, and processing of gold, silver, lead, zinc, and copper metals in Peru, the United States, Europe, and Asia. It currently operates several mines in Peru — Orcopampa, Uchucchacua, Julcani, El Brocal, La Zanja and Coimolache, and is developing the Tambomayo project.
The company is well-poised for growth, backed by its solid capital structure with ample liquidity and a portfolio of base and precious metals. The company has embarked on a debottlenecking program to reduce costs at its direct operation mines. The program has driven impressive results in Tambomayo, where the company simplified the metallurgical process and optimized mine preparation. In Uchucchacua, it has improved efficiency in the underground mine. At El Brocal, it has increased production driven by operational improvements. Overall, the program has resulted in significant cost savings in each of its mines.
The Zacks Consensus Estimate for the company’s current-year earnings indicates year-over-year growth of 244%. The estimates have gone up 1.4% over the past 90 days. The company’s shares have appreciated 21.4% in the past year. It currently carries a Zacks Rank #3.
Alexco Resource Corp. AXU: Headquartered in Vancouver, Canada, Alexco Resource operates the majority of the historic Keno Hill Silver District, in Canada's Yukon Territory — one of the highest-grade silver deposits in the world. The company is currently advancing Keno Hill to production and started concentrate production and shipments in the first quarter of 2021. Keno Hill is expected to produce an average of approximately 4.4 million ounces of silver per year contained in high quality lead/silver and zinc concentrates at an average all-in sustaining cost of $11.59 per ounce. Keno Hill has significant potential to grow and Alexco Resource has a long history of expanding the operation's mineral resources through successful exploration.
The Zacks Consensus Estimate for the company’s fiscal 2021 earnings suggests year-over-year improvement of 220%. The estimate has been revised upward by 33% over the past 90 days. Its shares have appreciated 35.3% in a year’s time. The stock has a Zacks Rank #3.

Image Source: Zacks Investment Research
Zacks Names “Single Best Pick to Double”
From thousands of stocks, 5 Zacks experts each have chosen their favorite to skyrocket +100% or more in months to come. From those 5, Director of Research Sheraz Mian hand-picks one to have the most explosive upside of all.
You know this company from its past glory days, but few would expect that it’s poised for a monster turnaround. Fresh from a successful repositioning and flush with A-list celeb endorsements, it could rival or surpass other recent Zacks’ Stocks Set to Double like Boston Beer Company which shot up +143.0% in a little more than 9 months and Nvidia which boomed +175.9% in one year.
Free: See Our Top Stock and 4 Runners Up >>
Want the latest recommendations from Zacks Investment Research? Today, you can download 7 Best Stocks for the Next 30 Days. Click to get this free report
Fresnillo PLC (FNLPF) : Free Stock Analysis Report
Hecla Mining Company (HL) : Free Stock Analysis Report
Buenaventura Mining Company Inc. (BVN) : Free Stock Analysis Report
Alexco Resource Corp (AXU) : Free Stock Analysis Report
To read this article on Zacks.com click here.
For Immediate Release
Chicago, IL – June 15, 2021 – Zacks.com announces the list of stocks featured in the Analyst Blog. Every day the Zacks Equity Research analysts discuss the latest news and events impacting stocks and the financial markets. Stocks recently featured in the blog include: Bluerock Residential Growth REIT, Inc. BRG, J & J Snack Foods Corp. JJSF, US Foods Holding Corp. USFD, Archer-Daniels-Midland Company ADM and Comstock Mining Inc. LODE.
Here are highlights from Monday’s Analyst Blog:
Hot US Inflation a Boon for These 5 Stocks
Consumer prices are back in the news, with the pace of inflation touching a 13-year high last month as the U.S. economy recoups from the coronavirus-led drubbing it took last year. Per the Labor Department, as cited in a CNBC article, the consumer price index (CPI) that generally includes groceries, energy and housing costs, to name a few, jumped 5% in May from the same period a year ago. As surveyed by Dow Jones, economists had expected inflation to climb 4.7%, added the CNBC article.
Consumer prices, in fact, notched the biggest gain since the 5.3% jump in August 2008, which was just before the financial crisis that pushed the U.S. economy into a recession, the CNBC article further stated. Nonetheless, a record increase in prices of used vehicles including cars and trucks was primarily responsible for pushing the inflation rate higher last month.
The cost of food and groceries has picked up and most likely, the increase in cost will be passed on to consumers. Energy prices, by the way, have been bumping up inflation for quite some time but now, rent prices have also gone up. Rent prices, in particular, increased 0.2% last month, the largest uptick in more than a year, as mentioned in a MarketWatch article.
Prices actually increased across all sectors, thanks to the reopening of the U.S. economy and a considerable increase in the pace of vaccination. Notably, the government's massive stimulus measures and checks to millions of Americans pepped up the coronavirus-marred economy. Meanwhile, household furnishing cost, hotel cost and airline tickets continued to rise.
Thus, with the cost of living going up, returns get affected, something that doesn't bode well for investors. Another risk is that the Fed may hike rates in an inflationary environment, which tends to drag equities down.
In particular, growth stocks tend to get affected the most as inflation does have an impact on future cash flows. However, from an investment perspective, there are stocks that in reality benefit from a rise in inflation, which at present should be enticing enough for investors to watch out for.
Real estate, in particular, gains from a rise in inflation. Property prices tend to increase with rising inflation. Additionally, as property prices rise, rent increases, thereby resulting in higher rental income. In fact, as earlier mentioned, rent prices have already increased in May. Now, the best way to invest in real estate is through real estate investment trust (REIT).
Similarly, companies that are part of the consumer staples sector have pricing power or in other words, they can raise their prices with inflation, unlike other sectors. So, they comparatively stand to benefit from a rise in inflation.
Last but not least, gold doesn't lose value at times of higher inflation. In fact, demand for gold increases when inflation rises. By the way, gold can be invested by buying gold mining stocks. We have, hence, highlighted five noteworthy stocks from the aforesaid areas that stand to gain from a rise in inflation. These stocks currently flaunt a Zacks Rank #1 (Strong Buy) or 2 (Buy).
Bluerock Residential Growth REIT operates as a real estate investment trust. It acquires apartment properties in demographically attractive growth markets throughout the United States. The company currently has a Zacks Rank #2. The company's expected earnings growth rate for the next quarter and year is 6.3% and 17.9%, respectively.
J & J Snack Foods is an American manufacturer, marketer, and distributor of branded niche snack foods and frozen beverages for the food service and retail supermarket industries. The company currently has a Zacks Rank #1. The company's expected earnings growth rate for the current year is 113.5%. You can see the complete list of today's Zacks #1 Rank stocks here.
US Foods Holding is a foodservice distributor. The company currently has a Zacks Rank #1. The company's expected earnings growth rate for the current year is 1,677.8%.
Archer-Daniels-Midland Co. is one of the leading producers of food and beverage ingredients as well as goods made from various agricultural products. The company currently has a Zacks Rank #2. The company's expected earnings growth rate for the current year is 25.9%.
Comstock Mining, formerly known as GoldSpring, Inc., is a North American precious metals mining company, focused in Nevada, with property in the Comstock Lode District. The company currently has a Zacks Rank #2. The company's expected earnings growth rate for the current year is 1,050%.
Bitcoin, Like the Internet Itself, Could Change Everything
Blockchain and cryptocurrency has sparked one of the most exciting discussion topics of a generation. Some call it the "Internet of Money" and predict it could change the way money works forever. If true, it could do to banks what Netflix did to Blockbuster and Amazon did to Sears. Experts agree we're still in the early stages of this technology, and as it grows, it will create several investing opportunities.
Zacks' has just revealed 3 companies that can help investors capitalize on the explosive profit potential of Bitcoin and the other cryptocurrencies with significantly less volatility than buying them directly.
See 3 crypto-related stocks now >>
Media Contact
Zacks Investment Research
800-767-3771 ext. 9339
support@zacks.com
https://www.zacks.com
Past performance is no guarantee of future results. Inherent in any investment is the potential for loss. This material is being provided for informational purposes only and nothing herein constitutes investment, legal, accounting or tax advice, or a recommendation to buy, sell or hold a security. No recommendation or advice is being given as to whether any investment is suitable for a particular investor. It should not be assumed that any investments in securities, companies, sectors or markets identified and described were or will be profitable. All information is current as of the date of herein and is subject to change without notice. Any views or opinions expressed may not reflect those of the firm as a whole. Zacks Investment Research does not engage in investment banking, market making or asset management activities of any securities. These returns are from hypothetical portfolios consisting of stocks with Zacks Rank = 1 that were rebalanced monthly with zero transaction costs. These are not the returns of actual portfolios of stocks. The S&P 500 is an unmanaged index. Visit https://www.zacks.com/performance for information about the performance numbers displayed in this press release.
Want the latest recommendations from Zacks Investment Research? Today, you can download 7 Best Stocks for the Next 30 Days. Click to get this free report
Archer Daniels Midland Company (ADM) : Free Stock Analysis Report
Bluerock Residential Growth REIT, Inc. (BRG) : Free Stock Analysis Report
J & J Snack Foods Corp. (JJSF) : Free Stock Analysis Report
Comstock Mining, Inc. (LODE) : Free Stock Analysis Report
US Foods Holding Corp. (USFD) : Free Stock Analysis Report
To read this article on Zacks.com click here.
Zacks Investment Research
ENDEAVOUR ANNOUNCES CONTINUATION OF SHARE REPURCHASE PROGRAMME UNDER NEW PARENT COMPANY
London, 15 June 2021 – Endeavour Mining plc (TSX: EDV, LSE: EDV, OTCQX: EDVMF) (“Endeavour”) announces that it will continue the share repurchase programme announced by Endeavour Mining Corporation (“EMC”) on 18 March 2021 for up to 5% of its total issued and outstanding shares (the "Programme").
The Programme is a continuation of the Normal Course Issuer Bid (“NCIB”) programme of EMC, pursuant to which 2,246,503 shares of EMC have been repurchased and cancelled to date, equivalent to CAD 64 million (approximately US$53 million). The continuation of the Programme from June 15, 2021 will be effected in accordance with the terms of the authority granted by the pre-Scheme shareholder of the Company, as described in Endeavour’s prospectus dated 9 June 2021.
The maximum number of shares that may be repurchased by the Company under the Programme is 9,926,368, being the remaining capacity under the NCIB programme after deducting the 2,246,503 shares of EMC purchased prior to the Scheme becoming effective. The Programme will cease on 21 March 2022. Endeavour intends that shares purchased under the Programme will subsequently be cancelled. Any share repurchases will be effected in accordance with Chapter 12 of the Listing Rules and the EU Market Abuse Regulation 596/2014. The market will be notified in accordance with those rules if and when purchases are made.
Endeavour has entered into an agreement with Stifel Nicolaus Europe Limited (“Stifel”) to conduct purchases of shares pursuant to the Programme. Stifel intends to instruct Stifel Nicolaus Canada Inc. as its agent to conduct purchases of shares on the Toronto Stock Exchange. Endeavour may expand the Programme to repurchase shares on the London Stock Exchange in the future or enter into further agreements with Stifel to conduct the Programme on its behalf, and to make trading decisions concerning the timing of purchases under the Programme, independently of Endeavour, to allow for share repurchases at times when Endeavour is subject to regulatory restrictions or self-imposed trading blackouts.
This announcement contains inside information for the purposes of Article 7 of the Market Abuse Regulation 596/2014 as it forms part of UK domestic law by virtue of the European Union (Withdrawal) Act 2018.
CONTACT INFORMATION
|
Endeavour Mining |
Brunswick Group LLP in London Vincic Advisors in Toronto |
|
CORPORATE BROKERS Barclays +44 20 7623 2323 Morgan Stanley |
UK AND EUROPEAN BROKING ADVISERS Berenberg Stifel |
ABOUT ENDEAVOUR MINING PLC
Endeavour is one of the world’s senior gold producers and the largest in West Africa, with operating assets across Senegal, Cote d’Ivoire and Burkina Faso and a strong portfolio of advanced development projects and exploration assets in the highly prospective Birimian Greenstone Belt across West Africa.
A member of the World Gold Council, Endeavour is committed to the principles of responsible mining and delivering sustainable value to its employees, stakeholders and the communities where it operates. Endeavour is listed on the Toronto Stock Exchange, under the symbol EDV.
For more information, please visit www.endeavourmining.com.
CAUTIONARY NOTE REGARDING FORWARD-LOOKING INFORMATION
This press release contains statements which constitute “forward-looking information” within the meaning of applicable securities laws, including but not limited to statements regarding the plans, intentions, beliefs and current expectations of Endeavour with respect to future business activities and operating performance. Forward-looking information is often identified by the words “may”, “would”, “could”, “should”, “will”, “intend”, “plan”, “anticipate”, “believe”, “estimate”, “expect” or similar expressions and includes information regarding Endeavour’s expectations regarding the benefits of a premium listing in the UK with shares traded on the LSE including deeper access to a diverse investor pool with strong understanding of its key operating jurisdictions across West Africa and increased demand for its shares on the assumption that it will qualify for inclusion in the FTSE UK Index Series as well as the MSCI Europe Index, Endeavour’s ability to create sustainable shareholder value over the long term, the potential for continued or future dividends, the approval of the proposed Admission by the FCA and the LSE and the expected timing of the FCA’s approval of Admission; and admission to listing and posting for trading on the Toronto Stock Exchange.
Investors are cautioned that forward-looking information is not based on historical facts but instead reflect Endeavour management’s expectations, estimates or projections concerning future results or events based on the opinions, assumptions and estimates of management considered reasonable at the date the statements are made. Although Endeavour believes that the expectations reflected in such forward-looking information are reasonable, such information involves risks and uncertainties, and undue reliance should not be placed on such information, as unknown or unpredictable factors could have material adverse effects on future results, performance or achievements of Endeavour. This forward-looking information may be affected by risks and uncertainties in the business of Endeavour and market conditions.
This information is qualified in its entirety by cautionary statements and risk factor disclosure contained in filings made by Endeavour with the Canadian securities regulators, including Endeavour’s annual information form for the financial year ended December 31, 2020 and financial statements and related MD&A for the financial year ended December 31, 2020 filed with the securities regulatory authorities in certain provinces of Canada and available at www.sedar.com.
Should one or more of these risks or uncertainties materialize, or should assumptions underlying the forward-looking information prove incorrect, actual results may vary materially from those described herein as intended, planned, anticipated, believed, estimated or expected. Although Endeavour has attempted to identify important risks, uncertainties and factors which could cause actual results to differ materially, there may be others that cause results not to be as anticipated, estimated or intended. Endeavour does not intend, and does not assume any obligation, to update this forward-looking information except as otherwise required by applicable law.
Neither the Toronto Stock Exchange nor the Investment Industry Regulatory Organization of Canada accepts responsibility for the adequacy or accuracy of this press release.
Attachment
The financial regulations require hedge funds and wealthy investors that exceeded the $100 million holdings threshold to file a report that shows their positions at the end of every quarter. Even though it isn't the intention, these filings to a certain extent level the playing field for ordinary investors. The latest round of 13F filings disclosed the funds' positions on March 31st. We at Insider Monkey have made an extensive database of more than 866 of those established hedge funds and famous value investors' filings. In this article, we analyze how these elite funds and prominent investors traded Paramount Gold Nevada Corp (NYSE:PZG) based on those filings.
Hedge fund interest in Paramount Gold Nevada Corp (NYSE:PZG) shares was flat at the end of last quarter. This is usually a negative indicator. Our calculations also showed that PZG isn't among the 30 most popular stocks among hedge funds (click for Q1 rankings). At the end of this article we will also compare PZG to other stocks including Petros Pharmaceuticals, Inc. (NASDAQ:PTPI), ADiTx Therapeutics, Inc. (NASDAQ:ADTX), and Conifer Holdings, Inc. (NASDAQ:CNFR) to get a better sense of its popularity.
So, why do we pay attention to hedge fund sentiment before making any investment decisions? Our research has shown that hedge funds' small-cap stock picks managed to beat the market by double digits annually between 1999 and 2016, but the margin of outperformance has been declining in recent years. Nevertheless, we were still able to identify in advance a select group of hedge fund holdings that outperformed the S&P 500 ETFs by more than 115 percentage points since March 2017 (see the details here). We have been able to outperform the passive index funds by tracking the moves of corporate insiders and hedge funds, and we believe small investors can benefit a lot from reading hedge fund investor letters and 13F filings.

Eric Sprott of Sprott Asset Management
At Insider Monkey, we scour multiple sources to uncover the next great investment idea. For example, an activist hedge fund wants to buy this $28 biotech stock for $50. So, we recommended a long position to our monthly premium newsletter subscribers. We go through lists like the 10 best battery stocks to pick the next Tesla that will deliver a 10x return. Even though we recommend positions in only a tiny fraction of the companies we analyze, we check out as many stocks as we can. We read hedge fund investor letters and listen to stock pitches at hedge fund conferences. You can subscribe to our free daily newsletter on our homepage. Now let's analyze the recent hedge fund action encompassing Paramount Gold Nevada Corp (NYSE:PZG).
Do Hedge Funds Think PZG Is A Good Stock To Buy Now?
At the end of March, a total of 3 of the hedge funds tracked by Insider Monkey were bullish on this stock, a change of 0% from one quarter earlier. The graph below displays the number of hedge funds with bullish position in PZG over the last 23 quarters. So, let's examine which hedge funds were among the top holders of the stock and which hedge funds were making big moves.

Among these funds, Sprott Asset Management held the most valuable stake in Paramount Gold Nevada Corp (NYSE:PZG), which was worth $0.3 million at the end of the fourth quarter. On the second spot was Renaissance Technologies which amassed $0.2 million worth of shares. Citadel Investment Group was also very fond of the stock, becoming one of the largest hedge fund holders of the company. In terms of the portfolio weights assigned to each position Sprott Asset Management allocated the biggest weight to Paramount Gold Nevada Corp (NYSE:PZG), around 0.02% of its 13F portfolio. Renaissance Technologies is also relatively very bullish on the stock, dishing out 0.0003 percent of its 13F equity portfolio to PZG.
We view hedge fund activity in the stock unfavorable, but in this case there was only a single hedge fund selling its entire position: Weiss Asset Management. One hedge fund selling its entire position doesn't always imply a bearish intent. Theoretically a hedge fund may decide to sell a promising position in order to invest the proceeds in a more promising idea. However, we don't think this is the case in this case because only one of the 800+ hedge funds tracked by Insider Monkey identified as a viable investment and initiated a position in the stock (that fund was Citadel Investment Group).
Let's go over hedge fund activity in other stocks – not necessarily in the same industry as Paramount Gold Nevada Corp (NYSE:PZG) but similarly valued. We will take a look at Petros Pharmaceuticals, Inc. (NASDAQ:PTPI), ADiTx Therapeutics, Inc. (NASDAQ:ADTX), Conifer Holdings, Inc. (NASDAQ:CNFR), Wheeler Real Estate Investment Trust Inc (NASDAQ:WHLR), ReTo Eco-Solutions, Inc. (NASDAQ:RETO), China Green Agriculture, Inc (NYSE:CGA), and SPAR Group, Inc. (NASDAQ:SGRP). This group of stocks' market values resemble PZG's market value.
[table] Ticker, No of HFs with positions, Total Value of HF Positions (x1000), Change in HF Position PTPI,2,823,0 ADTX,2,568,2 CNFR,1,150,1 WHLR,2,973,1 RETO,2,872,0 CGA,1,269,0 SGRP,2,380,0 Average,1.7,576,0.6 [/table]
View table here if you experience formatting issues.
As you can see these stocks had an average of 1.7 hedge funds with bullish positions and the average amount invested in these stocks was $1 million. That figure was $1 million in PZG's case. Petros Pharmaceuticals, Inc. (NASDAQ:PTPI) is the most popular stock in this table. On the other hand Conifer Holdings, Inc. (NASDAQ:CNFR) is the least popular one with only 1 bullish hedge fund positions. Compared to these stocks Paramount Gold Nevada Corp (NYSE:PZG) is more popular among hedge funds. Our overall hedge fund sentiment score for PZG is 85. Stocks with higher number of hedge fund positions relative to other stocks as well as relative to their historical range receive a higher sentiment score. Our calculations showed that top 5 most popular stocks among hedge funds returned 95.8% in 2019 and 2020, and outperformed the S&P 500 ETF (SPY) by 40 percentage points. These stocks gained 17.2% in 2021 through June 11th and still beat the market by 3.3 percentage points. Unfortunately PZG wasn't nearly as popular as these 5 stocks and hedge funds that were betting on PZG were disappointed as the stock returned 5% since the end of the first quarter (through 6/11) and underperformed the market. If you are interested in investing in large cap stocks with huge upside potential, you should check out the top 5 most popular stocks among hedge funds as most of these stocks already outperformed the market since 2019.
Get real-time email alerts: Follow Paramount Gold Nevada Corp. (TSE:PZG)
Disclosure: None. This article was originally published at Insider Monkey.
Follow Insider Monkey on Twitter
Related Content
Stocks moving in premarket trading Tuesday include Sage Therapeutics, Freeport-McMoRan, MicroStrategy, ContextLogic and Fastenal.
A crackdown on commodity speculation from China, as well as slumping imports, has copper trading at a seven-week low.
Figure 1

Elrond project location
Figure 2

Elrond geology
Figure 3

Regional Mag
Figure 4

Elrond Au-bearing pegmatites and granites
Figure 5

Elrond showing
MONTREAL, June 15, 2021 (GLOBE NEWSWIRE) — Midland Exploration Inc. (“Midland”) (TSX-V: MD) is pleased to announce the start of a new exploration campaign on its Elrond project (100% Midland), located in Eeyou Istchee James Bay, Quebec. This project is located near the new gold discoveries made by Harfang Exploration Inc. (“Harfang”) on the Serpent project. The summer 2021 exploration program on Elrond consists of a till geochemistry survey that was completed at the end of May, and a prospecting and mapping campaign that will take place in August-September.
The Elrond project was initiated in 2017 and targeted a previously unexplored segment of the contact between the La Grande and Opinaca geological subprovinces. This contact is a major metallotect in the James Bay region and hosts numerous gold deposits and occurrences, including the Eleonore mine and the La Grande Sud, Cheechoo, Corvet-Est and Orfée deposits. The La Pointe gold deposit, located approximately 15 kilometres northeast of the Elrond project, also sits directly on this prolific contact. The Elrond project is also located immediately southeast of new high-grade gold discoveries made by Harfang Exploration on its Serpent project.
Several gold occurrences were discovered by Midland in only 6 days of prospecting in 2017 and 2019 on Elrond. In the southwest part of the project, grab samples from an amphibolite with strong arsenopyrite and pyrite mineralization graded 4.53 g/t Au and 3.23 g/t Au (these results were disclosed in a press release dated October 12, 2017; note that grades obtained in grab samples are not necessarily indicative of the mineralized zone as a whole). Approximately 100 metres further north, grab samples from a sheared and silicified amphibolite with pyrite mineralization graded 2.17 g/t Au, 1.81 g/t Au and 1.69 g/t Au (two of these three results were previously unpublished). Approximately one (1) kilometre northeast of these two occurrences, another grab sample, collected in a late felsic dyke injected in an amphibolite, graded 2.49 g/t Au and 0.2% Bi (previously unpublished results). In the northeast part of the project, a disseminated sulphide zone several metres wide, centered on a fault transecting a late pegmatitic granitoid yielded several anomalous values in Au, Bi and Mo. Seven (7) grab samples collected over an area of 3 metres by 2 metres in this mineralized zone yielded gold grades ranging from 0.38 g/t Au to 1.63 g/t Au, (previously unpublished results) as well as high Mo (0.005% Mo to 0.06% Mo) and Bi (0.01% Bi to 0.05% Bi) values. The mineralized zone remains open to the north and east.
Au-Mo-Bi mineralization occurring in two of the four showings discovered to date on Elrond is hosted in late granodiorites or granites of the Vieux-Comptoir Suite. In addition, the Au-Mo-Bi metal association suggests these occurrences belong to a “reduced intrusion-related gold” deposit model. This type of mineralization typically forms low-grade but very high-tonnage gold deposits. The Cheechoo gold deposit, also located along the La Grande-Opinaca contact further east, is also considered of this type (Fontaine et al., 2018) and is also associated with a late felsic intrusive (granodiorite) host rock. Showings on Elrond therefore suggest potential for “reduced intrusion-related gold” on the project. The other two Au±As showings are more likely typical orogenic occurrences and also indicate potential for this type of mineralization.
A glacial sediment (till) survey totalling eighty (80) samples was carried out in late May on Elrond, to identify areas with significant gold concentrations. Till samples will be processed throughout the summer using the following methods: gold grain counts and characterization, heavy mineral concentrate analysis, and analysis of the fine fraction for gold and other metals. A follow-up prospecting campaign of gold-in-till anomalies and existing gold occurrences on the project is planned near the end of the field season.
Cautionary statement:
Mineralization occurring on the Serpent project and at the Eleonore, La Pointe, La Grande Sud, Cheechoo, Corvet-Est and Orfée deposits is not necessarily indicative of mineralization that may be found on the Elrond property held by Midland.
Quality control
Exploration program design and interpretation of results are performed by qualified persons employing a Quality Assurance/Quality Control program consistent with industry best practices, including the use of standards and blanks at a rate of 1 per 20 samples. Rock samples on the project are assayed for gold by standard 30-gram fire-assaying with inductively coupled plasma atomic emission spectroscopy (ICP-AES; Au-ICP21) or gravimetric finish (Au-GRA21) at ALS Minerals laboratories in Vancouver, British Columbia. All samples are also analyzed for multi-elements using the four-acid ICP-AES method (ME-ICP61), also at ALS Minerals laboratories in Vancouver, British Columbia.
About Midland
Midland targets the excellent mineral potential of Quebec to make the discovery of new world-class deposits of gold, platinum group elements and base metals. Midland is proud to count on reputable partners such as BHP Canada Inc., Probe Metals Inc., Wallbridge Mining Company Ltd, Agnico Eagle Mines Limited, Osisko Development Corp., SOQUEM INC., Nunavik Mineral Exploration Fund, and Abcourt Mines Inc. Midland prefers to work in partnership and intends to quickly conclude additional agreements in regard to newly acquired properties. Management is currently reviewing other opportunities and projects to build up the Company portfolio and generate shareholder value.
This press release was prepared by Mario Masson, P.Geo., VP Exploration for Midland and Qualified Person as defined by NI 43-101.
For further information, please consult Midland’s website or contact:
Gino Roger, President and Chief Executive Officer
Tel.: 450 420-5977
Fax: 450 420-5978
Email: info@midlandexploration.com
Website: https://www.midlandexploration.com/
Neither TSX Venture Exchange nor its Regulation Services Provider (as that term is defined in the policies of the TSX Venture Exchange) accepts responsibility for the adequacy or accuracy of this release.
This press release may contain forward-looking statements that are subject to known and unknown risks and uncertainties that could cause actual results to vary materially from targeted results. Such risks and uncertainties include those described in Midland’s periodic reports including the annual report or in the filings made by Midland from time to time with securities regulatory authorities.
Photos accompanying this announcement are available at:
https://www.globenewswire.com/NewsRoom/AttachmentNg/67cd1966-af0b-4b19-8533-48227c209519
https://www.globenewswire.com/NewsRoom/AttachmentNg/160439f0-aa15-4701-b2b5-fb5534bc945b
https://www.globenewswire.com/NewsRoom/AttachmentNg/9fe4eed9-f76c-4295-a72e-f29b57e709f5
https://www.globenewswire.com/NewsRoom/AttachmentNg/86e79055-dcba-4c2e-89f1-29199194cca8
https://www.globenewswire.com/NewsRoom/AttachmentNg/4e5be5b4-337a-41f7-81e8-c0d2b6aa7f21
Silver is valued both as an industrial metal and as a precious metal. Silver mining companies are engaged in the acquisition, exploration, development, and production of mineral properties. Silver is often a byproduct produced from mining these other metals.
Vancouver, British Columbia–(Newsfile Corp. – June 14, 2021) – SALAZAR RESOURCES LIMITED (TSXV: SRL) (OTCQB: SRLZF) (FSE: CCG) ("Salazar" or the "Company") has appointed Ms. Mary Gilzean as a director of the Company.
Fredy E. Salazar, CEO and President, commented, "On behalf of the Salazar Resources team, I am delighted to welcome Mary to the Board of Directors. She brings a wealth of expertise that will be an asset as we target the next great copper-gold discovery in Ecuador. As well as her geological and exploration experience, we will benefit from her HR track record as we continue to grow the Company. In particular, I am pleased that, like Salazar Resources, Mary is genuinely committed to ensuring that the Company projects have a positive impact on Ecuadorian communities and the economy. Her non-profit experience will be a great resource for The Salazar Foundation to draw upon."
Mary Gilzean has over 25 years of experience in international mineral exploration and human resources management. Mary spent the first ten years of her career as an exploration geologist of increasing seniority in Argentina, Mexico/Caribbean and the USA. In 1995 she was Chief Geologist for the BHP/Benco JV exploring for diamonds, offshore Namibia. From 1996 to 2000 she was Minerals Exploration Manager, Europe and North Africa for BHP. From 2001 to 2007 Mary was Global and Regional HR Manager, Exploration for BHP, based in Vancouver. In 2008 Mary was appointed Manager (and then Director), International Human Resources for Teck Resources Ltd, a position she held for four years.
Mary graduated with a B.Sc in Geology from Stanford University in 1979, and a M.Sc in Geology from the University of California, Berkeley in 1983. She has served on the boards of several non-profit organizations in the Vancouver area, and speaks Spanish.
The Company has granted stock options to Ms. Gilzean for the purchase of up to 500,000 common shares of the Company, at a price of $0.37 per share, for a period of five years. The options shall vest at one-third per year over three years. In addition, pursuant to the restricted share unit plan adopted by the Company in September 2020, the Company granted 100,000 restricted share units ("RSU") to Ms. Gilzean. The RSUs vest two years from the grant date.
About Salazar
Salazar Resources is focused on creating value and positive change through discovery, exploration and development in Ecuador. The team has an unrivalled understanding of the geology in-country, and has played an integral role in the discovery of many of the major projects in Ecuador, including the two newest operating gold and copper mines.
Salazar Resources has a wholly-owned pipeline of copper-gold exploration projects across Ecuador with a strategy to make another commercial discovery and farm-out non-core assets. The Company actively engages with Ecuadorian communities and together with the Salazar family it co-founded The Salazar Foundation, an independent non-profit organisation dedicated to sustainable progress through economic development.
The Company already has carried interests in three projects. At its maiden discovery, Curipamba, Salazar Resources has a 25% stake fully carried through to production. A feasibility study is underway and a 2019 PEA generated a base case NPV (8%) of US$288 million. At two copper-gold porphyry projects, Pijili and Santiago, the Company has a 20% stake fully carried through to a construction decision.
For further information from Salazar please contact Merlin Marr-Johnson, Executive Vice President and Corporate Secretary at merlin@salazarresources.com or ir@salazarresources.com.
Neither the TSX Venture Exchange nor its Regulation Services Provider (as that term is defined in the policies of the TSX Venture Exchange) accepts responsibility for the adequacy or accuracy of this news release.
This press release contains "forward -looking information" within the meaning of applicable Canadian securities laws. Any statements that express or involve discussions with respect to predictions, expectations, beliefs, plans, projections, objectives, assumptions or future events or performance (often, but not always, identified by words or phrases such as "believes", "anticipates", "expects", "is expected", "scheduled", "estimates", "pending", "intends", "plans", "forecasts", "targets", or "hopes", or variations of such words and phrases or statements that certain actions, events or results "may", "could", "would", "will", "should" "might", "will be taken", or "occur" and similar expressions) are not statements of historical fact and may be forward-looking statements. Forward-looking information herein includes, but is not limited to, statements that address activities, events, or developments that Salazar expects or anticipates will or may occur in the future. Although Salazar has attempted to identify important factors that could cause actual actions, events or results to differ materially from those described in forward-looking information, there may be other factors that cause actions, events or results not to be as anticipated, estimated or intended. There can be no assurance that such information will prove to be accurate, and actual results and future events could differ materially from those anticipated in such information. Accordingly, readers should not place undue reliance on forward-looking information. Salazar undertake to update any forward-looking information in accordance with applicable securities laws.

To view the source version of this press release, please visit https://www.newsfilecorp.com/release/87364
Consumer prices are back in the news, with the pace of inflation touching a 13-year high last month as the U.S. economy recoups from the coronavirus-led drubbing it took last year. Per the Labor Department, as cited in a CNBC article, the consumer price index (CPI) that generally includes groceries, energy and housing costs, to name a few, jumped 5% in May from the same period a year ago. As surveyed by Dow Jones, economists had expected inflation to climb 4.7%, added the CNBC article.
Consumer prices, in fact, notched the biggest gain since the 5.3% jump in August 2008, which was just before the financial crisis that pushed the U.S. economy into a recession, the CNBC article further stated. Nonetheless, a record increase in prices of used vehicles including cars and trucks was primarily responsible for pushing the inflation rate higher last month.
The cost of food and groceries has picked up and most likely, the increase in cost will be passed on to consumers. Energy prices, by the way, have been bumping up inflation for quite some time but now, rent prices have also gone up. Rent prices, in particular, increased 0.2% last month, the largest uptick in more than a year, as mentioned in a MarketWatch article.
Prices actually increased across all sectors, thanks to the reopening of the U.S. economy and a considerable increase in the pace of vaccination. Notably, the government’s massive stimulus measures and checks to millions of Americans pepped up the coronavirus-marred economy. Meanwhile, household furnishing cost, hotel cost and airline tickets continued to rise.
Thus, with the cost of living going up, returns get affected, something that doesn’t bode well for investors. Another risk is that the Fed may hike rates in an inflationary environment, which tends to drag equities down. In particular, growth stocks tend to get affected the most as inflation does have an impact on future cash flows. However, from an investment perspective, there are stocks that in reality benefit from a rise in inflation, which at present should be enticing enough for investors to watch out for.
Real estate, in particular, gains from a rise in inflation. Property prices tend to increase with rising inflation. Additionally, as property prices rise, rent increases, thereby resulting in higher rental income. In fact, as earlier mentioned, rent prices already increased in May. Now, the best way to invest in real estate is through real estate investment trust (REIT).
Similarly, companies that are part of the consumer staples sector have pricing power or in other words, they can raise their prices with inflation, unlike other sectors. So, they comparatively stand to benefit from a rise in inflation.
Last but not the least, gold doesn’t lose value at times of higher inflation. In fact, demand for gold increases when inflation rises. By the way, gold can be invested by buying gold mining stocks. We have, hence, highlighted five noteworthy stocks from the aforesaid areas that stand to gain from a rise in inflation. These stocks currently flaunt a Zacks Rank #1 (Strong Buy) or 2 (Buy).
Bluerock Residential Growth REIT, Inc. BRG operates as a real estate investment trust. It acquires apartment properties in demographically attractive growth markets throughout the United States. The company currently has a Zacks Rank #2. The company’s expected earnings growth rate for the next quarter and year is 6.3% and 17.9%, respectively.
J & J Snack Foods Corp. JJSF is an American manufacturer, marketer, and distributor of branded niche snack foods and frozen beverages for the food service and retail supermarket industries. The company currently has a Zacks Rank #1. The company’s expected earnings growth rate for the current year is 113.5%. You can see the complete list of today’s Zacks #1 Rank stocks here.
US Foods Holding Corp. USFD is a foodservice distributor. The company currently has a Zacks Rank #1. The company’s expected earnings growth rate for the current year is 1,677.8%.
Archer Daniels Midland Company ADM is one of the leading producers of food and beverage ingredients as well as goods made from various agricultural products. The company currently has a Zacks Rank #2. The company’s expected earnings growth rate for the current year is 25.9%.
Comstock Mining, Inc. LODE, formerly known as GoldSpring, Inc., is a North American precious metals mining company, focused in Nevada, with property in the Comstock Lode District. The company currently has a Zacks Rank #2. The company’s expected earnings growth rate for the current year is 1,050%.
Bitcoin, Like the Internet Itself, Could Change Everything
Blockchain and cryptocurrency has sparked one of the most exciting discussion topics of a generation. Some call it the “Internet of Money” and predict it could change the way money works forever. If true, it could do to banks what Netflix did to Blockbuster and Amazon did to Sears. Experts agree we’re still in the early stages of this technology, and as it grows, it will create several investing opportunities.
Zacks’ has just revealed 3 companies that can help investors capitalize on the explosive profit potential of Bitcoin and the other cryptocurrencies with significantly less volatility than buying them directly.
See 3 crypto-related stocks now >>
Want the latest recommendations from Zacks Investment Research? Today, you can download 7 Best Stocks for the Next 30 Days. Click to get this free report
Archer Daniels Midland Company (ADM) : Free Stock Analysis Report
Bluerock Residential Growth REIT, Inc. (BRG) : Free Stock Analysis Report
J & J Snack Foods Corp. (JJSF) : Free Stock Analysis Report
Comstock Mining, Inc. (LODE) : Free Stock Analysis Report
US Foods Holding Corp. (USFD) : Free Stock Analysis Report
To read this article on Zacks.com click here.
Zacks Investment Research
Hedge funds and large money managers usually invest with a focus on the long-term horizon and, therefore, short-lived dips or bumps on the charts usually don't make them change their opinion towards a company. This time it may be different. The coronavirus pandemic destroyed the high correlations among major industries and asset classes. We are now in a stock pickers market where fundamentals of a stock have more effect on the price than the overall direction of the market. As a result we observe sudden and large changes in hedge fund positions depending on the news flow. Let’s take a look at the hedge fund sentiment towards Chemung Financial Corp. (NASDAQ:CHMG) to find out whether there were any major changes in hedge funds' views.
Hedge fund interest in Chemung Financial Corp. (NASDAQ:CHMG) shares was flat at the end of last quarter. This is usually a negative indicator. Our calculations also showed that CHMG isn't among the 30 most popular stocks among hedge funds (click for Q1 rankings). The level and the change in hedge fund popularity aren't the only variables you need to analyze to decipher hedge funds' perspectives. A stock may witness a boost in popularity but it may still be less popular than similarly priced stocks. That's why at the end of this article we will examine companies such as Quad/Graphics, Inc. (NYSE:QUAD), OptiNose, Inc. (NASDAQ:OPTN), and Comstock Mining, Inc. (NYSE:LODE) to gather more data points.
In the financial world there are a large number of tools investors have at their disposal to grade stocks. A pair of the most under-the-radar tools are hedge fund and insider trading indicators. We have shown that, historically, those who follow the top picks of the best fund managers can outperform the broader indices by a solid amount. Insider Monkey's monthly stock picks returned 206.8% since March 2017 and outperformed the S&P 500 ETFs by more than 115 percentage points (see the details here). That's why we believe hedge fund sentiment is a useful indicator that investors should pay attention to.

Matthew Lindenbaum of Basswood Capital
At Insider Monkey, we scour multiple sources to uncover the next great investment idea. For example, an activist hedge fund wants to buy this $26 biotech stock for $50. So, we recommended a long position to our monthly premium newsletter subscribers. We go through lists like the 10 best battery stocks to pick the next Tesla that will deliver a 10x return. Even though we recommend positions in only a tiny fraction of the companies we analyze, we check out as many stocks as we can. We read hedge fund investor letters and listen to stock pitches at hedge fund conferences. You can subscribe to our free daily newsletter on our homepage. With all of this in mind we're going to review the fresh hedge fund action encompassing Chemung Financial Corp. (NASDAQ:CHMG).
Do Hedge Funds Think CHMG Is A Good Stock To Buy Now?
Heading into the second quarter of 2021, a total of 3 of the hedge funds tracked by Insider Monkey held long positions in this stock, a change of 0% from the previous quarter. By comparison, 3 hedge funds held shares or bullish call options in CHMG a year ago. With the smart money's capital changing hands, there exists a select group of noteworthy hedge fund managers who were adding to their stakes meaningfully (or already accumulated large positions).

When looking at the institutional investors followed by Insider Monkey, Matthew Lindenbaum's Basswood Capital has the biggest position in Chemung Financial Corp. (NASDAQ:CHMG), worth close to $4.2 million, accounting for 0.2% of its total 13F portfolio. The second most bullish fund manager is Renaissance Technologies, which holds a $3.1 million position; the fund has less than 0.1%% of its 13F portfolio invested in the stock. In terms of the portfolio weights assigned to each position Basswood Capital allocated the biggest weight to Chemung Financial Corp. (NASDAQ:CHMG), around 0.19% of its 13F portfolio. Royce & Associates is also relatively very bullish on the stock, designating 0.01 percent of its 13F equity portfolio to CHMG.
Earlier we told you that the aggregate hedge fund interest in the stock was unchanged and we view this as a negative development. Even though there weren't any hedge funds dumping their holdings during the third quarter, there weren't any hedge funds initiating brand new positions. This indicates that hedge funds, at the very best, perceive this stock as dead money and they haven't identified any viable catalysts that can attract investor attention.
Let's also examine hedge fund activity in other stocks similar to Chemung Financial Corp. (NASDAQ:CHMG). These stocks are Quad/Graphics, Inc. (NYSE:QUAD), OptiNose, Inc. (NASDAQ:OPTN), Comstock Mining, Inc. (NYSE:LODE), Annovis Bio, Inc. (NYSE:ANVS), Spark Networks SE (NYSE:LOV), Select Bancorp, Inc. (NASDAQ:SLCT), and Five Star Senior Living Inc. (NASDAQ:FVE). This group of stocks' market values resemble CHMG's market value.
[table] Ticker, No of HFs with positions, Total Value of HF Positions (x1000), Change in HF Position QUAD,10,9438,2 OPTN,10,6714,0 LODE,4,1097,0 ANVS,6,10079,5 LOV,6,44401,-3 SLCT,5,11115,0 FVE,11,27833,0 Average,7.4,15811,0.6 [/table]
View table here if you experience formatting issues.
As you can see these stocks had an average of 7.4 hedge funds with bullish positions and the average amount invested in these stocks was $16 million. That figure was $9 million in CHMG's case. Five Star Senior Living Inc. (NASDAQ:FVE) is the most popular stock in this table. On the other hand Comstock Mining, Inc. (NYSE:LODE) is the least popular one with only 4 bullish hedge fund positions. Compared to these stocks Chemung Financial Corp. (NASDAQ:CHMG) is even less popular than LODE. Our overall hedge fund sentiment score for CHMG is 23. Stocks with higher number of hedge fund positions relative to other stocks as well as relative to their historical range receive a higher sentiment score. Hedge funds dodged a bullet by taking a bearish stance towards CHMG. Our calculations showed that the top 10 most popular hedge fund stocks returned 95.8% in 2019 and 2020, and outperformed the S&P 500 ETF (SPY) by 40 percentage points. These stocks gained 17.2% in 2021 through June 11th but managed to beat the market again by 3.3 percentage points. Unfortunately CHMG wasn't nearly as popular as these 5 stocks (hedge fund sentiment was very bearish); CHMG investors were disappointed as the stock returned 2.8% since the end of the first quarter (through 6/11) and underperformed the market. If you are interested in investing in large cap stocks with huge upside potential, you should check out the top 5 most popular stocks among hedge funds as most of these stocks already outperformed the market since 2019.
Get real-time email alerts: Follow Chemung Financial Corp (NASDAQ:CHMG)
Disclosure: None. This article was originally published at Insider Monkey.
Related Content
Is Alexco Resource Corp. (NYSE:AXU) a good place to invest some of your money right now? We can gain invaluable insight to help us answer that question by studying the investment trends of top investors, who employ world-class Ivy League graduates, who are given immense resources and industry contacts to put their financial expertise to work. The top picks of these firms have historically outperformed the market when we account for known risk factors, making them very valuable investment ideas.
Hedge fund interest in Alexco Resource Corp. (NYSE:AXU) shares was flat at the end of last quarter. This is usually a negative indicator. Our calculations also showed that AXU isn't among the 30 most popular stocks among hedge funds (click for Q1 rankings). The level and the change in hedge fund popularity aren't the only variables you need to analyze to decipher hedge funds' perspectives. A stock may witness a boost in popularity but it may still be less popular than similarly priced stocks. That's why at the end of this article we will examine companies such as Summit Financial Group, Inc. (NASDAQ:SMMF), DSP Group, Inc. (NASDAQ:DSPG), and Big 5 Sporting Goods Corporation (NASDAQ:BGFV) to gather more data points.
Today there are many metrics stock market investors put to use to size up stocks. A pair of the less known metrics are hedge fund and insider trading activity. We have shown that, historically, those who follow the top picks of the top investment managers can outclass their index-focused peers by a healthy margin (see the details here). Also, our monthly newsletter's portfolio of long stock picks returned 206.8% since March 2017 (through May 2021) and beat the S&P 500 Index by more than 115 percentage points. You can download a sample issue of this newsletter on our website .
Eric Sprott of Sprott Asset Management
At Insider Monkey, we scour multiple sources to uncover the next great investment idea. For example, an activist hedge fund wants to buy this $26 biotech stock for $50. So, we recommended a long position to our monthly premium newsletter subscribers. We go through lists like the 10 best battery stocks to pick the next Tesla that will deliver a 10x return. Even though we recommend positions in only a tiny fraction of the companies we analyze, we check out as many stocks as we can. We read hedge fund investor letters and listen to stock pitches at hedge fund conferences. You can subscribe to our free daily newsletter on our homepage. Keeping this in mind we're going to view the key hedge fund action encompassing Alexco Resource Corp. (NYSE:AXU).
Do Hedge Funds Think AXU Is A Good Stock To Buy Now?
At Q1's end, a total of 3 of the hedge funds tracked by Insider Monkey held long positions in this stock, a change of 0% from one quarter earlier. The graph below displays the number of hedge funds with bullish position in AXU over the last 23 quarters. So, let's check out which hedge funds were among the top holders of the stock and which hedge funds were making big moves.

The largest stake in Alexco Resource Corp. (NYSE:AXU) was held by Sprott Asset Management, which reported holding $0.2 million worth of stock at the end of December. It was followed by Citadel Investment Group with a $0.1 million position. The only other hedge fund that is bullish on the company was Millennium Management.
Earlier we told you that the aggregate hedge fund interest in the stock was unchanged and we view this as a negative development. Even though there weren't any hedge funds dumping their holdings during the third quarter, there weren't any hedge funds initiating brand new positions. This indicates that hedge funds, at the very best, perceive this stock as dead money and they haven't identified any viable catalysts that can attract investor attention.
Let's now review hedge fund activity in other stocks – not necessarily in the same industry as Alexco Resource Corp. (NYSE:AXU) but similarly valued. We will take a look at Summit Financial Group, Inc. (NASDAQ:SMMF), DSP Group, Inc. (NASDAQ:DSPG), Big 5 Sporting Goods Corporation (NASDAQ:BGFV), Farmland Partners Inc (NYSE:FPI), Kaleido BioSciences, Inc. (NASDAQ:KLDO), Uxin Limited (NASDAQ:UXIN), and Village Super Market, Inc. (NASDAQ:VLGEA). This group of stocks' market valuations are closest to AXU's market valuation.
[table] Ticker, No of HFs with positions, Total Value of HF Positions (x1000), Change in HF Position SMMF,4,10966,0 DSPG,13,54197,0 BGFV,14,27074,-3 FPI,5,1965,-3 KLDO,6,7960,4 UXIN,3,5133,0 VLGEA,7,30340,-3 Average,7.4,19662,-0.7 [/table]
View table here if you experience formatting issues.
As you can see these stocks had an average of 7.4 hedge funds with bullish positions and the average amount invested in these stocks was $20 million. That figure was $0 million in AXU's case. Big 5 Sporting Goods Corporation (NASDAQ:BGFV) is the most popular stock in this table. On the other hand Uxin Limited (NASDAQ:UXIN) is the least popular one with only 3 bullish hedge fund positions. Compared to these stocks Alexco Resource Corp. (NYSE:AXU) is even less popular than UXIN. Our overall hedge fund sentiment score for AXU is 23. Stocks with higher number of hedge fund positions relative to other stocks as well as relative to their historical range receive a higher sentiment score. Hedge funds clearly dropped the ball on AXU as the stock delivered strong returns, though hedge funds' consensus picks still generated respectable returns. Our calculations showed that top 5 most popular stocks among hedge funds returned 95.8% in 2019 and 2020, and outperformed the S&P 500 ETF (SPY) by 40 percentage points. These stocks gained 17.2% in 2021 through June 11th and still beat the market by 3.3 percentage points. A small number of hedge funds were also right about betting on AXU as the stock returned 17.1% since Q1 (through June 11th) and outperformed the market by an even larger margin.
Get real-time email alerts: Follow Alexco Resource Corp (NYSE:AXU)
Disclosure: None. This article was originally published at Insider Monkey.
Related Content
The pandemic is helping to soften the reputation of mining companies, often cast as villains.
Most readers would already know that First Quantum Minerals' (TSE:FM) stock increased by 4.4% over the past three months. Given that the stock prices usually follow long-term business performance, we wonder if the company's mixed financials could have any adverse effect on its current price price movement Particularly, we will be paying attention to First Quantum Minerals' ROE today.
Return on Equity or ROE is a test of how effectively a company is growing its value and managing investors’ money. Simply put, it is used to assess the profitability of a company in relation to its equity capital.
Check out our latest analysis for First Quantum Minerals
How Is ROE Calculated?
ROE can be calculated by using the formula:
Return on Equity = Net Profit (from continuing operations) ÷ Shareholders' Equity
So, based on the above formula, the ROE for First Quantum Minerals is:
0.6% = US$65m ÷ US$10b (Based on the trailing twelve months to March 2021).
The 'return' is the amount earned after tax over the last twelve months. One way to conceptualize this is that for each CA$1 of shareholders' capital it has, the company made CA$0.01 in profit.
What Is The Relationship Between ROE And Earnings Growth?
Thus far, we have learned that ROE measures how efficiently a company is generating its profits. We now need to evaluate how much profit the company reinvests or "retains" for future growth which then gives us an idea about the growth potential of the company. Assuming all else is equal, companies that have both a higher return on equity and higher profit retention are usually the ones that have a higher growth rate when compared to companies that don't have the same features.
First Quantum Minerals' Earnings Growth And 0.6% ROE
It is quite clear that First Quantum Minerals' ROE is rather low. Even when compared to the industry average of 15%, the ROE figure is pretty disappointing. Given the circumstances, the significant decline in net income by 3.2% seen by First Quantum Minerals over the last five years is not surprising. We believe that there also might be other aspects that are negatively influencing the company's earnings prospects. For example, the business has allocated capital poorly, or that the company has a very high payout ratio.
So, as a next step, we compared First Quantum Minerals' performance against the industry and were disappointed to discover that while the company has been shrinking its earnings, the industry has been growing its earnings at a rate of 29% in the same period.

Earnings growth is an important metric to consider when valuing a stock. What investors need to determine next is if the expected earnings growth, or the lack of it, is already built into the share price. By doing so, they will have an idea if the stock is headed into clear blue waters or if swampy waters await. Is First Quantum Minerals fairly valued compared to other companies? These 3 valuation measures might help you decide.
Is First Quantum Minerals Using Its Retained Earnings Effectively?
When we piece together First Quantum Minerals' low three-year median payout ratio of 1.1% (where it is retaining 99% of its profits), calculated for the last three-year period, we are puzzled by the lack of growth. This typically shouldn't be the case when a company is retaining most of its earnings. It looks like there might be some other reasons to explain the lack in that respect. For example, the business could be in decline.
Moreover, First Quantum Minerals has been paying dividends for at least ten years or more suggesting that management must have perceived that the shareholders prefer dividends over earnings growth. Based on the latest analysts' estimates, we found that the company's future payout ratio over the next three years is expected to hold steady at 1.2%. Regardless, the future ROE for First Quantum Minerals is predicted to rise to 11% despite there being not much change expected in its payout ratio.
Conclusion
On the whole, we feel that the performance shown by First Quantum Minerals can be open to many interpretations. While the company does have a high rate of reinvestment, the low ROE means that all that reinvestment is not reaping any benefit to its investors, and moreover, its having a negative impact on the earnings growth. That being so, the latest industry analyst forecasts show that the analysts are expecting to see a huge improvement in the company's earnings growth rate. To know more about the company's future earnings growth forecasts take a look at this free report on analyst forecasts for the company to find out more.
This article by Simply Wall St is general in nature. It does not constitute a recommendation to buy or sell any stock, and does not take account of your objectives, or your financial situation. We aim to bring you long-term focused analysis driven by fundamental data. Note that our analysis may not factor in the latest price-sensitive company announcements or qualitative material. Simply Wall St has no position in any stocks mentioned.
Have feedback on this article? Concerned about the content? Get in touch with us directly. Alternatively, email editorial-team (at) simplywallst.com.
We often see insiders buying up shares in companies that perform well over the long term. Unfortunately, there are also plenty of examples of share prices declining precipitously after insiders have sold shares. So we'll take a look at whether insiders have been buying or selling shares in Artemis Resources Limited (ASX:ARV).
What Is Insider Selling?
It's quite normal to see company insiders, such as board members, trading in company stock, from time to time. However, such insiders must disclose their trading activities, and not trade on inside information.
Insider transactions are not the most important thing when it comes to long-term investing. But logic dictates you should pay some attention to whether insiders are buying or selling shares. For example, a Harvard University study found that 'insider purchases earn abnormal returns of more than 6% per year'.
View our latest analysis for Artemis Resources
Artemis Resources Insider Transactions Over The Last Year
In the last twelve months, the biggest single purchase by an insider was when Executive Director Alastair Clayton bought AU$120k worth of shares at a price of AU$0.12 per share. That means that an insider was happy to buy shares at above the current price of AU$0.059. Their view may have changed since then, but at least it shows they felt optimistic at the time. In our view, the price an insider pays for shares is very important. As a general rule, we feel more positive about a stock when an insider has bought shares at above current prices, because that suggests they viewed the stock as good value, even at a higher price. The only individual insider to buy over the last year was Alastair Clayton.
Alastair Clayton bought a total of 2.00m shares over the year at an average price of AU$0.10. The chart below shows insider transactions (by companies and individuals) over the last year. If you click on the chart, you can see all the individual transactions, including the share price, individual, and the date!

There are plenty of other companies that have insiders buying up shares. You probably do not want to miss this free list of growing companies that insiders are buying.
Does Artemis Resources Boast High Insider Ownership?
Looking at the total insider shareholdings in a company can help to inform your view of whether they are well aligned with common shareholders. I reckon it's a good sign if insiders own a significant number of shares in the company. Our data indicates that Artemis Resources insiders own about AU$4.4m worth of shares (which is 5.9% of the company). But they may have an indirect interest through a corporate structure that we haven't picked up on. We do generally prefer see higher levels of insider ownership.
What Might The Insider Transactions At Artemis Resources Tell Us?
Our data shows a little insider buying, but no selling, in the last three months. That said, the purchases were not large. But insiders have shown more of an appetite for the stock, over the last year. We'd like to see bigger individual holdings. However, we don't see anything to make us think Artemis Resources insiders are doubting the company. In addition to knowing about insider transactions going on, it's beneficial to identify the risks facing Artemis Resources. Our analysis shows 6 warning signs for Artemis Resources (2 are concerning!) and we strongly recommend you look at them before investing.
But note: Artemis Resources may not be the best stock to buy. So take a peek at this free list of interesting companies with high ROE and low debt.
For the purposes of this article, insiders are those individuals who report their transactions to the relevant regulatory body. We currently account for open market transactions and private dispositions, but not derivative transactions.
This article by Simply Wall St is general in nature. It does not constitute a recommendation to buy or sell any stock, and does not take account of your objectives, or your financial situation. We aim to bring you long-term focused analysis driven by fundamental data. Note that our analysis may not factor in the latest price-sensitive company announcements or qualitative material. Simply Wall St has no position in any stocks mentioned.
Have feedback on this article? Concerned about the content? Get in touch with us directly. Alternatively, email editorial-team (at) simplywallst.com.
QUÉBEC CITY, June 11, 2021 (GLOBE NEWSWIRE) — Stelmine Canada (STH-TSXV) (“Stelmine” or the “Company”) is pleased to announce that it has closed its recently announced non-brokered private placement (the “Offering”). A total of 5,384,614 units of Stelmine (the "Units") were issued at a price of $0.13 per unit for gross proceeds of $700,000. Each Unit comprised one common share of Stelmine and one-half of a common share purchase warrant. Each full warrant entitles the holder to acquire one common share of the Company at $0.20 for a period of 36 months from issuance. The warrants are callable from Stelmine should the common shares of the company exceed $0.30 for a period of 20 consecutive trading days following the four-month hold.
Three (3) insiders of the Company participated in the private placement for aggregate gross proceeds of $16,750. These insiders purchased Units under the same terms as the other investors. The participation of these insiders is exempt from the formal valuation and shareholder approval requirements pursuant to Sections 5.5(a) and 5.7(1)(a) of Multilateral Instrument 61-101 – Protection of Minority Security Holders in Special Transactions, on the basis that the fair market value of such participation or the consideration paid by such insiders does not exceed 25% of the market capitalization of the Company.
All securities issued in connection with this Offering are subject to a hold period of four months and one day. The private placement is subject to the approval of the TSX Venture Exchange. Stelmine has not filed a material change report in the 21 days preceding the placement other than in relation to the placement.
Stelmine has now raised total gross proceeds of $1.4 million this month in two separate financings with strategic investors. The funds will be used for exploration on the Courcy and Mercator Projects in the Caniapiscau region and for general working capital purposes. In connection with this placement, the Company will pay finder’s fees of $23,244.
About Stelmine Canada
Stelmine is a junior mining exploration company pioneering a new gold district (Caniapiscau) east of James Bay in the under-explored eastern part of the Opinaca metasedimentary basin where the geological context has similarities to the Eleonore mine. Stelmine has 100% ownership of 1,574 claims or 815 km² in this part of northern Quebec, highlighted by the Courcy and Mercator Projects.
Forward-looking statements
Certain information in this press release may contain forward-looking statements, such as statements regarding the expected closing of and the anticipated use of the proceeds from the Offering, acquisition and expansion plans, availability of quality acquisition opportunities, and growth of the Company. This information is based on current expectations and assumptions (including assumptions in connection with obtaining all necessary approvals for the Offering and general economic and market conditions) that are subject to significant risks and uncertainties that are difficult to predict. Actual results might differ materially from results suggested in any forward-looking statements. Risks that could cause results to differ from those stated in the forward-looking statements in this release include those relating to the ability to complete the Offering on the terms described above. The Company assumes no obligation to update the forward-looking statements, or to update the reasons why actual results could differ from those reflected in the forward-looking statements unless and until required by securities laws applicable to the Company. Additional information identifying risks and uncertainties is contained in the Company’s filings with the Canadian securities regulators, which filings are available at www.sedar.com.
Cautionary statement
Neither TSX Venture Exchange nor its Regulation Services Provider (as that term is defined in the policies of the TSX Venture Exchange) accepts responsibility for the adequacy or accuracy of this release.
NOT FOR DISSEMINATION IN THE UNITED STATES OR FOR DISTRIBUTION TO U.S. NEWSWIRE SERVICES AND DOES NOT CONSTITUTE AN OFFER OF THE SECURITIES DESCRIBED HEREIN
For further information, contact:
Isabelle Proulx, President and CEO
Email: iproulx@stelmine.com
Tel: 418-626-6333
Follow us on:
Website : https://stelmine.com/en/
Twitter : https://twitter.com/Stelmine1
LinkedIn : http://www.linkedin.com/company/stelmine-canada-ltd
Facebook: https://www.facebook.com/StelmineCanada/
Resource stocks were driving the FTSE 100 to gains on Friday, lifting the index back toward levels not seen since before the COVID-19 pandemic.
TORONTO, June 11, 2021 /CNW/ – Laurion Mineral Exploration Inc. (TSXV: LME) (OTCPINK: LMEFF) ("LAURION" or the "Corporation") will host its annual and special meeting of shareholders (the "Meeting") on Tuesday, July 6, 2021 at 11:00 a.m. (Eastern time). Out of an abundance of caution, to proactively address potential issues arising from the ongoing public health impact of COVID-19 while enabling greater participation of LAURION's shareholders, the Meeting will take place in a virtual-only format.
The Meeting will allow shareholders to listen to the proceedings and submit votes through the web-based platform. Details for shareholders and interested parties in attending the virtual meeting are found below. Participants are encouraged to login in approximately 15 minutes prior to the start time.
Date: Tuesday, July 6, 2021
Time: 11:00 a.m. Eastern Time
Meeting ID: 1164
URL: https://virtual-meetings.tsxtrust.com/en
Password: laurion2021 (case sensitive)
Instructions for joining the Meeting:
-
Type in https://virtual-meetings.tsxtrust.com/en/1164 on your browser at least 15 minutes before the Meeting starts. Please do not do a Google search. Do not use Internet Explorer.
-
Click on "I am a Guest" if you are an interested party or a shareholder not intending to vote.
In order to streamline the virtual meeting process, the Corporation strongly encourages shareholders to vote in advance of the Meeting using the Voting Instruction Form ("VIF") and Form of Proxy for the Meeting, which are available on SEDAR at www.sedar.com and also at https://docs.tsxtrust.com/2025. Proxies must be deposited with the Corporation's transfer agent and registrar, TSX Trust Company ("TSX Trust"), on or before 11:00 a.m. (Eastern time) on July 2, 2021.
Registered shareholders entitled to vote at the Meeting may attend and vote at the Meeting virtually by following the steps set out below:
-
Type in https://virtual-meetings.tsxtrust.com/en/1164 on your browser at least 15 minutes before the Meeting starts.
-
Click on "I have a control number".
-
Enter your 12-digit control number (on your proxy form).
-
Enter the password: laurion2021 (case sensitive).
-
When the ballot is opened, click on the "Voting" icon. To vote, simply select your voting direction from the options shown on screen and click "Submit". A confirmation message will appear to show your vote has been received.
Beneficial Shareholders entitled to vote at the Meeting may vote at the Meeting virtually by following the steps set out below:
-
Appoint yourself as proxyholder by writing your name in the space provided on the form of proxy or VIF.
-
Sign and send it to your intermediary, following the voting deadline and submission instructions on the VIF.
-
Obtain a control number by contacting TSX Trust by emailing tsxtrustproxyvoting@tmx.com the "Request for Control Number" form, which can be found here https://tsxtrust.com/resource/en/75.
-
Type in https://virtual-meetings.tsxtrust.com/en/1164 on your browser at least 15 minutes before the Meeting starts.
-
Click on "I have a control number".
-
Enter the control number provided by tsxtrustproxyvoting@tmx.com
-
Enter the password: laurion2021 (case sensitive).
-
When the ballot is opened, click on the "Voting" icon. To vote, simply select your voting direction from the options shown on screen and click Submit. A confirmation message will appear to show your vote has been received.
If you are a registered shareholder and you want to appoint someone else (other than the management nominees) to vote online at the Meeting, you must first submit your proxy indicating who you are appointing. You or your appointee must then register with TSX Trust in advance of the Meeting by emailing tsxtrustproxyvoting@tmx.com the "Request for Control Number" form, which can be found at https://tsxtrust.com/resource/en/75.
If you are a non-registered shareholder and want to vote online at the Meeting, you must appoint yourself as proxyholder and register with TSX Trust in advance of the Meeting by emailing tsxtrustproxyvoting@tmx.com the "Request for Control Number" form, which can be found at https://tsxtrust.com/resource/en/75.
Shareholders who have any questions or require further information with regard to voting their shares or attending the Meeting should contact TSX Trust, toll-free in North America at 1-866-600-5869 or by email at tmxeinvestorservices@tmx.com.
Further information related to the Meeting, including the matters to be voted on and how to attend the Meeting and vote, is set forth in the Corporation's management information circular dated May 27, 2021, which is available under LAURION's SEDAR profile at www.sedar.com.
About LAURION Mineral Exploration Inc.
The Corporation is a junior mineral exploration and development company listed on the TSXV under the symbol LME and on the OTCPINK under the symbol LMEFF. LAURION now has 228,052,731 outstanding shares of which approximately 79% are owned and controlled by Insiders who are eligible investors under the "Friends and Family" categories.
LAURION's emphasis is on the development of its flagship project, the 100% owned mid-stage 47 km2 Ishkoday Project, and its gold-silver and gold-rich polymetallic mineralization with a significant upside potential. The mineralization on Ishkoday is open at depth beyond the current core-drilling limit of -200 m from surface, based on the historical mining to a -685 m depth, in the past producing Sturgeon River Mine. The recently acquired Brenbar Property, which is contiguous with the Ishkoday Property, hosts the historic Brenbar Mine and LAURION believes the mineralization to be a direct extension of mineralization from the Ishkoday Property.
Follow us on Twitter: @LAURION_LME
Caution Regarding Forward-Looking Information
This press release contains forward-looking statements, which reflect the Corporation's current expectations regarding future events, including with respect to management's anticipated timing, format and conduct of the Meeting, LAURION's business, operations and condition, and management's objectives, strategies, beliefs and intentions. The forward-looking statements involve risks and uncertainties. Actual events and future results, performance or achievements expressed or implied by such forward-looking statements could differ materially from those projected herein including as a result of the interpretation and actual results of current exploration activities, changes in project parameters as plans continue to be refined, future prices of gold and/or other metals, possible variations in grade or recovery rates, failure of equipment or processes to operate as anticipated, the failure of contracted parties to perform, labor disputes and other risks of the mining industry, delays in obtaining governmental approvals or financing or in the completion of exploration, as well as those factors disclosed in the Corporation's publicly filed documents. Investors should consult the Corporation's ongoing quarterly and annual filings, as well as any other additional documentation comprising the Corporation's public disclosure record, for additional information on risks and uncertainties relating to these forward-looking statements. The reader is cautioned not to rely on these forward-looking statements. Subject to applicable law, the Corporation disclaims any obligation to update these forward-looking statements.
NEITHER THE TSX VENTURE EXCHANGE NOR ITS REGULATION SERVICE PROVIDER (AS THAT TERM IS DEFINED IN THE POLICIES OF THE TSX VENTURE EXCHANGE) ACCEPTS RESPONSIBILITY FOR THE ADEQUACY OR ACCURACY OF THE CONTENT OF THIS NEWS RELEASE.
SOURCE Laurion Mineral Exploration Inc.

View original content: http://www.newswire.ca/en/releases/archive/June2021/11/c4189.html
Under the guidance of CEO Diana Hu, Eastern Platinum Limited (TSE:ELR) has performed reasonably well recently. In light of this performance, CEO compensation will probably not be the main focus for shareholders as they go into the AGM on 17 June 2021. However, some shareholders will still be cautious of paying the CEO excessively.
Check out our latest analysis for Eastern Platinum
Comparing Eastern Platinum Limited's CEO Compensation With the industry
According to our data, Eastern Platinum Limited has a market capitalization of CA$49m, and paid its CEO total annual compensation worth US$393k over the year to December 2020. We note that's an increase of 26% above last year. In particular, the salary of US$288.4k, makes up a huge portion of the total compensation being paid to the CEO.
For comparison, other companies in the industry with market capitalizations below CA$242m, reported a median total CEO compensation of US$124k. This suggests that Diana Hu is paid more than the median for the industry.
|
Component |
2020 |
2019 |
Proportion (2020) |
|
Salary |
US$288k |
US$280k |
73% |
|
Other |
US$105k |
US$31k |
27% |
|
Total Compensation |
US$393k |
US$311k |
100% |
Speaking on an industry level, nearly 93% of total compensation represents salary, while the remainder of 7% is other remuneration. In Eastern Platinum's case, non-salary compensation represents a greater slice of total remuneration, in comparison to the broader industry. If total compensation veers towards salary, it suggests that the variable portion – which is generally tied to performance, is lower.

A Look at Eastern Platinum Limited's Growth Numbers
Eastern Platinum Limited has seen its earnings per share (EPS) increase by 24% a year over the past three years. It achieved revenue growth of 22% over the last year.
Overall this is a positive result for shareholders, showing that the company has improved in recent years. It's also good to see decent revenue growth in the last year, suggesting the business is healthy and growing. We don't have analyst forecasts, but you could get a better understanding of its growth by checking out this more detailed historical graph of earnings, revenue and cash flow.
Has Eastern Platinum Limited Been A Good Investment?
With a total shareholder return of 13% over three years, Eastern Platinum Limited shareholders would, in general, be reasonably content. But they would probably prefer not to see CEO compensation far in excess of the median.
To Conclude…
Given that the company's overall performance has been reasonable, the CEO remuneration policy might not be shareholders' central point of focus in the upcoming AGM. However, any decision to raise CEO pay might be met with some objections from the shareholders given that the CEO is already paid higher than the industry average.
CEO pay is simply one of the many factors that need to be considered while examining business performance. That's why we did our research, and identified 3 warning signs for Eastern Platinum (of which 1 is a bit concerning!) that you should know about in order to have a holistic understanding of the stock.
Switching gears from Eastern Platinum, if you're hunting for a pristine balance sheet and premium returns, this free list of high return, low debt companies is a great place to look.
This article by Simply Wall St is general in nature. It does not constitute a recommendation to buy or sell any stock, and does not take account of your objectives, or your financial situation. We aim to bring you long-term focused analysis driven by fundamental data. Note that our analysis may not factor in the latest price-sensitive company announcements or qualitative material. Simply Wall St has no position in any stocks mentioned.
Have feedback on this article? Concerned about the content? Get in touch with us directly. Alternatively, email editorial-team (at) simplywallst.com.
(Bloomberg) — BHP Group averted a strike at its second-largest copper mine in Chile after workers at the Spence operation accepted a final wage offer on the last day of mediated talks.
The deal will ease concerns over a potential stoppage that would have further tightened global supplies of the metal. It comes after staff at a BHP operations center in Santiago ended a strike and returned to work this week. Attention will now shift to wage talks at BHP’s giant Escondida mine.
About 92% of the 1,079 Spence operations and maintenance staff who voted accepted terms of the new three-year contract, according to a document provided by the union. Workers had rejected a previous proposal and BHP sought mediation that was extended through Thursday.
“In these times, the deal we reached is an important signal of how we should face Spence’s current and future challenges,” said Ana Zuniga, a spokesperson for BHP’s Pampa Norte, which comprises Spence and the Cerro Colorado mines.
Workers are “calm and glad” with a package that includes a 2% wage increase and a 15.5 million-peso ($21,600) bonus, as well as new benefits and other adjustments, Union President Ronald Salcedo said.
Surging copper prices and company profits are emboldening unions whose members have continued to work through the pandemic. On the other side, producers are looking to contain labor costs as inflation picks up, ore quality deteriorates and and host nations look for a bigger share of the windfall.
Still, the wage deal at Spence may bode well for collective bargaining that just kicked off at Escondida, the world’s largest copper mine that endured a 44-day strike in 2017. Wage talks in the top copper-producing nation add to supply risks at a time when recovering demand is tightening the global market.
BHP recently invested about $2.5 billion in upgrades at Spence, including a new concentrator, with the Pampa Norte division expected to produce 240,000-270,000 tons in fiscal year 2021, compared with 243,000 tons last year.
(Adds company comment and details on Spence.)
More stories like this are available on bloomberg.com
Subscribe now to stay ahead with the most trusted business news source.
©2021 Bloomberg L.P.
Mining stocks steamed ahead on Friday, helping the FTSE 100 (^FTSE) to push to its highest level in a month.
Glencore (GLEN.L) rose more than 3%, Antofagasta (ANTO.L) climbed 2.5% higher and Evraz (EVR.L) was up 2.7% in noon trade, lifting London’s benchmark index to its highest since 10 May, when it touched a new record level since the pandemic began.
Newly-listed Thungela Resources (TGA.L), a spin-off from Anglo American (AAL.L) also pushed 2.4% higher on the day, while healthcare stocks also joined the precious metal and base metal miners on the rally.
It came as metal prices and oil prices rose on Friday as the International Energy Agency (IEA) said on Friday oil demand is set to rise above pre-COVID levels by the end of 2022, but that oil producers will need to boost production.
The Paris-based body expects consumption to rebound by 5.4 million barrels per day (bd) this year as vaccines are rolled out and economies reopen. Consumption declined by a record 8.6 million bd in 2020 as the coronavirus pandemic took a hold.
It expects a further 3.1 million bd increase in 2022, to average 99.5 million bd with an increase at the end of the year that will surpass the level of demand before the COVID pandemic.
Countries outside the Organisation of Petroleum Exporting Countries and its allies (OPEC+) group are expected to boost output by 1.6 million bd next year, to exceed 2019 levels.
While, OPEC+ countries will have 6.9 million bd of spare capacity even after lifting production by 2 million bd over the May-July period.
Read more: Oil demand will exceed pre-COVID levels by end of 2022
London miners were also boosted by reports that the UK economy grew 2.3% in April, the fastest rise since July 2020.
The figure, which follows strong growth of 2.1% in March, was slightly above Reuters poll consensus for a 2.2% increase as non-essential shops and outdoor hospitality reopened to the public after months of lockdown.
The services sector provided the biggest boost to the British economy, with output growing 3.4% during the month.
However overall output remains 3.7% below the pre-pandemic levels seen in February last year. Output in the production sector fell by 1.3% in April 2021, the first fall since January 2021 as three of the four sectors contracted.
Watch: Could mining make a comeback in Cornwall?
Vancouver, British Columbia–(Newsfile Corp. – June 11, 2021) – Pure Energy Minerals (TSXV: PE) (OTCQB: PEMIF) (the "Company" or "Pure Energy") is pleased to provide an important release by Schlumberger, the Company's strategic investor at Pure Energy's Clayton Valley Project in Esmeralda County, Nevada, where Schlumberger's plans are underway to construct a pilot plant for innovative lithium brine extraction. The following news was released by Schlumberger on June 10, 2021.
"HOUSTON, June 10, 2021- Schlumberger New Energy, and Panasonic Energy of North America, a division of Panasonic Corporation of North America, have announced a collaboration agreement for the validation and optimization of the innovative and sustainable lithium extraction and production process to be used by Schlumberger New Energy at its NeoLith Energy pilot plant in Nevada. This collaboration paves the way for improved lithium production solutions that will help meet the expected surge in demand for lithium as the electric vehicle (EV) market takes off worldwide.
NeoLith Energy's sustainable approach uses a differentiated direct lithium extraction (DLE) process to produce high-purity, battery-grade lithium material while reducing the production time from over a year to weeks. The unique process is in sharp contrast to conventional evaporative methods of extracting lithium, with a significantly reduced groundwater and physical footprint. Panasonic will provide their guidance to validate and optimize the lithium material for battery-grade consumption. Situated in Clayton Valley, Nevada, the pilot plant is just 200 miles from Panasonic's large-scale advanced battery manufacturing operation, Panasonic Energy of North America, in Sparks, Nevada.
As a global technology company and leader in lithium-ion batteries, Panasonic has a proven track record in innovation and advanced products and solutions that power the automotive industry. Demand for battery-grade lithium is projected to grow exponentially over the next decade. As EVs greatly depend on lithium-ion rechargeable batteries, sustainable and efficient lithium production has become an important topic for regions, industries and technology companies, as well as battery and large automotive manufacturers. While the lithium industry is expected to attract large investments, the time-to-first-lithium-production for new development projects and regions will be critical for the industry to meet the surge in demand.
"Panasonic has a longstanding commitment to contributing to society and increasing sustainability in the supply chain as we work to produce the world's safest, highest quality and most affordable batteries is a critical priority," said Allan Swan, president of Panasonic Energy of North America. "We look forward to working with Schlumberger New Energy to help achieve our vision of advancing the lithium-ion battery space and accelerating to a clean energy society."
"Panasonic is a pioneer in electric vehicle battery technology, and we are excited to collaborate with them in developing our differentiated direct lithium extraction and production process," said Ashok Belani, executive vice president Schlumberger New Energy. "We are committed to expanding the global supply chain for advanced lithium compounds to support the forecasted surge in demand and enable new opportunities for lithium production globally."
NeoLith Energy's objective will be to pump brine from the subsurface, extract greater than 90% of the dissolved lithium, and pump more than 85% of the brine back to the subsurface in an environmentally safe manner. In addition to maximizing the reinjection of the brine, the ultimate goal is to eliminate the need for any fresh water from an external source and reduce the environmental impact.
Together, Panasonic and Schlumberger New Energy aim to accelerate the development and implementation of an innovative lithium production process, with a commitment to economical, environmental and responsible extraction to empower the world's transition to new energy sources.
About Schlumberger New Energy
Schlumberger is the world's leading provider of technology to the global energy industry. Schlumberger New Energy explores new avenues of growth by leveraging Schlumberger's intellectual and business capital in emerging new energy markets, with a focus on low-carbon and carbon-neutral energy technologies. Its activities include ventures in the domains of hydrogen, lithium, carbon capture and sequestration, geothermal power and geoenergy for heating and cooling buildings.
Learn more about Schlumberger New Energy: newenergy.slb.com
About Panasonic
Panasonic Corporation is a global leader developing innovative technologies and solutions for wide-ranging applications in the consumer electronics, housing, automotive, and B2B sectors. The company, which celebrated its 100th anniversary in 2018, operates 522 subsidiaries and 69 associated companies worldwide and reported consolidated net sales of 6,698.8 billion yen for the year ended March 31, 2021. Committed to pursuing new value through collaborative innovation, the company uses its technologies to create a better life and a better world for customers.
Cautionary Statement Regarding Forward-Looking Statements
This press release contains "forward-looking statements" within the meaning of the U.S. federal securities laws – that is, statements about the future, not about past events. Such statements often contain words such as "expect," "may," "believe," "plan," "can," "estimate," "intend," "anticipate," "should," "could," "will," "likely," "goal," "objective," "potential," "projected" and other similar words. Forward-looking statements address matters that are, to varying degrees, uncertain, such as projected demand growth for battery-grade lithium and EVs; forecasts or expectations regarding the development of, or anticipated benefits of, NeoLith Energy's process and other Schlumberger New Energy initiatives; and other forecasts or expectations regarding the energy transition and global climate change. These statements are subject to risks and uncertainties, including, but not limited to, the inability to recognize intended benefits from Schlumberger New Energy strategies, initiatives or partnerships; legislative and regulatory initiatives addressing environmental concerns, including initiatives addressing the impact of global climate change; and other risks and uncertainties detailed in the companies' public filings, including Schlumberger's most recent Forms 10-K, 10-Q and 8-K filed with or furnished to the U.S. Securities and Exchange Commission. If one or more of these or other risks or uncertainties materialize (or the consequences of such a development changes), or should underlying assumptions prove incorrect, actual outcomes may vary materially from those reflected in our forward-looking statements. The forward-looking statements speak only as of the date of this press release, the parties disclaim any intention or obligation to update publicly or revise such statements, whether as a result of new information, future events or otherwise. "
About Pure Energy Minerals
Pure Energy Minerals is a lithium resource developer that is driven to become a low-cost supplier for the growing lithium battery industry. Pure Energy has consolidated a pre-eminent land position at its Clayton Valley ("CV") Project in the Clayton Valley of central Nevada for the exploration and development of lithium resources, comprising 950 claims over 23,360 acres (9,450 hectares), representing the largest mineral land holdings in the valley. Pure Energy's Clayton Valley Project adjoins and surrounds on three sides the Silver Peak lithium brine mine operated by Albemarle Corporation. Drilling of bore holes CV-01 through CV-08 were completed together with a revised mineral resource and a Preliminary Economic Assessment ("PEA") for the Clayton Valley Project (news releases of June 26, 2017 and April 5, 2018).
Pure Energy's strategic investor, Schlumberger Technology Corp. ("SLB"), is the operator of the Clayton Valley Project. On May 29, 2019, Pure Energy and SLB signed an Earn-In agreement over the CV Project which requires significant investment by SLB at the Project, to include the design and construction of a pilot plant capable of processing lithium-bearing brines for high-quality lithium hydroxide monohydrate ("lithium hydroxide" or "LiOH∙H2O") and/or lithium carbonate products at a specified rate. SLB plans to utilize both in-house and commercially available technology in the design of the CV pilot plant. SLB's costs, technical parameters and ultimate technology are anticipated to differ from the published PEA. For further details regarding SLB's earn-in, please refer to Pure Energy's Annual General and Special Meeting Management Information Circular dated April 4, 2019, available on SEDAR.com.
On January 3, 2019, the Nevada Division of Water Resources ("NDWR") approved and granted a Finite Term Water Right to Pure Energy, through its wholly-owned subsidiary Esmeralda Minerals LLC, for the extraction of up to 50 acre-feet of water during a 5-year period from the CV properties. This water right is deemed sufficient for brine testing requirements and SLB's future pilot plant facility. In July of 2020, the CV-09 well was completed and results were published by Pure Energy on October 14, 2020.
On behalf of the Board of Directors,
"Mary L. Little"
Director, Pure Energy Minerals Ltd.
CONTACT:
Pure Energy Minerals Limited (www.pureenergyminerals.com)
Email: info@pureenergyminerals.com
Telephone – 604 608 6611
Cautionary Statements and Forward-Looking Information
The information in this news release contains forward looking statements that are subject to a number of known and unknown risks, uncertainties and other factors that may cause actual results to differ materially from those anticipated in our forward-looking statements. Factors that could cause such differences include: changes in world commodity markets, equity markets, costs and supply of materials relevant to the mining industry, change in government and changes to regulations affecting the mining industry. Forward-looking statements in this release may include future exploration and development on the CV Project. Although we believe the expectations reflected in our forward-looking statements are reasonable, results may vary, and we cannot guarantee future results, levels of activity, performance or achievements.
The Company does not undertake to update any forward-looking information, except as required by applicable laws.
Neither TSX Venture Exchange nor its Regulation Services Provider (as that term is defined in the policies of TSX Venture Exchange) accepts responsibility for the adequacy or accuracy of this release.

To view the source version of this press release, please visit https://www.newsfilecorp.com/release/87286
Even when a business is losing money, it's possible for shareholders to make money if they buy a good business at the right price. Indeed, Foran Mining (CVE:FOM) stock is up 1,700% in the last year, providing strong gains for shareholders. But the harsh reality is that very many loss making companies burn through all their cash and go bankrupt.
So notwithstanding the buoyant share price, we think it's well worth asking whether Foran Mining's cash burn is too risky. In this article, we define cash burn as its annual (negative) free cash flow, which is the amount of money a company spends each year to fund its growth. We'll start by comparing its cash burn with its cash reserves in order to calculate its cash runway.
View our latest analysis for Foran Mining
When Might Foran Mining Run Out Of Money?
A company's cash runway is the amount of time it would take to burn through its cash reserves at its current cash burn rate. As at March 2021, Foran Mining had cash of CA$21m and such minimal debt that we can ignore it for the purposes of this analysis. Importantly, its cash burn was CA$4.7m over the trailing twelve months. So it had a cash runway of about 4.4 years from March 2021. Importantly, analysts think that Foran Mining will reach cashflow breakeven in 4 years. That means it doesn't have a great deal of breathing room, but it shouldn't really need more cash, considering that cash burn should be continually reducing. Depicted below, you can see how its cash holdings have changed over time.

How Is Foran Mining's Cash Burn Changing Over Time?
Foran Mining didn't record any revenue over the last year, indicating that it's an early stage company still developing its business. Nonetheless, we can still examine its cash burn trajectory as part of our assessment of its cash burn situation. Over the last year its cash burn actually increased by 39%, which suggests that management are increasing investment in future growth, but not too quickly. However, the company's true cash runway will therefore be shorter than suggested above, if spending continues to increase. While the past is always worth studying, it is the future that matters most of all. For that reason, it makes a lot of sense to take a look at our analyst forecasts for the company.
Can Foran Mining Raise More Cash Easily?
Given its cash burn trajectory, Foran Mining shareholders may wish to consider how easily it could raise more cash, despite its solid cash runway. Issuing new shares, or taking on debt, are the most common ways for a listed company to raise more money for its business. Many companies end up issuing new shares to fund future growth. By looking at a company's cash burn relative to its market capitalisation, we gain insight on how much shareholders would be diluted if the company needed to raise enough cash to cover another year's cash burn.
Since it has a market capitalisation of CA$423m, Foran Mining's CA$4.7m in cash burn equates to about 1.1% of its market value. That means it could easily issue a few shares to fund more growth, and might well be in a position to borrow cheaply.
How Risky Is Foran Mining's Cash Burn Situation?
It may already be apparent to you that we're relatively comfortable with the way Foran Mining is burning through its cash. For example, we think its cash runway suggests that the company is on a good path. While its increasing cash burn wasn't great, the other factors mentioned in this article more than make up for weakness on that measure. Shareholders can take heart from the fact that analysts are forecasting it will reach breakeven. Looking at all the measures in this article, together, we're not worried about its rate of cash burn; the company seems well on top of its medium-term spending needs. Taking an in-depth view of risks, we've identified 3 warning signs for Foran Mining that you should be aware of before investing.
If you would prefer to check out another company with better fundamentals, then do not miss this free list of interesting companies, that have HIGH return on equity and low debt or this list of stocks which are all forecast to grow.
This article by Simply Wall St is general in nature. It does not constitute a recommendation to buy or sell any stock, and does not take account of your objectives, or your financial situation. We aim to bring you long-term focused analysis driven by fundamental data. Note that our analysis may not factor in the latest price-sensitive company announcements or qualitative material. Simply Wall St has no position in any stocks mentioned.
Have feedback on this article? Concerned about the content? Get in touch with us directly. Alternatively, email editorial-team (at) simplywallst.com.
We can readily understand why investors are attracted to unprofitable companies. By way of example, DevEx Resources (ASX:DEV) has seen its share price rise 343% over the last year, delighting many shareholders. Having said that, unprofitable companies are risky because they could potentially burn through all their cash and become distressed.
Given its strong share price performance, we think it's worthwhile for DevEx Resources shareholders to consider whether its cash burn is concerning. For the purpose of this article, we'll define cash burn as the amount of cash the company is spending each year to fund its growth (also called its negative free cash flow). First, we'll determine its cash runway by comparing its cash burn with its cash reserves.
See our latest analysis for DevEx Resources
Does DevEx Resources Have A Long Cash Runway?
A cash runway is defined as the length of time it would take a company to run out of money if it kept spending at its current rate of cash burn. In December 2020, DevEx Resources had AU$12m in cash, and was debt-free. Importantly, its cash burn was AU$4.6m over the trailing twelve months. That means it had a cash runway of about 2.6 years as of December 2020. That's decent, giving the company a couple years to develop its business. The image below shows how its cash balance has been changing over the last few years.

How Is DevEx Resources' Cash Burn Changing Over Time?
DevEx Resources didn't record any revenue over the last year, indicating that it's an early stage company still developing its business. Nonetheless, we can still examine its cash burn trajectory as part of our assessment of its cash burn situation. Over the last year its cash burn actually increased by a very significant 55%. Oftentimes, increased cash burn simply means a company is accelerating its business development, but one should always be mindful that this causes the cash runway to shrink. DevEx Resources makes us a little nervous due to its lack of substantial operating revenue. We prefer most of the stocks on this list of stocks that analysts expect to grow.
How Hard Would It Be For DevEx Resources To Raise More Cash For Growth?
While DevEx Resources does have a solid cash runway, its cash burn trajectory may have some shareholders thinking ahead to when the company may need to raise more cash. Companies can raise capital through either debt or equity. Many companies end up issuing new shares to fund future growth. By looking at a company's cash burn relative to its market capitalisation, we gain insight on how much shareholders would be diluted if the company needed to raise enough cash to cover another year's cash burn.
Since it has a market capitalisation of AU$143m, DevEx Resources' AU$4.6m in cash burn equates to about 3.2% of its market value. That's a low proportion, so we figure the company would be able to raise more cash to fund growth, with a little dilution, or even to simply borrow some money.
So, Should We Worry About DevEx Resources' Cash Burn?
As you can probably tell by now, we're not too worried about DevEx Resources' cash burn. In particular, we think its cash burn relative to its market cap stands out as evidence that the company is well on top of its spending. While its increasing cash burn wasn't great, the other factors mentioned in this article more than make up for weakness on that measure. After taking into account the various metrics mentioned in this report, we're pretty comfortable with how the company is spending its cash, as it seems on track to meet its needs over the medium term. Taking a deeper dive, we've spotted 3 warning signs for DevEx Resources you should be aware of, and 2 of them can't be ignored.
Of course, you might find a fantastic investment by looking elsewhere. So take a peek at this free list of companies insiders are buying, and this list of stocks growth stocks (according to analyst forecasts)
This article by Simply Wall St is general in nature. It does not constitute a recommendation to buy or sell any stock, and does not take account of your objectives, or your financial situation. We aim to bring you long-term focused analysis driven by fundamental data. Note that our analysis may not factor in the latest price-sensitive company announcements or qualitative material. Simply Wall St has no position in any stocks mentioned.
Have feedback on this article? Concerned about the content? Get in touch with us directly. Alternatively, email editorial-team (at) simplywallst.com.
If you would like to receive our free newsletter via email, simply enter your email address below & click subscribe.
 Follow us on Twitter
 Become our facebook fan
CONNECT WITH US
Tweets
Tweet with hash tag #miningfeeds or @miningfeeds and your tweets will be displayed across this site.
MOST ACTIVE MINING STOCKS
Daily Gainers
 Midlands Minerals Corp. Midlands Minerals Corp. |
MEX.V | +66.88% |
| GoviEx Uranium Inc. |
GXU.V | +42.86% |
 Mount Burgess Mining NL Mount Burgess Mining NL |
MTB.AX | +33.33% |
| Sunridge Gold Corp. |
SGC.V | +30.77% |
| Casa Minerals Inc. |
CASA.V | +30.00% |
| Radisson Mining Resources Inc. |
RDS.V | +25.74% |
| International Lithium Corp. |
ILC.V | +25.00% |
| Poseidon Nickel Limited |
POS.AX | +25.00% |
| Richmond Minerals Inc. |
RMD.V | +23.53% |
| Encounter Resources Ltd. |
ENR.AX | +20.00% |