Regular readers will know that we love our dividends at Simply Wall St, which is why it's exciting to see Hecla Mining Company (NYSE:HL) is about to trade ex-dividend in the next 3 days. Typically, the ex-dividend date is one business day before the record date which is the date on which a company determines the shareholders eligible to receive a dividend. The ex-dividend date is important because any transaction on a stock needs to have been settled before the record date in order to be eligible for a dividend. Thus, you can purchase Hecla Mining's shares before the 20th of August in order to receive the dividend, which the company will pay on the 3rd of September.
The company's upcoming dividend is US$0.011 a share, following on from the last 12 months, when the company distributed a total of US$0.045 per share to shareholders. Calculating the last year's worth of payments shows that Hecla Mining has a trailing yield of 0.7% on the current share price of $6.13. We love seeing companies pay a dividend, but it's also important to be sure that laying the golden eggs isn't going to kill our golden goose! As a result, readers should always check whether Hecla Mining has been able to grow its dividends, or if the dividend might be cut.
See our latest analysis for Hecla Mining
If a company pays out more in dividends than it earned, then the dividend might become unsustainable – hardly an ideal situation. Fortunately Hecla Mining's payout ratio is modest, at just 48% of profit. A useful secondary check can be to evaluate whether Hecla Mining generated enough free cash flow to afford its dividend. It paid out 12% of its free cash flow as dividends last year, which is conservatively low.
It's encouraging to see that the dividend is covered by both profit and cash flow. This generally suggests the dividend is sustainable, as long as earnings don't drop precipitously.
Click here to see the company's payout ratio, plus analyst estimates of its future dividends.

Have Earnings And Dividends Been Growing?
Businesses with shrinking earnings are tricky from a dividend perspective. If business enters a downturn and the dividend is cut, the company could see its value fall precipitously. Hecla Mining's earnings per share have fallen at approximately 22% a year over the previous five years. When earnings per share fall, the maximum amount of dividends that can be paid also falls.
Many investors will assess a company's dividend performance by evaluating how much the dividend payments have changed over time. Hecla Mining has seen its dividend decline 5.6% per annum on average over the past 10 years, which is not great to see. While it's not great that earnings and dividends per share have fallen in recent years, we're encouraged by the fact that management has trimmed the dividend rather than risk over-committing the company in a risky attempt to maintain yields to shareholders.
To Sum It Up
Is Hecla Mining worth buying for its dividend? Earnings per share are down meaningfully, although at least the company is paying out a low and conservative percentage of both its earnings and cash flow. It's definitely not great to see earnings falling, but at least there may be some buffer before the dividend needs to be cut. In summary, it's hard to get excited about Hecla Mining from a dividend perspective.
In light of that, while Hecla Mining has an appealing dividend, it's worth knowing the risks involved with this stock. In terms of investment risks, we've identified 3 warning signs with Hecla Mining and understanding them should be part of your investment process.
A common investment mistake is buying the first interesting stock you see. Here you can find a list of promising dividend stocks with a greater than 2% yield and an upcoming dividend.
This article by Simply Wall St is general in nature. We provide commentary based on historical data and analyst forecasts only using an unbiased methodology and our articles are not intended to be financial advice. It does not constitute a recommendation to buy or sell any stock, and does not take account of your objectives, or your financial situation. We aim to bring you long-term focused analysis driven by fundamental data. Note that our analysis may not factor in the latest price-sensitive company announcements or qualitative material. Simply Wall St has no position in any stocks mentioned.
Have feedback on this article? Concerned about the content? Get in touch with us directly. Alternatively, email editorial-team (at) simplywallst.com.
TORONTO, August 16, 2021–(BUSINESS WIRE)–Silver Bear Resources Plc ("Silver Bear" or the "Company") (TSX: SBR) announces the filing of its unaudited financial results for the three and six-month period ended 30 June 2021 today, including development highlights from its Mangazeisky silver project in Far East Russia.
For complete details of the unaudited consolidated financial statements ("Financial Statements") and associated management’s discussion and analysis ("MD&A"), please refer to the Company’s filings on SEDAR (www.sedar.com) or the Company’s website (www.silverbearresources.com).
Q2 2021 HIGHLIGHTS
During the three and six-month period ended 30 June 2021 the Group production statistics included:
-
Mined a total of 19,978 tonnes of ore (six months: 45,178 tonnes), processed 10,801 tonnes of ore (six months: 34,626 tonnes) at an average grade of 463 g/t of silver (six months: 588 g/t Ag), producing a total of 137,687 ounces of silver (six months: 573,773 ounces Ag);
-
Sold a total of 160,571 ounces of silver (six months: 655,801 ounces Ag) totaling production revenue of US$4,271,405 (six months: US$17,394,425) and reported a total comprehensive loss of $3,344,980 (six months: US$9,558,865) and an accumulated deficit of $229,419,891.
-
Exploration program 2021 is underway. Geophysical works (152 km2) and aerial survey (518 km2) completed on the Endybal area. Drilling is being done on the flanks of Vertikalny (South East and North West) and at other potentially mineralized zones on the licensed territory. 3,657 meters have been drilled during the 6 months out of 9,515 meters planned for the year. The company also planes to do 2,400 meters of trenching through the end of the exploration season.
-
As of the date of this report, the Group confirms there have been no major disruptions at either sites or to the Group’s planned production and operations due to the COVID-19 pandemic.
MANGAZEISKY SILVER PROJECT COMMERCIAL PRODUCTION
The table below details the production highlights for three and six-month period ended 30 June 2021 and 2020.
Production Highlights
|
Three-months |
Three-months |
Six-months |
Six-months |
|
|
Operating Data |
||||
|
Ore Mined (tonnes) |
19,978 |
39,765 |
45,158 |
75,415 |
|
Ore processed (tonnes) |
10,801 |
29,545 |
34,626 |
54,889 |
|
Head grade (g/t Ag) |
463 |
650 |
588 |
680 |
|
Recovery (%) |
85.4 |
87.0 |
88.6 |
86.5 |
|
Silver ounces produced |
137,687 |
576,824 |
573,773 |
1,034,282 |
|
Financial Data |
||||
|
Silver ounces sold |
160,571 |
592,938 |
655,801 |
1,065,378 |
|
Average realized price (US$/oz) |
26.60 |
16.35 |
26.52 |
16.59 |
|
Revenues, US$ |
4,271,405 |
9,695,280 |
17,394,425 |
17,670,112 |
Development & Operational Activities
During the second quarter 2021, the Group mined 50% less ore compared to the same quarter in 2020, as it moved deeper into Vertikalny open pit and in the second quarter mining vehicles were actively involved in open pit extension. Mining head grade reduced from second quarter 2020 to second quarter in 2021 by 29%, however recoveries remained steady as a result of several factors notably the full year of operating the Merrill Crowe process and improved cake washing technics at the end of the technological processing circuit, as well as other operational efficiencies implemented during the year. The 76% decrease in the silver production in the second quarter 2021 over 2020, is primarily due to volume of processed oxide ore and head grade. As it moves deeper down the open pit the company started incurring primary ore which is being stockpiled for future processing once the flotation facility is constructed and in production (expected in H2 2022). For the three-months ended June 30, 2021, the Group’s revenues decreased by 56% compared to the same period in 2020 due to decreased head grade and volume of produced silver.
During the 2021 winter road procurement and transportation campaign the company delivered approximately 14,000 tonnes of dry cargo and fuel, including regular operation supplies as well as construction materials for the flotation facility currently being built.
The construction of the flotation facility is underway. During the first half of 2021 the construction of the foundation and the pit backfill were completed, the frame of the building being currently fitted together. Walls will be put in place before the end of October 2021 so that the construction can continue inside of the building during the cold season.
As of the date of this report there are approximately 236 Prognoz employees at site. There are also 59 contractors, namely catering, process consultants, and construction workers. As of 30 June 2021, there was one minor loss time accident during the quarter with four mild COVID-19 cases reported with personnel isolated for 14 days.
In light of the World Health Organization ("WHO") declaring COVID-19 a global pandemic in March of this year, the Group has developed and implemented a response and mitigation plan for both its Yakutsk head office and Mangazeisky mine site. At the date of this report the Group has had no major disruptions at either sites or to our planned production and operations, however we continue to monitor the situation ensuring we keep the safety of our work force our main priority.
Exploration Activities
Exploration program 2021 is underway. During the year the company is planning to drill appx. 10,000 meters and complete 2,400 meters of trenching on the flanks of Vertikalny and other surrounding mineralized areas with high exploration potential with the goal to increase mineable resources for the processing plant on Vertikalny. There have been 3,657 meters drilled during the 6 months of the year. Geophysical works (152 km2) and aerial survey (518 km2) completed on the Endybal area.
About Silver Bear
Silver Bear (TSX: SBR) is focused on the development of its wholly-owned Mangazeisky Silver Project, covering a licence area of approximately 570 km2 that includes the high-grade Vertikalny deposit (amongst the highest- grade silver deposits in the world), located 400 km north of Yakutsk in the Republic of Sakha within the Russian Federation. As of April 2018, the Company attained first silver production as a result of commissioning activities and on 1 July 2019 the Company achieved full commercial production. Other information relating to Silver Bear is available on SEDAR at www.sedar.com as well as on the Company’s website at www.silverbearresources.com.
Cautionary Notes
This release and subsequent oral statements made by and on behalf of the Company may contain forward-looking statements, which reflect management's expectations. Wherever possible, words such as "intends", "expects", "scheduled", "estimates", "anticipates", "believes" and similar expressions or statements that certain actions, events or results "may", "could", "would", "might" or "will" be taken, occur or be achieved, have been used to identify these forward-looking statements. Although the forward-looking statements contained in this release reflect management's current beliefs based upon information currently available to management and based upon what management believes to be reasonable assumptions, the Company cannot be certain that actual results will be consistent with these forward-looking statements. A number of factors could cause events and achievements to differ materially from the results expressed or implied in the forward-looking statements. Such risk factors include, but are not limited, to the risk factors identified by the Company in its continuous disclosure filings filed from time to time on SEDAR. These factors should be considered carefully and prospective investors should not place undue reliance on the forward-looking statements. Forward-looking statements necessarily involve significant known and unknown risks, assumptions and uncertainties that may cause the Company's actual results, events, prospects and opportunities to differ materially from those expressed or implied by such forward-looking statements. Although the Company has attempted to identify important risks and factors that could cause actual actions, events or results to differ materially from those described in forward-looking statements, there may be other factors and risks that cause actions, events or results not to be as anticipated, estimated or intended. There can be no assurance that forward-looking statements will prove to be accurate, as actual results and future events could differ materially from those anticipated in such statements. Accordingly, prospective investors should not place undue reliance on forward-looking statements. These forward-looking statements are made as of the date of this release, and the Company assumes no obligation to update or revise them to reflect new events or circumstances, unless otherwise required by law.
View source version on businesswire.com: https://www.businesswire.com/news/home/20210816005603/en/
Contacts
Vadim Ilchuk
President and Chief Executive Officer
T: +7 985 866 8877
info@silverbearresources.com
Judith Webster
Investor Relations Manager & Corporate Secretary
T: +416 453 8818
jwebster@silverbearresources.com
VANCOUVER, BC, Aug. 16, 2021 /PRNewswire/ – Pan American Silver Corp. (NASDAQ: PAAS) (TSX: PAAS) ("the Company") will host a call to discuss the Company's environmental, social and governance ("ESG") approach on September 9, 2021 at 11:00 am ET (8:00 am PT). The Company's Board Chair and senior members of the management team will discuss the performance on key topics, and describe programs and initiatives to address ESG opportunities and challenges. The team will respond to questions from investors and analysts following the formal presentation.
ESG Conference Call and Webcast:
|
Date: |
Thursday, September 9, 2021 |
|
Time: |
11:00 am ET (8:00 am PT) |
|
Dial-in numbers: |
1-800-319-4610 (toll-free in Canada and the U.S.) |
|
+1-604-638-5340 (international participants) |
|
|
Webcast: |
The live webcast and presentation slides will be available at panamericansilver.com. An archive of the webcast will also be available for three months.
About Pan American Silver
Pan American owns and operates silver and gold mines located in Mexico, Peru, Canada, Argentina and Bolivia. We also own the Escobal mine in Guatemala that is currently not operating. Pan American provides enhanced exposure to silver through a large base of silver reserves and resources, as well as major catalysts to grow silver production. We have a 27-year history of operating in Latin America, earning an industry-leading reputation for sustainability performance, operational excellence and prudent financial management. We are headquartered in Vancouver, B.C. and our shares trade on NASDAQ and the Toronto Stock Exchange under the symbol "PAAS".
Learn more at panamericansilver.com

View original content:https://www.prnewswire.com/news-releases/pan-american-silver-to-host-esg-conference-call-and-webcast-301356231.html
SOURCE Pan American Silver Corp.
Pan American Silver Corp. (TSE:PAAS) is about to trade ex-dividend in the next three days. The ex-dividend date occurs one day before the record date which is the day on which shareholders need to be on the company's books in order to receive a dividend. The ex-dividend date is an important date to be aware of as any purchase of the stock made on or after this date might mean a late settlement that doesn't show on the record date. This means that investors who purchase Pan American Silver's shares on or after the 20th of August will not receive the dividend, which will be paid on the 3rd of September.
The company's next dividend payment will be US$0.10 per share, and in the last 12 months, the company paid a total of US$0.40 per share. Based on the last year's worth of payments, Pan American Silver has a trailing yield of 1.5% on the current stock price of CA$33.19. We love seeing companies pay a dividend, but it's also important to be sure that laying the golden eggs isn't going to kill our golden goose! So we need to check whether the dividend payments are covered, and if earnings are growing.
Check out our latest analysis for Pan American Silver
Dividends are usually paid out of company profits, so if a company pays out more than it earned then its dividend is usually at greater risk of being cut. Pan American Silver is paying out just 18% of its profit after tax, which is comfortably low and leaves plenty of breathing room in the case of adverse events. A useful secondary check can be to evaluate whether Pan American Silver generated enough free cash flow to afford its dividend. Thankfully its dividend payments took up just 27% of the free cash flow it generated, which is a comfortable payout ratio.
It's encouraging to see that the dividend is covered by both profit and cash flow. This generally suggests the dividend is sustainable, as long as earnings don't drop precipitously.
Click here to see the company's payout ratio, plus analyst estimates of its future dividends.

Have Earnings And Dividends Been Growing?
Companies with consistently growing earnings per share generally make the best dividend stocks, as they usually find it easier to grow dividends per share. If earnings decline and the company is forced to cut its dividend, investors could watch the value of their investment go up in smoke. Fortunately for readers, Pan American Silver's earnings per share have been growing at 20% a year for the past five years. Earnings per share are growing rapidly and the company is keeping more than half of its earnings within the business; an attractive combination which could suggest the company is focused on reinvesting to grow earnings further. This will make it easier to fund future growth efforts and we think this is an attractive combination – plus the dividend can always be increased later.
Another key way to measure a company's dividend prospects is by measuring its historical rate of dividend growth. Since the start of our data, 10 years ago, Pan American Silver has lifted its dividend by approximately 15% a year on average. It's great to see earnings per share growing rapidly over several years, and dividends per share growing right along with it.
To Sum It Up
From a dividend perspective, should investors buy or avoid Pan American Silver? It's great that Pan American Silver is growing earnings per share while simultaneously paying out a low percentage of both its earnings and cash flow. It's disappointing to see the dividend has been cut at least once in the past, but as things stand now, the low payout ratio suggests a conservative approach to dividends, which we like. Pan American Silver looks solid on this analysis overall, and we'd definitely consider investigating it more closely.
So while Pan American Silver looks good from a dividend perspective, it's always worthwhile being up to date with the risks involved in this stock. To help with this, we've discovered 1 warning sign for Pan American Silver that you should be aware of before investing in their shares.
We wouldn't recommend just buying the first dividend stock you see, though. Here's a list of interesting dividend stocks with a greater than 2% yield and an upcoming dividend.
This article by Simply Wall St is general in nature. We provide commentary based on historical data and analyst forecasts only using an unbiased methodology and our articles are not intended to be financial advice. It does not constitute a recommendation to buy or sell any stock, and does not take account of your objectives, or your financial situation. We aim to bring you long-term focused analysis driven by fundamental data. Note that our analysis may not factor in the latest price-sensitive company announcements or qualitative material. Simply Wall St has no position in any stocks mentioned.
Have feedback on this article? Concerned about the content? Get in touch with us directly. Alternatively, email editorial-team (at) simplywallst.com.
For us, stock picking is in large part the hunt for the truly magnificent stocks. Not every pick can be a winner, but when you pick the right stock, you can win big. One bright shining star stock has been GoGold Resources Inc. (TSE:GGD), which is 822% higher than three years ago. On top of that, the share price is up 15% in about a quarter. This could be related to the recent financial results, released recently – you can catch up on the most recent data by reading our company report. We love happy stories like this one. The company should be really proud of that performance!
With that in mind, it's worth seeing if the company's underlying fundamentals have been the driver of long term performance, or if there are some discrepancies.
Check out our latest analysis for GoGold Resources
While the efficient markets hypothesis continues to be taught by some, it has been proven that markets are over-reactive dynamic systems, and investors are not always rational. By comparing earnings per share (EPS) and share price changes over time, we can get a feel for how investor attitudes to a company have morphed over time.
During three years of share price growth, GoGold Resources moved from a loss to profitability. Given the importance of this milestone, it's not overly surprising that the share price has increased strongly.
The image below shows how EPS has tracked over time (if you click on the image you can see greater detail).

We consider it positive that insiders have made significant purchases in the last year. Even so, future earnings will be far more important to whether current shareholders make money. Before buying or selling a stock, we always recommend a close examination of historic growth trends, available here..
A Different Perspective
It's good to see that GoGold Resources has rewarded shareholders with a total shareholder return of 88% in the last twelve months. That's better than the annualised return of 21% over half a decade, implying that the company is doing better recently. Given the share price momentum remains strong, it might be worth taking a closer look at the stock, lest you miss an opportunity. I find it very interesting to look at share price over the long term as a proxy for business performance. But to truly gain insight, we need to consider other information, too. For instance, we've identified 2 warning signs for GoGold Resources (1 shouldn't be ignored) that you should be aware of.
GoGold Resources is not the only stock insiders are buying. So take a peek at this free list of growing companies with insider buying.
Please note, the market returns quoted in this article reflect the market weighted average returns of stocks that currently trade on CA exchanges.
This article by Simply Wall St is general in nature. We provide commentary based on historical data and analyst forecasts only using an unbiased methodology and our articles are not intended to be financial advice. It does not constitute a recommendation to buy or sell any stock, and does not take account of your objectives, or your financial situation. We aim to bring you long-term focused analysis driven by fundamental data. Note that our analysis may not factor in the latest price-sensitive company announcements or qualitative material. Simply Wall St has no position in any stocks mentioned.
Have feedback on this article? Concerned about the content? Get in touch with us directly. Alternatively, email editorial-team (at) simplywallst.com.
Vancouver, British Columbia–(Newsfile Corp. – August 16, 2021) – First Majestic Silver Corp. (NYSE: AG) (FSE: FMV) (TSX: FR) (the "Company" or "First Majestic") is pleased to announce the unaudited interim consolidated financial results of the Company for the second quarter ended June 30, 2021. The full version of the financial statements and the management discussion and analysis can be viewed on the Company's website at www.firstmajestic.com or on SEDAR at www.sedar.com and on EDGAR at www.sec.gov. All amounts are in U.S. dollars unless stated otherwise.
SECOND QUARTER 2021 HIGHLIGHTS
-
Revenues reached a new Company record of $154.1 million following the inclusion of approximately two months of production from the Jerritt Canyon mine in Nevada and robust production from the Mexican operations
-
Average realized silver price per ounce of $27.32, a 1% increase compared to Q1 2021
-
Cash costs increased to $13.89 per AgEq ounce, compared to $12.61 in Q1 2021, primarily due to higher ore development and the addition of the Jerritt Canyon operation
-
AISC were relatively unchanged at $19.42 per AgEq ounce, compared to $19.35 in Q1 2021
-
Mine operating earnings of $29.4 million, compared to $28.1 million in Q1 2021
-
Net earnings of $15.6 million (EPS of $0.06), compared to $1.9 million (EPS of $0.01) in Q1 2021
-
Adjusted EPS of $0.05 after excluding non-cash and non-recurring items, compared to $0.03 in Q1 2021 (non-GAAP)
-
Cash flow per share was $0.21 per share (non-GAAP), compared to $0.14 per share in Q1 2021
-
Cash and cash equivalents as of June 30, 2021 was $227.1 million. In addition, the Company has a strong working capital position of $276.3 million and total available liquidity of $316.3 million, including $40.0 million of available undrawn revolving credit facility
-
Declared a cash dividend payment of $0.006 per common share for the second quarter of 2021 for shareholders of record as of the close of business on August 26, 2021, and will be distributed on or about September 16, 2021
"Improved production rates and higher metal prices during the quarter generated record revenues for the business," stated Keith Neumeyer, President & CEO. "As a result of the higher revenues, our quarterly dividend increased by approximately 33% when compared to the prior quarterly payment. The mining units generated $29.4 million in mine operating earnings due to strong production and higher realized metal prices. At Jerritt Canyon, operational improvements are being achieved although AISC are expected to be higher than normal in the third quarter due to a $12.3 million lift on the tailing impoundment that is currently being constructed. Once completed, costs at Jerritt Canyon are expected to return to normal levels."
OPERATIONAL AND FINANCIAL HIGHLIGHTS
|
Key Performance Metrics |
2021-Q2 |
2021-Q1 |
Change |
2020-Q2 |
Change |
|
Operational |
|
|
|||
|
Ore Processed / Tonnes Milled |
826,213 |
614,245 |
35% |
333,559 |
148% |
|
Silver Ounces Produced |
3,274,026 |
2,908,024 |
13% |
1,834,575 |
78% |
|
Silver Equivalent Ounces Produced |
6,435,023 |
4,540,296 |
42% |
3,505,376 |
84% |
|
Cash Costs per Silver Equivalent Ounce (1) |
$13.89 |
$12.61 |
10% |
$7.76 |
79% |
|
All-in Sustaining Cost per Silver Equivalent Ounce (1) |
$19.42 |
$19.35 |
0% |
$13.95 |
39% |
|
Total Production Cost per Tonne (1) |
$104.94 |
$90.03 |
17% |
$78.78 |
33% |
|
Average Realized Silver Price per Ounce (1) |
$27.32 |
$27.13 |
1% |
$17.33 |
58% |
|
|
|
||||
|
Financial (in $millions) |
|
|
|||
|
Revenues |
$154.1 |
$100.5 |
53% |
$34.9 |
NM |
|
Mine Operating Earnings (Loss) |
$29.4 |
$28.1 |
5% |
($7.8) |
NM |
|
Net Earnings (Loss) |
$15.6 |
$1.9 |
NM |
($10.0) |
NM |
|
Operating Cash Flows before Movements in Working Capital and Taxes |
$51.2 |
$31.1 |
64% |
($16.4) |
NM |
|
Cash and Cash Equivalents |
$227.1 |
$201.7 |
13% |
$95.2 |
139% |
|
Working Capital (1) |
$276.3 |
$232.8 |
19% |
$114.2 |
142% |
|
|
|
||||
|
Shareholders |
|
|
|||
|
Earnings (Loss) per Share ("EPS") – Basic |
$0.06 |
$0.01 |
NM |
($0.05) |
NM |
|
Adjusted EPS (1) |
$0.05 |
$0.03 |
74% |
($0.10) |
153% |
|
Cash Flow per Share (1) |
$0.21 |
$0.14 |
51% |
($0.08) |
NM |
NM – Not meaningful
(1) The Company reports non-GAAP measures which include cash costs per silver equivalent ounce produced, all-in sustaining cost per silver equivalent ounce produced, total production cost per tonne, average realized silver price per ounce sold, working capital, adjusted EPS and cash flow per share. These measures are widely used in the mining industry as a benchmark for performance, but do not have a standardized meaning and the methods used by the Company to calculate such measures may differ from methods used by other companies with similar descriptions. See "Non-GAAP Measures" in the MD&A for a reconciliation of non-GAAP to GAAP measures.
Q2 2021 FINANCIAL RESULTS
The Company realized an average silver price of $27.32 per ounce during the second quarter of 2021, representing a 58% increase compared to the second quarter of 2020 and a 1% increase compared to the prior quarter.
Revenues generated in the second quarter totaled $154.1 million compared to $34.9 million in the second quarter of 2020, primarily due to a 199% increase in payable silver equivalent ounces sold due to a temporary suspension of operations mandated by the Mexican government in response to COVID-19 in the second quarter of 2020.
The Company reported mine operating earnings of $29.4 million compared to ($7.8) million in the second quarter of 2020. The increase in mine operating earnings is primarily attributed to higher ounces sold and higher metal prices.
The Company reported net earnings of $15.6 million (EPS of $0.06) compared to ($10.0) million (EPS of ($0.05)) in the second quarter of 2020. The increase in net earnings was primarily attributed to higher metal prices, temporary suspension of operating activities in the second quarter of 2020 in response to the COVID-19 pandemic, as well as a $10.3 million loss in the second quarter of 2020 related to mark-to-market adjustments on the Company's foreign currency derivatives.
Adjusted net earnings for the quarter was $12.7 million (adjusted EPS of $0.05) compared to ($20.7) million (adjusted EPS of ($0.10)) in the second quarter of 2020, after excluding non-cash and non-recurring items.
Cash flow from operations before movements in working capital and income taxes in the quarter was $51.2 million ($0.21 per share) compared to ($16.4) million (($0.08) per share) in the second quarter of 2020.
Cash and cash equivalents as of June 30, 2021 was $227.1 million. In addition, the Company had strong working capital of $276.3 million and total available liquidity of $316.3 million, including $40.0 million of available undrawn revolving credit facility.
OPERATIONAL HIGHLIGHTS
The table below represents the quarterly operating and cost parameters at each of the Company's four producing mines during the quarter.
|
Second Quarter Production Summary |
San Dimas |
Santa Elena |
La Encantada |
Jerritt Canyon Canyon(1) |
Consolidated |
|
Ore Processed / Tonnes Milled |
202,382 |
234,381 |
242,839 |
146,611 |
826,213 |
|
Silver Ounces Produced |
1,868,031 |
565,453 |
840,541 |
– |
3,274,026 |
|
Gold Ounces Produced |
19,227 |
8,453 |
102 |
18,762 |
46,544 |
|
Silver Equivalent Ounces Produced |
3,176,725 |
1,140,398 |
847,502 |
1,270,398 |
6,435,023 |
|
Cash Costs per Silver Equivalent Ounce |
$10.17 |
$16.70 |
$13.66 |
N/A |
$13.89 |
|
All-in Sustaining Cost per Silver Equivalent Ounce |
$14.22 |
$21.31 |
$15.97 |
N/A |
$19.42 |
|
Cash cost per AuEq Ounce |
N/A |
N/A |
N/A |
$1,407 |
N/A |
|
All-In sustaining costs per AuEq Ounce |
N/A |
N/A |
N/A |
$1,679 |
N/A |
|
Total Production Cost per Tonne |
$153.43 |
$79.17 |
$45.71 |
$177.30 |
$104.94 |
Total production in the second quarter was 6.4 million silver equivalent ounces, consisting of 3.3 million ounces of silver and 46,544 ounces of gold, representing an increase of 13% and 95%, respectively, compared to the previous quarter primarily due to a 14% increase in silver equivalent production from the three operating Mexican mines and the inclusion of production from the Jerritt Canyon mine effective April 30, 2021.
COSTS AND CAPITAL EXPENDITURES
Cash cost for the quarter was $13.89 per silver equivalent ounce, compared to $12.61 per ounce in the previous quarter. The increase in cash cost was due to higher ore development and the addition of the Jerritt Canyon mine which was producing at a higher cash cost in the first few months since the acquisition. The Company has identified numerous projects that will be implemented over the next 12 to 24 months at Jerritt Canyon to improve production and reduce costs at the mine and processing plant. The increase in cash costs were partially offset by lower cash costs at Santa Elena and La Encantada due to higher production.
AISC in the second quarter was $19.42 per ounce and in-line when compared to $19.35 per ounce with the previous quarter. The slight increase in AISC was primarily attributed to an increase in cash cost per AgEq ounce due to the addition of Jerritt Canyon which was mostly offset by a decrease in sustaining costs in total mine development in Mexico.
Total capital expenditures in the second quarter were $58.3 million, primarily consisting of $15.5 million at San Dimas, $17.2 million at Santa Elena (including $8.4 million towards the Ermitaño project), $2.8 million at La Encantada, $8.1 million at Jerritt Canyon and $14.4 million for strategic projects.
Q2 2021 DIVIDEND ANNOUNCEMENT
The Company is pleased to announce that its Board of Directors has declared a cash dividend payment in the amount of $0.006 per common share for the second quarter of 2021, representing a 33% increase compared to the prior quarterly payment as a result of higher generated revenues. The second quarter cash dividend will be paid to holders of record of First Majestic's common shares as of the close of business on August 26, 2021 and will be distributed on or about September 16, 2021.
Under the Company's dividend policy, the quarterly dividend per common share is targeted to equal approximately 1% of the Company's net quarterly revenues divided by the Company's then outstanding common shares on the record date.
The amount and distribution dates of future dividends remain at the discretion of the Board of Directors. This dividend qualifies as an 'eligible dividend' for Canadian income tax purposes. Dividends paid to shareholders outside Canada (non-resident investors) may be subject to Canadian non-resident withholding taxes.
ABOUT THE COMPANY
First Majestic is a publicly traded mining company focused on silver and gold production in Mexico and the United States and is aggressively pursuing the development of its existing mineral property assets. The Company presently owns and operates the San Dimas Silver/Gold Mine, the Santa Elena Silver/Gold Mine, the La Encantada Silver Mine and the Jerritt Canyon Gold Mine.
FOR FURTHER INFORMATION contact info@firstmajestic.com, visit our website at www.firstmajestic.com or call our toll-free number 1.866.529.2807.
FIRST MAJESTIC SILVER CORP.
"signed"
Keith Neumeyer, President & CEO
Cautionary Note Regarding Forward Looking Statements
This press release contains "forward‐looking information" and "forward-looking statements" under applicable Canadian and U.S. securities laws (collectively, "forward‐looking statements"). These statements relate to future events or the Company's future performance, business prospects or opportunities that are based on forecasts of future results, estimates of amounts not yet determinable and assumptions of management made in light of management's experience and perception of historical trends, current conditions and expected future developments. Forward-looking statements include, but are not limited to, statements with respect to: the Company's business strategy; future planning processes; commercial mining operations; cash flow; budgets; mine plans and mine life; costs of production; costs and timing of development at the Company's projects; capital projects and exploration activities and the possible results thereof; and payment of dividends. Assumptions may prove to be incorrect and actual results may differ materially from those anticipated. Consequently, guidance cannot be guaranteed. As such, investors are cautioned not to place undue reliance upon guidance and forward-looking statements as there can be no assurance that the plans, assumptions or expectations upon which they are placed will occur. All statements other than statements of historical fact may be forward‐looking statements. Statements concerning proven and probable mineral reserves and mineral resource estimates may also be deemed to constitute forward‐looking statements to the extent that they involve estimates of the mineralization that will be encountered as and if the property is developed, and in the case of measured and indicated mineral resources or proven and probable mineral reserves, such statements reflect the conclusion based on certain assumptions that the mineral deposit can be economically exploited. Any statements that express or involve discussions with respect to predictions, expectations, beliefs, plans, projections, objectives or future events or performance (often, but not always, using words or phrases such as "seek", "anticipate", "plan", "continue", "estimate", "expect", "may", "will", "project", "predict", "forecast", "potential", "target", "intend", "could", "might", "should", "believe" and similar expressions) are not statements of historical fact and may be "forward‐looking statements".
Actual results may vary from forward-looking statements. Forward-looking statements are subject to known and unknown risks, uncertainties and other factors that may cause actual results to materially differ from those expressed or implied by such forward-looking statements, including but not limited to: the duration and effects of the coronavirus and COVID-19, and any other pandemics on our operations and workforce, and the effects on global economies and society, risks related to the integration of acquisitions; actual results of exploration activities; conclusions of economic evaluations; changes in project parameters as plans continue to be refined; commodity prices; variations in ore reserves, grade or recovery rates; actual performance of plant, equipment or processes relative to specifications and expectations; accidents; labour relations; relations with local communities; changes in national or local governments; changes in applicable legislation or application thereof; delays in obtaining approvals or financing or in the completion of development or construction activities; exchange rate fluctuations; requirements for additional capital; government regulation; environmental risks; reclamation expenses; outcomes of pending litigation; limitations on insurance coverage as well as those factors discussed in the section entitled "Description of the Business – Risk Factors" in the Company's most recent Annual Information Form, available on www.sedar.com, and Form 40-F on file with the United States Securities and Exchange Commission in Washington, D.C. Although First Majestic has attempted to identify important factors that could cause actual results to differ materially from those contained in forward-looking statements, there may be other factors that cause results not to be as anticipated, estimated or intended.
The Company believes that the expectations reflected in these forward‐looking statements are reasonable, but no assurance can be given that these expectations will prove to be correct and such forward‐looking statements included herein should not be unduly relied upon. These statements speak only as of the date hereof. The Company does not intend, and does not assume any obligation, to update these forward-looking statements, except as required by applicable laws.

To view the source version of this press release, please visit https://www.newsfilecorp.com/release/93301
TORONTO, August 16, 2021–(BUSINESS WIRE)–Americas Gold and Silver Corporation (TSX: USA) (NYSE American: USAS) ("Americas" or the "Company"), a growing North American precious metals producer, reports consolidated financial and operational results for the quarter ended June 30, 2021 along with an operations update.
This earnings release should be read in conjunction with the Company’s Management’s Discussion and Analysis, Financial Statements and Notes to Financial Statements for the corresponding period, which have been posted on the Americas Gold and Silver Corporation SEDAR profile at www.sedar.com, and on its EDGAR profile at www.sec.gov, and which are also available on the Company’s website at www.americas-gold.com. All figures are in U.S. dollars unless otherwise noted.
Operational and Second Quarter Financial Highlights
-
Revenue of $9.5 million and net loss of $17.8 million for Q2-2021 or a loss of ($0.13) per share, with the loss mostly attributable to the continued ramp-up at Relief Canyon.
-
The Company signed an agreement on July 6, 2021 with the Mexican Ministries of Economy, Interior and Labour along with union representatives committing to a reopening of the Cosalá Operations. The Company anticipates that both the mine and the mill will be at full capacity by the start of Q4-2021 assuming the compliance of the agreement by members of the union.
-
Galena’s Recapitalization Plan is proceeding well with the Company continuing to experience higher year-over-year production in Q2-2021 compared to Q2-2020; silver production increased by 20% year-over-year while lead production increased by 10%.
-
Phase 1 drilling of Galena’s Recapitalization Plan was completed in the quarter and results will be incorporated into the updated mineral reserve and resource estimate before the end of August 2021. Phase 2 drilling has just begun with the first hole testing the down dip extension of the high-grade Silver Vein approximately 500 feet below the current drill station.
-
Following an extensive review and a challenging ramp-up at Relief Canyon, the operation proceeded with run-of-mine heap leaching and continued its efforts to resolve metallurgical challenges in Q2-2021. On August 13, 2021, the Company and the Board of Directors decided to temporarily suspend mining operations at Relief Canyon in order to prioritize capital for the Cosalá Operations re-start while it continues leaching operations and ongoing metallurgical test work.
-
Consolidated year-to-date operating metrics from YTD-2021 were generally not comparable to YTD-2020 due to the illegal blockade at the Cosalá Operations, suspension of operating metrics during the Galena Recapitalization Plan implementation, and the continued ramp-up of operations at Relief Canyon to full production.
"I expect the second half of 2021 will showcase the strength of the Company’s silver portfolio following a challenging start to the year," stated Americas Gold and Silver President & CEO Darren Blasutti. "The anticipated resource update for the Galena Complex is projected to highlight the significant potential of the asset while silver production continues to ramp-up quarter over quarter. Coupled with the anticipated full re-opening of the Cosalá Operations in Mexico by the start of Q4-2021, the Company’s profitability and cash flow is expected to improve significantly given higher silver, zinc and lead prices. At Relief Canyon, the Company continues to look at alternatives to improve the metallurgical recovery of the operation and I believe there remains significant value in the asset despite the initial challenges."
Cosalá Operations
On July 6, 2021, the Company signed an agreement with the Mexican Ministries of Economy, Interior and Labour along with union representatives committing to a re-opening at the Cosalá Operations. The agreement contemplates immediate right to possession of the property with joint inspections coordinated by the Ministry of Labor, so that the mine and mill can re-start operations in a safe and sustainable manner.
Mexican government inspectors from the Mexican Ministry of Labour have physically inspected the San Rafael mine and Los Braceros mill and reviewed the re-start plans, which validated the existing safe conditions at the operations and puts the Company in position to recall employees immediately. The Company is ready to recall all workers before the end of August so long as the union abides by the signed agreement.
Based on the favourable condition of the mine and mill, the Company continues to anticipate that both will be operating within a few weeks of the re-call of employees and for the Cosalá Operation to be at full capacity by the start of Q4-2021. The operation also has approximately 70,000 tonnes of ore in stockpile that can be processed as a contingency.
Upon a restart of operations, higher silver prices will allow the Company to target the higher-grade silver ores in the Upper Zone of San Rafael and develop the silver-copper EC120 project. Mining these silver-rich areas of the Cosalá Operations is expected to significantly increase silver production to over 2.5 million ounces of silver per year.
Galena Complex
The Company has completed the Phase 1 drilling program as part of the Galena Complex Recapitalization Plan. The Company expects to provide an updated mineral resource estimate by the end of August 2021. The Company is confident that based on the continued exploration success, from drilling completed during July 2020 through June 2021, that the resource estimate will increase. The Company’s most recent mineral resource update, which was released in September 2020, already demonstrated the significant exploration potential at the property with measured and indicated resource increasing by 36% and inferred resource increasing by 100%.
The initial 21-hole drill program targeting the Silver Vein at depth is complete with all holes intersecting mineralization. Most recent high-grade results include:
-
Hole 55-183: 3,345 g/t silver and 2.8% copper (3,633 g/t silver equivalent [1]) over 3.8 m [2]
including: 13,800 g/t silver and 11.1% copper (14,900 g/t silver equivalent) over 0.5 m -
Hole 55-143: 2,460 g/t silver and 2.1% copper (2,680 g/t silver equivalent) over 4.1 m
including: 7,060 g/t silver and 5.4% copper (7,620 g/t silver equivalent) over 0.6 m -
Hole 55-184: 3,966 g/t silver and 4.0% copper (4,372 g/t silver equivalent) over 2.2 m
including: 7,610 g/t silver and 7.6% copper (8,390 g/t silver equivalent) over 0.5 m -
Hole 55-173: 1,747 g/t silver and 2.0% copper (1,968 g/t silver equivalent) over 1.5 m
including: 12,400 g/t silver and 16.2% copper (14,100 g/t silver equivalent) over 0.1 m -
Hole 55-181: 1,185 g/t silver and 1.4% copper (1,330 g/t silver equivalent) over 1.9 m
and: 738 g/t silver and 0.5% copper (790 g/t silver equivalent) over 2.1 m -
Hole 55-186: 2,264 g/t silver and 3.1% copper (2,588 g/t silver equivalent) over 0.5 m
A full table of the drill results can be found at:
https://americas-gold.com/site/assets/files/4297/dr20210712.pdf
The Phase 2 drill program has commenced with several targets identified. Drilling at depth will continue to focus on the three south-east plunging veins which include the 72 Vein, the Silver Vein and the down-dip extension of the 360 Complex. Drilling has commenced from a newly developed drill station further east on the 5500-Level to continue to test the extension of the Silver Vein at depth following the success of the initial 21-hole drill program. The first drill hole from this station has commenced and is targeting the Silver Vein approximately 500 feet below the drill station. Subsequent drill stations are planned further east on the 5500-Level to continue to target the Silver Vein and 360 Complex. The initial drilling success of the 360 Complex during Phase 1 is believed to be the top of the system with the potential to extend at depth. Phase 2 will include continued exploration in gap areas within this south-east plunging trend to determine continuity and potential sources of these high-grade mineralized vein systems.
The goal of Phase 2 drilling is to add significant mine life in known vein systems and to discover new orebodies both at depth and near surface. The Company is targeting an additional 50 million ounces of silver from the Phase 2 drilling program, on a 100% basis for the property.
The Company expects 2021 to be a transitional year at the Galena Complex but the operation has already begun to benefit from the Recapitalization Plan with silver and lead production in Q2-2021 increasing by over 20% and 10%, respectively on a year-over-year basis. The Company is targeting to increase production to a 2 million ounce per year plan by the end of 2022 and longer term, assuming continued exploration success, the Company anticipates the operation will again reach peak historical annual production levels of approximately 5 million ounces per year.
Relief Canyon
While the Company was successful in meeting several important commissioning targets, including initial construction capital, and planned mining and crushing rates, the ramp-up at Relief Canyon has been and continues to be challenging since the first poured gold in February 2020. During this period, the Company and its consultants performed extensive analyses and implemented a number of procedural changes to address the start-up challenges typical of a heap leach operation. As part of this analysis, the Company has identified naturally occurring carbonaceous material within the Relief Canyon pit. The identification of this material was not recognized in the feasibility study.
The Company began two small run-of-mine test pads in Q1-2021 to evaluate the possibility of simplifying the flowsheet by by-passing the crushing and conveying circuits and transitioned to this method of ore placement in May 2021. Despite the encouraging initial results, the operation has not seen a sustained material increase in recoveries to date. Additional improvements in the predictive ability of the resource model are progressing with incorporation of the latest geological detail from recent pit mapping as well as new data from an extensive re-assaying program of 13,000 historic exploration pulp samples for the presence of carbonaceous material. Completion of this data compilation and analysis is targeted for late Q3-2021. Management also initiated several metallurgical test work programs to investigate ore treatment options, including Carbon-In-Leach processing. Several of the options present encouraging preliminary results. Further investigation is planned in the near term.
The Company is committed to continuing efforts to resolve these metallurgical challenges and increase production levels at Relief Canyon as noted above. However, the Company is in the process of reopening the Cosalá Operations and is currently prioritizing its capital resources to the re-start. As a result of these capital allocation decisions, the Company has decided to temporarily suspend mining operations at Relief Canyon pending improved consolidated capital and the initial metallurgical test results. During this time, the Company will continue leaching operations and working to improve recovery and operations through an extensive audit of drilling, sampling, ore control, and modelling, implementing internal QA/QC programs, and metallurgy testing program on carbonaceous material.
Notice of Intent for the Phase 2 EIS was published in the Federal Register in Q3-2020. The Phase 2 permit will allow the Company to continue mining at depth below the water table, expand the footprint of both the heap leach and waste rock storage facilities and expand the mining permit boundary. Approval of the EIS and receipt of the Phase 2 permit is expected before the end of Q3-2021.
About Americas Gold and Silver Corporation
Americas Gold and Silver Corporation is a high-growth precious metals mining company with multiple assets in North America. The Company owns and operates the Relief Canyon mine in Nevada, USA, the Cosalá Operations in Sinaloa, Mexico and manages the 60%-owned Galena Complex in Idaho, USA. The Company also owns the San Felipe development project in Sonora, Mexico. For further information, please see SEDAR or www.americas-gold.com.
Technical Information and Qualified Persons
The scientific and technical information relating to the operation of the Company’s material operating mining properties contained herein has been reviewed and approved by Daren Dell, P.Eng., Chief Operating Officer of the Company. The scientific and technical information relating to mineral resources and exploration contained herein has been reviewed and approved by Niel de Bruin, Director of Geology of the Company. Each of Messrs. Dell and de Bruin are "qualified persons" for the purposes of NI 43-101.
The Company’s current Annual Information Form and the NI 43-101 Technical Reports for its other material mineral properties, all of which are available on SEDAR at www.sedar.com, and EDGAR at www.sec.gov contain further details regarding mineral reserve and mineral resource estimates, classification and reporting parameters, key assumptions and associated risks for each of the Company’s material mineral properties, including a breakdown by category.
The diamond drilling program used NQ-size core. Americas Gold and Silver’s standard QA/QC practices were utilized to ensure the integrity of the core and sample preparation at the Galena Complex through delivery of the samples to the assay lab. The drill core was stored in a secure facility, photographed, logged and sampled based on lithologic and mineralogical interpretations. Standards of certified reference materials, field duplicates and blanks were inserted as samples shipped with the core samples to the lab.
Analytical work was carried out by American Analytical Services Inc. ("AAS") located in Osburn, Idaho. AAS is an independent, ISO-17025 accredited laboratory. Sample preparation includes a 30-gram pulp sample analyzed by atomic absorption spectrometry ("AA") techniques to determine silver, copper, and lead, using aqua regia for pulp digestion. Samples returning values over 514g/t Ag are re-assayed using fire-assay techniques for silver. Additionally, samples returning values over 23% Pb are re-assayed using titration techniques.
Duplicate pulp samples were sent out quarterly to ALS Global, an independent, ISO-17025 accredited laboratory based in Reno, Nevada to perform an independent check analysis. A conventional AA technique was used for the analysis of silver, copper and lead at ALS Global with the same industry standard procedures as those used by AAS. The assay results listed in this report did not show any significant contamination during sample preparation or sample bias of analysis.
All mining terms used herein have the meanings set forth in National Instrument 43-101 – Standards of Disclosure for Mineral Projects ("NI 43-101"), as required by Canadian securities regulatory authorities. These standards differ significantly from the requirements of the SEC that are applicable to domestic United States reporting companies. Any mineral reserves and mineral resources reported by the Company in accordance with NI 43-101 may not qualify as such under SEC standards. Accordingly, information contained in this news release may not be comparable to similar information made public by companies subject to the SEC’s reporting and disclosure requirements.
Cautionary Statement on Forward-Looking Information:
This news release contains "forward-looking information" within the meaning of applicable securities laws. Forward-looking information includes, but is not limited to, Americas Gold and Silver’s expectations, intentions, plans, assumptions and beliefs with respect to, among other things, estimated and targeted production rates and results for gold, silver and other precious metals, the expected prices of gold, silver and other precious metals, as well as the related costs, expenses and capital expenditures; the recapitalization plan at the Galena Complex, including the expected production levels and potential additional mineral resources thereat; the resumption of mining and processing operations at the Cosalá Operations following the resolution of the illegal blockade, including expected production levels; the expected capital costs required in connection with the resumption of mining and processing operations at the Cosalá Operations; the expectations regarding the level of support from the Mexican government with respect to the long-term stability of Cosalá Operations, and its ability to maintain such support in the near- and long-term; the Company’s production, development plans and performance expectations at the Relief Canyon Mine and its ability to finance, develop and operate Relief Canyon, including the expected improvement of operations and overall project economics in connection therewith, the timing and conclusions of the data compilation and analysis occurring at Relief Canyon the length of time of the temporary pause in mining operations at Relief Canyon to address the capital requirements for the re-opening of its Cosalá Operations and expected timing for the re-start of the Relief Canyon operations after such pause;. Often, but not always, forward-looking information can be identified by forward-looking words such as "anticipate", "believe", "expect", "goal", "plan", "intend", "potential’, "estimate", "may", "assume" and "will" or similar words suggesting future outcomes, or other expectations, beliefs, plans, objectives, assumptions, intentions, or statements about future events or performance. Forward-looking information is based on the opinions and estimates of Americas Gold and Silver as of the date such information is provided and is subject to known and unknown risks, uncertainties, and other factors that may cause the actual results, level of activity, performance, or achievements of Americas Gold and Silver to be materially different from those expressed or implied by such forward-looking information. With respect to the business of Americas Gold and Silver, these risks and uncertainties include risks relating to widespread epidemics or pandemic outbreak including the COVID-19 pandemic; the impact of COVID-19 on our workforce, suppliers and other essential resources and what effect those impacts, if they occur, would have on our business, including our ability to access goods and supplies, the ability to transport our products and impacts on employee productivity, the risks in connection with the operations, cash flow and results of the Company relating to the unknown duration and impact of the COVID-19 pandemic; interpretations or reinterpretations of geologic information; unfavorable exploration results; inability to obtain permits required for future exploration, development or production; general economic conditions and conditions affecting the industries in which the Company operates; the uncertainty of regulatory requirements and approvals; fluctuating mineral and commodity prices; the ability to obtain necessary future financing on acceptable terms or at all; the ability to operate the Relief Canyon Project; and risks associated with the mining industry such as economic factors (including future commodity prices, currency fluctuations and energy prices), ground conditions and other factors limiting mine access, failure of plant, equipment, processes and transportation services to operate as anticipated, environmental risks, government regulation, actual results of current exploration and production activities, possible variations in ore grade or recovery rates, permitting timelines, capital and construction expenditures, reclamation activities, labor relations or disruptions, social and political developments and other risks of the mining industry. The potential effects of the COVID-19 pandemic on our business and operations are unknown at this time, including the Company’s ability to manage challenges and restrictions arising from COVID-19 in the communities in which the Company operates and our ability to continue to safely operate and to safely return our business to normal operations. The impact of COVID-19 on the Company is dependent on a number of factors outside of its control and knowledge, including the effectiveness of the measures taken by public health and governmental authorities to combat the spread of the disease, global economic uncertainties and outlook due to the disease, and the evolving restrictions relating to mining activities and to travel in certain jurisdictions in which it operates. Although the Company has attempted to identify important factors that could cause actual results to differ materially from those contained in forward-looking information, there may be other factors that cause results not to be as anticipated, estimated, or intended. Readers are cautioned not to place undue reliance on such information. Additional information regarding the factors that may cause actual results to differ materially from this forward‐looking information is available in Americas Gold and Silver’s filings with the Canadian Securities Administrators on SEDAR and with the SEC. Americas Gold and Silver does not undertake any obligation to update publicly or otherwise revise any forward-looking information whether as a result of new information, future events or other such factors which affect this information, except as required by law. Americas Gold and Silver does not give any assurance (1) that Americas Gold and Silver will achieve its expectations, or (2) concerning the result or timing thereof. All subsequent written and oral forward‐looking information concerning Americas Gold and Silver are expressly qualified in their entirety by the cautionary statements above.
1 Silver equivalent was calculated using metal prices of $20.00/oz silver, $3.00/lb copper and $1.05/lb lead and equivalent metallurgical recoveries were assumed for all metals (silver, lead and copper).
2 Meters represent "True Width" which is calculated for significant intercepts only and is based on orientation axis of core across the estimated dip of the vein.
View source version on businesswire.com: https://www.businesswire.com/news/home/20210816005215/en/
Contacts
For more information:
Stefan Axell
VP, Corporate Development & Communications
Americas Gold and Silver Corporation
416-874-1708
Darren Blasutti
President and CEO
Americas Gold and Silver Corporation
416‐848‐9503
With the business potentially at an important milestone, we thought we'd take a closer look at McEwen Mining Inc.'s (NYSE:MUX) future prospects. McEwen Mining Inc. engages in the exploration, development, production, and sale of gold and silver deposits in the United States, Canada, Mexico, and Argentina. The US$514m market-cap company’s loss lessened since it announced a US$152m loss in the full financial year, compared to the latest trailing-twelve-month loss of US$52m, as it approaches breakeven. The most pressing concern for investors is McEwen Mining's path to profitability – when will it breakeven? Below we will provide a high-level summary of the industry analysts’ expectations for the company.
See our latest analysis for McEwen Mining
Consensus from 3 of the American Metals and Mining analysts is that McEwen Mining is on the verge of breakeven. They anticipate the company to incur a final loss in 2021, before generating positive profits of US$45m in 2022. Therefore, the company is expected to breakeven just over a year from today. In order to meet this breakeven date, we calculated the rate at which the company must grow year-on-year. It turns out an average annual growth rate of 166% is expected, which is rather optimistic! Should the business grow at a slower rate, it will become profitable at a later date than expected.

Given this is a high-level overview, we won’t go into details of McEwen Mining's upcoming projects, though, keep in mind that by and large metals and mining companies, depending on the stage of operation and metals mined, have irregular periods of cash flow. So, a high growth rate is not out of the ordinary, particularly when a company is in a period of investment.
Before we wrap up, there’s one aspect worth mentioning. The company has managed its capital judiciously, with debt making up 13% of equity. This means that it has predominantly funded its operations from equity capital, and its low debt obligation reduces the risk around investing in the loss-making company.
Next Steps:
There are too many aspects of McEwen Mining to cover in one brief article, but the key fundamentals for the company can all be found in one place – McEwen Mining's company page on Simply Wall St. We've also compiled a list of important aspects you should further research:
-
Historical Track Record: What has McEwen Mining's performance been like over the past? Go into more detail in the past track record analysis and take a look at the free visual representations of our analysis for more clarity.
-
Management Team: An experienced management team on the helm increases our confidence in the business – take a look at who sits on McEwen Mining's board and the CEO’s background.
-
Other High-Performing Stocks: Are there other stocks that provide better prospects with proven track records? Explore our free list of these great stocks here.
This article by Simply Wall St is general in nature. We provide commentary based on historical data and analyst forecasts only using an unbiased methodology and our articles are not intended to be financial advice. It does not constitute a recommendation to buy or sell any stock, and does not take account of your objectives, or your financial situation. We aim to bring you long-term focused analysis driven by fundamental data. Note that our analysis may not factor in the latest price-sensitive company announcements or qualitative material. Simply Wall St has no position in any stocks mentioned.
Have feedback on this article? Concerned about the content? Get in touch with us directly. Alternatively, email editorial-team (at) simplywallst.com.
Pretium Resources Inc. (TSE:PVG) investors will be delighted, with the company turning in some strong numbers with its latest results. It was overall a positive result, with revenues beating expectations by 5.9% to hit US$154m. Pretium Resources reported statutory earnings per share (EPS) US$0.16, which was a notable 19% above what the analysts had forecast. Earnings are an important time for investors, as they can track a company's performance, look at what the analysts are forecasting for next year, and see if there's been a change in sentiment towards the company. We thought readers would find it interesting to see the analysts latest (statutory) post-earnings forecasts for next year.
Check out our latest analysis for Pretium Resources

After the latest results, the seven analysts covering Pretium Resources are now predicting revenues of US$633.6m in 2021. If met, this would reflect a credible 2.3% improvement in sales compared to the last 12 months. Earnings are expected to improve, with Pretium Resources forecast to report a statutory profit of US$0.70 per share. Before this earnings report, the analysts had been forecasting revenues of US$624.9m and earnings per share (EPS) of US$0.64 in 2021. The analysts seems to have become more bullish on the business, judging by their new earnings per share estimates.
There's been no major changes to the consensus price target of CA$15.29, suggesting that the improved earnings per share outlook is not enough to have a long-term positive impact on the stock's valuation. Fixating on a single price target can be unwise though, since the consensus target is effectively the average of analyst price targets. As a result, some investors like to look at the range of estimates to see if there are any diverging opinions on the company's valuation. There are some variant perceptions on Pretium Resources, with the most bullish analyst valuing it at CA$18.50 and the most bearish at CA$13.50 per share. Analysts definitely have varying views on the business, but the spread of estimates is not wide enough in our view to suggest that extreme outcomes could await Pretium Resources shareholders.
One way to get more context on these forecasts is to look at how they compare to both past performance, and how other companies in the same industry are performing. It's pretty clear that there is an expectation that Pretium Resources' revenue growth will slow down substantially, with revenues to the end of 2021 expected to display 4.7% growth on an annualised basis. This is compared to a historical growth rate of 15% over the past three years. By way of comparison, the other companies in this industry with analyst coverage are forecast to grow their revenue at 3.5% annually. So it's pretty clear that, while Pretium Resources' revenue growth is expected to slow, it's still expected to grow faster than the industry itself.
The Bottom Line
The biggest takeaway for us is the consensus earnings per share upgrade, which suggests a clear improvement in sentiment around Pretium Resources' earnings potential next year. Fortunately, they also reconfirmed their revenue numbers, suggesting sales are tracking in line with expectations – and our data suggests that revenues are expected to grow faster than the wider industry. There was no real change to the consensus price target, suggesting that the intrinsic value of the business has not undergone any major changes with the latest estimates.
With that in mind, we wouldn't be too quick to come to a conclusion on Pretium Resources. Long-term earnings power is much more important than next year's profits. We have estimates – from multiple Pretium Resources analysts – going out to 2023, and you can see them free on our platform here.
Another thing to consider is whether management and directors have been buying or selling stock recently. We provide an overview of all open market stock trades for the last twelve months on our platform, here.
This article by Simply Wall St is general in nature. We provide commentary based on historical data and analyst forecasts only using an unbiased methodology and our articles are not intended to be financial advice. It does not constitute a recommendation to buy or sell any stock, and does not take account of your objectives, or your financial situation. We aim to bring you long-term focused analysis driven by fundamental data. Note that our analysis may not factor in the latest price-sensitive company announcements or qualitative material. Simply Wall St has no position in any stocks mentioned.
Have feedback on this article? Concerned about the content? Get in touch with us directly. Alternatively, email editorial-team (at) simplywallst.com.
Vancouver, British Columbia–(Newsfile Corp. – August 13, 2021) – SALAZAR RESOURCES LIMITED (TSXV: SRL) (OTCQX: SRLZF) (FSE: CCG) ("Salazar" or the "Company") is pleased to announce that it has completed Phase 1 drilling at its wholly-owned Los Osos project in El Oro, Ecuador ("Los Osos"), and to report the results from the final three holes drilled. In total, six holes were completed, comprising 3,785 metres ("m"), during the Phase 1 program.
Highlights:
-
OSO-05 returned mineralized intervals to a depth of 796 m downhole, with end of hole at 864 m
-
30 m @ 0.4 g/t Au, 0.1% Cu, and 1.0 g/t Ag from 44 m, including:
-
15 m @ 0.6 g/t Au, 0.1% Cu, and 1.1 g/t Ag from 54 m
-
-
18 m @ 0.3 g/t Au, 0.1% Cu, and 1.4 g/t Ag from 223 m
-
-
OSO-06 returned mineralized intervals to a depth of 514 m downhole, with end of hole at 516 m
-
87 m @ 0.2 g/t Au, 0.1% Cu, and 0.8 g/t Ag from 160 m
-
133 m @ 0.2 g/t Au, 0.1% Cu, and 0.6 g/t Ag from 282 m
-
17 m @ 0.4 g/t Au, 0.1% Cu, and 0.9 g/t Ag from 451 m
-
Fredy E. Salazar, CEO and President, commented: "Salazar Resources successfully encountered abundant sulphide mineralization in holes five and six prior to completing Phase 1 drilling at Los Osos. While we review all the data from Los Osos to decide our next steps, the rigs are being redeployed across Salazar's portfolio of assets; exploration crews are busy exploring at Los Santos and preparing for drilling at Rumiñahui, in line with our strategy to rapidly conduct exploration and make Ecuador's next commercial copper-gold discovery. With newly inaugurated President Lasso intent on attracting investment into businesses in Ecuador, and a strong metal price environment, the Company is well-placed to deliver results from its portfolio of projects during 2021."
Los Osos
Background information to Los Oso is available at the Salazar Resources website:
https://salazarresources.com/projects/100-salazar-owned/los-osos/
Drilling Update
Salazar Resources has completed 3,785 m of drilling in six holes at Los Osos to date. Today, The Company reports the results from the last 112 m of OSO-04, and full hole results from OSO-05 and OSO-06. Locations for all holes are shown in Figure 1 and significant drill intersections are shown in Table 1. The drill rigs have been redeployed across the Salazar Resources portfolio, in preparation for exploration drilling in conjunction with Adventus Mining and also on Salazar's wholly-owned properties.

Figure 1. Phase 1 drill plan, Los Osos, El Oro, Ecuador
To view an enhanced version of Figure 1, please visit:
https://orders.newsfilecorp.com/files/4631/93017_70a6eebc8497397f_003full.jpg
Source: Salazar Resources
Results
Holes OSO-04, OSO-05 and OSO-06 were designed to be angled holes 500-600 m long, or longer if still intersecting abundant sulphide mineralization at depth. Hole OSO-04 did not intersect significant amounts of sulphide and was stopped at a down hole depth of 430 m. Hole OSO-05 intersected abundant sulphide mineralization throughout its length and was eventually finished at a depth of 864 m. Although the hole was visually similar to OSO-03 and encouraged the continuation of the hole to its final depth, the results were lower grade than encountered in OSO-03.
Hole OSO-06 was collared from the same pad as OSO-01, but oriented to the west, rather than to the southeast. Whereas OSO-01 encountered an enriched zone from surface to the southeast, OSO-06 only entered elevated mineralization at a downhole depth of 87 m to the west. Throughout the length of the hole, the sulphide content was estimated to be lower than in holes OSO-01, OSO-03, and OSO-05 and a decision to end the hole at 516 m was taken.
All three holes were collared in metamorphic host rock before entering a suite of hydrothermal breccias, porphyritic andesites, dikes, and diorites. Sulphides were present throughout hole OSO-05 and OSO-06, in particular, predominantly pyrrhotite and pyrite with lesser chalcopyrite and arsenopyrite. The rocks are silicified and exhibit moderate phyllic alteration, with gold, copper, silver and trace molybdenum present in core. Significant intersections are shown in Table 1, below.
|
Table 1. Significant drill intersections from Los Osos |
|||||||
|
Hole |
From (m) |
To (m) |
Width* (m) |
Au (g/t) |
Cu (%) |
Mo (ppm) |
Ag (g/t) |
|
OSO-04 |
0.00 |
430.00 |
430.00 |
no significant results returned |
|||
|
OSO-05 |
41.00 |
70.61 |
29.61 |
0.45 |
0.06 |
10.00 |
1.01 |
|
Including |
54.40 |
69.00 |
14.60 |
0.59 |
0.09 |
14.00 |
1.14 |
|
96.00 |
121.76 |
25.76 |
0.19 |
0.07 |
8.06 |
1.01 |
|
|
223.40 |
241.25 |
17.85 |
0.27 |
0.08 |
58.71 |
1.46 |
|
|
398.35 |
460.80 |
62.45 |
0.38 |
0.04 |
2.46 |
0.79 |
|
|
602.60 |
611.90 |
9.30 |
0.48 |
0.20 |
13.32 |
2.06 |
|
|
745.84 |
796.00 |
50.16 |
0.18 |
0.07 |
9.24 |
1.56 |
|
|
OSO-06 |
13.30 |
91.25 |
77.95 |
0.24 |
0.03 |
16.10 |
1.16 |
|
160.40 |
247.50 |
87.10 |
0.22 |
0.06 |
11.08 |
0.78 |
|
|
281.60 |
414.8 |
133.20 |
0.22 |
0.06 |
5.80 |
0.60 |
|
|
450.70 |
477.77 |
17.27 |
0.37 |
0.06 |
3.85 |
0.85 |
|
|
Previously reported |
|||||||
|
OSO-01 |
0.00 |
243.70 |
243.70 |
0.31 |
0.06 |
1.81 |
|
|
Including |
0.00 |
69.00 |
69.00 |
0.59 |
0.03 |
1.23 |
|
|
Including |
25.00 |
28.00 |
3.00 |
4.59 |
0.03 |
0.30 |
|
|
563.40 |
574.80 |
11.40 |
0.60 |
0.03 |
|||
|
OSO-02 |
319.00 |
320.00 |
1.00 |
22.90 |
|||
|
337.90 |
339.10 |
1.20 |
2.51 |
||||
|
539.00 |
540.80 |
1.80 |
1.45 |
||||
|
OSO-03 |
6.55 |
246.60 |
240.05 |
0.39 |
0.09 |
16.52 |
7.10 |
|
Including |
6.55 |
57.50 |
50.95 |
0.52 |
0.08 |
9.48 |
25.12 |
|
Including |
223.55 |
246.60 |
23.05 |
0.74 |
0.11 |
12.11 |
2.99 |
|
345.25 |
382.00 |
36.75 |
0.37 |
0.06 |
27.58 |
0.77 |
|
|
470.65 |
524.15 |
53.50 |
0.52 |
0.07 |
2.4 |
1.13 |
|
|
*Reported intervals are down-hole lengths and not true thickness |
|||||||
Work Plan
The high-grade vein structures in the northeast of the licence area remain undrilled. Salazar Resources is reviewing the data from Los Osos and will continue to evaluate the options for the project within the broader portfolio of exploration licences.
QAQC
Salazar maintains a rigorous chain-of-custody and quality assurance/control program which includes the insertion of certified standard control samples and blanks, and re-analysis of samples with high levels (over limit) of gold, copper and zinc. All samples were analysed by Inspectorate Services Perú S.A.C. (Bureau Veritas), a certified ISO 17025:1999 and ISO 9001:2000 laboratory. The laboratory also maintains a QAQC program that includes insertion of blanks, standards and duplicate reanalysis of selected samples. Gold was analysed by fire assay – atomic absorption spectroscopy (FA-AAS). Silver, copper, zinc and other elements were analyzed by aqua regia extraction with an Inductively Coupled Plasma (ICP-ES) finish.
Qualified Person
Kieran Downes, Ph.D., P. Geo., a Qualified Person as defined by National Instrument 43-101, has reviewed and verified the technical information provided in this release.
About Salazar
Salazar Resources is focused on creating value and positive change through discovery, exploration and development in Ecuador. The team has an unrivalled understanding of the geology in-country and has played an integral role in the discovery of many of the major projects in Ecuador, including the two newest operating gold and copper mines.
Salazar Resources has a wholly owned pipeline of copper-gold exploration projects across Ecuador with a strategy to make another commercial discovery and farm-out non-core assets. The Company actively engages with Ecuadorian communities and together with the Salazar family it co-founded The Salazar Foundation, an independent non-profit organisation dedicated to sustainable progress through economic development.
The Company already has carried interests in three projects. At its maiden discovery, Curipamba, Salazar Resources has a 25% stake fully carried through to production. A feasibility study is underway and a 2019 PEA generated a base case NPV(8%) of US$288 million. At two copper-gold porphyry projects, Pijili and Santiago, the Company has a 20% stake fully carried through to a construction decision.
For further information from Salazar please contact Merlin Marr-Johnson, Executive Vice President and Corporate Secretary at merlin@salazarresources.com or ir@salazarresources.com.
Neither the TSX Venture Exchange nor its Regulation Services Provider (as that term is defined in the policies of the TSX Venture Exchange) accepts responsibility for the adequacy or accuracy of this news release.
This press release contains "forward -looking information" within the meaning of applicable securities laws. Any statements that express or involve discussions with respect to predictions, expectations, beliefs, plans, projections, objectives, assumptions or future events or performance (often, but not always, identified by words or phrases such as "believes", "anticipates", "expects", "is expected", "scheduled", "estimates", "pending", "intends", "plans", "seeks", "forecasts", "targets", or "hopes", or variations of such words and phrases or statements that certain actions, events or results "may", "could", "would", "will", "should" "might", "will be taken", or "occur" and similar expressions) are not statements of historical fact and may be forward-looking statements. Forward-looking information herein includes, but is not limited to, statements that address activities, events, or developments that Salazar expects or anticipates will or may occur in the future. Although Salazar has attempted to identify important factors that could cause actual actions, events or results to differ materially from those described in forward-looking information, there may be other factors that cause actions, events or results not to be as anticipated, estimated or intended. There can be no assurance that such information will prove to be accurate, and actual results and future events could differ materially from those anticipated in such information. Accordingly, readers should not place undue reliance on forward-looking information. Salazar undertake to update any forward-looking information in accordance with applicable securities laws.

To view the source version of this press release, please visit https://www.newsfilecorp.com/release/93017
TORONTO, Aug. 13, 2021 (GLOBE NEWSWIRE) — Churchill Resources Inc. (“Churchill” or the “Company”) (TSXV: CRI) is pleased to announce a non-brokered private placement of up to 3,750,000 flow-through common shares of the Company to be sold to charitable buyers (the “Charity FT Shares”) at a price of C$0.40 per Charity FT Share for gross proceeds to the Company of up to C$1,500,000 (the “Offering”). Subject to demand, the Company may elect to sell an additional 1,250,000 Charity FT Shares to raise an additional C$500,000 under the Offering. Red Cloud Securities Inc. is acting as a finder in connection with the Offering.
The Company intends to use the gross proceeds of the Offering for the exploration of the Company’s key projects, which may include its Taylor Brook Project in Newfoundland, its Pelly Bay Project in Nunavut, White River Project in Ontario and its recently optioned Florence Lake Project in Labrador.
The gross proceeds from the issuance of the Charity FT Shares will be used for “Canadian Exploration Expenses” (within the meaning of the Income Tax Act (Canada)) (the “Qualifying Expenditures”), which will be renounced with an effective date no later than December 31, 2021 to the purchasers of the Charity FT Shares in an aggregate amount not less than the gross proceeds raised from the issue of the Charity FT Shares. If the Qualifying Expenditures are reduced by the Canada Revenue Agency, the Company will indemnify each subscriber of Charity FT Shares for any additional taxes payable by such subscriber as a result of the Company’s failure to renounce the Qualifying Expenditures.
The closing of the Offering is expected to occur on or about August 25, 2021 and is subject to receipt of all necessary regulatory approvals including the TSX Venture Exchange. Finder’s fees will be payable and finder warrants will be issuable to eligible finders in connection wit the Offering in accordance with the policies of the TSX Venture Exchange. The Charity FT Shares and any common shares of the Company that are issuable from any finder’s warrants will be subject to a hold period of four months and one day in accordance with applicable securities laws.
About Churchill Resources Inc.
Churchill is managed by career mining industry professionals which currently holds four exploration projects, namely Taylor Brook and Florence Lake in Newfoundland, Pelly Bay in Nunavut and White River in Ontario. All four projects are at the evaluation stage, with known mineralized Ni-Cu-Co showings at Taylor Brook and Pelly Bay, and diamondiferous kimberlitic intrusives at White River and Pelly Bay. The primary focus of Churchill is on the continued exploration and development of the Taylor Brook and Florence Lake Project.
Further Information
For further information regarding Churchill, please contact:
Churchill Resources Inc.
Paul Sobie, Chief Executive Officer
Tel. 416.365.0930 (o)
647.988.0930 (m)
Cautionary Note Regarding Forward Looking Information
This news release contains "forward-looking information" and "forward-looking statements" (collectively, "forward-looking statements") within the meaning of the applicable Canadian securities legislation. All statements, other than statements of historical fact, are forward-looking statements and are based on expectations, estimates and projections as at the date of this news release. Any statement that involves discussions with respect to predictions, expectations, beliefs, plans, projections, objectives, assumptions, future events or performance (often but not always using phrases such as "expects", or "does not expect", "is expected", "anticipates" or "does not anticipate", "plans", “proposed”, "budget", "scheduled", "forecasts", "estimates", "believes" or "intends" or variations of such words and phrases or stating that certain actions, events or results "may" or "could", "would", "might" or "will" be taken to occur or be achieved) are not statements of historical fact and may be forward-looking statements. In this news release, forward-looking statements relate to, among other things, the completion of the Offering, including receipt of all necessary regulatory approvals, the Company’s objectives, goals and exploration activities conducted and proposed to be conducted at the Company’s properties; future growth potential of the Company, including whether any proposed exploration programs at any of the Company’s properties will be successful; exploration results; and future exploration plans and costs and financing availability.
These forward-looking statements are based on reasonable assumptions and estimates of management of the Company at the time such statements were made. Actual future results may differ materially as forward-looking statements involve known and unknown risks, uncertainties and other factors which may cause the actual results, performance or achievements of the Company to materially differ from any future results, performance or achievements expressed or implied by such forward-looking statements. Such factors, among other things, include: the expected benefits to the Company relating to the exploration conducted and proposed to be conducted at the Company’s properties; the receipt of all applicable regulatory approvals for the Offering; the completion of the Offering on the terms described herein, or at all; failure to identify any mineral resources or significant mineralization; the preliminary nature of metallurgical test results; uncertainties relating to the availability and costs of financing needed in the future, including to fund any exploration programs on the Company’s properties; fluctuations in general macroeconomic conditions; fluctuations in securities markets; fluctuations in spot and forward prices of gold, silver, base metals or certain other commodities; fluctuations in currency markets (such as the Canadian dollar to United States dollar exchange rate); change in national and local government, legislation, taxation, controls, regulations and political or economic developments; risks and hazards associated with the business of mineral exploration, development and mining (including environmental hazards, industrial accidents, unusual or unexpected formations pressures, cave-ins and flooding); inability to obtain adequate insurance to cover risks and hazards; the presence of laws and regulations that may impose restrictions on mining and mineral exploration; employee relations; relationships with and claims by local communities and indigenous populations; availability of increasing costs associated with mining inputs and labour; the speculative nature of mineral exploration and development (including the risks of obtaining necessary licenses, permits and approvals from government authorities); the unlikelihood that properties that are explored are ultimately developed into producing mines; geological factors; actual results of current and future exploration; changes in project parameters as plans continue to be evaluated; soil sampling results being preliminary in nature and are not conclusive evidence of the likelihood of a mineral deposit; title to properties; and those factors described in the most recently filed management’s discussion and analysis of the Company. Although the forward-looking statements contained in this news release are based upon what management of the Company believes, or believed at the time, to be reasonable assumptions, the Company cannot assure shareholders that actual results will be consistent with such forward-looking statements, as there may be other factors that cause results not to be as anticipated, estimated or intended. Accordingly, readers should not place undue reliance on forward-looking statements and information. There can be no assurance that forward-looking information, or the material factors or assumptions used to develop such forward-looking information, will prove to be accurate. The Company does not undertake to release publicly any revisions for updating any voluntary forward-looking statements, except as required by applicable securities law.
Neither the TSXV nor its Regulation Services Provider (as that term is defined in the policies of the TSXV) accepts responsibility for the adequacy or accuracy of this news release.

Image source: The Motley Fool. Fortuna Silver Mines (NYSE: FSM)Q2 2021 Earnings CallAug 12, 2021, 12:00 p.m. ETContents: Prepared Remarks Questions and Answers Call Participants Prepared Remarks: OperatorGood day, ladies and gentlemen, and welcome to the Fortuna Silver Mines second-quarter 2021 financial and operational results.
Pretium Resources (PVG) came out with quarterly earnings of $0.15 per share, beating the Zacks Consensus Estimate of $0.13 per share. This compares to earnings of $0.26 per share a year ago. These figures are adjusted for non-recurring items.
This quarterly report represents an earnings surprise of 15.38%. A quarter ago, it was expected that this gold mining company would post earnings of $0.21 per share when it actually produced earnings of $0.14, delivering a surprise of -33.33%.
Over the last four quarters, the company has surpassed consensus EPS estimates three times.
Pretium Resources, which belongs to the Zacks Mining – Gold industry, posted revenues of $152.31 million for the quarter ended June 2021, surpassing the Zacks Consensus Estimate by 6.21%. This compares to year-ago revenues of $166.57 million. The company has topped consensus revenue estimates three times over the last four quarters.
The sustainability of the stock's immediate price movement based on the recently-released numbers and future earnings expectations will mostly depend on management's commentary on the earnings call.
Pretium Resources shares have lost about 24% since the beginning of the year versus the S&P 500's gain of 18.4%.
What's Next for Pretium Resources?
While Pretium Resources has underperformed the market so far this year, the question that comes to investors' minds is: what's next for the stock?
There are no easy answers to this key question, but one reliable measure that can help investors address this is the company's earnings outlook. Not only does this include current consensus earnings expectations for the coming quarter(s), but also how these expectations have changed lately.
Empirical research shows a strong correlation between near-term stock movements and trends in earnings estimate revisions. Investors can track such revisions by themselves or rely on a tried-and-tested rating tool like the Zacks Rank, which has an impressive track record of harnessing the power of earnings estimate revisions.
Ahead of this earnings release, the estimate revisions trend for Pretium Resources was mixed. While the magnitude and direction of estimate revisions could change following the company's just-released earnings report, the current status translates into a Zacks Rank #3 (Hold) for the stock. So, the shares are expected to perform in line with the market in the near future. You can see the complete list of today's Zacks #1 Rank (Strong Buy) stocks here.
It will be interesting to see how estimates for the coming quarters and current fiscal year change in the days ahead. The current consensus EPS estimate is $0.18 on $170.7 million in revenues for the coming quarter and $0.60 on $638.15 million in revenues for the current fiscal year.
Investors should be mindful of the fact that the outlook for the industry can have a material impact on the performance of the stock as well. In terms of the Zacks Industry Rank, Mining – Gold is currently in the bottom 28% of the 250 plus Zacks industries. Our research shows that the top 50% of the Zacks-ranked industries outperform the bottom 50% by a factor of more than 2 to 1.
Want the latest recommendations from Zacks Investment Research? Today, you can download 7 Best Stocks for the Next 30 Days. Click to get this free report
Pretium Resources, Inc. (PVG) : Free Stock Analysis Report
To read this article on Zacks.com click here.
Zacks Investment Research
$48.2 million in cash and short-term investments, pre-development activities commenced
VANCOUVER, British Columbia, Aug. 13, 2021 (GLOBE NEWSWIRE) — Sabina Gold & Silver Corp. (“Sabina”) or (the “Company”) (SBB – TSX/ SGSVF – OTCQX) reports the interim financial results for the six months ended June 30, 2021.
“Sabina had a safe and productive second quarter with strong advancement of Goose site activities and other corporate initiatives,” said Bruce McLeod, President & CEO. “Planned exploration drilling for 2021 has wrapped up successfully and pre-development activities continue with advancement of the Umwelt underground exploration ramp and other site works including road construction and plant and camp laydown preparation. During the quarter, logistics and readiness planning was initiated at the Port facility to execute a significant summer sealift planned for August and September. The team also continued to advance detailed engineering and progress the Project debt process.”
Q2 2021 Highlights:
-
The Company has cash and cash equivalents and short-term investments of $48.2 million on June 30, 2021.
-
Work began on collaring the portal for the underground exploration ramp at Umwelt. The first blast occurred on May 31st with work driving the ramp continuing through the quarter.
-
During the quarter, the Company procured a variety of key supplies and equipment to advance the critical path activities to maintain schedule as set out in Sabina’s Updated Feasibility Study. Procurement items included the first phase of the permanent camp complex, mill buildings, a variety of construction supplies, Winter Ice Road (WIR) equipment and other mobile equipment.
-
Considerable work commenced on a logistics program to ship ~13,500 revenue tonnes (“RT”) of cargo from the East and 12,200 RT of Cargo from the West water routes as well as mobilizing a Hercules Aircraft program to transport additional equipment for the Umwelt underground exploration ramp.
-
During the quarter, the Company advanced detailed engineering on the project, with efforts specifically focused on the process plant, the power-house, and the Goose fuel farm design.
-
A construction crew was mobilized to perform work on 10M liter fuel tank at the port facility, rough grading at the plant site, and emergency pond for the underground decline at the Goose Property
-
A successful spring exploration drill program of 4,482 meters over 18 holes was completed at Goose targeting an equal mix of early-stage exploration areas and the Hook zone, an important link between the Goose Main and Nuvuyak mineral systems. Additionally, a small geotechnical drilling campaign of 98 meters over 7 holes tested the surface conditions of the planned water management structures.
-
For the three and six months ended June 30, 2021, the Company reported net losses of $1.6 million or $0.00 per share and $3.0 million or $0.01 per share, respectively.
For the full June 30, 2021 interim financial statements and Management’s Discussion and Analysis, please see the Company website at www.sabinagoldsilver.com or on SEDAR.
SABINA GOLD & SILVER CORP
Sabina Gold & Silver Corp. is well-financed and is an emerging precious metals company with district scale, advanced, high grade gold assets in Nunavut, Canada.
Sabina recently filed an Updated Feasibility Study (the “UFS”) on its 100% owned Back River Gold Project which presents a project that will produce ~223,000 ounces of gold a year (first five years average of 287,000 ounces a year with peak production of 312,000 ounces in year three) for ~15 years with a rapid payback of 2.3 years, with a post-tax IRR of ~28% and NPV5% of C$1.1B. See “National Instrument (NI) 43-101 Technical Report – 2021 Updated Feasibility Study for the Goose Project at the Back River Gold District, Nunavut, Canada” dated March 3, 2021.
The Project received its final major authorization on June 25, 2020 and is now in receipt of all major permits and authorizations for construction and operations.
In addition to Back River, Sabina also owns a significant silver royalty on Glencore’s Hackett River Project. The silver royalty on Hackett River’s silver production is comprised of 22.5% of the first 190 million ounces produced and 12.5% of all silver produced thereafter.
All news releases and further information can be found on the Company’s website at www.sabinagoldsilver.com or on SEDAR at www.sedar.com. All technical reports have been filed on www.sedar.com
For further information please contact:
Nicole Hoeller, Vice-President, Communications:
1 888 648-4218
nhoeller@sabinagoldsilver.com
Forward Looking Information
This news release contains “forward-looking information” within the meaning of applicable securities laws (the “forward-looking statements”), including, but not limited to, statements related to the expected use of proceeds of the Offering and the projections and assumptions of the results of the UFS. These forward-looking statements are made as of the date of this news release. Readers are cautioned not to place undue reliance on forward-looking statements, as there can be no assurance that the future circumstances, outcomes or results anticipated in or implied by such forward-looking statements will occur or that plans, intentions or expectations upon which the forward-looking statements are based will occur. While we have based these forward-looking statements on our expectations about future events as at the date that such statements were prepared, the statements are not a guarantee that such future events will occur and are subject to risks, uncertainties, assumptions and other factors which could cause events or outcomes to differ materially from those expressed or implied by such forward-looking statements. Such factors and assumptions include, among others, the uncertainty of production, development plans and costs estimates for the Back River Gold Project; discrepancies between actual and estimated mineral reserves and mineral resources, between actual and estimated development and operating costs; the interpretation of drill, metallurgical testing and other exploration results; the ability of the Company to retain its key management employees and skilled and experienced personnel; exploration, development and mining risks and the inherently dangerous nature of the mining industry, and the risk of inadequate insurance or inability to obtain insurance to cover these risks and other risks and uncertainties; property and mineral title risks including defective title to mineral claims or property; the effects of general economic conditions, commodity prices, changing foreign exchange rates and actions by government and regulatory authorities; and misjudgments in the course of preparing forward-looking statements. In addition, there are known and unknown risk factors which could cause our actual results, performance or achievements to differ materially from any future results, performance or achievements expressed or implied by the forward-looking statements. Known risk factors include risks associated with exploration and project development; the need for additional financing; the calculation of mineral resources and reserves; operational risks associated with mining and mineral processing; fluctuations in metal prices; title matters; government regulation; obtaining and renewing necessary licenses and permits; environmental liability and insurance; reliance on key personnel; the potential for conflicts of interest among certain of our officers or directors; the absence of dividends; currency fluctuations; labour disputes; competition; dilution; the volatility of the our common share price and volume; future sales of shares by existing shareholders; and other risks and uncertainties, including those relating to the Back River Project and general risks associated with the mineral exploration and development industry described in our Annual Information Form, financial statements and MD&A for the fiscal period ended December 31, 2020 filed with the Canadian Securities Administrators and available at www.sedar.com. Although we have attempted to identify important factors that could cause actual actions, events or results to differ materially from those described in forward-looking statements, there may be other factors that cause actions, events or results not to be as anticipated, estimated or intended. There can be no assurance that forward-looking statements will prove to be accurate, as actual results and future events could differ materially from those anticipated in such statements. Accordingly, readers should not place undue reliance on forward-looking statements. We are under no obligation to update or alter any forward-looking statements except as required under applicable securities laws.
Bruce McLeod, President & CEO
1800-555 Burrard Street, Two Bentall Centre
Vancouver, BC V7X 1M9
Tel 604 998-4175 Fax 604 998-1051
http://www.sabinagoldsilver.com

Joining the call today from Pan American are President and CEO Michael Steinmann; Steve Busby, chief operating officer; Rob Doyle, chief financial officer; Martin Wafforn, senior VP, technical services and process optimization; and Chris Emerson, VP, business development and geology. Thank you for joining us today to discuss our second-quarter results.
Shares Outstanding: 277,659,867
Trading Symbols: TSX: GGD
OTCQX: GLGDF
HALIFAX, NS, Aug. 12, 2021 /CNW/ – GoGold Resources Inc. (TSX: GGD) (OTCQX: GLGDF) ("GoGold", "the Company") is pleased to announce the release of financial results for the quarter ending June 30, 2021 with record revenue of $15 million (all amounts are in U.S. dollars) from the sale of 563,401 silver equivalent ounces.
"Parral had another great quarter, generating a record $7.5 million in free cash flow, or a record $27.1 million for the last 12 months. These funds are being reinvested into Los Ricos, which we believe is generating great value for our shareholders," Brad Langille, President and CEO stated. "Renegotiating the Parral off-take agreement provided cash savings of $194,000 in the two months since amendment."
Financial Highlights for the quarter ending June 30, 2021:
-
Free cash flow from Parral of $7.5 million
-
Company cash flow from operations before working capital of $6.0 million, $2.7 million after working capital
-
Adjusted net income of $3.9 million, adjusted for a one-time loss related to the off-take agreement amendment of $3.4 million
-
Revenue of $15 million on the sale of 563,401 silver equivalent ounces at a realized price per ounce of $26.58
-
Cash of $73.5 million USD
-
Production of 575,302 silver equivalent ounces, consisting of 315,632 silver ounces, 3,170 gold ounces, and 120 copper tonnes
The Corporation has an off-take agreement ("Off-Take Agreement") which was amended on April 29, 2021. Prior to amendment, the Off-Take Agreement resulted in an average of approximately 3.6% lower realized prices for gold and silver as compared to spot market pricing. Under the amended and restated Off-Take Agreement, the Corporation has agreed to sell to the counterparty 2.4% of all the refined gold and refined silver produced at Parral over the remaining life of the operation at a price equal to 30% of the prevailing market price. The difference between net income and adjusted net income is due to a one-time pre-tax adjustment of $3.4 million due to an onerous contract provision required for the Off-Take Amendment. Management estimates the amendment will provide a net cash benefit to the Corporation of approximately 2% of revenue on a monthly basis going forward. In the two months from amendment until June 30, the savings were $194,000.
Following are tables showing summarized financial information and key performance indicators:
|
Summarized Consolidated Financial Information |
Three months ended Jun 30 |
Nine months ended Jun 30 |
||
|
(in thousands USD, except per share amounts) |
2021 |
2020 |
2021 |
2020 |
|
Revenue |
$ 14,973 |
$ 7,886 |
$ 42,282 |
$ 25,792 |
|
Cost of sales, including depreciation |
8,754 |
6,401 |
25,190 |
22,395 |
|
Operating income (loss)1 |
746 |
254 |
8,174 |
(271) |
|
Net income (loss)1 |
438 |
2 |
7,406 |
(1,184) |
|
Adjusted net income1 |
3,902 |
2 |
10,870 |
(1,184) |
|
Basic net income (loss) per share |
0.002 |
0.000 |
0.028 |
(0.007) |
|
Cash flow from operations |
2,714 |
523 |
11,839 |
3,236 |
|
1Three and nine months ended June 30 includes one-time loss on onerous contract provision of $3,464. |
|
Key Performance Indicators1 |
Three months ended Jun 30 |
Nine months ended Jun 30 |
||
|
(in thousands USD, except per ounce amounts) |
2021 |
2020 |
2021 |
2020 |
|
Total tonnes stacked |
480,499 |
282,743 |
1,347,811 |
980,830 |
|
Silver equivalent ounces sold |
563,401 |
469,545 |
1,706,560 |
1,591,856 |
|
AISC per silver equivalent ounce2 |
$ 16.98 |
$ 14.93 |
$ 16.12 |
$ 14.87 |
|
Cash cost per silver equivalent ounce2 |
$ 13.31 |
$ 12.13 |
$ 12.79 |
$ 12.35 |
|
Realized silver price |
$ 26.58 |
$ 16.80 |
$ 24.78 |
$ 16.20 |
|
1Key performance indicators are unaudited non-GAAP measures. |
|
2Gold and copper are converted using average market prices. |
This news release should be read in conjunction with the interim condensed consolidated financial statements for the quarter ended June 30, 2021, notes to the financial statements, and management's discussion and analysis for the quarter ended June 30, 2021, which have been filed on SEDAR and are available on the Company's website.
Technical information contained in this news release with respect to GoGold has been reviewed and approved by Mr. Bob Harris, P.Eng., who is a qualified person for the purposes of NI 43-101.
About GoGold Resources
GoGold Resources (TSX: GGD) is a Canadian-based silver and gold producer focused on operating, developing, exploring and acquiring high quality projects in Mexico. The Company operates the Parral Tailings mine in the state of Chihuahua and has the Los Ricos South and Los Ricos North exploration projects in the state of Jalisco. Headquartered in Halifax, NS, GoGold is building a portfolio of low cost, high margin projects. For more information visit gogoldresources.com.
CAUTIONARY STATEMENT:
The securities described herein have not been, and will not be, registered under the United States Securities Act of 1933, as amended (the "U.S. Securities Act"), or any state securities laws, and may not be offered or sold within the United States or to, or for the benefit of, U.S. persons (as defined in Regulation S under the U.S. Securities Act) except in compliance with the registration requirements of the U.S. Securities Act and applicable state securities laws or pursuant to exemptions therefrom. This release does not constitute an offer to sell or a solicitation of an offer to buy of any of GoGold's securities in the United States.
This news release may contain "forward-looking information" as defined in applicable Canadian securities legislation. All statements other than statements of historical fact, included in this release, including, without limitation, statements regarding the Parral tailings project, the Los Ricos project, future operating margins, future production and processing, and future plans and objectives of GoGold, constitute forward looking information that involve various risks and uncertainties. Forward-looking information is based on a number of factors and assumptions which have been used to develop such information but which may prove to be incorrect, including, but not limited to, assumptions in connection with the continuance of GoGold and its subsidiaries as a going concern, general economic and market conditions, mineral prices, the accuracy of mineral resource estimates, and the performance of the Parral project There can be no assurance that such information will prove to be accurate and actual results and future events could differ materially from those anticipated in such forward-looking information.
Important factors that could cause actual results to differ materially from GoGold's expectations include exploration and development risks associated with the GoGold's projects, the failure to establish estimated mineral resources or mineral reserves, volatility of commodity prices, variations of recovery rates, the effects of the global COVID-19 pandemic, and global economic conditions. For additional information with respect to risk factors applicable to GoGold, reference should be made to GoGold's continuous disclosure materials filed from time to time with securities regulators, including, but not limited to, GoGold's Annual Information Form. The forward-looking information contained in this release is made as of the date of this release.
Cautionary non-GAAP Measures and Additional GAAP Measures
Note that for purposes of this section, GAAP refers to IFRS. The Company believes that investors use certain non-GAAP and additional GAAP measures as indicators to assess mining companies. They are intended to provide additional information and should not be considered in isolation or as a substitute for measures of performance prepared with GAAP. Non-GAAP and additional GAAP measures do not have a standardized meaning prescribed under IFRS and therefore may not be comparable to similar measures presented by other companies.
Additional GAAP measures that are presented on the face of the Company's consolidated statements of comprehensive income include "Operating income (loss)". These measures are intended to provide an indication of the Company's mine and operating performance. "Cash flow from operating activities before changes in non-cash working capital" is a non-GAAP performance measure that could provide an indication of the Company's ability to generate cash flows from operations, and is calculated by adding back the change in non-cash working capital to "Net cash used in operating activities" as presented on the Company's consolidated statements of cash flows. Per ounce measures are calculated by dividing the relevant mining and processing costs and total costs by the tonnes of ore processed in the period. "Cash costs per ounce" and "all-in sustaining costs per ounce" as used in this analysis are non-GAAP terms typically used by mining companies to assess the level of gross margin available to the Company by subtracting these costs from the unit price realized during the period. These non-GAAP terms are also used to assess the ability of a mining company to generate cash flow from operations. There may be some variation in the method of computation of these metrics as determined by the Company compared with other mining companies. In this context, "cash costs per ounce" reflects the cash operating costs allocated from in-process and dore inventory associated with ounces of silver and gold sold in the period. "Cash costs per ounce" may vary from one period to another due to operating efficiencies, grade of material processed and silver/gold recovery rates in the period. "All-in sustaining costs per ounce" include total cash costs, exploration, corporate and administrative, share based compensation and sustaining capital costs. For a reconciliation of non-GAAP and GAAP measures, please refer to the Management Discussion and Analysis dated August 11, 2021, for the quarter ended June 30, 2021, as presented on SEDAR.

View original content:https://www.prnewswire.com/news-releases/parral-generates-record-7-5m-usd-of-free-cash-flow-for-quarter-ending-june-30–2021–301354259.html
SOURCE GoGold Resources Inc.

View original content: http://www.newswire.ca/en/releases/archive/August2021/12/c7293.html
DENVER, CO / ACCESSWIRE / August 12, 2021 / Gold Resource Corporation (NYSE American:GORO) (the "Company", "We", "Our" or "GRC") considers the health and safety of its workers and host communities a fundamental priority of the Company's operations. With pandemic wellness protocols in place, the Company has mined continuously since the Mexican government allowed the Company's operations to reopen in May of 2020.
Like many other countries, the highly contagious COVID-19 delta variant has had a devastating impact on Mexico. In the last three weeks, the Don David Gold Mine has seen 77 cases confirmed with testing. Most of the people who have fallen ill are experiencing flu-like symptoms, but some were asymptomatic. To combat the virus, we have extended our screening protocols and medical assistance, where appropriate, to our local communities and to regions where our employees may travel on rotation. Currently 30% of our work force or 292 individuals are fully vaccinated, and we expect that another 200 will be vaccinated in the next week. Vaccination efforts are being led by local community government and current expectations are that all individuals in the local communities and in our workforce who wish to be vaccinated will be vaccinated by the end of September.
"We are grateful that the local communities of San José de Gracia and San Pedro Totolápam, and our employees are working together implementing COVID-19 safety protocols. Prevention is the best defense while vaccination for COVID-19 progresses in Mexico," said Alberto Reyes, Chief Operating Officer of Gold Resource Corporation. "This is a troubling time with the surge in the delta variant of COVID-19. Reducing the risk of transmission and protecting the health and wellness of our workers and surrounding communities is our top priority. We have in place a comprehensive COVID-19 safety plan to provide a safe work environment and to minimize the infection and transmission risk of COVID-19 to employees, contractors, and local communities."
While we have in place the more stringent transportation and workplace protocols, we will vary our mining and processing rates, as appropriate, while we continue our exploration drilling as normal. Accordingly, at this time we caution market participants that while we have not withdrawn our guidance for 2021, we expect that the safety protocols may constrain our operations until mid to late September. We will continue to monitor the situation, and should the need arise, we will report back to the market promptly.
Cautionary Statements:
This press release contains forward-looking statements that involve risks and uncertainties. The statements contained in this press release that are not purely historical are forward-looking statements within the meaning of Section 27A of the Securities Act and Section 21E of the Exchange Act. When used in this press release, the words "plan", "target", "anticipate," "believe," "estimate," "intend" and "expect" and similar expressions are intended to identify such forward-looking statements. Such forward-looking statements include, without limitation, the statements regarding Gold Resource Corporation's strategy, future plans for production, future expenses and costs, future liquidity and capital resources, and estimates of mineralized material. All forward- looking statements in this press release are based upon information available to Gold Resource Corporation on the date of this press release, and the company assumes no obligation to update any such forward-looking statements. Forward looking statements involve a number of risks and uncertainties, and there can be no assurance that such statements will prove to be accurate. The Company's actual results could differ materially from those discussed in this press release. In particular, the scope, duration, and impact of the COVID-19 pandemic on mining operations, Company employees, and supply chains as well as the scope, duration and impact of government action aimed at mitigating the pandemic may cause the actual results and future events to differ materially from those expressed or implied by such forward-looking information. Also, there can be no assurance that production will continue at any specific rate. Factors that could cause or contribute to such differences include, but are not limitedto, those discussed in the Company's 10-Q filed with the SEC.
For further information please contact:
Ann Wilkinson
Vice President, Investor Relations and Corporate Affairs
Ann.Wilkinson@GRC-USA.com
www.goldresourcecorp.com
SOURCE: Gold Resource Corporation
View source version on accesswire.com:
https://www.accesswire.com/659605/Gold-Resource-Corporation-Reports-Spike-in-COVID-19-Cases-at-Don-David-Gold-Mine-Reinstitutes-Stricter-Protocols-Regarding-Transportation-Operations-And-the-Frequency-of-Wellness-Checks
VANCOUVER, BC, Aug. 11, 2021 /CNW/ – Trading resumes in:
Company: Sego Resources Inc.
TSX-Venture Symbol: SGZ
All Issues: Yes
Resumption (ET): 12:15 PM
IIROC can make a decision to impose a temporary suspension (halt) of trading in a security of a publicly-listed company. Trading halts are implemented to ensure a fair and orderly market. IIROC is the national self-regulatory organization which oversees all investment dealers and trading activity on debt and equity marketplaces in Canada.
SOURCE Investment Industry Regulatory Organization of Canada (IIROC) – Halts/Resumptions
“Cision”
Cision
View original content: http://www.newswire.ca/en/releases/archive/August2021/11/c2876.html
Vancouver, British Columbia–(Newsfile Corp. – August 11, 2021) – Southern Silver Exploration Corp. (TSXV: SSV) (OTCQX: SSVFF) ("Southern Silver") reported today on further assay results from the Mina La Bocona target on the Cerro Las Minitas project, Durango, Mexico. These latest drill results are from the Huizache chimney, an area located approximately 80 metres to the northwest of the La Bocona and Mina Pina shafts along the eastern side of the Cerro and within the larger Mina La Bocona Target area.
The newly released polymetallic sulphide intercepts from the Mina La Bocona target area include:
-
a 2.1 metre interval (1.4 metre est. TT.) averaging 383g/t Ag, 7.9% Pb and 10.2% Zn (1051g/t AgEq) within a 16.3 metre interval (10.8 metre est. TT.) averaging 102g/t Ag, 1.8% Pb and 1.7% Zn (234g/t AgEq) from drill hole 21CLM-164; and
-
a 0.7 metre interval (0.6 metre est. TT.) averaging 543g/t Ag, 0.4g/t Au, 12.7% Pb and 1.0% Zn (1011g/t AgEq) within a 1.7 metre interval (1.3 metre est. TT.) averaging 263g/t Ag, 0.2g/t Au, 6.0% Pb and 1.2% Zn (513g/t AgEq) from drill hole 21CLM-167
These current results tested down dip of previously reported shallow oxide intercepts from 21CLM-158 (0.5m of 612g/t AgEq; see NR-12-21) and 21CLM-161 (0.9m of 588g/t AgEq; see NR-12-21) and has now extended the mineralized zone on the northwest flank of the Mina La Bocona target to depths of up to 250 metres below surface and remains partially open to depth.
Drilling also identified a semi-massive to massive lens of sphalerite-rich mineralization an additional 100 metres to the northwest of the Mina La Bocona target along the eastern side of the Cerro that also remains open to depth. Assays returned:
-
a 0.8 metre interval (0 .7 metre est. TT.) averaging 14g/t Ag, 0.4% Cu and 21.0% Zn (844g/t AgEq) within a 2.8 metre interval (2.5 metre est. TT.) averaging 7g/t Ag, 0.4% Cu, and 10.6% Zn (443g/t AgEq) from drill hole 21CLM-170
Exploration on the property continues with one drill. One hole remains to be tested on the east side of the Cerro as part of the current drill program which will then transition to "greenfields" targeting on the El Sol claim over the coming weeks. The El Sol concession, is located 2km to the northwest of the Mina La Bocona target area and covers the northerly projection of previously identified mineralization in the Blind Zone deposits and a second area of artisanal workings. The concession was re-acquired and prospected by Southern in 2020 and returned anomalous values from several strongly oxidized and silicified rocks including a dump sample CLM-316 which assayed 0.67g/t Au, 559g/t Ag, 3.3% Pb and 4.3% Zn.
The current drill program has now completed 56 core holes totaling 22,360 metres since drilling recommenced in September 2020. Assay results from five drill holes are pending and are anticipated over the coming weeks.
Southern Silver has now tested over 850 metres of strike length along the east side of the Cerro to depths of up to 500 metres, primarily in the South Skarn and Mina La Bocona target areas. Three bonanza grade mineralized zones have been identified as well as shallow intercepts of high-grade mineralization to the northwest of the Bocona target, results of which will be incorporated into an upcoming mineral resource update on the project.
The CLM Project remains one of the largest undeveloped silver-lead-zinc projects in the World and is wholly owned, unburdened by royalties, fully financed and fully permitted.

Figure 1: Plan Map of the Area of the Cerro showing the distribution of the CLM deposits and the location for new drill targeting, at the Mina La Bocona, South Skarn and Las Victorias targets.
To view an enhanced version of Figure 1, please visit:
https://orders.newsfilecorp.com/files/5344/92765_79016e0504432a8f_002full.jpg
Cerro Las Minitas Project
The Cerro Las Minitas project is an advanced exploration stage polymetallic Ag-Pb-Zn-Cu Skarn/CRD project located in southern Durango, Mexico.
The Cerro Las Minitas project as of May 9th, 2019 contains a Mineral Resource Estimate, at a 175g/t AgEq cut-off, of(1)
-
Indicated – 134Moz AgEq: 37.5Moz Ag, 40Mlb Cu, 303Mlb Pb and 897Mlb Zn
-
Inferred – 138Moz AgEq: 45.7Moz Ag, 76Mlb Cu, 253Mlb Pb and 796Mlb Zn
A total of 150 drill holes for 67,375metres has been completed on the CLM Project as of the end of 2020 with exploration expenditures of approximately US$27.0 million equating to exploration discovery costs of approximately C$0.09 per AgEq ounce.
Table 1: Select Assay Intervals from Mina La Bocona and South Skarn targets:
|
Hole # |
From |
To |
Interval |
Est. Tr. Thck. (m) |
Ag |
Au |
Cu |
Pb |
Zn |
AgEq |
ZnEq |
Notes |
|
New Huizache Assay Results |
||||||||||||
|
21CLM-162 |
128.7 |
129.9 |
1.2 |
0.9 |
139 |
0.2 |
0.0 |
3.2 |
0.4 |
273 |
6.9 |
|
|
and |
154.5 |
156.4 |
1.9 |
1.5 |
602 |
0.1 |
2.0 |
0.7 |
0.3 |
864 |
21.9 |
|
|
and |
210.6 |
211.7 |
1.1 |
0.9 |
75 |
0.1 |
0.1 |
3.5 |
0.5 |
215 |
5.4 |
|
|
21CLM-164 |
285.1 |
286.5 |
1.3 |
0.9 |
414 |
0.1 |
0.2 |
8.2 |
3.6 |
830 |
21.1 |
|
|
and |
293.7 |
309.9 |
16.3 |
10.8 |
102 |
0.0 |
0.1 |
1.8 |
1.7 |
234 |
5.9 |
|
|
inc. |
297.5 |
299.7 |
2.1 |
1.4 |
383 |
0.1 |
0.1 |
7.9 |
10.2 |
1051 |
26.7 |
|
|
21CLM-165 |
143.0 |
143.7 |
0.7 |
0.4 |
149 |
0.2 |
0.0 |
3.9 |
2.9 |
406 |
10.3 |
Hole lost before target |
|
21CLM-166 |
279.2 |
280.4 |
1.2 |
0.8 |
96 |
0.1 |
0.1 |
1.1 |
0.2 |
157 |
4.0 |
|
|
21CLM-167 |
239.4 |
241.0 |
1.7 |
1.3 |
263 |
0.2 |
0.0 |
6.0 |
1.2 |
513 |
13.0 |
|
|
inc. |
240.3 |
241.0 |
0.7 |
0.6 |
543 |
0.4 |
0.0 |
12.7 |
1.0 |
1011 |
25.6 |
|
|
Bocona Extension Assay Results |
||||||||||||
|
21CLM-168 |
326.5 |
330.9 |
4.4 |
3.7 |
69 |
0.0 |
0.1 |
0.7 |
0.2 |
112 |
2.8 |
|
|
inc. |
329.8 |
330.9 |
1.1 |
1.0 |
173 |
0.0 |
0.1 |
0.5 |
0.2 |
209 |
5.3 |
|
|
21CLM-170 |
328.7 |
331.4 |
2.8 |
2.5 |
7 |
0.0 |
0.1 |
0.0 |
10.6 |
443 |
11.2 |
|
|
inc. |
329.9 |
330.7 |
0.8 |
0.7 |
14 |
0.0 |
0.4 |
0.0 |
21.0 |
884 |
22.4 |
|
Analyzed by FA/AA for gold and ICP-AES by ALS Laboratories, North Vancouver, BC. Silver (>100ppm), copper, lead and zinc (>1%) overlimits assayed by ore grade ICP analysis, High silver overlimits (>1500g/t Ag) and gold overlimits (>10g/t Au) re-assayed with FA-Grav. High Pb (>20%) and Zn (>30%) overlimits assayed by titration. AgEq and ZnEq were calculated using average metal prices of: US$20/oz silver, US$1650/oz gold, US$3.25/lbs copper and US$0.9/lbs lead and US$1.15/lbs zinc. AgEq and ZnEq calculations did not account for relative metallurgical recoveries of the metals. Ore-grade composites are calculated using a 80g/t AgEq cut-off in sulphide and 0.5g/t AuEq in the oxide gold zone Composites have <20% internal dilution, except where noted; anomalous intercepts are calculated using a 10g/t AgEq cut-off.
About Southern Silver Exploration Corp.
Southern Silver Exploration Corp. is an exploration and development company with a focus on the discovery of world-class mineral deposits. Our specific emphasis is the 100% owned Cerro Las Minitas silver-lead-zinc project located in the heart of Mexico's Faja de Plata, which hosts multiple world-class mineral deposits such as Penasquito, Los Gatos, San Martin, Naica and Pitarrilla. We have assembled a team of highly experienced technical, operational and transactional professionals to support our exploration efforts in developing the Cerro Las Minitas project into a premier, high-grade, silver-lead-zinc mine. The Company engages in the acquisition, exploration and development either directly or through joint-venture relationships in mineral properties in major jurisdictions.
The Company property portfolio also includes the Oro porphyry copper-gold project located in southern New Mexico, USA, which includes patented land, State leases and BLM mineral claims totalling 22.3 sq. km. Targeting has been finalized and bonding pending for a 4,000m drill program, designed to test several copper-molybdenum porphyry and copper-gold skarn targets within a broad quartz-sericite-pyrite alteration zone, interpreted to overlie an unexposed porphyry centre. Drilling is expected to commence in Q4, 2021.
-
The 2019 Cerro Las Minitas Resource Estimate was prepared following CIM definitions for classification of Mineral Resources. Resources are constrained using mainly geological constraints and approximate 10g/t AgEq grade shells. The block models are comprised of an array of blocks measuring 10m x 2m x 10m, with grades for Au, Ag, Cu, Pb, Zn values interpolated using ID3 weighting. Silver and zinc equivalent values were subsequently calculated from the interpolated block grades. The model is identified at a 175g/t AgEq cut-off, with an indicated resource of 11,102,000 tonnes averaging 105g/t Ag, 0.10g/t Au, 1.2% Pb, 3.7% Zn and 0.16% Cu and an inferred resource of 12,844,000 tonnes averaging 111g/t Ag, 0.07g/t Au, 0.9% Pb, 2.8% Zn and 0.27% Cu. AgEq cut-off values were calculated using average long-term prices of $16.6/oz. silver, $1,275/oz. gold, $2.75/lb. copper, $1.0/lb. lead and $1.25/lb. zinc. Metal recoveries for the Blind, El Sol and Las Victorias deposits of 91% silver, 25% gold, 92% lead, 82% zinc and 80% copper and for the Skarn Front deposit of 85% silver, 18% gold, 89% lead, 92% zinc and 84% copper were used to define the cut-off grades. Base case cut-off grade assumed $75/tonne operating, smelting and sustaining costs. All prices are stated in $USD. Silver Equivalents were calculated from the interpolated block values using relative recoveries and prices between the component metals and silver to determine a final AgEq value. The same methodology was used to calculate the ZnEq value. Mineral resources are not mineral reserves until they have demonstrated economic viability. Mineral resource estimates do not account for a resource's mineability, selectivity, mining loss, or dilution. The current Resource Estimate was prepared by Garth Kirkham, P.Geo. of Kirkham Geosciences Ltd. who is the Independent Qualified Person responsible for presentation and review of the Mineral Resource Estimate. All figures are rounded to reflect the relative accuracy of the estimate and therefore numbers may not appear to add precisely.
Robert Macdonald, MSc. P.Geo, is a Qualified Person as defined by National Instrument 43-101 and supervised directly the collection of the data from the CLM Project that is reported in this disclosure and is responsible for the presentation of the technical information in this disclosure.
On behalf of the Board of Directors
"Lawrence Page"
Lawrence Page, Q.C.
President & Director, Southern Silver Exploration Corp.
For further information, please visit Southern Silver's website at https://www.southernsilverexploration.com or contact us at 604.641.2759 or by email at ir@mnxltd.com.
Neither TSX Venture Exchange nor its Regulation Services Provider (as that term is defined in the policies of the TSX Venture Exchange) accepts responsibility for the adequacy or accuracy of this release.
This news release contains forward-looking statements. Forward-looking statements address future events and conditions and therefore involve inherent risks and uncertainties. Actual results may differ materially from those currently anticipated in such statements. Factors that could cause actual results to differ materially from those in forward looking statements include the timing and receipt of government and regulatory approvals, and continued availability of capital and financing and general economic, market or business conditions. Southern Silver Exploration Corp. does not assume any obligation to update or revise its forward-looking statements, whether as a result of new information, future events or otherwise, except to the extent required by applicable law.

To view the source version of this press release, please visit https://www.newsfilecorp.com/release/92765
VANCOUVER, BC / ACCESSWIRE / August 11, 2021 / Pampa Metals Corp. ("Pampa Metals" or the "Company") (CSE:PM)(FSE:FIRA)(OTCQX:PMMCF) is pleased to announce that further to the news release of July 28, 2021, where the Company announced Austral Gold Ltd. ("Austral") (TSX-V:AGLD)(ASX:AGD), a company with a producing gold mine complex in Chile, signed an option to acquire up to an 80% joint venture interest in two of Pampa Metals' projects, Austral has initiated exploration activities at the Morros Blancos project. In addition, the closing conditions pursuant to the Option Agreement between the Company and Austral have been met.
Julian Bavin, CEO of Pampa Metals, commented: "We are pleased to see the initiation of exploration activities at our Morros Blancos project, one of two projects recently optioned by Austral. Austral brings great expertise in gold and silver exploration and is currently operating the active Amancaya gold-silver mine located immediately to the west of Morros Blancos in adjacent mineral concessions. We look forward to seeing Austral's exploration program develop."
Austral was recently granted an option to acquire up to an 80% joint venture interest in stages in Pampa Metals' Morros Blancos and Cerro Blanco properties in exchange for certain cash payments, exploration expenditures and the return to treasury of 2,963,132 shares of Pampa Metals held by Austral's wholly owned subsidiary, Revelo Resources Corp. In addition, Austral is required to complete a bankable feasibility study to earn the 80% interest in either or both properties. If the studies indicate that copper is the most valuable commodity instead of gold and silver, the Company can earn back an 80% interest under the same terms and conditions as those for Austral.
About Morros Blancos
The Morros Blancos (7,300 Ha) project is prospective for high-sulphidation epithermal gold-silver (+/- copper) and porphyry copper (+/- gold +/-moly) deposits and is located in the heart of the Paleocene Mineral Belt in northern Chile. The Paleocene Belt is host to important gold-silver and copper deposits and mines, and the project is located along a prolific segment of the prospective belt, along trend from important precious metals mines and projects, and adjacent and immediately east of Austral's Amancaya gold-silver mine. Access to the project is easy, being located less than 30 Km from the Pan American Highway, and altitudes are moderate. The project lies within potential operational distance of Austral's Guanaco processing plant, allowing for more flexible and potentially cheaper development and operation.
Technical information in this news release has been approved by Mario Orrego G., geologist and a registered member of the Chilean Mining Commission and a qualified person as defined by National Instrument 43-101. Mr. Orrego is a consultant to the company.
ABOUT PAMPA METALSPampa Metals is a Canadian company listed on the Canadian Stock Exchange (CSE: PM) as well as the Frankfurt (FSE: FIRA) and OTC (OTCQX: PMMCF) exchanges. Pampa Metals owns a highly prospective 59,000-hectare portfolio of eight projects for copper and gold located along proven mineral belts in Chile, one of the world's top mining jurisdictions. The Company has a vision to create value for shareholders and all other stakeholders by making a major copper discovery along the prime mineral belts of Chile, using the best geological and technological methods. For more information, please visit Pampa Metals' website www.pampametals.com .
ON BEHALF OF THE BOARD
Julian Bavin | Chief Executive Officer
INVESTOR CONTACT
Ioannis (Yannis) Tsitos | Director
investors@pampametals.com
www.pampametals.com
Neither the CSE nor the Investment Industry Regulatory Organization of Canada accepts responsibility for the adequacy or accuracy of this release.
Reference to existing or historic mines and projects, and the overall prospectivity of Chile, is for reference purposes only. The reader is cautioned that there is no evidence to date that comparable mineral resources could be found on Pampa Metals' properties.
FORWARD-LOOKING STATEMENTS
This news release contains certain statements that may be deemed 'forward-looking statements'. All statements in this release, other than statements of historical fact, that address events or developments that Pampa Metals expects to occur, are forward-looking statements. Forward-looking statements are statements that are not historical facts and are generally, but not always, identified by the words 'expects', 'plans', 'anticipates', 'believes', 'intends', 'estimates', 'projects', 'potential', 'indicate' and similar expressions, or that events or conditions 'will', 'would', 'may', 'could' or 'should' occur. Although Pampa Metals believes the expectations expressed in such forward-looking statements are based on reasonable assumptions, such statements are not guaranteeing of future performance and actual results may differ materially from those in forward-looking statements.
SOURCE: Pampa Metals Corp.
View source version on accesswire.com:
https://www.accesswire.com/659257/Pampa-Metals-Partner–Chilean-Gold-Producer-Austral-Gold-Begins-Exploration-at-Pampa-Metals-Morros-Blancos-Project
Vancouver, British Columbia–(Newsfile Corp. – August 11, 2021) – Sego Resources Inc. (TSXV: SGZ) ("Sego" or "the Company") is delighted to announce results from four additional diamond drill holes in the Southern Gold Zone of the Miner Mountain Porphyry Copper-Gold project near Princeton, BC. The Southern Gold Zone is an intrusion disseminated hosted gold zone discovered during the Company's 2020 field program (See NR July 7, 2020) and first drilled during April 2021 (See News Release May 27, 2021).
Table 1. Significant gold results in diamond drill holes collared in the Southern Gold Zone
|
Drill Hole |
From (m) |
To (m) |
Interval (m) |
Au (g/t) |
|
DDH 48 |
139.5 |
152.23 |
12.73 |
0.18 |
|
and |
172.00 |
174.00 |
2 |
0.82 |
|
DDH 49 |
19.00 |
84.12 |
65.12 |
0.60 |
|
Including |
28.76 |
54.45 |
25.69 |
0.95 |
|
DDH 50 |
11.28 |
105.48 |
94.20 |
0.86 |
|
Including |
38.3 |
56.90 |
18.6 |
1.73 |
|
Including |
72.35 |
97.20 |
24.85 |
1.05 |
DDH49 and DDH50 were collared 52 m and 46 m to the east and west, respectively, from the DDH46 and 47 section on the same fence as DDH47. Holes were oriented -50 at 160 azimuth similar to DDH46 and DDH47 (see Figure). Both holes intersected significant gold mineralization to the bottom of the holes and both warrant deepening below 84.12 m in DDH49 and 104.48 m in DDH50. DDH48 was collared 72 m to the northwest located on section DDH48-47 and intersected 0.18 g/t Au between 141 to152 m and 0.85 g/t gold (g/t Au) between 172 to 174 m. The results indicate a close proximity to deeper portions to the Southern Gold mineralization. DDH51 was collared 28 m north-northwest of DDH48, and was stopped at 108.5 m due to the fire ban and did not intersect any elevated gold results. For a detailed description of the geology and alteration of the Southern Gold Zone please refer to the Sego Resources Inc. May 27th News Release.
Recent tests of drill core from DDH46 and DDH47 indicate fine-grained moderate to strong amounts of K-feldspar in many of the mineralized sections are associated with <1 to 2% disseminated pyrite. Elsewhere chlorite-sericite assemblages contain similar pyrite contents and gold mineralization and both assemblages alter mainly intrusions. This relatively new type of bulk mineable target has few other indicators to guide explorers and is a challenge to shut down drill holes.
Future exploration will include drill testing to the east and west trend of the Southern Gold Zone and the region deep below the current mineralized zone trend. The magnetic high anomaly below overburden that extends south of the Southern Gold Zone would be evaluated as the programs progress.
BENCH SCALE METALLURGICAL TESTING RECOVERS 95.8% OF THE GOLD FROM THE SOUTHERN GOLD ZONE
An initial bench scale 32.9 kg representative sample from DDH46 and DDH47 core (April drill program) was submitted to Met-Solve Laboratories Inc. to investigate recovery gravity and leaching CN tests. The work concluded 9.8% of the gold reports to gravity concentration and 59.3% recovered in 1 hour and 72.6 % after 3 hours using a cyanide leaching process. An impressive 95.8% of the gold recovered test the composite sample with little further testing. The entire "Sego Resources Inc. Metallurgical Testwork Report" can be found at www.segoresources.com
CEO J. Paul Stevenson comments, "The July program drill results continued to extend the strike length of the Southern Gold Zone to add the potential of bulk tonnage gold mineralization. The Southern Gold Zone is most likely a distal expression of blind porphyry copper-gold mineralization within a larger porphyry copper-gold system at the Miner Mountain Project. Our next drill program will include deeper drilling of the holes that were terminated in mineralization, and expand the mineralized zone to the east and west. The remarkable bench scale metallurgical testwork indicates the potential for a very low cost bulk mineable gold producer."
maps are available in news release at www.segoresources.com
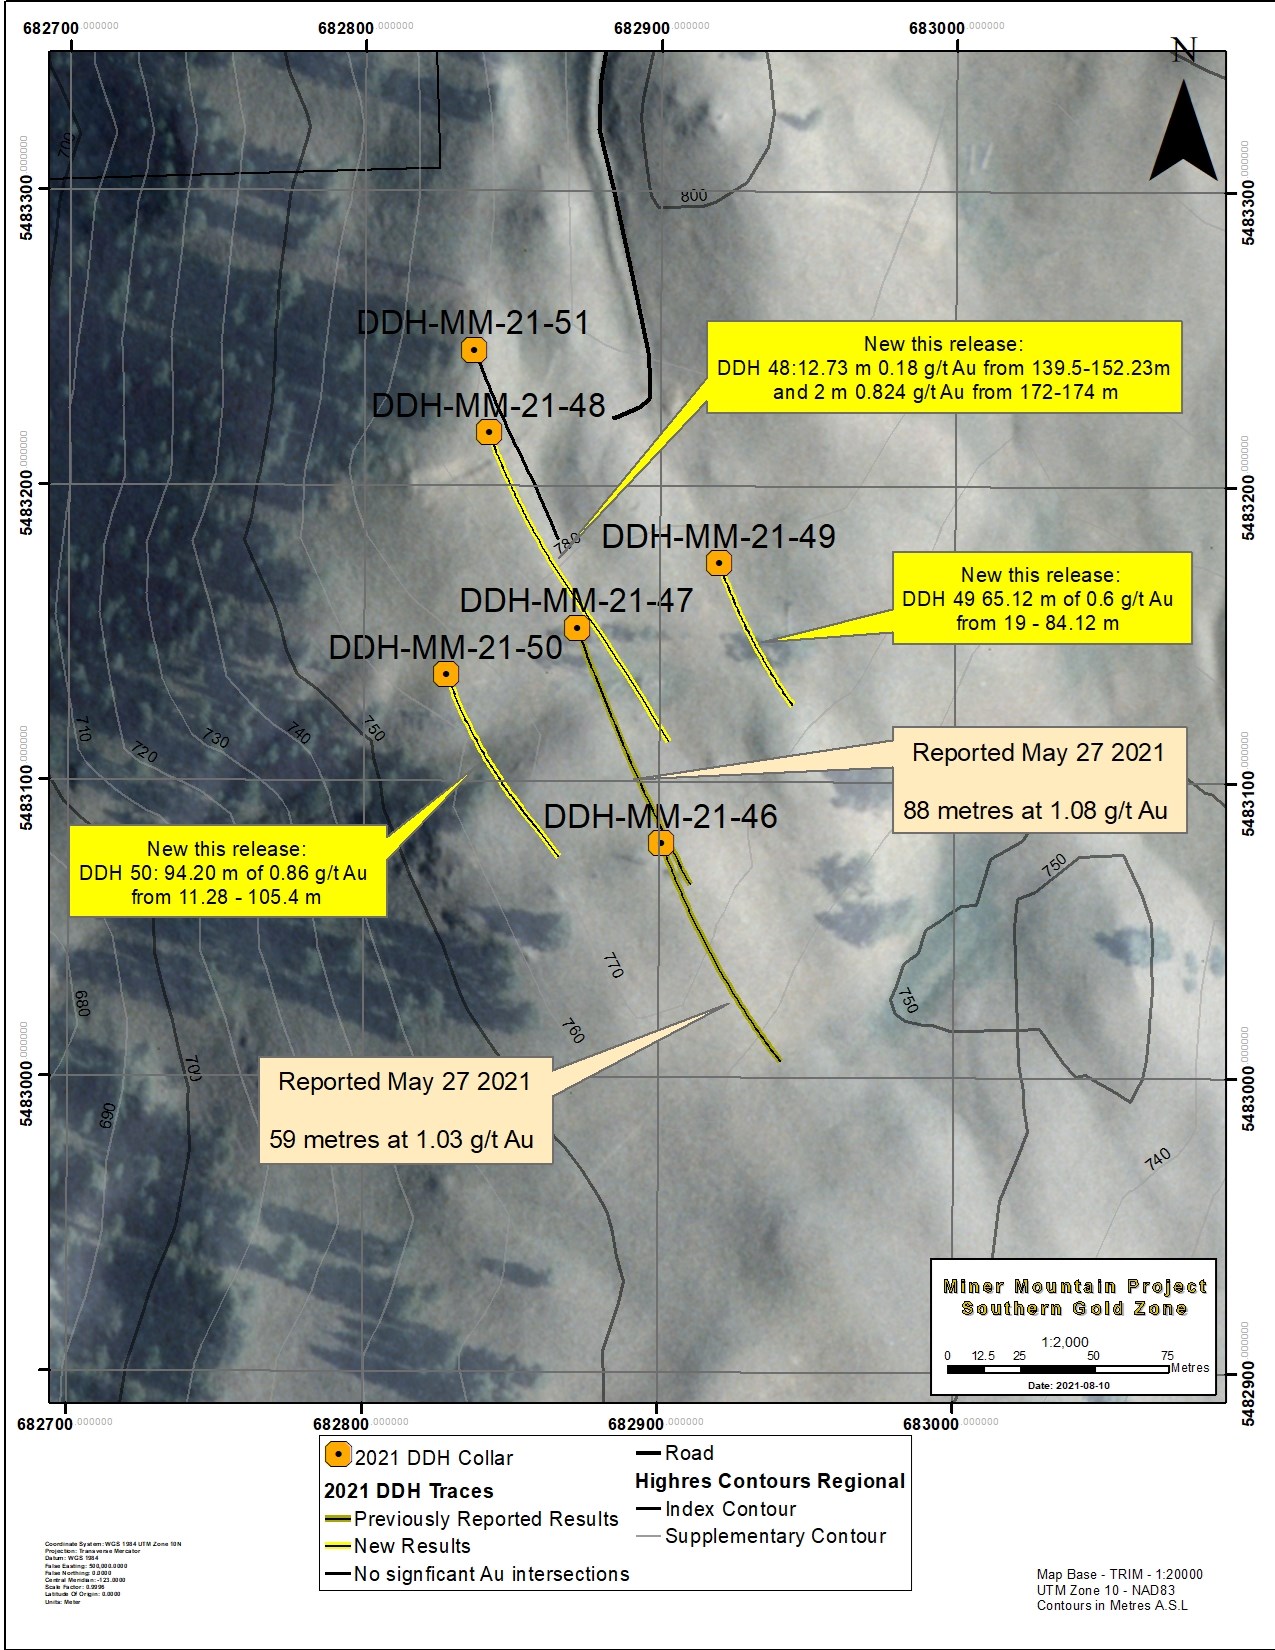
Figure 1- Plan View of Drilling To Date
To view an enhanced version of this graphic, please visit:
https://orders.newsfilecorp.com/files/1056/92823_0dee0677c42ed86e_002full.jpg
Quality Assurance / Quality Control
Drill core was shipped to MSALABS in Langley, BC for sample preparation and analysis. MSALABS is ISO/IEC 17025 and ISO 9001 certified. Samples were analyzed using an aqua regia digestion with an ICP finish.
Control samples comprising certified reference samples and blank samples were systematically inserted into the sample stream and analyzed as part of the Company's quality assurance / quality control protocol.
This news release was reviewed and approved by Ron Britten, Ph.D., P.Eng., a Qualified Person under NI 43-101.
About the Project:
Sego is 100% owner of the Miner Mountain project, an alkalic copper-gold porphyry exploration project near Princeton, British Columbia. The Miner Mountain Project combines alkalic porphyry copper-gold mineralization in the Cuba and other zones and the unusual gold mineralization in the Southern Gold Zone which may be distal to an alkalic copper-gold porphyry. The property is 2,056 hectares in size and is located 15 kilometres north of the Copper Mountain Mine operated by Copper Mountain Mining Corporation and Mitsubishi Copper. Sego has a Memorandum of Understanding with the Upper Similkameen Indian Band on whose Traditional Territory the Miner Mountain project is situated. Sego has received an Award of Excellence for its reclamation work at Miner Mountain.
For further information please contact:
J. Paul Stevenson, CEO (604) 682-2933
ceo@segoresources.com
Neither the TSX Venture Exchange nor its Regulation Services Provider (as that term is defined in the policies of the TSX Venture Exchange) accepts responsibility for the adequacy or accuracy of this release. No regulatory authority has approved or disapproved the information contained in this news release.
This release includes certain statements that may be deemed "forward-looking statements". All statements in this release, other than statement of historical facts that address future production, reserve potential, exploration drilling, exploitation activities and events or developments that the Company expects re forward-looking statements. Although the Company believes the expectations expressed in such forward-looking statements are based on reasonable assumptions, statements are not guarantees of future performance and actual results or developments may differ materially from the forward-looking statements. Factors that could cause actual results to differ materially from those in forward-looking statements include market prices, exploitation and exploration successes, continued availability of capital and financing, general economic, market or business conditions. Investors are cautioned that any such statements are not guarantees of future performance and those actual results or developments may differ materially from those projected in the forward-looking statements.

To view the source version of this press release, please visit https://www.newsfilecorp.com/release/92823
Asset bubbles may now be too big to burst, creating a situation that Central Banks around the world might be unable to control. If it all comes crashing down, we think there’s only one place to be …
Gold.
The precious metal could rise as high as $3,000 to $5,000 per ounce in the next 3-5 years.
That’s according to the same fund manager who predicted the 2016 gold rally.
As cited by Bloomberg, Diego Parrilla, manager of the $250-million Quadriga Igneo fund that called the last gold rally, massive long-term damage has been caused by wildly loose monetary and fiscal policies, and everyone is underestimating the huge risk as central banks unwind stimulus, with assets soaring amid artificially low interest rates.
“Central bank money printing isn’t really solving problems, it’s delaying the problem," Parrilla told Bloomberg. “Gold will benefit purely from being a physical asset that you cannot print."
But the rally may start even sooner …
Goldman Sachs is expecting gold prices to break out of their tight trading range this year, with inflation worries stoking demand. Goldman has a $2,300 price target on gold. That’s a 22% rally from current levels.
That’s what is said to happen when you print money like mad. Stocks and assets rise dramatically … but without any link to true fundamentals.
They may get a painful reality check. And we think gold will emerge as the big winner.
If that all comes crashing down, a junior mining stock like Starr Peak Mining Ltd. (TSX:STE.V; OTC:STRPF), which has recently doubled its drilling program amid a potential gold rush in Quebec after it found indications of gold–and more.
Gold+ … A Basket of Base Metals Make This One Even More Attractive
In this atmosphere, it’s hard to imagine much that is better than gold. But there may be something: It’s a Volcanogenic Massive Sulphide, or VMS, deposit–a basket of precious and base metals–many of which are part of today’s major commodities surge.
Zinc is priced near multiple-year highs, despite Chinese attempts to cool the situation down …
Silver prices are set to rally–again …
Copper prices have been on a run, with record highs, with only a recent China slowdown managing to pump the brakes a bit.
And of course, gold.
Add all of this up and it’s clear why VMS deposits could make a junior mining company even more valuable. They aren’t just wonderfully diverse, but they also give miners long-term production potential.
And they are exactly what the major miners are looking for, but rarely find.
Why? If you take Australia’s Kidd Mine–a famous VMS deposit–and look at those numbers, it becomes clear why these are the number one plays in the discovery path: Since 1966, the Kidd Mine has produced 9 million tons of zinc, over 3.4 million tons of copper, and 12,000 tons of silver.
That’s $27 billion in zinc at today’s prices, $32 billion in copper and $6.6 billion in silver.

So, not only is Quebec one of the most promising venues in the world for potential VMS deposits (not to mention gold, alone) …
But Starr Peak (TSX:STE.V; OTC:STRPF) has discovered an indication of just that. And the company reports it only took two 2 drills to find it.
Maiden Drills Surprised Investors
Starr Peak is an early stage exploration play. Some investors were fairly confident going into this one because they had been watching Amex Exploration, which made a high-grade gold discovery in 2019, right next to the past-producing Normetal Mine.
Now, the Normetal Mine has historically produced ~10.1 million tonnes of 2.15% copper, 5.12% zinc, 0.549g/t of gold and 45.25 g/t of silver.
So, when Starr Peak stepped in and acquired the land adjacent to Amex’s … and then bought the Normetal Mine itself (along with a string of other acquisitions), it started to attract attention–not the least from some Amex founders and shareholders themselves, who may have jumped on board for a hoped-for repeat success.
Starr Peak started drilling in January this year at its NewMetal property.
In March, it released its first results, showing large intervals of high-grade sulfide mineralization.
In May, they raised the stakes significantly, with drilling results indicating a potential VMS deposit, with rock containing multiple base metals, including zinc, copper, silver, and gold.
Then, in July, the best, highest-grade results yet, intersecting mineralization in every single hole:
-
Upper Zone (above 400m vertically)
o STE-21-09: 8.30 m of 10.09 % ZnEq including 2.70 m of 24.44 % ZnEq
o STE-21-17: 11.00 m of 9.01 % ZnEq including 3.00 m of 16.56 % ZnEq
o STE-21-27: 20.55 m of 7.04 % ZnEq including 5.10 m of 11.09 % ZnEq
o STE-21-29: 15.55 m of 9.94 % ZnEq including 10.10 m of 13.16 % ZnEq
-
Deep Zone (below 400m vertically)
o STE-21-14: 6.65 m of 18.07 % ZnEq which includes 1.05% Cu
o STE-21-21: 8.70 m of 8.82 % ZnEq including 2.15 m of 13.38 % ZnEq
And Now, Starr Peak Is Doubling DownAfter intersecting high-grade gold, silver, copper, and zinc on its first two drills at the past-producing mine it acquired earlier this year, the company looks to be fast-tracking expansion.
In May, it expanded drilling from 5,000 meters to 20,000 meters. In late July, when it announced its highest-grade result to date, Starr Peak said it would double drilling, to 40,000 meters.
When a company expands its drilling campaign to this effect, it tells us a lot about their level of confidence; and in this case, the VMS indications so far may be reason enough.
VMS deposits occur along tectonic plate boundaries, and finding one of these deposits puts Starr Peak in a position to become rich in metals that will continue to increase in value over time.
The most promising fact that comes from all of this is that as of July 2021, Starr Peaks has a 98% hit rate on its drill targets.
Recap: Results, Results, Results
Starr Peak (TSX:STE.V; OTC:STRPF) has proved to be clever with its decision to purchase the land adjacent to where Amex Exploration made their huge discovery. So far they have made some promising findings and based on their investments and efforts, they are quite confident with what they hope to continue to find. Starr Peak could prove to be a rather exciting opportunity, just based on the return that early Amex Exploration shareholders saw–without a VMS deposit.
-
Starr Peak now has over 2,800 hectares of highly prospective gold property, including a past-producing mine
-
It’s operating at a 98% hit rate for its drilling and has landed on high-grade indications of a potential VMS deposit, which position it to be very attractive to major miners combing wildly untapped Quebec for a juicy basket of metals
-
It’s just added significantly to its drilling for a second time from 40,000 meters to 60,000 meters based on its positive results so far, and it’s fully funded to keep drilling (with CAD$7.5 million in the bank as of July 22nd, 2021)
-
Amex earned early-in shareholders tons of returns, Starr Peak is setting themselves up for a potential repeat–or better.
This is an early-stage exploration play, but so far, it’s looking like one of the most exciting gold+ narratives we’ve seen in a very long time. It’s high-risk, high-reward, but with each drill hole, Starr Peak is further de-risking at a relatively fast pace.
Gold Majors Are Making Big Moves
AngloGold Ashanti (NYSE:AU) a South African mining company, is responsible for some of the most important discoveries in modern gold mining. They were one of the first companies to use laser technology to find gold deposits and create new mines. This innovative process helped them revolutionize the world's metals market with their laser-assisted exploration systems that can detect and map mineral reserves at depths up to 5 kilometers below ground level.
AngloGold is one of the most diverse and exciting miners on the planet, shielding itself from country-specific regulatory troubles or civil strife. It has operations on four continents including Africa, Australia, South America and North America. And though it has had some problems over the past decade, specifically in the early 2010s when the gold market took a major hit forcing many miners, including AngloGold to shutter operations, the mining giant has persevered.
Sociedad Química y Minera de Chile (NYSE:SQM) is a Chilean company that has been in operation for over 100 years and operates the most profitable commercial mine in the country. SQM produces more than 55 minerals, including lithium, iodine, potassium nitrate and copper. The company's headquarters are located on Avenida Kennedy, Santiago which was once an industrial area of the city with as many of 300 factories built there during its heyday between 1880 to 1930s.
Sociedad Química y Minera,signed in December a long-term supply deal with LG Energy Solution, which in turn supplies batteries to carmakers such as Tesla and GM. Under the deal, SQM will supply battery-grade lithium carbonate and lithium hydroxide to LG Energy Solution between 2021 and 2029. Sociedad Química y Minera sees the lithium industry growing at around 20 percent per year in the long term, supported by rising EV sales and emission reduction goals from China to the United States. And SQM doesn’t just produce lithium, either, making it well positioned in the resource boom.
Freeport-McMoRan’s (NYSE:FCX) roots date back to 1871, when it was founded as the Arizona Mining Company. In 1928, after experiencing a number of name changes and acquisitions, the company became Freeport-McMoRan Inc. While it’s primarily known for its copper production, it also produces gold. In fact, its Grasberg mine in Indonesia holds of the world's largest deposits of copper and gold. But that’s just scratching the surface of the miner’s global assets. Freeport-McMoRan also has extensive operations across the Americas, including mines in Arizona, Mexico and Peru.
The miner has long been recognized as a leader in safety practices and environmental stewardship with its sustainable development initiatives. The company is also committed to protecting human rights within their supply chain through an aggressive anti-corruption policy that includes detailed reporting on progress made towards these goals.
Kinross Gold Corp. (NYSE:KGC, TSX:K) is a Canadian-based gold mining company with operations in Africa, North America and Russia. They are one of the largest gold producers in the world and have been publicly traded on both the Toronto Stock Exchange (TSX) and American Stock Exchange (AMEX) since 2003. Their headquarters are located in Toronto, Ontario, Canada but they maintain offices all over the world including Johannesburg, South Africa; Denver, Colorado; Moscow, Russia; Kinshasa Democratic Republic of Congo; Lima Peru as well as Vancouver British Columbia Canada.
Similar to AngloGold and many of its other peers, Kinross has been enjoying dramatic improvements in profit margins and cash flow thanks to the surge in gold prices–and this trend appears set to continue with the gold outlook remaining decidedly bullish. With all factors remaining constant, Kinross should be able to realize high single-digit EPS expansion in the current year.
Kirkland Lake Gold (NYSE:KL, TSX:KL) is a Canadian gold mining company that has been in operation for over fifty years. They are one of the world's largest producers of gold, with their mines located throughout Canada. The company focuses on using sustainable practices to ensure they are leaving behind an environment that can be enjoyed by generations to come.
Recently, Kirkland and Newmont signed a $75 million exploration deal that could wind up being a game-changer for the industry. The two companies have agreed to split the cost 50/50 over five years with each company investing $15 million every year into joint projects between both companies for exploration purposes only – at this point it seems like a win. According to a joint press release in late 2020, “Newmont has acquired an option from Kirkland on the mining and mineral rights subject to a royalty payable by Newmont to Royal Gold, Inc. (the Holt Royalty) in exchange for a $75 million payment to Kirkland Lake Gold. Newmont can exercise the Option only in the event Kirkland intends to restart operations at the Holt Mine and process material subject to the Holt Royalty”
Barrick Gold (NYSE:GOLD, TSX:ABX) is a mining, exploration and production company. It has operations in Canada, the US and South America with mines in North America (Nevada), Chile and Argentina. Barrick also operates an open-pit mine at Pascua Lama on the border of Chile and Argentina. The Company's growth strategy includes expanding its Carlin Trend gold deposit in Nevada through selective acquisitions of key properties to provide meaningful leverage to rising gold prices as well as increased exploration for new deposits both within existing assets such as Porcupine District, Yukon Territory; San Dimas District, Sonora State, Mexico; Cortez Gold Project Colorado; El Peñón Mine Complex Santa Cruz Province Argentina) or outside them (Porco project).
Barrick is a top-tier gold miner with a global footprint. The Toronto-based gold giant operates in 13 countries, including Argentina, Canada, Chile, Côte d'Ivoire, Democratic Republic of the Congo, Dominican Republic, Mali, Papua New Guinea, Saudi Arabia, Tanzania, the United States and Zambia. Though Newmont surpassed Barrick as the largest gold miner when it acquired Goldcorp, Barrick is still a force to be reckoned with.
Following its acquisition of Goldcorp, Newmont (NYSE:NEM, TSX:NGT) has now become one of the world's largest gold producers. It is clear that this company knows how to produce and market gold on a large scale. The company also owns several mining operations in North America, Australia, and Asia Pacific regions. They have developed many different methods for extracting gold from mines all over the world including open pit mining techniques as well as underground extraction techniques.
In addition to producing and marketing their own mined resources, Newmont Goldcorp offers consulting services where they provide guidance on exploration projects around the globe. This company is an industry leader in exploration both domestically and abroad with offices located in 12 countries across 5 continents! Newmont works with their suppliers to find the best way to extract these materials from various sources including hard rock mines (rocks), soft rock mines (sedimentary rocks) or surface deposits of minerals like salt lakes or sand-based beaches.
Yamana Gold (NYSE:AUY, TSX:YRI), is a well-known gold mining company, with operations in Brazil and Argentina. The company has been producing gold for over 50 years and operates two mines: the Canadian Malartic mine in Canada and the Minera Florida mine in Chile. It also owns three other properties: Agua Rica, Tapada do Norte, and Caiena. One of Yamana's most notable mines is Chapada mine in Brazil which has been operational since 2011.
Earlier this year, Yamana signed a deal with industry giants Glencore and Goldcorp to develop and operate another Argentinian project, the Agua Rica. Initial analysis suggests the potential for a mine life in excess of 25 years at average annual production of approximately 236,000 tonnes (520 million pounds) of copper-equivalent metal, including the contributions of gold, molybdenum, and silver, for the first 10 years of operation.
Harmony Gold (NYSE:HMY) is a gold mining company that was founded in 1924. It has been listed on the Johannesburg Stock Exchange since 1928 and it incorporated in 1956. The company's headquarters are located in Johannesburg, South Africa. Harmony Gold operates mines in Australia, Ghana, Papua New Guinea and Tanzania as well as exploration properties across Africa including Namibia, Congo-Kinshasa and Mali.
Harmony is another South African miner which has exploded onto the radars of investors. In 2020, Harmony raised a whopping $200 million to partially fund a key acquisition of AngloGold’s assets in its home country. The deal is expected to more-than-triple its gold production to as much as 1.8 million ounces per year.
First Majestic Silver (NYSE:AG, TSX:FR) is an exploration and development company with operations in Mexico. First Majestic Silver has been developing the San Jose mine for over 20 years, and it is now one of the world's largest silver producing mines. With a team of experienced geologists, engineers, metallurgists, miners and other professionals, First Majestic Silver strives to develop high-quality resources that maximize shareholder value.
First Majestic Silver's goal is to provide shareholders with a secure investment in precious metals while maximizing profitability for each project. They are committed to enhancing economic growth by creating jobs through sustainable mining practices which will contribute positively to their local communities as well as society at large.
While its primary focus remains on silver mining, it does hold a number of gold assets, as well. Additionally, silver tends to follow gold’s lead when wider markets begin to look shaky. And with analysts sounding the alarms of a global economic slowdown, both metals are likely to regain popularity among investors.
Wheaton Precious Metals Corp. (NYSE:WPM, TSX:WPM) is a leading global precious metals mining company with extensive experience in exploration, development and production activities on six continents. The Company produces silver, gold and other related minerals from various mines in North America, South America and Africa. As one of the largest ‘streaming’ companies on the planet, Wheaton has agreements with 19 operating mines and 9 projects still in development. Its unique business model allows it to leverage price increases in the precious metals sector, as well as provide a quality dividend yield for its investors.
Recently, Wheaton sealed a deal with Hudbay Minerals Inc. relating to its Rosemont project. For an initial payment of $230 million, Wheaton is entitled to 100 percent of payable gold and silver at a price of $450 per ounce and $3.90 per ounce respectively.
Randy Smallwood, Wheaton's President and Chief Executive Officer explained, "With their most recent successful construction of the Constancia mine in Peru, the Hudbay team has proven themselves to be strong and responsible mine developers, and we are excited about the same team moving this project into production. Rosemont is an ideal fit for Wheaton's portfolio of high-quality assets, and when it is in production, should add well over fifty thousand gold equivalent ounces to our already growing production profile."
By. Charles Kennedy for Oilprice.com
**IMPORTANT! BY READING OUR CONTENT YOU EXPLICITLY AGREE TO THE FOLLOWING. PLEASE READ
CAREFULLY**
Forward-Looking Statements
This publication contains forward-looking information which is subject to a variety of risks and uncertainties and other factors that could cause actual events or results to differ from those projected in the forward-looking statements. Forward looking statements in this publication include that prices for gold, silver, copper, zinc and other base metals will retain their value in future as currently expected, or could continue to increase due to global demand and political reasons; that Starr Peak can fulfill all its obligations to acquire its Quebec properties; that Starr Peak’s property can continue to achieve drilling and mining success for gold and other metals; that historical geological information and estimations will prove to be accurate or at least very indicative; that high-grade targets exist; that Starr Peak will be able to carry out its business plans, including future exploration and drilling programs; that the preliminary drilling results will be confirmed as further exploration continues; that the lab results from Starr Peak’s initial exploration program will confirm evidence of a significant VMS deposit; that Starr Peak’s exploration results will gain the attention and interest of larger mining companies and investors; that Starr Peak’s exploration results will continue to show promising results justifying ongoing exploration and possible development efforts. These forward-looking statements are subject to a variety of risks and uncertainties and other factors that could cause actual events or results to differ materially from those projected in the forward-looking information. Risks that could change or prevent these statements from coming to fruition include that politics don’t have nearly the strong effect on gold and other base metal prices as expected; that demand for base metals may not continue to increase; that the Company may not complete all its announced mineral property purchases for various reasons; that the Company may not be able to finance its intended drilling and exploration programs; Starr Peak may not raise sufficient funds to carry out its business plans; that geological interpretations and technological results based on current data may change with more detailed information or testing; that the lab results from Starr Peak’s initial exploration program may not support evidence of a significant VMS deposit; that the preliminary drilling results may not be confirmed during further exploration efforts; that Starr Peak will fail to gain the attention and interest of other mining companies and investors; that Starr Peak’s exploration results may fail to find additional promising results justifying ongoing exploration and/or development efforts; and despite promising results from drilling and exploration, there may be no commercially viable minerals or ore on Starr Peak’s property. The forward-looking information contained herein is given as of the date hereof and we assume no responsibility to update or revise such information to reflect new events or circumstances, except as required by law.
DISCLAIMERS
This communication is for entertainment purposes only. Never invest purely based on our communication. We have not been compensated by Starr Peak but may in the future be compensated to conduct investor awareness advertising and marketing for TSXV:STE. The information in our communications and on our website has not been independently verified and is not guaranteed to be correct.
SHARE OWNERSHIP. The owner of Oilprice.com owns shares of Starr Peak and therefore has an additional incentive to see the featured company’s stock perform well. The owner of Oilprice.com will not notify the market when it decides to buy more or sell shares of this issuer in the market. The owner of Oilprice.com will be buying and selling shares of this issuer for its own profit. This is why we stress that you conduct extensive due diligence as well as seek the advice of your financial advisor or a registered broker-dealer before investing in any securities.
NOT AN INVESTMENT ADVISOR. The Company is not registered or licensed by any governing body in any jurisdiction to give investing advice or provide investment recommendation.
ALWAYS DO YOUR OWN RESEARCH and consult with a licensed investment professional before making an investment. This communication should not be used as a basis for making any investment.
RISK OF INVESTING. Investing is inherently risky. Don't trade with money you can't afford to lose. This is neither a solicitation nor an offer to Buy/Sell securities. No representation is being made that any stock acquisition will or is likely to achieve profits.
Read this article on OilPrice.com
Pan American Silver Corp. PAAS reported second-quarter 2021 adjusted earnings per share of 22 cents, missing the Zacks Consensus Estimate of 33 cents. The company had reported adjusted earnings per share of 28 cents in the year-ago quarter.
Including one-time items, the company reported earnings per share of 34 cents in the second quarter compared with the year-ago quarter’s 10 cents.
Pan American Silver’s revenues improved 53.2% year over year to $382 million in the quarter under review. The top line, however, lagged the Zacks Consensus Estimate of $457 million. Average realized silver price during the quarter jumped 62% year over year to $26.88 per equivalent ounce. Average realized gold price also increased 5.9% year over year to $1,809 per equivalent ounce. Revenues in the reported quarter were affected by increase in inventory. The company noted a build-up of in-heap gold inventories at Dolores and Shahuindo. This is expected to normalize in the back half of the year and result in higher revenues and cash flows.
Pan American Silver Corp. Price, Consensus and EPS Surprise

Pan American Silver Corp. price-consensus-eps-surprise-chart | Pan American Silver Corp. Quote
Operational Update
Consolidated silver production for the quarter was 4.5 million ounces, up 61% year over year. Consolidated gold production of 142.3 thousand ounces in the reported quarter reflects year-over-year growth of 47.3%.
Silver segment’s cash costs were $12.71 per ounce in the second quarter, up 104% from the year-ago period. The segment’s all-in sustaining costs (AISC) costs were up 30.5% year over year to $16.36 per ounce in the quarter. Gold segment’s cash costs were $857 per ounce, down 5% from the year-earlier quarter. The segment AISC costs amounted to $1,163 per ounce in the April-June period, reflecting year-over-year increase of 14.6%.
Pan American Silver reported mine-operating earnings of $103 million for the quarter, highlighting year-over-year improvement of 113%.
Financial Position
At the end of the second quarter, Pan American Silver had cash and short-term investment balances of $240.4 million, working capital of $603.1 million, and $500.0 million available on its revolving credit facility. It has an equity investment in Maverix Metals Inc. with a market value of $140 million. Total debt was at $47.7 million. Net cash generated from operations was $87.1 million in the reported quarter.
The company increased its quarterly dividend by 43% to 10 cents per share, marking the third dividend hike in the past 18 months.
Guidance
Pan American Silver maintains annual silver production guidance for the current year between 20.50 million ounces and 22 million ounces. Silver segment cash costs are expected to be $9.60-$11.60 per ounce. AISC is estimated between $14.25 per ounce and $15.75 per ounce for the ongoing year.
It expects 2021 annual gold production between 605 thousand ounces and 655.1 thousand ounces. Gold segment cash costs are projected in the range of $825 per ounce to $925 per ounce. AISC is forecast between $1,135 per ounce and $1,250 per ounce. Capital expenditure for 2021 is anticipated in the range of $285 million to $305 million.
The company expects cash flows to improve in the second half of the year, with the anticipated rise in throughput rates at La Colorada along with the normalization of inventory levels that were built up during the first half of 2021.
Price Performance

Image Source: Zacks Investment Research
Shares of the company have fallen 21.7% over the past year compared with the industry’s decline of 16.8%.
Zacks Rank & Stocks to Consider
Pan American Silver currently carries a Zacks Rank #3 (Hold).
Some better-ranked stocks in the basic materials space include Nucor Corporation NUE, Cabot Corporation CBT and Dow Inc. DOW.
Nucor has a projected earnings growth rate of 455% for 2021. The company’s shares have soared 160% in the past year. It currently flaunts a Zacks Rank #1 (Strong Buy). You can see the complete list of today’s Zacks #1 Rank stocks here.
Cabot has an expected earnings growth rate of 137% for the current fiscal year. The company’s shares have gained 33% in a year’s time. It currently sports a Zacks Rank #1.
Dow has an estimated earnings growth rate of 403% for the current year. In the past year, the company’s shares have gained 42%. It currently carries a Zacks Rank #2 (Buy).
Want the latest recommendations from Zacks Investment Research? Today, you can download 7 Best Stocks for the Next 30 Days. Click to get this free report
Pan American Silver Corp. (PAAS) : Free Stock Analysis Report
Nucor Corporation (NUE) : Free Stock Analysis Report
Dow Inc. (DOW) : Free Stock Analysis Report
Cabot Corporation (CBT) : Free Stock Analysis Report
To read this article on Zacks.com click here.
Vancouver, British Columbia–(Newsfile Corp. – August 11, 2021) – Starcore International Mines Ltd. (TSX: SAM) ("Starcore" or "the Company") announces production results for the first fiscal quarter ended July 31, 2021, at its San Martin Mine ("San Martin") in Queretaro, Mexico.
"The strategy to produce profitable ounces continues," stated Salvador Garcia, Chief Operating Officer of the company. "This is based on operating efficiency, cost control and efficient use of CAPEX in exploration to increase the reserves."
"With regard to the exploration plans that we reported on in the last quarter, the development of the manto discovered in the northwest part of the mine has commenced and has contributed to the quarterly production, as well as increasing the proven and probable reserves. The well being drilled in the eastern part of the mine was concluded and the ramp being developed to access the positive drill holes is ongoing."
"We are pleased with how the mine has been improving its performance in the last quarters, reflecting a more stable production that has resulted in positive cash flow and profit for the company."
|
San Martin Production |
Q1 2021 |
Q4 2021 |
Q/Q Change |
YTD 2021 |
YTD 2020 |
Y/Y Change |
|
Ore Milled (Tonnes) |
56,287 |
52,403 |
7% |
56,287 |
59,099 |
-5% |
|
Gold Equivalent Ounces |
2,895 |
2,603 |
11% |
2,895 |
3,259 |
-11% |
|
Gold Grade (Grams/Ton) |
1.64 |
1.52 |
7% |
1.64 |
1.70 |
-4% |
|
Silver Grade (Grams/Ton) |
20.84 |
24.62 |
-15% |
20.84 |
29.17 |
-29% |
|
Gold Recovery (%) |
88.34 |
87.33 |
1 |
88.34 |
88.74 |
0% |
|
Silver Recovery (%) |
52.11 |
57.52 |
-9% |
52.11 |
56.53 |
-8% |
|
Gold: Silver Ratio |
68.07 |
67.07 |
68.07 |
97.22 |
Salvador Garcia, B. Eng., a director of the Company and Chief Operating Officer, is the Company's qualified person on the project as required under NI 43-101and has prepared the technical information contained in this press release.
About Starcore
Starcore International Mines is engaged in precious metals production with focus and experience in Mexico. This base of producing assets is complemented by exploration and development projects throughout North America. The Company is a leader in Corporate Social Responsibility and advocates value driven decisions that will increase long term shareholder value. You can find more information on the investor friendly website here: www.starcore.com.
ON BEHALF OF STARCORE INTERNATIONAL
MINES LTD.
Signed "Robert Eadie"
Robert Eadie, President & Chief Executive Officer
FOR FURTHER INFORMATION PLEASE CONTACT:
EVAN EADIE
Investor Relations
Telephone: (604) 602-4935 x 203
Toll Free: 1-866-602-4935
Email: eeadie@starcore.com
The Toronto Stock Exchange has not reviewed, nor does it accept responsibility
for the adequacy or accuracy of this press release.

To view the source version of this press release, please visit https://www.newsfilecorp.com/release/92834
TORONTO, Aug. 11, 2021 (GLOBE NEWSWIRE) — Mandalay Resources Corporation ("Mandalay" or the "Company") (TSX: MND, OTCQB: MNDJF) is pleased to announce its financial results for the quarter ended June 30, 2021.
The Company’s condensed and consolidated interim financial results for the quarter ended June 30, 2021, together with its Management’s Discussion and Analysis (“MD&A”) for the corresponding period, can be accessed under the Company’s profile on www.sedar.com and on the Company’s website at www.mandalayresources.com. All currency references in this press release are in U.S. dollars except as otherwise indicated.
Second Quarter 2021 Highlights:
-
Quarterly revenue of $51.4 million – second highest since Q2 2016;
-
Adjusted EBITDA of $23.1 million;
-
$12.7 million free cash flow and $26.6 million in net cash flow from operating activities;
-
Adjusted net income of $11.5 million ($0.13 or C$0.15 per share);
-
Consolidated net income of $4.8 million ($0.05 or C$0.06 per share); and
-
Quarter ending cash balance of $39.1 million.
Dominic Duffy, President and CEO of Mandalay, commented:
“Mandalay Resources is pleased to deliver strong financial results for the second quarter of 2021, as the Company continues to execute against our operational strategy and is on track to attain our 2021 production and cost guidance.
During the second quarter, the Company generated $12.7 million in free cash flow and ended the quarter with a cash balance of $39.1 million. As the Company continues to generate strong free cash flow, the emerging strength of our balance sheet significantly improves our abilities to fund near-term growth opportunities. During this quarter, the Company also repaid $3.8 million towards our Syndicated Facility leaving $51.4 million owing.”
Mr. Duffy continued, “During the quarter the Company generated $51.4 million in consolidated revenue and $23.1 million in adjusted EBITDA, resulting in an EBITDA margin of 45%, and a year to date adjusted EBITDA of $49.2 million. Mandalay earned $11.5 million ($0.13 or C$0.15 per share) in adjusted net income during the second quarter, marking our sixth consecutive quarter of profitability.”
Mr. Duffy added, “Our consolidated cash and all-in sustaining costs per saleable gold equivalent ounce during the second quarter of 2021 were $960 and $1,342, respectively, an increase as compared to the $851 and $1,230 during the same period last year. The main reasons for this were due to foreign exchange movements, with local currencies strengthening against the U.S. dollar, a decrease in gold production at Björkdal for the quarter due to lower grade stoping and increased infill exploration spend at both sites.”
Mr. Duffy added, “Costerfield posted $23.4 million in revenue and $15.8 million in adjusted EBITDA at a cash cost and all-in sustaining cost of $652 and $1,009 per oz gold equivalent produced, respectively.
Exploration so far this year has been a huge success for Mandalay due to the outstanding results at our newly discovered high-grade Shepherd structure, which lies beneath our Youle mine at Costerfield. With $4.3 million spent on exploration year to date, we expect to exceed our 2021 guidance amount for exploration spending. The additional capital invested aligns with our growth strategy as the Company seeks to deliver further value at Costerfield by extending its life of mine.”
Mr. Duffy continued, “Björkdal generated stable production and sales resulting in $22.5 million and $6.5 million of revenue and adjusted EBITDA, respectively, during the second quarter of 2021. The underground mined tonnage ramp up continued as we mined approximately 540,000 tonnes during the first half of 2021, an approximate 11% increase as compared to the same period last year. We are on track to achieve our goal of 1.1 million tonnes production from the underground.
Grade performance during this quarter was lower than previous quarters mainly due to the amount of stope production performed in lower grade areas of the mine. This, along with negative exchange rate impacts, resulted in higher cash and all-in sustaining costs of $1,338 and $1,766, respectively, for the quarter. We expect to see a decrease to these higher unit costs in the coming quarters as we ramp up production in the lower, higher grade levels of Aurora.”
Mr. Duffy concluded, “For the rest of 2021, we expect to improve on this level of operational and financial performance, while building on our successful exploration campaigns. At Costerfield, the program will continue with infill drilling at Shepherd and progressing with deeper drilling at Cuffley, Augusta and Shepherd. At Björkdal, we will be focused on the Main, Central and Lake zones to the north east at depth and extensions of the Aurora zone. At current metal prices and exchange rates the Company is on schedule to be net debt free by year end 2021.”
Second Quarter 2021 Financial Summary
The following table summarizes the Company’s financial results for the three months and six months ended June 30, 2021, and 2020:
|
Three months |
Three months |
Six months |
Six months |
|
|
$’000 |
$’000 |
$’000 |
$’000 |
|
|
Revenue |
51,352 |
42,335 |
103,925 |
83,901 |
|
Cost of sales |
27,135 |
19,734 |
52,549 |
38,566 |
|
Adjusted EBITDA (1) |
23,135 |
21,271 |
49,197 |
42,174 |
|
Income from mine ops before depreciation, depletion |
24,217 |
22,601 |
51,376 |
45,335 |
|
Adjusted net income (1) |
11,475 |
7,632 |
17,121 |
12,818 |
|
Consolidated net income (loss) |
4,790 |
(2,439) |
30,290 |
(6,047) |
|
Capital expenditure |
13,578 |
10,566 |
25,604 |
20,603 |
|
Total assets |
310,841 |
260,298 |
310,841 |
260,298 |
|
Total liabilities |
151,852 |
155,024 |
151,852 |
155,024 |
|
Adjusted net income per share (1) |
0.13 |
0.08 |
0.19 |
0.14 |
|
Consolidated net income (loss) per share |
0.05 |
(0.03) |
0.33 |
(0.07) |
-
Adjusted EBITDA, adjusted net income (loss) and adjusted net income (loss) per share are non-IFRS measures, defined at the end of this press release “Non-IFRS Measures”.
In the second quarter of 2021, Mandalay generated consolidated revenue of $51.4 million, 21% higher than in the second quarter of 2021. This increase is attributable to Mandalay selling 3,199 more gold equivalent ounces combined with higher realized prices in the second quarter of 2021 compared to the second quarter of 2020. The Company’s realized gold price in the second quarter of 2021 increased by 5% compared to the second quarter of 2020, and the realized price of antimony increased by 120%.
Consolidated cash cost per ounce of $960 increased by 13% in the second quarter of 2021 compared to the second quarter of 2020, mainly due to higher costs of production. Cost of sales during the second quarter of 2021 versus the second quarter of 2020 were almost same at Costerfield and $3.7 million higher at Björkdal. Consolidated general and administrative costs were $0.2 million lower as compared to the prior year quarter.
Mandalay generated adjusted EBITDA of $23.1 million in the second quarter of 2021, 9% higher compared to the Company’s adjusted EBITDA of $21.3 million in the year ago quarter. Adjusted net income was $11.5 million in the second quarter of 2021, which excludes the $6.3 million fair value loss related to the gold hedges associated with the Syndicated Facility and $0.4 million fair value loss related to mark to market adjustment, compared to an adjusted net income of $7.6 million in the second quarter of 2020. Consolidated net income was $4.8 million for the second quarter of 2021, versus a net loss of $2.4 million in the second quarter of 2020. Mandalay ended the second quarter of 2021 with $39.1 million in cash and cash equivalents.
Second Quarter 2021 Operational Summary
The table below summarizes the Company’s operations, capital expenditures and operational unit costs for the three months and six months ended June 30, 2021 and 2020:
|
Three months |
Three months |
Six months |
Six months |
|
|
$’000 |
$’000 |
$’000 |
$’000 |
|
|
Costerfield |
||||
|
Gold produced (oz) |
9,959 |
10,353 |
21,041 |
20,973 |
|
Antimony produced (t) |
858 |
946 |
1,690 |
2,054 |
|
Gold equivalent produced (oz) |
14,818 |
13,502 |
30,276 |
28,429 |
|
Cash cost (1) per oz gold eq. produced ($) |
652 |
662 |
646 |
604 |
|
All-in sustaining cost (1) per oz gold eq. produced ($) |
1,009 |
1,025 |
972 |
935 |
|
Capital development |
3,108 |
3,481 |
6,086 |
6,677 |
|
Property, plant and equipment purchases |
1,029 |
716 |
1,930 |
1,497 |
|
Capitalized exploration |
1,583 |
1,335 |
2,807 |
2,067 |
|
Björkdal |
||||
|
Gold produced (oz) |
10,941 |
11,250 |
22,796 |
22,000 |
|
Cash cost (1) per oz gold produced ($) |
1,338 |
1,078 |
1,259 |
1,065 |
|
All-in sustaining cost (1) per oz gold produced ($) |
1,766 |
1,352 |
1,647 |
1,383 |
|
Capital development |
2,727 |
2,268 |
5,120 |
4,479 |
|
Property, plant and equipment purchases |
4,277 |
2,452 |
8,122 |
4,779 |
|
Capitalized exploration |
601 |
338 |
1,058 |
984 |
|
Cerro Bayo |
||||
|
Gold produced (oz) |
1,807 |
– |
2,531 |
– |
|
Silver produced (oz) |
87,062 |
– |
130,761 |
– |
|
Gold equivalent produced (oz) |
3,084 |
– |
4,447 |
– |
|
Cash cost (1) per oz gold eq. produced ($) |
1,097 |
– |
1,066 |
– |
|
All-in sustaining cost (1) per oz gold eq. produced ($) |
1,110 |
– |
1,075 |
– |
|
Consolidated |
||||
|
Gold equivalent produced (oz) |
28,843 |
24,752 |
57,519 |
50,429 |
|
Cash cost* per oz gold eq. produced ($) |
960 |
851 |
922 |
805 |
|
All-in sustaining cost (1) per oz gold eq. produced ($) |
1,342 |
1,230 |
1,284 |
1,244 |
|
Capital development |
5,835 |
5,749 |
11,206 |
11,156 |
|
Property, plant and equipment purchases |
5,306 |
3,168 |
10,052 |
6,276 |
|
Capitalized exploration (2) |
2,437 |
1,649 |
4,346 |
3,171 |
-
Cash cost and all-in sustaining cost are non-IFRS measures. See “Non-IFRS Measures” at the end of this press release.
-
Includes capitalized exploration relating to other non-core assets.
Costerfield gold-antimony mine, Victoria, Australia
Costerfield produced 9,959 ounces of gold and 858 tonnes of antimony for 14,818 gold equivalent ounces in the second quarter of 2021. Cash and all-in sustaining costs at Costerfield of $652/oz and $1,009/oz, respectively, compared to cash and all-in sustaining costs of $662/oz and $1,025/oz, respectively, in the second quarter of 2020.
Björkdal gold mine, Skellefteå, Sweden
Björkdal produced 10,941 ounces of gold in the second quarter of 2021 with cash and all-in sustaining costs of $1,338/oz and $1,766/oz, respectively, compared to cash and all-in sustaining costs of $1,078/oz and $1,352/oz, respectively, in the second quarter of 2020.
Cerro Bayo silver-gold mine, Patagonia, Chile
In the second quarter of 2021, the Company spent nil on care and maintenance expenses at Cerro Bayo, compared to $0.5 million in the second quarter of 2020. Cerro Bayo is currently subject to a binding option agreement between the Company and Equus Mining (“Equus”) pursuant to which Equus has an option to acquire Cerro Bayo. For further information see the Company’s October 8, 2019, press release.
During the second quarter of 2021, Cerro Bayo produced 1,807 ounces of gold and 87,062 ounces of silver for 3,084 gold equivalent ounces in the second quarter of 2021 at a cash cost of $1,097/oz.
Lupin, Nunavut, Canada
Care and maintenance spending at Lupin was less than $0.1 million during the second quarter of 2021, which was the same as in the second quarter of 2020. Reclamation spending at Lupin was $0.8 million during the second quarter of 2021 compared to $5.1 million during the second quarter of 2020. The full closure of Lupin will continue in the 2021 season funded by ongoing progressive security reductions held by CIRNA.
Challacollo, Chile
On April 19, 2021, Aftermath Silver Ltd. (“Aftermath Silver”) paid C$1.5 million in cash and issued 2,054,794 common shares at fair value of C$0.73 per share to the Company on May 05, 2021, in satisfaction of a purchase price instalment. As at June 30, 2021, the Company is holding this asset as held for sale. Further information regarding the definitive agreement signed with Aftermath Silver for the sale of Challacollo can be found in the Company’s November 12, 2019, press release.
La Quebrada, Chile
No work was carried out on the La Quebrada development property during Q2 2021.
COVID-19
The coronavirus (“COVID-19”) pandemic is present in all countries in which the Company operates, with cases being reported in Canada, Australia, Sweden and Chile. At this time, the Company has activated business continuity practices across all sites. Management will continue to monitor developments across all jurisdictions and will adjust its planning as necessary.
The Company is not able to estimate the duration of the pandemic and potential impact on its business if disruptions or delays in our operations occur or our ability to transfer our products to market. In addition, a severe prolonged economic downturn could result in a variety of risks to the business, including a decreased ability to raise additional capital when needed on acceptable terms, if at all. As the situation continues to evolve, the Company will continue to closely monitor operating conditions in the countries we operate and respond accordingly. More details are included in the press release dated March 20, 2020, and on the Company’s website.
Conference Call
Mandalay’s management will be hosting a conference call for investors and analysts on August 12, 2021, at 8:00 AM (Toronto time).
Analysts and interested investors are invited to participate using the following dial-in numbers:
|
Participant Number (Toll free): |
(877) 407-8289 |
|
Participant Number: |
(201) 689-8341 |
|
Conference ID: |
13722369 |
A replay of the conference call will be available until 11:59 PM (Toronto time), August 26, 2021, and can be accessed using the following dial-in number:
|
Encore Toll Free Dial-in Number: |
(877) 660-6853 |
|
Encore ID: |
13722369 |
About Mandalay Resources Corporation:
Mandalay Resources is a Canadian-based natural resource company with producing assets in Australia (Costerfield gold-antimony mine), Sweden (Björkdal gold mine) and Chile (Cerro Bayo gold-silver mine). The Company is focused on growing its production and reducing costs to generate significant positive cashflow.
Mandalay’s mission is to create shareholder value through the profitable operation of both its Costerfield and Björkdal mines. Currently, the Company’s main objective is to continue mining the high-grade Youle vein at Costerfield, which continues to supply high-grade ore, and to extend Youle’s Mineral Reserves at depth and to the south, as well as continuing the regional exploration program. At Björkdal, the Company will aim to increase production from the Aurora zone and other higher-grade areas in the coming years, in order to maximize profit margins from the mine and continue exploration in near mine and regional.
Forward-Looking Statements
This news release contains "forward-looking statements" within the meaning of applicable securities laws, including statements regarding the Company’s anticipated performance in 2021. Readers are cautioned not to place undue reliance on forward-looking statements. Actual results and developments may differ materially from those contemplated by these statements depending on, among other things, changes in commodity prices and general market and economic conditions. The factors identified above are not intended to represent a complete list of the factors that could affect Mandalay. A description of additional risks that could result in actual results and developments differing from those contemplated by forward-looking statements in this news release can be found under the heading “Risk Factors” in Mandalay’s annual information form dated March 31, 2021, a copy of which is available under Mandalay’s profile at www.sedar.com. In addition, there can be no assurance that any inferred resources that are discovered as a result of additional drilling will ever be upgraded to proven or probable reserves. Although Mandalay has attempted to identify important factors that could cause actual actions, events or results to differ materially from those described in forward-looking statements, there may be other factors that cause actions, events or results not to be as anticipated, estimated or intended. There can be no assurance that forward-looking statements will prove to be accurate, as actual results and future events could differ materially from those anticipated in such statements. Accordingly, readers should not place undue reliance on forward-looking statements.
Non-IFRS Measures
This news release may contain references to adjusted EBITDA, adjusted net income, free cash flow, cash cost per saleable ounce of gold equivalent produced and all-in sustaining cost all of which are non-IFRS measures and do not have standardized meanings under IFRS. Therefore, these measures may not be comparable to similar measures presented by other issuers.
Management uses adjusted EBITDA and free cash flow as measures of operating performance to assist in assessing the Company’s ability to generate liquidity through operating cash flow to fund future working capital needs and to fund future capital expenditures, as well as to assist in comparing financial performance from period to period on a consistent basis. Management uses adjusted net income in order to facilitate an understanding of the Company’s financial performance prior to the impact of non-recurring or special items. The Company believes that these measures are used by and are useful to investors and other users of the Company’s financial statements in evaluating the Company’s operating and cash performance because they allow for analysis of its financial results without regard to special, non-cash and other non-core items, which can vary substantially from company to company and over different periods.
The Company defines adjusted EBITDA as income from mine operations, net of administration costs, and before interest, taxes, non-cash charges/(income), intercompany charges and finance costs. The Company defines adjusted net income as net income before special items. Special items are items of income and expense that are presented separately due to their nature and, in some cases, expected infrequency of the events giving rise to them. A reconciliation between adjusted EBITDA and adjusted net income, on the one hand, and consolidated net income, on the other hand, is included in the MD&A.
The Company defines free cash flow as a measure of the Corporation’s ability to generate and manage liquidity. It is calculated starting with the net cash flows from operating activities (as per IFRS) and then subtracting capital expenditures and lease payments. Refer to Section 1.2 of MD&A for a reconciliation between free cash flow and net cash flows from operating activities.
For Costerfield, saleable equivalent gold ounces produced is calculated by adding to saleable gold ounces produced, the saleable antimony tonnes produced times the average antimony price in the period divided by the average gold price in the period. The total cash operating cost associated with the production of these saleable equivalent ounces produced in the period is then divided by the saleable equivalent gold ounces produced to yield the cash cost per saleable equivalent ounce produced. The cash cost excludes royalty expenses. Site all-in sustaining costs include total cash operating costs, sustaining mining capital, royalty expense, accretion and depletion. Sustaining capital reflects the capital required to maintain each site’s current level of operations. The site’s all-in sustaining cost per ounce of saleable gold equivalent in a period equals the all-in sustaining cost divided by the saleable equivalent gold ounces produced in the period.
For Cerro Bayo, saleable equivalent gold ounces produced is calculated by adding to saleable gold ounces produced, the saleable silver ounces produced times the average silver price in the period divided by the average gold price in the period. The total cash operating cost associated with the production of these saleable equivalent ounces produced in the period is then divided by the saleable equivalent gold ounces produced to yield the cash cost per saleable equivalent ounce produced. The cash cost excludes royalty expenses. Site all-in sustaining costs include total cash operating costs, sustaining mining capital, royalty expense, accretion and depletion. Sustaining capital reflects the capital required to maintain each site’s current level of operations. The site’s all-in sustaining cost per ounce of saleable gold equivalent in a period equals the all-in sustaining cost divided by the saleable equivalent gold ounces produced in the period.
For Björkdal, the total cash operating cost associated with the production of saleable gold ounces produced in the period is then divided by the saleable gold ounces produced to yield the cash cost per saleable gold ounce produced. The cash cost excludes royalty expenses. Site all-in costs include total cash operating costs, royalty expense, accretion, depletion, depreciation and amortization. Site all-in sustaining costs include total cash operating costs, sustaining mining capital, royalty expense, accretion and depletion. Sustaining capital reflects the capital required to maintain each site’s current level of operations. The site’s all-in sustaining cost per ounce of saleable gold equivalent in a period equals the all-in sustaining cost divided by the saleable equivalent gold ounces produced in the period.
For the Company as a whole, cash cost per saleable gold equivalent ounce is calculated by summing the gold equivalent ounces produced by each site and dividing the total by the sum of cash operating costs at the sites. Consolidated cash cost excludes royalty and corporate level general and administrative expenses. This definition was updated in the third quarter of 2020 to exclude corporate general and administrative expenses to better align with industry standard. All-in sustaining cost per saleable ounce gold equivalent in the period equals the sum of cash costs associated with the production of gold equivalent ounces at all operating sites in the period plus corporate overhead expense in the period plus sustaining mining capital, royalty expense, accretion, depletion, depreciation and amortization, divided by the total saleable gold equivalent ounces produced in the period. A reconciliation between cost of sales and cash costs, and also cash cost to all-in sustaining costs are included in the MD&A.
For Further Information:
Dominic Duffy
President and Chief Executive Officer
Edison Nguyen
Manager, Analytics and Investor Relations
Contact:
(647) 260-1566 ext. 1

Vancouver, British Columbia–(Newsfile Corp. – August 11, 2021) – Southern Silver Exploration Corp. (TSXV: SSV) (OTCQX: SSVFF) ("Southern Silver" or the "Company") is providing warrant exercise instructions for the two series of warrants dated September 11, 2020 which will increase in price on August 14, 2021. The warrants were issued in connection with a C$10 million brokered private placement of subscription receipts and a C$4 million non-brokered private placement of subscription receipts which both closed on August 14, 2020. Subscription receipts issued in these financings were converted into units on September 11, 2020 with each unit comprised of one common share and one-half share purchase warrant.
These warrant exercises are handled directly by Computershare, and all the original documents and funds should be delivered to Computershare. If warrant holders have any questions regarding exercise of their warrants, please contact Computershare at the following toll-free number:
1-800-564-6253 (toll-free in Canada and the United States) between the hours of 8:30 a.m. and 8:00 p.m. Eastern Time
Please see below for respective warrant prices.
Series #1 – 25 million warrants attached to the units converted from the 50 million subscription receipts at $0.20:
-
1 Warrant + CDN $0.25 = 1 Common Share for the period prior to August 13, 2021
-
1 Warrant + CDN $0.30 = 1 Common Share for the period August 14, 2021 to August 13, 2022
-
1 Warrant + CDN $0.35 = 1 Common Share for the period August 14, 2022 to time of expiry, August 14, 2023
Series #2 – 9,523,809 warrants attached to the units converted from the 19,047,620 subscription receipts at $0.21:
-
1 Warrant + CDN $0.28 = 1 Common Share for the period prior to August 13, 2021
-
1 Warrant + CDN $0.33 = 1 Common Share for the period August 14, 2021 to August 13, 2022
-
1 Warrant + CDN $0.38 = 1 Common Share for the period August 14, 2022 to time of expiry, August 14, 2023
On behalf of the Board of Directors
"Lawrence Page"
Lawrence Page, Q.C.
President & Director, Southern Silver Exploration Corp.
For further information, please visit Southern Silver's website at southernsilverexploration.com or contact us at 604.641.2759 or by email at ir@mnxltd.com.
Neither TSX Venture Exchange nor its Regulation Services Provider (as that term is defined in the policies of the TSX Venture Exchange) accepts responsibility for the adequacy or accuracy of this release.
This news release may contain forward-looking statements. Forward-looking statements address future events and conditions and therefore involve inherent risks and uncertainties. Actual results may differ materially from those currently anticipated in such statements. Factors that could cause actual results to differ materially from those in forward looking statements include the timing and receipt of government and regulatory approvals, and continued availability of capital and financing and general economic, market or business conditions. Southern Silver Exploration Corp. does not assume any obligation to update or revise its forward-looking statements, whether as a result of new information, future events or otherwise, except to the extent required by applicable law.

To view the source version of this press release, please visit https://www.newsfilecorp.com/release/92760
TORONTO, Aug. 10, 2021 /CNW/ – Excellon Resources Inc. (TSX: EXN) (TSX: EXN.WT) (NYSE: EXN) (FRA: E4X2) ("Excellon" or the "Company") is providing a further update on litigation involving the Company's subsidiary, San Pedro Resources SA de CV ("San Pedro") disclosed on December 5, 2019 in respect of the La Antigua mineral concession ("La Antigua"), which is part of the Evolución Property in Zacatecas.

Further to the Company's press release of July 2, 2021, Excellon received an initial electronic notice on July 1, 2021 that San Pedro's appeal to the federal courts of Mexico in respect of the litigation was dismissed, despite the lack of evidence, facts or law to support this outcome. The Company has now received the formal written decision on the appeal which, based on initial legal review, appears to uphold the judgment granting the plaintiff (the "Plaintiff") an award of approximately US$23 million (the "Judgment") and is not subject to further legal appeal in Mexico.
"These court decisions are the product of rank corruption and are a black mark on the judicial system of Mexico," stated Brendan Cahill, President and CEO. "The value ascribed in the judgment is impossible based on evidence, facts or law. Simply put, the maximum value realizable by the plaintiff from the agreement on La Antigua was US$500,000 in the best-case scenario, yet the Miguel Auza Mine was shut down in 2008 almost immediately after operations commenced."
"We continue to pursue avenues through our labour, community and government relationships and are investigating remedies under international law. In the interim, San Pedro continues to operate in the ordinary course. We do not expect this decision to impact any of our other assets, including Platosa, Kilgore, Oakley and Silver City. Additionally, to realize on the judgment, the plaintiff will need to contend with the interests of the 90 people San Pedro employs in the town of Miguel Auza and the economy of northern Zacatecas."
La Antigua was included in Excellon's acquisition of Silver Eagle Mines Inc. ("Silver Eagle") in 2009 and includes a portion of the Evolución mineral resource at Miguel Auza. The concession is subject to an exploration and exploitation agreement with purchase option (the "Agreement") between San Pedro (now a subsidiary of Excellon) and the Plaintiff that provided, among other things, for a minimum payment of US$2,500 plus value added tax per month (the "Advance Royalty") and the payment of a 3% net smelter return ("NSR") royalty. Pursuant to the Agreement, San Pedro had the right to purchase absolute title to La Antigua including the NSR royalty upon payment of US$500,000, a right that was never exercised as there was no economic sense in doing so. San Pedro has accrued the Advance Royalty on an ongoing basis.
Though the Miguel Auza Mine never reached commercial production and was put on care-and-maintenance in December 2008 prior to Excellon's acquisition of Silver Eagle, the Plaintiff sued San Pedro for non-compliance with the Agreement and specifically for not operating the Miguel Auza Mine. The Plaintiff was awarded damages of approximately US$700,000 in the court of first instance in Torreón, Coahuila. Both San Pedro and the Plaintiff appealed the decision to the Second District State Court in the Judicial District of Torreón. In December 2019, the Court confirmed the initial decision but, subsequently, pursuant to an order obtained by the Plaintiff, made the Judgment, predominantly in damages for the Miguel Auza Mine not being in operation. The book value of San Pedro's fixed assets is US$4.8 million.
As previously described, the Judgment is solely against San Pedro and the Company believes that the Plaintiff has no recourse against Excellon's other assets in Mexico (including Platosa), Idaho, Saxony or Canada. San Pedro is a wholly-owned, indirect subsidiary of the Company that holds the Miguel Auza processing facility and the original Miguel Auza mineral concessions, including the Evolución mineral resource disclosed in September 2020. San Pedro generates minimal cash flows from milling fees charged to the Platosa Mine for ore processing and holds minimal working capital. The Platosa Mine is owned and operated by an entirely separate subsidiary.
Additional updates will be provided as necessary in due course.
About Excellon
Excellon's vision is to create wealth by realizing strategic opportunities through discipline and innovation for the benefit of our employees, communities and shareholders. The Company is advancing a precious metals growth pipeline that includes: Platosa, Mexico's highest-grade silver mine since production commenced in 2005; Kilgore, a high quality advanced exploration gold project in Idaho with strong economics and significant growth and discovery potential; and an option on Silver City, a high-grade epithermal silver district in Saxony, Germany with 750 years of mining history and no modern exploration. The Company also aims to continue capitalizing on current market conditions by acquiring undervalued projects.
Additional details on Excellon's properties are available at www.excellonresources.com.
Forward-Looking Statements
The Toronto Stock Exchange has not reviewed and does not accept responsibility for the adequacy or accuracy of the content of this Press Release, which has been prepared by management. This press release contains forward-looking statements within the meaning of Section 27A of the Securities Act and Section 27E of the Exchange Act. Such statements include, without limitation, statements regarding the outcome and impact of the legal action in Mexico in respect of the La Antigua mineral concession that is part of the Evolución Property in Zacatecas (including the dismissal of the appeal by the federal courts of Mexico on July 1, 2021), mineral resources estimates, the future results of operations, performance and achievements of the Company, including potential property acquisitions, the timing, content, cost and results of proposed work programs, the discovery and delineation of mineral deposits/resources/reserves, geological interpretations, proposed production rates, potential mineral recovery processes and rates, business and financing plans, business trends and future operating revenues. Although the Company believes that such statements are reasonable, it can give no assurance that such expectations will prove to be correct. Forward-looking statements are typically identified by words such as: believe, expect, anticipate, intend, estimate, postulate and similar expressions, or are those, which, by their nature, refer to future events. The Company cautions investors that any forward-looking statements by the Company are not guarantees of future results or performance, and that actual results may differ materially from those in forward looking statements as a result of various factors, including, but not limited to, variations in the nature, quality and quantity of any mineral deposits that may be located, significant downward variations in the market price of any minerals produced, the Company's inability to obtain any necessary permits, consents or authorizations required for its activities, to produce minerals from its properties successfully or profitably, to continue its projected growth, to raise the necessary capital or to be fully able to implement its business strategies. All of the Company's public disclosure filings may be accessed via www.sedar.com and readers are urged to review these materials. This press release is not, and is not to be construed in any way as, an offer to buy or sell securities in the United States.
SOURCE Excellon Resources Inc.

View original content to download multimedia: http://www.newswire.ca/en/releases/archive/August2021/10/c6371.html
Highlighted results include 5.42 g/t Au over 28.05 m in drill hole 21GSE600, including 12.68 g/t Au over 5.30 m, and 10.05 g/t over 8.50 m including 78.20 g/t over 1.0 m in drill hole 21GSE598B
Figure 1

Focused view of the Hook target (3D and Cross Section), a key area between the Goose Main Deposit and the Nuvuyak Deposit
VANCOUVER, British Columbia, Aug. 10, 2021 (GLOBE NEWSWIRE) — Sabina Gold & Silver Corp (SBB.T/SGSVF.OTCQX), (“Sabina” or the “Company”) is pleased to announce initial results from the company’s spring drilling program completed at the Hook Target, which has been identified as a key link along a mineralized trend hosting the Goose Main and Nuvuyak gold deposits, on its 100%-owned Back River Gold Project (“Back River” or the “Project”) in Nunavut, Canada.
For the first half of this year, exploration was focused on the southern mineralized trend that hosts Goose Main and Nuvuyak. The Hook target, which was thought to be the link between these deposits received the bulk of the meterage of this spring’s program. Drill testing within the trend is highlighted by hole 21GSE600 which returned 5.42 g/t Au over 28.05 m, including 12.68 g/t Au over 5.30 m, returning the highest gram-meter intercept within the target trend to date. The intercept through the fold nose of the antiform sits within a 50.50 m length of anomalous gold mineralization (see Table 1), representing a key link in unlocking the trend by identifying a robust area for potential resource growth through further exploration. Three additional drill holes were also completed within the trend during the 2021 spring program which continued to further advance the geological controls and refine targets highlighted by broad mineralizing intercepts including 10.05 g/t over 8.50 m in drill hole 21GSE598B, 1.72 g/t over 10.30 m in drill hole 21GSE599 and 1.67 g/t over 15.55m in drill hole 21GSE590 (additional drill hole results supporting this release are available in Table 1).
“The ability to demonstrate significant resource growth potential such a short distance from our proposed mining infrastructure is a tremendous success and further testament to the Goose Property gold endowment. Our Hook target is located within the shadows of the Goose Main open pit and provides opportunities for exceptional alignment as we advance both exploration and development synergies for the entire southern Goose Main – Hook – Nuvuyak gold trend.” said Bruce McLeod, President & CEO.
Drill advancement at the Hook target area has become an important focus for exploration to establish future resource growth and mining synergies. An approximate 1,500 m of F1 antiform stratigraphy is identified to be relatively continuous from the daylighting of the Goose Main deposit to the furthest down plunge mineralization intercepts at Nuvuyak. A total of 450 m of exploration plunge length is interpreted to be open between these two deposits (see Figure 1) establishing a very prospective area for exploration and additional resource opportunity. The Goose Main deposit currently hosts an open pit and underground Proven reserve of 548,000 oz at an average grade of 4.60g/t and an additional open pit and underground Probable reserve of 301,000 oz at an average of 4.96 g/t. The Nuvuyak deposit currently hosts an initial NI 43-101 compliant Inferred resource of 583,000 oz at an average grade of 7.50 g/t and remains open in all directions.
Drill holes in this release targeted an area surrounding key features at the Hook Target that are demarked by a quartz feldspar porphyry dyke hosted in an interpreted early structural setting within the Lower Iron Formation (LIF). The southern envelope of the demarking structure is interpreted as an important intersection lineation where in contact with the LIF stratigraphy, as it appears to be spatially associated with a key gold structure. Drill hole 21GSE600 is located approximately 120 m down plunge along the unfolded D2 trend of the Goose Main deposit and 330 m up plunge from the Nuvuyak deposit. Mineralization within the drill hole is noted as fine – to medium- grained pyrrhotite occurring as replacement bands of the stratigraphy and fracture infills. Lesser arsenopyrite occurs locally associated with fine chlorite and silica veins/alteration. Visible gold was frequent within the main interval occurring as fine specks throughout the drill core intercept.
The spring drilling program at the Goose property is now complete with all drill holes totaling 4480 m which included the focused testing of five drill holes at the Hook Target (including one abandoned due to excessive deviation), twelve drill holes testing earlier staged target areas, and an additional six drill holes supporting geotechnical investigations.
Operating under Sabina’s COVID-19 Protocol Operational Framework, site personnel have now safely completed programs over a full year period with success in accomplishments in exploration and development activities. Our site staff and contract teams have contributed significantly in our ability to maintain the health and safety of our workforce, their families, and the local regional communities.
|
Hole ID |
Area |
Azimuth/ Dip |
Easting |
Northing UTM |
Hole Depth (m) |
From |
To |
Length |
Au (g/t) |
Lithology |
|
21GSE590 |
HK |
16/-66 |
433459 |
7269398 |
549 |
404.15 |
419.70 |
15.55 |
1.67 |
Iron Formation |
|
inc |
415.40 |
416.55 |
1.15 |
5.11 |
Iron Formation |
|||||
|
444.35 |
445.55 |
1.20 |
1.75 |
Iron Formation |
||||||
|
484.75 |
488.75 |
4.00 |
2.67 |
Iron Formation |
||||||
|
inc |
484.75 |
485.55 |
0.80 |
8.49 |
Iron Formation |
|||||
|
21GSE598 |
HK |
16/67 |
433437 |
7269429 |
128 |
Abandoned – NSV |
||||
|
21GSE598B |
HK |
15/65 |
433438 |
7269429 |
491 |
34.05 |
35.00 |
0.95 |
5.66 |
Greywacke |
|
353.00 |
361.00 |
8.00 |
1.19 |
Iron Formation |
||||||
|
367.90 |
376.40 |
8.50 |
10.05 |
Iron Formation |
||||||
|
inc |
368.50 |
369.50 |
1.00 |
78.20 |
Iron Formation |
|||||
|
389.00 |
395.60 |
6.60 |
2.14 |
Iron Formation |
||||||
|
390.75 |
391.40 |
0.65 |
9.10 |
Iron Formation |
||||||
|
21GSE599 |
HK |
15/-66 |
433530 |
7269480 |
542 |
398.30 |
408.60 |
10.30 |
1.72 |
Iron Formation |
|
inc |
398.30 |
399.30 |
1.00 |
2.44 |
Iron Formation |
|||||
|
and |
403.50 |
405.50 |
2.00 |
3.81 |
Iron Formation |
|||||
|
and |
406.90 |
408.60 |
1.70 |
2.50 |
Iron Formation |
|||||
|
21GSE600 |
HK |
17/-65 |
433495 |
7269516 |
494 |
347.80 |
351.30 |
3.50 |
3.06 |
Iron Formation |
|
inc |
347.80 |
349.10 |
1.30 |
5.06 |
Iron Formation |
|||||
|
357.75 |
363.40 |
5.65 |
3.36 |
Iron Formation |
||||||
|
inc |
362.00 |
362.55 |
0.55 |
15.55 |
Iron Formation |
|||||
|
370.25 |
398.30 |
28.05 |
5.42 |
Iron Formation |
||||||
|
inc |
378.50 |
379.60 |
1.10 |
27.20 |
Iron Formation |
|||||
|
and |
389.00 |
394.30 |
5.30 |
12.68 |
Iron Formation |
|||||
|
Assays Pending |
||||||||||
|
^True widths of the intercepts reported are unknown at this time. |
||||||||||
Table 1: Significant Intervals for Diamond Drill Holes at the Hook Target.
Qualified Persons
Mr. James Maxwell, P. Geo., and Director of Exploration for Sabina, is a Qualified Person pursuant to National Instrument 43-101 and has reviewed and approved of the technical content of this press release as it relates to the Back River Project.
Sabina Gold & Silver Corp.
Sabina Gold & Silver Corp. is well-financed and is an emerging precious metals company with district scale, advanced, high grade gold assets in Nunavut, Canada.
Sabina recently filed an Updated Feasibility Study (the “UFS”) on its 100% owned Back River Gold Project which presents a project that will produce ~223,000 ounces of gold a year (first five years average of 287,000 ounces a year with peak production of 312,000 ounces in year three) for ~15 years with a rapid payback of 2.3 years, with a post-tax IRR of ~28% and NPV5% of C$1.1B. See “National Instrument (NI) 43-101 Technical Report – 2021 Updated Feasibility Study for the Goose Project at the Back River Gold District, Nunavut, Canada” dated March 3, 2021.
The Project received its final major authorization on June 25, 2020 and is now in receipt of all major permits and authorizations for construction and operations.
In addition to Back River, Sabina also owns a significant silver royalty on Glencore’s Hackett River Project. The silver royalty on Hackett River’s silver production is comprised of 22.5% of the first 190 million ounces produced and 12.5% of all silver produced thereafter.
For further information please contact:
|
Nicole Hoeller, Vice-President, Communications: |
1 888 648-4218 |
|
Forward Looking Information
This news release contains “forward-looking information” within the meaning of applicable securities laws (the “forward-looking statements”), including, but not limited to, statements related to the expected use of proceeds of the Offering and the projections and assumptions of the results of the UFS. These forward-looking statements are made as of the date of this news release. Readers are cautioned not to place undue reliance on forward-looking statements, as there can be no assurance that the future circumstances, outcomes or results anticipated in or implied by such forward-looking statements will occur or that plans, intentions or expectations upon which the forward-looking statements are based will occur. While we have based these forward-looking statements on our expectations about future events as at the date that such statements were prepared, the statements are not a guarantee that such future events will occur and are subject to risks, uncertainties, assumptions and other factors which could cause events or outcomes to differ materially from those expressed or implied by such forward-looking statements. Such factors and assumptions include, among others, the uncertainty of production, development plans and costs estimates for the Back River Gold Project; discrepancies between actual and estimated mineral reserves and mineral resources, between actual and estimated development and operating costs; the interpretation of drill, metallurgical testing and other exploration results; the ability of the Company to retain its key management employees and skilled and experienced personnel; exploration, development and mining risks and the inherently dangerous nature of the mining industry, and the risk of inadequate insurance or inability to obtain insurance to cover these risks and other risks and uncertainties; property and mineral title risks including defective title to mineral claims or property; the effects of general economic conditions, commodity prices, changing foreign exchange rates and actions by government and regulatory authorities; and misjudgments in the course of preparing forward-looking statements. In addition, there are known and unknown risk factors which could cause our actual results, performance or achievements to differ materially from any future results, performance or achievements expressed or implied by the forward-looking statements. Known risk factors include risks associated with exploration and project development; the need for additional financing; the calculation of mineral resources and reserves; operational risks associated with mining and mineral processing; fluctuations in metal prices; title matters; government regulation; obtaining and renewing necessary licenses and permits; environmental liability and insurance; reliance on key personnel; the potential for conflicts of interest among certain of our officers or directors; the absence of dividends; currency fluctuations; labour disputes; competition; dilution; the volatility of the our common share price and volume; future sales of shares by existing shareholders; and other risks and uncertainties, including those relating to the Back River Project and general risks associated with the mineral exploration and development industry described in our Annual Information Form, financial statements and MD&A for the fiscal period ended December 31, 2020 filed with the Canadian Securities Administrators and available at www.sedar.com. Although we have attempted to identify important factors that could cause actual actions, events or results to differ materially from those described in forward-looking statements, there may be other factors that cause actions, events or results not to be as anticipated, estimated or intended. There can be no assurance that forward-looking statements will prove to be accurate, as actual results and future events could differ materially from those anticipated in such statements. Accordingly, readers should not place undue reliance on forward-looking statements. We are under no obligation to update or alter any forward-looking statements except as required under applicable securities laws.
Bruce McLeod, President & CEO
Suite 1800 – Two Bentall Centre
555 Burrard Street
Vancouver, BC V7X 1M7
Tel 604 998-4175 Fax 604 998-1051
http://www.sabinagoldsilver.com
A photo accompanying this announcement is available at https://www.globenewswire.com/NewsRoom/AttachmentNg/5ec21fe3-395a-4b11-97c2-f0af7f22d248

Pan American Silver (PAAS) came out with quarterly earnings of $0.22 per share, missing the Zacks Consensus Estimate of $0.33 per share. This compares to earnings of $0.28 per share a year ago. These figures are adjusted for non-recurring items.
This quarterly report represents an earnings surprise of -33.33%. A quarter ago, it was expected that this silver mining company would post earnings of $0.31 per share when it actually produced earnings of $0.18, delivering a surprise of -41.94%.
Over the last four quarters, the company has surpassed consensus EPS estimates just once.
Pan American Silver, which belongs to the Zacks Mining – Silver industry, posted revenues of $382.13 million for the quarter ended June 2021, missing the Zacks Consensus Estimate by 16.40%. This compares to year-ago revenues of $249.51 million. The company has topped consensus revenue estimates just once over the last four quarters.
The sustainability of the stock's immediate price movement based on the recently-released numbers and future earnings expectations will mostly depend on management's commentary on the earnings call.
Pan American Silver shares have lost about 26.1% since the beginning of the year versus the S&P 500's gain of 18%.
What's Next for Pan American Silver?
While Pan American Silver has underperformed the market so far this year, the question that comes to investors' minds is: what's next for the stock?
There are no easy answers to this key question, but one reliable measure that can help investors address this is the company's earnings outlook. Not only does this include current consensus earnings expectations for the coming quarter(s), but also how these expectations have changed lately.
Empirical research shows a strong correlation between near-term stock movements and trends in earnings estimate revisions. Investors can track such revisions by themselves or rely on a tried-and-tested rating tool like the Zacks Rank, which has an impressive track record of harnessing the power of earnings estimate revisions.
Ahead of this earnings release, the estimate revisions trend for Pan American Silver was mixed. While the magnitude and direction of estimate revisions could change following the company's just-released earnings report, the current status translates into a Zacks Rank #3 (Hold) for the stock. So, the shares are expected to perform in line with the market in the near future. You can see the complete list of today's Zacks #1 Rank (Strong Buy) stocks here.
It will be interesting to see how estimates for the coming quarters and current fiscal year change in the days ahead. The current consensus EPS estimate is $0.33 on $458.55 million in revenues for the coming quarter and $1.42 on $1.79 billion in revenues for the current fiscal year.
Investors should be mindful of the fact that the outlook for the industry can have a material impact on the performance of the stock as well. In terms of the Zacks Industry Rank, Mining – Silver is currently in the bottom 4% of the 250 plus Zacks industries. Our research shows that the top 50% of the Zacks-ranked industries outperform the bottom 50% by a factor of more than 2 to 1.
Want the latest recommendations from Zacks Investment Research? Today, you can download 7 Best Stocks for the Next 30 Days. Click to get this free report
Pan American Silver Corp. (PAAS) : Free Stock Analysis Report
To read this article on Zacks.com click here.
Zacks Investment Research
Endeavour Silver (EXK) came out with quarterly earnings of $0.01 per share, missing the Zacks Consensus Estimate of $0.03 per share. This compares to loss of $0.02 per share a year ago. These figures are adjusted for non-recurring items.
This quarterly report represents an earnings surprise of -66.67%. A quarter ago, it was expected that this silver mining company would post earnings of $0.02 per share when it actually produced a loss of $0.03, delivering a surprise of -250%.
Over the last four quarters, the company has surpassed consensus EPS estimates just once.
Endeavour Silver, which belongs to the Zacks Mining – Silver industry, posted revenues of $47.78 million for the quarter ended June 2021, surpassing the Zacks Consensus Estimate by 1.33%. This compares to year-ago revenues of $20.2 million. The company has topped consensus revenue estimates three times over the last four quarters.
The sustainability of the stock's immediate price movement based on the recently-released numbers and future earnings expectations will mostly depend on management's commentary on the earnings call.
Endeavour Silver shares have lost about 11.1% since the beginning of the year versus the S&P 500's gain of 18%.
What's Next for Endeavour Silver?
While Endeavour Silver has underperformed the market so far this year, the question that comes to investors' minds is: what's next for the stock?
There are no easy answers to this key question, but one reliable measure that can help investors address this is the company's earnings outlook. Not only does this include current consensus earnings expectations for the coming quarter(s), but also how these expectations have changed lately.
Empirical research shows a strong correlation between near-term stock movements and trends in earnings estimate revisions. Investors can track such revisions by themselves or rely on a tried-and-tested rating tool like the Zacks Rank, which has an impressive track record of harnessing the power of earnings estimate revisions.
Ahead of this earnings release, the estimate revisions trend for Endeavour Silver was unfavorable. While the magnitude and direction of estimate revisions could change following the company's just-released earnings report, the current status translates into a Zacks Rank #4 (Sell) for the stock. So, the shares are expected to underperform the market in the near future. You can see the complete list of today's Zacks #1 Rank (Strong Buy) stocks here.
It will be interesting to see how estimates for the coming quarters and current fiscal year change in the days ahead. The current consensus EPS estimate is $0.07 on $49.7 million in revenues for the coming quarter and $0.22 on $172.67 million in revenues for the current fiscal year.
Investors should be mindful of the fact that the outlook for the industry can have a material impact on the performance of the stock as well. In terms of the Zacks Industry Rank, Mining – Silver is currently in the bottom 4% of the 250 plus Zacks industries. Our research shows that the top 50% of the Zacks-ranked industries outperform the bottom 50% by a factor of more than 2 to 1.
Want the latest recommendations from Zacks Investment Research? Today, you can download 7 Best Stocks for the Next 30 Days. Click to get this free report
Endeavour Silver Corporation (EXK) : Free Stock Analysis Report
To read this article on Zacks.com click here.
If you would like to receive our free newsletter via email, simply enter your email address below & click subscribe.
 Follow us on Twitter
 Become our facebook fan
CONNECT WITH US
Tweets
Tweet with hash tag #miningfeeds or @miningfeeds and your tweets will be displayed across this site.
MOST ACTIVE MINING STOCKS
Daily Gainers
 Midlands Minerals Corp. Midlands Minerals Corp. |
MEX.V | +66.88% |
| GoviEx Uranium Inc. |
GXU.V | +42.86% |
 Mount Burgess Mining NL Mount Burgess Mining NL |
MTB.AX | +33.33% |
| Sunridge Gold Corp. |
SGC.V | +30.77% |
| Casa Minerals Inc. |
CASA.V | +30.00% |
| Radisson Mining Resources Inc. |
RDS.V | +25.74% |
| International Lithium Corp. |
ILC.V | +25.00% |
| Poseidon Nickel Limited |
POS.AX | +25.00% |
| Richmond Minerals Inc. |
RMD.V | +23.53% |
| Encounter Resources Ltd. |
ENR.AX | +20.00% |