Nears Completion of Transformational Green Shift to Tactical Decarbonization
VIRGINIA CITY, Nev., Aug. 10, 2021 (GLOBE NEWSWIRE) — Comstock Mining Inc. (NYSE: LODE) (“Comstock” and the “Company”), an emerging innovator and leader in the sustainable extraction, valorization, and production of high value strategic materials that are essential to meeting the rapidly increasing global demand for clean energy, carbon-neutrality, and natural products, today announced its unaudited financial results for the periods ended June 30, 2021:
Selected Strategic Highlights
-
Net income of $1.9 million for the six months ended June 30, 2021, or $0.05 per basic and diluted share, inclusive of $2.6 million in net gains related to the change in fair value of certain assets.
-
Net increase in shareholders’ equity of $38.5 million for the six months ended June 30, 2021, resulting from restructuring, financing, and investment activities, including total debt elimination and $34.2 million increase in total assets from $43.1 million as of December 31, 2020, to $77.3 million as of June 30, 2021.
-
Solid liquidity, with cash, cash equivalents and restricted cash of $5.3 million, over $20.0 million available under committed investment facilities as of June 30, 2021, and non-dilutive sales efforts underway for non-strategic assets with an expected aggregate cash value of over $25.0 million.
-
Transformational plans are nearing completion, after successfully liquidating non-core assets, eliminating debt, acquiring new technologies, strengthening management, and launching new strategic lines of business.
-
Recently announced lithium-ion battery, industrial hemp, and mercury remediation lines of business are expected to put the Company on track for consolidated annualized revenues exceeding $100,000,000, $300,000,000, and $900,000,000 in 2023, 2024, and 2025, respectively, during the first three full years of operations, not counting the impact of additional pending acquisitions.
“Our transformational efforts have quickened and have been especially impactful during the first half of this year,” said Corrado DeGasperis, Comstock’s Executive Chairman and Chief Executive Officer. “As a result, we have no debt, significant assets and book equity, material non-dilutive sources of cash, a portfolio of cutting-edge clean technologies, and an expanded management team that is laser focused on building an ecosystem of strategic businesses with the capacity for exponential growth and extraordinary financial, natural, and social impacts.”
Focus on Value Creation from Throughput, Revenue, Cash, and Decarbonization
“We are systemically strengthening our organization in ways that sustainably contribute to humanity’s rapidly-escalating demand for increasingly scarce natural resources, including the strategic resources needed to fuel the worldwide surge in, and transition to, clean energy and carbon-neutrality,” added DeGasperis. “To that end, we are targeting a few more commercially viable clean technology transactions that position us for extraordinary growth.”
“Throughput, revenue, cash and decarbonization are the lowest common denominators in each of our existing businesses,” continued DeGasperis. “Our team is focused on that math and the tactical activities that will be necessary to enable rapid and exponential financial, natural and social gains in markets that affect millions, but we are also keenly aware of the costs. We’ve structured each of our acquisitions to minimize dilution, by seeding each line of business with protected uses of our cash and equity, while positioning each line of business with its own cash, equity, and balance sheets, at the project and facility level. We believe that doing so will be an extremely cost-effective way to accelerate and dramatically exceed our pledge to sustainably deliver more than $500 million in shareholder value by 2023. Frankly, we believe our existing platform is already worth multiples of that target based on comparable valuations currently exceeding billions for similar lines of business. Our plans for exceeding those values come down to speed, scale, and leverage, with carbon as the common thread.”
Breakthrough Lithium-Ion Battery Recycling Technologies Enable Extraordinary Increase in Throughput
Comstock previously announced the filing of a Written Determination of Hazardous Waste Recycling (“Application”) by LINICO Corporation (“LiNiCo”), and its state-of-the-art lithium-ion battery (“LIB”) recycling facility (“LIB Recycling Facility”) that has now been designed for increased capacity and yields at a fraction of the capital of the known alternatives. Construction of the first phase of LiNiCo’s new processes will commence at the LIB Recycling Facility upon approval of the Application, with anticipated completion and start-up during the first half of 2022.
About 500,000 tons of expired LIBs containing over $900 million in strategic metals are being landfilled annually. A recent industry report estimated annual growth to more than $26 billion over the next two decades. Once complete, LiNiCo’s first LIB Recycling Facility is expected to scale up to its initial nameplate capacity, exceeding 100,000 tons per year of LIBs over three years, with revenues exceeding $500,000,000, in its third full year.
Renewable Process Solutions, An Engineering Powerhouse
LiNiCo’s capacity breakthroughs are the direct result of our recently acquired engineering, procurement, and construction (“EPC”) company, Renewable Process Solutions, Inc. (“RPS”), and its founder, Mr. Rahul Bobbili.
“Almost instantaneously, RPS and its network of engineering and advanced manufacturing experts integrated themselves into the LiNiCo team, enhancing designs, ensuring quality, reducing capital requirements and shortening lead times,” stated Mr. DeGasperis. “When the RPS engineers began developing breakthrough lithium extraction processes for us in real time, with their existing know-how, we also recognized other compelling synergies.”
RPS and Mr. Bobbili have designed and built 21 advanced renewable fuels production facilities since 2006, and RPS currently provides EPC services for the metals, mining, and renewable fuels industries. RPS also provides advanced equipment manufacturing services through its affiliated manufacturing facilities in the United States and India, at consistently superior qualities and rates. RPS brings Comstock an extraordinary competitive advantage.
Industry Leading, Industrial Scale Hemp Systems
Comstock’s investment in recycling lithium, nickel, and cobalt for cathodes led the Company to identify sources of carbon for use in the production of the graphite needed for LIB anodes, including the possibility of extracting and valorizing carbon from various alternative sources of biomass, such as forestry wastes and industrial hemp.
Industrial hemp is an extraordinary natural resource with tens of thousands of known applications, including food, feed, fuel, and fiber, and an array of emerging applications in batteries, bioplastics, and other renewable alternatives to fossil fuel derived products. Hemp’s ability to produce over 400 natural phytochemicals, such as cannabidiol (“CBD”) and cannabigerol (“CBG”), has also garnered growing attention for the compelling potential of these phytochemicals in health and wellness applications. The corresponding green rush is propelling global demand and sales of industrial hemp products to grow to $6.9 billion worldwide by 2025, according to Hemp Industry Daily.
Comstock and MANA Corporation (“MANA”), acquired a 50% stake in a pre-existing large-scale solvent extraction facility (“Biosciences Facility”) from Lakeview Energy LLC, an experienced agriproducts management company (“Lakeview”), and formed a joint venture with Lakeview to build, operate, and grow the Biosciences Facility.
“We’re proud to have assembled a world class team of industry veterans to rapidly retrofit and commence large scale solvent extraction operations and set a new standard in the industrial hemp industry for quality, compliance, consistency, flexibility and speed at a remarkable scale,” stated Mr. DeGasperis. “Once retrofits are complete in mid-2022, our facility will generate significant free cash flow by servicing a rapidly growing customer base with wholesale hemp products through a suite of custom-tailored hemp extraction, remediation, and refining solutions.”
The Biosciences Facility is expected to scale up to its initial nameplate capacity exceeding 200,000 pounds per day over its first three years, as it extracts, remediates, and refines oil from industrial hemp to generate annualized revenues of over $400,000,000 in its third full year of operations based solely on the small oil fraction of hemp. The remaining biomass is mostly cellulose, with many known co-products that the Company is evaluating for decarbonization synergies, including electrification applications that Company believes have been hiding in plain sight.
Plain Sight Innovations
Comstock has been working closely this year with its research and development partner, Plain Sight Innovations LLC (“PSI”), on several new technologies, including existing and extremely exciting processes for the efficient extraction and valorization of carbon from ubiquitous low-cost sources of feedstock.
“We’re building an ecosystem of strategic extraction and valorization facilities with complimentary feedstocks and products,” continued DeGasperis. “The consumption of any product is powered by its feedstock and, as vast as some feedstock supplies may seem, they are all finite. The world is watching that story unfold in electrification products, with a current focus on the scarcity of lithium and other cathode constituents, and a shared goal of reducing global carbon emissions. However, every cathode in every LIB needs an anode, and the vast majority of anodes are comprised of synthetic graphite, the global supplies of which are nearly all met with carbon intensive fossil fuel derivatives. We see that to be counterproductive, and its exactly the sort of inevitable need that we intend to address with our innovations. We believe that we are positioned ahead of that curve with our carbon and graphite technology developments, and my own extensive experience in building and running carbon and graphite production facilities.”
Comstock believes that the global transition to clean energy, escalating population growth, and accelerating natural resource scarcities are converging into a “perfect storm” of global demand in a broad array of strategic materials, including carbon, metals, and energy – without the corresponding capacity to sustainably meet even a fraction of the demand. The Company is planning and building the capacity to make a material contribution to meeting that demand.
Accelerating Innovation
“Shifting human consumption practices from wasteful and carbon intensive to more profitable, yet sustainable, and carbon neutral or negative requires innovation at unprecedented scales and rates,” added DeGasperis. “Exponential growth requires exponential capacity. We’re designing and deploying our systems for that capacity with our systemic management approach and extensive existing technology portfolio, but we’re still going to need more breakthroughs, speed, and capacity. We strongly believe that breakthrough speed has arrived in the form of quantum computing.”
Classical computing relies on binary states in order to complete logical operations that are either on or off. True or false. One or zero. In contrast, quantum computing is based on physical systems that can be in multiple states simultaneously, with each state having a probability of occurring after measurement. For quantum, that state can simultaneously be black, white, and every shade of grey in between. The distinction is powerful, and it gives quantum computers the potential to process exponentially more operations far more efficiently than classical computers.
The Company invested in Quantum Generative Materials LLC (“GenMat”) to support its development of a proprietary quantum operating system that harnesses emerging quantum computing technologies to accelerate the innovation of breakthrough new materials for use in high-impact applications, including batteries, mining, and decarbonization.
“Quantum computing has the profound potential to resolve urgent challenges of our time, such as global resource scarcity and climate change,” said Mr. DeGasperis. “We’re proud to collaborate with GenMat’s rapidly growing world class team and strategic network of quantum computing professionals and material scientists as they develop exceptional technologies, including specific technologies for direct use in each of our lines of business.”
Comstock and GenMat are focused on applications that accelerate the development of new materials and processes that address resource scarcity by facilitating climate smart mining, electrification, and decarbonization. Consequently, in addition to its investment, Comstock also secured exclusive rights to use GenMat’s quantum technologies in each of those fields of use to complement and enhance its existing operations and planned new business developments.
Triple Bottom Line
DeGasperis concluded: “We are now building a self-sustaining system that develops, builds, scales, and operates systemically-managed, rapidly-scalable, throughput-generating businesses that serve very large, fast-growing markets that enable exponential revenue growth while making globally-meaningful contributions to atmospheric carbon reduction and positive social outcomes. Our plan to do so from here begins with rounding out and deploying our core systems, starting with the completion of some complementary acquisitions and other transactions during the second half of 2021, the completion of construction and the commencement of operations in our lithium-ion battery recycling and industrial hemp extraction facilities in 2022, and the rapid satisfaction of our performance objectives that exceeds our $500,000,000 market value goal well before 2023.”
Conference Call
The Company will host a conference call today, August 10, 2021 at 8:00 a.m. Pacific Time/11:00 a.m. Eastern Time to report Second Quarter results and provide a business update. The Webcast will include a moderated Q&A, after the prepared remarks. Please join the event 10 to 15 minutes prior to the scheduled start time. The link to register in advance for this live Webcast is as follows:
Register in Advance for Our Zoom Webinar
When: August 10, 2021 08:00 AM Pacific Time (US and Canada)
Topic: Comstock Mining Second Quarter 2021 Results and Business Update
Please click the link below to register in advance for this webinar:
https://us02web.zoom.us/webinar/register/WN_AEfv_xN7RoiYEYpzl55gUw
The recording of the Webcast will be available, within 48 hours of the call, on the Company website:
http://www.comstockmining.com/investors/investor-library
About Comstock Mining Inc.
Comstock Mining Inc. (NYSE: LODE) (the “Company”) is an emerging innovator and leader in the sustainable extraction, valorization, and production of scarce natural resources, with a focus on high value strategic materials that are essential to meeting the rapidly increasing global demand for clean energy, carbon-neutrality, and natural products. To learn more, please visit www.comstockmining.com.
Forward-Looking Statements
This press release and any related calls or discussions may include forward-looking statements within the meaning of Section 27A of the Securities Act of 1933, as amended, and Section 21E of the Securities Exchange Act of 1934, as amended. All statements, other than statements of historical facts, are forward-looking statements. The words “believe,” “expect,” “anticipate,” “estimate,” “project,” “plan,” “should,” “intend,” “may,” “will,” “would,” “potential” and similar expressions identify forward-looking statements, but are not the exclusive means of doing so. Forward-looking statements include statements about matters such as: consummation of all pending transactions; project, asset or Company valuations; future industry market conditions; future explorations, acquisitions, investments and asset sales; future performance of and closings under various agreements; future changes in our exploration activities; future estimated mineral resources; future prices and sales of, and demand for, our products; future operating margins; available resources; environmental conservation outcomes; future impacts of land entitlements and uses; future permitting activities and needs therefor; future production capacity and operations; future operating and overhead costs; future capital expenditures and their impact on us; future impacts of operational and management changes (including changes in the board of directors); future changes in business strategies, planning and tactics and impacts of recent or future changes; future employment and contributions of personnel, including consultants; future land sales, investments, acquisitions, joint ventures, strategic alliances, business combinations, operational, tax, financial and restructuring initiatives; the nature and timing of and accounting for restructuring charges and derivative liabilities and the impact thereof; contingencies; future environmental compliance and changes in the regulatory environment; future offerings of equity or debt securities; asset sales and associated costs; future working capital, costs, revenues, business opportunities, debt levels, cash flows, margins, earnings and growth. These statements are based on assumptions and assessments made by our management in light of their experience and their perception of historical and current trends, current conditions, possible future developments and other factors they believe to be appropriate. Forward-looking statements are not guarantees, representations or warranties and are subject to risks and uncertainties, many of which are unforeseeable and beyond our control and could cause actual results, developments and business decisions to differ materially from those contemplated by such forward-looking statements. Some of those risks and uncertainties include the risk factors set forth in our filings with the SEC and the following: counterparty risks; capital markets’ valuation and pricing risks; adverse effects of climate changes or natural disasters; global economic and capital market uncertainties; the speculative nature of gold or mineral exploration, including risks of diminishing quantities or grades of qualified resources; operational or technical difficulties in connection with exploration or mining activities; contests over title to properties; potential dilution to our stockholders from our stock issuances and recapitalization and balance sheet restructuring activities; potential inability to comply with applicable government regulations or law; adoption of or changes in legislation or regulations adversely affecting businesses; permitting constraints or delays; decisions regarding business opportunities that may be presented to, or pursued by, us or others; the impact of, or the non-performance by parties under agreements relating to, acquisitions, joint ventures, strategic alliances, business combinations, asset sales, leases, options and investments to which we may be party; changes in the United States or other monetary or fiscal policies or regulations; interruptions in production capabilities due to capital constraints; equipment failures; fluctuation of prices for gold or certain other commodities (such as silver, zinc, cyanide, water, diesel fuel and electricity); changes in generally accepted accounting principles; adverse effects of terrorism and geopolitical events; potential inability to implement business strategies; potential inability to grow revenues; potential inability to attract and retain key personnel; interruptions in delivery of critical supplies, equipment and raw materials due to credit or other limitations imposed by vendors or others; assertion of claims, lawsuits and proceedings; potential inability to satisfy debt and lease obligations; potential inability to maintain an effective system of internal controls over financial reporting; potential inability or failure to timely file periodic reports with the SEC; potential inability to list our securities on any securities exchange or market; inability to maintain the listing of our securities; and work stoppages or other labor difficulties. Occurrence of such events or circumstances could have a material adverse effect on our business, financial condition, results of operations or cash flows or the market price of our securities. All subsequent written and oral forward-looking statements by or attributable to us or persons acting on our behalf are expressly qualified in their entirety by these factors. Except as may be required by securities or other law, we undertake no obligation to publicly update or revise any forward-looking statements, whether as a result of new information, future events, or otherwise.
Neither this press release nor any related calls or discussions constitutes an offer to sell, the solicitation of an offer to buy or a recommendation with respect to any securities of the Company.
|
Contact Information |
||
|
Comstock Mining Inc. |
Corrado De Gasperis |
Zach Spencer |

Comstock Mining, Inc. (LODE) came out with a quarterly loss of $0.04 per share versus the Zacks Consensus Estimate of $0.01. This compares to earnings of $0.05 per share a year ago. These figures are adjusted for non-recurring items.
This quarterly report represents an earnings surprise of -500%. A quarter ago, it was expected that this company would post a loss of $0.04 per share when it actually produced earnings of $0.02, delivering a surprise of 150%.
Over the last four quarters, the company has surpassed consensus EPS estimates just once.
Comstock Mining, Inc.Which belongs to the Zacks Mining – Gold industry, posted revenues of $0.06 million for the quarter ended June 2021, missing the Zacks Consensus Estimate by 21.43%. This compares to year-ago revenues of $0.05 million. The company has not been able to beat consensus revenue estimates over the last four quarters.
The sustainability of the stock's immediate price movement based on the recently-released numbers and future earnings expectations will mostly depend on management's commentary on the earnings call.
Comstock Mining, Inc. Shares have added about 181.7% since the beginning of the year versus the S&P 500's gain of 18%.
What's Next for Comstock Mining, Inc.
While Comstock Mining, Inc. Has outperformed the market so far this year, the question that comes to investors' minds is: what's next for the stock?
There are no easy answers to this key question, but one reliable measure that can help investors address this is the company's earnings outlook. Not only does this include current consensus earnings expectations for the coming quarter(s), but also how these expectations have changed lately.
Empirical research shows a strong correlation between near-term stock movements and trends in earnings estimate revisions. Investors can track such revisions by themselves or rely on a tried-and-tested rating tool like the Zacks Rank, which has an impressive track record of harnessing the power of earnings estimate revisions.
Ahead of this earnings release, the estimate revisions trend for Comstock Mining, Inc. Was mixed. While the magnitude and direction of estimate revisions could change following the company's just-released earnings report, the current status translates into a Zacks Rank #3 (Hold) for the stock. So, the shares are expected to perform in line with the market in the near future. You can see the complete list of today's Zacks #1 Rank (Strong Buy) stocks here.
It will be interesting to see how estimates for the coming quarters and current fiscal year change in the days ahead. The current consensus EPS estimate is $0.01 on $0.09 million in revenues for the coming quarter and $0.23 on $0.32 million in revenues for the current fiscal year.
Investors should be mindful of the fact that the outlook for the industry can have a material impact on the performance of the stock as well. In terms of the Zacks Industry Rank, Mining – Gold is currently in the bottom 27% of the 250 plus Zacks industries. Our research shows that the top 50% of the Zacks-ranked industries outperform the bottom 50% by a factor of more than 2 to 1.
Want the latest recommendations from Zacks Investment Research? Today, you can download 7 Best Stocks for the Next 30 Days. Click to get this free report
Comstock Mining, Inc. (LODE) : Free Stock Analysis Report
To read this article on Zacks.com click here.
Zacks Investment Research
COEUR D'ALENE, Idaho, August 09, 2021–(BUSINESS WIRE)–Hecla Mining Company (NYSE:HL) today announced it will release another CEO webcast, Hecla’s Q2 2021 Performance Review, from its ongoing series. The webcast will be available on the Company’s website today.
This webcast series provides additional information on the Company’s high-grade, low-cost silver mines. Videos will be available on the Company’s website at www.hecla-mining.com and various social media platforms.
ABOUT HECLA
Founded in 1891, Hecla Mining Company (NYSE:HL) is the largest silver producer in the United States. In addition to operating mines in Alaska, Idaho and Quebec, Canada, the Company owns a number of exploration properties and pre-development projects in world-class silver and gold mining districts throughout North America.
Category: Press Release
View source version on businesswire.com: https://www.businesswire.com/news/home/20210809005728/en/
Contacts
Jeanne DuPont
Senior Communications Coordinator
800-HECLA91 (800-432-5291)
Investor Relations
Email: hmc-info@hecla-mining.com
Website: www.hecla-mining.com
VANCOUVER, BC, Aug. 9, 2021 /CNW/ – Trading resumes in:
Company: Salazar Resources Limited
TSX-Venture Symbol: SRL
All Issues: Yes
Resumption (ET): 12:30 PM
IIROC can make a decision to impose a temporary suspension (halt) of trading in a security of a publicly-listed company. Trading halts are implemented to ensure a fair and orderly market. IIROC is the national self-regulatory organization which oversees all investment dealers and trading activity on debt and equity marketplaces in Canada.
SOURCE Investment Industry Regulatory Organization of Canada (IIROC) – Halts/Resumptions

View original content: http://www.newswire.ca/en/releases/archive/August2021/09/c1510.html
VANCOUVER, BC, Aug. 9, 2021 /CNW/ – The following issues have been halted by IIROC:
Company: Salazar Resources Limited
TSX-Venture Symbol: SRL
All Issues: Yes
Reason: At the Request of the Company Pending News
Halt Time (ET): 8:57 AM
IIROC can make a decision to impose a temporary suspension (halt) of trading in a security of a publicly-listed company. Trading halts are implemented to ensure a fair and orderly market. IIROC is the national self-regulatory organization which oversees all investment dealers and trading activity on debt and equity marketplaces in Canada.
SOURCE Investment Industry Regulatory Organization of Canada (IIROC) – Halts/Resumptions

View original content: http://www.newswire.ca/en/releases/archive/August2021/09/c1313.html
DENVER, CO / ACCESSWIRE / August 9, 2021 / Gold Resource Corporation (NYSE American:GORO) (the "Company", "We", "Our" or "GRC") has confirmed the up-dip extension of the Switchback vein system, approximately 30 meters (two mine levels) above the existing mine workings and has intersected additional mineralization outside of current mining areas which provides the Company with the opportunity to potentially develop a new mineralized zone.
Mr. Allen Palmiere, President and CEO of Gold Resource Corporation. "The results of drilling completed in the first half of 2021 have confirmed the potential for identifying new resources at the Don David Gold Mine. The focus of our geologists, has been to explore new areas and to continue identifying additional mineralization along strike and up-dip at shallower elevations above the current mine workings."
Mr. Nick Suter, Interim Vice President, Exploration commented, "Confirmation of the continuity of the robust Sandy vein at higher levels presents an opportunity to develop a new mineralized zone in the more easily accessible northern part of the Arista mine. Our objectives going forward continue to be to test these zones and extensions in order to expand resources of this growing system, as well as continue infill drilling to upgrade mineralized material to measured and indicated mineral resources."
Switchback drill highlights include:
Hole # 521013:
-
5.37 m grading 1.51 g/t gold, 95 g/t silver, 0.21% copper, 1.22% lead, 1.84% zinc
incl. 2.90 m grading 2.61 g/t gold, 155 g/t silver, 0.25% copper, 2.07% lead, 3.00% zinc
Hole# 521014:
-
0.78 m grading 0.82 g/t gold, 640 g/t silver, 0.24% copper, 0.24% lead, 0.84% zinc
Hole# 521015:
-
1.55m grading 0.01 g/t gold, 2,610 g/t silver, 0.31% copper, 0% lead, 0% zinc
Hole # 521018:
-
0.36 m grading 4.45 g/t gold, 4,460 g/t silver, 0.03% copper, 1.05% lead, 2.36% zinc
The first two holes drilled from an underground exploration drill station located in a development ramp of the mine's Switchback vein system, confirmed the up-dip extension of the Switchback vein system, approximately 30 meters (two mine levels) above the existing mine workings. These intersections extend near mine up-dip continuity further to the west-northwest, with both the Soledad and Selene veins intersected. The latter two drill holes, drilled from a drill station located in a dedicated exploration development drift in the hanging-wall of the Switchback system, have identified narrow structures that have been correlated to veins in the Switchback system; these structures are approximately 80 to 100 meters above the previously identified upper limit of the Switchback vein system and extend the known mineralization to shallower depths.
|
Hole # |
Vein |
From |
To |
Interval |
Au |
Ag |
Cu |
Pb |
Zn |
|
|
Meters |
Meters |
Meters |
g/t |
g/t |
% |
% |
% |
|||
|
521013 |
Soledad |
208.36 |
213.73 |
5.37 |
1.51 |
95 |
0.21 |
1.22 |
1.84 |
|
|
Incl. |
210.83 |
213.73 |
2.90 |
2.61 |
155 |
0.25 |
2.07 |
3.00 |
||
|
Selene |
223.91 |
226.11 |
2.20 |
1.03 |
25 |
0.62 |
0.34 |
0.99 |
||
|
521014 |
Vein |
135.53 |
136.61 |
1.08 |
1.02 |
26 |
`0.12 |
2.63 |
4.57 |
|
|
Soledad |
194.07 |
201.12 |
7.05 |
1.32 |
23 |
0.29 |
1.07 |
3.25 |
||
|
Selene |
206.22 |
207.00 |
0.78 |
0.82 |
640 |
0.24 |
0.24 |
0.84 |
||
|
521015 |
Fault |
218.25 |
219.80 |
1.55 |
0.01 |
2,610 |
0.31 |
0.00 |
0.01 |
|
|
Selene (?) |
222.80 |
224.38 |
1.58 |
0.07 |
100 |
0.05 |
0.17 |
0.19 |
||
|
Incl. |
224.10 |
224.38 |
0.28 |
0.13 |
233 |
0.03 |
0.55 |
0.50 |
||
|
521018 |
Soledad (?) |
241.12 |
244.28 |
3.16 |
0.76 |
99 |
0.03 |
0.27 |
0.48 |
|
|
Incl. |
241.12 |
242.25 |
1.13 |
0.65 |
188 |
0.03 |
0.58 |
0.89 |
||
|
SBN1 (?) |
321.68 |
322.04 |
0.36 |
4.45 |
4,460 |
0.03 |
1.05 |
2.36 |
Assays by ALS, Vancouver, BC Canada. Meters down hole, Not true width.
Plan View of Switchback mining Area for Reference Showing holes referenced in above table

Cross Section view (A-AA), looking west-northwest, of Switchback mine area to provide context for elevation of holes relative to mine workings.

Sandy vein system drill highlights include:
Hole # 521021:
-
8.67 m grading 1.61 g/t gold, 33 g/t silver, 0.48% copper, 2.40% lead, 2.13% zinc
incl. 2.77 m grading 4.88 g/t gold, 75 g/t silver, 0.93% copper, 6.40% lead, 3.96% zinc
Hole # 521022:
-
1.18 m grading 2.32 g/t gold, 19 g/t silver, 0.21% copper, 1.38% lead, 6.79% zinc
(m=meters, g/t=gram per tonne; full drill table below)
In addition, five (5) drill holes confirmed the continuity of the mineralized Sandy 1 vein which is sub-parallel to the Switchback vein system and between the Arista and Switchback vein systems. In addition to the three holes reported below, one hole hit the vein system, but it was not significantly mineralized in the area of intersection and the results from the final hole are pending. The Sandy vein system is believed to be a feeder to the higher elevation Sasha and Sadie veins drilled from the same drill station located approximately 500 meters to the northeast of the mine's Arista vein system. The Sandy 1 vein is open on dip and along strike to the northwest, whilst southeastern potential, including linkage to the Switchback system, is being evaluated.
Drill highlights in this area include:
|
Hole # |
Vein |
From |
To |
Interval |
Au |
Ag |
Cu |
Pb |
Zn |
|
|
Meters |
Meters |
Meters |
g/t |
g/t |
% |
% |
% |
|||
|
521019 |
Sandy 1 |
251.60 |
258.66 |
7.06 |
0.16 |
30 |
0.34 |
1.25 |
2.08 |
|
|
Incl. |
253.76 |
255.02 |
1.26 |
0.09 |
70 |
0.66 |
4.35 |
4.72 |
||
|
521021 |
Sandy 1 |
275.77 |
284.44 |
8.67 |
1.61 |
33 |
0.48 |
2.40 |
2.13 |
|
|
Incl. |
278.23 |
281.00 |
2.77 |
4.88 |
75 |
0.93 |
6.40 |
3.96 |
||
|
521022 |
Sandy 1 |
221.58 |
226.80 |
5.22 |
0.07 |
25 |
0.29 |
2.40 |
1.62 |
|
|
Incl. |
221.58 |
223.14 |
1.56 |
0.12 |
51 |
0.19 |
6.12 |
3.10 |
||
|
Vein |
236.66 |
237.84 |
1.18 |
2.32 |
19 |
0.21 |
1.38 |
6.79 |
Assays by ALS, Vancouver, BC Canada. Metres down hole, Not true width.
Plan View of dedicated exploration Drill Development North for Reference Showing holes referenced in above table (highlighted drill stations have drilling planned for Q3 and q4)

Cross Section view (B-BB), looking northwest, of Sandy 1 vein area to provide context of holes relative to mine workings.

About GRC:
Gold Resource Corporation is a gold and silver producer, developer, and explorer with operations in Oaxaca, Mexico. Under the direction of a new board and senior leadership, the focus is to unlock the significant upside potential of its existing infrastructure and large land position surrounding the mine. For more information, please visit GRC's website, located at www.goldresourcecorp.com and read the Company's 10-K for an understanding of the risk factors involved.
Cautionary Statements:
This press release contains forward-looking statements that involve risks and uncertainties. The statements contained in this press release that are not purely historical are forward-looking statements within the meaning of Section 27A of the Securities Act and Section 21E of the Exchange Act. When used in this press release, the words "plan", "target", "anticipate," "believe," "estimate," "intend" and "expect" and similar expressions are intended to identify such forward-looking statements. Such forward-looking statements include, without limitation, the statements regarding Gold Resource Corporation's strategy, future plans for production, future expenses and costs, future liquidity and capital resources, and estimates of mineralized material. All forward-looking statements in this press release are based upon information available to Gold Resource Corporation on the date of this press release, and the company assumes no obligation to update any such forward-looking statements. Forward-looking statements involve a number of risks and uncertainties, and there can be no assurance that such statements will prove to be accurate. The Company's actual results could differ materially from those discussed in this press release. In particular, the scope, duration, and impact of the COVID-19 pandemic on mining operations,Company employees, and supply chains as well as the scope, duration and impact of government action aimed at mitigating the pandemic may cause the actual results and future events to differ materially from those expressed or implied by such forward-looking information. Also, there can be no assurance that production will continue at any specific rate. Factors that could cause or contribute to such differences include, but are not limited to, those discussed in the Company's 10-Q filed with the SEC.
For further information please contact:
Ann Wilkinson
Vice President, Investor Relations and Corporate Affairs
Ann.Wilkinson@GRC-USA.com
www.goldresourcecorp.com
SOURCE: Gold Resource Corporation
View source version on accesswire.com:
https://www.accesswire.com/659037/Gold-Resource-Corporation-Q2-2021-Drill-Results-Adds-Mineralized-Material
TORONTO, Aug. 9, 2021 /CNW/ – Adventus Mining Corporation ("Adventus") (TSXV: ADZN) (OTCQX: ADVZF) and Salazar Resources Limited ("Salazar") (TSXV: SRL) (OTCQB: SRLZF) (collectively the "Partners") are pleased to announce the identification of a new volcanogenic massive sulphide ("VMS") system approximately 4.5 km southwest of the El Domo VMS deposit ("El Domo") located within the 21,537-hectare Curipamba project in central Ecuador.
Highlights – Drill Results from the Agua Santa Target at Curipamba:
-
CREG-008 was the first drill hole at the Agua Santa target and intersected 6.34 metres of 1.77% copper, 1.46 g/t gold, 7.45% zinc, 23.2 g/t silver, and 0.24% lead – including 1.40 metres of 1.58% copper, 2.67 g/t gold, 31.20% zinc, 55.0 g/t silver, and 1.01% lead
-
One drill rig is actively working at Agua Santa following up the massive sulphide mineralization identified in drill hole CREG-008
Regional drilling on the Agua Santa target (Figure 1) started mid-June 2021 and six drill holes have been successfully completed totaling 1,588 metres with one drill hole in progress. VMS mineralization was identified in the first drill hole of the work program designed to test the edge of a Mobile MT ("MMT") airborne geophysical anomaly (Figure 1) that coincided with both favourable geology and surface geochemistry results from prospecting in nearby creek beds. The drill site location was limited due to limited access to surface rights, but the Partners have recently purchased additional surface rights providing wider access and coverage of the MMT geophysical anomaly for additional drilling.
Figure 1: Drill Collar Location Map

Drill hole CREG-008 (Figure 2) intersected a different volcanic stratigraphy than El Domo, dominated by mafic volcanic rocks with massive sulphide intersected in three separate intervals from 60.52 to 66.86 metres with variably mineralized volcaniclastic rocks in between the massive sulphide, noting the highly fragmental appearance of the mineralization.
Figure 2: Drill Section – First drill hole CREG-008 at the Agua Santa target

|
Drill Hole |
From (m) |
To (m) |
Thickness (m) |
Cu |
Au |
Zn |
Ag |
Pb |
Approx. True |
|
CREG-008 |
60.52 |
66.86 |
6.34 |
1.77 |
1.46 |
7.45 |
23.2 |
0.24 |
N/A |
|
including |
60.52 |
61.92 |
1.40 |
1.58 |
2.67 |
31.20 |
55.0 |
1.01 |
N/A |
|
(1) |
This is an early-stage exploration project, meaning geological modeling has not determined the orientation of stratigraphy to accurately determine an approximate true thickness for lithologies and mineralization |
In the footwall of the massive sulphide mineralization in CREG-008, several broad zones of pyritic stringer stockwork in massive mafic volcanic rocks were observed with focused hydrothermal alteration halos directly around the mineralization. The strongest occurrence of pyritic stringer stockwork in CREG-008 occurs from 158.00 to 164.60 metres of semi-massive to massive sulphide. No significant results were obtained from the pyritic stringer stockwork. Analytical results from the additional drill holes at Agua Santa will be released once data has been received from the laboratory and the results have passed the Partners' quality assurance and quality control ("QAQC") protocols. Drill collar locations of all drill holes are presented in Table 1.
As a result of the identification of this new VMS system, the Partners have increased the regional drilling budget from 4,000 metres to 6,000 metres in 2021, principally to further assess the Agua Santa area. Other high priority targets defined during the 2020 target generation initiative process remain untested (see January 21, 2020 news release). Of key importance is that most of these targets are new and have not seen significant exploration or drilling historically.
Technical Information and QAQC
The Curipamba project work program is being managed and reviewed by Vice President Exploration, Jason Dunning, M.Sc., P.Geo., a Qualified Person within the meaning of NI 43-101. Salazar staff collect and process samples that are securely sealed and shipped to Bureau Veritas ("BV") in Quito for sample preparation that includes crushing and milling to prepare pulps that are then split for shipment to their facility in Vancouver, Canada for analysis. All assay data have undergone internal validation of QAQC; noting there is an established sampling control program with blind insertion of assay blanks, certified industry standards and sample duplicates for the Curipamba project. A QAQC program is also in place at BV and includes insertion of blanks, standards, and duplicate reanalysis of selected samples. BV's quality system complies with the requirements for the International Standards ISO 9001:2000 and ISO 17025: 1999. At BV, samples from regional drilling have silver and base metals analyzed by a modified ore grade 24-element aqua regia technique with ICP-ES finish. Gold is analyzed by fire assay fusion with AAS finish. Overlimit protocols are in place for gold, silver, copper, lead, and zinc.
Qualified Person
The technical information of this news release has been reviewed and verified as accurate by Mr. Jason Dunning, M.Sc., P.Geo., Vice President Exploration for Adventus, a non-Independent Qualified Person, as defined by NI 43-101.
About Adventus
Adventus Mining Corporation is an Ecuador focused copper-gold exploration and development company. Its strategic shareholders include Altius Minerals Corporation, Greenstone Resources LP, Wheaton Precious Metals Corp., and the Nobis Group of Ecuador. Adventus is advancing the El Domo copper-gold project through a feasibility study, while exploring the broader Curipamba district. In addition, Adventus is engaged in a country-wide exploration alliance with its partners in Ecuador, which has incorporated the Pijili and Santiago copper-gold porphyry projects to date. Adventus also controls an exploration project portfolio in Ireland with South32 Limited as funding partner as well as an investment portfolio of equities in several exploration companies. Adventus is based in Toronto, Canada, and is listed on the TSX Venture Exchange under the symbol ADZN and trades on the OTCQX under the symbol ADVZF.
About Salazar
Salazar Resources Limited is focused on creating value and positive change through discovery, exploration, and development in Ecuador. The team has an unrivalled understanding of the geology in-country and has played an integral role in the discovery of many of the major projects in Ecuador, including the two newest operating gold and copper mines. Salazar Resources has a wholly owned pipeline of copper-gold exploration projects across Ecuador with a strategy to make another commercial discovery and farm-out non-core assets. The Company actively engages with Ecuadorian communities and together with the Salazar family it co-founded The Salazar Foundation, an independent non-profit organization dedicated to sustainable progress through economic development. The Company already has carried interests in three projects. At its maiden discovery, Curipamba, Salazar Resources has a 25% stake fully carried through to production. At two copper-gold porphyry projects, Pijili and Santiago, the Company has a 20% stake fully carried through to a construction decision.
Neither the TSX Venture Exchange nor its Regulation Services Provider (as that term is defined in the policies of the TSX Venture Exchange) accepts responsibility for the adequacy or accuracy of this news release.
This press release contains "forward -looking information" within the meaning of applicable Canadian securities laws. Any statements that express or involve discussions with respect to predictions, expectations, beliefs, plans, projections, objectives, assumptions or future events or performance (often, but not always, identified by words or phrases such as "believes", "anticipates", "expects", "is expected", "scheduled", "estimates", "pending", "intends", "plans", "forecasts", "targets", or "hopes", or variations of such words and phrases or statements that certain actions, events or results "may", "could", "would", "will", "should" "might", "will be taken", or "occur" and similar expressions) are not statements of historical fact and may be forward-looking statements.
Forward-looking information herein includes, but is not limited to, statements that address activities, events, or developments that Adventus and Salazar expect or anticipate will or may occur in the future. Although Adventus and Salazar have attempted to identify important factors that could cause actual actions, events, or results to differ materially from those described in forward-looking information, there may be other factors that cause actions, events or results not to be as anticipated, estimated, or intended. There can be no assurance that such information will prove to be accurate, and actual results and future events could differ materially from those anticipated in such information. Accordingly, readers should not place undue reliance on forward-looking information. Adventus and Salazar undertake to update any forward-looking information except in accordance with applicable securities laws.
Please also visit the Adventus website at www.adventusmining.com and LinkedIn page at https://www.linkedin.com/company/adventus-mining-corporation.
Table 1: Drill Collar Information (UTM Datum – Provisional South American 1956, Zone 17)
|
Hole ID |
EAST |
NORTH |
ELEV |
AZIMUTH |
DIP |
DEPTH |
COMMENT |
|
CREG-008 |
691805 |
9851410 |
448 |
270 |
-50 |
323.90 |
Successfully completed per design |
|
CREG-009 |
691855 |
9851475 |
445 |
270 |
-50 |
258.35 |
Successfully completed per design; results pending |
|
CREG-010 |
691778 |
9851372 |
453 |
270 |
-50 |
284.90 |
Successfully completed per design; results pending |
|
CREG-011 |
691805 |
9851410 |
448 |
270 |
-85 |
242.45 |
Successfully completed per design; results pending |
|
CREG-012 |
691908 |
9851586 |
460 |
270 |
-50 |
284.55 |
Successfully completed per design; results pending |
|
CREG-013 |
691859 |
9851410 |
420 |
270 |
-85 |
203.25 |
Successfully completed per design; results pending |
|
CREG-014 |
691705 |
9851410 |
465 |
270 |
-50 |
N/A |
In Progress |

SOURCE Adventus Mining Corporation

View original content to download multimedia: http://www.newswire.ca/en/releases/archive/August2021/09/c8459.html
VANCOUVER, British Columbia, Aug. 09, 2021 (GLOBE NEWSWIRE) — Pretium Resources Inc. (TSX/NYSE:PVG) (“Pretivm” or the “Company”) announces today that it has amended its existing credit facility (the “Amended Loan Facility”) on favourable terms, increasing the Loan Facility size to US$350 million from its current US$300 million. The Amended Loan Facility is comprised of a US$100 million non-revolving term credit facility (the “Term Facility”) and a US$250 million revolving credit facility (the “Revolving Facility”).
The Term Facility was used to refinance the existing term loan (US$100 million on closing date) and the Revolving Facility will be available for general corporate purposes. The Amended Loan Facility has been made available for a term of four years, maturing on August 8, 2025.
“The increase in available liquidity combined with our strong financial performance provides us with flexibility and positions us to seize operational and strategic opportunities as they arise,” said Jacques Perron, President and Chief Executive Officer of Pretivm.
The Term Facility is to be repaid by way of seventeen equal quarterly installments of principal plus accrued interest commencing on September 30th, 2021. Any funds drawn on the Revolving Facility are repayable in a single, lump sum payment (principal and all accrued and unpaid interest) on the maturity date.
The Amended Loan Facility is available by way of US dollar London Interbank Offered Rate (“LIBOR”) loans that bear interest at LIBOR (or Secured Overnight Financing Rate, after the cessation of LIBOR) plus an applicable margin (ranging from 2.5% to 3.5%) determined based on the Company’s net leverage ratio, as well as other customary borrowing options. The Amended Loan Facility includes standard and customary finance terms and conditions including with respect to fees, representations, warranties, and covenants.
The terms and conditions of the Amended Loan Facility are set out in the Amended and Restated Credit Agreement made among the Company and a syndicate of lenders. The Bank of Nova Scotia acted as administrative agent, the Bank of Nova Scotia, ING Capital LLC and SG Americas Securities, LLC acted as the joint lead arrangers and joint bookrunners, with ING Capital LLC and SG Americas Securities, LLC acting as co-syndication Agents.
About Pretivm
Pretivm is an intermediate gold producer with the high-grade gold underground Brucejack Mine.
For further information contact:
Troy Shultz
Manager, Investor Relations &
Corporate Communications
Pretium Resources Inc.
Suite 2300, Four Bentall Centre, 1055 Dunsmuir Street
PO Box 49334 Vancouver, BC V7X 1L4
(604) 558-1784
invest@pretivm.com
(SEDAR filings: Pretium Resources Inc.)
Regarding Forward-Looking Information
This news release contains “forward-looking information” and “forward looking statements”, within the meaning of applicable Canadian and United States securities legislation (collectively herein referred to as “forward-looking information”), including the “safe harbour” provisions of Canadian provincial securities legislation and the U.S. Private Securities Litigation Reform Act of 1995, Section 21E of the U.S. Securities Exchange Act of 1934, as amended, and Section 27A of the U.S. Securities Act of 1933, as amended.
Wherever possible, words such as “plans”, “expects”, “guidance”, “projects”, “assumes”, “budget”, “strategy”, “scheduled”, “estimates”, “forecasts”, “anticipates”, “believes”, “intends”, “modeled”, “targets” and similar expressions or statements that certain actions, events or results “may”, “could”, “would”, “might” or “will” be taken, occur or be achieved, or the negative forms of any of these terms and similar expressions, have been used to identify forward-looking information. Forward-looking information may include, but is not limited to, statements with respect to: the Amended Loan Facility, including its terms, use of funds, maturity and repayment; our liquidity and the adequacy of our financial resources (including capital resources); our intentions with respect to our capital resources; capital allocation plans; and our financing activities, including plans for the use of proceeds thereof. Any statements that express or involve discussions with respect to predictions, expectations, beliefs, plans, projections, objectives, assumptions or future events or performance are not statements of historical fact and may be forward-looking information.
Forward-looking information is subject to a variety of known and unknown risks, uncertainties and other factors that could cause actual results, actions, events, conditions, performance or achievements to materially differ from those expressed or implied by the forward-looking information, including, without limitation, those related to: uncertainty as to the outcome of legal proceedings; the effect of indebtedness on cash flow and business operations; the effect of a pandemic and particularly the COVID-19 outbreak as a global pandemic and at the Brucejack Mine on the Company’s business, financial condition and results of operations and the impact of the COVID-19 outbreak on our workforce, suppliers and other essential resources and what effect those impacts, if they occur, would have on our business, financial condition and results of operations; the effectiveness of our COVID-19 management plans, related protocols and preventative measures; the effect of restrictive covenants pursuant to the Amended Loan Facility; assumptions regarding expected capital costs, operating costs and expenditures, production schedules, economic returns and other projections; our production, gold grade, milling recovery, cash flow and cost estimates, including the accuracy thereof; commodity price fluctuations, including gold and silver price volatility; the accuracy of our Mineral Resource and Reserve estimates (including with respect to size, grade and mining and milling recoverability) and the geological, operational costs and price assumptions on which they are based; our need or ability to raise enough capital to mine, develop, expand or complete further exploration programs on our mineral properties; our ability to generate operating revenues and cash flow in the future; and such other risks as are identified in Pretivm’s public disclosure documents filed on SEDAR at www.sedar.com and in the United States through EDGAR at the Security and Exchange Commission’s website at www.sec.gov (collectively, the “Pretivm Disclosure Documents”). This list is not exhaustive of the factors that may affect any of our forward-looking information. Although we have attempted to identify important factors that could cause actual results, actions, events, conditions, performance or achievements to differ materially from those contained in forward-looking information, there may be other factors that cause results, actions, events, conditions, performance or achievements to differ from those anticipated, estimated or intended.
Our forward-looking information is based on the assumptions, beliefs, expectations and opinions of management on the date the statements are made, many of which may be difficult to predict and beyond our control. In connection with the forward-looking information contained in this news release, we have made certain assumptions about, among other things: our business and operations and that no significant event will occur outside of our normal course of business and operations (other than as expressly set out herein); the impact of the COVID-19 pandemic and outbreak, including on our operations and workforce; planned exploration, development and production activities and the results, costs and timing thereof; future price of gold and silver and other metal prices; the accuracy of our Mineral Resource and Mineral Reserve estimates and related information, analyses and interpretations (including with respect to any updates or anticipated updates); the geology and mineralization of the Brucejack Mine; operating conditions; capital and operating cost estimates; production and processing estimates; the results, costs and timing of future exploration and drilling; timelines and similar statements relating to the economic viability of the Brucejack Mine; the geopolitical, economic, permitting and legal climate that we operate in; the adequacy of our financial resources, and our ability to raise any necessary additional capital on reasonable terms; our ability to satisfy the terms and conditions of our debt obligations; commodity prices; currency exchange rates and interest rates; political and regulatory stability; requirements under applicable laws; market competition; sustained labour stability and availability of equipment; positive relations with local groups; favourable equity and debt capital markets; stability in financial capital markets; and the litigation we are currently involved in. Although we believe that the assumptions inherent in forward-looking information are reasonable as of the date of this news release, these assumptions are subject to significant business, social, economic, political, regulatory, competitive and other risks and uncertainties, contingencies and other factors that could cause actual actions, events, conditions, results, performance or achievements to be materially different from those projected in the forward-looking information. The Company cautions that the foregoing list of assumptions is not exhaustive. Other events or circumstances could cause actual results to differ materially from those estimated or projected and expressed in, or implied by, the forward-looking information contained in this news release.
Additional information about the risks and uncertainties concerning forward-looking information and material factors or assumptions on which such forward-looking information is based is provided in the Pretivm Disclosure Documents.
Forward-looking information is not a guarantee of future performance. There can be no assurance that forward-looking information will prove to be accurate, as actual results and future events could differ materially from those anticipated in such information. Forward-looking information involves statements about the future and is inherently uncertain, and our actual achievements or other future events or conditions may differ materially from those reflected in the forward-looking information due to a variety of risks, uncertainties and other factors, including, without limitation, those referred to in this news release and the Pretivm Disclosure Documents. For the reasons set forth above, readers and prospective investors should not place undue reliance on forward-looking information.
We do not assume any obligation to update forward-looking information, whether as a result of new information, future events or otherwise, other than as required by applicable law. Neither the TSX nor the NYSE has approved or disapproved of the information contained herein.

TORONTO, Aug. 09, 2021 (GLOBE NEWSWIRE) — Mandalay Resources Corporation (“Mandalay” or “the Company”) (TSX: MND, OTCQB: MNDJF) announces that its second quarter 2021 financial results will be released after market close on August 11, 2021, followed by a conference call with Dominic Duffy, President and Chief Executive Officer of Mandalay for investors and analysts on August 12, 2021, at 8:00 AM (Toronto time).
Analysts and interested investors are invited to participate using the following dial-in numbers:
|
Participant Number (Toll free): |
(877) 407-8289 |
|
Participant Number: |
(201) 689-8341 |
|
Conference ID: |
13722369 |
A replay of the conference call will be available until 11:59 PM (Toronto time), August 26, 2021, and can be accessed using the following dial-in number:
|
Encore Toll Free Dial-in Number: |
(877) 660-6853 |
|
Encore ID: |
13722369 |
For Further Information:
Dominic Duffy
President and Chief Executive Officer
Edison Nguyen
Manager, Analytics and Investor Relations
Contact:
(647) 260-1566
About Mandalay Resources Corporation:
Mandalay Resources is a Canadian-based natural resource company with producing assets in Australia (Costerfield gold-antimony mine), Sweden (Björkdal gold mine) and Chile (Cerro Bayo gold-silver mine). The Company is focused on growing its production and reducing costs to generate significant positive cashflow.
Mandalay’s mission is to create shareholder value through the profitable operation of both its Costerfield and Björkdal mines. Currently, the Company’s main objective is to continue mining the high-grade Youle vein at Costerfield, which continues to supply high-grade ore, and to extend Youle’s Mineral Reserves at depth and to the south, as well as continuing the regional exploration program. At Björkdal, the Company will aim to increase production from the Aurora zone and other higher-grade areas in the coming years, in order to maximize profit margins from the mine and continue exploration in near mine and regional.

The market expects Comstock Mining, Inc. (LODE) to deliver a year-over-year decline in earnings on higher revenues when it reports results for the quarter ended June 2021. This widely-known consensus outlook is important in assessing the company's earnings picture, but a powerful factor that might influence its near-term stock price is how the actual results compare to these estimates.
The stock might move higher if these key numbers top expectations in the upcoming earnings report. On the other hand, if they miss, the stock may move lower.
While management's discussion of business conditions on the earnings call will mostly determine the sustainability of the immediate price change and future earnings expectations, it's worth having a handicapping insight into the odds of a positive EPS surprise.
Zacks Consensus Estimate
This company is expected to post quarterly earnings of $0.01 per share in its upcoming report, which represents a year-over-year change of -80%.
Revenues are expected to be $0.07 million, up 40% from the year-ago quarter.
Estimate Revisions Trend
The consensus EPS estimate for the quarter has remained unchanged over the last 30 days. This is essentially a reflection of how the covering analysts have collectively reassessed their initial estimates over this period.
Investors should keep in mind that the direction of estimate revisions by each of the covering analysts may not always get reflected in the aggregate change.
Price, Consensus and EPS Surprise

Earnings Whisper
Estimate revisions ahead of a company's earnings release offer clues to the business conditions for the period whose results are coming out. This insight is at the core of our proprietary surprise prediction model — the Zacks Earnings ESP (Expected Surprise Prediction).
The Zacks Earnings ESP compares the Most Accurate Estimate to the Zacks Consensus Estimate for the quarter; the Most Accurate Estimate is a more recent version of the Zacks Consensus EPS estimate. The idea here is that analysts revising their estimates right before an earnings release have the latest information, which could potentially be more accurate than what they and others contributing to the consensus had predicted earlier.
Thus, a positive or negative Earnings ESP reading theoretically indicates the likely deviation of the actual earnings from the consensus estimate. However, the model's predictive power is significant for positive ESP readings only.
A positive Earnings ESP is a strong predictor of an earnings beat, particularly when combined with a Zacks Rank #1 (Strong Buy), 2 (Buy) or 3 (Hold). Our research shows that stocks with this combination produce a positive surprise nearly 70% of the time, and a solid Zacks Rank actually increases the predictive power of Earnings ESP.
Please note that a negative Earnings ESP reading is not indicative of an earnings miss. Our research shows that it is difficult to predict an earnings beat with any degree of confidence for stocks with negative Earnings ESP readings and/or Zacks Rank of 4 (Sell) or 5 (Strong Sell).
How Have the Numbers Shaped Up for Comstock Mining, Inc.
For Comstock Mining, Inc.The Most Accurate Estimate is the same as the Zacks Consensus Estimate, suggesting that there are no recent analyst views which differ from what have been considered to derive the consensus estimate. This has resulted in an Earnings ESP of 0%.
On the other hand, the stock currently carries a Zacks Rank of #3.
So, this combination makes it difficult to conclusively predict that Comstock Mining, Inc. Will beat the consensus EPS estimate.
Does Earnings Surprise History Hold Any Clue?
While calculating estimates for a company's future earnings, analysts often consider to what extent it has been able to match past consensus estimates. So, it's worth taking a look at the surprise history for gauging its influence on the upcoming number.
For the last reported quarter, it was expected that Comstock Mining, Inc. Would post a loss of $0.04 per share when it actually produced earnings of $0.02, delivering a surprise of +150%.
Over the last four quarters, the company has beaten consensus EPS estimates two times.
Bottom Line
An earnings beat or miss may not be the sole basis for a stock moving higher or lower. Many stocks end up losing ground despite an earnings beat due to other factors that disappoint investors. Similarly, unforeseen catalysts help a number of stocks gain despite an earnings miss.
That said, betting on stocks that are expected to beat earnings expectations does increase the odds of success. This is why it's worth checking a company's Earnings ESP and Zacks Rank ahead of its quarterly release. Make sure to utilize our Earnings ESP Filter to uncover the best stocks to buy or sell before they've reported.
Comstock Mining, Inc. Doesn't appear a compelling earnings-beat candidate. However, investors should pay attention to other factors too for betting on this stock or staying away from it ahead of its earnings release.
Want the latest recommendations from Zacks Investment Research? Today, you can download 7 Best Stocks for the Next 30 Days. Click to get this free report
Comstock Mining, Inc. (LODE) : Free Stock Analysis Report
To read this article on Zacks.com click here.
On the call this morning, we have Rob Henderson, president and CEO; Sandra Daycock, chief financial officer; and Fernando Cornejo, chief operating officer. Thank you, Fiona, and thank you, everyone, for dialing in today.
Comstock Mining, Inc. LODE is scheduled to report second-quarter 2021 results on Aug 10, before the market opens.
Q2 Estimates
The Zacks Consensus Estimate for second-quarter revenues is currently pegged at $0.07 million, suggesting growth of 40% from the prior-year quarter. The consensus mark for earnings stands at 1 cent per share, indicating a decline of 80% from the 5 cents reported in the year-ago quarter. The earnings estimate has remained unchanged over the past 30 days.
Q1 Results
Comstock Mining reported earnings per share of 2 cents per share against a loss of 5 cents in the prior-year quarter. The figure compared favorably with the Zacks Consensus Estimate of a loss of 4 cents per share. The company has a trailing four-quarter earnings surprise of 97.6%, on average.
Comstock Mining, Inc. Price and EPS Surprise

Comstock Mining, Inc. price-eps-surprise | Comstock Mining, Inc. Quote
Factors to Note
The company’s mining segment comprises mining, mine development, processing, and environmental and reclamation operations, related mineral properties, water rights, properties, plant and equipment, investments in Tonogold and Pelen, and general and administrative expenses. The company ceased mining in 2015 and has concluded processing material from its leach pad in December 2016. Thus, no production or mining revenues will be reported in the company’s second-quarter results.
The real estate segment consists of real estate rental operations, including the Daney Ranch and Gold Hill Hotel, and related properties and equipment, as well as assets held for sale to Sierra Springs Opportunity Fund, Inc. (“SSOF”), and investments in and advances to SSOF. Real estate revenues for the second quarter might have witnessed growth, courtesy of an increase from the Daney Ranch lease signed Sep 1, 2020. This is likely to be partly offset by decrease in rentals of its metallurgical labs at the company's processing site and a decreased rental rate with the Gold Hill Hotel lessees.
Real estate costs and expenses for the to-be-reported quarter are likely to have witnessed year-over-year escalation due to higher depreciation expenses associated with the Gold Hill Hotel and Daney Ranch properties, which were classified as assets held for sale prior to September 2020. With certain assets becoming fully depreciated, mining costs and expenses are likely to have been low. These costs include depreciation expense on temporarily idled mining equipment, processing facilities and heap leach pads. General and administrative expenses may have been higher primarily due to higher professional service and directors' fees and performance-based stock compensation expense. On Mar 5, 2021, the company extinguished all of its debt obligations totaling $3.6 million, leading to expected saving of more than $0.3 million in annual interest expenses. This might have contributed to earnings in the second quarter as well. All of these factors might get reflected in the company’s to-be-reported quarter results.
What the Zacks Model Unveils
Our proven model does not conclusively predict an earnings beat for Comstock Mining this time around. The combination of a positive Earnings ESP and a Zacks Rank #1 (Strong Buy), 2 (Buy) or 3 (Hold) increases the odds of an earnings beat. But that is not the case here as you will see below.
You can uncover the best stocks to buy or sell before they’re reported with our Earnings ESP Filter.
Earnings ESP: The Earnings ESP for Comstock Mining is 0.00%.
Zacks Rank: The company currently has a Zacks Rank #3.
Price Performance

Image Source: Zacks Investment Research
Comstock Mining’s shares have soared 258.8% in the past year against the industry’s decline of 22%.
Stocks Poised to Beat Estimates
Here are some companies in the basic materials space you may want to consider as our model shows that these have the right combination of elements to post earnings beat this quarter:
Nutrien Ltd. NTR has an Earnings ESP of +1.44% and a Zacks Rank #1. You can see the complete list of today’s Zacks #1 Rank stocks here.
GrowGeneration Corp. GRWG has an Earnings ESP of +3.45% and a Zacks Rank of 2, currently.
Wheaton Precious Metals Corp. WPM has a Zacks Rank #3 and an Earnings ESP of +1.18%, at present.
Want the latest recommendations from Zacks Investment Research? Today, you can download 7 Best Stocks for the Next 30 Days. Click to get this free report
Comstock Mining, Inc. (LODE) : Free Stock Analysis Report
Wheaton Precious Metals Corp. (WPM) : Free Stock Analysis Report
Nutrien Ltd. (NTR) : Free Stock Analysis Report
GrowGeneration Corp. (GRWG) : Free Stock Analysis Report
To read this article on Zacks.com click here.
How far off is Fresnillo plc (LON:FRES) from its intrinsic value? Using the most recent financial data, we'll take a look at whether the stock is fairly priced by projecting its future cash flows and then discounting them to today's value. We will use the Discounted Cash Flow (DCF) model on this occasion. Don't get put off by the jargon, the math behind it is actually quite straightforward.
We generally believe that a company's value is the present value of all of the cash it will generate in the future. However, a DCF is just one valuation metric among many, and it is not without flaws. If you still have some burning questions about this type of valuation, take a look at the Simply Wall St analysis model.
See our latest analysis for Fresnillo
The calculation
We use what is known as a 2-stage model, which simply means we have two different periods of growth rates for the company's cash flows. Generally the first stage is higher growth, and the second stage is a lower growth phase. To start off with, we need to estimate the next ten years of cash flows. Where possible we use analyst estimates, but when these aren't available we extrapolate the previous free cash flow (FCF) from the last estimate or reported value. We assume companies with shrinking free cash flow will slow their rate of shrinkage, and that companies with growing free cash flow will see their growth rate slow, over this period. We do this to reflect that growth tends to slow more in the early years than it does in later years.
A DCF is all about the idea that a dollar in the future is less valuable than a dollar today, and so the sum of these future cash flows is then discounted to today's value:
10-year free cash flow (FCF) forecast
|
2022 |
2023 |
2024 |
2025 |
2026 |
2027 |
2028 |
2029 |
2030 |
2031 |
|
|
Levered FCF ($, Millions) |
US$781.3m |
US$677.4m |
US$617.1m |
US$580.4m |
US$557.8m |
US$544.1m |
US$536.3m |
US$532.4m |
US$531.1m |
US$531.7m |
|
Growth Rate Estimate Source |
Analyst x6 |
Analyst x4 |
Est @ -8.9% |
Est @ -5.96% |
Est @ -3.89% |
Est @ -2.45% |
Est @ -1.44% |
Est @ -0.73% |
Est @ -0.24% |
Est @ 0.11% |
|
Present Value ($, Millions) Discounted @ 7.9% |
US$724 |
US$582 |
US$491 |
US$428 |
US$381 |
US$344 |
US$315 |
US$289 |
US$268 |
US$248 |
("Est" = FCF growth rate estimated by Simply Wall St)
Present Value of 10-year Cash Flow (PVCF) = US$4.1b
The second stage is also known as Terminal Value, this is the business's cash flow after the first stage. For a number of reasons a very conservative growth rate is used that cannot exceed that of a country's GDP growth. In this case we have used the 5-year average of the 10-year government bond yield (0.9%) to estimate future growth. In the same way as with the 10-year 'growth' period, we discount future cash flows to today's value, using a cost of equity of 7.9%.
Terminal Value (TV)= FCF2031 × (1 + g) ÷ (r – g) = US$532m× (1 + 0.9%) ÷ (7.9%– 0.9%) = US$7.7b
Present Value of Terminal Value (PVTV)= TV / (1 + r)10= US$7.7b÷ ( 1 + 7.9%)10= US$3.6b
The total value is the sum of cash flows for the next ten years plus the discounted terminal value, which results in the Total Equity Value, which in this case is US$7.6b. In the final step we divide the equity value by the number of shares outstanding. Compared to the current share price of UK£8.2, the company appears around fair value at the time of writing. Remember though, that this is just an approximate valuation, and like any complex formula – garbage in, garbage out.

Important assumptions
Now the most important inputs to a discounted cash flow are the discount rate, and of course, the actual cash flows. You don't have to agree with these inputs, I recommend redoing the calculations yourself and playing with them. The DCF also does not consider the possible cyclicality of an industry, or a company's future capital requirements, so it does not give a full picture of a company's potential performance. Given that we are looking at Fresnillo as potential shareholders, the cost of equity is used as the discount rate, rather than the cost of capital (or weighted average cost of capital, WACC) which accounts for debt. In this calculation we've used 7.9%, which is based on a levered beta of 1.116. Beta is a measure of a stock's volatility, compared to the market as a whole. We get our beta from the industry average beta of globally comparable companies, with an imposed limit between 0.8 and 2.0, which is a reasonable range for a stable business.
Next Steps:
Whilst important, the DCF calculation is only one of many factors that you need to assess for a company. It's not possible to obtain a foolproof valuation with a DCF model. Instead the best use for a DCF model is to test certain assumptions and theories to see if they would lead to the company being undervalued or overvalued. For instance, if the terminal value growth rate is adjusted slightly, it can dramatically alter the overall result. For Fresnillo, we've compiled three important items you should further examine:
-
Risks: To that end, you should be aware of the 1 warning sign we've spotted with Fresnillo .
-
Future Earnings: How does FRES's growth rate compare to its peers and the wider market? Dig deeper into the analyst consensus number for the upcoming years by interacting with our free analyst growth expectation chart.
-
Other Solid Businesses: Low debt, high returns on equity and good past performance are fundamental to a strong business. Why not explore our interactive list of stocks with solid business fundamentals to see if there are other companies you may not have considered!
PS. The Simply Wall St app conducts a discounted cash flow valuation for every stock on the LSE every day. If you want to find the calculation for other stocks just search here.
This article by Simply Wall St is general in nature. It does not constitute a recommendation to buy or sell any stock, and does not take account of your objectives, or your financial situation. We aim to bring you long-term focused analysis driven by fundamental data. Note that our analysis may not factor in the latest price-sensitive company announcements or qualitative material. Simply Wall St has no position in any stocks mentioned.
Have feedback on this article? Concerned about the content? Get in touch with us directly. Alternatively, email editorial-team (at) simplywallst.com.
McEwen (MUX) came out with a quarterly loss of $0.01 per share in line with the Zacks Consensus Estimate. This compares to loss of $0.05 per share a year ago. These figures are adjusted for non-recurring items.
A quarter ago, it was expected that this gold and silver mining company would post a loss of $0.02 per share when it actually produced a loss of $0.03, delivering a surprise of -50%.
Over the last four quarters, the company has not been able to surpass consensus EPS estimates.
McEwen, which belongs to the Zacks Mining – Miscellaneous industry, posted revenues of $40.71 million for the quarter ended June 2021, surpassing the Zacks Consensus Estimate by 1.26%. This compares to year-ago revenues of $18.29 million. The company has topped consensus revenue estimates just once over the last four quarters.
The sustainability of the stock's immediate price movement based on the recently-released numbers and future earnings expectations will mostly depend on management's commentary on the earnings call.
McEwen shares have added about 22.8% since the beginning of the year versus the S&P 500's gain of 17.8%.
What's Next for McEwen?
While McEwen has outperformed the market so far this year, the question that comes to investors' minds is: what's next for the stock?
There are no easy answers to this key question, but one reliable measure that can help investors address this is the company's earnings outlook. Not only does this include current consensus earnings expectations for the coming quarter(s), but also how these expectations have changed lately.
Empirical research shows a strong correlation between near-term stock movements and trends in earnings estimate revisions. Investors can track such revisions by themselves or rely on a tried-and-tested rating tool like the Zacks Rank, which has an impressive track record of harnessing the power of earnings estimate revisions.
Ahead of this earnings release, the estimate revisions trend for McEwen was mixed. While the magnitude and direction of estimate revisions could change following the company's just-released earnings report, the current status translates into a Zacks Rank #3 (Hold) for the stock. So, the shares are expected to perform in line with the market in the near future. You can see the complete list of today's Zacks #1 Rank (Strong Buy) stocks here.
It will be interesting to see how estimates for the coming quarters and current fiscal year change in the days ahead. The current consensus EPS estimate is -$0.01 on $39.4 million in revenues for the coming quarter and -$0.08 on $143.95 million in revenues for the current fiscal year.
Investors should be mindful of the fact that the outlook for the industry can have a material impact on the performance of the stock as well. In terms of the Zacks Industry Rank, Mining – Miscellaneous is currently in the bottom 24% of the 250 plus Zacks industries. Our research shows that the top 50% of the Zacks-ranked industries outperform the bottom 50% by a factor of more than 2 to 1.
Want the latest recommendations from Zacks Investment Research? Today, you can download 7 Best Stocks for the Next 30 Days. Click to get this free report
McEwen Mining Inc. (MUX) : Free Stock Analysis Report
To read this article on Zacks.com click here.
Wall Street expects a year-over-year decline in earnings on lower revenues when Pretium Resources (PVG) reports results for the quarter ended June 2021. While this widely-known consensus outlook is important in gauging the company's earnings picture, a powerful factor that could impact its near-term stock price is how the actual results compare to these estimates.
The stock might move higher if these key numbers top expectations in the upcoming earnings report, which is expected to be released on August 12. On the other hand, if they miss, the stock may move lower.
While management's discussion of business conditions on the earnings call will mostly determine the sustainability of the immediate price change and future earnings expectations, it's worth having a handicapping insight into the odds of a positive EPS surprise.
Zacks Consensus Estimate
This gold mining company is expected to post quarterly earnings of $0.12 per share in its upcoming report, which represents a year-over-year change of -53.9%.
Revenues are expected to be $136.3 million, down 18.2% from the year-ago quarter.
Estimate Revisions Trend
The consensus EPS estimate for the quarter has remained unchanged over the last 30 days. This is essentially a reflection of how the covering analysts have collectively reassessed their initial estimates over this period.
Investors should keep in mind that the direction of estimate revisions by each of the covering analysts may not always get reflected in the aggregate change.
Price, Consensus and EPS Surprise

Earnings Whisper
Estimate revisions ahead of a company's earnings release offer clues to the business conditions for the period whose results are coming out. This insight is at the core of our proprietary surprise prediction model — the Zacks Earnings ESP (Expected Surprise Prediction).
The Zacks Earnings ESP compares the Most Accurate Estimate to the Zacks Consensus Estimate for the quarter; the Most Accurate Estimate is a more recent version of the Zacks Consensus EPS estimate. The idea here is that analysts revising their estimates right before an earnings release have the latest information, which could potentially be more accurate than what they and others contributing to the consensus had predicted earlier.
Thus, a positive or negative Earnings ESP reading theoretically indicates the likely deviation of the actual earnings from the consensus estimate. However, the model's predictive power is significant for positive ESP readings only.
A positive Earnings ESP is a strong predictor of an earnings beat, particularly when combined with a Zacks Rank #1 (Strong Buy), 2 (Buy) or 3 (Hold). Our research shows that stocks with this combination produce a positive surprise nearly 70% of the time, and a solid Zacks Rank actually increases the predictive power of Earnings ESP.
Please note that a negative Earnings ESP reading is not indicative of an earnings miss. Our research shows that it is difficult to predict an earnings beat with any degree of confidence for stocks with negative Earnings ESP readings and/or Zacks Rank of 4 (Sell) or 5 (Strong Sell).
How Have the Numbers Shaped Up for Pretium Resources?
For Pretium Resources, the Most Accurate Estimate is the same as the Zacks Consensus Estimate, suggesting that there are no recent analyst views which differ from what have been considered to derive the consensus estimate. This has resulted in an Earnings ESP of 0%.
On the other hand, the stock currently carries a Zacks Rank of #5.
So, this combination makes it difficult to conclusively predict that Pretium Resources will beat the consensus EPS estimate.
Does Earnings Surprise History Hold Any Clue?
While calculating estimates for a company's future earnings, analysts often consider to what extent it has been able to match past consensus estimates. So, it's worth taking a look at the surprise history for gauging its influence on the upcoming number.
For the last reported quarter, it was expected that Pretium Resources would post earnings of $0.21 per share when it actually produced earnings of $0.14, delivering a surprise of -33.33%.
Over the last four quarters, the company has beaten consensus EPS estimates three times.
Bottom Line
An earnings beat or miss may not be the sole basis for a stock moving higher or lower. Many stocks end up losing ground despite an earnings beat due to other factors that disappoint investors. Similarly, unforeseen catalysts help a number of stocks gain despite an earnings miss.
That said, betting on stocks that are expected to beat earnings expectations does increase the odds of success. This is why it's worth checking a company's Earnings ESP and Zacks Rank ahead of its quarterly release. Make sure to utilize our Earnings ESP Filter to uncover the best stocks to buy or sell before they've reported.
Pretium Resources doesn't appear a compelling earnings-beat candidate. However, investors should pay attention to other factors too for betting on this stock or staying away from it ahead of its earnings release.
Want the latest recommendations from Zacks Investment Research? Today, you can download 7 Best Stocks for the Next 30 Days. Click to get this free report
Pretium Resources, Inc. (PVG) : Free Stock Analysis Report
To read this article on Zacks.com click here.
A look at the shareholders of Pretium Resources Inc. (TSE:PVG) can tell us which group is most powerful. Insiders often own a large chunk of younger, smaller, companies while huge companies tend to have institutions as shareholders. Companies that used to be publicly owned tend to have lower insider ownership.
Pretium Resources has a market capitalization of CA$2.2b, so we would expect some institutional investors to have noticed the stock. In the chart below, we can see that institutional investors have bought into the company. Let's delve deeper into each type of owner, to discover more about Pretium Resources.
View our latest analysis for Pretium Resources

What Does The Institutional Ownership Tell Us About Pretium Resources?
Many institutions measure their performance against an index that approximates the local market. So they usually pay more attention to companies that are included in major indices.
As you can see, institutional investors have a fair amount of stake in Pretium Resources. This suggests some credibility amongst professional investors. But we can't rely on that fact alone since institutions make bad investments sometimes, just like everyone does. If multiple institutions change their view on a stock at the same time, you could see the share price drop fast. It's therefore worth looking at Pretium Resources' earnings history below. Of course, the future is what really matters.

Institutional investors own over 50% of the company, so together than can probably strongly influence board decisions. We note that hedge funds don't have a meaningful investment in Pretium Resources. Our data shows that Van Eck Associates Corporation is the largest shareholder with 10% of shares outstanding. With 5.0% and 4.3% of the shares outstanding respectively, Morgan Stanley, Investment Banking and Brokerage Investments and Letko, Brosseau & Associates Inc. are the second and third largest shareholders.
A closer look at our ownership figures suggests that the top 19 shareholders have a combined ownership of 50% implying that no single shareholder has a majority.
Researching institutional ownership is a good way to gauge and filter a stock's expected performance. The same can be achieved by studying analyst sentiments. There are a reasonable number of analysts covering the stock, so it might be useful to find out their aggregate view on the future.
Insider Ownership Of Pretium Resources
While the precise definition of an insider can be subjective, almost everyone considers board members to be insiders. The company management answer to the board and the latter should represent the interests of shareholders. Notably, sometimes top-level managers are on the board themselves.
Insider ownership is positive when it signals leadership are thinking like the true owners of the company. However, high insider ownership can also give immense power to a small group within the company. This can be negative in some circumstances.
Our data suggests that insiders own under 1% of Pretium Resources Inc. in their own names. Keep in mind that it's a big company, and the insiders own CA$1.3m worth of shares. The absolute value might be more important than the proportional share. Arguably, recent buying and selling is just as important to consider. You can click here to see if insiders have been buying or selling.
General Public Ownership
The general public holds a 27% stake in Pretium Resources. This size of ownership, while considerable, may not be enough to change company policy if the decision is not in sync with other large shareholders.
Next Steps:
While it is well worth considering the different groups that own a company, there are other factors that are even more important.
I like to dive deeper into how a company has performed in the past. You can find historic revenue and earnings in this detailed graph.
If you would prefer discover what analysts are predicting in terms of future growth, do not miss this free report on analyst forecasts.
NB: Figures in this article are calculated using data from the last twelve months, which refer to the 12-month period ending on the last date of the month the financial statement is dated. This may not be consistent with full year annual report figures.
This article by Simply Wall St is general in nature. It does not constitute a recommendation to buy or sell any stock, and does not take account of your objectives, or your financial situation. We aim to bring you long-term focused analysis driven by fundamental data. Note that our analysis may not factor in the latest price-sensitive company announcements or qualitative material. Simply Wall St has no position in any stocks mentioned.
Have feedback on this article? Concerned about the content? Get in touch with us directly. Alternatively, email editorial-team (at) simplywallst.com.
Hecla Mining (HL) came out with quarterly earnings of $0.06 per share, beating the Zacks Consensus Estimate of $0.05 per share. This compares to earnings of $0.01 per share a year ago. These figures are adjusted for non-recurring items.
This quarterly report represents an earnings surprise of 20%. A quarter ago, it was expected that this precious metals company would post earnings of $0.05 per share when it actually produced earnings of $0.06, delivering a surprise of 20%.
Over the last four quarters, the company has surpassed consensus EPS estimates three times.
Hecla Mining, which belongs to the Zacks Mining – Silver industry, posted revenues of $217.98 million for the quarter ended June 2021, missing the Zacks Consensus Estimate by 1.88%. This compares to year-ago revenues of $166.36 million. The company has topped consensus revenue estimates two times over the last four quarters.
The sustainability of the stock's immediate price movement based on the recently-released numbers and future earnings expectations will mostly depend on management's commentary on the earnings call.
Hecla Mining shares have added about 2.2% since the beginning of the year versus the S&P 500's gain of 17.8%.
What's Next for Hecla Mining?
While Hecla Mining has underperformed the market so far this year, the question that comes to investors' minds is: what's next for the stock?
There are no easy answers to this key question, but one reliable measure that can help investors address this is the company's earnings outlook. Not only does this include current consensus earnings expectations for the coming quarter(s), but also how these expectations have changed lately.
Empirical research shows a strong correlation between near-term stock movements and trends in earnings estimate revisions. Investors can track such revisions by themselves or rely on a tried-and-tested rating tool like the Zacks Rank, which has an impressive track record of harnessing the power of earnings estimate revisions.
Ahead of this earnings release, the estimate revisions trend for Hecla Mining was mixed. While the magnitude and direction of estimate revisions could change following the company's just-released earnings report, the current status translates into a Zacks Rank #3 (Hold) for the stock. So, the shares are expected to perform in line with the market in the near future. You can see the complete list of today's Zacks #1 Rank (Strong Buy) stocks here.
It will be interesting to see how estimates for the coming quarters and current fiscal year change in the days ahead. The current consensus EPS estimate is $0.06 on $213.17 million in revenues for the coming quarter and $0.21 on $883.32 million in revenues for the current fiscal year.
Investors should be mindful of the fact that the outlook for the industry can have a material impact on the performance of the stock as well. In terms of the Zacks Industry Rank, Mining – Silver is currently in the bottom 2% of the 250 plus Zacks industries. Our research shows that the top 50% of the Zacks-ranked industries outperform the bottom 50% by a factor of more than 2 to 1.
Want the latest recommendations from Zacks Investment Research? Today, you can download 7 Best Stocks for the Next 30 Days. Click to get this free report
Hecla Mining Company (HL) : Free Stock Analysis Report
To read this article on Zacks.com click here.
Zacks Investment Research
Silvercorp (SVM) came out with quarterly earnings of $0.07 per share, missing the Zacks Consensus Estimate of $0.08 per share. This compares to earnings of $0.05 per share a year ago. These figures are adjusted for non-recurring items.
This quarterly report represents an earnings surprise of -12.50%. A quarter ago, it was expected that this mineral miner would post earnings of $0.04 per share when it actually produced earnings of $0.04, delivering no surprise.
Over the last four quarters, the company has not been able to surpass consensus EPS estimates.
Silvercorp, which belongs to the Zacks Mining – Miscellaneous industry, posted revenues of $58.82 million for the quarter ended June 2021, surpassing the Zacks Consensus Estimate by 7.14%. This compares to year-ago revenues of $46.71 million. The company has topped consensus revenue estimates just once over the last four quarters.
The sustainability of the stock's immediate price movement based on the recently-released numbers and future earnings expectations will mostly depend on management's commentary on the earnings call.
Silvercorp shares have lost about 29.3% since the beginning of the year versus the S&P 500's gain of 17.2%.
What's Next for Silvercorp?
While Silvercorp has underperformed the market so far this year, the question that comes to investors' minds is: what's next for the stock?
There are no easy answers to this key question, but one reliable measure that can help investors address this is the company's earnings outlook. Not only does this include current consensus earnings expectations for the coming quarter(s), but also how these expectations have changed lately.
Empirical research shows a strong correlation between near-term stock movements and trends in earnings estimate revisions. Investors can track such revisions by themselves or rely on a tried-and-tested rating tool like the Zacks Rank, which has an impressive track record of harnessing the power of earnings estimate revisions.
Ahead of this earnings release, the estimate revisions trend for Silvercorp was unfavorable. While the magnitude and direction of estimate revisions could change following the company's just-released earnings report, the current status translates into a Zacks Rank #4 (Sell) for the stock. So, the shares are expected to underperform the market in the near future. You can see the complete list of today's Zacks #1 Rank (Strong Buy) stocks here.
It will be interesting to see how estimates for the coming quarters and current fiscal year change in the days ahead. The current consensus EPS estimate is $0.09 on $60.6 million in revenues for the coming quarter and $0.33 on $219.3 million in revenues for the current fiscal year.
Investors should be mindful of the fact that the outlook for the industry can have a material impact on the performance of the stock as well. In terms of the Zacks Industry Rank, Mining – Miscellaneous is currently in the bottom 30% of the 250 plus Zacks industries. Our research shows that the top 50% of the Zacks-ranked industries outperform the bottom 50% by a factor of more than 2 to 1.
Want the latest recommendations from Zacks Investment Research? Today, you can download 7 Best Stocks for the Next 30 Days. Click to get this free report
Silvercorp Metals Inc. (SVM) : Free Stock Analysis Report
To read this article on Zacks.com click here.
Zacks Investment Research
Vancouver, British Columbia–(Newsfile Corp. – August 5, 2021) – Chesapeake Gold Corp. (TSXV: CKG) (OTCQX: CHPGF) – Director and CEO, Alan Pangbourne speaks about their flagship asset, the Metates project, located in Durango State, Mexico that is projected to produce 110,000 ounces of gold.
If you cannot view the video above, please visit:
https://b-tv.com/chesapeake-gold-large-undeveloped-gold-silver-project-ceo-clip-90sec/
Chesapeake Gold Corp. (TSXV: CKG) (OTCQX: CHPGF)
Chesapeake Gold is being featured on BNN Bloomberg Aug 7th – Aug 8th, 2021.
About CEO Clips:
CEO Clips is the largest library of publicly traded company CEO videos in Canada and the US. These 90 second video profiles broadcast on national TV and online via 15 top financial sites including: Thomson Reuters, Bloomberg, Yahoo! Finance and Stockhouse.com.
BTV – Business Television/CEO Clips
Contact:
Trina Schlingmann
(604) 664-7401 x 5
trina@b-tv.com

To view the source version of this press release, please visit https://www.newsfilecorp.com/release/92219
TORONTO, Aug. 04, 2021 (GLOBE NEWSWIRE) — McEwen Mining Inc. (NYSE: MUX) (TSX: MUX) today reported its second quarter (Q2) and first half (H1) results for the period ended June 30th, 2021.
-
Our operations delivered strong production results in line with our expectations, and we are on track to meet our 2021 production guidance of 141,000 to 160,400 GEOs.
-
We continue to execute on our turnaround strategy and have made significant progress both from an operational and a financial perspective (see Tables 1-3 below). We expect this trend to continue to the remainder of 2021, as the Froome mine at the Fox Complex reaches commercial production in Q4.
-
On July 6, 2021, we announced that a subsidiary that holds 100% of the Los Azules copper project will be raising financing for the continued development of that project, as well as to fund a modest exploration program for its Elder Creek copper exploration property in Nevada. McEwen Copper is seeking to raise up to $80 million in a private offering and Rob McEwen has committed the first $40 million dollars.
-
Our quarterly webcast will take place on Thursday, August 5th at 2 pm EDT. Please see the details below.
Table 1. Production and costs Q2 & H1 2021 ended June 30th, 2021 compared Q2 & H1 2020
|
% Increase (Decrease) |
Production (GEOs)(1) |
Cash Costs ($/GEO)(2) |
AISC ($/GEO)(2) |
|||||||||
|
Q2 |
H1 |
Q2 |
H1 |
Q2 |
H1 |
|||||||
|
Gold Bar Mine, Nevada |
131 |
% |
41 |
% |
(17 |
%) |
(13 |
%) |
(34 |
%) |
(25 |
%) |
|
Fox Complex, Canada |
223 |
% |
17 |
% |
(71 |
%) |
(22 |
%) |
(67 |
%) |
(29 |
%) |
|
San José Mine, Argentina(3) |
102 |
% |
46 |
% |
(14 |
%) |
(9 |
%) |
2 |
% |
(8 |
%) |
|
El Gallo Project, Mexico |
(32 |
%) |
(46 |
%) |
Residual leaching(4) |
|||||||
Table 2. Liquidity at June 30th, 2021 and December 31st, 2020
|
(Millions of Dollars) |
Q2 2021 ended |
Q4 2020 ended |
|
Cash and cash equivalents |
42.2 |
20.8 |
|
Liquid assets |
48.9 |
25.9 |
|
Working capital |
30.0 |
7.9 |
|
Long-term debt principal |
50.0 |
50.0 |
Table 3. Financial results Q2 & H1 2021 ended June 30th, 2021 compared Q2 & H1 2020
|
(Millions of Dollars) |
2021 |
2020 |
||||||
|
Q2 |
H1 |
Q2 |
H1 |
|||||
|
Revenue |
40.7 |
64.5 |
18.3 |
49.7 |
||||
|
Cash gross profit (loss) |
9.6 |
9.7 |
(4.1 |
) |
(1.1 |
) |
||
|
Gross profit (loss) |
4.1 |
(0.9 |
) |
(8.9 |
) |
(12.6 |
) |
|
|
Net loss |
(6.0 |
) |
(18.5 |
) |
(19.8 |
) |
(119.0 |
) |
|
Net loss per share |
(0.01 |
) |
(0.04 |
) |
(0.05 |
) |
(0.30 |
) |
Operations Update
Gold Bar Mine, USA (100% Interest)
Gold Bar produced 14,100 GEOs in Q2 at total cash costs(2) and all-in sustaining costs (AISC)(2) of $1,463 and $1,619 per GEO sold, respectively. This compares to 6,100 GEOs in Q2 2020 at total cash costs and AISC of $1,772 and $2,462 per GEO, respectively. The cost decrease is driven by the increase in production and by the significant operational improvements we have been continuing to work through over the past year. We expect to see this trend continue into the second half of 2021.
Exploration is focusing on testing near-mine targets and further defining oxide resources on the neighboring Tonkin property. During the quarter we incurred exploration expenses of $1.3 million of a total $5.0 million budget for 2021.
Fox Complex, Canada (100% Interest)
Black Fox produced 7,100 GEOs in Q2 at total cash costs and AISC of $917 and $1,088 per GEO sold, respectively. This compares to 2,200 GEOs in Q2 2020 at total cash costs and AISC of $3,121 and $3,332 per GEO, respectively. Mining has transitioned to the Froome deposit and is performing to plan, commercial production expected in Q4 2021.
We remain focused on our principal exploration goal of cost-effectively discovering and extending gold deposits adjacent to our existing operations to contribute to near-term gold production. During the quarter we incurred exploration expenses of $3.5 million of a total $9.0 million budget for 2021.
A Preliminary Economic Assessment (PEA) to expand the production from the Fox Complex is expected to be released in the second half of the year, following additional drilling and resource estimate updates at the Stock and Grey Fox properties.
San José Mine, Argentina (49% Interest)
Our attributable production from San José in Q2 was 9,300 gold ounces and 607,000 silver ounces, for a total of 18,200 GEOs(3). For Q2, total cash costs and AISC were $1,105 and $1,500 per GEO sold, respectively. This compares to 9,000 GEOs in Q2 2020 at total cash costs and AISC of $1,280 and $1,476 per GEO, respectively. In Q2 2020, operations at San José were adversely impacted by government-imposed COVID-19 restrictions.
We received $2.6 million and $7.6 million in dividends in Q2 and H1, respectively, compared to $0.3 million dividends received during the same periods in 2020.
El Gallo Project, Mexico (100% Interest)
In Q2, El Gallo produced 1,300 GEOs from residual leaching of the heap leach pad. Incremental residual leaching cost for the period was $2.7 million(4). The residual leaching activities at El Gallo are expected to wind down in early 2022.
Los Azules Copper Project, Argentina (100% Interest)
On July 6, 2021, we announced the formation of a wholly-owned subsidiary to hold the Los Azules Copper project (“McEwen Copper”) and to raise financing to advance the project to a preliminary feasibility study and to construct a road to the project providing year-round access compared to the current 5-month seasonal access window. McEwen Copper will hold the Los Azules assets as well as the Elder Creek exploration project in Nevada. McEwen Copper is seeking to raise up to $80 million in a private offering.
Table 4 below provides production and cost results for Q1, Q2 and H1 2021 and comparative results from 2020:
|
Q1 |
Q2 |
H1 |
FY2021 |
||||
|
2021 |
2020 |
2021 |
2020 |
2021 |
2020 |
||
|
Total Production |
|||||||
|
Gold (oz) |
23,300 |
29,200 |
31,700 |
15,700 |
55,000 |
44,900 |
110,500 – 127,900 |
|
Silver (oz) |
493,200 |
553,200 |
611,700 |
359,400 |
1,104,900 |
912,600 |
2,300,000 – 2,450,000 |
|
GEOs(1) |
30,600 |
35,100 |
40,700 |
19,200 |
71,300 |
54,200 |
141,000 – 160,400 |
|
Gold Bar Mine, Nevada |
|||||||
|
GEOs(1) |
7,400 |
9,100 |
14,100 |
6,100 |
21,500 |
15,200 |
37,000 – 45,000 |
|
Cash Costs ($/GEO)(1)(3) |
1,865 |
1,887 |
1,463 |
1,772 |
1,598 |
1,840 |
|
|
AISC ($/GEO)(1)(3) |
1,934 |
2,177 |
1,619 |
2,462 |
1,725 |
2,293 |
|
|
Fox Complex, Canada |
|||||||
|
GEOs(1) |
5,200 |
8,300 |
7,100 |
2,200 |
12,300 |
10,500 |
27,500 – 32,500 |
|
Cash Costs ($/GEO)(1)(3) |
1,262 |
838 |
917 |
3,121 |
1,066 |
1,369 |
|
|
AISC ($/GEO)(1)(3) |
1,560 |
1,339 |
1,088 |
3,332 |
1,282 |
1,803 |
|
|
San José Mine, Argentina (49%)(4) |
|||||||
|
Gold (oz) |
9,500 |
9,000 |
9,300 |
5,500 |
18,800 |
14,500 |
41,500 – 44,500 |
|
Silver (oz) |
492,300 |
551,900 |
607,000 |
358,700 |
1,099,600 |
910,600 |
2,300,000 – 2,450,000 |
|
GEOs(1) |
16,700 |
14,900 |
18,200 |
9,000 |
34,800 |
23,900 |
72,000 – 77,000 |
|
Cash Costs ($/GEO)(1)(3) |
1,088 |
1,138 |
1,105 |
1,280 |
1,097 |
1,207 |
|
|
AISC ($/GEO)(1)(3) |
1,328 |
1,592 |
1,500 |
1,476 |
1,418 |
1,535 |
|
|
El Gallo Project, Mexico |
|||||||
|
GEOs(1)(6) |
1,300 |
2,700 |
1,300 |
1,900 |
2,500 |
4,600 |
4,500 – 5,900 |
Notes:
-
Gold Equivalent Ounces (GEOs) are calculated based on a gold to silver price ratio of 68:1 for Q1 and Q2 2021, 94:1 for Q1 2020, 104:1 for Q2 2020, and 75:1 for full year 2021 Production Guidance.
-
Cash gross profit, cash costs per ounce, all-in sustaining costs (AISC) per ounce, and liquid assets are non-GAAP financial performance measures with no standardized definition under U.S. GAAP. For a description of the non-GAAP measures see "Non-GAAP Financial Measures" section in this press release; for the reconciliation of the non-GAAP measures to the closest U.S. GAAP measures, see the Management Discussion and Analysis for the year ended December 31st, 2020 filed on EDGAR and SEDAR.
-
Represents the portion attributable to us from our 49% interest in the San José Mine.
-
Both cash costs and AISC per GEO no longer represent key metrics used by management to evaluate residual leaching at the El Gallo Project. For this reason, the Company has ceased relying on, and disclosing, cash costs and all-in-sustaining costs per ounce as a key metric.
For the SEC Form 10-Q Financial Statements and MD&A refer to: http://www.sec.gov/cgi-bin/browse-edgar?action=getcompany&CIK=0000314203
Conference Call and Webcast
Management will discuss our Q2 2021 financial results and project developments and follow with a question-and-answer session. Questions can be asked directly by participants over the phone during the webcast.
|
Thursday, August 5th, 2021 at 2:00 pm EDT |
To call into the conference call over the phone, please register here: Audience URL: |
The webcast will be archived on McEwen Mining's website at https://www.mcewenmining.com/media following the call.
COVID-19
All our operations have implemented rigorous health and safety measures to prevent the spread of the COVID-19 virus. Currently, the COVID-19 pandemic is not materially affecting our operations, or our future plans and objectives.
Reliability of Information Regarding San José
Minera Santa Cruz S.A., the owner of the San José Mine, is responsible for and has supplied to the Company all reported results from the San José Mine. McEwen Mining's joint venture partner, a subsidiary of Hochschild Mining plc, and its affiliates other than MSC do not accept responsibility for the use of project data or the adequacy or accuracy of this release.
Technical Information
The technical contents of this news release have been reviewed and approved by G. Peter Mah, P.Eng., COO of McEwen Mining and a Qualified Person as defined by Canadian Securities Administrators National Instrument 43-101 "Standards of Disclosure for Mineral Projects."
CAUTIONARY NOTE REGARDING NON-GAAP MEASURES
In this release, we have provided information prepared or calculated according to United States Generally Accepted Accounting Principles ("U.S. GAAP"), as well as provided some non-U.S. GAAP ("non-GAAP") performance measures. Because the non-GAAP performance measures do not have any standardized meaning prescribed by U.S. GAAP, they may not be comparable to similar measures presented by other companies.
Cash Costs and All-in Sustaining Costs
Cash costs consist of mining, processing, on-site general and administrative costs, community and permitting costs related to current operations, royalty costs, refining and treatment charges (for both doré and concentrate products), sales costs, export taxes and operational stripping costs, and exclude depreciation and amortization. All-in sustaining costs consist of cash costs (as described above), plus accretion of retirement obligations and amortization of the asset retirement costs related to operating sites, sustaining exploration and development costs, sustaining capital expenditures, and sustaining lease payments. Both cash costs and all-in sustaining costs are divided by the gold equivalent ounces sold to determine cash costs and all-in sustaining costs on a per ounce basis. We use and report these measures to provide additional information regarding operational efficiencies on an individual mine basis, and believe that these measures provide investors and analysts with useful information about our underlying costs of operations. A reconciliation to production costs applicable to sales, the nearest U.S. GAAP measure is provided in McEwen Mining's Quarterly Report on Form 10-Q for the quarter ended June 30, 2021.
Cash Gross Profit
Cash gross profit is a non-GAAP financial measure and does not have any standardized meaning under GAAP. We use cash gross profit to evaluate our operating performance and ability to generate cash flow; we disclose cash gross profit as we believe this measure provides valuable assistance to investors and analysts in evaluating our ability to finance our ongoing business and capital activities. The most directly comparable measure prepared in accordance with GAAP is gross profit or loss. Cash gross profit is calculated by adding back the depreciation and depletion expense to gross profit or loss. A reconciliation to gross profit, the nearest U.S. GAAP measure is provided in McEwen Mining's Quarterly Report on Form 10-Q for the quarter ended June 30, 2021.
Liquid assets
The term liquid assets used in this report is a non-GAAP financial measure. We report this measure to better understand our liquidity in each reporting period. Liquid assets is calculated as the sum of the Balance Sheet line items of cash and cash equivalents, restricted cash and investments, plus ounces of doré held in precious metals inventories valued at the London PM Fix spot price at the corresponding period. A reconciliation to the nearest U.S. GAAP measure is provided in McEwen Mining's Quarterly Report on Form 10-Q for the quarter ended June 30, 2021.
CAUTION CONCERNING FORWARD-LOOKING STATEMENTS
This news release contains certain forward-looking statements and information, including "forward-looking statements" within the meaning of the Private Securities Litigation Reform Act of 1995. The forward-looking statements and information expressed, as at the date of this news release, McEwen Mining Inc.'s (the "Company") estimates, forecasts, projections, expectations or beliefs as to future events and results. Forward-looking statements and information are necessarily based upon a number of estimates and assumptions that, while considered reasonable by management, are inherently subject to significant business, economic and competitive uncertainties, risks and contingencies, and there can be no assurance that such statements and information will prove to be accurate. Therefore, actual results and future events could differ materially from those anticipated in such statements and information. Risks and uncertainties that could cause results or future events to differ materially from current expectations expressed or implied by the forward-looking statements and information include, but are not limited to, effects of the COVID-19 pandemic, fluctuations in the market price of precious metals, mining industry risks, political, economic, social and security risks associated with foreign operations, the ability of the corporation to receive or receive in a timely manner permits or other approvals required in connection with operations, risks associated with the construction of mining operations and commencement of production and the projected costs thereof, risks related to litigation, the state of the capital markets, environmental risks and hazards, uncertainty as to calculation of mineral resources and reserves, and other risks. Readers should not place undue reliance on forward-looking statements or information included herein, which speak only as of the date hereof. The Company undertakes no obligation to reissue or update forward-looking statements or information as a result of new information or events after the date hereof except as may be required by law. See McEwen Mining's Annual Report on Form 10-K for the fiscal year ended December 31, 2020 and other filings with the Securities and Exchange Commission, under the caption "Risk Factors", for additional information on risks, uncertainties and other factors relating to the forward-looking statements and information regarding the Company. All forward-looking statements and information made in this news release are qualified by this cautionary statement.
This news release and the information included herein do not constitute an offer to buy or the solicitation of an offer to subscribe for or to buy any of the securities described herein, nor shall there be any sale of these securities in any jurisdiction in which such offer, solicitation or sale would be unlawful prior to registration or qualification under the securities laws of any such jurisdiction.
The NYSE and TSX have not reviewed and do not accept responsibility for the adequacy or accuracy of the contents of this news release, which has been prepared by the management of McEwen Mining Inc.
ABOUT MCEWEN MINING
McEwen Mining is a diversified gold and silver producer and explorer focused in the Americas with operating mines in Nevada, Canada, Mexico and Argentina.
|
CONTACT INFORMATION: |
||
|
Investor Relations: Mihaela Iancu ext. 320 |
Website: www.mcewenmining.com Facebook: facebook.com/mcewenmining Twitter: twitter.com/mcewenmining Instagram: instagram.com/mcewenmining |
150 King Street West |
Legendary fund manager Li Lu (who Charlie Munger backed) once said, 'The biggest investment risk is not the volatility of prices, but whether you will suffer a permanent loss of capital.' When we think about how risky a company is, we always like to look at its use of debt, since debt overload can lead to ruin. We can see that Pan American Silver Corp. (TSE:PAAS) does use debt in its business. But should shareholders be worried about its use of debt?
When Is Debt Dangerous?
Generally speaking, debt only becomes a real problem when a company can't easily pay it off, either by raising capital or with its own cash flow. Part and parcel of capitalism is the process of 'creative destruction' where failed businesses are mercilessly liquidated by their bankers. However, a more frequent (but still costly) occurrence is where a company must issue shares at bargain-basement prices, permanently diluting shareholders, just to shore up its balance sheet. Of course, the upside of debt is that it often represents cheap capital, especially when it replaces dilution in a company with the ability to reinvest at high rates of return. When we think about a company's use of debt, we first look at cash and debt together.
See our latest analysis for Pan American Silver
What Is Pan American Silver's Net Debt?
You can click the graphic below for the historical numbers, but it shows that Pan American Silver had US$20.8m of debt in March 2021, down from US$280.8m, one year before. But on the other hand it also has US$206.4m in cash, leading to a US$185.6m net cash position.

How Healthy Is Pan American Silver's Balance Sheet?
Zooming in on the latest balance sheet data, we can see that Pan American Silver had liabilities of US$324.8m due within 12 months and liabilities of US$454.5m due beyond that. On the other hand, it had cash of US$206.4m and US$139.1m worth of receivables due within a year. So its liabilities outweigh the sum of its cash and (near-term) receivables by US$433.8m.
Of course, Pan American Silver has a market capitalization of US$5.87b, so these liabilities are probably manageable. However, we do think it is worth keeping an eye on its balance sheet strength, as it may change over time. Despite its noteworthy liabilities, Pan American Silver boasts net cash, so it's fair to say it does not have a heavy debt load!
Better yet, Pan American Silver grew its EBIT by 122% last year, which is an impressive improvement. If maintained that growth will make the debt even more manageable in the years ahead. The balance sheet is clearly the area to focus on when you are analysing debt. But it is future earnings, more than anything, that will determine Pan American Silver's ability to maintain a healthy balance sheet going forward. So if you want to see what the professionals think, you might find this free report on analyst profit forecasts to be interesting.
But our final consideration is also important, because a company cannot pay debt with paper profits; it needs cold hard cash. While Pan American Silver has net cash on its balance sheet, it's still worth taking a look at its ability to convert earnings before interest and tax (EBIT) to free cash flow, to help us understand how quickly it is building (or eroding) that cash balance. During the last two years, Pan American Silver generated free cash flow amounting to a very robust 91% of its EBIT, more than we'd expect. That positions it well to pay down debt if desirable to do so.
Summing up
While it is always sensible to look at a company's total liabilities, it is very reassuring that Pan American Silver has US$185.6m in net cash. And it impressed us with free cash flow of US$207m, being 91% of its EBIT. So we don't think Pan American Silver's use of debt is risky. Another factor that would give us confidence in Pan American Silver would be if insiders have been buying shares: if you're conscious of that signal too, you can find out instantly by clicking this link.
If you're interested in investing in businesses that can grow profits without the burden of debt, then check out this free list of growing businesses that have net cash on the balance sheet.
This article by Simply Wall St is general in nature. It does not constitute a recommendation to buy or sell any stock, and does not take account of your objectives, or your financial situation. We aim to bring you long-term focused analysis driven by fundamental data. Note that our analysis may not factor in the latest price-sensitive company announcements or qualitative material. Simply Wall St has no position in any stocks mentioned.
Have feedback on this article? Concerned about the content? Get in touch with us directly. Alternatively, email editorial-team (at) simplywallst.com.
VIRGINIA CITY, Nev., Aug. 04, 2021 (GLOBE NEWSWIRE) — Comstock Mining Inc. (the “Company”) (NYSE American: LODE), an emerging leader in climate-smart, sustainable mineral development and production, will host a conference call on Tuesday, August 10, 2021 at 8:00 a.m. Pacific Time/11:00 a.m. Eastern Time to report Second Quarter results and provide a business update. The Webcast will include a moderated Q&A, after the prepared remarks. Please join the event 10 to 15 minutes prior to the scheduled start time. The link to register in advance for this live Webcast is as follows:
Register in Advance for Our Zoom Webinar
When: August 10, 2021 08:00 AM Pacific Time (US and Canada)
Topic: Comstock Mining Second Quarter 2021 Results and Business Update
Please click the link below to register in advance for this webinar:
https://us02web.zoom.us/webinar/register/WN_AEfv_xN7RoiYEYpzl55gUw
The recording of the Webcast will be available, within 48 hours of the call, on the Company website:
http://www.comstockmining.com/investors/investor-library
About Comstock Mining Inc.
Comstock (NYSE: LODE) is an emerging leader in the sustainable extraction, valorization, and production of innovation-based, clean, renewable natural resources, with a focus on high-value, cash-generating, strategic materials that are essential to meeting the rapidly increasing global demand for clean energy, carbon-neutrality, and natural products. To learn more, please visit www.comstockmining.com.
Comstock was selected to join the Russell Microcap® Index at the conclusion of the 2021 Russell indexes annual reconstitution, effective after the US market opened on June 4, 2021. Membership in the Russell Microcap® Index, which remains in place for one year, means automatic inclusion in the appropriate growth and value style indexes. FTSE Russell determines membership for its Russell indexes primarily by objective, market-capitalization rankings and style attributes.
Forward-Looking Statements
This press release and any related calls or discussions may include forward-looking statements within the meaning of Section 27A of the Securities Act of 1933, as amended, and Section 21E of the Securities Exchange Act of 1934, as amended. All statements, other than statements of historical facts, are forward-looking statements. The words “believe,” “expect,” “anticipate,” “estimate,” “project,” “plan,” “should,” “intend,” “may,” “will,” “would,” “potential” and similar expressions identify forward-looking statements, but are not the exclusive means of doing so. Forward-looking statements include statements about matters such as: consummation of all pending transactions; project, asset or Company valuations; future industry market conditions; future explorations, acquisitions, investments and asset sales; future performance of and closings under various agreements; future changes in our exploration activities; future estimated mineral resources; future prices and sales of, and demand for, our products; future impacts of land entitlements and uses; future permitting activities and needs therefor; future production capacity and operations; future operating and overhead costs; future capital expenditures and their impact on us; future impacts of operational and management changes (including changes in the board of directors); future changes in business strategies, planning and tactics and impacts of recent or future changes; future employment and contributions of personnel, including consultants; future land sales, investments, acquisitions, joint ventures, strategic alliances, business combinations, operational, tax, financial and restructuring initiatives; the nature and timing of and accounting for restructuring charges and derivative liabilities and the impact thereof; contingencies; future environmental compliance and changes in the regulatory environment; future offerings of equity or debt securities; asset sales and associated costs; future working capital, costs, revenues, business opportunities, debt levels, cash flows, margins, earnings and growth. These statements are based on assumptions and assessments made by our management in light of their experience and their perception of historical and current trends, current conditions, possible future developments and other factors they believe to be appropriate. Forward-looking statements are not guarantees, representations or warranties and are subject to risks and uncertainties, many of which are unforeseeable and beyond our control and could cause actual results, developments and business decisions to differ materially from those contemplated by such forward-looking statements. Some of those risks and uncertainties include the risk factors set forth in our filings with the SEC and the following: counterparty risks; capital markets’ valuation and pricing risks; adverse effects of climate changes or natural disasters; global economic and capital market uncertainties; the speculative nature of gold or mineral exploration, including risks of diminishing quantities or grades of qualified resources; operational or technical difficulties in connection with exploration or mining activities; contests over title to properties; potential dilution to our stockholders from our stock issuances and recapitalization and balance sheet restructuring activities; potential inability to comply with applicable government regulations or law; adoption of or changes in legislation or regulations adversely affecting businesses; permitting constraints or delays; decisions regarding business opportunities that may be presented to, or pursued by, us or others; the impact of, or the non-performance by parties under agreements relating to, acquisitions, joint ventures, strategic alliances, business combinations, asset sales, leases, options and investments to which we may be party; changes in the United States or other monetary or fiscal policies or regulations; interruptions in production capabilities due to capital constraints; equipment failures; fluctuation of prices for gold or certain other commodities (such as silver, zinc, cyanide, water, diesel fuel and electricity); changes in generally accepted accounting principles; adverse effects of terrorism and geopolitical events; potential inability to implement business strategies; potential inability to grow revenues; potential inability to attract and retain key personnel; interruptions in delivery of critical supplies, equipment and raw materials due to credit or other limitations imposed by vendors or others; assertion of claims, lawsuits and proceedings; potential inability to satisfy debt and lease obligations; potential inability to maintain an effective system of internal controls over financial reporting; potential inability or failure to timely file periodic reports with the SEC; potential inability to list our securities on any securities exchange or market; inability to maintain the listing of our securities; and work stoppages or other labor difficulties. Occurrence of such events or circumstances could have a material adverse effect on our business, financial condition, results of operations or cash flows or the market price of our securities. All subsequent written and oral forward-looking statements by or attributable to us or persons acting on our behalf are expressly qualified in their entirety by these factors. Except as may be required by securities or other law, we undertake no obligation to publicly update or revise any forward-looking statements, whether as a result of new information, future events, or otherwise.
Neither this press release nor any related calls or discussions constitutes an offer to sell, the solicitation of an offer to buy or a recommendation with respect to any securities of the Company, the fund or any other issuer.
|
Contact information: |
||
|
Comstock Mining Inc. |
Corrado De Gasperis |
Zach Spencer |
TSX Venture Exchange (TSX-V): GRG
Frankfurt Stock Exchange (FSE): G6A
OTCQB Venture Market (OTCQB): GARWF
VANCOUVER, BC, Aug. 4, 2021 /PRNewswire/ – Golden Arrow Resources Corporation (TSX-V: GRG) (FSE: G6A) (OTCQB: GARWF), ("Golden Arrow" or the "Company") is pleased to report that additional geophysical surveying at its Rosales Copper Project in Chile has identified a more conductive and larger feature below the near-surface conductivity anomalies reported in the June 24th, 2021 news release (see Figure 1: https://bit.ly/3zPcik5).
The previously reported G1 and G2 conductivity anomaly targets cover 850×500 metres and 600×400 metres at surface, respectively, and are laterally separated by approximately 500 metres. The new TEM sounding survey has provided vertical sections showing one or more zones of moderate conductivity within 250m of surface, interpreted to correlate with the previously reported anomalies. Additionally, the sections have detected a more prominent sub-horizontal conductor at approximately 500m depth, and with occasional sub-vertical zones of increased conductivity connecting the near-surface and deep conductive features. The deep conductor appears to be more prominent below the G1 anomaly.
"We are very excited by this additional data from TEM soundings, which suggests a stratabound or mantos-style copper deposit model, which is further supported by the mineralization, alteration and host rocks identified to date at Rosales. This type of high-grade copper deposit is common in Chile, with well-known examples including the El Soldado and Mantos Blanco mines," stated Brian McEwen, VP Exploration and Development for Golden Arrow.
The Company has secured a drill contract and will be proceeding with an initial 3,000 metre phased reverse circulation drill program to test the targets. The first phase is expected to commence in August and will include approximately 1,400 metres in four holes, to test both the upper and lower conductors and confirm the interpretation (Figure 1). The subsequent 1,600 metres will be used to test the extent of the anomalies as well as other targets.
Rosales Project and Geophysical Program Results
The Rosales Project currently includes 3,444 hectares of 100% held mineral claims and an additional 900 hectares under application. The Project is located in the Atacama Region, a prolific mining district that hosts multiple large precious and base metal mines. The project is road-accessible and is situated less than 90 kilometres from the mining centre of Copiapo, with world-class exploration and mining infrastructure readily available.
The initial reconnaissance program at Rosales identified two general areas of prospective copper mineralization: the Margarita Mine trend (MMT), and the NW Target. The MMT is a 3.5-kilometre-long structural corridor, oriented northeast-southwest, mainly defined by felsic dykes. Chalcocite and chrysocolla were identified in outcrop over a 350 by 400 metres area underlain by andesitic volcanoclastics and andesites, within Jurassic aged volcano-sedimentary sequences. Samples from the area averaged 1.74% copper with a high value of 4.37% copper (see News Release dated July 20, 2020 filed on SEDAR). The copper mineralization fills fractures and is disseminated in the matrix of the volcanoclastic host rock, with further indications of manto-type mineralization in this zone.
As described in the June 24th, 2021 news release, the Transient Electromagnetic (TEM) surface in-loop geophysical survey detected two highly-conductive anomalies in the MMT, named G1 and G2, estimated to start within 100 metres of the surface. The G1 target is the highest priority target for drilling due to its size, strong conductivity and correlation with high copper values in surface rock-chip samples.
After completing the surface TEM survey, the geophysical contractor (Quantec Geoscience Chile Ltda.) completed three lines of TEM soundings crossing the two MMT anomalies to provide resistivity, displayed in vertical images (see Figure 1). The TEM sounding sections reveal one or more upper zones of moderate conductivity above 250m below surface, interpreted to correlate with the conductors detected in the previously reported fixed in-loop TEM surveys. Additionally, the sounding sections have detected a prominent and extensive conductor at approximately 500m depth and appear to resolve increased conductivity below G1, proximal to a vertical corridor postulated to represent a feeder-structure.
The flat-lying and layered appearance of the anomalies, combined with the copper sulphide mineralization observed at surface, are consistent with expectations for copper manto (stratabound) deposits. These deposits typically contain 1-2% copper, with hypogene mineralogy consisting of bornite, chalcocite and chalcopyrite; mineralization is often associated with albite alteration[1]. These deposits are relatively common in Chile, and in the northern part of the country are hosted by Jurassic volcanic rocks. Many of these characteristics have been noted at Rosales and Golden Arrow believes this to be an appropriate exploration model for the project. For reference, Figure 2 (https://bit.ly/2WpMKvq) shows a schematic cross section of the manto-type deposit at El Soldado Mine, located 132km north of Santiago, which has been mined by several groups over decades and is currently operated by Anglo American.
In addition to the TEM surveys, Golden Arrow has completed a ground-based magnetic survey covering 5,035 hectares. Preliminary interpretation of the data indicates zones of low magnetism that are coincident with the TEM in-loop survey conductivity anomalies. This has been seen at other mantos-type copper deposits, including El Soldado1.
Independent geophysical consultant Miles Rideout continues to guide the program and has provided additional interpretation of the data and recommendations for drilling.
Survey Methodology
The TEM sounding surveys were spaced at 50m intervals along the lines, and employed 200x200m transmit loops. The Geonics Protem instrumentation recorded 3-component data at 25 and 2.5 Hz, in order to register data from near surface to approximately 1000m depth. The sounding data were inverse-modelled with Quantec's TIMAGE software. The sections, consisting of 1D-stitched models, present resistivity data in Ohm-metre units, where electrically conductive features are coloured red and purple, and electrically resistive features are shown in hues of blue and white. Note that in Figure 1, the fixed in-loop TEM surveys has conductive response coloured red, and the lack of conductive response is shown in shades of green and blue. For additional details on the methodology of the in-loop survey, please refer to the June 24th, 2021 news release.
Qualified Persons
The technical portions of this news release have been reviewed and approved by Brian McEwen, P.Geol., VP Exploration and Development to the Company and a Qualified Person as defined in National Instrument 43-101.
About Golden Arrow:
Golden Arrow Resources Corporation is a mining exploration company with a successful track record of creating value by making precious and base metal discoveries and advancing them into exceptional deposits. The Company is well leveraged to the price of gold, having monetized its Chinchillas silver discovery into a significant holding in precious metals producer SSR Mining Inc.
Golden Arrow is actively exploring a portfolio that includes an epithermal gold project in Argentina, a district–scale frontier gold opportunity in Paraguay, a base-metal project in the heart of a leading mining district in Chile and more than 180,000 hectares of properties in Argentina.
The Company is a member of the Grosso Group, a resource management group that has pioneered exploration in Argentina since 1993.
ON BEHALF OF THE BOARD
"Joseph Grosso"
______________________
Mr. Joseph Grosso,
Executive Chairman, President and CEO
Neither TSX Venture Exchange nor its Regulation Services Provider (as that term is defined in policies of the TSX Venture Exchange) accepts responsibility for the adequacy or accuracy of this release.
This news release may contain forward-looking statements. Forward-looking statements address future events and conditions and therefore involve inherent risks and uncertainties. All statements, other than statements of historical fact, that address activities, events or developments the Company believes, expects or anticipates will or may occur in the future, including, without limitation, statements about the Company's plans for its mineral properties; the Company's business strategy, plans and outlooks; the future financial or operating performance of the Company; and future exploration and operating plans are forward-looking statements.
Forward-looking statements are subject to a number of risks and uncertainties that may cause the actual results of the Company to differ materially from those discussed in the forward-looking statements and, even if such actual results are realized or substantially realized, there can be no assurance that they will have the expected consequences to, or effects on, the Company. Factors that could cause actual results or events to differ materially from current expectations include, among other things: the impact of COVID-19; risks and uncertainties related to the ability to obtain, amend, or maintain licenses, permits, or surface rights; risks associated with technical difficulties in connection with mining activities; and the possibility that future exploration, development or mining results will not be consistent with the Company's expectations. Actual results may differ materially from those currently anticipated in such statements. Readers are encouraged to refer to the Company's public disclosure documents for a more detailed discussion of factors that may impact expected future results. The Company undertakes no obligation to publicly update or revise any forward-looking statements, unless required pursuant to applicable laws.
|
______________________ |
|
|
1 |
From: Boric, R., Holmgren, C. & Wilson, N.S.F. & Zentilli, M., 2002 – The Geology of the El Soldado Manto Type Cu (Ag) Deposit, Central Chile; in Porter, T.M. (Ed.), Hydrothermal Iron Oxide Copper-Gold & Related Deposits: A Global Perspective, Volume 2; PGC Publishing, Adelaide, pp 185-205 |

View original content to download multimedia:https://www.prnewswire.com/news-releases/golden-arrow-identifies-multiple-target-horizons-and-announces-first-drill-program-at-rosales-copper-project-chile-301347949.html
SOURCE Golden Arrow Resources Corporation
Shares Outstanding: 277,578,617
Trading Symbols:TSX: GGD
OTCQX: GLGDF
HALIFAX, NS, Aug. 4, 2021 /PRNewswire/ – GoGold Resources Inc. (TSX: GGD) (OTCQX: GLGDF) ("GoGold", "the Company") is pleased to announce that Karen Flores has been appointed to the Company's Board of Directors effective August 4, 2021, pending regulatory approval.
Ms. Flores is the CEO of the Mining Chamber of Mexico, which represents the interests of the country's mining-metallurgical industry. In June 2020, Forbes Mexico recognized Karen as one of the 100 Most Powerful Women in Mexico for her ground-breaking leadership in the mining industry. She is also an advisor for the Chamber of Commerce of Canada in Mexico (CANCHAM), where she chairs the Integration Caucus and the Women Building Business committee. She is part of the founding group of WIM Women Mexico, a subsidiary of Women in Mining International.
With more than 15 years of experience in the mining sector, Ms. Flores has held positions in both public administration and private industry. She has gathered extensive experience working in the field promoting mining communities, as well as successful negotiation, communication, and sustainability strategies. She has also played an active role in discussion forums and working groups that promote the interests of the mining industry. Ms. Flores was an active member of the Association of Mining Engineers, Metallurgists and Geologists of Mexico (AIMMGM), holding different honorary positions such as Vice-President of Government Affairs, Communications Coordinator of District Mexico, and Coordinator of Public Relations and Protocol for the XXXI and XXXII International Mining Conventions.
Prior to her current role as CEO of the Mining Chamber of Mexico, Ms. Flores was the head of Corporate and Government Relations for the Mexico Division of Agnico Eagle from 2014 to 2019. She represented the interests of the company before government entities, chambers of commerce, trade associations, and managed the social and governmental aspects of the due diligence process for new projects. Between 2007 and 2013, Ms. Flores worked at the Undersecretariat for Mining of the Ministry of Economy, holding various positions such as Advisor, Head of Analysis and Information, Chief of Staff, Assistant General Manager of the Undersecretary's Office, among others.
"We are pleased to welcome Ms. Flores to the board of directors. Her extensive governmental, industry, and community relations experience will bring enhanced board-level knowledge to advance GoGold's environmental, social and governance ("ESG") practices," said Brad Langille, President and CEO. "We believe GoGold shareholders will be well served by Karen's engagement, perspective and service as a board member of the Company."
About GoGold Resources
GoGold Resources (TSX: GGD) is a Canadian-based silver and gold producer focused on operating, developing, exploring and acquiring high quality projects in Mexico. The Company operates the Parral Tailings mine in the state of Chihuahua and has the Los Ricos South and Los Ricos North exploration projects in the state of Jalisco. Headquartered in Halifax, NS, GoGold is building a portfolio of low cost, high margin projects. For more information visit gogoldresources.com.
CAUTIONARY STATEMENT:
The securities described herein have not been, and will not be, registered under the United States Securities Act of 1933, as amended (the "U.S. Securities Act"), or any state securities laws, and may not be offered or sold within the United States or to, or for the benefit of, U.S. persons (as defined in Regulation S under the U.S. Securities Act) except in compliance with the registration requirements of the U.S. Securities Act and applicable state securities laws or pursuant to exemptions therefrom. This release does not constitute an offer to sell or a solicitation of an offer to buy of any of GoGold's securities in the United States.

View original content:https://www.prnewswire.com/news-releases/gogold-appoints-karen-flores-to-board-of-directors-301347955.html
SOURCE GoGold Resources Inc.
Endeavour Silver (EXK) is expected to deliver a year-over-year increase in earnings on higher revenues when it reports results for the quarter ended June 2021. This widely-known consensus outlook gives a good sense of the company's earnings picture, but how the actual results compare to these estimates is a powerful factor that could impact its near-term stock price.
The stock might move higher if these key numbers top expectations in the upcoming earnings report, which is expected to be released on August 10. On the other hand, if they miss, the stock may move lower.
While the sustainability of the immediate price change and future earnings expectations will mostly depend on management's discussion of business conditions on the earnings call, it's worth handicapping the probability of a positive EPS surprise.
Zacks Consensus Estimate
This silver mining company is expected to post quarterly earnings of $0.03 per share in its upcoming report, which represents a year-over-year change of +250%.
Revenues are expected to be $47.15 million, up 133.4% from the year-ago quarter.
Estimate Revisions Trend
The consensus EPS estimate for the quarter has been revised 42.86% higher over the last 30 days to the current level. This is essentially a reflection of how the covering analysts have collectively reassessed their initial estimates over this period.
Investors should keep in mind that an aggregate change may not always reflect the direction of estimate revisions by each of the covering analysts.
Price, Consensus and EPS Surprise

Earnings Whisper
Estimate revisions ahead of a company's earnings release offer clues to the business conditions for the period whose results are coming out. This insight is at the core of our proprietary surprise prediction model — the Zacks Earnings ESP (Expected Surprise Prediction).
The Zacks Earnings ESP compares the Most Accurate Estimate to the Zacks Consensus Estimate for the quarter; the Most Accurate Estimate is a more recent version of the Zacks Consensus EPS estimate. The idea here is that analysts revising their estimates right before an earnings release have the latest information, which could potentially be more accurate than what they and others contributing to the consensus had predicted earlier.
Thus, a positive or negative Earnings ESP reading theoretically indicates the likely deviation of the actual earnings from the consensus estimate. However, the model's predictive power is significant for positive ESP readings only.
A positive Earnings ESP is a strong predictor of an earnings beat, particularly when combined with a Zacks Rank #1 (Strong Buy), 2 (Buy) or 3 (Hold). Our research shows that stocks with this combination produce a positive surprise nearly 70% of the time, and a solid Zacks Rank actually increases the predictive power of Earnings ESP.
Please note that a negative Earnings ESP reading is not indicative of an earnings miss. Our research shows that it is difficult to predict an earnings beat with any degree of confidence for stocks with negative Earnings ESP readings and/or Zacks Rank of 4 (Sell) or 5 (Strong Sell).
How Have the Numbers Shaped Up for Endeavour Silver?
For Endeavour Silver, the Most Accurate Estimate is lower than the Zacks Consensus Estimate, suggesting that analysts have recently become bearish on the company's earnings prospects. This has resulted in an Earnings ESP of -28.57%.
On the other hand, the stock currently carries a Zacks Rank of #4.
So, this combination makes it difficult to conclusively predict that Endeavour Silver will beat the consensus EPS estimate.
Does Earnings Surprise History Hold Any Clue?
While calculating estimates for a company's future earnings, analysts often consider to what extent it has been able to match past consensus estimates. So, it's worth taking a look at the surprise history for gauging its influence on the upcoming number.
For the last reported quarter, it was expected that Endeavour Silver would post earnings of $0.02 per share when it actually produced a loss of $0.03, delivering a surprise of -250%.
Over the last four quarters, the company has beaten consensus EPS estimates two times.
Bottom Line
An earnings beat or miss may not be the sole basis for a stock moving higher or lower. Many stocks end up losing ground despite an earnings beat due to other factors that disappoint investors. Similarly, unforeseen catalysts help a number of stocks gain despite an earnings miss.
That said, betting on stocks that are expected to beat earnings expectations does increase the odds of success. This is why it's worth checking a company's Earnings ESP and Zacks Rank ahead of its quarterly release. Make sure to utilize our Earnings ESP Filter to uncover the best stocks to buy or sell before they've reported.
Endeavour Silver doesn't appear a compelling earnings-beat candidate. However, investors should pay attention to other factors too for betting on this stock or staying away from it ahead of its earnings release.
Want the latest recommendations from Zacks Investment Research? Today, you can download 7 Best Stocks for the Next 30 Days. Click to get this free report
Endeavour Silver Corporation (EXK) : Free Stock Analysis Report
To read this article on Zacks.com click here.
DENVER, CO / ACCESSWIRE / August 3, 2021 / Solitario Zinc Corp. ("Solitario") (NYSE American:XPL)(TSX:SLR) is pleased to announce that it has acquired approximately 11,600 acres of mineral rights in western South Dakota known as the Golden Crest Project. These mineral claims comprise strategic land holdings in a gold district that has historically produced from multiple mines ranging in production from several million to the more than 40 million ounces of gold at the Super Giant Homestake Mine. The project area is in a safe and mining friendly jurisdiction with highly developed infrastructure, an unbroken 145-year record of continuous gold mining, a skilled mining workforce and a history of high-grade, underground mineable gold deposits.
Chris Herald, President and CEO of Solitario, stated: "Golden Crest is the most significant gold exploration effort we have ever undertaken in our corporate history. The northern Black Hills is one of the most gold-endowed regions in the world and we firmly believe that it has the potential to host multiple new, world class gold deposits. We have been working on this project for nearly a year and have assembled a significant land position in this exciting gold belt.
Adding the Golden Crest gold project to our two high-grade zinc assets, Florida Canyon and Lik, creates a company with a compelling value proposition in zinc and an exciting green fields gold property situated in an exceptional gold belt that is underexplored."
What We Know About Super Giant Gold Deposits
The historic Homestake Mine (42 million mined ounces and 20 million unmined ounces of gold) is one of the largest individual gold deposits in North America and has the distinction of falling into a rare class known as Super Giant gold deposits (deposits containing +58 million ounces). There are less than forty known gold deposits of this size worldwide. Super Giant deposits are characterized by a cluster of surrounding geologically similar deposits within an area of several hundred square kilometers that define profoundly mineralized regions. Globally, these deposit clusters nearly always contain satellite gold endowments in excess of 100 million ounces. Examples of Super Giants and their associated clusters include the Timmins-Abitibi Belt (Canada), Golden Mile-Eastern Goldfields (Australia), Obuasi-West Africa and Carlin/Gold Strike-Carlin Trend (Nevada).
Chris Herald further stated, "We do not believe that the Homestake Super Giant deposit exists in isolation, but is located within a group of gold deposits, the majority of which are yet to be discovered. The region has exceptional exploration potential representing one of the world's best districts for undiscovered large gold deposits. We believe areas west of the Homestake Mine have a high potential for the discovery of significant new deposits through a well-funded and systematic modern exploration strategy. Historic Homestake Mining Company exploration reports and new syntheses of Black Hills geology provide strong support for the gold potential in areas that Solitario has staked. This information, coupled with our own ongoing independent work, formed the basis for our Golden Crest land acquisition program."
The World's Most Underexplored Super Giant Gold Region in the World – Where Are the Undiscovered 100 Million Ounces of Gold?
Most of the known gold deposits in the Black Hills were found at the surface during the Black Hills Gold Rush from 1876-1896. Exploration efforts to locate totally new deposits have been slight and sporadic during the past 120 years. Despite the immense fertility of the district, no comprehensive and systematic exploration program has ever been performed, even by Homestake Mining Company. Remarkably, no truly new gold deposits have been discovered in the Black Hills since the turn of the 20th Century.
The Homestake Mine operated continuously for approximately 125 years (1876 – 2001) during which time the Homestake Mining Company had a virtual monopoly on ownership of mineral lands throughout much of the region. Homestake had ample future reserves for over a hundred years of mine operations, and so it never felt compelled to search for gold regionally. During this period, nearly all of Homestake's exploration work was conducted within three to four miles of the original discovery, except for a period between 1988 to 1993.
Homestake's very limited amount of regional exploration work in the 80's and early 90's included a widely spaced stream sediment geochemistry program over an area of seventy-five square miles. This effort identified five largely unexplored drainage areas in the western part of the district with anomalous gold and associated pathfinder elements. Four of these five anomalies had completely unexplained bedrock gold sources, well outside of known historically mined areas. Solitario now controls all four of the likely bedrock source regions of these sediment anomalies and is conducting exploration to further define gold distribution.
In addition, Homestake drilled three deep reconnaissance wildcat holes in the western portion of the northern Black Hills to test for the presence of favorable Precambrian rocks. Two of these holes intersected the important ore-hosting Homestake Iron Formation within areas that Solitario now controls.
Target Rich Property – Every Drill Hole Will Test Three Different Gold Target Zones
The Black Hills exhibits a remarkable spatial superposition of significant gold deposit types of different ages, all within a single compact mining district. Few other districts in the world possess this feature. Large Precambrian-aged orogenic gold deposits, such as Homestake, hosted in Precambrian basement, are overlain by ancient paleoplacers at the Precambrian-Cambrian unconformity that preserve gold eroded from the older deposits during Precambrian weathering and erosion. These in turn are overlain by Paleozoic sedimentary rock sequences 300-400 meters thick that contain several prominent stratigraphic hosts for Tertiary-aged replacement style gold mineralization in high-grade veins and disseminated bulk tonnage deposits. The contemporaneous igneous rocks associated with the Tertiary mineralizing event that intrude the Paleozoic rocks and basement also host significant gold resources. Initial exploration work by Solitario suggest these gold targets lying above the Precambrian basement occur within Solitario's Golden Crest Project property position and can easily be reached by drilling to depths ranging from 200-400 meters.
Thus, every exploration hole has the opportunity to test for multiple deposit types as it cuts through Paleozoic or igneous rocks searching for concealed Precambrian gold. These stacked targets significantly de-risk the exploration for the larger, but more challenging to find, Precambrian deposits. Several of these additional deposit types can be world class targets in their own right: the sediment-hosted Wharf Mine of Coeur Mining has a total gold resource base of 7.4 million ounces (mined and current resources) and the igneous-hosted Gilt Edge Mine of Agnico Eagle Ltd hosts a growing resource in excess of 3 million ounces of gold.
Land Position and Lease Terms
The Golden Crest project consists of 580 claims covering 11,600 acres. Of this, approximately two-thirds of the claims are subject to a lease signed in late-May 2021, with a private LLC. According to the terms of the lease, Solitario owns a 100% interest in these claims subject to certain scheduled annual payments, work commitments, a potential success bonus, and a 2% Net Smelter Return Royalty. Solitario has the option, but not the obligation, to reduce the Net Smelter Return royalty to 1.0% by paying the owner $1,000,000. Solitario paid the underlying owner $65,000 upon signing. In addition, Solitario has agreed, at its option, to pay the underlying owner the following annual payments and perform the following minimum work commitments to keep the lease in good standing:
|
Time Period |
Payment |
Time Period |
Work Commitment |
|
Year One Anniversary |
$60,000 |
Year One |
$200,000 |
|
Year Two Anniversary |
$70,000 |
Year Two |
$400,000 |
|
Year Three Anniversary |
$80,000 |
Year Three |
$600,000 |
|
Year Four Anniversary |
$90,000 |
Year Four |
$800,000 |
|
Years Five-Ten Anniversaries |
$100,000 |
Year Five & Thereafter |
$1,000,000 |
|
Years Eleven & Thereafter |
$150,000 |
About Solitario
Solitario is an emerging zinc and gold exploration and development company traded on the NYSE American ("XPL") and on the Toronto Stock Exchange ("SLR"). In addition to its newly acquired Golden Crest properties, Solitario holds 50% joint venture interest (Teck Resources 50%) in the high-grade, open-pittable Lik zinc deposit in Alaska and a 39% joint venture interest (Nexa Resources holds the remaining 61% interest) on the high-grade Florida Canyon zinc project in Peru. Solitario's Management and Directors hold approximately 9.3% (excluding options) of the Company's 58.4 million shares outstanding. Solitario's cash balance and marketable securities stand at approximately US$6.9 million. Additional information about Solitario is available online at www.solitariozinc.com.
For More Information Please Contact:
Valerie Kimball
Director – Investor Relations
(720) 933-1150
(800) 229-6827
Christopher E. Herald
President & CEO
(303) 534-1030, Ext. 14
Cautionary Statement Regarding Forward Looking Information
This press release contains forward-looking statements within the meaning of the U.S. Securities Act of 1933 and the U.S. Securities Exchange Act of 1934, and as defined in the United States Private Securities Litigation Reform Act of 1995 (and the equivalent under Canadian securities laws),that are intended to be covered by the safe harbor created by such sections. Forward-looking statements are statements that are not historical fact. They are based on the beliefs, estimates and opinions of the Company's management on the date the statements are made and address activities, events or developments that Solitario expects or anticipates will or may occur in the future, and are based on current expectations and assumptions. Forward-looking statements involve a number of risks and uncertainties. Consequently, there can be no assurances that such statements will prove to be accurate and actual results and future events could differ materially from those anticipated in such statements. Solitario's Golden Crest land position does not cover any of the areas of historical gold production or historical unmined resources, but are thought to be on trend with these known areas of mineralization. Certain historical information concerning exploration and gold production in the Black Hills region has been obtained through both public and private sources and are believed to be substantially factual, but Solitario can give no assurances of the accuracy of such information. Such forward-looking statements include, without limitation, statements regarding the Company's expectation of the projected timing and outcome of engineering studies; expectations regarding the receipt of all necessary permits and approvals to implement a mining plan, if any, at Lik or Florida Canyon; the potential for confirming, upgrading and expanding zinc, lead and silver mineralized material; future operating and capital cost estimates may indicate that the stated resources may not be economic; estimates of zinc, lead and silver grades of resources provided are predicted and actual mining grade could be substantially lower; estimates of recovery rates for could be lower than estimated for establishing the cutoff grade; and other statements that are not historical facts could vary significantly from assumptions made in the PEA. Although Solitario management believes that its expectations are based on reasonable assumptions, it can give no assurance that these expectations will prove correct. Important factors that could cause actual results to differ materially from those in the forward-looking statements include, among others, risks relating to risks that Solitario's and its joint venture partners' exploration and property advancement efforts will not be successful; risks relating to fluctuations in the price of zinc, lead and silver; the inherently hazardous nature of mining-related activities; uncertainties concerning reserve and resource estimates; availability of outside contractors, and other activities; uncertainties relating to obtaining approvals and permits from governmental regulatory authorities; the possibility that environmental laws and regulations will change over time and become even more restrictive; and availability and timing of capital for financing the Company's exploration and development activities, including uncertainty of being able to raise capital on favorable terms or at all; as well as those factors discussed in Solitario's filings with the U.S. Securities and Exchange Commission (the "SEC") including Solitario's latest Annual Report on Form 10-K and its other SEC filings (and Canadian filings) including, without limitation, its latest Quarterly Report on Form 10-Q. The Company does not intend to publicly update any forward-looking statements, whether as a result of new information, future events, or otherwise, except as may be required under applicable securities laws.
SOURCE: Solitario Zinc Corp.
View source version on accesswire.com:
https://www.accesswire.com/657945/Solitario-Establishes-Major-New-Land-Positions-in-Highly-Prospective-Gold-Terrain-in-the-United-States
Individual and institutional investors as well as advisors are invited to log-on to VirtualInvestorConferences.com to view presentations
NEW YORK, Aug. 3, 2021 /CNW/ – Virtual Investor Conferences, the leading proprietary investor conference series today announced that the presentations from the July Green Energy & Precious Metals lnvestor Conference are now available for on-demand viewing.
REGISTER OR LOGIN NOW TO VIEW THE PRESENTATIONS: https://bit.ly/37cWBqt
The company presentations will be available 24/7 for 90 days. Investors, advisors and analysts may download shareholder materials from the "virtual trade booth" for the next three weeks.
Participating Companies:
|
Presentation |
Ticker(s) |
|
Byron King, Editor, "Whiskey & Gunpowder", Agora Financial-St. Paul Research |
|
|
Raymond M. McCormick, Managing Director, Energy & Natural Resources, Capstone Partners "An Investment Banker's Perspective of the Uranium Industry" |
|
|
Appia Energy Corp. |
(OTCQB: APAAF | CSE: API) |
|
Thor Mining PLC |
(OTCQB: THORF | ASX: THR | AIM: THR) |
|
Renforth Resources Inc. |
(OTCQB: RFHRF | CSE: RFR) |
|
Ion Energy Ltd. |
(OTCQB: IONGF | TSX-V: ION) |
|
Baselode Energy Corp. |
(OTCQB: BSENF | TSX-V: FIND) |
|
Blue Sky Uranium Corp. |
(OTCQB: BKUCF | TSX: BSK) |
|
Energy Fuels Inc. |
(NYSE American: UUUU | TSX: EFR) |
|
Euro Manganese Inc. |
(OTCQX: EUMNF | TSX-V: EMN) |
|
Silver Elephant Mining Corp |
(OTCQX: SILEF | TSX-V: ELEF) |
|
Commerce Resources Corp. |
(OTCQX: CMRZF | TSX-V: CCE) |
|
First Cobalt Corp. |
(OTCQX: FTSSF | TSX-V: FCC) |
|
Nouveau Monde Graphite Inc. |
(NYSE: NMG | TSX-V: NOU) |
|
Giga Metals Corp. |
(OTCQB: HNCKF | TSX-V: GIGA) |
|
Nova Royalty Corp. |
(OTCQB: NOVRF | TSX-V: NOVR) |
|
Lion One Metals Ltd. |
(OTCQX: LOMLF | TSX-V: LIO) |
|
Starcore International Mines Ltd. |
(OTCQB: SHVLF | TSX: SAM) |
|
Golden Valley Mines and Royalties Ltd. |
(OTCQX: GLVMF | TSX-V: GZZ) |
|
Arizona Metals Corp. |
(OTCQX: AZMCF | TSX-V: AMC) |
|
Barksdale Resources Corp. |
(OTCQX: BRKCF | TSX-V: BRO) |
|
Ridgeline Minerals Corp. |
(OTCQX: RDGMF | TSX-V: RDG) |
|
Liberty Gold Corp. |
(OTCQX: LGDTF | TSX: LGD) |
|
Outback Goldfields Corp. |
(OTCQB: OZBKF | CSE: OZ) |
|
Karora Resources Inc. |
(OTCQX: KRRGF | TSX: KRR) |
|
Empress Royalty Corp. |
(OTCQB: EMPYF | TSX-V: EMPR) |
|
Bunker Hill Mining Corp. |
(OTCQB: BHLL | TSX-V: BNKR) |
|
Vior Inc. |
|
|
Kodiak Copper Corp. |
(OTCQB: KDKCF | TSX-V: KDK) |
|
Heliostar Metals Ltd. |
(OTCQX: HSTXF | TSX-V: HSTR) |
|
Honey Badger Silver Inc. |
(Pink: HBEIF| TSX-V: TUF) |
|
Tinka Resources Ltd. |
(OTCQB: TKRFF | TSX-V: TK) |
|
Salazar Resources Ltd. |
(OTCQX: SRLZF | TSX-V: SRL) |
|
Stratabound Minerals Corp. |
(OTCQB: SBMIF | TSX-V: SB) |
|
KORE Mining Ltd. |
(OTCQX: KOREF | TSX-V: KORE) |
|
Fabled Silver Gold Corp. |
(OTCQB: FBSGF | TSX-V: FCO) |
|
Element 29 Resources Inc. |
(OTCQB: EMTRF| TSX-V: ECU) |
|
Canada Nickel Company Inc. |
(OTCQB: CNIKF | TSX-V: CNC) |
|
Aztec Minerals Corp. |
(OTCQB: AZZTF | TSX-V: AZT) |
|
Granite Creek Copper Ltd. |
(OTCQB: GCXXF | TSX-V: GCX) |
|
Group Ten Metals Inc. |
(OTCQB: PGEZF | TSX- V: PGE) |
|
Metallic Minerals Ltd. |
(OTCQB: MMNGF | TSX-V: MMG) |
|
Imperial Mining Group Ltd. |
(OTCQB: IMPNF | TSX-V: IPG) |
|
Defiance Silver Corp. |
(OTCQX: DNCVF | TSX-V: DEF) |
|
Orezone Gold Corp. |
(OTCQX: ORZCF | TSX-V: ORE) |
|
GoldSpot Discoveries Corp. |
(OTCQX: SPOFF | TSX-V: SPOT) |
To facilitate investor relations scheduling, for more information about the program and to view a complete calendar of Virtual Investor Conferences, please visit www.virtualinvestorconferences.com.
About Virtual Investor Conferences®
Virtual Investor Conferences (VIC) is the leading proprietary investor conference series that provides an interactive forum for publicly-traded companies to meet and present directly with investors.
A real-time solution for investor engagement, Virtual Investor Conferences is part of OTC Market Group's suite of investor relations services specifically designed for more efficient Investor Access. Replicating the look and feel of on-site investor conferences, Virtual Investor Conferences combine leading-edge conferencing and investor communications capabilities with a comprehensive global investor audience network.
SOURCE VirtualInvestorConferences.com

View original content: http://www.newswire.ca/en/releases/archive/August2021/03/c1698.html
Toronto, Ontario–(Newsfile Corp. – August 3, 2021) – Monarca Minerals, Inc. (TSXV: MMN) ("Monarca" or the "Company") is pleased to announce that it has obtained an Environmental Permit (known as Informe Preventivo) to complete its planned 5,000 metre drilling program on its San Jose Silver Project ("San Jose") in Mexico.
Carlos Espinosa, President and CEO of Monarca commented, "We are very pleased that despite several delays due to COVID-19 restrictions in Mexico, we have obtained the environmental permit that will allow us to build and rehabilitate 7 km of roads in order to complete our 5,000 m drilling program. This was one of the last pieces of the puzzle, and we are now moving forward with our drilling plans for San Jose."
Monarca commenced building and completing the rehabilitation of 7 km of roads during the week of July 26 and drilling is expected to commence within the next four weeks once site preparation is complete.
An initial 10 drill holes are planned to depths of up to 500 m as indicated below in Figure 1. The planned drill holes are superimposed on a plan view of the Induced Polarization (IP) survey results at San Jose.
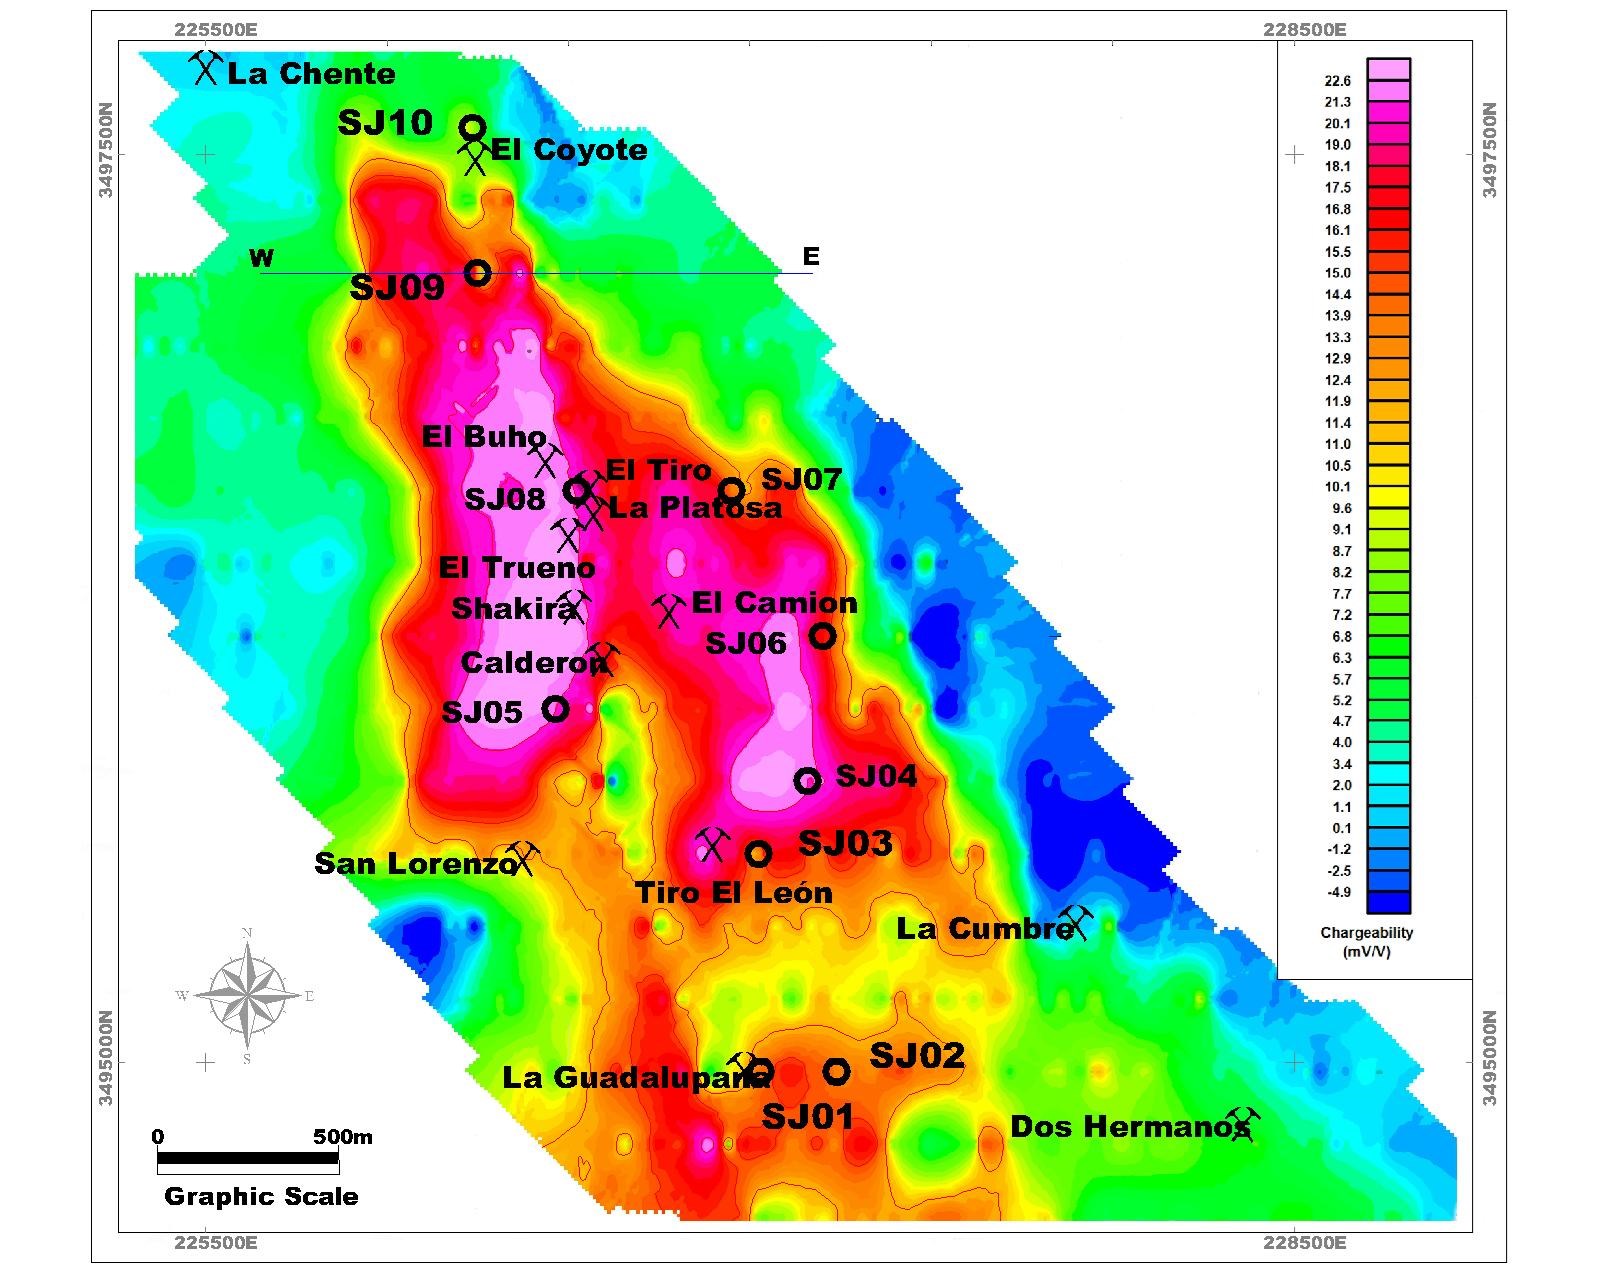
Figure 1: Planned drill holes on the San Jose Silver Project
To view an enhanced version of Figure 1, please visit:
https://orders.newsfilecorp.com/files/2584/91994_b266f22b543a3aec_001full.jpg
The drill holes are designed to intersect several strong IP anomalies identified in 2019, as indicated in Figure 2 below for one planned drill hole (SJ09).
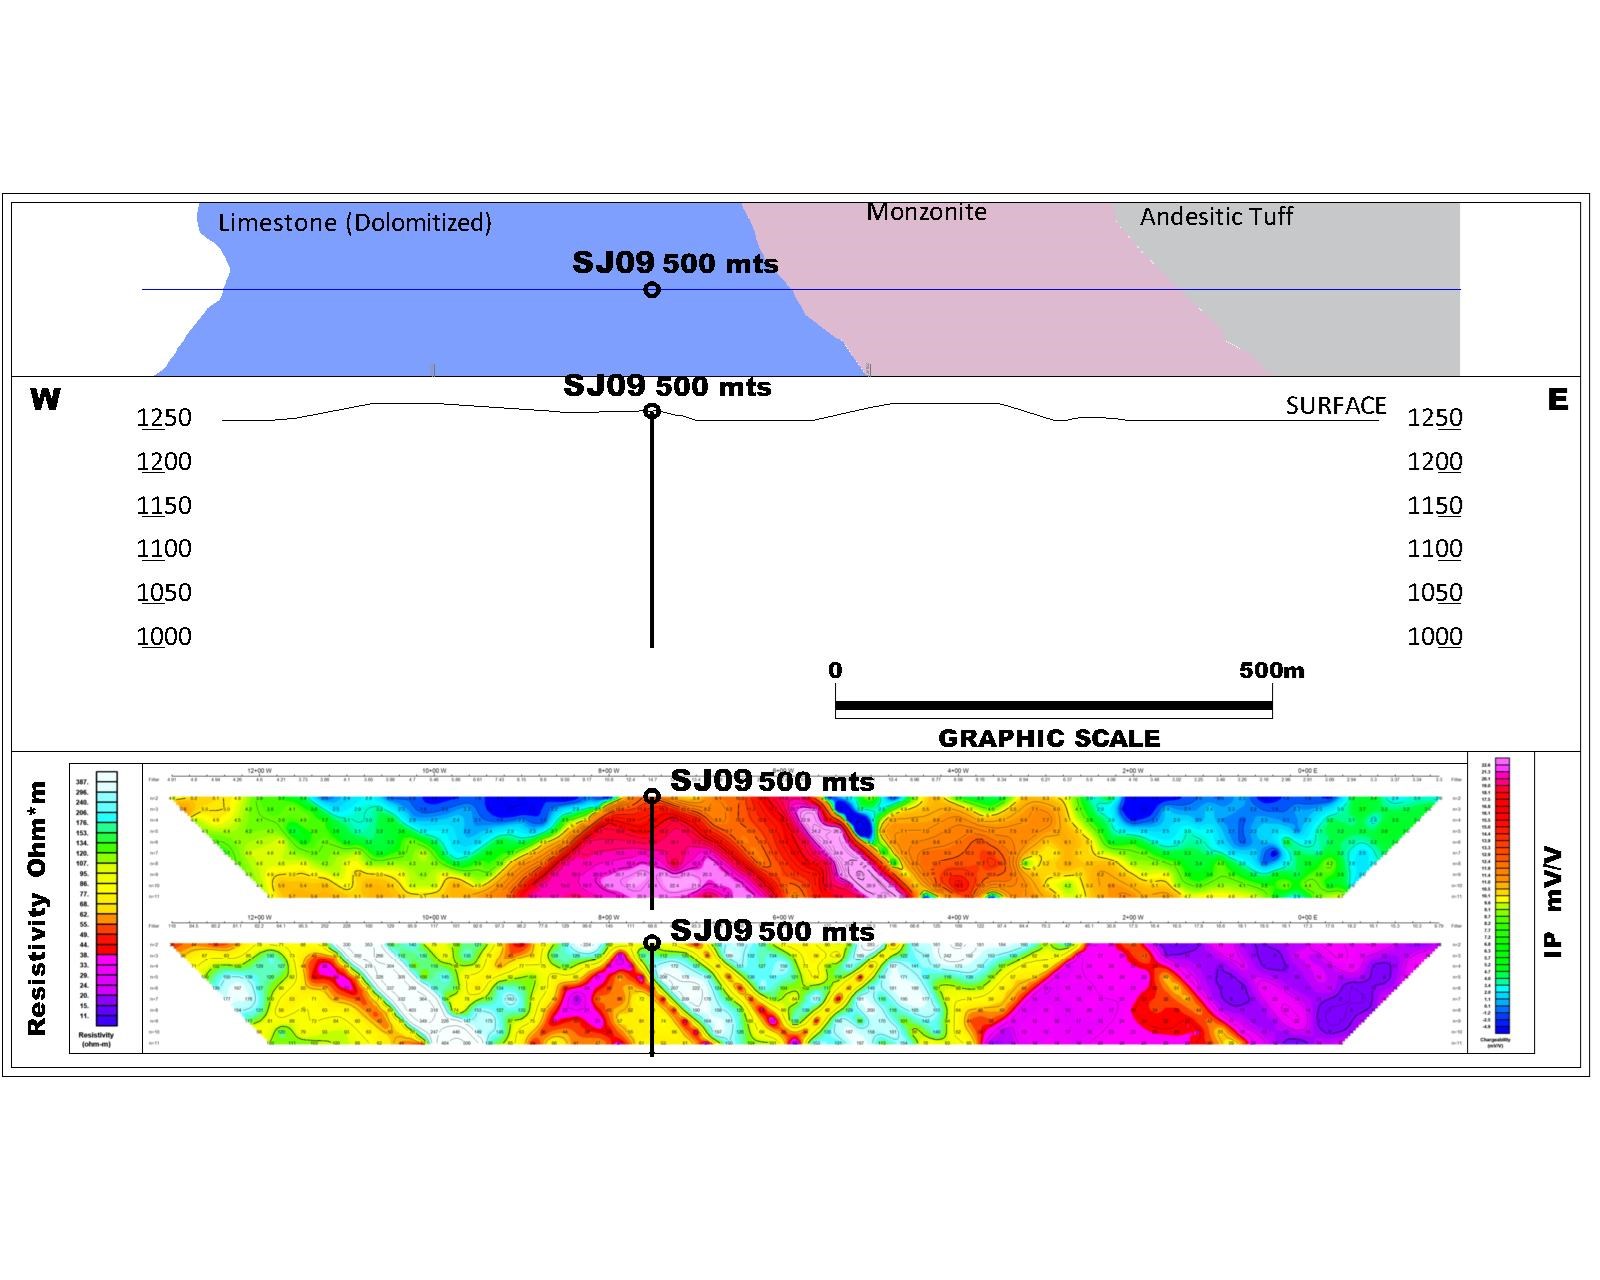
Figure 2: Cross section of a planned drill hole (SJ09) at San Jose targeting strong IP anomaly
To view an enhanced version of Figure 2, please visit:
https://orders.newsfilecorp.com/files/2584/91994_b266f22b543a3aec_005full.jpg
Grant of Stock Options
The Company also announces that, in accordance with the Company's stock option plan, it has granted the Directors of the Company a total of 2,400,000 stock options. Each option is exercisable to purchase one common share of the Company at $.08 per share for a period of 4 years from the date of issuance.
Qualified Person Statement
Michael R. Smith is the Qualified Person (QP) who has prepared and approved the scientific and technical information disclosed in this news release. Mr. Smith is a Registered Member (#04167376 – Geology) of the Society for Mining, Metallurgy & Exploration (SME) and the Executive Vice President, Exploration for Monarca Minerals Inc.
About Monarca Minerals Inc.
Monarca is a Canadian mining company listed on the TSX Venture Exchange (TSXV: MMN) and focused on the exploration and development of silver projects along a highly productive mineralized belt in Mexico. The Company has a portfolio of silver projects including an Inferred Mineral Resource of 19.8 million tonnes at 45.0 g/t Ag (28.7 million ounces of contained silver) at its Tejamen deposit in Durango, Mexico.
For further information, please contact:
Carlos Espinosa
President, CEO & Director
Monarca Minerals Inc.
E: cespinosa@slgmexico.com
Cautionary Note Regarding Forward-Looking Statements Forward-Looking Statements:
The above contains forward-looking statements that are subject to a number of known and unknown risks, uncertainties and other factors that may cause actual results to differ materially from those anticipated in our forward-looking statements. Factors that could cause such differences include: changes in world commodity markets, equity markets, costs and supply of materials relevant to the mining industry, change in government and changes to regulations affecting the mining industry. Forward-looking statements in this release include statements regarding future exploration programs, operation plans, geological interpretations, mineral tenure issues and mineral recovery processes. Although we believe the expectations reflected in our forward-looking statements are reasonable, results may vary, and we cannot guarantee future results, levels of activity, performance or achievements.
Neither the TSX Venture Exchange nor its Regulation Service Provider (as that term is defined in the policies of the TSX Venture Exchange) accepts responsibility for the adequacy or accuracy of this release.
/NOT FOR DISTRIBUTION TO UNITED STATES WIRE SERVICES OR DISSEMINATION IN THE UNITED STATES/

To view the source version of this press release, please visit https://www.newsfilecorp.com/release/91994
The market expects Pan American Silver (PAAS) to deliver a year-over-year increase in earnings on higher revenues when it reports results for the quarter ended June 2021. This widely-known consensus outlook is important in assessing the company's earnings picture, but a powerful factor that might influence its near-term stock price is how the actual results compare to these estimates.
The earnings report, which is expected to be released on August 10, 2021, might help the stock move higher if these key numbers are better than expectations. On the other hand, if they miss, the stock may move lower.
While management's discussion of business conditions on the earnings call will mostly determine the sustainability of the immediate price change and future earnings expectations, it's worth having a handicapping insight into the odds of a positive EPS surprise.
Zacks Consensus Estimate
This silver mining company is expected to post quarterly earnings of $0.33 per share in its upcoming report, which represents a year-over-year change of +17.9%.
Revenues are expected to be $457.09 million, up 83.2% from the year-ago quarter.
Estimate Revisions Trend
The consensus EPS estimate for the quarter has been revised 22.22% higher over the last 30 days to the current level. This is essentially a reflection of how the covering analysts have collectively reassessed their initial estimates over this period.
Investors should keep in mind that an aggregate change may not always reflect the direction of estimate revisions by each of the covering analysts.
Earnings Whisper
Estimate revisions ahead of a company's earnings release offer clues to the business conditions for the period whose results are coming out. This insight is at the core of our proprietary surprise prediction model — the Zacks Earnings ESP (Expected Surprise Prediction).
The Zacks Earnings ESP compares the Most Accurate Estimate to the Zacks Consensus Estimate for the quarter; the Most Accurate Estimate is a more recent version of the Zacks Consensus EPS estimate. The idea here is that analysts revising their estimates right before an earnings release have the latest information, which could potentially be more accurate than what they and others contributing to the consensus had predicted earlier.
Thus, a positive or negative Earnings ESP reading theoretically indicates the likely deviation of the actual earnings from the consensus estimate. However, the model's predictive power is significant for positive ESP readings only.
A positive Earnings ESP is a strong predictor of an earnings beat, particularly when combined with a Zacks Rank #1 (Strong Buy), 2 (Buy) or 3 (Hold). Our research shows that stocks with this combination produce a positive surprise nearly 70% of the time, and a solid Zacks Rank actually increases the predictive power of Earnings ESP.
Please note that a negative Earnings ESP reading is not indicative of an earnings miss. Our research shows that it is difficult to predict an earnings beat with any degree of confidence for stocks with negative Earnings ESP readings and/or Zacks Rank of 4 (Sell) or 5 (Strong Sell).
How Have the Numbers Shaped Up for Pan American Silver?
For Pan American Silver, the Most Accurate Estimate is the same as the Zacks Consensus Estimate, suggesting that there are no recent analyst views which differ from what have been considered to derive the consensus estimate. This has resulted in an Earnings ESP of 0%.
On the other hand, the stock currently carries a Zacks Rank of #3.
So, this combination makes it difficult to conclusively predict that Pan American Silver will beat the consensus EPS estimate.
Does Earnings Surprise History Hold Any Clue?
While calculating estimates for a company's future earnings, analysts often consider to what extent it has been able to match past consensus estimates. So, it's worth taking a look at the surprise history for gauging its influence on the upcoming number.
For the last reported quarter, it was expected that Pan American Silver would post earnings of $0.31 per share when it actually produced earnings of $0.18, delivering a surprise of -41.94%.
Over the last four quarters, the company has beaten consensus EPS estimates two times.
Bottom Line
An earnings beat or miss may not be the sole basis for a stock moving higher or lower. Many stocks end up losing ground despite an earnings beat due to other factors that disappoint investors. Similarly, unforeseen catalysts help a number of stocks gain despite an earnings miss.
That said, betting on stocks that are expected to beat earnings expectations does increase the odds of success. This is why it's worth checking a company's Earnings ESP and Zacks Rank ahead of its quarterly release. Make sure to utilize our Earnings ESP Filter to uncover the best stocks to buy or sell before they've reported.
Pan American Silver doesn't appear a compelling earnings-beat candidate. However, investors should pay attention to other factors too for betting on this stock or staying away from it ahead of its earnings release.
Want the latest recommendations from Zacks Investment Research? Today, you can download 7 Best Stocks for the Next 30 Days. Click to get this free report
Pan American Silver Corp. (PAAS) : Free Stock Analysis Report
To read this article on Zacks.com click here.
Individual and institutional investors as well as advisors are invited to log-on to VirtualInvestorConferences.com to view presentations
NEW YORK, Aug. 2, 2021 /PRNewswire/ — Virtual Investor Conferences, the leading proprietary investor conference series today announced that the presentations from the July Green Energy & Precious Metals lnvestor Conference are now available for on-demand viewing.

REGISTER OR LOGIN NOW TO VIEW THE PRESENTATIONS: https://bit.ly/37cWBqt
The company presentations will be available 24/7 for 90 days. Investors, advisors and analysts may download shareholder materials from the "virtual trade booth" for the next three weeks.
Participating Companies:
|
Presentation |
Ticker(s) |
|
Byron King, Editor, "Whiskey & Gunpowder", Agora Financial-St. Paul Research |
|
|
Raymond M. McCormick, Managing Director, Energy & Natural Resources, Capstone Partners "An Investment Banker's Perspective of the Uranium Industry" |
|
|
Appia Energy Corp. |
(OTCQB: APAAF | CSE: API) |
|
Thor Mining PLC |
(OTCQB: THORF | ASX: THR | AIM: THR) |
|
Renforth Resources Inc. |
(OTCQB: RFHRF | CSE: RFR) |
|
Ion Energy Ltd. |
(OTCQB: IONGF | TSX-V: ION) |
|
Baselode Energy Corp. |
(OTCQB: BSENF | TSX-V: FIND) |
|
Blue Sky Uranium Corp. |
(OTCQB: BKUCF | TSX: BSK) |
|
Energy Fuels Inc. |
(NYSE American: UUUU | TSX: EFR) |
|
Euro Manganese Inc. |
(OTCQX: EUMNF | TSX-V: EMN) |
|
Silver Elephant Mining Corp |
(OTCQX: SILEF | TSX-V: ELEF) |
|
Commerce Resources Corp. |
(OTCQX: CMRZF | TSX-V: CCE) |
|
First Cobalt Corp. |
(OTCQX: FTSSF | TSX-V: FCC) |
|
Nouveau Monde Graphite Inc. |
(NYSE: NMG | TSX-V: NOU) |
|
Giga Metals Corp. |
(OTCQB: HNCKF | TSX-V: GIGA) |
|
Nova Royalty Corp. |
(OTCQB: NOVRF | TSX-V: NOVR) |
|
Lion One Metals Ltd. |
(OTCQX: LOMLF | TSX-V: LIO) |
|
Starcore International Mines Ltd. |
(OTCQB: SHVLF | TSX: SAM) |
|
Golden Valley Mines and Royalties Ltd. |
(OTCQX: GLVMF | TSX-V: GZZ) |
|
Arizona Metals Corp. |
(OTCQX: AZMCF | TSX-V: AMC) |
|
Barksdale Resources Corp. |
(OTCQX: BRKCF | TSX-V: BRO) |
|
Ridgeline Minerals Corp. |
(OTCQX: RDGMF | TSX-V: RDG) |
|
Liberty Gold Corp. |
(OTCQX: LGDTF | TSX: LGD) |
|
Outback Goldfields Corp. |
(OTCQB: OZBKF | CSE: OZ) |
|
Karora Resources Inc. |
(OTCQX: KRRGF | TSX: KRR) |
|
Empress Royalty Corp. |
(OTCQB: EMPYF | TSX-V: EMPR) |
|
Bunker Hill Mining Corp. |
(OTCQB: BHLL | TSX-V: BNKR) |
|
Vior Inc. |
|
|
Kodiak Copper Corp. |
(OTCQB: KDKCF | TSX-V: KDK) |
|
Heliostar Metals Ltd. |
(OTCQX: HSTXF | TSX-V: HSTR) |
|
Honey Badger Silver Inc. |
(Pink: HBEIF| TSX-V: TUF) |
|
Tinka Resources Ltd. |
(OTCQB: TKRFF | TSX-V: TK) |
|
Salazar Resources Ltd. |
(OTCQX: SRLZF | TSX-V: SRL) |
|
Stratabound Minerals Corp. |
(OTCQB: SBMIF | TSX-V: SB) |
|
KORE Mining Ltd. |
(OTCQX: KOREF | TSX-V: KORE) |
|
Fabled Silver Gold Corp. |
(OTCQB: FBSGF | TSX-V: FCO) |
|
Element 29 Resources Inc. |
(OTCQB: EMTRF| TSX-V: ECU) |
|
Canada Nickel Company Inc. |
(OTCQB: CNIKF | TSX-V: CNC) |
|
Aztec Minerals Corp. |
(OTCQB: AZZTF | TSX-V: AZT) |
|
Granite Creek Copper Ltd. |
(OTCQB: GCXXF | TSX-V: GCX) |
|
Group Ten Metals Inc. |
(OTCQB: PGEZF | TSX- V: PGE) |
|
Metallic Minerals Ltd. |
(OTCQB: MMNGF | TSX-V: MMG) |
|
Imperial Mining Group Ltd. |
(OTCQB: IMPNF | TSX-V: IPG) |
|
Defiance Silver Corp. |
(OTCQX: DNCVF | TSX-V: DEF) |
|
Orezone Gold Corp. |
(OTCQX: ORZCF | TSX-V: ORE) |
|
GoldSpot Discoveries Corp. |
(OTCQX: SPOFF | TSX-V: SPOT) |
To facilitate investor relations scheduling, for more information about the program and to view a complete calendar of Virtual Investor Conferences, please visit www.virtualinvestorconferences.com.
About Virtual Investor Conferences®
Virtual Investor Conferences (VIC) is the leading proprietary investor conference series that provides an interactive forum for publicly-traded companies to meet and present directly with investors.
A real-time solution for investor engagement, Virtual Investor Conferences is part of OTC Market Group's suite of investor relations services specifically designed for more efficient Investor Access. Replicating the look and feel of on-site investor conferences, Virtual Investor Conferences combine leading-edge conferencing and investor communications capabilities with a comprehensive global investor audience network.

View original content to download multimedia:https://www.prnewswire.com/news-releases/green-energy–precious-metals-investor-conference-presentations-now-available-for-on-demand-viewing-301345875.html
SOURCE VirtualInvestorConferences.com
If you would like to receive our free newsletter via email, simply enter your email address below & click subscribe.
 Follow us on Twitter
 Become our facebook fan
CONNECT WITH US
Tweets
Tweet with hash tag #miningfeeds or @miningfeeds and your tweets will be displayed across this site.
MOST ACTIVE MINING STOCKS
Daily Gainers
 Midlands Minerals Corp. Midlands Minerals Corp. |
MEX.V | +66.88% |
| GoviEx Uranium Inc. |
GXU.V | +42.86% |
 Mount Burgess Mining NL Mount Burgess Mining NL |
MTB.AX | +33.33% |
| Sunridge Gold Corp. |
SGC.V | +30.77% |
| Casa Minerals Inc. |
CASA.V | +30.00% |
| Radisson Mining Resources Inc. |
RDS.V | +25.74% |
| International Lithium Corp. |
ILC.V | +25.00% |
| Poseidon Nickel Limited |
POS.AX | +25.00% |
| Richmond Minerals Inc. |
RMD.V | +23.53% |
| Encounter Resources Ltd. |
ENR.AX | +20.00% |