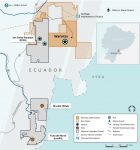
Vancouver, British Columbia–(Newsfile Corp. – August 23, 2021) – Playfair's (TSXV: PLY) (FSE: P1J1) (OTC Pink: PLYFF) core drilling program on its large (201 square kilometers) 100% owned RKV Copper Project in South Central Norway is expected to start in early September. Playfair has delineated seven drill targets in five areas, Drill Notifications have been made and necessary permits are approved.
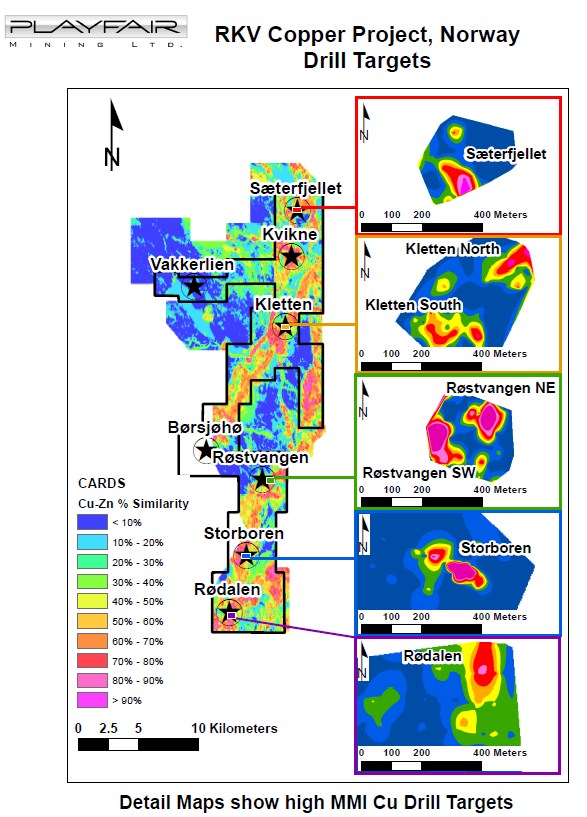
Figure 1
To view an enhanced version of Figure 1, please visit:
https://orders.newsfilecorp.com/files/7302/94037_35fb048aa4722bdf_002full.jpg
Playfair, as a responsible mineral explorer, values protecting the natural environment it works in. Playfair uses new technologies and methods to reduce the impact of its exploration. Playfair's exploration to date has been in three phases.
The first phase of Playfair's exploration used non-invasive machine learning algorithms to reinterpret existing geochemical-geological-geophysical data sets and outline potential exploration target areas with similarities to known mineral occurrences.
The second phase of Playfair's exploration was minimally invasive. In the areas outlined as possibly favourable by the machine learning algorithms small pits were dug by hand, samples of soil were removed, and the pits refilled. There was no off-road driving. Subsequent chemical analysis outlined areas with a high content of copper or other elements of interest.
The third phase of Playfair's exploration measured the intensity of the earth's magnetic field in some of the areas where a high copper content was found in soils. Variations in the magnetic field provide important information about the underlying bedrock. The survey was non-intrusive and used an unmanned drone to carry the measuring equipment.
The seven drill targets were previously described: Storboren (November 07, 2019, and December 05, 2019, News Releases), Sæterfjellet, (January 06, 2021, News Release), Kletten North and Kletten South (January 28, 2021, News Release), Røstvangen Northeast and Røstvangen Southwest (February 17, 2021, News Release) and Rødalen (March 11, 2021, News Release).
The drill targets are MMI (Mobile Metal Ion) copper anomalies discovered by sampling target areas generated by Windfall Geotek (TSXV: WIN) (OTCQB: WINKF) using their proprietary Computer Aided Resources Detection System (CARDS).
All seven drill targets show compelling coherent MMI Cu anomalies with multiple MMI Cu values greater than 6,000 ppb. The highest value recorded was 53,300 ppb MMI Cu. A short MMI Report by SGS states that values greater than 6,000 ppb MMI Cu "are likely to be associated with weathering copper sulphides."
Playfair's fourth phase of exploration is planned to begin in September 2021. In keeping with Playfair's intent to minimise the impact of its exploration on the natural environment Playfair will use a lightweight drilling machine which can be disassembled and hand-carried to the drill sites. Playfair's man-portable drill has now arrived in Norway, cleared customs and has been transported to Tynset, approximately 25 km from Rødalen, the first drill target. With a population of 5,400, Tynset is the municipal centre of the Nord-Østerdalen region. Arctic Drilling As., a local Norwegian Company will carry out the drilling.

Figure 2
To view an enhanced version of Figure 2, please visit:
https://orders.newsfilecorp.com/files/7302/94037_35fb048aa4722bdf_003full.jpg
A presentation on the drilling plans can be found at this direct link or on Playfair's website.
The technical contents of this release were approved by Greg Davison, PGeo, a qualified person as defined by National Instrument 43-101.
The road to a cleaner environment includes electric vehicles. Electric vehicles need copper, nickel, and cobalt. There is no green future without minerals.
For further information visit our website at www.playfairmining.com or contact:
Donald G. Moore
CEO and Director
Phone: 604-377-9220
Email: dmoore@wascomgt.com
D. Neil Briggs
Director
Phone: 604-562-2578
Email: nbriggs@wascomgt.com
Forward-Looking Statements: This Playfair Mining Ltd News Release may contain certain "forward-looking" statements and information relating to Playfair which are based on the beliefs of Playfair management, as well as assumptions made by and information currently available to Playfair management. Such statements reflect the current risks, uncertainties and assumptions related to certain factors including, without limitations, exploration and development risks, expenditure and financing requirements, title matters, operating hazards, metal prices, political and economic factors, competitive factors, general economic conditions, relationships with vendors and strategic partners, governmental regulation and supervision, seasonality, technological change, industry practices, and one-time events. Should any one or more of these risks or uncertainties materialize or change, or should any underlying assumptions prove incorrect, actual results and forward-looking statements may vary materially from those described herein.
Neither TSX Venture Exchange nor its Regulation Services Provider (as that term is defined in the policies of the TSX Venture Exchange) accepts responsibility for the adequacy or accuracy of this release.

To view the source version of this press release, please visit https://www.newsfilecorp.com/release/94037
Vancouver, British Columbia–(Newsfile Corp. – August 19, 2021) – Contact Gold Corp. (TSXV: C) (OTCQB: CGOLF) (the "Company" or "Contact Gold") is pleased to announce its financial and operating results for the three- and six-months ended June 30, 2021.
Details of financial results as at and for the three- and six-months ended June 30, 2021, are described in the unaudited condensed interim consolidated financial statements and related notes thereto (the "Interim Financial Statements") as prepared in accordance with International Financial Reporting Standards ("IFRS"), and MD&A for the corresponding period, copies of which are available on SEDAR at www.sedar.com.
Beginning the year ended December 31, 2019, the Company began reporting its financial results in accordance with United States Generally Accepted Auditing Principles ("US GAAP"). Accordingly, financial information filed under the Company's issuer profile on SEDAR for the years ended December 31, 2019, and December 31, 2020, and for each of the interim periods for the year 2020, and the three-months ended March 31, 2021, inclusive were prepared in accordance with US GAAP. The Company had previously reported pursuant to IFRS. Pursuant to having completed a corporate continuance to the Province of British Columbia in June 2021, the Company has reverted to preparing and reporting its consolidated financial statements in accordance with IFRS, with retrospective application through an election to change all of its accounting policies.
IFRS differs in some respects from US GAAP, and thus financial results may not be comparable to that which has been reported in previously-filed financial statements. A discussion concerning the re-adoption of IFRS and transition from US GAAP is included in Interim Financial Statements under heading, "Re-adoption of IFRS and reclassification of comparative periods".
The following selected financial data is derived from the Interim Financial Statements. Unless otherwise stated, the information herein, and in the tables below, is presented in Canadian dollars.
|
Three months ended |
Six months ended |
||||||||||
|
Attributable to shareholders: |
June 30, 2021 |
June 30, 2020 |
June 30, 2021 |
June 30, 2020 |
|||||||
|
Loss for the period |
$ |
1,931 |
$ |
692 |
$ |
3,640 |
$ |
3,394 |
|||
|
Other comprehensive loss (gain) |
$ |
386 |
$ |
1,603 |
$ |
871 |
$ |
(1,824) |
|||
|
Loss and comprehensive loss |
$ |
2,317 |
$ |
2,235 |
$ |
4,511 |
$ |
1,570 |
|||
|
Basic and diluted loss per share |
$ |
0.01 |
$ |
0.01 |
$ |
0.02 |
$ |
0.04 |
|||
Losses attributable to shareholders for the three and six months ended June 30, 2021 of $1.93 million and $3.64 million (2020: $0.69 million and $3.39 million, respectively), reflect primarily (i) exploration and evaluation of the Company's exploration property interests ($1.10 million and $2.02 million for each of the three- and six-month periods), (ii) costs incurred for professional, legal and advisory fees, administration & office expenditures, wages and salaries, and investor relations activities in aggregate for the three- and six-month period $0.74 million and $1.34 million, and (iii) non-cash stock-based compensation expense of $0.07 million and $0.23 million for the three- and six-month periods. Expenses incurred for the three- and six-month periods ended June 30, 2020, reflect similar activities.
During the three and six months ended June 30, 2021, exploration and evaluation expenditures were predominantly related to activity at the Green Springs property, including the evaluation and review of data generated through 2020 and planning for the commencement of the 2021 program early in the year, and the drilling of 7,511 metres of reverse circulation drilling through June 30, 2021. Approximately $2.00 million in expenditures had been incurred through June 30, 2021 for exploration at Green Springs and Pony Creek (in aggregate through June 30, 2020, $0.61 million).
Other comprehensive loss attributable to shareholders for the three- and six-month periods ended June 30, 2021 was $0.39 million and $0.87 million (three and six months ended June 30, 2020: loss of $1.60 million and gain of $1.82 million, respectively). The other comprehensive loss or gain recognized in a given period reflects primarily the foreign currency impact arising on the post-acquisition carrying value of the Company's U.S. entity which holds the exploration property portfolio, whereby the gain or loss reflects the relative value of the Canadian dollar (the Company's reporting currency) compared to the United States dollar (the currency in which the value of the exploration property portfolio is recorded).
Net cash operating outflows for the six-month period ended June 30, 2021 of $2.81 million reflects primarily (i) ongoing exploration activity, (ii) investor relations and head office costs, and (iii) the settlement of balances due to service providers and vendors at year end (June 30, 2020 $1.37 million).
|
As June 30, 2021 |
As at December 31, 2020 |
|||||
|
Cash |
$ |
1,966,103 |
$ |
4,753,148 |
||
|
Working capital |
$ |
1,570,827 |
$ |
4,750,446 |
||
|
Total assets |
$ |
30,691,776 |
$ |
34,543,579 |
||
|
Current liabilities |
$ |
672,894 |
$ |
412,498 |
||
|
Shareholders' equity |
$ |
29,851,768 |
$ |
33,961,885 |
The Company has elected to capitalize mineral property acquisition costs, and expense exploration expenditures as incurred. Total assets at June 30, 2021 comprise primarily: exploration and evaluation assets of $28.42 million, and $1.97 million in cash. At December 31, 2020 total assets primarily comprised exploration and evaluation assets of $29.22 million, and $4.75 million in cash.
Total liabilities at June 30, 2021 include non-current liabilities of $1.67 million (December 31, 2020: $1.69 million), and payables and accruals of $0.67 million (December 31, 2020: $0.41 million).
Accumulated other comprehensive loss of $2.92 million at June 30, 2021 (December 31, 2020: $2.05 million) is the aggregate foreign currency impact on the translation to Canadian dollars of the value of the Company's U.S. entity and its portfolio of exploration properties.
Option award to new employee
The Company also announces that on August 16, 2021, a new employee was granted options to purchase an aggregate of 125,000 common shares in the Company, with an exercise price of $0.08 per share. The options have been granted pursuant to the Company's Omnibus Stock and Incentive Plan, and will expire five years from the date of grant. All of the options are subject to vesting provisions.
About Contact Gold Corp.
Contact Gold is currently a Nevada-incorporated entity. The Company is focused on advancing the Green Springs and Pony Creek gold projects in Nevada, both of which host extensive and robust Carlin-type gold systems.
Green Springs is located near the southern end of the Cortez Trend of Carlin-type gold deposits in Nevada, east of Fiore Gold's Pan Mine and Gold Rock Project, and south of Waterton's Mount Hamilton deposit. The Green Springs property is 18.5 km2, encompassing 3 shallow past-producing open pits and numerous targets that were not mined.
Pony Creek is strategically located immediately south of Gold Standard Ventures' Railroad Project, on the Southern Carlin Trend, and totals 81.7 km2 underpinned by a Carlin-type system with historic gold resources.
Additional information about the Company is available at www.contactgold.com.
For more information, please contact (604) 449-3361 for either:
John Wenger, Chief Financial Officer wenger@contactgold.com
John Glanville Director, Investor Relations glanville@contactgold.com
Neither the TSXV nor its Regulation Services Provider (as that term is defined in the policies of the TSXV) accepts responsibility for the adequacy of this release. No stock exchange, securities commission or other regulatory authority has approved or disapproved the information contained herein.
Cautionary Note Regarding Forward-Looking Information
This news release contains "forward-looking information" and "forward-looking statements" (collectively, "forward-looking statements") within the meaning of the applicable Canadian securities legislation. All statements, other than statements of historical fact, are forward-looking statements and are based on expectations, estimates and projections as at the date of this news release. Any statement that involves discussions with respect to predictions, expectations, beliefs, plans, projections, objectives, assumptions, future events or performance (often but not always using phrases such as "expects", or "does not expect", "is expected", "anticipates" or "does not anticipate", "plans", "budget", "scheduled", "forecasts", "estimates", "believes" or "intends" or variations of such words and phrases or stating that certain actions, events or results "may" or "could", "would", "might" or "will" be taken to occur or be achieved) are not statements of historical fact and may be forward-looking statements. In this news release, forward-looking statements relate, among other things, to planned expenditures through the remainder of the year, and the anticipated exploration activities of the Company at Green Springs or Pony Creek.
These forward-looking statements are based on reasonable assumptions and estimates of management of the Company at the time such statements were made. Actual future results may differ materially as forward-looking statements involve known and unknown risks, uncertainties and other factors which may cause the actual results, performance or achievements of the Company to materially differ from any future results, performance or achievements expressed or implied by such forward-looking statements. Such factors, among other things, include: impacts arising from the global disruption caused by the COVID-19 coronavirus outbreak; fluctuations in general macroeconomic conditions; fluctuations in securities markets; fluctuations in spot and forward prices of gold, silver, base metals or certain other commodities; fluctuations in currency markets (such as the Canadian dollar to United States dollar exchange rate); change in national and local government, legislation, taxation, controls, regulations and political or economic developments; risks and hazards associated with the business of mineral exploration, development and mining (including environmental hazards, industrial accidents, unusual or unexpected formations pressures, cave-ins and flooding); inability to obtain adequate insurance to cover risks and hazards; the presence of laws and regulations that may impose restrictions on mining; employee relations; relationships with and claims by local communities and indigenous populations; availability of increasing costs associated with mining inputs and labour; the speculative nature of mineral exploration and development (including the risks of obtaining necessary licenses, permits and approvals from government authorities); and title to properties. Although the forward-looking statements contained in this news release are based upon what management of the Company believes, or believed at the time, to be reasonable assumptions, the Company cannot assure shareholders that actual results will be consistent with such forward-looking statements, as there may be other factors that cause results not to be as anticipated, estimated or intended. Readers should not place undue reliance on the forward-looking statements and information contained in this news release. The Company assumes no obligation to update the forward-looking statements of beliefs, opinions, projections, or other factors, should they change, except as required by law.

To view the source version of this press release, please visit https://www.newsfilecorp.com/release/93823
VANCOUVER, BC, Aug. 11, 2021 /CNW/ – Trading resumes in:
Company: Sego Resources Inc.
TSX-Venture Symbol: SGZ
All Issues: Yes
Resumption (ET): 12:15 PM
IIROC can make a decision to impose a temporary suspension (halt) of trading in a security of a publicly-listed company. Trading halts are implemented to ensure a fair and orderly market. IIROC is the national self-regulatory organization which oversees all investment dealers and trading activity on debt and equity marketplaces in Canada.
SOURCE Investment Industry Regulatory Organization of Canada (IIROC) – Halts/Resumptions
“Cision”
Cision
View original content: http://www.newswire.ca/en/releases/archive/August2021/11/c2876.html
GRAND BAIE, Mauritius, Aug. 06, 2021 (GLOBE NEWSWIRE) — Alphamin Resources Corp. (AFM:TSXV, APH:JSE AltX, “Alphamin” or the “Company”), a producer of 4% of the world’s mined tin1 from its high grade operation in the Democratic Republic of Congo, has released its unaudited consolidated financial statements and accompanying Management’s Discussion and Analysis for the three and six months ended June 30, 2021:
-
Q2 EBITDA of $34,1m, at a tin price of $28,308/t versus current of $34,700/t
-
Net Debt reduced to $29,5m
-
Contained tin production of 2,412 tons (11% below prior guidance and 8% below the prior quarter)
-
Fine tin recovery plant fully commissioned and producing from 26 June 2021
-
Mpama South phase 3 drilling progressing to plan with high-grade intercepts previously announced
-
Mpama North Deeps drilling commenced with additional rigs under mobilisation to accelerate drilling campaign
A Media Snippet accompanying this announcement is available by clicking on the image or link below:
Operational and Financial Summary for the Quarter ended June 20212

Operational and Financial Performance
Contained tin production of 2,412 tons was 11% below guidance (2,700 tons), impacted by a low feed grade of 3.2% Sn compared to 3.8% Sn the previous quarter. The month of June 2021 saw lower than expected grades from underground. The variable nature of high-grade tin mineralisation in the orebody may cause large fluctuations in delivered grade – as a mitigating tool we will increase planned waste development for the remainder of the year in order to provide more mining flexibility for blending high- and low-grade areas.
Taking into consideration the lower feed grade, the processing plant performed well, treating 12% more material and achieving recoveries of 72%.
Our EBITDA of $34,1m for Q2 2021 is 7% below Q1 2021 – the previous quarter benefitted from a significant catch-up in tin sales following logistical bottlenecks during Q4 2020. Tin prices are currently trading at around $34,700/t, 23% above prices achieved during the past quarter.
Net debt amounted to $29,5m at 30 June 2021, down 50% from the start of the financial year (31 December 2020: $59,9m).
The Company has appointed Mr. Jan Trouw as the on-mine Managing Director of its 84,14% subsidiary, Alphamin Bisie Mining, effective 1 July 2021. Mr Trouw is well known to the Alphamin team and has over 40 years of African mining experience – recently as head of the Frontier copper mine in the DRC and prior to that as General Manager of the high-grade Chibuluma copper mine in Zambia. He was instrumental during late 2019 as an advisor in developing the new mining method and mine design criteria for Alphamin’s Bisie tin mine. We look forward to working with Mr Trouw in realising our vision of becoming one of the world’s largest long-life tin producers.
Over the last 7 years, Alphamin’s Bisie tin mine has developed from an exploration asset to a steady state operating mine, producing 4% of the world’s mined tin. Our Chief Operating Officer, Mr Trevor Faber, was instrumental in delivering on this key objective with exceptional drive under challenging conditions. By mutual agreement, Mr Faber and the Company resolved that it’s Bisie mine is in safe hands under the on-mine leadership of the Managing Director, Mr Trouw, and his team. Therefore Mr Faber’s role as corporate Chief Operating Officer is no longer required with effect 5 August 2021. The Board wishes to express its sincere gratitude to Mr Faber for a job well done and looks forward to following his future successes in developing the next major project.
Guidance for H2 2021
The grade of ore mined from underground in Q2 2021 was lower than that expected from the Mineral Resource model, although some benefit was gained from additional tin mineralisation delineated by grade control drilling. Overall, for material mined since commissioning to date, the actual grades from underground were substantially in line with the Resource Model after taking account of planned dilution factors.
Underground practices relating to stope planning, delineation and blasting were sub-optimal during H1 2021. Our newly appointed ABM Managing Director, Jan Trouw, has already introduced much improved planning and mining practices with positive results.
For the second half of 2021 and into Q1 2022, we expect to mine lower tin grades averaging 3,2% to 3,5%, which at higher plant recoveries of 78% (including the FTP recovery) and monthly throughput of 36,000t amounts to contained tin production of between 900t and 1000t per month. Production guidance for H2 2021 is approximately 5,500t of contained tin (previous guidance: 6,500t). The grade of ore mined is expected to increase to an average of 4% from Q2 2022 leaving this lower grade window as temporary.
Growth Initiatives
Fine Tin Recovery Plant (FTP) – The FTP is fully commissioned and has produced at steady state from 26 June 2021. Expenditure at completion amounted to US$5.7 million. Production from the FTP since commissioning increased overall contained tin production by 5%. This exceeded expectations so early after commissioning. Optimisation work in pursuit of higher FTP recoveries is ongoing.
Exploration Activities – Alphamin’s exploration initiative aims to: extend the life-of-mine at its currently producing Mpama North operation; to declare a Maiden Mineral Resource for Mpama South (located 750 metres south of Mpama North); and to discover at least one additional orebody on the highly prospective Bisie Ridge (13km strike length).
Drilling at the Mpama North orebody commenced on 2 July 2021. An initial 15,000 metre (22 holes) drilling campaign over 4 months is planned to test the strike and dip extension of the current producing orebody, below 400m in depth from the mine portal.
The initial Mpama South drilling program comprises of 16,800m of which 12,300m (52 holes) has been completed. Independent laboratory assays have been received for 39 holes to date. This initial drilling program is intended to form the basis of a Mineral Resource estimation exercise, the results of which are expected to be announced by the end of 2021. Infill drilling and further step-out drilling will continue from after August for the remainder of 2021. As previously announced, drilling results to date indicate the potential for another high-grade deposit, 750m South of the Company’s current producing Mpama North mine.
In addition to Mpama North and Mpama South, drilling on the highly prospective Bisie ridge (13km strike length), which falls within the Company’s mining licence, is expected to commence during Q3 2021. The Company’s appointed structural specialists, TECT Geological Consulting, identified high potential drill targets less than 8km south of the current operating mine.
Covid-19 Pandemic and Impact on Operations
The health of our employees is of paramount importance and in this regard the Company has a range of Covid-19 awareness, prevention and other risk mitigation controls in place.
To date, the Company has been able to continue with normal production and concentrate sales activities and has not been negatively affected by the Covid-19 pandemic.
Qualified Person
Mr. Clive Brown Pr. Eng., B.Sc. Engineering (Mining), is a qualified person (QP) as defined in National Instrument 43-101 and has reviewed and approved the scientific and technical information contained in this news release. He is a Principal Consultant and Director of Bara Consulting Pty Limited, an independent technical consultant to the Company.
____________________________________________________________
FOR MORE INFORMATION, PLEASE CONTACT:
Maritz Smith
CEO
Alphamin Resources Corp.
Tel: +230 269 4166
E-mail: msmith@alphaminresources.com
CAUTION REGARDING FORWARD LOOKING STATEMENTS
Information in this news release that is not a statement of historical fact constitutes forward-looking information. Forward-looking statements contained herein include, without limitation, statements relating to expected future EBITDA for Q2 2021, the impact of the Company’s fine tin recovery plant on production and the timing and success of additional exploration drilling outcomes. Forward-looking statements are based on assumptions management believes to be reasonable at the time such statements are made. There can be no assurance that such statements will prove to be accurate, as actual results and future events could differ materially from those anticipated in such statements. Accordingly, readers should not place undue reliance on forward-looking statements. Although Alphamin has attempted to identify important factors that could cause actual results to differ materially from those contained in forward-looking statements, there may be other factors that cause results not to be as anticipated, estimated or intended. Factors that may cause actual results to differ materially from expected results described in forward-looking statements include, but are not limited to: uncertainties associated with Alphamin’s resource and reserve estimates, uncertainties regarding estimates of the expected mined tin grades, processing plant performance and recoveries, uncertainties regarding global supply and demand for tin and market and sales prices, uncertainties with respect to social, community and environmental impacts, uninterupted access to required infrastructure, adverse political events, impacts of the global Covid-19 pandemic on mining operations and commodity prices as well as those risk factors set out in the Company’s Management Discussion and Analysis and other disclosure documents available under the Company’s profile at www.sedar.com. Forward-looking statements contained herein are made as of the date of this news release and Alphamin disclaims any obligation to update any forward-looking statements, whether as a result of new information, future events or results or otherwise, except as required by applicable securities laws.
Neither the TSX Venture Exchange nor its regulation services provider (as that term is defined in the policies of the TSX Venture Exchange) accepts responsibility for the adequacy or accuracy of this news release.
USE OF NON-IFRS FINANCIAL PERFORMANCE MEASURES
This announcement refers to the following non-IFRS financial performance measure:
EBITDA
EBITDA is profit before net finance expense, income taxes and depreciation, depletion, and amortization. EBITDA provides insight into our overall business performance (a combination of cost management and growth) and is the corresponding flow driver towards the objective of achieving industry-leading returns. This measure assists readers in understanding the ongoing cash generating potential of the business including liquidity to fund working capital, servicing debt, and funding capital expenditures and investment opportunities.
This measure is not recognized under IFRS as it does not have any standardized meaning prescribed by IFRS and is therefore unlikely to be comparable to similar measures presented by other issuers. EBITDA data is intended to provide additional information and should not be considered in isolation or as a substitute for measures of performance prepared in accordance with IFRS.
____________________________________________________________
1Data obtained from International Tin Association Tin Industry Review 2020 2 Production information is disclosed on a 100% basis. Alphamin indirectly owns 84.14% of its operating subsidiary to which the information relates.

Vancouver, British Columbia–(Newsfile Corp. – August 3, 2021) – Lara Exploration Ltd. (TSXV: LRA) ("Lara"), is pleased to report the planned start of field work and receipt of the second option payment from Minsur S.A. ("Minsur") of US$200,000 as part of an Option and Royalty Agreement ("the Agreement") for the Lara Copper Project signed in July 2020.
The Lara Copper Project comprises of mineral rights covering a partly defined copper-molybdenum porphyry deposit, located in the Laramate Province of the Ayacucho Department, approximately 40km inland from the town of Palpa on the Pan American Highway. The Project is registered in the name of Minas Dixon S.A., which is in turn owned 55% Global Battery Metals Ltd. ("GBML"), and 45% by Lara.
Under the terms of the Agreement, GBML and Lara have granted Minsur an exclusive option to acquire a 100% interest in the Lara Copper Project by making staged cash payments of US$5.75 million to Minas Dixon S.A. on the satisfaction of various milestones, and with each of GBML and Lara retaining a 0.75% net smelter royalty. Payment milestones for the Agreement are summarized in the following table:
|
Milestone/Date |
Option Payment |
Status |
|
Upon Registration of the Agreement before Public Notary |
US$59,000 |
Received |
|
One year from Registration of Agreement |
US$200,000 |
Received |
|
Approval of Environmental Study and Start of Work ("DIA-IA") |
US$200,000 |
|
|
One year from approval of the DIA-IA |
US$300,000 |
|
|
Approval of Semi-Detailed Environmental Study ("EIA-SD") |
US$500,000 |
|
|
One year from approval of the EIA-SD |
US$1,500,000 |
|
|
Upon transfer of Title |
US$3,000,000 |
|
|
Total |
US$5,759,000 |
Minsur is expected to start fieldwork at the Lara project this month, including:
-
Detailed relogging of 7,345 meters from 27 diamond drill holes
-
Review of 2,504 meters from 23 RC drill holes (dependent on the state of the RC rock chips)
-
Detailed geological mapping of 1,800 hectares
-
Geophysics
Permitting is also underway for a drilling campaign that is targeted to commence in Q2-2022, once the permit has been approved.
About Lara Exploration
Lara is an exploration company following the Prospect and Royalty Generator business model, which aims to minimize shareholder dilution and financial risk by generating prospects and exploring them in joint ventures funded by partners, retaining a minority interest and or a royalty. The Company currently holds a diverse portfolio of prospects, deposits and royalties in Brazil and Peru. Lara's common shares trade on the TSX Venture Exchange under the symbol "LRA".
Michael Bennell, Lara's Vice President Exploration and a Fellow of the Australasian Institute of Mining and Metallurgy (AusIMM), is a Qualified Person as defined by National Instrument 43-101 Standards of Disclosure for Mineral Projects and has approved the technical disclosure and verified the technical information in this news release.
For further information on Lara Exploration Ltd. please consult our website www.laraexploration.com, or contact Chris MacIntyre, VP Corporate Development, at +1 416 703 0010.
Neither the TSX Venture Exchange nor the Investment Industry Regulatory Organization of Canada accepts responsibility for the adequacy or accuracy of this release.
-30-
To view the source version of this press release, please visit https://www.newsfilecorp.com/release/91949
While some are satisfied with an index fund, active investors aim to find truly magnificent investments on the stock market. When you find (and hold) a big winner, you can markedly improve your finances. For example, Alphamin Resources Corp. (CVE:AFM) has generated a beautiful 338% return in just a single year. Also pleasing for shareholders was the 29% gain in the last three months. It is also impressive that the stock is up 206% over three years, adding to the sense that it is a real winner.
See our latest analysis for Alphamin Resources
While Alphamin Resources made a small profit, in the last year, we think that the market is probably more focussed on the top line growth at the moment. Generally speaking, we'd consider a stock like this alongside loss-making companies, simply because the quantum of the profit is so low. For shareholders to have confidence a company will grow profits significantly, it must grow revenue.
Over the last twelve months, Alphamin Resources' revenue grew by 133%. That's well above most other pre-profit companies. But the share price seems headed to the moon, up 338% as previously highlighted. Even the most bullish shareholders might be thinking that the share price might drop back a bit, after a gain like that. So this looks like a great watchlist candidate for investors who look for high growth inflexion points.
You can see below how earnings and revenue have changed over time (discover the exact values by clicking on the image).

It's good to see that there was some significant insider buying in the last three months. That's a positive. That said, we think earnings and revenue growth trends are even more important factors to consider. So we recommend checking out this free report showing consensus forecasts
A Different Perspective
It's good to see that Alphamin Resources has rewarded shareholders with a total shareholder return of 338% in the last twelve months. Since the one-year TSR is better than the five-year TSR (the latter coming in at 25% per year), it would seem that the stock's performance has improved in recent times. Given the share price momentum remains strong, it might be worth taking a closer look at the stock, lest you miss an opportunity. While it is well worth considering the different impacts that market conditions can have on the share price, there are other factors that are even more important. Consider risks, for instance. Every company has them, and we've spotted 2 warning signs for Alphamin Resources you should know about.
If you like to buy stocks alongside management, then you might just love this free list of companies. (Hint: insiders have been buying them).
Please note, the market returns quoted in this article reflect the market weighted average returns of stocks that currently trade on CA exchanges.
This article by Simply Wall St is general in nature. It does not constitute a recommendation to buy or sell any stock, and does not take account of your objectives, or your financial situation. We aim to bring you long-term focused analysis driven by fundamental data. Note that our analysis may not factor in the latest price-sensitive company announcements or qualitative material. Simply Wall St has no position in any stocks mentioned.
Have feedback on this article? Concerned about the content? Get in touch with us directly. Alternatively, email editorial-team (at) simplywallst.com.
NOT FOR DISTRIBUTION TO UNITED STATES NEWSWIRE SERVICES OR FOR DISSEMINATION IN THE UNITED STATES
VANCOUVER, British Columbia, July 14, 2021 (GLOBE NEWSWIRE) — Lupaka Gold Corp. ("Lupaka Gold" or the “Company") (TSX-V: LPK, FRA: LQP) announces that the Company has closed the non-brokered private placement previously announced on June 23, 2021 (the “Placement”).
The Company issued 4,000,000 units at a price of $0.05 per unit for gross proceeds of $200,000. Each unit consists of one common share of the Company (“Share”) and one transferable common share purchase warrant (“Warrant Share”) entitling the holder to purchase an additional common share of the Company at a price of $0.10 for a period of three years from the closing (the “Placement”). All Shares issued and Warrants Shares (if exercised prior to November 15, 2021) are subject to a hold period expiring four months and one day from the closing date of the Placement in accordance with applicable securities laws. Closing of the Placement is subject to final acceptance by the TSX Venture Exchange.
In connection with the subscriptions received the Company expects to pay finders’ fees in the amount of $10,000 in cash. No insiders participated in this Placement.
The proceeds of the Placement will be used to pay ongoing operating costs as the Company continues to pursue its litigation against the Republic of Peru and to support review of potential new properties.
This news release does not constitute an offer to sell or a solicitation of an offer to buy any of the securities in the United States. The Securities have not been and will not be registered under the United States Securities Act of 1933, as amended, or any state securities laws and may not be offered or sold within the United States or to U.S. Persons unless an exemption from such registration is available.
Neither the TSX Venture Exchange nor its Regulation Service Provider (as the term is defined in the policies of the TSX Venture Exchange) accepts responsibility for the adequacy of this news release.
FOR FURTHER INFORMATION PLEASE CONTACT:
Gordon Ellis, C.E.O.
gellis@lupakagold.com
Tel: (604) 985-3147
or visit the Company’s profile at www.sedar.com or its website at www.lupakagold.com
Metals X Limited (ASX:MLX) is possibly approaching a major achievement in its business, so we would like to shine some light on the company. Metals X Limited engages in the production of tin in Australia. The AU$200m market-cap company’s loss lessened since it announced a AU$80m loss in the full financial year, compared to the latest trailing-twelve-month loss of AU$58m, as it approaches breakeven. The most pressing concern for investors is Metals X's path to profitability – when will it breakeven? We've put together a brief outline of industry analyst expectations for the company, its year of breakeven and its implied growth rate.
Check out our latest analysis for Metals X
Metals X is bordering on breakeven, according to some Australian Metals and Mining analysts. They anticipate the company to incur a final loss in 2021, before generating positive profits of AU$63m in 2022. Therefore, the company is expected to breakeven just over a year from now. How fast will the company have to grow each year in order to reach the breakeven point by 2022? Working backwards from analyst estimates, it turns out that they expect the company to grow 81% year-on-year, on average, which is extremely buoyant. Should the business grow at a slower rate, it will become profitable at a later date than expected.

Given this is a high-level overview, we won’t go into details of Metals X's upcoming projects, though, keep in mind that generally a metal and mining business has lumpy cash flows which are contingent on the natural resource mined and stage at which the company is operating. This means, large upcoming growth rates are not abnormal as the company is beginning to reap the benefits of earlier investments.
Before we wrap up, there’s one issue worth mentioning. Metals X currently has a relatively high level of debt. Typically, debt shouldn’t exceed 40% of your equity, which in Metals X's case is 43%. A higher level of debt requires more stringent capital management which increases the risk around investing in the loss-making company.
Next Steps:
There are key fundamentals of Metals X which are not covered in this article, but we must stress again that this is merely a basic overview. For a more comprehensive look at Metals X, take a look at Metals X's company page on Simply Wall St. We've also put together a list of key factors you should look at:
-
Valuation: What is Metals X worth today? Has the future growth potential already been factored into the price? The intrinsic value infographic in our free research report helps visualize whether Metals X is currently mispriced by the market.
-
Management Team: An experienced management team on the helm increases our confidence in the business – take a look at who sits on Metals X’s board and the CEO’s background.
-
Other High-Performing Stocks: Are there other stocks that provide better prospects with proven track records? Explore our free list of these great stocks here.
This article by Simply Wall St is general in nature. It does not constitute a recommendation to buy or sell any stock, and does not take account of your objectives, or your financial situation. We aim to bring you long-term focused analysis driven by fundamental data. Note that our analysis may not factor in the latest price-sensitive company announcements or qualitative material. Simply Wall St has no position in any stocks mentioned.
Have feedback on this article? Concerned about the content? Get in touch with us directly. Alternatively, email editorial-team (at) simplywallst.com.
Energy Fuels (UUUU) closed at $5.41 in the latest trading session, marking a +1.31% move from the prior day. This move outpaced the S&P 500's daily gain of 1.13%.
Heading into today, shares of the uranium and vanadium miner and developer had lost 22.72% over the past month, lagging the Basic Materials sector's loss of 4.51% and the S&P 500's gain of 2.39% in that time.
UUUU will be looking to display strength as it nears its next earnings release. In that report, analysts expect UUUU to post earnings of -$0.04 per share. This would mark year-over-year growth of 50%. Meanwhile, our latest consensus estimate is calling for revenue of $5.48 million, up 1269.75% from the prior-year quarter.
Looking at the full year, our Zacks Consensus Estimates suggest analysts are expecting earnings of -$0.17 per share and revenue of $18.41 million. These totals would mark changes of +26.09% and +1010.62%, respectively, from last year.
It is also important to note the recent changes to analyst estimates for UUUU. These revisions typically reflect the latest short-term business trends, which can change frequently. As such, positive estimate revisions reflect analyst optimism about the company's business and profitability.
Our research shows that these estimate changes are directly correlated with near-term stock prices. To benefit from this, we have developed the Zacks Rank, a proprietary model which takes these estimate changes into account and provides an actionable rating system.
The Zacks Rank system ranges from #1 (Strong Buy) to #5 (Strong Sell). It has a remarkable, outside-audited track record of success, with #1 stocks delivering an average annual return of +25% since 1988. The Zacks Consensus EPS estimate remained stagnant within the past month. UUUU is currently sporting a Zacks Rank of #3 (Hold).
The Mining – Non Ferrous industry is part of the Basic Materials sector. This industry currently has a Zacks Industry Rank of 45, which puts it in the top 18% of all 250+ industries.
The Zacks Industry Rank gauges the strength of our industry groups by measuring the average Zacks Rank of the individual stocks within the groups. Our research shows that the top 50% rated industries outperform the bottom half by a factor of 2 to 1.
You can find more information on all of these metrics, and much more, on Zacks.com.
Want the latest recommendations from Zacks Investment Research? Today, you can download 7 Best Stocks for the Next 30 Days. Click to get this free report
Energy Fuels Inc (UUUU) : Free Stock Analysis Report
To read this article on Zacks.com click here.
Zacks Investment Research
GRAND BAIE, Mauritius, July 06, 2021 (GLOBE NEWSWIRE) — Alphamin Resources Corp. (AFM:TSXV, APH:JSE AltX, “Alphamin” or the “Company”), a producer of 4% of the world’s mined tin1 from its high grade operation in the Democratic Republic of Congo, is pleased to provide the following operational and growth update for the quarter ended June 2021:
-
Q2 EBITDA guidance of $34m, at a tin price of $28,326/t versus current of $31,800/t
-
Net Debt reduced to $29.9m
-
Contained tin production of 2,412 tons (11% below prior guidance and 8% below the prior quarter)
-
Fine tin recovery plant fully commissioned and producing from 26 June 2021
-
Mpama South phase 3 drilling progressing to plan with strong visual mineralisation from initial step-out holes
-
Mpama North Deeps drilling commenced 2 July 2021 with additional rigs under mobilisation to accelerate drilling campaign
Operational and Financial Summary for the Quarter ended June 20212
|
Description |
Units |
Actual |
||
|
Quarter |
Quarter |
Variance |
||
|
Tons Processed |
Tons |
105,294 |
93,997 |
12% |
|
Tin Grade Processed |
% Sn |
3.2 |
3.8 |
-16% |
|
Overall Plant Recovery |
% |
72 |
74 |
-3% |
|
Contained Tin Produced |
Tons |
2,412 |
2,611 |
-8% |
|
Contained Tin Sold |
Tons |
2,404 |
3,351 |
-28% |
|
EBITDA3 (Q2 2021 guidance) |
US$'000 |
34,000 |
36,453 |
-7% |
|
Tin Price Achieved |
US$/t |
28,326 |
23,083 |
23% |
____________________________
1Data obtained from International Tin Association Tin Industry Review 2020. 2Production information is disclosed on a 100% basis. Alphamin indirectly owns 84.14% of its operating subsidiary to which the information relates. 3Q2 2021 EBITDA represents management’s guidance.
Operational and Financial Performance
Contained tin production of 2,412 tons was 11% below guidance (2,700 tons), impacted by a low feed grade of 3.2% Sn compared to 3.8% Sn the previous quarter. The month of June 2021 saw lower than expected grades from underground. The variable nature of tin mineralisation in the orebody may cause large fluctuations in delivered grade – as a mitigating tool we will increase planned waste development for the remainder of the year in order to provide more mining flexibility for blending high- and low-grade areas.
Taking into consideration the lower feed grade, the processing plant performed well, treating 12% more material and achieving recoveries of 72%.
Our EBITDA guidance of $34m for Q2 2021 is 7% below Q1 2021 – the previous quarter benefitted from a significant catch-up in tin sales following logistical bottlenecks during Q4 2020. Tin prices are currently trading at around $31,800/t, 12% above prices achieved during the past quarter.
Net debt amounted to $29.9m at 30 June 2021, down 50% from the start of the financial year (31 December 2020: $59.9m).
The Company has appointed Mr. Jan Trouw as the on-mine Managing Director of its 84.14% subsidiary, Alphamin Bisie Mining, effective 1 July 2021. Mr Trouw is well known to the Alphamin team and has over 40 years of African mining experience – recently as head of the Frontier copper mine in the DRC and prior to that as General Manager of the high-grade Chibuluma copper mine in Zambia. He was instrumental during late 2019 in developing the new mining method and mine design criteria for Alphamin’s Bisie tin mine. We look forward to working with Mr Trouw in realising our vision of becoming one of the world’s largest long-life tin producers.
Alphamin’s unaudited consolidated financial statements and accompanying Management’s Discussion and Analysis for the quarter ended 30 June 2021 is expected to be released on or around 9 August 2021.
Growth Initiatives
Fine Tin Recovery Plant (FTP) – The FTP is fully commissioned and produced at steady state from 26 June 2021. Expenditure at completion is substantially in line with the budget of US$4.6 million. Production from the FTP during its first week of operations increased overall contained tin production by 5%. This exceeded expectations so early after commissioning. The exceptionally high grade of the FTP concentrates provides further scope to reduce product grade in pursuit of higher tin recoveries.
Exploration Activities – Alphamin’s exploration initiative aims to: extend the life-of-mine at its currently producing Mpama North operation; to declare a Maiden Mineral Resource for Mpama South (located 750 metres south of Mpama North); and to discover at least one additional orebody on the highly prospective Bisie Ridge (13km strike length).
Drilling at the Mpama North orebody commenced on 2 July 2021. An initial 15,000 metre (22 holes) drilling campaign over 4 months is planned to test the strike and dip extension of the current producing orebody, below 400m in depth from the mine portal.
The Mpama South phases 1 and 2 drilling of 10,015 metres (46 holes) have been completed with external assays for 29 holes announced to date. The remaining external lab assays are expected in two batches during July and early August 2021. Phase 3 drilling of 6,800 metres is progressing to plan – to date, 5 of the 24 holes have been completed showing strong visual mineralisation over wide intercepts within the interpreted high-grade shoot.
In addition to Mpama North and Mpama South, drilling on the highly prospective Bisie ridge (13km strike length), which falls within the Company’s mining licence, is expected to commence in August 2021. Access roads have been established and initial drill targets are being developed in consultation with the Company’s appointed structural specialists, TECT Geological Consulting.
Qualified Person
Mr Vaughn Duke Pr.Eng. PMP, MBA, B.Sc. Mining Engineering (Hons.), is a qualified person (QP) as defined in National Instrument 43-101 and has reviewed and approved the scientific and technical information contained in this news release. He is a Principal Consultant, Partner and Director of Sound Mining Solutions, an independent technical consultant to the Company.
FOR MORE INFORMATION, PLEASE CONTACT:
Maritz Smith
CEO
Alphamin Resources Corp.
Tel: +230 269 4166
E-mail: msmith@alphaminresources.com
CAUTION REGARDING FORWARD LOOKING STATEMENTS
Information in this news release that is not a statement of historical fact constitutes forward-looking information. Forward-looking statements contained herein include, without limitation, statements relating to expected future EBITDA for Q2 2021, the impact of the Company’s fine tin recovery plant on production and the timing and success of additional exploration drilling outcomes. Forward-looking statements are based on assumptions management believes to be reasonable at the time such statements are made. There can be no assurance that such statements will prove to be accurate, as actual results and future events could differ materially from those anticipated in such statements. Accordingly, readers should not place undue reliance on forward-looking statements. Although Alphamin has attempted to identify important factors that could cause actual results to differ materially from those contained in forward-looking statements, there may be other factors that cause results not to be as anticipated, estimated or intended. Factors that may cause actual results to differ materially from expected results described in forward-looking statements include, but are not limited to: uncertainties associated with Alphamin’s resource and reserve estimates, uncertainties regarding estimates of the expected mined tin grades, processing plant performance and recoveries, uncertainties regarding global supply and demand for tin and market and sales prices, uncertainties with respect to social, community and environmental impacts, uninterupted access to required infrastructure, adverse political events, impacts of the global Covid-19 pandemic on mining operations and commodity prices as well as those risk factors set out in the Company’s Management Discussion and Analysis and other disclosure documents available under the Company’s profile at www.sedar.com. Forward-looking statements contained herein are made as of the date of this news release and Alphamin disclaims any obligation to update any forward-looking statements, whether as a result of new information, future events or results or otherwise, except as required by applicable securities laws.
Neither the TSX Venture Exchange nor its regulation services provider (as that term is defined in the policies of the TSX Venture Exchange) accepts responsibility for the adequacy or accuracy of this news release.
USE OF NON-IFRS FINANCIAL PERFORMANCE MEASURES
This announcement refers to the following non-IFRS financial performance measure:
EBITDA
EBITDA is profit before net finance expense, income taxes and depreciation, depletion, and amortization. EBITDA provides insight into our overall business performance (a combination of cost management and growth) and is the corresponding flow driver towards the objective of achieving industry-leading returns. This measure assists readers in understanding the ongoing cash generating potential of the business including liquidity to fund working capital, servicing debt, and funding capital expenditures and investment opportunities.
This measure is not recognized under IFRS as it does not have any standardized meaning prescribed by IFRS and is therefore unlikely to be comparable to similar measures presented by other issuers. EBITDA data is intended to provide additional information and should not be considered in isolation or as a substitute for measures of performance prepared in accordance with IFRS.
VANCOUVER, British Columbia, June 28, 2021 (GLOBE NEWSWIRE) — Melior Resources Inc. (TSXV: “MLR”) (“Melior” or the “Company”) refers to its press release of April 28, 2021 regarding the Default Notice received from Pala Investments Ltd (“Pala”) and the subsequent Standstill Agreement entered into with Pala.
The Company announces that it has today entered into a further standstill amending agreement with Pala pursuant to which Pala has agreed to extend the standstill period until September 30, 2021.
Furthermore, Melior has also today entered into a further amended demand promissory note (the “Amended Promissory Note”) with Pala extending the maturity of the loan from June 30, 2021 to September 30, 2021. All other terms of the Amended Promissory Note remain unchanged.
MELIOR RESOURCES INC.
Martyn Buttenshaw
Interim Chief Executive Officer
+41 41 560 9070
info@meliorresources.com
Neither the TSX Venture Exchange nor its Regulation Services Provider (as that term is defined in the policies of the TSX Venture Exchange) accepts responsibility for the adequacy or accuracy of this release.
The proven Zacks Rank system focuses on earnings estimates and estimate revisions to find winning stocks. Nevertheless, we know that our readers all have their own perspectives, so we are always looking at the latest trends in value, growth, and momentum to find strong picks.
Of these, value investing is easily one of the most popular ways to find great stocks in any market environment. Value investors use tried-and-true metrics and fundamental analysis to find companies that they believe are undervalued at their current share price levels.
Zacks has developed the innovative Style Scores system to highlight stocks with specific traits. For example, value investors will be interested in stocks with great grades in the "Value" category. When paired with a high Zacks Rank, "A" grades in the Value category are among the strongest value stocks on the market today.
One company to watch right now is ANGLO AMER ADR (NGLOY). NGLOY is currently sporting a Zacks Rank of #2 (Buy), as well as a Value grade of A. The stock holds a P/E ratio of 6.24, while its industry has an average P/E of 7.48. Over the past year, NGLOY's Forward P/E has been as high as 12.90 and as low as 5.75, with a median of 8.42.
We should also highlight that NGLOY has a P/B ratio of 1.70. Investors use the P/B ratio to look at a stock's market value versus its book value, which is defined as total assets minus total liabilities. This stock's P/B looks solid versus its industry's average P/B of 3.22. Over the past 12 months, NGLOY's P/B has been as high as 2.04 and as low as 1.03, with a median of 1.49.
These figures are just a handful of the metrics value investors tend to look at, but they help show that ANGLO AMER ADR is likely being undervalued right now. Considering this, as well as the strength of its earnings outlook, NGLOY feels like a great value stock at the moment.
Want the latest recommendations from Zacks Investment Research? Today, you can download 7 Best Stocks for the Next 30 Days. Click to get this free report
ANGLO AMER ADR (NGLOY) : Free Stock Analysis Report
To read this article on Zacks.com click here.
Vancouver, British Columbia–(Newsfile Corp. – June 28, 2021) – Contact Gold Corp. (TSXV: C) (OTCQB: CGOLF) (the "Company" or "Contact Gold") is pleased to announce the drilling of an additional gold discovery, X-Ray, at its Green Springs gold project in White Pine County, Nevada.
This new discovery at the X-Ray Target comes on the heels of the Company's Tango discovery, announced June 15, 2021, and contains even better oxide gold intercepts. The X-Ray Target sits midway between the northern end of the Mine Trend and the Alpha Zone, and bridges a gap with no prior drilling of over 500 metres between these zones. The X-Ray and Tango discoveries are the blueprint for a significant expansion opportunity at the property.
Drill Highlights:
-
1.28 g/t oxide Au over 39.62 m in drill hole GS21-48, from a depth of 12.19 metres,
-
including 2.93 g/t Au over 9.14 m
-
-
0.82 g/t oxide Au over 24.38 m in drill hole GS21-49 from a depth of 9.14 metres,
-
Including 1.23 g/t Au over 9.14 metres
-
Key Points:
-
Second gold discovery of 2021 made at the X-Ray Target in the northern portion of Green Springs
-
X-Ray sits in a structurally complex area midway between the northern end of the Mine Trend and the Alpha Zone, and bridges a gap of over 500 metres that had seen no drilling prior to Contact Gold's
-
Remains open for expansion, particularly to the south where it is overlain by the barren Joana limestone, as well as along strike of the Pilot Shale unit to the west and east
-
X-Ray was identified by soil and rock geochemical sampling, geological mapping, and interpretation of drill results at the nearby Alpha Zone
-
Additional detailed mapping and road cut sampling is underway to refine the next phase of drilling
-
Gold mineralization at X-Ray is hosted in well oxidized Pilot Shale – the same stratigraphic horizon hosting gold mineralization at Alpha and the new Tango discovery
"The discovery of another brand-new zone of oxidized gold mineralization in the Pilot Shale at Green Springs is a great accomplishment for our team. This discovery provides further validity to our exploration model targeting the underexplored Pilot Shale, which was the primary factor in deciding to acquire the project. As we continue to employ this model we are achieving excellent first pass hit rates at new, previously undrilled targets, providing us confidence to aggressively continue to test similar new areas and targets elsewhere on the project," said Vance Spalding, Contact Gold's Vice President of Exploration. "The discovery of broad intervals of well-oxidized mineralization at X-Ray opens up the potential to put together a significant zone of gold in the previously undrilled gap between Alpha and the Mine Trend."
The X-Ray Discovery:
X-Ray is located in a structurally complex area midway between the northern end of the Mine Trend and the Alpha Zone, bridging a gap of over 500 metres.
-
X-Ray is hosted at the Devonian Guilmette limestone/ Pilot shale contact, host to Kinross' 1.5 Moz Alligator Ridge/Vantage and Saga deposits at the Bald Mountain mine 40 km to the north
-
The Devonian limestone/shale host at X-Ray, Tango and Alpha is underexplored at Green Springs where it underlies the Mississippian limestone/shale contact that was previously exploited along the Mine Trend
-
Gold mineralization at X-Ray is mostly hosted within decalcified and variably oxidized and silicified Pilot Shale with minor mineralization in collapse breccia of the underlying Guilmette limestone
-
X-Ray is open for expansion, particularly to the south and west and east
-
Road cut sampling and detailed mapping of the drill road are underway to collect the necessary data to plan the 2nd phase drill program
Contact Gold began the 2021 Green Springs drill program in late February and completed 58 drill holes totalling 7,511 meters. Assays are pending for 32 drill holes, including from the Mine Trend, Alpha Zone and the Golf Target.
2021 Green Springs drill hole results from this news release:
|
Drill Hole |
Zone |
From (m) |
To (m) |
Interval |
Grade g/t Au |
Oxidation |
|
GS21-48 |
X-Ray |
12.19 |
51.82 |
39.62 |
1.28 |
Oxide (71% CN Recovery) |
|
including |
19.81 |
30.48 |
10.67 |
1.10 |
Oxide (90% CN Recovery) |
|
|
and including |
33.53 |
42.67 |
9.14 |
2.93 |
Oxide (74% CN Recovery) |
|
|
GS21-49 |
X-Ray |
9.14 |
33.53 |
24.38 |
0.82 |
Oxide (97% CN Recovery) |
|
including |
22.86 |
32.00 |
9.14 |
1.25 |
Oxide (98% CN Recovery) |
|
|
GS21-50 |
X-Ray |
No reportable intercepts |
||||
|
GS21-51 |
X-Ray |
No reportable intercepts |
||||

Figure 1- Plan map of the X-Ray discovery.
To view an enhanced version of Figure 1, please visit:
https://orders.newsfilecorp.com/files/5350/88674_4c3b03f644ceb9fa_004full.jpg
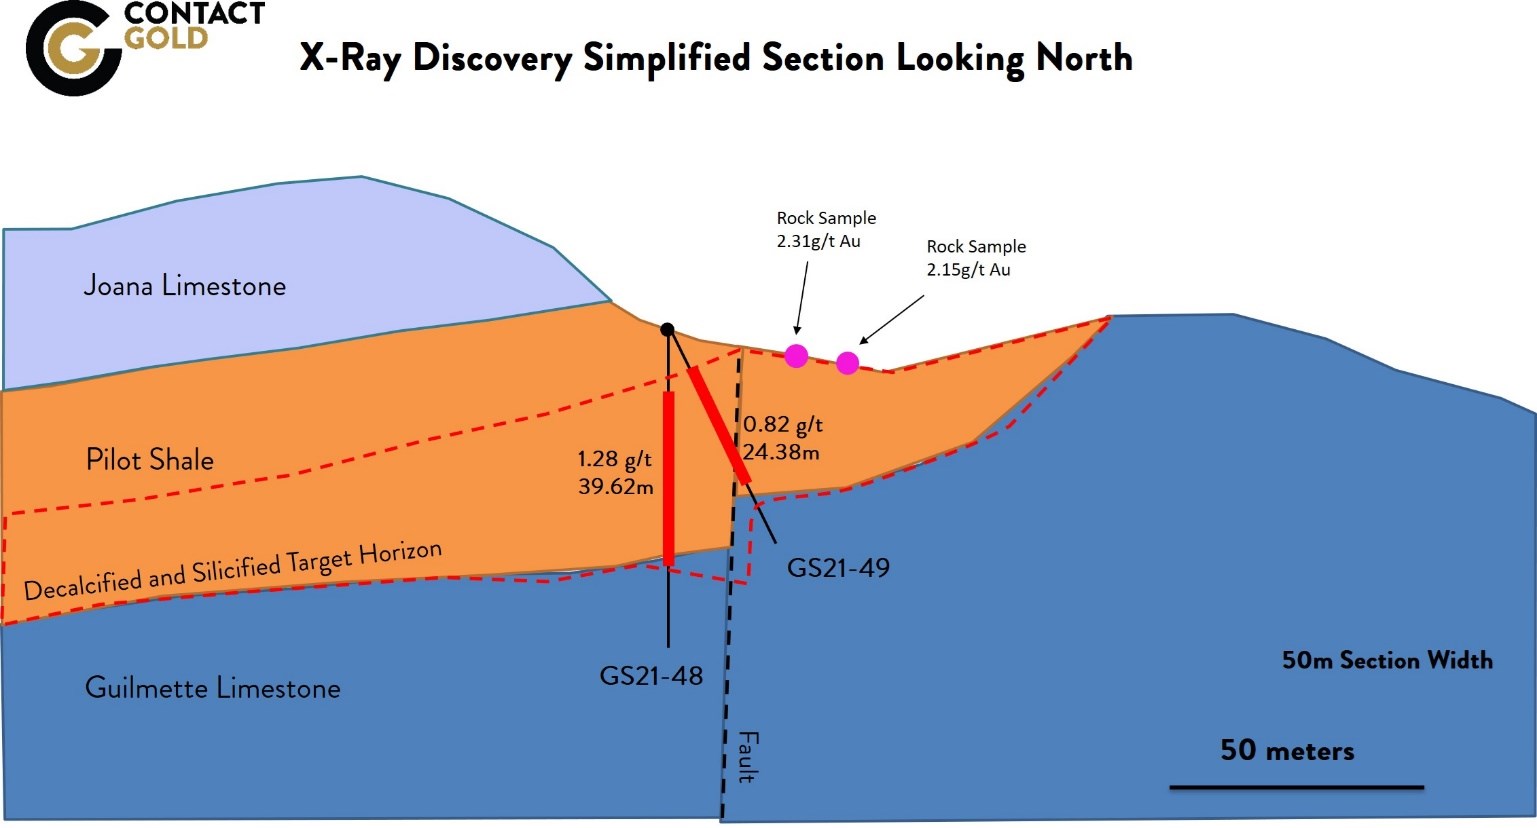
Figure 2 – North looking cross section through the X-Ray discovery.
To view an enhanced version of Figure 2, please visit:
https://orders.newsfilecorp.com/files/5350/88674_4c3b03f644ceb9fa_005full.jpg
About the Green Springs Project:
Green Springs is located near the southern end of the Cortez Trend of Carlin-type gold deposits in White Pine County, Nevada, east of Fiore Gold's Pan Mine and Gold Rock Project and south of Waterton's Mount Hamilton deposit. The Green Springs property is comprised of 257 lode mining claims covering 19.86 km2 of U.S. Federal lands, encompassing 3 shallow past producing open pits and numerous targets that were not mined.
Contact Gold signed a purchase option agreement with Ely Gold Royalties ("Ely Gold") to acquire an undivided 100% interest in Green Springs in July 2019. Green Springs is an early-stage exploration property and does not contain any mineral resource estimates as defined by National Instrument 43-101, Standards of Disclosure for Mineral Projects ("NI 43-101"). There has been insufficient exploration to define a mineral resource estimate at Green Springs. Additional information about Green Springs is summarized in the NI 43-101 Technical Report entitled "NI 43-101 Technical Report for the Green Springs Project, White Pine County, Nevada, USA" prepared for Contact Gold, with an effective date of June 12, 2020, and dated August 5, 2020, as prepared by John J. Read, C.P.G; an independent consultant and qualified person under NI 43-101, and can be viewed under Contact Gold's issuer profile on SEDAR at www.sedar.com.
The scientific and technical information contained in this news release has been reviewed and approved by Vance Spalding, CPG, VP Exploration, Contact Gold, who is a "qualified person" within the meaning of NI 43-101. Drill intercepts were calculated using a minimum thickness of 3.05 metres averaging 0.14 ppm gold and allowing inclusion of up to 4.57 metres of material averaging less than 0.14 ppm gold for low grade intervals and higher-grade intervals were calculated using a minimum thickness of 3.05 metres averaging 1.00 ppm gold and allowing inclusion of up to 4.57 metres of assays averaging less than 1.00 ppm gold. Gravimetric assays are used for all Fire Assays above 4.00 ppm gold. Cyanide solubility assays are completed on all Fire Assays greater than 0.1 g/t. True width of drilled mineralization is unknown, but owing to the apparent flat lying nature of mineralization, is estimated to generally be at least 70% of drilled thickness in most cases. The Cyanide recovery percentages are equally averaged by interval, and are not weighted by gold content per interval. Quality Assurance / Quality Control consists of regular insertion of certified reference standards, blanks, and duplicates. All failures are followed up and resolved whenever possible with additional investigation whenever such an event occurs. All assays are completed at Paragon; an ISO 17025:2005 accredited lab. Check assays are completed at a second, reputable assay lab after the program is complete.
About Contact Gold Corp.
Contact Gold is an exploration company focused on making district scale gold discoveries in Nevada. Contact Gold's extensive land holdings are on the prolific Carlin and Cortez gold trends which host numerous gold deposits and mines. Contact Gold's land position comprises approximately 140 km2 of target rich mineral tenure hosting numerous known gold occurrences, ranging from early- to advanced-exploration and resource definition stage.
Additional information about the Company is available at www.contactgold.com.
For more information, please contact: +1 (604) 449-3361
John Glanville – Director Investor Relations
Chris Pennimpede – VP, Corporate Development
E-mail: info@ContactGold.com
Neither the TSXV nor its Regulation Services Provider (as that term is defined in the policies of the TSXV) accepts responsibility for the adequacy of this release. No stock exchange, securities commission or other regulatory authority has approved or disapproved the information contained herein.
Cautionary Note Regarding Forward-Looking Information
This news release contains "forward-looking information" and "forward-looking statements" (collectively, "forward-looking statements") within the meaning of the applicable Canadian securities legislation. All statements, other than statements of historical fact, are forward-looking statements and are based on expectations, estimates and projections as at the date of this news release. Any statement that involves discussions with respect to predictions, expectations, beliefs, plans, projections, objectives, assumptions, future events or performance (often but not always using phrases such as "expects", or "does not expect", "is expected", "anticipates" or "does not anticipate", "plans", "budget", "scheduled", "forecasts", "estimates", "believes" or "intends" or variations of such words and phrases or stating that certain actions, events or results "may" or "could", "would", "might" or "will" be taken to occur or be achieved) are not statements of historical fact and may be forward-looking statements. In this news release, forward-looking statements relate, among other things, to the anticipated exploration activities of the Company on the Green Springs property.
These forward-looking statements are based on reasonable assumptions and estimates of management of the Company at the time such statements were made. Actual future results may differ materially as forward-looking statements involve known and unknown risks, uncertainties and other factors which may cause the actual results, performance or achievements of the Company to materially differ from any future results, performance or achievements expressed or implied by such forward-looking statements. Such factors, among other things, include: impacts arising from the global disruption by the Covid-19 coronavirus outbreak; fluctuations in general macroeconomic conditions; fluctuations in securities markets; fluctuations in spot and forward prices of gold, silver, base metals or certain other commodities; fluctuations in currency markets (such as the Canadian dollar to United States dollar exchange rate); change in national and local government, legislation, taxation, controls, regulations and political or economic developments; risks and hazards associated with the business of mineral exploration, development and mining (including environmental hazards, industrial accidents, unusual or unexpected formations pressures, cave-ins and flooding); inability to obtain adequate insurance to cover risks and hazards; the presence of laws and regulations that may impose restrictions on mining; employee relations; relationships with and claims by local communities and indigenous populations; availability of increasing costs associated with mining inputs and labour; the speculative nature of mineral exploration and development (including the risks of obtaining necessary licenses, permits and approvals from government authorities); and title to properties. Although the forward-looking statements contained in this news release are based upon what management of the Company believes, or believed at the time, to be reasonable assumptions, the Company cannot assure shareholders that actual results will be consistent with such forward-looking statements, as there may be other factors that cause results not to be as anticipated, estimated or intended. Readers should not place undue reliance on the forward-looking statements and information contained in this news release. The Company assumes no obligation to update the forward-looking statements of beliefs, opinions, projections, or other factors, should they change, except as required by law.

To view the source version of this press release, please visit https://www.newsfilecorp.com/release/88674
Vancouver, British Columbia–(Newsfile Corp. – June 15, 2021) – Contact Gold Corp. (TSXV: C) (OTCQB: CGOLF) (the "Company" or "Contact Gold") is pleased to announce the drilling of a new gold discovery at its Green Springs gold project in White Pine County, Nevada.
Drill Highlights:
-
0.55 g/t oxide Au over 54.86 m in drill hole GS21-31, from a depth of 19.81 metres, including 1.34 g/t Au over 3.05 m
-
1.01 g/t oxide Au over 13.72 m in drill hole GS21-32 from a depth of 24.38 metres, including 2.71 g/t Au over 3.05 m
-
0.87 g/t oxide Au over 13.72 m in drill hole GS21-27 from a depth of 15.24 metres, including 1.5 g/t Au over 4.57 m
Key Points:
-
New gold discovery made at the Tango Target in the northern portion of Green Springs
-
Tango represents a step out of over 500 metres from the next closest drill holes at the Alpha Zone (see news release dated April 14, 2021), and remains open for expansion, particularly to the south and west
-
An additional 15 drill holes drilled at the Tango Target all intercepted intervals of near surface, oxidized gold mineralization over an area of 250 x 500 metres
-
Tango was identified by soil and rock geochemical sampling and was never before drilled; all holes drilled by Contact Gold at Tango intersected significant gold mineralization
-
Road cut sampling and additional detailed mapping are underway to refine targeting ahead of the next phase of drilling
-
Contact Gold has staked an additional 18 claims to the north of the Tango discovery, covering 15.5 Hectares or 36 Acres of prospective ground
"We are ecstatic to have discovered a large new zone of oxidized gold mineralization at Green Springs. Opportunities to generate and drill shallow, new targets that result in new discoveries are becoming increasingly rare in Nevada, especially on the major gold trends," said Matt Lennox-King, President & CEO of Contact Gold. "The Tango discovery, with its large surface footprint, strong oxide grades and thicknesses is a testament to the quality of targets that Vance Spalding, Contact Gold's Vice President of Exploration and his team have generated at Green Springs. We are excited to get back on the ground at Tango and continue growing this exciting new discovery. In the meantime, we are excited to receive results from the newly drilled connector zone, which are the first ever holes into a 500-metre gap between the Mine Trend and Alpha Zone."
The Tango Discovery:
Tango is located 500 metres to the NE of the Alpha Zone, and represents an entirely new gold zone.
-
Tango is hosted at the Devonian limestone/shale contact, host to Kinross's 1.5 Moz Alligator Ridge/Vantage and Saga deposits at the Bald Mountain mine 40 km to the north
-
The Devonian limestone/shale host at Tango and Alpha is underexplored at Green Springs where it underlies the Mississippian limestone/shale contact that was previously exploited along the mine trend
-
Gold mineralization at Tango is mostly hosted within decalcified and variably oxidized and silicified Pilot Shale with minor mineralization in collapse breccia of the underlying Guilmette limestone
-
Northwest and North-South striking, high angle faults control the gold mineralization at Tango
-
Tango is open for expansion, particularly to the south and west
-
Road cut sampling and detailed mapping of the Tango drill road are underway to collect the necessary data to plan the 2nd phase drill program
Contact Gold began the 2021 Green Springs drill program in late February and completed 58 drill holes totalling 7,511 meters. Assays are pending for 36 drill holes, including from the Mine Trend and Connector Target between the Mine Trend and Alpha Zone.

Figure 1 – Plan map of the new Tango discovery, northeast of the Alpha Zone and Mine Trend
To view an enhanced version of Figure 1, please visit:
https://orders.newsfilecorp.com/files/5350/87554_Tango%20Plan%20Map.jpg
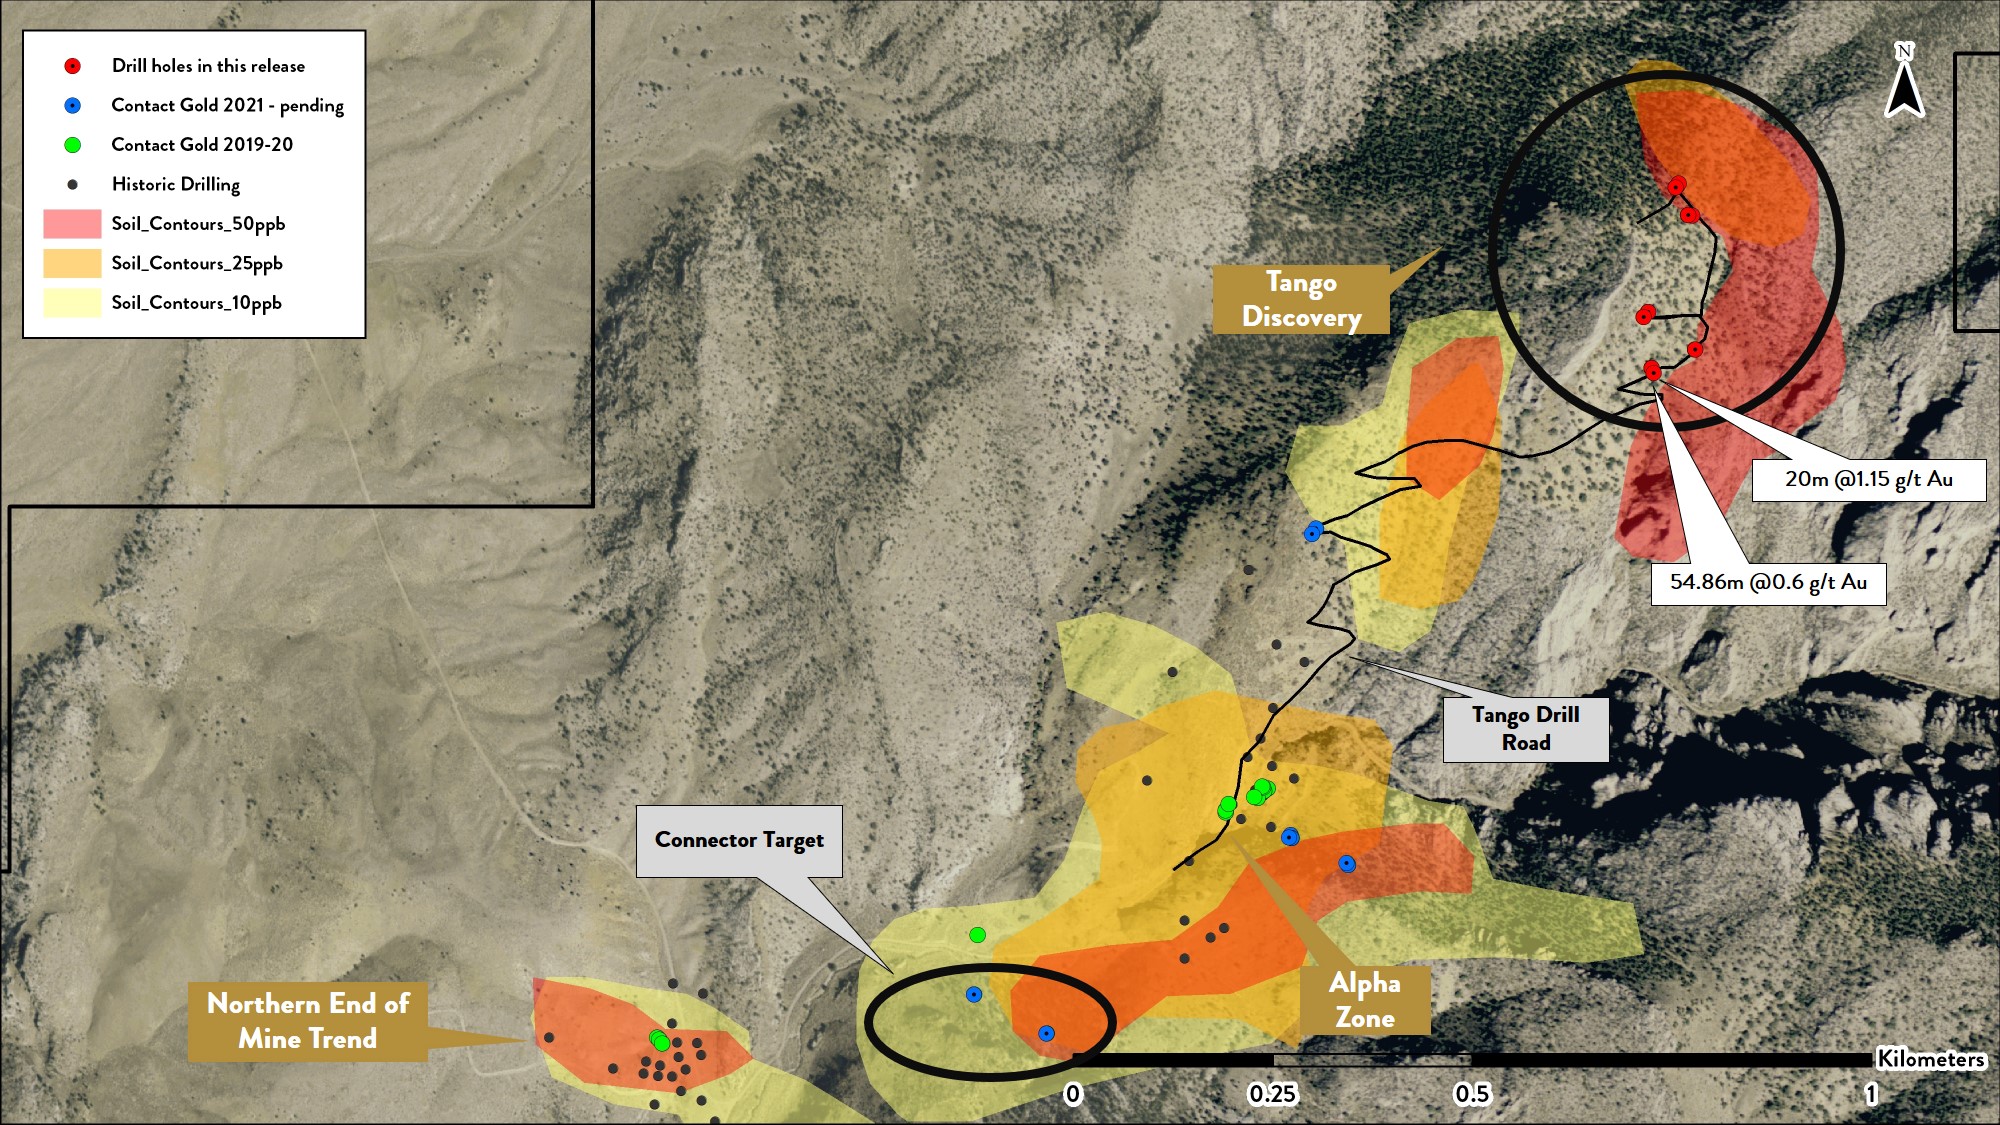
Figure 2 – Plan map of the Tango Target showing discovery drill holes
To view an enhanced version of Figure 2, please visit:
https://orders.newsfilecorp.com/files/5350/87554_Tango%20Detailed%20Map.jpg
2021 Green Springs drill hole results from this news release:
|
Drill |
Zone |
From (m) |
To (m) |
Interval |
Grade |
Oxidation |
|
GS 2124 |
Tango |
12.19 |
16.76 |
4.57 |
0.28 |
Oxide (64% CN Recovery) |
|
GS 2125 |
Tango |
15.24 |
28.96 |
13.72 |
0.40 |
Oxide (71% CN Recovery) |
|
GS 2126 |
Tango |
16.76 |
27.43 |
10.67 |
0.36 |
Oxide (65% CN Recovery) |
|
GS 2127 |
Tango |
15.24 |
28.96 |
13.72 |
0.87 |
Oxide (65% CN Recovery) |
|
including |
19.81 |
24.38 |
4.57 |
1.50 |
Oxide (69% CN Recovery) |
|
|
GS 2128 |
Tango |
9.14 |
36.58 |
27.43 |
0.35 |
Oxide (62% CN Recovery) |
|
GS 2129 |
Tango |
16.76 |
22.86 |
6.10 |
0.42 |
Oxide (70% CN Recovery) |
|
GS 2130 |
Tango |
22.86 |
28.96 |
6.10 |
0.24 |
Oxide (71% CN Recovery) |
|
GS 2131 |
Tango |
19.81 |
74.68 |
54.86 |
0.55 |
Oxide (76% CN Recovery) |
|
including |
38.10 |
41.15 |
3.05 |
1.34 |
Oxide (80% CN Recovery) |
|
|
GS 2132 |
Tango |
24.38 |
38.10 |
13.72 |
1.01 |
Oxide (73% CN Recovery) |
|
including |
28.96 |
32.00 |
3.05 |
2.71 |
Oxide (66% CN Recovery) |
|
|
GS 2133 |
Tango |
30.48 |
39.62 |
9.14 |
0.33 |
Oxide (70% CN Recovery) |
|
GS 2134 |
Tango |
44.20 |
47.24 |
3.05 |
0.25 |
Oxide (71% CN Recovery) |
|
GS 2135 |
Tango |
70.10 |
88.39 |
18.29 |
0.26 |
Oxide (70% CN Recovery) |
|
GS 2136 |
Tango |
28.96 |
35.05 |
6.10 |
0.27 |
Oxide (70% CN Recovery) |
|
GS 2137 |
Tango |
32.00 |
41.15 |
9.14 |
0.32 |
Oxide (80% CN Recovery) |
|
GS 2138 |
Tango |
No reportable intercepts |
||||
|
GS 2139 |
Tango |
3.05 |
15.24 |
12.19 |
0.24 |
Oxide (62% CN Recovery) |
|
GS 2140 |
Tango |
19.81 |
24.38 |
4.57 |
0.19 |
Oxide (77% CN Recovery) |

Figure 3 – Drone photo of the Tango discovery and holes 31 and 32
To view an enhanced version of Figure 3, please visit:
https://orders.newsfilecorp.com/files/5350/87554_Tango%20Drone%20Shot.jpg
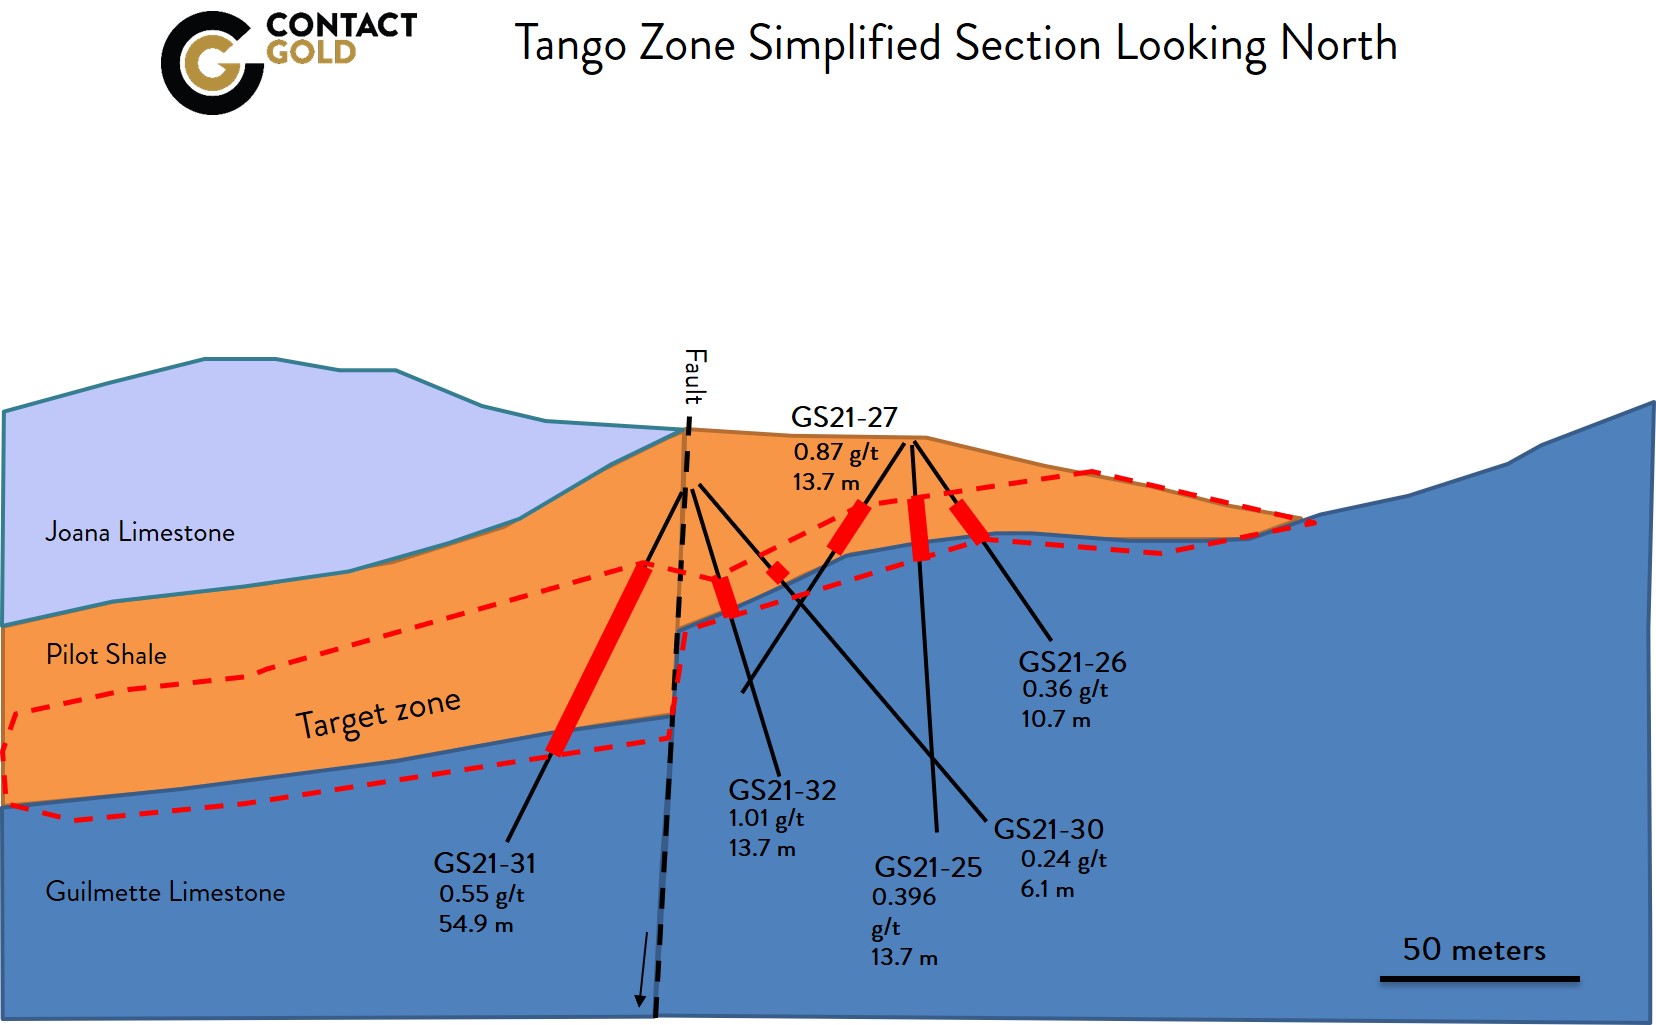
Figure 4 – Cross section through Green Springs holes 31 and 32
To view an enhanced version of Figure 4, please visit:
https://orders.newsfilecorp.com/files/5350/87554_Tango%20Section%2031%2032.jpg
About the Green Springs Project:
Green Springs is located near the southern end of the Cortez Trend of Carlin-type gold deposits in White Pine County, Nevada, east of Fiore Gold's Pan Mine and Gold Rock Project and south of Waterton's Mount Hamilton deposit. The Green Springs property is 18.65 km2 encompassing 3 shallow past producing open pits and numerous targets that were not mined.
Contact Gold signed a purchase option agreement with Ely Gold Royalties ("Ely Gold") to acquire an undivided 100% interest in Green Springs in July 2019. Green Springs is an early-stage exploration property and does not contain any mineral resource estimates as defined by National Instrument 43-101, Standards of Disclosure for Mineral Projects ("NI 43-101"). There has been insufficient exploration to define a mineral resource estimate at Green Springs. Additional information about Green Springs is summarized in the NI 43-101 Technical Report entitled "NI 43-101 Technical Report for the Green Springs Project, White Pine County, Nevada, USA" prepared for Contact Gold, with an effective date of June 12, 2020, and dated August 5, 2020, as prepared by John J. Read, C.P.G; an independent consultant and qualified person under NI 43-101, and can be viewed under Contact Gold's issuer profile on SEDAR at www.sedar.com.
The scientific and technical information contained in this news release has been reviewed and approved by Vance Spalding, CPG, VP Exploration, Contact Gold, who is a "qualified person" within the meaning of NI 43-101. Drill intercepts were calculated using a minimum thickness of 3.05 metres averaging 0.14 ppm gold and allowing inclusion of up to 4.57 metres of material averaging less than 0.14 ppm gold for low grade intervals and higher-grade intervals were calculated using a minimum thickness of 3.05 metres averaging 1.00 ppm gold and allowing inclusion of up to 4.57 metres of assays averaging less than 1.00 ppm gold. Gravimetric assays are used for all Fire Assays above 4.00 ppm gold. Cyanide solubility assays are completed on all Fire Assays greater than 0.1 g/t. True width of drilled mineralization is unknown, but owing to the apparent flat lying nature of mineralization, is estimated to generally be at least 70% of drilled thickness in most cases. The Cyanide recovery percentages are equally averaged by interval, and are not weighted by gold content per interval. Quality Assurance / Quality Control consists of regular insertion of certified reference standards, blanks, and duplicates. All failures are followed up and resolved whenever possible with additional investigation whenever such an event occurs. All assays are completed at Paragon; an ISO 17025:2005 accredited lab. Check assays are completed at a second, reputable assay lab after the program is complete.
About Contact Gold Corp.
Contact Gold is an exploration company focused on making district scale gold discoveries in Nevada. Contact Gold's extensive land holdings are on the prolific Carlin and Cortez gold trends which host numerous gold deposits and mines. Contact Gold's land position comprises approximately 140 km2 of target rich mineral tenure hosting numerous known gold occurrences, ranging from early- to advanced-exploration and resource definition stage.
Additional information about the Company is available at www.contactgold.com.
For more information, please contact: +1 (604) 449-3361
John Glanville – Director Investor Relations
Chris Pennimpede – VP, Corporate Development
E-mail: info@ContactGold.com
Neither the TSXV nor its Regulation Services Provider (as that term is defined in the policies of the TSXV) accepts responsibility for the adequacy of this release. No stock exchange, securities commission or other regulatory authority has approved or disapproved the information contained herein.
Cautionary Note Regarding Forward-Looking Information
This news release contains "forward-looking information" and "forward-looking statements" (collectively, "forward-looking statements") within the meaning of the applicable Canadian securities legislation. All statements, other than statements of historical fact, are forward-looking statements and are based on expectations, estimates and projections as at the date of this news release. Any statement that involves discussions with respect to predictions, expectations, beliefs, plans, projections, objectives, assumptions, future events or performance (often but not always using phrases such as "expects", or "does not expect", "is expected", "anticipates" or "does not anticipate", "plans", "budget", "scheduled", "forecasts", "estimates", "believes" or "intends" or variations of such words and phrases or stating that certain actions, events or results "may" or "could", "would", "might" or "will" be taken to occur or be achieved) are not statements of historical fact and may be forward-looking statements. In this news release, forward-looking statements relate, among other things, to the anticipated exploration activities of the Company on the Green Springs property.
These forward-looking statements are based on reasonable assumptions and estimates of management of the Company at the time such statements were made. Actual future results may differ materially as forward-looking statements involve known and unknown risks, uncertainties and other factors which may cause the actual results, performance or achievements of the Company to materially differ from any future results, performance or achievements expressed or implied by such forward-looking statements. Such factors, among other things, include: impacts arising from the global disruption by the Covid-19 coronavirus outbreak; fluctuations in general macroeconomic conditions; fluctuations in securities markets; fluctuations in spot and forward prices of gold, silver, base metals or certain other commodities; fluctuations in currency markets (such as the Canadian dollar to United States dollar exchange rate); change in national and local government, legislation, taxation, controls, regulations and political or economic developments; risks and hazards associated with the business of mineral exploration, development and mining (including environmental hazards, industrial accidents, unusual or unexpected formations pressures, cave-ins and flooding); inability to obtain adequate insurance to cover risks and hazards; the presence of laws and regulations that may impose restrictions on mining; employee relations; relationships with and claims by local communities and indigenous populations; availability of increasing costs associated with mining inputs and labour; the speculative nature of mineral exploration and development (including the risks of obtaining necessary licenses, permits and approvals from government authorities); and title to properties. Although the forward-looking statements contained in this news release are based upon what management of the Company believes, or believed at the time, to be reasonable assumptions, the Company cannot assure shareholders that actual results will be consistent with such forward-looking statements, as there may be other factors that cause results not to be as anticipated, estimated or intended. Readers should not place undue reliance on the forward-looking statements and information contained in this news release. The Company assumes no obligation to update the forward-looking statements of beliefs, opinions, projections, or other factors, should they change, except as required by law.

To view the source version of this press release, please visit https://www.newsfilecorp.com/release/87554
The Mosaic Company MOS recently announced its sales volumes and revenues for May 2021 by business unit.
The Potash Segment recorded sales volume of 891,000 tons in May, up 10% from 810,000 tons in the year-ago period. Sales revenues were $246 million, up around 40% from $176 million in the prior-year period.
The Mosaic Fertilizantes segment witnessed a roughly 9% decline in sales volume to 790,000 tons from 870,000 tons last year. Sales revenues increased around 30% to $336 million from $259 million recorded last year.
The Phosphates segment recorded sales volume of 553,000 tons, down around 9% from 608,000 tons in 2020. Sales revenues in the segment were $327 million, up around 53% year over year.
Shares of Mosaic have gained 142.9% in the past year compared with 80.4% rise of the industry.

Image Source: Zacks Investment Research
The company, in its last earnings call, noted that it expects strong fundamental trends witnessed in the last three quarters to continue through 2021. Strong crop demand, affordable inputs and favorable weather indicate strong grower economics.
Chinese phosphate exports are expected to remain low in 2021 due to high domestic demand and recent industry restructuring limit supplies available for export.
The company projects $80-$90 per ton improvement in realized prices in the Phosphates segment, sequentially, in the second quarter. In the Potash segment, $20-$30 per ton improvement in realized prices is expected in the second quarter.
The Mosaic Company Price and Consensus

The Mosaic Company price-consensus-chart | The Mosaic Company Quote
Zacks Rank & Key Picks
Mosaic currently has a Zacks Rank #3 (Hold).
Some better-ranked stocks in the basic materials space are Nucor Corporation NUE, Olin Corporation OLN and Cabot Corporation CBT.
Nucor has a projected earnings growth rate of around 260% for the current year. The company’s shares have surged 130.3% in a year. It currently flaunts a Zacks Rank #1 (Strong Buy). You can see the complete list of today’s Zacks #1 Rank stocks here.
Olin has an expected earnings growth rate of around 506.7% for the current year. The company’s shares have skyrocketed 264% in the past year. It currently sports a Zacks Rank #1.
Cabot has an expected earnings growth rate of around 126% for the current fiscal. The company’s shares have surged 59.9% in the past year. It currently carries a Zacks Rank #1.
Zacks Names “Single Best Pick to Double”
From thousands of stocks, 5 Zacks experts each have chosen their favorite to skyrocket +100% or more in months to come. From those 5, Director of Research Sheraz Mian hand-picks one to have the most explosive upside of all.
You know this company from its past glory days, but few would expect that it’s poised for a monster turnaround. Fresh from a successful repositioning and flush with A-list celeb endorsements, it could rival or surpass other recent Zacks’ Stocks Set to Double like Boston Beer Company which shot up +143.0% in a little more than 9 months and Nvidia which boomed +175.9% in one year.
Free: See Our Top Stock and 4 Runners Up >>
Want the latest recommendations from Zacks Investment Research? Today, you can download 7 Best Stocks for the Next 30 Days. Click to get this free report
Nucor Corporation (NUE) : Free Stock Analysis Report
The Mosaic Company (MOS) : Free Stock Analysis Report
Cabot Corporation (CBT) : Free Stock Analysis Report
Olin Corporation (OLN) : Free Stock Analysis Report
To read this article on Zacks.com click here.
Hedge funds and large money managers usually invest with a focus on the long-term horizon and, therefore, short-lived dips or bumps on the charts usually don't make them change their opinion towards a company. This time it may be different. The coronavirus pandemic destroyed the high correlations among major industries and asset classes. We are now in a stock pickers market where fundamentals of a stock have more effect on the price than the overall direction of the market. As a result we observe sudden and large changes in hedge fund positions depending on the news flow. Let’s take a look at the hedge fund sentiment towards Chemung Financial Corp. (NASDAQ:CHMG) to find out whether there were any major changes in hedge funds' views.
Hedge fund interest in Chemung Financial Corp. (NASDAQ:CHMG) shares was flat at the end of last quarter. This is usually a negative indicator. Our calculations also showed that CHMG isn't among the 30 most popular stocks among hedge funds (click for Q1 rankings). The level and the change in hedge fund popularity aren't the only variables you need to analyze to decipher hedge funds' perspectives. A stock may witness a boost in popularity but it may still be less popular than similarly priced stocks. That's why at the end of this article we will examine companies such as Quad/Graphics, Inc. (NYSE:QUAD), OptiNose, Inc. (NASDAQ:OPTN), and Comstock Mining, Inc. (NYSE:LODE) to gather more data points.
In the financial world there are a large number of tools investors have at their disposal to grade stocks. A pair of the most under-the-radar tools are hedge fund and insider trading indicators. We have shown that, historically, those who follow the top picks of the best fund managers can outperform the broader indices by a solid amount. Insider Monkey's monthly stock picks returned 206.8% since March 2017 and outperformed the S&P 500 ETFs by more than 115 percentage points (see the details here). That's why we believe hedge fund sentiment is a useful indicator that investors should pay attention to.

Matthew Lindenbaum of Basswood Capital
At Insider Monkey, we scour multiple sources to uncover the next great investment idea. For example, an activist hedge fund wants to buy this $26 biotech stock for $50. So, we recommended a long position to our monthly premium newsletter subscribers. We go through lists like the 10 best battery stocks to pick the next Tesla that will deliver a 10x return. Even though we recommend positions in only a tiny fraction of the companies we analyze, we check out as many stocks as we can. We read hedge fund investor letters and listen to stock pitches at hedge fund conferences. You can subscribe to our free daily newsletter on our homepage. With all of this in mind we're going to review the fresh hedge fund action encompassing Chemung Financial Corp. (NASDAQ:CHMG).
Do Hedge Funds Think CHMG Is A Good Stock To Buy Now?
Heading into the second quarter of 2021, a total of 3 of the hedge funds tracked by Insider Monkey held long positions in this stock, a change of 0% from the previous quarter. By comparison, 3 hedge funds held shares or bullish call options in CHMG a year ago. With the smart money's capital changing hands, there exists a select group of noteworthy hedge fund managers who were adding to their stakes meaningfully (or already accumulated large positions).

When looking at the institutional investors followed by Insider Monkey, Matthew Lindenbaum's Basswood Capital has the biggest position in Chemung Financial Corp. (NASDAQ:CHMG), worth close to $4.2 million, accounting for 0.2% of its total 13F portfolio. The second most bullish fund manager is Renaissance Technologies, which holds a $3.1 million position; the fund has less than 0.1%% of its 13F portfolio invested in the stock. In terms of the portfolio weights assigned to each position Basswood Capital allocated the biggest weight to Chemung Financial Corp. (NASDAQ:CHMG), around 0.19% of its 13F portfolio. Royce & Associates is also relatively very bullish on the stock, designating 0.01 percent of its 13F equity portfolio to CHMG.
Earlier we told you that the aggregate hedge fund interest in the stock was unchanged and we view this as a negative development. Even though there weren't any hedge funds dumping their holdings during the third quarter, there weren't any hedge funds initiating brand new positions. This indicates that hedge funds, at the very best, perceive this stock as dead money and they haven't identified any viable catalysts that can attract investor attention.
Let's also examine hedge fund activity in other stocks similar to Chemung Financial Corp. (NASDAQ:CHMG). These stocks are Quad/Graphics, Inc. (NYSE:QUAD), OptiNose, Inc. (NASDAQ:OPTN), Comstock Mining, Inc. (NYSE:LODE), Annovis Bio, Inc. (NYSE:ANVS), Spark Networks SE (NYSE:LOV), Select Bancorp, Inc. (NASDAQ:SLCT), and Five Star Senior Living Inc. (NASDAQ:FVE). This group of stocks' market values resemble CHMG's market value.
[table] Ticker, No of HFs with positions, Total Value of HF Positions (x1000), Change in HF Position QUAD,10,9438,2 OPTN,10,6714,0 LODE,4,1097,0 ANVS,6,10079,5 LOV,6,44401,-3 SLCT,5,11115,0 FVE,11,27833,0 Average,7.4,15811,0.6 [/table]
View table here if you experience formatting issues.
As you can see these stocks had an average of 7.4 hedge funds with bullish positions and the average amount invested in these stocks was $16 million. That figure was $9 million in CHMG's case. Five Star Senior Living Inc. (NASDAQ:FVE) is the most popular stock in this table. On the other hand Comstock Mining, Inc. (NYSE:LODE) is the least popular one with only 4 bullish hedge fund positions. Compared to these stocks Chemung Financial Corp. (NASDAQ:CHMG) is even less popular than LODE. Our overall hedge fund sentiment score for CHMG is 23. Stocks with higher number of hedge fund positions relative to other stocks as well as relative to their historical range receive a higher sentiment score. Hedge funds dodged a bullet by taking a bearish stance towards CHMG. Our calculations showed that the top 10 most popular hedge fund stocks returned 95.8% in 2019 and 2020, and outperformed the S&P 500 ETF (SPY) by 40 percentage points. These stocks gained 17.2% in 2021 through June 11th but managed to beat the market again by 3.3 percentage points. Unfortunately CHMG wasn't nearly as popular as these 5 stocks (hedge fund sentiment was very bearish); CHMG investors were disappointed as the stock returned 2.8% since the end of the first quarter (through 6/11) and underperformed the market. If you are interested in investing in large cap stocks with huge upside potential, you should check out the top 5 most popular stocks among hedge funds as most of these stocks already outperformed the market since 2019.
Get real-time email alerts: Follow Chemung Financial Corp (NASDAQ:CHMG)
Disclosure: None. This article was originally published at Insider Monkey.
Related Content
Is Alexco Resource Corp. (NYSE:AXU) a good place to invest some of your money right now? We can gain invaluable insight to help us answer that question by studying the investment trends of top investors, who employ world-class Ivy League graduates, who are given immense resources and industry contacts to put their financial expertise to work. The top picks of these firms have historically outperformed the market when we account for known risk factors, making them very valuable investment ideas.
Hedge fund interest in Alexco Resource Corp. (NYSE:AXU) shares was flat at the end of last quarter. This is usually a negative indicator. Our calculations also showed that AXU isn't among the 30 most popular stocks among hedge funds (click for Q1 rankings). The level and the change in hedge fund popularity aren't the only variables you need to analyze to decipher hedge funds' perspectives. A stock may witness a boost in popularity but it may still be less popular than similarly priced stocks. That's why at the end of this article we will examine companies such as Summit Financial Group, Inc. (NASDAQ:SMMF), DSP Group, Inc. (NASDAQ:DSPG), and Big 5 Sporting Goods Corporation (NASDAQ:BGFV) to gather more data points.
Today there are many metrics stock market investors put to use to size up stocks. A pair of the less known metrics are hedge fund and insider trading activity. We have shown that, historically, those who follow the top picks of the top investment managers can outclass their index-focused peers by a healthy margin (see the details here). Also, our monthly newsletter's portfolio of long stock picks returned 206.8% since March 2017 (through May 2021) and beat the S&P 500 Index by more than 115 percentage points. You can download a sample issue of this newsletter on our website .

Eric Sprott of Sprott Asset Management
At Insider Monkey, we scour multiple sources to uncover the next great investment idea. For example, an activist hedge fund wants to buy this $26 biotech stock for $50. So, we recommended a long position to our monthly premium newsletter subscribers. We go through lists like the 10 best battery stocks to pick the next Tesla that will deliver a 10x return. Even though we recommend positions in only a tiny fraction of the companies we analyze, we check out as many stocks as we can. We read hedge fund investor letters and listen to stock pitches at hedge fund conferences. You can subscribe to our free daily newsletter on our homepage. Keeping this in mind we're going to view the key hedge fund action encompassing Alexco Resource Corp. (NYSE:AXU).
Do Hedge Funds Think AXU Is A Good Stock To Buy Now?
At Q1's end, a total of 3 of the hedge funds tracked by Insider Monkey held long positions in this stock, a change of 0% from one quarter earlier. The graph below displays the number of hedge funds with bullish position in AXU over the last 23 quarters. So, let's check out which hedge funds were among the top holders of the stock and which hedge funds were making big moves.

The largest stake in Alexco Resource Corp. (NYSE:AXU) was held by Sprott Asset Management, which reported holding $0.2 million worth of stock at the end of December. It was followed by Citadel Investment Group with a $0.1 million position. The only other hedge fund that is bullish on the company was Millennium Management.
Earlier we told you that the aggregate hedge fund interest in the stock was unchanged and we view this as a negative development. Even though there weren't any hedge funds dumping their holdings during the third quarter, there weren't any hedge funds initiating brand new positions. This indicates that hedge funds, at the very best, perceive this stock as dead money and they haven't identified any viable catalysts that can attract investor attention.
Let's now review hedge fund activity in other stocks – not necessarily in the same industry as Alexco Resource Corp. (NYSE:AXU) but similarly valued. We will take a look at Summit Financial Group, Inc. (NASDAQ:SMMF), DSP Group, Inc. (NASDAQ:DSPG), Big 5 Sporting Goods Corporation (NASDAQ:BGFV), Farmland Partners Inc (NYSE:FPI), Kaleido BioSciences, Inc. (NASDAQ:KLDO), Uxin Limited (NASDAQ:UXIN), and Village Super Market, Inc. (NASDAQ:VLGEA). This group of stocks' market valuations are closest to AXU's market valuation.
[table] Ticker, No of HFs with positions, Total Value of HF Positions (x1000), Change in HF Position SMMF,4,10966,0 DSPG,13,54197,0 BGFV,14,27074,-3 FPI,5,1965,-3 KLDO,6,7960,4 UXIN,3,5133,0 VLGEA,7,30340,-3 Average,7.4,19662,-0.7 [/table]
View table here if you experience formatting issues.
As you can see these stocks had an average of 7.4 hedge funds with bullish positions and the average amount invested in these stocks was $20 million. That figure was $0 million in AXU's case. Big 5 Sporting Goods Corporation (NASDAQ:BGFV) is the most popular stock in this table. On the other hand Uxin Limited (NASDAQ:UXIN) is the least popular one with only 3 bullish hedge fund positions. Compared to these stocks Alexco Resource Corp. (NYSE:AXU) is even less popular than UXIN. Our overall hedge fund sentiment score for AXU is 23. Stocks with higher number of hedge fund positions relative to other stocks as well as relative to their historical range receive a higher sentiment score. Hedge funds clearly dropped the ball on AXU as the stock delivered strong returns, though hedge funds' consensus picks still generated respectable returns. Our calculations showed that top 5 most popular stocks among hedge funds returned 95.8% in 2019 and 2020, and outperformed the S&P 500 ETF (SPY) by 40 percentage points. These stocks gained 17.2% in 2021 through June 11th and still beat the market by 3.3 percentage points. A small number of hedge funds were also right about betting on AXU as the stock returned 17.1% since Q1 (through June 11th) and outperformed the market by an even larger margin.
Get real-time email alerts: Follow Alexco Resource Corp (NYSE:AXU)
Disclosure: None. This article was originally published at Insider Monkey.
Related Content
The pandemic is helping to soften the reputation of mining companies, often cast as villains.
Most readers would already know that First Quantum Minerals' (TSE:FM) stock increased by 4.4% over the past three months. Given that the stock prices usually follow long-term business performance, we wonder if the company's mixed financials could have any adverse effect on its current price price movement Particularly, we will be paying attention to First Quantum Minerals' ROE today.
Return on Equity or ROE is a test of how effectively a company is growing its value and managing investors’ money. Simply put, it is used to assess the profitability of a company in relation to its equity capital.
Check out our latest analysis for First Quantum Minerals
How Is ROE Calculated?
ROE can be calculated by using the formula:
Return on Equity = Net Profit (from continuing operations) ÷ Shareholders' Equity
So, based on the above formula, the ROE for First Quantum Minerals is:
0.6% = US$65m ÷ US$10b (Based on the trailing twelve months to March 2021).
The 'return' is the amount earned after tax over the last twelve months. One way to conceptualize this is that for each CA$1 of shareholders' capital it has, the company made CA$0.01 in profit.
What Is The Relationship Between ROE And Earnings Growth?
Thus far, we have learned that ROE measures how efficiently a company is generating its profits. We now need to evaluate how much profit the company reinvests or "retains" for future growth which then gives us an idea about the growth potential of the company. Assuming all else is equal, companies that have both a higher return on equity and higher profit retention are usually the ones that have a higher growth rate when compared to companies that don't have the same features.
First Quantum Minerals' Earnings Growth And 0.6% ROE
It is quite clear that First Quantum Minerals' ROE is rather low. Even when compared to the industry average of 15%, the ROE figure is pretty disappointing. Given the circumstances, the significant decline in net income by 3.2% seen by First Quantum Minerals over the last five years is not surprising. We believe that there also might be other aspects that are negatively influencing the company's earnings prospects. For example, the business has allocated capital poorly, or that the company has a very high payout ratio.
So, as a next step, we compared First Quantum Minerals' performance against the industry and were disappointed to discover that while the company has been shrinking its earnings, the industry has been growing its earnings at a rate of 29% in the same period.

Earnings growth is an important metric to consider when valuing a stock. What investors need to determine next is if the expected earnings growth, or the lack of it, is already built into the share price. By doing so, they will have an idea if the stock is headed into clear blue waters or if swampy waters await. Is First Quantum Minerals fairly valued compared to other companies? These 3 valuation measures might help you decide.
Is First Quantum Minerals Using Its Retained Earnings Effectively?
When we piece together First Quantum Minerals' low three-year median payout ratio of 1.1% (where it is retaining 99% of its profits), calculated for the last three-year period, we are puzzled by the lack of growth. This typically shouldn't be the case when a company is retaining most of its earnings. It looks like there might be some other reasons to explain the lack in that respect. For example, the business could be in decline.
Moreover, First Quantum Minerals has been paying dividends for at least ten years or more suggesting that management must have perceived that the shareholders prefer dividends over earnings growth. Based on the latest analysts' estimates, we found that the company's future payout ratio over the next three years is expected to hold steady at 1.2%. Regardless, the future ROE for First Quantum Minerals is predicted to rise to 11% despite there being not much change expected in its payout ratio.
Conclusion
On the whole, we feel that the performance shown by First Quantum Minerals can be open to many interpretations. While the company does have a high rate of reinvestment, the low ROE means that all that reinvestment is not reaping any benefit to its investors, and moreover, its having a negative impact on the earnings growth. That being so, the latest industry analyst forecasts show that the analysts are expecting to see a huge improvement in the company's earnings growth rate. To know more about the company's future earnings growth forecasts take a look at this free report on analyst forecasts for the company to find out more.
This article by Simply Wall St is general in nature. It does not constitute a recommendation to buy or sell any stock, and does not take account of your objectives, or your financial situation. We aim to bring you long-term focused analysis driven by fundamental data. Note that our analysis may not factor in the latest price-sensitive company announcements or qualitative material. Simply Wall St has no position in any stocks mentioned.
Have feedback on this article? Concerned about the content? Get in touch with us directly. Alternatively, email editorial-team (at) simplywallst.com.
We often see insiders buying up shares in companies that perform well over the long term. Unfortunately, there are also plenty of examples of share prices declining precipitously after insiders have sold shares. So we'll take a look at whether insiders have been buying or selling shares in Artemis Resources Limited (ASX:ARV).
What Is Insider Selling?
It's quite normal to see company insiders, such as board members, trading in company stock, from time to time. However, such insiders must disclose their trading activities, and not trade on inside information.
Insider transactions are not the most important thing when it comes to long-term investing. But logic dictates you should pay some attention to whether insiders are buying or selling shares. For example, a Harvard University study found that 'insider purchases earn abnormal returns of more than 6% per year'.
View our latest analysis for Artemis Resources
Artemis Resources Insider Transactions Over The Last Year
In the last twelve months, the biggest single purchase by an insider was when Executive Director Alastair Clayton bought AU$120k worth of shares at a price of AU$0.12 per share. That means that an insider was happy to buy shares at above the current price of AU$0.059. Their view may have changed since then, but at least it shows they felt optimistic at the time. In our view, the price an insider pays for shares is very important. As a general rule, we feel more positive about a stock when an insider has bought shares at above current prices, because that suggests they viewed the stock as good value, even at a higher price. The only individual insider to buy over the last year was Alastair Clayton.
Alastair Clayton bought a total of 2.00m shares over the year at an average price of AU$0.10. The chart below shows insider transactions (by companies and individuals) over the last year. If you click on the chart, you can see all the individual transactions, including the share price, individual, and the date!

There are plenty of other companies that have insiders buying up shares. You probably do not want to miss this free list of growing companies that insiders are buying.
Does Artemis Resources Boast High Insider Ownership?
Looking at the total insider shareholdings in a company can help to inform your view of whether they are well aligned with common shareholders. I reckon it's a good sign if insiders own a significant number of shares in the company. Our data indicates that Artemis Resources insiders own about AU$4.4m worth of shares (which is 5.9% of the company). But they may have an indirect interest through a corporate structure that we haven't picked up on. We do generally prefer see higher levels of insider ownership.
What Might The Insider Transactions At Artemis Resources Tell Us?
Our data shows a little insider buying, but no selling, in the last three months. That said, the purchases were not large. But insiders have shown more of an appetite for the stock, over the last year. We'd like to see bigger individual holdings. However, we don't see anything to make us think Artemis Resources insiders are doubting the company. In addition to knowing about insider transactions going on, it's beneficial to identify the risks facing Artemis Resources. Our analysis shows 6 warning signs for Artemis Resources (2 are concerning!) and we strongly recommend you look at them before investing.
But note: Artemis Resources may not be the best stock to buy. So take a peek at this free list of interesting companies with high ROE and low debt.
For the purposes of this article, insiders are those individuals who report their transactions to the relevant regulatory body. We currently account for open market transactions and private dispositions, but not derivative transactions.
This article by Simply Wall St is general in nature. It does not constitute a recommendation to buy or sell any stock, and does not take account of your objectives, or your financial situation. We aim to bring you long-term focused analysis driven by fundamental data. Note that our analysis may not factor in the latest price-sensitive company announcements or qualitative material. Simply Wall St has no position in any stocks mentioned.
Have feedback on this article? Concerned about the content? Get in touch with us directly. Alternatively, email editorial-team (at) simplywallst.com.
QUÉBEC CITY, June 11, 2021 (GLOBE NEWSWIRE) — Stelmine Canada (STH-TSXV) (“Stelmine” or the “Company”) is pleased to announce that it has closed its recently announced non-brokered private placement (the “Offering”). A total of 5,384,614 units of Stelmine (the "Units") were issued at a price of $0.13 per unit for gross proceeds of $700,000. Each Unit comprised one common share of Stelmine and one-half of a common share purchase warrant. Each full warrant entitles the holder to acquire one common share of the Company at $0.20 for a period of 36 months from issuance. The warrants are callable from Stelmine should the common shares of the company exceed $0.30 for a period of 20 consecutive trading days following the four-month hold.
Three (3) insiders of the Company participated in the private placement for aggregate gross proceeds of $16,750. These insiders purchased Units under the same terms as the other investors. The participation of these insiders is exempt from the formal valuation and shareholder approval requirements pursuant to Sections 5.5(a) and 5.7(1)(a) of Multilateral Instrument 61-101 – Protection of Minority Security Holders in Special Transactions, on the basis that the fair market value of such participation or the consideration paid by such insiders does not exceed 25% of the market capitalization of the Company.
All securities issued in connection with this Offering are subject to a hold period of four months and one day. The private placement is subject to the approval of the TSX Venture Exchange. Stelmine has not filed a material change report in the 21 days preceding the placement other than in relation to the placement.
Stelmine has now raised total gross proceeds of $1.4 million this month in two separate financings with strategic investors. The funds will be used for exploration on the Courcy and Mercator Projects in the Caniapiscau region and for general working capital purposes. In connection with this placement, the Company will pay finder’s fees of $23,244.
About Stelmine Canada
Stelmine is a junior mining exploration company pioneering a new gold district (Caniapiscau) east of James Bay in the under-explored eastern part of the Opinaca metasedimentary basin where the geological context has similarities to the Eleonore mine. Stelmine has 100% ownership of 1,574 claims or 815 km² in this part of northern Quebec, highlighted by the Courcy and Mercator Projects.
Forward-looking statements
Certain information in this press release may contain forward-looking statements, such as statements regarding the expected closing of and the anticipated use of the proceeds from the Offering, acquisition and expansion plans, availability of quality acquisition opportunities, and growth of the Company. This information is based on current expectations and assumptions (including assumptions in connection with obtaining all necessary approvals for the Offering and general economic and market conditions) that are subject to significant risks and uncertainties that are difficult to predict. Actual results might differ materially from results suggested in any forward-looking statements. Risks that could cause results to differ from those stated in the forward-looking statements in this release include those relating to the ability to complete the Offering on the terms described above. The Company assumes no obligation to update the forward-looking statements, or to update the reasons why actual results could differ from those reflected in the forward-looking statements unless and until required by securities laws applicable to the Company. Additional information identifying risks and uncertainties is contained in the Company’s filings with the Canadian securities regulators, which filings are available at www.sedar.com.
Cautionary statement
Neither TSX Venture Exchange nor its Regulation Services Provider (as that term is defined in the policies of the TSX Venture Exchange) accepts responsibility for the adequacy or accuracy of this release.
NOT FOR DISSEMINATION IN THE UNITED STATES OR FOR DISTRIBUTION TO U.S. NEWSWIRE SERVICES AND DOES NOT CONSTITUTE AN OFFER OF THE SECURITIES DESCRIBED HEREIN
For further information, contact:
Isabelle Proulx, President and CEO
Email: iproulx@stelmine.com
Tel: 418-626-6333
Follow us on:
Website : https://stelmine.com/en/
Twitter : https://twitter.com/Stelmine1
LinkedIn : http://www.linkedin.com/company/stelmine-canada-ltd
Facebook: https://www.facebook.com/StelmineCanada/
Resource stocks were driving the FTSE 100 to gains on Friday, lifting the index back toward levels not seen since before the COVID-19 pandemic.
TORONTO, June 11, 2021 /CNW/ – Laurion Mineral Exploration Inc. (TSXV: LME) (OTCPINK: LMEFF) ("LAURION" or the "Corporation") will host its annual and special meeting of shareholders (the "Meeting") on Tuesday, July 6, 2021 at 11:00 a.m. (Eastern time). Out of an abundance of caution, to proactively address potential issues arising from the ongoing public health impact of COVID-19 while enabling greater participation of LAURION's shareholders, the Meeting will take place in a virtual-only format.
The Meeting will allow shareholders to listen to the proceedings and submit votes through the web-based platform. Details for shareholders and interested parties in attending the virtual meeting are found below. Participants are encouraged to login in approximately 15 minutes prior to the start time.
Date: Tuesday, July 6, 2021
Time: 11:00 a.m. Eastern Time
Meeting ID: 1164
URL: https://virtual-meetings.tsxtrust.com/en
Password: laurion2021 (case sensitive)
Instructions for joining the Meeting:
-
Type in https://virtual-meetings.tsxtrust.com/en/1164 on your browser at least 15 minutes before the Meeting starts. Please do not do a Google search. Do not use Internet Explorer.
-
Click on "I am a Guest" if you are an interested party or a shareholder not intending to vote.
In order to streamline the virtual meeting process, the Corporation strongly encourages shareholders to vote in advance of the Meeting using the Voting Instruction Form ("VIF") and Form of Proxy for the Meeting, which are available on SEDAR at www.sedar.com and also at https://docs.tsxtrust.com/2025. Proxies must be deposited with the Corporation's transfer agent and registrar, TSX Trust Company ("TSX Trust"), on or before 11:00 a.m. (Eastern time) on July 2, 2021.
Registered shareholders entitled to vote at the Meeting may attend and vote at the Meeting virtually by following the steps set out below:
-
Type in https://virtual-meetings.tsxtrust.com/en/1164 on your browser at least 15 minutes before the Meeting starts.
-
Click on "I have a control number".
-
Enter your 12-digit control number (on your proxy form).
-
Enter the password: laurion2021 (case sensitive).
-
When the ballot is opened, click on the "Voting" icon. To vote, simply select your voting direction from the options shown on screen and click "Submit". A confirmation message will appear to show your vote has been received.
Beneficial Shareholders entitled to vote at the Meeting may vote at the Meeting virtually by following the steps set out below:
-
Appoint yourself as proxyholder by writing your name in the space provided on the form of proxy or VIF.
-
Sign and send it to your intermediary, following the voting deadline and submission instructions on the VIF.
-
Obtain a control number by contacting TSX Trust by emailing tsxtrustproxyvoting@tmx.com the "Request for Control Number" form, which can be found here https://tsxtrust.com/resource/en/75.
-
Type in https://virtual-meetings.tsxtrust.com/en/1164 on your browser at least 15 minutes before the Meeting starts.
-
Click on "I have a control number".
-
Enter the control number provided by tsxtrustproxyvoting@tmx.com
-
Enter the password: laurion2021 (case sensitive).
-
When the ballot is opened, click on the "Voting" icon. To vote, simply select your voting direction from the options shown on screen and click Submit. A confirmation message will appear to show your vote has been received.
If you are a registered shareholder and you want to appoint someone else (other than the management nominees) to vote online at the Meeting, you must first submit your proxy indicating who you are appointing. You or your appointee must then register with TSX Trust in advance of the Meeting by emailing tsxtrustproxyvoting@tmx.com the "Request for Control Number" form, which can be found at https://tsxtrust.com/resource/en/75.
If you are a non-registered shareholder and want to vote online at the Meeting, you must appoint yourself as proxyholder and register with TSX Trust in advance of the Meeting by emailing tsxtrustproxyvoting@tmx.com the "Request for Control Number" form, which can be found at https://tsxtrust.com/resource/en/75.
Shareholders who have any questions or require further information with regard to voting their shares or attending the Meeting should contact TSX Trust, toll-free in North America at 1-866-600-5869 or by email at tmxeinvestorservices@tmx.com.
Further information related to the Meeting, including the matters to be voted on and how to attend the Meeting and vote, is set forth in the Corporation's management information circular dated May 27, 2021, which is available under LAURION's SEDAR profile at www.sedar.com.
About LAURION Mineral Exploration Inc.
The Corporation is a junior mineral exploration and development company listed on the TSXV under the symbol LME and on the OTCPINK under the symbol LMEFF. LAURION now has 228,052,731 outstanding shares of which approximately 79% are owned and controlled by Insiders who are eligible investors under the "Friends and Family" categories.
LAURION's emphasis is on the development of its flagship project, the 100% owned mid-stage 47 km2 Ishkoday Project, and its gold-silver and gold-rich polymetallic mineralization with a significant upside potential. The mineralization on Ishkoday is open at depth beyond the current core-drilling limit of -200 m from surface, based on the historical mining to a -685 m depth, in the past producing Sturgeon River Mine. The recently acquired Brenbar Property, which is contiguous with the Ishkoday Property, hosts the historic Brenbar Mine and LAURION believes the mineralization to be a direct extension of mineralization from the Ishkoday Property.
Follow us on Twitter: @LAURION_LME
Caution Regarding Forward-Looking Information
This press release contains forward-looking statements, which reflect the Corporation's current expectations regarding future events, including with respect to management's anticipated timing, format and conduct of the Meeting, LAURION's business, operations and condition, and management's objectives, strategies, beliefs and intentions. The forward-looking statements involve risks and uncertainties. Actual events and future results, performance or achievements expressed or implied by such forward-looking statements could differ materially from those projected herein including as a result of the interpretation and actual results of current exploration activities, changes in project parameters as plans continue to be refined, future prices of gold and/or other metals, possible variations in grade or recovery rates, failure of equipment or processes to operate as anticipated, the failure of contracted parties to perform, labor disputes and other risks of the mining industry, delays in obtaining governmental approvals or financing or in the completion of exploration, as well as those factors disclosed in the Corporation's publicly filed documents. Investors should consult the Corporation's ongoing quarterly and annual filings, as well as any other additional documentation comprising the Corporation's public disclosure record, for additional information on risks and uncertainties relating to these forward-looking statements. The reader is cautioned not to rely on these forward-looking statements. Subject to applicable law, the Corporation disclaims any obligation to update these forward-looking statements.
NEITHER THE TSX VENTURE EXCHANGE NOR ITS REGULATION SERVICE PROVIDER (AS THAT TERM IS DEFINED IN THE POLICIES OF THE TSX VENTURE EXCHANGE) ACCEPTS RESPONSIBILITY FOR THE ADEQUACY OR ACCURACY OF THE CONTENT OF THIS NEWS RELEASE.
SOURCE Laurion Mineral Exploration Inc.

View original content: http://www.newswire.ca/en/releases/archive/June2021/11/c4189.html
Under the guidance of CEO Diana Hu, Eastern Platinum Limited (TSE:ELR) has performed reasonably well recently. In light of this performance, CEO compensation will probably not be the main focus for shareholders as they go into the AGM on 17 June 2021. However, some shareholders will still be cautious of paying the CEO excessively.
Check out our latest analysis for Eastern Platinum
Comparing Eastern Platinum Limited's CEO Compensation With the industry
According to our data, Eastern Platinum Limited has a market capitalization of CA$49m, and paid its CEO total annual compensation worth US$393k over the year to December 2020. We note that's an increase of 26% above last year. In particular, the salary of US$288.4k, makes up a huge portion of the total compensation being paid to the CEO.
For comparison, other companies in the industry with market capitalizations below CA$242m, reported a median total CEO compensation of US$124k. This suggests that Diana Hu is paid more than the median for the industry.
|
Component |
2020 |
2019 |
Proportion (2020) |
|
Salary |
US$288k |
US$280k |
73% |
|
Other |
US$105k |
US$31k |
27% |
|
Total Compensation |
US$393k |
US$311k |
100% |
Speaking on an industry level, nearly 93% of total compensation represents salary, while the remainder of 7% is other remuneration. In Eastern Platinum's case, non-salary compensation represents a greater slice of total remuneration, in comparison to the broader industry. If total compensation veers towards salary, it suggests that the variable portion – which is generally tied to performance, is lower.

A Look at Eastern Platinum Limited's Growth Numbers
Eastern Platinum Limited has seen its earnings per share (EPS) increase by 24% a year over the past three years. It achieved revenue growth of 22% over the last year.
Overall this is a positive result for shareholders, showing that the company has improved in recent years. It's also good to see decent revenue growth in the last year, suggesting the business is healthy and growing. We don't have analyst forecasts, but you could get a better understanding of its growth by checking out this more detailed historical graph of earnings, revenue and cash flow.
Has Eastern Platinum Limited Been A Good Investment?
With a total shareholder return of 13% over three years, Eastern Platinum Limited shareholders would, in general, be reasonably content. But they would probably prefer not to see CEO compensation far in excess of the median.
To Conclude…
Given that the company's overall performance has been reasonable, the CEO remuneration policy might not be shareholders' central point of focus in the upcoming AGM. However, any decision to raise CEO pay might be met with some objections from the shareholders given that the CEO is already paid higher than the industry average.
CEO pay is simply one of the many factors that need to be considered while examining business performance. That's why we did our research, and identified 3 warning signs for Eastern Platinum (of which 1 is a bit concerning!) that you should know about in order to have a holistic understanding of the stock.
Switching gears from Eastern Platinum, if you're hunting for a pristine balance sheet and premium returns, this free list of high return, low debt companies is a great place to look.
This article by Simply Wall St is general in nature. It does not constitute a recommendation to buy or sell any stock, and does not take account of your objectives, or your financial situation. We aim to bring you long-term focused analysis driven by fundamental data. Note that our analysis may not factor in the latest price-sensitive company announcements or qualitative material. Simply Wall St has no position in any stocks mentioned.
Have feedback on this article? Concerned about the content? Get in touch with us directly. Alternatively, email editorial-team (at) simplywallst.com.
(Bloomberg) — BHP Group averted a strike at its second-largest copper mine in Chile after workers at the Spence operation accepted a final wage offer on the last day of mediated talks.
The deal will ease concerns over a potential stoppage that would have further tightened global supplies of the metal. It comes after staff at a BHP operations center in Santiago ended a strike and returned to work this week. Attention will now shift to wage talks at BHP’s giant Escondida mine.
About 92% of the 1,079 Spence operations and maintenance staff who voted accepted terms of the new three-year contract, according to a document provided by the union. Workers had rejected a previous proposal and BHP sought mediation that was extended through Thursday.
“In these times, the deal we reached is an important signal of how we should face Spence’s current and future challenges,” said Ana Zuniga, a spokesperson for BHP’s Pampa Norte, which comprises Spence and the Cerro Colorado mines.
Workers are “calm and glad” with a package that includes a 2% wage increase and a 15.5 million-peso ($21,600) bonus, as well as new benefits and other adjustments, Union President Ronald Salcedo said.
Surging copper prices and company profits are emboldening unions whose members have continued to work through the pandemic. On the other side, producers are looking to contain labor costs as inflation picks up, ore quality deteriorates and and host nations look for a bigger share of the windfall.
Still, the wage deal at Spence may bode well for collective bargaining that just kicked off at Escondida, the world’s largest copper mine that endured a 44-day strike in 2017. Wage talks in the top copper-producing nation add to supply risks at a time when recovering demand is tightening the global market.
BHP recently invested about $2.5 billion in upgrades at Spence, including a new concentrator, with the Pampa Norte division expected to produce 240,000-270,000 tons in fiscal year 2021, compared with 243,000 tons last year.
(Adds company comment and details on Spence.)
More stories like this are available on bloomberg.com
Subscribe now to stay ahead with the most trusted business news source.
©2021 Bloomberg L.P.
Mining stocks steamed ahead on Friday, helping the FTSE 100 (^FTSE) to push to its highest level in a month.
Glencore (GLEN.L) rose more than 3%, Antofagasta (ANTO.L) climbed 2.5% higher and Evraz (EVR.L) was up 2.7% in noon trade, lifting London’s benchmark index to its highest since 10 May, when it touched a new record level since the pandemic began.
Newly-listed Thungela Resources (TGA.L), a spin-off from Anglo American (AAL.L) also pushed 2.4% higher on the day, while healthcare stocks also joined the precious metal and base metal miners on the rally.
It came as metal prices and oil prices rose on Friday as the International Energy Agency (IEA) said on Friday oil demand is set to rise above pre-COVID levels by the end of 2022, but that oil producers will need to boost production.
The Paris-based body expects consumption to rebound by 5.4 million barrels per day (bd) this year as vaccines are rolled out and economies reopen. Consumption declined by a record 8.6 million bd in 2020 as the coronavirus pandemic took a hold.
It expects a further 3.1 million bd increase in 2022, to average 99.5 million bd with an increase at the end of the year that will surpass the level of demand before the COVID pandemic.
Countries outside the Organisation of Petroleum Exporting Countries and its allies (OPEC+) group are expected to boost output by 1.6 million bd next year, to exceed 2019 levels.
While, OPEC+ countries will have 6.9 million bd of spare capacity even after lifting production by 2 million bd over the May-July period.
Read more: Oil demand will exceed pre-COVID levels by end of 2022
London miners were also boosted by reports that the UK economy grew 2.3% in April, the fastest rise since July 2020.
The figure, which follows strong growth of 2.1% in March, was slightly above Reuters poll consensus for a 2.2% increase as non-essential shops and outdoor hospitality reopened to the public after months of lockdown.
The services sector provided the biggest boost to the British economy, with output growing 3.4% during the month.
However overall output remains 3.7% below the pre-pandemic levels seen in February last year. Output in the production sector fell by 1.3% in April 2021, the first fall since January 2021 as three of the four sectors contracted.
Watch: Could mining make a comeback in Cornwall?
Vancouver, British Columbia–(Newsfile Corp. – June 11, 2021) – Pure Energy Minerals (TSXV: PE) (OTCQB: PEMIF) (the "Company" or "Pure Energy") is pleased to provide an important release by Schlumberger, the Company's strategic investor at Pure Energy's Clayton Valley Project in Esmeralda County, Nevada, where Schlumberger's plans are underway to construct a pilot plant for innovative lithium brine extraction. The following news was released by Schlumberger on June 10, 2021.
"HOUSTON, June 10, 2021- Schlumberger New Energy, and Panasonic Energy of North America, a division of Panasonic Corporation of North America, have announced a collaboration agreement for the validation and optimization of the innovative and sustainable lithium extraction and production process to be used by Schlumberger New Energy at its NeoLith Energy pilot plant in Nevada. This collaboration paves the way for improved lithium production solutions that will help meet the expected surge in demand for lithium as the electric vehicle (EV) market takes off worldwide.
NeoLith Energy's sustainable approach uses a differentiated direct lithium extraction (DLE) process to produce high-purity, battery-grade lithium material while reducing the production time from over a year to weeks. The unique process is in sharp contrast to conventional evaporative methods of extracting lithium, with a significantly reduced groundwater and physical footprint. Panasonic will provide their guidance to validate and optimize the lithium material for battery-grade consumption. Situated in Clayton Valley, Nevada, the pilot plant is just 200 miles from Panasonic's large-scale advanced battery manufacturing operation, Panasonic Energy of North America, in Sparks, Nevada.
As a global technology company and leader in lithium-ion batteries, Panasonic has a proven track record in innovation and advanced products and solutions that power the automotive industry. Demand for battery-grade lithium is projected to grow exponentially over the next decade. As EVs greatly depend on lithium-ion rechargeable batteries, sustainable and efficient lithium production has become an important topic for regions, industries and technology companies, as well as battery and large automotive manufacturers. While the lithium industry is expected to attract large investments, the time-to-first-lithium-production for new development projects and regions will be critical for the industry to meet the surge in demand.
"Panasonic has a longstanding commitment to contributing to society and increasing sustainability in the supply chain as we work to produce the world's safest, highest quality and most affordable batteries is a critical priority," said Allan Swan, president of Panasonic Energy of North America. "We look forward to working with Schlumberger New Energy to help achieve our vision of advancing the lithium-ion battery space and accelerating to a clean energy society."
"Panasonic is a pioneer in electric vehicle battery technology, and we are excited to collaborate with them in developing our differentiated direct lithium extraction and production process," said Ashok Belani, executive vice president Schlumberger New Energy. "We are committed to expanding the global supply chain for advanced lithium compounds to support the forecasted surge in demand and enable new opportunities for lithium production globally."
NeoLith Energy's objective will be to pump brine from the subsurface, extract greater than 90% of the dissolved lithium, and pump more than 85% of the brine back to the subsurface in an environmentally safe manner. In addition to maximizing the reinjection of the brine, the ultimate goal is to eliminate the need for any fresh water from an external source and reduce the environmental impact.
Together, Panasonic and Schlumberger New Energy aim to accelerate the development and implementation of an innovative lithium production process, with a commitment to economical, environmental and responsible extraction to empower the world's transition to new energy sources.
About Schlumberger New Energy
Schlumberger is the world's leading provider of technology to the global energy industry. Schlumberger New Energy explores new avenues of growth by leveraging Schlumberger's intellectual and business capital in emerging new energy markets, with a focus on low-carbon and carbon-neutral energy technologies. Its activities include ventures in the domains of hydrogen, lithium, carbon capture and sequestration, geothermal power and geoenergy for heating and cooling buildings.
Learn more about Schlumberger New Energy: newenergy.slb.com
About Panasonic
Panasonic Corporation is a global leader developing innovative technologies and solutions for wide-ranging applications in the consumer electronics, housing, automotive, and B2B sectors. The company, which celebrated its 100th anniversary in 2018, operates 522 subsidiaries and 69 associated companies worldwide and reported consolidated net sales of 6,698.8 billion yen for the year ended March 31, 2021. Committed to pursuing new value through collaborative innovation, the company uses its technologies to create a better life and a better world for customers.
Cautionary Statement Regarding Forward-Looking Statements
This press release contains "forward-looking statements" within the meaning of the U.S. federal securities laws – that is, statements about the future, not about past events. Such statements often contain words such as "expect," "may," "believe," "plan," "can," "estimate," "intend," "anticipate," "should," "could," "will," "likely," "goal," "objective," "potential," "projected" and other similar words. Forward-looking statements address matters that are, to varying degrees, uncertain, such as projected demand growth for battery-grade lithium and EVs; forecasts or expectations regarding the development of, or anticipated benefits of, NeoLith Energy's process and other Schlumberger New Energy initiatives; and other forecasts or expectations regarding the energy transition and global climate change. These statements are subject to risks and uncertainties, including, but not limited to, the inability to recognize intended benefits from Schlumberger New Energy strategies, initiatives or partnerships; legislative and regulatory initiatives addressing environmental concerns, including initiatives addressing the impact of global climate change; and other risks and uncertainties detailed in the companies' public filings, including Schlumberger's most recent Forms 10-K, 10-Q and 8-K filed with or furnished to the U.S. Securities and Exchange Commission. If one or more of these or other risks or uncertainties materialize (or the consequences of such a development changes), or should underlying assumptions prove incorrect, actual outcomes may vary materially from those reflected in our forward-looking statements. The forward-looking statements speak only as of the date of this press release, the parties disclaim any intention or obligation to update publicly or revise such statements, whether as a result of new information, future events or otherwise. "
About Pure Energy Minerals
Pure Energy Minerals is a lithium resource developer that is driven to become a low-cost supplier for the growing lithium battery industry. Pure Energy has consolidated a pre-eminent land position at its Clayton Valley ("CV") Project in the Clayton Valley of central Nevada for the exploration and development of lithium resources, comprising 950 claims over 23,360 acres (9,450 hectares), representing the largest mineral land holdings in the valley. Pure Energy's Clayton Valley Project adjoins and surrounds on three sides the Silver Peak lithium brine mine operated by Albemarle Corporation. Drilling of bore holes CV-01 through CV-08 were completed together with a revised mineral resource and a Preliminary Economic Assessment ("PEA") for the Clayton Valley Project (news releases of June 26, 2017 and April 5, 2018).
Pure Energy's strategic investor, Schlumberger Technology Corp. ("SLB"), is the operator of the Clayton Valley Project. On May 29, 2019, Pure Energy and SLB signed an Earn-In agreement over the CV Project which requires significant investment by SLB at the Project, to include the design and construction of a pilot plant capable of processing lithium-bearing brines for high-quality lithium hydroxide monohydrate ("lithium hydroxide" or "LiOH∙H2O") and/or lithium carbonate products at a specified rate. SLB plans to utilize both in-house and commercially available technology in the design of the CV pilot plant. SLB's costs, technical parameters and ultimate technology are anticipated to differ from the published PEA. For further details regarding SLB's earn-in, please refer to Pure Energy's Annual General and Special Meeting Management Information Circular dated April 4, 2019, available on SEDAR.com.
On January 3, 2019, the Nevada Division of Water Resources ("NDWR") approved and granted a Finite Term Water Right to Pure Energy, through its wholly-owned subsidiary Esmeralda Minerals LLC, for the extraction of up to 50 acre-feet of water during a 5-year period from the CV properties. This water right is deemed sufficient for brine testing requirements and SLB's future pilot plant facility. In July of 2020, the CV-09 well was completed and results were published by Pure Energy on October 14, 2020.
On behalf of the Board of Directors,
"Mary L. Little"
Director, Pure Energy Minerals Ltd.
CONTACT:
Pure Energy Minerals Limited (www.pureenergyminerals.com)
Email: info@pureenergyminerals.com
Telephone – 604 608 6611
Cautionary Statements and Forward-Looking Information
The information in this news release contains forward looking statements that are subject to a number of known and unknown risks, uncertainties and other factors that may cause actual results to differ materially from those anticipated in our forward-looking statements. Factors that could cause such differences include: changes in world commodity markets, equity markets, costs and supply of materials relevant to the mining industry, change in government and changes to regulations affecting the mining industry. Forward-looking statements in this release may include future exploration and development on the CV Project. Although we believe the expectations reflected in our forward-looking statements are reasonable, results may vary, and we cannot guarantee future results, levels of activity, performance or achievements.
The Company does not undertake to update any forward-looking information, except as required by applicable laws.
Neither TSX Venture Exchange nor its Regulation Services Provider (as that term is defined in the policies of TSX Venture Exchange) accepts responsibility for the adequacy or accuracy of this release.

To view the source version of this press release, please visit https://www.newsfilecorp.com/release/87286
Even when a business is losing money, it's possible for shareholders to make money if they buy a good business at the right price. Indeed, Foran Mining (CVE:FOM) stock is up 1,700% in the last year, providing strong gains for shareholders. But the harsh reality is that very many loss making companies burn through all their cash and go bankrupt.
So notwithstanding the buoyant share price, we think it's well worth asking whether Foran Mining's cash burn is too risky. In this article, we define cash burn as its annual (negative) free cash flow, which is the amount of money a company spends each year to fund its growth. We'll start by comparing its cash burn with its cash reserves in order to calculate its cash runway.
View our latest analysis for Foran Mining
When Might Foran Mining Run Out Of Money?
A company's cash runway is the amount of time it would take to burn through its cash reserves at its current cash burn rate. As at March 2021, Foran Mining had cash of CA$21m and such minimal debt that we can ignore it for the purposes of this analysis. Importantly, its cash burn was CA$4.7m over the trailing twelve months. So it had a cash runway of about 4.4 years from March 2021. Importantly, analysts think that Foran Mining will reach cashflow breakeven in 4 years. That means it doesn't have a great deal of breathing room, but it shouldn't really need more cash, considering that cash burn should be continually reducing. Depicted below, you can see how its cash holdings have changed over time.

How Is Foran Mining's Cash Burn Changing Over Time?
Foran Mining didn't record any revenue over the last year, indicating that it's an early stage company still developing its business. Nonetheless, we can still examine its cash burn trajectory as part of our assessment of its cash burn situation. Over the last year its cash burn actually increased by 39%, which suggests that management are increasing investment in future growth, but not too quickly. However, the company's true cash runway will therefore be shorter than suggested above, if spending continues to increase. While the past is always worth studying, it is the future that matters most of all. For that reason, it makes a lot of sense to take a look at our analyst forecasts for the company.
Can Foran Mining Raise More Cash Easily?
Given its cash burn trajectory, Foran Mining shareholders may wish to consider how easily it could raise more cash, despite its solid cash runway. Issuing new shares, or taking on debt, are the most common ways for a listed company to raise more money for its business. Many companies end up issuing new shares to fund future growth. By looking at a company's cash burn relative to its market capitalisation, we gain insight on how much shareholders would be diluted if the company needed to raise enough cash to cover another year's cash burn.
Since it has a market capitalisation of CA$423m, Foran Mining's CA$4.7m in cash burn equates to about 1.1% of its market value. That means it could easily issue a few shares to fund more growth, and might well be in a position to borrow cheaply.
How Risky Is Foran Mining's Cash Burn Situation?
It may already be apparent to you that we're relatively comfortable with the way Foran Mining is burning through its cash. For example, we think its cash runway suggests that the company is on a good path. While its increasing cash burn wasn't great, the other factors mentioned in this article more than make up for weakness on that measure. Shareholders can take heart from the fact that analysts are forecasting it will reach breakeven. Looking at all the measures in this article, together, we're not worried about its rate of cash burn; the company seems well on top of its medium-term spending needs. Taking an in-depth view of risks, we've identified 3 warning signs for Foran Mining that you should be aware of before investing.
If you would prefer to check out another company with better fundamentals, then do not miss this free list of interesting companies, that have HIGH return on equity and low debt or this list of stocks which are all forecast to grow.
This article by Simply Wall St is general in nature. It does not constitute a recommendation to buy or sell any stock, and does not take account of your objectives, or your financial situation. We aim to bring you long-term focused analysis driven by fundamental data. Note that our analysis may not factor in the latest price-sensitive company announcements or qualitative material. Simply Wall St has no position in any stocks mentioned.
Have feedback on this article? Concerned about the content? Get in touch with us directly. Alternatively, email editorial-team (at) simplywallst.com.
We can readily understand why investors are attracted to unprofitable companies. By way of example, DevEx Resources (ASX:DEV) has seen its share price rise 343% over the last year, delighting many shareholders. Having said that, unprofitable companies are risky because they could potentially burn through all their cash and become distressed.
Given its strong share price performance, we think it's worthwhile for DevEx Resources shareholders to consider whether its cash burn is concerning. For the purpose of this article, we'll define cash burn as the amount of cash the company is spending each year to fund its growth (also called its negative free cash flow). First, we'll determine its cash runway by comparing its cash burn with its cash reserves.
See our latest analysis for DevEx Resources
Does DevEx Resources Have A Long Cash Runway?
A cash runway is defined as the length of time it would take a company to run out of money if it kept spending at its current rate of cash burn. In December 2020, DevEx Resources had AU$12m in cash, and was debt-free. Importantly, its cash burn was AU$4.6m over the trailing twelve months. That means it had a cash runway of about 2.6 years as of December 2020. That's decent, giving the company a couple years to develop its business. The image below shows how its cash balance has been changing over the last few years.

How Is DevEx Resources' Cash Burn Changing Over Time?
DevEx Resources didn't record any revenue over the last year, indicating that it's an early stage company still developing its business. Nonetheless, we can still examine its cash burn trajectory as part of our assessment of its cash burn situation. Over the last year its cash burn actually increased by a very significant 55%. Oftentimes, increased cash burn simply means a company is accelerating its business development, but one should always be mindful that this causes the cash runway to shrink. DevEx Resources makes us a little nervous due to its lack of substantial operating revenue. We prefer most of the stocks on this list of stocks that analysts expect to grow.
How Hard Would It Be For DevEx Resources To Raise More Cash For Growth?
While DevEx Resources does have a solid cash runway, its cash burn trajectory may have some shareholders thinking ahead to when the company may need to raise more cash. Companies can raise capital through either debt or equity. Many companies end up issuing new shares to fund future growth. By looking at a company's cash burn relative to its market capitalisation, we gain insight on how much shareholders would be diluted if the company needed to raise enough cash to cover another year's cash burn.
Since it has a market capitalisation of AU$143m, DevEx Resources' AU$4.6m in cash burn equates to about 3.2% of its market value. That's a low proportion, so we figure the company would be able to raise more cash to fund growth, with a little dilution, or even to simply borrow some money.
So, Should We Worry About DevEx Resources' Cash Burn?
As you can probably tell by now, we're not too worried about DevEx Resources' cash burn. In particular, we think its cash burn relative to its market cap stands out as evidence that the company is well on top of its spending. While its increasing cash burn wasn't great, the other factors mentioned in this article more than make up for weakness on that measure. After taking into account the various metrics mentioned in this report, we're pretty comfortable with how the company is spending its cash, as it seems on track to meet its needs over the medium term. Taking a deeper dive, we've spotted 3 warning signs for DevEx Resources you should be aware of, and 2 of them can't be ignored.
Of course, you might find a fantastic investment by looking elsewhere. So take a peek at this free list of companies insiders are buying, and this list of stocks growth stocks (according to analyst forecasts)
This article by Simply Wall St is general in nature. It does not constitute a recommendation to buy or sell any stock, and does not take account of your objectives, or your financial situation. We aim to bring you long-term focused analysis driven by fundamental data. Note that our analysis may not factor in the latest price-sensitive company announcements or qualitative material. Simply Wall St has no position in any stocks mentioned.
Have feedback on this article? Concerned about the content? Get in touch with us directly. Alternatively, email editorial-team (at) simplywallst.com.
The WisdomTree International Hedged Quality Dividend Growth ETF (IHDG) made its debut on 05/07/2014, and is a smart beta exchange traded fund that provides broad exposure to the Broad Developed World ETFs category of the market.
What Are Smart Beta ETFs?
Market cap weighted indexes were created to reflect the market, or a specific segment of the market, and the ETF industry has traditionally been dominated by products based on this strategy.
A good option for investors who believe in market efficiency, market cap weighted indexes offer a low-cost, convenient, and transparent way of replicating market returns.
On the other hand, some investors who believe that it is possible to beat the market by superior stock selection opt to invest in another class of funds that track non-cap weighted strategies–popularly known as smart beta.
Non-cap weighted indexes try to choose stocks that have a better chance of risk-return performance, which is based on specific fundamental characteristics, or a mix of other such characteristics.
The smart beta space gives investors many different choices, from equal-weighting, one of the simplest strategies, to more complicated ones like fundamental and volatility/momentum based weighting. However, not all of these methodologies have been able to deliver remarkable returns.
Fund Sponsor & Index
IHDG is managed by Wisdomtree, and this fund has amassed over $996.37 million, which makes it one of the larger ETFs in the Broad Developed World ETFs. This particular fund seeks to match the performance of the WisdomTree International Hedged Quality Dividend Growth Index before fees and expenses.
The WisdomTree International Hedged Quality Dividend Growth Index is designed to provide exposure to the developed market companies while at the same time neutralizing exposure to fluctuations between the value of foreign currencies and the U.S. dollar.
Cost & Other Expenses
Since cheaper funds tend to produce better results than more expensive funds, assuming all other factors remain equal, it is important for investors to pay attention to an ETF's expense ratio.
Operating expenses on an annual basis are 0.58% for this ETF, which makes it one of the more expensive products in the space.
It has a 12-month trailing dividend yield of 2.13%.
Sector Exposure and Top Holdings
Most ETFs are very transparent products, and disclose their holdings on a daily basis. ETFs also offer diversified exposure, which minimizes single stock risk, though it's still important for investors to research a fund's holdings.
When you look at individual holdings, Rio Tinto Plc (RIO) accounts for about 6.49% of the fund's total assets, followed by Bhp Group Ltd (BHP) and Unilever Plc (ULVR).
IHDG's top 10 holdings account for about 42.88% of its total assets under management.
Performance and Risk
The ETF has added roughly 11.19% so far this year and it's up approximately 27.24% in the last one year (as of 06/11/2021). In the past 52-week period, it has traded between $34.53 and $43.99.
The ETF has a beta of 0.70 and standard deviation of 19.26% for the trailing three-year period, making it a medium risk choice in the space. With about 398 holdings, it effectively diversifies company-specific risk.
Alternatives
WisdomTree International Hedged Quality Dividend Growth ETF is not a suitable option for investors seeking to outperform the Broad Developed World ETFs segment of the market. Instead, there are other ETFs in the space which investors should consider.
IShares Core Dividend Growth ETF (DGRO) tracks Morningstar US Dividend Growth Index and the Vanguard Dividend Appreciation ETF (VIG) tracks NASDAQ US Dividend Achievers Select Index. IShares Core Dividend Growth ETF has $19.02 billion in assets, Vanguard Dividend Appreciation ETF has $59.51 billion. DGRO has an expense ratio of 0.08% and VIG charges 0.06%.
Investors looking for cheaper and lower-risk options should consider traditional market cap weighted ETFs that aim to match the returns of the Broad Developed World ETFs.
Bottom Line
To learn more about this product and other ETFs, screen for products that match your investment objectives and read articles on latest developments in the ETF investing universe, please visit Zacks ETF Center.
Want the latest recommendations from Zacks Investment Research? Today, you can download 7 Best Stocks for the Next 30 Days. Click to get this free report
WisdomTree International Hedged Quality Dividend Growth ETF (IHDG): ETF Research Reports
BHP Group Limited Sponsored ADR (BHP) : Free Stock Analysis Report
Rio Tinto PLC (RIO) : Free Stock Analysis Report
Vanguard Dividend Appreciation ETF (VIG): ETF Research Reports
iShares Core Dividend Growth ETF (DGRO): ETF Research Reports
To read this article on Zacks.com click here.
If you would like to receive our free newsletter via email, simply enter your email address below & click subscribe.
 Follow us on Twitter
 Become our facebook fan
CONNECT WITH US
Tweets
Tweet with hash tag #miningfeeds or @miningfeeds and your tweets will be displayed across this site.
MOST ACTIVE MINING STOCKS
Daily Gainers
 Lincoln Minerals Limited Lincoln Minerals Limited |
LML.AX | +125.00% |
| Golden Cross Resources Ltd. |
GCR.AX | +33.33% |
 Casa Minerals Inc. Casa Minerals Inc. |
CASA.V | +30.00% |
| Athena Resources Ltd. |
AHN.AX | +22.22% |
| Adavale Resources Limited |
ADD.AX | +22.22% |
| Azimut Exploration Inc. |
AZM.V | +21.98% |
| New Stratus Energy Inc. |
NSE.V | +21.05% |
| Dynasty Gold Corp. |
DYG.V | +18.42% |
| Azincourt Energy Corp. |
AAZ.V | +18.18% |
| Gladiator Resources Limited |
GLA.AX | +17.65% |