
Gold’s incredible strength this summer is very unusual, as early summers are the weakest times of the year seasonally for gold, silver, and their miners’ stocks. With traders’ attention diverted to vacations and summer fun, interest in and demand for precious metals normally wane. So this entire sector tends to suffer a seasonal lull, along with the general markets. This June’s bull-market breakout is a momentous anomaly.
This doldrums term is very apt for gold’s usual summer predicament. It describes a zone in the world’s oceans surrounding the equator. There hot air is constantly rising, creating long-lived low-pressure areas. They are often calm, with little or no prevailing winds. History is full of accounts of sailing ships getting trapped in this zone for days or weeks, unable to make headway. The doldrums were murder on ships’ morale.
Crews had no idea when the winds would pick up again, while they continued burning through their limited stores of food and drink. Without moving air, the stifling heat and humidity were suffocating on these ships long before air conditioning. Misery and boredom were extreme, leading to fights breaking out and occasional mutinies. Being trapped in the doldrums was viewed with dread, it was a very trying experience.
Gold investors can somewhat relate. Like clockwork nearly every summer, gold starts drifting listlessly sideways. It often can’t make significant progress no matter what the trends looked like heading into June, July, and August. As the days and weeks slowly pass, sentiment deteriorates markedly. Patience is gradually exhausted, supplanted with deep frustration. Plenty of traders capitulate, abandoning ship.
Thus after decades of trading gold, silver, and their miners’ stocks, I’ve come to call this time of year the summer doldrums. Junes and Julies in particular are usually desolate sentiment wastelands for precious metals, totally devoid of recurring seasonal demand surges. Unlike much of the rest of the year, these summer months simply lack any major income-cycle or cultural drivers of outsized gold investment demand.
The vast majority of the world’s investors and speculators live in the northern hemisphere, so markets take a back seat to the great joys of summer. Traders take advantage of the long sunny days and kids being out of school to go on extended vacations, hang out with friends, and enjoy life. And when they aren’t paying much attention to the markets, naturally they aren’t allocating much new capital to gold.
Given gold’s dull summer action historically, it is never wise to expect too much from it this time of year. Summer rallies can happen, but they aren’t common. So expectations need to be tempered, especially in Junes and Julies. That early-1990s Gin Blossoms song “Hey Jealousy” comes to mind, declaring “If you don’t expect too much from me, you might not be let down.” The markets are ultimately an expectations game.
Quantifying gold’s summer seasonal tendencies during bull markets requires all relevant years’ price action to be recast in perfectly-comparable percentage terms. That is accomplished by individually indexing each calendar year’s gold price to its last close before market summers, which is May’s final trading day. That is set at 100, then all gold-price action each summer is recalculated off that common indexed baseline.
So gold trading at an indexed level of 105 simply means it has rallied 5% from May’s final close, while 95 shows it is down 5%. This methodology renders all bull-market-year gold summers in like terms. That’s necessary since gold’s price range has been so vast, from $257 in April 2001 to $1894 in August 2011. That span encompassed gold’s last secular bull, which enjoyed a colossal 638.2% gain over those 10.4 years!
Obviously 2001 to 2011 were certainly bull years. 2012 was technically one too, despite gold suffering a major correction following that powerful bull run. At worst that year, gold fell 18.8% from its 2011 peak. That was not quite enough to enter formal bear territory at a 20%+ drop. But 2013 to 2015 were definitely brutal bear years, which need to be excluded since gold behaves very differently in bull and bear markets.
In early 2013 the Fed’s wildly-unprecedented open-ended QE3 campaign ramped to full speed, radically distorting the markets. Stock markets levitated on the Fed’s implied backstopping, slaughtering demand for alternative investments led by gold. So in Q2’13 alone, gold plummeted 22.8% which proved its worst quarter in an astounding 93 years! Gold’s bear continued until the Fed started hiking rates again in late 2015.
The day after that first rate hike in 9.5 years in mid-December 2015, gold plunged to a major 6.1-year secular low. Then it surged out of that irrational rate-hike scare, formally crossing the +20% new-bull threshold in early March 2016. Ever since, gold has remained in this current bull. At worst in December 2016 after gold was crushed on the post-election Trumphoria stock-market surge, it had only corrected 17.3%.
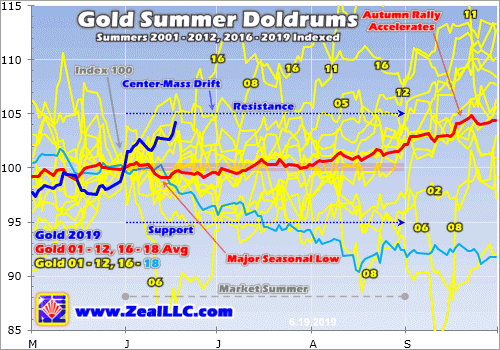
So the bull-market years for gold in modern history ran from 2001 to 2012, skipped the intervening bear-market years of 2013 to 2015, then resumed in 2016 to 2019. Thus these are the years most relevant to understanding gold’s typical summer-doldrums performance, which is necessary for managing your own expectations this time of year. This spilled-spaghetti mess of a chart is fairly simple and easy to understand.
The yellow lines show gold’s individual-year summer price action indexed from each May’s final close for all years from 2001 to 2012 and 2016 to 2017. 2018’s is rendered in light blue. Together these establish gold’s summer trading range. All those past bull-market years’ individual indexes are averaged together in the red line, revealing gold’s central summer tendency. 2019’s indexed action is superimposed in dark blue.
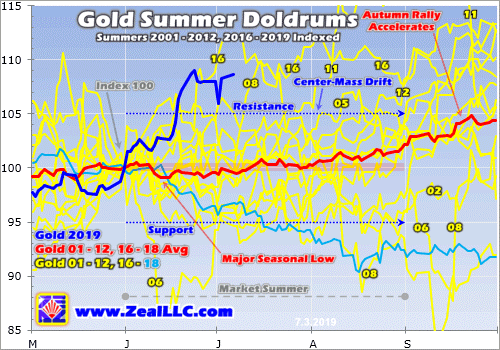
While there are outlier years, gold generally drifts listlessly in the summer doldrums much like a sailing ship trapped near the equator. The center-mass drift trend is crystal-clear in this chart. The vast majority of the time in June, July, and August, gold simply meanders between +/-5% from May’s final close. This year that equated to a probable summer range between $1240 to $1370. Gold tends to stay well within trend.
Obviously this year has proven a huge exception to that normal summer rule, with gold rocketing higher to a major bull-market breakout! Gold blasted to its best early-summer performance ever seen in all modern bull-market years. Comparing this current summer’s dark-blue line to past years’ price action certainly drives home how unique, exceptional, and special gold’s breakout surge to major new secular highs has been.
Still, understanding gold’s typical behavior this time of year is important for traders. Sentiment isn’t only determined by outcome, but by the interplay between outcome and expectations. If gold rallies 5% but you expected 10% gains, you will be disappointed and grow discouraged and bearish. But if gold rallies that same 5% and you expected no gains, you’ll be excited and get optimistic and bullish. Expectations are key.
History has proven it is wise not to expect too much from gold in these lazy market summers, particularly Junes and Julies. Occasionally gold still manages to stage a summer rally, like this year’s monster. But most of the time gold doesn’t veer materially from its usual summer-drift trading range, where it is often adrift like a classic tall ship. With range breakouts either way uncommon, there’s often little to get excited about.
In this chart I labeled some of the outlying years where gold burst out of its usual summer-drift trend, both to the upside and downside. But these exciting summers are atypical, and can’t be expected very often. Most of the time gold grinds sideways on balance not far from its May close. Traders not armed with this critical knowledge often wax bearish during gold’s summer doldrums and exit in frustration, a real mistake.
Gold’s summer-doldrums lull marks the best time of the year seasonally to deploy capital, to buy low at a time when few others are willing. Gold enjoys powerful seasonal rallies that start in Augusts and run until the following Mays! These are fueled by outsized investment demand driven by a series of major income-cycle and cultural factors from around the world. Summer is when investors should be bullish, not bearish.
The red average indexed line above encompassing 2001 to 2012 and 2016 to 2018 reveals gold’s true underlying summer trend in bull-market years. Technically gold’s major seasonal low arrives relatively early in summers, mid-June. On average through all these modern bull-market years, gold slumped 0.9% between May’s close and that summer nadir. But seasonally that’s still on the early side to deploy capital.
Check out the yellow indexed lines in this chart. They tend to cluster closer to flatlined in mid-June than through all of July. The only reason gold’s seasonal low appears in mid-June mathematically is a single extreme-outlier year, 2006. The spring seasonal rally was epic that year, gold rocketed 33.4% higher to a dazzling new bull high of $720 in just 2.0 months between mid-March to mid-May! That was incredible.
Extreme euphoria had catapulted gold an astounding 38.9% above its 200-day moving average, radically overbought by any standard. That was way too far too fast to be sustainable, so after that gold had to pay the piper in a sharp mean-reversion overshoot. So over the next month or so into mid-June, gold’s overheated price plummeted 21.9%! That crazy outlier is the only reason gold’s major summer low isn’t later.
There were 15 bull-market years from 2001 to 2012 and 2016 to 2018. That is a big-enough sample to smooth out the trend, but not large enough to prevent extreme deviations from skewing it a bit. Gold sees a series of marginally-higher lows in late June, early July, and even late July. In this dataset they came in 0.0%, 0.3%, and 0.8% higher than mid-June’s initial low. And that last late-July one arrives over 6 weeks later.
So generally there’s no hurry to deploy capital right at that initial mid-June seasonal low. Gold tends to drift nearly flatlined over the next several weeks into early July, trying traders’ patience. Buying within a few trading days of the US Independence Day holiday seems to have the best odds of catching gold near its summer-doldrums lows. Investment capital inflows usually begin ramping back up after that as traders return.
On average in these modern bull-market years, gold slipped 0.4% in Junes before rallying 0.7% in Julies. After July’s initial lazy summer week, gold tends to gradually start clawing its way back higher again. But this is so subtle that Julies often still feel summer-doldrumsy. By the final trading day in July, gold is still only 0.3% higher than its May close kicking off summers. That’s too small to restore damaged sentiment.
Since gold exited May 2019 at $1305, an average 0.3% rally by July’s end would put it at $1309. That’s hardly enough to generate excitement after two psychologically-grating months of drifting. But the best times to deploy any investment capital are when no one else wants to so prices are low. Gold’s summer doldrums come to swift ends in Augusts, which saw hefty average gains of 1.9% in these bull-market years!
And that’s just the start of gold’s major autumn seasonal rally, which has averaged strong 5.7% gains between mid-Junes to late Septembers. That is driven by Asian gold demand coming back online, first post-harvest-surplus buying and later Indian-wedding-season buying. June is the worst of gold’s summer doldrums, and the first half of July is when to buy back in. It’s important to be fully deployed before August.
These gold summer doldrums driven by investors pulling back from the markets to enjoy their vacation season don’t exist in a vacuum. Gold’s fortunes drive the entire precious-metals complex, including both silver and the stocks of the gold and silver miners. These are effectively leveraged plays on gold, so the summer doldrums in them mirror and exaggerate gold’s own. Check out this same chart type applied to silver.
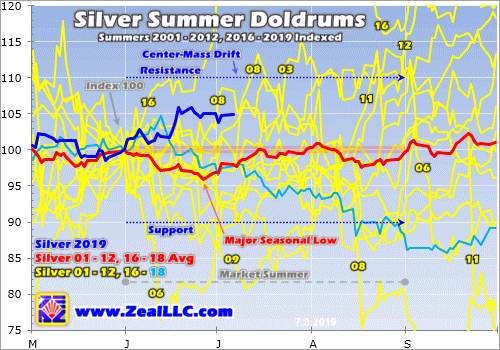
Since silver is much more volatile than gold, naturally its summer-doldrums-drift trading range is wider. The great majority of the time, silver meanders between +/-10% from its final May close. That came in at $14.56 this year, implying a summer-2019 silver trading range between $13.10 to $16.02. While silver suffered that extreme June-2006 selling anomaly too, its major seasonal low arrives a couple weeks after gold’s.
Given gold’s spectacular bull-market-breakout surge last month, silver’s summer performance this year has been utterly dismal. Normally silver amplifies gold upside by at least 2x. But silver has been bombed out and languishing for so long that investors and speculators still want nothing to do with it. Silver often acts as a gold sentiment gauge, and gold hasn’t been over $1400 long enough yet to shift psychology to bullish.
On average in these same gold-bull-market years of 2001 to 2012 and 2016 to 2018, silver dropped 4.1% between May’s close and late June. That is much deeper than gold’s 0.9% seasonal slump, which isn’t surprising given silver’s leverage to gold. Silver’s summer performances are also much lumpier than gold’s. Junes see average silver losses of 3.2%, but those are more than erased in strong rebounds in Julies.
Silver’s big 3.6% average rally in Julies amplifies gold’s gains by an impressive 5.1x! But unfortunately silver hasn’t been able to maintain that seasonal momentum, with Augusts averaging a modest decline of 0.7%. Overall from the end of May to the end of August, silver’s summer-doldrums performance tends to drift lower. Silver averaged a 0.4% full-summer loss, way behind gold’s 2.2% gain through June, July, and August.
That means silver sentiment this time of year is often worse than gold’s, which is already plenty bearish. The summer doldrums are more challenging for silver than gold. Being in the newsletter business for a couple decades now, I’ve heard from countless discouraged investors over the summers. While I haven’t tracked this, it sure feels like silver investors have been disproportionally represented in that feedback.
Since gold is silver’s primary driver, this white metal is stuck in the same dull drifting boat as gold in the market summers. Silver usually leverages whatever is happening in gold, both good and bad. But again the brunt of silver’s summer weakness is borne in Junes. Fully expecting this seasonal weakness and rolling with the punches helps prevent getting disheartened, which in turn can lead to irrationally selling low.
The gold miners’ stocks are also hostage to gold’s summer doldrums. This last chart applies this same methodology to the flagship HUI gold-stock index, which mostly closely mirrors that leading GDX VanEck Vectors Gold Miners ETF. The major gold stocks tend to amplify gold’s gains and losses by 2x to 3x, so it is not surprising that the HUI’s summer-doldrums-drift trading range is also twice as wide as gold’s own.
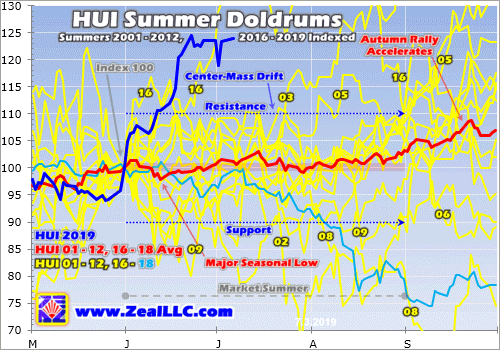
The gold miners’ stocks share silver’s center-mass summer drift running +/-10% from May’s close. This year the HUI entered the summer doldrums at 157.1, implying a June, July, and August trading range of 141.4 to 172.8. While gold stocks’ GDX ETF is too young to do long-term seasonal analysis on, in GDX terms this summer range translates to $19.43 to $23.75 this year. That’s based off a May 31st close of $21.59.
Thanks to gold’s dazzling bull-market breakout, gold stocks have defied these weak summer seasonals this year to soar to their own major decisive breakout! This high-potential contrarian sector has enjoyed its best early-summer performance ever witnessed in gold’s modern bull-market years. While I hope this incredible outperformance persists, the summer doldrums could still reassert themselves if gold retreats.
Like gold, the gold stocks’ major summer seasonal low arrives in mid-June. On average in these gold-bull-market years of 2001 to 2012 and 2016 to 2018, by then the HUI had slid 2.1% from its May close. Then gold stocks tended to more than fully rebound by the end of June, making for an average 0.6% gain that month. But there is no follow-through in July, where the gold stocks averaged a modest 0.5% loss.
Overall between the end of May and the end of July, which encompasses the dark heart of the summer doldrums, the HUI proved dead flat on average. Again two solid months of grinding sideways on balance is hard for traders to stomach, especially if they’re not aware of the summer-doldrums drift. The key to surviving it with minimum psychological angst is to fully expect it. Managing expectations in markets is essential!
But also like gold, the big payoff for weathering the gold-stock summer starts in August. With gold’s major autumn rally getting underway, the gold stocks as measured by the HUI amplify it with good average gains of 3.1% in Augusts! And that’s only the start of gold stocks’ parallel autumn rally with gold’s, which has averaged 9.3% gains from late Julies to late Septembers. Gold-stock upside resumes in late summers.
Like much in life, withstanding the precious-metals summer doldrums is less challenging if you know they’re coming. While outlying years happen, they aren’t common. So the only safe bet to make is expecting gold, silver, and the stocks of their miners to languish in Junes and Julies. Then when these drifts again come to pass, you won’t be surprised and won’t get too bearish. That will protect you from selling low.
The precious-metals sector radically bucked its seasonal-slump trend this year, surging to a record start. Gold began blasting higher on May’s final trading day, and that sharp rally carried into early June. New trade-war tariff threats were ramping up market fears, driving the US stock markets to selloff lows following late April’s all-time record highs. So traders remembered diversifying with gold and flocked back to it.
In mid-June gold’s gains accelerated after the Fed reversed its future-rate outlook from hiking back to cutting. That propelled gold to its first new bull-market highs in 3.0 years, with it surging to a 5.8-year secular high on that late-June breakout day. That momentum fed on itself and carried gold back over $1400 for the first time since early September 2013. Those awesome $1400+ levels have mostly held since.
The gold miners’ stocks naturally leveraged gold’s gains, enjoying their own epic early-summer action. The precious-metals sector is doing wildly better than last summer, when gold rolled over in mid-June on a sharp US dollar rally. Hyper-leveraged gold-futures speculators watch the dollar’s fortunes for trading cues. Hopefully gold’s huge early-summer gains can hold, and it consolidates sideways in coming weeks.
Gold’s massive and exceptional June rally was mostly fueled by speculators buying enormous quantities of gold futures. That has largely exhausted their available capital firepower, and left their collective bets on gold exceedingly bullish. These positions must be partially unwound with selling, which forces gold into a high consolidation at best and a sharp selloff at worst. So gold isn’t out of the summer-doldrums woods yet.
The inevitable coming gold-futures selling could be largely offset by investment buying. Investors are radically underinvested in gold after the second-largest and first-longest stock bull in US history, giving them big room to buy to reestablish normal portfolio allocations. Since they love chasing winners, gold’s powerful new-high psychology is starting to attract them back. Their return could dwarf gold-futures selling.
Given gold’s long-established lackluster summer-doldrums performance record, it is probably not prudent to chase this rally with gold-futures speculators effectively all-in longs and all-out shorts. But the metal and its miners’ stocks can be accumulated aggressively on any significant weakness. All portfolios need a 10% allocation in gold and gold stocks! Far-more upside is coming after recent overboughtness is worked off.
One of my core missions at Zeal is relentlessly studying the gold-stock world to uncover the stocks with superior fundamentals and upside potential. The trading books in both our popular weekly and monthly newsletters are currently full of these better gold and silver miners. Mostly added in recent months as gold stocks recovered from selloffs, their unrealized gains were already running as high as +105% this week!
If you want to multiply your capital in the markets, you have to stay informed. Our newsletters are a great way, easy to read and affordable. They draw on my vast experience, knowledge, wisdom, and ongoing research to explain what’s going on in the markets, why, and how to trade them with specific stocks. As of Q1 we’ve recommended and realized 1089 newsletter stock trades since 2001, averaging annualized realized gains of +15.8%! That’s nearly double the long-term stock-market average. Subscribe today and take advantage of our 20%-off summer-doldrums sale!
The bottom line is gold, silver, and their miners’ stocks usually drift listlessly during market summers. As investors shift their focus from markets to vacations, capital inflows wane. Junes and Julies in particular are simply devoid of the big recurring gold-investment-demand surges seen during much of the rest of the year, leaving them weak. Investors need to expect lackluster sideways action on balance this time of year.
This summer has proven an epic exception, with gold rocketing to its first major bull-market breakout in years! That has catapulted both the metal and its miners’ stocks to their best early-summer performances in gold’s modern bull-market years. But the summer doldrums could still reassert themselves as specs’ excessively-bullish gold-futures bets are bled off. So enjoy these big anomalous gains, but remain wary.
Adam Hamilton, CPA
July 8, 2019
Copyright 2000 – 2019 Zeal LLC (www.ZealLLC.com)
- Major fundamental processes and events create the large chart patterns seen on the monthly charts. It’s important for gold and stock market investors to stay focused on the big picture, both technically and fundamentally.
- To view the big technical picture for gold, please click here now. Double-click to enlarge.
- Since 2001, my proprietary weekly chart signals system has only generated five buy signals for gold bullion. Note the similarity of the latest one with the 2009 signal.
- The current signal happens with India just days away (July 5) from a possible gold tariff tax cut as part of its new budget, and the July 31 Fed meeting only a month away.
- I’ve put the odds of a gold tariff tax cut at about 50%. To view key news related to the US business cycle, please click here now. The Dow gave back most of its early morning gain yesterday, after rising on the news that Trump would temporarily halt his tariff tax bombing runs on the stock markets, corporations, and working class of America.
- Over the long term, the only way for conservative governments to compete with handouts-focused liberals at the voting polls is with working class tax cuts. By refusing to cut income taxes for America’s working class, Trump risks losing the 2020 election.
- He is now rumoured to be considering a capital gain tax cut (for stock market elitists) instead of an income tax cut for the poor. That’s going to drive more blue-collar voters towards the democrats.
- With US corporate earnings and America’s working class now looking a lot like drowning passengers on the Titanic, gold is the obvious “choice of champions”.
- To view another key big picture chart for this mighty asset, please click here now. Double-click to enlarge.
- After a major upside breakout from an enormous bullish chart pattern, a pullback is expected and normal. The bigger the chart pattern is, the bigger the pullback can be.
- Gold could easily pull back to the $1320-$1250 price zone before roaring on towards my $1550 and $2000 price targets. That shouldn’t bother investors because this type of pullback action is typical after a major breakout.
- Regardless, a shallow pullback would obviously be preferred by most gold market investors and that’s also a realistic scenario.
- Please click here now. Double-click to enlarge. There is a bull flag in play on the daily gold chart.
- A cut in India’s gold tariff tax on Friday would be the likely catalyst for an upside breakout from the flag pattern. If there is no cut, a deeper correction would likely ensue. In that scenario, gold would probably pull back to at least $1360, but more likely to $1320-$1250 by the July 31 Fed meet.
- Please click here now. There’s a lot of talk about the gold versus silver ratio right now. Silver investors should exercise caution before racing in to buy silver just based on the level of the ratio. Here’s why:
- If Trump blows the 2020 election, America could quickly become a socialist state. Stock markets would incinerate and silver (an industrial metal) could fall further against gold on the ratio chart until inflation became obvious.
- Also, the monsoon season in India isn’t going well. It’s a mini-disaster now, and it could soon become a full disaster. If the crop harvest is horrific, Indian farmers won’t have additional money to buy physical silver bullion.
- They will likely just buy the gold they need to meet their needs for religious festivals and weddings. That will put even more upside pressure on the gold/silver ratio.
- U.S. corn crops are also in trouble. The crop situation in both India and America is significant. It could produce food inflation, especially if the democrats win the U.S. election. Regardless, silver investors should wait for inflation to appear rather than try to anticipate it.
- The 80 area on the ratio chart could be support now. Silver can do well against the dollar, but investors should wait for silver to break down from the green uptrend channel I’ve highlighted on the chart before getting too excited about… silver versus gold.
- Silver and mining stocks should be part of an overall allocation to the gold asset class. Amateur stock market investors need to be careful about trying to outperform the Dow with their own growth stocks portfolio. Growth stocks should be part of a US stock market portfolio. They are not a replacement for the Dow.
- Likewise, gold market investors should be careful about owning only silver or mining stocks with the belief they will outperform gold bullion over the long run. That’s unlikely to happen. A well-diversified gold asset class portfolio includes bullion, ETFs, and individual miners. Simply put, to stand tall, own it all!
- Please click here now. Double-click to enlarge this spectacular GDX chart. Note the bullish pennant formation in play. GDX has barely retraced any of its recent near-vertical blast to the upside. The 50% Fibonacci line sits at about $23.20. Gold stock accumulators need to get toes in the water as this pullback plays out. Why? Well, perhaps because history favours the bold!
- America could descend into a permanent socialist and stagflationary quagmire after the next election. This, while India’s first “semi-sane” finance minister in years could cut the gold import tax within just days. She is highly unlikely to unveil any new policy that is negative for gold. It’s obvious that for the world’s greatest asset and the companies that mine it, all major fundamental and technical lights are green!
Special Offer For Website Readers: Please send me an Email to freereports4@gracelandupdates.com and I’ll send you my free “The Bold Go For The Gold!” report. I highlight outperforming miners in the gold price pullback zone, with key buy and sell points for eight of them!
Stewart Thomson
Graceland Updates
Stewart Thomson is a retired Merrill Lynch broker. Stewart writes the Graceland Updates daily between 4am-7am. They are sent out around 8am-9am. The newsletter is attractively priced and the format is a unique numbered point form. Giving clarity of each point and saving valuable reading time.
Risks, Disclaimers, Legal
Stewart Thomson is no longer an investment advisor. The information provided by Stewart and Graceland Updates is for general information purposes only. Before taking any action on any investment, it is imperative that you consult with multiple properly licensed, experienced and qualified investment advisors and get numerous opinions before taking any action. Your minimum risk on any investment in the world is: 100% loss of all your money. You may be taking or preparing to take leveraged positions in investments and not know it, exposing yourself to unlimited risks. This is highly concerning if you are an investor in any derivatives products. There is an approx $700 trillion OTC Derivatives Iceberg with a tiny portion written off officially. The bottom line:
Are You Prepared?
Gold closed the month of June and the quarter above $1400/oz, holding the majority of its recent gains. That does not necessitate continued strength but it is a good sign.
The technicals and fundamentals are finally in place for Gold.
It is outperforming all major currencies and the Federal Reserve is weeks away from beginning a new cycle of rate cuts. The U.S. Dollar has lost its uptrend.
The near-term outlook is very strong but if the Federal Reserve cuts rates three or four times and Gold strongly outperforms the stock market then this move can go to $1900/oz.
But let’s focus and the here and now.
This breakout in Gold potentially has quite a bit of room to run.
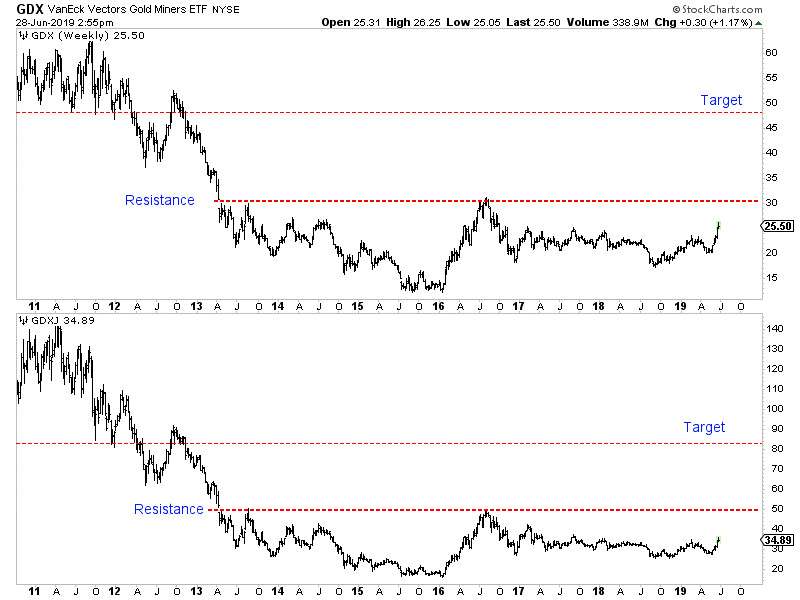
The weekly chart below shows how there is very little resistance from $1420/oz to the low $1500s. Moreover, there are strong measured upside targets of $1600/oz to $1700/oz.
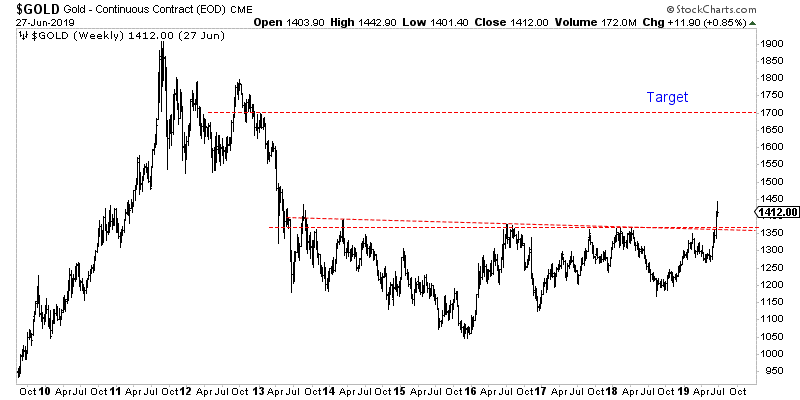
If Gold is going to trend higher towards $1600-$1700/oz, then the gold stocks are going to run much higher.
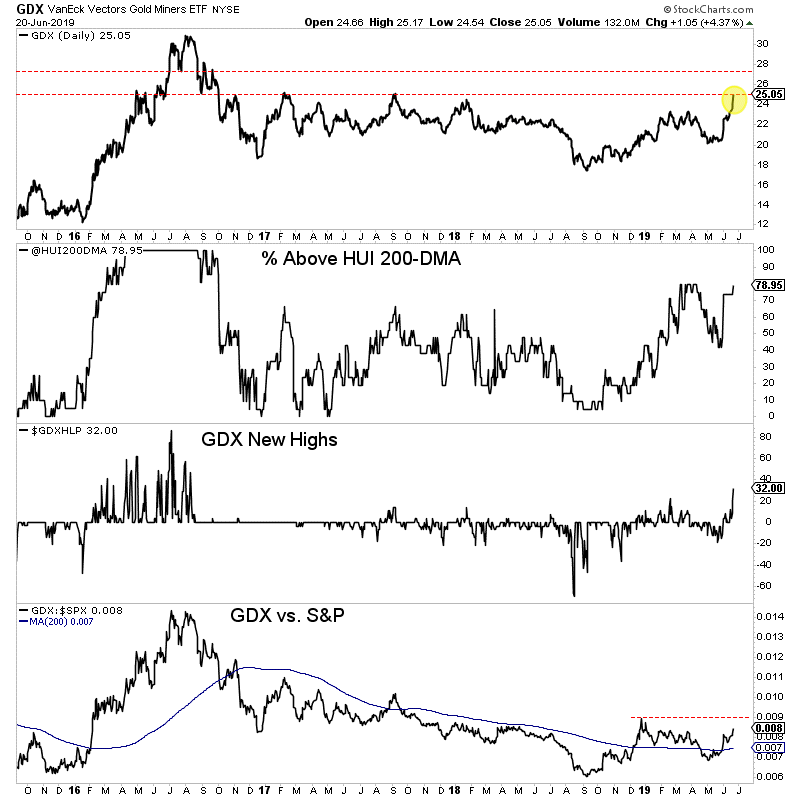
GDX is trading below $26. A break past $30-$31, would trigger a measured upside target of almost $50.
GDXJ is lagging both Gold and GDX but we know it can catch up quite quickly. First is needs to reach resistance at $50. A clean break past $50 triggers an upside target of ~$83.
If the Fed does cut rates three or four times and either the greenback cracks more or Gold outperforms the stock market then Gold should be able to reach the $1700/oz target. If only one of those things happen then it still has a good shot to hit $1550/oz.
If the breakout gains traction then the gold stocks, which have strongly outperformed in recent weeks will continue to outperform. That is how these type of moves work.
As we noted last week, be wary of over anticipating a correction. Bull moves tend to remain overbought with overly bullish sentiment. The perfect entry point is behind us.
That being said if Gold does snap back to $1370-$1380/oz for a retest then that would be the time to put more capital work and aggressively so if you missed the last move. To learn which stocks we own and intend to buy that have 3x to 5x potential, consider learning more about our premium service.
Jordan Roy-Byrne CMT, MFTA
July 2, 2019
The gold miners’ stocks just blasted higher to a major decisive breakout this week! Driven by gold’s own huge bull-market breakout, the gold stocks surged well above vexing years-old upper resistance. The resulting new multi-year highs are a game changer, starting to shift long-apathetic sector sentiment back towards bullish. This will increasingly attract back traders, with their buying unleashing a virtuous circle of gains.
Traders usually track gold-stock fortunes with this sector’s most-popular exchange-traded fund, the GDX VanEck Vectors Gold Miners ETF. Launched in May 2006, this was the original gold-stock ETF. That big first-mover advantage has helped propel GDX to sector dominance. This week its net assets of $10.5b ran 44.6x larger than the next-biggest 1x-long major-gold-miners ETF! GDX is this sector’s leading benchmark.
And as recently as late May, neither speculators nor investors wanted anything to do with gold stocks. GDX slumped to $20.42 on May 29th, down 3.2% year-to-date. That was much worse than gold’s own slight 0.2% YTD decline then warranted. The gold stocks were really out of favor, largely ignored by apathetic traders. What a difference a month makes though, as their fortunes changed radically in June.
The gold miners started reanimating on May 31st, after Trump unleashed a bombshell warning to Mexico the evening before. He said tariffs would be imposed on all of its exports to the US if it didn’t seriously clamp down on illegal immigration across the US southern border. While Trump subsequently suspended those tariffs on Mexico’s promises to take action, that was the catalyzing event that awoke gold from its slumber.
A couple weeks ago I wrote an essay on the resulting mounting gold-stock upleg, explaining what was going on. But the developments since have been stunning, a colossal bullish surprise. Long neglected, GDX kept on marching higher mid-month leading into last week’s highly-anticipated Federal Open Market Committee decision. GDX closed at $23.67 the day before, already 15.9% higher in only several weeks.
The Fed kowtowed to stock traders’ hyper-dovish expectations and shifted its future rate bias from tightening to cutting, lighting a fire under gold. In last week’s essay I analyzed the gold bull breaking out, which was a momentous sea-change event. Gold rallied 1.0% to $1360 that day with top Fed officials forecasting a new rate cut next year. Gold-stock traders just shrugged at gold’s best close in 2.9 years.
They only bid GDX 1.4% higher to $24.00 after the Fed’s dovish shift. That only amplified gold’s gains by 1.4x, far short of the major gold stocks’ normal upside leverage to gold of 2x to 3x. While gold was high, it had tried and failed for years to break out above its $1350 resistance zone. And gold stocks suffered big and sharp selloffs after those previous forays proved unsuccessful. Traders didn’t expect this time to be different.
That Fed-Day evening New York time, Asian markets reopened as their Thursday morning rolled around. The Asian cultures have a deep cultural affinity for gold, and aggressively piled on in early trading. All that buying catapulted gold from $1358 to $1383 in about an hour! Partially thanks to Iran shooting down a big and sophisticated US surveillance drone overnight, gold’s Asia gains held in last Thursday’s U.S. trading.
Gold closed 2.1% higher that day at $1389, a decisive breakout 1%+ beyond its previous bull-market high of $1365 from way back in early July 2016! That also happened to be a 5.8-year closing high, so gold-stock traders realized big changes were afoot. They poured capital into gold stocks with a vengeance, catapulting GDX 4.4% higher on 3.5x its 3-month-average daily volume! That propelled it to $25.05 on close.
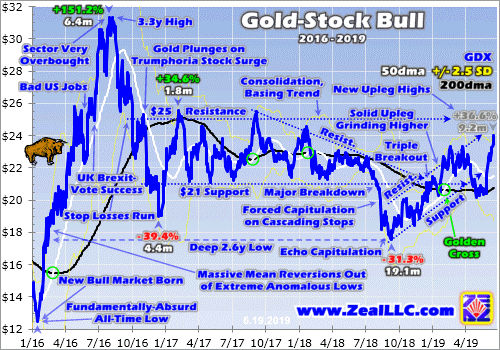
That was a critical technical level, as this GDX chart shows. It looks at the gold-stock price action of the last several years or so during gold’s own parallel bull market. GDX is rendered in blue, its key 50-day and 200-day moving averages in white and black, and 2.5-standard-deviation bands in light yellow. This leading gold-stock ETF had to decisively best years-old upper resistance at $25 to prove this time is different.
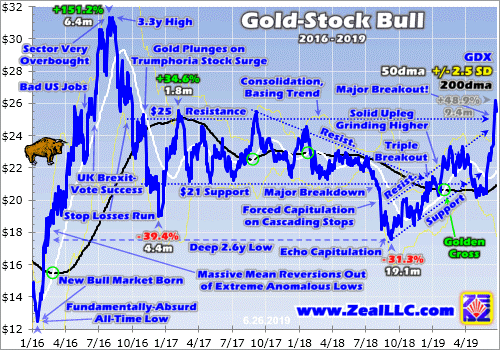
Since late 2016, GDX has largely been trapped in a giant consolidation basing trend running from $21 support to $25 resistance. $25 had proven a graveyard in the sky for gold stocks since November 2016, and needed to be overcome to change bearish psychology. GDX’s $25.05 close last Thursday on that new secular gold high was right there. But $25 resistance had to be broken decisively to impress traders.
Last Friday gold climbed another 0.7% to $1399 on pure momentum, yet gold-stock traders were worrying again. So GDX’s resulting 0.6% rally was pathetic, actually lagging gold. While not a decisive breakout over $25.25, or 1% above that long-vexing resistance line, GDX’s $25.21 close was darned close. The major gold stocks as measured by this ETF hadn’t been higher in 21.4 months. That was certainly bullish.
Last Friday and this Monday it was becoming evident that new-high psychology was taking root in gold. That is a powerful force motivating speculators and investors to buy. GDX $25 finally being materially surpassed has long been the key to unleashing this self-reinforcing sentiment in gold stocks. A couple weeks ago when GDX had merely climbed to $23.33 at best, I wrote about this coming critical breakout.
“The higher gold stocks climb, the more traders will want to buy them to ride that momentum. The more capital they deploy, the more gold stocks will rally. This normal virtuous circle of improving psychology and buying will become even more exaggerated as GDX $25 is surpassed. Seeing the highest gold-stock levels in several years will work wonders to improve sector sentiment, unleashing widespread bullishness.”
“This gold-stock upleg’s potential gains are massive spanning such a major upside breakout. Remember speculators and investors love chasing winners, so the higher gold stocks rally the more attractive they’ll look.” Nothing drives trader interest and thus capital inflows like major new highs. And GDX was right on the verge of entering that excitement-fueling zone decisively over $25 as markets opened for trading this week.
This Monday gold surged another 1.4% higher to a dazzling $1419 close! That new 6.1-year high was fueled by sheer momentum, there was little gold-moving news that day. Gold’s new-high psychology was already feeding on itself. And that enthusiasm spilled into gold stocks, with traders bidding GDX another 3.8% higher to $26.17. That was the long-awaited decisive $25 breakout, with GDX blasting 4.7% beyond!
The importance of gold stocks powering through to new 2.7-year highs cannot be overstated. Major new highs act like magnets attracting traders’ attention, interest, and capital. They prove that the long-ignored gold stocks are in bull-market-rallying mode again, portending massive gains to come. They also garner media coverage, which greatly increases the number of traders looking to ride the breakout momentum.
Since late May’s depressing low, GDX had rocketed a huge 28.2% higher in just 18 trading days! Stock traders would kill for those kinds of fast gains. And the major gold stocks’ upleg-to-date advance per this ETF had grown to 48.9% over 9.4 months. That would be impressive for any sector, but is actually still on the smaller side for the high-potential gold stocks. Their uplegs have tended to grow much larger in the past.
The last time gold was hitting new bull-market highs was in the first half of 2016. That was the maiden upleg of this bull, where gold soared 29.9% higher in just 6.7 months. The resulting excitement fueled a deluge of capital roaring into gold stocks, which skyrocketed GDX an incredible 151.2% higher in roughly that same span! While that upleg was exceptionally large, the last major gold-stock bull’s uplegs were big.
Before GDX came along, the primary gold-stock benchmark was the classic HUI NYSE Arca Gold BUGS Index. Like GDX it tracks most of the same major gold stocks, so HUI and GDX price action are usually indistinguishable. The last gold-stock bull straddling GDX’s birth saw the HUI soar 1664.4% higher over 10.8 years between November 2000 to September 2011! Those gains accrued over 12 separate uplegs.
One was an anomaly, the epic mean-reversion rebound after late 2008’s first-in-a-century stock panic. Excluding it, the other 11 normal gold-stock uplegs in that last bull averaged 80.7% gains over 7.9 months per the HUI! So GDX’s 48.9% upleg-to-date advance as of early this week remains well below precedent to be mature. Odds are it will grow much larger in line with past major uplegs before giving up its ghost.
Gold stocks paid a terrible price as gold drifted sideways over the last several years, trapped under that $1350 resistance zone which masked its in-progress bull. That’s why GDX mostly meandered between those $21 support and $25 resistance lines since late 2016. That chronic inability to break out to new highs gradually scared away the great majority of traders, leaving gold stocks incredibly undervalued.
Gold-stock prices are ultimately determined by gold, because it overwhelmingly drives their earnings. So one way to measure gold-stock “valuations” is looking at them relative to gold. This can be done using the GDX/GLD Ratio, the leading gold-stock ETF’s price divided by the flagship gold ETF’s price. That of course is the GLD SPDR Gold Shares. I last wrote about and analyzed the GGR in an early-February essay.
This Monday as GDX finally decisively broke above $25 to close at $26.17, GLD’s shares closed way up at $133.94. That made for a GGR of just 0.195x at the best gold-stock levels in several years. Yet that was still really low by historical standards. The last normal years for the gold market were arguably 2009 to 2012. That stretch was sandwiched between 2008’s stock panic and the Fed’s QE3 stock-market levitation.
The resulting extreme and irrational stock euphoria had a devastating impact on gold. But from 2009 to 2012 before markets became wildly central-bank-distorted and fake, the GDX/GLD ratio averaged 0.381x. That encompassed all kinds of gold environments, from strong bull to budding bear. So there’s no better recent span to approximate gold stocks’ “fair value” relative to gold. Applying that today is super-bullish.
At Monday’s $133.94 GLD close, that historical-average fair-value GGR would put GDX at $51.03. That is a whopping 95.0% higher than its actual close that day! Gold stocks are literally trading at just half of where they ought to be at today’s gold prices, meaning they still need to double just to catch up. And that doesn’t account for higher future gold prices or the GGR overshooting proportionally higher after mean reverting!
At best GDX has powered 151.2% higher within gold’s current bull. But during gold’s last secular bull, the HUI skyrocketed an astounding 1664.4% higher over 10.8 years! Gold stocks are one of the highest-potential sectors in the entire stock markets. When they really start running the resulting gains can truly generate life-changing wealth. That’s why contrarians are willing to suffer between their mighty bull runs.
This week’s long-awaited GDX $25 breakout is a critical technical milestone that is likely signaling much-bigger gains to come. The gold-stock surge this month is really special, actually the strongest early-summer performance for this sector in modern gold-bull history! Normally this time of year I’d be updating my gold-summer-doldrums research, highlighting the weakest time of the year seasonally for gold stocks.
Hopefully I can find time next week. This chart looks at the HUI’s average summer performances in all modern gold-bull-market years. Each summer is individually indexed to its final close in May, keeping gold-stock price action perfectly comparable regardless of prevailing gold levels. The yellow lines show 2001 to 2012 and 2016 to 2017. Last year’s summer gold-stock action is rendered in light blue for comparison.
All these lines averaged together form the red one, revealing the center-mass drift trend of gold stocks in market summers. Gold stocks’ current 2019 summer action is superimposed over all that in dark blue. As you can see, this past month’s action is the best summer start gold stocks have seen since at least 2001! They are even tracking better than the summer of 2016 in this gold bull’s mighty maiden upleg.
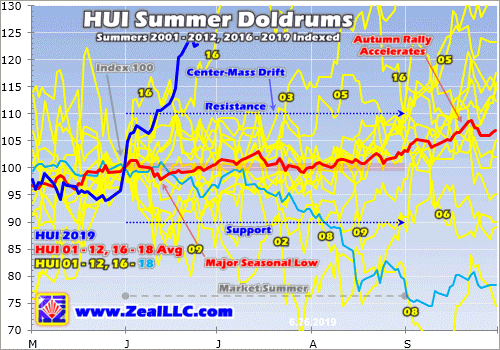
This chart really illuminates how unique gold stocks’ powerful June rally has been. This is more evidence that a sea-change sentiment shift is underway in this long-neglected sector. That sure implies the gains to come will be much larger than traders expect, driving GDX towards its own new bull highs on balance. In early August 2016, GDX hit its bull-to-date high of $31.32. That’s 19.7% higher than Monday’s breakout close.
The major gold miners’ fundamentals remain strong and bullish too, supporting much-higher stock prices. After every quarterly earnings season, I dig deep into the GDX gold miners’ fundamentals. They finished reporting their latest Q1’19 results about 6 weeks ago, and I wrote a comprehensive essay analyzing them. At that point GDX was still really out of favor, languishing under its $21 multi-year support line.
Stock prices are ultimately determined by underlying corporate earnings, and for the gold miners that is totally dependent on prevailing gold prices. Gold-mining costs are best measured in all-in-sustaining-cost terms. In Q1’19 the GDX gold miners’ AISCs averaged $893 per ounce. That’s right in line with the prior four quarters’ trend of $884, $856, $877, and $889. Gold-mining profits are going to soar with higher gold.
Gold averaged $1303 in Q1 when the major gold miners were producing it for $893. That implies they were earning $410 per ounce mined. $1400 and $1500 gold are only 7.4% and 15.1% higher from there. As the GDX gold miners’ AISCs reveal, gold-mining costs are largely fixed from quarter to quarter and don’t follow gold higher. So assuming flat AISCs, gold-mining profits surge to $507 at $1400 and $607 at $1500.
That’s 23.7% and 48.0% higher from Q1’19 levels on mere 7.4% and 15.1% gold gains from that quarter’s average price! And as of earlier this week, gold had already climbed 9.2% of that. The major gold miners’ fundamentals are already bullish, but improve greatly at higher prevailing gold prices. With earnings growth hard to come by in general stock markets this year, the gold stocks will be even more alluring.
All the stars are aligning for big gold-stock gains in coming months, with their technicals, sentiment, and fundamentals all looking very bullish. This breaking-out gold-stock upleg has excellent potential to grow much larger later this year, greatly rewarding contrarians buying in early. More and more traders are becoming aware of this sector’s huge potential, and their buying will push the gold stocks much higher.
This is not the summer to check out, but to do your homework and get deployed in great gold stocks. All portfolios need a 10% allocation in gold and its miners’ stocks! Many smaller mid-tier and junior miners have superior fundamentals and upside potential to the majors of GDX. And by the time gold stocks get really exciting again hitting their own new bull highs, much of the easy gains will have already been won.
One of my core missions at Zeal is relentlessly studying the gold-stock world to uncover the stocks with superior fundamentals and upside potential. The trading books in both our popular weekly and monthly newsletters are currently full of these better gold and silver miners. Mostly added in recent months as gold stocks recovered from selloffs, their unrealized gains were already running as high as +109% this week!
If you want to multiply your capital in the markets, you have to stay informed. Our newsletters are a great way, easy to read and affordable. They draw on my vast experience, knowledge, wisdom, and ongoing research to explain what’s going on in the markets, why, and how to trade them with specific stocks. As of Q1 we’ve recommended and realized 1089 newsletter stock trades since 2001, averaging annualized realized gains of +15.8%! That’s nearly double the long-term stock-market average. Subscribe today and take advantage of our 20%-off summer-doldrums sale!
The bottom line is gold stocks have joined gold with their own decisive breakout! GDX finally burst back above its long-oppressing $25 upper-resistance line this week. These multi-year highs are a game changer for gold stocks, ushering back long-absent bullish psychology enticing traders to return. They’ve been gone for so long that this entire gold-mining sector is deeply undervalued relative to prevailing gold prices.
That portends huge upside potential as gold and its miners’ stocks return to the limelight on their major breakouts. Traders love chasing winners to ride their upside momentum, and buying begets buying. Of course gold-stock uplegs don’t power higher in straight lines, periodic selloffs to rebalance sentiment are normal and healthy. So any material gold-stock weakness should be used to accumulate sizable positions.
Adam Hamilton, CPA
June 28, 2019
Copyright 2000 – 2019 Zeal LLC (www.ZealLLC.com
- To view what may be the most important chart in the history of markets, please click here now. Double-click to enlarge. Gold is breaking out of a massive inverse H&S bull continuation pattern, and that pattern itself may be the head of an even more massive pattern that targets the $3000 price area.
- Please click here now. Double-click to enlarge this fabulous GDX chart.
- At my https://guswinger.com swing trade service, traders are sitting on a veritable mountain of profits, having entered NUGT at about $20 barely a week ago. It’s $30 now!
- NUGT is a triple-leveraged ETF that tracks GDX. We are also long Barrick and Agnico Eagle stock, and we hold Kirkland Lake call options. If the market turns lower, we’ll not only have the profits locked in… we’ll short the market too, via DUST and JDST.
- Having said that, long-term investors should not try to top call this market. Gold is staging a major upside breakout on the charts, and the fear trade is the main price driver now. Hedges should be reduced, and aggressive speculators should hold call options on quality miners.
- Almost all major US money managers and analysts are predicting a major dovish pivot for the Fed at the upcoming July 31 meeting.
- Unfortunately for members of the Trump administration “fan club”, these analysts are basing their outlook on a peaking business cycle and the horrifying (and potentially inflationary) effects of the tariff taxes tantrum currently being thrown by the administration.
- Tariffs are a global GDP growth wrecking ball, and I’m predicting there are going to be more tariff taxes, more corporate earnings disappointments, and no tax cuts for the working class of America.
- The million-dollar question is this: What does the Fed do when the tariffs begin creating visible inflation as corporate earnings continue to fade?
- If the Fed hikes to fight the inflation, the stock market implodes and gold rallies strongly. If the Fed does nothing, the stock market likely goes nowhere and gold rallies.
- If the Fed cuts (and three big bank analysts are predicting a half point cut at the July meet), the stock market would stagger higher, and gold would probably stage a “moon shot” higher.
- Trump put more sanctions in place against Iran yesterday. Iranian government spokesmen suggested that marks the end of diplomacy. War isn’t guaranteed, but it’s certainly possible. The bottom line: Gold is the obvious place for investors to be!
- Please click here now. Double-click to enlarge. While gold stocks continue to soar, the US stock market is struggling.
- I’m long TQQQ as a swing trade. I do still have buy signals in play on the weekly charts for most of the US stock market, but my recommendation as any business cycle matures is to reduce position size on core positions. Concentrate on short-term trading to reduce risk and relieve stress.
- That’s hard for investors to do, especially when their favourite politician, Donald Trump, is the president of the United States. Like Trump, Herb Hoover was an incredibly successful businessman. When he was elected, many of America’s business leaders predicted that the business cycle was “defeated”, and America would never have a recession ever again.
- The stock market promptly fell 90% and the nation voted in socialist and war mongering madman Roosevelt. He gave the citizens food stamps, took their gold, and the banks bought stocks as the ravaged citizens sold.
- The US stock market moves higher or lower mainly on interest rate decisions from the Fed (which includes QE/QT) and on earnings growth, or lack of it.
- If the Fed cuts rates and earnings don’t start improving, money managers will begin to sell stock market rallies and rate cut decisions. The gold price rally will intensify in that situation.
- Please click here now. Double-click to enlarge. The price action on this USD vs yen chart is quite concerning, and it fits with current calls from major bank analysts for rate cuts to stop the economic slowdown from worsening.
- When the US stock market rises while the dollar falls against the yen, it suggests the rally is not based on economic growth, and risks are rising. That’s exactly what is happening now.
- Please click here now. Double-click to enlarge. Is bitcoin a safe haven? I call it an asset that makes investors richer, but whether it’s a safe haven or not is debatable.
- What is clear though, is that gold, T-bonds, yen, and bitcoin are all rallying… as money managers grow more concerned about peaking US growth in this business cycle.
- Please click here now. Double-click to enlarge this weekly GDX chart. A major breakout occurred yesterday, and a flagpole pattern has formed on the chart. A bull flag on a weekly chart in any market is very rare and carries powerful upside implications. I think a bull flag may start forming on GDX and many component stocks. When will the breakout happen?
- Well, I’ll predict that the breakout happens around the July 31 Fed meet, as an institutional money manager stampede into gold stocks is unleashed!
Special Offer For Website Readers: Please send me an Email to freereports4@gracelandupdates.com and I’ll send you my free “Junior Miners On Golden Steroids!” report. I highlight key GDXJ junior and intermediate miners that are becoming must-own stocks for the rest of 2019! I include key buy and sell levels for each stock.
Thewanks!!
Cheers
Stewart Thomson
Graceland Updates
Written between 4am-7am. 5-6 issues per week. Emailed at approx 9am daily.
Email:
Updates daily between 4am-7am. They are sent out around 8am-9am. The newsletter is attractively priced and the format is a unique numbered point form. Giving clarity of each point and saving valuable reading time.
Risks, Disclaimers, Legal
Stewart Thomson is no longer an investment advisor. The information provided by Stewart and Graceland Updates is for general information purposes only. Before taking any action on any investment, it is imperative that you consult with multiple properly licensed, experienced and qualified investment advisors and get numerous opinions before taking any action. Your minimum risk on any investment in the world is: 100% loss of all your money. You may be taking or preparing to take leveraged positions in investments and not know it, exposing yourself to unlimited risks. This is highly concerning if you are an investor in any derivatives products. There is an approx $700 trillion OTC Derivatives Iceberg with a tiny portion written off officially. The bottom line:
Are You Prepared?
Gold is finally surging to new bull-market highs! Several years after its last bull high, gold punched through vexing resistance after the Fed continued capitulating on ever normalizing. This huge milestone changes everything for gold and its miners’ stocks, unleashing new-high psychology fueling self-feeding buying. With speculators not yet all-in and investors wildly underdeployed, gold has room to power much higher.
Gold momentum has certainly been building for a major upside breakout. Back in mid-April with gold still near $1300, I wrote an essay describing the “Gold-Bull Breakout Potential” and why it was finally coming. Then a couple weeks ago with gold in the $1330s, I published another one analyzing “Gold Surges Near Breakout”. For several years higher lows had slowly compressed gold ever closer to surging over resistance.
Today’s gold bull was first born back in mid-December 2015 the day after the Fed’s initial rate hike in its just-abandoned tightening cycle. Gold’s maiden upleg was massive, rocketing 29.9% higher in just 6.7 months to $1365 in early July 2016! But that first high-water mark has proven impregnable over the 3.0 years since. Gold tried and failed to break out in 2017, 2018, and 2019, repelled near a $1350 Maginot Line.
While gold mostly climbed on balance, the lack of higher highs really impaired traders’ view on this asset. New bull highs generate enthusiasm, enticing capital inflows. When prices fail to achieve new bull bests from time to time, traders’ interest wanes. Gold was largely forgotten, even though it technically remained in a bull market since there had been no 20%+ selloff. Psychology needed new bull highs decisively over $1365.
While they were inevitable sooner or later here, I sure didn’t expect them this week. June is peak summer doldrums, the weakest time of the year seasonally for gold. And U.S. stock markets remain way up near recent all-time record highs, steeped in euphoria. That has really stunted gold demand in recent years. So the odds favored gold’s long-overdue bull-market breakout getting pushed later into July or August.
But this metal was defying weak seasonals to inch inexorably closer. It closed at $1340 on June 7th, $1342 on the 13th, and $1346 ton June 18. That was the day before the latest Fed decision. The Federal Open Market Committee had really painted itself into a corner. It had shifted dovish so hard in recent months that traders’ expectations for a new rate-cut cycle starting seemed impossible to meet.
Had the Fed not been dovish enough, the U.S. dollar would’ve surged unleashing sizable-to-serious gold-futures selling. But amazingly the FOMC managed to neither cut rates nor tease a rate cut at its next meeting in late July, yet still convince traders it was ready to cut. That masterful sleight of hand came in the quarterly dot plot, the collective future federal-funds-rate forecasts of top Fed officials. They were dovish.
Back in late September before the flagship S&P 500 stock index plunged 19.8% in a severe near-bear correction, the dots predicted 5 more rate hikes including 3 in 2019 and 1 in 2020. After December’s 9th hike of this cycle, the mid-December dot plot only moderated to 2 in 2019 and 1 in 2020. In the next dot plot in late March, this year’s hikes were struck but 2020’s lone 1 remained. That led into this week’s dot plot.
Traders were expecting almost 4 rate cuts over the next year heading into this FOMC decision, which seemed like a bridge too far. And it was! Top Fed officials’ neutral 2019 outlook of no rate hikes stayed unchanged, no cuts were added. I’m surprised the U.S. dollar didn’t surge on that, indirectly hitting gold. But the dot plot did eliminate 2020’s lone hike and pencil in 2 cuts instead, which was a major dovish shift.
So improbably in mid-June with the S&P 500 just 0.7% off late April’s all-time-record peak, gold caught a bid. Even before Wednesday’s 2pm release of the FOMC statement and dot plot, gold held steady near $1345. When the Fed headlines hit and currency traders interpreted them as dollar-bearish and sold, gold shot up to $1354. It gradually climbed from there to challenge $1360 by the end of that U.S. trading day.
Gold’s full reaction after major FOMC decisions often isn’t apparent until the next trading day though, after Asian traders can react. Their markets are closed when the Fed makes its announcements. As Asian markets opened Thursday morning which was late evening Wednesday U.S. time, gold rocketed from $1358 to $1385 in about an hour! Being a markets junkie, I always check overseas action last thing before bed.
I could hardly believe my eyes that night, and verified gold’s price in multiple trading accounts. This gold bull was breaking out! A decisive breakout is 1%+ beyond an old key level. That translated into $1379 off July 2016’s seemingly-ancient $1365 bull-to-date peak. If those gains could hold into the US close on Thursday, a decisive breakout would be confirmed. In early summer with euphoric U.S. stock markets no less!
These charts are current to Wednesday’s Fed-Day closes. In order to write and proof these essays on Thursdays, Wednesdays are the data cutoff. But as I pen these words on midday Thursday, gold is still trading at $1385 in U.S. markets (and has climbed over $1400 on June 24 – ed). This breakout looks like the real deal, the answer to contrarian investors’ prayers. And speculators’ gold-futures positioning shows room for more buying!
Because of the extreme leverage inherent in gold futures, their traders wield outsized influence over the short-term gold price. At $1350 gold, each 100-ounce contract controls $135,000 worth. Yet traders are now only required to hold $3400 cash in their account per contract. That equates to absurd maximum leverage of 39.7x. Each gold-futures dollar has up to 40x the gold-price impact as a dollar invested outright!
This chart superimposes gold in blue over speculators’ total gold-futures positions, with long upside bets in green and short downside bets in red. Note that while gold has spent several years struggling with that $1350 overhead resistance, it has carved major higher lows. That has coiled gold into a giant tightening ascending-triangle technical formation. These patterns are usually resolved with strong upside breakouts.
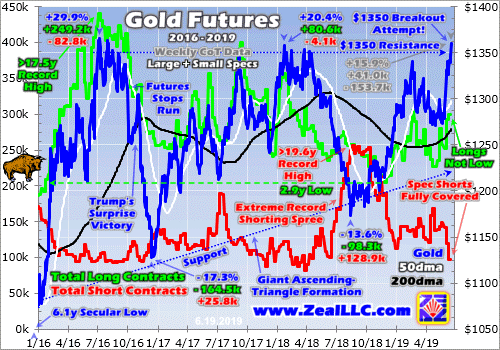
Speculators’ collective gold-futures bets are reported weekly late each Friday afternoon, current to the preceding Tuesday. So the latest data available when this essay was published was as of June 11, 6 trading days before the Fed’s shift into forecasting rate cuts coming. Gold did rally 1.5% over the next Commitments-of-Traders-report week ending this Tuesday the 18th, so specs had to be buying gold futures.
But this latest-available data still offers some great insights. Total spec longs and shorts were running 299.1k and 97.1k gold-futures contracts nearing the FOMC decision. Those shorts were actually at a 14.3-month low, leaving big room for aggressive short selling. I was worried heading into this week’s Fed meeting that it would disappoint by not being dovish enough, igniting a dollar rally triggering gold-futures shorting.
With shorts so low, the risk of a short-term gold selloff remains high. But high gold prices really stamp out any zeal traders have for short selling gold futures at extreme leverage. At 39.7x, a mere 2.5% gold rally would wipe out 100% of the capital risked by short sellers! So in the several months following recent years’ major $1350 breakout attempts, spec shorts stayed low. They didn’t climb until gold started falling.
Major gold uplegs have three stages. They are initially triggered by gold-futures short covering which quickly exhausts itself after a couple months or so. Note above that gold’s 15.9% upleg as of Wednesday was largely fueled by a massive 153.7k contracts of short covering! That was necessary after spec short selling soared to all-time-record highs late last August, forcing gold to the lows which birthed this upleg.
After first-stage short covering, the second stage is fueled by gold-futures long buying. So far that has been relatively minor, just 41.0k contracts as of the latest CoT data. Again heading into the FOMC, the specs were only long 299.1k contracts. That is much lower than at past $1350-breakout attempts, which implies much more room to keep buying from here. This is very bullish for gold unless short selling flares up.
Back in early July 2016 when gold rocketed to this bull’s initial $1365 peak, it was fueled by spec longs soaring to 440.4k contracts! That was a whopping 141.3k or 47.2% higher than the latest read. The next major $1350 breakout attempt came in early September 2017, driven by total spec longs surging way back up to 400.1k contracts. That too was 101.0k or 33.8% higher than recent levels leading into the Fed.
In late January 2018 that vexing upper resistance repelled another valiant gold breakout attempt. Total spec longs crested at 356.4k then. That was 57.3k or 19.2% higher than the latest data. So assuming there wasn’t massive gold-futures long buying leading into this Tuesday, there’s still room for gold-futures speculators to buy another 57k to 141k contracts! Such big long buying would propel gold well higher from here.
But far more bullish than that is the potential stage-three investment buying. While speculators have the leverage, investors control vastly-larger pools of capital. All the stage-one gold-futures short covering and stage-two gold-futures long buying is just an ignition mechanism to entice investors to return. Once they do, their big capital inflows can ignite strong virtuous circles of buying that persist for months or even years.
The higher gold climbs, the more investors want to own it. The more they buy, the higher gold rallies. As investors love chasing winners, nothing drives buying like new highs. New-high psychology is easily the most-powerful motivator fueling big investment buying. And gold investment remains very low even this week as gold’s bull-market breakout neared. This is evident in the leading gold ETF’s gold-bullion holdings.
The American GLD SPDR Gold Shares dominates the gold-ETF world, acting as the primary conduit for American stock-market capital to flow into and out of gold. I discussed this in depth a couple months ago in another essay on stock euphoria and gold. As of this Wednesday as gold surged back to $1360 on that Fed capitulation from tightening, GLD held 764.1 metric tons of physical gold bullion for its shareholders.
In early July 2016 when gold first hit $1365, GLD’s holdings ran far higher at 981.3t. That was 217.2t or 28.4% higher than this week’s levels! At that next major $1350 breakout attempt in early September 2017, GLD’s holdings were 836.9t or 9.5% above today’s levels. And at January 2018’s attempt this key metric for gold investment hit 849.3t, or 11.2% higher than this week. There’s lots of room for investors to buy!
GLD’s holdings haven’t really soared since the first half of 2016 when gold rocketed 29.9% higher in this bull’s maiden upleg. That was the last time new bull highs made investors excited about gold. So their potential buying from here is much bigger than the GLD holdings near $1350 breakout attempts suggest. The total GLD build in that huge H1’16 gold upleg was 351.1t or 55.7%. Consider that from recent lows.
In early October GLD’s holdings sunk to a deep 2.6-year secular low of 730.2t. That was before the US stock markets started plunging in Q4’s severe near-bear correction, so gold was deeply out of favor with stock euphoria extreme. A similar total build of 350t from there as gold returns to favor among investors would push GLD’s holdings over 1080 metric tons. That would represent a 47.9% total upleg build, not extreme.
And American stock investors pouring enough capital into GLD to force it to grow its physical-gold-bullion holdings to 1080t isn’t a stretch. Back in early December 2012 fully 15.6 months after gold’s last secular bull peaked, GLD’s holdings hit their all-time high of 1353.3 metric tons. That’s 77% higher than this week’s levels, proving investors have vast room to shift capital back into gold given their current low allocations.
One way of inferring gold investment is looking at the ratio of the value of GLD’s gold holdings to the total market capitalization of all 500 elite S&P 500 companies. From 2009 to 2012 that averaged 0.475%, for an implied gold portfolio allocation near 0.5% for American stock investors. That’s terrible, as every investor needs a 10% allocation in gold and its miners’ stocks! But 0.5% is still far higher than today’s levels.
When the SPX recently peaked at the end of April, this ratio was running around 0.12%. That’s only a quarter of that average from recent years before gold fell deeply out of favor. Today investors are so radically underinvested in gold that their portfolio allocations need to quadruple from here to merely return to quasi-normal levels! So there’s room for great amounts of capital to return to gold, driving it much higher.
Again my data cutoff for this essay was Wednesday’s close, before gold started breaking out. At that point its gold bull to date was 29.9% higher at best as of several years earlier. The last secular gold bull ran between April 2001 to August 2011. Over that 10.4-year span, gold powered a massive 638.2% higher! So gold ultimately doubling or tripling from this bull’s birthing low of $1051 certainly isn’t a stretch at all.
With this gold bull finally breaking out after several years of vexing failures, there are dozens of charts I’d like to share today. But I’m settling with three so you don’t have to read a book. Again June happens to be gold’s weakest time of the year seasonally, which gold’s breakout surge is bucking. But despite the wonderful emerging new-high psychology, gold’s advance isn’t particularly outsized even for summer doldrums.
This chart looks at gold’s average summer performances in all modern bull-market years. Each summer is individually indexed to its final close in May, keeping gold price action perfectly comparable regardless of prevailing levels. The yellow lines show 2001 to 2012 and 2016 to 2017. Last year’s summer action is rendered in light blue for easier comparison. All these lines are then averaged together into the red one.
That reveals the center-mass drift trend of gold in market summers, which include June, July, and August proper. Gold’s current 2019 summer action is superimposed over all that history in dark blue. At least as of gold’s $1360 Wednesday close following the FOMC, it was only up 4.2% summer-to-date. That is still within the typical gold summer trend of +/-5% from May’s close. This gold summer rally is big, but not extreme.
As I continue writing this essay early Thursday afternoon, gold is trading near $1386. That is up 6.2% since the end of May. In the summer of 2016 the last time gold was in favor and enjoying that new-high psychology, it rocketed as high as +12.3% summer-to-date by early July. So while early summers tend to be weak, gold can still power higher in the right conditions. And a major bull-market breakout is definitely it!
The main beneficiary of higher gold prices is the gold miners. They enjoy big profits leverage to gold as its price rallies higher. Last week I wrote a whole essay on this “Gold-Stock Upleg Mounting” where I went into leverage. The leading gold-stock benchmark is the GDX VanEck Vectors Gold Miners ETF. In mid-May I dug into its component gold miners’ latest Q1’19 results, revealing their current fundamentals.
The GDX gold miners’ average all-in sustaining costs last quarter were $893 per ounce mined. When compared to Q1’s average gold price near $1300, at $1400 and $1500 gold the major gold miners’ profits would soar 25% and 49% higher! So naturally gold-stock prices are surging with gold’s awesome bull-market breakout this week. Here’s the latest chart of gold-stock performance per GDX as of Wednesday.
Since late 2016 the gold stocks have been trapped in a giant consolidation by gold remaining mostly out of favor with investors. That manifested in GDX terms in a major trading range running from $21 lower support to $25 upper resistance. On Fed Day as gold rallied to $1360, GDX’s price climbed to $24.00 on close. That was a 16.7-month high for this leading gold-stock benchmark, and nearing its own breakout.
Early Thursday afternoon as I pen this essay, GDX has surged again to $25. That’s right at that major resistance line of recent years. A decisive breakout from here would portend gold stocks finally being off to the races again. And that means enormous gains for contrarian speculators and investors. In essentially the first half of 2016 as gold blasted 29.9% higher, GDX skyrocketed 151.2% for huge 5.1x leverage!
As of Wednesday this current gold-stock upleg per GDX only had 36.6% gains. As gold’s own new-high psychology makes gold stocks alluring again, they should soar dramatically from here. We haven’t seen a real gold-stock upleg in several years. Just like gold, when its miners’ stocks are powering to new highs buying begets buying. Traders love chasing their gains which fuels a glorious virtuous circle of capital inflows.
For years traders have told me they were avoiding gold stocks until something big changed. And there is nothing bigger for this high-potential sector than new gold-bull highs. All the stars are aligning for big gold-stock gains in the coming months, with their technicals, sentiment, and fundamentals all looking very bullish. This is not the summer to check out, but to do your homework and get deployed in great gold stocks.
Unfortunately the major gold miners dominating GDX are failing to grow their production. That along with their large market caps means smaller mid-tier and junior gold miners with superior fundamentals will enjoy far-better upside as gold climbs higher. While GDX should amplify gold’s gains by 2x to 3x, that will be dwarfed by the epic gains in better smaller miners. Major gold uplegs are a gold-stock pickers’ market!
One of my core missions at Zeal is relentlessly studying the gold-stock world to uncover the stocks with superior fundamentals and upside potential. The trading books in both our popular weekly and monthly newsletters are currently full of these better gold and silver miners. Mostly added in recent months as gold stocks recovered from selloffs, their unrealized gains were already running as high as +108% on Wednesday!
If you want to multiply your capital in the markets, you have to stay informed. Our newsletters are a great way, easy to read and affordable. They draw on my vast experience, knowledge, wisdom, and ongoing research to explain what’s going on in the markets, why, and how to trade them with specific stocks. As of Q1 we’ve recommended and realized 1089 newsletter stock trades since 2001, averaging annualized realized gains of +15.8%! That’s nearly double the long-term stock-market average. Subscribe today and take advantage of our 20%-off summer-doldrums sale!
The bottom line is gold is finally breaking out to new bull-market highs! Somehow the FOMC managed to be dovish enough in its rate-cut outlook this week to drive US-dollar selling, which unleashed major gold buying. So gold blasted back over its bull-to-date peak from several years earlier that had oppressed it for so long. Gold hasn’t enjoyed new-high psychology since then, which is a powerfully-bullish motivating force.
New bull highs bring gold back into the limelight, making it attractive again. Traders love chasing winners to ride their upside momentum, and buying begets buying. Gold coming back into favor portends much more upside to come, with room for big buying by both gold-futures speculators and far-more-important investors. As their capital inflows push gold to new bull-market heights, the gold stocks are going to soar!
Adam Hamilton, CPA
June 24, 2019
Copyright 2000 – 2019 Zeal LLC (www.ZealLLC.com)
Gold has finally broken out to the upside.
In Asia trading on Thursday, Gold exploded through the $1360 to $1370 resistance zone and was able to hold the gains throughout the day, closing above $1395/oz.
As we pen this article, Gold has to chance to break $1400/oz by the weekend. The close of the month (and quarter) next week will provide an additional clue as to the sustainability of this strength.
The gold stocks meanwhile have been on an absolute tear. GDX is up 16 of the past 17 trading days and has gained 23% over that period. GDXJ is up 13 of the past 17 sessions and has also gained 23% during that period.
GDX closed right at resistance at $25. It could blow through it and reach a multi-year high at $27 or it could first correct and consolidate around $25.
GDX’s various indicators are very encouraging but not quite at confirmed bull market levels.
Roughly a third of GDX made new highs, which is the highest amount since August 2016. Also, 79% of miners closed above the 200-day moving average. Surpassing 90% would be quite bullish.
The GDX to S&P ratio needs to close above its recent peak to signal sustainable relative strength.
Turning to GDXJ, we see that it is slightly behind GDX in nominal and relative terms. It faces a bit of resistance here around $35 but more resistance at $37.
The percentage of GDXJ stocks above the 200-day moving average and at new highs are at very encouraging levels but need to advance higher to confirm a new bull market.
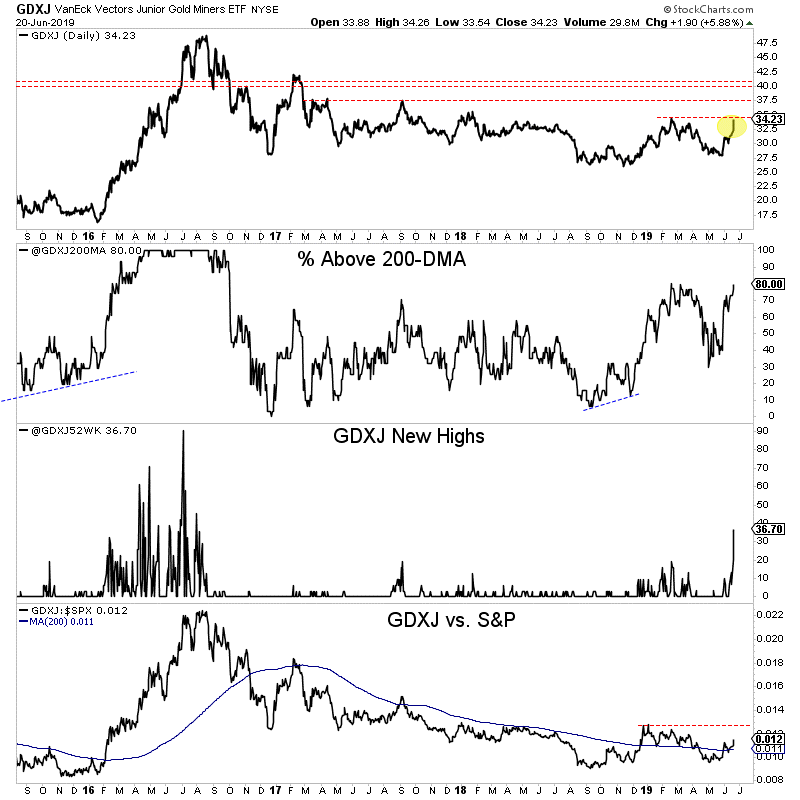
Assuming Gold maintains current strength without more than a minor retest of previous resistance then we should look for GDX and GDXJ to approach the aforementioned resistance targets. Initially, that means GDX $27 and GDXJ $37.
If the miners were to reach those targets then these various indicators should reach bull market levels at the same time.
The fundamentals are finally in place for precious metals (as we’ve mentioned in recent articles) and that, along with bullish technicians is why we should remain bullish.
Unless Gold loses the breakout gains into the end of the quarter, then I would not anticipate too much of a pullback. Bull moves tend to remain overbought with overly bullish sentiment.
As we noted last week, the gold stocks, junior gold stocks and Silver are ready to explode higher once the breakout move in Gold is confirmed. To learn which stocks we own and intend to buy that have 3x to 5x potential, consider learning more about our premium service.
By Jordan Roy-Byrne CMT, MFTA
June 21, 2019
- It’s my firm belief that most Americans are living in a fantasy world where a superhero named President Trump is going to negotiate fabulous “America-first” trade deals with cowering governments around the world… and Americans will then magically relive the 1950s with massive GDP growth, even while QE to infinity becomes as American as apple pie.
- The reality of the situation is almost the exact opposite of this fantasy world; de-dollarization is relentless and American government size and debt growth is totally out of control.
- China is an economic bullet train carrying 1.4 billion gold-focused passengers. It’s blasting through a melting block of American fiat-focused butter, and India’s citizens are poised to take everything China’s citizens are doing to even greater gold-oriented heights.
- The rise of the Chindian gold-oriented economic empire and the decline of the American empire are both unstoppable processes.
- There’s no question that Trump will negotiate numerous trade deals with more favourable terms for America than his presidential predecessors ever did, but the tariff taxes involved mean these deals create less global growth rather than more.
- These taxes are also inflationary.
- A “big” trade deal between China and American is unlikely, but even if it happens it would probably add only about half a point to the current pathetic level of U.S. GDP growth in the short term, and it wouldn’t stop the business cycle from peaking.
- The cycle is peaking. Recession is coming.
- Please click here now. Double-click to enlarge. A breakout above $1362 targets $1450.
- Simply put, the peak in the business cycle is when sane investors buy gold and silly children try to relieve the 1950s by price-chasing the U.S. stock market.
- I’m long the stock market, but I’m not buying new and bigger core positions. I consider that an act of financial madness.
- Please click here now. Double-click to enlarge. It’s been a great ten-year run for the stock market, and now it’s clearly time to book some profits, fade position size, buy gold, and wait for the next bear market in stocks to bring a major buying opportunity.
- Please click here now. Double-click to enlarge. There is no asset class that does as well as gold does as the business cycle peaks, and this cycle peak might include the interesting arrival of… inflation.
- Note the similarity of the current action in the inverse H&S bull continuation pattern to the price action in late 2009. Gold is poised for a major upside breakout.
- I think the U.S. business cycle peak will force Trump to change tactics from trying to extend the cycle with tariff taxes and he’ll focus on devaluing the dollar. If he loses the election, the democrats are also likely to pursue dollar devaluation. It’s win-win for gold.
- I expect this U.S. business cycle peak will be followed by a substantial period of growing stagflation.
- That means the Dow could gyrate between about 15,000 and 30,000 for years in a stagflationary quagmire, much like it gyrated between 500 and 1000 in the 1970s as stagflation lorded over all markets.
- “Right now, they’ll just give a very dovish message that leans toward a July rate cut. The market is worried enough about weakness in China, inflation undershooting and the possibility that tariffs disrupt the global supply chain that it’s hard for me not to think the Fed won’t be moving faster than people thought.” – Joe LaVorgna, chief economist for the Americas, Natixis, June 14, 2019.
- Mike Grapen is chief economist at Barclays bank, and he’s predicting a half-point cut in July! The bottom line is that while the long-term outlook for America is empire-fade and stagflation, the Fed is still a powerful central bank and the main driver of the U.S. stock market.
- On that note, please click here now. Double-click to enlarge this short-term Nasdaq stock market chart. While big core positions should be reduced as the business cycle matures, short-term trading should be embraced.
- At my https://guswinger.com swing trade site, I’m betting the Fed makes a dovish statement at tomorrow’s key meeting, and that creates short-term buying of the stock market… and gold!
- Please click here now. Double-click to enlarge this GDX chart. The current Fed meet should be bullish for gold stocks. What about the July meet?
- Well, that should be even more bullish! A big rate cut in July may not be enough to save the stock market from the tariff tax quagmire it’s sinking into as the business cycle peaks.
- That’s because institutional money managers traditionally begin to sell the stock market as the Fed cuts rates at the peak of the cycle and… they buy gold! Once tomorrow’s Fed meet is out of the way, it will be time for gold stock investors to get bold, reduce hedges, buy all dips, and… enjoy!
Special Offer For Website Readers: Please send me an Email to freereports4@gracelandupdates.com and I’ll send you my free “Gold & Silver Miners, A Perfect Mix!” report. I highlight key gold and silver miners that are poised fly in July! Key buy and sell tactics for each stock are included.
Thanks!!
Cheers
Stewart Thomson
Graceland Updates
Written between 4am-7am. 5-6 issues per week. Emailed at approx 9am daily.
Email:
Graceland Updates daily between 4am-7am. They are sent out around 8am-9am. The newsletter is attractively priced and the format is a unique numbered point form. Giving clarity of each point and saving valuable reading time.
Risks, Disclaimers, Legal
Stewart Thomson is no longer an investment advisor. The information provided by Stewart and Graceland Updates is for general information purposes only. Before taking any action on any investment, it is imperative that you consult with multiple properly licensed, experienced and qualified investment advisors and get numerous opinions before taking any action. Your minimum risk on any investment in the world is: 100% loss of all your money. You may be taking or preparing to take leveraged positions in investments and not know it, exposing yourself to unlimited risks. This is highly concerning if you are an investor in any derivatives products. There is an approx $700 trillion OTC Derivatives Iceberg with a tiny portion written off officially. The bottom line:
Are You Prepared?
The gold miners’ stocks have surged powerfully over the past few weeks, challenging upleg highs. Traders started returning to this small contrarian sector as gold blasted back above the psychologically-crucial $1300 line. While such early-summer strength is atypical, gold miners’ technicals, sentiment, and fundamentals all support more gains to come. Gold stocks need to mean revert to much-higher price levels.
Traders usually track gold-stock fortunes with this sector’s most-popular exchange-traded fund, the GDX VanEck Vectors Gold Miners ETF. Launched in May 2006, this was the maiden gold-stock ETF. That big first-mover advantage has helped propel GDX to sector dominance. This week its net assets of $9.7b ran 46.5x larger than the next-biggest 1x-long major-gold-miners ETF! GDX is this sector’s leading benchmark.
And it sure didn’t look pretty in May, with traders wanting nothing to do with gold stocks. GDX spent the great majority of last month languishing near its 200-day moving average. Just a few weeks ago on May 29th, GDX closed at $20.42. That was down 3.2% year-to-date, much worse than gold’s own slight 0.2% YTD decline. The gold stocks were really out of favor, just like the metal they mine which fuels their profits.
This sector started perking up on May 30th, when gold and GDX enjoyed 0.7% and 1.7% rallies. Major gold miners’ inherent profits leverage to gold usually helps their stock prices amplify gold’s gains by 2x to 3x. But there was still no excitement with gold and GDX trading at $1288 and $20.77 heading into June. Early market summers have gold’s weakest seasonals of the year, usually weighing on it and the miners.
But leave it to Trump to unleash a bombshell shaking the status quo. That evening he shocked, tweeting “On June 10th, the United States will impose a 5% Tariff on all goods coming into our Country from Mexico, until such time as illegal migrants coming through Mexico, and into our Country, STOP. The Tariff will gradually increase until the Illegal Immigration problem is remedied, at which time the Tariffs will be removed.”
The White House said those tariffs would be ratcheted up 5% each month until they hit their terminal 25% level on October 1st! While Trump later suspended his Mexico-tariff threat, it really surprised traders. Not only was Trump opening up a new front in the trade wars, but he was tying tariffs to non-trade issues as a hardline negotiating tactic. That had serious implications, so Asian traders flooded into gold after that tweet.
The next day that new momentum spilled into the US, driving gold 1.3% higher to $1305. Long-apathetic gold-stock traders rejoiced at seeing gold claw back over $1300. That has proven a crucial level for gold sentiment for years now, the dividing line between popular bearishness and bullishness. GDX shot up 3.9% that day. Asian traders bought gold aggressively heading into the next trading day, driving a $1300 breakout.
That upside action again carried into U.S. markets on June 3rd, when gold powered another 1.5% higher to $1325. The major gold stocks’ gains mounted, with GDX surging another 4.2% to $22.49. In those two trading days following Trump’s Mexico-tariff threat, this leading gold-stock ETF blasted 8.3% higher on a 2.8% gold surge! GDX’s gains were amplifying gold’s breakout rally by a strong 3.0x, rekindling sector interest.
There’s nothing speculators and investors like more than chasing winners, riding the momentum. So that newfound gold and gold-stock buying persisted. By this Wednesday’s data cutoff for this essay, gold had powered 4.1% higher since May 29th. True to form, the major gold stocks as measured by GDX rocketed up 12.4% in that same span for 3.0x leverage. The gold miners’ stocks are starting to return to favor again!
Their strong gains in recent weeks didn’t erupt from major lows, but from a lull in a solid existing upleg. This chart looks at GDX over the past several years or so, across the life of gold’s current bull market. It is important to consider big moves in broader technical context, as that offers clues on what’s likely next. The gold miners’ stocks have lots of room to rally much higher from here, with major-upside-breakout potential.
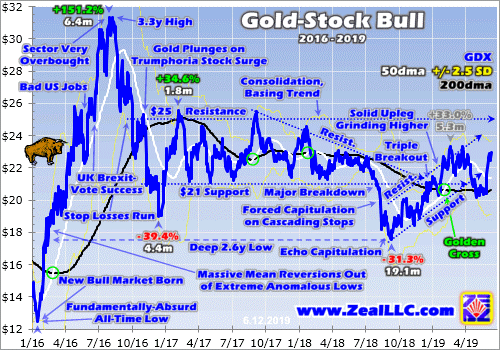
While this week’s $23ish GDX levels feel high after May’s disheartening 200dma grind, they are actually fairly low. Since late 2016 GDX has mostly meandered in a major consolidation trend running from $21 support to $25 resistance. $23 is right in the middle of that long basing channel, which isn’t noteworthy at all technically. The gold miners’ stocks won’t get exciting again until GDX breaks out decisively above $25.
The past few weeks’ big surge is simply part of an in-progress upleg born in deep despair back in early September. That episode was brutal. All-time-record gold-futures short selling hammered the metal to 19.3-month lows. That unleashed cascading stop-loss selling in gold stocks, an ugly forced capitulation that crushed GDX to deep 2.6-year secular lows. All the gains since are just a normal mean reversion higher.
Gold stocks’ recovery from those anomalous extreme lows has already passed plenty of bullish technical milestones. GDX’s series of higher lows and higher highs carved the nice uptrend rendered above. This leading sector benchmark enjoyed a major triple breakout, climbing back over three key resistance zones including GDX’s 200dma. A powerful Golden Cross buy signal flashed as GDX’s 50dma surged over its 200dma.
By late February this young gold-stock upleg had lifted GDX 33.0% higher to $23.36. But there was no reason for gold stocks’ mean reversion higher to fail there. Those gains remained relatively small by sector standards. Back in essentially the first half of 2016, GDX skyrocketed 151.2% higher in a monster upleg on a parallel 29.9% gold one! And gold-stock uplegs during gold’s last bull averaged bigger gains too.
Before GDX came along, the primary gold-stock benchmark was the classic HUI NYSE Arca Gold BUGS Index. Like GDX it tracks most of the same major gold stocks, so HUI and GDX price action are usually indistinguishable. The last gold-stock bull straddling GDX’s birth saw the HUI soar 1664.4% higher over 10.8 years between November 2000 to September 2011! Those gains accrued over 12 separate uplegs.
One was an anomaly, the epic mean-reversion rebound after late 2008’s first-in-a-century stock panic. Excluding it, the other 11 normal gold-stock uplegs in that last bull averaged 80.7% gains over 7.9 months per the HUI! So GDX’s 33.0% upleg-to-date advance as of late February was nothing, way too small to be mature. Odds are it will yet grow much larger in line with past precedent before giving up its ghost.
Mid-upleg selloffs after big surges are normal and healthy to rebalance sentiment. If greed becomes too excessive early in uplegs, it can prematurely exhaust them by pulling forward too much future buying. In most cases mid-upleg pullbacks bounce at upleg support. But that didn’t hold in late April, as GDX fell even farther to its 200dma. That was the result of extreme stock-market euphoria stunting gold demand.
The gold stocks were down but not out, simply awaiting signs of life in gold before traders returned. That came in late May after the stock markets had entered a pullback and Trump’s Mexico-tariff threat rattled traders. GDX quickly leapt back up into its upleg’s uptrend channel, proving it is alive and well. Overall this upleg’s technicals remain very bullish, pushing this leading ETF’s price ever closer to a major upside breakout.
For the better part of several years now, GDX $25 has proven gold stocks’ graveyard in the sky. They’ve challenged it several times, but haven’t been able to decisively break though. They certainly can go much higher. In this gold bull’s monster initial upleg in H1’16, GDX rallied as high as $31.32. And near the end of gold’s last secular bull, this ETF peaked at $66.63 in September 2011. There’s nothing magical about $25.
And it isn’t far away at all. As of the middle of this week, GDX merely had to rally 8.9% more to regain $25! That’s nothing for a sector as volatile as gold stocks. Remember just a few weeks ago GDX surged 8.3% in only two trading days as gold powered back over $1300 after Trump’s Mexico-tariff threat. So a major gold-stock breakout that would radically improve sector psychology is very much within reach today.
The higher gold stocks climb, the more traders will want to buy them to ride that momentum. The more capital they deploy, the more gold stocks will rally. This normal virtuous circle of improving psychology and buying will become even more exaggerated as GDX $25 is surpassed. Seeing the highest gold-stock levels in several years will work wonders to improve sector sentiment, unleashing widespread bullishness.
This gold-stock upleg’s potential gains are massive spanning such a major upside breakout. Remember speculators and investors love chasing winners, so the higher gold stocks rally the more attractive they’ll look. If GDX’s current upleg grows to the last secular bull’s average upleg gain of 80.7%, it would catapult this ETF to $31.75. The major factor almost certain to push GDX well over $25 is gold’s own breakout.
Much like GDX $25, gold’s own bull since December 2015 has been capped near $1350 ever since. Last week I wrote a whole essay explaining why gold is winding closer and closer to blasting through that to new bull-market highs. New-bull-high psychology in gold would spark a frenzied rush to bring neglected gold stocks back into portfolios. Weakening general stock markets should create the necessary gold demand.
Gold stock sentiment is merely decent today, average at best even after recent weeks’ sharp surge. That leaves lots of room for improvement. The more bullish traders get on gold miners’ stocks, the more they will want to buy. Gold miners’ shift back into favor could easily propel GDX back above $25 anytime in the coming months. But we may have to wait until August, after the worst of the gold summer doldrums pass.
Normally this time of year I’d be updating my gold-summer-doldrums research. But that takes a backseat to the recent gold and gold-stock surges. In a nutshell, Junes and Julys are the weakest time of the year seasonally for gold with no recurring outsized gold-demand spikes. Gold and gold stocks can rally during early summers if unexpected demand materializes, but they usually don’t. Will summer 2019 prove an exception?
I sure hope so, but only time will tell. This next chart looks at the HUI’s average summer performances in all modern gold-bull-market years. Each summer is individually indexed to its final close in May, keeping gold-stock price action perfectly comparable regardless of prevailing gold levels. The yellow lines show 2001 to 2012 and 2016 to 2017. Last year’s summer gold-stock action is rendered in light blue for comparison.
All these lines averaged together form the red one, revealing the center-mass drift trend of gold stocks in market summers. Gold stocks’ current 2019 summer action is superimposed over all that in dark blue. As you can see, this sector is off to one of its best summer starts in all modern bull-market years! That could be sustainable like summer 2016’s powerful run, or gold stocks may end up consolidating until August.
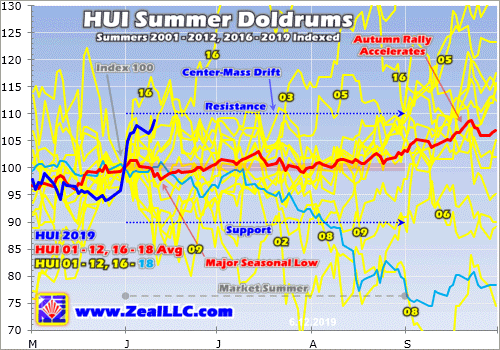
Which way this summer plays out depends on gold. If gold keeps climbing on balance, so will the stocks of its miners regardless of seasonal tendencies. Weakening stock markets would spur gold investment demand continuing to push its price higher. A weaker U.S. dollar would also help, motivating gold-futures speculators to buy as well. Only time will tell whether the gold and gold-stock breakouts come sooner or later.
Whatever the timing, the gold miners’ fundamentals remain strong and bullish and support much-higher stock prices. After every quarterly earnings season, I dig deep into the GDX gold miners’ fundamentals. They finished reporting their latest Q1’19 results about a month ago, and I wrote a comprehensive essay analyzing them. There’s no doubt fundamentally that gold stocks should be trading way over GDX $25 levels.
Stock prices are ultimately determined by underlying corporate earnings, and for the gold miners that is totally dependent on prevailing gold prices. Gold-mining costs are best measured in all-in-sustaining-cost terms. In Q1’19 the GDX gold miners’ AISCs averaged $893 per ounce. That’s right in line with the prior four quarters’ trend of $884, $856, $877, and $889. Gold-mining profits are going to soar with higher gold.
Gold averaged $1303 in Q1 when the major gold miners were producing it for $893. That implies they were earning $410 per ounce mined. $1400 and $1500 gold are only 7.4% and 15.1% higher from there. As the GDX gold miners’ AISCs reveal, gold-mining costs are largely fixed from quarter to quarter and don’t follow gold higher. So assuming flat AISCs, gold-mining profits surge to $507 at $1400 and $607 at $1500.
That’s 23.7% and 48.0% higher from Q1’19 levels on mere 7.4% and 15.1% gold gains from that quarter’s average price! And as of the middle of this week, gold had already climbed 2.3% of that. The major gold miners’ fundamentals are already bullish, but improve greatly at higher prevailing gold prices. With earnings growth hard to come by in general stock markets this year, the gold stocks will be even more alluring.
All the stars are aligning for big gold-stock gains in coming months, with their technicals, sentiment, and fundamentals all looking very bullish. This mounting gold-stock upleg has great potential to grow much larger later this year, greatly rewarding contrarian traders buying in early. More and more investors are becoming aware of this sector’s huge potential, including elite billionaires running major hedge funds.
This week one of them, Paul Tudor Jones, gave an interview in New York. He was asked what his best trade over the next year or two will be. He said, “The best trade is going to be gold. If I have to pick my favorite for the next 12 to 24 months it probably would be gold. I think gold goes beyond $1400, it goes to $1700 rather quickly. It has everything going for it in a world where rates are conceivably going to zero…”
This is not the summer to check out, but to do your homework and get deployed in great gold stocks. All portfolios need a 10% allocation in gold and its miners’ stocks! Many smaller mid-tier and junior miners have superior fundamentals and upside potential to the majors of GDX. And by the time the gold stocks get really exciting again in upside breakouts with gold, much of the easy gains will have already been won.
One of my core missions at Zeal is relentlessly studying the gold-stock world to uncover the stocks with superior fundamentals and upside potential. The trading books in both our popular weekly and monthly newsletters are currently full of these better gold and silver miners. Mostly added in recent months as gold stocks recovered from selloffs, their prices remain relatively low with big upside potential as gold rallies!
If you want to multiply your capital in the markets, you have to stay informed. Our newsletters are a great way, easy to read and affordable. They draw on my vast experience, knowledge, wisdom, and ongoing research to explain what’s going on in the markets, why, and how to trade them with specific stocks. As of Q1 we’ve recommended and realized 1089 newsletter stock trades since 2001, averaging annualized realized gains of +15.8%! That’s nearly double the long-term stock-market average. Subscribe today and take advantage of our 20%-off summer-doldrums sale!
The bottom line is this gold stock upleg is mounting. Despite weak early-summer seasonals, the gold miners’ stocks are rallying with gold and nearing a major breakout above GDX $25. Seeing the best gold-stock prices in several years will really motivate traders to return, fueling a virtuous circle of capital inflows and gains. Gold stock technicals, sentiment, and fundamentals all support much-higher prices ahead.
Gold’s own inexorably-nearing major bull-market breakout will really light a fire under gold stocks. The higher gold climbs, the more investors and speculators will want to own it and its miners. While summer may force a consolidation, softening stock markets could easily overcome gold’s weak seasonals. The potential gold-stock gains as gold returns to favor are massive, so it’s important to get deployed early.
Adam Hamilton, CPA
June 17, 2019
Copyright 2000 – 2019 Zeal LLC (www.ZealLLC.com)
The more times a level is tested, the weaker it becomes and the more likely it is to break.
Once again, Gold has rallied up to the wall of resistance in the $1350 to $1375 region. Gold has previously tested that wall a handful of times but failed to break through.
This time, Gold is in position to punch through and I will explain why.
First, we can allude to what we already wrote. The more times a level is tested, the more likely it is to break. By virtue of testing resistance again, Gold is already in a better position.
Second, the fundamentals are moving into place.
Specifically, market-based indicators of real interest rates (the fundamental driver for Gold) are falling in anticipation of Fed easing, which is nearly a given at this point.
Over the past year, we’ve noted that in 11 of the 13 rate-cut cycles since 1955, gold stocks have averaged a 172% gain from the bottom (usually a few months before) around the first rate cut.
In short, the start of a rate cut cycle is usually very bullish for precious metals. This was not in place in 2017 or 2018 but should be for the second half of 2019.
Third, Gold is in position to break resistance while the US Dollar technically remains in an uptrend but in a weak state. At present, the dollar is not oversold nor does it appear likely to blast higher.
In the summer of 2016, the dollar had already put in a higher low while in late 2017 and early 2018, the dollar broke to new lows but Gold failed to break through.
If the greenback were to weaken and lose its 40-week moving average (which it has held for over a year), it should push Gold past $1400/oz and potentially to $1500/oz.
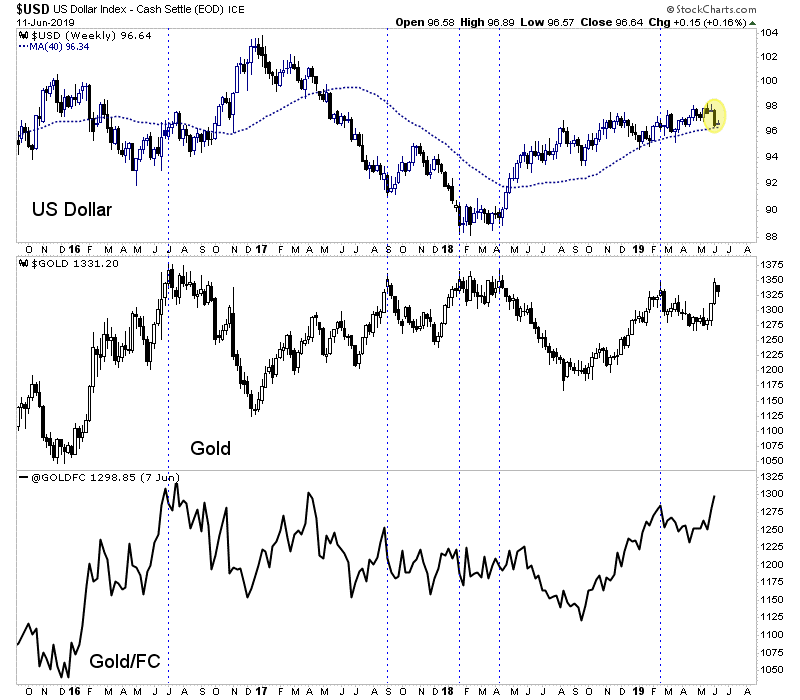
If the Fed follows through and we get multiple rate hikes before 2020, Gold should break the wall of the resistance. Couple that with a breakdown in the dollar and Gold could reach $1500/oz or even higher.
We anticipate the gold stocks, junior gold stocks and Silver could explode higher once Gold breaks that wall of resistance. To learn which stocks we own and intend to buy that have 3x to 5x potential, consider learning more about our premium service.
Jordan Roy-Byrne, CMT, MFTA
June 14,2019
- A lot of Americans getting a myriad of government entitlements thought that President Trump would recreate the 1950s for them.
- If Trump had eliminated the PIT (personal income tax), capital gains tax, and corporate income tax, I’ve estimated that around $100 trillion in capital would have surged into America.
- That would have created a super-sized version of what Switzerland achieved at its peak.
- Sadly, Trump and his team didn’t do that, mainly because they are giving the citizens what they want; bigger government, more debt, and more storytelling.
- To understand what is likely coming next for America, please click here now. Mike Wilson does a near-perfect job of outlining what I believe is in store for H2 of 2019.
- Yesterday, Goldman Sachs’ chief economist was quite adamant that the consensus prediction of three rate cuts in the second half of this year would go awry, and the Fed will not cut at all.
- The risks are clearly rising for U.S. stock market investors.
- My biggest concern is that many Americans sold a lot of their gold stocks into the lows and are now aggressively buying the US stock market. The size of their buying is quite large.
- Unfortunately, their buying appears to be based mostly on Trump’s frequent “Let’s make America great!” pump-up tweets, rather than prudent study of the business cycle.
- The U.S. business cycle is very late stage now, and that’s when investors must reduce stock market exposure and increase exposure to gold!
- Having said that, please click here now. Double-click to enlarge this TQQQ triple-leveraged Nasdaq ETF chart.
- Almost 80% of mainstream stock market analysts predict the Fed will cut in July. If they are correct, the stock market will likely soar to new highs. If they are wrong, the market likely begins crashing at the start of August.
- A lot of stocks in the Dow Jones Industrials index are already at new highs, and that’s usually a sign that the indexes will make new highs too, regardless of whether a crash follows soon after that. I think new highs for the indexes occurs ahead of the July Fed meeting. That meeting also likely marks the final bull market peak for the U.S. stock market.
- At my https://guswinger.com swing trade service, we are long the stock market via TQQQ. My system is mechanical; I am always either long or short the Nasdaq via TQQQ/SQQQ. I’m also always long or short gold stocks via NUGT/DUST.
- Even if the Fed doesn’t cut rates at the July 31 meeting, the market has about six weeks to keep rallying before getting disappointed by the Fed’s decision.
- Also, I would not rule out a rate cut, because the Fed has tended to support the stock market whenever it gets into trouble. The Fed has also tended to support the U.S. government with lower rates when the government wants to borrow a lot of money.
- What about gold? Well, I suggested that investors should brace themselves for a pullback from $1350. That’s clearly in play this week as the stock market rallies. Also, Indian dealers have reduced their buying after the big gold price surge.
- Please click here now. Double-click to enlarge this daily gold chart. The most impressive event in the rally from the $1272 area is the creation of a new up channel!
- A range trade for gold is likely now. I think it will be in the $1310-$1350 area, although a wider range of $1292-$1350 is also possible. I’m happily short gold stocks at my swing trade service via DUST/JDST after a big NUGT/JNUG win, but I do expect some gold stocks to keep rallying even as gold consolidates in the trading range.
- On that note, please click here now. Double-click to enlarge this Kirkland Lake chart. My swing trade subscribers and I hold call options on this great company. The stock is trading above its February high while most gold stocks are not. This kind of outperformance is what I look for when considering a call options position.
- As GDX tumbled yesterday, Kirkland rallied higher!
- Speaking of GDX, please click here now. Double-click to enlarge. The entire pullback from February is starting to look like a giant flag pattern. The price target of the pattern is about $29.
- Please click here now. Double-click to enlarge. That’s a second look at the GDX chart. Any consolidation that occurs now will build a H&S bull continuation pattern as well as more flag-like price action.
- The July Fed meeting (which occurs as the gold love trade strong demand season begins) could create a stock market inferno and a gold stocks “Rally to the stars”. The bottom line: Investors who pare their stock market exposure as the US business cycle matures and increase their exposure to gold stocks are clearly acting with professionalism and prudence!
Special Offer For Website Readers: Please send me an Email to freereports4@gracelandupdates.com and I’ll send you my free “Golden Junior Giants!” report. I highlight key junior miners that are outperforming in this gold price consolidation zone, with key buy and sell tactics for each stock!
Thanks!!
Cheers
Stewart Thomson
Graceland Updates written daily between 4am-7am. They are sent out around 8am-9am. The newsletter is attractively priced and the format is a unique numbered point form. Giving clarity of each point and saving valuable reading time.
Risks, Disclaimers, Legal
Stewart Thomson is no longer an investment advisor. The information provided by Stewart and Graceland Updates is for general information purposes only. Before taking any action on any investment, it is imperative that you consult with multiple properly licensed, experienced and qualified investment advisors and get numerous opinions before taking any action. Your minimum risk on any investment in the world is: 100% loss of all your money. You may be taking or preparing to take leveraged positions in investments and not know it, exposing yourself to unlimited risks. This is highly concerning if you are an investor in any derivatives products. There is an approx $700 trillion OTC Derivatives Iceberg with a tiny portion written off officially. The bottom line:
Are You Prepared?
Gold surged sharply over the past week or so, nearing a major bull-market breakout! Nearly everyone was surprised by this violent awakening, which erupted suddenly as gold languished around year-to-date lows. If this dramatic rally has staying power, gold has good odds of achieving decisive new bull-market highs. That would change everything psychologically, ushering gold and its miners’ stocks back into favor.
Gold has largely flown under traders’ radars this year, mostly drowning in apathy. Actually this unique asset had a strong start, climbing 4.6% year-to-date by mid-February to hit $1341. While merely a 10.1-month high, gold was close to a major bull-market breakout. For several years now, gold has faced stiff resistance around $1350. It has repelled gold multiple times, looking like an impregnable Maginot Line.
But gold’s promising ascent was short-circuited from there, unleashing a disheartening slump over the next 10 weeks or so. By early May, gold had retreated 5.2% to $1271. The primary culprit was resurgent euphoria in the US stock markets. Equity exuberance has long proven gold’s mortal nemesis. When stock markets are high and expected to continue climbing on balance, gold investment demand often withers.
The recent gold action can’t be understood without the context of the US stock markets as represented by their flagship S&P 500 index (SPX). Heading into last September, the SPX was marching to a series of new all-time record highs. Since gold tends to climb when stock markets sell off, there was little demand for this essential portfolio diversifier. Why buy gold when stocks seem to do nothing but rally indefinitely?
That who-cares sentiment helped fuel all-time-record short selling in gold futures, hammering gold down to $1174 in mid-August for a 19.3-month low. Stuck in the shadows of euphoric stock markets, gold largely drifted sideways from there averaging $1197 until early October. But on October 10th, hyper-complacent stock traders were finally confronted with a serious selloff as the SPX plunged 3.3% that day alone.
Earlier hawkish comments from the Fed chairman were to blame. With stock markets bleeding, traders remembered gold. The world’s leading and dominant gold exchange-traded fund is the GLD SPDR Gold Shares. According to the latest data from the venerable World Gold Council, GLD’s 784.3 metric tons of gold bullion held in trust for its shareholders at the end of Q1’19 represented 31.6% of global gold ETFs’ total.
In early October with the SPX just fractionally under its recent record peak, GLD’s holdings slumped to a deep 2.6-year secular low of 730.2t. But a few trading days later as the SPX’s sudden and sharp plunge started to kill complacency, GLD enjoyed a big 1.2% holdings build. When stock traders buy GLD shares at a faster pace than gold itself is being bought, GLD’s managers equalize that excess demand by buying gold.
That SPX selloff snowballed into a severe near-bear correction, down 19.8% by Christmas Eve. With the stock markets burning, investors remembered the timeless wisdom of prudently diversifying their stock-heavy portfolios with counter-moving gold. It had rallied 8.1% in 4.3 months by the time a super-oversold SPX was ready to bounce. That gold upleg kept growing, ultimately extending to 14.2% gains by mid-February.
But as gold neared that major $1350 bull-market breakout then, stock euphoria came roaring back with a vengeance. The SPX had rocketed 18.2% higher out of its correction low by then, fueled by a radical shift back to dovishness by the Fed! It completely capitulated and caved to the stock markets, declaring that its quantitative-tightening monetary policy was open for adjustment in contrast to earlier statements on QT.
By that point the SPX had regained nearly 3/4ths of its total correction losses, so exuberant-again traders started to forget gold. Gold investment demand peaked in late January the day before the Fed gave in on QT, capping a 12.8% GLD-holdings build over 3.8 months. The higher the SPX rallied in recent months, the greater stock euphoria grew and the more gold was forgotten. Yet again stock euphoria stunted gold.
The SPX peaked at the end of April at another new all-time-record high. That extended its total monster-bounce rebound rally since late December to a colossal 25.3% in 4.2 months! A couple days later in early May with the SPX still near records, gold fell to that $1271 YTD low. Euphoric stock investors’ exodus from gold persisted another week, when GLD’s holdings slumped to 733.2t. That was down 11.0% in 3.3 months.
Gold failed to break out above its years-old $1350 resistance zone in mid-February because skyrocketing stock markets forced it back out of favor. Between late January and mid-May, fully 97% of GLD’s holdings build fueled by the SPX’s severe near-bear correction largely in Q4 had been erased! Just like late last summer, gold was again hostage to lofty euphoric stock markets. Investors wanted nothing to do with it.
But the SPX started rolling over again in May, slowly at first. It was shoved after Trump got fed up with China backtracking on nearly a year’s worth of trade negotiations with the US. On May 5th he warned that tariffs on $200b of annual Chinese imports would blast from 10% to 25% going effective the following Friday. That gradually drove the SPX lower into mid-May, including serious 1.7% and 2.4% down days.
So once again just like in October the last time the SPX rolled over hard, gold caught a bid. It rallied back up to $1299 in mid-May as investors again remembered stock markets can also fall. GLD’s holdings began modestly recovering as stock-market capital started slowly migrating back into gold. But that nascent trend reversed again in mid-May as stock markets bounced sharply higher, unleashing surging euphoria.
The primary driver of gold in recent years has been stock-market fortunes. Gold often falls out of favor when stock markets are high and rallying, then starts returning to favor when they sell off again. In a very real sense gold is the anti-stock trade. While it doesn’t only climb when stock markets weaken, that’s what mainstream investors remember gold for. Its investment demand is rarely strong near stock-market highs.
So gold again slumped back near $1273 by late May as the SPX rebounded, further demoralizing the few remaining contrarians. This metal felt pretty hopeless heading into its summer doldrums, its weakest time of the year seasonally. Then a Trump bombshell shocked stock traders out of their complacency. He warned the US was levying escalating tariffs on all Mexican imports to force Mexico to fight illegal immigration!
Last Friday May 31 was the first trading day after that surprise, and the SPX fell 1.3% to its lowest close since its all-time-record peak a month earlier. That extended its total recent selloff to 6.6%, so worries mounted. Gold had closed at $1288 in the prior day’s US trading session. Overnight after Trump’s tweet on Mexico tariffs gold rallied to $1297. That upside continued in the U.S., with gold closing 1.3% higher at $1305.
$1300 is a critical psychological line, heavily coloring sentiment especially among hyper-leveraged gold-futures speculators. They tend to buy aggressively when gold regains $1300 from below, and sell hard when gold breaks under $1300 from above. But while gold-futures trading heavily influences short-term gold price action, only sustained investment buying can ultimately grow gold uplegs to major status.
GLD’s holdings are the best daily proxy available of gold investment demand. And last Friday when gold surged, GLD merely saw a small 0.3% holdings build. American stock investors weren’t buying gold, it was the gold-futures speculators. These traders control far-less capital than investors, so their available buying firepower to push gold higher is limited. Gold uplegs never reach potential without investment demand.
The Asian markets were closed last Friday as gold rallied back over $1300 in the States. So when they opened again this past Monday June 3, Asian traders piled on to the gold buying. By the time the U.S. stock markets neared opening that day, gold was already up to $1317 in overnight trading. Once again that global momentum carried into the U.S. session, helping gold surge another 1.5% higher to $1325!
While great to see, that was still just a 3.2-month high. Without investment demand, gold’s new surge was unlikely to last very long on gold-futures buying alone. But something big changed that day in the U.S. markets. American stock traders, which had mostly shunned gold since late January, took notice. They started shifting capital back into gold via GLD shares in a major way, driving a huge 2.2% build in its holdings!
That was the biggest single-day percentage jump in this leading gold ETF’s holdings in 2.9 years, since early July 2016. That happened to be soon after the UK’s surprise pro-Brexit vote, when gold soared on the resulting uncertainty. While one day doesn’t make a trend, such a massive shift in gold investment buying is definitely attention-grabbing. If investors continue returning on balance, gold is heading way higher.
As this chart shows, gold is now within easy striking distance of a major bull-market breakout! It is not only nearing that vexing $1350 resistance zone, but has a high base from which to launch an assault. If gold-investment demand persists, gold doesn’t have far to run to hit new bull-to-date highs. Of course further stock-market weakness on balance would greatly help, but it’s not necessary with new-high psychology.
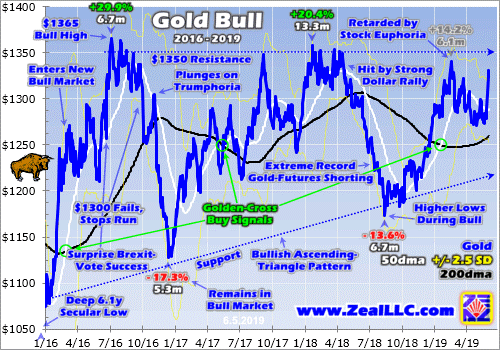
Blinded by apathy, not many traders realize gold still remains in a secular bull market. It was born from deep 6.1-year secular lows in mid-December 2015, the day after the Fed’s first rate hike in its latest tightening cycle. Over the next 6.7 months gold soared 29.9% higher in a massive upleg, entering new-bull-market territory at 20%+ gains. That left gold very overbought, so it crested at $1365 in early July 2016.
After strong bull-market uplegs big corrections are totally normal to rebalance sentiment, bleeding off the excessive greed at preceding highs. Gold consolidated high just under $1350 after that initial upleg, then fell to its 200-day moving average. It had resumed rallying in October 2016, but reversed sharply after Trump’s surprise election victory in early November. That pivotal event indirectly forced gold into a nosedive.
Gold plummeting in that election’s wake was the result of incredible euphoria, or Trumphoria at that time. Trump not only won the presidency, but Republicans controlled both chambers of Congress. So stock markets soared on hopes for big tax cuts soon. The SPX surged dramatically higher on truly-epic levels of euphoria, which in turn battered gold. Most investors shun gold when stock markets look awesome.
That greatly exacerbated gold’s normal correction to a monster 17.3% over 5.3 months! While very ugly and miserable, that remained shy of the 20%+ selloff necessary to qualify as a new bear market. Thus gold’s bull remained alive and well, albeit wounded by such a serious loss. Still gold recovered to power 20.4% higher over the next 13.3 months into early 2018, despite the SPX continuing to soar dramatically.
In late January 2018 gold peaked at $1358 just a couple days before the SPX’s own extremely-euphoric all-time-record high. While stock euphoria stunts gold investment demand, gold can still rally in lofty stock markets if it has sufficient capital-inflow momentum. But unfortunately buying was exhausted, then gold again consolidated high just under $1350 like it had done a couple summers earlier. It couldn’t break out.
A few months later gold was beaten down into another 13.6% correction over 6.7 months. It started on a sharp rally in the US dollar, which motivated gold-futures speculators to sell aggressively. Then the gold downside persisted on investors exiting as the SPX marched back up towards record highs after a sharp-yet-shallow-and-short 10.2% correction in early February 2018. Gold apathy and despair flared again.
But gold bottomed late last summer as extreme record gold-futures shorting exhausted itself, and started recovering higher again. That young upleg really accelerated when the SPX rolled over into that severe near-bear correction largely in Q4’18. That extended gold’s latest gains to 14.2% over 6.1 months as of that latest major interim high of $1341 in mid-February. Check out this gold bull’s resulting entire chart pattern.
After a strong start hitting $1365 several summers ago, gold couldn’t punch through to new bull highs. It tried several times, but stock-market euphoria and heavy gold-futures selling on U.S.-dollar strength kept batting it back down. Although gold couldn’t make new-high progress, it did carve a nice secular series of higher lows. While higher lows aren’t as exciting and attention-grabbing as higher highs, they are very bullish.
Flat highs combined with rising lows have created a gigantic ascending-triangle technical formation in gold over the past several years. That’s very clear above, gold coiling ever-tighter between climbing lower support and horizontal upper resistance. Ascending triangles are bullish chart patterns that are usually resolved with strong upside breakouts. Gold has spent recent years being accumulated behind the scenes.
No new bull-market highs along with gold being overshadowed by the stock markets surging to their own all-time-record highs in recent years has left this gold bull in stealth mode. Few investors realize it is still underway, and nearing a major bull-market breakout. But once that process become apparent, gold will quickly return to radars and become big financial news. Then gold enthusiasm will rapidly mushroom.
Any close over that vexing multi-year $1350 upper-resistance line will catch attention. But gold will have to break out decisively above there, exceeding $1350 by 1%+, to really attract the limelight. That would be $1364 gold. This Wednesday at the data cutoff for this essay, gold closed at $1331. That only left another 2.4% to climb to hit that decisive-breakout level. That’s trivial when investment capital is returning.
This gold bull’s first two uplegs averaged 25.2% gains. Today’s third upleg only ran 14.2% back in mid-February before the monster stock-market bounce’s extreme euphoria temporarily derailed it. All it would take for gold to extend to that key $1364 level is for this upleg to grow to 16.2%. That would still be modest, well behind the first two uplegs’ 29.9% and 20.4% gains. A decisive breakout is very close from here!
And once gold heads over its $1365 bull-to-date peak of July 2016, gold investment will start becoming popular again. Financial-media coverage will explode, and be overwhelmingly positive. Investors love chasing winners, and nothing motivates them to buy more than new bull-market highs. We’ve seen that in spades in the stock markets in recent years. Major buying from highs often becomes self-feeding.
The virtuous circle of inflows driven by new-high psychology can get very powerful. The more gold rallies, the more traders want to buy it to chase the momentum. The more they buy, the faster gold rallies. Gold hasn’t enjoyed positive capital-inflow dynamics like this since summer 2016. The potential gold upside from here as this unique investment returns to favor is big, supported by key tailwinds not enjoyed in years.
Starting from mid-August’s deep gold low, 20% and 30% total uplegs would catapult this metal way up to $1408 and $1526! Major new bull-market highs in gold would happen with a backdrop of dangerously-overvalued stock markets rolling over, greatly increasing the investment appeal of gold. And since the SPX is unlikely to keep surging to more record highs, stock euphoria shouldn’t arise to retard gold’s ascent.
The amount of gold buying investors need to do is staggering, as they are radically underinvested. Every investor needs a 10% portfolio allocation in gold and its miners’ stocks, period. Their current allocations to gold are virtually nonexistent per the leading proxy. For Americans it is the ratio between the total value of GLD’s gold-bullion holdings and all 500 SPX stocks’ collective market capitalizations. This is super-low.
At the end of April at the SPX’s latest peak, its stocks commanded a total $26,048.3b market cap. That is colossal beyond belief. Meanwhile GLD’s 746.7t of gold that day were only worth $30.8b at $1283. That implies American stock investors had a gold portfolio allocation around 0.12%, effectively nothing! Merely to boost that to even 0.5%, their gold holdings would have to quadruple. There’s vast potential for gold buying.
Another thing going in gold’s favor is the high U.S.-dollar levels. Its leading benchmark the U.S. Dollar Index hit 23.3-month highs in late April, then revisited those levels in late May. Gold-futures speculators tend to sell gold on a strengthening dollar and buy gold on a weakening dollar. The dollar is likely to drift lower in future months too, adding to gold’s momentum. The high dollar irks the Trump Administration, hurting U.S. exports.
So gold is nearing a major bull-market breakout that will change everything, wildly improving investors’ gold outlook and thus investment demand! The main beneficiary of higher gold prices will be the stocks of its miners. This chart shows the same gold-bull timeframe in the leading GDX VanEck Vectors Gold Miners ETF. I analyzed the latest Q1’19 fundamental results from its miners in depth just several weeks ago.

This article is focused on gold so I’ll discuss gold stocks in a future one. For our purposes today, note how GDX is positioning for a major breakout of its own above years-old $25 upper resistance. So far GDX’s current upleg is only 33.0% higher at best, small for this volatile high-potential sector. When gold powered 29.9% higher in essentially the first half of 2016, GDX amplified its gains with a monster 151.2% upleg!
So with gold on the verge of a major bull-market breakout, the beaten-down gold stocks are the place to be to greatly leverage gold’s upside. Since the gold-stock ETFs are burdened with underperformers at higher weightings, the best gains will be won in individual gold stocks with superior fundamentals. The kind of upside they can accrue during major gold uplegs is amazing, really multiplying wealth rapidly.
One of my core missions at Zeal is relentlessly studying the gold-stock world to uncover the stocks with superior fundamentals and upside potential. The trading books in both our popular weekly and monthly newsletters are currently full of these better gold and silver miners. Mostly added in recent months as gold stocks recovered from deep lows, their prices remain relatively low with big upside potential as gold rallies!
If you want to multiply your capital in the markets, you have to stay informed. Our newsletters are a great way, easy to read and affordable. They draw on my vast experience, knowledge, wisdom, and ongoing research to explain what’s going on in the markets, why, and how to trade them with specific stocks. As of Q1 we’ve recommended and realized 1089 newsletter stock trades since 2001, averaging annualized realized gains of +15.8%! That’s nearly double the long-term stock-market average. Subscribe today for just $12 per issue!
The bottom line is gold just surged near a major bull-market breakout. The $1350 resistance zone that has vexed gold for years is once again within easy range. All it will take to drive gold to new bull highs over $1365 is sustained investment buying. And that’s not a tall order with the stock markets starting to roll over again after record highs. GLD just enjoyed its biggest daily build in several years this past Monday.
Once gold gets to new bull-market highs, psychology will shift rapidly in its favor. Gold financial-media coverage will soar, and will be overwhelmingly positive. This will motivate investors and speculators alike to shift capital back into gold to chase its upside momentum. The potential gold and gold-stock gains with sentiment turning favorable are massive. It’s best to get deployed before gold’s breakout unleashes this.
Adam Hamilton, CPA
June 10, 2019
Copyright 2000 – 2019 Zeal LLC (www.ZealLLC.com)
In recent days the market has moved from expecting a rate cut by January 2020 to now expecting as much as three rate cuts by then. As a result both Gold and gold stocks launched higher, forming a “three white soldiers” bullish reversal pattern.
Last week and in previous writings, we noted the importance of the actual rate cut for Gold and gold stocks. Their performance in both nominal and relative terms usually takes hold after the actual cut.
Now, the question is, is this a rally or a bull market? (There is a difference even though financial media talks about multi-year bull moves as “rallies.”)
The start of a new rate cut cycle hasn’t always produced a bull market in precious metals. For example, after the rate cuts in 1989 and 1995 Gold rallied by only 12% and 18%. Fortunately for us bulls, the current context is totally different but I digress.
The stock market will answer the question.
There has never been a real bull market in precious metals without Gold outperforming the stock market (excluding the 1985-1987 period during a 50% decline in the US Dollar).
The chart below plots Gold (red) and Gold against the stock market (blue).
As you can see, during the 1970s and 2000s, the Gold/S&P 500 ratio rose alongside Gold. That wasn’t the case in the mid 1980s, the mid 1990s and the past few years.
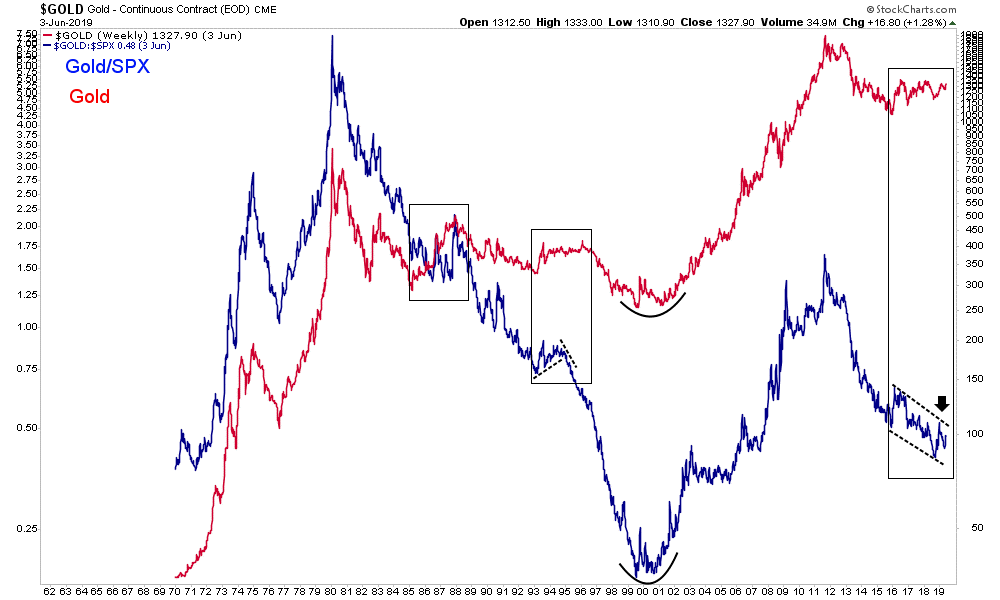
If the Fed rate cuts and other measures are able to successfully revive the U.S. economy and stock market then Gold isn’t going to receive enough capital inflows to sustain a bull market. On the other hand, if the U.S. economy slips into recession and the stock market experiences a real bear market then Gold should have enough fuel to retest its all time highs.
In the scenario in which the stock market and economy stabilize and recover, Gold can still perform well. Fed rate cuts and the like could push it past $1400/oz and potentially to $1500/oz.
How the Gold/S&P 500 ratio performs will inform us on the sustainability of that move. It will tell us if it’s just a rally or the start of a real bull market.
The gold stocks are nearly as historically cheap and hated as they’ve ever been. They could make quite a run on a clean breakout in Gold through the wall of resistance at $1375/oz, which we think is more likely than not. To learn what stocks we own and intend to buy that have 3x to 5x potential, consider learning more about our premium service.
Jordan Roy-Byrne CMT, MFTA
June 7, 2019
- The powerful sell signals I have in play for U.S. stock markets at my guswinger.com trading service show no signs of abating.
- Please click here now. Double-click to enlarge this Nasdaq ETF chart.
- U.S. President Trump unleashed a huge corporate tax cut early in his presidency, and that was very positive news for the stock market. Since early 2018 though, he clearly reversed course on taxes and has donned a ghoulish “Super Tariff Taxes Man” cape.
- Trump now seems emotionally obsessed with tariff taxes, QE, rate cuts, and appears to have made no effort to reverse the massive growth in government size and debt.
- U.S. population demographics are not good. An aging population is now trying to wall in an entitlements-oriented political system that depends on the dollar as reserve currency to keep it solvent.
- Trump’s calls for more QE at the peak of the business cycle are something out of a “Twilight Zone” episode.
- QE is supposed to be an emergency policy tool reserved for severe economic crisis, not for launch at the peak of the business cycle to empower ever-more government spending and debt!
- Institutional investors are becoming very concerned (and rightly so) that Trump’s tariff taxes will push the U.S. economy into recession before the business cycle naturally does so.
- For those of us who shorted the stock market as my QQQ-NYSE signals flashed though, Trump’s actions are “making us great”.
- Please click here now. Double-click to enlarge this spectacular GDX daily chart.
- In the summer of 2018 a lot of analysts predicted a stock market crash that would drag down gold stocks (like 2008). In contrast, I suggested a stock market crash was likely, but it would be accompanied by a surge in the price of GDX.
- That’s what happened last fall, and it’s happening again now. GDX is surging higher as the US stock market nose dives!
- Note my $25-$26 target zone for GDX on this daily chart.
- Please click here now. Double-click to enlarge. My $25-$26 target zone is based partly on the weekly chart resistance in that price zone.
- A Friday NYSE close above $23 for GDX, $36 for Newmont, $46 for Agnico Eagle, and $14 for Barrick are what I’m looking for to launch a major run higher for most gold stocks. That may or may not be accompanied by a move above $1370 for gold bullion and a fresh leg down for the tariffs-infested stock market.
- Please click here now. Double-click to enlarge. That’s a look at my swing trade signals for GDX.
- There are multiple gaps in play on the daily chart. That’s very rare in any market. In time, this GDX price action may be viewed as “legendary” in the face of the stock market rout….
- If the rally continues and makes it to my target prices!
- I issued a general gold stocks profit booking call for investors and traders yesterday, but not for JNUG, which I suggest investors hold for more glorious potential gains until I get a full signal for the sector.
- Please click here now. On Sunday the Chinese government issued a white paper stating that Trump has backtracked in tariff tax negotiations. Now a travel warning has been also issued. This is going to generate additional concern for Chinese citizens who are invested in America. They pay close attention to official statements from their government.
- SPDR (GLD-NYSE) tonnage surged to the 159 level yesterday. This is clear evidence that U.S. money managers are also going for the gold! Chinese investors are reporting buying additional gold because they believe Trump cannot be trusted in negotiations.
- I predicted that Chinese investors would begin buying gold instead of investing in stock markets as the trust issue reared its ugly head, and now it’s happening. The bottom line: It really doesn’t matter whether Trump can be trusted or not.
- What matters is what U.S. and Chinese investors believe, and they clearly believe that it’s time to go for the gold!
- Please click here now. Double-click to enlarge what I believe is the most majestic-looking chart in the history of markets. All the price action taking place now is exactly what investors should expect to happen in the final right shoulder rally of a H&S bull continuation pattern. Gold’s fear trade in America and the love trade in China and India are in perfect sync, both technically and fundamentally. Investors need do only one thing now, and that is to bask in the golden glory of this historic moment in bull era time!
Special Offer For Website Readers: Please send me an Email to free reports4@gracelandupdates.com and I’ll send you my free “Golden Rockets To Pluto!” report. I highlight eight gold miners trading under $10/share that are poised for stage “multi-bagger” gains as gold breaks above $1370! I include key tactics to buy and sell each stock.
Stewart Thomson
Graceland Updates
Written between 4am-7am. 5-6 issues per week. Emailed at approx 9am daily.
Email:
Stewart Thomson is a retired Merrill Lynch broker. Stewart writes the Graceland Updates daily between 4am-7am. They are sent out around 8am-9am. The newsletter is attractively priced and the format is a unique numbered point form. Giving clarity of each point and saving valuable reading time.
Risks, Disclaimers, Legal
Stewart Thomson is no longer an investment advisor. The information provided by Stewart and Graceland Updates is for general information purposes only. Before taking any action on any investment, it is imperative that you consult with multiple properly licensed, experienced and qualified investment advisors and get numerous opinions before taking any action. Your minimum risk on any investment in the world is: 100% loss of all your money. You may be taking or preparing to take leveraged positions in investments and not know it, exposing yourself to unlimited risks. This is highly concerning if you are an investor in any derivatives products. There is an approx $700 trillion OTC Derivatives Iceberg with a tiny portion written off officially. The bottom line:
Are You Prepared?
We have written for over a year about the historical importance of the shift in Federal Reserve policy. We’ve noted that over the past 65 years in 11 of 13 rate cut cycles the gold stocks have enjoyed tremendous gains. The historical data shows an average gain of over 170% and median gain of almost 150%.
As of last Tuesday morning, the market showed an 84% chance of a rate cut by the Fed meeting in January 2020. That’s only 8 months away!
With that said, it appears odd that the gold stocks are struggling. The market tends to anticipate and discount potential news in advance. One would expect the gold stocks to begin to “price in” a rate cut, given that the market is nearly convinced a rate cut is on the horizon.
However, the historical data argues otherwise. The median and average bottom around the first rate cut is typically one and two months before that first rate cut.
The likely months for the first rate cut figure to be either September or December. If the Fed cuts rates in September, then the data argues for a bottom in August or late July. If the Fed were to cut in December, then its possible we could see a bottom earlier than a month before.
The timeline for a potential bottom in the gold stocks could line up well with the current technical outlook.
In the chart below we plot GDX along with the percentage of stocks that closed above the 200-day moving average (in the HUI) and the GDX advance decline (AD) line.
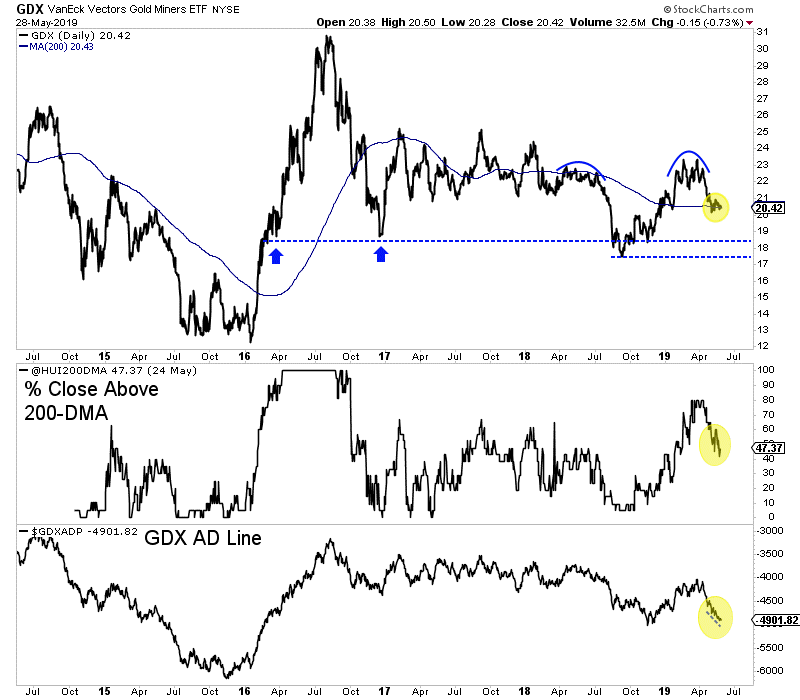
GDX is oversold on a short-term basis but remains weak. It’s AD line (an important breadth indicator) is showing a negative divergence.
Gold stocks are not oversold on a 200-day basis. As you can see, 47% of the HUI (GDX sans royalty companies) closed above the 200-day moving average.
Ultimately, I’d love to see GDX bottom around $18 in August with that aforementioned percentage below 20%. A double bottom prior to a Fed rate cut in September would trigger a strong run into year end.
In any case, the gold stocks could be setting up for a mid summer bottom and one that would be really significant if the Fed cuts rates in September. We continue to look at individual companies that are trading at excellent values and have important upcoming summer catalysts. To learn what stocks we own and intend to buy that have 3x to 5x potential, consider learning more about our premium service.
Jordan Roy-Byrne, CMT, MFTA
June 3, 2019
1. The fear trade for gold continues to gain fundamental strength. The technical picture is also solid. Please click here now. Double-click to enlarge. Gold is poised for significant upside action in the second half of this year.
2. A large bull wedge is in play as institutional investors become more concerned about the slowing global economy.
3. Please click here now. Double-click to enlarge. This Nasdaq ETF chart (QQQ-NYSE) looks particularly concerning. A break under the $177.50 price zone could be followed by a significant decline.
4. The recent peaks and troughs for the stock market are in sync with the peaks and troughs for the price of oil. If oil can’t rise with Iran being pounded by US government sanctions, something is wrong.
5. Oil could crash if there’s a softening of the sanctions and that could cause a stock market crash.
6. Please click here now. Double-click to enlarge this oil price chart. Low priced oil helps consumers, but it hurts stock market earnings. An ominous bear flag has appeared on the chart.
7. US frackers need $60 oil on a consistent basis. They help provide the stock market with the earnings growth it needs to satisfy institutional investors.
8. $60 oil on a sustained basis is just not happening right now, and I don’t expect it will happen without a major upturn in the global economy.
9. Please click here now. Institutional analysts are beginning to view the tariff taxes as a growth-inhibiting quagmire that won’t go away for a long time.
10. They are also beginning to talk about the inflationary implications of the tariffs. What happens if inflation picks up and Trump successfully pressures the Fed into leaving rates alone?
11. That could cause much greater concern about inflation amongst economists and money managers would likely turn to gold to protect their portfolios.
12. The second of half of 2019 is likely to see gold get significant investor interest… particularly if the stock market continues to weaken while inflationary pressures rise.
13. Both my short-term and medium-term stock market trade signals have moved to a “ sell ”. The long-term buy signal is still holding but it looks shaky.
14. Please click here now. Double-click to enlarge this dollar versus yen chart. The dollar looks terrible and a new leg lower seems imminent.
15. The dollar’s softness relates to lack of interest in US risk-on markets by investors. They are more interested in safety now than risk-related opportunity. That’s good news for gold!
16. The US government has referred to the tariff taxes issue as a war. In the short-term, it’s producing higher prices for US consumers and dragging down global GDP growth.
17. In the medium-term, China’s government could restrict rare earth exports to America. That would probably cause a stock market crash. If the US economy keeps softening as China begins to handle the tariffs issue more aggressively, US democrats could get elected.
18. In turn, that would put the dollar front and centre in the next economic downturn.
19. My big focus for the long-term asset allocation is the Indian stock market and gold. That’s because Indian GDP growth will almost certainly rise to 10%+ and stay there for decades.
20. This, while America probably grows at 3%-4% in a good year and averages 1%-2%. There’s only so much upside “ blood ” that the Fed can squeeze out of a QE “ stone ” for US stock market investors with that kind of growth. The demographics just aren’t there, and the entitlements are too big of a drag on the economy.
21. I’m vastly more focused on short-term trading for the US stock market now than long-term investment. I do that at www.guswinger.com where I also trade NUGT and DUST for gold stock trading enthusiasts.
22. Please click here now. Double-click to enlarge. I don’t expect much action from GDX and gold stocks until gold bursts out of the bull wedge formation and the US stock market begins another leg down.
23. That likely happens as institutional investors accept the tariff talks as an unresolvable quagmire and begin to wonder how the Fed will deal with emerging stagflation.
24. A Friday close of $23 for GDX, $14 for Barrick (GOLD-NYSE), $36 for Newmont (NEM-NYSE) and $46 for Agnico (AEM-NYSE) are the “ launchpad ” numbers for gold stock investors to focus on. When those numbers are hit, basis a Friday close, gold, silver, and the miners will be ready for a major bull run!
Special Offer For Website Readers: Please send me an Email to freereports4@gracelandupdates.com and I’ll send you my free “Gold Stock Fresh Buy & Sell Signals!” report. I highlight key signals for stocks like Kirkland Lake that offer lucrative profits for both traders and investors!
Cheers
Stewart Thomson
Graceland Updates
Written between 4am-7am. 5-6 issues per week. Emailed at approx 9am daily.
www.gracelandupdates.com
gracelandjuniors.com
www.guswinger.com
Email:
stewart@gracelandupdates.com
stewart@gracelandjuniors.com
stewart@guswinger.com
Stewart Thomson is a retired Merrill Lynch broker. Stewart writes the Graceland Updates daily between 4am-7am. They are sent out around 8am-9am. The newsletter is attractively priced and the format is a unique numbered point form. Giving clarity of each point and saving valuable reading time.
Risks, Disclaimers, Legal
Stewart Thomson is no longer an investment advisor. The information provided by Stewart and Graceland Updates is for general information purposes only. Before taking any action on any investment, it is imperative that you consult with multiple properly licensed, experienced and qualified investment advisors and get numerous opinions before taking any action. Your minimum risk on any investment in the world is: 100% loss of all your money. You may be taking or preparing to take leveraged positions in investments and not know it, exposing yourself to unlimited risks. This is highly concerning if you are an investor in any derivatives products. There is an approx $700 trillion OTC Derivatives Iceberg with a tiny portion written off officially. The bottom line:
Are You Prepared?
The mid-tier gold miners’ stocks in the sweet spot for price-appreciation potential have been struggling in recent months, grinding lower with gold. Their strong early-year momentum has been sapped by recent stock-market euphoria. But gold-mining stocks are more important than ever for prudently diversifying portfolios. The mid-tiers’ recently-reported Q1’19 results reveal their fundamentals remain sound and bullish.
The wild market action in Q4’18 emphasized why investors shouldn’t overlook gold stocks. All portfolios need a 10% allocation in gold and its miners’ stocks! As the flagship S&P 500 broad-market stock index plunged 9.2% in December alone, nearly entering a new bear market, the leading mid-tier gold-stock ETF surged 13.7% higher that month. That was a warning shot across the bow that these markets are changing.
Four times a year publicly-traded companies release treasure troves of valuable information in the form of quarterly reports. Required by the U.S. Securities and Exchange Commission, these 10-Qs and 10-Ks contain the best fundamental data available to traders. They dispel all the sentiment distortions inevitably surrounding prevailing stock-price levels, revealing corporations’ underlying hard fundamental realities.
The global nature of the gold-mining industry complicates efforts to gather this important data. Many mid-tier gold miners trade in Australia, Canada, South Africa, the United Kingdom, and other countries with quite-different reporting requirements. These include half-year reporting rather than quarterly, long 90-day filing deadlines after year-ends, and very-dissimilar presentations of operating and financial results.
The definitive list of mid-tier gold miners to analyze comes from the GDXJ VanEck Vectors Junior Gold Miners ETF. Despite its misleading name, GDXJ is largely dominated by mid-tier gold miners and not juniors. GDXJ is the world’s second-largest gold-stock ETF, with $3.6b of net assets this week. That is only behind its big-brother GDX VanEck Vectors Gold Miners ETF that includes the major gold miners.
Major gold miners are those that produce over 1m ounces of gold annually. The mid-tier gold miners are smaller, producing between 300k to 1m ounces each year. Below 300k is the junior realm. Translated into quarterly terms, majors mine 250k+ ounces, mid-tiers 75k to 250k, and juniors less than 75k. GDXJ was originally launched as a real junior-gold-stock ETF as its name implies, but it was forced to change its mission.
Gold stocks soared in price and popularity in the first half of 2016, ignited by a new bull market in gold. The metal itself awoke from deep secular lows and surged 29.9% higher in just 6.7 months. GDXJ and GDX skyrocketed 202.5% and 151.2% higher in roughly that same span, greatly leveraging gold’s gains. As capital flooded into GDXJ to own junior miners, this ETF risked running afoul of Canadian securities laws.
Canada is the center of the junior-gold universe, where most juniors trade. Once any investor including an ETF buys up a 20%+ stake in a Canadian stock, it is legally deemed a takeover offer. This may have been relevant to a single corporate buyer amassing 20%+, but GDXJ’s legions of investors certainly weren’t trying to take over small gold miners. GDXJ diversified away from juniors to comply with that archaic rule.
Smaller juniors by market capitalization were abandoned entirely, cutting them off from the sizable flows of ETF capital. Larger juniors were kept, but with their weightings within GDXJ greatly demoted. Most of its ranks were filled with mid-tier gold miners, as well as a handful of smaller majors. That was frustrating, but ultimately beneficial. Mid-tier gold miners are in the sweet spot for stock-price-appreciation potential!
For years major gold miners have struggled with declining production, they can’t find or buy enough new gold to offset their depletion. And the stock-price inertia from their large market capitalizations is hard to overcome. The mid-tiers can and are boosting their gold output, which fuels growth in operating cash flows and profitability. With much-lower market caps, capital inflows drive their stock prices higher much faster.
Every quarter I dive into the latest results from the top 34 GDXJ components. That’s simply an arbitrary number that fits neatly into the tables below, but a commanding sample. These companies represented 82.7% of GDXJ’s total weighting this week, even though it contained a whopping 72 stocks! 3 of the top 34 were majors mining 250k+ ounces, 21 mid-tiers at 75k to 250k, 7 “juniors” under 75k, and 3 explorers with zero.
These majors accounted for 13.0% of GDXJ’s total weighting, and really have no place in a “Junior Gold Miners ETF” when they could instead be exclusively in GDX. These mid-tiers weighed in at 57.6% of GDXJ. The “juniors” among the top 34 represented just 8.9% of GDXJ’s total. But only 4 of them at a mere 4.4% of GDXJ are true juniors, meaning they derive over half their revenues from actually mining gold.
The rest include a primary silver miner, gold-royalty company, and gold streamer. GDXJ has become a full-on mid-tier gold miners ETF, with modest major and tiny junior exposure. Traders need to realize it is not a junior-gold investment vehicle as advertised. GDXJ also has major overlap with GDX. Fully 29 of these top 34 GDXJ gold miners are included in GDX too, with 23 of them also among GDX’s top 34 stocks.
The GDXJ top 34 accounting for 82.7% of its total weighting also represent 37.4% of GDX’s own total weighting! The GDXJ top 34 mostly clustered between the 10th- to 40th-highest weightings in GDX. Thus over 3/4ths of GDXJ is made up by almost 3/8ths of GDX. But GDXJ is far superior, excluding the large gold majors struggling with production growth. GDXJ gives much-higher weightings to better mid-tier miners.
The average Q1’19 gold production among GDXJ’s top 34 was 149k ounces, a bit over half as big as the GDX top 34’s 267k average. Despite these two ETFs’ extensive common holdings, GDXJ is increasingly outperforming GDX. GDXJ holds many of the world’s best mid-tier gold miners with big upside potential as gold’s own bull resumes powering higher. Thus it is important to analyze GDXJ miners’ latest results.
So after every quarterly earnings season I wade through all available operational and financial results and dump key data into a big spreadsheet for analysis. Some highlights make it into these tables. Any blank fields mean a company hadn’t reported that data as of this Wednesday. The first couple columns show each GDXJ component’s symbol and weighting within this ETF as of this week. Not all are US symbols.
18 of the GDXJ top 34 primarily trade in the U.S., 5 in Australia, 8 in Canada, and 3 in the U.K. So some symbols are listings from companies’ main foreign stock exchanges. That’s followed by each gold miner’s Q1’19 production in ounces, which is mostly in pure-gold terms excluding byproducts often found in gold ore like silver and base metals. Then production’s absolute year-over-year change from Q1’18 is shown.
Next comes gold miners’ most-important fundamental data for investors, cash costs and all-in sustaining costs per ounce mined. The latter directly drives profitability which ultimately determines stock prices. These key costs are also followed by YoY changes. Last but not least the annual changes are shown in operating cash flows generated, hard GAAP earnings, revenues, and cash on hand with a couple exceptions.
Percentage changes aren’t relevant or meaningful if data shifted from positive to negative or vice versa, or if derived from two negative numbers. So in those cases I included raw underlying data rather than weird or misleading percentage changes. In cases where foreign GDXJ components only released half-year data, I used that and split it in half where appropriate. That offers a decent approximation of Q1’19 results.
Symbols highlighted in light blue newly climbed into the ranks of GDXJ’s top 34 over this past year. And symbols highlighted in yellow show the rare GDXJ-top-34 components that aren’t also in GDX. If both conditions are true blue-yellow checkerboarding is used. Production bold-faced in blue shows the handful of junior gold miners in GDXJ’s higher ranks, under 75k ounces quarterly with over half of sales from gold.
This whole dataset together compared with past quarters offers a fantastic high-level read on how mid-tier gold miners as an industry are faring fundamentally. While slightly-lower gold prices made Q1 somewhat challenging, the GDXJ miners generally fared quite well. They mostly kept costs in check, paving the way for profits to soar and really amplify gold’s overdue-to-resume bull market. That’s very bullish for their stocks.
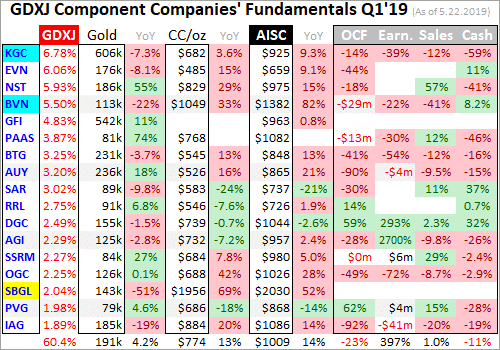
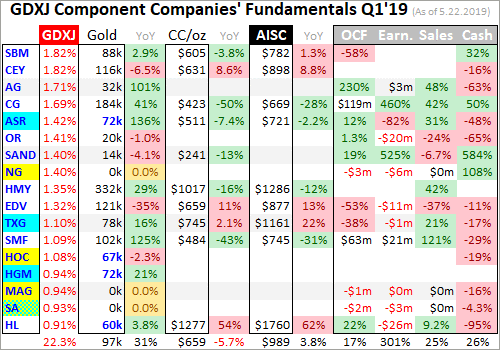
GDXJ’s managers have continued to fine-tune its ranks over this past year, making some good changes. For some inexplicable reason, one of the world’s largest gold miners AngloGold Ashanti was one of this ETF’s top holdings as discussed in Q3’18. AU was finally kicked out and replaced with a smaller major gold miner Kinross and a mid-tier Buenaventura. Together they now account for 12.3% of GDXJ’s weighting.
Reshuffling at the top makes year-over-year changes less comparable, particularly given KGC’s larger size relative to most of the rest of GDXJ’s stocks. 4 other smaller stocks also climbed into this ETF’s top-34 ranks. As GDXJ is largely market-cap weighted, it is normal for companies to rise into and fall out of the top 34’s lower end. All these year-over-year comparisons are across somewhat-different top-34 stocks.
Production has always been the lifeblood of the gold-mining industry. Gold miners have no control over prevailing gold prices, their product sells for whatever the markets offer. Thus growing production is the only manageable way to boost revenues, leading to amplified gains in operating cash flows and profits. Higher production generates more capital to invest in expanding existing mines and building or buying new ones.
Gold-stock investors have long prized production growth above everything else, as it is inexorably linked to company growth and thus stock-price-appreciation potential. The top 34 GDXJ gold miners excelled in that department, growing their aggregate Q1 output by a big 15.6% YoY to 4.6m ounces! That’s impressive, trouncing both the major gold miners dominating GDX as well as the entire world’s gold-mining industry.
Last week I analyzed the GDX majors’ Q1’19 results, showing they are still struggling to replace depleting production. The GDX top 34’s total output plunged a sharp 6.3% YoY to 8.8m ounces, but if adjusted for a recent in-process mega-merger that decline moderates to 0.2% YoY. That’s still much worse than the world gold-mining industry as a whole, as reflected in the World Gold Council’s comprehensive quarterly data.
Total global gold production in Q1’19 climbed 1.1% YoY to 27.4m ounces, which the majors still fell well short of. The GDXJ mid-tiers were able to enjoy very-strong growth because this ETF isn’t burdened by the struggling majors. Again GDXJ’s components start at the 10th-highest weighting in GDX. The 9 above that averaged huge Q1 production of 537k ounces, which is fully 3.6x bigger than the GDXJ-top-34 average!
The more gold miners produce, the harder it is to even keep up with relentless depletion let alone grow their output consistently. Large economically-viable gold deposits are getting increasingly difficult to find and ever-more-expensive to develop, with low-hanging fruit long since exploited. But with much-smaller production bases, mine expansions and new mine builds generate big output growth for mid-tier golds.
Their awesome Q1 production surge wasn’t just from the new components climbing into the ranks of the top 34 over this past year. The average growth rate of all these companies producing weighed in at 16.1% YoY, right in line with the 15.6% total growth. The law-of-large-numbers growth limitations also apply to gold miners’ market capitalizations. The GDXJ top 34 averaged just $1.7b in the middle of this week.
Last week the GDX top 34 sported a far-higher average of $5.2b. With the mid-tiers generally less than a third as big as the majors, their stock prices have much-less inertia. Capital inflows as gold stocks return to favor on gold rallying propel mid-tier stocks to much-higher levels faster than majors. They truly are the sweet spot of the gold-stock realm, not bogged down like the majors with way less risk than the juniors.
Also interesting on the GDXJ production front last quarter was silver. This “Junior Gold Miners ETF” also includes major silver miners, both primary and byproduct ones. The GDXJ top 34’s silver mined surged 13.8% higher YoY to 26.5m ounces! For comparison the GDX top 34’s total reported silver output of 27.3m actually plunged 25.2% YoY. Even mega-merger-adjusted their silver production still fell 8.0% YoY.
The mid-tier gold miners continue to prove all-important production growth is achievable off smaller bases. With a handful of mines or less to operate, mid-tiers can focus on expanding them or building a new mine to boost their output beyond depletion. But the majors are increasingly failing to do this from the already-high production bases they operate at. As long as majors are struggling, it is prudent to avoid them.
GDXJ investors would be better served if this ETF contained no major gold miners producing over 250k ounces a quarter on average. They still command over 1/8th of its weighting, which could be far better reallocated in mid-tiers and juniors. If VanEck kept the major gold miners in GDX where they belong, it would give GDXJ much-better upside potential. That would make this ETF more popular and successful.
In gold mining, production and costs are generally inversely related. Gold-mining costs are largely fixed quarter after quarter, with actual mining requiring about the same levels of infrastructure, equipment, and employees. So the higher production, the more ounces to spread mining’s big fixed costs across. Thus with sharply-higher YoY production in Q1’19, the GDXJ top 34 should’ve seen proportionally-lower costs.
There are two major ways to measure gold-mining costs, classic cash costs per ounce and the superior all-in sustaining costs per ounce. Both are useful metrics. Cash costs are the acid test of gold-miner survivability in lower-gold-price environments, revealing the worst-case gold levels necessary to keep the mines running. All-in sustaining costs show where gold needs to trade to maintain current mining tempos indefinitely.
Cash costs naturally encompass all cash expenses necessary to produce each ounce of gold, including all direct production costs, mine-level administration, smelting, refining, transport, regulatory, royalty, and tax expenses. In Q1’19 these top-34-GDXJ-component gold miners that reported cash costs averaged $730 per ounce. That was up a sizable 5.4% YoY, and much worse than the GDX top 34’s $616 average.
These were the highest average mid-tier cash costs seen in the 12 quarters I’ve been doing this research, which was potentially concerning. Thankfully that was heavily skewed by some extreme outliers relative to this sector and their own history. Peru’s Buenaventura saw cash costs soar 33% YoY to $1049! That was a one-off anomaly driven by the company halting one of its key mines in January to centralize operations.
Two major South African miners saw really-high cash costs too, Sibanye’s eye-popping $1956 per ounce and Harmony’s $1017. South Africa’s former gold juggernaut has been struggling for years, facing endless government corruption and very-deep and expensive mines. Sibanye in particular really needs to get kicked out of GDXJ, as it is now a primary platinum-group-metals miner at well over 5/8ths of Q1 revenues.
Finally Hecla’s cash costs skyrocketed 54% YoY to $1277 in Q1, mainly due to ongoing problems at its Nevada operations. It actually suspended 2019 production and cost guidance on these, which certainly isn’t a good sign! None of these 4 gold miners represent mid-tiers as a whole. Excluding them, the rest of the GDXJ top 34 averaged excellent cash costs of just $622 last quarter. That’s on the low end of the range.
Way more important than cash costs are the far-superior all-in sustaining costs. They were introduced by the World Gold Council in June 2013 to give investors a much-better understanding of what it really costs to maintain gold mines as ongoing concerns. AISCs include all direct cash costs, but then add on everything else that is necessary to maintain and replenish operations at current gold-production levels.
These additional expenses include exploration for new gold to mine to replace depleting deposits, mine-development and construction expenses, remediation, and mine reclamation. They also include the corporate-level administration expenses necessary to oversee gold mines. All-in sustaining costs are the most-important gold-mining cost metric by far for investors, revealing gold miners’ true operating profitability.
The GDXJ-top-34 AISC picture in Q1’19 looked much like the cash-cost one. Average AISCs defied much-higher production to surge 6.0% higher YoY to $1002 per ounce! While still far below Q1’s average gold price of $1303, those were the highest AISCs seen by far since at least Q2’16 when I started this thread of research. But again that was heavily skewed by those same 4 gold miners struggling with sky-high costs.
Excluding BVN’s $1382, SBGL’s insane $2030, HMY’s $1286, and HL’s extreme $1760, the rest of the GDXJ top 34 averaged a far-better $891 per ounce. That was 5.8% lower than Q1’18’s average, indeed reflecting fast-growing output. It was also right in line with the 2017-and-2018 quarterly average of $903, as well as the top 34 GDX majors’ Q1’19 average of $893. Most mid-tier golds are keeping costs under control.
Interestingly gold-mining costs tend to peak in Q1s before drifting lower in subsequent quarters. That’s because gold miners often make capital improvements and sequence mining in such a way that Q1s see the lowest ore grades and thus lowest production. I discussed this in some depth last week in my GDX Q1’19 essay. Odds are the GDXJ mid-tiers’ costs will decline significantly in coming quarters as output ramps.
Yet even at that distorted artificially-high Q1 average AISC of $1002, the elite GDXJ gold miners have great potential to enjoy surging profits and hence stock prices as gold recovers. The average gold price in Q1’19 drifted 1.9% lower YoY to $1303. That implies the mid-tier miners were averaging profits around $301 per ounce. Gold is due to head far higher as these bubble-valued stock markets face an overdue bear.
That will rekindle gold investment demand like usual, those new capital inflows fueling a major gold upleg. A mere 7.7% advance from $1300 would carry gold to $1400, and just 15.4% would hit $1500. Those are modest and easily-achievable gains by past-gold-upleg standards. During essentially the first half of 2016 after major stock-market selloffs, gold blasted 29.9% higher in 6.7 months! Gold can rapidly return to favor.
At $1300 and Q1’s $1002 average AISCs, the major gold miners are still earning a very-healthy $298 per ounce. But at $1400 and $1500 gold, those profits soar to $398 and $498. That’s 33.6% and 67.1% higher on relatively-small 7.7% and 15.4% gold uplegs from here! And if the mid-tiers’ average AISCs retreat back near $900 without the outliers, that profits growth rockets to 67.8% at $1400 and 101.3% at $1500!
The gold miners’ awesome inherent profits leverage to gold is why this beaten-down forsaken sector is so darned attractive. The major gold stocks of GDX tend to amplify gold uplegs by 2x to 3x, and the mid-tier miners of GDXJ usually do much better. As gold rallies on renewed investment demand as stock markets weaken, better mid-tier gold stocks soar dramatically multiplying investors’ wealth. This is a must-own sector.
While investors continue to harbor serious apathy for gold stocks, the mid-tier miners’ costs remain well-positioned to fuel monster profits growth in a higher-gold-price environment. This is a stark contrast to the rest of the markets, where rising earnings are looking to be scarce. Investors love higher profits, and few if any sectors will rival the gold miners’ earnings growth. It was already underway in Q1 on higher production.
In terms of hard accounting numbers, the GDXJ top 34’s total sales grew 5.0% YoY to $4.9b in Q1’19. That was the result of 15.6%-higher gold output easily offsetting the 1.9%-lower average gold price last quarter. Again the mid-tiers just trounced the majors, with the GDX top 34’s sales dropping a sharp 5.2% YoY when adjusted for the in-progress mega-merger between elite gold majors Newmont and Goldcorp.
The higher sales among the top 34 GDXJ stocks also drove impressive 22.2% YoY GAAP profits growth to a total of $197m in Q1! That again reveals the rising-cost problems are isolated in a handful of GDXJ components, not mid-tier miners as a whole. The majors of GDX again fared much worse last quarter, seeing earnings fall 7.2% YoY when accounting for that mega-merger. Mid-tiers are really outperforming.
The one blemish on the accounting front was operating cash flows generated, which fell 17.7% YoY in total among the GDXJ-top-34-component stocks to $1.1b. There were no individual-company disasters which stood out, just weaker cash flows across the board. Still the mid-tier miners were producing healthy amounts of cash as the big profits gap between their AISCs and prevailing gold prices last quarter implied.
The GDXJ top 34’s overall cash treasuries fell a similar 20.4% YoY in Q1 to $5.1b, reflecting lower OCFs. But less cash isn’t necessarily negative, as gold miners tap their cash hoards when they are building or buying expansions or mines. So declining cash balances suggest more investment to grow production in future quarters, which is always good news in this sector. The mid-tier golds’ Q1’19 results were bullish.
GDXJ’s mostly-mid-tier component list of great gold miners is really faring well, especially compared to the struggling large gold miners. Investors looking to ride this gold-stock bull should avoid the world’s biggest gold producers and instead deploy their capital in the mid-tier realm. The best gains will be won in individual smaller gold miners with superior fundamentals, plenty of which are included within GDXJ.
Despite being the world’s leading gold-stock ETF, GDX needs to be avoided. The major gold miners that dominate its weightings are struggling too much fundamentally, unable to grow their production. Capital will instead flow into the mid-tiers, juniors, and maybe a few smaller majors still able to boost their output and thus earnings going forward. None of this is new, but the major and mid-tier disconnect continues to worsen.
Again back in essentially the first half of 2016, GDXJ skyrocketed 202.5% higher on a 29.9% gold upleg in roughly the same span! While GDX somewhat kept pace then at +151.2%, it is lagging GDXJ more and more as its weightings are more concentrated in stagnant gold mega-miners. The recent big mergers are going to worsen that investor-hostile trend. Investors should buy better individual gold stocks, or GDXJ.
One of my core missions at Zeal is relentlessly studying the gold-stock world to uncover the stocks with superior fundamentals and upside potential. The trading books in both our popular weekly and monthly newsletters are currently full of these better gold and silver miners. Mostly added in recent months as gold stocks recovered from deep lows, their prices remain relatively low with big upside potential as gold rallies!
If you want to multiply your capital in the markets, you have to stay informed. Our newsletters are a great way, easy to read and affordable. They draw on my vast experience, knowledge, wisdom, and ongoing research to explain what’s going on in the markets, why, and how to trade them with specific stocks. As of Q1 we’ve recommended and realized 1089 newsletter stock trades since 2001, averaging annualized realized gains of +15.8%! That’s nearly double the long-term stock-market average. Subscribe today for just $12 per issue!
The bottom line is the mid-tier gold miners are thriving fundamentally. They are still rapidly growing their production while majors suffer chronic output declines. Most mid-tiers are holding the line on costs, which portends strong leveraged profits growth as gold continues grinding higher on balance. The performance gap between the smaller mid-tier and junior gold miners and larger major ones is big and still mounting.
Investors and speculators really need to pay attention to this intra-sector disconnect. Gold and its miners’ stocks should power far higher in coming years as the lofty general stock markets roll over. But the vast majority of the gains will be concentrated in growing gold miners, not shrinking ones. This means the mid-tier and junior gold miners will far outperform the majors as gold powers higher on weaker stock markets.
Adam Hamilton, CPA
May 27, 2019
Copyright 2000 – 2019 Zeal LLC (www.ZealLLC.com)
1. “Buy in July to watch your gold stocks fly!” That’s a time-tested mantra from “Goldlion”, who picks the junior mining stocks for my Graceland Juniors newsletter.
2. Sadly, this is not July. It’s the month of May, and May is part of the soft demand season for gold. The strong demand season typically runs from August to February.
3. A lot of gold stock investors want gold stocks to roar higher now, but nothing happens before its time. Interestingly, gold’s strong season begins just as stock market crash season begins.
4. Crash season for the US stock market typically runs from August to October. As the business cycle matures, stock market crash season becomes more dangerous and the strong demand season for gold offers more potential reward.
5. Please click here now. Double-click to enlarge. The soft price action is seasonally expected and there’s short term technical weakness, but there’s nothing overly negative, let alone bearish, on this daily gold chart.
6. Please click here now. Double-click to enlarge this magnificent weekly gold chart. Like Ray Dalio, I’ve suggested the next crisis will be a US dollar crisis more than an economic growth crisis.
7. That’s mainly because Trump administration is pro-growth and pro-business, but it’s also continued to grow both the government debt and the overall size of the government, all in the name of “making citizens great”.
8. This approach to running the government has greatly strengthened the private sector economy while greatly weakening the ability of the government to fund its insane debt and size growth in even a mild economic downturn.
9. In the next downturn, I expect the American private sector to weather the storm reasonably well while the government is forced to print money to fund itself. The bottom line:
10. In the last downturn, QE was used to promote growth and it was deflationary. In the next downturn, QE will be used to make up for lacklustre demand for government bonds, and it will be extremely inflationary.
11. Please click here now. Like America’s Warren Buffett, India’s Rakesh “RJ” Jhunjhunwala likes to heap praise on his government leaders instead of calling them out as extortionists and bullies.
12. Having said that, RJ has the same outlook for the private sector of India that I do in the medium and long-term; a move back towards 8%-9% GDP growth, and then a long-term stay in the double-digits range.
13. This gargantuan growth will increase gold demand quite substantially, and it’s likely to happen as the US government begins devaluing the dollar to manage its outrageous spending and debt. That will trigger fresh fear trade buying in America.
14. Please click here now. Double-click to enlarge this spectacular bitcoin chart. I expect a flag pattern will form, and then bitcoin should roar to the $20,000 area highs.
15. Most investors try to make money by buying what is hot, and they tend to get emotional about it. Bitcoin is not hot. It’s warm.
16. I focus on asset classes more than market timing, although I do that too. Investors build the most wealth, and stay sane doing it, by reducing their focus on what is hot, and instead focusing on making sure they own a piece of the asset class action.
17. The US stock market is part of the global stock markets asset class. So are Chindian stock markets. So, I own some US, Indian, and Chinese stock markets asset class action and I recommend that all investors own some too. It’s that simple.
18. Bitcoin and related crypto currencies are the newest asset class. There’s a lot of silly debate about whether gold is better than bitcoin, or vice-versa. I take the stand that it doesn’t matter which is better. What matters is that both are asset classes and investors need to get involved if they want to get richer. Period.
19. Some analysts claim that bitcoin is already more widely used as a payment mechanism than Paypal. That may or may not be true. Regardless, in time I think crypto will become as widely used as most government fiat, and governments will eagerly tax it with an electronic money transaction tax.
20. My prediction is that bitcoin isn’t going away but governments will ultimately make the most money from it. Investors who want to make money with it, albeit less than the government “people helpers” will make, can check out my crypto/blockchain newsletter at www.gublockchain.com.
21. Please click here now. Double-click to enlarge. I’ll make another prediction, which is that in the current pullback, gold stocks will bottom before bullion does.
22. So far in this month of May, GDX is already showing solid strength relative to gold.
23. Note the dramatic decline in volume from February. Declining volume that accompanies a price decline is a sign of a very healthy market.
24. My Graceland “traffic lights” proprietary technical system indicates that a Friday close over $23 would see a lot of gold stocks begin a major rally. I’ll be watching gold stocks closely for signs of a bullish non-confirmation with bullion… to jump-start that rally!
Special Offer For Website Readers: Please send me an Email to freereports4@gracelandupdates.com and I’ll send you my free “Golden Mid Caps!” report. I highlight gold producers that are not too big and not too small that are trading in the $2 to $10 price range with significant upside price action possible!
Thanks!!
Stewart Thomson
Graceland Updates
https://gracelandjuniors.com
www.guswinger.com
Email:
stewart@gracelandupdates.com
stewart@gracelandjuniors.com
stewart@guswinger.com
Stewart Thomson is a retired Merrill Lynch broker. Stewart writes the Graceland Updates daily between 4am-7am. They are sent out around 8am-9am. The newsletter is attractively priced and the format is a unique numbered point form. Giving clarity of each point and saving valuable reading time.
Risks, Disclaimers, Legal
Stewart Thomson is no longer an investment advisor. The information provided by Stewart and Graceland Updates is for general information purposes only. Before taking any action on any investment, it is imperative that you consult with multiple properly licensed, experienced and qualified investment advisors and get numerous opinions before taking any action. Your minimum risk on any investment in the world is: 100% loss of all your money. You may be taking or preparing to take leveraged positions in investments and not know it, exposing yourself to unlimited risks. This is highly concerning if you are an investor in any derivatives products. There is an approx $700 trillion OTC Derivatives Iceberg with a tiny portion written off officially. The bottom line:
Are You Prepared?
The major gold miners’ stocks are drifting sideways with gold, their early-year momentum sapped by the recent stock-market euphoria. But they are more important than ever for prudently diversifying portfolios, a rare sector that surges when stock markets weaken. Their just-reported Q1’19 results reveal how gold miners are faring as a sector, and their current fundamentals are way better than bearish psychology implies.
The wild market action in Q4’18 again emphasized why investors shouldn’t overlook gold stocks. Every portfolio needs a 10% allocation in gold and its miners’ stocks. As the flagship S&P 500 broad-market stock index plunged 19.8% largely in that quarter to nearly enter a bear market, the leading gold-stock ETF rallied 11.4% higher in that span. That was a warning shot across the bow that these markets are changing.
Four times a year publicly-traded companies release treasure troves of valuable information in the form of quarterly reports. Required by the US Securities and Exchange Commission, these 10-Qs and 10-Ks contain the best fundamental data available to traders. They dispel all the sentiment distortions inevitably surrounding prevailing stock-price levels, revealing corporations’ underlying hard fundamental realities.
The definitive list of major gold-mining stocks to analyze comes from the world’s most-popular gold-stock investment vehicle, the GDX VanEck Vectors Gold Miners ETF. Launched way back in May 2006, it has an insurmountable first-mover lead. GDX’s net assets running $9.0b this week were a staggering 46.6x larger than the next-biggest 1x-long major-gold-miners ETF! GDX is effectively this sector’s blue-chip index.
It currently includes 46 component stocks, which are weighted in proportion to their market capitalizations. This list is dominated by the world’s largest gold miners, and their collective importance to this industry cannot be overstated. Every quarter I dive into the latest operating and financial results from GDX’s top 34 companies. That’s simply an arbitrary number that fits neatly into the tables below, but a commanding sample.
As of this week these elite gold miners accounted for fully 94.3% of GDX’s total weighting. Last quarter they combined to mine 274.4 metric tons of gold. That was 32.2% of the aggregate world total in Q1’19 according to the World Gold Council, which publishes comprehensive global gold supply-and-demand data quarterly. So for anyone deploying capital in gold or its miners’ stocks, watching GDX miners is imperative.
The largest primary gold miners dominating GDX’s ranks are scattered around the world. 20 of the top 34 mainly trade in US stock markets, 6 in Australia, 5 in Canada, 2 in China, and 1 in the United Kingdom. GDX’s geopolitical diversity is excellent for investors, but makes it more difficult to analyze and compare the biggest gold miners’ results. Financial-reporting requirements vary considerably from country to country.
In Australia, South Africa, and the UK, companies report in half-year increments instead of quarterly. The big gold miners often publish quarterly updates, but their data is limited. In cases where half-year data is all that was made available, I split it in half for a Q1 approximation. While Canada has quarterly reporting, the deadlines are looser than in the States. Some Canadian gold miners drag their feet in getting results out.
While it is challenging bringing all the quarterly data together for the diverse GDX-top-34 gold miners, analyzing it in the aggregate is essential to see how they are doing. So each quarter I wade through all available operational and financial reports and dump the data into a big spreadsheet for analysis. The highlights make it into these tables. Blank fields mean a company hadn’t reported that data as of this Wednesday.
The first couple columns of these tables show each GDX component’s symbol and weighting within this ETF as of this week. While most of these stocks trade on US exchanges, some symbols are listings from companies’ primary foreign stock exchanges. That’s followed by each gold miner’s Q1’19 production in ounces, which is mostly in pure-gold terms. That excludes byproduct metals often present in gold ore.
Those are usually silver and base metals like copper, which are valuable. They are sold to offset some of the considerable expenses of gold mining, lowering per-ounce costs and thus raising overall profitability. In cases where companies didn’t separate out gold and lumped all production into gold-equivalent ounces, those GEOs are included instead. Then production’s absolute year-over-year change from Q1’18 is shown.
Next comes gold miners’ most-important fundamental data for investors, cash costs and all-in sustaining costs per ounce mined. The latter directly drives profitability which ultimately determines stock prices. These key costs are also followed by YoY changes. Last but not least the annual changes are shown in operating cash flows generated, hard GAAP earnings, revenues, and cash on hand with a couple exceptions.
Percentage changes aren’t relevant or meaningful if data shifted from positive to negative or vice versa, or if derived from two negative numbers. So in those cases I included raw underlying data rather than weird or misleading percentage changes. Companies with symbols highlighted in light-blue have newly climbed into the elite ranks of GDX’s top 34 over this past year. This entire dataset together is quite valuable.
It offers a fantastic high-level read on how the major gold miners are faring fundamentally as an industry and individually. While the endless challenge of growing production continues to vex plenty of the world’s larger gold miners, they generally performed much better in Q1’19 than today’s low gold-stock prices reflect. Last quarter was also a big transition one as the recent gold-stock mega-mergers continued to settle out.
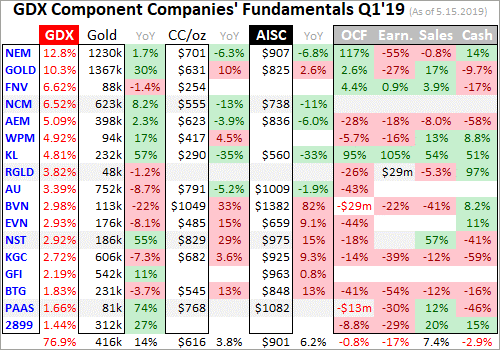
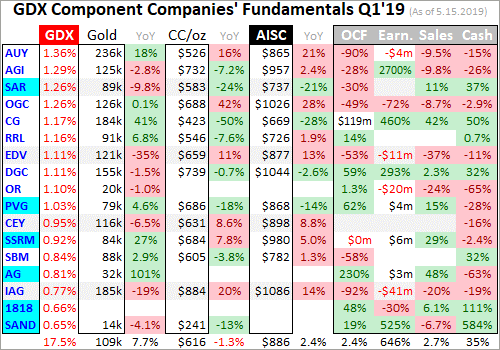
Production has always been the lifeblood of the gold-mining industry. Gold miners have no control over prevailing gold prices, their product sells for whatever the markets offer. Thus growing production is the only manageable way to boost revenues, leading to amplified gains in operating cash flows and profits. Higher output generates more capital to invest in expanding existing mines and building or buying new ones.
Gold-stock investors have long prized production growth above everything else, as it is inexorably linked to company growth and thus stock-price-appreciation potential. But for several years now the major gold miners have been struggling to grow production. Large economically-viable gold deposits are getting increasingly harder to find and more expensive to exploit, with the low-hanging fruit long since picked.
Gold miners’ exploration budgets have cratered since gold collapsed in Q2’13, plummeting 22.8%! That was the yellow metal’s worst quarter in an astounding 93 years, which devastated sentiment and scared investors away from this sector. Much less capital to explore shrank the pipeline of new finds to replace relentless depletion at existing mines. That left major gold miners just one viable option to grow their output.
They either have to buy existing mines and/or deposits from other companies, or acquire those outright. That’s unleashed a merger-and-acquisition wave that culminated in recent quarters. In September 2018 gold giant Barrick Gold announced it was merging with Randgold. Not to be outdone, in January 2019 the other gold behemoth Newmont Mining declared it was acquiring Goldcorp in another colossal mega-deal.
I wrote a whole essay analyzing these mega-mergers in mid-February, and believe they are bad for this sector for a variety of reasons. For our purposes today, Q1’19 was the first quarter fully reflecting the new Barrick including Randgold. But Newmont’s acquisition of Goldcorp wasn’t finalized until April 2019, so that isn’t included in NEM’s Q1’19 results. And unfortunately Goldcorp’s weren’t published separately either.
That makes analyzing the GDX top 34’s gold production last quarter more complicated than usual. As far as I can tell, Newmont released nothing on Goldcorp’s Q1 operations. As usual when one company buys out another, the acquired company’s website is quickly effectively deleted. It is replaced with a tiny new website largely devoid of useful information, that redirects to the new combined company’s main website.
So Goldcorp’s Q1 results were apparently cast into a black hole, never to be seen by investors. Across last year’s four quarters, Goldcorp ranked as the 5th-to-7th-largest GDX component. So excluding it from this leading gold-stock ETF skews all kinds of Q1 numbers. This discontinuity will resolve itself over the next couple quarters as Newmont and Goldcorp are fully integrated into the new, wait for it, “Newmont Goldcorp”.
In Q1’19 these top 34 GDX gold miners produced 8.8m ounces of gold, which was down a sharp 6.3% from Q1’18’s levels. But Goldcorp averaged 574k ounces of quarterly production in 2018. If that is added in, Q1’19’s climbs to 9.4m ounces which is only off a slight 0.2% YoY. Stable gold output is a victory for the major gold miners, as there have been plenty of recent quarters where their production has declined.
But depletion is still a huge challenge for them, as they are losing market share to smaller gold miners that aren’t so unwieldy to manage. The World Gold Council publishes the best global gold fundamental supply-and-demand data quarterly. According to its latest Q1’19 Gold Demand Trends report, total world mine production actually climbed 1.1% YoY in Q1. So the larger gold miners continue to underperform.
On a quarter-over-quarter basis since Q4’18, the GDX top 34’s gold production plunged 8.8%! But again that is overstated by Goldcorp’s missing-in-action Q1 output. Add in that 2018 quarterly approximation, and that decline moderates to 2.8% QoQ. The quarter-to-quarter output dynamics among the major gold miners are somewhat surprising. Gold is not produced at a steady pace year-round as logically assumed.
Going back to 2010, the world gold mine production per the WGC has averaged sharp 7.2% QoQ drops from Q4s to Q1s! For many if not most major gold miners, calendar years’ first quarters mark the low ebb in their annual output. The gold miners attribute this Q1 lull to new capital spending that slows production as mine infrastructure is upgraded. That weaker output in Q1s is regained with big jumps in following quarters.
In that same decade-long WGC dataset, Q2s saw world mine production average big 5.4% QoQ surges from Q1s! That sharp acceleration trend continued in Q3s, which averaged additional 5.3% QoQ growth from Q2s. Then that petered out on average in Q4s, which were only 0.5% better than Q3s. So it is normal for gold miners’ production to fall sharply in years’ Q1s before rebounding strongly in Q2s and Q3s.
There’s more to this intra-year seasonality than capital spending though. Mine managers play a big role in how they plan their ore sequencing. Individual gold deposits are not homogenous, but have varying richness throughout their orebodies. Mine managers have to decide which ore to mine in any quarter, which is fed through their fixed-capacity mills for crushing and gold recovery. Ore grade determines output.
The more gold per ton of ore dug and hauled in any quarter, the more gold produced. Mine managers choose to process more lower-grade ores in Q1s, then move to higher-grade ore mixes in Q2s and Q3s. That helps maximize their incentive bonuses. Q3 results are reported in early-to-mid Novembers soon before year-ends. Higher production boosts stock prices heading into that year-end bonus-calculation time!
Realize that Q1 results reported from early-to-mid Mays generally show a year’s weakest gold output. It is surprising to see investors sell gold stocks hard when Q1’s production declines from Q4’s, as this is par for the course in this industry. The bright side is excitement later builds throughout the year as Q2’s and Q3’s production grows fast. The gold miners look better fundamentally later in years than earlier in them!
With year-over-year gold production among the GDX top 34 effectively flat in Q1’19 with Goldcorp’s likely output added back in, odds argued against much of a change in gold-mining costs. They are largely fixed quarter after quarter, with actual mining requiring the same levels of infrastructure, equipment, and employees. These big fixed costs are spread across production, making unit costs inversely proportional to it.
There are two major ways to measure gold-mining costs, classic cash costs per ounce and the superior all-in sustaining costs per ounce. Both are useful metrics. Cash costs are the acid test of gold-miner survivability in lower-gold-price environments, revealing the worst-case gold levels necessary to keep the mines running. All-in sustaining costs show where gold needs to trade to maintain current mining tempos indefinitely.
Cash costs naturally encompass all cash expenses necessary to produce each ounce of gold, including all direct production costs, mine-level administration, smelting, refining, transport, regulatory, royalty, and tax expenses. In Q1’19 these top-34-GDX-component gold miners that reported cash costs averaged $616 per ounce. That actually fell a sharp 7.7% YoY, down on the low side of recent years’ cash-cost range.
Investor sentiment in gold-stock land has been really poor, as recent months’ extreme stock euphoria has really stunted interest in gold. If stock markets seemingly do nothing but rally indefinitely, then why bother prudently diversifying stock-heavy portfolios with counter-moving gold? There’s been increasing chatter lately about the gold-mining industry’s viability, which isn’t unusual when psychology waxes quite bearish.
Those worries are ridiculous with the major gold miners’ cash costs averaging in the low $600s even in Q1’s low-quarterly-output ebb. As long as gold remains well above $616, this neglected sector faces no existential threat. And Q1’s top-34-GDX-average cash costs are even skewed higher by one struggling gold miner, Peru’s Buenaventura. In Q1’19 it suffered a sharp 22.2% YoY plunge in gold production.
That was primarily due to the company stopping extraction operations at one of its key mines in January to rejigger and centralize it. That lower output to spread mining’s big fixed costs across was enough to catapult BVN’s Q1 cash costs 33.1% higher YoY to an extreme $1049 per ounce. Those are expected to mean revert much lower in coming quarters. Ex-BVN the rest of the GDX top 34 averaged merely $600.
Way more important than cash costs are the far-superior all-in sustaining costs. They were introduced by the World Gold Council in June 2013 to give investors a much-better understanding of what it really costs to maintain gold mines as ongoing concerns. AISCs include all direct cash costs, but then add on everything else that is necessary to maintain and replenish operations at current gold-production levels.
These additional expenses include exploration for new gold to mine to replace depleting deposits, mine-development and construction expenses, remediation, and mine reclamation. They also include the corporate-level administration expenses necessary to oversee gold mines. All-in sustaining costs are the most-important gold-mining cost metric by far for investors, revealing gold miners’ true operating profitability.
The GDX-top-34 gold miners reported average AISCs of $893 per ounce in Q1’19, up merely 1.0% YoY. These flat AISCs are right in line with flat production when Goldcorp’s likely output is added back in. The big operational challenges at Buenaventura also rocketed its AISCs an incredible 82.3% higher YoY to an anomalous $1382 per ounce. Excluding BVN, the rest of the GDX top 34 averaged $874 AISCs in Q1.
That’s right in line with the past couple calendar years’ quarterly average of $872. The major gold miners, despite still struggling to grow their production enough to exceed depletion, are still holding the line on all-important costs. Those stable costs regardless of prevailing gold prices are what make the gold stocks so attractive. They have massive upside potential as their profits amplify the higher gold prices still coming.
The gold price averaged $1303 in Q1’19. Subtracting the major gold miners’ average $893 AISCs from that yields strong profits of $410 per ounce. While recent years’ universal stock-market euphoria has capped gold at $1350 resistance, it has still been grinding higher on balance carving higher lows. Gold is getting wound tighter and tighter towards a major upside breakout to new bull highs well above $1350.
Like usual gold investment demand will be rekindled when the stock markets inevitably roll over materially again, propelling gold higher. A mere 7.7% upleg from $1300 would carry gold to $1400, and just 15.4% would hit $1500. Those are modest and easily-achievable gains by past-gold-upleg standards. During essentially the first half of 2016 after major stock-market selloffs, gold blasted 29.9% higher in 6.7 months!
At $1300 and Q1’s $893 average AISCs, the major gold miners are earning $407 per ounce. But at $1400 and $1500 gold, those profits soar to $507 and $607. That’s 24.6% and 49.1% higher on relatively-small 7.7% and 15.4% gold uplegs from here! This inherent profits leverage to gold is why the major gold stocks of GDX tend to amplify gold uplegs by 2x to 3x or so. Investors enjoy large gains as gold rallies.
Despite investors’ serious apathy for this sector, the gold miners’ costs remain well-positioned to fuel big profits growth in a higher-gold-price environment. Investors love rising earnings, which are looking to be scarce in the general stock markets this year. The better gold miners’ stocks are likely to see big capital inflows as gold continues climbing on balance, which will drive them and to a lesser extent GDX much higher.
The GDX top 34’s accounting results weren’t as impressive as their flat production and costs in Q1. The lack of Goldcorp’s operations being accounted for last quarter again distorted normal annual comparisons. So all these Q1’19 numbers are compared to Q1’18’s excluding Goldcorp. Last quarter’s average gold price being 1.9% lower than Q1’18’s average also played a role in weaker year-over-year performance.
The GDX top 34’s total revenues fell 5.2% YoY ex-Goldcorp to $9.2b in Q1’19. That’s reasonable given the slightly-lower production and gold prices. Lower byproduct silver output also contributed, as a half-dozen of these elite major gold miners also produce sizable amounts of silver. Again without Goldcorp, the total silver output among the GDX top 34 fell 8.0% YoY to 27.3m ounces in Q1 weighing on total sales.
Their overall cash flows generated from operations mirrored this weakening trend, down 9.1% YoY to $2.8b last quarter. Still the GDX-top-34 gold miners were producing lots of cash as the big profits gap between their AISCs and prevailing gold prices implied. Only two of these major gold miners suffered significant negative OCFs, and one of those was naturally Buenaventura with all its production struggles.
These elite gold miners remained flush with cash at the end of Q1, reporting $11.1b on their books. That is 11.3% lower YoY without Goldcorp. The gold miners tap into their cash hoards when they are building or buying mines, so declines in overall cash balances suggest more investment in growing future output. Investors fretting about the gold-mining industry today aren’t following their strong operating cash flows.
Last but not least are the GDX top 34’s hard accounting profits under Generally Accepted Accounting Principles. These are the actual quarterly earnings reported to the SEC and other regulators. Overall profits excluding Goldcorp only declined 7.2% YoY to $731m in Q1’19. That’s really impressive in light of the 5.2%-lower revenues. Prior quarters’ big mine-impairment charges on lower gold prices also dried up.
So the major gold miners included in this sector’s leading ETF are doing a lot better than investors are giving them credit for. There’s no fundamental reason for this critical portfolio-diversifying contrarian sector to be shunned. Gold stocks’ only problem is the lack of upside action in gold, which will quickly change once the stock markets decisively roll over again. December 2018 proved these relationships still work.
As the S&P 500 plunged 9.2% that month, investors remembered the timeless wisdom of keeping some gold and gold miners’ stocks in their portfolios. So they started shifting capital back in, driving gold 4.9% higher that month which GDX leveraged to a big 10.5% gain! Gold and its miners’ stocks act like portfolio insurance when stock markets sell off. Everyone really needs a 10% allocation in gold and gold stocks!
That being said, GDX isn’t the best way to do it. This ETF’s potential upside is retarded by the large gold miners struggling to grow their production. Investment capital will seek out the smaller mid-tier and junior gold miners actually able to increase their output. It’s far better to invest in these great individual miners with superior fundamentals. While plenty are included in GDX, their relatively-low weightings dilute their gains.
GDX’s little-brother ETF GDXJ is another option. While advertised as a “Junior Gold Miners ETF”, it is really a mid-tier gold miners ETF. It includes most of the better GDX components, with higher weightings since the largest gold majors are excluded. I wrote an entire essay in mid-January explaining why GDXJ is superior to GDX, and my next essay a week from now will delve into the GDXJ gold miners’ Q1’19 results.
Back in essentially the first half of 2016, GDXJ rocketed 202.5% higher on a 29.9% gold upleg in roughly the same span! While GDX somewhat kept pace then at +151.2%, it is lagging GDXJ more and more as its weightings are more concentrated in stagnant gold super-majors. The recent mega-mergers are going to worsen that investor-hostile trend. Investors should buy better individual gold stocks, or GDXJ, instead of GDX.
One of my core missions at Zeal is relentlessly studying the gold-stock world to uncover the stocks with superior fundamentals and upside potential. The trading books in both our popular weekly and monthly newsletters are currently full of these better gold and silver miners. Mostly added in recent months as gold stocks recovered from deep lows, their prices remain relatively low with big upside potential as gold rallies!
If you want to multiply your capital in the markets, you have to stay informed. Our newsletters are a great way, easy to read and affordable. They draw on my vast experience, knowledge, wisdom, and ongoing research to explain what’s going on in the markets, why, and how to trade them with specific stocks. As of Q1 we’ve recommended and realized 1089 newsletter stock trades since 2001, averaging annualized realized gains of +15.8%! That’s nearly double the long-term stock-market average. Subscribe today for just $12 per issue!
The bottom line is the major gold miners performed pretty well last quarter. Their production held steady despite lower prevailing gold prices and inexorable depletion. That led to flat costs right in line with prior years’ average levels. That leaves gold-mining earnings positioned to soar higher in future quarters as gold continues slowly grinding higher on balance. Another major stock-market selloff will accelerate that trend.
Stock investors are making a serious mistake ignoring gold and its miners’ stocks. The bearish sentiment plaguing this sector today is irrational given miners’ solid fundamentals. Diversifying is best done before it is necessary, buying low with gold-stock prices so beaten-down. This is the only sector likely to rally fast amplifying gold’s upside when stock markets inevitably swoon again. Don’t overlook the great opportunity here!
Adam Hamilton, CPA
May 21, 2019
Copyright 2000 – 2019 Zeal LLC (www.ZealLLC.com)
The junior resource sector is a people business. In my view, making money consistently in a sector which is fraught with risk and failure, without a doubt, is inextricably linked to the quality of the people who are running the companies with which I am investing.
This statement, and statements like it, are very likely the most common answers you will hear from many pundits throughout the industry. While this should now be common knowledge, however, I still hear from investors who invest and lose money with “butchers, bakers and candlestick makers.”
So, why does this still happen? I’m not totally sure. Maybe it’s the potential for a quick buck or simply investors caught up in a narrative. Whatever the answer may be, I’m sure it will continue in the future, and that’s too bad. While it makes a select few rich, overall, the promotion of mediocrity is really bad for the sector.
In saying this, today I have for you a conversation with one of the sector’s ‘greats;’ a man and a group in which it’s worth investing.
This person is Dr. Mark O’Dea, Chairman and Founder of Oxygen Capital.
Oxygen Capital has a great track record of success within the sector, as they have provided a ton of value for their shareholders through the sale of many of their projects, such as Fronteer Gold, Aurora Energy and True Gold.
In our conversation, I asked O’Dea about the secret behind Oxygen Capital’s success, lessons he’s learned while working in the sector, his view of jurisdictional risk and more. There’s a lot to glean from O’Dea’s answers – Enjoy!
Brian: In my opinion, one of the biggest issues facing most people is their lack of self-awareness. Whether it be in their investments or their personal lives, many people either have no idea or are prone to lying to themselves about where they are strong and where they are weak and, thus, typically fall short of their goals and aspirations. Oxygen Capital and its managing partners definitely don’t have this issue, as their track record for success within the resource sector is among the best I have seen. What has and continues to make Oxygen Capital successful within the resource sector?
Mark: When you start working on a project, you know reasonably soon, whether it has the potential to be an economic deposit or not, and if it doesn’t, there’s really no point in faking it. It’s a waste of time, it destroys the trust of shareholders, and it builds the wrong type of working culture. So, you’re much better off focusing your efforts on finding the right project. We have lived by the philosophy of “good projects and good places” for 20 years now and it has worked out really, really well.
Over that period, I’ve been CEO and/or Executive Chairman of a number of public companies that have been acquired, because they were underpinned by projects that were either operating mines, or advanced projects that could ultimately become mines.
For example, Fronteer Gold, among other things, had the high grade Long Canyon deposit that ultimately became a mine built by Newmont, after they acquired Fronteer in 2011. It is now one of their lowest cost mines in the USA. Aurora Energy defined and advanced one of the largest uranium deposits in Canada back in 2009, and it was ultimately acquired by Paladin in 2011. Its Michelin deposit needs higher Uranium prices, but it’s got all the attributes of a long life mine. And most recently, at True Gold, we built an open-pit, heap leach gold mine in West Africa, and shortly after we poured our first gold bar in 2016, we were acquired by Endeavour Mining. So, all of our big successes have been underpinned by high quality projects that were either mines or had the potential to become mines.
Today, we’ve got four companies at Oxygen – Pure Gold, Liberty Gold, Sun Metals and Discovery Metals. We’ve created, in my view, one of the best exploration and development pipelines in the business. And all of our companies continue to be underpinned by good projects, in good places. At Pure Gold, we have the large Madsen Gold Deposit in Red Lake Ontario, which is currently the highest grade gold development project in Canada today. We just finished a bankable feasibility study that’s underpinned by a two million ounce indicated resource, at almost nine grams per ton, with another half million ounces of inferred gold. It’s going through the final permitting process and ultimately the goal is to become the next Canadian producer.
Liberty is rapidly advancing three big open pit gold projects in the Great Basin of the United States. They’re excellent projects in a Tier 1 jurisdiction. We recently put out a PEA on Gold Strike and it shows that it’s got the makings of an excellent low cost mine. It’s very appealing. And we’re about to start drilling Black Pine, which is another big Carlin-style gold system that has exciting size potential.
Finally, Sun Metals, we just made a highly disruptive discovery in BC, which was frankly, one of the best high grade copper-gold intercepts in Canada in 2018. We’re about to get back in there this summer and continue drilling to build continuity and size. We are all very excited. So, all of our businesses are underpinned by real projects and that’s been the key to our success.
Brian: Over the course of my life, I have learned that a large portion of what it takes to be successful is not being afraid of failure. The caveat being that it doesn’t pay to be irrationally courageous, either. Firstly, do you agree? Secondly, can you give an example, in terms of your personal resource sector career, of how you used this philosophy to overcome adversity and be successful?
Mark: I would agree with both points, this business is like a treasure hunt, and you know you’re going to make a lot of wrong turns, and hit a lot of dead ends along the way. But when you persevere and ultimately get to the prize, the reward can be spectacular for everyone, and it’s worth it.
We look at dozens and dozens of projects every year, and the key is to know, A, what makes a good project, and those are things like grade, size, strip ratio, metallurgy, all those kinds of things. The second is knowing when to keep going and when to stop.
In my opinion, it is perfectly fine and, in fact, preferable to cut your losses and move on, if your project isn’t shaping up into something meaningful. So, maybe the metallurgy is fatal, or the strip ratio is too high, or the grade is too low, or maybe you just got the geology all wrong. Whatever the reason, failure is part of this business and winning teams in my opinion need to be able to try and fail and quickly move on to a better project. That’s what investors expect of you.
Brian: For me, jurisdictional risk is an interesting subject because everyone has their own criteria for what constitutes risk. For most, jurisdictional risk is most closely tied to the politics of the country in question, or the politics of a neighbouring country.
Over the course of your career, you have worked in and run mining companies in a variety of different countries around the world. These countries range from premier jurisdictions, like Canada and the United States, to some of the more difficult places, like Burkina Faso and Turkey. How have these experiences shaped the way you view jurisdictional risk?
Mark: In my view, risk comes in many forms and I put risk in two categories. One is subterranean risk. Everything below the ground, and the other is above ground risk. And so, 50 years ago in our sector, all the risk associated with mining was subterranean and related to the deposit itself. Did it have the grade and the size or not? And today, all those subterranean risks are still there, to the exact same extent, but layered on top of it all are the above ground risks. Which are, in many ways, far more challenging, because they’re difficult to manage and they can take a lot of time.
I’m talking about things like regulatory, permitting, social, and geo political risk, and mining is under increased scrutiny today. Regardless of the jurisdiction you’re in these days, each jurisdiction has its challenges, whether it’s from local communities or an environmental group.
From day one, your project needs to be positioned in a way that benefits the local community, regardless of where you are. And that means employment, a better way of life and environmental protection, and if you get these three correct right out of the gate, then you are at least increasing your chances of success down the road.
Brian: At the moment, bearish sentiment within the resource sector appears to be very prevalent. As a consequence, many of the junior companies that I have spoken to are finding it very hard to raise cash to further develop their projects. Oxygen Capital companies have a great reputation when it comes to their ability to raise cash. First, how is it that Oxygen companies are able to raise cash in difficult markets and, second, in your opinion, why is the junior resource sector on a whole, seemingly, having a hard time attracting investment capital?
Mark: Since 2013, we’ve been in a bear market; gold spiked at US$1890 /oz in 2012, and then we’ve been bumping along in the US$1200s to US$1300 range for about six years now. And, during this period, there have been some pretty massive structural changes, with traditional funding having exited the space and dried up. ETF flows have stolen liquidity, and passive money is taken over from active money. During this period, we’ve been able to stick to our knitting and we’ve been focused on buying, exploring and advancing great projects in great places, and building our pipeline. Our businesses have been able to grow in this bear market because we’ve been able to attract some of the best investors and name brand backers in the sector, and I’m extremely thankful for their support in backing our companies. Since 2012, we’ve raised about $500 million dollars in 30 finances. And that includes the CapEx to build the Karma open-pit mine in Burkina Faso.
The biggest challenge to raising new capital today is the decimation of actively managed resource funds. These funds kept the ecosystem going for decades and most of that capital has now migrated into passively managed ETFs, which don’t participate in financings. It has also shifted into other speculative industries, which hasn’t helped. But I do fundamentally believe, that the relevance and approval of the sector is going to have a renaissance as the demand for green technologies puts a bigger and bigger focus on the need for metals in our modern lives.
Brian: Having attended many resource sector focused investment conferences over the years, it’s clear, to me at least, that the majority of investors in the sector are in their, so-to-speak, ‘golden years.’ The younger generations, mainly the millennials, on mass, are virtually absent, with their attention seemingly more focused on cannabis and crypto. The question that comes to my mind is, why? Is it a matter of relatability? In your opinion, why has the resource sector failed to attract the millennial generation’s investment dollars, thus far?
Mark: I think that is an important question, but I’m not sure we’re getting the answer right. The broader market has been booming, other sectors have been on fire and generating great returns, in sectors that are more topical and, frankly, cooler. In contrast, you look at the mining space and the equities have been going down for eight years, so there hasn’t been an opportunity for them to make any money. So, they’ve been staying away and that’s one answer.
The other answer, I think there’s a cognitive dissonance between understanding the role of mining in propelling a greener, more sustainable society. That vision requires metals. And, ultimately, I think a connection needs to be made by people, who are embracing electric vehicles, wind turbines, solar panels, and recognize that they all require metals. Lots of metal, which can be extracted without destroying the environment.
As an example, Tesla just published an article today saying there’s not going to be enough metal to supply the electric vehicle demand that’s anticipated. And that’s all copper, cobalt, nickel, etc. What end consumers and investors need to realize is that, mining and environmentalism are all part of the same continuum. We’re all on the same team. And people can feel good about extracting metals from the ground, to build a sustainable greener future, while still protecting the environment. It all needs to be able to coexist as part of the same ecosystem.
Brian: Within Oxygen, you tend to focus on de-risked projects as part of your ethos. A great example of an advanced de-risked project would be the Madsen Red Lake Gold Mine, which is owned by Pure Gold, in Red Lake, Ontario. Red Lake is a prolific district. What are your reasons for focusing on gold right now and what do you see as a future for Red Lake?
Mark: Almost all of our success as a group comes from projects that have been worked on in the past and we have effectively “rediscovered” them. We can include the Michelin Project that Aurora had, Goldstrike and Black Pine at Liberty Gold, Karma at True Gold, Long Canyon at Fronteer Gold and Madsen at Pure Gold. These were all past producing mines or previous exploration projects that were forgotten and put away for various reasons including low metal prices or changes to corporate direction.
Madsen is a perfect example to highlight. This was a past producing mine for 38 years, it produced 2.5 million ounces of gold and effectively lay dormant for 20 years, owned by the predecessor company Claude Resources, who worked on it intermittently, but never advanced it to the stage of developing a new geological understanding and getting it back into production.
Pure Gold picked it up in 2014, and consolidated the property for a net cost of $8.7 million dollars and the team has focused on re-interpreting, compiling, integrating, every bit of data they could for two years on this project. We came up with a new geological model and the Company is now sitting on the highest grade development gold project in Canada, with a million ounces of reserves, drilled off at six-and-half meter centers, and sitting within a 2.1 million ounce indicated resource with another half million ounces of inferred resource. It’s an extraordinary accomplishment and these are all new ounces. This is not a remnant project that we’re going to go in and salvage. These are brand new ounces sitting outside of historical development. So, that’s a pretty important fact to include in there.
Madsen, even though it’s evolved from a historical legacy project, it is actually a big part of the future of Red Lake. It’s a sunrise asset today. We’re about to move through the final permitting process and into production with a high grade gold reserve of one million ounces, with the potential to provide decades of production in Red Lake. Meanwhile, the Red Lake mine complex itself is a sunset asset and it’s starting to wane. So, I think Madsen is going to be a very, very important component of the whole consolidated Red Lake package.
Brian: In my opinion, distinguishing if management teams are owners or if they are solely employees is integral to understanding the motivation the team has to succeed. Not only is it integral to understand how much of the company insiders own, but at what price.
How important do you think it is that management own shares in their own companies?
Mark: I think it’s vital, I think it’s one of the most important things that a shareholder should look at, when they invest in a company. How much skin in the game does the management have? There’s a massive difference between being an employee and being an owner. Being an owner of your company, through owning a significant portion of shares, is a really strong testament to your dedication and your focus on making it a successful venture. For example, at Pure Gold, we recently had five year options that were about to expire last month and everybody in the group, all the board and senior management, exercised those options and held the stock, adding three million shares of insider ownership to the books.
One of the things I have learned over the years is that when you have a project that you truly believe in, own as much of it as possible. I’m one of the largest shareholders in each of the oxygen companies, and have been regularly adding to my position at Pure Gold and Liberty Gold.
Brian: Mark, it has been a pleasure. Thank you very much for sharing your thoughts on the resource sector and, most importantly, educating us on the Oxygen Capital group of companies. Before we end, do you have any final thoughts or advice for resource sector investors in 2019 and beyond?
Mark: I will leave you with a quote from Miles Davis, who knew what he was talking about when it came to jazz when he said, “Time is not the main thing. It’s the only thing.” He wasn’t talking about mining, obviously, he was talking about music. But I think it is equally applicable to the mining sectors.
In this business or any cyclical business, if you get the timing right, the results can be spectacular, beautiful. And to me, it feels very much like the timing is right for the resource stocks to resurface and breakout from this bear market in the very near term.
Don’t want to miss a new investment idea, interview or financial product review? Become a Junior Stock Review VIP now – it’s FREE!
Until next time,
Brian Leni P.Eng
Founder – Junior Stock Review
Disclaimer: The following is not an investment recommendation, it is an investment idea. I am not a certified investment professional, nor do I know you and your individual investment needs. Please perform your own due diligence to decide whether this is a company and sector that is best suited for your personal investment criteria. I do NOT own shares in any of the companies discussed in the interview. I have NO business relationship with Oxygen Capital or any of its associated companies.
1. The short seasonal rally for gold that typically follows India’s Akha Teej holiday (May 7 this year) is in play but this time it is being “juiced” by a major U.S. stock market meltdown!
2. In a game with nine innings, the U.S. business cycle is probably in the eighth or ninth inning.
3. Stock market welfare programs provided by central banks (QE and intense rate cuts) have extended the bull market in stocks. QE is a vile form of corporate socialism. Horrifically, QE is maniacally embraced by governments around the world.
4. Extreme interest rate cuts are a tool to attack elderly savers and make small business loans unprofitable, while promoting stock market buybacks that enrich the elite. These rate cuts and QE also promote government debt worship.
5. The debt worship, which is particularly prevalent in America, has exponentially increased the danger of a 1929-style global stock markets crash. Ominously, it’s happening as the business cycle peaks and a wave of de-dollarization is racing across the globe.
6. U.S. oil company profits have played a big role in overall stock market earnings, and oil suddenly looks quite shaky.
7. The tech-weighted Nasdaq has done better than the Dow in recent years, but the latest tariff tax tantrums thrown by U.S. and Chinese governments could become big nails in the overall earnings growth coffin.
8. Please click here now. Mike Wilson is one of America’s most influential stock market analysts. He suggests that America is headed for recession if more tariffs are coming. I’ve predicted more tariffs are on the way, and here to stay!
9. The tariffs are here for the long-term because the decline of America as lead empire is long-term. Some major bank economists and analysts are also beginning to adopt this view.
10. My www.guswinger.com swing trade service caught all the latest downside action in the Nasdaq as well as the stunning rally in the dollar against the yuan in the FOREX market. These swing trades are mechanical. They are not influenced by U.S. government “world growth leader” propaganda and debt worship.
11. Please click here now. Double-click to enlarge. The Dow has gone nowhere since the tariff taxes were launched. I predict it will continue to go nowhere.
12. Horrifically, at this stage of the business cycle a meltdown is as likely as sideways action. The only people making any money in this stock market are short-term traders and dividend investors.
13. Please click here now. Double-click to enlarge this superb gold chart. The bull wedge breakout is impressive but until the dollar collapses against the yen I would not get overly excited about gold’s immediate prospects for substantially higher prices.
14. On that note, please click here now. Double-click to enlarge. I warned investors about the importance of the 109.50 price zone on this USD vs yen chart.
15. A sustained decline below 109.50 would likely see gold challenge the $1350 area highs and the U.S. stock market could enter an “incineration” phase.
16. The influence of Chinese citizens on the gold price should not be underestimated. The tariff taxes are creating a wave of nationalism but also concern about the stock market.
17. When risks rise, bank FOREX traders buy the yen, sell the dollar, and China goes for the gold!
18. I don’t expect the Chinese government to aggressively sell US T-bonds right now, but more U.S. tariffs are likely and then I expect significant T-bond selling to get underway.
19. That will create concerning inflation in America as the U.S. government is forced to either print money or raise rates to peddle its debt to cautious domestic buyers. Hedge fund “supremo” Ray Dalio has predicted America’s future is an inflationary depression. Going forward, all roads lead to gold.
20. Please click here now. Double-click to enlarge this GDX chart. There’s nothing negative about the price action in most gold stocks right now. It’s all positive. Note the burst of volume during yesterday’s spectacular GDX rally….
21. A rally that occurred while the Dow tumbled 600 points!
22. In the big picture, it’s quite rare for gold stocks to fall while the stock market falls. It happened in 2008 due to system risk but that’s the exception to the gold stocks versus stock market rule.
23. Volume has generally softened since the February strong demand season peak after generally rising during the September-February rally. Note my 14,7,7 Stochastics series buy signal that is just occurring now. A Friday close above $23 is my “launchpad” number.
24. What would be the main feature of an inflationary depression? It would probably be extreme money printing conducted by the U.S. government. GDX has a realistic chance of hitting the $30 area in the second half of this year, and then going even higher in 2020. The good news for gold stock investors is that tariffs are not likely to go away until stock markets incinerate, inflation skyrockets, and the price of gold begins to go parabolic!
Special Offer For Website Readers: Please send me an Email to freereports4@gracelandupdates.com and I’ll send you my free “Make Gold Stock Profits Now!” report. I highlight key gold stock breakouts and include investor tactics to make money and limit risk. I also highlight the stunning action in bitcoin that is occurring during the stock market meltdown!
Stewart Thomson
Graceland Updates
https://gracelandjuniors.com
www.guswinger.com
Email:
stewart@gracelandupdates.com
stewart@gracelandjuniors.com
stewart@guswinger.com
Stewart Thomson is a retired Merrill Lynch broker. Stewart writes the Graceland Updates daily between 4am-7am. They are sent out around 8am-9am. The newsletter is attractively priced and the format is a unique numbered point form. Giving clarity of each point and saving valuable reading time.
Risks, Disclaimers, Legal
Stewart Thomson is no longer an investment advisor. The information provided by Stewart and Graceland Updates is for general information purposes only. Before taking any action on any investment, it is imperative that you consult with multiple properly licensed, experienced and qualified investment advisors and get numerous opinions before taking any action. Your minimum risk on any investment in the world is: 100% loss of all your money. You may be taking or preparing to take leveraged positions in investments and not know it, exposing yourself to unlimited risks. This is highly concerning if you are an investor in any derivatives products. There is an approx $700 trillion OTC Derivatives Iceberg with a tiny portion written off officially. The bottom line:
Are You Prepared?
The U.S. stock markets sure feel inflectiony, at a major juncture. After achieving new all-time record highs, sentiment was euphoric heading into this week. But those latest heights could be a massive triple top that formed over 15 months. Then heavy selling erupted in recent days as the U.S.-China trade war suddenly went hostile. The big U.S. stocks just-reported Q1’19 fundamentals will help determine where markets go next.
Four times a year publicly-traded companies release treasure troves of valuable information in the form of quarterly reports. Required by the U.S. Securities and Exchange Commission, these 10-Qs and 10-Ks contain the best fundamental data available to traders. They dispel all the sentiment distortions inevitably surrounding prevailing stock-price levels, revealing corporations’ underlying hard fundamental realities.
The deadline for filing 10-Qs for “large accelerated filers” is 40 days after fiscal quarter-ends. The SEC defines this as companies with market capitalizations over $700m. That currently includes every stock in the flagship S&P 500 stock index (SPX), which contains the biggest and best American companies. The middle of this week marked 38 days since the end of Q1, so almost all the big U.S. stocks have reported.
The SPX is the world’s most-important stock index by far, with its components commanding a staggering collective market cap of $24.9t at the end of Q1! The vast majority of investors own the big U.S. stocks of the SPX, as some combination of them are usually the top holdings of nearly every investment fund. That includes retirement capital, so the fortunes of the big U.S. stocks are crucial for Americans’ overall wealth.
The major ETFs that track the S&P 500 dominate the increasingly-popular passive-investment strategies as well. The SPY SPDR S&P 500 ETF, IVV iShares Core S&P 500 ETF, and VOO Vanguard S&P 500 ETF are among the largest in the world. This week they reported colossal net assets running $271.9b, $175.1b, and $111.5b respectively! The big SPX companies overwhelmingly drive the entire stock markets.
Q1’19 proved extraordinary, the SPX soaring 13.1% higher in a massive rebound rally after suffering a severe correction largely in Q4. That pummeled this key benchmark stock index 19.8% lower in jU.S.t 3.1 months, right on the verge of entering a new bear market at -20%. By the end of Q1, fully 5/6ths of those deep losses had been reversed. Did the big U.S. stocks’ fundamental performances support such huge gains?
Corporate-earnings growth was expected to slow dramatically in Q1, stalling out after soaring 20.5% last year. 2018’s four quarters straddled the Tax Cuts and Jobs Act, which became law right when that year dawned. Its centerpiece was slashing the U.S. corporate tax rate from 35% to 21%, which naturally greatly boosted profits from pre-TCJA levels. Q1’19 would be the first quarter with post-TCJA year-over-year comparisons.
Big U.S. stocks’ valuations, where their stock prices are trading relative to their underlying earnings, offer critical clues on what is likely coming next. By late April the epic stock-market bull as measured by the SPX extended to huge 335.4% gains over 10.1 years! That clocked in as the second-largest and first-longest bull in U.S. stock-market history. With the inevitable subsequent bear overdue, valuations really matter.
Every quarter I analyze the top 34 SPX/SPY component stocks ranked by market cap. This is just an arbitrary number that fits neatly into the tables below, but a dominant sample of the SPX. As Q1 waned, these American giants alone commanded fully 43.7% of the SPX’s total weighting! Their $10.9t collective market cap exceeded that of the bottom 437 SPX companies. Big U.S. stocks’ importance cannot be overstated.
I wade through the 10-Q or 10-K SEC filings of these top SPX companies for a ton of fundamental data I feed into a spreadsheet for analysis. The highlights make it into these tables below. They start with each company’s symbol, weighting in the SPX and SPY, and market cap as of the final trading day of Q1’19. That’s followed by the year-over-year change in each company’s market capitalization, an important metric.
Major U.S. corporations have been engaged in a wildly-unprecedented stock-buyback binge ever since the Fed forced interest rates to deep artificial lows during 2008’s stock panic. Thus, the appreciation in their share prices also reflects shrinking shares outstanding. Looking at market-cap changes instead of just underlying share-price changes effectively normalizes out stock buybacks, offering purer views of value.
That’s followed by quarterly sales along with their YoY change. Top-line revenues are one of the best indicators of businesses’ health. While profits can be easily manipulated quarter to quarter by playing with all kinds of accounting estimates, sales are tougher to artificially inflate. Ultimately sales growth is necessary for companies to expand, as bottom-line profits growth driven by cost-cutting is inherently limited.
Operating cash flows are also important, showing how much capital companies’ businesses are actually generating. Companies must be cash-flow-positive to survive and thrive, using their existing capital to make more cash. Unfortunately many companies now obscure quarterly OCFs by reporting them in year-to-date terms, lumping multiple quarters together. So if necessary to get Q1’s OCFs, I subtracted prior quarters’.
Next are the actual hard quarterly earnings that must be reported to the SEC under Generally Accepted Accounting Principles. Lamentably companies now tend to use fake pro-forma earnings to downplay real GAAP results. These are derided as EBS profits, Everything but the Bad Stuff! Certain expenses are simply ignored on a pro-forma basis to artificially inflate reported corporate profits, often misleading traders.
While we’re also collecting the earnings-per-share data Wall Street loves, it’s more important to consider total profits. Stock buybacks are executed to manipulate EPS higher, because the shares-outstanding denominator of its calculation shrinks as shares are repurchased. Raw profits are a cleaner measure, again effectively neutralizing the impacts of stock buybacks. They better reflect underlying business performance.
Finally the trailing-twelve-month price-to-earnings ratios as of the end of Q1’19 are noted. TTM P/Es look at the last four reported quarters of actual GAAP profits compared to prevailing stock prices. They are the gold-standard metric for valuations. Wall Street often intentionally conceals these real P/Es by using the fictional forward P/Es instead, which are literally mere guesses about future profits that often prove far too optimistic.
These are mostly calendar-Q1 results, but some big U.S. stocks use fiscal quarters offset from normal ones. Walmart, Home Depot, and Cisco have lagging quarters ending one month after calendar ones, so their results here are current to the end of January instead of March. Oracle uses quarters that end one month before calendar ones, so its results are as of the end of February. Offset reporting ought to be banned.
Reporting on offset quarters renders companies’ results way less comparable with the vast majority that report on calendar quarters. We traders all naturally think in calendar-quarter terms too. Decades ago there were valid business reasons to run on offset fiscal quarters. But today’s sophisticated accounting systems that are largely automated running in real-time eliminate all excuses for not reporting normally.
Stocks with symbols highlighted in blue have newly climbed into the ranks of the SPX’s top 34 companies over the past year, as investors bid up their stock prices and thU.S. market caps relative to their peers. Overall the big U.S. stocks’ Q1’19 results looked pretty mixed, with slight sales growth and strong earnings growth. But these growth rates are really slowing, and valuations remain extreme relative to underlying profits.
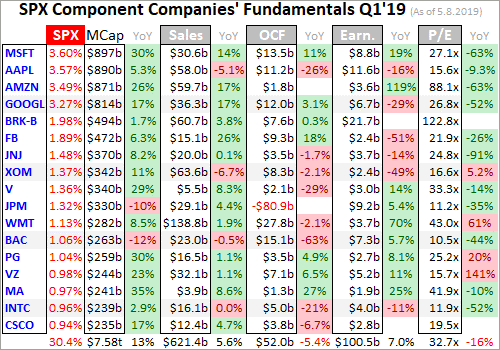
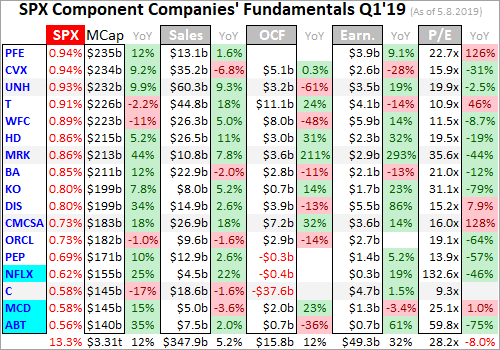
From the ends of Q1’18 to Q1’19, the S&P 500 rallied 7.3% higher. While solid, that’s not much relative to the extreme euphoria and complacency during this latest earnings season. These stock markets could really be in a massive-triple-top scenario after this record bull run, a menacing bearish omen. The SPX initially peaked at 2872.9 in late January 2018, mere weeks after those record corporate tax cuts went into effect.
Then it quickly plunged 10.2% in 0.4 months, a sharp-yet-shallow-and-short correction. But with overall SPX earnings growth exceeding 20% YoY comparing post-tax-cut quarters to pre-tax-cut ones, this key benchmark clawed back higher and hit 2930.8 in late September 2018. That was merely a 2.0% marginal gain over 7.8 months which saw some of the strongest corporate-profits surges ever from already-high levels.
From there the SPX plummeted 19.8% in 3.1 months in that severe near-bear correction largely in Q4. This trend of slightly-better record highs followed by far-worse selloffs is troubling. By late April 2019 the SPX had stretched to 2945.8, jU.S.t 2.5% above its initial peak 15.1 months earlier. Such paltry gains in a span with record corporate tax cuts and resulting torrid earnings growth should really give traders pause.
Technically these three major record highs look like a massive triple top. The big U.S. stocks’ Q1 results are critical to supporting or refuting this bearish technical picture. The SPX/SPY top 34 did enjoy superior market-cap appreciation from the ends of Q1’18 to Q1’19, averaging 12.8% gains which ran 1.7x those of the entire SPX. That exacerbated the concentration of capital in the largest SPX stocks, the mega-cap techs.
As Q1 ended, 5 of the 6 largest SPX stocks were Microsoft, Apple, Amazon, Alphabet, and Facebook. Together they accounted for a staggering 15.8% of this flagship index’s entire market cap, closing in on 1/6th! These companies are universally adored by investors, owned by the vast majority of all funds and constantly extolled in glowing terms in the financial media. Investors think mega-cap techs can do no wrong.
Last summer these incredible businesses were viewed as recession-proof, effectively impregnable. But even if there’s some truth to that, it doesn’t guarantee mega-cap-tech stock prices will weather a stock-market selloff. During that 19.8% SPX correction mostly in Q4, these 5 dominant SPX stocks and another SPX-top-34 tech darling Netflix averaged ugly 33.3% selloffs! They amplified the SPX’s decline by 1.7x.
No matter how amazing the sales growth among the mega-cap techs, they aren’t only not immune to SPX selloffs but their lofty stock prices make them more vulnerable. Overall the SPX/SPY top 34 companies reported Q1’19 revenues of $969.3b, which was 0.9% YoY higher than the top 34’s in Q1’18. That’s not great performance considering how universally-loved and -owned these companies are among nearly all funds.
Those 6 mega-cap tech stocks did far better, enjoying order-of-magnitude-better revenues growth of 9.9% YoY! Excluding them the rest of the SPX top 34 actually saw total sales slump 1.8% lower YoY, which sure doesn’t sound like a strong economy. If this trend of stalling or slowing revenue growth continues, profits growth will have to start falling sharply in future quarters. Earnings ultimately amplify sales trends.
Even more bearish, Wall Street analysts headed into Q1’19’s earnings season expecting all 500 SPX companies to enjoy 4.7% total revenues growth. But the top 34 that dominate the U.S. stock markets did much worse at 0.9% even with mega-cap techs included. That was definitely a sharp slowdown too, as the SPX top 34 saw 4.2% YoY sales growth in Q4’18. Slowing revenue growth is a real threat to the stock markets.
Remember the SPX surged dramatically in Q1, fueling quite-euphoric sentiment leading into quarter-end. At the same time traders mostly believed that a U.S.-China trade deal would soon be signed, removing the trade-war risks. High tariffs are a serious problem for the gigantic multinational companies leading the SPX, potentially heavily impacting sales. Yet revenue growth was already slowing even before this week!
Trump had twice delayed hiking U.S. tariffs on Chinese imports from 10% to 25%, a good-faith sign giving time for real trade-deal negotiations. But his patience ran out this past Sunday after China backtracked on key previoU.S. commitments. So Trump tweeted the current 10% U.S. tariffs on $200b of annual Chinese imports would surge to 25% today, and warned that 25% tariffs were coming “shortly” on another $325b!
China will retaliate as long as high U.S. tariffs remain in effect. That will really retard U.S. sales from top-34 SPX companies in that country. Beloved market-darling Apple is a great example. This second-biggest stock in the S&P 500 did $10.2b or 17.6% of its Q1’19 sales in China! The U.S.-China trade war heating up in a serious way portends even-weaker revenues going forward for the big U.S. stocks dominating the SPX.
The total operating cash flows generated by the top 34 SPX/SPY companies looked like a disaster in Q1, plummeting 64.4% YoY to $67.8b. Thankfully that is heavily skewed by a couple of the major U.S. banks. JPMorgan Chase and Citigroup reported staggering negative OCFs of $80.9b and $37.6b in Q1, due to colossal $123.1b and $30.4b negative changes in trading assets! This seems really confusing to me.
Mega-bank financials are fantastically-complex, and no one can hope to understand them unless deeply immersed in that world. I’ve been a certified public accountant for decades now, spending vast amounts of time buried in 10-Qs and 10-Ks to fuel my stock trading. Yet even with my background and experience I can’t interpret mega-bank results. It seems weird trading assets plummeted in Q1 as the SPX surged sharply.
But rather than getting bogged down in mega-bank arcania that may be impossible to comprehend by outsiders, we can just exclude the four SPX-top-34 mega-banks from our OCF analysis. They include JPMorgan Chase, Bank of America, Wells Fargo, and Citigroup. Without them, the rest of the SPX top 34 reported total OCFs of $163.2b in Q1’19. That was dead-flat ex-banks, up just 0.3% YoY from Q1’18’s OCFs.
So the big U.S. stocks’ operating-cash-flow generation really slowed too in Q1, stalling out compared to hefty 11.5% YoY growth in Q4’18. That’s another sign that the U.S. economy must be slowing despite the red-hot stock markets. That’s ominous and bearish considering the coming headwinds if the trade wars continue and if the stock markets roll over decisively. Future quarters’ business environments won’t be as good.
Earnings were a different story entirely last quarter, soaring dramatically among the SPX/SPY top 34. They totaled $149.8b, surging an enormous 36.1% YoY! But that was skewed way higher by Warren Buffett’s famous Berkshire Hathaway, the biggest SPX stock after the mega-cap techs. BRK reported a monster Q1 profit of $21.7b, compared to a $1.1b loss a year earlier. That accounted for 1/7th of the top 34’s total.
But Berkshire’s epic profits are due to the sharp stock-market rebound rally, not underlying operations. A new accounting rule that Warren Buffett hates and rails against at every opportunity requires unrealized capital gains and losses to be flushed through quarterly profits. Thus when the SPX plunged in Q4’18, BRK reported a colossal $25.4b GAAP loss. That was largely reversed in Q1’19 with its gigantic $21.7b gain.
Excluding the $16.1b of BRK’s Q1 profits that were mark-to-market stock-price gains, the SPX top 34’s total profits grew 21.5% YoY to $133.6b in Q1. That’s still impressive, but it masks some big problems on the corporate-earnings front. Those 6 elite mega-cap tech companies dominating the SPX actually saw their collective Q1 GAAP profits plunge 11.2% YoY! Apple, Alphabet, and Facebook suffered sharp declines.
Usually mega-cap tech stocks are the profits engine driving the entire SPX higher. If these market-darling companies that are universally-loved and -held struggled with earnings growth in Q1, what does that say about profits going forward? And again profits can be manipulated quarter-to-quarter by playing with all kinds of accounting estimates. So if anything corporate profits are overstated instead of understated.
One of Wall Street’s great farces is the game of comparing quarterly results to expectations instead of what they were in the comparable quarter a year earlier. Mighty Apple is a great example, reporting after the close on April 30th. Its Q1 earnings per share and sales of $2.47 and $58.0b came in ahead of Wall Street expectations of $2.37 and $57.5b. So Apple’s stock surged 4.9% the next day on those “great results”.
But that expectations bar had been lowered dramatically, which is the only reason Apple beat. On an absolute year-over-year basis compared to Q1’18, Q1’19 saw sales drop 5.1%, OCFs plummet 26.3%, and earnings plunge 16.4% YoY! That was quite weak, and couldn’t be considered good by any honest measure. In this recent Q1 earnings season, the fake expectations game obscured plenty of real weakness.
Yet overall SPX-top-34 profits growth still remained strong, with companies suffering drops offset by other companies seeing big jumps. But earnings can’t be considered in isolation, they are only relevant relative to underlying stock prices. Imagine you own a rental house and someone offers you $1000 a month to move in. The reasonableness of that earnings stream is totally dependent on the value of your property.
If your house is worth $100k, $1k a month looks great. But if it’s worth $1m, $1k a month is terrible. The profits anything generates are only measurable relative to the capital invested in that asset. The classic trailing-twelve-month price-to-earnings ratios show how expensive stock prices are relative to underlying corporate profits. Big SPX-top-34 earnings growth isn’t bullish if overall profits are low compared to stock prices.
At the end of Q1’19 proper before these Q1 results were reported, the SPX/SPY top 34 component stocks averaged TTM P/Es of 30.4x. That is definitely improving compared to the prior four quarters’ trend of 46.0x, 53.4x, 49.0x, and 39.7x. But 30.4x is still dangerously high absolutely. Over the past century-and-a-quarter or so, fair value for the U.S. stock markets was 14x. Double that at 28x is where bubble territory begins.
So the big U.S. stocks were literally trading at bubble valuations exiting Q1! Their stock prices were far too high relative to their underlying earnings production compared to almost all of U.S. stock-market history. And this wasn’t just a mega-cap-tech-stock thing, with these elite companies often being bid to really-high valuations compared to other sectors. The 6 mega-cap techs we’ve discussed indeed averaged a crazy 52.0x.
But the other 28 top-34-SPX companies remained very expensive near bubble territory even excluding the tech giants, averaging 25.8x! Even the strong Q1’19 earnings growth didn’t help much. At the end of April as those Q1 results started to work into TTM P/E calculations, the SPX top 34 averaged a slightly-higher P/E of 31.0x. Literal bubble valuations with stock markets trading near all-time record highs are ominous.
Just last Friday when the SPX closed right at its highest levels in history, I wrote a contrarian essay on these “Dangerous Stock Markets”. It explained how high valuations kill bull markets, summoning bears that are necessary to maul stock prices sideways to lower long enough for profits to catch up with lofty stock prices. These fearsome beasts are nothing to be trifled with, yet complacent traders mock them.
The SPX’s last couple bears that awoke and ravaged due to high valuations pummeled the SPX 49.1% lower in 2.6 years leading into October 2002, and 56.8% lower over 1.4 years leading into March 2009! Seeing big U.S. stocks’ prices cut in half or worse is common and expected in major bear markets. And there’s a decent chance the current bubble valuations in U.S. stock markets will soon look even more extreme.
Over the past several calendar years, earnings growth among all 500 SPX companies ran 9.3%, 16.2%, and 20.5%. This year even Wall Street analysts expect it to be flat at best. And if corporate revenues actually start shrinking due to mounting trade wars or rolling-over stock markets damaging confidence and spending, profits will amplify that downside. Declining SPX profits will proportionally boost valuations.
If the big U.S. stocks’ fundamentals deteriorate, the overdue bear reckoning after this monster bull is even more certain. Cash is king in bear markets, since its buying power grows. Investors who hold cash during a 50% bear market can double their holdings at the bottom by buying back their stocks at half-price. But cash doesn’t appreciate in value like gold, which actually grows wealth during major stock-market bears.
Gold investment demand surges as stock markets weaken, as we got a taste of in December. While the SPX plunged 9.2%, gold rallied 4.9% as investors flocked back. The gold miners’ stocks which leverage gold’s gains fared even better, with their leading index surging 10.7% higher. The last time a major SPX selloff awakened gold in the first half of 2016, it soared 30% higher fueling a massive 182% gold-stock upleg!
Absolutely essential in bear markets is cultivating excellent contrarian intelligence sources. That’s our specialty at Zeal. After decades studying the markets and trading, we really walk the contrarian walk. We buy low when few others will, so we can later sell high when few others can. While Wall Street will deny this coming stock-market bear all the way down, we will help you both understand it and prosper during it.
We’ve long published acclaimed weekly and monthly newsletters for speculators and investors. They draw on my vast experience, knowledge, wisdom, and ongoing research to explain what’s going on in the markets, why, and how to trade them with specific stocks. As of Q1 we’ve recommended and realized 1089 newsletter stock trades since 2001, averaging annualized realized gains of +15.8%! That’s nearly double the long-term stock-market average. Subscribe today for just $12 per issue!
The bottom line is the big U.S. stocks’ Q1’19 results were pretty mixed despite the surging stock markets. Revenues and operating cash flows only grew slightly, which were sharp slowdowns from big surges in previous quarters. While earnings somehow defied sales to soar dramatically again, that disconnect can’t persist. A slowdown looked to be underway even before the U.S.-China trade war flared much hotter this week.
Even the surging corporate profits weren’t enough to rescue super-expensive stock markets from extreme bubble valuations. They are what spawn major bear markets, which are necessary to maul stock prices long enough for valuations to mean revert lower. Make no mistake, these overvalued stock markets are still an accident waiting to happen. Stock investors should diversify, adding substantial gold allocations.
Adam Hamilton, CPA
May 15, 2019
Copyright 2000 – 2019 Zeal LLC (www.ZealLLC.com)
- There has been an uptick in market risk over the past couple of weeks, and that’s being reflected in dollar-yen and dollar-gold.
- Please click here now. Double-click to enlarge this dollar versus yen chart.
- The 109.50 area on this chart is quite important for gold investors. If the dollar falls under that price zone, gold is likely to surge to above $1300.
- Please click here now. Double-click to enlarge. Gold looks technically solid here in the middle of the soft demand season. There’s a bull wedge in play, a Stochastics buy signal, and a small double bottom at about $1268.
- The U.S. stock market is entering its soft season (May-October) but gold’s strong season really doesn’t get underway until August. Investors should exercise patience but there’s little cause for gold market concern.
- Gold stocks were slightly higher earlier this week with the Dow Jones down about 500 points on negative trade negotiation news. That’s positive action for these stocks!
- The U.S. and Chinese governments are close to announcing a trade deal, but it comes late in the U.S. business cycle and at the start of the stock market soft season.
- A trade deal would likely benefit the Chinese stock market. That’s good news for gold and gold stocks. Chinese investors are in a “so-so” mood right now. A trade deal would put them in a great mood, and when they are in a great mood they celebrate by buying lots of gold.
- U.S. growth stocks would likely benefit as well. In the big picture, the Chinese stock market gets badly hurt by tariffs and the U.S. stock market gets badly hurt by QT and rate hikes.
- I’m adamant that even the most diehard gold bug should have some capital in the U.S. stock market, bonds, and real estate. Even if it’s just 10% of a gold bug’s portfolio, it’s important for all investors to hedge their bets.
- For mainstream investors, gold is the hedge. For gold investors, stock markets, government bonds, and real estate are the hedge.
- Investors who put all their eggs in one asset class tend to be driven by emotion. If the stock market soars, they curse gold and chase the stock market. If the stock market falls and gold soars, they sell their stocks and buy gold. That’s not going to build sustained wealth in any asset class. It’s destructive action.
- Whether there is a trade deal or not, gold-oriented China is going to keep growing at twice the GDP growth rate of America for a long time, and gold-obsessed India could grow at three times the U.S. growth rate for even longer.
- What this means for gold is an evolution of the asset class, from a simple U.S.-based fear trade hedge to a more sophisticated globally-endorsed asset that rises against all fiat in good times and bad, and swoons rather than crashes during setbacks.
- The evolution is real, but are investors aware?
- Please click here now. Double-click to enlarge this TLT-NYSE bond ETF chart. It has my Graceland Updates proprietary buy and sell signals annotated on the chart.
- Gold is the ultimate risk-off asset class, but T-bonds are a very good indicator of stock market risk. I have a buy signal in play for bonds as the stock market weak season begins.
- Please click here now. Renowned economist Joe Stiglitz notes that while U.S. corporate capital expenditures did rise substantially after the Trump tax cuts, stock market buybacks were about 20% higher than those expenditures.
- Stiglitz appears overly-critical of Trump, but he is correct that the huge buybacks versus expenditures spread is concerning.
- The U.S. economy is reasonably solid, but a lot of the stock market gains are more related to these buybacks, manipulated interest rates, and QE rather than to corporate earnings and overall economic growth.
- In a nutshell, there is risk in the market that needs to be respected, especially as the stock market’s soft season begins.
- Please click here now. Double-click to enlarge this GDX daily chart. There’s a fresh bear flag in play, but there’s also a large bull wedge pattern appearing.
- With Stochastics the most oversold since September, any pullback this week is likely to be contained by the bull wedge formation. GDX could be making a seasonal low, here in the $19-$20 price zone.
- The bottom line for gold, silver, and the miners is that the market has already evolved to the point that soft season price declines are of no concern. My suggestion is to focus on short term trading in the soft demand season and core position capital gain in the strong season!
Special Offer For Website Readers: Please send me an Email to freereports4@gracelandupdates.com and I’ll send you my free “Senior Producer Buy & Sell Tactics” report. I highlight key prices and indicators for six top senior gold producers, with tactics for short-term traders and long-term home run hitters!
Stewart Thomson
Graceland Updates
Email:
Stewart Thomson is a retired Merrill Lynch broker. Stewart writes the Graceland Updates daily between 4am-7am. They are sent out around 8am-9am. The newsletter is attractively priced and the format is a unique numbered point form giving clarity of each point and saving valuable reading time.
Risks, Disclaimers, Legal
Stewart Thomson is no longer an investment advisor. The information provided by Stewart and Graceland Updates is for general information purposes only. Before taking any action on any investment, it is imperative that you consult with multiple properly licensed, experienced and qualified investment advisors and get numerous opinions before taking any action. Your minimum risk on any investment in the world is: 100% loss of all your money. You may be taking or preparing to take leveraged positions in investments and not know it, exposing yourself to unlimited risks. This is highly concerning if you are an investor in any derivatives products. There is an approx $700 trillion OTC Derivatives Iceberg with a tiny portion written off officially. The bottom line:
Are You Prepared?
Several weeks ago we wrote about the downside risk in the gold stocks.
After the various gold stock indices formed distribution-type tops, the subsequent selling has been swift. Miners have plunged through moving averages and short-term breadth indicators quickly reached oversold extremes.
While the gold stocks are oversold, it could be a little while before we can expect a sustained rebound.
We plot GDX below along with the percentage of HUI stocks that closed above the 50-day moving average and 200-day moving average. (The HUI is essentially GDX sans royalty companies).
The breakdown from the rounding top projects down to $19.50 but strong support is unlikely to be found until $17 or the low $18s. Should GDX trade below $19.50 then the percentage of the HUI above the 200-day moving average (currently at 50%) will decrease materially.
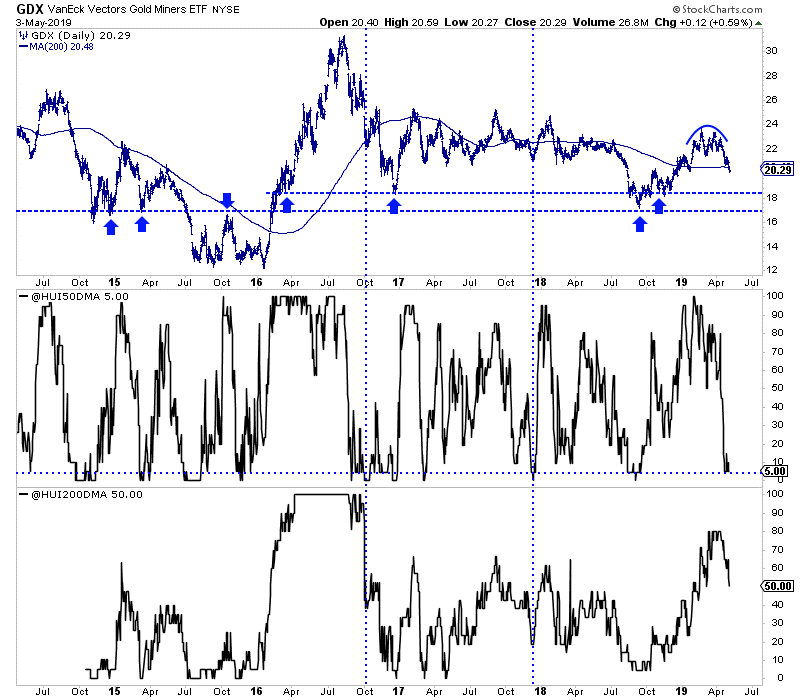
GDXJ, which closed the week at $28.41 has formed a larger distribution top that projects to a measured downside target of $26.50-$27.00. There is a confluence of strong support around $26.00.
Only 33% of GDXJ stocks are trading above the 200-day moving average. GDXJ could be closer to its low than GDX.
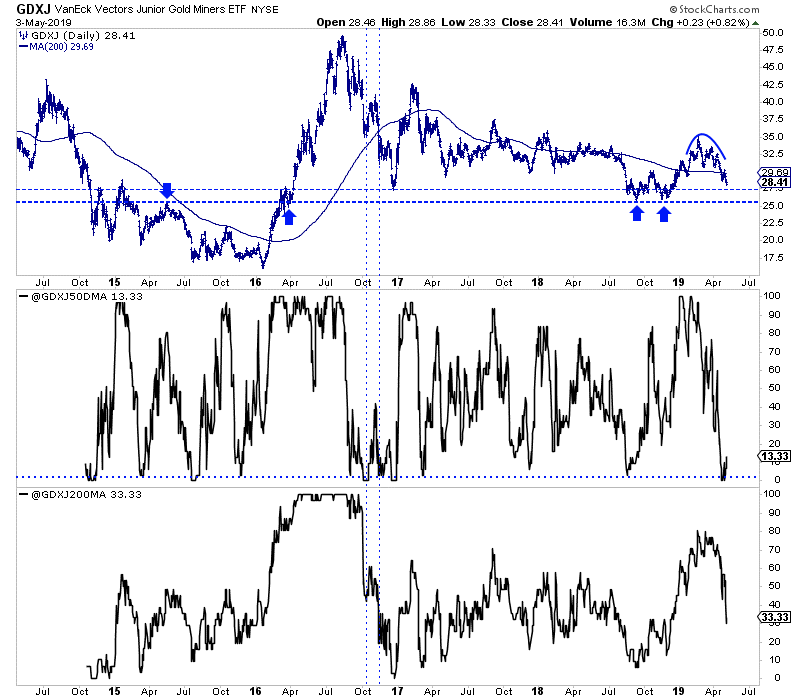
If GDX and GDXJ successfully retest their 2018 lows then their performance in relative terms could inform us on the sustainability of that rebound.
Below we plot Gold, GDX and GDXJ all against the stock market. These charts also have a chance to form double bottoms.
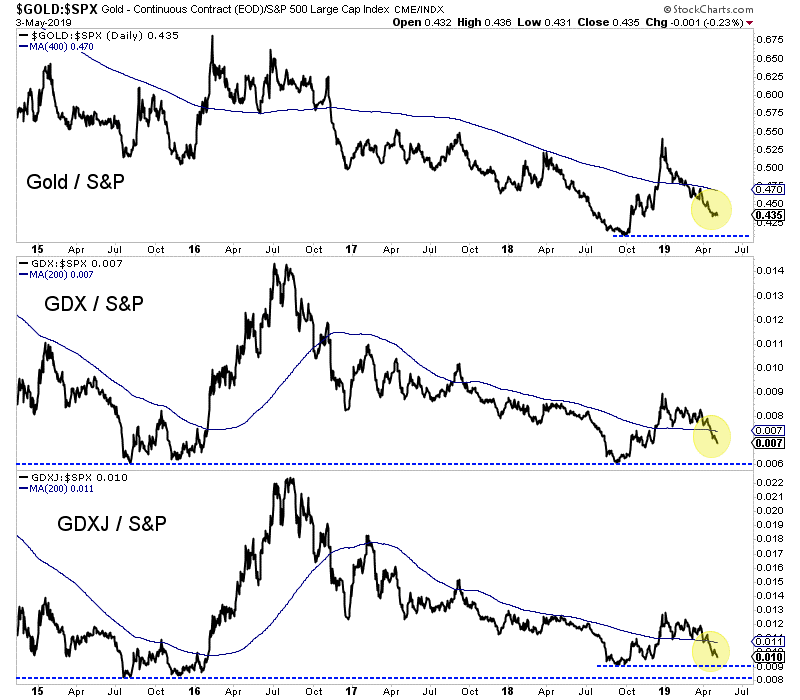
The gold stocks have broken down and have more downside potential until testing strong support levels. We don’t want to fight that breakdown until the market tests strong support amid an extreme oversold condition. That could entail GDX and GDXJ testing their 2018 lows with less than 10%-15% of the stocks trading above their 200-day moving average.
Sentiment indicators for Gold and Silver are trending in the right direction but more selling and lower prices are likely needed before those indicators reach extremes.
As far as fundamentals, there could be some potential bullish developments waiting in the background. If these things come to pass then the gold stocks could be in position to rocket higher after forming a double bottom.
The weeks and months ahead could be an opportune, low risk time to position yourself. We are looking for deep values with catalysts and anything we missed in recent months than can be bought at a discount. To learn what stocks we own and intend to buy that have 3x to 5x potential, consider learning more about our premium service.
By Jordan Roy-Byrne CMT, MFTA
May 7, 2019
These record U.S. stock-market levels are very dangerous, riddled with extreme levels of euphoria and complacency. Largely thanks to the Fed, traders are convinced stocks can rally indefinitely. But stock prices are very expensive relative to underlying corporate earnings, with valuations back up near bubble levels. These are classic topping signs, with profits growth stalling and the Fed out of easy dovish ammunition.
Stock markets are forever cyclical, meandering in an endless series of bulls and bears. The latter phase of these cycles is inevitable, like winter following summer. Traders grow too excited in bull markets, and bid up stock prices far higher than their fundamentals support. Subsequent bear markets are necessary to eradicate unsustainable valuation excesses, forcing stock prices sideways to lower until profits catch up.
This latest bull market grew into a raging monster largely fueled by extreme Fed easing. At its latest all-time record peak hit just this week, the flagship US S&P 500 broad-market stock index (SPX) has soared 335.4% higher over 10.1 years! That makes for the second-biggest and first-longest bull in US history, only possible because it gorged on $3625b of quantitative-easing money printing by the Fed over 6.7 years.
That epic 5.3x mushrooming of the Fed’s balance sheet peaked in February 2015, when the SPX was just clawing over 2100. It soon coasted to a 2130.8 topping in May 2015, before trading sideways to lower for 13.7 months without Fed QE. Modest new highs weren’t seen until July 2016, after the U.K.’s Brexit-vote surprise kindled hopes for more central-bank easing. Another surprise event drove the final third of this bull.
The November 2016 elections were a Republican sweep, with Trump winning the presidency while his party controlled both chambers of Congress. So the SPX started surging to new record highs, initially on hopes for big tax cuts soon and later on record corporate tax cuts becoming law. That ultimately propelled the SPX to 2872.9 in late January 2018 and 2930.8 in late September 2018, lofty new all-time record highs.
But paraphrasing an ancient Biblical passage from Job, the Fed gave then the Fed took away. Right after the SPX peaked, the Fed ramped its year-old quantitative-tightening campaign to full speed in Q4’18. QT was supposed to unwind a large fraction of that $3625b of QE-conjured money, shrinking the Fed’s crazy-bloated balance sheet. $50b per month of QT monetary destruction had to be this QE-fueled bull’s death knell!
Indeed the stock markets crumbled under that Fed-tightening onslaught, plunging 19.8% over the next 3.1 months into late December 2018. That severe correction was right on the verge of crossing the -20% threshold into new-bear territory. Over a third of those serious losses happened in just 4 trading days after the Fed chairman declared full-speed QT was “on automatic pilot”. By that time the SPX was very oversold.
Stock-market extremes never last long, with big and sharp mean-reversion bounces following major selloffs. The SPX reversed hard and soared into early 2019, already 12.3% higher by late January. Then the Fed’s first policy decision after that stock-crushing QT-autopilot one saw this central bank completely cave to the stock markets. It removed references to further rate hikes and declared it was ready to adjust QT.
That dovishness unleashed more waves of momentum buying. By the eve of the Fed’s next meeting in mid-March, the SPX had rocketed 20.5% above its severe-correction near-bear low. But that wasn’t good enough for the Fed, which slashed its future-rate-hike outlook while declaring it would essentially stop QT by September 2019. That is very premature, implying less than 23% of the Fed’s total QE will be unwound!
That goosed the stock markets again, helping push the SPX to an enormous 25.3% rebound-rally gain by this week. At 2945.8, it had edged 0.5% above late September’s then-record peak. With stock markets more than regaining their big losses, euphoria and complacency exploded again. These herd emotions have proven dangerous in market history, marking major toppings including terminal bulls rolling over to bears.
Euphoria is simply “a strong feeling of happiness, confidence, or well-being”. It is always accompanied by complacency, which is “a feeling of contentment or self-satisfaction, especially when coupled with an unawareness of danger or trouble”. This perfectly describes the stock markets’ sentiment-scape in recent months. Speculators and investors just love these lofty stock prices, with virtually no fear of material selloffs.
While euphoria and complacency are ethereal and unmeasurable, they can be inferred. The classic VIX fear gauge is the most-popular way. It quantifies the implied volatility options traders expect in the SPX over the next month, as expressed through their collective trades. While a high VIX reveals fear, a low one shows the direct opposite which is complacency. In mid-April the VIX revisited ominous bull-slaying levels.
This chart superimposes the SPX over its VIX sentiment indicator over the past several years or so. This monster Fed-QE-fueled stock bull sure looks to be carving a massive triple top in its terminal phase. At best in late April, the SPX had merely clawed back 2.5% over its initial peak of late January 2018. That’s terrible progress across 15.1 months where the biggest corporate tax cuts in US history greatly boosted profits.
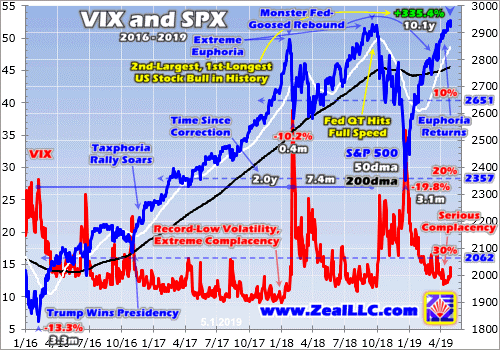
While the first two-thirds of this monster bull were directly driven by the Fed’s extreme QE, the final third was corporate-tax-cut driven. Starting with that November 2016 Republican sweep, there was enormous anticipation of what eventually became the Tax Cuts and Jobs Act. Signed into law in December 2017, it went into effect as 2018 dawned. Its centerpiece was slashing the US corporate tax rate from 35% to 21%.
The SPX surged 19.4% in 2017 in the thrall of taxphoria hopes, driving 62 new record-high closes out of 251 trading days! The first 18 trading days of 2018 saw another 14 more, catapulting both euphoria and complacency off the charts. The VIX slumped into the 9s early that peaking month, proving that fear was nonexistent. Virtually no one expected a selloff when the SPX peaked at 2872.9, when the VIX closed at 11.1.
But just when traders were convinced stock markets could rally indefinitely with no material selloffs, the SPX suddenly nosed over into its first correction in 2.0 years. While sharp yet shallow and short at a 10.2% loss in just 0.4 months, it was a warning shot. Even with elite SPX companies’ corporate profits expected to soar 20%+ that year due to those big tax cuts, stock markets were already too high to rally much.
After that minor flash correction, the SPX started marching higher again throughout 2018. It wasn’t able to eclipse January’s maiden peak until late August, and ultimately crested merely 2.0% above it in late September. Such meager gains again suggested the corporate tax cuts were nearly fully priced in during 2017, leaving little room for additional gains. The day the SPX peaked at 2930.8, the VIX closed at 11.8.
Once again traders’ euphoria and complacency were extreme. The pressure on contrarians to capitulate was immense. But given the extreme stock-market technicals, sentiment, and valuations, I stuck to my guns warning how dangerous the stock markets were. Just a week after that all-time record high in the SPX, I published an essay warning “Fed QT is Bull’s Death Knell” one trading day before QT hit terminal velocity.
Indeed the stock markets fell hard, plunging 19.8% over 3.1 months into late December! That correction was much larger and more menacing than early 2018’s, on the edge of formal bear-market territory. And it happened despite SPX companies’ earnings actually blasting 20.5% higher year-over-year in 2018. Two corrections, including a serious one, in one of the best corporate-profits years on record should give pause.
The stock markets were due for a sharp mean-reversion rebound higher after such a steep drop. But the Fed waxing hyper-dovish and killing both its rate-hike cycle and QT really artificially extended it. Just over half the total rebound rally came after the Fed utterly surrendered to stock traders starting in late January. Many larger SPX-rally days clustered around dovish Fed announcements, they really amplified this rally.
It looked and felt exactly like a bear-market rally, the biggest and fastest ever witnessed in stock markets. The SPX soared in a symmetrical V-bounce out of late December’s deep lows. Those gains were front-loaded, fast initially but fading in recent months despite the Fed’s super-dovish jawboning. That severe near-bear correction that spawned this rally also fit the definition of a waterfall decline, an ominous omen.
They are 15%+ SPX selloffs without any interrupting countertrend rallies exceeding 5%. Since 1946 this had happened only 19 previous times. After every single past selloff, 100% of the time, the SPX retested its waterfall-decline lows! All 19 happened in bear markets. After these retests, fully 15 of the 19 were followed by new lower lows as those bears deepened. Only 4 of the 19 waterfall retests climaxed their bears.
So market history is crystal-clear in warning that the wild stock-market action of the past 7.3 months is exceedingly dangerous technically. Yet euphoria and complacency still exploded again in March and April as the SPX kept stretching skywards. By mid-April as the SPX clawed back up to 2907.4, the VIX fell back under 12.0 on close. Those were the lowest levels of fear seen since October 3rd, a bearish portent.
While that was a couple weeks after the SPX’s late-September then-record peak, this leading stock index was still just 0.2% lower. The selling that would grow into the severe near-bear correction began the very next day, and snowballed from there. Right when traders again delude themselves into believing stock markets can rally indefinitely, the hard reality of market cycles slams them like a sledgehammer to the skull.
Extreme levels of euphoria and complacency are always very dangerous, presaging major stock-market selloffs. Low VIX levels following record or near-record stock-market highs should not be trifled with, but considered a dire warning of serious downside risks. Very-high technicals breed very-lopsided sentiment, blinding traders to markets’ perpetual cyclicality. Today’s risks are compounded by near-bubble valuations.
For a century-and-a-quarter or so before the Fed’s insane QE experiment starting in late 2008, the US stock markets had averaged trailing-twelve-month price-to-earnings ratios around 14x earnings. That is considered fair-value, which makes sense. The reciprocal of 14x is 7.1%, which is a fair rate for both investors to earn to let companies use their saved capital and for companies to pay to use those same funds.
But valuations oscillate well above and below fair value in great waves that correspond with bull and bear markets. In bulls stocks are enthusiastically bid to high valuations not justified by their underlying profits. Valuation extremes start at twice fair value, 28x trailing earnings which is formally bubble territory. That necessitates bears to maul stock prices long enough for earnings to catch up, but stocks usually overshoot.
While major bull markets end above 28x, major bear markets often end between 7x to 10x. That’s the time investors should throw all their capital at the stock markets, when stocks are dirt-cheap and deeply out of favor. But instead they foolishly buy high near bull-market tops, which often leads to selling low later at catastrophic losses. The SPX valuations during this 15-month triple-top span have been scary-high.
This next chart shows the actual SPX in red, superimposed over the average trailing-twelve-month price-to-earnings ratios of its 500 elite companies. Their simple average at the end of every month is shown in light blue, and is what I’m using in this essay. The dark-blue line instead weights SPX-component P/Es by their companies’ market capitalizations. The white line shows where the SPX would be at 14x fair-value.
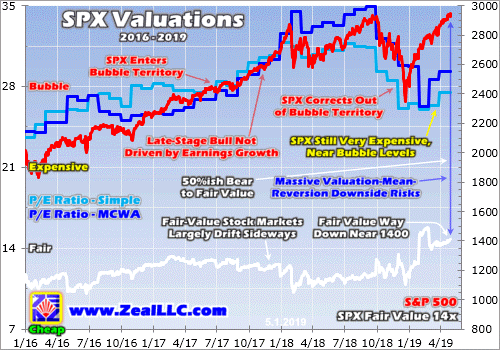
Remember the final third of this monster bull erupted on taxphoria after Trump won the presidency. But following trillions of dollars of QE before that, the SPX wasn’t cheap heading into November 2016. These elite stocks averaged TTM P/Es of 26.3x, just shy of 28x bubble territory. Interestingly that was about the same valuation as the 25.9x when QE ended in February 2015. Stocks had long been very expensive.
SPX corporate earnings did rise nicely in 2017, up about 16%. Republicans streamlining regulations was a factor, but more important was the widespread optimism from stock markets surging to endless new record highs. But the problem was stocks were already so overvalued that higher profits barely made a dent. At best that year the fair-value SPX at 14x hit 1296.0, a staggering 52% below the SPX’s 2017 high!
The SPX first crossed that 28x bubble threshold in late November 2016 after stocks surged higher on that Republican sweep. Valuations hung around 28x until July 2017 when they started climbing even higher. By late January 2018 just after the SPX’s initial peak, its elite companies were averaging TTM P/Es way up at 31.8x! While bubble valuations can persist while euphoria lasts, they are very dangerous for stocks.
SPX corporate-earnings growth in 2018 was amazing, exceeding 20% year-over-year thanks to those record corporate tax cuts. The four quarters of 2018 were the only ones comparing post-tax-cut and pre-tax-cut profits, an enormous one-off discontinuity. Yet damningly the valuations still didn’t retreat, in late September just after the SPX’s record peak its components were still averaging extreme 31.4x TTM P/Es.
That severe near-bear correction largely in Q4 last year certainly helped, dragging valuations back down out of bubble territory. But even at the end of December just after the lows, the SPX was still sporting a 26.1x valuation. That was near bubble territory, right around the levels just before Trump was elected. No bear market would end its predations and start hibernating while valuations remained so darned high!
In recent months many Wall Street apologists have claimed that severe correction was effectively a very-short-lived bear market since it was so close to 20% on a closing basis. They argue that means a new bull is underway that can run for years more. But bears don’t give up their ghosts after a single selloff with price-to-earnings ratios still near bubble levels. Bears ravage until valuations are mauled back under 14x.
Interestingly valuations haven’t soared back up with the massive rebound rally so far this year. By the end of April, the SPX components’ average P/E had only returned to 27.5x. That’s not greatly above the late-December levels. This was due to blowout Q4’18 earnings from SPX companies, the last quarter with profits compared across the Tax Cuts and Jobs Act. Q4’17 also rolled off, which the TCJA heavily distorted.
But 27.5x is still just under bubble territory, dangerously-expensive levels for stocks achieving record highs again. If the inevitable bear following the past decade’s enormous Fed-inflated monster bull just pushed stocks back down to 14x fair value, the SPX would have to plunge way back near 1400. That’s a heck of a long ways down from here, a 52% drop. Cutting stocks in half is right in line with bear-market precedent.
The SPX’s last bear market ran from October 2007 to March 2009, and pummeled this leading American stock index a gut-wrenching 56.8% lower in 1.4 years. That bear-market bottom birthed this current bull, when the SPX traded down to 12.6x earnings. Before that the SPX suffered another bear from March 2000 to October 2002, a 49.1% drop over 2.6 years. So 50%ish SPX losses are par for the course in bears!
Several factors could make this long-overdue next bear even worse. In 2016, 2017, and 2018, the elite SPX companies’ profits grew 9.3%, 16.2%, and 20.5% YoY. This year even Wall Street is forecasting earnings to be flat at best. There’s a real possibility they will even contract in 2019, the first year comparing post-tax-cut quarters. Stalling or shrinking corporate profits make near-bubble valuations even more extreme.
Lower profits actually push valuations even higher, increasing the valuation pressure for a major bear market. And with average month-end SPX TTM P/Es running 30.5x in 2018 at 20% profits growth, there’s no way similar high valuations will fly this year with zero profits growth. The more quarterly earnings fail to climb, the more worried traders will get over high stock prices and the more likely they will start selling.
And after the second-largest and first-longest bull market in US stock-market history, mostly driven by extreme Fed easing no less, the subsequent bear should be proportionally massive. There’s a fairly-high chance this bear won’t stop brutalizing stocks until the average SPX P/E falls near half fair-value around 7x earnings. That’s where the biggest bears in the past have ended, valuations overshot way under 14x.
Finally the Fed is going to have a hard time riding to the rescue again since it has expended all its easy dovish ammunition. It really only has three options left for another dovish surprise, and the latter two are very serious decisions. Top Fed officials’ outlook for rates in their collective dot-plot forecast can still be lowered to show cuts coming. But since these guys downplay the dot plot, that won’t mollify traders for long.
That leaves actually cutting rates or birthing QE4, which are huge course changes that the Fed can’t take lightly or revoke without panicking stock markets! With the Fed just about out of dovish rabbits to pull out of its hat, it doesn’t have many options to slow the selling when stock markets inevitably turn south again. Cutting rates or restarting QE may even exacerbate any selloff, worrying traders about what so scared the Fed.
The overdue bear market is still coming, make no mistake. Extreme technicals, sentiment, and valuations assure it. Investors really need to lighten up on their stock-heavy portfolios, and protect themselves with cash and gold. Holding cash through a 50% bear market allows investors to buy back their stocks at half-price, doubling their holdings. But unlike cash gold actually appreciates in value during bears, growing weath.
Gold investment demand surges as stock markets weaken, as we got a taste of in December. While the SPX plunged 9.2%, gold rallied 4.9% as investors flocked back. The gold miners’ stocks which leverage gold’s gains fared even better, with their leading index surging 10.7% higher. The last time a major SPX selloff awakened gold in the first half of 2016, it soared 30% higher fueling a massive 182% gold-stock upleg!
Absolutely essential in bear markets is cultivating excellent contrarian intelligence sources. That’s our specialty at Zeal. After decades studying the markets and trading, we really walk the contrarian walk. We buy low when few others will, so we can later sell high when few others can. While Wall Street will deny this coming stock-market bear all the way down, we will help you both understand it and prosper during it.
We’ve long published acclaimed weekly and monthly newsletters for speculators and investors. They draw on my vast experience, knowledge, wisdom, and ongoing research to explain what’s going on in the markets, why, and how to trade them with specific stocks. As of Q1 we’ve recommended and realized 1089 newsletter stock trades since 2001, averaging annualized realized gains of +15.8%! That’s nearly double the long-term stock-market average. Subscribe today for just $12 per issue!
The bottom line is these stock markets are very dangerous. A monster bull has been topping over the past year-and-quarter, leading to extreme technicals, sentiment, and valuations. Traders’ euphoria and complacency have been running at bull-slaying levels, while valuations remain way up near perilous bubble territory. All this is happening as corporate profits flatline after surging dramatically on the corporate tax cuts.
Like after every past waterfall decline, the stock markets are due to roll over and retest their deep late-December lows. Odds are they will fail, confirming a major new bear market. And the Fed doesn’t have much dovish ammunition left to retard the heavy selling. Gold investment demand will surge as stocks finally face their reckoning after this artificially-amplified bull. That will push gold and its miners’ stocks far higher.
Adam Hamilton, CPA
May 6, 2019
Copyright 2000 – 2019 Zeal LLC (www.ZealLLC.com)
As we know, Gold and the US Dollar have an inverse relationship. Gold is priced in US Dollars and the drivers of each are similar (from an inverse point of view). Over long-term periods both trend in the same direction but the magnitude of the moves can vary and be quite different.
The standard inverse relationship has not been a perfect one in recent months or years.
In the chart below we plot Gold, gold stocks and the US Dollar.
We highlight (with vertical lines) the points at which Gold tested the wall of resistance. As you can see, the relationship with the dollar hasn’t been uniform.
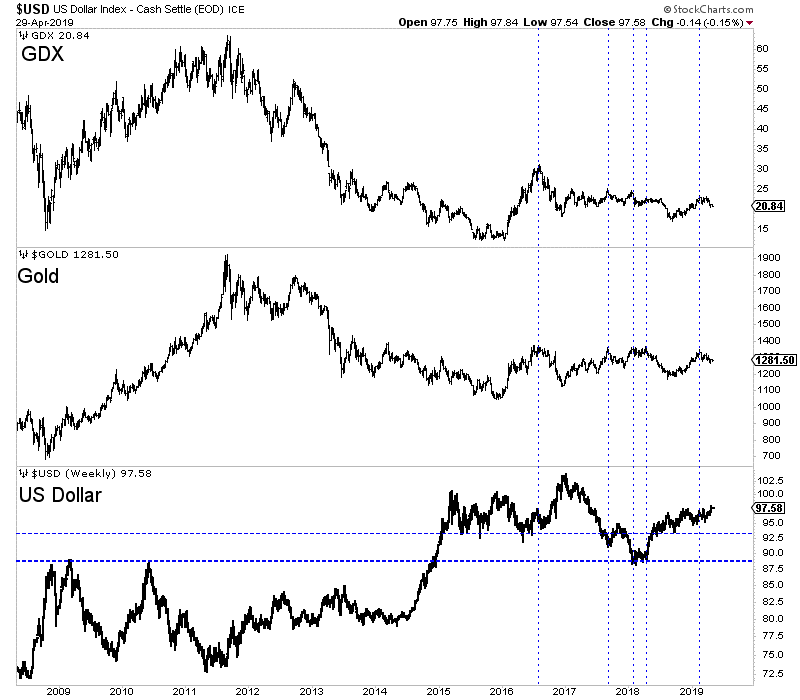
In particular, note what transpired in 2017. The dollar declined sharply and penetrated its 2016 low to the downside yet Gold didn’t make a new high and gold stocks didn’t even come close to their 2016 high.
Recently, the reverse has transpired. The US Dollar has or is breaking out to a new high yet Gold is much closer to its 52-week high rather than its 52-week low.
Gold bulls hope the breakout will reverse course and lead to a big decline. Surely, a big decline would push Gold to a massive breakout. Or would it?
Recall 2017. Gold did not breakout and gold stocks performed even worse. Gold’s fundamentals were not bullish because real interest rates increased throughout 2017. Dollar weakness simply prevented Gold and gold stocks from faring worse.
If the dollar declines again and for similar reasons as in 2017 (global recovery and global risks averted) then we should not expect Gold to breakout. If strength in US stocks and global stocks continues then Gold is not going to breakout regardless of what happens to the US dollar.
If the US Dollar were to continue rising throughout 2019 then it would eventually cause a myriad of problems that would lead to softer policy and Fed rate cuts. Gold may not breakout initially but eventually it would.
The best scenario for Gold would be a dollar decline coupled with a decrease in real interest rates, which would be driven by Fed rate cuts or a consistent rise in inflation as the Fed stands pat.
Keep an eye on the US Dollar over the weeks ahead as its fate could give us a sense of where things are going for the balance of 2019 and then we could assess how Gold may react.
The weeks or months ahead should continue to be an opportune time to position yourself in the Gold sector. We are looking for deep values and anything we missed in recent months that gives us a second chance opportunity. To learn what stocks we own and intend to buy that have 3x to 5x potential, consider learning more about our premium service.
Jordan Roy-Byrne
May 2, 2019
- Gold stocks tend to become extraordinarily volatile during weeks that feature multiple key fear trade events.
- As the month of May begins, gold stocks are faced with a FOMC meeting and the US jobs report.
- Please click here now. Double-click to enlarge this daily gold chart.
- Gold itself is quite stable ahead of these key events, in part because of steady physical market demand for India’s Akha Teej prosperity festival.
- All gold market investors should consider owning at least some physical gold bullion, even if it’s a token amount. A gold bug should view bullion the way a fiat bug views their dollars.
- Gold is money!
- A solid bull wedge is in play on the gold chart and my 14,7,7 Stochastics series oscillator is flashing a buy signal.
- Support is at $1268 and resistance is at $1288. If gold can close above $1290 on Friday after the jobs report… a significant rally is likely to occur.
- Having said that, the current burst of physical market demand is likely temporary because the soft demand season really doesn’t end until August.
- The bottom line is that gold might be making a final low for 2019 in the $1268 area, but the big upside action is unlikely to happen until the strong physical demand season begins later in the summer.
- Please click here now. US stock markets are entering a big resistance zone as the weak month of May begins, and the dollar is beginning to decline against the yen.
- This is gold-supportive.
- The stock market needs strong oil company earnings and Trump just finished a fresh oil price bashing rant. If oil is peaking here, S&P500 earnings are likely to also be peaking.
- Please click here now. The Fed is floating a new scheme to put QE in the hands of commercial banks. This may be partly to accommodate the US government’s voracious appetite for debt and it’s positive for gold.
- It’s unclear exactly how the scheme would work since it’s still in the planning stages, but if this “commercial bank QE” program moves reserves back into the commercial banking system it could help boost loans growth.
- That would boost money velocity and inflation.
- Please click here now. Double-click to enlarge this GDX daily chart.
- While gold is quite stable this week, gold stocks are volatile and struggling. On the positive side, GDX volume has softened since the strong demand season peak in mid-February, Stochastics is oversold, and the price is at trendline and Fibonacci support.
- Please click here now. Double-click to enlarge. On the negative side, there’s a potential bear flag pattern in play.
- It’s not a textbook pattern; the flagpole is not vertical and the flag itself is rough, but gold stocks have an ominous history of staging dramatic sell-offs around and during FOMC meet days.
- Traders may want to reduce size or go to the sidelines because even the best trading systems will produce a lot of whipsaw action at times like this.
- I personally keep trading through these situations because when the trend finally asserts itself, I want to be in for the big move! Also, my trade size is reasonable. Trading accounts should only be one component of an investor’s total precious metals portfolio.
- Please click here now. Double-click to enlarge this weekly CDNX “traffic lights” chart. Junior mining stock enthusiasts need to be patient. It’s likely going to take a sustained gold price of $1370 or higher to generate a long-term buy signal for these miners. They will rally nicely before that happens but it may take until later in the summer to generate the “major league” buy signal that will produce gains of hundreds of percent per share for most of the stocks.
- It’s hard to see the Fed doing anything tomorrow other than holding rates where they are now. A strong jobs report could be viewed as inflationary because the Fed seems reluctant to take on Trump and hike rates. There’s a lot of pension money in the stock market and rate hikes can really hurt that money. A May stock market swoon? Yes. A crash? No. A Friday close above $1290 for gold likely ends the current price correction and that should put gold stock investors in a great state of mind!
Special Offer For Website Readers: Please send me an Email to freereports4@gracelandupdates.com and I’ll send you my free “Prepare For Blast Off!” report. I highlight eight key miners with entry points for gold stock enthusiasts who want to prepare now for the gold price surge above $1290!
Stewart Thomson
Graceland Updates
Email:
Stewart Thomson is a retired Merrill Lynch broker. Stewart writes the Graceland Updates daily between 4am-7am. They are sent out around 8am-9am.
Risks, Disclaimers, Legal
Stewart Thomson is no longer an investment advisor. The information provided by Stewart and Graceland Updates is for general information purposes only. Before taking any action on any investment, it is imperative that you consult with multiple properly licensed, experienced and qualified investment advisors and get numerous opinions before taking any action. Your minimum risk on any investment in the world is: 100% loss of all your money. You may be taking or preparing to take leveraged positions in investments and not know it, exposing yourself to unlimited risks. This is highly concerning if you are an investor in any derivatives products. There is an approx $700 trillion OTC Derivatives Iceberg with a tiny portion written off officially. The bottom line:
Are You Prepared?
Eskay Creek, formerly the world’s highest-grade gold mine, may be headed for a re-start due to very promising exploration work completed by Skeena Resources (TSX.V: SKE).
Eskay Creek was operated by Barrick Gold until shutting down in 2008 due to a combination of high operating costs and a low gold price. Skeena picked up the option to explore the closed mine and has been working diligently on the project for the last two years.
Skeena has proved up a 4-million ounce gold equivalent resource at 4.5 grams/ton (indicated and inferred) open pit. The open pit aspect makes this a tantalizing prospect for investors.
Skeena sees a pathway to making the ultimate total resource larger and bringing the grade closer to 6 grams/ton. Work over the next year will determine the viability of re-opening the mine. Skeena believes Eskay Creek is the best open pit deposit of any junior miner in the world, and the stock price is yet to reflect this.
Jonathan Roth of CEO.ca sat down with Skeena’s CEO Walter Coles, Jr. and Skeena’s VP of Communications Kelly Earle to discuss the company’s discoveries, what the next steps are, and why investors should be paying attention.
Jonathan Roth: What attracted you to Skeena? Because obviously you had a lot of options. Why would you come to Skeena?
Kelly Earle: So, I was initially drawn to the Golden Triangle, the assets they were bringing into the fold, the possibility of acquiring two past producing mines as legendary as Snip and Eskay Creek. So that’s really what drew me in. But then what kept me here was really the team, a really young, keen team that I think is really the future of junior mining in Vancouver.
Jonathan Roth: Why don’t you unpack what you’ve discovered up at Eskay Creek?
Kelly Earle: So, at Eskay Creek, excitingly, we just announced a 4 million-ounce resource combined between indicated and inferred at 4.5 grams/ton open pit. To put that in context, most open pit mines operating today are around the one to two gram/ton mark. And ours is at 4.5 grams/ton and we see a pathway to bring it closer to six grams/ton. So, it’s a world class deposit from a once-legendary mine. Eskay Creek was the highest-grade gold producer in the world when it was in production. It’s very exciting to think that we’ve really just have found what’s left, what the remnants are. But even the remnants are extremely high grade by today’s standards.
Jonathan Roth: Barrick owned Eskay Creek and then they stopped mining at around 2007, 2008, somewhere around there?
Kelly Earle: Yes, 2008.
Jonathan Roth: So why did they stop, given the fact of what you folks have discovered?
Kelly Earle: We get this question a lot. It’s hard for people to understand: if it’s so great, if there’s 4 million ounces left there, why on earth did Barrick walk away? And it’s really just a function of the price of gold and how remote the mine was at the time.
So, when the mine was in operation, it was all diesel powered. So absolutely everything ran on diesel, which for the most part was flown in and flown out. There was road access, but it was still diesel powered. Secondly, the price of gold was significantly lower than it is today. So, the decision to shut the mine down was made in 2005. Price of gold was around $450, $500 an ounce. That meant the cutoff grade – to hit a 20 gram per ton head grade at the mill – they needed a 15 gram per ton cut-off grade, which is crazy by today’s standards.
So, anything below 15 grams per ton was just considered waste. So, if you look at it in the context of the time frame, it made sense that the mine shut down. Also, Barrick was just bringing Placer Dome on board, this was a big several hundred thousand ounce a year producer. The grades were dropping off at Eskay, the production annually was dropping off. It didn’t make sense to keep it open anymore because of how remote it was and the cost of producing it. So, in many ways we’re lucky because we’re left with the remnants that are now extremely high grade by today’s standards and the infrastructure has also improved dramatically since the mine was in production.
Jonathan Roth: The infrastructure obviously must be already there, and my understanding is that things are even easier to get in and out of there than they were say even a decade ago?
Kelly Earle: Within the last year, Highway 37 and the Northwest Transmission Line have been put in, which goes all the way up to Imperial Metals Red Chris Mine. Then within the last 10 years, there have been three hydroelectric facilities built between Snip and Eskay Creek. So, areas that were once all diesel operated for mines, we now have 4 cents a kilowatt hour power – so dramatically changes the opex.
We’ve talked to some engineers who said historically 50% of opex would have been diesel. Now with hydroelectric power, that would be more like 10 to 15%. So, it dramatically changes the cost to put it back into production. And at Eskay, the hydroelectric facility’s only seven kilometers away, down a paved road.
Jonathan Roth: This is Skeena’s CEO, Walter Coles Junior. The son of a very senior former US diplomat working in states that comprised the former Soviet Union, Coles is well versed in navigating the halls of power. Skeena’s projects are located in British Columbia, and Coles has made it a priority to maintain an excellent relationship with BC’s left leaning provincial government and local First Nations groups.
Walter Coles: For us, our experience with the NDP government has been phenomenal. From John Horgan as a premier to Michele Mungall, the mines minister; to her staff, Dave Nikolejsin, who’s a deputy mines minister. I’ll even shout out Peter Robb, who’s the assistant deputy mines minister. When we’ve had problems with delays in permitting, we go to Victoria and things are fixed right away.
Jonathan Roth: There’s been a general perception that the NDP government and British Columbia is not favorable to resource development projects. Obviously, you’ve seen the flip opposite of that?
Walter Coles: I think the facts can speak for themselves. BC has permitted more mines in Canada than any other province in the last three years. That speaks for itself. KSM last year got all their permits. The Red Mountain, IDM’s Red Mountain Mine got all of their permits. Pretium was permitted, I believe, in less than two years. I’m talking about the Brucejack Mine. Red Chris got all of, that’s Imperial Metals, was able to permit the Red Chris Mine. This is all on the Golden Triangle and all within the last three and a half years. In my view, there’s strong political support for mining in this province.
Jonathan Roth: So, what’s the game plan then moving forward?
Walter Coles: Our game plan is to aggressively advance Eskay Creek. The idea is we get the PEA done early in Q3 and we’ll immediately start, I hope, we’ll start pushing towards a feasibility study and we’ll probably start to permit Eskay Creek as well, to be able to put this mine back into production in the next couple years.
Jonathan Roth: So, you know obviously the resource market has been really tough for investors. It’s about as tough as it gets.
Walter Coles: Understatement.
Jonathan Roth: Right. So why, given the general market that’s out there, why should investors give you maybe a second or third look?
Walter Coles: It’s easy. In my mind, it comes down to Eskay and Snip. Snip is our other project, again, a past producing mine. There just aren’t deposits like this around the world. They’re very, very rare and our market cap right now today is about 40 million, 42 million Canadian. And we have 4 million ounces of very high grade, very attractive resource. It’s a combination of gold and silver, but I call it 4.5 million ounces of gold equivalent.
If you look at the valuations of other very well run companies, let’s say a Barkerville or let’s say an Osisko or let’s say an Ascot, as comparables to Skeena, all of those market caps are north of $175 million, and frankly we have more resource than any of those companies. And ours is open pit. The rest of them gotta go underground. So ours is easier mining. I would say adjusted for open pit versus underground, better grade, and we have more. And our market cap is like 15 to 20 percent of what these other companies are valued at. So, we are extremely undervalued right now. So if you’re an investor and you want to have exposure to precious metals, to gold, this is a way you can have leverage and the quality of the assets that we have right now, in my mind, would mean that your risk of losing money is probably a lot less than your risk of making a lot of money. That’s the kind of asymmetric investment opportunities all of us look for.
Jonathan Roth: So, you just mentioned a word there. You said undervalued. Why do you think Skeena’s been so undervalued for so long?
Walter Coles: Yeah, well, I would argue that our success at raising capital from some of the mining focused institutions, like mutual funds and hedge funds around the world, has come back to haunt us because there’s been a trend in the world of pulling capital out of actively managed investment funds and putting that capital into passively managed funds, like ETFs, index funds. So a lot of the mutual funds that we raise money from have faced redemptions over the last 18 months, and even though they told us they liked our project, their investors were pulling money out of their funds, so they were forced sellers of Skeena over the last year and a half. Unfortunately, in my mind, it’s like the worst in the 10 years that I’ve been involved with the sector, it’s the worst I’ve ever seen it. The consequence was we had forced sellers and there’s no bid, no buyers. So that’s taken Skeena down to the level it’s been in for the last six months. But I think we’re through all of that. I think those forced sellers are out and so I think the stock is now at an inflection point where there’s no more sellers. Now the question is: is there any stock available?
Jonathan Roth: What do you have going on now and what do you see happening over the next say six months to a year in terms of your work there?
Kelly Earle: So, we just put out the resource at Eskay that I mentioned, the 4 million ounces, and we’re working hard on metallurgy, because that is a question that we get a lot. Historically, there are a lot of deleterious elements, mercury, arsenic, that were associated. It’s a VMS deposit, volcanogenic massive sulfide deposit. You get extremely high grade, but then you also get some mercury and arsenic, so we’re working on the metallurgy now. We are very confident that it will be clean ore. We’re mining in mostly a different ore type than what was mined historically, but we need the metallurgy out and that report to show the market that it is going to be mineable. So that’s a key milestone that’s coming up for us within the next month.
Then after that, we’re going to be pushing forward on a preliminary economic assessment. So, we’re pretty excited about that. We run the numbers internally and they’re looking good. We’ve hired an engineering firm and we’ve brought an engineer on board to represent Skeena. So, we’re growing and we’re pushing towards that PEA and then while that’s all going on, we will be drilling.
I think people should give Skeena a look because of the amazing quality of Eskay Creek. I mentioned before about when I was part of Hod Maden I didn’t realize it at the time. I think Walter and I and the rest of our team are beginning to realize: this is an amazing deposit that we’re a part of. This is going to be one of the highest-grade open pit mines in North America, if not the world, when it goes back to production. It’s pretty rare that you sit on a brownfield site in a stable jurisdiction, with first nations and government support, 4 million ounces, 4.5 grams open pit. That’s a once-in-a-lifetime project to be a part of and I wholeheartedly believe that Eskay Creek will be back into production.
Walter Coles: We have something very special and it’s hard to find assets like this one. The Eskay Creek deposit is the best open pit deposit that any junior company in the entire world holds right now.
Courtesy: CEO.ca
Disclaimer
All statements in this report, other than statements of historical fact should be considered forward-looking statements. These statements relate to future events or future performance. Forward-looking statements are often, but not always identified by the use of words such as “seek”, “anticipate”, “plan”, “continue”, “estimate”, “expect”, “may”, “will”, “project”, “predict”, “potential”, “targeting”, “intend”, “could”, “might”, “should”, “believe” and similar expressions. Much of this report is comprised of statements of projection. These statements involve known and unknown risks, uncertainties and other factors that may cause actual results or events to differ materially from those anticipated in such forward-looking statements. Risks and uncertainties respecting mineral exploration companies are generally disclosed in the annual financial or other filing documents of those and similar companies as filed with the relevant securities commissions, and should be reviewed by any reader of this video.
Roth Multimedia executive producer Jonathan Roth is an online financial content producer. He is focused on researching and marketing resource and other public companies. Nothing in this video should be construed as a solicitation to buy or sell any securities mentioned anywhere in this video. This article is intended for informational and entertainment purposes only! Be advised Jonathan Roth is not a registered broker-dealer or financial advisor. Before investing in any securities, you should consult with your financial advisor and a registered broker-dealer. In many cases Jonathan Roth owns shares in the companies he features. For those reasons, please be aware that Jonathan Roth can be considered extremely biased in regards to the companies he writes about and features in his videos. Jonathan Roth does not own and never has owned any shares in Skeena Resources. He was paid for production of this video and another to be released at a later date.
Because Jonathan Roth has been paid by Skeena Resources, there is an inherent conflict of interest involved that may influence his perspective on Skeena Resources. This is why you should conduct extensive due diligence as well as seek the advice of your financial advisor and a registered broker-dealer before investing in any securities. Jonathan Roth may purchase shares of Skeena Resources for the purpose of selling them for his own profit and will buy or sell at any time without notice to anyone, including readers/viewers of this video.
Jonathan Roth shall not be liable for any damages, losses, or costs of any kind or type arising out of or in any way connected with the use of this video. You should independently investigate and fully understand all risks before investing. When investing in speculative stocks, it is possible to lose your entire investment.
Any decision to purchase or sell as a result of the opinions expressed in this report will be the full responsibility of the person authorizing such transaction, and should only be made after such person has consulted a registered financial advisor and conducted thorough due diligence. Information in this report has been obtained from sources considered to be reliable, but we do not guarantee that they are accurate or complete. Our views and opinions in this video are our own views and are based on information that we have received, which we assumed to be reliable. We do not guarantee that any of the companies mentioned in this video (specifically Skeena Resources) will perform as we expect, and any comparisons we have made to other companies may not be valid or come into effect.
Jonathan Roth does not undertake any obligation to publicly update or revise any statements made in this video & article.
Gold has failed to gain traction over the past couple months, normally a seasonally-strong time. That has really weighed on sentiment, leaving traders increasingly bearish. Gold investment demand has flagged dramatically with lofty stock markets spewing great euphoria. That’s given gold-futures speculators the run of the market, where they have sold aggressively including extreme shorting. But that’s actually very bullish.
Gold price action is driven by the collective trading of both investors and speculators. The former control vast amounts of capital, which dominates gold prices when it is migrating in or out. But investors’ interest in gold withers when stock markets are super-high. When stocks seemingly do nothing but rally, there’s no perceived need to prudently diversify stock-heavy portfolios with counter-moving gold. It falls out of favor.
Extreme stock-market euphoria is gold’s primary problem now, acting like kryptonite for gold investment. This week the flagship US S&P 500 broad-market stock index clawed back to a new all-time record high. That extended its monster rebound rally since late December’s near-bear lows to 24.8%! The farther the stock markets advance, the more gold is forgotten. Investors have relentlessly pulled capital back out of gold.
The best proxy for gold investment demand is the physical gold-bullion holdings of the world’s dominant gold exchange-traded fund, the American GLD SPDR Gold Shares. In early October soon after the S&P 500 peaked but before it started plunging in its severe 19.8% correction, GLD’s holdings slumped to a deep 2.6-year low of 730.2 metric tons. I explained these stock-market and GLD dynamics in depth last week.
Then the very day the stock markets first dropped hard, investors remembered gold. Over the next 3.8 months into late January, GLD’s holdings surged 12.8% to 823.9t on heavy capital inflows from American stock investors. That helped push gold 8.9% higher in that span. But as euphoria came roaring back as the S&P 500 rebounded sharply from its deep selloff, gold’s relative luster again faded in investors’ eyes.
Between late January and this week, they’ve dumped GLD shares much faster than gold itself was being sold. That has forced GLD’s holdings 9.2% lower in the last 2.8 months to 747.9t, helping push gold’s price down 2.7%. Over 4/5ths of gold’s stock-market-correction-driven investment surge has now been erased, leaving GLD’s holdings just 2.4% above their secular lows of early October before stocks plunged!
The gold-investment selling via GLD in recent months has been relentless, especially in February and now April. During February’s 19 trading days, 13 saw GLD draws averaging 0.4%. And as of the middle of this week, April’s 17 trading days so far have seen 12 GLD-draw days also averaging 0.4%. Gold has faced unyielding selling pressure from American stock investors as the S&P 500 levitated ever higher.
There’s an old proverb stating “when the cat’s away, the mice will play”. That concept perfectly applies to the gold market. When investors are away, the gold-futures speculators will play. Investors’ capital just dwarfs speculators’, so when gold investment demand is robust spec trading is drowned out and usually irrelevant. But when investors aren’t interested, the gold-price impact of gold-futures trading is magnified.
These traders already punch far above their weights, their capital being far more potent than investors’ on a dollar-for-dollar basis. Gold futures allow extreme leverage far beyond anything legal in the stock markets. Each gold-futures contract controls 100 troy ounces of gold, which is worth $127,500 at $1275. But gold-futures speculators are only required to keep $3,400 cash in their accounts for each gold-futures contract.
That gives them absurd maximum leverage up to 37.5x, compared to the decades-old 2.0x limit in stock markets! At 30x leverage, every dollar deployed in gold futures has literally 30x the price impact on gold as another dollar used to buy gold outright. Just $1 of gold-futures capital flows yield the same gold-price result as $30 of investment capital flows. Gold-futures trading’s impact on gold is wildly disproportionate.
Further amplifying gold-futures speculators’ outsized influence, the American gold-futures price is gold’s global reference one. So when heavy gold-futures selling blasts that headline price lower, the resulting negative psychology quickly infects the rest of the world gold markets. Gold-futures trading is effectively the tail that wags the gold-investment dog. This vexing problem shouldn’t be allowed to exist, but it does.
Over the past couple months as mounting stock-market euphoria seduced investment capital out of gold, speculators’ gold-futures selling has soared to extremes at times. That really exacerbated the counter-seasonal downside pressure on gold prices. This heavy selling is evident in the weekly Commitments of Traders reports from the CFTC, which detail speculators’ collective long and short positions in gold futures.
This chart superimposes several years of daily gold prices in blue over the weekly CoT data. Total spec long contracts are shown in greed, and total shorts in red. The falling longs and rising shorts since gold last peaked near $1341 in mid-February are a big reason for its recent weakness. But the lower specs push their longs and the higher they ramp their shorts, the more bullish gold’s near-term outlook grows.
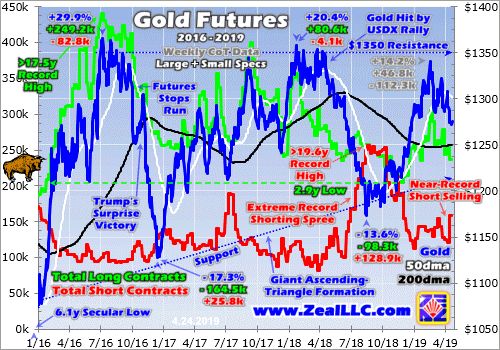
A couple weeks ago I dug deeper into gold futures’ impact on gold prices in recent years, so I’m going to focus on recent months here. On February 19th when gold surged to $1341, total spec longs and shorts were running 305.0k and 138.5k contracts. While those longs remained way below recent years’ peaks, they were still near the highest levels seen in the past year. I developed a simple metric to quantify that.
This chart shows the general rule on gold-futures trading driving gold price action. When speculators are buying by either adding new longs or covering existing shorts, gold rallies. When they are selling existing longs or adding new shorts, gold retreats. So the lower spec longs, and the higher spec shorts, the more bullish gold’s near-term outlook. The opposite is also true, higher longs and lower shorts are bearish for gold.
Gold’s biggest uplegs in recent years emerged from relatively-low spec longs and/or relatively-high spec shorts. Figuring out how low or high both sides of this trade happen to be can be done by looking at current levels compared to their trading ranges over the past year. When gold peaked at $1341 9 weeks ago, total spec longs were running 96% up into their 52-week trading range. That was certainly relatively high.
That left speculators little room to buy more gold-futures long contracts unless they expanded their total capital allocation back to bigger prior-year levels. If they didn’t, they had a lot more room to sell than to buy. That same CoT week, total spec shorts were running 32% up into their own past-year trading range. Thus the short-side guys had probable remaining room to cover 1/3rd of their shorts, which was relatively low.
If investors had been buying gold, if the mounting stock euphoria hadn’t been sucking capital out of gold, speculators’ gold-futures positioning wouldn’t have mattered much. But with investors missing in action, the gold-futures traders were ruling the roost. And they started selling heavily in the CoT week ending on Tuesday March 5th. Be aware that CoT weeks always run from Tuesday closes to Tuesday closes.
Gold began that CoT week looking great, trading at $1328. But speculators started selling gold futures, pushing gold down towards $1300. That is a hugely-important psychological level for gold, which seems to attract gold-futures stop losses like gravity. So as $1300 neared and failed, gold-futures selling ramped up massively. That CoT week ended with specs dumping 34.0k long contracts while adding 11.9k short ones!
A 20k+ contract change in either spec longs or shorts in a single CoT week is the threshold where huge begins. 20k contracts control the equivalent of 62.2 metric tons of gold, way too much for normal markets to absorb in a single week. That big bout of spec gold-futures long selling that kicked off the last couple months’ gold slump was exceptional. At that point 1053 CoT weeks had passed since early 1999, a long span.
That CoT week’s spec long selling ranked as the 20th largest ever witnessed, a rare event. And in terms of speculators’ total gold-futures selling including both longs and shorts, it was the 11th largest on record! It’s important to realize that gold-futures selling of that magnitude is unusual, unsustainable, and self-limiting. The lower spec longs and the higher spec shorts, the less gold futures these traders have left to sell.
That extreme selling blitz puking out the equivalent of 142.6t of gold in a single CoT week would probably have been the end of it without the growing stock-market euphoria. Gold usually carves a major seasonal low in mid-March before powering higher in its spring rally. But with the S&P 500 levitating and investors still selling gold on balance, sentiment stayed fairly bearish so gold-futures specs had the run of the market.
Still gold defied the surging stock markets to rally like usual, climbing back to $1322 by March 25th. The gold-futures speculators were responsible, adding 20.4k new long contracts while covering 15.4k short ones in the CoT week ending a day later. That was the equivalent of 111.3t of gold buying. But over the next CoT week, that reversed into heavy selling. That again surrounded gold plunging back under $1300.
For decades now I’ve intensely studied and closely watched the markets in real-time. I get up at 5am and follow the data and news feeds until 4pm or later. Usually when gold or the stock markets make some big intraday move, it’s explainable by news or data. Neither gold’s 1.7% plunge on March 1st, nor its later 1.4% drop on March 28th, had any apparent catalysts! But both days saw gold break back below $1300.
Running extreme leverage up to 37.5x, gold-futures speculators can’t afford to be wrong for long. A mere 2.7% gold price move against their positions would wipe out 100% of their capital risked at such leverage! So these guys have to maintain an ultra-short-term price-dominated focus, and they have to run tight stop losses or risk quick ruin. Long-side gold-futures traders have long clustered stops near that key $1300 level.
So when gold falls back through $1300 from above, mechanical stop-loss orders start triggering resulting in forced long selling. That quickly pushes gold even lower, tripping more stops to fuel cascading selling. By the time the dust settled in that CoT week ending on April 2nd with gold battered back to $1291, total spec gold-futures longs had plummeted 35.3k contracts! They weren’t short selling then, as shorts fell 2.1k.
That massive long dump was again exceptional, ranking as the 18th largest ever witnessed out of 1057 CoT weeks since early 1999 at that point. Speculators can’t maintain such crazy selling rates for long, as just 7 weeks at that pace would drive their longs to zero which will never happen. For the second time in 4 CoT weeks, extreme spec gold-futures long selling hammered gold from well above $1300 to back below.
But gold soon started recovering even while investors mesmerized by stock euphoria exited. Gold again climbed up over $1300, hitting $1308 on April 10th. This metal really wants to power higher even with investment capital fleeing to chase the lofty stock markets. Yet once again extreme gold-futures selling erupted in the latest CoT week reported before this essay was published, which ended last Tuesday April 16th.
For the third time in 7 weeks, extreme gold-futures selling flared as gold passed back down below $1300. Once again there were no significant data or news catalysts around the world, gold-futures selling just snowballed to a stunning degree. That CoT week total spec longs dropped another 17.5k contracts, close to that 20k+ huge threshold. But total spec shorts exploded an utterly-astounding 36.9k contracts higher!
That single-CoT-week shorting was so crazy it ranked as the 2nd highest ever witnessed out of the 1059 CoT weeks since early 1999! The only bigger shorting week was back in mid-November 2015, soon after the Fed telegraphed its first rate hike of the recent cycle. Yet that record shorting would soon prove very bullish for gold, birthing a major bull market. Gold surged 29.9% higher in 6.7 months in the first half of 2016.
Considered together in that latest reported CoT week ending April 16th, speculators’ total long and short selling rocketed to 54.4k contracts! That is the 5th highest on record, incredibly extreme. The 1st and 4th weighed in at 70.4k and 56.7k, and both occurred in December 2017. That record gold-futures selling also proved very bullish, as gold soon surged sharply to challenge a major bull-market breakout above $1350.
Big gold-futures selling is always bullish for gold, because those bearish bets will soon be unwound with proportional buying. This current episode won’t prove an exception, especially with near-record shorting. While making bullish long-side gold-futures trades is voluntary, short covering is mandatory. Shorting is effectively borrowing gold futures that traders don’t own, those contracts have to be repurchased and paid back.
Between gold’s latest interim high in mid-February to this extreme latest-reported CoT week, total spec longs collapsed 68.5k contracts or 22.5%. That’s a lot in a short span, leaving longs running just 32% up into their past-year trading range. That means specs easily have room to do over 2/3rds of their likely near-term long buying, and much more if higher gold prices excite traders enough to bet at previous years’ scales.
And over the last 8 reported CoT weeks, total spec shorts rose 19.5k contracts. That left them 37% up into their own past-year trading range. That’s not high, but it still leaves a lot more shorts that have to be covered with offsetting buying as gold reverses higher again. Total spec selling since February 19th ran 88.0k contracts, the equivalent of 273.9t of gold. That’s helped force gold 4.8% lower from $1341 to $1276.
The bright side of all this gold-futures selling is it is inherently self-limiting and self-correcting. The more these traders sell, the less they have left to sell. And the higher the odds they will start buying in a big way to mean revert their recent bearish bets back to normal. One of these days some catalyst will arise that will spark major spec gold-futures buying. Gold will surge sharply for weeks as buying normalizes bets.
The biggest casualty of recent months’ extreme near-record gold-futures selling was the gold miners’ stocks, which amplify moves in gold. The major gold miners of the leading GDX VanEck Vectors Gold Miners ETF tend to leverage gold’s action by 2x to 3x. That has weighed on gold-stock prices and psychology since mid-February. GDX slumped while gold-futures speculators battered the gold price lower.
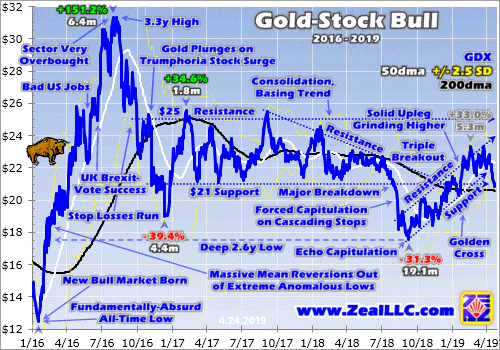
Despite that extreme gold-futures selling nearing records, and incredible stock-market euphoria stunting gold investment demand, the gold stocks have weathered this storm really well. GDX did knife back under its upleg’s support, nearing its 200-day moving average which is much-stronger support. But the major gold stocks have proven impressively resilient overall, largely consolidating high as gold swooned.
Again gold was pounded 4.8% lower over those 8 CoT weeks starting near $1341 and ending way down near $1276. At 2x to 3x normal leverage, the gold stocks would’ve plunged almost 10% to 15%. Yet over that exact span GDX merely slid 5.7%, just 1.2x gold’s loss! And GDX’s leverage was healthy before that as gold rallied, running 2.8x at best by mid-February. The gold stocks have really been holding their own.
Gold stocks are set to surge again once gold reverses decisively higher, which is increasingly likely any day now. These lofty euphoric stock markets are going to inevitably encounter some catalyst sparking significant selling, which will snowball after such a massive and long rally steeped in such epic complacency. Gold investment demand will turn on a dime as stock markets roll over, just like back in early October.
And when gold starts moving higher, the hyper-leveraged gold-futures speculators will rush to buy and pile on to its upside momentum. And after slashing their longs and ramping their shorts over the past couple months, they have major buying to do to reestablish bullish positioning relative to gold to ride its next rally. As leveraged gold-futures capital inflows force gold higher, gold stocks will really amplify its gains.
The last time major gold investment buying lined up with major gold-futures buying by the speculators was in roughly the first half of 2016. That catapulted gold 29.9% higher in 6.7 months kicking off this bull. The major gold stocks as measured by GDX soared 151.2% in essentially that same span, amplifying the big gold gains by 5.1x. Gold stocks are the place to be when traders are pouring capital back into gold!
One of my core missions at Zeal is relentlessly studying the gold-stock world to uncover the stocks with superior fundamentals and upside potential. The trading books in both our popular weekly and monthly newsletters are currently full of these better gold and silver miners. We’ve added plenty of new trades since mid-February as older ones were stopped out, which are ready to surge much higher as gold recovers.
To multiply your capital in the markets, you have to stay informed. Our newsletters are a great way, easy to read and affordable. They draw on my vast experience, knowledge, wisdom, and ongoing research to explain what’s going on in the markets, why, and how to trade them with specific stocks. As of Q1 we’ve recommended and realized 1089 newsletter stock trades since 2001, averaging annualized realized gains of +15.8%! That’s nearly double the long-term stock-market average. Subscribe today for just $12 per issue!
The bottom line is gold has been bludgeoned by extreme gold-futures selling in the past couple months, culminating in near-record shorting. That’s what forced gold lower during its usual spring-rally timeframe. With investors seduced by the lofty euphoric stock markets, gold-futures speculators have been running roughshod over gold prices. But their heavy selling is self-limiting, and will reverse into proportional buying.
Speculators’ big bearish shift in gold-futures positioning will have to be normalized, resulting in big buying that will push gold higher. That upside momentum could really grow, especially when stock markets roll over and again rekindle gold investment demand. The biggest gains as gold mean reverts back higher will come in the stocks of its miners. They’ve proven resilient as gold swooned, and are poised to surge again.
Adam Hamilton, CPA
April 30, 2019
Copyright 2000 – 2019 Zeal LLC (www.ZealLLC.com)
- The weak physical demand season continues to cause gold to drift with a clear but modest downside bias.
- Despite the swoon, most top bank analysts are extremely positive in their outlook for gold in the second half of the year.
- Please click here now. Standard Chartered analyst Suki Cooper notes a high correlation between the Fed’s actions now and in 2006. Gold does respond to a more dovish Fed, but not immediately.
- Suki also predicts U.S. GDP growth will be under 2.5% in 2019, fade to under 2% in 2020, and a downturn will begin in 2021.
- She expects the Fed to remain in pause mode and then announce a rate cut as growth and corporate profits continue to fade.
- The IMF predicts a similar fade in global growth generally, with the exception of China. India is also likely to see strong growth and that will likely be augmented with government handouts related to the election there.
- Essentially, the West will see fading growth. The Fed’s actions will be negative for the dollar and positive for the fear trade for gold. The East will see solid growth and that will be supportive for the love trade for gold.
- The big picture for gold in both the East and the West is positive.
- Please click here now. Double-click to enlarge this GDX chart.
- While the bank analysts are happy to wait out the weak season, I focus on swing trading with my guswinger.com trade alerts service. While many gold investors are a bit gloomy right now, we’ve been “riding the gravy train” with DUST-NYSE throughout most of the latest GDX downturn.
- Recent COT reports show the commercials doing aggressive buying of both gold and silver COMEX contracts. That’s positive but it doesn’t reduce account drawdowns for gold stock investors.
- Ultimately, winning trades are how to reduce drawdowns and commercial traders on the COMEX are currently covering enormous short positions at huge profits.
- Diversification plays a key role in successful investing. A modest allocation of capital to a solid swing trade program should be part of that diversification.
- To view the daily gold chart, please click here now. Double-click to enlarge.
- A potential bull wedge pattern is in play, but until there’s a bigger rally it’s not an actual textbook pattern.
- On a positive note, the blue lag line of my 14,7,7 Stochastics oscillator is almost oversold and “rallies with teeth” tend to occur when that happens.
- Chinese citizens are becoming more positive about their economy and gold demand is perking up. The Akha Teej festival in India is scheduled for May 7 and demand is picking up there too.
- The commercial trader buying on the COMEX could be related to this Chindian love trade but the intensity of the buying could also suggest that commercial traders are also anticipating the U.S. stock market could have a particularly nasty “Sell in May and go away”
- The S&P 500 index is near its highs and oil prices keep climbing. For now, oil is really in a sweet spot where it is high enough to help S&P500 earnings but not too high to hurt consumers.
- That could change quite dramatically, depending on how Iran responds to the U.S. government’s “My way or the highway” announcement to end sanctions waivers on Iranian oil exports.
- Good news for oil company earnings could quickly morph into “stagflationary concern” and this could be on the minds of the COMEX commercial traders who are buying gold and silver extremely aggressively now.
- American “Gmen” enforce these sanctions by threatening to cut nations off from the dollar-oriented US financial system unless they follow their orders. In the big picture, U.S. government “my way or the highwayism” related to Iran is simply going to accelerate the global wave of de-dollarization, which is good news for gold investors.
- Please click here now. Double-click to enlarge this GDX chart. The 50% retracement zone in the $20.50 area and the 60% retracement zone in the $20 area are where gold stock investors should look for a significant rally to begin.
- The bottom line is that physical market demand softness is likely to continue into the summer… but a big relief rally for the entire precious metals sector is imminent!
Special Offer For Website Readers: Please send me an Email to freereports4@gracelandupdates.com and I’ll send you my free “Golden Exceptions To The Rule!” report. I highlight key miners that are blasting higher even with the gold/silver price swoon and I include pinpoint buy and sell trigger points for each stock!
Thanks!!
Cheers
Stewart Thomson
Graceland Updates
Written between 4am-7am. 5-6 issues per week. Emailed at approx 9am daily.
Email:
Graceland Updates daily between 4am-7am. They are sent out around 8am-9am. The newsletter is attractively priced and the format is a unique numbered point form. Giving clarity of each point and saving valuable reading time.
Risks, Disclaimers, Legal
Stewart Thomson is no longer an investment advisor. The information provided by Stewart and Graceland Updates is for general information purposes only. Before taking any action on any investment, it is imperative that you consult with multiple properly licensed, experienced and qualified investment advisors and get numerous opinions before taking any action. Your minimum risk on any investment in the world is: 100% loss of all your money. You may be taking or preparing to take leveraged positions in investments and not know it, exposing yourself to unlimited risks. This is highly concerning if you are an investor in any derivatives products. There is an approx $700 trillion OTC Derivatives Iceberg with a tiny portion written off officially. The bottom line:
Are You Prepared?
If you would like to receive our free newsletter via email, simply enter your email address below & click subscribe.
 Follow us on Twitter
 Become our facebook fan
CONNECT WITH US
Tweets
Tweet with hash tag #miningfeeds or @miningfeeds and your tweets will be displayed across this site.
MOST ACTIVE MINING STOCKS
Daily Gainers
 CMC Metals Ltd. CMC Metals Ltd. |
CMB.V | +900.00% |
 Eden Energy Ltd Eden Energy Ltd |
EDE.AX | +200.00% |
| GoviEx Uranium Inc. |
GXU.V | +42.86% |
| Eagle Nickel Ltd. |
ENL.AX | +41.67% |
| Citigold Corp. Limited |
CTO.AX | +33.33% |
| Mount Burgess Mining NL |
MTB.AX | +33.33% |
| Exalt Resources Limited |
ERD.AX | +31.94% |
| Casa Minerals Inc. |
CASA.V | +30.00% |
| Cariboo Rose Resources Ltd |
CRB.V | +28.57% |
| Belmont Resources Inc. |
BEA.V | +28.57% |


