
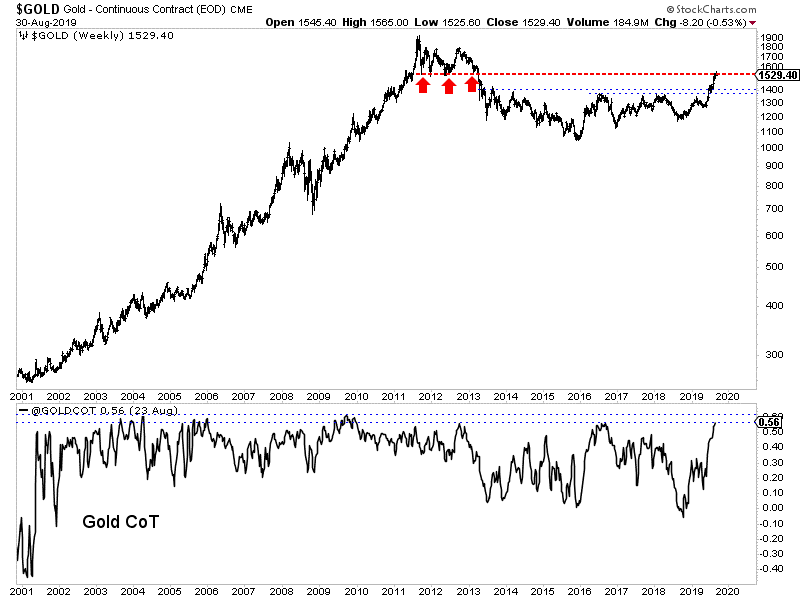
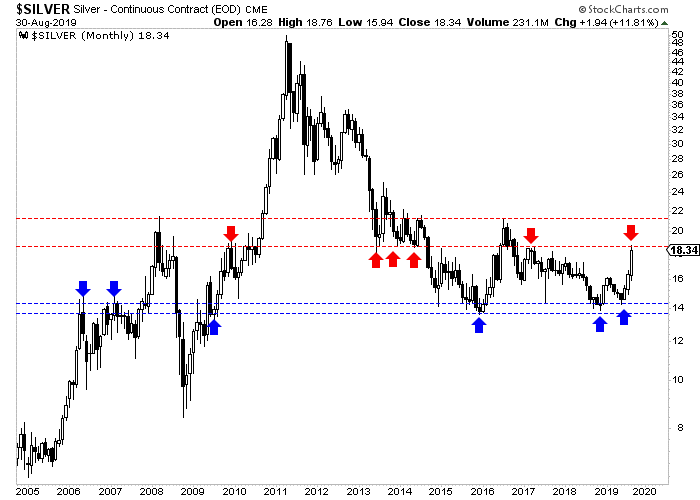
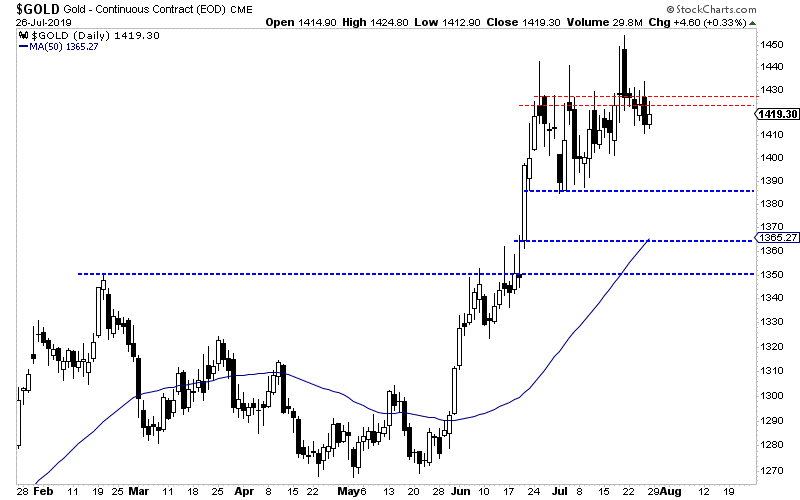
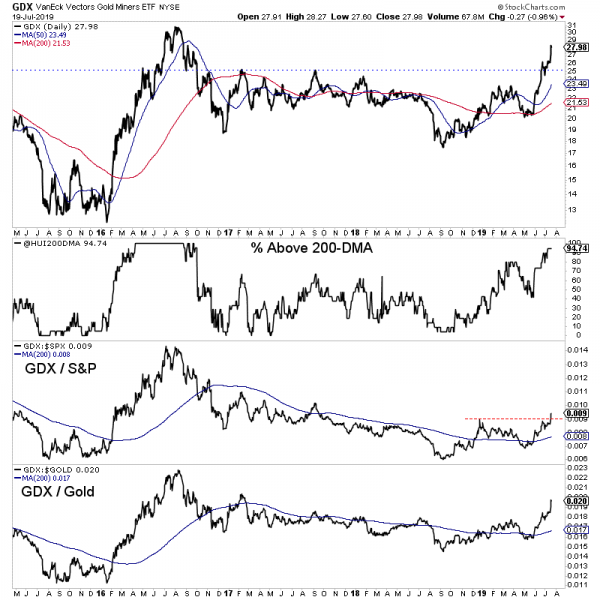
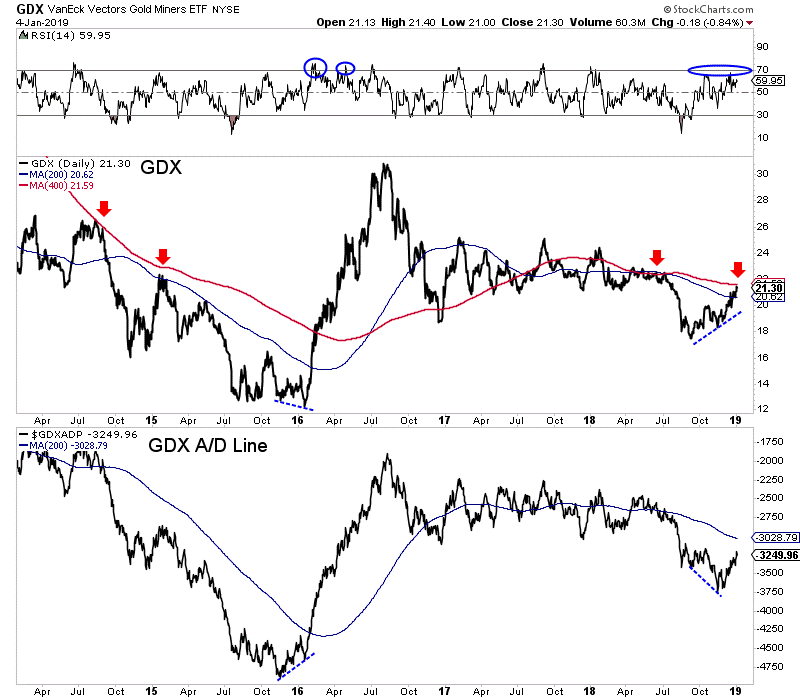
It has taken a few weeks to play out but our warning of a correction in precious metals (first on August 18) is coming to pass.
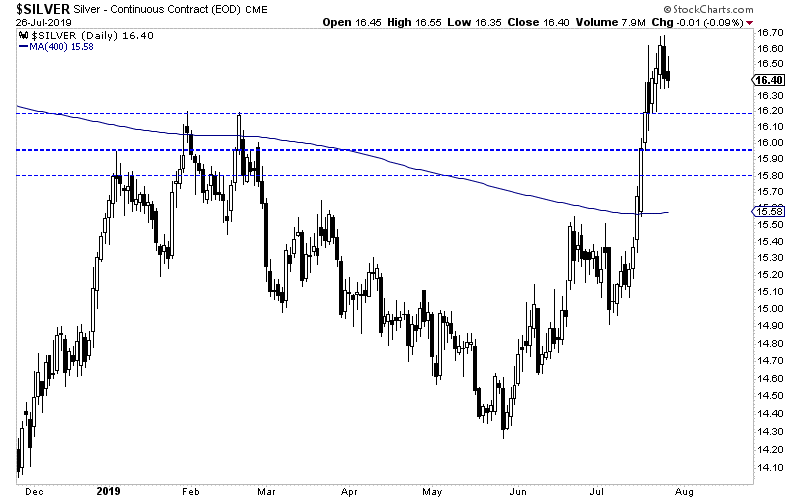
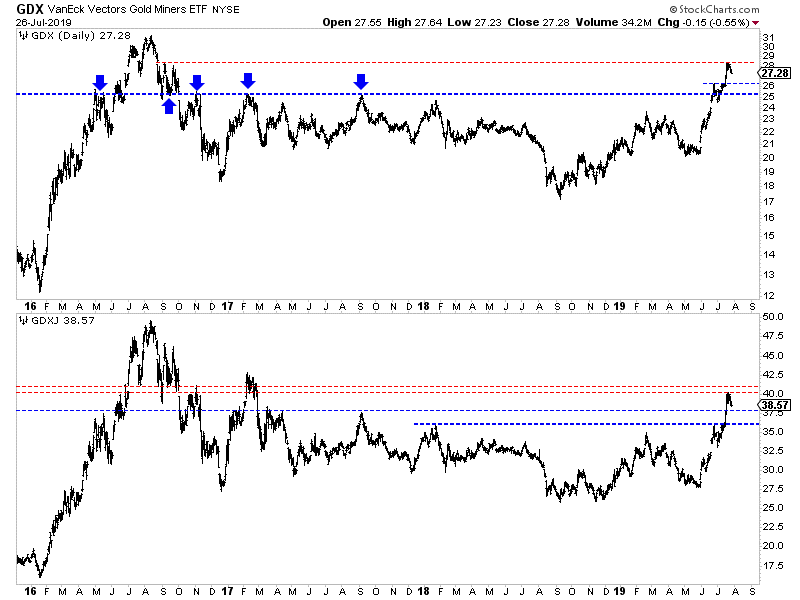
Last week Gold, Silver and GDX all formed big bearish reversals at multi-year resistance levels. Yes, these resistance levels (Gold $1550, Silver $18.50, GDX 31) date back to 2013.
Bonds and precious metals have benefitted from the shift in Fed policy as well as fears of recession and growth in negative interest rate bonds.
These drivers could pause or shift temporarily and that would be supportive of stocks and not precious metals. Let me explain.
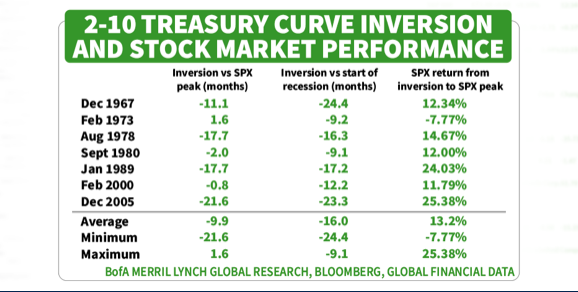
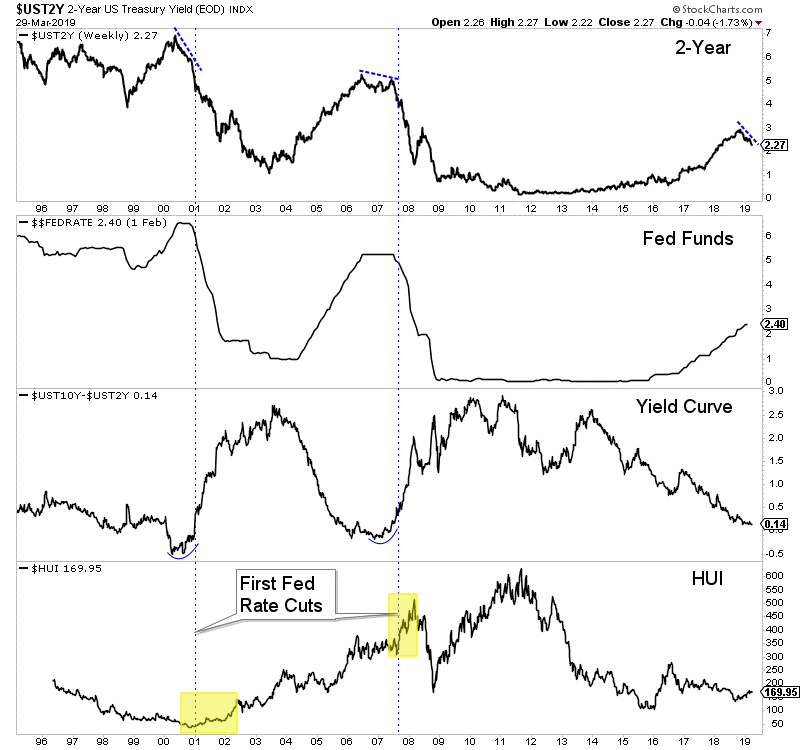
First, the fears of recession are driven by the inversion of the yield curve. But the problem is the timing.
There is a lag between the inversion and the peak in the stock market, and stocks tend to perform well during that lag period. The data below shows an average gain of 13% and an average lag time of 10 months.
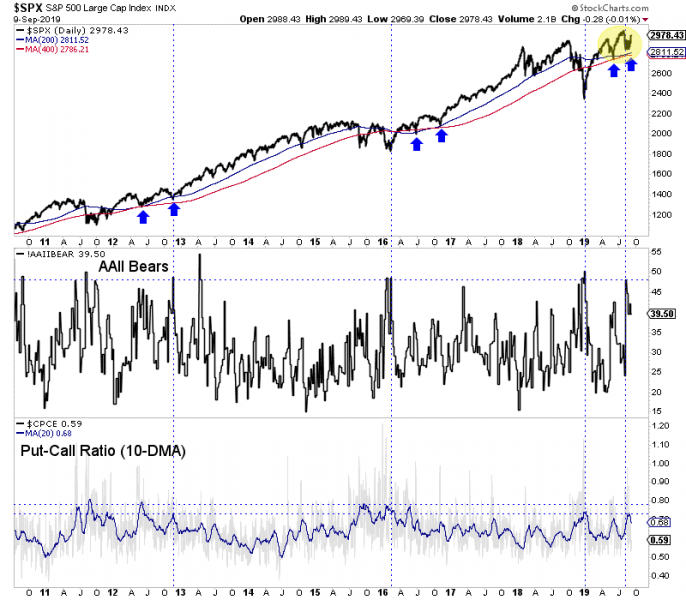
The U.S. stock market has held up very well despite growing recession fears and persistent bearish sentiment. In the chart below we plot the S&P 500 along with two sentiment indicators.
In recent weeks, the number of AAII Bears and the put-call ratio together hit their third highest level in nearly the past seven years. Despite that sentiment, the S&P appears to be emerging from its recent lows in the manner it did in 2012 and 2016.
A sustained rally in the stock market is going to allay some recession fears and suck some capital out of bonds thereby leading to higher yields.
This will cause precious metals to correct but that is no surprise given what the charts are already showing us. How much and how long of a correction will depend on Fed policy.
If the Fed continues to cut rates well into 2020 then that is bullish for precious metals even if the long end of the yield curve is rising. If the Fed cuts in September and stands pat until March 2020 then precious metals will continue to correct and digest recent gains.
Ultimately, the mix of a stronger dollar, inverted yield curve and political pressure is more likely than not to lead to continued rate cuts over the next 15 months.
Therefore if you missed the recent run in precious metals, don’t panic. It’s best to be patient and let this correction run its course. Better value and new opportunities will emerge. To learn the stocks we own and intend to buy that have 3x to 5x potential, consider learning more about our premium service.
by Jordan Roy-Byrne CMT, MFTA
September 10, 2019
A few weeks ago we wrote that precious metals were at risk of a correction.
First, they powered higher. But last week they ran into technical resistance levels that date back well beyond only a few years.
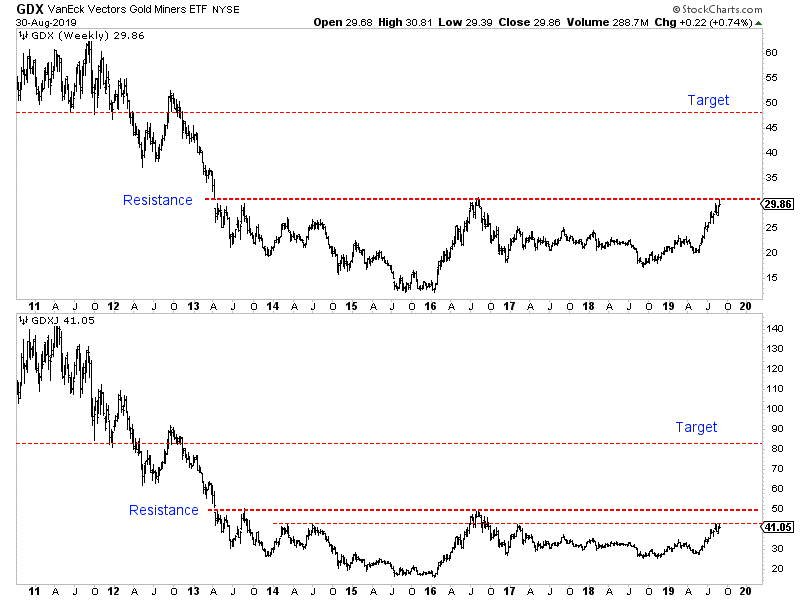
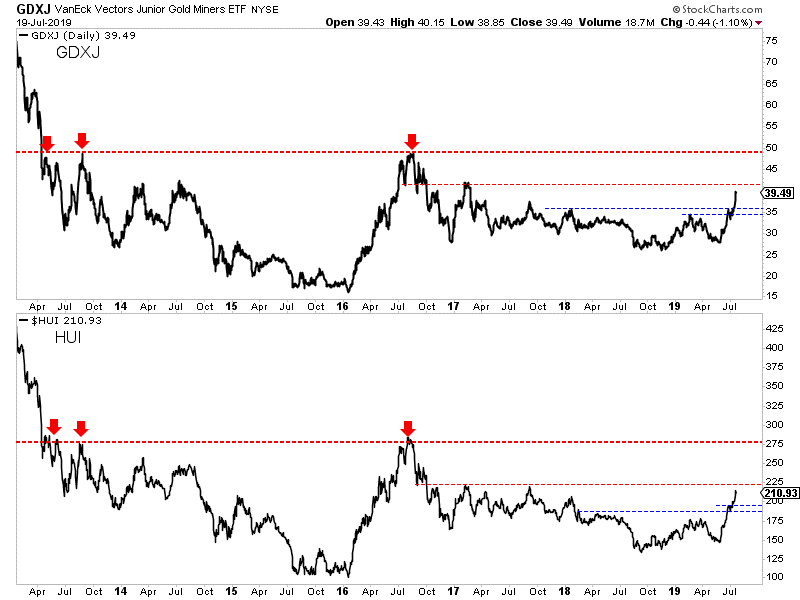
This is true for Gold, Silver as well as the miner ETFs: GDX and GDXJ.
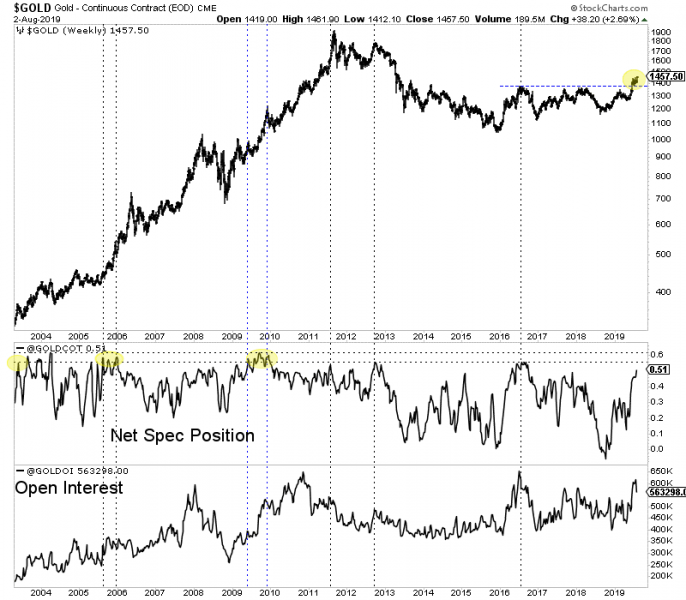
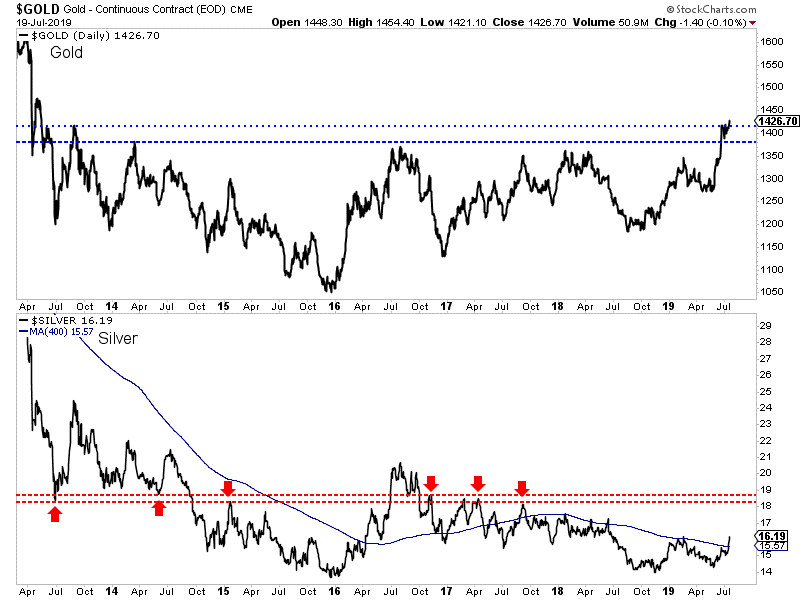
Starting with Gold, we can see that it has struggled to get through $1550/oz. That’s not a surprise as we pointed out this level as resistance since Gold surpassed $1370/oz.
The combination of multi-year resistance at $1550/oz and the current high net speculative position could force Gold down to a retest of $1400/oz.
Meanwhile, Silver has been the strongest component of the sector in the short-term.
It closed the month of August right at major resistance in the mid $18s, which as you can see, has been a key level for the last 11 years. A monthly close above $18.50 would be significant but it may not happen until October or November.
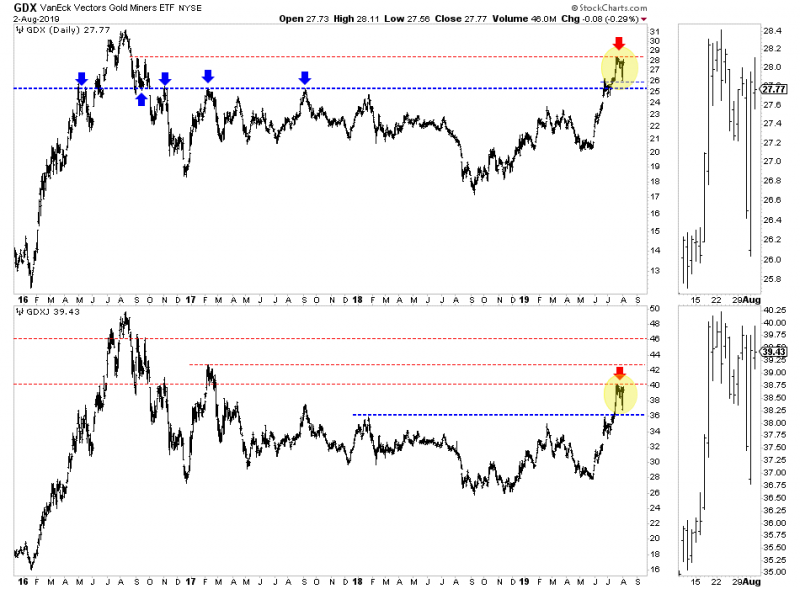
Turning to the stocks, we see that GDX has reached its 2016 high and 6-year resistance. A correction or consolidation for weeks or even a few months would be perfectly normal.
GDXJ has lagged much like Silver as it has yet to reach its 2016 high near $50. However, it is dealing with important resistance at $42 which dates back to 2014.
As summer winds down, the excitement in precious metals is building.
The retail crowd is looking to jump back in for the first time in years and the same can be said for many institutions.
In the big picture, this is the time to jump back in. You do want to get in before the sector makes its next break higher and before GDX and GDXJ surpass multi-year resistance.
However, the immediate risk appears to be to the downside.
Gold, Silver and gold stock ETFs all are at multi-year resistance levels. A correction and consolidation is perfectly normal and should be expected here.
If you missed the recent run then don’t panic. It’s best to exercise patience and wait for weakness. Better value and new opportunities will emerge. To learn the stocks we own and intend to buy that have 3x to 5x potential, consider learning more about our premium service.
By Jordan Roy-Byrne CMT, MFTA
September 5, 2019
Back during the bear market years (it’s nice to be able to write that now), I regularly would compare the declines in Gold, Silver and gold stocks to their past history. It gave us a visual representation of just how bad the forever bear market was and helped us decipher when it might end.
Thankfully that is all behind us.
Now it’s time to compare recent bullish moves to past iterations.
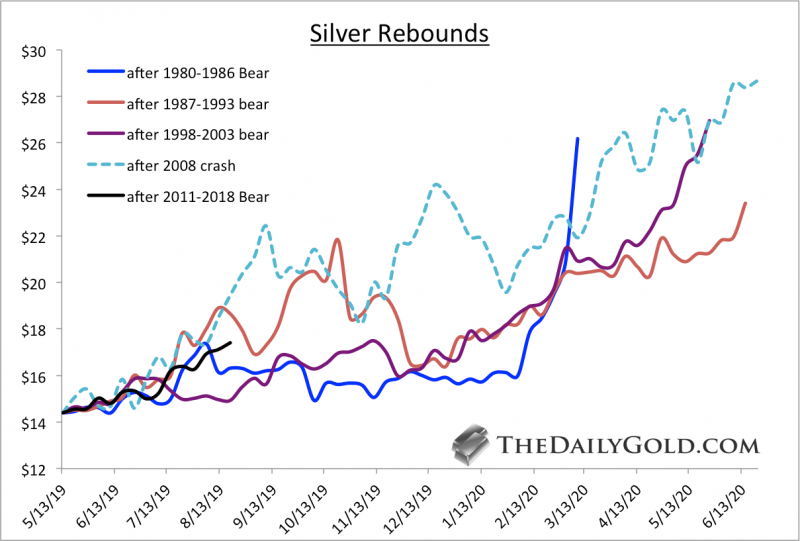
First is Silver.
The recent low in Silver has several good comparisons, which include the lows in 1986, 1993 and 2003. We also included the 2008 low.
If Silver’s rebound were simply an average of the four rebounds shown then it would reach nearly $24 by the end of March 2020.
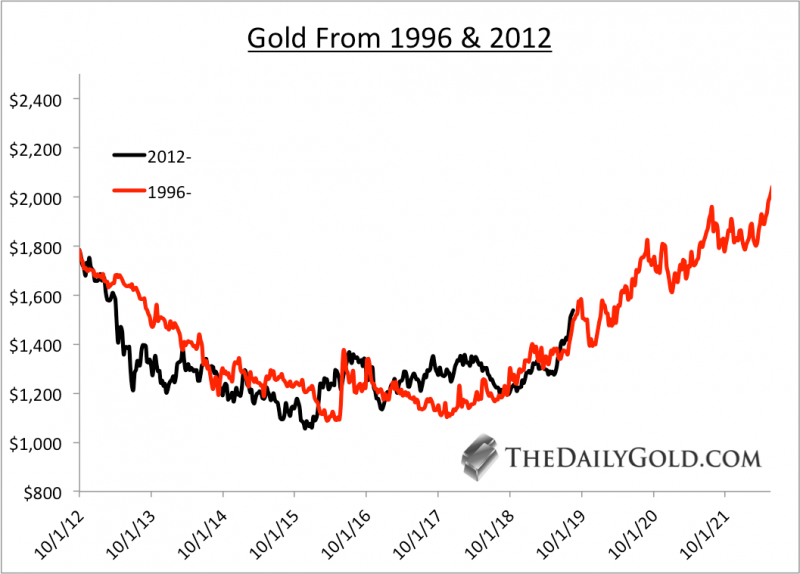
Gold is tricky because there is not an obvious bull comparison. Its major lows were essentially in 1970, 1985 and 1999 to 2001.
However, when we consider the preceding bear market, the best comparison to the recent bear and current bull is the late 1990s and early 2000s.
Mind you, we aren’t forecasting or predicting that 2003 to 2006 will be duplicated over the next three years. It’s possible, but we are simply arguing that the 2012 to 2019 period most resembles 1996 to 2003.
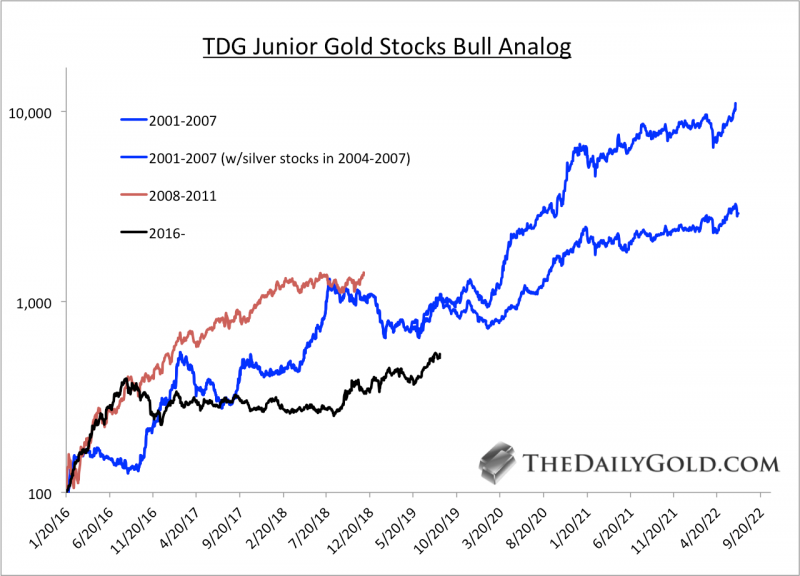
Turning to the gold stocks and specifically the junior gold stocks, here is how the 2016 bottom compares to the bottoms in 2001 and 2008.
Note that the basket of 20 stocks we used is quite strong compared to GDXJ. In other words, we erred on the side of positive performance.
In our new book (available at TheDailyGold.com), we argue that the 2016 low in gold stocks was very similar to the 1957 low.
There are numerous similarities between today and the early to mid 1960s. That includes the gold stocks and their incredible long-term value at the start of a major inflationary cycle.
Below we compare the 1957 and 2016 lows with data from the Barron’s Gold Mining Index, which appreciated over 40-fold from its 1957 low to the peak in 1980.
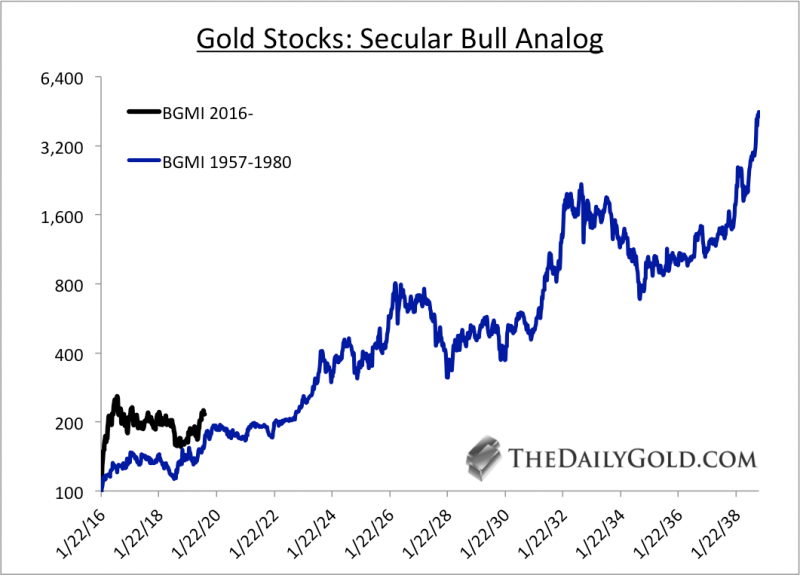
As you can see, if Gold remains in a real bull market then significant upside potential remains in place across the precious metals complex.
Fundamentally, Gold could remain in a bullish trend until the next economic recovery gains traction. That could be anywhere from a few to four years away.
If gold continues to follow the pattern of the early 2000s then it could reach $3000/oz by the start of 2023.
Jordan Roy-Byrne CMT, MFTA
August 28, 2019
Last week we wrote that near-term risk in precious metals (Gold and GDX especially) was rising and a correction could begin soon.
As Gold nearly reached major resistance at $1550/oz, the miners already began to correct. That negative divergence is an ominous signal for the sector in the short term.
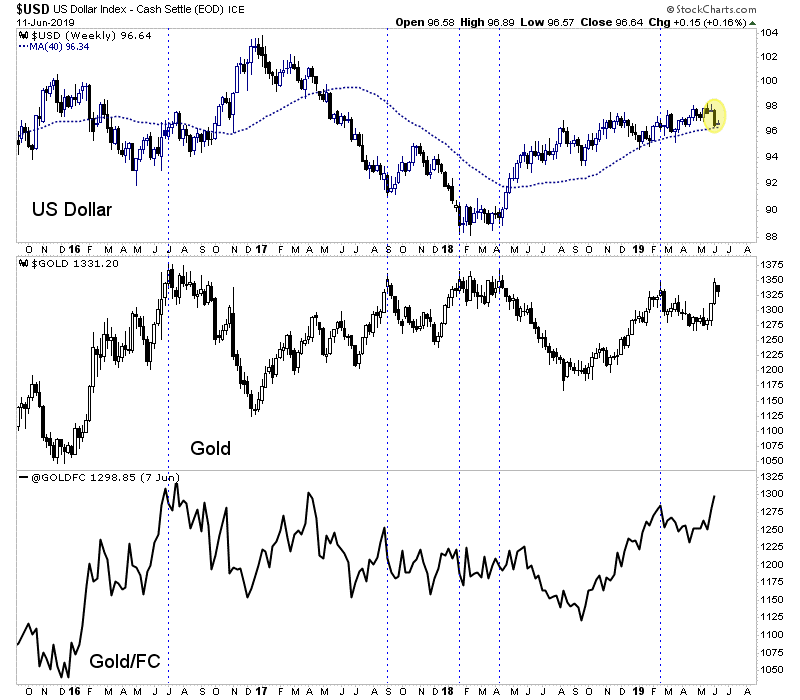
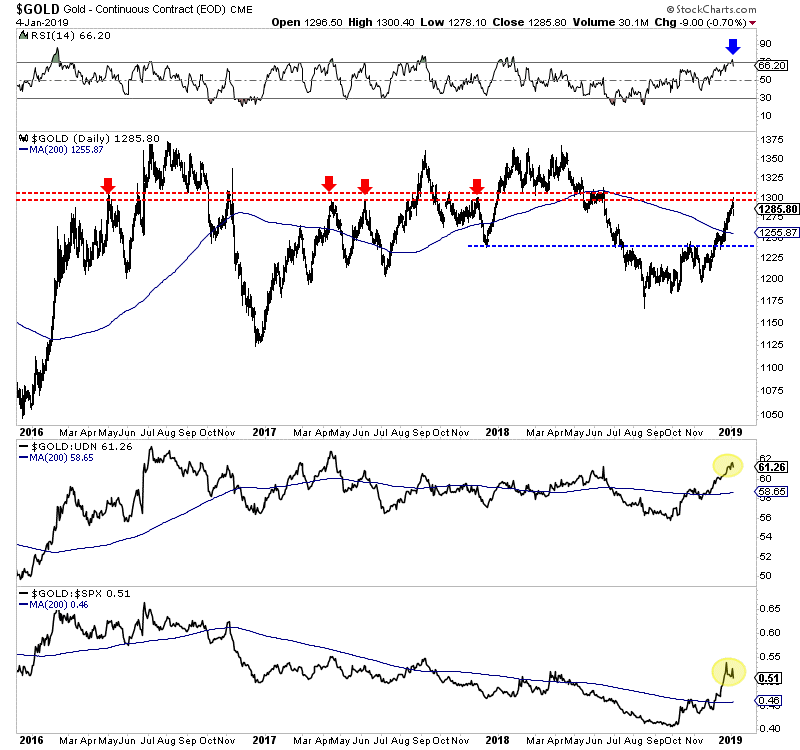
However, the good news is, at least at present, Gold remains very strong in real and intermarket terms.
The first example of that is Gold’s strength against foreign currencies (Gold/FC). Gold/FC made a new all time high a few weeks ago and is now 4% above the previous all time high.
In the chart below we mark the points when Gold/FC made a new high first in blue and Gold’s new highs in black. Note that when Gold/FC makes a new high first, Gold tends to follow.
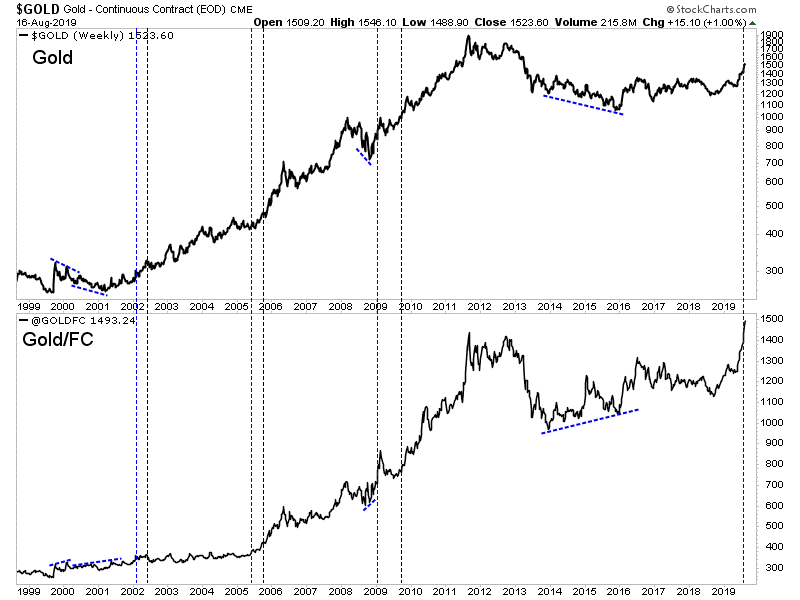
Also, we should note that Gold’s false new high in 1996 and cyclical bull market from 1985 to 1987 were never confirmed by Gold/FC, which showed a negative divergence both instances.
Elsewhere, Gold is very strong against global equity markets and has reached important resistance relative to the S&P 500.
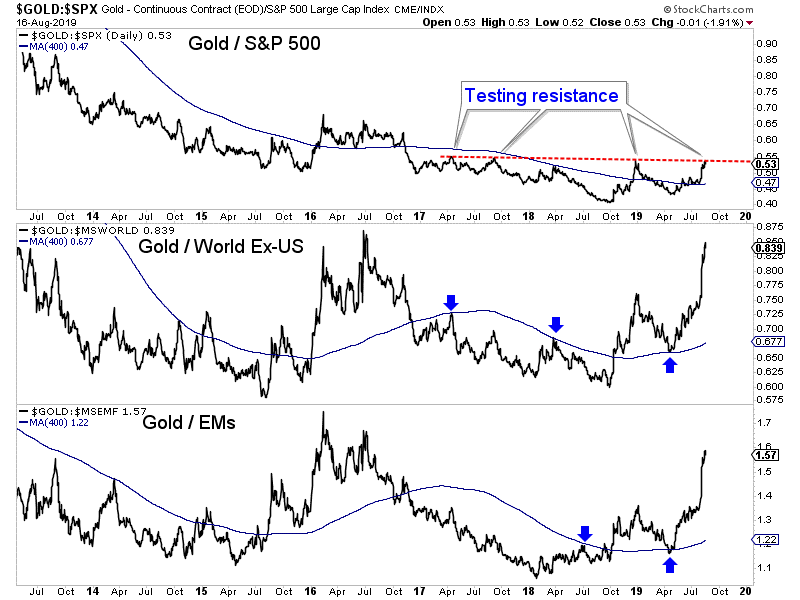
In all of these charts, including Gold against the S&P 500, the market is well above long-term moving averages and support. We do expect Gold to correct soon in both nominal and real terms but it does have plenty of breathing room.
Unlike in 2016, Gold against foreign currencies is at an all time high and the Federal Reserve has started a new cycle of rate cuts.
However, be advised that even within primary uptrends Gold and gold stocks have often consolidated and corrected for several months.
If you missed the recent run, then it is best to be patient, buy value and wait for weakness in the high quality juniors that appear extended. The best time to buy the leaders is during a correction. New opportunities will also emerge. To learn the stocks we own and intend to buy during this weakness that have 3x to 5x potential, consider learning more about our premium service.
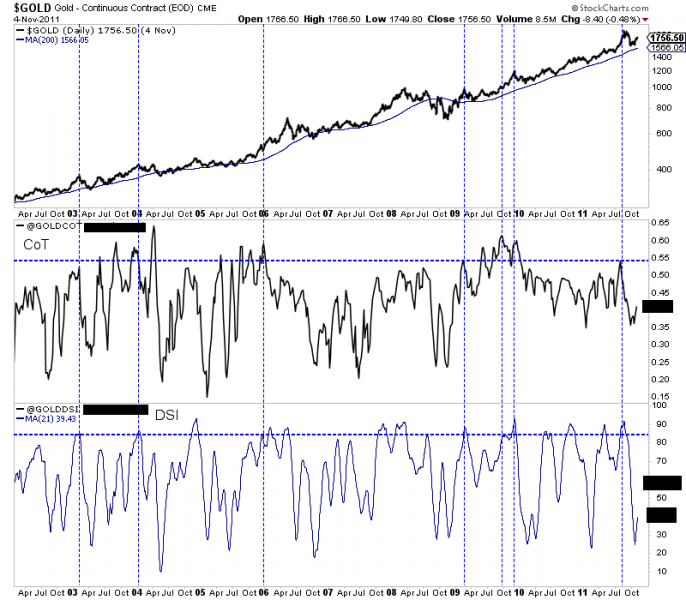
Last week was another strong one for the precious metals sector.
Gold gained a whopping $51/oz or 3.5%. The gold stocks (GDX, GDXJ) advanced by roughly 6%. Silver gained 4%.
Momentum in the sector began to build once Gold surpassed resistance at $1420-$1425/oz. We had noted the lack of resistance from $1425 to $1525-$1550/oz.
Gold has not reached $1550/oz yet but as it inches higher, some technical and sentiment indicators are urging caution.
Gold’s net speculative position of 54% is very close to the peaks of 55% to 60% seen since 2000. It’s possible the commercial hedgers will start covering at some point like they did in 2006 and 2010 but for now we have to assume they won’t if $1550/oz holds as resistance.
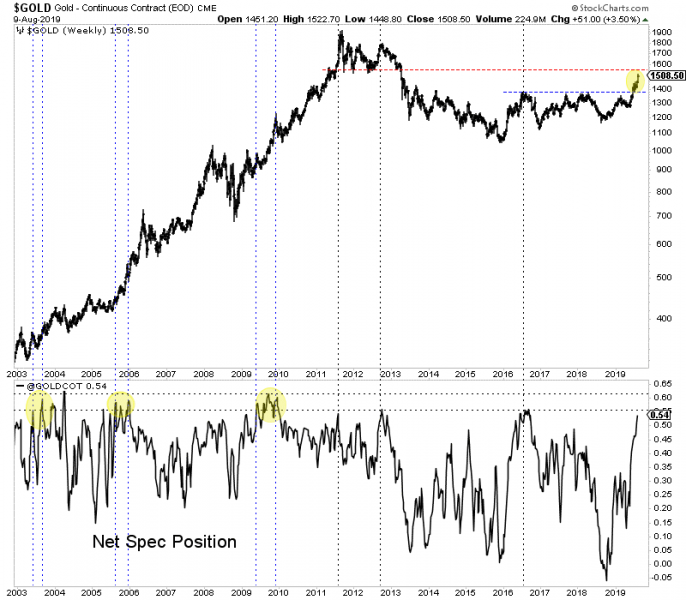
In the next chart we plot Gold’s net speculative position (51%) and the 21-day average of the daily sentiment index (DSI) from 2002 to 2011 (84%).
During that strong 10-year period, those figures of 51% and 84% were reached seven times. Five of those seven times Gold corrected or consolidated for at least a few months.
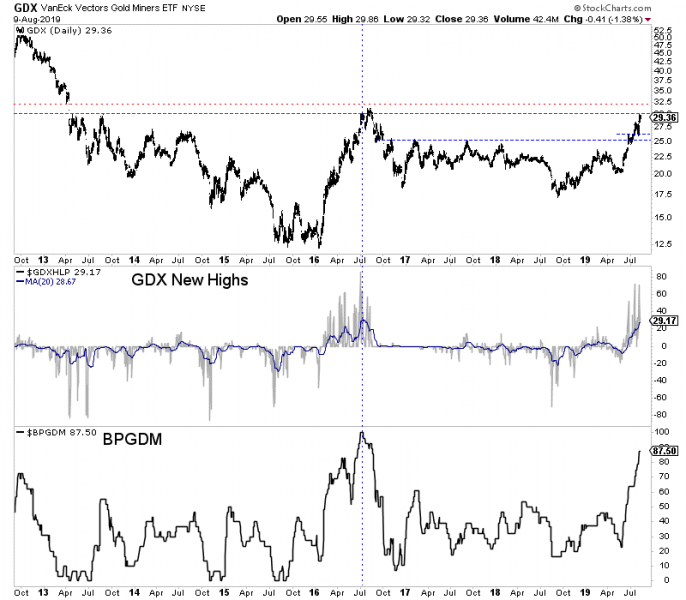
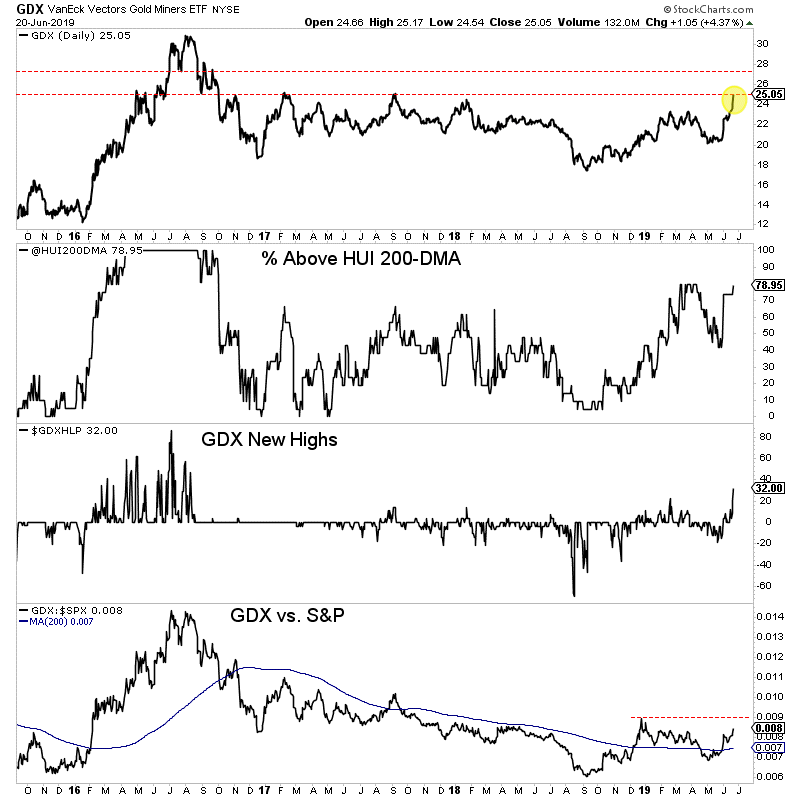
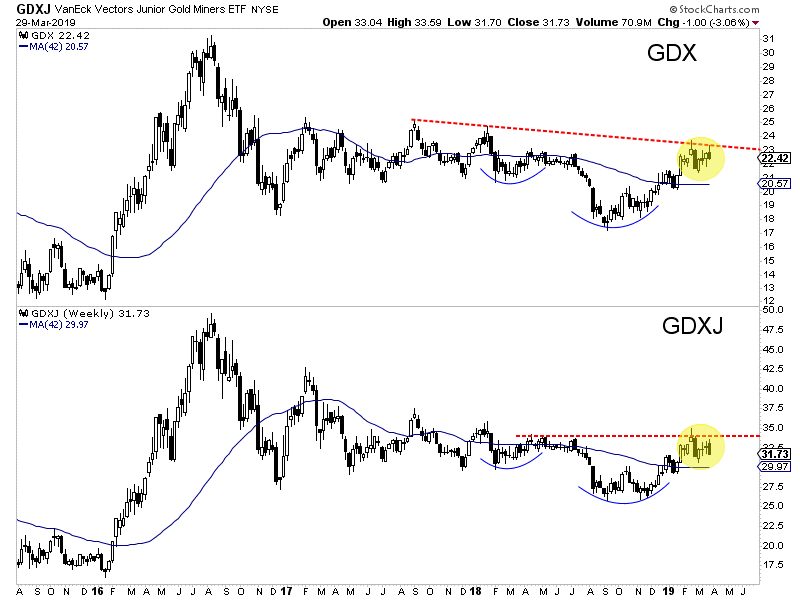
Turning to the gold stocks (and GDX specifically), we find a fairly overbought condition while the market approaches multi-year resistance at $31-$32.
The bullish percentage index (BPGDM) and a 20-day moving average of new highs in GDX are approaching the levels they peaked at in July 2016.
The trend in precious metals is strong and the fundamentals are bullish but there can obviously be corrections and consolidations within strong trends.
Sentiment indicators are becoming a concern and Gold and gold stocks (GDX) are approaching obvious resistance levels at $1550/oz and $31-$32.
This is not the time to be placing aggressive bets on Gold or the senior gold stocks. If there is a sector correction, those areas figure to be hit harder than Silver or junior mining stocks which are not as extended.
If you missed the recent run then it is best to be patient, buy value and wait for weakness in anything that is strong but too extended. New opportunities will emerge. To learn the stocks we own and intend to buy during the next correction that have 3x to 5x potential, consider learning more about our premium service.
By Jordan Roy-Byrne CMT, MFTA
August 14, 2019
After a major trend change, it can be difficult for the majority of investors and market watchers to shift and adjust accordingly to the new trend.
It’s no different in the current case of precious metals which, other than a huge rally in the first half of 2016 have been dead money for the majority of the current decade. Despite the newfound bullish fundamentals and bullish technical action, plenty of worry remains that the breakout in Gold could fail.
Conventional wisdom argues the sector has run too far too fast and needs to correct. Technical and sentiment indicators are showing extremes (but only when judged against recent, bear market years).
While we do not want to outright chase this strength we also don’t want to wait for a big reset that may not materialize.
After grinding around $1420-$1425/oz for five weeks, Gold closed the week near $1500/oz. This suggests it has surpassed resistance at $1425/oz and should continue towards resistance at $1525 to $1550/oz.
Speculators are increasing their exposure, but the net speculative position is not quite yet at an extreme.
Although gold has pushed higher, the gold stocks have remained in a correction which began 11 days ago. So the much anticipated correction or snapback in the miners is already taking place and Thursday’s low could mark the worst of it.
The miners could have more backing and filling ahead but the path of least resistance remains higher. GDX could test $31 and GDXJ could surpass $42.50 as gold establishes another, higher floor.
On the fundamental side, the Fed cut the funds rate down to 2.25% but the market continues to expect more. The 2-year yield closed the week at 1.72%, which implies an additional two rate cuts.
At some point the precious metals sector will endure a sustained correction. That point does not appear to be imminent.
Take advantage of the current pause in gold stocks to buy weakness and look for fresh opportunities and value plays that are not so extended. To learn the stocks we own and intend to buy that have 3x to 5x potential, consider learning more about our premium service.
By Jordan Roy-Byrne CMT, MFTA
August 12, 2019
The precious metals sector appears to have started a correction.
It was roaring higher until natural resistance kicked in and the U.S. Dollar grinded its way higher, towards its 2019 high. Factor in the Fed decision this week and it has created a natural “buy the rumor, sell the news” event.
We cannot know for certain what the Federal Reserve will do or even more importantly, how the market will react. But we can take note of key levels in these markets.
Gold has held above $1400/oz but has been unable to break past resistance at $1420-$1425/oz. A retest of $1385/oz is quite possible and so is a test of $1365/oz.
Silver has outperformed Gold since it broke above its 400-day moving average, which provided strong resistance dating back to the end of 2017.
Silver encountered resistance at $16.60-$16.70/oz and could test initial support at $16.20/oz. Below that is strong support at $15.95/oz.
Turning to the gold stocks, we find a clear setup between support and resistance.
GDX, the ETF for large gold producers has resistance at $28 but good support above $25.00, which was previous resistance for nearly three years. Look for initial support around $26.00.
GDXJ, the ETF for the “senior” junior companies, faces resistance at $40-$41. It has initial support around $37.50 with strong support at $36.00.
Regardless of what the Fed does or says, my expectation is precious metals will test these levels and ultimately hold them. The Fed and global central banks want to ease policy and this figures to be more than a one-off.
Precious metals became overbought and a correction is in order.
Investors who smartly positioned in recent months should continue to hold their winners. If the sector continues to correct then look to be a buyer at the aforementioned support levels.
Look to focus your capital on fresh opportunities and value plays that are not very overbought or extended. To learn the stocks we own and intend to buy on this weakness that have 3x to 5x potential, consider learning more about our premium service.
Jordan Roy-Byrne CMT, MFTA
July 30, 2019
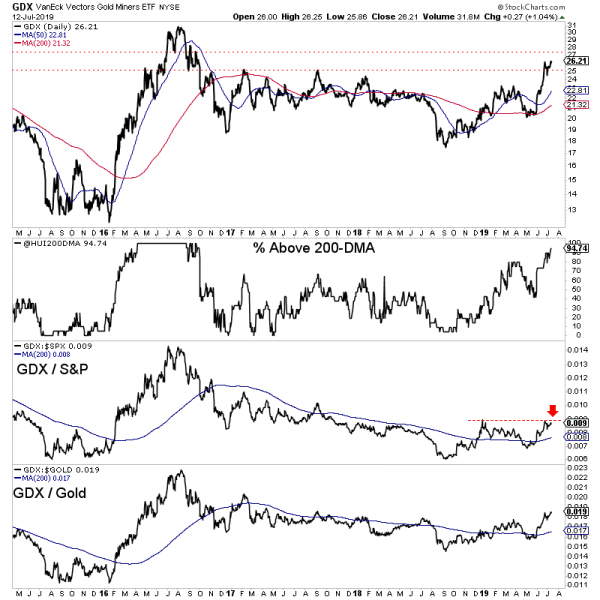
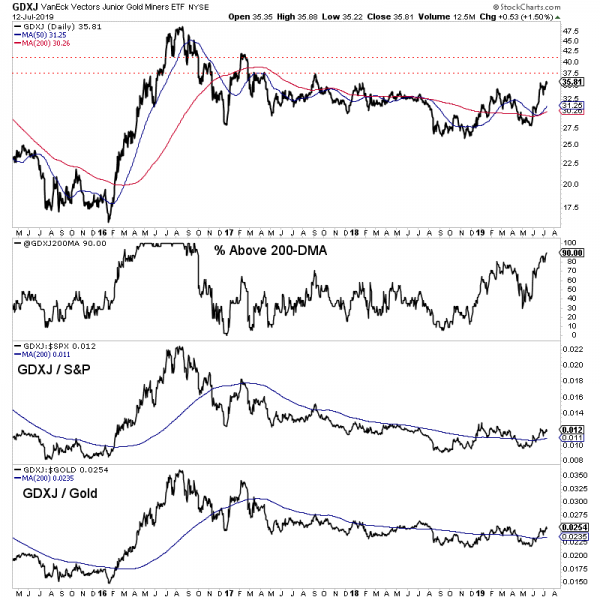
It was a huge week for the gold stocks. GDX gained nearly 7% while GDXJ surged over 10%.
Gold hit $1450/oz after Thursday before selling off Friday. Silver met the same fate on Friday but managed to close the week up over 6% and at a new 52-week high.
Let’s take a look at the current technicals.
Gold closed the week just below $1427/oz. If it remains above $1420-$1425, then it is likely to trend towards $1475/oz, which is the only resistance between $1425 and $1525.
If Gold trades back below $1420 then there is a risk it could test $1380 again.
Silver has taken out resistance at its 400-day moving average in convincing fashion but needs to surpass its February 2019 high. Its next major resistance target is the mid $18s.
Turning to the stocks, we start with GDX which is closing in on its 2016 high. Should Gold trend towards $1475/oz then GDX would likely retest that 2016 high at $31.
Breadth remains strong and so too is GDX’ relative strength. GDX relative to the S&P made a 21-month high and relative to Gold made a 2-year high.
Both GDXJ (juniors) and the HUI (miners only) still have room to go before reaching their 2016 highs.
In fact, both are facing some immediate overhead resistance. For GDXJ which closed at $39.50, that resistance is at $40-$41. For HUI which closed at 211, that resistance is at 220.
The support levels are $36 for GDXJ and 195 for the HUI.
If Gold and Silver maintain current levels, then the immediate bias remains higher and GDX could soon test its 2016 high.
GDXJ and HUI have roughly 30% upside to their 2016 highs. Such a move probably requires a move in Gold to at least $1525/oz.
However, if Friday was the start of a correction then GDX could test $26 and GDXJ could test $36.
For investors in the juniors and seniors, continue to hold winners. If the sector corrects, then look to take advantage of that weakness. If metals and shares maintain these levels then focus your capital on fresh opportunities and value plays that are not overbought or extended. To learn the stocks we own and intend to buy that have 3x to 5x potential, consider learning more about our premium service.
By Jordan Roy-Byrne CMT, MFTA
July 23, 2019
Gold and gold stocks especially continue to shrug off bits and pieces of bad news.
No escalation in the trade war? The selloff lasted one day and the sector rebounded strongly the following day.
Strong headline jobs number? Again, the weakness was a buying opportunity.
This past week there was more.
The June CPI report came in hotter than expected, which could mitigate the degree the Fed eases in the future. Also, bond yields in the US have risen the entire week.
No dice.
Gold closed the week at $1412/oz while the gold stocks closed just inches from new highs on the daily charts.
Turning to the technicals of the gold stocks, we see both underlying and relative strength.
Nearly 95% of the large miners closed above the 200-day moving average. Meanwhile GDX relative to both the S&P 500 and Gold is above a rising 200-day moving average. The GDX to Gold ratio is at a 2-year high while the GDX to S&P 500 ratio is very close to a new 52-week high.
GDXJ is lagging GDX a bit but it is coming around.
90% of the ETF closed above the 200-day moving average. That is the highest reading in nearly three years.
GDXJ relative to the S&P and Gold has turned bullish and is holding above upward sloping 200-day moving averages.
The immediate upside targets for GDX and GDXJ are GDX $27.50 and GDXJ $37.50. The next level of targets would be GDX $30 and GDXJ $41.
Gold has endured some selling in the $1420-$1425/oz range but has remained bid around $1400/oz. A daily close above $1420/oz would remove much of the resistance from here to the low $1500s.
For investors in the juniors and seniors, continue to hold your winners and focus your capital on fresh opportunities and value plays that could move with the next leg higher. To learn which stocks we own and intend to buy that have 3x to 5x potential, consider learning more about our premium service.
Gold closed the month of June and the quarter above $1400/oz, holding the majority of its recent gains. That does not necessitate continued strength but it is a good sign.
The technicals and fundamentals are finally in place for Gold.
It is outperforming all major currencies and the Federal Reserve is weeks away from beginning a new cycle of rate cuts. The U.S. Dollar has lost its uptrend.
The near-term outlook is very strong but if the Federal Reserve cuts rates three or four times and Gold strongly outperforms the stock market then this move can go to $1900/oz.
But let’s focus and the here and now.
This breakout in Gold potentially has quite a bit of room to run.
The weekly chart below shows how there is very little resistance from $1420/oz to the low $1500s. Moreover, there are strong measured upside targets of $1600/oz to $1700/oz.
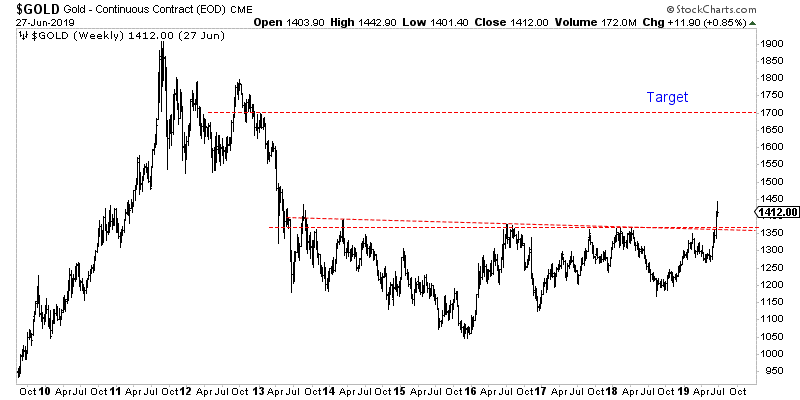
If Gold is going to trend higher towards $1600-$1700/oz, then the gold stocks are going to run much higher.
GDX is trading below $26. A break past $30-$31, would trigger a measured upside target of almost $50.
GDXJ is lagging both Gold and GDX but we know it can catch up quite quickly. First is needs to reach resistance at $50. A clean break past $50 triggers an upside target of ~$83.
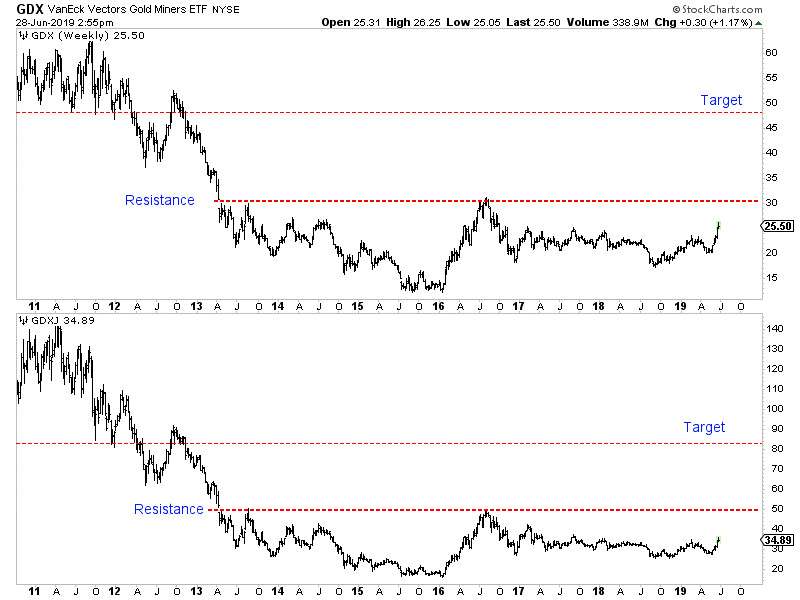
If the Fed does cut rates three or four times and either the greenback cracks more or Gold outperforms the stock market then Gold should be able to reach the $1700/oz target. If only one of those things happen then it still has a good shot to hit $1550/oz.
If the breakout gains traction then the gold stocks, which have strongly outperformed in recent weeks will continue to outperform. That is how these type of moves work.
As we noted last week, be wary of over anticipating a correction. Bull moves tend to remain overbought with overly bullish sentiment. The perfect entry point is behind us.
That being said if Gold does snap back to $1370-$1380/oz for a retest then that would be the time to put more capital work and aggressively so if you missed the last move. To learn which stocks we own and intend to buy that have 3x to 5x potential, consider learning more about our premium service.
Jordan Roy-Byrne CMT, MFTA
July 2, 2019
Gold has finally broken out to the upside.
In Asia trading on Thursday, Gold exploded through the $1360 to $1370 resistance zone and was able to hold the gains throughout the day, closing above $1395/oz.
As we pen this article, Gold has to chance to break $1400/oz by the weekend. The close of the month (and quarter) next week will provide an additional clue as to the sustainability of this strength.
The gold stocks meanwhile have been on an absolute tear. GDX is up 16 of the past 17 trading days and has gained 23% over that period. GDXJ is up 13 of the past 17 sessions and has also gained 23% during that period.
GDX closed right at resistance at $25. It could blow through it and reach a multi-year high at $27 or it could first correct and consolidate around $25.
GDX’s various indicators are very encouraging but not quite at confirmed bull market levels.
Roughly a third of GDX made new highs, which is the highest amount since August 2016. Also, 79% of miners closed above the 200-day moving average. Surpassing 90% would be quite bullish.
The GDX to S&P ratio needs to close above its recent peak to signal sustainable relative strength.
Turning to GDXJ, we see that it is slightly behind GDX in nominal and relative terms. It faces a bit of resistance here around $35 but more resistance at $37.
The percentage of GDXJ stocks above the 200-day moving average and at new highs are at very encouraging levels but need to advance higher to confirm a new bull market.
Assuming Gold maintains current strength without more than a minor retest of previous resistance then we should look for GDX and GDXJ to approach the aforementioned resistance targets. Initially, that means GDX $27 and GDXJ $37.
If the miners were to reach those targets then these various indicators should reach bull market levels at the same time.
The fundamentals are finally in place for precious metals (as we’ve mentioned in recent articles) and that, along with bullish technicians is why we should remain bullish.
Unless Gold loses the breakout gains into the end of the quarter, then I would not anticipate too much of a pullback. Bull moves tend to remain overbought with overly bullish sentiment.
As we noted last week, the gold stocks, junior gold stocks and Silver are ready to explode higher once the breakout move in Gold is confirmed. To learn which stocks we own and intend to buy that have 3x to 5x potential, consider learning more about our premium service.
By Jordan Roy-Byrne CMT, MFTA
June 21, 2019
The more times a level is tested, the weaker it becomes and the more likely it is to break.
Once again, Gold has rallied up to the wall of resistance in the $1350 to $1375 region. Gold has previously tested that wall a handful of times but failed to break through.
This time, Gold is in position to punch through and I will explain why.
First, we can allude to what we already wrote. The more times a level is tested, the more likely it is to break. By virtue of testing resistance again, Gold is already in a better position.
Second, the fundamentals are moving into place.
Specifically, market-based indicators of real interest rates (the fundamental driver for Gold) are falling in anticipation of Fed easing, which is nearly a given at this point.
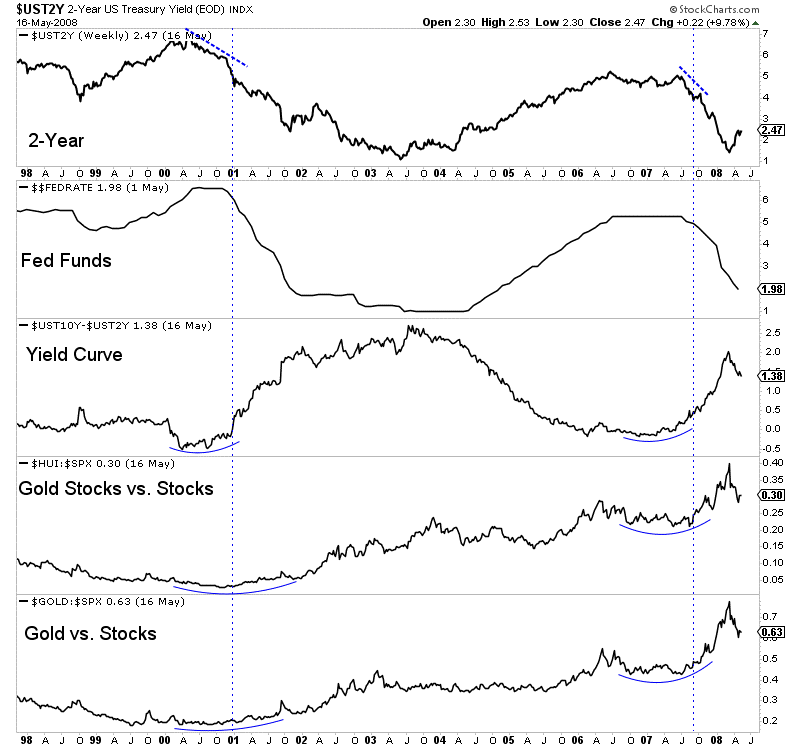
Over the past year, we’ve noted that in 11 of the 13 rate-cut cycles since 1955, gold stocks have averaged a 172% gain from the bottom (usually a few months before) around the first rate cut.
In short, the start of a rate cut cycle is usually very bullish for precious metals. This was not in place in 2017 or 2018 but should be for the second half of 2019.
Third, Gold is in position to break resistance while the US Dollar technically remains in an uptrend but in a weak state. At present, the dollar is not oversold nor does it appear likely to blast higher.
In the summer of 2016, the dollar had already put in a higher low while in late 2017 and early 2018, the dollar broke to new lows but Gold failed to break through.
If the greenback were to weaken and lose its 40-week moving average (which it has held for over a year), it should push Gold past $1400/oz and potentially to $1500/oz.
If the Fed follows through and we get multiple rate hikes before 2020, Gold should break the wall of the resistance. Couple that with a breakdown in the dollar and Gold could reach $1500/oz or even higher.
We anticipate the gold stocks, junior gold stocks and Silver could explode higher once Gold breaks that wall of resistance. To learn which stocks we own and intend to buy that have 3x to 5x potential, consider learning more about our premium service.
Jordan Roy-Byrne, CMT, MFTA
June 14,2019
In recent days the market has moved from expecting a rate cut by January 2020 to now expecting as much as three rate cuts by then. As a result both Gold and gold stocks launched higher, forming a “three white soldiers” bullish reversal pattern.
Last week and in previous writings, we noted the importance of the actual rate cut for Gold and gold stocks. Their performance in both nominal and relative terms usually takes hold after the actual cut.
Now, the question is, is this a rally or a bull market? (There is a difference even though financial media talks about multi-year bull moves as “rallies.”)
The start of a new rate cut cycle hasn’t always produced a bull market in precious metals. For example, after the rate cuts in 1989 and 1995 Gold rallied by only 12% and 18%. Fortunately for us bulls, the current context is totally different but I digress.
The stock market will answer the question.
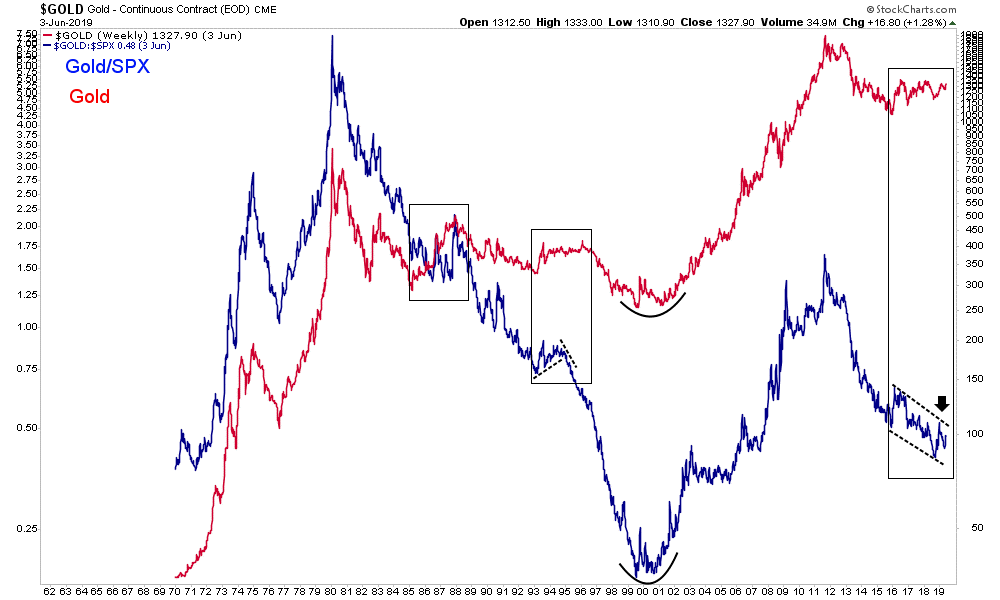
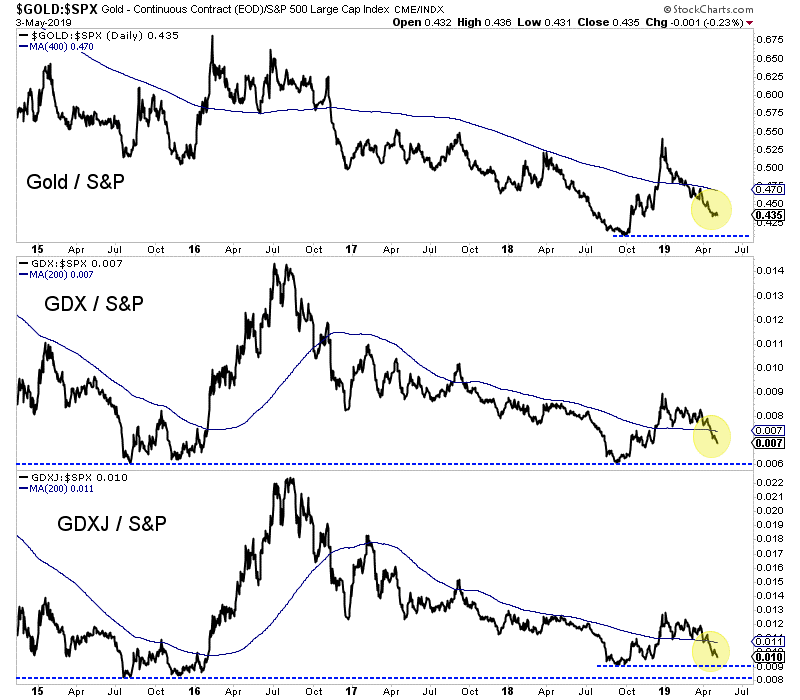
There has never been a real bull market in precious metals without Gold outperforming the stock market (excluding the 1985-1987 period during a 50% decline in the US Dollar).
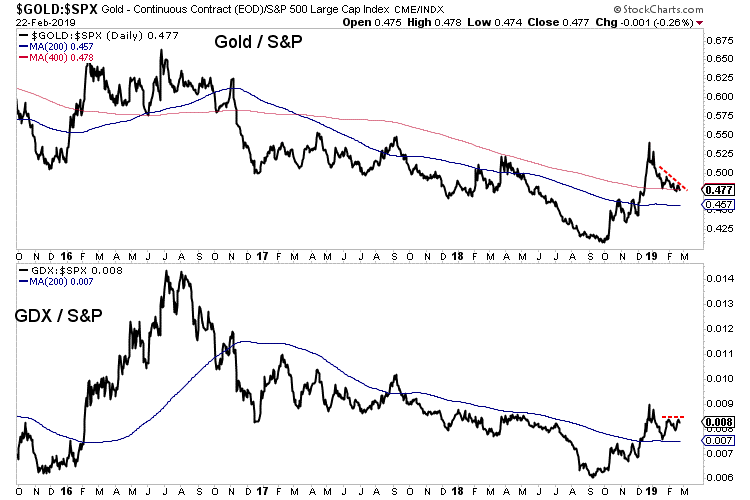
The chart below plots Gold (red) and Gold against the stock market (blue).
As you can see, during the 1970s and 2000s, the Gold/S&P 500 ratio rose alongside Gold. That wasn’t the case in the mid 1980s, the mid 1990s and the past few years.
If the Fed rate cuts and other measures are able to successfully revive the U.S. economy and stock market then Gold isn’t going to receive enough capital inflows to sustain a bull market. On the other hand, if the U.S. economy slips into recession and the stock market experiences a real bear market then Gold should have enough fuel to retest its all time highs.
In the scenario in which the stock market and economy stabilize and recover, Gold can still perform well. Fed rate cuts and the like could push it past $1400/oz and potentially to $1500/oz.
How the Gold/S&P 500 ratio performs will inform us on the sustainability of that move. It will tell us if it’s just a rally or the start of a real bull market.
The gold stocks are nearly as historically cheap and hated as they’ve ever been. They could make quite a run on a clean breakout in Gold through the wall of resistance at $1375/oz, which we think is more likely than not. To learn what stocks we own and intend to buy that have 3x to 5x potential, consider learning more about our premium service.
Jordan Roy-Byrne CMT, MFTA
June 7, 2019
We have written for over a year about the historical importance of the shift in Federal Reserve policy. We’ve noted that over the past 65 years in 11 of 13 rate cut cycles the gold stocks have enjoyed tremendous gains. The historical data shows an average gain of over 170% and median gain of almost 150%.
As of last Tuesday morning, the market showed an 84% chance of a rate cut by the Fed meeting in January 2020. That’s only 8 months away!
With that said, it appears odd that the gold stocks are struggling. The market tends to anticipate and discount potential news in advance. One would expect the gold stocks to begin to “price in” a rate cut, given that the market is nearly convinced a rate cut is on the horizon.
However, the historical data argues otherwise. The median and average bottom around the first rate cut is typically one and two months before that first rate cut.
The likely months for the first rate cut figure to be either September or December. If the Fed cuts rates in September, then the data argues for a bottom in August or late July. If the Fed were to cut in December, then its possible we could see a bottom earlier than a month before.
The timeline for a potential bottom in the gold stocks could line up well with the current technical outlook.
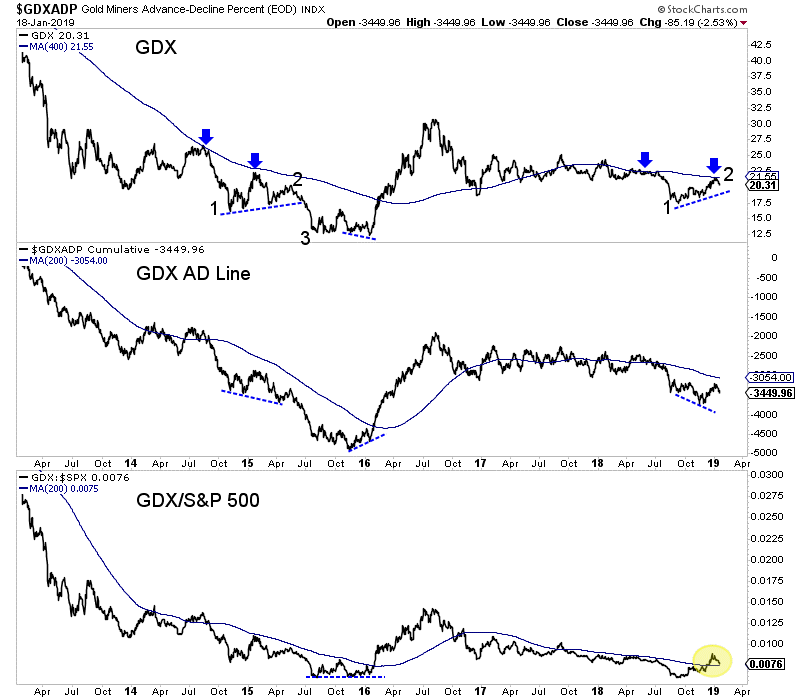
In the chart below we plot GDX along with the percentage of stocks that closed above the 200-day moving average (in the HUI) and the GDX advance decline (AD) line.
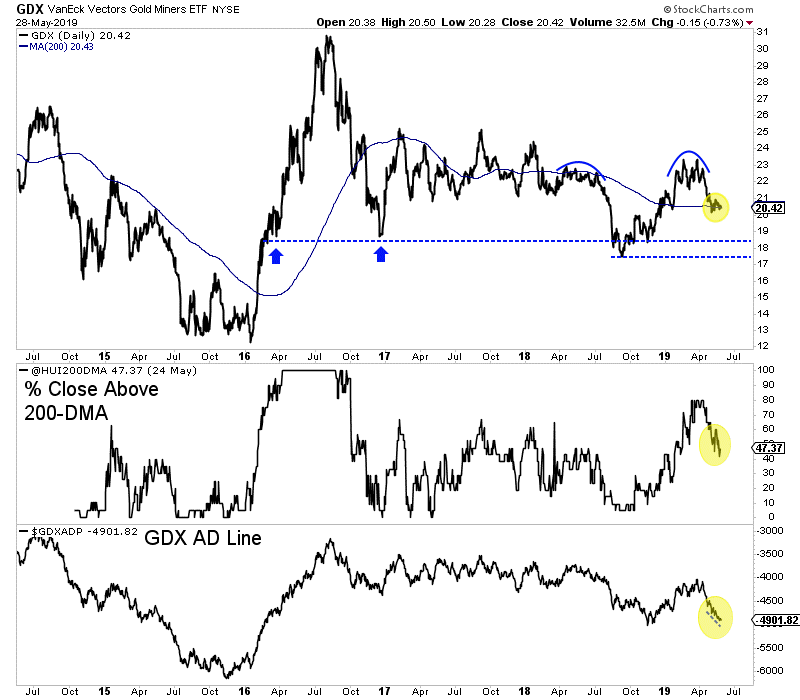
GDX is oversold on a short-term basis but remains weak. It’s AD line (an important breadth indicator) is showing a negative divergence.
Gold stocks are not oversold on a 200-day basis. As you can see, 47% of the HUI (GDX sans royalty companies) closed above the 200-day moving average.
Ultimately, I’d love to see GDX bottom around $18 in August with that aforementioned percentage below 20%. A double bottom prior to a Fed rate cut in September would trigger a strong run into year end.
In any case, the gold stocks could be setting up for a mid summer bottom and one that would be really significant if the Fed cuts rates in September. We continue to look at individual companies that are trading at excellent values and have important upcoming summer catalysts. To learn what stocks we own and intend to buy that have 3x to 5x potential, consider learning more about our premium service.
Jordan Roy-Byrne, CMT, MFTA
June 3, 2019
Several weeks ago we wrote about the downside risk in the gold stocks.
After the various gold stock indices formed distribution-type tops, the subsequent selling has been swift. Miners have plunged through moving averages and short-term breadth indicators quickly reached oversold extremes.
While the gold stocks are oversold, it could be a little while before we can expect a sustained rebound.
We plot GDX below along with the percentage of HUI stocks that closed above the 50-day moving average and 200-day moving average. (The HUI is essentially GDX sans royalty companies).
The breakdown from the rounding top projects down to $19.50 but strong support is unlikely to be found until $17 or the low $18s. Should GDX trade below $19.50 then the percentage of the HUI above the 200-day moving average (currently at 50%) will decrease materially.
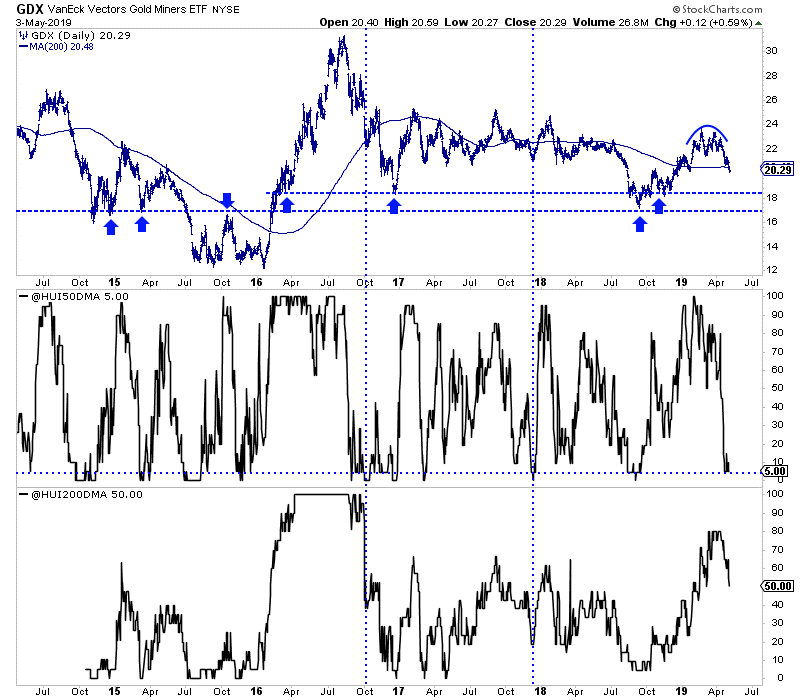
GDXJ, which closed the week at $28.41 has formed a larger distribution top that projects to a measured downside target of $26.50-$27.00. There is a confluence of strong support around $26.00.
Only 33% of GDXJ stocks are trading above the 200-day moving average. GDXJ could be closer to its low than GDX.
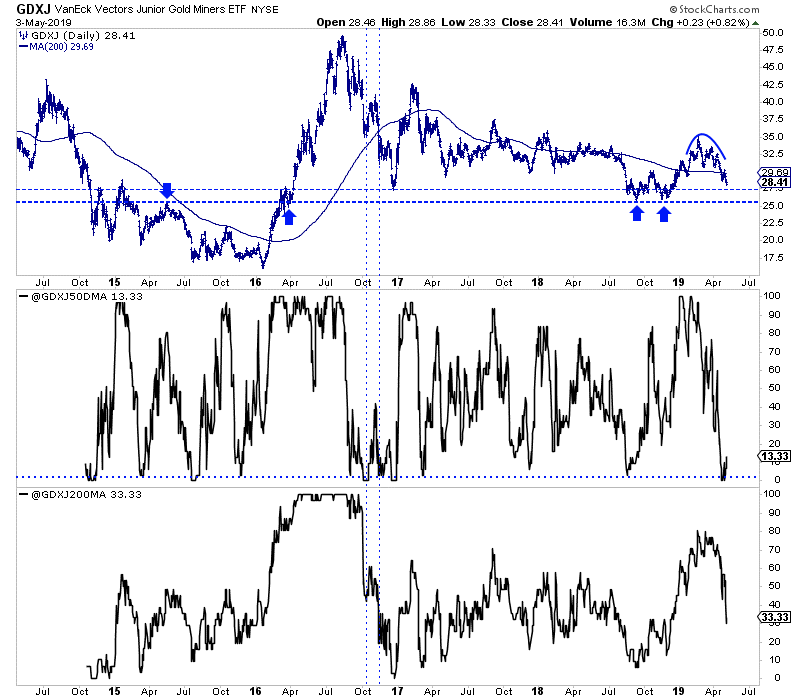
If GDX and GDXJ successfully retest their 2018 lows then their performance in relative terms could inform us on the sustainability of that rebound.
Below we plot Gold, GDX and GDXJ all against the stock market. These charts also have a chance to form double bottoms.
The gold stocks have broken down and have more downside potential until testing strong support levels. We don’t want to fight that breakdown until the market tests strong support amid an extreme oversold condition. That could entail GDX and GDXJ testing their 2018 lows with less than 10%-15% of the stocks trading above their 200-day moving average.
Sentiment indicators for Gold and Silver are trending in the right direction but more selling and lower prices are likely needed before those indicators reach extremes.
As far as fundamentals, there could be some potential bullish developments waiting in the background. If these things come to pass then the gold stocks could be in position to rocket higher after forming a double bottom.
The weeks and months ahead could be an opportune, low risk time to position yourself. We are looking for deep values with catalysts and anything we missed in recent months than can be bought at a discount. To learn what stocks we own and intend to buy that have 3x to 5x potential, consider learning more about our premium service.
By Jordan Roy-Byrne CMT, MFTA
May 7, 2019
As we know, Gold and the US Dollar have an inverse relationship. Gold is priced in US Dollars and the drivers of each are similar (from an inverse point of view). Over long-term periods both trend in the same direction but the magnitude of the moves can vary and be quite different.
The standard inverse relationship has not been a perfect one in recent months or years.
In the chart below we plot Gold, gold stocks and the US Dollar.
We highlight (with vertical lines) the points at which Gold tested the wall of resistance. As you can see, the relationship with the dollar hasn’t been uniform.
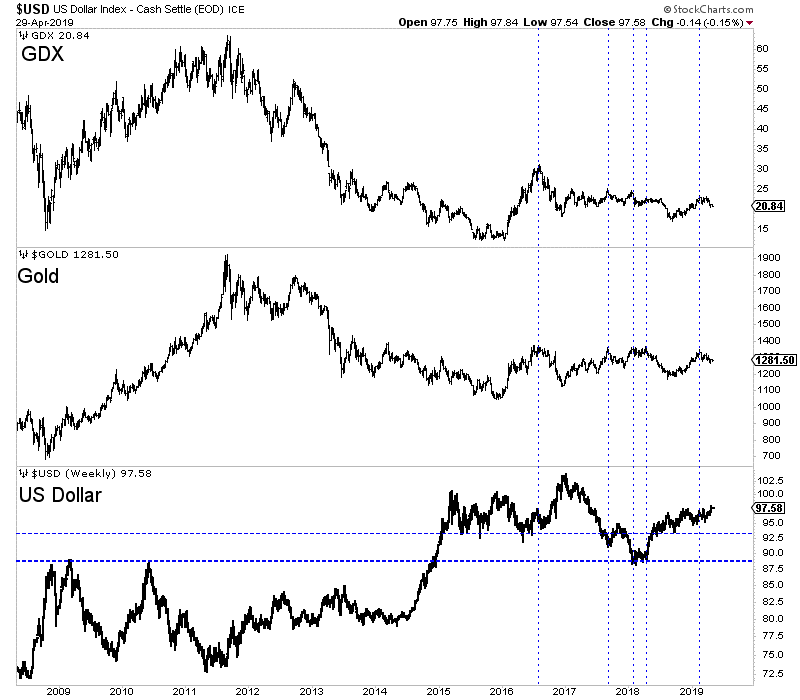
In particular, note what transpired in 2017. The dollar declined sharply and penetrated its 2016 low to the downside yet Gold didn’t make a new high and gold stocks didn’t even come close to their 2016 high.
Recently, the reverse has transpired. The US Dollar has or is breaking out to a new high yet Gold is much closer to its 52-week high rather than its 52-week low.
Gold bulls hope the breakout will reverse course and lead to a big decline. Surely, a big decline would push Gold to a massive breakout. Or would it?
Recall 2017. Gold did not breakout and gold stocks performed even worse. Gold’s fundamentals were not bullish because real interest rates increased throughout 2017. Dollar weakness simply prevented Gold and gold stocks from faring worse.
If the dollar declines again and for similar reasons as in 2017 (global recovery and global risks averted) then we should not expect Gold to breakout. If strength in US stocks and global stocks continues then Gold is not going to breakout regardless of what happens to the US dollar.
If the US Dollar were to continue rising throughout 2019 then it would eventually cause a myriad of problems that would lead to softer policy and Fed rate cuts. Gold may not breakout initially but eventually it would.
The best scenario for Gold would be a dollar decline coupled with a decrease in real interest rates, which would be driven by Fed rate cuts or a consistent rise in inflation as the Fed stands pat.
Keep an eye on the US Dollar over the weeks ahead as its fate could give us a sense of where things are going for the balance of 2019 and then we could assess how Gold may react.
The weeks or months ahead should continue to be an opportune time to position yourself in the Gold sector. We are looking for deep values and anything we missed in recent months that gives us a second chance opportunity. To learn what stocks we own and intend to buy that have 3x to 5x potential, consider learning more about our premium service.
Jordan Roy-Byrne
May 2, 2019
The downside potential in precious metals discussed last week is playing out as Gold and gold stocks have broken down technically.
The global economy appears to be firming and that is evidenced by a sustained rebound in global equity markets.
As a result, the potential for a rate cut which pushed precious metals higher is now unwinding. That has caused the breakdown in precious metals and there is more unwinding to go.
We have trumpeted the need (in precious metals) for a rate cut as a fundamental catalyst for the next bull market. But there is another scenario that plays well for Gold.
Let’s step back for a second and remember that Gold is driven by declining real interest rates and secondarily, a steepening yield curve. Either essentially entails Fed rate cuts or inflation rising faster than short-term rates which in other words equates to rising inflation expectations.
In the chart below we plot Gold along with a number of fundamental indicators for Gold. These include the real 5-year TIPS yield (as calculated from the TIPS market), the real 5-year yield, the real fed funds rate and the yield curve (upside down).
If the Federal Reserve is not cutting rates in the next 12 months then the best case scenario for Gold would be a bump in inflation that leads to a material decline in real interest rates and a steepening of the yield curve.
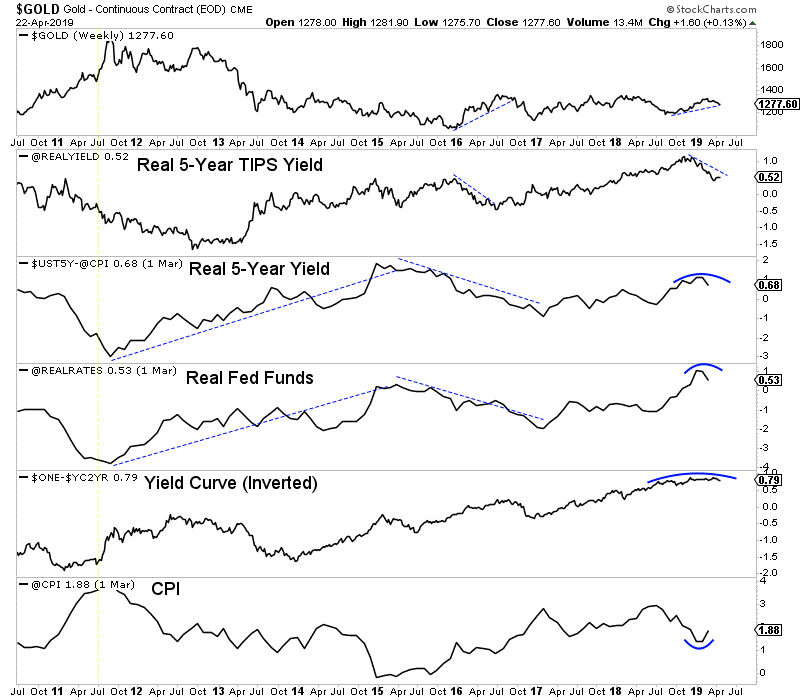
The CPI is rebounding and if it were to reach 3% while the Fed stands pat, that would equate to a real Fed Funds rate of -1.6%. That would imply a decline of -2.1% from here.
Gold would definitely rally in that scenario but for now, the market is focused on the declining expectations for a rate cut in the next 12 months. Until the unwinding of that trade is complete, Gold is likely to trade lower.
However, the point is that we should not be bearish for long if inflation indicators and inflation expectations increase in a sustained fashion. That equates to falling real interest rates which is bullish for Gold.
The CPI may ultimately need to exceed 3% or even 4% to spring a huge breakout in Gold, but a return to 3% with the Fed remaining paused could push Gold back to the wall of resistance.
The gold stocks are extremely oversold on a short-term basis and a rally should begin within the next day or two. That being said, the path of least resistance is lower until the market shifts its focus from a rate cut to rising inflation. That will take some time.
The months ahead could be an especially opportune time to position yourself in this sector. We will be looking for anything we missed in recent months that gives us a second chance opportunity. To learn what stocks we own and intend to buy that have 3x to 5x potential, consider learning more about our premium service.
By Jordan Roy-Byrne CMT, MFTA
April 25, 2019
The big picture fundamentals for precious metals have been trending more bullish in recent months as expectations for the Federal Reserve went from a few rate hikes in 2019 to an expectation of a rate cut within the next 12 months. That is aligned with the peak in the 2-year yield and growing concerns over slowing growth globally.
However, that doesn’t preclude a temporary improvement in the economy and markets. China is stimulating again. Global equities have recovered and the S&P 500 is on the cusp of a new high.
All of this means a Fed rate cut in the next 12 months is less likely. Not unlikely but less likely.
Precious Metals have been trading on Fed rate expectations for a while. Higher highs in equities and some stabilization in the economy will chip away at expectations for a rate cut and as a result, some bearish price action is showing up in the precious metals sector.
Below we plot the daily line charts of the gold and silver stocks.
They have formed bearish patterns with the silver stocks (SIL) leading to the downside followed by GDXJ while GDX has held up the best. These charts need to hold their early March low to avoid a break to the downside.
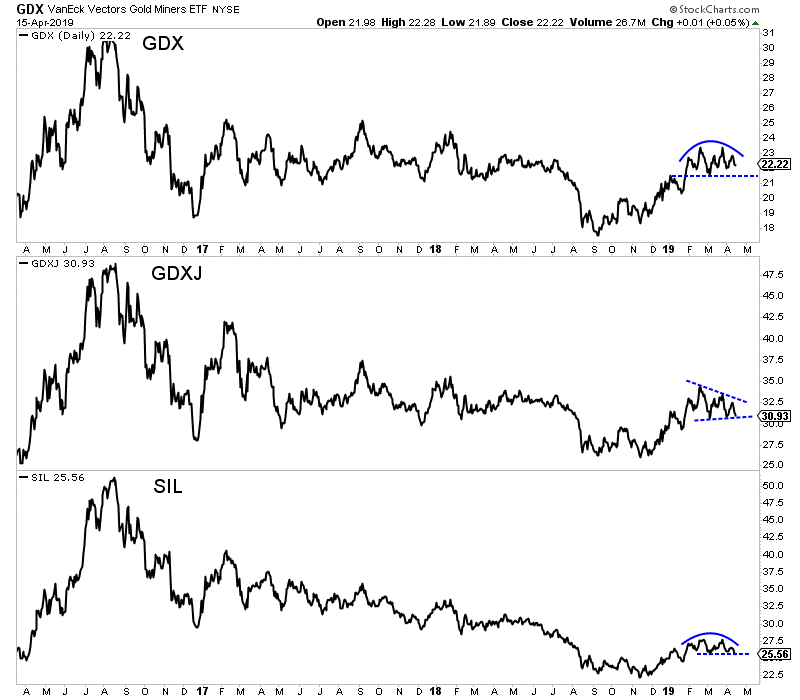
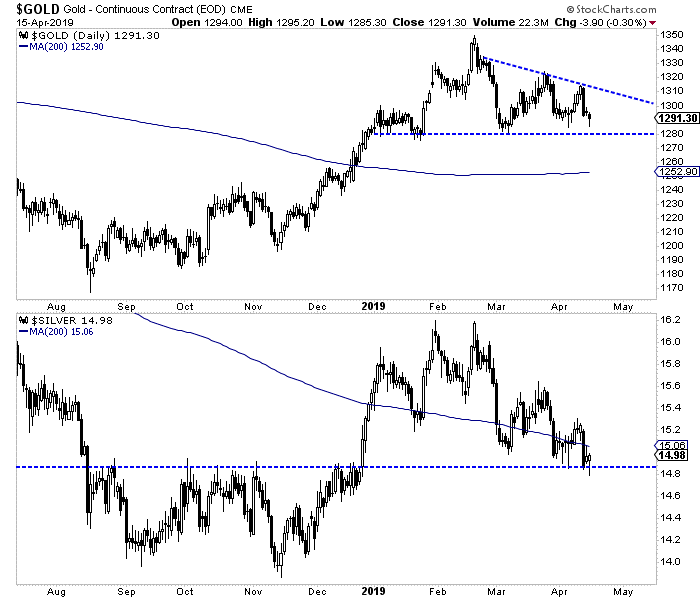
Turning to the metals, we find Silver has been leading the entire complex lower. It has found temporary support just below $15.00.
Meanwhile, Gold has formed a bearish pattern and if it loses support at $1280 will likely dump to its 200-day moving average at $1253 and probably lower.
Circling back to the gold stocks, I do want to note the weekly candle charts because they illustrate the big picture prognosis.
We can see that for GDX and GDXJ the critical levels are clearly $23 and $34. The gold stocks have failed to break resistance for now but it’s clear that a weekly close above those levels would signal a bull market.
If the miners and Gold break lower then it’s no reason to throw in the towel. We would not be surprised if the next low the miners make could be the last one before a bull run begins.
In the meantime, the question is will it be a higher low or will the miners form huge double bottoms at $18 and $26?
The weeks and months ahead should be an especially opportune time to position yourself in this sector. We will be looking for anything we missed in recent months that gives us a second chance opportunity. To learn what stocks we own and intend to buy that have 3x to 5x potential, consider learning more about our premium service.
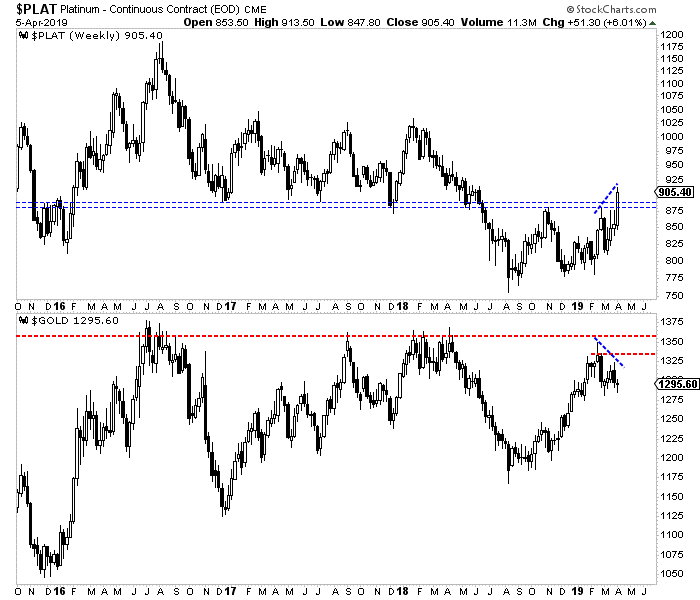
There are more than a handful of things I can cite as leading indicators for the Gold price.
Ratios such as Gold against the stock market and Gold against foreign currencies are generally good leading indicators. The gold stocks and Silver can function as leading indicators at times.
The yield curve and bonds can also be leading indicators.
But there is one thing I’ve never mentioned, nor written about. It makes sense in the current context though. That’s Platinum.
Platinum has a brief but clear history as a leading indicator for Gold.
Platinum outperformed and led Gold higher immediately after the two most recent major lows: 1985 and 1999-2001.
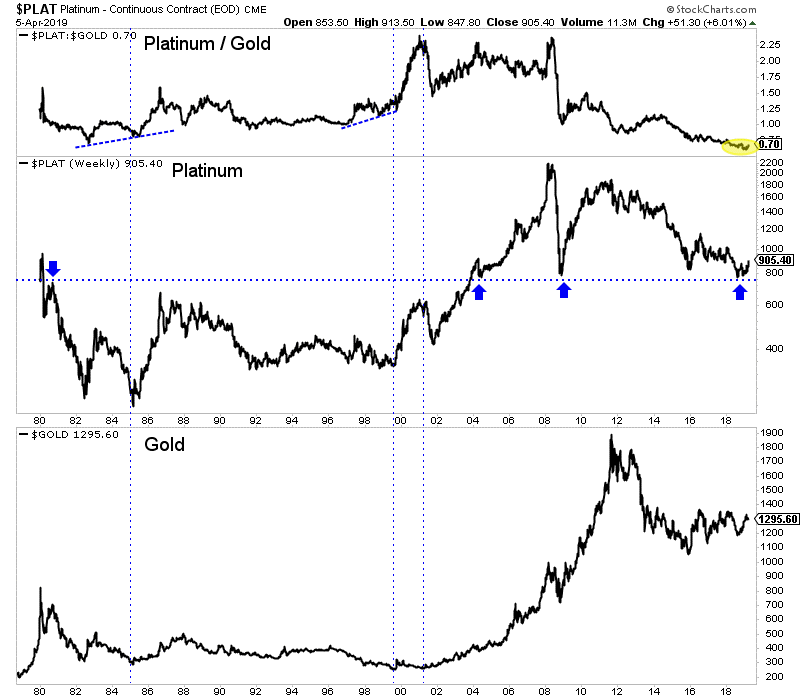
We also want to note the 1966-1968 period when Platinum tripled in price. Silver doubled and Gold of course was still fixed in price. In any event, Platinum’s huge move in the late 1960s was a leading indicator for Gold’s forthcoming surge.
Since the February highs Platinum has made a higher high while Gold has corrected. Platinum looks like it has a reasonable shot to make a new 52-week high this year while Gold would need to fight through the wall of resistance to make a new 52-week high.
According to BMG Group, a study by Wainright Economics showed that Platinum is the leading indicator of inflation. While Gold and Silver lead by a year, Platinum leads by 16 months.
Whatever the reason, history is clear. Around major bottoms in precious metals, Platinum tends to outperform and lead Gold. Since February Platinum has strongly outperformed Gold while registering an important positive divergence.
We will certainly keep abreast of the other leading indicators such as relative performance of the miners, Fed policy, a steepening yield curve and precious metals performance against the stock market. We will also keep an eye on Platinum as continued outperformance would be a strongly bullish signal for Gold for 2020 and beyond.
The weeks and months ahead should continue to be an especially opportune time to position yourself in this sector. To learn what stocks we are buying and have 3x to 5x potential, consider learning more about our premium service.
April 11, 2019
Jordan Roy-Byrne
Stop me if you’ve heard this before. Precious Metals disappointed again.
The miners were leading the metals but the metals broke down from bear flag patterns and that took the miners lower, suggesting an interim top is in place.
The technicals suggest weakness could be ahead for the sector but the fundamentals are finally turning bullish.
Before we get to fundamentals, let’s look at the technicals. The weekly candle chart of GDX and GDXJ is below.
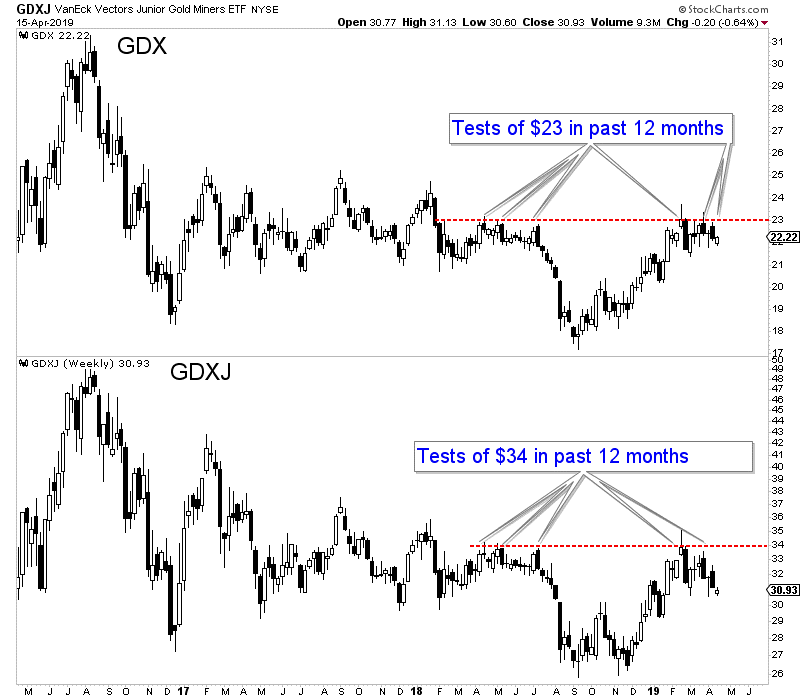
After last week’s failure to break weekly resistance, GDX now has resistance at $23 and GDXJ has resistance at $34.
The near-term trend is probably lower but if the Fed is going to cut rates later this year, I’d expect the miners to eventually make a higher low which could also look like the right shoulder of an irregular head and shoulders bottoming pattern.
As we noted last week, it wasn’t until after the first rate cut (in the previous two occurrences) that precious metals began to outperform.
The chart below shows the pattern that leads to strong performance in gold stocks. The 2-year yield starts to decline, the Fed pauses, the yield curve steepens, the Fed cuts and then gold stocks perform.
With the current context and history, we can make the case that gold stocks and Gold will not officially move into a bull market until the Fed makes its first rate cut. Fed funds futures are now essentially discounting a rate cut by December and showing nearly a 30% chance of two rate cuts by January 2020.
Bonds are overbought (and yields are oversold) and so these markets could see a counter trend move which would align with weakness in precious metals.
However, precious metals bulls should not be dissuaded by weakness as a rate cut is likely coming within the next 12 months and probably sooner. The weeks and months ahead could prove to be an especially opportune time to position in advance of the first cut and a confirmed new bull market in gold stocks. To learn what stocks we are buying and think have 3x to 5x potential, consider learning more about our premium service.
April 3, 2019
Jordan Roy-Byrne
Since last spring we’ve written over and over again about a Fed rate cut being the catalyst for a bull move in gold stocks.
The history is almost bulletproof. Many lows in gold stocks over the past 60 years coincided with the end of rate hikes.
At present the Federal Reserve is in pause mode and the market is on the cusp of pricing in a rate cut. Friday, Fed funds futures showed a 56% chance of a rate cut by January 2020.
However, precious metals have yet to make new 52-week highs. The gold stocks (GDX & GDXJ) are much closer to doing so than the metals.
Simply waiting for the Fed to cut rates risks missing out on some upside. As market timers, we have to anticipate it.
Is there a leading indicator for the Fed moving from a pause to a cut?
Take a look at the chart below in which we plot data from the last two instances of new rate cut cycles: 2001 and 2007. The vertical lines highlight the Fed’s first cut in those two cycles.
There are several observations to make.
First, Gold and gold stock relative performance accelerated after the rate hikes.
Second, the 10-year and 2-year yield spread began to steepen prior to that outperformance and prior to the rate cuts. And that’s because the 2-year yield, which is a proxy for the Fed funds rate, was trending lower in advance of the first cut.
In short, the sharp decline in the 2-year yield preceded the Fed moving from a pause to a cut. Prior to both the 2001 and 2007 cuts, the 2-year yield had declined by over 1%.
How does this compare to today?
The yield curve has yet to steepen and precious metals have not begun or confirmed outperformance against the stock market.
However, the positive sign for precious metals is the 2-year yield has already declined from nearly 3% down to 2.24% as we pen this.
Every cycle is different and each has its own nuances but we cannot ignore the current decline in the 2-year yield. The closer it gets to 2.00%, the more the market will price in a rate cut.
With its decline to 2.24% today (Monday) the market has now priced in a 73% chance of a rate cut by January 2020. Not surprisingly, precious metals are trading higher.
If the 2-year yield continues to decline then precious metals (and gold stocks especially) should build more and more evidence that they are in a new bull market. To learn what stocks we are buying and think have 3x to 5x potential, consider learning more about our premium service.
In recent weeks we noted the bullish outlook for the stock market.
Friday the S&P 500 as well as ACWX (global equity ETF ex US stocks) closed above resistance and made higher highs.
Not surprisingly, as US and global equities have avoided a bear market (for the time being), precious metals have weakened. It’s not a surprise that as Gold failed to breakout both the S&P 500 and global equities (ACWX) held their 200-day moving averages and then made a higher high.
The very recent underperformance in Gold and precious metals is better illustrated in the ratio charts below.
Gold against stocks made a very strong move in the fourth quarter but instead of digesting or consolidating that move, the ratios have steadily declined. The same could be said for the GDX ratios as they have formed rounding tops.
The implication is obviously not favorable for precious metals because outperformance of the stock market is a necessity for a bull market and especially so, given the current context.
That being said, one positive for the precious metals complex is the miners are outperforming the metals. Last week the GDX to Gold ratio hit a seven and a half month high.
Another positive is breadth has not deteriorated yet. The GDX advance decline line is only a tiny bit off the recent high and 73% of the HUI and 65% of GDXJ are above the 200-day moving averages.
Ultimately and to continue to beat the dead horse, a bull market in precious metals cannot begin without outperformance against the stock market. That will likely coincide with the Fed moving from pause mode to rate cuts.
The immediate outlook is bullish for stocks and therefore do not expect Gold to breakout or begin a bull market. It’s unclear if renewed stock market strength will lead to a larger topping pattern or if its an indication that growth will stabilize for the rest of 2019.
Regardless, until Gold outperforms stocks and the Fed is ready to cut, we are focused on the companies that can perform without a rising Gold price. To learn which juniors have 3x to 5x potential over the next 12 to 18 months, consider learning more about our premium service.
It’s important to understand Gold’s fundamentals as it will help us confirm a new bull market.
To this point, Gold’s rallies have failed to make higher highs and higher lows because, although there has been improvement in fundamentals, the fundamentals have not turned bullish yet.
The technical trigger will be Gold and gold stock outperformance of the stock market which will likely lead to the fundamental catalyst of Fed rate cuts. The start of rate cuts will indicate declining real interest rates which is the key driver of bull markets in Gold.
With that said, here are some things that do not impact the price of Gold.
Geopolitics
This was borne out of the 1970s because geopolitical developments then did impact Gold. They affected Oil prices which impacts inflation. Random geopolitical events have no immediate impact on Gold unless they directly impact the fundamentals. Unless an event has immediate and sustained consequences for energy prices, it should be ignored and deemed short-term noise.
Central Bank Buying
This sounds impressive and important. Central Banks are powerful entities who help manage economies. Surely, they know something? According to Bloomberg, Central Banks are buying Gold at the fastest clip in almost 50 years!
The truth is Central Banks don’t have any inside information and their buying or selling cannot be used for market timing purposes. The chart below shows that the 2001-2011 run began with record central bank selling. Central Banks have been consistent buyers since the 2011 peak. If anything at all, the information is a contrary indicator.
Supply & Demand
Gold is not like the other commodities. It acts far more like a currency as its drivers are inflation, interest rates and the U.S. Dollar.
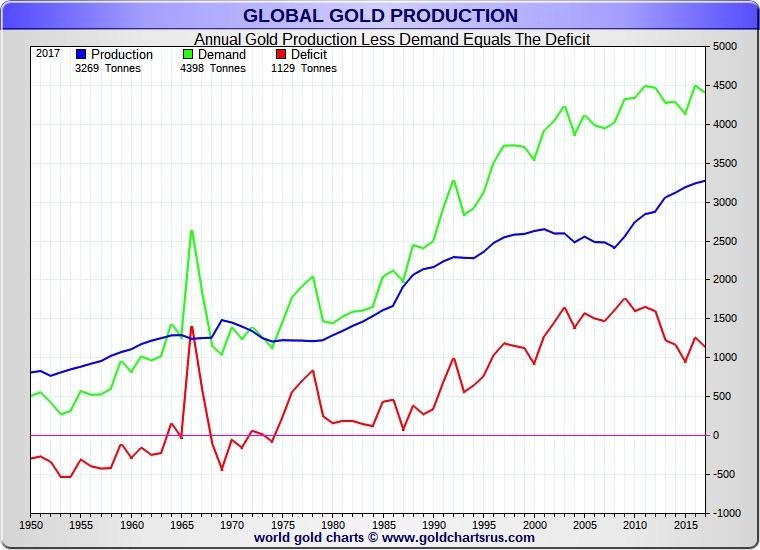
The price of Gold doesn’t respond to changes in supply and demand. The chart below from Nick Laird shows that demand actually surged in the 1980s and 1990s, creating a rising deficit throughout the late 1980s and entire 1990s. But that was a time when the price trended sideways to lower.
Part of the reason for that is jewelry demand is the largest component of Gold demand and it trends inversely to the Gold price.
It’s also important to note, Gold isn’t consumed like other commodities. Its supply grows in perpetuity. This is another reason its not impacted by supply and demand.
It’s also another reason why “Peak Gold” if true, will not impact the Gold price.
To sum things up, its ultimately inflation and interest rates which drive Gold because they drive real interest rates. Investment demand usually mirrors the trend in real interest rates and it impacts the price trend more than any other form of demand.
Other factors such as geopolitics, jewelry demand, Central Bank buying, Peak Gold and physical demand (which, if you read most gold bugs is always red hot) don’t impact the primary trend in the Gold price.
While Peak Gold or production difficulties do not affect the Gold price, they are hugely bullish for the companies that are making high margin discoveries or adding value to high margin deposits. Capital is flowing to the companies that are making these discoveries regardless of the trend in metals prices. When Gold fundamentals turn bullish, that is when massive amounts of capital will flow into juniors, creating a historic bull market. To learn which juniors have 3x to 5x potential over the next 12 to 18 months, consider learning more about our premium service.
The recent rally showed quite a bit of promise.
Gold stocks surged past their long-term moving averages while breadth indicators surpassed all prior bear market peaks (excluding 2016). 71% of the HUI and 81% of GDXJ closed above the 200-day moving average.
GDX and GDXJ looked to be on their way to $25 and $37, with Gold approaching $1360/oz and those breadth figures on the way to hitting 90%.
However, the stock market rebound pushed past its initial resistance and precious metals reversed course yet again before hitting those targets.
Other than 1985-1987 there has never been a bull market in precious metals without their simultaneous outperformance of the stock market.
Gold stocks and Gold especially have trended lower against the stock market since the end of December. The price action suggests this relative weakness should continue over the days and weeks ahead. If the ratios in the chart below lose the 200-day moving average then the next strong support becomes the 2018 autumn lows.
It was also disappointing that Gold peaked prior to touching $1360/oz. This leaves a noticeable lower high on the chart.
Meanwhile, Silver did not confirm Gold’s rise in February. It formed a double top as twice it failed at a confluence of resistance at $16.00/oz.
Turning to the gold stocks, we find the price action of the past two weeks is similar to the peaks in summer 2017 and January 2018.
February 2019 figures to mark at least an interim peak in precious metals. The next key support for Gold and the gold stocks are the 200-day moving averages.
If the gold stocks can maintain recent breadth gains then the 200-day moving averages could mark an important low within a fledgling uptrend. If not, then a retest of the 2018 lows (especially in the gold stocks and Silver) becomes a stronger possibility.
As we noted last week, the near-term outlook for the stock market is bullish and in the current context that is negative for precious metals which cannot breakout or begin a bull market until the Fed turns from a pause to rate cuts.
Plenty of values remain in the mining equities and we should see more come about as spring beckons. To learn which juniors have 3x and 5x potential over the next 12-18 months, consider learning more about our premium service.
Back in 2013 I recall having a bearish view on the stock market due to extremely bullish sentiment readings. The market completely ignored that, made a major breakout through 13 year resistance and continued running for years.
Lesson learned.
Turning to Gold, we find something similar during major breakouts in 2005, 2007 and 2009. In the chart below we plot Gold along with its net speculative position (as a percentage of open interest) and the widely followed daily sentiment index.
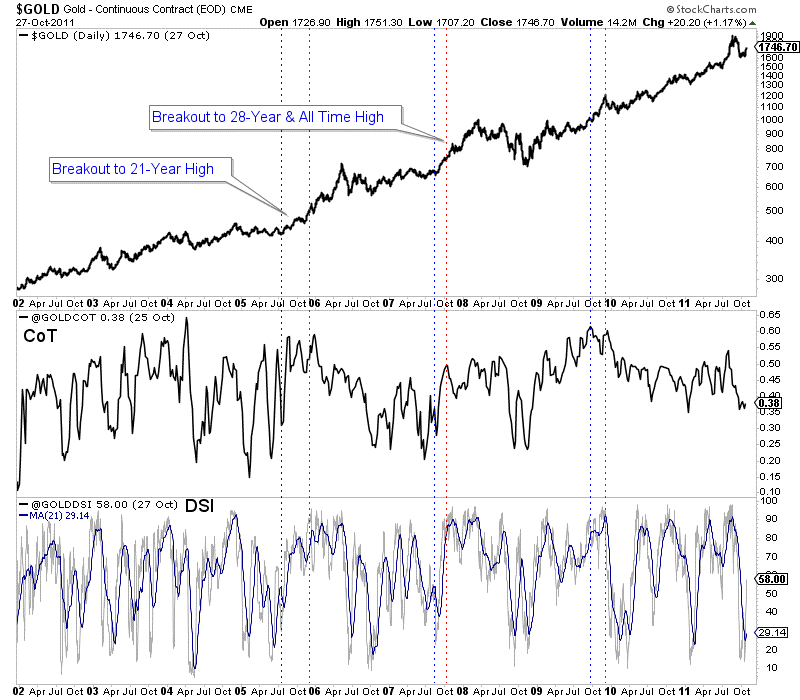
In August 2005 and the start of 2006, the net speculative position in Gold reached (excluding 2004) what were the highest levels since the start of the data in 1987.
In late 2007, the net speculative position was not at an extreme but the daily sentiment index spent quite a bit of time around 90% bulls immediately prior to Gold breaking out to a new all time high.
Both the net speculative position and daily sentiment index were very elevated in the fall of 2009, immediately prior to Gold breaking out above its 2008 peak. The net speculative position then was at its second highest level since 1987.
As of February 5, when the Gold price closed at $1319/oz, the net speculative position in Gold was 27% of open interest. Gold gained $30/oz since then but that is well below the 55%-60% peak levels seen in 2016, 2012, 2009 and 2004-2006.
While that is encouraging, history shows that if and when Gold breaks its resistance ($1375-$1400/oz) sentiment indicators figure to be close to bullish extremes. When a market is coming out of a bad bear market or on the cusp of a multi-year breakout, bullish sentiment isn’t necessarily bearish.
In fact, a market that cannot register bullish sentiment extremes is one that may not be strong enough to breakout.
Circling back to the present, the one thing that can prevent Gold from breaking out is renewed underperformance against the stock market. In the chart below we plot Gold and GDX against the S&P 500.
Precious metals stopped outperforming the stock market in late December and the Gold to S&P 500 ratio appears weak and likely to weaken further.
The S&P 500 recently cleared its moving average resistance and its advance decline line hit a new all time high. These things suggest higher prices in the near future and that, rather than bullish sentiment would provide resistance to Gold over the next few months.
Although Gold will not break resistance in that scenario, we should keep an eye on the gold stocks which have shown improving breadth and relative strength. Plenty of great values remain and there is still plenty of time to position yourself to take advantage. If a huge breakout is coming later in the year then the next few months may be your last chance. To learn what stocks we are buying and have 3x to 5x potential consider learning more about our premium service.
Roughly one year ago and prior to that we observed that the gold stocks could be following the recovery template from what we deemed a “mega bear market.”
We define that as a bear market that is over two and a half years in time and over 80% in price. It cuts both ways.
The gold stocks from 2011 to January 2016 had declined more than 80% and for more than four years. It was a textbook mega bear market.
The sharp recovery in 2016 quickly faded and left us wondering if there was a historical comparison.
Turns out, there are three strong and relevant comparisons.
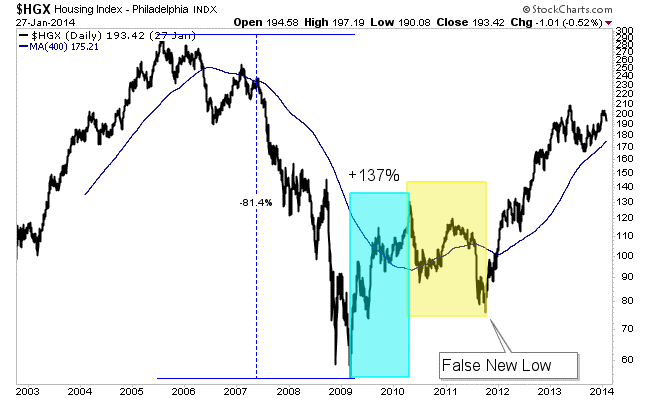
The housing sector declined 81% from its peak in 2005 to the market bottom in March 2009. Then it rebounded 137% before correcting 42% over 18 months. The correction ended with a false new low.
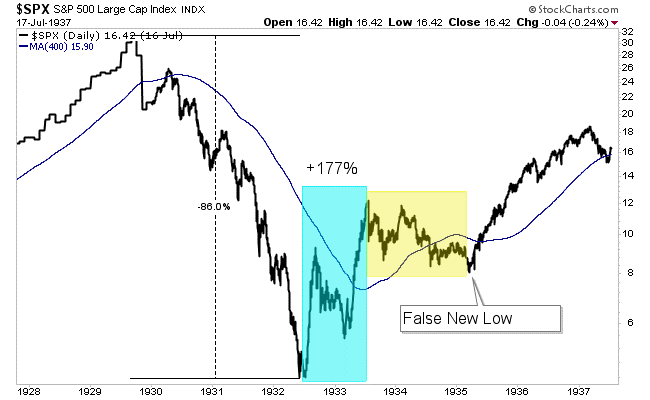
The S&P 500 crashed nearly 90% over a nearly three year period. Then it rebounded 177% before correcting for 20 months. That correction also ended in a false new low.
Thailand from 1994 through 2000 is quite similar to the gold stocks from 2011 through 2016. Before its 200% move higher from 2002 through 2003, Thailand corrected 54% over a 2-year and 5-month period.
Note that its final low at the end of 2001 could have been a false new low if not for the initial sharp correction down to L1.
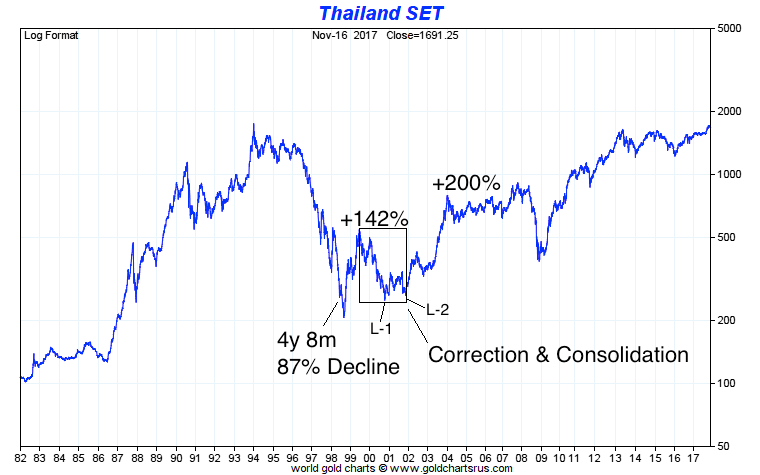
The template for a recovery from a mega bear market is as follows.
Following the bear market low, a sharp rally begins that lasts only six to twelve months. Then the market endures a significant correction that lasts a minimum of 18 months and ends with a breakdown to new lows (which ends up being a false move).
Then the major wave higher begins.
Here is the data on those three examples, another one (Mortgage sector) and the gold stocks (GDX).
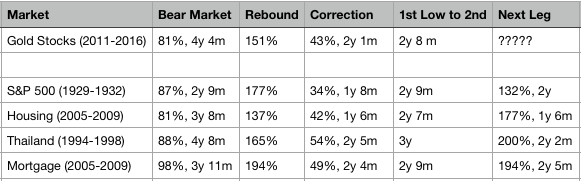
Note how the time between the bear market bottom and the correction low (for the gold stocks) is almost identical to three of the four examples. Also, note how the second leg higher surpassed the initial rebound in each example (ex S&P 500).
Here is how GDX stacks up (visually) with the others. Its rebound (and potentially second leg higher) began after the false breakdown in September.
Last week we asked the question whether gold stocks would correct or consolidate in a bullish fashion. The evidence now favors a bullish consolidation. As a result, we are looking at potential near-term upside targets of $1350-$1360 for Gold, $25 for GDX and $37 for GDXJ.
The short-term trend is healthy and this historical comparison is table-pounding bullish. We’ve been increasing our exposure and will continue to do so. Plenty of great values remain and there is time to position yourself to take advantage. To learn what stocks we are buying and think have 3x to 5x potential consider learning more about our premium service.
February 20, 2019
by Jordan Roy-Byrne
Gold stocks have to do more to confirm they are in a new bull market.
Sure, they’ve surged above key moving average resistance and breadth has improved.
However, the gold stocks have not yet broken the pattern of lower highs and breadth, while improved, is not at bull market levels yet. Let’s review where things currently stand.
In recent weeks GDX and GDXJ surged above the critical 400-day moving average which has been an excellent indicator of the primary trend dating back to 2012. That’s positive and hasn’t happened since the summer of 2017.
Moving forward, I see two plausible scenarios for the gold stocks.
They are either going to build a bullish consolidation (as I’ve sketched out below) or they will have a longer and deeper retracement which could lead to a test of the 200-day moving averages (not shown) near $20.50 for GDX and $30 for GDXJ.
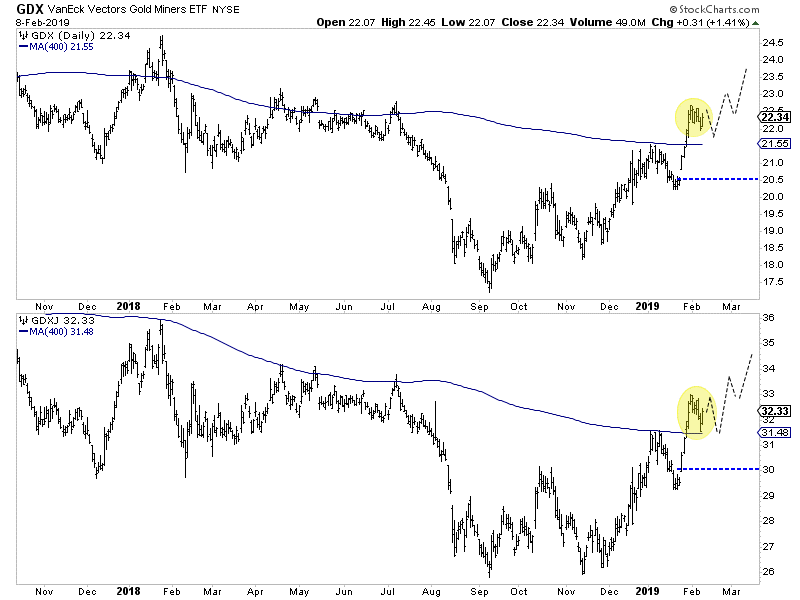
In the bullish scenario, look for the miners to hold above their 400-day moving averages and build a tight consolidation. If that develops, we would gain strong confidence in a bullish outcome.
In the bearish scenario, the miners would sell off below recent lows and threaten a test of the 200-day moving averages and the nearby open gaps.
Also, keep an eye on Silver, which like the miners will outperform when the sector trend is established. Note that on Thursday Silver bounced from the $15.60-$15.65/oz level which has been a critical level over the past two years. (See the arrows in the chart).
Should Silver hold that low then it should be able to rally above its 400-day moving average for the first time in over a year and test $17.25.
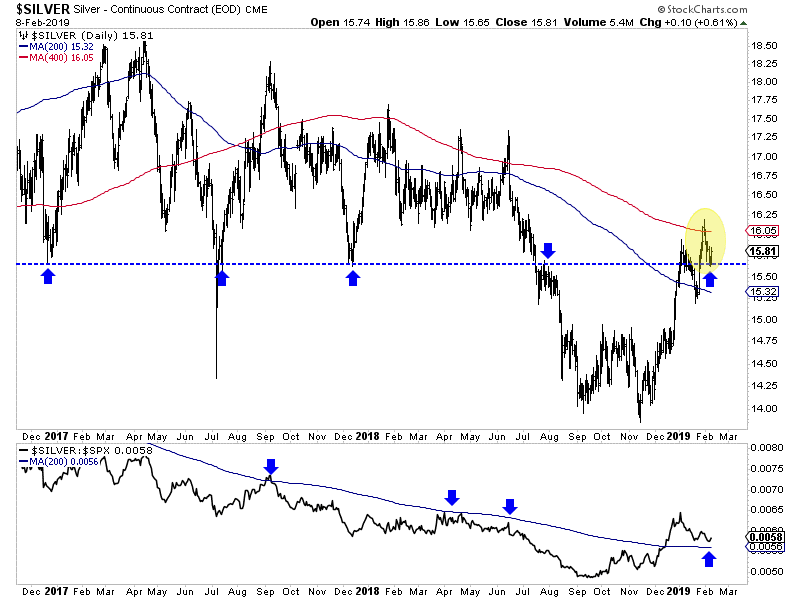
At the bottom of the chart we plot Silver against the S&P 500 and according to the 200-day moving average, that relative trend has turned in favor of Silver.
The bottom line is if GDX, GDXJ and Silver can maintain the lows from last week and firm up against the S&P 500 then they are likely going higher. If those lows break convincingly then look for a longer and deeper correction.
Essentially, should a bullish consolidation develop, we will prepare to put more capital to work. If not, then a deeper and longer correction is more likely which means we can be patient. To prepare yourself for some epic buying opportunities in junior gold and silver stocks before this bull market really gets going, consider learning more about our premium service.
First we need to define what a breakout actually is. It is when the price breaks a pattern or a range and a new trend is therefore established.
Today, people are all too quick to refer to almost every move higher as a breakout. Just google “Gold Breakout” and you’ll see what I mean.
Sure, closing above $1300 was a breakout for Gold. But that’s hardly significant. If and when Gold surpasses the wall (resistance at $1350-$1375), it will mark a real breakout.
The good news is Gold is currently in a much better position both fundamentally and technically than it was in 2016, 2017 and 2018.
Let me start with the technicals.
Gold in real terms is stronger than at any other time in the past few years.
In the chart below we plot Gold against foreign currencies (FC), stocks, bonds and commodities. The four vertical lines highlight the points when Gold was testing its wall of resistance.
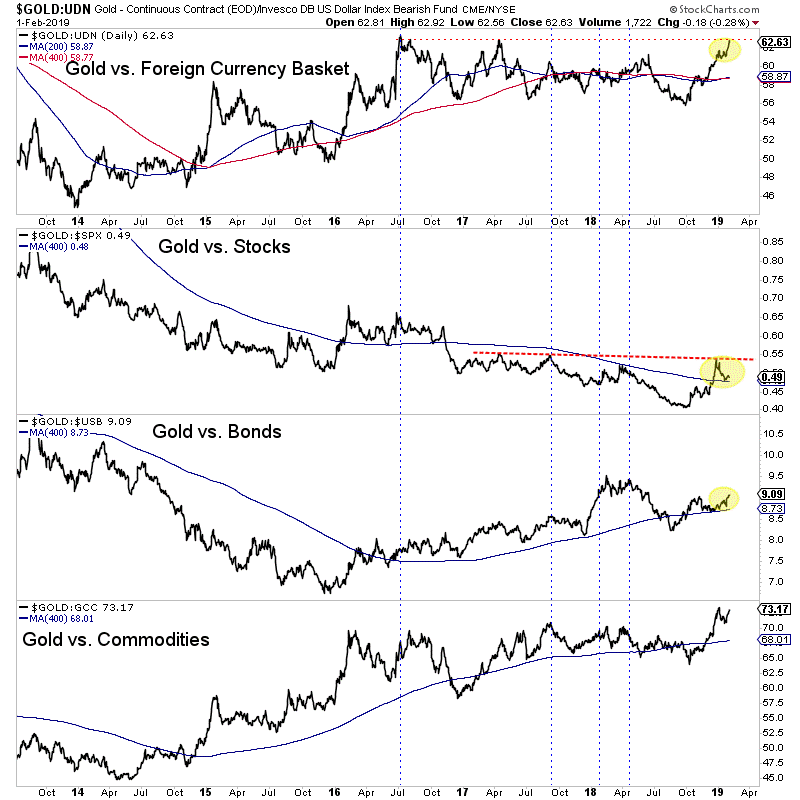
During 2017 through 2018, Gold was driven mostly by a weak dollar. In relative terms, Gold was weak against FC and stocks.
Relative to summer 2016, Gold is currently stronger against bonds and commodities and is inches away from testing its 2016 high against FC.
The last thing holding Gold back is the stock market. Note that the Gold to S&P 500 ratio has not made a higher high in recent days. While its holding above moving average support it desperately needs to make a higher high to confirm a new Gold bull market is underway.
The performance of Gold relative to the stock market is connected to the fundamentals for Gold.
If the stock rally and economic data hold firm, the Fed could reintroduce rate hikes into the equation. That’s not a bullish scenario for Gold. (It’s important to keep this in mind).
On the other hand, if the market is right, the Fed is done hiking rates and will make its first rate cut in 2020.
That scenario eventually implies equity market weakness, a push higher in the Gold to stock market ratio and a breakout in Gold.
So who should we trust: the market or the Fed, who thinks they could hike this year?
The gold stocks are providing additional evidence. They exploded above their 400-day moving averages and have shown strong breadth over the past two weeks.
At present, the weight of the evidence is favoring bullish outcomes for precious metals. Ultimately, if Gold and gold stocks extend their outperformance against the stock market then look out for a breakout and a full blown bull market. To prepare yourself for some epic buying opportunities in junior gold and silver stocks, consider learning more about our premium service.
Last week we discussed the difference between a rally and bull market.
Gold stocks have been in a rally.
That rally is now over as gold stocks peaked at their 400-day moving averages days ago and sliced through their 200-day moving averages Friday.
Take a look at the charts of any gold stock index (GDX, GDXJ, HUI) and it’s clear they are in a downtrend.
Go back two to three years. You’ll see lower highs and lower lows. That’s a downtrend!
Until that changes, we have to respect that.
The change will come when the market knows the Fed is done hiking and anticipates the start of rate cuts.
Going back 65 years, I counted 13 times when the Fed went from rate hikes to rate cuts. The average gain in gold stocks during 11 of those periods was 172%.
The moves higher began an average and median of three to four months after the time of the last hike.
If the final hike is in March or June then the bull run should begin around the average time frame. If December 2018 was the final hike, then obviously the move higher could begin after the average or median period.
The immediate risk is the gold stocks could be starting another leg lower. In the chart below, we see similarities between GDX today and where it was in Q2 2015.
At both junctures the market had finished rallying after breaking down from a long consolidation. Note the points 1,2,3 and also the similarities in the advance-decline line. One positive difference is GDX relative to the stock market has surpassed its 200-day moving average.
In summation, we are looking for one more leg lower before a potential historic buying opportunity in precious metals. How much lower and for how long could depend on how soon the market is certain the Fed is done hiking.
There is no need to chase anything now as there will be plenty of time to get into cheap juniors that can triple and quadruple once things really get going. Recall that many juniors began huge moves months after epic sector lows in January 2016, October 2008, May 2005 and November 2000. Don’t chase the wrong stocks right now. To prepare yourself for some epic buying opportunities in junior gold and silver stocks, consider learning more about our premium service.
The precious metals complex has enjoyed a nice run in recent months.
GDX has gained 25% since the September lows while GDXJ has gained 22% since its November low. Gold has rallied over $100/oz since its October low and Silver has surged in recent weeks.
The Gold community is getting excited again. They think the equity market is doomed and Gold has started a real bull run. That may be true but in the interim there are questions on the sustainability of recent strength.
Below we plot GDX with its advance decline (A/D) line and its RSI indicator. We already know that the A/D line has been carrying a few negative divergences.
With respect to RSI, typically in a strong, trending move it will surpass 70 (sooner rather than later) and that indicates strong momentum which implies some sustainability.
As GDX tests its 400-day moving average, it is lacking strong breadth and strong momentum.
Meanwhile, Gold finally reached an RSI of +70 but after it occurred Gold formed a bearish reversal at strong resistance at $1300. That is why we want momentum to reach overbought conditions sooner rather than later.
Silver (not shown) formed a similar bearish reversal as it approached resistance at $16.00.
Precious metals have tested resistance but with a lack of strong momentum and strong breadth. This implies that recent strength is probably not immediately sustainable.
Can precious metals digest and maintain recent gains or will they give most of them back as has been the case for years and years?
Assuming precious metals correct and consolidate, then there are multiple things we want to watch including breadth and relative strength against stocks and foreign currencies. In addition, we also should watch how the miners perform relative to Gold.
If Gold pushes past $1300 and the gold stocks surge past their 400-day moving averages it would signal a change in character for the market. At that juncture it would difficult to argue against a bull market.
In any case, it is not wise to chase strength until we get more evidence that a bull market has started. There will be plenty of time to get into cheap juniors that can triple and quadruple once things really get going. Note that many juniors began huge moves months after lows in January 2016, October 2008, May 2005 and November 2000. To prepare yourself for some epic buying opportunities in junior gold and silver stocks in 2019, consider learning more about our premium service.
If you would like to receive our free newsletter via email, simply enter your email address below & click subscribe.
 Follow us on Twitter
 Become our facebook fan
CONNECT WITH US
Tweets
Tweet with hash tag #miningfeeds or @miningfeeds and your tweets will be displayed across this site.
MOST ACTIVE MINING STOCKS
Daily Gainers
 CMC Metals Ltd. CMC Metals Ltd. |
CMB.V | +900.00% |
 Eden Energy Ltd Eden Energy Ltd |
EDE.AX | +200.00% |
| GoviEx Uranium Inc. |
GXU.V | +42.86% |
| Eagle Nickel Ltd. |
ENL.AX | +41.67% |
| Citigold Corp. Limited |
CTO.AX | +33.33% |
| Mount Burgess Mining NL |
MTB.AX | +33.33% |
| Exalt Resources Limited |
ERD.AX | +31.94% |
| Casa Minerals Inc. |
CASA.V | +30.00% |
| Cariboo Rose Resources Ltd |
CRB.V | +28.57% |
| Belmont Resources Inc. |
BEA.V | +28.57% |


