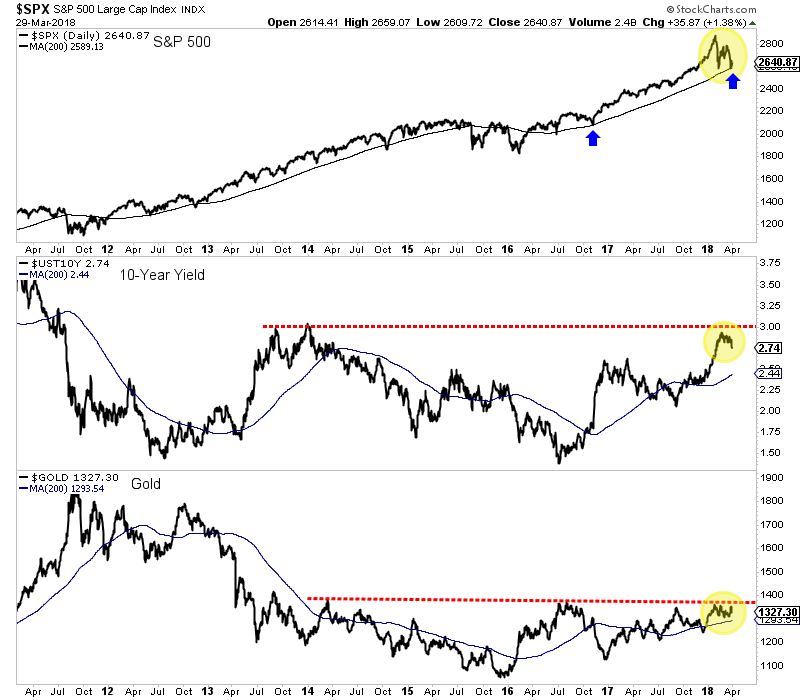
As we’ve been saying, the stock market will have great influence on Gold. It has been easy to see in recent months.
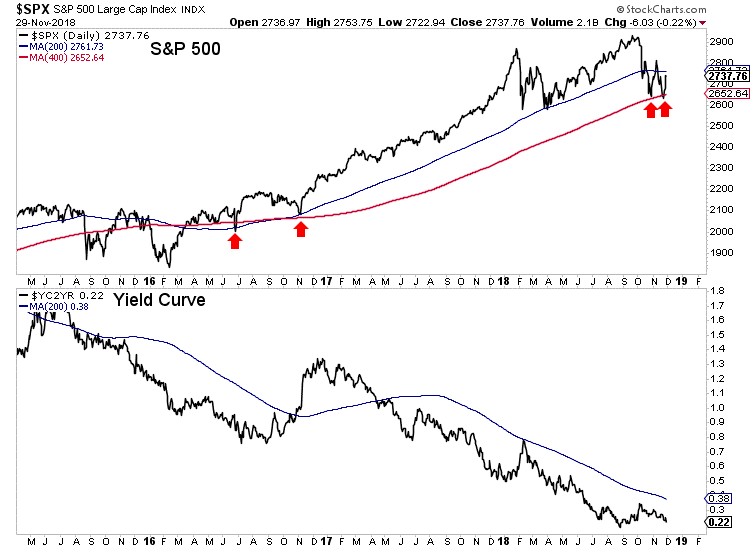
The S&P 500 has cracked, losing both its 200-day and 400-day moving averages. Gold and gold stocks have benefitted and gained in recent months even with a stable to rising U.S. Dollar.
The past 65 years of history shows us that in almost any context (but not all) the time between the Fed’s last rate hike and first rate cut is exactly when you want to buy gold stocks.
We don’t know if December is the last rate hike. No one does.
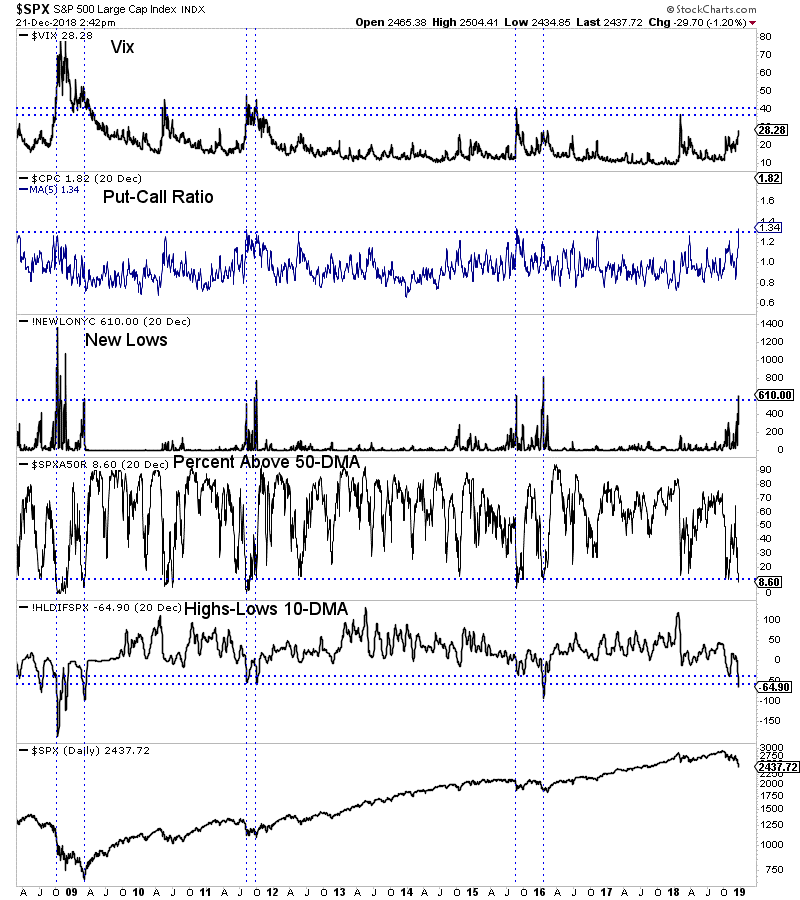
What we do know is the stock market is approaching an extreme oversold condition and is likely to begin a counter trend rally very soon.
In the chart below we plot five indicators that can help define an extreme oversold condition. These include the Vix, the put-call ratio and several breadth indicators. All but the Vix are in extreme oversold territory.
As we pen this article, the S&P 500 is trading at 2436.
The 40-month moving average, which has provided key support and resistance over the past 20 years (including the 2016 and 2011 lows) is at 2395 while the 50% retracement of the 2016 to 2018 advance is at 2380.
The setup for a bullish reversal is in place.
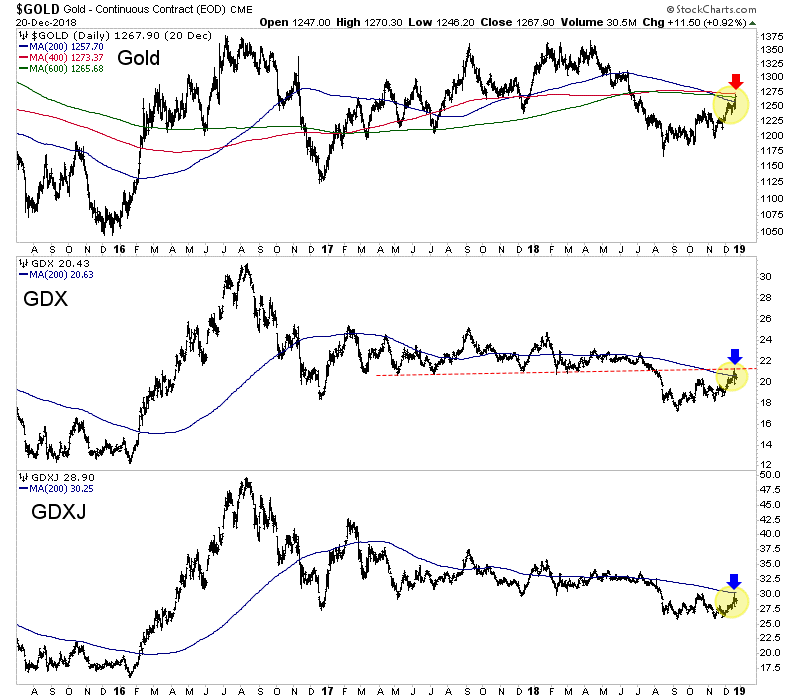
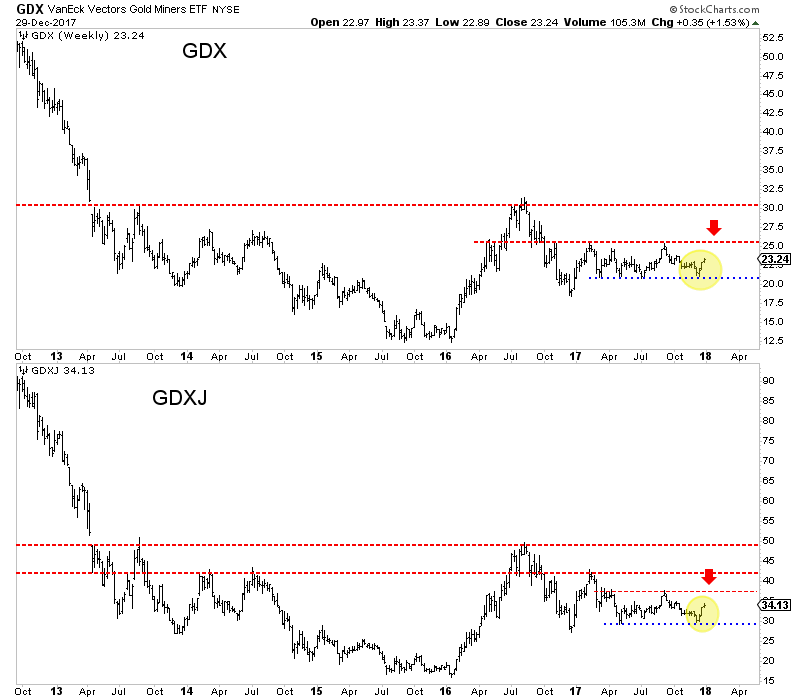
Meanwhile, despite the recent carnage in stocks, precious metals have been unable to surpass resistance.
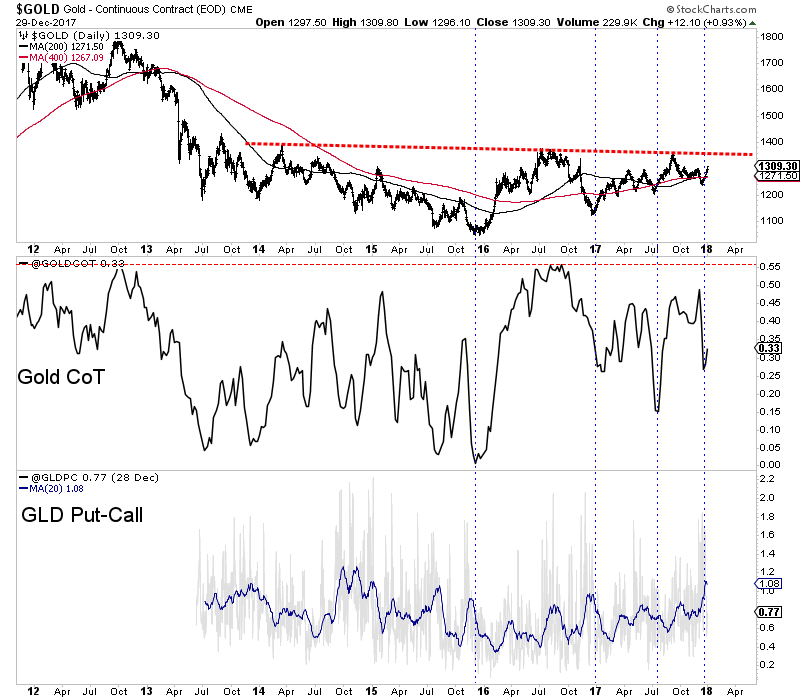
Gold is set to close the week right below a confluence of resistance at $1260-$1270. Perhaps it will close right on its 200-day moving average at $1258.
The gold stocks (GDX, GDXJ) have been strong since Thanksgiving but appear to have been turned back at their 200-day moving averages.
So in recent days the selloff in the S&P 500 accelerated but precious metals (at least to this point) failed to capitalize in a bullish fashion.
If the S&P 500 is within one or two days of a rally then we should not expect much more upside in Gold and GDX in particular. Those were the markets that benefited most from weakness in the S&P 500.
As we noted last week, the weakness in the stock market (and the economy) has not done enough to change Fed policy yet.
Over the past 65 years, the start of bull markets and big rallies in gold stocks coincided with the start of rate cuts. When the market sniffs the first rate cut, we will know precious metals are beginning a sustained advance and not another false start.
In recent days we’ve seen the beginnings of an inversion in the yield curve.
The 2-year yield and the 5-year yield have inverted but not yet the the 2-year yield and the 10-year yield, the curve that is watched most. However, “2s and 10s” as bond traders would say appear headed for an inversion very soon.
We know that an inversion of the yield curve precedes a recession and bear market. That is good for Gold. But timing is important and the key word is precedes.
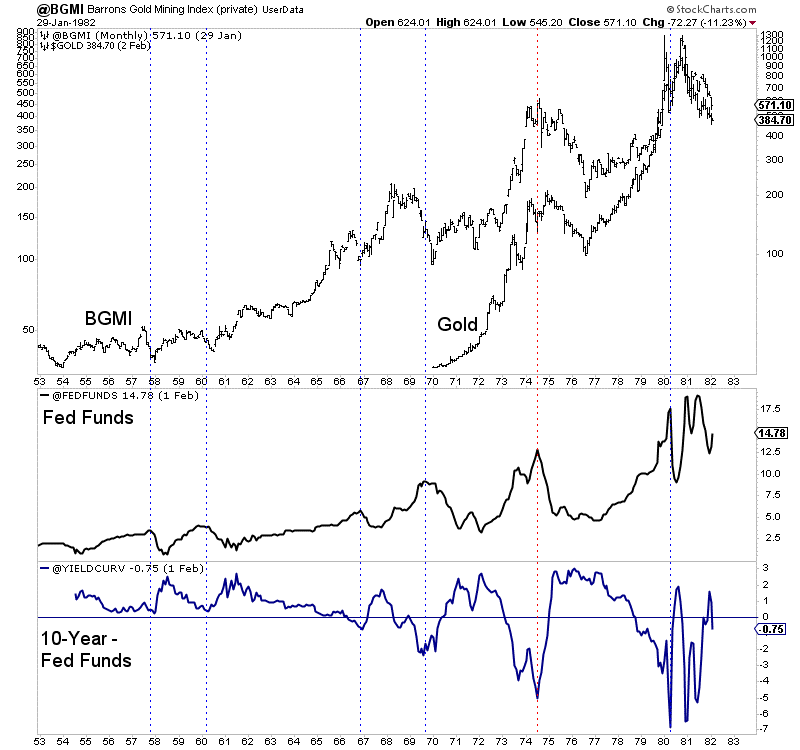
In order to analyze the consequences for Gold we should consult history.
First let’s take a look at the 1950-1980 period.
In the chart below we plot the Barron’s Gold Mining Index (BGMI), Gold, the Fed funds rate (FFR) and the difference between the 10-year yield and the FFR (as a proxy for the yield curve).
The six vertical lines highlight peaks in the FFR and troughs in the yield curve (YC), which begins to steepen when the market discounts the start of rate cuts. A steepening YC is and has been bullish for Gold except when it’s preceded by inflation or a big run in Gold.
Note that five of the six lines also mark a recession except in 1966-1967.
At present, the yield curve is on the cusp of inverting for only the third time since 1990.
The previous two inversions in 2000 and 2007 were soon followed by a steepening curve as the market sensed a shift in Fed policy.
The initial rate cut in 2000 marked an epic low in the gold stocks and the start of Gold strongly outperforming the stock market. In summer of 2007 the rate cuts began and precious metals embarked on another impulsive advance.
The historical inversions carry a different context but the takeaways are not so different.
Aside from the mid 1970s to the early 1980s, we find that a steepening of the curve (which accelerates from the start of Fed rate cuts) is bullish for precious metals. (This also includes a steepening in late 1984 that preceded the bull market in the mid 1980s).
With that said, the inversion itself is not bullish for precious metals because there can be a lag from then to the first rate cut and steepening of the curve.
I took a careful look at four of the previous inversions and counted the time from that point to the next significant low in gold stocks. The average and median time of those four is 10 months.
That appears to be inline with my thinking that the Federal Reserve’s final rate hike will be sometime in 2019.
Recent market and economic developments are positive for Gold and precious metals but conditions are not bullish yet.
Bullish conditions and bullish fundamentals would be highlighted by a shift in Fed policy. They aren’t shifting yet. They are slowing, which precedes a shift.
From a market standpoint, we need to see strength in Gold in real terms (against stocks and foreign currencies) and a steepening of the yield curve. These developments along with shifting Fed policy will tell us a new bull market is soon to begin.
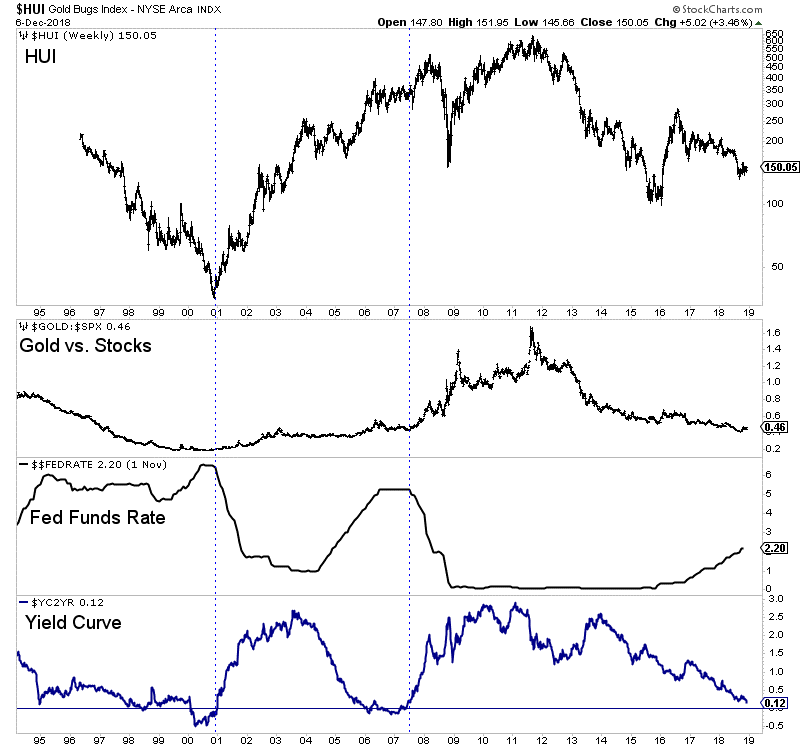
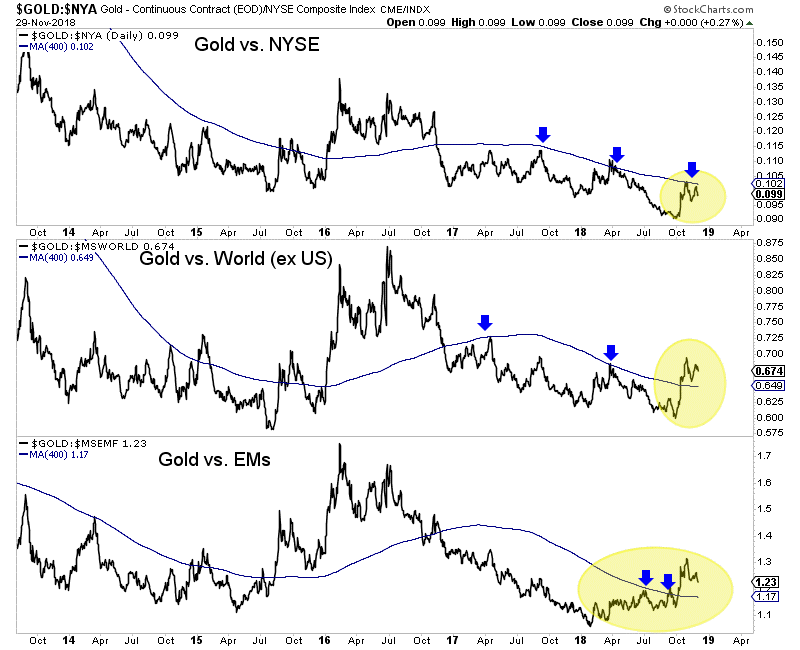
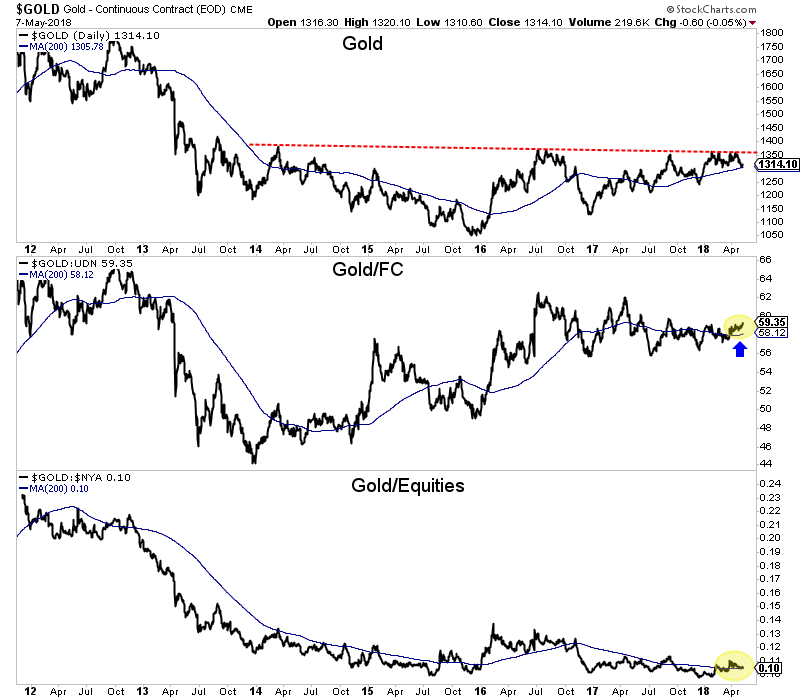
In regards to Gold against equities, the chart below shows both progress but the need for more strength.
Gold remains below its long-term moving average against U.S. stocks (NYSE). The trend has not turned bullish yet.
Gold relative to the rest of the world (U.S. excluded) and Emerging Markets has turned the corner but now must prove it can hold above the long-term moving average.
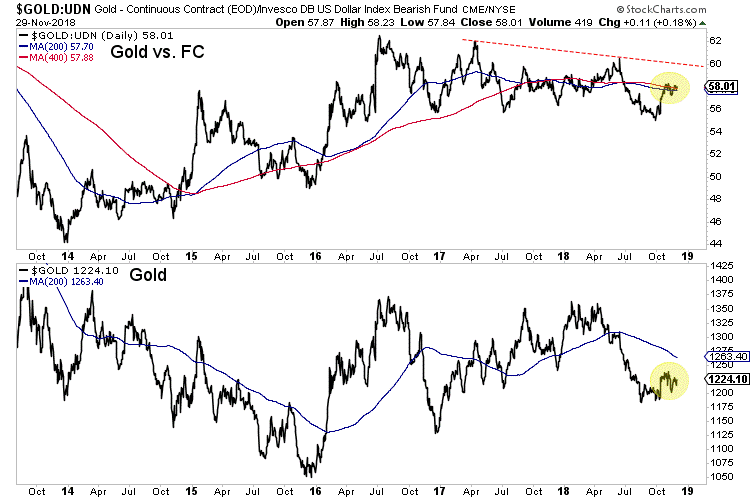
Gold relative to foreign currencies is at an interesting juncture as the chart below shows. Over the past month it has been battling with a confluence of resistance right at its 200 and 400 day moving averages.
From a market standpoint, the stock market is key as it will front-run Fed policy. It’s a reflection of the economy and health of corporations. A stronger stock market means tighter Fed policy.
That could go out the window if and when the S&P 500 loses its recent lows at the 400-day moving average. But these lows could hold for several months.
The yield curve continues to flatten, which is not bullish for Gold. Steepening is.
Although the Fed said something about rate hikes coming to an end and the market now expects only two more hikes, the conditions are not there for Gold.
On the fundamental side, history argues that conditions turn most bullish after the last hike and when the market begins to discount a new rate cutting cycle. It appears we are still months away from the last hike.
On the technical side, there is improvement in the leading indicators but nothing definite yet.
Gold has not broken out of its downtrend relative to U.S. stocks nor has it broken out against foreign currencies. These things should happen before a bull market begins.
In the meantime, don’t try to catch falling knives or chase weakness as there will be plenty of time to get into cheap juniors that can triple and quadruple once things really get going. Moreover, the start of the next bull looks to be more than a few months away.
Fed week is exciting for some. Gold bulls and bugs alike hope the Fed will do something or say something that will trigger a huge move in precious metals. It doesn’t work like that. The Fed follows the market, which for the Fed Funds rate (FFR) is the 2-year yield. The 2-year yield has been screaming higher over the past 12 months and it implies at least another two rate hikes in the future. That’s not good for precious metals and could be partly why (among other reasons) Gold and gold stocks have lost their 200-day moving averages. Whatever the reason, the short-term technicals are negative and there is risk of increased selling before a potential rebound in July.
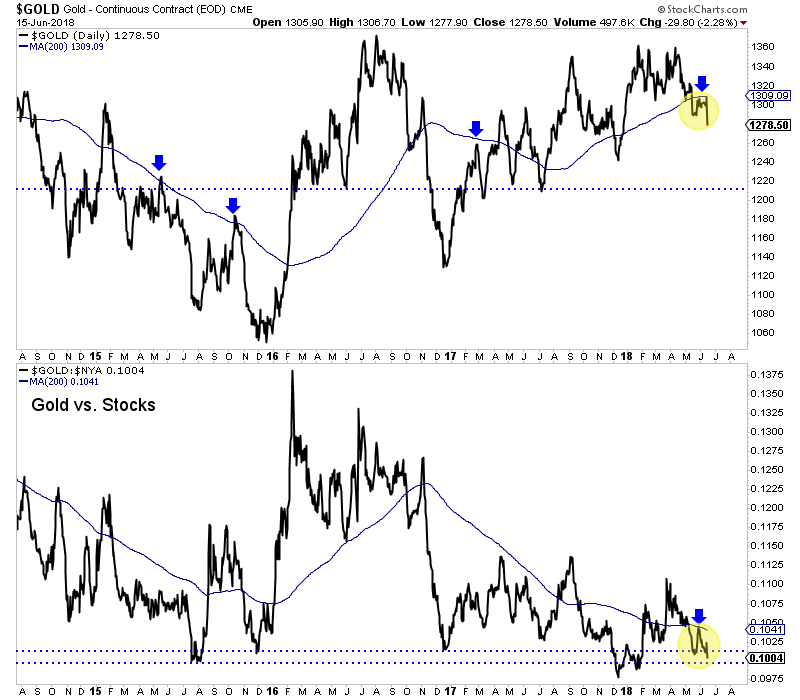
First, let’s take a look at Gold and gold against the equity market. As we can see from the chart, Gold in June has failed twice at its 200-day moving average. That is different from 2017 when each time Gold lost its 200-day moving average, it made a V rebound back above it.
Gold & Gold/Stocks
Gold’s weakness against the broad equity market is another concern. At the bottom of the chart we plot Gold against the NYSE, a broad stock market index. The ratio recently failed at its downtrending 200-day moving average and is also threatening a move to new lows for essentially the first time since 2015. (The December 2017 break was not sustained to the downside).
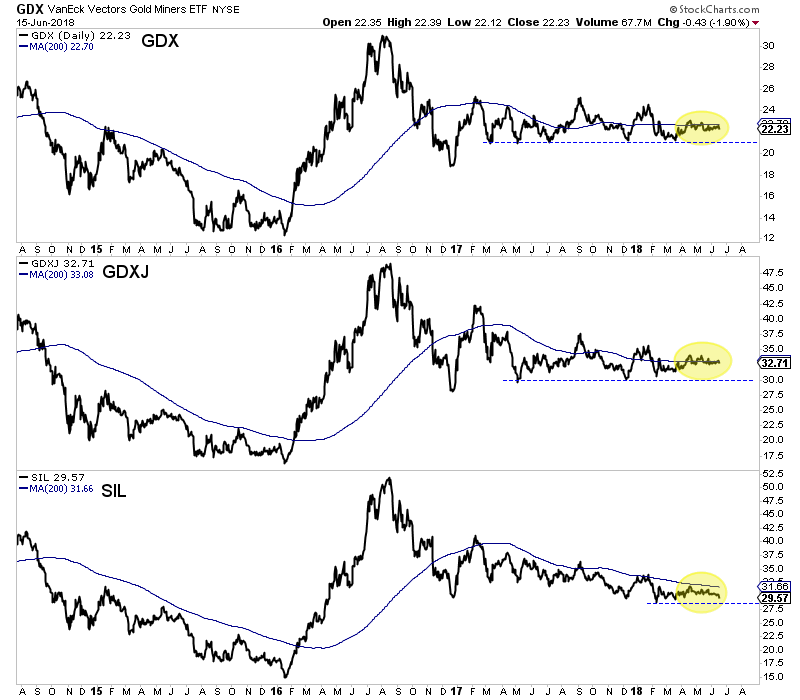
Elsewhere, the miners have spent the second quarter wrestling with their 200-day moving averages. GDX failed at its 200-dma twice in the past month, including last week. Meanwhile, GDXJ has shown a tiny bit more strength but essentially has wrestled with its 200-dma since April. The silver stocks (SIL) have been weaker as they have not traded above their 200-dma since January and could have started to breakdown on Friday by closing at 3-month low.
GDX, GDXJ, & SIL
The immediate outlook for precious metals is negative as the price action suggests but current bearish sentiment implies a rebound is on the horizon. The summer could be playing out as we anticipated three weeks ago. An immediate move lower could push Gold to strong support around $1260 and that would put sentiment indicators into truly extreme territory. From there, it is critical that the sector recaptures 200-day moving averages. Given our recent cautious views, we have narrowed our focus to a smaller group of companies capable of performing well in this environment. To follow our guidance and learn our favorite juniors for the next 6 to 12 months, consider learning about our premium service.
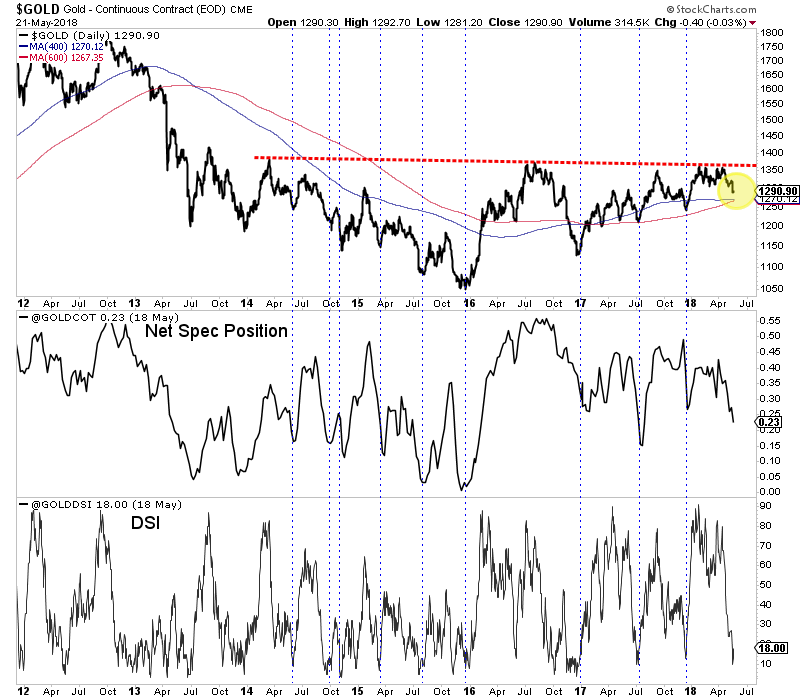
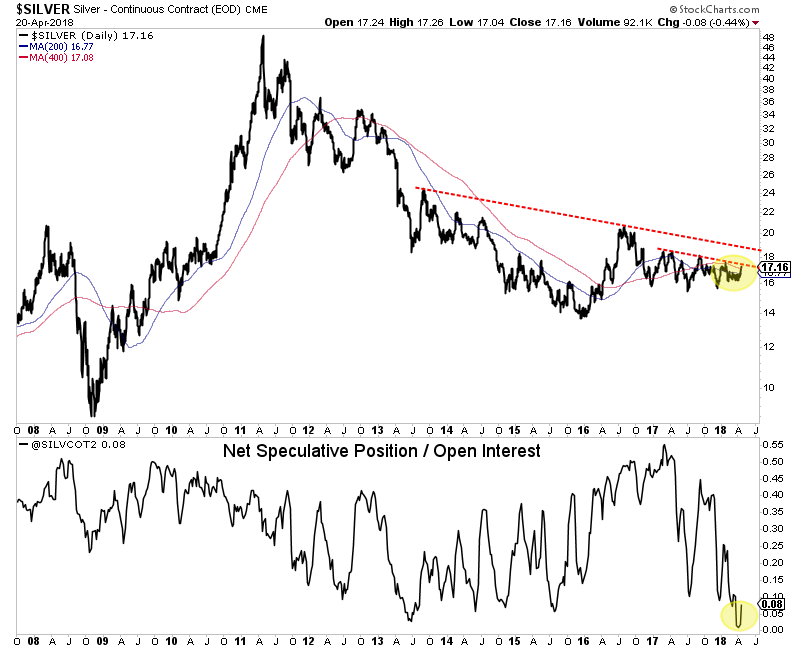
Gold failed to breakout in the spring and recently lost weekly support at $1310. Meanwhile, the gold stocks have held up well in recent weeks (considering Gold) but still have much to prove. Silver couldn’t rally much when its net speculative position was at an all time low. The question now is where do things go from here. The price action is not bullish but with a Fed hike looming and negative sentiment, Gold could be poised to snapback after testing lower levels.
The technicals for Gold show a strong confluence of support at $1265 to $1270. It has traded as low as $1281 in recent days. Trendlines and long-term moving averages coalesce at $1265 to $1270. On the weekly chart, $1265 stands out as a key level. A little bit more selling could bring Gold down to key support.
Gold with Sentiment Indicators
The sentiment indicators (shown at the bottom of the above chart) are encouraging and would be more so with a test of that aforementioned support. The net speculative position as of last Tuesday hit 22.7% of open interest, which is one of the lowest readings of the past two years. The daily sentiment index hit only 10% bulls last week. It’s 21-day average is 32% bulls and if that fell below 30% it would mark a 9-month low.
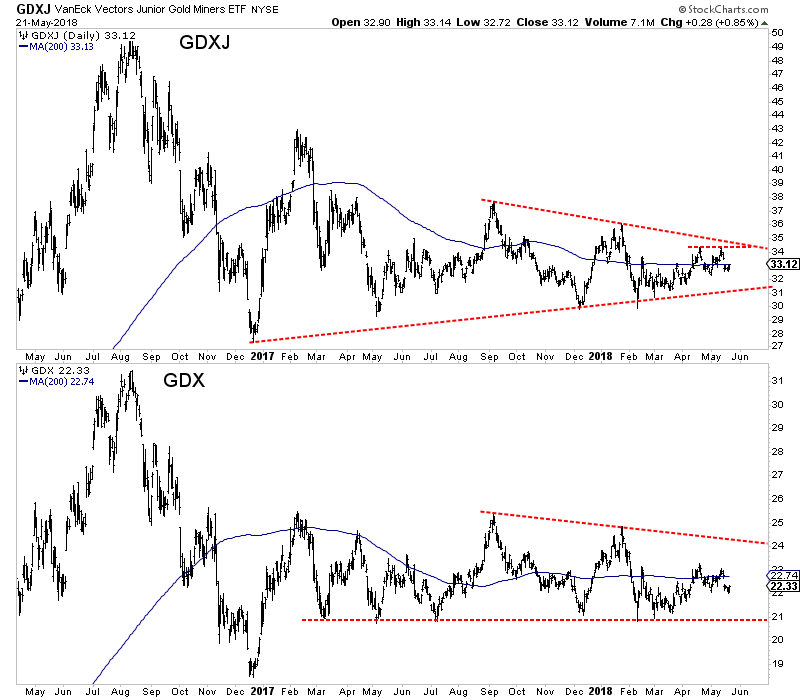
Turning to the miners, we find a sector that continues to be wedged in between support and resistance. GDXJ has trendline and lateral support in the $31s with key resistance in the low $34s. GDX has immediate support at $22 and strong support at $21 while initial resistance is at $23. If Gold is to have another chance to breakout in the months ahead then GDX and GDXJ need to surpass their April highs.
GDXJ, GDX Daily Bar Charts
While we are concerned about Gold for the remainder of 2018, it could be setting up for a summer rally and especially if it drops to strong support around $1265. Sentiment would reach even more encouraging levels and that coupled with strong technical support could produce a rebound. In the meantime we continue to focus on and accumulate the juniors that have 300% to 500% return potential over the next 12 to 18 months. To follow our guidance and learn our favorite juniors for the balance of 2018, consider learning more about our premium service.
Ask some gold bugs why Gold has not broken out yet and you will probably get the usual answers. Some will say it’s due to manipulation or price suppression. Others will mention the current rally in the US Dollar (while neglecting that the previous decline in the greenback was unable to take Gold to a new high). Few would say the fundamentals are not in place. No one can know for certain but Gold’s fundamentals have not improved over the past year and are not where they need to be to support a breakout.
The vast majority of history shows us that Gold is inversely correlated to real interest rates (or real yields). It makes perfect sense because Gold has been money for thousands of years. When real rates decline, the real return on money in the bank or in a treasury bill or note decreases. Gold benefits. The corollary is also true. Rising real interest rates indicate stronger real return on money invested in the aforementioned instruments. That’s negative for Gold.
Real interest rates have actually strengthened for nearly 18 months, as the chart below shows. Gold has performed well during that period because of weakness in the US Dollar as well as some anticipation of an escalation in long-term yields.
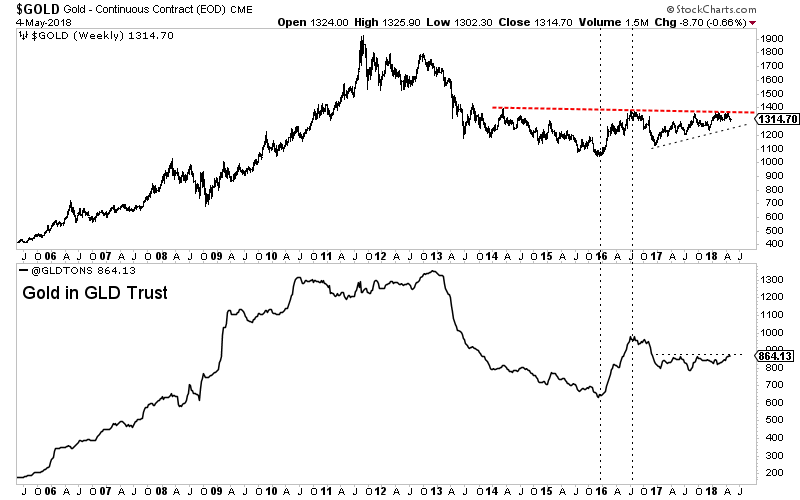
Given the rise in real interest rates, it is not a surprise that investment demand for Gold has been weak. Gold bugs frequently trumpet strong demand from China and how tight the physical Gold market is but in reality, investment demand is what drives bull markets. Investment demand tends to respond to or follow negative and/or declining real interest rates.
One way of measuring investment demand in real time is by following the amount of Gold held in the GLD trust. As we can see below, investment demand (by this metric) confirmed the rebound in Gold in the first half of 2016. However, it has essentially been flat over the past 18 months as Gold rebounded from the low $1100s all the way to $1360.
Gold & Tons in GLD Trust
So if Gold’s fundamentals are not bullish and investment demand is flat, what conditions need to change that would benefit Gold?
Obviously, Gold needs declining real interest rates. It needs some combination of an acceleration in inflation and a pause or slowdown in short-term yields including the Fed Funds rate. Inflation has risen in recent quarters but short-term yields have risen faster as evidenced by the increase in real interest rates (shown in our first chart).
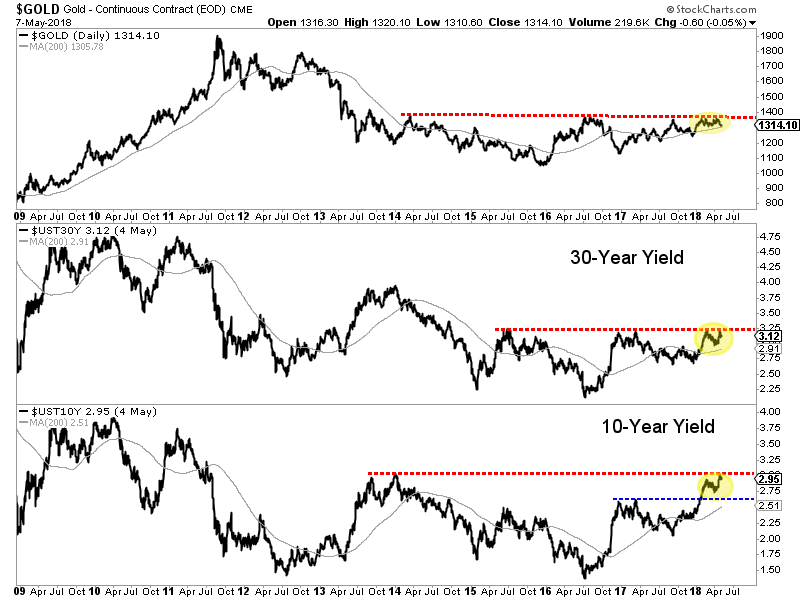
Weeks ago Gold was sniffing a breakout as long-term bond yields, such as the 10-year and 30-year yield were also threatening a breakout. An upside break in long-term yields would be significant for Gold as it would signal an increase in inflation expectations and pressure the balance sheets of both an over-indebted corporate sector as well as a government already running the largest non-recessionary, peacetime budget deficit in history. However, bond yields have yet to breakout even as the masses have positioned for such. In other words, Bonds could be ripe for a counter-trend rally which means yields would be ripe for a counter-trend decline.
An upside breakout in bond yields could also potentially lead to a new uptrend in the Gold to Stocks ratio. It could cause issues in the economy and stock market which would in turn, benefit Gold. While Gold is in a new uptrend relative to Bonds (not shown) and is currently firming against foreign currencies, it has not been able to sustain strength relative to the equity market. From an intermarket perspective this is the link that has been missing to put Gold in a real bull market.
Gold, Gold/Foreign Currencies, Gold/Equities
It would not be a surprise to see Gold correct lower as fundamentals are not currently bullish and the US Dollar (the weakness of which supported Gold throughout 2017) is rebounding with potentially more upside. Although inflation is increasing, it has not increased fast enough to counteract the rise in short-term yields. A future breakout in long-term yields could be the missing catalyst for Gold as it would cause issues in the economy and stock market and lead to softer Fed policy. Until then, traders and investors would be wise to focus on the junior miners that can add value to their projects in the meantime. To follow our guidance and learn our favorite juniors for the next six months, consider learning more about our premium service.
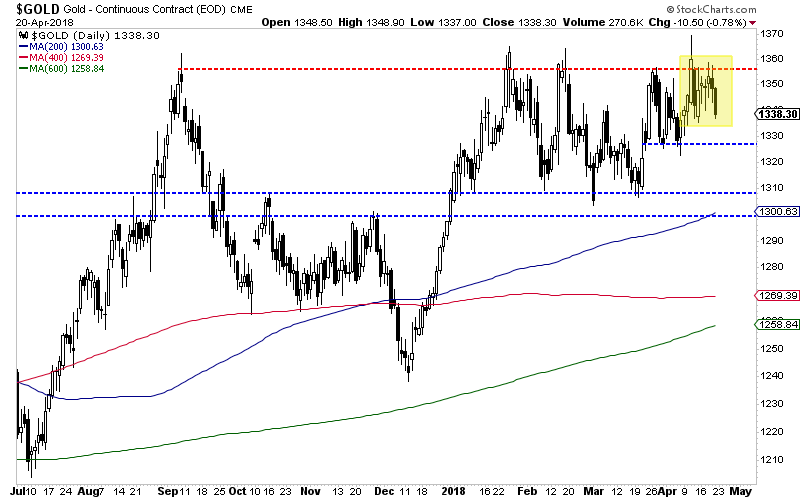
It was an interesting week in the precious metals complex. There appeared to be the start of a short squeeze in Silver (hedge funds were heavily short) but it ceased at an important resistance. Meanwhile, Gold closed the week on a weak note, losing $1340-$1350. The gold stocks, like silver closed the week below technical resistance. The price action in the complex continues to suggest that a breakout in Gold is the key to unleashing strong outperformance from Silver and the gold stocks.
While Silver has very supportive sentiment, it has not broken out from its downtrend yet. The net speculative position was at 1.1% a few weeks ago, an all time low. That won’t spring Silver by itself unless Silver can surpass critical resistance in the mid $18s. And that may not happen until Gold breaks $1360-$1370. Silver has strong support in the low to mid $16s.
Silver & Silver Net Speculative Position
Moving to Gold, the daily chart below shows Gold losing $1340-$1350 after rejection again at $1360. Immediate support for Gold lies at $1325 which if broken would lead to a test of $1300-$1310 and the 200-day moving average.
Gold Daily Candles
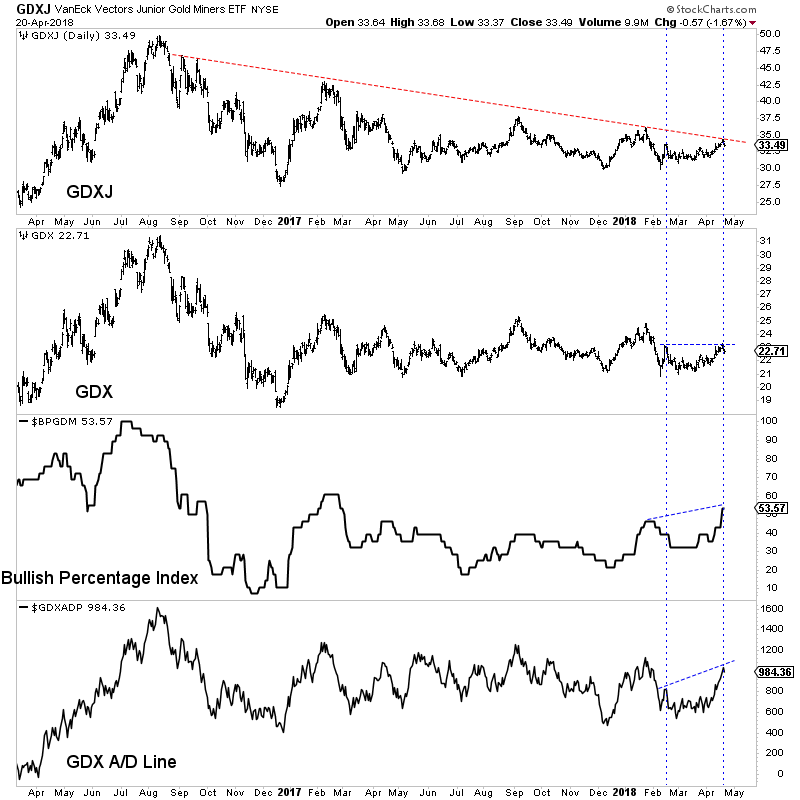
We have a few observations to share with respect to the gold stocks. First, GDXJ has pulled back from trendline resistance around $34. Second, breadth indicators for GDX such as the advance decline line (A/D) and the bullish percentage index (BPI) are showing a positive divergence. The BPI has reached a 52-week high while the A/D line is not far from its January peak when GDX nearly hit $25. So while GDX has been relatively weak, its internals are showing more strength.
Silver and the gold stocks have yet to break important resistance as Gold once again was turned back at major resistance. If the US Dollar, which closed at 90.07, rallies up to its 200-day moving average at 92, Gold would likely test $1300-$1310. Should Silver and the gold stocks hold up well in that scenario (which could be suggested by current breadth) then it would imply a good rebound from the sector back to resistance points. Lower prices in the juniors would be a welcome sign and another opportunity to accumulate ahead of a major breakout in the not too distant future. In anticipation of that breakout, we have been accumulating the juniors with 300% to 500% upside potential over the next 18-24 months. To follow our guidance and learn our favorite juniors, consider learning more about our premium service.
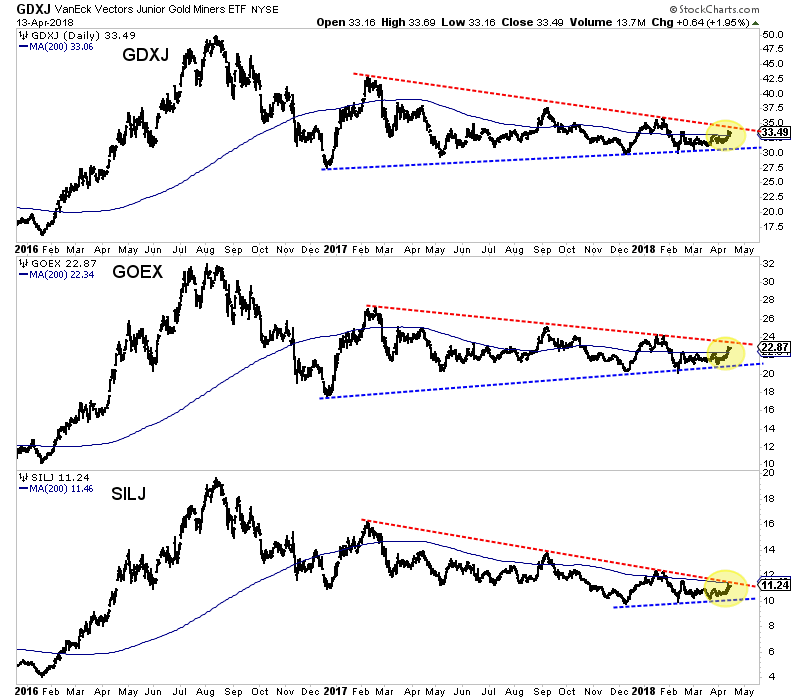
A few weeks ago we wrote that it may not be Gold’s time yet but a few recent developments suggest its time could be sooner than we anticipated. Although Gold failed to breakout last week, we should note the positive action in the miners. Over the past seven trading days the miners have strongly outperformed Gold. That includes the juniors, which appear very close to breaking out of the downtrend that has been in effect for over 12 months.
In the chart below we plot the three major junior ETFs: GDXJ, GOEX (explorers) and SILJ (silver juniors). The juniors have trended lower since February 2017 but are now threatening to break trendline resistance. Since December 2017 the juniors have traded in an increasingly tighter and tighter range which indicates a break is coming very soon. Also, note how the 200-day moving averages are flat and no longer sloping lower. That reflects a mature correction and the potential for a new uptrend if the juniors break above resistance in a strong fashion.
GDXJ, GOEX, SILJ Daily Bar Charts
There are a few other things worth mentioning.
First, as we alluded to, GDXJ has strongly outperformed Gold over the past seven trading days. The GDXJ to Gold ratio has reached its highest mark since the start of February. That sudden relative strength is significant considering Gold is within spitting distance of a major breakout.
Second, one custom breadth indicator we track is the percentage of juniors (a basket of 50 stocks) trading above the 200-day moving average. This figure (currently 42%) has not exceeded 51% since February 2017. A strong push above 51% could confirm a renewed uptrend in the juniors.
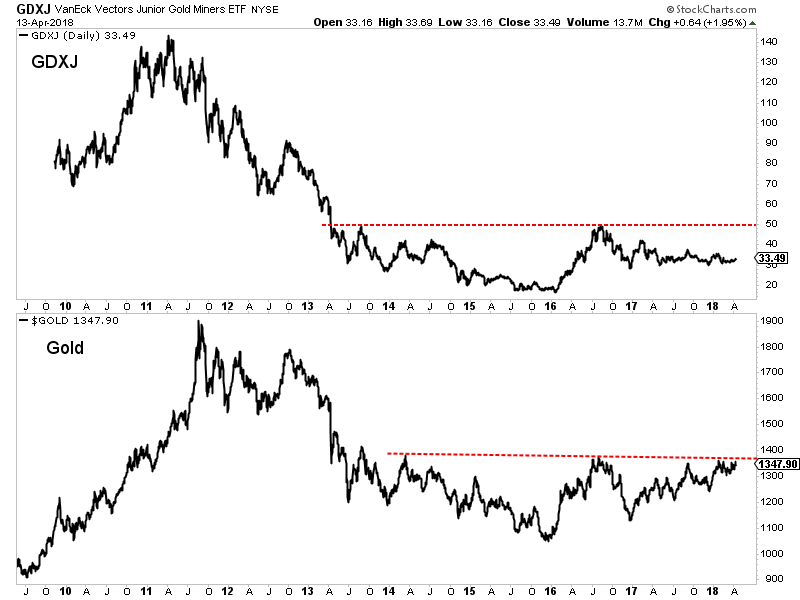
If juniors are going to break out of their downtrends, it could mark the start of potentially a very large move. Gold, upon a breakout through $1375, will have a measured upside target of roughly $1700/oz. Although the juniors aren’t very close to breaking their 2016 high, they, upon a breakout would have similar upside potential. GDXJ, upon a breakout through $50 would have a measured upside target of $83.
GDXJ & Gold Necklines
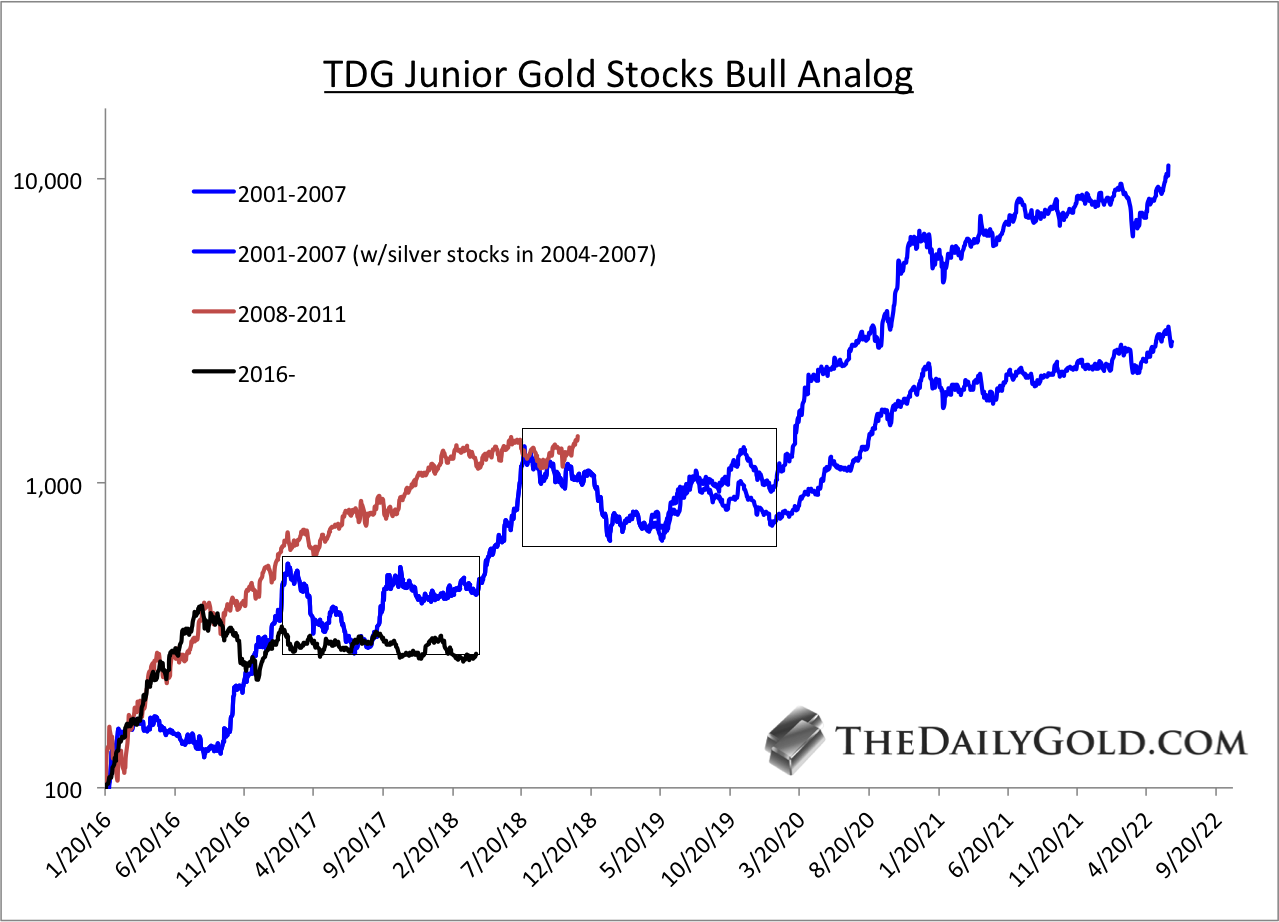
That potential measured upside target for GDXJ may seem extreme but for juniors its par for the course. Below we show an updated chart of our Junior Gold Stocks Bull Analog. By my data, juniors are well below where they were during the 2001-2007 and 2008-2011 bull markets. So if Gold breaks higher and is going to reach $1700/oz then juniors are likely to catch up to historical performance.
TDG Junior Gold Stocks Bull Analog
Although Gold failed to breakout (again) last week, the performance in the gold stocks did not confirm that failure. The newfound relative strength, if sustained over the next few weeks could signal that a sector breakout is much closer than previously anticipated. The juniors are very close to breaking their downtrend and that break could only be the start of a potentially massive move. In anticipation of that potential move, we have been accumulating the juniors that have 300% to 500% upside potential over the next 18-24 months. To follow our guidance and learn our favorite juniors, consider learning more about our premium service.
Readers know that I have beaten this drum all too often. Gold’s major fundamental driver is declining or negative real rates. There is a strong inverse correlation because Gold is money. That’s what JP Morgan said and he’s far more qualified to understand than quotable celebrities like Mark Cuban. But I digress.
When real rates are increasing or strongly positive (during most of the 1980s and 1990s and 2011 through 2015) Gold performs poorly because one can earn a real return on their money unlike with Gold. However, when real rates decrease and particularly when they are negative, Gold flourishes. That being said, right now there is an interesting development. Real rates have increased over the past year but Gold has held steady. Reviewing recent history can help us answer which is right.
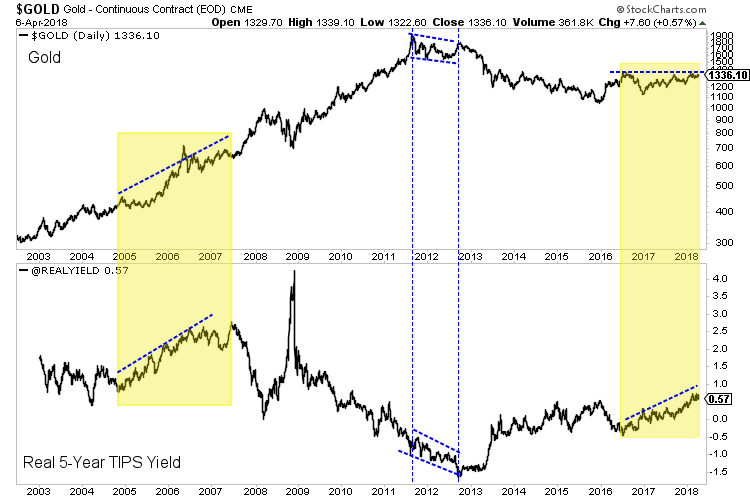
First we look at a market-based indicator for real rates (yields). The US Treasury publishes this data daily as calculated from the TIPS market. Below we plot Gold along with the real 5-year TIPS yield, which recently touched an 8-year high. Interestingly, Gold has held up well. Note that there were two previous, similar divergences. Gold peaked in 2011 even though the real 5-year yield did not bottom until 2012. From 2005 to 2006 Gold made a significant break to the upside yet the real 5-year yield also increased during that time. Both times Gold was right.
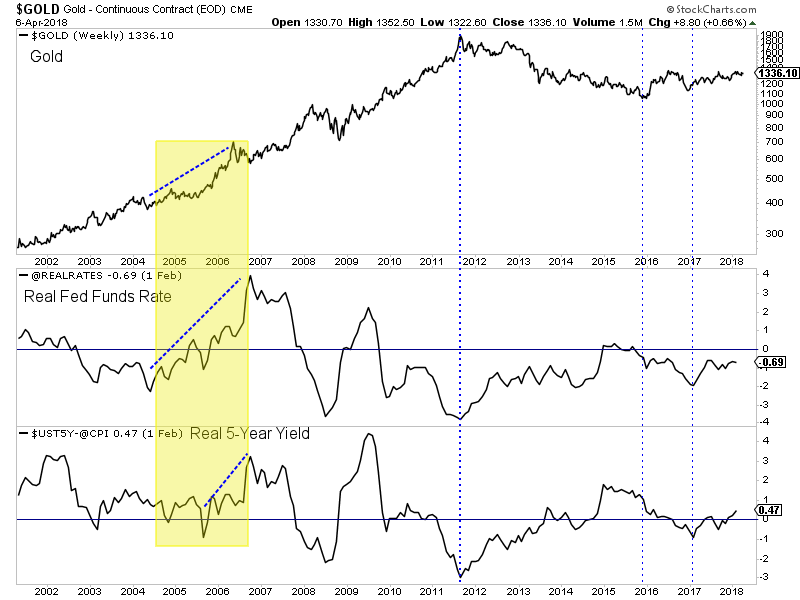
Market-based indicators are great but in the context of real rates, the basic calculation has proven to be a better indicator for Gold. In this chart we plot Gold along with the real fed funds rate (inflation less the fed funds rate) and the real 5-year yield (inflation yess the 5-year yield). Note that both statistics peaked in 2011 at exactly the same time as Gold. Both have increased since the start of 2017 (along with Gold) but are nowhere close to the 8-year high that the real 5-year TIPS yield is. The TIPS market is exaggerating the strength of real yields.
Ultimately it remains to be seen which is right (Gold or real rates) but the past tells us to side with the market (Gold) rather than a fundamental indicator. The market is a discounting mechanism.
Gold holding steady despite an increase in real rates could be a bullish signal just as Gold declining amid falling real rates would be concerning. Perhaps Gold is discounting the likelihood that real rates have peaked and the risk of a sharp decline in real rates in 2020. In any case, those who focus too much on real rates and not the message of the market could risk missing out on a huge break to the upside. In anticipation of that move we continue to accumulate the juniors that have 300% to 500% upside potential over the next 18-24 months. To follow our guidance and learn our favorite juniors for the next 12-18 months, consider learning more about our premium service.
Last week we noted that Gold’s quarterly close would be a key marker for Gold’s immediate breakout potential. Gold was seemingly on course for its highest quarterly close since 2012 until it reversed back below quarterly resistance at $1330/oz. Hence, an imminent break to the upside is unlikely and gold watchers will have to remain patient. It’s not yet Gold’s time. It will be soon enough.
One catalyst for the most recent strength in Gold (the correction in equities) appears to have faded as the S&P 500 has held its 200-day moving average. A sustained rebound in equities while bond yields correct would not be particularly bullish for Gold. The obvious reason is capital is flowing into equities and not Gold. A rebound in equities amid a temporary reduction in inflation expectations would equate to stable or rising real yields.
Essentially, there are two ways Gold can break to the upside. The first is Gold senses a breakout in long-term bond yields and a sustained rise in inflation expectations. Those developments would soon negatively impact the economy and stock market which would lead to easier Fed policy and ultimately falling real yields.
The other scenario is bond yields do not break to the upside, there is a slowdown, the stock market declines and the Fed has to reverse course all together. As we predicted in past editorials, long-term yields are trending lower and that could continue. In the meantime, Gold will not break to the upside unless the stock market experiences more turmoil.
Take a look at those examples and note the time between the end of the bear market and the next significant low (from which the bull resumed). In most cases the time between those lows is two years and seven to nine months. For the gold stocks it has only been two years and two months since that epic January 2016 low.
Assuming stocks rebound and long-term bond yields continue to moderate, then Gold is unlikely to breakout this spring. However, that is perfectly okay as our historical study suggests the miners (while facing little downside) may not begin a real bull move for several months. Gold Investors should not be discouraged as they could panic at the absolute worst time (I’m already seeing it anecdotally). Regardless of whether the bull move begins in a few months, five months or whenever, we continue to remain patient while accumulating the juniors we think have 500% return potential over the next 18-24 months. To follow our guidance and learn our favorite juniors for the next 12-18 months, consider learning more about our service.
There are very few sellers left
There were very few sellers left in January 2016 when the devastating “forever bear” was about to end. Six months later and a 150% rebound in the large caps and 200% rise in the juniors (GDXJ) provided sellers an opportunity. They drove the miners and juniors down by 40% to 45% in less than five months. However, both GDX and GDXJ have been able to hold above that low multiple times. GDX has held $21 four times! GDXJ has held $29.50 twice in solid fashion.
The bears had multiple opportunities in 2017 to push the miners lower but the miners held above their December 2016 lows and maintained the 62% retracement of the 2016 surge. The miners did not break out in 2017 but they held key support multiple times and the latest rebound suggests selling power has dried up.
The recovery pattern following a mega-bear market bodes well for gold stocks in the second half of 2018
In November we wrote about this history and the potential implication for gold stocks in 2018 and beyond. The mega bear markets that compare to gold stocks from 2011-2016 with respect to price (+80% decline) and time (+2 years) follow a distinct pattern. The initial rebound is sizeable in price but not so much in time. That gives way to a correction and consolidation that lasts a minimum of 18 months. Then the market surges higher in third-wave like fashion.
The gold stocks are nearly 17 months through their consolidation. We do not know if the consolidation is ending soon or if it will last another three, six or even nine months. We do know that history argues the correction and consolidation should end sometime in 2018.
Gold is not too far away from breaking out
Gold is much closer to breaking its 2016 high than the miners but the miners could begin to sniff that potential breakout in Gold before or as it happens. Gold recently bottomed around $1240 with sentiment indicators at encouraging levels. In the chart below we plot Gold along with its net speculative position as a percentage of open interest (CoT) and the GLD put-call ratio. The CoT recently touched 27% which, although not a bearish extreme is fairly low relative to most readings since February 2016. The GLD put-call ratio recently touched the highest level in more than two years. With current sentiment relatively muted, Gold has a chance to rally up to trendline resistance. That would put it in position to breakout sometime in 2018.
Gold Stocks are one of the few sectors that offer compelling value
As we discussed last week, the gold stocks continue to offer historic value. The value is not quite as historic as in January 2016 when it was absolutely historic but it remains exceptional. Outside of the commodity sector there is nothing in a value sense that compares with the gold stocks. Even within the commodity sector, there is little that compares to gold stocks. Heading into 2018 traders and investors have to be intrigued at the deep value opportunity in the gold stocks in nominal and especially relative terms.
Increasing inflation expectations
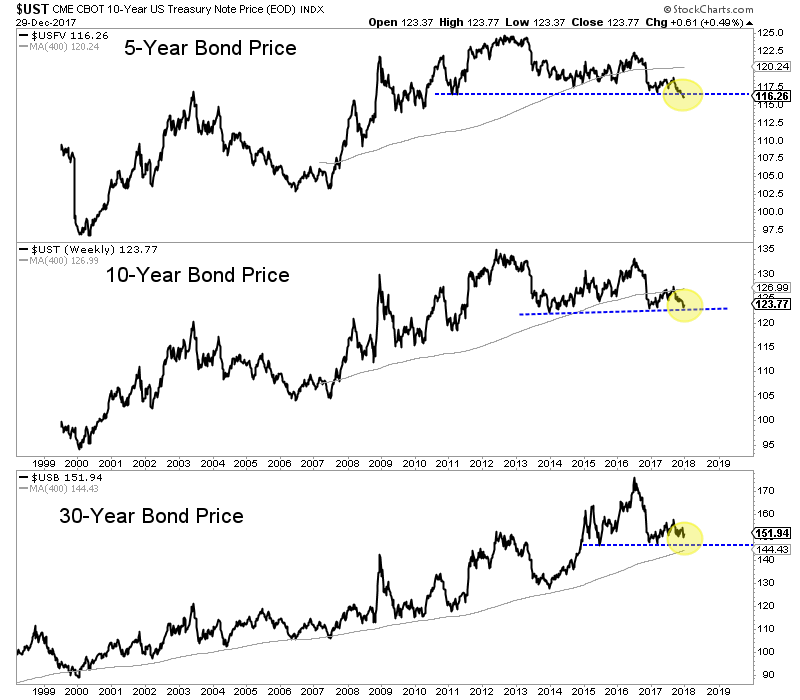
Commodities typically outperform at the end of an expansion and into the beginning of a recession. This is accompanied by rising inflation. Some commodity sectors have performed well but the commodities as a whole (CRB or CCI) has yet to make new highs. One thing that could trigger a sharp rise in inflation expectations would be a breakdown in long-term bond prices.
In the chart below we plot the 5-year bond price, the 10-year bond price and the 30-year bond price. The 5-year bond has already broken to a 7-year low while the 10-year bond is not far behind. The 30-year bond continues to hold above its 2015-2016 lows but does not have much wiggle room. A breakdown in the 10-year and 30-year bonds may not be immediately bullish for precious metals but a continued decline or acceleration to the downside would be.
The strength of the current rebound in the gold stocks has definitely surpassed our expectations and the December lows should hold moving forward. If that is the case then a breakout move for the gold stocks this year is more likely than not. More backing and filling may be ahead but if GDX and GDXJ can surpass their September highs it would be a very good sign for 2018. The miners have plenty of work to do before a true breakout move can begin but traders and investors would be wise to keep a close eye on the sector. We prefer companies with strong fundamentals that are trading at reasonable values and have upcoming catalysts that will drive buying. To follow our guidance and learn our favorite juniors for 2018, consider learning more about our premium service.


 Follow us on Twitter
 Become our facebook fan


