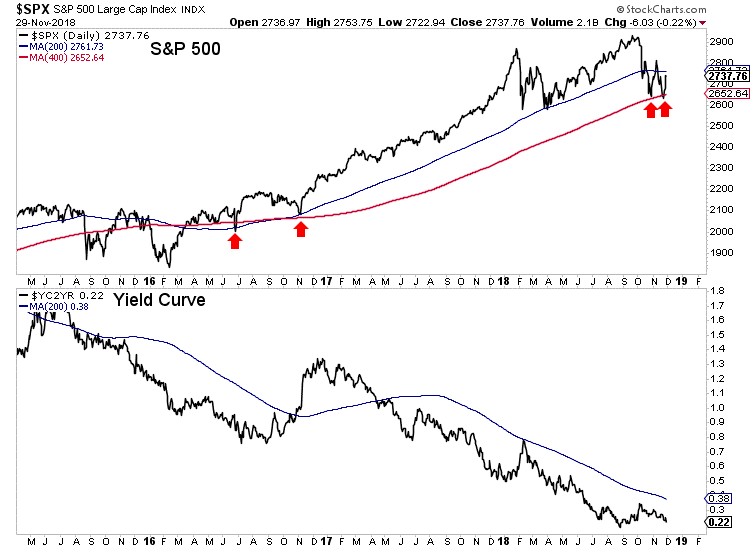
As we’ve been saying, the stock market will have great influence on Gold. It has been easy to see in recent months.
The S&P 500 has cracked, losing both its 200-day and 400-day moving averages. Gold and gold stocks have benefitted and gained in recent months even with a stable to rising U.S. Dollar.
The past 65 years of history shows us that in almost any context (but not all) the time between the Fed’s last rate hike and first rate cut is exactly when you want to buy gold stocks.
We don’t know if December is the last rate hike. No one does.
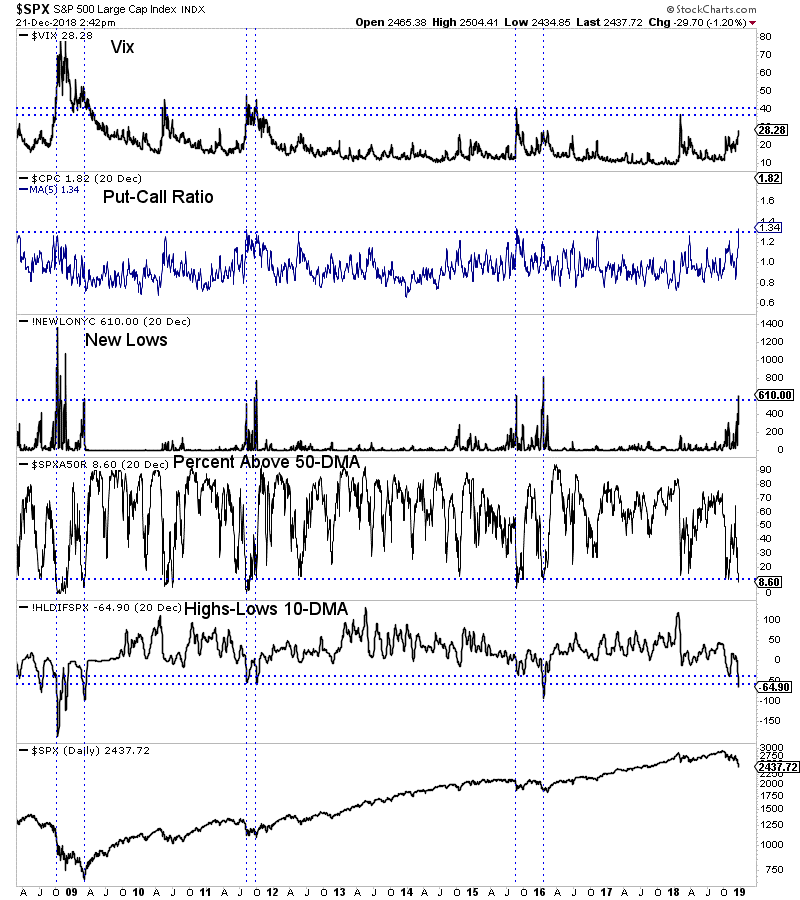
What we do know is the stock market is approaching an extreme oversold condition and is likely to begin a counter trend rally very soon.
In the chart below we plot five indicators that can help define an extreme oversold condition. These include the Vix, the put-call ratio and several breadth indicators. All but the Vix are in extreme oversold territory.
As we pen this article, the S&P 500 is trading at 2436.
The 40-month moving average, which has provided key support and resistance over the past 20 years (including the 2016 and 2011 lows) is at 2395 while the 50% retracement of the 2016 to 2018 advance is at 2380.
The setup for a bullish reversal is in place.
Meanwhile, despite the recent carnage in stocks, precious metals have been unable to surpass resistance.
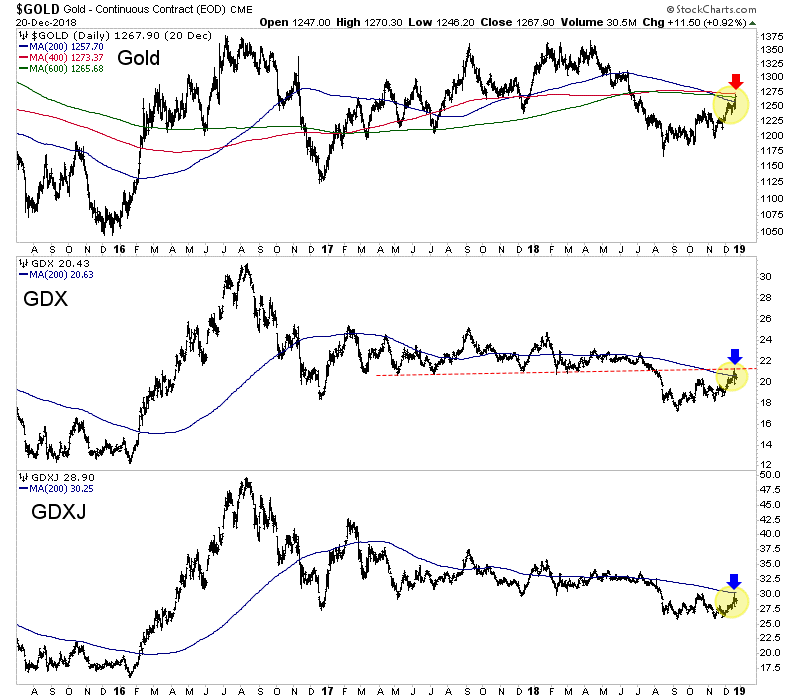
Gold is set to close the week right below a confluence of resistance at $1260-$1270. Perhaps it will close right on its 200-day moving average at $1258.
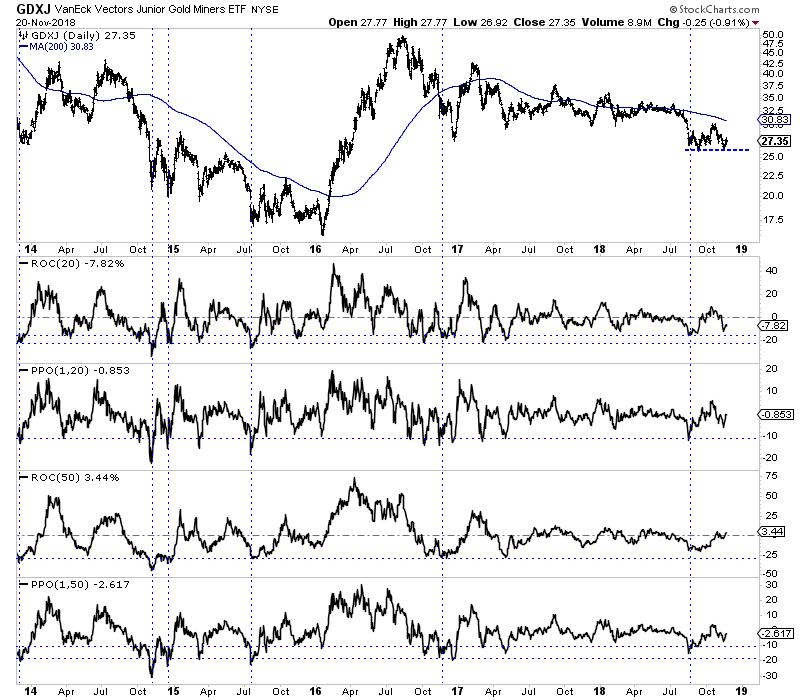
The gold stocks (GDX, GDXJ) have been strong since Thanksgiving but appear to have been turned back at their 200-day moving averages.
So in recent days the selloff in the S&P 500 accelerated but precious metals (at least to this point) failed to capitalize in a bullish fashion.
If the S&P 500 is within one or two days of a rally then we should not expect much more upside in Gold and GDX in particular. Those were the markets that benefited most from weakness in the S&P 500.
As we noted last week, the weakness in the stock market (and the economy) has not done enough to change Fed policy yet.
Over the past 65 years, the start of bull markets and big rallies in gold stocks coincided with the start of rate cuts. When the market sniffs the first rate cut, we will know precious metals are beginning a sustained advance and not another false start.
Recent market and economic developments are positive for Gold and precious metals but conditions are not bullish yet.
Bullish conditions and bullish fundamentals would be highlighted by a shift in Fed policy. They aren’t shifting yet. They are slowing, which precedes a shift.
From a market standpoint, we need to see strength in Gold in real terms (against stocks and foreign currencies) and a steepening of the yield curve. These developments along with shifting Fed policy will tell us a new bull market is soon to begin.
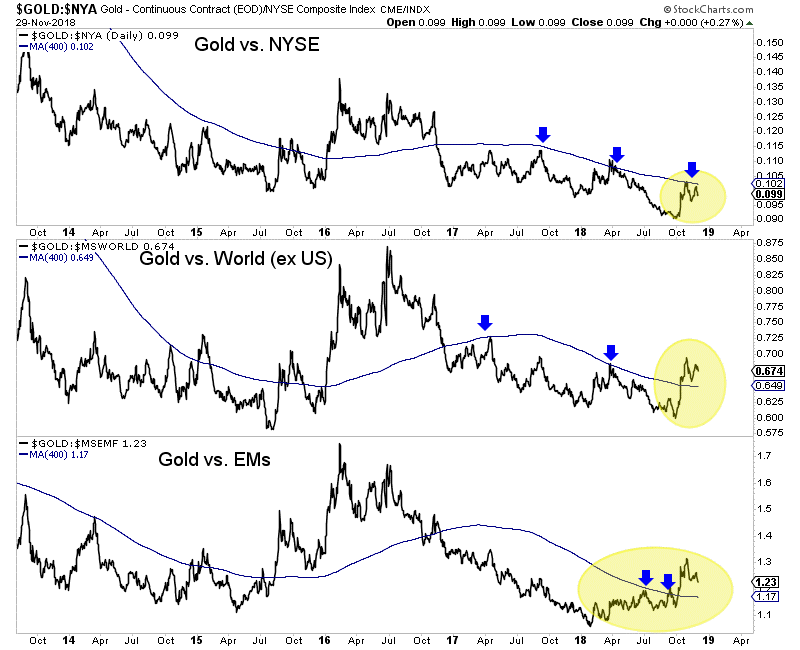
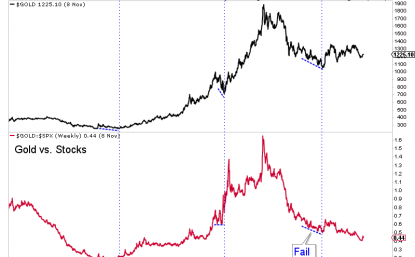
In regards to Gold against equities, the chart below shows both progress but the need for more strength.
Gold remains below its long-term moving average against U.S. stocks (NYSE). The trend has not turned bullish yet.
Gold relative to the rest of the world (U.S. excluded) and Emerging Markets has turned the corner but now must prove it can hold above the long-term moving average.
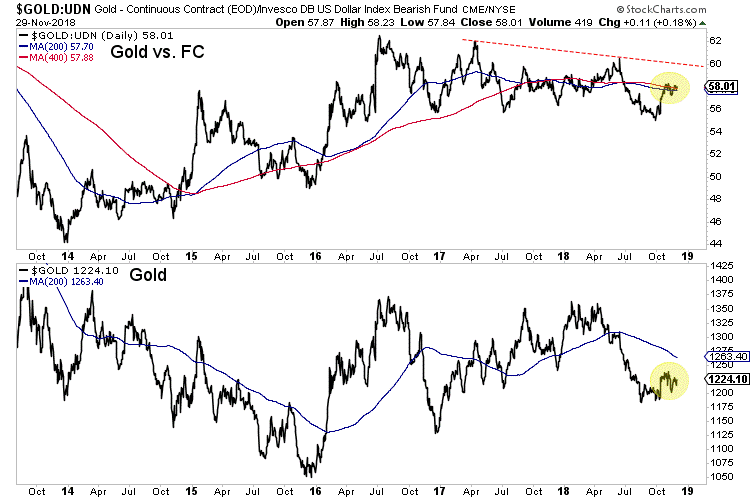
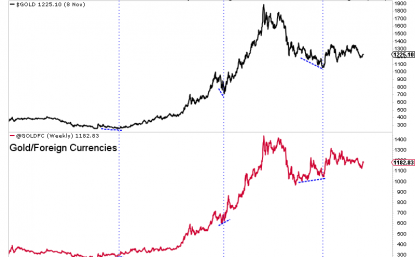
Gold relative to foreign currencies is at an interesting juncture as the chart below shows. Over the past month it has been battling with a confluence of resistance right at its 200 and 400 day moving averages.
From a market standpoint, the stock market is key as it will front-run Fed policy. It’s a reflection of the economy and health of corporations. A stronger stock market means tighter Fed policy.
That could go out the window if and when the S&P 500 loses its recent lows at the 400-day moving average. But these lows could hold for several months.
The yield curve continues to flatten, which is not bullish for Gold. Steepening is.
Although the Fed said something about rate hikes coming to an end and the market now expects only two more hikes, the conditions are not there for Gold.
On the fundamental side, history argues that conditions turn most bullish after the last hike and when the market begins to discount a new rate cutting cycle. It appears we are still months away from the last hike.
On the technical side, there is improvement in the leading indicators but nothing definite yet.
Gold has not broken out of its downtrend relative to U.S. stocks nor has it broken out against foreign currencies. These things should happen before a bull market begins.
In the meantime, don’t try to catch falling knives or chase weakness as there will be plenty of time to get into cheap juniors that can triple and quadruple once things really get going. Moreover, the start of the next bull looks to be more than a few months away.
It is very difficult to pick exact bottoms but there are many tools we can use to help us pinpoint potential bottoms.
You don’t hear technical analysts talk about fundamentals but we do for a reason. Major shifts in the primary trend are supported by fundamental shifts, though they can be very hard to spot until after the fact.
Because of our extensive study of history, we are convinced that precious metals will not begin a real bull market until the Fed stops hiking rates. The data shows that many times (though not every time) the gold stocks bottomed soon after the Fed’s final rate hike.
Yes, we’ve beaten this to death but the point is fundamentals matter.
Moving on, we are going to introduce you to a number of tools and indicators which you can use to spot potential bottoms and turning points on a shorter term basis.
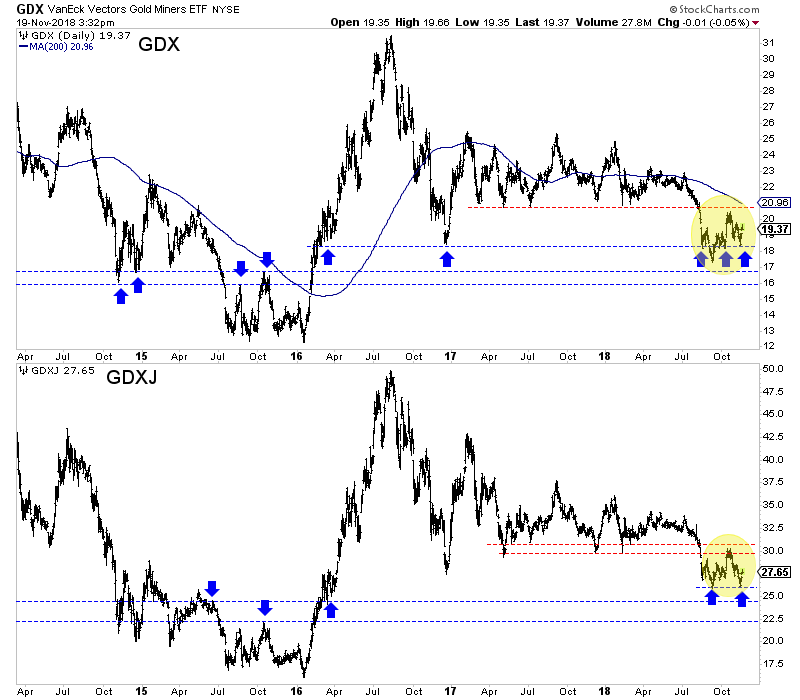
The first and foremost focus should be the price action and the various support and resistance lines that are nearby.
In the chart below, we highlight the support and resistance areas.
For example, GDX last week bounced from support at $18. It faces strong resistance above $20. A loss of $18 would likely lead to a test of support in the $16s. GDXJ meanwhile, bounced from its September low at $26. It faces strong resistance near $30 and if it loses the recent low could test support in the $22-$24 range.
1
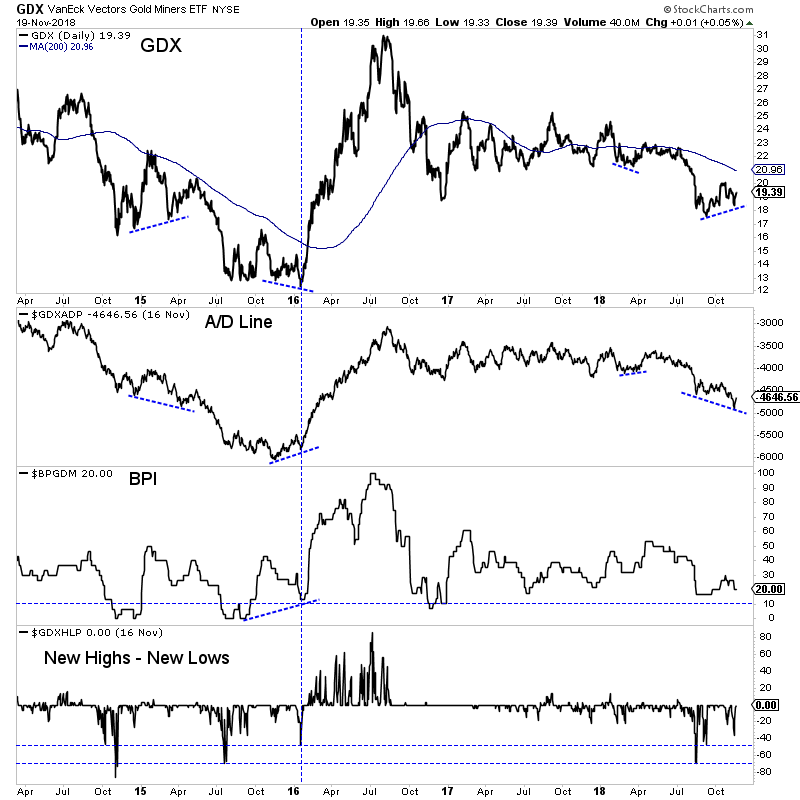
After considering the price action and important support and resistance levels, we turn to the breadth indicators which provide us information in regards to participation and sector divergences.
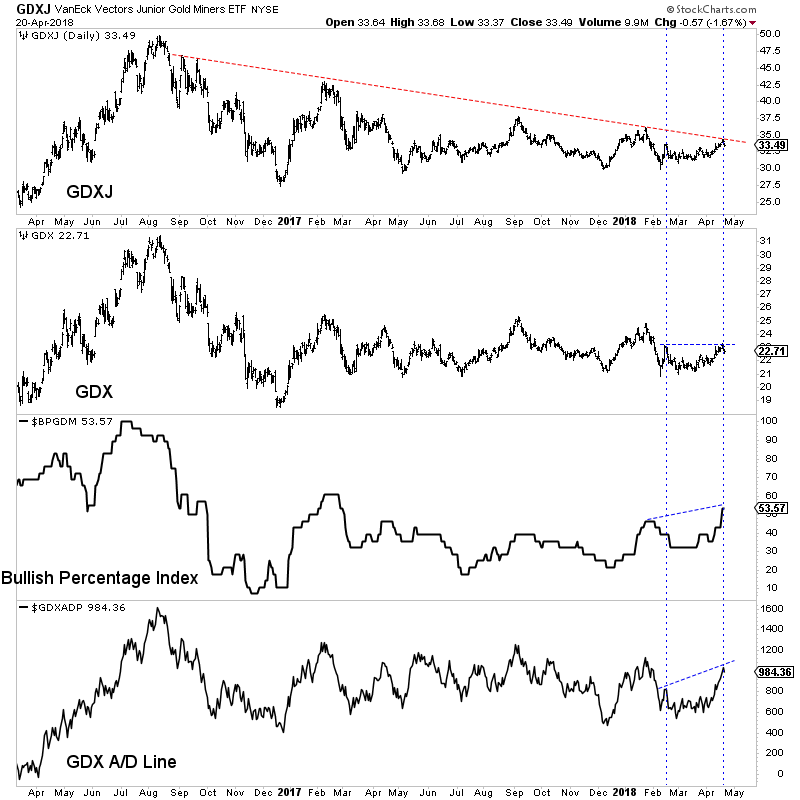
We plot GDX below along with its advance decline (A/D) line, the bullish percentage index (BPI) and new highs minus new lows.
The A/D line, which is one of the most trusted leading indicators is flashing a negative divergence. It looks similar to the one in early 2015. Note that it flashed a major positive divergence in early 2016. Smaller positive divergences were seen in March 2018 and September 2018.
The BPI currently is not telling us much. It needs to fall to 10% for the sector to be considered very oversold.
Days ago the new highs minus new lows indicator hit nearly -40%, which is fairly oversold. In my opinion over -50% or even -70% tends to signal a sustained low as it did in late 2014, summer 2015 and late summer 2018.
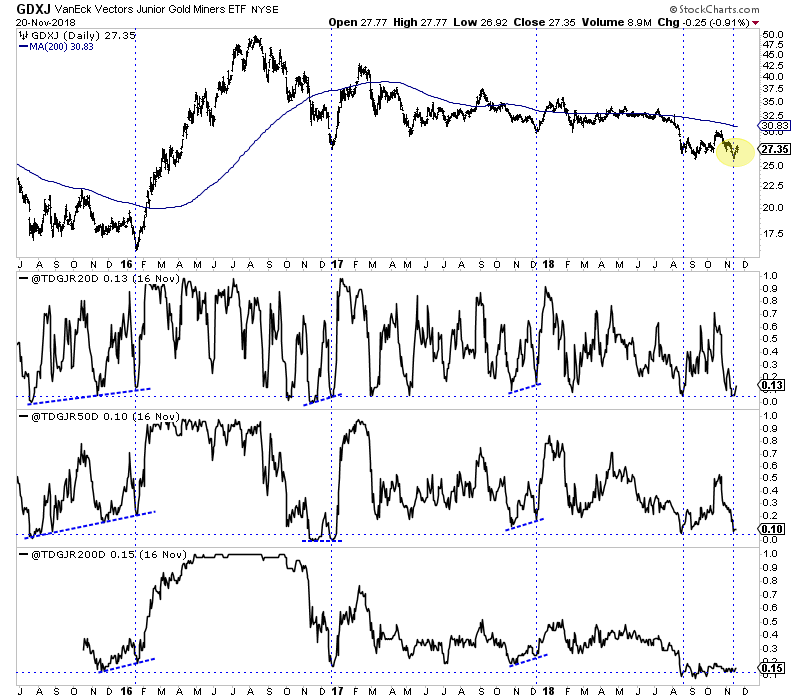
Another breadth indicator (and one we custom made for GDXJ) is the percentage of stocks that closed above various moving averages. Below we plot GDXJ along with the percentage of a basket of 55 junior stocks (mostly in GDXJ) that closed above the 20-day moving average, 50-day moving average and 200-day moving average.
This data showed a strong positive divergence in early 2016 as well in late 2017 and to a lesser degree in late 2016. Last week it showed an oversold condition in GDXJ but no positive divergences.
In addition to breadth indicators, we can also study how the stocks are performing versus the metals and we can track various momentum oscillators.
My two favorite oscillators to study are the rate of change indicator and the distance from the moving average indicator. We plot these in the GDXJ chart below on a 20-day and 50-day basis.
Note that the most oversold points usually occur on the first leg down or the first break of support. Subsequent tests of the same support will show a less oversold condition. That’s good if that low can hold. If not, it’s worse as the market will break to new lows in a less oversold state.
So what can we conclude from the current price action and these various indicators?
The gold stocks hit an oversold condition last week as evidenced by the very weak breadth in GDXJ and the new highs minus new lows indicator for GDX touching nearly -40%. They also hit some technical support.
However, there are no positive divergences in any of the breadth indicators and the GDX (A/D) line is flashing a serious negative divergence.
The recent weakness in Gold and gold mining stocks is not over. In fact, we are worried about another leg down getting underway.
If that comes to pass, we are positioned to profit from it. But I digress.
Long-term oriented investors and speculators should be aware of the near term trends but they should also be aware of the conditions that will lead to a shift from a bear market to a bull market.
Here, we focus on five factors that precede major bottoms in precious metals.
Gold Outperforms the Stock Market
Other than in 1985 through 1987 there has never been a real bull market in Gold without it outperforming the stock market. A weak stock market usually coincides with conditions that are favorable for precious metals. That’s either high inflation or economic weakness that induces policy that is usually bullish for precious metals. The 2016-2017 period failed to be a bull market because the equity market continued to outperform Gold. Note that the Gold to Stocks ratio bottomed prior to the 2001 and 2008 bottoms.
Gold Outperforms Foreign Currencies
Gold outperforming foreign currencies is important because this usually happens while the US Dollar remains in an uptrend. It signals relative strength in Gold and shows that Gold is not being held hostage by the strong dollar. It also can signal a coming peak in the dollar. Gold was outperforming foreign currencies prior to the 2001, 2008 and late 2015 bottoms. There are currently no positive divergences in place.
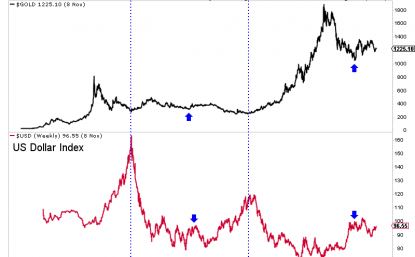
Major Peak in the US Dollar
This does not precede bottoms in Gold as it typically is a lagging indicator. But a list of “4” things does not carry the same weight as five. Anyway, Gold is not going to embark on a major, long-lasting bull market without a corresponding peak in the US Dollar. Sure, they can rise at the same time and for months on end. However, it’s difficult to imagine a multi-year bull market in Gold without a corresponding peak in the dollar. Peaks in 1993 and 2016 led to brief runs in Gold but those were nothing like the 1985 and 2001 peaks.
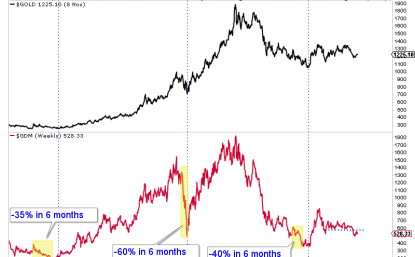
Gold Mining Stocks Crash
This is not a mandatory component of major bottoms but definitely is something that can occur before a major bottom. Below we plot GDM, which is the forerunner to GDX. Note that gold stocks essentially crashed into their late 2000 and late 2008 lows. They also crashed into their summer 2015 low which wasn’t the final low for the sector but was for the senior miners. The main point is that if gold mining stocks fall apart again it could very well be a sign that a bottom is almost imminent.
Fed Policy Change
Over the past 60 years, gold stocks have often bottomed almost immediately after the peak in the Fed Funds rate (FFR). In 10 of 12 rate cut cycles, gold stocks bottomed a median of one month and an average of two months after the peak in the FFR. The average gain of gold stocks following that low was 185%. There are also points where the gold stocks declined during a period of rate cuts or no Fed activity. Bottoms then were sometimes followed by the start of Fed hikes. However, given the current conditions, we are quite confident that gold stocks will bottom immediately after the Fed’s final rate hike.
Now you know what to look for to signal that a major bottom is imminent.
Gold failed to breakout in the spring and recently lost weekly support at $1310. Meanwhile, the gold stocks have held up well in recent weeks (considering Gold) but still have much to prove. Silver couldn’t rally much when its net speculative position was at an all time low. The question now is where do things go from here. The price action is not bullish but with a Fed hike looming and negative sentiment, Gold could be poised to snapback after testing lower levels.
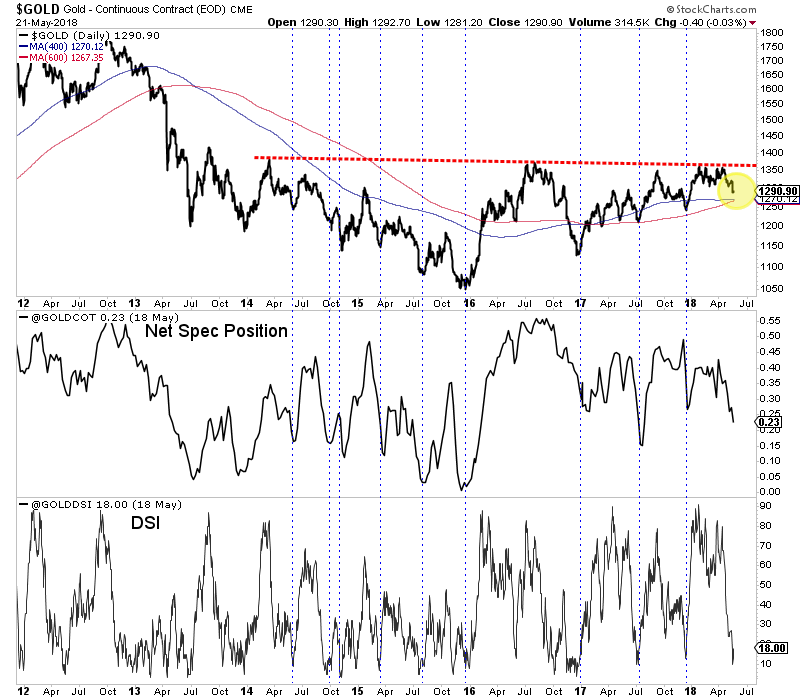
The technicals for Gold show a strong confluence of support at $1265 to $1270. It has traded as low as $1281 in recent days. Trendlines and long-term moving averages coalesce at $1265 to $1270. On the weekly chart, $1265 stands out as a key level. A little bit more selling could bring Gold down to key support.
Gold with Sentiment Indicators
The sentiment indicators (shown at the bottom of the above chart) are encouraging and would be more so with a test of that aforementioned support. The net speculative position as of last Tuesday hit 22.7% of open interest, which is one of the lowest readings of the past two years. The daily sentiment index hit only 10% bulls last week. It’s 21-day average is 32% bulls and if that fell below 30% it would mark a 9-month low.
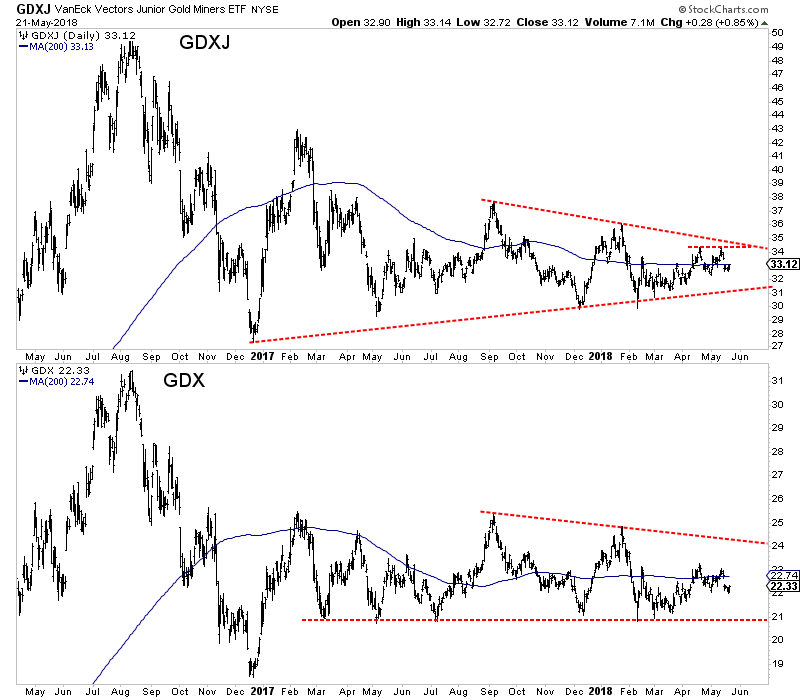
Turning to the miners, we find a sector that continues to be wedged in between support and resistance. GDXJ has trendline and lateral support in the $31s with key resistance in the low $34s. GDX has immediate support at $22 and strong support at $21 while initial resistance is at $23. If Gold is to have another chance to breakout in the months ahead then GDX and GDXJ need to surpass their April highs.
GDXJ, GDX Daily Bar Charts
While we are concerned about Gold for the remainder of 2018, it could be setting up for a summer rally and especially if it drops to strong support around $1265. Sentiment would reach even more encouraging levels and that coupled with strong technical support could produce a rebound. In the meantime we continue to focus on and accumulate the juniors that have 300% to 500% return potential over the next 12 to 18 months. To follow our guidance and learn our favorite juniors for the balance of 2018, consider learning more about our premium service.
It was music to gold bug ears.
We’ve all heard the seemingly shocking or outrageous price targets for Gold. So it’s not new.
But this time from a non gold pusher. Someone with credibility in the larger financial world and a track record to boot.
Gundlach’s comment was included in every piece of Gold literature that recently crossed my desk. No doubt, if Gold starts breaking to the upside, Gundlach’s quote will be used by aggressive marketers and publishers. But I digress.
According to ZeroHedge, Gundlach said that based on classic chart reading, there is an “explosive, potential energy” of a huge “head and shoulders bottom” base, signaling a move of $1000/oz.
But there’s one problem.
I like Jeff Gundlach. He’s way smarter and way more successful than me.
But there’s no technical basis for $1000/oz upside in Gold.
The measured upside target from the recent years of consolidation projects to $1700/oz. Upon a break above $1375/oz, the target becomes $1700/oz, with a pit stop likely around $1550/oz.
The next strong technical targets, following $1700 are $1800 and $1900, the all-time high.
The biggest moves (in nominal terms) in most markets occur after breakouts to new all time highs.
As you can see, Gold is one of the best examples of this. Look at how Gold surged after 1971, 1978 and 2009.
Gold Weekly Line Chart
The potential breakout through $1375/oz would be the most significant one since 2005 when Gold took out +20 year resistance to make a new multi-decade high. Sure, the breakouts in 2008 and 2009 were quite significant but Gold’s bull market was already well established.
Circling back to Gundlach’s target, I don’t see anything technically that points to $2,375 being a strong target. The strongest targets are $1700, $1800 and $1900. The most significant upside move would likely be a retest of the all time high. That is roughly $525/oz of upside.
But upside of $1000/oz sounds better and makes for better headlines than $525/oz of upside. In other words, it will get picked up by media outlets. (Think of Jim Rickards $10,000 target which has been given quite a bit of coverage on mainstream outlets).
My guess is Gundlach thinks Gold is going to break to the upside and his $1000/oz upside call is a way for him to get credit for calling the breakout while remaining front and center in the media.
At present, Gold is trying to recover after failing to make a weekly close above $1350/oz for five consecutive weeks. The good news is the gold stocks have held up quite well and so too has Gold priced against foreign currencies. If these conditions persist during weakness in Gold then it suggests Gold would have another chance to breakout sooner rather than later. In anticipation of that breakout, we have been accumulating the juniors with 300% to 500% upside potential over the next 18-24 months. To follow our guidance and learn our favorite juniors, consider learning more about our premium service.
It was an interesting week in the precious metals complex. There appeared to be the start of a short squeeze in Silver (hedge funds were heavily short) but it ceased at an important resistance. Meanwhile, Gold closed the week on a weak note, losing $1340-$1350. The gold stocks, like silver closed the week below technical resistance. The price action in the complex continues to suggest that a breakout in Gold is the key to unleashing strong outperformance from Silver and the gold stocks.
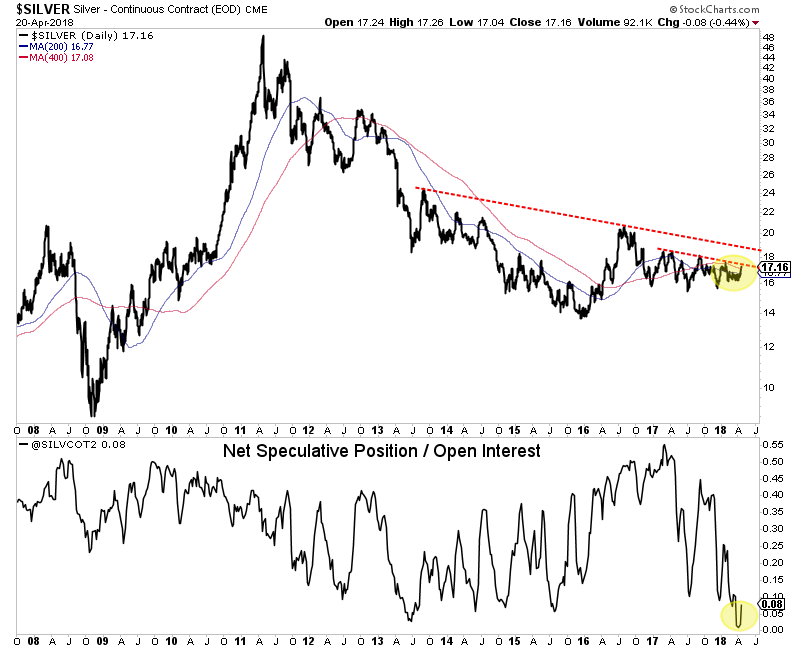
While Silver has very supportive sentiment, it has not broken out from its downtrend yet. The net speculative position was at 1.1% a few weeks ago, an all time low. That won’t spring Silver by itself unless Silver can surpass critical resistance in the mid $18s. And that may not happen until Gold breaks $1360-$1370. Silver has strong support in the low to mid $16s.
Silver & Silver Net Speculative Position
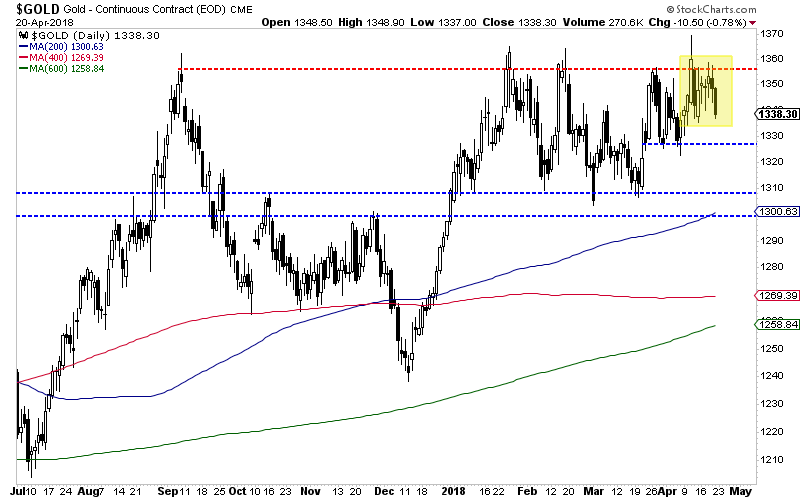
Moving to Gold, the daily chart below shows Gold losing $1340-$1350 after rejection again at $1360. Immediate support for Gold lies at $1325 which if broken would lead to a test of $1300-$1310 and the 200-day moving average.
Gold Daily Candles
We have a few observations to share with respect to the gold stocks. First, GDXJ has pulled back from trendline resistance around $34. Second, breadth indicators for GDX such as the advance decline line (A/D) and the bullish percentage index (BPI) are showing a positive divergence. The BPI has reached a 52-week high while the A/D line is not far from its January peak when GDX nearly hit $25. So while GDX has been relatively weak, its internals are showing more strength.
Silver and the gold stocks have yet to break important resistance as Gold once again was turned back at major resistance. If the US Dollar, which closed at 90.07, rallies up to its 200-day moving average at 92, Gold would likely test $1300-$1310. Should Silver and the gold stocks hold up well in that scenario (which could be suggested by current breadth) then it would imply a good rebound from the sector back to resistance points. Lower prices in the juniors would be a welcome sign and another opportunity to accumulate ahead of a major breakout in the not too distant future. In anticipation of that breakout, we have been accumulating the juniors with 300% to 500% upside potential over the next 18-24 months. To follow our guidance and learn our favorite juniors, consider learning more about our premium service.
Gold was well bid during the equity correction but it could not breakout then and has retreated as equities have roared back. As a result, the Gold to stocks ratio has retraced most of its recent surge. Meanwhile, the US Dollar has rebounded and the oversold and overhated bond market could be starting a rally. The recent rise in long-term bond yields which has benefitted Gold appears due for a pause or correction. Meanwhile, Gold could also correct and consolidate as it waits for a breakout in long-term bond yields which should in turn benefit Gold.
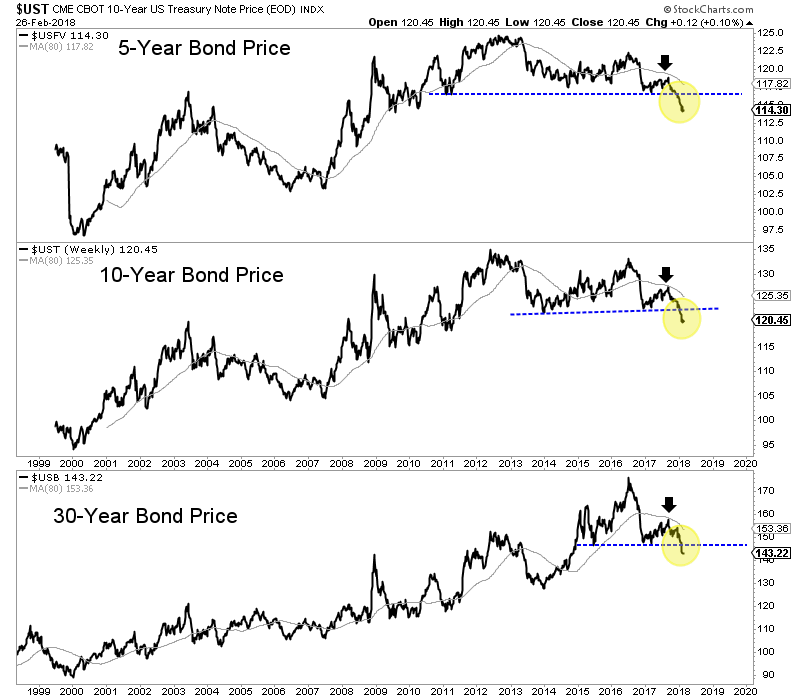
As we noted in One Big, Potential Catalyst for Gold in 2018, Gold is no longer trading with bonds and therefore could benefit from a big breakdown in bonds. As the chart below shows, the bond market has experienced a major breakdown. In recent days, the 5-year, 10-year and 30-year bonds all touched multi-year lows.
The breakdown in the bond market has helped Gold rally but why hasn’t Gold reached the corresponding multi-year highs?
First, we should remember that the correlation between Gold and bonds was positive until November 2017. The market has begun to sense inflation only recently.
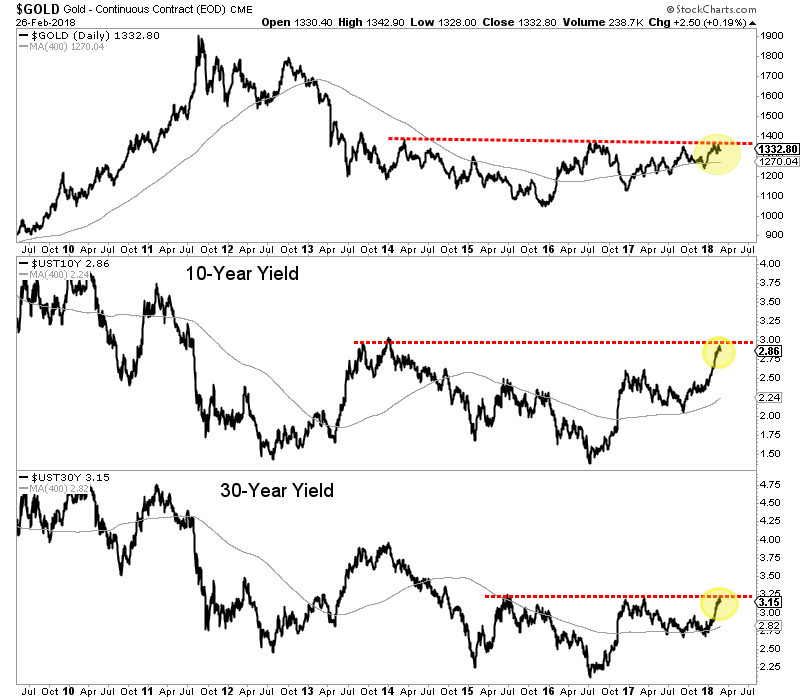
Second, while bond prices have broken down to multi-year lows, bond yields (and specifically long-term yields) have yet to breakout to multi-year highs.
The chart below shows long-term yields are testing multi-year resistance. For the 10-year yield, a strong push above 3.00% would mark more than a 6-year and almost 7-year high. A break above 3.25% in the 30-year yield would mark a 4-year high.
We have argued that Gold was unlikely to breakout immediately due to its lack of relative strength as well as the lack of strength from Silver and the gold shares.
If that remains the case then we would also expect bond yields to correct and digest their recent advance rather than breakout. We should also note that the daily sentiment index for bonds hit an 18-day average of 15% bulls. That is a bearish extreme and suggests the probability that bonds will rebound and yields will decline.
Gold could be waiting for a major breakout in bond yields, which would be a reflection of increasing inflation and inflation expectations. It would also result in more pressure on the economy and therefore the stock market. That would benefit Gold in both nominal and real terms. We expect a counter-trend move in Gold and bond yields before a breakout. This will allow us a bit more time to position in the juniors that should deliver fantastic returns. To follow our guidance and learn our favorite juniors for the next 12-18 months, consider learning more about our service.
Gold and gold stocks have enjoyed an excellent rebound since their December lows. Over the past six weeks Gold rebounded from a low of $1238 all the way to $1365 in recent days. The miners meanwhile rebounded nearly 18% (GDX) and 21% (GDXJ). However, these markets are approaching important resistance levels and at a time when sentiment is becoming stretched and the US Dollar has become very oversold.
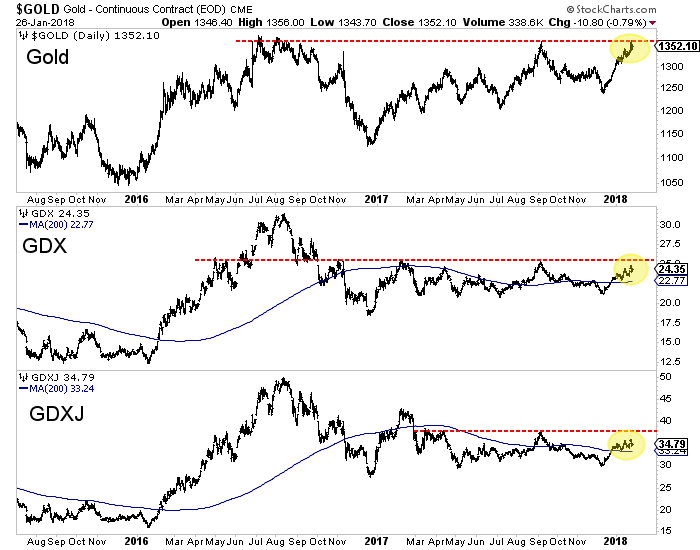
Take a look at the charts of Gold, GDX and GDXJ. Gold has reached the September 2017 highs while GDX came within 2%-3%. GDXJ is lagging but came within less than 5%. Another round of buying over a few days should be enough to push the miners to resistance.
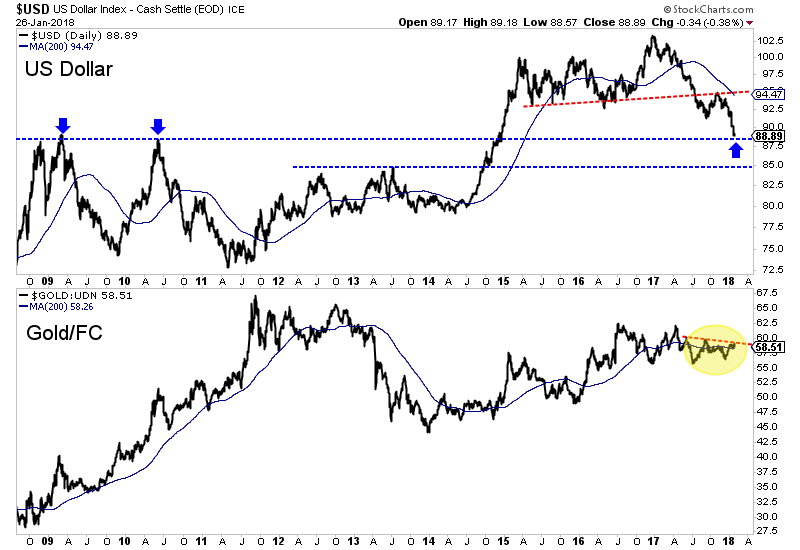
Recent strength in Gold and gold stocks is mostly due to weakness in the US Dollar which is very oversold and approaching important support. On Friday, the US Dollar Index touched 88, which marks the 2009 and 2010 peaks and is the only real support between the low 80s and the low 90s. We also plot Gold against foreign currencies (Gold/FC) which tells if Gold is rising in real terms or if its rising due to the US Dollar weakness. Gold/FC failed to break above key resistance. That signals that over the short-term, Gold would be vulnerable to a bounce in the US Dollar.
Some sentiment indicators suggest the rebound in precious metals could be in its later innings. Thursday the daily sentiment index for Gold hit 91% bulls. Friday, the daily sentiment index for the greenback hit 10% bulls. The CoT’s are not as extreme. Gold’s net speculative position (relative to open interest) is 40% bulls. The 2011, 2012 and 2016 peaks were around 55% bulls. Meanwhile, Silver’s net speculative position is at 26% bulls.
Gold and gold stocks have enjoyed a great rebound since the Fed rate hike but technicals and sentiment suggest they are due for a pause or correction. The miners and Gold are very close to the resistance levels we noted in a recent editorial. Recent strength has been driven mostly by weakness in the US Dollar which is very oversold and testing support. Meanwhile, the daily sentiment index has reached short-term extremes for Gold and the greenback. The odds appear to favor a pause in this rebound or a short-term correction. That is great news for anyone who missed the rally as it would setup a decent buying opportunity before a major breakout. We continue to seek the juniors that are trading at reasonable values but have fundamental and technical catalysts that will drive increased buying. To follow our guidance and learn our favorite juniors for 2018, consider learning more about our premium service.
We started employing analog charts during the latter stages of the seemingly forever bear market in precious metals. Comparing current to past trends by using price data is not considered technical analysis but it is extremely valuable because history tends to repeat itself. It also helps us identify extremes as well as opportunities. For example, in 2015 it was clear the epic bear market in gold stocks was due for a major reversal. Today, precious metals appear to be in the early innings of a cyclical bull market and the analogs suggest there is plenty of room to run to the upside.
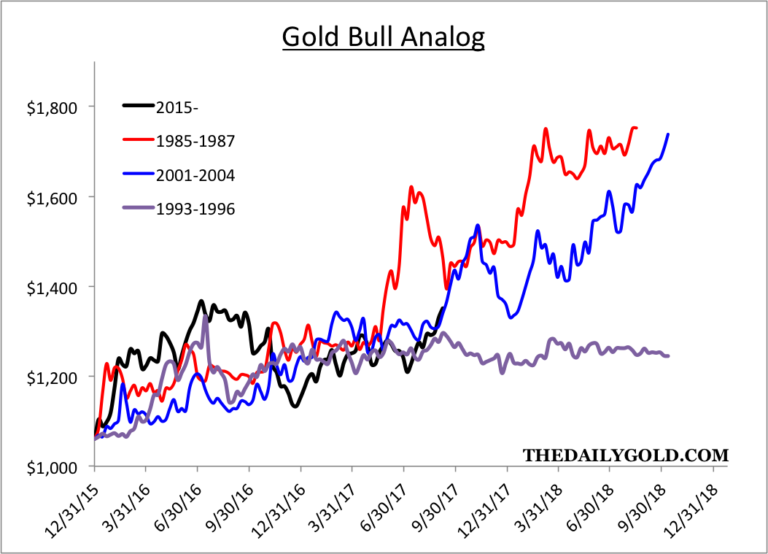
The first chart compares the current recovery in Gold to past recoveries. In recent quarters we had anticipated a similar, explosive rebound like in 2008 and 1976. However, with 18 months of evidence we can now say the current rebound most resembles the rebounds that started in 1985 and 2001. Both of those rebounds imply Gold could reach $1700/oz by Q4 of 2018. However, if Gold cannot takeout the resistance around $1375 then it could end up following the path of the 1993 rebound.
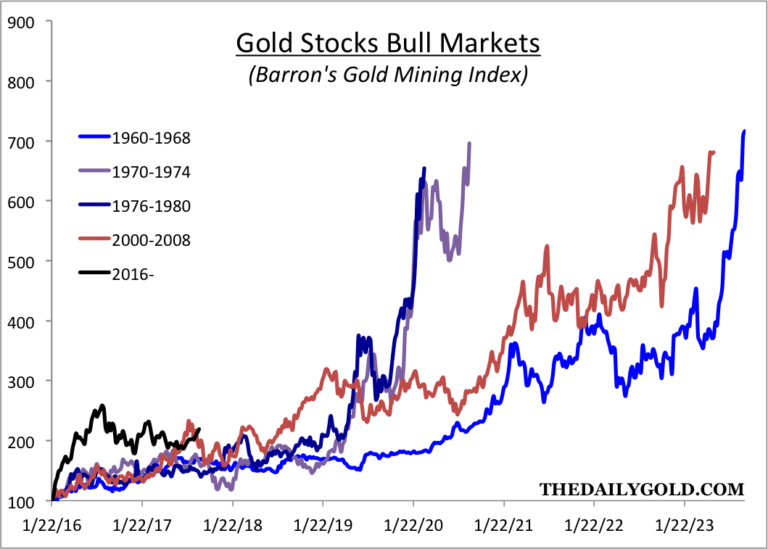
Next we look at the large cap gold stocks. The data is from the Barron’s Gold Mining Index (BGMI) which is one of the few indices with a multi-decade history. If one were to look at the HUI or GDM (parent index of GDX) it would show the gold stocks are currently behind the rebound that began in the fourth quarters of 2000 and 2008. Data from the BGMI implies the rebound in gold stocks is ahead of schedule. In a broader sense, the BGMI certainly has plenty of room to run as many of its bull markets have achieved 7-fold returns.
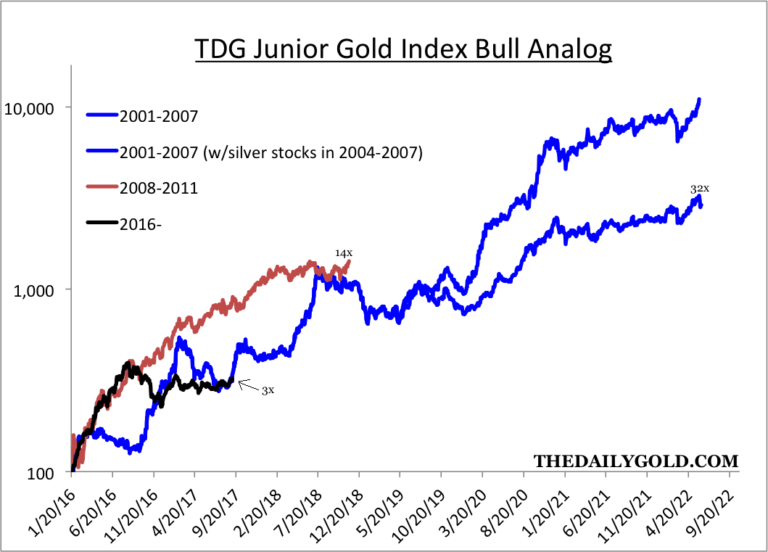
Next is an analog constructed from data from my custom junior gold indices. The juniors are currently right at the point where the 2001-2007 bull made a massive move higher over the next 12 months. The two bulls for comparison are a very long cycle (+6 years and less than 3 years). At worst, I’d expect this bull to last somewhere in between. If Gold makes a clean break above $1375/oz then I’d expect this bull to advance to the 14x peak the other bulls achieved before 2019.
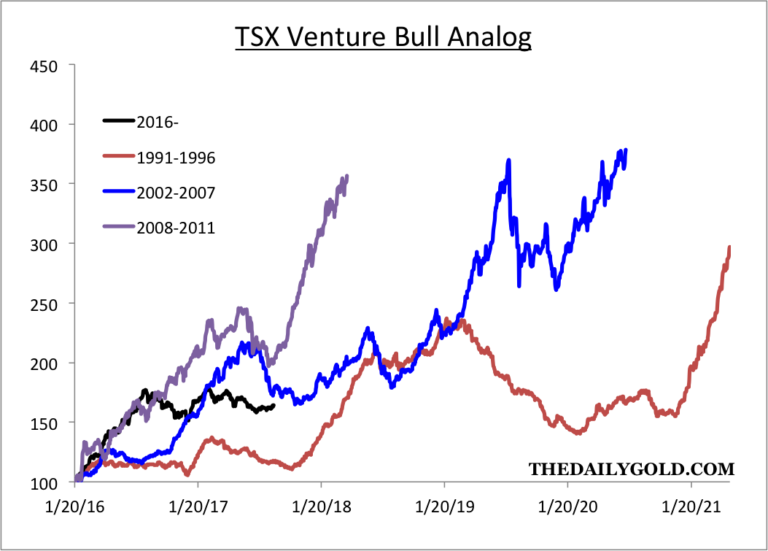
Finally, here is the TSX Venture Index. The three previous bulls averaged close to a 250% gain. The current bull is up roughly 60%. The gains for the overall index are muted as the index contains a large amount of worthless companies. Nevertheless, the bull market has plenty of room to run in terms of time and price.
The analogs show that the current bull market in Gold, gold stocks and juniors is obviously in the early innings in both time and price. Interestingly, the analog for Gold and the junior gold stocks suggests there is the possibility of strong upside potential over the next 12 months. If Gold breaks above major resistance around $1375/oz, then the juniors and large gold stocks could realize that upside potential over the next 18 months. Although the fledgling correction in precious metals could continue and expand, the broader risk to reward is skewed to the upside. Therefore, we want to accumulate the best opportunities in the juniors on weakness. To find out the best buys right now and our favorite juniors for 2018, consider learning more about our premium service.
Jordan Roy-Byrne CMT, MFTA
Jordan@TheDailyGold.com
Three weeks ago we discussed how Gold needed to perform considering the US$ index was likely to bounce due to an oversold condition and extreme bearish sentiment.
We wrote: “Simply put, Gold will have to prove itself in real terms if it is going to hold its ground or breakout as the US$ begins a likely bounce.”
The US$ index has enjoyed only a slight rebound but Gold has maintained its 2017 US$ weakness induced gains because of its strong relative performance. Below we plot the daily line chart of Gold and a number of ratios: Gold against foreign currencies (Gold/FC), Gold against Equities and Gold against Bonds. Since the July low, Gold has showed good nominal and relative performance.
The key has been the strong rebound in Gold/FC and the breakout in Gold/Equities. Gold/FC has broken above two trendlines and is now testing its 200-day moving average. Meanwhile, Gold/Equities has broken above one trendline and has regained its 200-day moving average. It would be very bullish for Gold if Gold/FC pushed through its 200-day moving average while Gold/Equities pushed above trendline 2. Those moves would likely accompany a Gold breakout through $1300/oz but more importantly, they would put Gold in a position of trading above its 200-day moving average in nominal terms and against the major asset classes (stocks, bonds, currencies).
Although Gold failed to break above $1300/oz today (Friday), it remains in position to do so because of its renewed strength in real terms. As long as the US$ index does not rally hard, we expect Gold to break above $1300 and reach $1375. The gold stocks as a group have been lagging recently but in the event of a Gold breakout, we foresee significant upside potential as the group could play catch up. Consider learning more about our premium service including our favorite junior exploration companies.


 Follow us on Twitter
 Become our facebook fan


