

Lavras Gold (TSXV:LGC) recently announced significant follow-up drilling results at their Fazenda do Posto discovery within the LDS Project in southern Brazil. This discovery, initially reported in August 2023, has now been further validated in terms of gold grades, widths, and continuity, with potential for resource expansion in several directions.
Lavras Gold President & CEO Michael Durose commented in a press release: “We are very pleased to validate the Fazenda do Posto gold discovery with this scissor hole, which cross cuts the earlier hole that returned 340 m at 1.1 g/t gold. While it is still early in the drilling program, we are delighted to have intercepted another very long and continuous zone of gold mineralization starting at a shallow depth and running for over 200 metres. This is a unique bulk tonnage near-surface gold system characterized by remarkably continuous gold mineralization within an episyenite host rock. A higher-grade core of gold mineralization is beginning to develop based on the limited drilling we have completed so far. Drilling is ongoing and we look forward to additional drill results as we begin to unravel this new gold discovery.”
The Fazenda do Posto discovery, situated about 150 meters west of the Lavras Gold Butiá Gold Deposit, shows promising proximity to the Butiá deposit, which itself holds an NI 43-101 gold resource of approximately 500,000 ounces and is open for expansion.
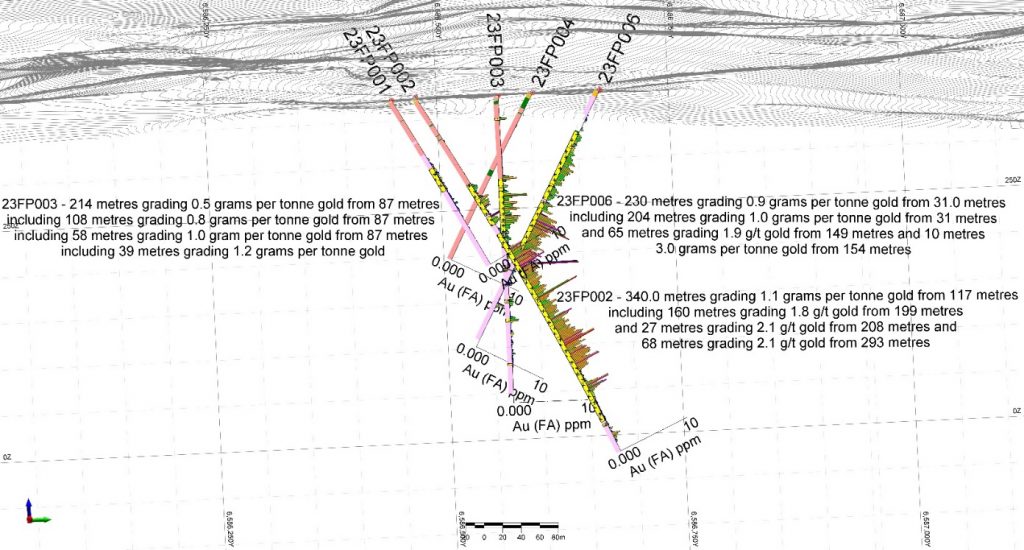
Drill hole 23FP006, a focal point of this announcement, was aimed at exploring the northeastern extension of Fazenda do Posto. It was positioned roughly 210 meters northeast of the initial discovery hole, 23FP002, and yielded continuous gold mineralization starting at a depth of 31 meters for a span of 230 meters. Detailed assay results have been tabulated and disclosed for this hole.
This discovery signifies a potential critical mass of gold mineralization in the area, further advancing Lavras Gold’s goal of developing a bulk tonnage open pit gold mine. Despite challenges such as record rainfalls impacting drilling site access and causing delays, the company has expedited efforts to define the new discovery’s geometry and grade distribution. To date, two drill rigs have completed over 3,000 meters of drilling across 14 holes at Fazenda do Posto.
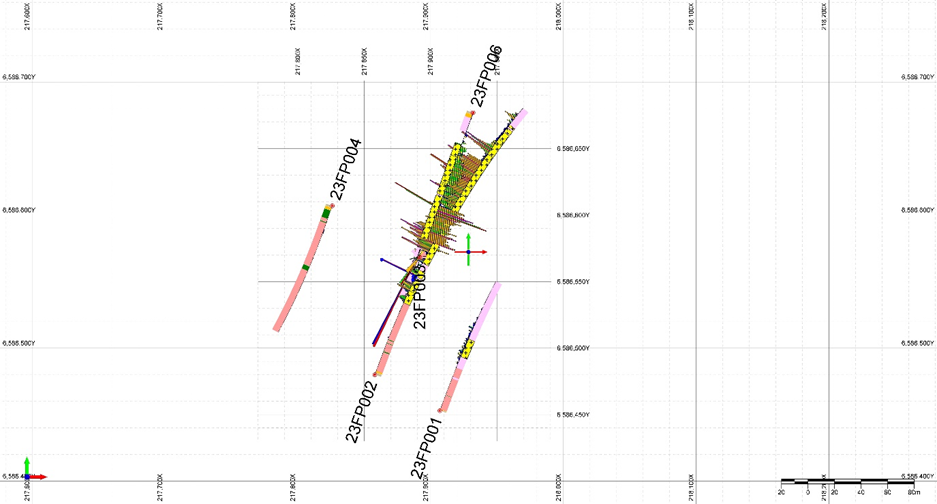
The drilling results from Fazenda do Posto, located along the western edge of the Lavras do Sul intrusive complex and near the town of Lavras do Sul, are highly encouraging. Four drill holes totaling 1,520 meters have been completed, each yielding varied results. These include 23FP001 encountering modest gold values, 23FP002 confirming gold mineralization to a vertical depth of approximately 390 meters, and 23FP003 and 23FP004 showing significant mineralization and hydrothermal alteration respectively.
Looking ahead, Lavras Gold aims to further explore and define the Fazenda do Posto discovery and the Butiá Gold Deposit. The medium-term goal is to prepare a preliminary economic study for a potential gold mining project, supported by ongoing regional exploration within the broader 22,000-hectare LDS Project.
The overall success of the LDS exploration program has been noteworthy since Lavras Gold went public in April 2022. This includes completing a regional drone magnetic survey, ongoing soil geochemistry programs, and the reinterpretation of the Caneleira Gold Discovery. New gold mineral systems have been identified at various locations within the property, indicating a significant upside for continued exploration and development.
Highlights from the results are as follows:
- Hole 23FP006 includes 65 metres at 1.9 g/t gold and including 10 metres at 3.0 g/t gold
- Hole 23FP006, a scissor hole that cuts across discovery hole 23FP002, confirms the lateral continuity of gold mineralization for about 180 metres in a northeast direction and starting at a drill hole depth of 31 metres.
- The vertical extent of gold mineralization at the Fazenda do Posto discovery has been traced for 330 metres.
- Vertical Hole 23FP003 drilled 58 metres grading 1.0 g/t gold starting at a drillhole depth of 80 metres within a larger gold mineralized interval of 214 metres.
- Three drill holes – FP002, FP003 and FP006 have returned significant gold assay results displaying continuous gold mineralization over very long intervals. The gold mineralization typically occurs within a brick-red coloured episyenite. The gold is usually associated with fine grained disseminated pyrite and/or arsenian pyrite and usually occurs with iron-rich dark green to black chlorite. Grey-white carbonate vesicles are typically associated with the gold mineralized zone. Photos showing examples of mineralized episyenite are shown in Figure 4, Figure 5 and Figure 6.
- Gold mineralization has been traced over a northeast-southwest extent of about 180 metres, and a vertical distance of 330 metres. Gold mineralization starts at a vertical depth of about 26 metres in the northeast area, as defined by drill hole 23FP006, and approximately 100 metres depth as defined by drill hole 23FP002.
- A higher-grade core of mineralization appears to be developing in the centre of the deposit, flanked by lower to moderate gold grades along the margins.
TABLE 1. Summary table of metre-by-metre drilling assay results from drill hole 23FP006 on Fazenda do Posto target.
| Hole | Azimuth (degrees) |
Dip (degrees) |
End of hole (metres) |
From (metres) |
To (metres) |
Gold interval (metres) |
Gold grade (g/t) |
Lithology |
| 23FP006 | 200 | -60 | 299.83 | 31.1 | 32.0 | 0.9 | 0.31 | Episyenite |
| 33.0 | 35.0 | 2.0 | 0.14 | Episyenite | ||||
| 35.0 | 37.0 | 2.0 | 0.11 | Episyenite | ||||
| 37.0 | 39.0 | 2.0 | 0.35 | Episyenite | ||||
| 39.0 | 41.0 | 2.0 | 0.02 | Episyenite | ||||
| 41.0 | 43.0 | 2.0 | 0.01 | Episyenite | ||||
| 43.0 | 45.0 | 2.0 | 0.01 | Episyenite | ||||
| 45.0 | 47.0 | 2.0 | 0.02 | Episyenite | ||||
| 47.0 | 48.0 | 1.0 | 0.32 | Episyenite | ||||
| 48.0 | 49.0 | 1.0 | 0.55 | Episyenite | ||||
| 49.0 | 50.4 | 1.4 | 0.01 | Episyenite | ||||
| 50.4 | 51.7 | 1.3 | 0.01 | Episyenite | ||||
| 51.7 | 53.0 | 1.3 | 0.01 | Episyenite | ||||
| 53.0 | 54.0 | 1.0 | 0.01 | Episyenite | ||||
| 54.0 | 55.0 | 1.0 | 0.34 | Episyenite | ||||
| 55.0 | 56.0 | 1.0 | 0.74 | Episyenite | ||||
| 56.0 | 57.0 | 1.0 | 0.41 | Episyenite | ||||
| 57.0 | 58.0 | 1.0 | 0.50 | Episyenite | ||||
| 58.0 | 59.0 | 1.0 | 0.62 | Episyenite | ||||
| 59.0 | 60.0 | 1.0 | 0.65 | Episyenite | ||||
| 60.0 | 61.0 | 1.0 | 0.50 | Episyenite | ||||
| 61.0 | 62.0 | 1.0 | 0.35 | Episyenite | ||||
| 62.0 | 63.0 | 1.0 | 0.30 | Episyenite | ||||
| 63.0 | 64.0 | 1.0 | 0.43 | Episyenite | ||||
| 64.0 | 65.0 | 1.0 | 0.24 | Episyenite | ||||
| 65.0 | 66.0 | 1.0 | 0.57 | Episyenite | ||||
| 66.0 | 67.0 | 1.0 | 0.42 | Episyenite | ||||
| 67.0 | 68.0 | 1.0 | 0.16 | Episyenite | ||||
| 68.0 | 69.0 | 1.0 | 0.47 | Episyenite | ||||
| 69.0 | 70.0 | 1.0 | 0.41 | Episyenite | ||||
| 70.0 | 71.0 | 1.0 | 0.26 | Episyenite | ||||
| 71.0 | 72.0 | 1.0 | 0.40 | Episyenite | ||||
| 72.0 | 73.0 | 1.0 | 0.45 | Episyenite | ||||
| 73.0 | 74.0 | 1.0 | 0.27 | Episyenite | ||||
| 74.0 | 75.0 | 1.0 | 0.52 | Episyenite | ||||
| 75.0 | 76.0 | 1.0 | 0.44 | Episyenite | ||||
| 76.0 | 77.0 | 1.0 | 0.92 | Episyenite | ||||
| 77.0 | 78.0 | 1.0 | 0.70 | Perthitic granite | ||||
| 78.0 | 79.0 | 1.0 | 0.42 | Episyenite | ||||
| 79.0 | 80.0 | 1.0 | 0.34 | Episyenite | ||||
| 80.0 | 81.0 | 1.0 | 0.50 | Episyenite | ||||
| 81.0 | 82.0 | 1.0 | 0.68 | Episyenite | ||||
| 82.0 | 83.0 | 1.0 | 1.04 | Episyenite | ||||
| 83.0 | 84.0 | 1.0 | 0.59 | Episyenite | ||||
| 84.0 | 85.0 | 1.0 | 0.87 | Episyenite | ||||
| 85.0 | 86.0 | 1.0 | 0.92 | Episyenite | ||||
| 86.0 | 87.0 | 1.0 | 1.62 | Episyenite | ||||
| 87.0 | 88.0 | 1.0 | 1.21 | Episyenite | ||||
| 88.0 | 89.0 | 1.0 | 0.71 | Episyenite | ||||
| 89.0 | 90.0 | 1.0 | 0.45 | Episyenite | ||||
| 90.0 | 91.0 | 1.0 | 0.89 | Episyenite | ||||
| 91.0 | 92.0 | 1.0 | 0.59 | Episyenite | ||||
| 92.0 | 93.0 | 1.0 | 1.37 | Episyenite | ||||
| 93.0 | 94.0 | 1.0 | 1.81 | Episyenite | ||||
| 94.0 | 95.0 | 1.0 | 1.33 | Episyenite | ||||
| 95.0 | 96.0 | 1.0 | 0.50 | Episyenite | ||||
| 96.0 | 97.0 | 1.0 | 1.72 | Episyenite | ||||
| 97.0 | 98.0 | 1.0 | 0.95 | Episyenie | ||||
| 98.0 | 99.0 | 1.0 | 1.12 | Episyenite | ||||
| 99.0 | 100.0 | 1.0 | 1.09 | Episyenite | ||||
| 100.0 | 101.0 | 1.0 | 0.94 | Episyenite | ||||
| 101.0 | 102.0 | 1.0 | 0.67 | Episyenite | ||||
| 102.0 | 103.0 | 1.0 | 0.92 | Episyenite | ||||
| 103.0 | 104.0 | 1.0 | 0.73 | Episyenite | ||||
| 104.0 | 105.0 | 1.0 | 0.83 | Episyenite | ||||
| 105.0 | 106.0 | 1.0 | 1.13 | Episyenite | ||||
| 106.0 | 107.0 | 1.0 | 0.82 | Episyenite | ||||
| 107.0 | 108.0 | 1.0 | 0.54 | Episyenite | ||||
| 108.0 | 109.0 | 1.0 | 0.49 | Episyenite | ||||
| 109.0 | 110.0 | 1.0 | 1.06 | Episyenite | ||||
| 110.0 | 111.0 | 1.0 | 0.73 | Episyenite | ||||
| 111.0 | 112.0 | 1.0 | 1.01 | Episyenite | ||||
| 112.0 | 113.0 | 1.0 | 0.91 | Episyenite | ||||
| 113.0 | 114.0 | 1.0 | 0.36 | Episyenite | ||||
| 114.0 | 115.0 | 1.0 | 0.29 | Episyenite | ||||
| 115.0 | 116.0 | 1.0 | 0.11 | Episyenite | ||||
| 116.0 | 117.0 | 1.0 | 0.17 | Episyenite | ||||
| 117.0 | 118.0 | 1.0 | 0.42 | Episyenite | ||||
| 118.0 | 119.0 | 1.0 | 0.70 | Episyenite | ||||
| 119.0 | 120.0 | 1.0 | 0.53 | Episyenite | ||||
| 120.0 | 121.0 | 1.0 | 1.41 | Episyenite | ||||
| 121.0 | 122.0 | 1.0 | 0.66 | Episyenite | ||||
| 122.0 | 123.0 | 1.0 | 0.50 | Episyenite | ||||
| 123.0 | 124.0 | 1.0 | 0.59 | Episyenite | ||||
| 124.0 | 125.0 | 1.0 | 1.38 | Episyenite | ||||
| 125.0 | 126.0 | 1.0 | 0.02 | Episyenite | ||||
| 126.0 | 127.0 | 1.0 | 0.89 | Episyenite | ||||
| 127.0 | 128.0 | 1.0 | 0.64 | Episyenite | ||||
| 128.0 | 129.0 | 1.0 | 0.71 | Episyenite | ||||
| 129.0 | 130.0 | 1.0 | 0.44 | Episyenite | ||||
| 130.0 | 131.0 | 1.0 | 0.53 | Episyenite | ||||
| 131.0 | 132.0 | 1.0 | 0.41 | Episyenite | ||||
| 132.0 | 133.0 | 1.0 | 0.16 | Perthitic Granite | ||||
| 133.0 | 134.0 | 1.0 | 0.01 | Perthitic Granite | ||||
| 134.0 | 135.0 | 1.0 | 0.14 | Perthitic Granite | ||||
| 135.0 | 136.0 | 1.0 | 0.90 | Episyenite | ||||
| 136.0 | 137.0 | 1.0 | 1.09 | Episyenite | ||||
| 137.0 | 138.0 | 1.0 | 1.03 | Episyenite | ||||
| 138.0 | 139.0 | 1.0 | 0.29 | Episyenite | ||||
| 139.0 | 140.0 | 1.0 | 0.51 | Episyenite | ||||
| 140.0 | 141.0 | 1.0 | 0.57 | Episyenite | ||||
| 141.0 | 142.0 | 1.0 | 0.52 | Episyenite | ||||
| 142.0 | 143.0 | 1.0 | 0.81 | Episyenite | ||||
| 143.0 | 144.0 | 1.0 | 0.47 | Episyenite | ||||
| 144.0 | 145.0 | 1.0 | 2.43 | Episyenite | ||||
| 145.0 | 146.0 | 1.0 | 0.16 | Episyenite | ||||
| 146.0 | 147.0 | 1.0 | 0.12 | Episyenite | ||||
| 147.0 | 148.0 | 1.0 | 0.10 | Episyenite | ||||
| 148.0 | 149.0 | 1.0 | 0.12 | Episyenite | ||||
| 149.0 | 150.0 | 1.0 | 2.04 | Episyenite | ||||
| 150.0 | 151.0 | 1.0 | 2.91 | Episyenite | ||||
| 151.0 | 152.0 | 1.0 | 2.22 | Episyenite | ||||
| 152.0 | 153.0 | 1.0 | 2.11 | Episyenite | ||||
| 153.0 | 154.0 | 1.0 | 0.83 | Episyenite | ||||
| 154.0 | 155.0 | 1.0 | 2.92 | Episyenite | ||||
| 155.0 | 156.0 | 1.0 | 2.04 | Episyenite | ||||
| 156.0 | 157.0 | 1.0 | 3.19 | Episyenite | ||||
| 157.0 | 158.0 | 1.0 | 3.94 | Episyenite | ||||
| 158.0 | 159.0 | 1.0 | 2.02 | Episyenite | ||||
| 159.0 | 160.0 | 1.0 | 0.67 | Episyenite | ||||
| 160.0 | 161.0 | 1.0 | 8.05 | Episyenite | ||||
| 161.0 | 162.0 | 1.0 | 1.90 | Episyenite | ||||
| 162.0 | 163.0 | 1.0 | 1.75 | Episyenite | ||||
| 163.0 | 164.0 | 1.0 | 3.13 | Episyenite | ||||
| 164.0 | 165.0 | 1.0 | 0.98 | Episyenite | ||||
| 165.0 | 166.0 | 1.0 | 1.28 | Episyenite | ||||
| 166.0 | 167.0 | 1.0 | 2.47 | Episyenite | ||||
| 167.0 | 168.0 | 1.0 | 2.66 | Episyenite | ||||
| 168.0 | 169.0 | 1.0 | 1.47 | Episyenite | ||||
| 169.0 | 170.0 | 1.0 | 2.13 | Episyenite | ||||
| 170.0 | 171.0 | 1.0 | 1.85 | Episyenite | ||||
| 171.0 | 172.0 | 1.0 | 1.33 | Episyenite | ||||
| 172.0 | 173.0 | 1.0 | 0.82 | Episyenite | ||||
| 173.0 | 174.0 | 1.0 | 1.13 | Episyenite | ||||
| 174.0 | 175.0 | 1.0 | 1.99 | Episyenite | ||||
| 175.0 | 176.0 | 1.0 | 0.79 | Episyenite | ||||
| 176.0 | 177.0 | 1.0 | 1.69 | Episyenite | ||||
| 177.0 | 178.0 | 1.0 | 1.97 | Episyenite | ||||
| 178.0 | 179.0 | 1.0 | 1.47 | Episyenite | ||||
| 179.0 | 180.0 | 1.0 | 1.29 | Episyenite | ||||
| 180.0 | 181.0 | 1.0 | 2.30 | Episyenite | ||||
| 181.0 | 182.0 | 1.0 | 1.04 | Episyenite | ||||
| 182.0 | 183.0 | 1.0 | 0.68 | Episyenite | ||||
| 183.0 | 184.0 | 1.0 | 2.08 | Episyenite | ||||
| 184.0 | 185.0 | 1.0 | 2.94 | Episyenite | ||||
| 185.0 | 186.0 | 1.0 | 0.73 | Episyenite | ||||
| 186.0 | 187.0 | 1.0 | 2.47 | Episyenite | ||||
| 187.0 | 188.0 | 1.0 | 0.96 | Episyenite | ||||
| 188.0 | 189.0 | 1.0 | 0.64 | Episyenite | ||||
| 189.0 | 190.0 | 1.0 | 1.44 | Episyenite | ||||
| 190.0 | 191.0 | 1.0 | 3.01 | Episyenite | ||||
| 191.0 | 192.0 | 1.0 | 2.26 | Episyenite | ||||
| 192.0 | 193.0 | 1.0 | 1.56 | Episyenite | ||||
| 193.0 | 194.0 | 1.0 | 1.33 | Episyenite | ||||
| 194.0 | 195.0 | 1.0 | 2.10 | Episyenite | ||||
| 195.0 | 196.0 | 1.0 | 1.39 | Episyenite | ||||
| 196.0 | 197.0 | 1.0 | 2.17 | Episyenite | ||||
| 197.0 | 198.0 | 1.0 | 1.74 | Episyenite | ||||
| 198.0 | 199.0 | 1.0 | 1.72 | Episyenite | ||||
| 199.0 | 200.0 | 1.0 | 1.65 | Episyenite | ||||
| 200.0 | 201.0 | 1.0 | 1.77 | Episyenite | ||||
| 201.0 | 202.0 | 1.0 | 2.51 | Episyenite | ||||
| 202.0 | 203.0 | 1.0 | 1.86 | Episyenite | ||||
| 203.0 | 204.0 | 1.0 | 1.54 | Episyenite | ||||
| 204.0 | 205.0 | 1.0 | 4.07 | Episyenite | ||||
| 205.0 | 206.0 | 1.0 | 1.22 | Episyenite | ||||
| 206.0 | 207.0 | 1.0 | 1.25 | Episyenite | ||||
| 207.0 | 208.0 | 1.0 | 1.20 | Episyenite | ||||
| 208.0 | 209.0 | 1.0 | 1.44 | Episyenite | ||||
| 209.0 | 210.0 | 1.0 | 1.34 | Episyenite | ||||
| 210.0 | 211.0 | 1.0 | 0.23 | Perthitic Granite | ||||
| 211.0 | 212.0 | 1.0 | 0.72 | Perthitic Granite | ||||
| 212.0 | 213.0 | 1.0 | 2.18 | Perthitic Granite | ||||
| 213.0 | 214.0 | 1.0 | 2.59 | Perthitic Granite | ||||
| 214.0 | 215.0 | 1.0 | 0.32 | Perthitic Granite | ||||
| 215.0 | 216.0 | 1.0 | 0.14 | Perthitic Granite | ||||
| 216.0 | 217.0 | 1.0 | 0.14 | Perthitic Granite | ||||
| 217.0 | 218.0 | 1.0 | 0.69 | Perthitic Granite | ||||
| 218.0 | 219.0 | 1.0 | 0.04 | Perthitic Granite | ||||
| 219.0 | 220.0 | 1.0 | 0.08 | Perthitic Granite | ||||
| 220.0 | 221.0 | 1.0 | 0.36 | Perthitic Granite | ||||
| 221.0 | 222.0 | 1.0 | 0.18 | Perthitic Granite | ||||
| 222.0 | 223.0 | 1.0 | 0.10 | Perthitic Granite | ||||
| 223.0 | 224.0 | 1.0 | 0.01 | Perthitic Granite | ||||
| 224.0 | 225.0 | 1.0 | 0.09 | Perthitic Granite | ||||
| 225.0 | 226.0 | 1.0 | 0.16 | Perthitic Granite | ||||
| 226.0 | 227.0 | 1.0 | 0.02 | Perthitic Granite | ||||
| 227.0 | 228.0 | 1.0 | 0.02 | Perthitic Granite | ||||
| 228.0 | 229.0 | 1.0 | 0.13 | Perthitic Granite | ||||
| 229.0 | 230.0 | 1.0 | 0.12 | Perthitic Granite | ||||
| 230.0 | 231.0 | 1.0 | 0.11 | Perthitic Granite | ||||
| 231.0 | 232.0 | 1.0 | 1.31 | Perthitic Granite | ||||
| 232.0 | 233.0 | 1.0 | 0.05 | Perthitic Granite | ||||
| 233.0 | 234.0 | 1.0 | 0.20 | Perthitic Granite | ||||
| 234.0 | 235.0 | 1.0 | 0.33 | Perthitic Granite | ||||
| 235.0 | 236.0 | 1.0 | 0.01 | Perthitic Granite | ||||
| 236.0 | 237.0 | 1.0 | 0.01 | Perthitic Granite | ||||
| 237.0 | 239.0 | 2.0 | 0.01 | Perthitic Granite | ||||
| 239.0 | 241.0 | 2.0 | 0.01 | Perthitic Granite | ||||
| 241.0 | 243.0 | 2.0 | 0.04 | Perthitic Granite | ||||
| 243.0 | 245.0 | 2.0 | 0.02 | Perthitic Granite | ||||
| 245.0 | 247.0 | 2.0 | 0.02 | Perthitic Granite | ||||
| 247.0 | 249.0 | 2.0 | 0.06 | Perthitic Granite | ||||
| 249.0 | 250.0 | 1.0 | 0.03 | Perthitic Granite | ||||
| 250.0 | 251.0 | 1.0 | 0.08 | Perthitic Granite | ||||
| 251.0 | 252.0 | 1.0 | 0.20 | Perthitic Granite | ||||
| 252.0 | 253.0 | 1.0 | 0.03 | Perthitic Granite | ||||
| 253.0 | 254.0 | 1.0 | 0.02 | Perthitic Granite | ||||
| 254.0 | 255.0 | 1.0 | 0.07 | Perthitic Granite | ||||
| 255.0 | 256.0 | 1.0 | 0.10 | Perthitic Granite | ||||
| 256.0 | 257.0 | 1.0 | 1.84 | Perthitic Granite | ||||
| 257.0 | 258.0 | 1.0 | 0.26 | Perthitic Granite | ||||
| 258.0 | 259.0 | 1.0 | 0.25 | Perthitic Granite | ||||
| 259.0 | 260.0 | 1.0 | 0.61 | Perthitic Granite | ||||
| 260.0 | 261.0 | 1.0 | 0.16 | Perthitic Granite | ||||
| 261.0 | 262.0 | 1.0 | 0.08 | Perthitic Granite | ||||
| 262.0 | 263.0 | 1.0 | 0.01 | Perthitic Granite | ||||
| 263.0 | 264.0 | 1.0 | 0.01 | Perthitic Granite | ||||
| 264.0 | 265.0 | 1.0 | 0.01 | Perthitic Granite | ||||
| 265.0 | 267.0 | 2.0 | 0.02 | Perthitic Granite | ||||
| 267.0 | 269.0 | 2.0 | 0.01 | Perthitic Granite | ||||
| 269.0 | 271.0 | 2.0 | 0.02 | Perthitic Granite | ||||
| 271.0 | 273.0 | 2.0 | 0.01 | Perthitic Granite | ||||
| 273.0 | 275.0 | 2.0 | 0.01 | Perthitic Granite | ||||
| 275.0 | 277.0 | 2.0 | 0.01 | Perthitic Granite | ||||
| 277.0 | 279.0 | 2.0 | 0.01 | Perthitic Granite | ||||
| 279.0 | 281.0 | 2.0 | 0.01 | Perthitic Granite | ||||
| 281.0 | 283.0 | 2.0 | 0.01 | Perthitic Granite | ||||
| 283.0 | 285.0 | 2.0 | 0.01 | Perthitic Granite | ||||
| 285.0 | 287.0 | 2.0 | 0.01 | Perthitic Granite | ||||
| 287.0 | 289.0 | 2.0 | 0.01 | Perthitic Granite | ||||
| 289.0 | 291.0 | 2.0 | 0.01 | Perthitic Granite | ||||
| 291.0 | 293.0 | 2.0 | 0.01 | Perthitic Granite | ||||
| 293.0 | 295.0 | 2.0 | 0.01 | Perthitic Granite | ||||
| 295.0 | 297.0 | 2.0 | 0.01 | Perthitic Granite | ||||
| 297.0 | 299.8 | 2.8 | 0.01 | Perthitic Granite |
Notes
- Assumes 0.25 g/t gold cut-off grade, no top cut.
- The Company has been targeting larger intersections of greater than 0.25 g/t gold. Intersections that are lower than this threshold may provide exploration insight and may therefore be disclosed.
- Intervals represent drill core interval; true widths have not been determined at this time.
TABLE 2. Summary of Drill hole Assay Results for Fazenda do Posto target.
| Hole | Azimuth (degrees) |
Dip (dip) |
End of hole (metres) |
From (metres) |
To (metres) |
Interval (metres) |
Gold grade (grams/tonne) |
Comment |
| 23FP001 | 20 | -60 | 214.05 | 77.00 | 153.00 | 76.00 | 0.17 | Drilled peripheral to main target |
| 85.00 | 86.00 | 1.00 | 0.32 | Along southeast edge of FP | ||||
| 90.00 | 93.00 | 3.00 | 0.33 | |||||
| 96.00 | 97.00 | 1.00 | 0.57 | |||||
| 102.00 | 104.00 | 2.00 | 0.34 | |||||
| 109.00 | 110.00 | 1.00 | 0.42 | |||||
| 113.00 | 118.00 | 5.00 | 0.23 | |||||
| 135.00 | 137.00 | 2.00 | 0.47 | |||||
| 143.00 | 144.00 | 1.00 | 0.26 | |||||
| 23FP002 | 20 | -60 | 464.59 | 58.00 | 59.00 | 1.00 | 0.18 | Discovery hole |
| 117.00 | 457.00 | 340.00 | 1.09 | Mineralized episyenite | ||||
| Including | 199.00 | 359.00 | 160.00 | 1.79 | ||||
| Including | 208.00 | 235.00 | 27.00 | 2.07 | ||||
| Including | 293.00 | 361.00 | 68.00 | 2.09 | ||||
| 23FP003 | 0 | -90 | 332.17 | 24.00 | 27.00 | 3.00 | 0.71 | |
| 87.00 | 294.00 | 207.00 | 0.49 | |||||
| including | 87.00 | 227.00 | 140.00 | 0.67 | ||||
| Including | 87.00 | 195.00 | 108.00 | 0.80 | ||||
| Including | 87.00 | 151.00 | 64.00 | 0.91 | Mineralized episyenite | |||
| Including | 87.00 | 145.00 | 58.00 | 0.97 | ||||
| Including | 106.00 | 145.00 | 39.00 | 1.17 | ||||
| Hole | Azimuth (degrees) |
Dip (degrees) |
End of hole (metres) |
From (metres) |
To (metres) |
Interval (metres) |
Gold grade (grams/tonne) |
Comment |
| 23FP004 | 200 | -60 | No Significant Value | Drilled southwest away from target | ||||
| 23FP006 | 200 | -60 | 31.06 | 261.00 | 229.94 | 0.86 | Drilled southwest into target | |
| including | 31.06 | 235.00 | 203.94 | 0.95 | Mineralized episyenite | |||
| including | 31.06 | 222.00 | 190.94 | 1.00 | ||||
| including | 149.00 | 214.00 | 65.00 | 1.94 | ||||
| including | 149.00 | 187.00 | 38.00 | 2.03 | ||||
| including | 154.00 | 164.00 | 10.00 | 2.96 | ||||
| including | 190.00 | 205.00 | 15.00 | 2.05 |
The above references an opinion and is for information purposes only. It is not intended to be investment advice. Seek a licensed professional for investment advice. The author is not an insider or shareholder of any of the companies mentioned above.
Golden Ridge Resources (TSXV:GLDN), recently completed its 2023 Phase II drilling campaign at the Williams Gold Property, located within the Appleton and Dog Bay Fault Corridors. This campaign followed the 2022 Phase II drilling, where the company reported its largest gram meter intercept at the Williams Property, with an 86-meter section containing 1.00 g/t Au.
Mike Blady, Director, CEO and President of Golden Ridge, commented in a press release: “Drilling 86 gram-meters Au in our first reported hole of Phase II drilling is very exciting. The highlighted intercept in WIL-23-30 represents our highest gram-meter interval to date at Williams. Drilling has now confirmed at least five distinct mineralized zones at Williams all of which remain open along strike and at depth. Observing the increased alteration and veining drilled over 41 holes in Phase II strongly suggests that we are vectoring towards the full potential of the Property.”
The 2023 Phase II drilling initially concentrated on WIL-22-12, which revealed a complex network of veins and veinlets, yielding a significant section measuring 37.93 meters with a grade of 0.68 g/t Au. This area, now known as the Cabin Zone Extension (CZE), extends northeast from the original ‘Cabin Zone’, a gold-in-soil anomaly stretching over 1 kilometre. Six drill holes, WIL-23-30 through WIL-23-35, totalling 1,029 meters, were completed in this extension. Each drill hole intersected a broad alteration halo and a system of veins and veinlets, similar to those observed in the initial Phase I drilling. Notably, drill hole WIL-23-30 intersected an 86-meter section grading 1 g/t gold, including a 2-meter section with a high yield of 9.21 g/t. The drilling also uncovered several fault/rubble zones associated with graphite, indicating potential post-mineralization movement. The mineralization at the Cabin Zone Extension remains open for exploration.
In total, the 2023 drill program at the Williams Gold Property comprised 41 holes, spanning 5,982 meters. This brings Golden Ridge’s total to 70 drill holes over both Phase I and II, amounting to 10,182 meters. The company is still awaiting the balance of assay results from the 2023 program. These drills primarily targeted areas between 100m to 200m depth, focusing on anomalies identified in earlier explorations. Past field programs by Golden Ridge between 2020 and 2022 have yielded significant float samples with up to 281 g/t Au and soil samples reaching 1,503 ppb Au.
Phase II drilling revealed broad mineralization characterized by a complex system of veins, veinlets, and vein breccia, some up to 1.5 meters. The gold-bearing veins were frequently associated with sericitic and chloritic alteration. Sulphide mineralization was more prevalent in Phase II cores, with the host rock containing disseminated pyrite, arsenopyrite near mineralized zones, and trace pyrrhotite in intensely veined areas. Gold veins primarily contained pyrite and were associated with arsenopyrite, pyrrhotite, chalcopyrite, and galena, among others.
Golden Ridge is analyzing the structural controls influencing the transportation and deposition of gold-bearing fluids on the Williams Property. The vein systems suggest a transitional tectonic environment with both brittle and ductile features. The company is focusing on fracture filling as the main style of vein deposition, indicating a trans-tensional environment. Distinguishing gold-bearing veins involves identifying associations with sericitic-chloritic alteration and arsenopyrite.
Highlights from the results are as follows: 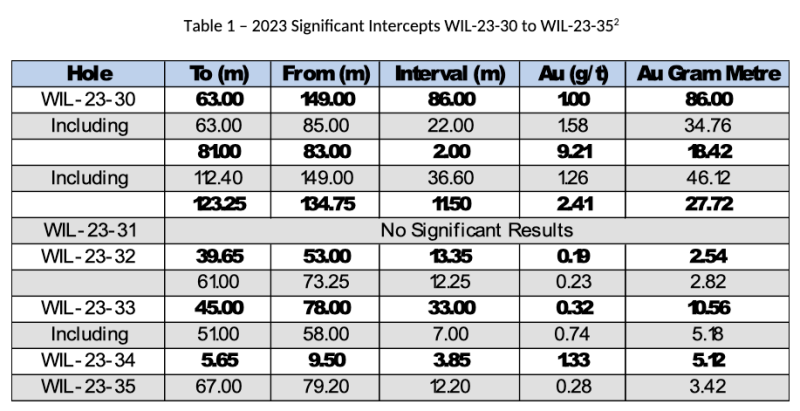
The above references an opinion and is for information purposes only. It is not intended to be investment advice. Seek a licensed professional for investment advice. The author is not an insider or shareholder of any of the companies mentioned above.
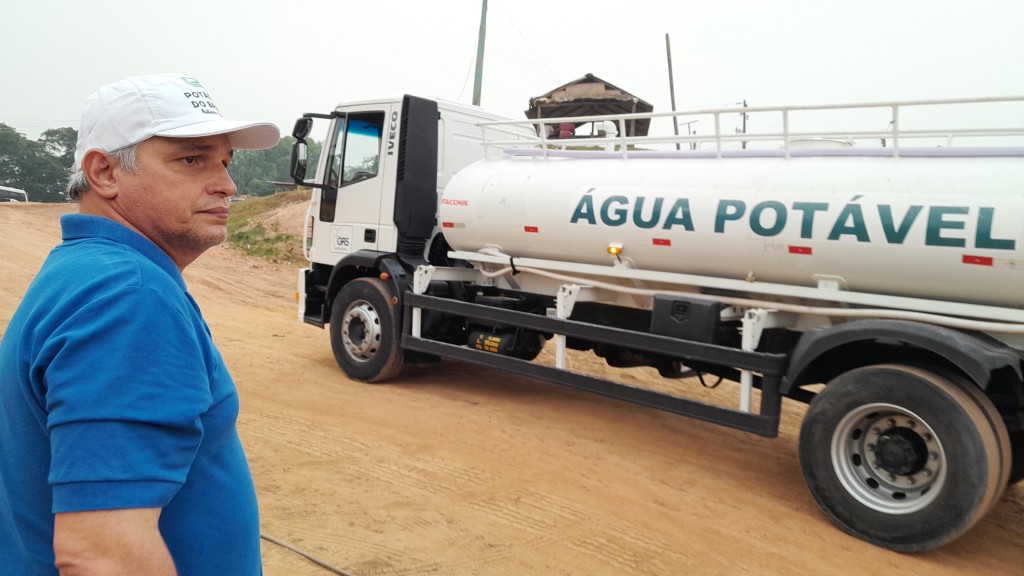
The Autazes region, located 112 kilometres from Manaus, has been experiencing a significant increase in wildfires, prompting urgent response measures to support the affected environment and assist the socially vulnerable communities nearby. In response to the intensifying fires exacerbated by the dry river season, Potássio do Brasil, a Brazil Potash subsidiary, has stepped in to provide humanitarian and environmental assistance to the municipality of Autazes.
Adriano Espeschit, President of Potássio do Brasil, commented: “This is a moment of humanitarian aid where everyone must come together for the sake of the environment and, above all, the people. We are collaborating with the community, and their issues are our concerns as well, so we are joining forces in the fight against wildfires in the municipality.”
Following a request from the Indigenous Mura Council (CIM) for clean water for the indigenous people of the 36 villages in the municipality, Potássio do Brasil supplied two water trucks to address the water shortage during the crisis. The trucks were delivered over the weekend to the CIM’s headquarters. In addition to water supply, Potássio do Brasil donated 40 sets of Personal Protective Equipment (PPE) to local firefighting teams to help ensure their safety while battling the blazes.
More than 20 firefighters are working tirelessly to control the wildfires within the rural communities of the municipality. Their efforts are part of a broader collaboration that includes the Autazes Environmental Department, Municipal Guard, Civil Defense, Traffic Department, Camera Monitoring Center (Ciops), Civil and Military Police, and the Fire Department.
Potássio do Brasil is also extending its support to the state government by providing essential food baskets for distribution to families in social vulnerability, both indigenous and non-indigenous, throughout the state.
The company, which has plans to produce potash fertilizer in Autazes, is actively involved in various socio-economic and environmental projects aimed at benefiting the local population.
The above references an opinion and is for information purposes only. It is not intended to be investment advice. Seek a licensed professional for investment advice. The author is not an insider or shareholder of any of the companies mentioned above.
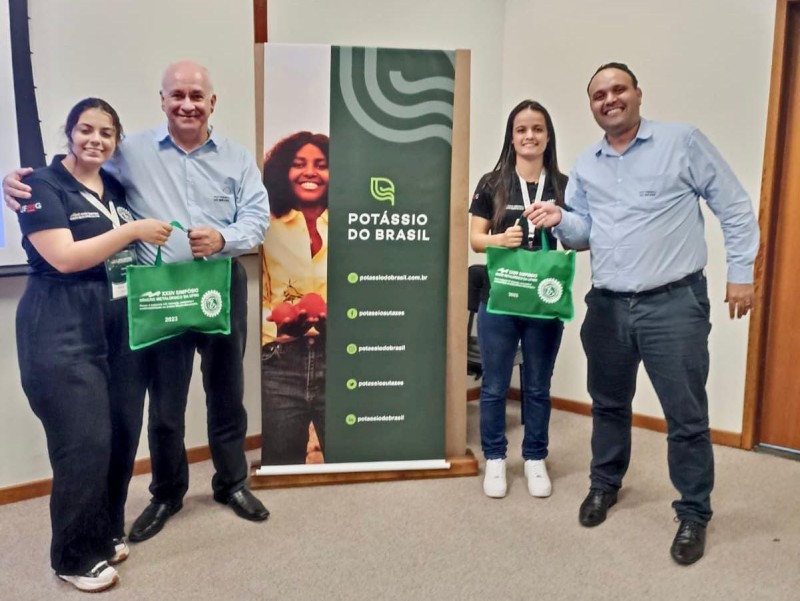
Brazil Potash was a highlight and presenter at the 34th edition of the Mining-Metallurgical Symposium, held at the Federal University of Minas Gerais (UFMG). This annual event, taking place from October 23rd to the 27th in Minas Gerais, was hosted by the Grêmio of Metallurgical Engineering and Mining Engineering at UFMG. The symposium serves as a converging point for professionals and scholars to exchange insights on important matters impacting the mining and metallurgical industries.
Theme and Contributions
This year’s theme, “Industry 4.0: innovation, economy, and sustainability,” set the stage for discussions surrounding the advancement and modernization of the industry. Adriano Espeschit, president of Potássio do Brasil a subsidiary of Brazil Potash, delivered a lecture titled “Mining in/out of Indigenous Lands,” providing a deep dive into the intricacies of mining operations in sensitive areas. His talk also shed light on the challenges linked to the Autazes Potash Project in Amazonas, one of the most conscientious and eco-friendly potash projects around the world.
Davidson Aquino, the financial director at Potássio do Brasil, addressed the symposium attendees, elaborating on the critical nature of potash as a strategic mineral. Aquino’s speech emphasized potassium chloride fertilizer’s role in bolstering food security and combating hunger worldwide, alongside highlighting the strategic significance of the Autazes Potash Project for the Brazilian agricultural sector and global markets.
The Brazilian Potash Market and Potássio do Brasil’s Role
Brazil’s potash market plays a crucial role in the country’s agricultural success, given that potash is a key component of fertilizers used to enhance crop yields. Despite being one of the world’s leading consumers of potash, Brazil relies heavily on imports to satisfy its agricultural demands. This dependence makes initiatives like the Autazes Potássio Project especially important, as they represent steps toward self-sufficiency in a critical resource.
Brazil Potash has been proactively engaging with the mining community, participating in conferences and exhibitions to underscore the Autazes Potash Project’s societal benefits. The company’s active role and consistent updates on industry practices demonstrate a commitment to staying on top of mining sector trends and contributing to sustainable practices within the industry.
Industry Perspectives and Future Outlook
The discussions at the symposium highlighted a collective understanding of the need for innovative and sustainable approaches to mining, especially around projects like Autazes Potash Project, which are located in areas with delicate ecological and social balances. As the industry moves forward, the ideas and strategies stemming from these discussions are expected to shape the future of mining, particularly in regions rich in natural resources like Brazil.
The 34th UFMG Mining-Metallurgical Symposium provided a platform for Brazil Potash executives to articulate the details and strategic importance of their projects but also created a wider dialogue on the responsible and sustainable extraction of minerals in the age of Industry 4.0. As Brazil continues to develop its domestic potash resources, companies like Brazil Potash will be expected to lead, shaping the narrative for mining in the region.
The above references an opinion and is for information purposes only. It is not intended to be investment advice. Seek a licensed professional for investment advice. The author is not an insider or shareholder of any of the companies mentioned above.
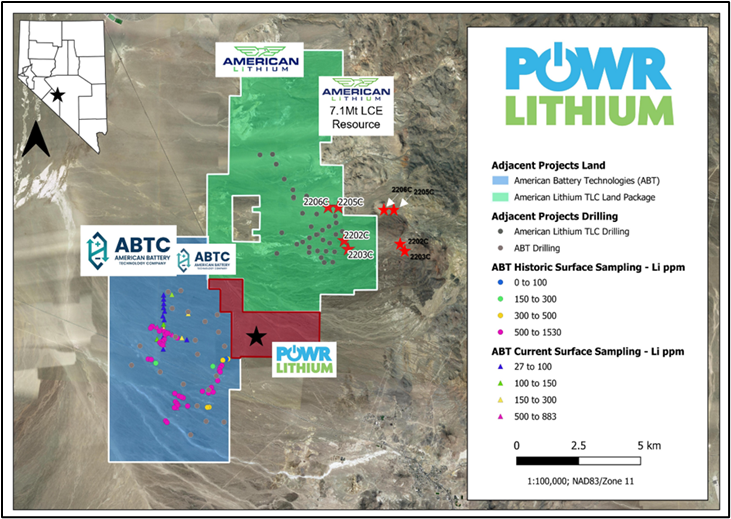
POWR Lithium Corp. (CSE:POWR) has recently shared updates on its Halo Project near Tonopah, Nevada. The project, comprising 98 mineral claims in Esmeralda and Nye counties, is being explored for its potential in claystone-hosted lithium mineralization. This comes amidst a growing interest in lithium exploration in the region, spurred by positive developments in adjacent properties.
Patrick Morris, CEO of POWR Lithium, commented in a press release: “We are pleased to have completed the Phase 1 drilling program with four holes traversing the claystone sequence suspected to host important Li values both to the north and west. I applaud the efforts of both Falcon Drilling and our field team to complete this maiden program during the 2023 field program and am anxious to receive the analytical results from our laboratory.”
The drilling operations at Halo were conducted by Falcon Drilling, based in Carson City, Nevada. Falcon’s equipment, known for its versatility and mobility, is both designed and manufactured by the company and has been used in various projects worldwide. This equipment allows for flexible site adjustments and targeting based on initial results and consultations between the project supervisor and POWR’s exploration team.
The drilling at Halo began on October 31 and concluded on November 13. The holes drilled varied in depth from 153.6 meters to 245.4 meters, penetrating through layers of claystone and siltstone. POWR’s technical team managed the logging, cutting, and sampling processes at their facility in Tonopah, Nevada. In total, 490 samples were collected and sent to American Assay Laboratories in Sparks, Nevada, for analysis. The initial findings from these samples are expected to be released soon.
Adjacent to the Halo Project, two other significant developments have been noted. To the north, American Lithium, with a market capitalization of US$246 million, released a positive preliminary economic assessment for its TLC Project. This assessment includes an after-tax net present value of US$3.26 billion and an internal rate of return of 27.5%. Meanwhile, to the southwest, American Battery Technology, valued at US$190 million, has confirmed the presence of lithium at depths exceeding 1,400 feet (430 meters). These developments are closely monitored by POWR Lithium, indicating a heightened interest in the region’s lithium potential.
POWR Lithium focuses on advancing North American lithium deposits. Besides the Halo Project, the company also holds interests in the Eli properties in Nevada. Furthermore, POWR Lithium is working on developing claystone extraction and processing technologies to enhance efficiency and sustainability in the lithium value chain. More information about the company and its projects can be found on its website.
Highlights from the results are as follows:
- Recent two-million-dollar ($2M) financing provides year-end impetus and launchpad for 2024.
- Company completed 884 meters in 4 HQ core holes across the project area.
- Adjoining property activities, results, and investments provide encouragement.
The above references an opinion and is for information purposes only. It is not intended to be investment advice. Seek a licensed professional for investment advice. The author is not an insider or shareholder of any of the companies mentioned above.
In a significant development for Ecuador’s mining industry, Canadian junior Adventus Mining (TSXV:ADZN) (OTCQX:ADVZF) is set to acquire Luminex Resources (TSXV:LR) (OTCQX:LUMIF), forming a new entity focused on copper-gold development in Ecuador. The transaction, structured as a merger, entails Adventus Mining absorbing Luminex, with Luminex shareholders receiving 0.67 of an Adventus share for each share they hold. This move is expected to consolidate the two companies’ strengths, leading to a more robust presence in the South American mining landscape.
Adventus chief executive Christian Kargl-Simard commented in a press release: “For Adventus shareholders, the new capital and acquisition of Luminex’s Condor project and other properties allows the creation of a stronger and more diversified company with one of the largest copper-gold exploration portfolios in Ecuador.”
The newly formed company, which will continue to operate under the Adventus name and ticker, will focus on advancing two primary projects in Ecuador. The El Domo-Curipamba copper-gold deposit, currently at the feasibility stage, is recognized for its high copper-gold grades and low capital intensity. It has garnered interest from the Ecuadorian government and is undergoing environmental consultations, with a construction decision anticipated in the first half of 2024. The other key project is the Condor gold project, in the preliminary economic assessment (PEA) stage. Located in southeastern Ecuador, near the Fruta del Norte mine and the El Mirador copper mine, the Condor project’s preliminary economic assessment, completed in 2021, predicts a 12-year operation producing 187,000 ounces of gold annually.
The merger will create a company with one of the largest exploration portfolios in Ecuador, encompassing over 135,000 hectares across 13 projects. This expansion reflects a strategic move to consolidate a significant presence in a country rich in mining potential.
The business combination has garnered support from influential figures in the mining sector, including geologist and entrepreneur Ross Beaty’s Lumina Group, local Ecuadorian investors, and strategic equity investors like Altius Minerals and Wheaton Precious Metals. Post-transaction, Adventus shareholders are set to own 61% of the new entity, with Luminex shareholders owning the remaining 39%. Ross Beaty is expected to be the sole shareholder with more than 10% of the issued and outstanding shares. Concurrent with the transaction, the companies announced a financing round of approximately $17.1 million, with participation from Beaty and Wheaton.
Mining is a significant contributor to Ecuador’s economy, ranking as the fourth-largest source of income last year, following oil, bananas, and shrimp, and contributing $2.8 billion to the state’s coffers. However, the sector faces challenges, including growing opposition to extractive activities. According to the country’s Chamber of Mining, this opposition is impeding nearly $1 billion in potential investment and delaying about 100 projects over the next two years. Despite these challenges, projects like SolGold’s (LON: SOLG) Cascabel copper-gold project, which recently received a 25-year license renewal, demonstrate the ongoing potential and interest in Ecuador’s mining sector.
This merger between Adventus and Luminex represents a strategic consolidation in the industry, aiming to leverage the strengths of both companies to advance copper-gold mining projects in Ecuador, a region with significant untapped potential.
The above references an opinion and is for information purposes only. It is not intended to be investment advice. Seek a licensed professional for investment advice. The author is not an insider or shareholder of any of the companies mentioned above.
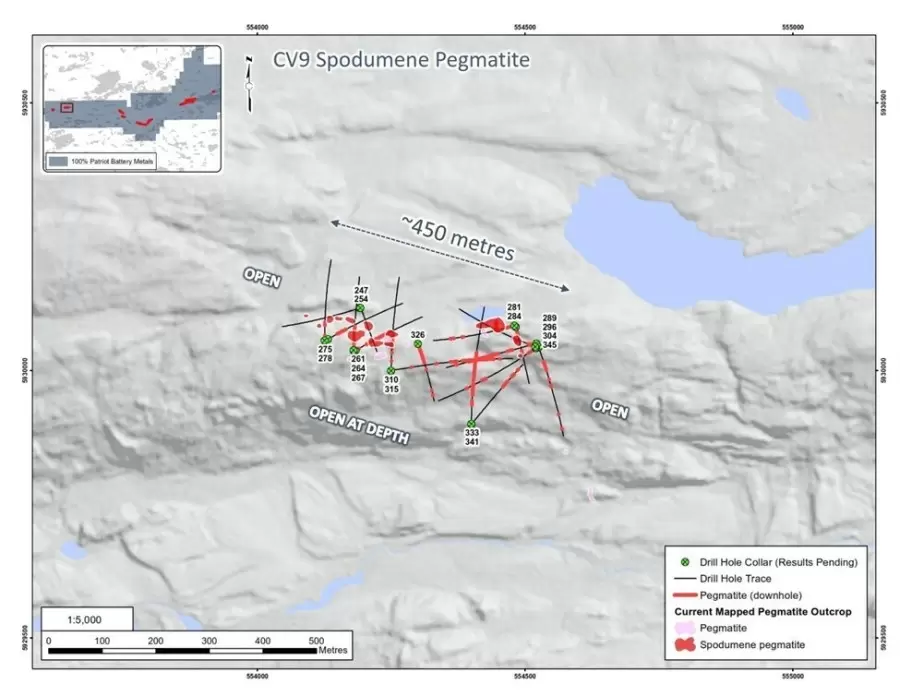
Patriot Battery Metals (TSXV:PMET) recently reported significant findings from its inaugural drilling program at the CV9 Spodumene Pegmatite, part of its Corvette Property in Quebec’s Eeyou Istchee James Bay region. The company’s exploration efforts have generated positive results, particularly from drill hole CV23-345, which encountered approximately 100 meters of near-continuous spodumene-bearing pegmatite.
Darren L. Smith, Company Vice President of Exploration, commented in a press release: “This is a very strong start to the drill exploration at the CV9 Pegmatite. Although no core assays have been received yet, the presence of spodumene and the length of pegmatite encountered in multiple holes, highlighted by an approximate 100 m near-continuous spodumene-bearing hit in the final hole of the program, are very positive in terms of potential of this pegmatite to hold significant scale.
This discovery is one of several from the program, with three drill holes showing continuous pegmatite intersections exceeding 60 meters. The findings at CV9, located 14 kilometers west of the CV5 mineral resource, contribute to a better understanding of the pegmatite’s structure. Preliminary geological modeling suggests the CV9 Pegmatite significantly widens to at least 80 meters at certain points and remains open for exploration in multiple directions.
In total, 18 core holes, amounting to roughly 4,000 meters of NQ coring, were completed. The intervals of pegmatite, primarily spodumene-bearing, varied in length, with the longest being the 100-meter interval in CV23-345. Other notable intervals included 76 meters in drill hole CV23-315 and 70 meters in CV23-333.
The primary aim of the drill program at CV9 was to ascertain the geometry and orientation of the pegmatite system. The company employed a variety of drilling orientations from multiple locations, with results consistently improving as the program progressed. The last eight holes all yielded continuous core-length pegmatite intercepts of over 10 meters, including three intersections exceeding 60 meters.
The CV9 Pegmatite is currently interpreted as a single principal dyke with a steep northerly dip and a moderate east-southeast plunge. The strike length is approximately 450 meters, as defined by drilling and outcrop, and it remains open for further exploration. The variable width of the dyke and the significant thickening observed in places indicate similarities with the CV5 Pegmatite in terms of depth and scale.
Although core sample assays from the CV9 Pegmatite are still pending, the initial results are promising and suggest a potential for significant scale. The company plans to refine the geological model for CV9 upon receiving assays and will develop a follow-up drill program based on these initial successes.
The 2023 summer-fall program also included continued drill delineation of the CV5 and CV13 spodumene pegmatites. With over 140 drill holes completed, core sample assays, including those from the 18 holes at CV9, are expected in the first quarter of 2024.
The company is temporarily pausing drilling for the winter but plans to resume in early January with an increase in drilling activity. While core processing continues on site, the company awaits lab results, which will be reported in batches as they are received. Despite the promising nature of the pegmatite intervals, the company cautions against using visual estimates of mineral abundance as a proxy for laboratory analyses. These estimates do not provide detailed information about mineral concentrations, impurities, or other properties relevant to economic valuations.
Highlights from the results are as follows:
- Drill hole CV23-345 hits approximately 100 m of near-continuous spodumene-bearing pegmatite at CV9.
- Three (3) drill holes have returned continuous pegmatite intersections of 60+ m.
- Patriot has defined a pegmatite strike length of approximately 450 m by drilling and outcrop at CV9, which remains open.
- CV9 is located approximately 14 km west of the CV5 mineral resource.
- Preliminary geological modelling indicates the CV9 Pegmatite significantly thickens to at least 80 m width at one location and remains open in multiple directions.
- The magnitude of this variably mineralized pegmatite blow-out is significant, sharing similarities to those present at the CV5 Pegmatite in terms of depth and scale.
- Eighteen (18) core holes (~4,000 m) have been completed in the inaugural drill program at the CV9 Pegmatite – sample assays are pending.
- While it is early stage, the work done to date has resulted in an improvement in the understanding of the CV9 Pegmatite as the program went on, with a number of high priority targets now identified.
The above references an opinion and is for information purposes only. It is not intended to be investment advice. Seek a licensed professional for investment advice. The author is not an insider or shareholder of any of the companies mentioned above.
Probe Gold (TSX:PRB) has released the latest results from its 2023 drilling program at the Monique site, part of its Novador property near Val-d’Or, Quebec. The company, which owns the property entirely, reported significant findings from 25 drill holes, covering a total distance of 9,940 meters. These results indicate high-grade gold intersections along the strike, at various depths, and within the predicted gold zones of the Monique deposit, extending from the surface down to a depth of approximately 450 meters.
The recent drilling outcomes highlight notable gold grades and thicknesses, suggesting the ongoing expansion and consistent presence of gold mineralization at the Monique deposit. The identified gold trend zones at Monique are noted to be open for further exploration both along the strike and at greater depths.
Out of the 25 drill holes, 20 were aimed at expansion and infill drilling, intended to either identify or confirm in-pit mineralization. These holes yielded gold intercepts exceeding 0.42 grams per tonne (g/t) of gold, surpassing the cut-off grade set in the current resource estimate for the pit-constrained area. Notably, 17 of these holes revealed gold intercepts with a combined grade and thickness exceeding 10.0 g/t Au. Additionally, five exploration holes drilled south of the conceptual pit encountered parallel structures, with two of these holes showing lower-grade gold values.
The identified gold mineralization is predominantly linked to deformation zones crossing the deposit. These zones are characterized by an orientation ranging from 280° to 300° and a dip of 75° to 80° to the north. The gold presence is defined by a network of veins and veinlets composed of quartz, carbonate, albite, and occasionally tourmaline, along with disseminated pyrite in the surrounding altered rocks.
Since 2016, Probe Gold has been actively expanding its land holdings in the Val-d’Or East area of Quebec, which is known for its mining potential. The company now boasts a district-scale land package spanning 600 square kilometres, making it one of the largest landholders in the Val-d’Or mining camp. The Novador project, a subset of these holdings, covers 175 square kilometres and includes three previously operational mines: the Beliveau Mine, Bussière Mine, and Monique Mine. This project aligns with three regional mining trends.
The Val-d’Or area, recognized for its political stability and cost-effective mining operations, hosts several active mining companies and processing facilities. Across its properties in this region, Probe Gold reports gold resources totalling approximately 3.79 million ounces in the Measured and Indicated categories, and an additional 1.42 million ounces in the Inferred category, encompassing all trends and deposits within the area.
Highlights from the results are as follows:
- Multiple high-grade gold intercepts found within and around the Monique conceptual pit.
- Infill drilling continues to intersect thick gold zones inside the conceptual pit, yielding up to 6.4 g/t Au over 18.3 metres (11.8 g/t Au over 18.3 metres uncut, including 223 g/t Au over 0.8 metre); 3.3 g/t Au over 27.9 metres; and 1.9 g/t Au over 47.9 metres.
- Exploration and expansion drilling around and inside the Monique conceptual pit intersected new significant mineralization grading up to 16.6 g/t Au over 2.0 metres; 1.6 g/t Au over 19.5 metres; and 2.7 g/t Au over 11.8 metres.
- Over 70,000 metres of drilling have been completed at Novador in 2023. Drilling for this year is finished at Monique, and two drills are now active at Courvan.
- Planning a 30,000 metres expansion drill program for Q1 2024 at Novador.
| Hole Number | From (m) | To (m) | Length (m) | Gold (g/t) | Zone |
| MO-23-626 | 144.0 | 159.2 | 15.2 | 0.8 | New/Expan |
| MO-23-626 | 211.5 | 212.3 | 0.8 | 44.8 | New/Expan |
| MO-23-626 (cut) | 373.0 | 391.3 | 18.3 | 6.4 | B/Infill |
| MO-23-626 (uncut) | 373.0 | 391.3 | 18.3 | 11.8 | B/Infill |
| Including | 375.5 | 376.3 | 0.8 | 223.0 | B/Infill |
| MO-23-626 | 537.0 | 539.0 | 2.0 | 16.6 | M/Expan |
| MO-23-627 | 347.0 | 353.0 | 6.0 | 4.9 | B/Infill |
| MO-23-628 | 159.0 | 192.0 | 33.0 | 1.3 | B/Infill |
| MO-23-628 | 353.0 | 368.9 | 15.9 | 2.0 | M/Expan |
| Including | 360.0 | 361.0 | 1.0 | 23.4 | M/Expan |
| MO-23-629 | 70.0 | 102.0 | 32.0 | 0.7 | New/Expan |
| MO-23-630 | 152.0 | 154.0 | 2.0 | 9.8 | A/Infill |
| MO-23-630 | 223.0 | 270.9 | 47.9 | 1.9 | B/Infill |
| MO-23-631 | 136.0 | 153.0 | 17.0 | 0.6 | New/Expan |
| MO-23-632 | 250.8 | 255.4 | 4.6 | 2.5 | A/Infill |
| MO-23-632 | 263.0 | 273.8 | 10.8 | 1.6 | B/Infill |
| MO-23-632 | 308.2 | 324.1 | 15.9 | 2.0 | I/Infill |
| MO-23-632 | 447.0 | 457.5 | 10.5 | 2.0 | M/Expan |
| MO-23-633 | 143.0 | 154.0 | 11.0 | 1.2 | New/Expan |
| MO-23-635 | 238.0 | 250.0 | 12.0 | 2.9 | B/Infill |
| MO-23-635 | 348.0 | 349.5 | 1.5 | 9.5 | New/Expan |
| MO-23-635 | 365.0 | 372.0 | 7.0 | 2.4 | M North/Ex |
| MO-23-635 | 393.1 | 421.0 | 27.9 | 3.3 | M/Infill |
| Including | 401.1 | 407.1 | 6.0 | 6.2 | M/Infill |
| MO-23-637 | 122.0 | 141.5 | 19.5 | 1.6 | New/Expan |
| MO-23-639 | 59.0 | 60.5 | 1.5 | 18.9 | New/Expan |
| MO-23-645 | 239.5 | 252.0 | 12.5 | 4.7 | A/Infill |
| Including | 240.5 | 241.5 | 1.0 | 51.1 | A/Infill |
| MO-23-645 | 371.0 | 388.0 | 17.0 | 4.8 | I/Infill |
| Including | 382.1 | 383.1 | 1.0 | 49.3 | I/Infill |
| Including | 386.1 | 387.0 | 0.9 | 25.7 | I/Infill |
| MO-23-645 | 484.0 | 491.7 | 7.7 | 1.9 | M/Expan |
| Including | 484.9 | 485.8 | 0.9 | 11.9 | M/Expan |
| MO-23-646 | 242.0 | 243.0 | 1.0 | 32.7 | New/Expan |
| MO-23-646 | 326.0 | 327.5 | 1.5 | 8.8 | A/Infill |
| MO-23-647 | 25.5 | 27.0 | 1.5 | 6.2 | A/Expan |
| MO-23-647 | 397.4 | 415.8 | 18.4 | 3.4 | B//Infill |
| including | 414.8 | 415.8 | 1.0 | 49.7 | B/Infill |
| MO-23-647 | 467.0 | 470.5 | 3.5 | 3.3 | I/Expan |
| MO-23-647 | 547.5 | 564.0 | 16.5 | 1.8 | M/Expan |
| including | 561.0 | 564.0 | 3.0 | 6.4 | M/Expan |
| MO-23-648 | 83.0 | 103.0 | 20.0 | 1.5 | J/Expan |
| MO-23-649 | 319.0 | 338.5 | 19.5 | 1.6 | B/Infill |
| including | 324.0 | 325.0 | 1.0 | 23.6 | B/Infill |
| MO-23-650 | 249.9 | 257.0 | 7.1 | 1.6 | A/Expan |
| MO-23-650 | 618.3 | 626.3 | 8.0 | 3.2 | B/Expan |
| MO-23-650 | 724.8 | 736.6 | 11.8 | 2.7 | M/Expan |
| including | 726.8 | 728.8 | 2.0 | 8.8 | M/Expan |
The above references an opinion and is for information purposes only. It is not intended to be investment advice. Seek a licensed professional for investment advice. The author is not an insider or shareholder of any of the companies mentioned above.
The global shift towards renewable energy, marked by a growing reliance on wind power and electric vehicles (EVs), hinges significantly on copper availability. However, a slump in the copper market presents a complex scenario. The current situation is characterized by a decrease in copper prices due to reduced demand from manufacturers and builders, who incorporate the metal in various applications, from electrical wiring to roofing. This drop in demand has led to a surplus, keeping copper prices low and thereby discouraging necessary investments for future supply.
Junior Copper Mining Companies and Solaris Resources
Junior mining companies like Solaris Resources (TSX:SLS) (OTCQB:SLSSF) are part of the solution in addressing the copper supply issue for the green energy transition. Their focus on discovering and advancing new copper resources, as exemplified by the Warintza Project in Ecuador, is key to meeting future demands. Recent expansions in the Warintza East discovery demonstrate the significant potential of such projects. On top of this, strategic partnerships, like Solaris’ appointment of China International Capital Corporation Limited (CICC) as a financial advisor, highlight the growing global interest in new copper resources, with the company considering investor interest in the project and company.
Mining Challenges and Investment Hesitance
The heart of the issue lies in the mining sector. To meet the burgeoning demands of renewable energy transition, mining firms are required to extract vast amounts of new copper in the coming years. Yet, the current market conditions are causing hesitance. Major mining companies like Freeport-McMoRan and Glencore have expressed their intentions to delay new mining projects until copper prices rise. This cautious approach stems from the high capital costs of developing new mines and the desire for profitability over long-term operations.
The Demand-Supply Mismatch and Future Projections
The mismatch between current supply and future demand is setting the stage for a potential market crunch, potentially leading to price spikes and supply shortfalls. Goldman Sachs metals strategist Nicholas Snowdon predicts an inevitable phase of extreme scarcity in the copper market. Adding to the complexity, factors such as a weaker pandemic recovery in China, the world’s largest copper consumer, and the resolution of supply disruptions in major producers like Chile and Peru contribute to the current market dynamics.
Renewable Energy’s Growing Copper Appetite
Despite these challenges, the demand for copper in the green energy sector is on the rise. Copper is essential for the construction of wind farms, solar arrays, and the manufacturing of batteries and power lines. However, this sector still accounts for less than 10% of global copper usage. China’s significant investments in renewable energy and EVs are driving up its copper consumption, with an increase in solar-related copper demand.
As the world moves towards a greener future, copper supplies become increasingly important, but the current market slump poses both a challenge and an opportunity. On one hand, it discourages immediate investments in new mining projects; on the other, it highlights the need for strategic planning and innovation to ensure a steady supply of copper for the burgeoning renewable energy sector.
The above references an opinion and is for information purposes only. It is not intended to be investment advice. Seek a licensed professional for investment advice. The author is not an insider or shareholder of any of the companies mentioned above.
Gladiator Metals (TSXV: GLAD) has announced an update on its data compilation and exploration efforts at the Whitehorse Copper Project. This update includes the discovery of significant, unmined Copper-Gold skarns over a 700-meter strike at the historic Little Chief mine trend.
Gladiator CEO Jason Bontempo commented in a press release: “With the identification of the Middle Chief mineralization Gladiator continues to define areas of high-grade copper skarn mineralisation with significant exploration upside from its data compilation of historic drilling datasets. The Middle Chief mineralization represents a near-surface area of mineralization open in all directions with limited exploration or development away from historical underground infrastructure. Historical drilling and past production from the Little Chief mine area as a whole remains shallow, and this data compilation represents an opportunity to review the deposit in 3D for the first time to begin to appreciate the exploration potential of the high-grade copper-gold skarn, which remains open in all directions, for future resource growth. Planned diamond drilling is scheduled to commence in the coming months and will be testing the Middle Chief target as well as near mine extensions to the historic Little Chief mine.”
The Little Chief Mine, along with the Middle Chief Target, forms part of the Whitehorse Copper Belt. The Little Chief Mine, historically the largest producer in this area, yielded around 8.54 million tonnes of ore with a copper grade of over 1.5% and 0.75g/t gold, according to a 1984 report by Watson. Mining operations at Little Chief began in 1967 and concluded in 1982, influenced by the low copper prices at the time. Gladiator’s recent review suggests the potential for further mineralization at deeper levels, previously unexplored by drilling.
Gladiator has been actively compiling and reviewing historical drilling data from the Little Chief mining area. This includes a LIDAR survey, reconnaissance, and sampling around the historic mine site. The results confirmed significant mineralization, initially identified in drilling from the decline of the old Little Chief underground mine, with additional drilling occurring before the mine’s closure in 1982.
David Tenney in 1981 reported underground reserves at Little Chief and Middle Chief that had remained unexplored. Gladiator’s analysis of historical drilling data has now identified a significant body of shallow mineralization, named the Middle Chief mineralization. This body, over 200 meters in length and located 120 meters below the surface, lies beneath the decline and north of the Little Chief Open pit and underground mine. It appears largely intact, with limited drilling scope to date.
The historical drilling data, comprising 628 underground and 166 surface holes, covering a total of 68,940 meters, had not been previously reported by Gladiator. It highlights substantial unmined mineralization.
For the first time, Gladiator has been able to review and model this mineralization in three dimensions, providing a new perspective for targeting further mineralization. The company plans to utilize modern geophysics techniques, including down-hole electromagnetics (DHEM), in its exploration.
Gladiator intends to commence exploration drilling at Middle Chief in the coming months, following a recently approved Class 1 exploration notification. This will be accompanied by DHEM surveying to identify undrilled extensions to the mineralization.
At the same time, Gladiator is conducting a high-resolution drone-borne aeromagnetic survey over the Little Chief area. The company plans to process the magnetic data and complete a three-dimensional inversion model, important for targeting the Magnetite enriched Skarns associated with historical mineralization.
Gladiator also plans to broaden its assay scope in future drilling and sampling, including testing for gold, silver, and molybdenum, which were significant contributors to the economics of the historic Little Chief operations.
The historical drilling data, obtained from the Yukon Geological Survey archives, has been incorporated into an industry-standard database by Gladiator. This comprehensive compilation and analysis marks a significant step in Gladiator’s ongoing exploration and development efforts in the Whitehorse Copper Project area.
Highlights from the results are as follows:
- Recent collation of historic data identifies the Middle Chief prospect a significant highly prospective unmined zone of mineralisation, commencing from 120m below surface at the northern extent of the former Little Chief open cut and underground mine at the Whitehorse Copper Project, including:
- LCU-009: 49.83m @ 3.06% Cu from 70.26m
- LCU-017: 54.10m @ 2.05% Cu from 77.42m
- LCU-023: 33.99m @ 2.10% Cu from 148.89m, Incl. 15.24m @ 3.26%Cu
- LCU-503: 32.22m @ 2.11% Cu from 83.91m, Incl. 17.07m @ 3.47% Cu
- LCU-543: 13.72m @ 1.28% Cu from 66.14m and 41.15m @ 2.22% Cu from 87.48m
- LCU-610: 50.99m @ 1.87% Cu from 18.11m, Incl. 39.84m @ 2.19% Cu from 23.16m
- High grade copper skarn mineralisation at Middle Chief remains open in all directions. Unmined historic resources were established, and drilling completed just prior to the closure of the Little Chief mine in 1982, due to the prevailing low copper prices at the time.
- Approval has now received from the Yukon Department of Energy, Mines and Resources (EMR) for a Class 1 exploration permit allowing up to 10,000 metres of diamond drilling, to test the Middle Chief prospect area and extensions to mineralisation at the Little Chief historical production area.
- Compiled historical drilling data is limited to selective sampling and assaying for copper only. Gladiator intends to assay all future drilling and sampling for additional credits including Molybdenum, Silver and Gold which were proven contributors to the economics of historic operations.
The above references an opinion and is for information purposes only. It is not intended to be investment advice. Seek a licensed professional for investment advice. The author is not an insider or shareholder of any of the companies mentioned above.
Belmont Resources (TSXV:BEA) has completed the logging of drill core samples from two additional drill holes, AJ23-06 and AJ23-09. These holes have revealed a second mineralized zone, extending over 100 meters, characterized by extensive silicic and phyllic alteration, as well as widespread sulphide mineralization.
George Sookochoff, CEO of Belmont Resources, commented in a press release: “I am certainly pleased with the visuals of the drill core thus far and in particular the lengths of the mineralization situated both under and nearby the Athelstan gold mine. We were targeting and believe to have located one or more feeder systems to the extensive gold mineralization at surface. If assay results indeed support the visuals then we will have several more good targets to test in Q1 2024, in particular underneath the Jackpot mine.”
The drilling operations, specifically targeting the ‘A’ Zone situated 100 meters southeast of holes AJ23-07 and AJ23-08, were focused beneath the surface gold mineralization. Both AJ23-06 and AJ23-09 were drilled over the same geophysical anomaly beneath the Athelstan gold mine. Previously, holes AJ23-07 and AJ23-08 had intersected a 100-meter mineralized zone directly below this mine.
The recent drilling in the South Zone, encompassing all four diamond drill holes, has consistently intersected silica, silica-carbonate, and phyllic alteration over 100-meter intervals. These mineralized zones, located directly beneath and adjacent to the Athelstan mine, suggest a potential 100-meter extension along the Athelstan gold zone trend. The drill cores have shown signs of multi-meter quartz shear and stockwork-style vein intersections in various lithologies, containing pyrrhotite, pyrite, and traces of chalco and arsenopyrite. These findings suggest possible conduits for deep-seated hydrothermal fluids, potentially linked to gold deposits previously mined in the area.
Furthermore, shallow listwanite units, ranging from oxidized to unweathered states, have been consistently found, along with extensive alteration zones showing moderate sulphide mineralization at depths not previously explored by historic drilling or mining activities.
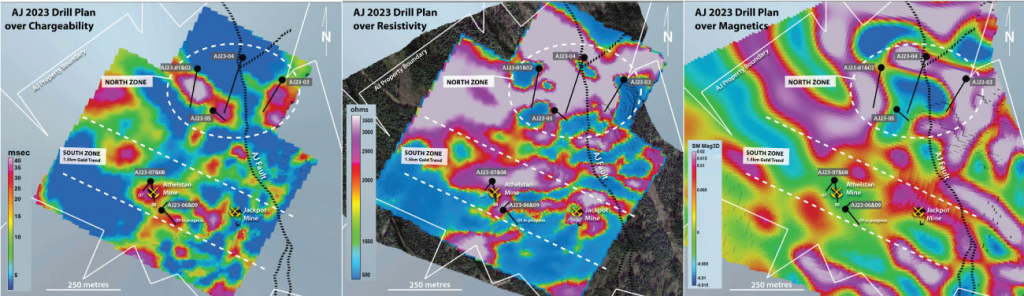
Belmont’s recently concluded drilling program comprised nine holes, spanning 2,000 meters, and aimed to investigate several coincident geophysical-geological anomalies on the A-J property. The North Zone was explored through holes AJ23-01 to 05, while the South Zone was the focus of holes AJ23-06 to 09.
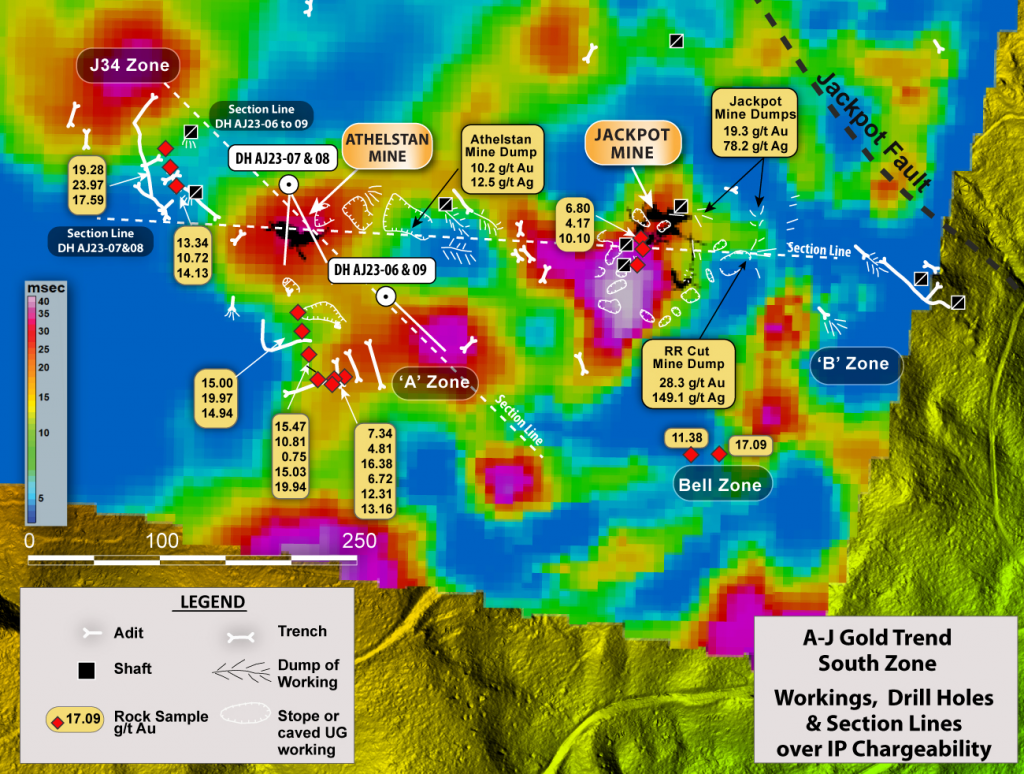
The South Zone drilling was particularly aimed at identifying a potential feeder structure for near-surface gold mineralization. This zone is part of a 1.0 km mineralized gold trend, which includes the Athelstan and Jackpot mines, historically producing significant amounts of gold and silver.
A 2002 report by R.E. Miller B.Eng., P.Geo, estimated a potential resource of 2,000-5,000 ounces of gold in the surface and near-surface areas of the A-J Group. This estimation was based on prior trenching results and sampling from mine dumps.
Gold mineralization in this zone has been linked to 2020 IP survey data, which indicated subsurface chargeability and resistivity highs, along with magnetic lows. These features are interpreted as signs of sulphide mineralization and alteration zones.
Core logging for all four South Zone drill holes is now complete, with samples sent to MSA Labs in Langley, B.C. for further analysis. Logging of the North Zone holes is ongoing and expected to be completed shortly.
Listwanite, a key mineral in this context, is associated with high-grade gold mineralization. The historic production on the property, mainly from the South Zone, has targeted massive sulfide and oxidized sulfide zones within listwanite. The process of serpentinization, which involves gold assimilation in secondary sulfides or magnetite, is thought to play a role in the formation of these deposits. This is supported by the observed magnetic anomalies within the property.
Notably, listwanite-associated lode-gold deposits are prominent in North America, with examples including the Mother Lode gold district in California and the Abitibi greenstone belt in Canada. High gold grades are often found in proximity to carbonate-altered ultramafic rocks, such as listwanite, a feature also observed in several multi-million-ounce gold deposits in British Columbia.
Highlights from the results are as follows:
- AJ23-06 and AJ23-09 intercept a second mineralized zone of over 100 meters of extensive silicic and phyllic alteration accompanied by widespread sulphide mineralization .
- Mineralization now intersected over 100 metre durations in all four diamond drill holes directly beneath and nearby the Athelstan mine.
The above references an opinion and is for information purposes only. It is not intended to be investment advice. Seek a licensed professional for investment advice. The author is not an insider or shareholder of any of the companies mentioned above.
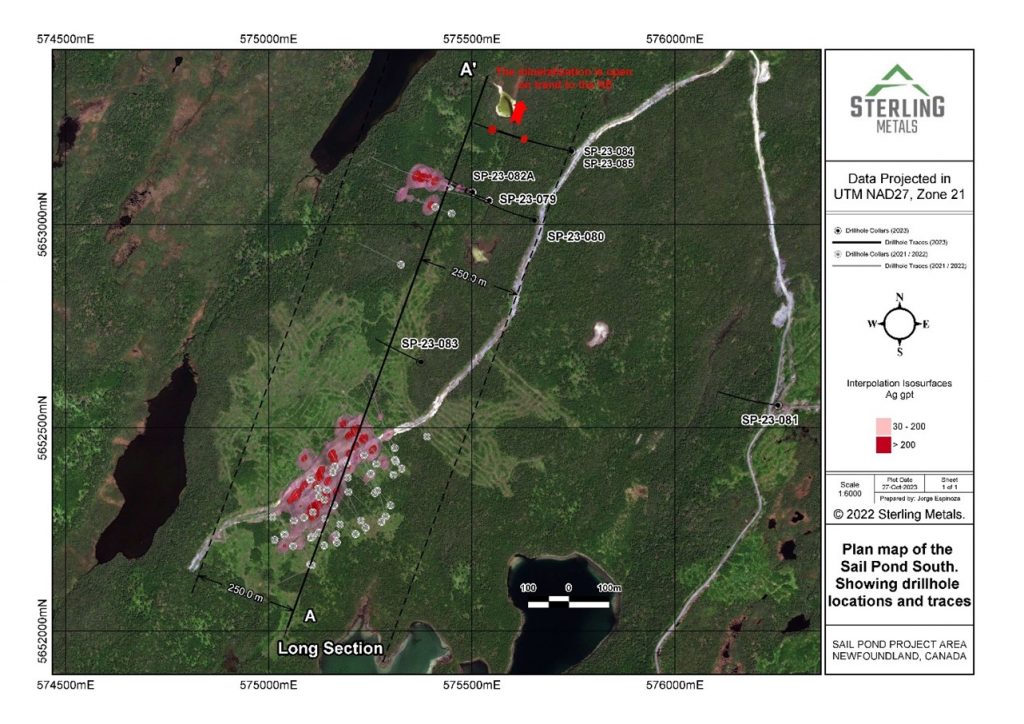
Sterling Metals (TSXV:SAG), reported the findings from their 2023 drilling activities at the Sail Pond Silver and Base Metal Project in Newfoundland’s Great Northern Peninsula. The exploration at Sail Pond, particularly at the Heimdall and Heimdall North zones, was aimed at discovering economically viable deposits of high-grade silver and copper.
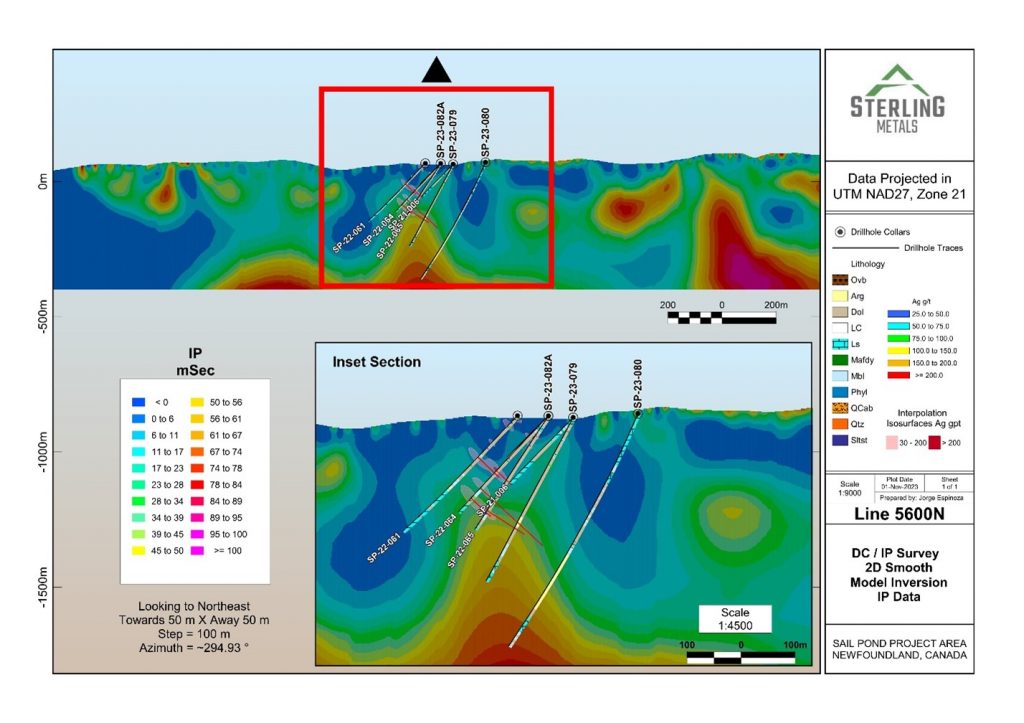
Jeremy Niemi, SVP Exploration and Evaluation, commented in a press release: “Ahead of our 2023 drilling campaign at Sail Pond, we implemented a systematic approach targeting the source of the mineralization at Heimdall North by employing the deep looking Orion survey. We were encouraged by strong geophysical targets in the right geological locations and these targets are where we started our 2023 drilling. Learning from the initial holes and with the mineralization source eluding us, our team rapidly pivoted to focus on structural data and on-the-ground observations for the final holes of the program. The final two holes yielded an additional high-grade copper-silver intersection and a broad mineralization zone spanning nearly 30 meters north of the Heimdall North Zone. Notably, this zone remains open to the north. Moving forward, our efforts will continue to concentrate on locating large areas of interest with the potential for massive sulphide accumulations, aiming to uncover the origins of the numerous high-grade intersections at Sail Pond.”
The company conducted a comprehensive ground geophysical survey during the winter of 2023, utilizing deep-looking Orion surveys and resistivity technology. This effort aimed to uncover large-scale anomalies indicative of significant silver-copper mineralization. Covering a total of 39.2-line kilometres of Induced Polarization (IP) and 19.6 kilometres of Titan MT, the survey targeted the identification of mineralization and key geological structures.
Despite initial setbacks, including a significant fault encountered in hole 79, which impeded drilling progress, Sterling Metals reported positive outcomes. The fault, filled with sand and loose material, suggested that the chargeability response beneath Heimdall North might be due to geological structures rather than sulfide accumulation. Further drilling between the Heimdall and Heimdall North zones revealed the presence of pyrite-bearing argillite rather than anticipated sulfide traps.
In a strategic shift, the final two drill holes of the program, SP-23-84/85, were guided by structural interpretations from surface mapping and LiDAR data. Targeting a structural convergence and potential dilation zone north of the Heimdall Zone, these holes successfully intersected high-grade silver-copper mineralization. This finding, expanding the Heimdall trend by 200 meters, marks a significant advancement in understanding the geological framework of the area and will inform future exploration efforts at Sail Pond.
Sterling Metals also updated on the progress at its Adeline Project in Labrador. The company completed a 1,930-meter drilling program in 2023 and is currently awaiting assay results from ALS. The assays, expected by the end of the month, have been delayed due to additional steps taken to ensure comprehensive collection of copper in the mineralization samples.
Overall, the company’s exploration activities, though facing geological challenges, have yielded promising results, particularly in the expansion of the Heimdall trend and the identification of new mineralization zones. These developments are pivotal in Sterling Metals’ ongoing efforts to delineate the extent and quality of mineralization at both Sail Pond and Adeline projects.
Highlights from the results are as follows:
- A total of 8 drill holes covering 2,058 m were completed, focusing on 4 distinct target areas defined by the Orion 3D geophysical survey (the “Orion survey”)
- Drilling extended high-grade silver-copper mineralization 200 m beyond previous intersections (Figure 2) and the area remains open to the north
- The new extension of the Heimdall North Zone discovered through structural interpretation of the project lidar, graded 932 g/t Ag, 4.51% Cu over 0.3 m starting at 209 m depth in hole SP-23-085 (Figure 3) and 303 g/t Ag, 1.26% Cu and 5.59% Pb over 0.3 m starting at 279.9 m (Figure 4)
- The Company is currently undertaking physical property studies using the relevant core from Sail Pond and its new structural understanding to delineate areas of interest for higher permeability where economic quantities of high-grade sulfides are trapped
Table 1. Reported assay intervals from 2023 Sail Pond drilling.
| Drillhole | From (m) | To (m) | Length (m) | AgEq (g/t) | Ag (g/t) | Cu (%) | Pb (%) | Zn (%) | Sb (%) |
| SP-23-079 | 98.08 | 98.43 | 0.35 | 209.7 | 79 | 0.094 | 3.89 | 0.014 | 0.042 |
| SP-23-080 | 236 | 236.25 | 0.25 | 110.2 | 62 | 0.25 | 0.17 | 0.18 | 0.06 |
| SP-23-081 | No Significant Results | ||||||||
| SP-23-082 | Hole stopped due to hole alignment issue | ||||||||
| SP-23-082A | Hole stopped due to fault zone | ||||||||
| SP-23-083 | No Significant Results | ||||||||
| SP-23-084 | 278 | 280.15 | 2.15 | 93.6 | 40 | 0.16 | 0.22 | 0.70 | 0.038 |
| inc | 279.9 | 280.15 | 0.25 | 718.3 | 303 | 1.26 | 1.54 | 5.59 | 0.28 |
| and | 287.7 | 288 | 0.3 | 411.4 | 205 | 0.73 | 2.74 | 0.39 | 0.20 |
| SP-23-085 | 208 | 210.35 | 2.35 | 265 | 147 | 0.71 | 0.17 | 0.14 | 0.18 |
| inc | 208.97 | 209.29 | 0.32 | 1665.3 | 932 | 4.51 | 0.93 | 0.76 | 1.12 |
| and | 277.45 | 305.45 | 28 | 28.1 | 8.5 | 0.037 | 0.12 | 0.27 | 0.019 |
| inc | 279.92 | 280.17 | 0.25 | 259.4 | 105 | 0.42 | 0.82 | 1.83 | 0.14 |
| inc | 288.25 | 288.6 | 0.35 | 201.7 | 2 | 0.019 | 0.06 | 5.81 | 0.016 |
| inc | 299 | 299.25 | 0.25 | 145.6 | 10 | 0.044 | 2.88 | 0.36 | 0.198 |
| inc | 300.55 | 301 | 0.45 | 208.9 | 110 | 0.39 | 0.31 | 0.94 | 0.10 |
- See Figure 2 and Table 2 for drillhole locations.
- All reported depths and intervals are drill hole depths and intervals unless otherwise noted, and do not represent true thicknesses, which have yet to be determined.
Table 2. Reported 2023 Sail Pond hole locations and directions.
| Hole ID | Easting | Northing | Elevation (m) | Azimuth | Dip | Final Depth (m) |
| SP-23-079 | 575543 | 5653059 | 63.4 | 290 | -65 | 343 |
| SP-23-080 | 575653 | 5653012 | 75 | 290 | -65 | 493 |
| SP-23-081 | 576255 | 5652556 | 106 | 280 | -45 | 208 |
| SP-23-082 | 575502 | 5653080 | 66.18 | 290 | -45 | 54 |
| SP-23-082A | 575502 | 5653080 | 66.18 | 295 | -45 | 108 |
| SP-23-083 | 575376 | 5652667 | 78 | 295 | -45 | 178 |
| SP-23-084 | 575741 | 5653185 | 73 | 290 | -45 | 352 |
| SP-23-085 | 575741 | 5653185 | 73 | 290 | -55 | 322 |
The above references an opinion and is for information purposes only. It is not intended to be investment advice. Seek a licensed professional for investment advice. The author is not an insider or shareholder of any of the companies mentioned above.
Osino Resources (TSXV:OSI) recently released an update on the ongoing Phase 2 drill program at its Eureka Project, which is focused on exploring and expanding the gold discovery initially reported on August 9, 2023. The current drill program, which began in late September 2023, has seen significant progress with five out of the planned seven holes, totalling 1,133 meters, already completed. There is a possibility of extending the drilling budget due to encouraging results from the ongoing step-out holes.
The drilling operations, comprising holes ORD010 to ORD014, were conducted on an azimuth of 090 degrees, targeting the area perpendicular to the strike of a parasitic fold identified on the surface. The subsequent holes, ORD015 and ORD016, are planned at an azimuth of 135 degrees, aiming to explore the geological formations east of this fold. These efforts are directed at testing the continuity of mineralization in areas marked by gossan and garnet alteration, as well as near the marble contact zone, where a recent rock chip sampling yielded an assay value of 12.1 g/t Au.
The Eureka Project is situated within the Okonguarri Formation of the Damara Supergroup. This geological setting is noteworthy as it is the same host rock that is found at the Otjikoto gold project of B2Gold Corp., located approximately 140 kilometres northeast along the same geological strike. The area’s lithology is characterized by a mix of interbedded sands, shales, mudstones, calcareous sands, and marble, all of which have undergone metamorphosis to greenschist facies. This geological complexity is further accentuated by multiple episodes of folding and faulting, contributing to the intricate structural formation of the region.
The current focus of drilling is a south-westerly plunging shoot, which has been intersected over an area of approximately 350 by 150 meters, with a variable thickness of 20 to 60 meters. This mineralized zone remains open to the west, south, and east and is primarily concentrated along a fault or series of faults on the axial plane of an overturned F1 recumbent fold. The complexity of the deposit is compounded by the re-folding of the F1 fold along a later F2 fold generation, enhancing the fracture system within the deposit.
The gold mineralization at Eureka is believed to have occurred in two distinct phases. The initial phase is associated with low-grade, bedding parallel quartz-carbonate veins, followed by a higher-grade phase in massive sulphide breccias along axial planar faults. The sulphide composition mainly includes pyrrhotite and pyrite, with traces of chalcopyrite. The most significant grade intervals are characterized by massive pyrrhotite and intense brecciation. Garnet alteration, particularly in finely interbedded sands and shales, is frequently linked with high-grade zones and serves as a key indicator for gold exploration in the region.
Dave Underwood, Osino’s VP Exploration commented in a press release: “We have now spent considerable time and effort on site doing fine-scale mapping and relogging core to interpret the results at this first Eureka target. The mineralization at Eureka is quite different to the company’s other deposits at Twin Hills and Ondundu, with its much higher gold grades associated with sulphide breccias and skarn alteration. The excitement is building within the team as we come to grips with what Eureka has to offer in terms of grade, scale and the potential for multiple deposits. The mineralization at Eureka is hosted within a calcareous sedimentary package which has seen at least two and possibly three episodes of complex folding and faulting. We are using oriented diamond core for all holes to try and unravel the geological puzzle and build a coherent lithological and structural model. The first hole in the second phase of drilling appears to have clipped the edge of the mineralization but the second hole (ORD011) went through a wide zone and returned 61m @ 2.40g/t Au from 66m down. The third hole intercepted a very high grade (20m @ 5.60g/t) interval to the north of ORD011, confirming the robustness of the mineralization.
The next two holes drilled to the south and southeast of previous work also show visual indicators of good mineralization including sulphide breccias and visible gold. We expect to receive these results before the end of November. The Eureka deposit is wide open to the east, west and south at this stage and there are strong indications in the magnetic data that there may be a second parallel shoot just 1km to the west.”
Future Exploration Plans
The company has outlined a comprehensive work program for the coming months at the Eureka discovery and its surrounding areas. Key components of this program include:
- Completion of the Phase 2 drilling and subsequent assaying, followed by an update to the geological and structural model.
- Execution of a detailed heli-borne magnetic survey, scheduled for late November 2023, to refine the five magnetic targets identified from regional magnetics and potentially uncover additional targets.
- Alteration mapping utilizing satellite and airphoto data.
- Expansion of step-out and infill surface geochemistry sampling programs, including exploration of new targets in the northern part of the license area, within the Kuiseb Formation Sediments.
- Additional delineation and step-out drilling planned for the first quarter of 2024.
- Follow-up mapping and rock chip sampling across the area, stemming from a comprehensive soil program.
- Scout drilling of magnetic targets, particularly focusing on pyrrhotite dominated mineralization due to its strong magnetic signature.
Highlights from the results are as follows:
- Eureka (Phase 2) step-out drill program consisting of seven holes for 1400m nearing completion, focussed on the first of five geophysical and surface targets in the area.
- Latest results received include:
- ORD011: 61m @ 2.4g/t Au incl. 13m @ 6.2g/t and 13m @ 3.39g/t (from 66m)
- ORD012: 20m @ 5.60g/t Au (from 75 to 95m)
- Detailed mapping on surface, combined with structural logging of the oriented diamond core, has enabled the team to build a preliminary lithological and structural model.
- Helicopter-borne magnetic and radiometric survey to be completed before end of 2023 designed to better define the remaining four primary geophysical targets for drill testing early in 2024.
- Results from the previous round of Eureka drilling include:
- ORD005: 47m @ 5.92g/t Au (144 – 191m) incl. 27m @ 8.69g/t Au and 3m @ 13g/t Au
- ORD006: 18m @ 4.94g/t Au (194 – 212m) and 5m @ 3.5g/t Au
- ORD004: 17m @ 4.13g/t Au (81 – 98m) and 13m @ 5.77g/t Au
- ORD001: 38m@ 1.67g/t Au (43 – 81m) incl. 3m @ 9.43g/t Au and 3m @ 6.90g/t Au
The above references an opinion and is for information purposes only. It is not intended to be investment advice. Seek a licensed professional for investment advice. The author is not an insider or shareholder of any of the companies mentioned above.
Tower Resources (TSXV:TWR) has completed its first follow-up diamond drilling program at the Rabbit North property in Kamloops, British Columbia. The program aimed to further explore the Rainbow porphyry copper-gold-molybdenum (Cu-Au-Mo) zone and the Thunder gold zone, which are newly discovered areas on the property.
The drilling program consisted of four holes, numbered RN23-046 to RN23-049, covering a total depth of 1052.2 meters. Holes RN23-046 and RN23-047 were drilled in the Thunder Zone, while RN23-048 and RN23-049 targeted the Rainbow Zone. These zones are covered by over 15 meters of glacial till and partly by up to 40 meters of Chilcotin basalt flows. Beneath the basalt, a weathering profile suggests potential for supergene enrichment of primary sulphide mineralization.
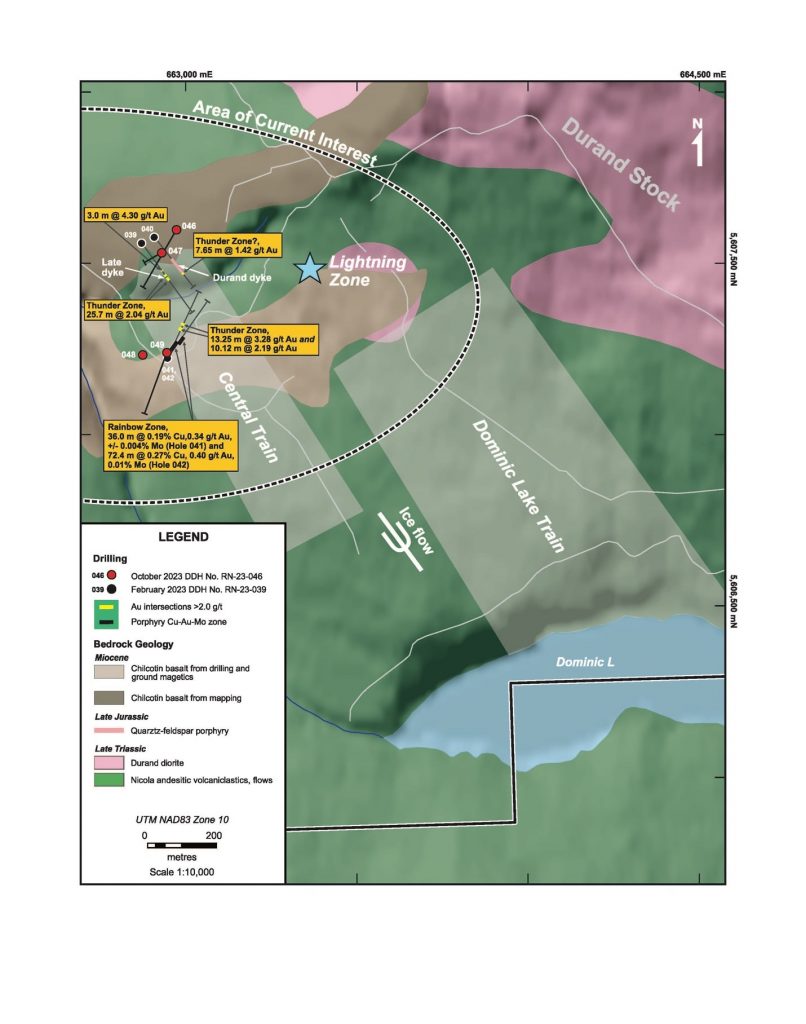
The Rainbow Zone, characterized by a magmatic-hydrothermal breccia, was the focus of holes RN23-048 and RN23-049. These holes aimed to confirm the presence of Cu-Au-Mo mineralization and assess its economic potential, following earlier discoveries in holes RN23-041 and RN23-042.
The Thunder Zone, investigated by holes RN23-046 and RN23-047, was initially explored through earlier holes RN23-039 and RN23-041. The objective was to determine the structure and extent of the gold mineralization in this area.
Hole RN23-048 was drilled to explore the western thickening of the Rainbow Zone, while RN23-049 aimed to ascertain the continuity of mineralization across a magnetic anomaly. Hole RN23-046 was drilled to intersect the Thunder Zone near a previous intersection, and RN23-047 was oriented to confirm or reject the hypothesis of a single gold zone. Tower Resources plans to announce the results of the drilling program after completing the analysis of all assays.
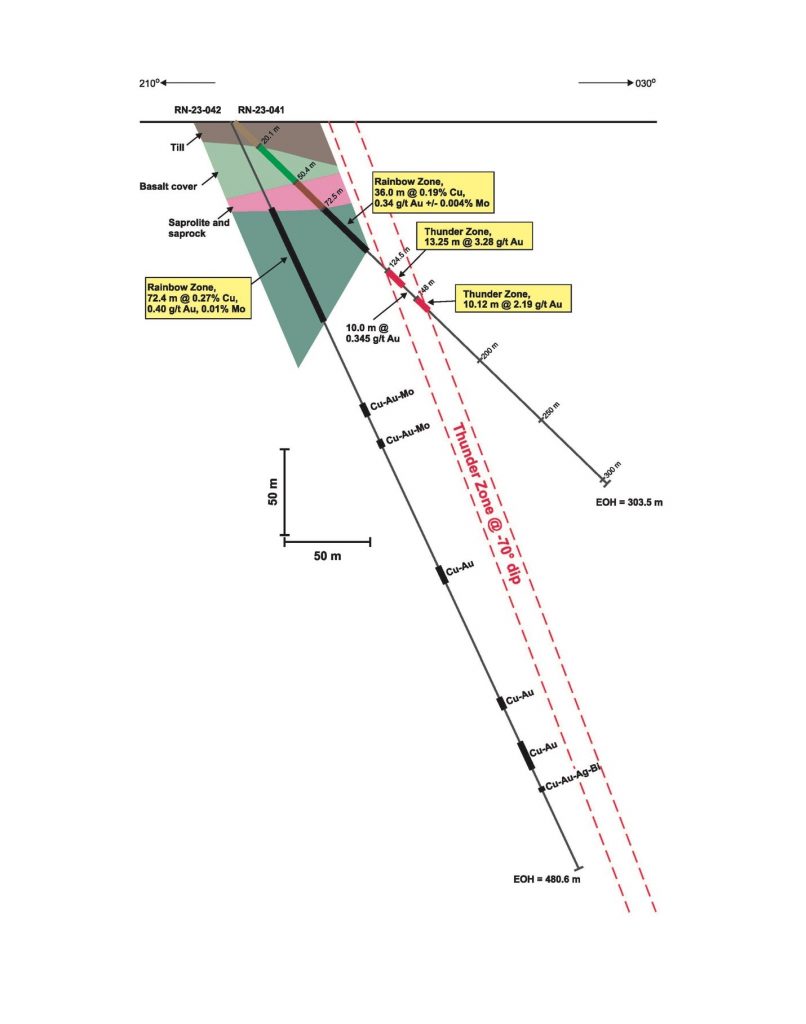
Highlights from the results are as follows:
Table 1 – Drill hole summary for Holes 046 to 049.
| Hole No. | Aximuth (°) |
Dip (°) |
Length (m) |
Target (Zone) |
Objective |
| RN23-046 | 210 | -45 | 275.2 | Thunder | Cross zone near Hole 039 intersection |
| RN23-047 | 240 | -60 | 117.0 | Thunder | Determine whether zone strikes SSE or ENE |
| RN23-048 | 0 | -90 | 363.0 | Rainbow | Confirm zone thickens rapidly to west |
| RN23-049 | 200 | -50 | 297.0 | Rainbow | Confirm zone continuity across saddle in associated magnetic anomaly |
| 1052.2 |
The above references an opinion and is for information purposes only. It is not intended to be investment advice. Seek a licensed professional for investment advice. The author is not an insider or shareholder of any of the companies mentioned above.
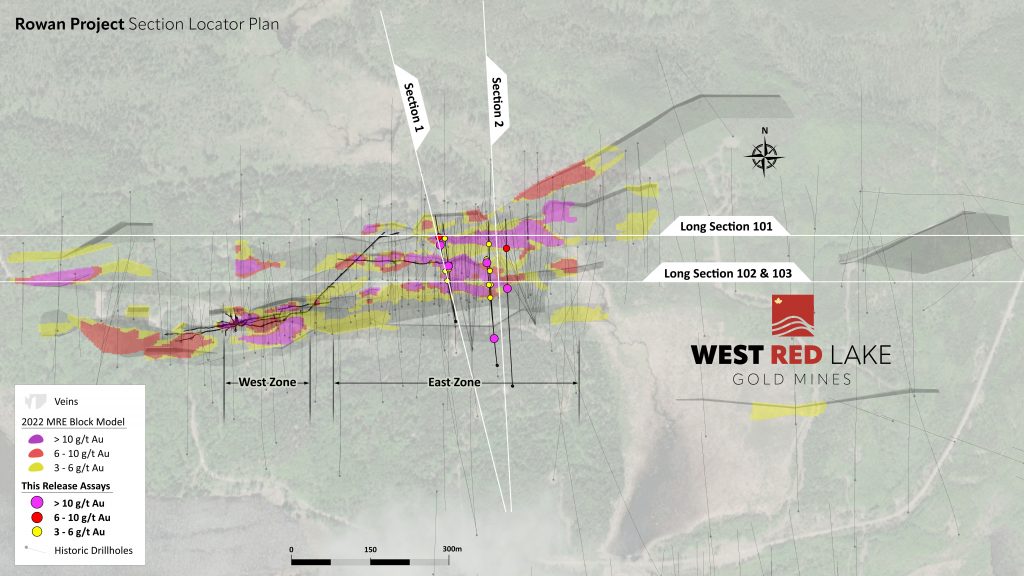
West Red Lake Gold Mines (TSXV:WRLG) recently announced significant results from their drilling operations at the Rowan Property, located in the Red Lake Gold District in Northwestern Ontario. The property, wholly owned by the company, has been a focal point of its exploration activities.
Shane Williams, President & CEO, commented in a press release: “With this latest round of Rowan drill results, we have now successfully extended mineralization in the high-grade East Zone down to a vertical depth of 490m. If the Red Lake District has taught us anything, it’s that these zones can continue to depths exceeding 4km when the structural and geologic conditions are right. The Rowan Mine target has consistently demonstrated it has what it takes to produce high-grade gold intercepts over significant widths, and we look forward to continuing to drill and grow this exceptional resource along strike and at depth.”
In their latest update, West Red Lake Gold Mines highlighted the outcomes from two specific drill holes, RLG-23-171 and RLG-23-172. These holes are notable for being the deepest so far to intercept Vein 101 in the East Zone, a high-grade ore chute. This chute has been traced over an impressive length of 250 meters and reached a vertical depth of 490 meters from the surface, with indications that it extends further.
An intriguing discovery was made with Hole RLG-23-171, which intersected a new vein, running parallel and south of the established Rowan vein system. This vein showed a gold content of 19.82 grams per tonne (g/t) over a length of 0.8 meters, suggesting potential for further discoveries in the area.
Additionally, the company reported high-grade intercepts in Hole RLG-23-168, located outside the mineral resource domains defined in December 2022. This finding points to the potential for expanding the resource along the west.
The Rowan Mine Target, where these findings were made, has continued to deliver results that exceed initial expectations. These results not only align with the geological models but also enhance the known high-grade Inferred Mineral Resource at the site, which currently stands at 827,462 ounces of gold at an average grade of 9.2 g/t.
So far in 2023, West Red Lake Gold Mines has completed 52 diamond drill holes covering 18,990 meters at the Rowan Mine target. Out of these, assay results for 45 holes have been received, with one hole partially assayed and six awaiting results and quality control checks.
The Rowan Mine Target is characterized by more than seven sub-parallel, near-vertical veins extending over approximately 1.1 kilometres. These veins follow the east-west direction of D2 deformation and are typically 1.0 to 1.5 meters thick. The entire Rowan vein corridor is about 115 meters thick. Gold mineralization is primarily found within quartz-carbonate veins along the footwall margin of a porphyritic felsic intrusive. The presence of visible gold and base metal sulphides, like galena and sphalerite, often indicates higher gold grades.
The drilling campaign in 2023 has focused on verifying historical data and filling gaps in the analytical data from previous selective sampling techniques. The results so far reaffirm the presence of gold mineralization at depth and along the strike, with grades consistent or exceeding those in the current Inferred Mineral Resource. Notably, recent drilling in the 100 Vein Zone, previously considered lower grade, has revealed higher gold grades at deeper levels, a trend observed in other parts of the Red Lake district. The ongoing drilling at the Rowan Mine Target aims to further delineate and expand the high-grade mineral resource.
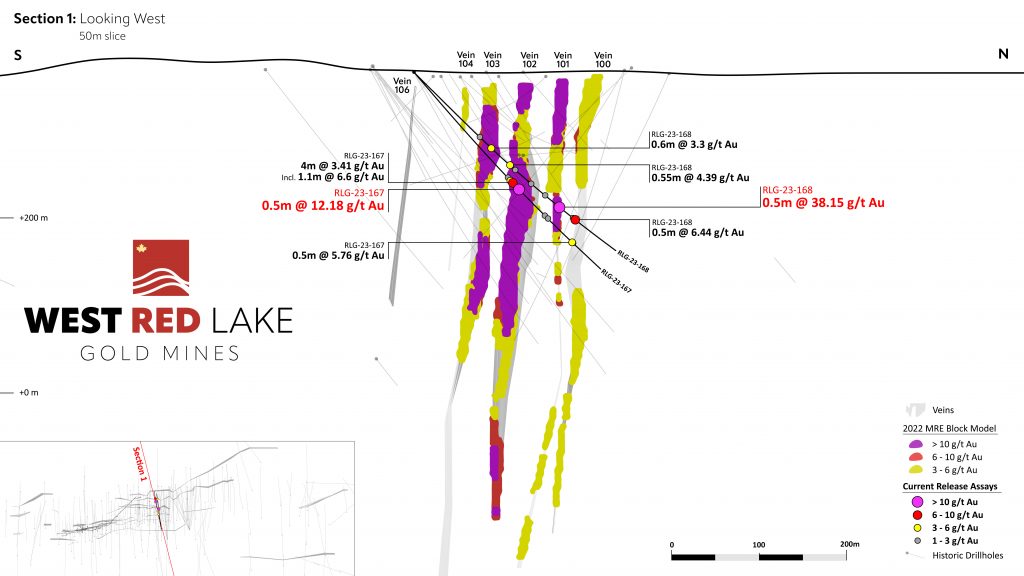
- Hole RLG-23-171 Intersected 2.4m @ 10.92 g/t Au, from 562.35m to 564.75m, Including 0.5m @ 48.30 g/t Au, from 564.25m to 564.75m; and 0.8m @ 19.82 g/t Au, from 147.2m to 148m.
- Hole RLG-23-172 Intersected 2.15m @ 11.07 g/t Au, from 443.60m to 445.75m, Including 0.5m @ 45.90 g/t Au, from 444.70m to 445.20m.
- Hole RLG-23-168 Intersected 0.5m @ 38.15 g/t Au, from 229.75m to 230.25m
TABLE 1. Significant intercepts (>3 g/t Au) from drilling at Rowan Mine Target.
| Hole ID | Target | Zone | From (m) | To (m) | Thick (m)* | Au (g/t) |
| RLG-23-167 | Rowan Mine | V102 (hw) | 170.00 | 174.00 | 4.00 | 3.41 |
| Incl. | Rowan Mine | 170.00 | 171.10 | 1.10 | 6.60 | |
| AND | Rowan Mine | V102 | 180.30 | 180.80 | 0.50 | 12.18 |
| AND | Rowan Mine | V100 | 267.00 | 267.50 | 0.50 | 5.76 |
| RLG-23-168 | Rowan Mine | V103 | 125.40 | 126.00 | 0.60 | 3.30 |
| AND | Rowan Mine | V102 (hw) | 154.50 | 155.05 | 0.55 | 4.39 |
| AND | Rowan Mine | V101 | 229.75 | 230.25 | 0.50 | 38.15 |
| AND | Rowan Mine | V100 | 253.00 | 253.50 | 0.50 | 6.44 |
| RLG-23-170 | Rowan Mine | V103 (fw) | 318.00 | 319.00 | 1.00 | 4.45 |
| AND | Rowan Mine | V102 | 370.00 | 372.00 | 2.00 | 3.66 |
| Incl. | Rowan Mine | 370.00 | 371.00 | 1.00 | 6.78 | |
| AND | Rowan Mine | V101 | 469.00 | 471.00 | 2.00 | 5.64 |
| Incl. | Rowan Mine | 470.00 | 471.00 | 1.00 | 9.13 | |
| RLG-23-171 | Rowan Mine | NEW | 147.20 | 148.00 | 0.80 | 19.82 |
| AND | Rowan Mine | V103 | 370.50 | 372.00 | 1.50 | 3.77 |
| Incl. | Rowan Mine | 371.00 | 372.00 | 1.00 | 5.27 | |
| AND | Rowan Mine | V102 | 440.00 | 444.00 | 4.00 | 3.93 |
| Incl. | Rowan Mine | 442.00 | 442.50 | 0.50 | 10.74 | |
| AND | Rowan Mine | V101 | 562.35 | 564.75 | 2.40 | 10.92 |
| Incl. | Rowan Mine | 564.25 | 564.75 | 0.50 | 48.30 | |
| AND | Rowan Mine | V100 (fw) | 582.00 | 582.50 | 0.50 | 4.42 |
| RLG-23-172 | Rowan Mine | V103 (fw) | 443.60 | 445.75 | 2.15 | 11.07 |
| Incl. | Rowan Mine | 444.70 | 445.20 | 0.50 | 45.90 | |
| AND | Rowan Mine | V101 | 602.35 | 602.85 | 0.50 | 6.28 |
*The “From-To” intervals in Table 1 are denoting overall downhole length of the intercept. True thickness has not been calculated for these intercepts but is expected to be ≥ 60% of downhole thickness based on intercept angles observed in the drill core. Under ‘Zone’ column, (hw) is indicating ‘hanging wall to’ and (fw) is indicating ‘footwall to’ main vein zones.
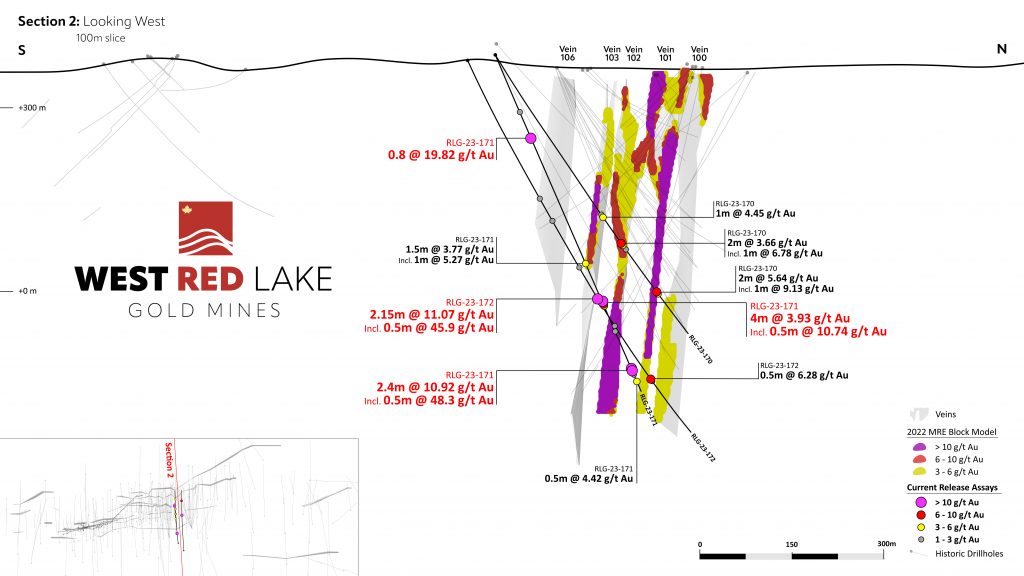

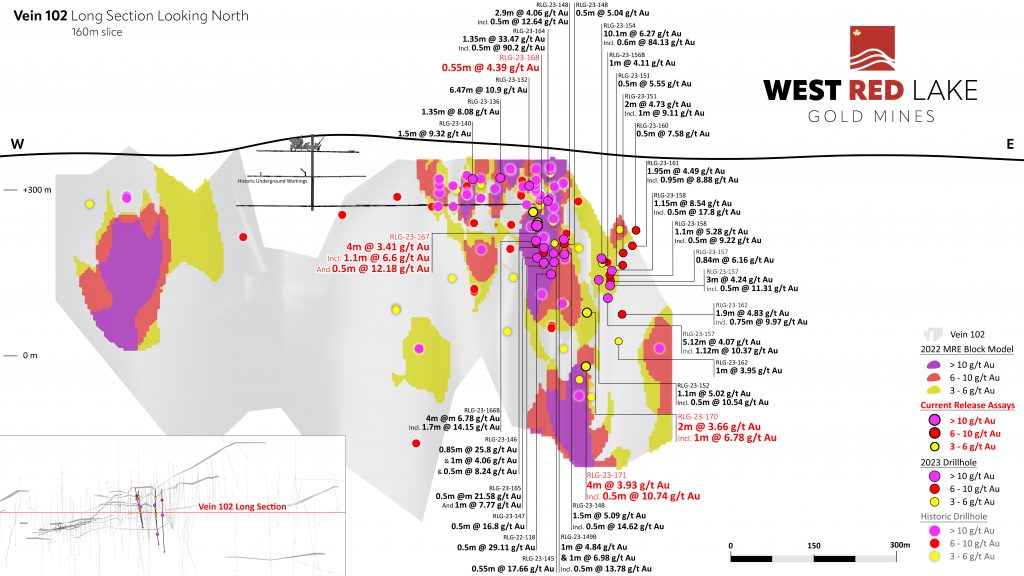
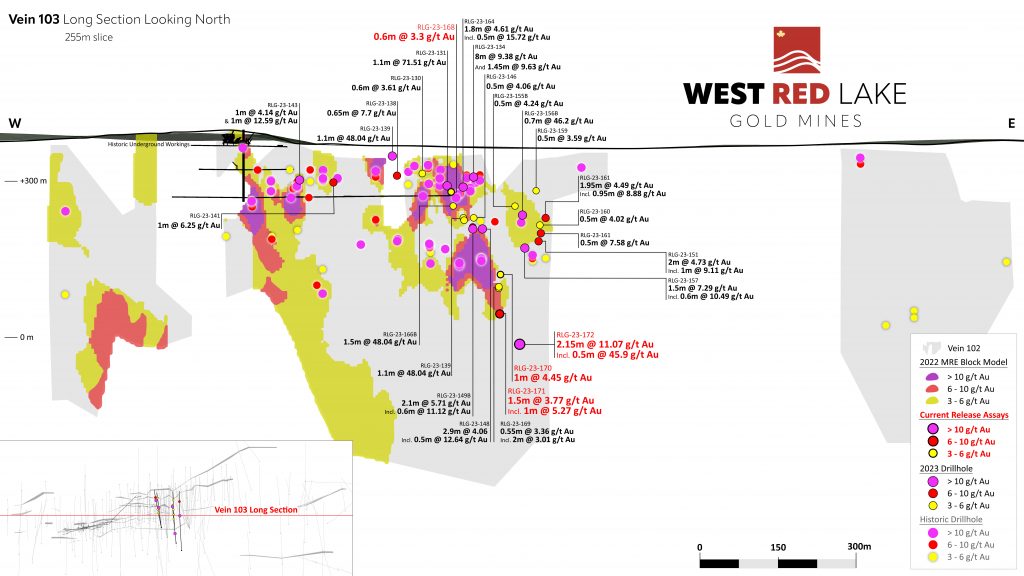
| Hole ID | Target | Easting | Northing | Elev (m) | Length (m) | Azimuth | Dip |
| RLG-23-167 | Rowan Mine | 422019 | 5657795 | 367 | 312 | 350 | -50 |
| RLG-23-168 | Rowan Mine | 422019 | 5657795 | 367 | 312 | 348 | -45 |
| RLG-23-170 | Rowan Mine | 422110 | 5657700 | 386 | 555 | 353 | -59 |
| RLG-23-171 | Rowan Mine | 422110 | 5657700 | 386 | 600 | 353 | -67 |
| RLG-23-172 | Rowan Mine | 422143 | 5657654 | 378 | 712 | 356 | -66 |
The above references an opinion and is for information purposes only. It is not intended to be investment advice. Seek a licensed professional for investment advice. The author is not an insider or shareholder of any of the companies mentioned above.
Anthony Cohen, CEO of Plato Gold (TSXV:PGC), recently took the time to talk to MiningFeeds about the company’s ambitious moves in gold exploration. The focus of the discussion was the commencement of a drill program at the company’s promising Marriott Gold Property. This project, nestled in Matheson, Ontario, and part of the renowned Abitibi Greenstone Belt, marks a significant step for Plato Gold.
This drill program is a strategic follow-up to an airborne magnetic survey conducted in the spring of 2022. Using advanced Unmanned Aerial Vehicle (UAV) technology, the team at Plato Gold has identified two exploration targets based on the geology and geophysics of the area. The planned drilling will cover 450 meters across these two holes, aiming to uncover the potential high-grade gold deposits. Plato Gold has also made headlines with its Timmins Gold Project in Ontario, Canada, and the Lolita Project in Santa Cruz, Argentina. These projects represent the company’s strategic positioning in some of the world’s most significant gold and base metal camps.
The above references an opinion and is for information purposes only. It is not intended to be investment advice. Seek a licensed professional for investment advice. The author is not an insider or shareholder of any of the companies mentioned above.
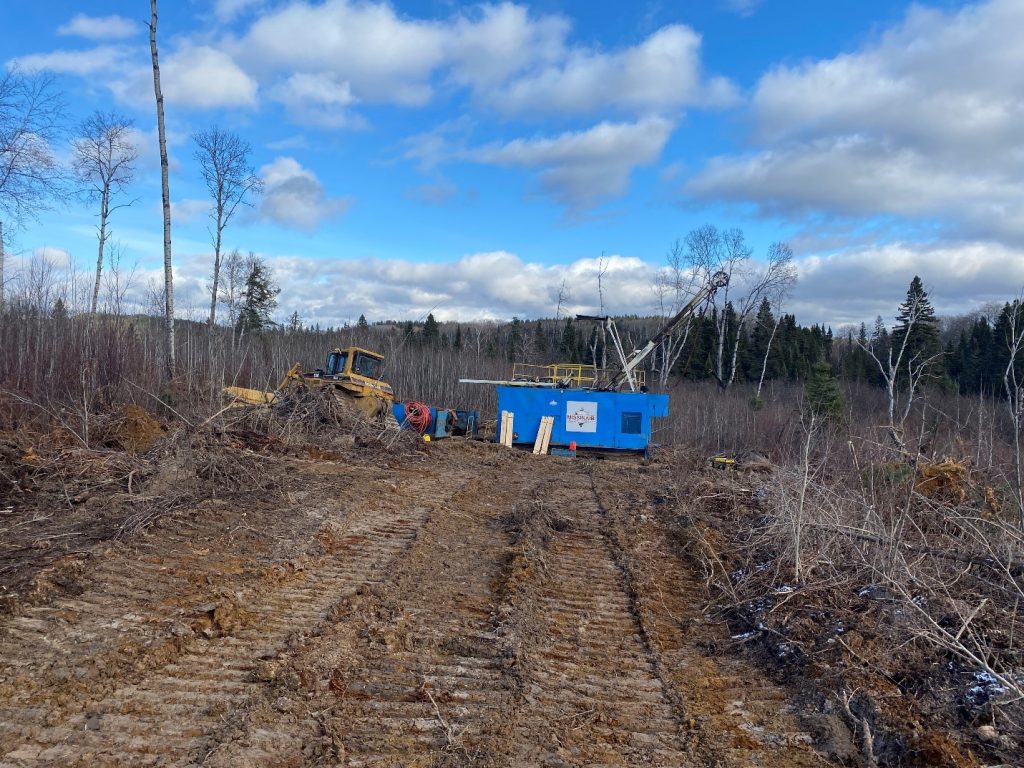
Plato Gold (TSXV:PGC) has initiated a drilling campaign at their Marriott Gold Property located in Matheson, Ontario. The drilling effort, composed of two holes totalling 450 meters, is targeting areas identified as promising by both geological and geophysical studies, as illustrated in Figure 1. This new phase of drilling is a direct progression from the airborne magnetic surveys conducted with an Unmanned Aerial Vehicle (UAV) in the spring of the previous year. The chosen drill sites are approximately 11 kilometres to the east of the Holt gold mining complex owned by Agnico Eagle.
Anthony Cohen, President and CEO of Plato Gold, commented in a press release: “Plato is pleased to commence drilling on one of our well-located gold properties in the Harker/Holloway gold camp. All of our properties have excellent infrastructure nearby, as well as either currently operating or historic mining operations.”
The drill hole collars were precisely positioned at anomalies highlighted by geophysical analysis, linking magnetic, electromagnetic (EM), and gravity highs. These highs are believed to correspond with iron-rich tholeiitic basalts, and potentially with sulphide and gold mineralization. The gravity-high signals at the drill locations are similar to those at the historic Harker and Iris gold mines.
The Marriott Gold Property lies within the prolific Abitibi Greenstone Belt, known for its extensive gold mining history. Geologically, the area of the planned drill holes falls within a southern deformation zone that runs parallel to the Porcupine-Destor Deformation Zone on the northern boundary of the property. Interpretations of the 2022 UAV magnetic survey suggest that northeast-southwest trending crosscut faults are near the drill sites, which could act as conduits for gold-enriched fluids. It is within these structures that gold mineralization is typically found in the Abitibi region.
Further geophysical examination indicates that the selected drill targets lie along a stratigraphic unit trending southwest, which continues towards the Harker gold mine, Iris mine, and the Howey-Cochenour-Williams occurrence, hosting a range of minerals such as gold, silver, tungsten, copper, lead, and zinc. Harker gold mine, located roughly 14.7 kilometers southwest from the drill sites, has a history of exploration, with significant amounts of ore being previously excavated and processed.
The Marriott Property itself spans approximately 2728 hectares with 142 cell claims and is wholly owned by Plato Gold Corp. It’s positioned in the eastern segment of the Abitibi Greenstone Belt, near the Ontario-Quebec border, within the mineral-rich Timmins-Kirkland Lake area.
The Abitibi Greenstone Belt is an ancient volcanic sequence over 2.6 billion years old, known for its significant gold deposits. This geological formation is one of the largest of its kind and has played a critical role in the mining history of both Ontario and Quebec. The area has been a focal point for numerous scientific studies due to its complex seismic and volcanic history and continues to be a major target for mineral exploration and investment due to its vast resource potential.
Some of the highlights of the property are as follows:
Marriott Property:
- Located within Abitibi Greenstone Belt gold mining camp
- Excellent access – located on Highway 101
- Excellent infrastructure – located 45 km northeast of Kirkland Lake and 130 km east of Timmins
The proposed drill holes were selected based on geophysics and geology characteristics of Abitibi gold deposits:
- Magnetic, electromagnetic (EM) and gravity anomalies
- Deformation zone parallel to Porcupine-Destor Deformation Zone
- NE-SW trending fault
- Same stratigraphic unit as the historic Harker gold mine and Iris gold mine.
The above references an opinion and is for information purposes only. It is not intended to be investment advice. Seek a licensed professional for investment advice. The author is not an insider or shareholder of any of the companies mentioned above.
![]()
Gladiator Metals (TSXV:GLAD) has updated shareholders on the latest developments in its exploration activities at the Whitehorse Copper Project, a site with a history of copper production. The company’s recent efforts include compiling historical drilling data, conducting a LIDAR survey, and sampling in areas around the Arctic Chief mining pits.
Gladiator CEO, Jason Bontempo commented in a press release: “The Arctic Chief Trend continues to develop as a significant exploration opportunity with outcropping copper-gold skarn mineralization now mapped by Gladiator extending for at least 2.4km of strike and external to past historical operations. Previous successful exploitation of the Arctic Chief Trend was very limited in scope and depth, with only minor amounts of drilling being undertaken outside of the past production area. Mineralization remains open in all directions (along strike and at depth) at all of the defined prospect areas. Regional programs are still active in the Whitehorse Copper belt with the results of ongoing drone borne magnetics anticipated shortly”.
The focus of the current work is the Arctic Chief Trend, where historical records indicate past production of high-grade copper ore. Gladiator Metals has charted several prospective zones extending over a 2.4km strike. The trend contains two shallow historic open pits, named East and West, which previously yielded copper ore with significant gold content.
Historical records, as cited by a report from 1984, indicate that the Arctic Chief area produced over 200,000 tonnes of copper ore with grades of 1.4% copper and 1.0 g/t gold. Despite these figures, past mining efforts were confined and shallow, with minimal drilling beyond the mined zones, suggesting the presence of unexplored mineralization along strike and at depth.
Gladiator Metals’ review of historical drilling has uncovered indications of potential mineralization extending from the small excavations. Notably, the previous drill samples were tested only for copper, despite high-grade gold being present, as recent sample analysis showing gold values reaching up to 19.9 g/t. Future assays will now also test for gold, silver, and molybdenum, recognizing their historical contribution to the site’s value.
The company has retrieved drill records from the Yukon Geological Survey and incorporated them into a database, standard within the industry. Detailed historical drilling data and rock chip sampling results have been made available for public access.
On the regional exploration front, Gladiator Metals has identified over 30 new high-grade targets suitable for drilling. These sites are linked with copper-rich skarns along the boundary where the Cretaceous Whitehorse Plutonic Suite meets the clastic and carbonate metasediments of the Triassic to Jurassic Lewes River Group. This contact zone extends over 35km and is considered underexplored but highly promising for high-grade copper and other minerals.
Gladiator Metals’ exploration efforts are facilitated by the accessible nature of the Whitehorse project, which benefits from existing infrastructure and its proximity to the city of Whitehorse. The company also notes the advantage of having an established partnership with the project’s landholders and a local drilling service provider.
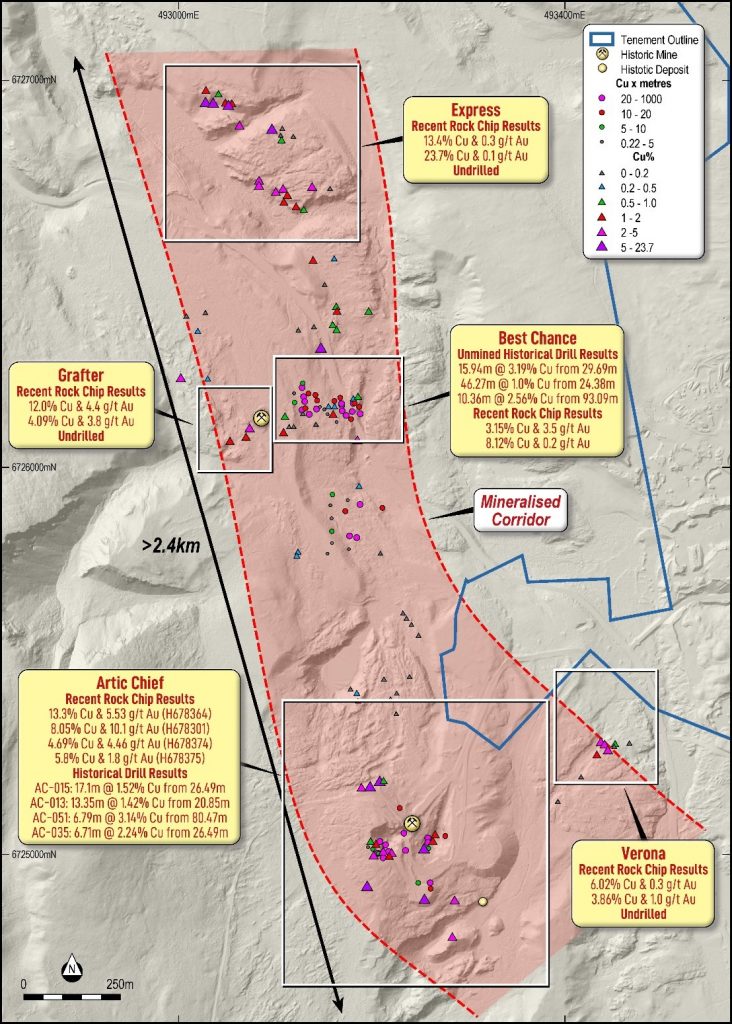
Highlights from the project are as follows:
Best Chance Prospect
Recently collated historic drilling (51 holes for 5,038 metres) none of which had been previously reported by the Company, highlight significant mineralization that remains unmined and extends over more than 250m with mineralization remaining open along strike and at depth. Downhole mineralization includes:
- BCH-024: 15.94m @ 3.19% Cu from 29.96m
- BCH-022: 16m @ 1.6% Cu from 25.15m
- BCH-029: 14.94m @ 1.75% Cu from 27.43m
- BCH-023: 46.27m @ 1.0% Cu from 24.38m
- BCH-010: 20.18m @ 1.5% Cu from 88.51m including 10.36m @ 2.56% Cu from 93.09m
- BCH-006: 51.66m @ 0.67% Cu from 12.13m
- BCH-037: 17.07m @ 1.5% Cu from 74.37m
In conjunction to the historic drill data compilation, Gladiator undertook reconnaissance, investigation and sampling of outcropping mineralization proximal to historic drilling. Sampling identified multiple zones of outcropping mineralization in the Best Chance prospect area with results including:
- Outcropping skarn mineralization 150m to the north of the drill area. Rock chips include:
- 8.12% Cu and 0.2g/t Au (H678262)
- 2.39% Cu (H678263 – No Au assay)
- Outcropping skarn mineralization 150m to the south of the drill area. Rock chips include:
- 3.15% Cu and 3.5g/t Au (H678352)
Verona Prospect
Undrilled high-grade copper and gold mineralization 400m to the NE of two small open cut mining pits located at Arctic Chief historic mining area defined by rock chipping with results including:
- 6.02% Cu and 0.3g/t Au (H678347)
- 3.86% Cu and 1g/t Au (H678349)
- 2.55% Cu and 0.1g/t Au (H678453)
Grafter Prospect
Undrilled high-grade copper and gold mineralization defined by rock chipping around small, historic underground workings 200m to the West of the Best Chance prospect area with results including:
- 12% Cu and 4.4g/t Au (H678356)
- 4.09% Cu and 3.8g/t Au (H678310)
Empress of India Prospect
Undrilled high-grade copper and gold mineralization defined by rock chipping of multiple zones over more than 400m of strike with results including:
- 23.7% Cu and 0.1g/t Au (H678385)
- 13.4% Cu and 0.3g/t Au (H678332)
- 12.95% Cu and 0.1g/t Au (H678332)
Arctic Chief Prospect
The results above over the various prospects comprising the Arctic Chief trend are in addition to a previously announced data compilation completed at Artic Chief Prospect (News release dated 31 July 2023) which included (refer to Figure 3 for locations):
- Unmined Intersections:
- AC-015: 17.1m @ 1.52% Cu from 26.49m
- AC-013: 13.35m @ 1.42% Cu from 20.85m
- AC-051: 6.79m @ 3.14% Cu Fr 80.47m
- AC-035: 6.71m @ 2.24% Cu Fr 29.44m
- Mined Intersections:
- XAC-001 21.33m @ 1.48% Cu from 6.1m
- XAC-002: 8.43m @ 2.31% Cu from 37.75m
- XAC-004: 30.48m @ 1.83% Cu from 15.24m
- AC-002: 21.03m @ 3.95% Cu from 21.34m including 9.75m @ 7.81% Cu from 29.87m
- AC-009: 23.17m @ 1.10% Cu from 19.2m
- AC-010: 27.09m @ 1.49% Cu from 23.2m including 9.96m @ 3.18% Cu from 40.33m
- AC-022: 11.34m @ 2.06% Cu from 35.72m
- AC-026: 14.2m @ 1.8% Cu from 22.04m, including 7.62m @ 3.01% Cu from 23.56m
The above references an opinion and is for information purposes only. It is not intended to be investment advice. Seek a licensed professional for investment advice. The author is not an insider or shareholder of any of the companies mentioned above.

Solaris Resources (TSX:SLS) has announced the addition of Mr. Javier Toro to their executive team as the Chief Operating Officer (COO), starting January 1st, 2023. Mr. Toro will take the reins of the Warintza Project, which is situated in the southeastern region of Ecuador. In a parallel development, the company has disclosed that it is close to securing significant financing, citing advanced negotiations over an offtake financing package amounting to US$80 million. This funding is intended to support the necessary studies and permitting processes for the Warintza Project.
Mr. Toro, an industry veteran, brings over a quarter-century of experience as a Mining Engineer. His illustrious career is highlighted by his expertise in steering the design and execution of engineering and economic assessments for notable open-pit copper ventures across the Americas. His previous position was with Hudbay Minerals, where he ascended to the role of Vice President, Mining Technical Services, after holding a series of incrementally senior positions. His tenure at Hudbay was marked by his oversight of several crucial technical reports and economic assessments for significant mining projects, including the Constancia mine in Peru and Copper World mine in the United States.
Before his engagement with Hudbay Minerals, Mr. Toro’s expertise was honed at Golder Associates Peru S.A., where he was instrumental in delivering mining designs and project cost evaluations. His foundational roles in various management capacities have been focused on geotechnical, hydrogeological, and mine planning operations. Mr. Toro’s academic credentials are equally impressive, with a Bachelor’s degree in Mining Engineering with Honors from the National University of Engineering in Lima, Peru.
The financial package, which Solaris is nearing an agreement on, must meet several conditions before the closing of the US$80 million financing deal. These include finalizing definitive documentation, and it’s been noted that there’s no certainty yet that this consensus will be reached or that the financing will ultimately be confirmed.
In related news, on September 12, 2023, Solaris provided an update on its exploration, reporting copper equivalent grades from its initial two reconnaissance drill holes at the Patrimonio site. Discovered in June 2023, Patrimonio is a new copper deposit located roughly half a kilometre southwest of Warintza Central. The drilling outcomes not only established the presence of significant copper mineralization but also uncovered a distinctive skarn-style mineralization within carbonate-rich volcanic sequences. The origin of this mineralization remains unidentified.
The two drill holes, SLSP-01 and SLSP-02, delivered copper equivalent grades from the surface, indicating two distinct phases of mineralization. The upper portions of the drill holes showed evidence of strong skarn alteration along with potassic alteration, with the latter stages dominated by a dacite porphyry showing quartz-sericite-pyrite alteration. The insights drawn from the drill core analysis point to a complex geological formation and suggest a different origin for the skarn mineralization compared to the later-stage alterations. This discovery hints at the possibility of uncovering additional skarn mineralization and potentially its source within the larger Patrimonio anomaly.
The company is actively engaged in detailed mapping and sampling efforts aimed at refining its understanding of this mineral system. These efforts include establishing the patterns of skarn presence and alteration zonation to prioritize further drilling sites. The mineralization detected so far remains open in multiple directions, adjacent to a less mineralized quartz-monzodiorite porphyry. The geological footprint of Patrimonio is outlined by an extensive soil anomaly pattern, with copper and molybdenum anomalies complementing each other and suggesting a strong mineral presence, which is further confirmed by the outcropping porphyry system showcasing extensive alteration and veining on the western periphery of an interpreted major fault line near Warintza Central.
The above references an opinion and is for information purposes only. It is not intended to be investment advice. Seek a licensed professional for investment advice. The author is not an insider or shareholder of any of the companies mentioned above.
On August 30th, Adriano Espeschit, the President of Potássio do Brasil, a subsidiary of Brazil Potash, joined a panel discussion from 9:00 am to 11:00 am at the Expo & Brazilian Congress of Mining, commonly known as Exposibram. The event is taking place from August 28th to 31st at the Hangar Centro de Convenções & Feiras da Amazônia, in Belém, Pará, and is organized by the Brazilian Institute of Mining (IBRAM).
Regarded as one of Latin America’s premier mining gatherings, Exposibram aims to foster dialogue between the mining industry and broader society, focusing especially on sustainability issues. The event attracts a diverse audience including mining firms, suppliers, academic institutions, business delegations, government bodies, and entities associated with the public sector. Together, they explore the future outlook of the global mineral industry.
Topics for the lectures and discussions at Exposibram are chosen with a view to the global political and socio-economic landscape. Panels cover various aspects like business perspectives in the mineral sector, technological innovations, diversity and inclusion, social responsibility, environmental concerns, and investment trends.
This year, the conference agenda also included a speech by Espeschit during a panel titled “Public Policies for Strategic Minerals in Brazil.” The company Potássio do Brasil, which Espeschit represents, also maintains a booth at the event. Here, attendees can get acquainted with the Autazes Potash Project, an initiative planned for implementation in the municipality of Autazes in the state of Amazonas.
Brazil Potash and its subsidiary were highlighted on the opening day of Exposibram 2023. The exhibition hall, which features some of Brazil’s largest mining companies, was inaugurated by Helder Barbalho, the governor of the host city, and Raul Jungmann, the CEO of IBRAM. Davidson Aquino, the Finance and Administration Director of Potássio do Brasil, stood in for Espeschit during the opening ceremonies where discussions revolved around current scenarios and future trends in the mineral sector.
The Autazes Potash Project, showcased at the company’s stand, aims to produce potassium chloride fertilizer in Autazes, employing methods that align with Environmental, Social and Governance (ESG) criteria. This marks the second consecutive year that Potássio do Brasil has participated in Exposibram, reinforcing the company’s commitment to fostering socioeconomic development in Amazonas through sustainable and technologically advanced initiatives.
The above references an opinion and is for information purposes only. It is not intended to be investment advice. Seek a licensed professional for investment advice. The author is not an insider or shareholder of any of the companies mentioned above.
Freegold Ventures (TSX:FVL) has announced the confirmation of the downdip extension of the Cleary Vein Zone, as part of its Golden Summit project located near Fairbanks, Alaska. The company’s recent drilling results have shown promising continuity of mineralization.
Since the commencement of the drill programs between 2020 and 2022, the in-pit resource at Golden Summit has seen a significant increase, with indicated resources rising from 1.35 million ounces to 12.6 million ounces, and inferred resources from 1.58 million ounces to 7.7 million ounces. The latest drill program, spanning 2023-2024, aims to further upgrade these resource estimates through strategic drilling and testing of new higher-grade targets.
Drill hole GS2330 is part of the company’s infill drilling efforts and has recently provided positive results. Three distinct mineralized intervals have been identified in the core samples from this hole, with notable grades exceeding the February 2023 resource estimates. The first interval revealed a grade of 40.5 grams per tonne (gpt) gold over 3 meters, followed by a 100.7-meter interval at 1.00 gpt, and a final intersection of 18.2 meters at 1.03 gpt.
An accompanying geological section indicates an 800-meter mineralized strike within the Cleary Zone that extends 1.5 kilometers along the strike and is open to further exploration to the west. The consistency and dip of the higher-grade mineralization within this zone highlight its potential for future infill drilling.
The ongoing drill campaign also includes operations in the Dolphin Cleary area, with two drill rigs targeting the Tolovana Vein Swarm. Notably, visible gold has been observed in drill hole GS2336, which follows the promising results from GS2335, positioned 30 meters to the north. Several holes (GS2331 – GS2336) west of Willow Creek are currently being assayed, aiming to expand the known high-grade mineralization towards the west.
Exploratory drilling to the north and northwest of the Dolphin Cleary Zones has also intersected the up-dip of the mineralization trend, with assay results from holes GS2320 to GS2328 anticipated. The Saddle Zone drill program is exploratory in nature, with holes SZ2301 to SZ2307 designed to understand mineralization controls. Visible gold in SZ2307 suggests the necessity for further exploration.
The updated mineral resource estimate as of February 2023, using a cut-off grade of 0.45 g/t gold and a gold price of $1,792 per ounce, stands at 12.01 million ounces at 0.92 g/t gold (indicated) and 7.7 million ounces at 0.85 g/t gold (inferred).
Quality assurance and quality control protocols are in place, with the company detailing that core samples have been processed using industry-standard practices at ACT Laboratories. The samples undergo thorough preparation and are assayed using fire assay techniques, with any samples over 10 g/t gold assayed using a gravimetric finish for greater accuracy.
Highlights from the results are as follows:
- 40.3 g/t Au over 3 metres
- 1. 0g/t Au over 100.7 metres
- Including 1.44 g/t Au over 31.4 metres
- 1.03 g/t Au over 18.8 metres
|
HOLE |
AZIMUTH |
DIP |
DEPTH |
FROM |
TO |
INTERVAL |
AU |
|
GS2330 |
360 |
-70 |
407.5 |
163.7 |
166.7 |
3.0 |
40.5 |
|
239.8 |
340.5 |
100.7 |
1.00 |
||||
|
including |
278.6 |
310 |
31.4 |
1.44 |
|||
|
388.8 |
407 |
18.2 |
1.03 |
|
The width refers to drill hole intercepts; true width cannot be determined due to the uncertain geometry of mineralization. |
Assays are pending for the following holes:
|
Zone |
Hole Numbers |
|
Dolphin Cleary North Drilling |
GS2320 – GS2328 |
|
Tolovana South Area |
GS2329 |
|
Tolovana Vein Swarm west of Willow Creek |
GS2331 – GS2335 |
|
Saddle Zone |
SZ2301 – SZ2307 |
|
Tolovana Area in progress |
GS2336 & GS2337 |
|
The number of Holes yet to be reported |
23 |
The above references an opinion and is for information purposes only. It is not intended to be investment advice. Seek a licensed professional for investment advice. The author is not an insider or shareholder of any of the companies mentioned above.
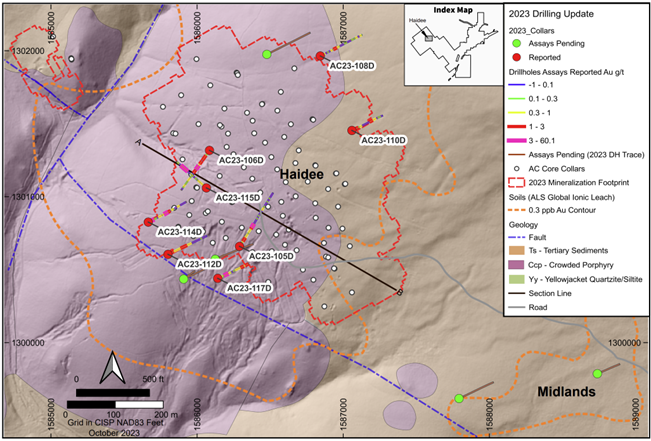
Revival Gold (TSXV:RVG) has announced the results of eight core drill holes as part of its 2023 exploration activities at the Beartrack-Arnett Gold Project in Idaho, USA. All eight holes are from the Haidee deposit area and showed near-surface oxide gold mineralization above the cut-off grade. The 2023 drilling at Haidee consisted of twelve core drill holes, which aimed to investigate various targets related to the existing Haidee Mineral Reserve.
Hugh Agro, President & CEO of Revival Gold, commented in a press release: “The confirmation of higher grade near-surface oxide gold mineralization beyond the current Mineral Reserve at Haidee is a significant development. The results validate our team’s exploration case for higher grade material and possible feeder structures at Haidee, and they demonstrate tangible potential to meaningfully expand Revival Gold’s proposed Haidee open pit and heap leach restart plans for Beartrack-Arnett. We look forward to releasing this year’s remaining drill results in the weeks ahead.”
In addition to Haidee, the company also completed drilling in three new target areas at Beartrack-Arnett: Roman’s Trench, Midlands, and Ridge. In total, 18 core drill holes covering 3,350 meters were completed in this year’s campaign. Results for two of the holes at Roman’s Trench were disclosed on September 27, 2023, and results for the remaining eight holes are anticipated to be released next month.
Two particular holes, AC23-106D and AC23-115D, were drilled to further investigate high-grade mineralization found in hole AC22-094D on the western side of the Haidee Mineral Reserve. Both holes revealed additional high-grade mineralization. Hole AC23-115D specifically showed mineralization in what is interpreted to be a feeder structure with a north-northeast strike and a moderate southeasterly dip. These findings confirm the presence of higher-grade mineralization outside the current reserve pit at Haidee, suggesting the potential for increasing Mineral Reserves in the area.
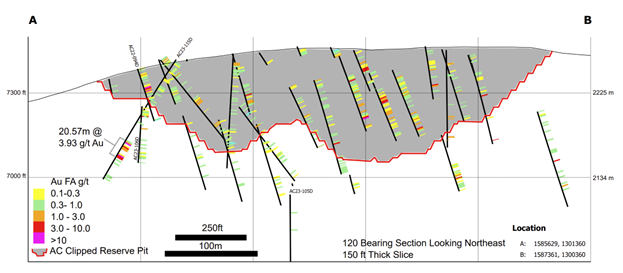
Apart from Haidee, Revival Gold reported outcomes from a channel sampling program at Roman’s Trench. This program was initiated to follow up on earlier chip sampling and involved cutting a continuous channel across an 11.9-meter outcrop to obtain a more representative sample set. Eight samples were taken at roughly 1.4-meter intervals along the channel, and five vertical crosscuts were also taken. Gold values varied from 0.04 g/t to 112 g/t, with two additional samples over 6 g/t. These results, although not reflecting the true width of the structure due to the sampling method, support the existence of high-grade oxide gold mineralization in the Roman’s Trench area, warranting further investigation.
Highlights from the results are as follows:
| Hole Number |
Area | Azimuth (deg.) |
Dip (deg.) |
From (m) |
To (m) |
Drilled Width1 (m) |
Fire Assay Gold Grade (g/t) |
| AC23-105D | Haidee-Deep | 34 | -67 | 30.9 | 45.1 | 14.3 | 0.47 |
| 53.3 | 57.7 | 4.4 | 0.33 | ||||
| 61.4 | 65.0 | 4.1 | 0.28 | ||||
| 109.2 | 125.3 | 16.1 | 0.55 | ||||
| Incl. | 120.1 | 125.3 | 5.2 | 1.15 | |||
| 131.7 | 132.3 | 0.6 | 4.77 | ||||
| AC23-106D2 | Haidee-AC23-094D offset | 215 | -50 | 11.9 | 16.2 | 4.3 | 0.32 |
| 23.1 | 35.1 | 12.0 | 0.47 | ||||
| 57.5 | 70.3 | 12.8 | 0.93 | ||||
| Incl. | 68.7 | 70.3 | 1.6 | 5.04 | |||
| 117.7 | 123.9 | 6.2 | 0.29 | ||||
| 147.1 | 155.3 | 8.3 | 0.27 | ||||
| AC23-108D | Haidee-Up-dip | 64 | -61 | 72.7 | 77.0 | 4.3 | 0.93 |
| 187.4 | 189.6 | 2.2 | 0.33 | ||||
| AC23-110D3 | Haidee-Up-Dip | 65 | -63 | 10.1 | 24.4 | 14.4 | 0.50 |
| Incl. | 11.4 | 13.0 | 1.5 | 2.92 | |||
| 43.4 | 46.2 | 2.8 | 0.40 | ||||
| 101.2 | 106.1 | 4.9 | 0.53 | ||||
| 113.1 | 116.7 | 3.7 | 0.38 | ||||
| 121.3 | 127.4 | 6.1 | 0.38 | ||||
| AC23-112D | Haidee-Down-Dip | 65 | -61 | 13.1 | 20.0 | 6.9 | 0.61 |
| Incl. | 18.5 | 20.0 | 1.5 | 2.25 | |||
| 48.0 | 50.6 | 2.6 | 0.42 | ||||
| 55.8 | 58.8 | 3.0 | 0.45 | ||||
| 64.9 | 69.5 | 4.6 | 0.80 | ||||
| 93.9 | 98.1 | 4.3 | 0.38 | ||||
| 106.1 | 112.2 | 6.1 | 0.34 | ||||
| AC23-114D4 | Haidee-Down-Dip | 64 | -61 | 12.3 | 18.0 | 5.7 | 1.44 |
| Incl. | 16.5 | 18.0 | 1.5 | 3.52 | |||
| 57.6 | 60.7 | 3.0 | 0.56 | ||||
| 73.3 | 75.3 | 2.0 | 0.39 | ||||
| 79.9 | 86.3 | 6.4 | 1.23 | ||||
| Incl. | 85.2 | 86.3 | 1.1 | 5.25 | |||
| 98.1 | 100.7 | 2.6 | 0.69 | ||||
| 117.0 | 120.1 | 3.0 | 0.45 | ||||
| 148.9 | 155.0 | 6.1 | 0.39 | ||||
| AC23-115D5 | Haidee-AC23-094D offset | 311 | -56 | 2.1 | 5.8 | 3.7 | 0.48 |
| 23.8 | 26.8 | 3.0 | 0.57 | ||||
| 34.4 | 39.0 | 4.6 | 0.25 | ||||
| 104.3 | 124.8 | 20.6 | 3.93 | ||||
| Incl. | 105.4 | 106.8 | 1.4 | 19.6 | |||
| Incl. | 120.6 | 124.8 | 4.3 | 9.15 | |||
| AC23-117D6 | Haidee-Down-Dip | 66 | -61 | 5.2 | 11.6 | 6.5 | 0.56 |
| 16.5 | 19.2 | 2.7 | 0.56 | ||||
| 39.8 | 46.6 | 6.8 | 1.20 | ||||
| Incl. | 39.8 | 41.4 | 1.6 | 3.55 | |||
| 54.1 | 63.4 | 9.3 | 0.43 | ||||
| 87.3 | 91.9 | 4.6 | 0.26 | ||||
| 122.8 | 127.4 | 4.6 | 0.75 | ||||
| 1 True width is estimated to be 50% to 70% of drilled width. | |||||||
| 2 AC23-106D: 40% recovery from 29.4 meters to 30.4 meters | |||||||
| 3 AC23-110D: No recovery from 13.0 meters to 15.8 meters and 22.3 meters to 23.5 meters. These intervals were included in grade calculations at 0 g/t gold. | |||||||
| 4 AC23-112D: 40% recovery from 13.1 meters to 14.6 meters; 50% recovery from 16.2 meters to 17.7 meters | |||||||
| 5 AC23-115D: 35% recovery from 3.4 meters to 4.0 meters. | |||||||
| 6 AC23-117D: 35% recovery from 5.2 meters to 5.8 meters and 25% recovery from 6.4 meters to 7.0 meters. | |||||||
The above references an opinion and is for information purposes only. It is not intended to be investment advice. Seek a licensed professional for investment advice. The author is not an insider or shareholder of any of the companies mentioned above.
If you would like to receive our free newsletter via email, simply enter your email address below & click subscribe.
 Follow us on Twitter
 Become our facebook fan
CONNECT WITH US
Tweets
Tweet with hash tag #miningfeeds or @miningfeeds and your tweets will be displayed across this site.
MOST ACTIVE MINING STOCKS
Daily Gainers
 CMC Metals Ltd. CMC Metals Ltd. |
CMB.V | +900.00% |
 Eden Energy Ltd Eden Energy Ltd |
EDE.AX | +200.00% |
| GoviEx Uranium Inc. |
GXU.V | +42.86% |
| Eagle Nickel Ltd. |
ENL.AX | +41.67% |
| Citigold Corp. Limited |
CTO.AX | +33.33% |
| Mount Burgess Mining NL |
MTB.AX | +33.33% |
| Exalt Resources Limited |
ERD.AX | +31.94% |
| Casa Minerals Inc. |
CASA.V | +30.00% |
| Cariboo Rose Resources Ltd |
CRB.V | +28.57% |
| Belmont Resources Inc. |
BEA.V | +28.57% |


