


Arizona Sonoran Copper (TSX:ASCU) has reported its latest Mineral Resource Update (MRE) for its Cactus Project, a combined initiative that includes the Cactus, Stockpile, and Parks/Salyer deposits. Situated 45 miles south of Phoenix, Arizona, the Cactus Project is expected to be the focus of an upcoming Pre-Feasibility Study slated for release in the first quarter of 2024. The goal is to establish a copper cathode heap leach and SXEW operation that produces 45-50 thousand tons per annum (ktpa).
The Cactus Project is an entirely-owned brownfield project located on private land in Arizona. The site comes with approximately $30 million worth of existing infrastructure, an advanced stage of permitting, approved water rights, and ready access to water sources.
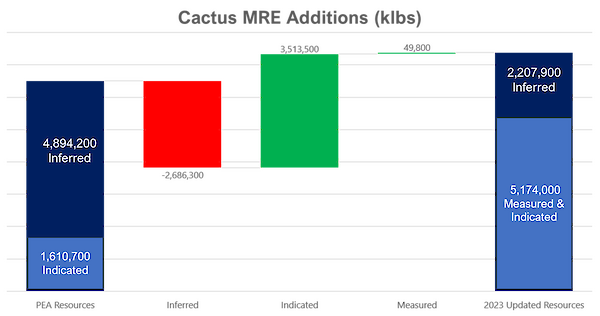
George Ogilvie, CEO of Arizona Sonoran Copper Company commented in a press release: “Our team has completed yet another key milestone in the process of reactivating the Cactus Mine. Driven through textbook infill drilling programs at Parks/Salyer and Cactus, our team readies an already significant copper asset in Arizona, USA for the next step in technical reporting; 3.6 billion pounds of Copper were added and converted to the M&I category for a new M&I mineral resource of 5.2 billion pounds. The leachable Copper M&I category now stands at 4.4 billion pounds of Copper and will act as the foundation for our upcoming PFS. The PFS remains on track and on budget for Q1 2024. I look forward to our team continuing to deliver on key objectives over the next year.”
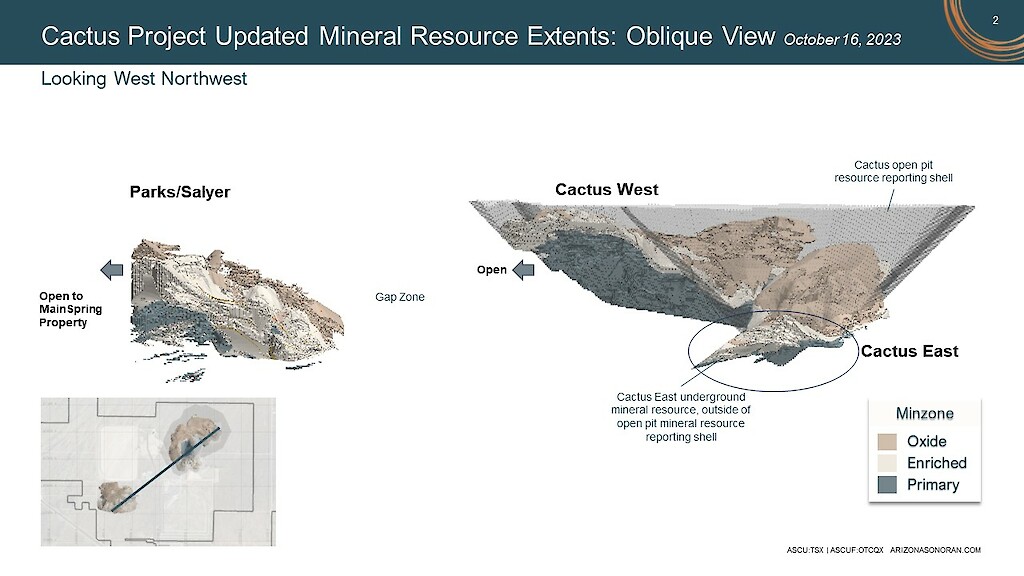
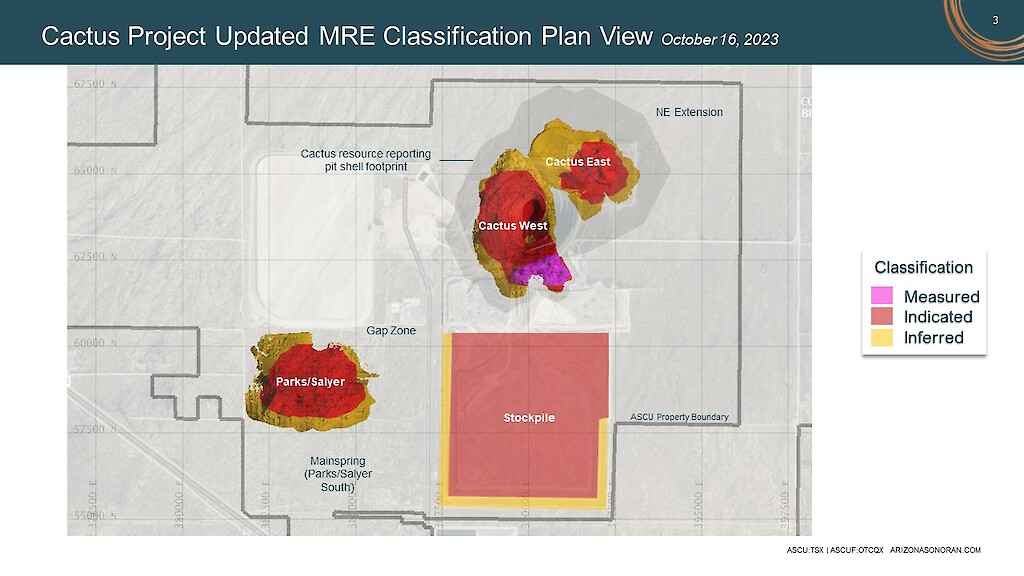
The newly updated MRE is backed by extensive drilling programs concentrated on the northeastern portion of the Santa Cruz porphyry copper system, to which the company has access to around 3.5 miles. The drilling data has been categorized into Measured, Indicated, and Inferred resources based on the spacing between drilling points. Specifically, a total of 80,715 feet of new drilling into the Cactus deposits has been carried out since May 2021, and new Parks/Salyer drilling accumulated to 57,250 feet from July 2022 to March 2023. The company plans to continue drilling beyond April 2023 with the intention of releasing another mineral resource update in 2024.
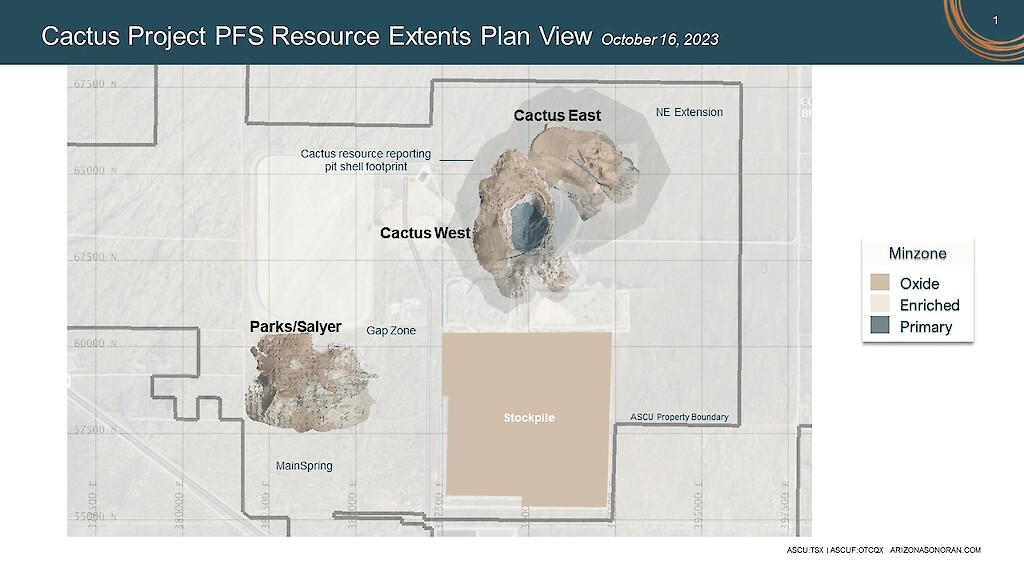
In terms of geology, the resource areas within the Cactus Project consist of fragmented parts of the larger Santa Cruz Porphyry System. The mineral deposits are hosted mainly in Precambrian Oracle granite and Laramide monzonite porphyry. The geology of the site is complex, with notable fracturing, faulting, and both pre-mineral and post-mineral brecciation. The resource areas also contain both oxide and enriched copper mineralization, lying above the primary sulphide mineralization. This geological complexity and the continuity of mineralization styles suggest that the resource areas might have once been interconnected, which assists in further exploration and modelling of the resources.
Cactus Project Resource Modelling
The resource modelling for the Cactus Project was carried out by Arizona Sonoran Copper Company Inc.’s (ASCU) resource team and Allan Schappert, a qualified individual as per the National Instrument 43-101 standards for mineral projects. The team utilized updated drilling data and interpretations to form the basis of the Mineral Resource model, which was developed in Vulcan software.
The data used for generating the mineral resources included a significant number of drill holes and measurements. Specifically, the Cactus Project involved 305 drill holes totalling 309,418.5 feet; Parks/Salyer had 77 drill holes with 172,166.3 feet; and the stockpile had 518 drill holes totalling 44,728.2 feet. This drilling data is backed by standard quality assurance and control programs, and the quality of the data has been deemed suitable for use in resource estimation.
When it comes to the mineralized domains, these align with what one would expect for porphyry copper systems. These domains represent varying rock types and copper mineral zones, which in turn are associated with weathering processes that lead to secondary copper enrichment. Several mineral zones including leached, oxide, enriched, and primary were identified through logging and sequential copper analyses.
Physical density measurements were also an integral part of the resource modelling. Both historical data from ASARCO and recent measurements by ASCU were included. For the Cactus and Parks/Salyer deposits, density was measured using the wet and dry weight method with thousands of samples considered for accurate assessment. For the stockpile, given its unconsolidated nature, density was calculated based on weight and volume measurements from four test holes.
Copper grades were estimated using a technique called Ordinary Kriging. A range of statistical and visual validation methods were employed, ensuring the reliability of these estimates. This included comparisons of statistical distribution, visual cross-checks against the drilling data, and other methods like change of support and swath plots.
Updates on Parks/Salyer and Cactus Deposits
Parks/Salyer showed a notable increase in its leachable Indicated mineral resource, rising from 2,461 million pounds (Mlbs) in the 2022 Preliminary Economic Assessment (PEA) to 2,677 Mlbs. This increase is attributed to successful infill drilling, the inclusion of mineral resources under a new Mineral Exploration Permit obtained in October 2024, and a slight natural extension of mineralization onto the MainSpring property.
In the case of the Cactus deposits, the focus of Measured and Indicated drilling programs was on upgrading the Inferred mineral resources from the PEA to support the upcoming Pre-Feasibility Study. The total leachable Measured and Indicated resources for Cactus were reported to be 156.3 million tons at a grade of 0.491% Cu TSol, distributed between open pit and underground mineral resources. The Cactus East sector notably contains 41.2 million tons at a much higher grade of 1.057% Cu TSol.
Stockpile Conversion and Classification
The Stockpile saw a significant shift from Inferred to Indicated classification. Previously categorized solely as Inferred, recent drilling efforts have converted 217 million pounds of copper at a grade of 0.153% Cu TSol into the Indicated category. Only 3 million pounds now remain in the Inferred category. This change does indicate a minor reduction in total pounds, but the grade increased, largely due to higher copper grades in the upper lift of the stockpile.
Highlights and results from the MRE are as follows:
| PREVIOUS MINERAL RESOURCE
(As of September 28, 2022) |
UPDATED MINERAL RESOURCE
(As of August 31, 2023) |
VARIANCE | |||||
| Tons | Grade | Pounds | Tons | Grade | Pounds | Cu Content | |
| kt | Cu%¹ | Cu Mlbs | kt | Cu%¹ | Cu Mlbs | % | |
| Total Measured |
N/A |
10,400 |
0.241 |
49.8 |
New |
||
| Leachable |
9,100 |
0.230¹ |
41.9 |
New |
|||
| Primary |
1,300 |
0.315 |
8.0 |
New |
|||
| Total Indicated |
151,800 |
0.531 |
1,610.7 |
435,300 |
0.589 |
5,124.2 |
+218% |
| Leachable |
73,900 |
0.723 |
1,065.2 |
348,500 |
0.629¹ |
4,387.2 |
+312% |
| Primary |
77,900 |
0.350 |
545.5 |
86,800 |
0.425 |
737.0 |
+35% |
| Total M&I |
151,800 |
0.531 |
1,610.7 |
445,700 |
0.580 |
5,174.0 |
+221% |
| Leachable |
73,900 |
0.723 |
1,065.2 |
357,600 |
0.619¹ |
4,429.0 |
+316% |
| Primary |
77,900 |
0.350 |
545.5 |
88,000 |
0.423 |
745.0 |
+37% |
| Total Inferred |
449,900 |
0.544 |
4,894.2 |
233,800 |
0.472 |
2,207.9 |
-55% |
| Leachable |
310,400 |
0.590 |
3,663.7 |
107,700 |
0.607¹ |
1,307.9 |
-64% |
| Primary |
139,500 |
0.441 |
1,230.5 |
126,200 |
0.357 |
900.0 |
-27% |
NOTES:
1. Leachable copper grades are reported using sequential assaying to calculate the soluble copper grade. Primary copper grades are reported as total copper, Total category grades reported as weighted average copper grades of soluble copper grades for leachable material and total copper grades for primary material. Tons are reported as short tons.
2. Stockpile resource estimates have an effective date of 1st March, 2022, Cactus resource estimates have an effective date of 29th April, 2022, Parks/Salyer resource estimates have an effective date of 19th May, 2023. All resources use a copper price of US$3.75/lb.
3. Technical and economic parameters defining resource pit shell: mining cost US$2.43/t; G&A US$0.55/t, 10% dilution, and 44°-46° pit slope angle.
4. Technical and economic parameters defining underground resource: mining cost US$27.62/t, G&A US$0.55/t, and 5% dilution,
5. Technical and economic parameters defining processing: Oxide heap leach (HL) processing cost of US$2.24/t assuming 86.3% recoveries, enriched HL processing cost of US$2.13/t assuming 90.5% recoveries, Primary mill processing cost of US$8.50/t assuming 92% recoveries. HL selling cost of US$0.27/lb; Mill selling cost of US$0.62/lb.
6. Royalties of 3.18% and 2.5% apply to the ASCU properties and stateland respectively. No royalties apply to the MainSpring (Parks/Salyer South) property.
7. For Cactus: Variable cutoff grades were reported depending on material type, potential mining method, and potential processing method. Oxide material within resource pit shell = 0.099% TSol; enriched material within resource pit shell = 0.092% TSol; primary material within resource pit shell = 0.226% CuT; oxide underground material outside resource pit shell = 0.549% TSol; enriched underground material outside resource pit shell = 0.522% TSol; primary underground material outside resource pit shell = 0.691% CuT.
8. For Parks/Salyer: Variable cut-off grades were reported depending on material type, associated potential processing method, and applicable royalties. For ASCU properties – Oxide underground material = 0.549% TSol; enriched underground material = 0.522% TSol; primary underground material = 0.691% CuT. For stateland property – Oxide underground material = 0.545% TSol; enriched underground material = 0.518% TSol; primary underground material = 0.686% CuT. For MainSpring (Parks/Salyer South) properties – Oxide underground material = 0.532% TSol; enriched underground material = 0.505% TSol; primary underground material = 0.669% CuT.
9. Mineral resources, which are not mineral reserves, do not have demonstrated economic viability. The estimate of mineral resources may be materially affected by environmental, permitting, legal, title, sociopolitical, marketing, or other relevant factors.
10. The quantity and grade of reported inferred mineral resources in this estimation are uncertain in nature and there is insufficient exploration to define these inferred mineral resources as an indicated or measured mineral resource; it is uncertain if further exploration will result in upgrading them to an indicated or measured classification.
11. Totals may not add up due to rounding.
- 221% increase of total Measured and Indicated (“M&I”) resources (including primary resources), and a 9% increase of grade, resulting in a 55% decrease of Inferred resources due to upgrading of material
- MRE including Primary Resource Opportunity
- M&I 445.7 Mt @ 0.58% Cu for 5.17 billion pounds of copper
- Inferred 233.8 Mt @ 0.47% Cu for 2.21 billion pounds of copper
- Leachable (Oxide and Enriched) Mineral Resource
- M&I category increases by 316%: 357.6 million tons (“Mt”) at 0.62% Soluble Copper (“Cu TSol”) for 4.43 billion lbs of copper
- Inferred Category decreases by 64%: 107.7 Mt at 0.61% Cu TSol for 1.31 billion lbs of copper due to upgrading of material
- Low discovery cost – $0.005 / lb per pound
- +1.0% Soluble Copper Grades – specifically, Parks/Salyer contains 130Mt @ 1.028% Cu Tsol and Cactus East contains 41.2Mt @ 1.057% Cu TSol within M&I resources reporting to underground resource cutoff grades.
- Continuity confirmed – total drill database includes 526,000 ft (160,420 m) of drilling in 900 holes, resulting in demonstrated consistency of mineralization overall and a significant upgrade of the Parks/Salyer Deposit from the last MRE
- High Quality – first declaration of Measured mineral resources and significant conversion of Inferred mineral resources to the Indicated category which have the potential to be used to declare first reserves in the pending Pre-Feasibility Study expected in Q1 2024
- Location Advantages – set within Casa Grande’s industrial park and connected to nationwide transportation (highway and railroad), a streamlined permitting process, access to Arizona Public Service power, and access to water
- Growth – ongoing drilling will focus on Parks/Salyer southern extensions (Parks/Salyer South property); exposure to a 4 km mine trend with pockets of mineralization known south of Parks/Sayler, in the Gap Zone and NE of Cactus East
- Next Steps – Continue decreasing drill spacings to 125 ft (38 m) for future studies; begin drilling at the MainSpring (Parks/Salyer South) property
TABLE 2: Parks/Salyer Deposit
| PREVIOUS MINERAL RESOURCE
(As of September 28, 2022) |
UPDATED MINERAL RESOURCE
(As of August 31, 2023) |
|||||
| Tons | Grade | Pounds | Tons | Grade | Pounds | |
| kt | Cu% * | Cu Mlbs | kt | Cu% * | Cu Mlbs | |
| Total Indicated | N/A | 143,900 | 1.009 | 2,906.1 | ||
| Total Leachable | 130,200 | 1.028* | 2,676.6 | |||
| Oxide | 10,000 | 0.921* | 183.7 | |||
| Enriched | 120,200 | 1.037* | 2,493.0 | |||
| Total Inferred | 143,600 | 1.015 | 2,915.4 | 48,400 | 0.967 | 936.1 |
| Total Leachable | 115,400 | 1.066* | 2,460.9 | 44,500 | 0.982* | 873.2 |
| Oxide | 14,100 | 0.827* | 233.7 | 8,700 | 0.925* | 161.7 |
| Enriched | 101,200 | 1.100* | 2,227.2 | 35,700 | 0.996* | 711.5 |
NOTES: refer to TABLE 1
*Denotes Cu TSol, generated using a sequential assaying technique to calculate the grade of the soluble copper.
TABLE 3: Cactus East, Underground Resource outside of Cactus Open Pit Resource
| PREVIOUS MINERAL RESOURCE
(As of September 28, 2022) |
UPDATED MINERAL RESOURCE
(As of August 31, 2023) |
|||||
| Tons | Grade | Pounds | Tons | Grade | Pounds | |
| kt | Cu% * | Cu Mlbs | kt | Cu% * | Cu Mlbs | |
| Total Indicated | 9,900 | 0.912 | 180.0 | 10,400 | 0.882 | 182.6 |
| Leachable | 7,700 | 0.954* | 146.2 | 9,000 | 0.891* | 161.0 |
| Total Inferred | 19,200 | 0.873 | 335.9 | 6,400 | 0.785 | 100.1 |
| Leachable | 17,900 | 0.881* | 315.7 | 4,600 | 0.767* | 69.9 |
NOTES: refer to TABLE 1
*Denotes Cu TSol, generated using a sequential assaying technique to calculate the grade of the soluble copper.
TABLE 4: Cactus Open Pit, inclusive of Cactus West and Cactus East
| PREVIOUS MINERAL RESOURCE
(As of September 28, 2022) |
UPDATED MINERAL RESOURCE
(As of August 31, 2023) |
|||||
| Tons | Grade | Pounds | Tons | Grade | Pounds | |
| kt | Cu% * | Cu Mlbs | kt | Cu% * | Cu Mlbs | |
| Total Measured | N/A | 10,400 | 0.241 | 49.8 | ||
| Leachable | 9,100 | 0.230* | 41.9 | |||
| Total Indicated | 141,900 | 0.505 | 1,431.6 | 209,900 | 0.433 | 1,818.1 |
| Leachable | 66,200 | 0.696* | 919.7 | 138,200 | 0.482* | 1,332.1 |
| Total M&I | 141,900 | 0.505 | 1,431.6 | 220,300 | 0.424 | 1,868.0 |
| Leachable | 66,200 | 0.696* | 919.7 | 147,300 | 0.466* | 1,374.0 |
| Total Inferred | 209,700 | 0.339 | 1,428.7 | 177,900 | 0.328 | 1,168.7 |
| Leachable | 99,700 | 0.334* | 672.1 | 57,500 | 0.315* | 361.8 |
NOTES: refer to TABLE 1
*Denotes Cu TSol, generated using a sequential assaying technique to calculate the grade of the soluble copper.
TABLE 5: Stockpile
| PREVIOUS MINERAL RESOURCE
(As of August 31, 2021) |
UPDATED MINERAL RESOURCE
(As of August 31, 2023) |
|||||
| Tons | Grade | Pounds | Tons | Grade | Pounds | |
| kt | Cu TSol% | Cu Mlbs | kt | Cu Tsol% | Cu Mlbs | |
| Indicated (Oxide) | N/A | 71,100 | 0.153 | 217.3 | ||
| Inferred (Oxide) | 77,400 | 0.144 | 223.5 | 1,200 | 0.127 | 3.0 |
NOTES: refer to TABLE 1
 Follow us on Twitter
 Become our facebook fan


Comments are closed.