


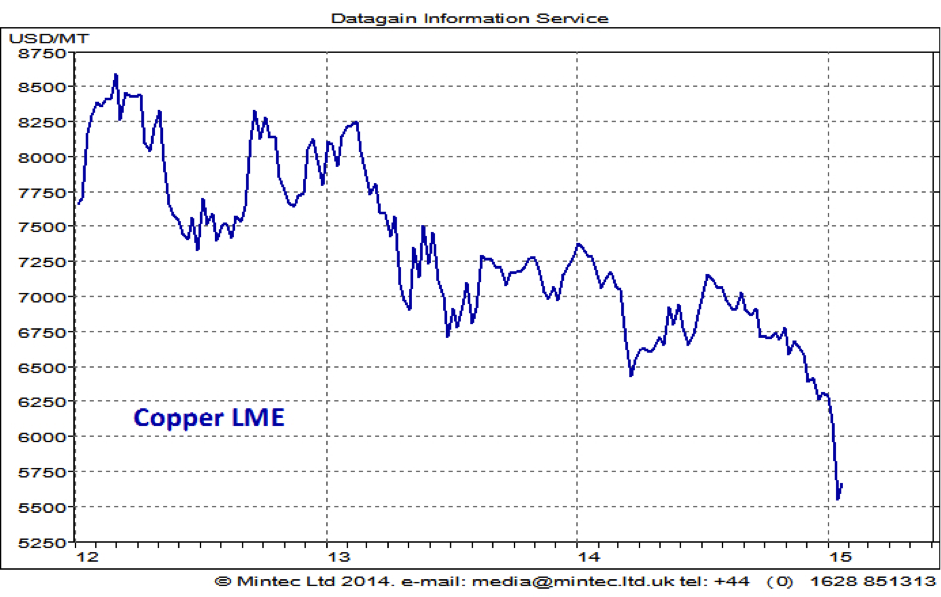
Copper prices fell sharply at the start of the year, 11% down since the beginning of January. Prices have been in decline since mid-2014, broadly in line with the trend seen in other base metals; however, it was an extent of the fall that was remarkable, with prices declining in January more than for the whole of 2014 – down 14%. There is always a great degree of uncertainty and speculation around copper pricing, so understanding what is behind the price movement is a tricky business. So, what are the key factors driving copper prices?
Click here for reference chart.
Economic sentiment
Copper is the third most widely used metal after steel and aluminium. Of all the non-precious metals, it is the best conductor of electricity, and as such is widely used for cables and wiring. It is therefore crucial for sectors such as electricity, consumer electronics and transport. Copper prices are particularly sensitive to changes in the global economic environment due to its use in a broad range of industrial and consumer applications.
Global economic sentiment has deteriorated in 2014, particularly in the second half. Although the US economy has been strong in recent months, the rest of the world, notably China and the eurozone, have generally been below expectations.
In January, the forecast for eurozone for 2015 was cut to 1.2%, down 0.2 percentage points compared to previous forecasts, with deflation considered a major threat to economic recovery both for the eurozone and globally. The GDP of the euro area is still below the pre-crisis level, unlike in the US, where the pre-crisis peak has been surpassed.
Economic growth in China continues to slow after the rapid growth seen over the last decade. China’s growth has slowed to 7.4% in 2014, falling under the government target of 7.5%. Growth for 2015 is expected to be even lower at 7.1% due to the continuing slowdown in real estate investment.
With most of the expected increases in future global consumption coming from outside the US, this disappointing international economic news have been pushing copper prices downward in recent months.
Supply and demand
In the first half of the year, it looked like situation was improving in the copper market, continuing the trend seen in 2013, with even small surplus expected for 2014. However, towards the end of the year, analysts have cut back their surplus forecast, and some are even expecting a small production deficit, estimated at around 160,000 for the first 10 months of 2014.
World mine production is estimated to have increased by around 2% in the first ten months of 2014. With the exception of Chile, where production remained largely unchanged, output rose from most producers.
Despite slowdown in some major economies, a strong demand growth was posted in the first ten months of 2014. World consumption is estimated to have reached 1.9m tonnes, up 11% y-o-y. Notably, higher than expected demand was recorded for China, where lower supply of high-grade scrap led to the use of more cathode. In addition, demand in China was driven by the ongoing expansion of the nation’s electricity grid infrastructure. Demand from China is estimated to have risen by 18%. Outside China, world demand rose by 5%, driven largely by growth in the EU and Japan, up 11% and 10% respectively.
China
The determination of the price of copper is increasingly dominated by China, which is responsible for over 40% of global consumption. Consumption growth has slowed in China in recent years, but still remained at relatively high levels. One area that adds uncertainty in global copper market is unknown size of stocks in China. Significant part of copper stocks in China is widely believed to have been used as collateral for financing deals, rather than for physical consumption. The extent and scale of these activities are largely unknown, although the trend is reported to be on the decline in recent months. However, offsetting this, estimates for strategic buying by the State Reserve Bureau (SBR), one of the most influential players in the global metals markets, doubled for 2014.
Outlook
Looking ahead, demand is likely to remain robust in 2015. Tightness in scrap metal prices is likely to continue in 2015. As is strategic buying by China’s State Reserve Bureau (SRB), albeit the scale of this expected buying is uncertain. Recent sharp falls in prices have been largely driven by cuts to global economic growth and falling prices of other major industrial commodities. So, in this context, the sharp falls of recent weeks look exaggerated. Although expectations of slowdown in global economic growth is likely to continue to drive prices down, relatively tight fundamentals and policies in China aimed to support its economy, including continued investment in infrastructure and monetary easing by central bank, will limit price declines.
 Follow us on Twitter
 Become our facebook fan


Comments are closed.