Announced proposed changes to its Board and executive leadership team, positioning the Company to capitalize on strong global momentum supporting nuclear energy. Highly experienced and successful uranium industry leader and proven team builder John Borshoff has been tapped to join Forsys with a strategy focused on growing the Company into a global uranium enterprise. Forsys Metals Corp. shares T.FSY are trading up $0.06 at $0.39.
Read:
- Greenland Mines Lands a Site Team at Sarfartoq Within Days of Signing, Setting Up a 2026 Rare Earth Field Program
- Quantum Secure Encryption Scales Commercial Deployment as U.S. Pours Billions Into Quantum Computing
- The $1 Trillion Data Problem Quantum Computing Is About to Make Worse
- Seven Months After Its IPO, Starfighters Space (FJET) Lands in the Russell 3000® — And It Isn't Alone
- Cardiac AI Diagnostics Clears China Regulatory Gate Via Lishman Global As Edison Award, Northern California Deployment, And Indigenous Partnership Stack Validation
Toronto, Ontario–(Newsfile Corp. – June 15, 2026) – Forsys Metals Corp. (TSX: FSY) (FSE: F2T) (NSX: FSY) ("Forsys" or the "Company") is pleased to announce proposed changes to its Board and executive leadership team, positioning the Company to capitalize on strong global momentum supporting nuclear energy.
HIGHLIGHTS
-
Highly experienced and successful uranium industry leader and proven team builder , Mr. John Borshoff, to join Forsys with a strategy focused on growing the Company into a global uranium enterprise.
-
Mr. Borshoff will commence as CEO, President and Executive Director immediately following the Company's forthcoming annual and special shareholders meeting to be held on July 31, 2026 (the "Meeting"), if elected by shareholders at the Meeting and subject to the Shareholder Approvals and TSX Approval described below.
-
Until the Meeting, Mr. Borshoff will act as Interim President and will be involved in the day-to-day management of the Company, including commencing implementation of the Company's new strategic plan.
-
-
Value creation strategy to deliver Forsys' new growth objectives and enhance shareholder value, benefitting from Mr. Borshoff's past successes in the uranium sector:
-
Advance the Company's wholly-owned Norasa Uranium Project in Namibia towards development readiness.
-
Commence concurrent evaluation for strategic mergers and acquisitions (M&A) to build a diverse project pipeline of development and production options in a resource-constrained uranium market experiencing rising global energy demand and future uranium supply shortage.
-
Build a team to successfully deliver the Company's vision.
-
-
Forsys Chairman Martin Rowley and Interim President John Borshoff will host an investor webinar tomorrow, Tuesday 16th June at 8am EDT (8pm AWST / 10pm AEST) with details outlined in the announcement.
Appointment of President/CEO
The Company is pleased to announce that, if elected by shareholders at the Meeting and subject to the Shareholder Approvals and TSX Approval described below, Mr. Borshoff will commence as President/CEO and Executive Director of the Company following the Meeting. Effective immediately, and in advance of the Meeting, Mr. Borshoff has been appointed as Interim President of the Company, and will be actively involved in implementing the Company's strategy, supporting day-to-day management.
Mr. Borshoff is a highly regarded leader in the global uranium industry, with an unrivalled track record of creating exceptional shareholder value, exemplified by his leadership at Paladin Energy Limited ("Paladin") and Deep Yellow Limited ("Deep Yellow"). One of the world's most experienced uranium mining executives, Mr. Borshoff has spent more than 50 years building uranium companies from exploration through development to production, creating successful mining operations and earning global recognition for achievements that have helped shape the modern uranium industry.
In 1993, Mr. Borshoff founded Paladin, which he grew from a junior explorer into a multi-mine AUD$5B uranium producer. Mr. Borshoff led the team that completed the drill out, feasibility studies, financing, construction, commissioning and safe operation of Langer Heinrich and Kayelekera, the first two new conventional uranium mines built in the world in the last 20 years.
In late 2016, Mr. Borshoff was appointed as Managing Director/CEO of Deep Yellow. Over the subsequent nine years, he transformed Deep Yellow from a AUD$10.7M junior explorer to a AUD$2.3B development business with two long-life greenfield projects in Namibia and Australia (with the Australian project acquired via its 2022 merger with Vimy Resources Limited) culminating in the completion of a Definitive Feasibility Study of the flagship Tumas Project in Namibia in 2024 and commencement of detailed engineering work in 2025 to facilitate the final investment decision.
Shareholder and TSX Approval
The commencement of Mr. Borshoff as President/CEO and Executive Director is subject to shareholders approving the equity incentive component of Mr. Borshoff's consulting package, shareholders approving the Company's Amended and Restated Omnibus Incentive Plan (the "Shareholder Approvals") and receipt of TSX acceptance or approval for the proposed security-based compensation arrangements, grants or issuances ("TSX Approval"). No incentive securities will be issued unless and until the applicable Shareholder Approvals and TSX Approval have been obtained.
The Company will seek the necessary Shareholder Approvals at the Meeting.
The management information circular for the Meeting will include disclosure of the material terms of the proposed equity incentive component, including the number and type of securities issuable, vesting and exercise terms, expiry, any insider participation and any disinterested shareholder approval required under TSX rules.
Until the Shareholder Approvals and TSX Approval and all other regulatory approvals are obtained, Mr. Borshoff will be working with the current Board on strategic direction and key operational priorities in his interim capacity, and no incentive securities will be issued.
Other Board Changes
If the Shareholder Approvals and TSX Approval are obtained, Mr. Borshoff is elected as a director at the Meeting and Mr. Borshoff commences on a permanent basis as the Company's President and CEO and Executive Director:
- Mr. Mark Frewin has agreed to step down as CEO at the Meeting; but will continue as a Non-Executive Director; and
- Messrs. Stefano Roma and Jorge Estepa have agreed to retire from the Board at the Meeting. Mr Estepa will continue as Corporate Secretary; and Mr. Martin Rowley will continue as Chairman of the Company and Mr. Pierfranco Malpenga and Mr. Knowledge Katti will continue as Directors.
Strategic Transformation
The clear objective of the Board in engaging Mr. Borshoff, with his strong leadership and proven performance, his deep understanding of the uranium supply sector, together with his appreciation of the many challenges this sector currently faces, is to benefit from his expertise and his extensive experience, with the successes achieved with his previous endeavors in the uranium business. His approach will again employ a value creation strategy centered on asset optimization, M&A and building a proven team capable of converting vision into reality with effective execution.
Asset Optimization
The Norasa Uranium Project has potential for development but requires further targeted evaluation to become development ready.
The Company will accelerate its efforts to move the Norasa Uranium Project forward so Forsys can be in a position to make development decisions that capture the potential value available from supplying into a highly constrained uranium market.
Strategic Acquisitions
Forsys intends to evaluate a range of opportunities across several jurisdictions to identify undervalued, high-potential uranium resources that could enhance Forsys' exposure to a strengthening uranium market and build a more diverse portfolio with growth opportunities.
Name Change
As part of the reinvigoration of the Company, a name change for Forsys will be presented to shareholders for approval at the Meeting. The implementation of any name change, and any related change to the Company's trading symbols or security identifiers, will be subject to receipt of any required TSX and other regulatory approvals.
Chairman of Forsys Mr. Martin Rowley commented: "Today's announcement is a pivotal moment for our Company. We are fortunate to have been able to secure the services of John Borshoff who brings significant experience and growth potential to our business. His refreshed strategic direction offers a clear vision for growth that we know John and the team have the ability to translate into disciplined execution."
"Forsys has been endeavoring to strengthen the Company and its direction for some time in anticipation of benefiting its shareholders and stakeholders from the upsurge in nuclear energy demand that is currently taking place. This move to secure the services of a highly experienced and respected leader who has accomplished such notable achievements with the other uranium companies in which he has been involved fits in perfectly with the Board's objectives for a repositioning of the Company."
"This appointment reflects the Board's strong belief that a renewed strategic direction is essential for us to capitalize on the opportunities available for uranium, drive improved business performance and position the Company to become a significant player within the global uranium sector. Mr. Borshoff's reputation and experience will play a key role in attracting the talent needed to build the Company into a significant player in the global uranium industry."
"Subject to Mr Borshoff's appointment becoming formalized and continuing, Forsys can move forward with strong and experienced leadership, well-defined goals and a clear point of differentiation, positioning the Company to stand apart from its peers."
"I strongly encourage shareholders to support all of the resolutions to be considered at the upcoming Meeting. These approvals are required to implement this key appointment and to align Mr. Borshoff package with shareholder outcomes. All directors of the Company intend to vote shares held or controlled by them in favour of all resolutions they are entitled to vote on."
Mr. John Borshoff, Interim President and proposed incoming CEO and President commented: "I am delighted to be given the opportunity to lead another uranium company that I believe has significant unrealized potential. Forsys is undervalued compared to its peers, and having spent time evaluating opportunities, I see potential upside in both developing the Company's existing asset base and introducing other disciplined growth strategies through M&A."
"We are in a period of a major (worldwide) energy transition, with increasing focus on energy security, reliability and affordability. Recent geopolitical instability, including disruption in oil and gas markets, has further exposed the energy vulnerability that exists. In my view, the asymmetric focus on renewables has exacerbated the energy problem. In terms of being able to satisfy the larger global energy equation, renewable energy has been oversold now a very poor second both in terms of expense and capability. As a consequence, the world is reassessing what it means and needs to have a secure, reliable energy system, contributing to the renewed interest in nuclear energy and strengthening long-term fundamentals for uranium demand."
"In my view, the supply basis for both uranium and other energy sources will need to be revised if it is to eventually meet the accelerating electricity demand. All this has significant implications for uranium, which is entering into a fundamental supply deficit that will become larger in the mid-term unless the sector becomes more capable and introduces highly innovative practices to meet the expected unprecedented demand."
"My ambition is to position Forsys at the forefront by establishing a multiple project portfolio to meet the demands of a sector that is facing anticipated supply challenges."
"There is a tremendous opportunity to build on Forsys' existing asset base in Namibia and position the Company as a major, global developer and supplier of uranium in the modern nuclear era. I am excited and energized by the opportunity the Chairman has entrusted to me, and I look forward to working closely with the Company and stakeholders to realize this ambition."
Investor Webinar
Forsys will be holding an investor webinar and conference call for shareholders and interested stakeholders on Tuesday 16th June at 8am EDT (8pm AWST / 10pm AEST).
Participants will need to pre-register for the call using the links below. Participants will receive a calendar invite and a unique code which is to be quoted when dialing into the call via a phone line.
To ask a question, participants will need to dial into the conference call and dial "*1" (star, 1) on their telephone keypad.
Phone Line Pre-Registration Link: https://registrations.events/direct/MCM37018619
*In order to ask questions you must be dialed in to the phone line
To register for the webinar only portion of the call, please visit: https://webcast.openbriefing.com/forsysmetals-ann-2026/
Neither the TSX nor its Regulation Services Provider (as that term is defined in the policies of the TSX) accepts responsibility for the adequacy or accuracy of this release.
About Forsys Metals Corp.Forsys Metals Corp. (TSX: FSY) (FSE: F2T) (NSX: FSY) is an emerging uranium developer focused on advancing its wholly owned Norasa Uranium Project, located in the politically and uranium friendly jurisdiction of Namibia, Africa. The Norasa Uranium Project is comprised of the Valencia Uranium deposit (ML-149) and the nearby Namibplaas Uranium deposit (EPL-3638). Further information is available at the Company website www.forsysmetals.com.
This news release was authorized for dissemination by Mr. Martin Rowley, Chairman, for and on behalf of the Board of Directors of Forsys Metals Corp. For additional information please contact:
John Borshoff, Interim President, Forsys Metals Corp.+61 419 912 571John.borshoff@forsysmetals.com
Richard Parkhouse, Investor Relations, Forsys Metals Corp.+44 7730493432rparkhouse@forsysmetals.com info@forsysmetals.com
Greg Taylor, GT Investor Relations+1 416 605-5120gtaylor@g-tinvestorrelations.com
Cameron Gilenko, Australian Media and Investor Relations, Sodali & Co+61 446 984 953cameron.gilenko@sodali.com
Forward-Looking Information
Certain information contained in this press release constitutes "forward-looking information" within the meaning of Canadian legislation, including statements regarding the proposed appointments and board changes, the Shareholder Approvals and TSX Approval, the proposed issue of incentive securities, the proposed name change, the Company's strategy, the advancement of the Norasa Uranium Project, potential M&A opportunities and the Company's growth objectives. Generally, these forward-looking statements can be identified by the use of forward-looking terminology such as "plans", "expects" or "does not expect", "is expected", "budget", "scheduled", "estimates", "forecasts", "intends", "anticipates" or "does not anticipate", or "believes", or variations of such words and phrases, or statements that certain actions, events or results "may", "could", "would", "might" or "will be taken", "occur", "be achieved" or "has the potential to". Forward-looking statements contained in this press release are qualified in their entirety by the inherent risks and uncertainties surrounding future expectations. Among those factors which could cause actual results to differ materially are the following: the risk that the required shareholder, TSX or other regulatory approvals are not obtained; the proposed appointments, incentive arrangements or name change are not implemented as expected; M&A opportunities are not identified or completed; market conditions change; or the Norasa Uranium Project does not advance as currently expected; as well as other risk factors listed from time to time in our reports filed with Canadian securities regulators on SEDAR+ at www.sedarplus.ca. The forward-looking statements included in this press release are made as of the date of this press release and the Company disclaims any intention or obligation to update or revise any forward-looking statements, whether as a result of new information, future events or otherwise, except as expressly required by applicable securities legislation.
To view the source version of this press release, please visit https://www.newsfilecorp.com/release/301459
Toronto, Ontario–(Newsfile Corp. – May 25, 2026) – The following is a list of Upcoming Meeting Dates announced this week for Reporting Issuers in Canada. The data is supplied by Issuing Companies through the service of CDS Clearing and Depository Services Inc.
| Company Name | Record Date | Meeting Date | Type |
| Apex Critical Metals Corp. | June 8, 2026 | July 10, 2026 | AG |
| Ashley Gold Corp. | June 9, 2026 | July 14, 2026 | AS |
| Athena Gold Corporation | June 9, 2026 | July 24, 2026 | AS |
| CORE SILVER CORP. * | May 12, 2026 | June 16, 2026 | AGS |
| Canasil Resources Inc. | June 12, 2026 | July 21, 2026 | AGS |
| EVERYDAY PEOPLE FINANCIAL CORP | June 8, 2026 | July 23, 2026 | AS |
| Else Nutrition Holdings Inc. | May 20, 2026 | June 30, 2026 | AG |
| FTI Foodtech International Inc* | May 19, 2026 | June 25, 2026 | A |
| Fluent Corp. | June 12, 2026 | July 28, 2026 | AS |
| Forsys Metals Corp % | May 22, 2026 | June 30, 2026 | AGS |
| Future Fuels Inc. | June 9, 2026 | July 14, 2026 | AG |
| GINSMS Inc. | May 26, 2026 | June 26, 2026 | AS |
| Information Services Corporation | May 27, 2026 | June 26, 2026 | S |
| Matachewan Consolidated Mines * | May 26, 2026 | June 30, 2026 | AG |
| Metasphere Labs Inc. * | May 27, 2026 | July 9, 2026 | AS |
| Mineros S.A. | June 1, 2026 | July 13, 2026 | S |
| Netramark Holdings Inc | June 5, 2026 | July 13, 2026 | AGS |
| NorthStar Gaming Holdings Inc.% | April 10, 2026 | May 25, 2026 | AS |
| Omega Pacific Resources Inc. | June 9, 2026 | July 15, 2026 | A |
| Orecap Invest Corp. | May 29, 2026 | July 14, 2026 | AGS |
| Playgon Games Inc. | May 25, 2026 | June 29, 2026 | AGS |
| Pulsar Helium Inc. | June 12, 2026 | July 17, 2026 | AGS |
| Rakovina Therapeutics Inc. * | July 7, 2026 | August 18, 2026 | AG |
| Roland Mineral Enterprises Corp | June 9, 2026 | July 14, 2026 | AS |
| SAPUTO INC | June 12, 2026 | August 7, 2026 | A |
| Sabio Holdings Inc. * | May 13, 2026 | July 10, 2026 | AG |
| Sable Resources Ltd. | June 8, 2026 | July 14, 2026 | AS |
| Sankamap Metals Inc. | June 9, 2026 | July 15, 2026 | A |
| Skull Ridge Gold Corp. | June 12, 2026 | July 22, 2026 | AGS |
| Stardust Metal Corp. | June 1, 2026 | July 14, 2026 | AGS |
| TOTAL TELCOM INC | June 15, 2026 | July 17, 2026 | AG |
| Torrent Gold Inc. | June 11, 2026 | July 17, 2026 | A |
| Uranium Royalty Corp | June 15, 2026 | July 20, 2026 | S |
| VISION MARINE TECHNOLOGIES INC | May 15, 2026 | June 15, 2026 | S |
| Verses AI Inc. % | April 24, 2026 | June 10, 2026 | A |
| Viridian Metals Inc. | May 15, 2026 | June 22, 2026 | AS |
| Vitality Products Inc. | June 11, 2026 | July 21, 2026 | AG |
| Volta Metals Ltd. | June 10, 2026 | July 15, 2026 | AGS |
| Xigem Technologies Corp. * | May 19, 2026 | June 30, 2026 | AGS |
Legend:
* = Change in Previously Reported Information% = Cancelled Meeting@ = Adjourned Meeting
Type of Meeting
A = Annual MeetingS = Special MeetingG = General MeetingB = Bondholder MeetingC = Court Meeting
For more information, please visit https://www.cds.ca/
To view the source version of this press release, please visit https://www.newsfilecorp.com/release/298384
Vancouver, British Columbia–(Newsfile Corp. – April 24, 2026) – District Metals Corp. (TSXV: DMX) (Nasdaq First North: DMXSE SDB) (OTCQX: DMXCF) (FSE: DFPP); ("District" or the "Company") welcomes the proposal by the Geological Survey of Sweden (SGU) to designate the Häggån Alum Shale Deposit, held by Aura Energy Ltd., as a deposit of national interest (Riksintresse) for valuable substances or raw materials. The Häggån Deposit is located within the Berg and Åre Municipalities and is adjacent west of District's Viken Alum Shale Deposit (Figure 1), which is currently under review by the SGU as a deposit of potential national interest.
The SGU's proposal is based on a comprehensive evaluation framework requiring that all three criteria for national interest designation be met:
the presence of substances of significant importance to society's needs or long-term security of supply;
materials with particularly valuable properties; and
a deposit that is well investigated and documented. The evaluation also considers a long-term perspective exceeding 50 years.
According to the SGU's assessment, the Häggån Deposit satisfies these criteria through its substantial and well-documented polymetallic resource base, which includes vanadium, uranium, nickel, molybdenum, zinc, and other critical raw materials. These metals are increasingly vital for Europe's energy transition, electrification, and industrial resilience, and are expected to remain strategically important over the coming decades.
Garrett Ainsworth, CEO of District, commented: "We view the SGU's proposal as a strong endorsement of the regional geological potential and the long-term strategic importance of Alum Shale polymetallic mineralized systems in the County of Jämtland. The recognition of the Häggån Deposit as a potential deposit of national interest highlights the importance of securing sustainable, domestic sources of critical metals within Sweden and the European Union."
The proposed designation of national interest aims to ensure that land-use planning decisions appropriately consider the presence of strategically important mineral resources and also protects it for potential future extraction. District believes that such recognition provides a balanced framework to safeguard future mineral resource development opportunities while respecting environmental and other societal considerations.
District Metals continues to advance its portfolio of projects in Sweden with a focus on responsible exploration and development of uranium properties that includes the Viken Property and Alum Shale Properties. The Company emphasizes its commitment to adhering to Sweden's high environmental standards and continuing constructive dialogue with landowners, municipalities, and relevant stakeholders.
The Company will follow the progression of the SGU's proposal through the consultation process and remains committed to contributing constructively to discussions regarding sustainable mineral resource development in Sweden.
More information on national interest status can be found here:
Figure 1: Plan View of Viken Property with Häggån Deposit Adjacent West
To view an enhanced version of this graphic, please visit:https://images.newsfilecorp.com/files/7971/294107_5456e6ac740779da_002full.jpg
Technical Information
All scientific and technical information in this news release has been prepared by, or approved by Garrett Ainsworth, P.Geo, President and CEO of the Company. Mr. Ainsworth is a Qualified Person for the purposes of National Instrument 43-101 – Standards of Disclosure for Mineral Projects ("NI 43-101").
Mr. Ainsworth has not verified any of the information regarding any of the properties or projects referred to herein other than the Viken Property. Mineralization on any other property referred to herein is not necessarily indicative of mineralization on the Viken Property.
About District Metals Corp.
District Metals Corp. is led by industry professionals with a track record of success in the mining industry. The Company's mandate is to seek out, explore, and develop prospective mineral properties through a disciplined science-based approach to create shareholder value and benefit other stakeholders. District is a 2025 TSX Venture 50 company, ranking among the top-performing issuers on the TSX Venture Exchange in the past year.
District is a uranium polymetallic exploration and development company focused on its flagship Viken Property in Sweden. The Viken Property covers 100% of the Viken Energy Metals Deposit, which contains the largest undeveloped Mineral Resource Estimate of uranium in the worldi along with significant Mineral Resource Estimates of vanadium, molybdenum, nickel, copper, zinc, and other important and critical raw materials.
For further information on the Viken Property, please see the technical report entitled "NI 43-101 Updated Mineral Resource Estimate and Technical Report on the Viken Energy Metals Project, Jämtland County, Sweden" dated effective April 25, 2025, which is available on SEDAR+ at www.sedarplus.ca.
On Behalf of the Board of Directors
"Garrett Ainsworth"
President and Chief Executive Officer(604) 288-4430
Neither the TSX Venture Exchange nor its Regulation Services Provider (as that term is defined in policies of the TSX Venture Exchange) accepts responsibility for the adequacy or accuracy of this release.
Cautionary Statement Regarding "Forward-Looking Information"
This news release contains certain statements that may be considered "forward-looking information" with respect to the Company within the meaning of applicable securities laws. In some cases, but not necessarily in all cases, forward-looking information can be identified by the use of forward-looking terminology such as "plans", "targets", "expects" or "does not expect", "is expected", "an opportunity exists", "is positioned", "estimates", "intends", "assumes", "anticipates" or "does not anticipate" or "believes", or variations of such words and phrases or statements that certain actions, events or results "may", "could", "would", "might", "will" or "will be taken", "occur" or "be achieved" and any similar expressions. In addition, any statements that refer to expectations, predictions, indications, projections or other characterizations of future events or circumstances contain forward-looking information. Statements containing forward-looking information are not historical facts but instead represent management's expectations, estimates and projections regarding future events. Forward-looking information in this news release relating to the Company include, among other things, statements relating to uranium and Alum Shale mining regulation in Sweden.
These statements and other forward-looking information are based on opinions, assumptions and estimates made by the Company in light of its experience and perception of historical trends, current conditions and expected future developments, as well as other factors that the Company believes are appropriate and reasonable in the circumstances, as of the date of this news release, including, without limitation, the reliability of exploration and drill results; reliability of data and the accuracy of publicly reported information regarding current, past and historic mines in the Bergslagen district and in respect of the Swedish properties; uranium and Alum Shale exploration and mining regulation in Sweden; the Company's ability to raise sufficient capital to fund planned exploration activities, maintain corporate capacity; stability in financial and capital markets; the Company's ability to complete its planned exploration programs; the absence of adverse conditions at mineral properties; no unforeseen operational delays; no material delays in obtaining necessary permits; the price of metals remaining at levels that render mineral properties economic.
Forward-looking information is necessarily based on a number of opinions, assumptions and estimates that, while considered reasonable by the Company as of the date such statements are made, are subject to known and unknown risks, uncertainties, assumptions and other factors that may cause the actual results, level of activity, performance or achievements to be materially different from those expressed or implied by such forward-looking information, including but not limited to risks associated with the following: the uncertainty of whether the Viken Deposit will be designated a deposit of national interest; the results of the inquiry into the mining of Alum Shale in Sweden and the possibility that it will be the subject of a municipal veto; the reliability of historic data on District's properties; the Company's ability to raise sufficient capital to finance planned exploration; the Company's limited operating history; the Company's negative operating cash flow and dependence on third-party financing; the uncertainty of additional funding; the uncertainties associated with early stage exploration activities including general economic, market and business conditions, the regulatory process, failure to obtain necessary permits and approvals, technical issues, potential delays, unexpected events and management's capacity to execute and implement its future plans; the Company's ability to identify Mineral Resources and Mineral Reserves; the substantial expenditures required to establish Mineral Reserves through drilling and the estimation of Mineral Reserves or Mineral Resources; the uncertainty of estimates used to calculate mineralization figures; changes in governmental regulations; compliance with applicable laws and regulations; competition for future resource acquisitions and skilled industry personnel; reliance on key personnel; title matters; conflicts of interest; environmental laws and regulations and associated risks, including climate change legislation; land reclamation requirements; changes in government policies; volatility of the Company's share price; the unlikelihood that shareholders will receive dividends from the Company; potential future acquisitions and joint ventures; infrastructure risks; fluctuations in demand for, and prices of metals; fluctuations in foreign currency exchange rates; legal proceedings and the enforceability of judgments; going concern risk; risks related to the Company's information technology systems and cyber-security risks; and risk related to the outbreak of epidemics or pandemics or other health crises. These factors and assumptions are not intended to represent a complete list of the factors and assumptions that could affect the Company. These factors and assumptions, however, should be considered carefully. Although the Company has attempted to identify factors that would cause actual actions, events or results to differ materially from those disclosed in the forward-looking information or information, there may be other factors that cause actions, events or results not to be as anticipated, estimated or intended. Also, many of such factors are beyond the control of the Company. Accordingly, readers should not place undue reliance on forward-looking information. The forward-looking information is made as of the date of this news release, and the Company assumes no obligation to publicly update or revise such forward-looking information, except as required by applicable securities laws.
i S&P Global Market Intelligence – Market Intelligence Research
To view the source version of this press release, please visit https://www.newsfilecorp.com/release/294107
Even if it's not a huge purchase, we think it was good to see that Philip Mitchell, the Executive Chair of Aura Energy Limited (ASX:AEE) recently shelled out AU$115k to buy stock, at AU$0.11 per share. Although the purchase is not a big one, increasing their shareholding by only 9.3%, it can be interpreted as a good sign.
Aura Energy Insider Transactions Over The Last Year
In fact, the recent purchase by Philip Mitchell was the biggest purchase of Aura Energy shares made by an insider individual in the last twelve months, according to our records. That implies that an insider found the current price of AU$0.13 per share to be enticing. That means they have been optimistic about the company in the past, though they may have changed their mind. While we always like to see insider buying, it's less meaningful if the purchases were made at much lower prices, as the opportunity they saw may have passed. Happily, the Aura Energy insider decided to buy shares at close to current prices. Philip Mitchell was the only individual insider to buy shares in the last twelve months.
You can see the insider transactions (by companies and individuals) over the last year depicted in the chart below. By clicking on the graph below, you can see the precise details of each insider transaction!
See our latest analysis for Aura Energy
ASX:AEE Insider Trading Volume April 7th 2026
There are plenty of other companies that have insiders buying up shares. You probably do not want to miss this free list of undervalued small cap companies that insiders are buying.
Insider Ownership
Another way to test the alignment between the leaders of a company and other shareholders is to look at how many shares they own. A high insider ownership often makes company leadership more mindful of shareholder interests. From our data, it seems that Aura Energy insiders own 9.7% of the company, worth about AU$12m. We do note, however, it is possible insiders have an indirect interest through a private company or other corporate structure. Overall, this level of ownership isn't that impressive, but it's certainly better than nothing!
What Might The Insider Transactions At Aura Energy Tell Us?
It's certainly positive to see the recent insider purchase. We also take confidence from the longer term picture of insider transactions. However, we note that the company didn't make a profit over the last twelve months, which makes us cautious. When combined with notable insider ownership, these factors suggest Aura Energy insiders are well aligned, and that they may think the share price is too low. So while it's helpful to know what insiders are doing in terms of buying or selling, it's also helpful to know the risks that a particular company is facing. When we did our research, we found 3 warning signs for Aura Energy (2 don't sit too well with us!) that we believe deserve your full attention.
If you would prefer to check out another company — one with potentially superior financials — then do not miss this free list of interesting companies, that have HIGH return on equity and low debt.
For the purposes of this article, insiders are those individuals who report their transactions to the relevant regulatory body. We currently account for open market transactions and private dispositions of direct interests only, but not derivative transactions or indirect interests.
Have feedback on this article? Concerned about the content? Get in touch with us directly. Alternatively, email editorial-team (at) simplywallst.com.This article by Simply Wall St is general in nature. We provide commentary based on historical data and analyst forecasts only using an unbiased methodology and our articles are not intended to be financial advice. It does not constitute a recommendation to buy or sell any stock, and does not take account of your objectives, or your financial situation. We aim to bring you long-term focused analysis driven by fundamental data. Note that our analysis may not factor in the latest price-sensitive company announcements or qualitative material. Simply Wall St has no position in any stocks mentioned.
Even when a business is losing money, it's possible for shareholders to make money if they buy a good business at the right price. For example, although Amazon.com made losses for many years after listing, if you had bought and held the shares since 1999, you would have made a fortune. But the harsh reality is that very many loss making companies burn through all their cash and go bankrupt.
Given this risk, we thought we'd take a look at whether Forsys Metals (TSE:FSY) shareholders should be worried about its cash burn. For the purposes of this article, cash burn is the annual rate at which an unprofitable company spends cash to fund its growth; its negative free cash flow. The first step is to compare its cash burn with its cash reserves, to give us its 'cash runway'.
How Long Is Forsys Metals' Cash Runway?
A company's cash runway is calculated by dividing its cash hoard by its cash burn. As at December 2025, Forsys Metals had cash of CA$19m and no debt. Importantly, its cash burn was CA$6.6m over the trailing twelve months. Therefore, from December 2025 it had 2.8 years of cash runway. That's decent, giving the company a couple years to develop its business. You can see how its cash balance has changed over time in the image below.
TSX:FSY Debt to Equity History April 2nd 2026
View our latest analysis for Forsys Metals
How Is Forsys Metals' Cash Burn Changing Over Time?
Because Forsys Metals isn't currently generating revenue, we consider it an early-stage business. Nonetheless, we can still examine its cash burn trajectory as part of our assessment of its cash burn situation. While it hardly paints a picture of imminent growth, the fact that it has reduced its cash burn by 34% over the last year suggests some degree of prudence. Admittedly, we're a bit cautious of Forsys Metals due to its lack of significant operating revenues. We prefer most of the stocks on this list of stocks that analysts expect to grow.
Can Forsys Metals Raise More Cash Easily?
While Forsys Metals is showing a solid reduction in its cash burn, it's still worth considering how easily it could raise more cash, even just to fuel faster growth. Generally speaking, a listed business can raise new cash through issuing shares or taking on debt. Many companies end up issuing new shares to fund future growth. By comparing a company's annual cash burn to its total market capitalisation, we can estimate roughly how many shares it would have to issue in order to run the company for another year (at the same burn rate).
Since it has a market capitalisation of CA$109m, Forsys Metals' CA$6.6m in cash burn equates to about 6.1% of its market value. Given that is a rather small percentage, it would probably be really easy for the company to fund another year's growth by issuing some new shares to investors, or even by taking out a loan.
So, Should We Worry About Forsys Metals' Cash Burn?
As you can probably tell by now, we're not too worried about Forsys Metals' cash burn. In particular, we think its cash runway stands out as evidence that the company is well on top of its spending. Its cash burn reduction wasn't quite as good, but was still rather encouraging! Looking at all the measures in this article, together, we're not worried about its rate of cash burn; the company seems well on top of its medium-term spending needs. Taking a deeper dive, we've spotted 5 warning signs for Forsys Metals you should be aware of, and 2 of them shouldn't be ignored.
If you would prefer to check out another company with better fundamentals, then do not miss this free list of interesting companies, that have HIGH return on equity and low debt or this list of stocks which are all forecast to grow.
Have feedback on this article? Concerned about the content? Get in touch with us directly. Alternatively, email editorial-team (at) simplywallst.com.This article by Simply Wall St is general in nature. We provide commentary based on historical data and analyst forecasts only using an unbiased methodology and our articles are not intended to be financial advice. It does not constitute a recommendation to buy or sell any stock, and does not take account of your objectives, or your financial situation. We aim to bring you long-term focused analysis driven by fundamental data. Note that our analysis may not factor in the latest price-sensitive company announcements or qualitative material. Simply Wall St has no position in any stocks mentioned.
Strong gains for the AIM All Share were reported today, with hopes of de-escalation in the Middle East serving to buoy sentiment. The junior index added seven points, marginally outperforming other European benchmarks to close at 717.12.
- RC Fornax +24%
- BRCK +24%
- Aura Energy +11%
- Ironveld -43%
- Plexus -38%
RC Fornax [LON:RCFX] added 24% on the day to top the board, with gains coming off the back of a well received trading update. New. Orders have given improved visibility of the full year performance, with the company’s flexible delivery model also seen as appealing in the current climate.
BRCK [LON:BRCK] was just under 24% higher on the day following notification of bid interest. However a second filing late afternoon may raise some questions. The share price hasn’t been disturbed though, and remains around 30% below the bid price should DD be completed and the offer progress.
Aura Energy [LON:AURA] gets the notable mention, up 11% on the day. That coincides with news that the company Chairman had increased his stake in the business. Volumes have however been unremarkable and the gain is barely above the spread.
Ironveld [LON:IRON] was 43% down on the day. This morning the company published delayed results, enabling the stock to be relisted after a three month suspension. There was a further note to advise that up to £1m was being raised at a heavy discount to fund working capital and business development needs.
Plexus [LON:POS] was in second to last place, down 38%. That’s off the back of both a trading update and interim results, which showed sales markedly lower and losses up, whilst project delays mean the forward-looking picture will also look challenging. Perhaps more critically however management note that they can economise to avoid the need for further funding as they navigate the current situation.
The round up is taking a couple of extra days off over the long Easter weekend, but we’ll be back on Tuesday 7th April as usual.
Get free weekly UK company analysis from The Armchair Trader here
Toronto, Ontario–(Newsfile Corp. – February 6, 2026) – Forsys Metals Corp. (TSX: FSY) (FSE: F2T) (NSX: FSY) ("Forsys" or the "Company") announces that it has changed its auditor from BDO Audit Pty Ltd. (the "Former Auditor") to RSM Canadea LLP (the "Successor Auditor"). The Former Auditor resigned as the auditor of the Company effective February 5, 2026 and the board of directors of the Company appointed the Successor Auditor on February 5, 2026, to hold office until the next annual shareholder meeting of the Company.
The Company's board of directors and audit committee each approved the resignation of the Former Auditor and the appointment of the Successor Auditor in place of the Former Auditor. There have been no reservations or modified opinions contained in the Former Auditor's reports on any of the Company's financial statements relating to the relevant period (as defined in Section 4.11 of National Instrument 51-102 ("NI 51-102")) or any subsequent period, and there are no reportable events (as defined in Section 4.11. of NI 51-102) between the Company and Former Auditor.
The Company will be filing the required reporting package within the prescribed time period in accordance with NI 51-102.
About Forsys Metals Corp.
Forsys Metals Corp. (TSX: FSY) (FSE: F2T) (NSX: FSY) is an emerging uranium developer focused on advancing its wholly owned Norasa Uranium Project, located in the politically and uranium friendly jurisdiction of Namibia, Africa. The Norasa Uranium Project is comprised of the Valencia Uranium deposit (ML-149) and the nearby Namibplaas Uranium deposit (EPL-3638). Further information is available at the Company website www.forsysmetals.com.
On behalf of the Board of Directors of Forsys Metals Corp. Richard Parkhouse, Investor Relations. For additional information please contact:
Richard Parkhouse, Investor Relationsemail: rparkhouse@forsysmetals.com email: info@forsysmetals.com
Forward-Looking Statement
Certain information contained in this press release constitutes "forward-looking information", within the meaning of Canadian legislation. Generally, these forward-looking statements can be identified by the use of forward-looking terminology such as "plans", "expects" or "does not expect", "is expected", "budget", "scheduled", "estimates", "forecasts", "intends", "anticipates" or "does not anticipate", or "believes", or variations of such words and phrases or state that certain actions, events or results "may", "could", "would", "might" or "will be taken", "occur", "be achieved" or "has the potential to". Forward-looking statements contained in this press release are qualified in their entirety by the inherent risks and uncertainties surrounding future expectations. Among those factors which could cause actual results to differ materially are the following: market conditions and other risk factors listed from time to time in our reports filed with Canadian securities regulators on SEDAR+ at www.sedarplus.ca. The forward-looking statements included in this press release are made as of the date of this press release and Forsys Metals Corp disclaim any intention or obligation to update or revise any forward-looking statements, whether as a result of new information, future events or otherwise, except as expressly required by applicable securities legislation.
To view the source version of this press release, please visit https://www.newsfilecorp.com/release/282977
Toronto, Ontario–(Newsfile Corp. – January 15, 2026) – Forsys Metals Corp. (TSX: FSY) (FSE: F2T) (NSX: FSY) ("Forsys" or the "Company") is pleased to announce further drilling results from its extension and exploration drilling program at the Valencia deposit (under ML 149), part of the Company's Norasa Uranium project ("Norasa"1).
The drilling program's objective is to expand mineral resources within and adjacent to the Valencia main pit. A further 960 metres ("m") of processed downhole gamma survey results and 8,519 ICP assay results have been logged and processed since the Company's September 2, 2025 news release. The results obtained on mineralised intercepts for the Valencia main and satellite deposits are reported below (Table 1).
Uranium intercepts have been logged, both in the infill drilling and in the resource extension drilling programs. The drilling is intended to improve the definition of the orebody, providing additional information for pit optimisation and mine planning.
Forsys' Country Director, Pine van Wyk, commented: "We are further encouraged by these results from both the Valencia Main deposit and its surrounding satellite targets. The extension and exploration drilling program has concluded and ongoing drilling has identified resource extention potential, while also improving our geological understanding of the deposit and confidence in the mineral resource."
Highlights
Widths are reported as drill hole intersection lengths. True width is estimated to be approximately 75% of the downhole width.
Highlights are as follows:
- Valencia Main Pit: Infill drilling has focused on the Valencia Main deposit, aiming to expand the Valencia Main resource and upgrade the resource classification. Infill drilling had the objective to move the resource into the Indicated and Measured categories (Figure 1). Since 2024, 17,532 m has been completed in 209 drill holes at Valencia Main. Results received since September 2, 2025 include drillhole VA24-127 with 64 m from surface to 64 m depth averaging 333 ppm U3O8. These new results continue to highlight the strong potential to enhance both tonnage and grade at Valencia.
- Valencia South: Drilling tested the down-plunge extension to the south of the Valencia Main deposit with the objective of increasing and upgrading the Indicated resource in this portion of the Valencia main deposit. Encouraging results have been obtained so far. Recent drilling includes borehole VA25-289 intersecting 32 m averaging 168 ppm eU3O8 from 90 m to 122 m followed by three more intersects of 7 m averaging 156 ppm eU3O8, 13 m grading 419 ppm U3O8 and 53.9 m grading 385 ppm U3O8, between 212 m and 304 m depth, the latter two intercepts being laboratory assays (ICP-MS).
- Valencia West: Results have been obtained at Valencia West (Figures 1 and 2) where seven boreholes have been completed since February 2025 for a total of 1,067 m. ICP assay results received since September 2025 include the following highlights: 315 ppm U3O8 over a 9.01 m interval in drillhole VA25-288 and 5 m grading 682 ppm U3O8 in borehole VA25-292. The drilling intersected additional uranium mineralization down dip, along strike and near surface, establishing a link with the Valencia Main resource. The drill spacing is believed to be sufficient for this zone to be classified within the existing Indicated Resource, potentially extending the Valencia Main pit by approximately 150 m to the west.
- The Jolie Zone satellite mineralization is located about 600 m north of the Valencia Main resource. 24 boreholes totalling 3,505 m have been completed since February 2025. Drilling identified two sub-parallel mineralised intrusions, approximately 50 m from each other. Assay results received since September 2025 include 263 ppm U3O8 over a 5 m interval and a further 736 ppm U3O8 over 11 m in drillhole VA25-273. Interpretation of these results indicates a continuity of mineralization, which is significant since it enhances the potential foradditional mineral resources. Mineralization is inferred over a strike length of approximately 350 metres at the Jolie Zone.
- The Valencia East satellite deposit generated encouraging results from the recent drill campaign. 35 boreholes, totalling 3,838 m, have been drilled since 2024, including both infill and extension drilling of the historical resource (Figure 1). Assay results received since September 2025 include two intersections in drillhole VA25-302 which returned 207 ppm U3O8 over a 9 m interval, followed by 30.6 m grading 186 ppm U3O8.. Borehole VA25-284 intersected 241 ppm U3O8 over a 22 m width from 75 m, and VA25-298 intersected 612 ppm U3O8 over a 7m width from 120 m. The aim of the infill drilling is to upgrade the Valencia East resource to the Indicated category. Extension drilling has identified additional mineralization along strike and down dip. See Figure-2 below.
Figure-1: Overview of Valencia infill and exploration drilling, showing the metres x ppm U3O8 for the 2024 to 2025 drill results.
To view an enhanced version of this graphic, please visit:https://images.newsfilecorp.com/files/12099/280438_85b8502a546f08b2_003full.jpg
Figure-2: Cross section, 75m wide through Valencia East, showing the borehole grades and current Resource Model grade bins. Borehole VA25-302 indicates elevated grades with respect to the 2024 Resource Block Model, while grades in boreholes VA25-284, VA25-298 and VA25-302 all indicate potential for additional resources to the SE of the 2024 model.
To view an enhanced version of this graphic, please visit:https://images.newsfilecorp.com/files/12099/280438_85b8502a546f08b2_004full.jpg
Table-1: 2025 drill campaign; comprehensive drillhole results update since the Company's September 2, 2025 news release (final results as at December 15, 2025); Widths are reported as drill hole intersection lengths. True width is estimated to be approximately 75% of the downhole width. Infill Drilling is for Valencia Main and West.
| Target | BHID | From (m) | To (m) | Width (m) | eU3O8 (ppm) | U3O8 (ppm) |
| Valencia West | VA24-068 | 49 | 52 | 3 | 98 | 104 |
| Valencia West | VA24-069 | 77 | 81 | 4 | 219 | 380 |
| Valencia West | VA24-070 | 50 | 54 | 4 | 197 | 252 |
| Valencia West | VA24-071 | 66 | 70 | 4 | 57 | |
| Valencia West | VA24-073 | 109 | 143.74 | 34.74 | 162 | 177 |
| Valencia Infill | VA24-074 | 43 | 91 | 48 | 256 | 256 |
| Valencia Infill | VA24-075 | 15 | 17 | 2 | 50 | 57 |
| Valencia Infill | VA24-076 | 23 | 53 | 30 | 142 | 129 |
| Valencia Infill | VA24-080 | 45 | 79 | 34 | 279 | 257 |
| Valencia Infill | VA24-082 | 0 | 1 | 1 | 53 | |
| Valencia West | VA24-083A | 158 | 208 | 50 | 193 | 185 |
| Valencia Infill | VA24-085 | 56 | 70 | 14 | 508 | 548 |
| Valencia Infill | VA24-086 | 35 | 66 | 31 | 292 | 277 |
| Valencia Infill | VA24-088 | 33 | 34 | 1 | 138 | 146 |
| Valencia Infill | VA24-089 | 32 | 63 | 31 | 317 | 329 |
| Valencia Infill | VA24-090 | 15 | 63 | 48 | 179 | 182 |
| Valencia Infill | VA24-091 | 22 | 49 | 27 | 132 | 145 |
| Jolie | VA24-098 | 101 | 125 | 24 | 137 | 171 |
| Jolie | VA24-098A | 53 | 57 | 4 | 146 | 133 |
| Jolie | VA24-099 | 57 | 125 | 68 | 120 | 143 |
| Jolie | VA24-099 | 152 | 159 | 7 | 142 | 205 |
| Jolie | VA24-100 | 100 | 105 | 5 | 148 | 116 |
| Jolie | VA24-101 | 58 | 62 | 4 | 74 | 111 |
| Valencia Infill | VA24-102 | 9 | 56 | 47 | 149 | |
| Valencia Infill | VA24-104 | 54 | 69 | 15 | 144 | 132 |
| Valencia Infill | VA24-105 | 32 | 36 | 4 | 93 | 103 |
| Valencia Infill | VA24-107 | 17 | 40 | 23 | 185 | 187 |
| Valencia Infill | VA24-109 | 0 | 68 | 68 | 104 | 83 |
| Valencia Infill | VA24-113 | 16 | 60 | 44 | 141 | 162 |
| Valencia Infill | VA24-114 | 10 | 12 | 2 | 77 | 52 |
| Valencia Infill | VA24-115 | 4 | 58 | 54 | 163 | 159 |
| Valencia Infill | VA24-116 | 34 | 65 | 31 | 178 | 176 |
| Valencia Infill | VA24-117 | 63 | 69 | 6 | 128 | 160 |
| Valencia Infill | VA24-118 | 5 | 27 | 22 | 261 | 303 |
| Valencia Infill | VA24-119 | 9 | 59 | 50 | 174 | 172 |
| Valencia Infill | VA24-120 | 11 | 34 | 23 | 113 | 106 |
| Valencia Infill | VA24-120 | 43 | 60 | 17 | 158 | 129 |
| Valencia Infill | VA24-121 | 19 | 65 | 46 | 111 | 118 |
| Valencia Infill | VA24-122 | 25 | 40 | 15 | 133 | 98 |
| Valencia Infill | VA24-123 | 64 | 71 | 7 | 140 | 150 |
| Valencia Infill | VA24-124 | 24 | 30 | 6 | 222 | 187 |
| Valencia Infill | VA24-125 | 18 | 72 | 54 | 88 | 107 |
| Valencia Infill | VA24-126 | 46 | 49 | 3 | 283 | 322 |
| Valencia Infill | VA24-127 | 0 | 64 | 64 | 360 | 333 |
| Valencia Infill | VA24-128 | 18 | 27 | 9 | 238 | 187 |
| Valencia Infill | VA24-128 | 38 | 61 | 23 | 279 | 318 |
| Valencia Infill | VA24-130 | 18 | 43 | 25 | 82 | 103 |
| Valencia Infill | VA24-131 | 0 | 1 | 1 | 58 | |
| Valencia Infill | VA24-133 | 46 | 49 | 3 | 103 | 97 |
| Valencia Infill | VA24-135 | 33 | 55 | 22 | 169 | 168 |
| Valencia Infill | VA24-136 | 43 | 52 | 9 | 118 | 146 |
| Valencia Infill | VA24-137 | 6 | 8 | 2 | 73 | 51 |
| Valencia Infill | VA24-138 | 14 | 20 | 6 | 239 | 116 |
| Valencia Infill | VA24-140 | 46 | 70 | 24 | 112 | 108 |
| Valencia Infill | VA24-141 | 36 | 76 | 40 | 136 | 152 |
| Valencia Infill | VA24-142 | 66 | 75 | 9 | 243 | 238 |
| Valencia Infill | VA24-146 | 9 | 73 | 64 | 137 | 146 |
| Valencia Infill | VA24-150 | 16 | 19 | 3 | 136 | 178 |
| Valencia Infill | VA24-151 | 20 | 27 | 7 | 186 | 280 |
| Valencia Infill | VA24-151 | 36 | 44 | 8 | 169 | 259 |
| Valencia Infill | VA24-152 | 24 | 39 | 15 | 113 | 110 |
| Valencia Infill | VA24-152 | 83 | 92 | 9 | 216 | 228 |
| Valencia Infill | VA24-158 | 69 | 92 | 23 | 106 | 118 |
| Valencia Infill | VA24-159 | 49 | 89 | 40 | 307 | 340 |
| Valencia Infill | VA24-160 | 27 | 43 | 16 | 108 | 110 |
| Valencia Infill | VA24-160 | 69 | 84 | 15 | 213 | |
| Valencia Infill | VA24-161 | 42 | 67 | 25 | 165 | 174 |
| Valencia Infill | VA24-163 | 47 | 56 | 9 | 129 | 160 |
| Valencia Infill | VA24-164 | 47 | 53 | 6 | 185 | 133 |
| Valencia Infill | VA24-165 | 24 | 80 | 56 | 89 | 89 |
| Valencia Infill | VA24-166 | 23 | 31 | 8 | 137 | 170 |
| Valencia Infill | VA24-166 | 68 | 89 | 21 | 143 | 135 |
| Valencia Infill | VA24-167 | 16 | 42 | 26 | 141 | 137 |
| Valencia Infill | VA24-168 | 66 | 84 | 18 | 116 | 114 |
| Valencia Infill | VA24-169 | 16 | 38 | 22 | 92 | 101 |
| Valencia Infill | VA24-170 | 43 | 69 | 26 | 234 | 267 |
| Valencia Infill | VA24-171 | 50 | 59 | 9 | 83 | 76 |
| Valencia Infill | VA24-172 | 25 | 56 | 31 | 217 | |
| Valencia Infill | VA24-173 | 13 | 40 | 27 | 311 | 372 |
| Valencia Infill | VA24-174 | 9 | 75 | 66 | 217 | 239 |
| Valencia Infill | VA24-175 | 46 | 91 | 45 | 99 | |
| Valencia Infill | VA24-176 | 17 | 38 | 21 | 100 | 88 |
| Valencia Infill | VA24-177 | 7 | 80 | 73 | 97 | 88 |
| Valencia Infill | VA24-178 | 52 | 69 | 17 | 133 | 125 |
| Valencia Infill | VA24-179 | 24 | 76 | 52 | 125 | 104 |
| Valencia Infill | VA24-180 | 40 | 80 | 40 | 98 | 108 |
| Valencia Infill | VA24-181 | 63 | 94 | 31 | 127 | |
| Valencia Infill | VA24-182 | 48 | 93 | 45 | 189 | 157 |
| Valencia Infill | VA24-184 | 21 | 54 | 33 | 113 | 132 |
| Valencia Infill | VA24-185 | 60 | 62 | 2 | 135 | 125 |
| Valencia | VA24-186 | 57 | 93 | 36 | 161 | 155 |
| Valencia | VA24-186 | 121 | 145 | 24 | 283 | 292 |
| Jolie | VA24-194 | 58 | 71 | 13 | 158 | 188 |
| Jolie | VA24-195 | 29 | 43 | 14 | 137 | 137 |
| Jolie | VA24-195 | 144 | 180 | 36 | 167 | 155 |
| Jolie | VA24-196 | 132 | 143 | 11 | 92 | 96 |
| Jolie | VA24-197 | 70 | 75 | 5 | 64 | 58 |
| Jolie | VA24-198 | 31 | 50 | 19 | 130 | 161 |
| Valencia Main | VA24-PQ13 | 1 | 42.61 | 41.61 | 145 | |
| Valencia | VA25-270 | 63 | 96 | 33 | 94 | 112 |
| Valencia West | VA25-271 | 108 | 110 | 2 | 129 | 149 |
| Jolie | VA25-272 | 75 | 83 | 8 | 117 | 142 |
| Jolie | VA25-273 | 97 | 102 | 5 | 228 | 263 |
| Jolie | VA25-273 | 143 | 154 | 11 | 629 | 736 |
| Jolie | VA25-274 | 31 | 50 | 19 | 102 | 142 |
| Jolie | VA25-275 | 12 | 66 | 54 | 75 | 99 |
| Jolie | VA25-275 | 93 | 97 | 4 | 272 | 277 |
| Jolie | VA25-276 | 13 | 19 | 6 | 258 | 301 |
| Jolie | VA25-276 | 75 | 79 | 4 | 265 | 394 |
| Valencia | VA25-277 | 29 | 36 | 7 | 136 | 119 |
| Valencia | VA25-278 | 9 | 54 | 45 | 104 | 108 |
| Valencia | VA25-278 | 82 | 100 | 18 | 135 | |
| Valencia | VA25-279 | 57 | 90 | 33 | 81 | 119 |
| Valencia East | VA25-280 | 16 | 19 | 3 | 63 | 57 |
| Valencia East | VA25-281 | 19 | 38 | 19 | 169 | 173 |
| Valencia East | VA25-281 | 96 | 101 | 5 | 120 | 143 |
| Valencia East | VA25-282 | 53 | 60 | 7 | 101 | 113 |
| Valencia East | VA25-283 | 68 | 74 | 6 | 144 | 189 |
| Valencia East | VA25-283 | 115 | 120 | 5 | 191 | 108 |
| Valencia East | VA25-284 | 75 | 97 | 22 | 171 | 241 |
| Jolie | VA25-285 | 83 | 95 | 12 | 83 | 109 |
| Valencia West | VA25-286 | 75 | 78 | 3 | 108 | 131 |
| Valencia West | VA25-287 | 91 | 109 | 18 | 120 | 104 |
| Valencia West | VA25-288 | 182.92 | 191.93 | 9.01 | 276 | 315 |
| Valencia S | VA25-289 | 90 | 122 | 32 | 168 | |
| Valencia S | VA25-289 | 212 | 219 | 7 | 156 | |
| Valencia S | VA25-289 | 225 | 238 | 13 | 341 | 419 |
| Valencia S | VA25-289 | 250 | 303.9 | 53.9 | 348 | 385 |
| Valencia S | VA25-291 | 75 | 76 | 1 | 58 | |
| Valencia West | VA25-292 | 81 | 86 | 5 | 581 | 682 |
| Valencia West | VA25-293 | 86 | 90.8 | 4.8 | 102 | 112 |
| Valencia West | VA25-294 | 83.8 | 87 | 3.2 | 164 | 163 |
| Valencia East | VA25-295 | 58 | 81 | 23 | 198 | 234 |
| Valencia East | VA25-296 | 81 | 85 | 4 | 284 | |
| Valencia East | VA25-297 | 86 | 93 | 7 | 244 | 273 |
| Valencia East | VA25-298 | 92 | 97 | 5 | 191 | 239 |
| Valencia East | VA25-298 | 120 | 127 | 7 | 456 | 612 |
| Valencia East | VA25-300 | 106 | 113 | 7 | 254 | 207 |
| Valencia East | VA25-300 | 147 | 160 | 13 | 129 | 114 |
| Valencia East | VA25-301 | 96 | 102 | 6 | 220 | 179 |
| Valencia East | VA25-301 | 126 | 132 | 6 | 375 | 325 |
| Valencia East | VA25-302 | 93 | 102 | 9 | 78 | 207 |
| Valencia East | VA25-302 | 142 | 172.6 | 30.6 | 133 | 186 |
| Valencia East | VA25-303 | 107.4 | 111.11 | 3.71 | 298 | 316 |
| Valencia East | VA25-303 | 151.97 | 167.8 | 15.83 | 287 | 250 |
| Valencia East | VA25-304 | 127 | 128 | 1 | 67 | 169 |
| Valencia East | VA25-305 | 86 | 94 | 8 | 201 | 222 |
| Valencia East | VA25-306 | 34 | 48 | 14 | 113 | 123 |
| Valencia East | VA25-307 | 68 | 75 | 7 | 190 | 189 |
| Valencia East | VA25-307 | 89 | 117 | 28 | 90 | 90 |
| Valencia East | VA25-307 | 123 | 132 | 9 | 98 | 104 |
| Valencia Main | VA25-PQ14 | 20 | 96.64 | 76.64 | 130 | 150 |
The above table lists all mineral intercept results obtained since the Company's September 2, 2025 news release. Drill collar positions are guided by field mapping and the current geological model. Interval widths are presented per downhole measurements; True widths of mineralized intrusions are expected to deviate from the reported widths. Drilling orientations are planned to intersect mineralization at high angles, as far as is possible, depending on terrain and accessibility of drill positions.
Quality Assurance and Quality Control ("QAQC")
Recent (2024 to date) Sampling and Assays
- Samples were taken from the diamond drill cores and RC chips for geochemical assay guided by radiometric downhole logging. The samples are sent to SGS Laboratories in South Africa, for sample preparation and ICP analyses. QAQC included regular internal and external check tests on a continuous basis in each of the sample batches processed.
- Forsys employs a QAQC program with Certified Reference Materials (CRMs), blanks, coarse duplicates, and pulp duplicates inserted into each batch of samples. The QAQC insert rate comprises 4 % CRMs using three CRM types with different grades of U3O8; 4 % blanks and 8 % to 10 % duplicates. RC sample batches have a field duplicate split at the drill rig; and pulp duplicates split at prescribed intervals at the laboratory. Core samples have coarse cruch duplicates, and pulp duplicates, each split at the laboratory.
External Check Assay Laboratory
Four percent of the samples sent to SGS are also submitted for check analyses to UIS Laboratories (UIS) in South Africa; UIS serves as the independent accredited laboratory. The sample results are further validated by comparison with the downhole radiometric scans.
Qualified Persons Statement for Mineral Resource The information in this release that relates to the Interim Drilling Results for the Norasa Project is based on information compiled or reviewed by Dr Guy Freemantle of The MSA Group (Pty) Ltd., Johannesburg, South Africa. The MSA Group are independent consultants to the Norasa Project, Namibia. Dr Freemantle holds a Bachelor of Science in Geology (2006) and Doctor of Philosophy in Geology (2017) both at the University of the Witwatersrand. He is a member of the Society of Economic Geologists (892905) and current Africa region VP; a Fellow of the Geological Society of South Africa (965392); and is registered with SACNASP (Registration 117527). Dr Freemantle has practiced his profession continuously for 16 years and has sufficient experience and knowledge that is relevant to the style of mineralization and type of deposits under consideration as well as to the activity that is being undertaken to fulfil requirements of a Qualified Person as per NI 43-101. Dr Freemantle consents to this release in the form and context in which it appears.
About Forsys Metals Corp.Forsys Metals Corp. (TSX: FSY) (FSE: F2T) (NSX: FSY) is an emerging uranium developer focused on advancing its wholly owned Norasa Uranium Project, located in the politically and uranium friendly jurisdiction of Namibia, Africa. The Norasa Uranium Project is comprised of the Valencia Uranium deposit (ML-149) and the nearby Namibplaas Uranium deposit (EPL-3638). Further information is available at the Company website www.forsysmetals.com.
On behalf of the Board of Directors of Forsys Metals Corp. Richard Parkhouse, Investor Relations. For additional information, please contact:
Pine van Wyk, Country Director, Forsysemail: pine@forsysmetals.com
Richard Parkhouse, Investor Relationsemail: rparkhouse@forsysmetals.com email: info@forsysmetals.com
Forward-Looking Statement
Certain information contained in this press release constitutes "forward-looking information", within the meaning of Canadian legislation. Generally, these forward-looking statements can be identified by the use of forward-looking terminology such as "plans", "expects" or "does not expect", "is expected", "budget", "scheduled", "estimates", "forecasts", "intends", "anticipates" or "does not anticipate", or "believes", or variations of such words and phrases or state that certain actions, events or results "may", "could", "would", "might" or "will be taken", "occur", "be achieved" or "has the potential to". Forward-looking statements contained in this press release are qualified in their entirety by the inherent risks and uncertainties surrounding future expectations. Among those factors which could cause actual results to differ materially are the following: market conditions and other risk factors listed from time to time in our reports filed with Canadian securities regulators on SEDAR+ at www.sedarplus.ca. The forward-looking statements included in this press release are made as of the date of this press release and Forsys Metals Corp disclaim any intention or obligation to update or revise any forward-looking statements, whether as a result of new information, future events or otherwise, except as expressly required by applicable securities legislation.
1 The Norasa Uranium Project ("Norasa") is wholly owned by the Company's 100% subsidiary Valencia Uranium (Pty) Ltd. ("Valencia Uranium") and comprises the Valencia uranium deposits (held under ML-149) ("Valencia") and the Namibplaas uranium deposit (under EPL-3638, application for ML-251) ("Namibplaas"), located in the Erongo region of Namibia.
2 Assay results are denoted U3O8, while grades calculated from downhole gamma are represented by eU3O8.
To view the source version of this press release, please visit https://www.newsfilecorp.com/release/280438
Whilst it may not be a huge deal, we thought it was good to see that the Forsys Metals Corp. (TSE:FSY) Independent Director, Pierfranco Malpenga, recently bought CA$96k worth of stock, for CA$0.28 per share. Although the purchase is not a big one, increasing their shareholding by only 8.6%, it can be interpreted as a good sign.
The Last 12 Months Of Insider Transactions At Forsys Metals
In the last twelve months, the biggest single purchase by an insider was when Director Stefano Roma bought CA$2.8m worth of shares at a price of CA$0.50 per share. So it's clear an insider wanted to buy, even at a higher price than the current share price (being CA$0.28). Their view may have changed since then, but at least it shows they felt optimistic at the time. In our view, the price an insider pays for shares is very important. It is generally more encouraging if they paid above the current price, as it suggests they saw value, even at higher levels.
While Forsys Metals insiders bought shares during the last year, they didn't sell. The chart below shows insider transactions (by companies and individuals) over the last year. If you click on the chart, you can see all the individual transactions, including the share price, individual, and the date!
Check out our latest analysis for Forsys Metals
TSX:FSY Insider Trading Volume November 26th 2025
Forsys Metals is not the only stock that insiders are buying. For those who like to find small cap companies at attractive valuations, this free list of growing companies with recent insider purchasing, could be just the ticket.
Insider Ownership
Many investors like to check how much of a company is owned by insiders. We usually like to see fairly high levels of insider ownership. Insiders own 7.1% of Forsys Metals shares, worth about CA$4.7m, according to our data. We do generally prefer see higher levels of insider ownership.
So What Does This Data Suggest About Forsys Metals Insiders?
The recent insider purchases are heartening. We also take confidence from the longer term picture of insider transactions. However, we note that the company didn't make a profit over the last twelve months, which makes us cautious. We would certainly prefer see higher levels of insider ownership but analysis of the insider transactions suggests that Forsys Metals insiders are expecting a bright future. So these insider transactions can help us build a thesis about the stock, but it's also worthwhile knowing the risks facing this company. At Simply Wall St, we've found that Forsys Metals has 4 warning signs (2 shouldn't be ignored!) that deserve your attention before going any further with your analysis.
Of course, you might find a fantastic investment by looking elsewhere. So take a peek at this free list of interesting companies.
For the purposes of this article, insiders are those individuals who report their transactions to the relevant regulatory body. We currently account for open market transactions and private dispositions of direct interests only, but not derivative transactions or indirect interests.
Have feedback on this article? Concerned about the content? Get in touch with us directly. Alternatively, email editorial-team (at) simplywallst.com.This article by Simply Wall St is general in nature. We provide commentary based on historical data and analyst forecasts only using an unbiased methodology and our articles are not intended to be financial advice. It does not constitute a recommendation to buy or sell any stock, and does not take account of your objectives, or your financial situation. We aim to bring you long-term focused analysis driven by fundamental data. Note that our analysis may not factor in the latest price-sensitive company announcements or qualitative material. Simply Wall St has no position in any stocks mentioned.
The Canadian market has shown resilience with improved labour productivity and a healthy rise in hourly compensation, which is helping to support consumer spending and the broader economy. In light of these conditions, investors might find value in exploring opportunities beyond the established giants. Penny stocks, though an older term, continue to hold relevance as they often represent smaller or newer companies with potential for growth; here we examine three such stocks that demonstrate strong financial fundamentals.
Top 10 Penny Stocks In Canada
|
Name |
Share Price |
Market Cap |
Financial Health Rating |
|
Westbridge Renewable Energy (TSXV:WEB) |
CA$0.61 |
CA$61.7M |
★★★★★★ |
|
CEMATRIX (TSX:CEMX) |
CA$0.31 |
CA$48.06M |
★★★★★★ |
|
Fintech Select (TSXV:FTEC) |
CA$0.04 |
CA$2.8M |
★★★★★★ |
|
Findev (TSXV:FDI) |
CA$0.43 |
CA$12.75M |
★★★★★★ |
|
Thor Explorations (TSXV:THX) |
CA$0.885 |
CA$578.81M |
★★★★★★ |
|
Automotive Finco (TSXV:AFCC.H) |
CA$0.94 |
CA$18.63M |
★★★★★★ |
|
Amerigo Resources (TSX:ARG) |
CA$2.08 |
CA$335.9M |
★★★★★☆ |
|
Pulse Seismic (TSX:PSD) |
CA$3.76 |
CA$192.36M |
★★★★★★ |
|
Hemisphere Energy (TSXV:HME) |
CA$1.94 |
CA$186.17M |
★★★★★★ |
|
McChip Resources (TSXV:MCS) |
CA$1.47 |
CA$8.39M |
★★★★★★ |
Click here to see the full list of 430 stocks from our TSX Penny Stocks screener.
Here we highlight a subset of our preferred stocks from the screener.
Simply Wall St Financial Health Rating: ★★★★★☆
Overview: ACT Energy Technologies Ltd. offers directional drilling services to oil and natural gas companies in Canada and the United States, with a market capitalization of CA$159.83 million.
Operations: The company generates CA$523.90 million in revenue from its directional drilling services provided to oil and natural gas sectors in Canada and the United States.
Market Cap: CA$159.83M
ACT Energy Technologies Ltd. has shown stable weekly volatility over the past year, with its interest payments well-covered by EBIT at 5 times coverage and a satisfactory net debt to equity ratio of 27.4%. Despite a recent net loss of CA$9.96 million for Q2 2025, the company maintains high-quality earnings and experienced management. Its short-term assets exceed both short-term and long-term liabilities, indicating financial stability. However, earnings growth has decelerated compared to its five-year average, and analysts forecast a slight decline in earnings over the next three years. The company also announced a share repurchase program recently.
TSX:ACX Financial Position Analysis as at Aug 2025Forsys Metals
Simply Wall St Financial Health Rating: ★★★★☆☆
Overview: Forsys Metals Corp. focuses on the acquisition, exploration, and development of uranium mineral properties in Africa and has a market cap of CA$117.98 million.
Operations: Currently, there are no reported revenue segments for the company.
Market Cap: CA$117.98M
Forsys Metals Corp., a pre-revenue company with a market cap of CA$117.98 million, is advancing its Namibplaas uranium property in Namibia through an extensive 64-hole drill program aimed at upgrading resource classification and expanding potential mineralization. Despite being debt-free with short-term assets exceeding liabilities, Forsys faces financial challenges, including less than a year of cash runway and increasing losses over the past five years. Recent earnings reports show consistent net losses, while its share price remains highly volatile. The management team is experienced, providing some stability amid these operational hurdles as they focus on long-term project development.
TSX:FSY Debt to Equity History and Analysis as at Aug 2025Leading Edge Materials
Simply Wall St Financial Health Rating: ★★★★★☆
Overview: Leading Edge Materials Corp. focuses on the exploration and development of resource properties in Sweden and Romania, with a market cap of CA$35.99 million.
Operations: There are no reported revenue segments for this company.
Market Cap: CA$35.99M
Leading Edge Materials Corp., with a market cap of CA$35.99 million, remains pre-revenue as it explores resource properties in Sweden and Romania. Despite being debt-free, the company’s short-term assets do not cover its long-term liabilities, though they exceed short-term obligations. Recent private placements raised up to CA$4 million to extend its cash runway beyond the current four months. The company’s stock has experienced high volatility, with weekly fluctuations still above most Canadian stocks despite some reduction over the past year. Management and board experience lend stability as they navigate financial challenges amid ongoing exploration efforts.
-
Review our historical performance report to gain insights into Leading Edge Materials’ track record.
TSXV:LEM Debt to Equity History and Analysis as at Aug 2025Taking Advantage
-
Discover the full array of 430 TSX Penny Stocks right here.
-
Ready To Venture Into Other Investment Styles? AI is about to change healthcare. These 27 stocks are working on everything from early diagnostics to drug discovery. The best part – they are all under $10b in market cap – there’s still time to get in early.
This article by Simply Wall St is general in nature. We provide commentary based on historical data and analyst forecasts only using an unbiased methodology and our articles are not intended to be financial advice. It does not constitute a recommendation to buy or sell any stock, and does not take account of your objectives, or your financial situation. We aim to bring you long-term focused analysis driven by fundamental data. Note that our analysis may not factor in the latest price-sensitive company announcements or qualitative material. Simply Wall St has no position in any stocks mentioned.
Companies discussed in this article include TSX:ACX TSX:FSY and TSXV:LEM.
This article was originally published by Simply Wall St.
Have feedback on this article? Concerned about the content? Get in touch with us directly. Alternatively, email editorial-team@simplywallst.com
The Canadian stock market has shown resilience, with the TSX rising over 2% recently, even as global markets grapple with tariff uncertainties and economic pressures. Amidst this backdrop, penny stocks—often seen as smaller or newer companies—offer intriguing opportunities for growth at accessible price points. Despite being a somewhat outdated term, these stocks can still represent hidden gems when they possess strong financials and clear growth potential.
Top 10 Penny Stocks In Canada
|
Name |
Share Price |
Market Cap |
Financial Health Rating |
|
Westbridge Renewable Energy (TSXV:WEB) |
CA$0.60 |
CA$56.64M |
★★★★★★ |
|
NTG Clarity Networks (TSXV:NCI) |
CA$1.56 |
CA$66.86M |
★★★★★★ |
|
Thor Explorations (TSXV:THX) |
CA$0.61 |
CA$399.18M |
★★★★☆☆ |
|
Orezone Gold (TSX:ORE) |
CA$1.22 |
CA$627.66M |
★★★★★☆ |
|
Amerigo Resources (TSX:ARG) |
CA$1.77 |
CA$287.36M |
★★★★★☆ |
|
PetroTal (TSX:TAL) |
CA$0.55 |
CA$512.47M |
★★★★★☆ |
|
Pulse Seismic (TSX:PSD) |
CA$2.50 |
CA$128M |
★★★★★★ |
|
McCoy Global (TSX:MCB) |
CA$3.36 |
CA$91.06M |
★★★★★★ |
|
Findev (TSXV:FDI) |
CA$0.49 |
CA$13.89M |
★★★★★★ |
|
BluMetric Environmental (TSXV:BLM) |
CA$1.21 |
CA$42.83M |
★★★★★★ |
Click here to see the full list of 924 stocks from our TSX Penny Stocks screener.
Below we spotlight a couple of our favorites from our exclusive screener.
Simply Wall St Financial Health Rating: ★★★★★★
Overview: Base Carbon Inc. provides capital, development expertise, and management resources to projects in voluntary carbon and broader environmental markets, with a market cap of CA$46.66 million.
Operations: The company generates revenue of $27.95 million from the development and deployment of its projects in voluntary carbon and environmental markets.
Market Cap: CA$46.66M
Base Carbon Inc., with a market cap of CA$46.66 million, has shown significant revenue growth of 335.4% over the past year, generating US$27.95 million from its environmental projects. Despite this growth, the company is currently unprofitable and reported a net loss of US$28.91 million for 2024, compared to a net income in the previous year. The absence of debt and strong asset coverage for liabilities are positive aspects; however, an auditor’s report expressed doubts about its ability to continue as a going concern due to financial challenges, highlighting risks associated with investing in such stocks.
-
Click to explore a detailed breakdown of our findings in Base Carbon’s financial health report.
-
Examine Base Carbon’s past performance report to understand how it has performed in prior years.
NEOE:BCBN Revenue & Expenses Breakdown as at Apr 2025Forsys Metals
Simply Wall St Financial Health Rating: ★★★★★★
Overview: Forsys Metals Corp. is involved in the acquisition, exploration, and development of mineral properties in Africa with a market cap of CA$101.13 million.
Operations: Forsys Metals Corp. does not report specific revenue segments.
Market Cap: CA$101.13M
Forsys Metals Corp., with a market cap of CA$101.13 million, is pre-revenue and currently unprofitable, with no forecasted profitability in the near term. The company has been actively engaged in its Norasa Uranium project, showing promising results from ore-sorting testwork aimed at enhancing processing efficiency and reducing costs. Recent drilling at the Valencia site indicates potential resource expansion. Despite having no long-term liabilities and sufficient short-term assets to cover liabilities, Forsys faces high volatility in its share price and limited cash runway, although recent capital raises may provide some relief.
-
Dive into the specifics of Forsys Metals here with our thorough balance sheet health report.
-
Assess Forsys Metals’ previous results with our detailed historical performance reports.
TSX:FSY Debt to Equity History and Analysis as at Apr 2025Electric Metals (USA)
Simply Wall St Financial Health Rating: ★★★★★☆
Overview: Electric Metals (USA) Limited focuses on acquiring, exploring, and developing mineral properties in the United States, Canada, and Australia with a market cap of CA$21.08 million.
Operations: Electric Metals (USA) Limited has not reported any revenue segments.
Market Cap: CA$21.08M
Electric Metals (USA) Limited, with a market cap of CA$21.08 million, is pre-revenue and currently unprofitable. The company focuses on the Emily Manganese Project in Minnesota, which aligns with recent U.S. policy shifts promoting domestic mineral production. This project could reduce reliance on foreign manganese supply for EV batteries and energy storage sectors. Despite being debt-free, Electric Metals faces challenges such as high share price volatility and insufficient short-term assets to cover liabilities. Recent agreements aim to enhance investor outreach in Chinese markets, potentially broadening its shareholder base amidst ongoing financial constraints.
TSXV:EML Debt to Equity History and Analysis as at Apr 2025Summing It All Up
-
Embark on your investment journey to our 924 TSX Penny Stocks selection here.
-
Looking For Alternative Opportunities? Trump has pledged to “unleash” American oil and gas and these 22 US stocks have developments that are poised to benefit.
This article by Simply Wall St is general in nature. We provide commentary based on historical data and analyst forecasts only using an unbiased methodology and our articles are not intended to be financial advice. It does not constitute a recommendation to buy or sell any stock, and does not take account of your objectives, or your financial situation. We aim to bring you long-term focused analysis driven by fundamental data. Note that our analysis may not factor in the latest price-sensitive company announcements or qualitative material. Simply Wall St has no position in any stocks mentioned.
Companies discussed in this article include NEOE:BCBN TSX:FSY and TSXV:EML.
This article was originally published by Simply Wall St.
Have feedback on this article? Concerned about the content? Get in touch with us directly. Alternatively, email editorial-team@simplywallst.com
As the Canadian market navigates a landscape of cooling economic growth and inflationary pressures, investors are increasingly looking for opportunities that balance affordability with potential upside. Penny stocks, often associated with smaller or newer companies, offer a unique investment avenue that remains relevant despite their somewhat outdated label. When coupled with strong financials and solid fundamentals, these stocks can present hidden opportunities for growth without many of the typical risks associated with this segment of the market.
Top 10 Penny Stocks In Canada
|
Name |
Share Price |
Market Cap |
Financial Health Rating |
|
NTG Clarity Networks (TSXV:NCI) |
CA$1.79 |
CA$75.46M |
★★★★★☆ |
|
NamSys (TSXV:CTZ) |
CA$1.09 |
CA$29.28M |
★★★★★★ |
|
Madoro Metals (TSXV:MDM) |
CA$0.045 |
CA$4.03M |
★★★★★★ |
|
Orezone Gold (TSX:ORE) |
CA$0.90 |
CA$464.04M |
★★★★★☆ |
|
Amerigo Resources (TSX:ARG) |
CA$1.91 |
CA$314.55M |
★★★★★☆ |
|
Alvopetro Energy (TSXV:ALV) |
CA$4.93 |
CA$179.53M |
★★★★★★ |
|
PetroTal (TSX:TAL) |
CA$0.69 |
CA$632.47M |
★★★★★☆ |
|
McCoy Global (TSX:MCB) |
CA$3.29 |
CA$89.42M |
★★★★★★ |
|
Findev (TSXV:FDI) |
CA$0.485 |
CA$13.89M |
★★★★★★ |
|
BluMetric Environmental (TSXV:BLM) |
CA$1.17 |
CA$43.2M |
★★★★★★ |
Click here to see the full list of 934 stocks from our TSX Penny Stocks screener.
We're going to check out a few of the best picks from our screener tool.
Simply Wall St Financial Health Rating: ★★★★★★
Overview: Forsys Metals Corp. is involved in the acquisition, exploration, and development of mineral properties in Africa and has a market cap of CA$128.30 million.
Operations: Forsys Metals Corp. does not report any revenue segments.
Market Cap: CA$128.3M
Forsys Metals Corp., with a market cap of CA$128.30 million, is currently pre-revenue and unprofitable, but it has no debt and its short-term assets exceed liabilities. The company recently raised capital through private placements, securing CA$7.85 million in early 2025 to extend its cash runway beyond the previous estimate of seven months. Forsys's seasoned management team is overseeing an extensive drilling program at the Norasa Uranium project in Africa, which shows potential for resource expansion at the Valencia site. Despite high share price volatility and negative return on equity, these developments may interest speculative investors seeking exposure to uranium exploration.
TSX:FSY Financial Position Analysis as at Mar 2025GoviEx Uranium
Simply Wall St Financial Health Rating: ★★★★★★
Overview: GoviEx Uranium Inc. is a mineral resources company focused on acquiring, exploring, and developing uranium properties in Africa, with a market cap of CA$52.82 million.
Operations: Currently, there are no reported revenue segments for the company.
Market Cap: CA$52.82M
GoviEx Uranium Inc., with a market cap of CA$52.82 million, is pre-revenue and currently unprofitable, but it remains debt-free with short-term assets exceeding liabilities. The company recently announced a private placement to raise up to CAD 7.5 million, enhancing its cash runway beyond the current three months. GoviEx's feasibility study for the Muntanga Uranium Project in Zambia presents promising economics with an after-tax NPV of US$243 million and an IRR of 20.8%. These developments may attract speculative investors interested in emerging uranium projects amid growing nuclear fuel demand.
TSXV:GXU Debt to Equity History and Analysis as at Mar 2025Orogen Royalties
Simply Wall St Financial Health Rating: ★★★★★★
Overview: Orogen Royalties Inc. is a mineral exploration company active in Canada, the United States, Mexico, Argentina, and Kenya with a market cap of CA$322.63 million.
Operations: The company's revenue is primarily derived from mineral exploration, totaling CA$7.33 million.
Market Cap: CA$322.63M
Orogen Royalties Inc., with a market cap of CA$322.63 million, is not pre-revenue and has seen profitability growth over the past five years, although recent earnings have declined. The company benefits from its strategic royalty interests, including a 1% net smelter return royalty on the Expanded Silicon project in Nevada, which now boasts an updated inferred resource of 16.31 million ounces of gold. Additionally, Orogen holds a cash-flowing 2% NSR royalty at the Navidad target in Mexico, where significant gold-silver mineralization has been identified. Orogen remains debt-free with short-term assets comfortably covering liabilities.
TSXV:OGN Financial Position Analysis as at Mar 2025Seize The Opportunity
-
Click through to start exploring the rest of the 931 TSX Penny Stocks now.
-
Have a stake in these businesses? Integrate your holdings into Simply Wall St's portfolio for notifications and detailed stock reports.
-
Invest smarter with the free Simply Wall St app providing detailed insights into every stock market around the globe.
Want To Explore Some Alternatives?
-
Explore high-performing small cap companies that haven't yet garnered significant analyst attention.
-
Jump on the AI train with fast growing tech companies forging a new era of innovation.
-
Find companies with promising cash flow potential yet trading below their fair value.
This article by Simply Wall St is general in nature. We provide commentary based on historical data and analyst forecasts only using an unbiased methodology and our articles are not intended to be financial advice. It does not constitute a recommendation to buy or sell any stock, and does not take account of your objectives, or your financial situation. We aim to bring you long-term focused analysis driven by fundamental data. Note that our analysis may not factor in the latest price-sensitive company announcements or qualitative material. Simply Wall St has no position in any stocks mentioned.
Companies discussed in this article include TSX:FSY TSXV:GXU and TSXV:OGN.
Have feedback on this article? Concerned about the content? Get in touch with us directly. Alternatively, email editorial-team@simplywallst.com
Forsys Metals Corp
TORONTO, Feb. 26, 2025 (GLOBE NEWSWIRE) — Forsys Metals Corp. (TSX: FSY) (FSE: F2T) (NSX: FSY) (“Forsys” or the “Company”)
Forsys is pleased to announce further interim drilling results from its Resource Extension and Exploration drilling program on Valencia (ML 149), at the Company’s Norasa Uranium project (“Norasa1”). The drilling program currently underway is designed to expand and upgrade Valencia’s resources within and close to the current main pit. Positive results indicate good potential to increase the resource and grade level at Valencia.
Highlights
Highlights are as follows:
-
20,597 metres (“m”) of drilling have been completed in 211 boreholes since February 2024;
-
Drilling at the Jolie Zone includes an intercept of 308 ppm eU3O8 over 23m from 18m to 41m depth in drillhole VA24-061;
-
At Valencia West, all 37 drillholes intersected uranium mineralisation. The best results include an intercept of 240 ppm eU3O8 over 58m from 157m to 215m depth in drillhole VA24-083A;
-
Infill drilling at the Valencia main deposit intersected 481 ppm eU3O8 over a 63m interval in drillhole VA24-127 and 306 ppm eU3O8 over a 91m interval in drillhole VA24-175;
Pine van Wyk, Forsys Country Director commented: “Drilling results obtained to date demonstrate good potential to expand and upgrade the resources to support the Norasa development strategy. The continuity of mineralization at Valencia West and Jolie Zone highlights opportunities to extend the potential mine life and enhance project economics.”
Summary
A total of 20,597.08m of drilling has been completed in 211 boreholes since the drilling program commenced in February 2024. To date, assays from 70 drillholes have been received and 19,092 down-hole metres have been surveyed with a gamma ray spectrometer (“downhole gamma”). Assay results in Table 1 and in the text are denoted U3O8, while grades calculated from downhole gamma are represented by eU3O8.
-
12 drillholes at the Jolie Zone target in 2024 identified two zones of sub-parallel mineralised alaskite intrusions (Zones 1 and 2), which are approximately 50m apart (Figures 1 and 4). These zones strike NE-SW and are both open-ended to the SW along strike and at depth, whereas Zone 2 is also open-ended to the NE. Results from Jolie include 308 ppm eU3O8 over 23m from 18m to 41m depth (Zone 1 in drillhole VA24-061) and 166 ppm eU3O8 over 74m from 57m to 131m depth (Zone 2 in drillhole VA24-099). The SW and depth extensions of mineralisation are currently being tested by a further six drillholes, aiming to increase the known strike extent to 300m.
-
Exploration drilling at Valencia West has defined additional mineralised ground to the west of the Valencia main orebody. Positive results could potentially extend the main pit to the west. All of the 37 drillholes completed in the area during 2024 intersected uranium mineralization (Figure 1). Results include 240 ppm eU3O8 over 58m from 157m to 215m depth in drillhole VA24-083A. Recent drillholes have linked Valencia West to the Valencia Main resource, including drillhole VA24-189 with 200 ppm eU3O8 over 22m from 89m to 111m depth (Table 1). Further drilling is in progress to establish intersections and grade for detailed resource modelling at Valencia West (Figure 1).
-
Infill drilling is aimed at converting an existing 22 Mt Indicated Resource into Measured category (Figures 1 and 2). Intersections include 481 ppm eU3O8 over a 63m interval in drillhole VA24-127 and 306 ppm eU3O8 over a 91m interval in drillhole VA24-175 (Table 1).
Valencia Main Pit Extension and Resource Upgrade Drilling
Current drilling aims to upgrade the Valencia Main resource through infill drilling and expand the Valencia Main resource to the west and also assess satellite mineralisation extension potential at the Jolie Zone target 600 m north of the Valencia Main pit (Figure 1). Seventy-one additional drillholes totaling 9,637 m of combined percussion, reverse circulation (“RC”) and diamond drilling have been scheduled for the drilling program at Valencia. The drill program tests potential targets within and adjacent to the Valencia Main Pit:
-
Valencia Main Infill drilling is aimed at converting an existing 22 Mt Indicated Resource into Measured category (Figures 1 and 2). To date, 10,836m (147 drillholes) of the planned 14,127m (189 drillholes) have been completed. Infill drilling is planned to test down to the 650m elevation, with several holes terminating in high-grades of up to 712 ppm eU3O8, and many of which contain high grades from the collar to the end of hole. Selected results are listed in Table 1 and include 481 ppm eU3O8 over a 63 m interval in drillhole VA24-127 and 306 ppm eU3O8 over a 91m interval in drillhole VA24-175. Of the 189 planned drillholes, 148 were drilled with RC, two with PQ and the remainder are being established as open-hole percussion drills (Figure 2). All the RC and PQ drillholes are surveyed with downhole gamma probes and individual metre samples are sent for laboratory analysis. The percussion holes are analysed with downhole gamma only. Once completed, the percussion drillholes will amount to a maximum of 37% of the Infill drilling and the downhole gamma results will be reconciled against all laboratory analyses in the programme.High grade results of the down-plunge extension to the south of the Valencia Main deposit, were previously reported (August 14th 2024). One further drillhole is currently planned, with the aim of potentially increasing the Indicated Resource in this area.
-
Valencia West exploration drilling is defining the extension of the main pit to the west. All 37 drillholes, drilled during 2024 in this area (Figure 1), intersected uranium mineralization, which extends along strike and to surface. Results (see Table 1) include 240 ppm eU3O8 over 58m from 157m to 215m depth in drillhole VA24-083A (Figure 3). Recent drillholes have linked Valencia West to the Valencia Main resource, including drillhole VA24-189 with 220 ppm eU3O8 over 13m from 14m to 27m depth and 200 ppm eU3O8 over 22m from 89m to 111m depth. Boreholes VA24-188 and VA24-190 are in progress and aim to potentially upgrade the link between Valencia West and the Valencia Main to the Indicated resource class.
Valencia Satellite Exploration Drilling
The Valencia satellite exploration drill program comprises several targets adjacent to or in the vicinity of the Valencia Main deposit. The programme aims to identify additional resource potential. Results of exploration drilling at the Jolie Zone; Valencia North and Bundu targets; and infill drilling at the Valencia East deposit were reported on August 14th 2024. Exploration drilling at the Jolie Zone target is in progress (Figure 1).
The Jolie Zone mineralisation occurs about 600 m north of the Valencia Main deposit (Figure 1). Historic drilling, comprising of five diamond holes and one percussion hole, intersected mineralisation within Jolie Zone-1, with high grade lenses of poor continuity along strike. Drilling of 12 holes, all completed during 2024, identified a thicker and more continuous mineralised intrusion (“Jolie Zone-2”), about 50m to the SE, and sub-parallel to Zone-1 (Figures 1 and 4). Both these zones are open-ended along strike to the SW and at depth, with Zone-2 also open-ended to the NE. Results (Table 1) include 308 ppm eU3O8 over 23m from 18m to 41m depth (Zone-1 in drillhole VA24-061) and 166 ppm U3O8 over 74m from 57m to 131m depth (Zone-2 in drillhole VA24-099). The SW and depth extension is currently being tested by a further six drillholes, aiming to test the strike extension to 300m.
Overview map of the Valencia drill program as at 15 February 2025 where all collars are for the current programme Feb 2024 to present.
Figure 1: Overview map of the Valencia drill program as at 15 February 2025 where all collars are for the current programme Feb 2024 to present.
Detailed overview of the Valencia Infill drilling programme as at 15 February 2025.
Figure 2: Detailed overview of the Valencia Infill drilling programme as at 15 February 2025.
Section through Valencia West (section width 80m showing drillhole intersections and resource blocks).
Figure 3: Section through Valencia West (section width 80m showing drillhole intersections and resource blocks).
Composite section through the Jolie Zone (section width 45m)
Figure 4: Composite section through the Jolie Zone (section width 45m)
Table 1: 2024 drill campaign; selected drillhole results (as of 15 February 2025); Widths are reported as drill hole lengths. True width is estimated to be approximately 75% of the downhole width. Infill Drilling is for Valencia Main and West
|
Target |
BHID |
From (m) |
To (m) |
Width (m) |
eU3O8 (ppm) |
Comments |
|
Jolie |
VA24-061 |
18 |
41 |
23 |
308 |
Zone 1 |
|
Jolie |
VA24-062 |
73 |
94 |
21 |
259 |
Zone 2 |
|
Jolie |
VA24-098 |
52 |
75 |
23 |
93 |
Zone 2 |
|
Jolie |
and: |
89 |
133 |
44 |
148 |
Zone 2 |
|
Jolie |
VA24-099 |
1 |
19 |
18 |
72 |
Zone 2 |
|
Jolie |
and: |
57 |
131 |
74 |
166 |
Zone 2 |
|
Jolie |
and: |
152 |
160 |
8 |
187 |
Zone 1 |
|
Jolie |
VA24-100 |
63 |
159 |
96 |
86 |
Zone 2 |
|
Valencia West |
VA24-069 |
74 |
99 |
25 |
223 |
Angled |
|
Valencia West |
VA24-073 |
109 |
145 |
36 |
222 |
Angled |
|
Valencia West |
and: |
168 |
182 |
14 |
276 |
Angled |
|
Valencia West |
VA24-083A |
157 |
215 |
58 |
240 |
Angled |
|
Valencia West |
VA24-189 |
14 |
27 |
13 |
220 |
Angled |
|
Valencia West |
and: |
89 |
111 |
22 |
200 |
Angled |
|
Infill Drilling |
VA24-PQ08 |
12 |
37.95 |
25.95 |
422 |
Vertical |
|
Infill Drilling |
and: |
37.95 |
65.33 |
27.38 |
613 |
Vertical |
|
Infill Drilling |
VA24-PQ12 |
29 |
122 |
93 |
344 |
Vertical |
|
Infill Drilling |
VA24-074 |
43 |
93 |
50 |
337 |
Vertical |
|
Infill Drilling |
VA24-077 |
10 |
70 |
60 |
227 |
Vertical |
|
Infill Drilling |
VA24-078 |
13 |
95 |
82 |
241 |
Vertical |
|
Infill Drilling |
VA24-079 |
28 |
104 |
76 |
243 |
Vertical |
|
Infill Drilling |
VA24-080 |
46 |
79 |
33 |
386 |
Vertical |
|
Infill Drilling |
VA24-085 |
6 |
70 |
64 |
230 |
Vertical |
|
Infill Drilling |
VA24-086 |
35 |
66 |
31 |
389 |
Vertical |
|
Infill Drilling |
VA24-089 |
1 |
63 |
62 |
252 |
Vertical |
|
Infill Drilling |
VA24-094 |
5 |
68 |
63 |
208 |
Vertical |
|
Infill Drilling |
VA24-097 |
18 |
74 |
56 |
221 |
Vertical |
|
Infill Drilling |
VA24-115 |
1 |
58 |
57 |
220 |
Vertical |
|
Infill Drilling |
VA24-119 |
5 |
59 |
54 |
232 |
Vertical |
|
Infill Drilling |
VA24-127 |
1 |
64 |
63 |
481 |
Vertical |
|
Infill Drilling |
VA24-128 |
1 |
61 |
60 |
228 |
Vertical |
|
Infill Drilling |
VA24-144 |
24 |
79 |
55 |
330 |
Angled |
|
Infill Drilling |
VA24-146 |
1 |
73 |
72 |
183 |
Angled |
|
Infill Drilling |
VA24-159 |
29 |
89 |
60 |
303 |
Angled |
|
Infill Drilling |
VA24-173 |
1 |
40 |
39 |
320 |
Vertical |
|
Infill Drilling |
VA24-174 |
1 |
75 |
74 |
271 |
Vertical |
|
Infill Drilling |
VA24-175 |
1 |
92 |
91 |
306 |
Angled |
|
Infill Drilling |
VA24-181 |
1 |
94 |
93 |
169 |
Angled |
|
Infill Drilling |
VA24-182 |
3 |
93 |
90 |
176 |
Angled |
|
Infill Drilling |
VA24-191 |
1 |
88 |
87 |
255 |
Angled |
|
|
|
|
|
|
|
|
QAQCRecent (2023-2024) Sampling and Assays
-
Samples were taken from the half cores and RC chips for geochemical assay guided by the routine downhole radiometric probe results and sent to Trace Elements Analysis Laboratories (Pty) Ltd (“TEA Labs”) at Swakopmund, Namibia for sample preparation and analyses by XRF. TEA Labs internal and external check tests were conducted by ICP analyses.
-
Forsys employs a QAQC program with Certified Reference Materials (CRMs), blanks, coarse duplicates, and pulp duplicates inserted into each batch of samples. The QAQC insert rate comprises 4 % CRMs using three CRM types with several, appropriate grades of U3O8; 4 % blanks and 8 % to 10 % duplicates. RC sample batches have three types of duplicates; a field duplicate split at the drill rig; a coarse duplicate split at prescribed intervals at the laboratory; and pulp duplicates, also split at the laboratory. Core samples have coarse and pulp duplicates split at the laboratory.
External Check Assay LaboratoryFour percent of the samples sent to TEA Labs are also submitted for check analyses to SGS Laboratories (“SGS”) in South Africa; SGS serves as the independent accredited laboratory to the programme. The sample results are further validated by comparison with the downhole radiometric scans.
Qualified Persons Statement for Mineral Resource The information in this release that relates to the Interim Drilling Results for the Norasa Project is based on information compiled or reviewed by Dr Guy Freemantle of The MSA Group (Pty) Ltd., Johannesburg, South Africa. The MSA Group are independent consultants to the Norasa Project, Namibia. Dr Freemantle holds a Bachelor of Science in Geology (2006) and Doctor of Philosophy in Geology (2017) both at the University of the Witwatersrand. He is a member of the Society of Economic Geologists (892905); a Fellow of the Geological Society of South Africa (965392); and is registered with SACNASP (Registration 117527). Dr Freemantle has practiced his profession continuously for 15 years and has sufficient experience and knowledge that is relevant to the style of mineralisation and type of deposits under consideration as well as to the activity that is being undertaken to fulfil requirements of a Qualified Person as per NI 43-101. Dr Freemantle consents to this release in the form and context in which it appears.
About Forsys Metals Corp.Forsys Metals Corp. (TSX: FSY, FSE: F2T, NSX: FSY) is an emerging uranium developer focused on advancing its wholly owned Norasa Uranium Project, located in the politically and uranium friendly jurisdiction of Namibia, Africa. The Norasa Uranium Project is comprised of the Valencia Uranium deposit (ML-149) and the nearby Namibplaas Uranium deposit (EPL-3638). Further information is available at the Company website www.forsysmetals.com
On behalf of the Board of Directors of Forsys Metals Corp. Richard Parkhouse, Investor Relations. For additional information please contact:
Pine van Wyk, Country Director, Forsysemail: pine@forsysmetals.com
Richard Parkhouse, Investor Relationsemail: rparkhouse@forsysmetals.com email: info@forsysmetals.com
Forward Looking Statement
Certain information contained in this press release constitutes "forward-looking information", within the meaning of Canadian legislation. Generally, these forward-looking statements can be identified by the use of forward-looking terminology such as "plans", "expects" or "does not expect", "is expected", "budget", "scheduled", "estimates", "forecasts", "intends", "anticipates" or "does not anticipate", or "believes", or variations of such words and phrases or state that certain actions, events or results "may", "could", "would", "might" or "will be taken", "occur", "be achieved" or "has the potential to". Forward looking statements contained in this press release are qualified in their entirety by the inherent risks and uncertainties surrounding future expectations. Among those factors which could cause actual results to differ materially are the following: market conditions and other risk factors listed from time to time in our reports filed with Canadian securities regulators on SEDAR+ at www.sedarplus.ca. The forward-looking statements included in this press release are made as of the date of this press release and Forsys Metals Corp disclaim any intention or obligation to update or revise any forward-looking statements, whether as a result of new information, future events or otherwise, except as expressly required by applicable securities legislation.
1 The Norasa Uranium Project (“Norasa“) is wholly owned by the Company’s 100% subsidiary Valencia Uranium (Pty) Ltd. (“Valencia Uranium”) and comprises the Valencia uranium deposits (held under ML-149) ("Valencia”) and the Namibplaas uranium deposit (under EPL-3638) (“Namibplaas”), located in the Erongo region of Namibia.
Photos accompanying this announcement are available at
https://www.globenewswire.com/NewsRoom/AttachmentNg/b7974a48-cf36-4bbb-a76f-056e415629b3
https://www.globenewswire.com/NewsRoom/AttachmentNg/c5556c7c-15ef-4706-ae9a-addfa2c1f87d
https://www.globenewswire.com/NewsRoom/AttachmentNg/ae9e944d-514a-495d-aaf4-a81e6bd61048
https://www.globenewswire.com/NewsRoom/AttachmentNg/fcf9917d-2dc0-45cc-b741-fd34c6821831
Forsys Metals (FSY.TO) on Wednesday reported further interim drilling results from its resource exte
VANCOUVER, BC, Jan. 31, 2025 /CNW/ – (TSX: LUN) (Nasdaq Stockholm: LUMI) Lundin Mining Corporation ("Lundin Mining" or the "Company") reports the following updated share capital and voting rights, in accordance with the Swedish Financial Instruments Trading Act:
The number of issued and outstanding shares of the Company has increased by 93,674,455 to 867,777,426 common shares with voting rights as of January 31, 2025. The increase in the number of issued and outstanding shares from January 1, 2025 to date is the result of shares issued in connection with the Filo Corp. acquisition (see press release dated January 15, 2025 entitled "Lundin Mining Completes Joint Acquisition of Filo with BHP and 50% Sale of Josemaria to Form Vicuña Corp."), and the exercise of employee stock options or the vesting of employee share units, offset by any share buy backs completed under the normal course issuer bid.
About Lundin Mining
Lundin Mining is a diversified Canadian base metals mining company with operations or projects in Argentina, Brazil, Chile, and the United States of America, primarily producing copper, gold and nickel. In December 2024 the Company announced the sale of its European assets to Boliden. The transaction is expected to close in mid-2025 subject to customary conditions and regulatory approvals.
The information in this release is subject to the disclosure requirements of Lundin Mining under the Swedish Financial Instruments Trading Act. The information was submitted for publication, through the agency of the contact persons set out below on January 31, 2025 at 14:30 Pacific Time.
Lundin Mining Announces Updated Share Capital and Voting Rights (CNW Group/Lundin Mining Corporation)
SOURCE Lundin Mining Corporation
Cision
View original content to download multimedia: http://www.newswire.ca/en/releases/archive/January2025/31/c8898.html
Usually, when one insider buys stock, it might not be a monumental event. But when multiple insiders are buying like they did in the case of Aura Energy Limited (ASX:AEE), that sends out a positive message to the company's shareholders.
While insider transactions are not the most important thing when it comes to long-term investing, we would consider it foolish to ignore insider transactions altogether.
View our latest analysis for Aura Energy
The Last 12 Months Of Insider Transactions At Aura Energy
Over the last year, we can see that the biggest insider purchase was by MD, CEO & Director Andrew Grove for AU$100k worth of shares, at about AU$0.18 per share. So it's clear an insider wanted to buy, even at a higher price than the current share price (being AU$0.14). While their view may have changed since the purchase was made, this does at least suggest they have had confidence in the company's future. In our view, the price an insider pays for shares is very important. Generally speaking, it catches our eye when insiders have purchased shares at above current prices, as it suggests they believed the shares were worth buying, even at a higher price.
Aura Energy insiders may have bought shares in the last year, but they didn't sell any. The chart below shows insider transactions (by companies and individuals) over the last year. By clicking on the graph below, you can see the precise details of each insider transaction!
ASX:AEE Insider Trading Volume January 10th 2025
There are plenty of other companies that have insiders buying up shares. You probably do not want to miss this free list of undervalued small cap companies that insiders are buying.
Does Aura Energy Boast High Insider Ownership?
For a common shareholder, it is worth checking how many shares are held by company insiders. I reckon it's a good sign if insiders own a significant number of shares in the company. From our data, it seems that Aura Energy insiders own 11% of the company, worth about AU$13m. We do note, however, it is possible insiders have an indirect interest through a private company or other corporate structure. Whilst better than nothing, we're not overly impressed by these holdings.
What Might The Insider Transactions At Aura Energy Tell Us?
The fact that there have been no Aura Energy insider transactions recently certainly doesn't bother us. On a brighter note, the transactions over the last year are encouraging. Insiders do have a stake in Aura Energy and their transactions don't cause us concern. While it's good to be aware of what's going on with the insider's ownership and transactions, we make sure to also consider what risks are facing a stock before making any investment decision. To help with this, we've discovered 4 warning signs (2 make us uncomfortable!) that you ought to be aware of before buying any shares in Aura Energy.
Of course Aura Energy may not be the best stock to buy. So you may wish to see this free collection of high quality companies.
For the purposes of this article, insiders are those individuals who report their transactions to the relevant regulatory body. We currently account for open market transactions and private dispositions of direct interests only, but not derivative transactions or indirect interests.
Have feedback on this article? Concerned about the content? Get in touch with us directly. Alternatively, email editorial-team (at) simplywallst.com.This article by Simply Wall St is general in nature. We provide commentary based on historical data and analyst forecasts only using an unbiased methodology and our articles are not intended to be financial advice. It does not constitute a recommendation to buy or sell any stock, and does not take account of your objectives, or your financial situation. We aim to bring you long-term focused analysis driven by fundamental data. Note that our analysis may not factor in the latest price-sensitive company announcements or qualitative material. Simply Wall St has no position in any stocks mentioned.
Forsys Metals Corp
TORONTO, Jan. 06, 2025 (GLOBE NEWSWIRE) — Forsys Metals Corp. (TSX: FSY) (FSE: F2T) (NSX: FSY) (“Forsys” or the “Company”) is pleased to announce that its wholly-owned subsidiary Valencia Uranium (Pty) (“Valencia Uranium”) has finalised an agreement with Namibplaas Guestfarm and Tours (Proprietory) Limited (the “Farm Owner”) for the purchase of Portion-1 of farm Namibplaas No. 93 (the “Property”), at the Company’s Norasa Uranium project (“Norasa1”).
The Property hosts the Namibplaas uranium deposit (“Namibplaas”), under Exclusive Prospecting Licence (EPL-3638) The purchase of this Property is the final outcome of lengthy negotiations for the economic terms for access rights with the previous farm owner.
EPL-3638 covers a total surface area of 1,266 ha; with approximately 93 % (1,179 ha) located on the Property, which measures approximately 6,700 hectares (ha). Figure-1 (below) provides an overview of the Property, the Company’s mineral licence holding and applications, exclusive use area and planned and existing linear infrastructure.
EPL-3638 is situated less than 3 km to the northeast of the Valencia deposit (ML-149) and is accessed via a newly constructed industrial grade road from the B2 highway to the Valencia project site followed by a track suitable for 4×4 vehicles.
For detailed information on the recent updated Mineral Resource Estimate for Norasa, please refer to the Company’s news release dated 14 May 2024. Planning is underway for diamond and reverse circulation drilling designed to expand and upgrade the resource within the Namibplaas main deposit and from adjacent targets.
The Company has also applied for additional exclusive prospecting ground, EPL-10501 and EPL-8633. Approximately 237 ha, (42 %) of the EPL-10501 application area and 239 ha,(5%) of EPL- 9865 are are also located on the Property. For further detail, see Figure-1 below.
_______________________________________________
1 The Norasa Uranium Project (“Norasa“) is wholly owned by the Company’s 100% subsidiary Valencia Uranium (Pty) Ltd. (“Valencia Uranium”) and comprises the Valencia uranium deposits (held under ML-149) ("Valencia”) and the Namibplaas uranium deposit (under EPL-3638) (“Namibplaas”), located in the Erongo region of Namibia.
On farm Valencia No.122, ML-149, the company’s interest including its planned access works area for the mine’s infrastructure, are covered by an exclusive use contract over approximately 3,346 ha. The contract with this land owner is valid for the duration of ML-149, which extends until 2033.
Figure-1: Overview map showing the transaction property, Valencia mineral licence holdings and applications and linear infrastructure
Figure-1: Overview map showing the transaction property, Valencia mineral licence holdings and applications and linear infrastructure
Key Terms of the Land Purchase Agreement
Under the terms of the agreement Valencia Uranium will pay the Farm Owner an aggregate amount of 24 million Namibia Dollars (NAD) (approximately US$1,282k). An initial payment of NAD 7 million (approximately US$374k) will be made once all conditions have been met, with the remaining NAD 17 million (approximately US$908k) payable in monthly installments over a ten year period, accruing interest at Namibia’s prime lending rate 2 plus 2% per annum from the date of title transfer following regulatory approval. The signing of the agreement was 17th December 2024.
The transaction remains subject to the receipt of all regulatory approvals, including, without limitation, the approval of the Ministry of Agriculture and the Ministry of Lands and Resettlement.
Mark Frewin, Forsys’ CEO commented: “The acquisition of farm Namibplaas, Portion-1 means that the Company now has unfettered access to the Namibplaas licence area, adding significant value and flexibility to our mine development strategy. The plan is to prioritize a drill program on Namibplaas as soon as possible and continue to expand and upgrade the total uranium resources to support the overall Norasa mine development.”
2 10.75% per Bank of Namibia______________________________________________________________________________________________________
About Forsys Metals Corp.Forsys Metals Corp. (TSX: FSY, FSE: F2T, NSX: FSY) is an emerging uranium developer focused on advancing its wholly owned Norasa Uranium Project, located in the politically and uranium friendly jurisdiction of Namibia, Africa. The Norasa Uranium Project is comprised of the Valencia Uranium deposit (ML-149) and the nearby Namibplaas Uranium deposit (EPL-3638). Further information is available at the Company website www.forsysmetals.com.
On behalf of the Board of Directors of Forsys Metals Corp. Richard Parkhouse, Investor Relations. For additional information please contact:
Richard Parkhouse, Investor Relationsemail: rparkhouse@forsysmetals.com email: info@forsysmetals.com
Forward Looking Statement
Certain information contained in this press release constitutes "forward-looking information", within the meaning of Canadian legislation. Generally, these forward-looking statements can be identified by the use of forward-looking terminology such as "plans", "expects" or "does not expect", "is expected", "budget", "scheduled", "estimates", "forecasts", "intends", "anticipates" or "does not anticipate", or "believes", or variations of such words and phrases or state that certain actions, events or results "may", "could", "would", "might" or "will be taken", "occur", "be achieved" or "has the potential to". Forward looking statements contained in this press release are qualified in their entirety by the inherent risks and uncertainties surrounding future expectations. Among those factors which could cause actual results to differ materially are the following: market conditions and other risk factors listed from time to time in our reports filed with Canadian securities regulators on SEDAR+ at www.sedarplus.ca. The forward-looking statements included in this press release are made as of the date of this press release and Forsys Metals Corp disclaim any intention or obligation to update or revise any forward-looking statements, whether as a result of new information, future events or otherwise, except as expressly required by applicable securities legislation.
A photo accompanying this announcement is available at https://www.globenewswire.com/NewsRoom/AttachmentNg/cbe5c51e-66f7-4089-8b48-a122ccaf1f04
The Canadian market remained flat over the last week but has shown a robust 21% increase over the past year, with earnings expected to grow by 16% annually. Investing in penny stocks—often associated with smaller or newer companies—can still offer intriguing growth opportunities, especially when these stocks are backed by strong financial health. Let’s take a closer look at several penny stocks that combine balance sheet strength with long-term potential, making them noteworthy options for investors seeking promising prospects.
Top 10 Penny Stocks In Canada
|
Name |
Share Price |
Market Cap |
Financial Health Rating |
|
Alvopetro Energy (TSXV:ALV) |
CA$4.74 |
CA$173.17M |
★★★★★★ |
|
Amerigo Resources (TSX:ARG) |
CA$1.71 |
CA$275.23M |
★★★★★☆ |
|
Pulse Seismic (TSX:PSD) |
CA$2.30 |
CA$117.56M |
★★★★★★ |
|
Findev (TSXV:FDI) |
CA$0.42 |
CA$12.03M |
★★★★★☆ |
|
Mandalay Resources (TSX:MND) |
CA$3.39 |
CA$311.07M |
★★★★★★ |
|
PetroTal (TSX:TAL) |
CA$0.64 |
CA$584.03M |
★★★★★★ |
|
Winshear Gold (TSXV:WINS) |
CA$0.18 |
CA$5.66M |
★★★★★★ |
|
Foraco International (TSX:FAR) |
CA$2.17 |
CA$214.74M |
★★★★★☆ |
|
East West Petroleum (TSXV:EW) |
CA$0.04 |
CA$3.62M |
★★★★★★ |
|
NamSys (TSXV:CTZ) |
CA$1.07 |
CA$28.74M |
★★★★★★ |
Click here to see the full list of 964 stocks from our TSX Penny Stocks screener.
Let’s dive into some prime choices out of the screener.
Simply Wall St Financial Health Rating: ★★★★★★
Overview: Avino Silver & Gold Mines Ltd. focuses on the acquisition, exploration, and development of mineral properties in Canada, with a market cap of CA$204.54 million.
Operations: Avino Silver & Gold Mines Ltd. has not reported any specific revenue segments.
Market Cap: CA$204.54M
Avino Silver & Gold Mines Ltd., with a market cap of CA$204.54 million, has demonstrated strong financial health, as its operating cash flow significantly covers its debt, and it maintains more cash than total debt. The company reported substantial earnings growth of 180.1% over the past year, outpacing the industry average. Recent results show improved profitability with net income rising to US$1.17 million for Q3 2024 from a loss in the previous year, alongside increased production metrics in copper and silver output. However, shareholder dilution occurred recently with an increase in shares outstanding by 7.7%.
TSX:ASM Debt to Equity History and Analysis as at Nov 2024Dundee
Simply Wall St Financial Health Rating: ★★★★☆☆
Overview: Dundee Corporation is a publicly owned investment manager with a market cap of CA$157.33 million.
Operations: The company has not reported any revenue segments.
Market Cap: CA$157.33M
Dundee Corporation, with a market cap of CA$157.33 million, has shown significant financial improvement. It recently became profitable, reporting net income of CA$7.25 million for Q3 2024 compared to a loss last year. Despite limited revenue (CA$1.72 million for the quarter), its return on equity is high at 22.2%, and it maintains more cash than total debt, indicating strong balance sheet management. The company completed preferred stock buybacks, reflecting strategic capital management without shareholder dilution over the past year. However, negative operating cash flow suggests challenges in covering debt through operations alone remain.
-
Click here to discover the nuances of Dundee with our detailed analytical financial health report.
-
Explore historical data to track Dundee’s performance over time in our past results report.
TSX:DC.A Financial Position Analysis as at Nov 2024Forsys Metals
Simply Wall St Financial Health Rating: ★★★★☆☆
Overview: Forsys Metals Corp., with a market cap of CA$133.87 million, is involved in the acquisition, exploration, and development of mineral properties in Africa through its subsidiaries.
Operations: Forsys Metals Corp. currently does not report any revenue segments.
Market Cap: CA$133.87M
Forsys Metals Corp., with a market cap of CA$133.87 million, remains pre-revenue and unprofitable, with no significant revenue streams reported. The company has managed to reduce its net loss in recent quarters, reporting a net loss of CA$0.51 million for Q3 2024 compared to CA$2.76 million the previous year. Despite having no long-term liabilities and being debt-free, Forsys faces financial challenges with less than one year of cash runway based on current free cash flow trends. Recent insider selling over the past three months may indicate potential concerns among stakeholders regarding future prospects.
TSX:FSY Debt to Equity History and Analysis as at Nov 2024Seize The Opportunity
-
Embark on your investment journey to our 964 TSX Penny Stocks selection here.
-
Already own these companies? Link your portfolio to Simply Wall St and get alerts on any new warning signs to your stocks.
-
Discover a world of investment opportunities with Simply Wall St’s free app and access unparalleled stock analysis across all markets.
Ready To Venture Into Other Investment Styles?
-
Explore high-performing small cap companies that haven’t yet garnered significant analyst attention.
-
Jump on the AI train with fast growing tech companies forging a new era of innovation.
-
Find companies with promising cash flow potential yet trading below their fair value.
This article by Simply Wall St is general in nature. We provide commentary based on historical data and analyst forecasts only using an unbiased methodology and our articles are not intended to be financial advice. It does not constitute a recommendation to buy or sell any stock, and does not take account of your objectives, or your financial situation. We aim to bring you long-term focused analysis driven by fundamental data. Note that our analysis may not factor in the latest price-sensitive company announcements or qualitative material. Simply Wall St has no position in any stocks mentioned.
Companies discussed in this article include TSX:ASM TSX:DC.A and TSX:FSY.
Have feedback on this article? Concerned about the content? Get in touch with us directly. Alternatively, email editorial-team@simplywallst.com
The Canadian market has seen a notable increase, climbing 1.4% over the last week and rising 28% over the past year, with earnings expected to grow by 16% annually. For those interested in investing in smaller or newer companies, penny stocks—despite their somewhat outdated name—can still offer surprising value when backed by strong financials. This article will explore several penny stocks that stand out for their financial strength and potential for long-term growth.
Top 10 Penny Stocks In Canada
|
Name |
Share Price |
Market Cap |
Financial Health Rating |
|
PetroTal (TSX:TAL) |
CA$0.68 |
CA$620.88M |
★★★★★★ |
|
Findev (TSXV:FDI) |
CA$0.41 |
CA$11.75M |
★★★★★☆ |
|
Winshear Gold (TSXV:WINS) |
CA$0.165 |
CA$4.4M |
★★★★★★ |
|
Mandalay Resources (TSX:MND) |
CA$3.24 |
CA$297.04M |
★★★★★★ |
|
Pulse Seismic (TSX:PSD) |
CA$2.29 |
CA$119.71M |
★★★★★★ |
|
Amerigo Resources (TSX:ARG) |
CA$1.80 |
CA$303.72M |
★★★★★☆ |
|
Foraco International (TSX:FAR) |
CA$2.40 |
CA$221.84M |
★★★★★☆ |
|
East West Petroleum (TSXV:EW) |
CA$0.035 |
CA$3.17M |
★★★★★★ |
|
Newport Exploration (TSXV:NWX) |
CA$0.115 |
CA$12.14M |
★★★★★★ |
|
NamSys (TSXV:CTZ) |
CA$1.11 |
CA$30.89M |
★★★★★★ |
Click here to see the full list of 947 stocks from our TSX Penny Stocks screener.
Underneath we present a selection of stocks filtered out by our screen.
Simply Wall St Financial Health Rating: ★★★★☆☆
Overview: Dundee Corporation is a publicly owned investment manager with a market cap of CA$150.99 million.
Operations: The company’s revenue is primarily derived from its Mining Services segment, which generated CA$3.72 million, along with contributions from Corporate and Others amounting to CA$4.00 million.
Market Cap: CA$150.99M
Dundee Corporation, with a market cap of CA$150.99 million, primarily derives its revenue from its Mining Services segment. The company has recently completed the redemption of preferred shares, which may improve financial flexibility. Despite lacking significant revenue streams (CA$6 million), Dundee reported substantial net income gains due to large one-off items impacting results. While the company’s debt levels are satisfactory and short-term assets cover liabilities comfortably, operating cash flow remains negative. The management and board are experienced, but the Return on Equity is low at 9.3%. Its Price-To-Earnings ratio suggests it might be undervalued compared to the broader Canadian market.
TSX:DC.A Financial Position Analysis as at Oct 2024Eloro Resources
Simply Wall St Financial Health Rating: ★★★★★★
Overview: Eloro Resources Ltd. is involved in the exploration and development of mineral properties in Bolivia and Peru, with a market cap of CA$93.14 million.
Operations: Eloro Resources Ltd. currently does not report any revenue segments.
Market Cap: CA$93.14M
Eloro Resources Ltd., with a market cap of CA$93.14 million, focuses on mineral exploration in Bolivia and Peru but remains pre-revenue. Recent developments include a private placement to raise CA$2.7 million, potentially extending its cash runway beyond the current seven months forecasted under free cash flow estimates. The company is debt-free and has sufficient short-term assets to cover liabilities, though it faces ongoing losses without profitability expected in the near term. Management changes aim to bolster strategic direction as Eloro advances its Iska Iska project, emphasizing increased drilling density for better resource definition and potential economic viability assessments.
-
Jump into the full analysis health report here for a deeper understanding of Eloro Resources.
-
Assess Eloro Resources’ future earnings estimates with our detailed growth reports.
TSX:ELO Debt to Equity History and Analysis as at Oct 2024Forsys Metals
Simply Wall St Financial Health Rating: ★★★★☆☆
Overview: Forsys Metals Corp., with a market cap of CA$147.65 million, is involved in the acquisition, exploration, and development of mineral properties in Africa through its subsidiaries.
Operations: Forsys Metals Corp. currently does not have any reported revenue segments.
Market Cap: CA$147.65M
Forsys Metals Corp., with a market cap of CA$147.65 million, is pre-revenue and engaged in mineral exploration in Africa. The company recently reported significant interim drilling results from its Norasa Uranium project, indicating potential resource expansion at the Valencia site. Despite having no long-term liabilities and being debt-free, Forsys faces financial challenges with less than a year of cash runway based on current free cash flow trends. Additionally, there has been significant insider selling over the past three months. Recent management changes include the appointment of Pierfranco Malpenga to strengthen strategic oversight.
TSX:FSY Financial Position Analysis as at Oct 2024Make It Happen
-
Jump into our full catalog of 947 TSX Penny Stocks here.
-
Invested in any of these stocks? Simplify your portfolio management with Simply Wall St and stay ahead with our alerts for any critical updates on your stocks.
-
Take control of your financial future using Simply Wall St, offering free, in-depth knowledge of international markets to every investor.
Looking For Alternative Opportunities?
-
Explore high-performing small cap companies that haven’t yet garnered significant analyst attention.
-
Jump on the AI train with fast growing tech companies forging a new era of innovation.
-
Find companies with promising cash flow potential yet trading below their fair value.
This article by Simply Wall St is general in nature. We provide commentary based on historical data and analyst forecasts only using an unbiased methodology and our articles are not intended to be financial advice. It does not constitute a recommendation to buy or sell any stock, and does not take account of your objectives, or your financial situation. We aim to bring you long-term focused analysis driven by fundamental data. Note that our analysis may not factor in the latest price-sensitive company announcements or qualitative material. Simply Wall St has no position in any stocks mentioned.
Companies discussed in this article include TSX:DC.A TSX:ELO and TSX:FSY.
Have feedback on this article? Concerned about the content? Get in touch with us directly. Alternatively, email editorial-team@simplywallst.com
Key Insights
-
Significantly high institutional ownership implies Aura Energy's stock price is sensitive to their trading actions
-
The top 6 shareholders own 52% of the company
-
Using data from company's past performance alongside ownership research, one can better assess the future performance of a company
Every investor in Aura Energy Limited (ASX:AEE) should be aware of the most powerful shareholder groups. The group holding the most number of shares in the company, around 52% to be precise, is institutions. Put another way, the group faces the maximum upside potential (or downside risk).
Because institutional owners have a huge pool of resources and liquidity, their investing decisions tend to carry a great deal of weight, especially with individual investors. As a result, a sizeable amount of institutional money invested in a firm is generally viewed as a positive attribute.
Let's delve deeper into each type of owner of Aura Energy, beginning with the chart below.
View our latest analysis for Aura Energy
ownership-breakdownWhat Does The Institutional Ownership Tell Us About Aura Energy?
Institutions typically measure themselves against a benchmark when reporting to their own investors, so they often become more enthusiastic about a stock once it's included in a major index. We would expect most companies to have some institutions on the register, especially if they are growing.
We can see that Aura Energy does have institutional investors; and they hold a good portion of the company's stock. This can indicate that the company has a certain degree of credibility in the investment community. However, it is best to be wary of relying on the supposed validation that comes with institutional investors. They too, get it wrong sometimes. When multiple institutions own a stock, there's always a risk that they are in a 'crowded trade'. When such a trade goes wrong, multiple parties may compete to sell stock fast. This risk is higher in a company without a history of growth. You can see Aura Energy's historic earnings and revenue below, but keep in mind there's always more to the story.
Investors should note that institutions actually own more than half the company, so they can collectively wield significant power. Aura Energy is not owned by hedge funds. Macquarie Group, Ltd., Banking & Securities Investments is currently the company's largest shareholder with 14% of shares outstanding. The Lind Partners, LLC is the second largest shareholder owning 8.4% of common stock, and Asean Investment Management holds about 8.1% of the company stock.
We did some more digging and found that 6 of the top shareholders account for roughly 52% of the register, implying that along with larger shareholders, there are a few smaller shareholders, thereby balancing out each others interests somewhat.
While it makes sense to study institutional ownership data for a company, it also makes sense to study analyst sentiments to know which way the wind is blowing. While there is some analyst coverage, the company is probably not widely covered. So it could gain more attention, down the track.
Insider Ownership Of Aura Energy
The definition of an insider can differ slightly between different countries, but members of the board of directors always count. Company management run the business, but the CEO will answer to the board, even if he or she is a member of it.
Insider ownership is positive when it signals leadership are thinking like the true owners of the company. However, high insider ownership can also give immense power to a small group within the company. This can be negative in some circumstances.
Shareholders would probably be interested to learn that insiders own shares in Aura Energy Limited. As individuals, the insiders collectively own AU$14m worth of the AU$157m company. This shows at least some alignment, but we usually like to see larger insider holdings. You can click here to see if those insiders have been buying or selling.
General Public Ownership
The general public– including retail investors — own 32% stake in the company, and hence can't easily be ignored. While this size of ownership may not be enough to sway a policy decision in their favour, they can still make a collective impact on company policies.
Private Company Ownership
We can see that Private Companies own 7.1%, of the shares on issue. It's hard to draw any conclusions from this fact alone, so its worth looking into who owns those private companies. Sometimes insiders or other related parties have an interest in shares in a public company through a separate private company.
Next Steps:
It's always worth thinking about the different groups who own shares in a company. But to understand Aura Energy better, we need to consider many other factors. For example, we've discovered 3 warning signs for Aura Energy (2 don't sit too well with us!) that you should be aware of before investing here.
If you are like me, you may want to think about whether this company will grow or shrink. Luckily, you can check this free report showing analyst forecasts for its future.
NB: Figures in this article are calculated using data from the last twelve months, which refer to the 12-month period ending on the last date of the month the financial statement is dated. This may not be consistent with full year annual report figures.
Have feedback on this article? Concerned about the content? Get in touch with us directly. Alternatively, email editorial-team (at) simplywallst.com.This article by Simply Wall St is general in nature. We provide commentary based on historical data and analyst forecasts only using an unbiased methodology and our articles are not intended to be financial advice. It does not constitute a recommendation to buy or sell any stock, and does not take account of your objectives, or your financial situation. We aim to bring you long-term focused analysis driven by fundamental data. Note that our analysis may not factor in the latest price-sensitive company announcements or qualitative material. Simply Wall St has no position in any stocks mentioned.
As every investor would know, not every swing hits the sweet spot. But really bad investments should be rare. So consider, for a moment, the misfortune of Energy Resources of Australia Ltd (ASX:ERA) investors who have held the stock for three years as it declined a whopping 99%. That would certainly shake our confidence in the decision to own the stock. And the ride hasn't got any smoother in recent times over the last year, with the price 88% lower in that time. Shareholders have had an even rougher run lately, with the share price down 89% in the last 90 days. While a drop like that is definitely a body blow, money isn't as important as health and happiness.
Given the past week has been tough on shareholders, let's investigate the fundamentals and see what we can learn.
Check out our latest analysis for Energy Resources of Australia
Because Energy Resources of Australia made a loss in the last twelve months, we think the market is probably more focussed on revenue and revenue growth, at least for now. When a company doesn't make profits, we'd generally hope to see good revenue growth. As you can imagine, fast revenue growth, when maintained, often leads to fast profit growth.
Over the last three years, Energy Resources of Australia's revenue dropped 65% per year. That's definitely a weaker result than most pre-profit companies report. The swift share price decline at an annual compound rate of 26%, reflects this weak fundamental performance. We prefer leave it to clowns to try to catch falling knives, like this stock. There is a good reason that investors often describe buying a sharply falling stock price as 'trying to catch a falling knife'. Think about it.
You can see how earnings and revenue have changed over time in the image below (click on the chart to see the exact values).
This free interactive report on Energy Resources of Australia's balance sheet strength is a great place to start, if you want to investigate the stock further.
What About The Total Shareholder Return (TSR)?
Investors should note that there's a difference between Energy Resources of Australia's total shareholder return (TSR) and its share price change, which we've covered above. The TSR attempts to capture the value of dividends (as if they were reinvested) as well as any spin-offs or discounted capital raisings offered to shareholders. Energy Resources of Australia hasn't been paying dividends, but its TSR of -87% exceeds its share price return of -99%, implying it has either spun-off a business, or raised capital at a discount; thereby providing additional value to shareholders.
A Different Perspective
Investors in Energy Resources of Australia had a tough year, with a total loss of 56%, against a market gain of about 25%. Even the share prices of good stocks drop sometimes, but we want to see improvements in the fundamental metrics of a business, before getting too interested. Regrettably, last year's performance caps off a bad run, with the shareholders facing a total loss of 11% per year over five years. We realise that Baron Rothschild has said investors should "buy when there is blood on the streets", but we caution that investors should first be sure they are buying a high quality business. I find it very interesting to look at share price over the long term as a proxy for business performance. But to truly gain insight, we need to consider other information, too. Take risks, for example – Energy Resources of Australia has 4 warning signs (and 3 which are concerning) we think you should know about.
We will like Energy Resources of Australia better if we see some big insider buys. While we wait, check out this free list of undervalued stocks (mostly small caps) with considerable, recent, insider buying.
Please note, the market returns quoted in this article reflect the market weighted average returns of stocks that currently trade on Australian exchanges.
Have feedback on this article? Concerned about the content? Get in touch with us directly. Alternatively, email editorial-team (at) simplywallst.com.This article by Simply Wall St is general in nature. We provide commentary based on historical data and analyst forecasts only using an unbiased methodology and our articles are not intended to be financial advice. It does not constitute a recommendation to buy or sell any stock, and does not take account of your objectives, or your financial situation. We aim to bring you long-term focused analysis driven by fundamental data. Note that our analysis may not factor in the latest price-sensitive company announcements or qualitative material. Simply Wall St has no position in any stocks mentioned.
Key Insights
-
Given the large stake in the stock by institutions, Forsys Metals' stock price might be vulnerable to their trading decisions
-
A total of 3 investors have a majority stake in the company with 55% ownership
-
Ownership research, combined with past performance data can help provide a good understanding of opportunities in a stock
To get a sense of who is truly in control of Forsys Metals Corp. (TSE:FSY), it is important to understand the ownership structure of the business. With 48% stake, hedge funds possess the maximum shares in the company. In other words, the group stands to gain the most (or lose the most) from their investment into the company.
And as as result, hedge funds investors reaped the most rewards after the company's stock price gained 19% last week. The gains from last week would have further boosted the one-year return to shareholders which currently stand at 19%.
Let's take a closer look to see what the different types of shareholders can tell us about Forsys Metals.
See our latest analysis for Forsys Metals
ownership-breakdownWhat Does The Institutional Ownership Tell Us About Forsys Metals?
Institutions typically measure themselves against a benchmark when reporting to their own investors, so they often become more enthusiastic about a stock once it's included in a major index. We would expect most companies to have some institutions on the register, especially if they are growing.
As you can see, institutional investors have a fair amount of stake in Forsys Metals. This implies the analysts working for those institutions have looked at the stock and they like it. But just like anyone else, they could be wrong. It is not uncommon to see a big share price drop if two large institutional investors try to sell out of a stock at the same time. So it is worth checking the past earnings trajectory of Forsys Metals, (below). Of course, keep in mind that there are other factors to consider, too.
Our data indicates that hedge funds own 48% of Forsys Metals. That's interesting, because hedge funds can be quite active and activist. Many look for medium term catalysts that will drive the share price higher. Looking at our data, we can see that the largest shareholder is Leo Fund Managers Limited with 31% of shares outstanding. MM Asset Management Inc is the second largest shareholder owning 17% of common stock, and ALPS Advisors, Inc. holds about 7.3% of the company stock. Additionally, the company's CEO Mark Frewin directly holds 0.6% of the total shares outstanding.
To make our study more interesting, we found that the top 3 shareholders have a majority ownership in the company, meaning that they are powerful enough to influence the decisions of the company.
Researching institutional ownership is a good way to gauge and filter a stock's expected performance. The same can be achieved by studying analyst sentiments. There is a little analyst coverage of the stock, but not much. So there is room for it to gain more coverage.
Insider Ownership Of Forsys Metals
While the precise definition of an insider can be subjective, almost everyone considers board members to be insiders. Management ultimately answers to the board. However, it is not uncommon for managers to be executive board members, especially if they are a founder or the CEO.
Insider ownership is positive when it signals leadership are thinking like the true owners of the company. However, high insider ownership can also give immense power to a small group within the company. This can be negative in some circumstances.
Our most recent data indicates that insiders own less than 1% of Forsys Metals Corp.. It has a market capitalization of just CA$148m, and the board has only CA$1.4m worth of shares in their own names. We generally like to see a board more invested. However it might be worth checking if those insiders have been buying.
General Public Ownership
The general public– including retail investors — own 37% stake in the company, and hence can't easily be ignored. This size of ownership, while considerable, may not be enough to change company policy if the decision is not in sync with other large shareholders.
Next Steps:
While it is well worth considering the different groups that own a company, there are other factors that are even more important. To that end, you should learn about the 5 warning signs we've spotted with Forsys Metals (including 3 which are significant) .
If you are like me, you may want to think about whether this company will grow or shrink. Luckily, you can check this free report showing analyst forecasts for its future.
NB: Figures in this article are calculated using data from the last twelve months, which refer to the 12-month period ending on the last date of the month the financial statement is dated. This may not be consistent with full year annual report figures.
Have feedback on this article? Concerned about the content? Get in touch with us directly. Alternatively, email editorial-team (at) simplywallst.com.This article by Simply Wall St is general in nature. We provide commentary based on historical data and analyst forecasts only using an unbiased methodology and our articles are not intended to be financial advice. It does not constitute a recommendation to buy or sell any stock, and does not take account of your objectives, or your financial situation. We aim to bring you long-term focused analysis driven by fundamental data. Note that our analysis may not factor in the latest price-sensitive company announcements or qualitative material. Simply Wall St has no position in any stocks mentioned.
Forsys Metals Corp
TORONTO, Sept. 04, 2024 (GLOBE NEWSWIRE) — Forsys Metals Corp. (TSX: FSY) (FSE: F2T) (NSX: FSY) (“Forsys” or the “Company”) is pleased to announce the appointment of Pierfranco Malpenga as a member of the Board of Directors of the Company, effective immediately.
Pierfranco has over 25 years experience in finance, in particular as an Investment Manager and Advisor. He has held various roles as CIO and Member of the Investment Committee of asset management companies and family offices. He began his career at Mediobanca and worked for more than 8 years at Goldman Sachs in their equity division. Pierfranco graduated cum laude with a degree in Economics from Bocconi University in Milan.
’We are pleased to welcome Mr. Malpenga to our Board”, said Forsys Chairman Mr. Martin Rowley, “He brings valuable knowledge and experience in all aspects of the capital markets which will be beneficial to the Company as it continues to advance its Norasa Uranium Project.”
About Forsys Metals Corp.
Forsys Metals Corp. (TSX: FSY, FSE: F2T, NSX: FSY) is an emerging uranium developer focused on advancing its wholly owned Norasa Uranium Project, located in the politically and uranium friendly jurisdiction of Namibia, Africa. The Norasa Uranium Project is comprised of the Valencia Uranium deposit (ML-149) and the nearby Namibplaas Uranium deposit (EPL-3638). Further information is available at the Company website www.forsysmetals.com
On behalf of the Board of Directors of Forsys Metals Corp. Richard Parkhouse, Director, Investor Relations. For additional information please contact:
Richard Parkhouse, Director, Investor Relationsemail: rparkhouse@forsysmetals.com email: info@forsysmetals.comphone : +44 7730493432
Nikolas Matysek, Communications Manager (Canada)email: nmatysek@forsysmetals.com
Forward Looking Statement
Certain information contained in this press release constitutes "forward-looking information", within the meaning of Canadian legislation. Generally, these forward-looking statements can be identified by the use of forward-looking terminology such as "plans", "expects" or "does not expect", "is expected", "budget", "scheduled", "estimates", "forecasts", "intends", "anticipates" or "does not anticipate", or "believes", or variations of such words and phrases or state that certain actions, events or results "may", "could", "would", "might" or "will be taken", "occur", "be achieved" or "has the potential to". Forward looking statements contained in this press release are qualified in their entirety by the inherent risks and uncertainties surrounding future expectations. Among those factors which could cause actual results to differ materially are the following: market conditions and other risk factors listed from time to time in our reports filed with Canadian securities regulators on SEDAR+ at www.sedarplus.ca. The forward-looking statements included in this press release are made as of the date of this press release and Forsys Metals Corp disclaim any intention or obligation to update or revise any forward-looking statements, whether as a result of new information, future events or otherwise, except as expressly required by applicable securities legislation.
Wallbridge Mining Company Limited
TORONTO, June 27, 2024 (GLOBE NEWSWIRE) — Wallbridge Mining Company Limited (TSX:WM, OTCQB:WLBMF) (“Wallbridge” or the “Company”) held its Annual Meeting of Shareholders (the “Meeting”) on June 26, 2024.
A total of 375,770,677 shares or 36.98% of the outstanding shares of the Company were represented at the Meeting. All of the matters submitted to the shareholders for approval as set out in the Company's notice of meeting and management information circular dated May 17, 2024 (“MIC”) were approved by the requisite majority of votes cast at the Meeting.
Voting on the following matters, as described in the MIC, were as follows:
To Set the Number of Directors at Seven (7)
|
Votes For |
Votes Against |
||
|
Number |
Percent |
Number |
Percent |
|
327,860,364 |
87.25% |
47,910,313 |
12.75% |
Election of Directors for the Ensuing Year
The following directors were elected until the next annual meeting of shareholders or until their successors are otherwise duly elected or appointed: Brian Penny, Janet Wilkinson, Michael Pesner, Anthony Makuch, Jeffery Snow, Danielle Giovenazzo and Brian Christie.
|
|
Votes For |
Votes Withheld |
||
|
|
Number |
Percent |
Number |
Percent |
|
Brian Penny |
307,933,143 |
87.647% |
43,398,663 |
12.353% |
|
Janet Wilkinson |
325,213,100 |
92.566% |
26,118,706 |
7.434% |
|
Michael Pesner |
289,152,398 |
82.302% |
62,179,408 |
17.698% |
|
Anthony Makuch |
343,276,508 |
97.707% |
8,055,298 |
2.293% |
|
Jeffery Snow |
345,531,527 |
98.349% |
5,800,279 |
1.651% |
|
Danielle Giovenazzo |
289,089,828 |
82.284% |
62,241,978 |
17.716% |
|
Brian Christie |
344,870,421 |
98.161% |
6,461,385 |
1.839% |
Appointment of KPMG LLP as Auditor of the Corporation for the ensuing year and authorizing the Directors to fix their remuneration
|
Votes For |
Votes Withheld |
||
|
Number |
Percent |
Number |
Percent |
|
373,296,489 |
99.342% |
2,474,188 |
0.658% |
About Wallbridge Mining
Wallbridge is focused on creating value through the exploration and sustainable development of gold projects along the Detour-Fenelon Gold Trend in Québec’s Northern Abitibi region while respecting the environment and communities where it operates.
Wallbridge’s most advanced projects, Fenelon Gold (“Fenelon”) and Martiniere Gold (“Martiniere”) incorporate a combined 3.05 million ounces of indicated gold resources and 2.35 million ounces of inferred gold resources. Fenelon and Martiniere are located within an 830 square kilometre exploration land package controlled by Wallbridge.
Wallbridge has reported a positive Preliminary Economic Assessment (“PEA”) at Fenelon that estimates average annual gold production of 212,000 ounces over 12 years.
Wallbridge also holds a 15.79% interest in the common shares of NorthX Nickel Corp. (formerly “Archer Exploration”) as a result of the sale of the Company’s portfolio of nickel assets in Ontario and Québec. For further information please visit the Company’s website at https://wallbridgemining.com/ or contact:
Wallbridge Mining Company Limited
|
Brian Penny, CPA, CMAChief Executive OfficerEmail: bpenny@wallbridgemining.comM: +1 416 716 8346 |
Victoria Vargas, B.Sc. (Hon.) Economics, MBACapital Markets AdvisorEmail: vvargas@wallbridgemining.comM: +1 289 242 3599 |
Cautionary Note Regarding Forward-Looking InformationThe information in this document may contain forward-looking statements or information (collectively, “FLI”) within the meaning of applicable Canadian securities legislation. FLI is based on expectations, estimates, projections and interpretations as at the date of this document.
All statements, other than statements of historical fact, included herein are FLI that involve various risks, assumptions, estimates and uncertainties. Generally, FLI can be identified by the use of statements that include, but are not limited to, words such as “seeks”, “believes”, “anticipates”, “plans”, “continues”, “budget”, “scheduled”, “estimates”, “expects”, “forecasts”, “intends”, “projects”, “predicts”, “proposes”, "potential", “targets” and variations of such words and phrases, or by statements that certain actions, events or results “may”, “will”, “could”, “would”, “should” or “might”, “be taken”, “occur” or “be achieved.”
FLI in this document may include, but is not limited to: statements regarding the results of the PEA; the potential future performance of the Common Shares; future drill results; the Company’s ability to convert inferred resources into measured and indicated resources; environmental matters; stakeholder engagement and relationships; parameters and methods used to estimate the MRE’s at Fenelon and Martiniere (collectively the “Deposits”); the prospects, if any, of the Deposits; future drilling at the Deposits; and the significance of historic exploration activities and results.
FLI is designed to help you understand management’s current views of its near- and longer-term prospects, and it may not be appropriate for other purposes. FLI by their nature are based on assumptions and involve known and unknown risks, uncertainties and other factors which may cause the actual results, performance, or achievements of the Company to be materially different from any future results, performance or achievements expressed or implied by such FLI. Although the FLI contained in this document is based upon what management believes, or believed at the time, to be reasonable assumptions, the Company cannot assure shareholders and prospective purchasers of securities of the Company that actual results will be consistent with such FLI, as there may be other factors that cause results not to be as anticipated, estimated or intended, and neither the Company nor any other person assumes responsibility for the accuracy and completeness of any such FLI. Except as required by law, the Company does not undertake, and assumes no obligation, to update or revise any such FLI contained in this document to reflect new events or circumstances. Unless otherwise noted, this document has been prepared based on information available as of the date of this document. Accordingly, you should not place undue reliance on the FLI, or information contained herein.
Furthermore, should one or more of the risks, uncertainties or other factors materialize, or should underlying assumptions prove incorrect, actual results may vary materially from those described in FLI.
Assumptions upon which FLI is based, without limitation, include: the results of exploration activities, the Company’s financial position and general economic conditions; the ability of exploration activities to accurately predict mineralization; the accuracy of geological modelling; the ability of the Company to complete further exploration activities; the legitimacy of title and property interests in the Deposits; the accuracy of key assumptions, parameters or methods used to estimate the MREs and in the PEA; the ability of the Company to obtain required approvals; geological, mining and exploration technical problems; failure of equipment or processes to operate as anticipated; the evolution of the global economic climate; metal prices; foreign exchange rates; environmental expectations; community and non-governmental actions; and, the Company’s ability to secure required funding. Risks and uncertainties about Wallbridge's business are discussed in the disclosure materials filed with the securities regulatory authorities in Canada, which are available at www.sedarplus.ca.
Cautionary Notes to United States InvestorsWallbridge prepares its disclosure in accordance with NI 43-101 which differs from the requirements of the U.S. Securities and Exchange Commission (the "SEC"). Terms relating to mineral properties, mineralization and estimates of mineral reserves and mineral resources and economic studies used herein are defined in accordance with NI 43-101 under the guidelines set out in CIM Definition Standards on Mineral Resources and Mineral Reserves, adopted by the Canadian Institute of Mining, Metallurgy and Petroleum Council on May 19, 2014, as amended. NI 43-101 differs significantly from the disclosure requirements of the SEC generally applicable to US companies. As such, the information presented herein concerning mineral properties, mineralization and estimates of mineral reserves and mineral resources may not be comparable to similar information made public by U.S. companies subject to the reporting and disclosure requirements under the U.S. federal securities laws and the rules and regulations thereunder.
Forsys Metals Corp
TORONTO, June 18, 2024 (GLOBE NEWSWIRE) — Forsys Metals Corp. (TSX: FSY) (FSE: F2T) (NSX: FSY) (“Forsys” or the “Company”)
Forsys is pleased to be able to release the results of its metallurgical column leaching test work for its Norasa Uranium project (“Norasa Project”1) together with details of its work plan for further optimising heap leach conditions and ore-sorting testwork.
Highlights
-
Completed metallurgical test work supports utilizing heap leaching to recover uranium at Norasa.
-
A total of 16 metallurgical column leach tests have been completed. Various test conditions were assessed, covering initial scouting tests aimed at evaluating the impact of binder addition, higher irrigation rates and grind size on recoveries, leach kinetics and acid consumption.
-
Uranium extraction rates of up to 87% (crushed with a conventional cone crusher, average of solids and solution based recovery) were achieved within a leach cycle time of 30 days or less. Sulphuric acid consumption ranged from 17 kg/t to 38 kg/t, depending on operational parameters. This recovery rate is on par with that achieved by other similar type operations with comparable ore type.
With the integration of higher irrigation rates, binder addition and grind size adjustments, there is an opportunity to optimise the baseline parameters, enhancing leach kinetics, reagent addition and recovery rates.
Extensive follow-up test work is planned. The primary areas of focus will include additional column tests aimed at assessing a high-pressure grinding rolls (“HPGR”) crushed product, acid consumption, irrigation rate and leach duration, with the objective of achieving an optimal uranium dissolution rate. Literature indicates between 4% to 6% increased metal extractions in heap leach operations with HPGR crushing.
As part of this follow-up test work, ore amenability for bulk ore sorting will be assessed, aimed at upgrading material prior to leaching to enhance recoveries and expedite cash flow and bolster project economics.
The Norasa Uranium Project (“Norasa Project“) is wholly-owned by the Company’s 100% subsidiary Valencia Uranium (Pty) Ltd. (“Valencia Uranium”) and comprises the Valencia uranium deposits (held under ML-149) ("Valencia”) and the Namibplaas uranium deposit (under EPL-3638, application for ML-251) (“Nambiplaas”), located in the Erongo region of Namibia.
Sample selection for metallurgical test work
Based on the mineral exploration and resource definition, with close to 300,000 metres of drilling executed for the Norasa Project and resulting mineral resource estimate and block models for Valencia, bulk samples for metallurgical test work were composed to account for the composition and spatial variance within each of the deposits.
For the bulk samples from the Valencia ore-body which underwent leaching test work at an accredited laboratory, SGS Laboratories in South Africa (“SGS”), a mix of different lithologies was selected from drill cores of a number of diamond holes, with the objective of representing the overall run-of-mine ore composition from this deposit.
From lithology modelling, it is evident that the main uranium hosting ore is alaskite, which is a rock of granitic composition. Limited uranium mineralisation occurs at the contact zones to the country rock, i.e. in schists, marbles and gneisses by intruding alaskite veins.
The bulk samples comprise fresh rock material from diamond drill cores. The initial leach test sample for phase 1 of the column leach testing was composed of alaskite material only. The second sample for phase 2 of the column leach testing was made up of ore and country rock types in proportions of approximately 72% of alaskite / granite lithologies, 13% of marble and calc-silicate rock and the remaining 15 % of different types of unmineralised schists and gneisses.
Metallurgical column leach testwork results
To date, leaching testwork at SGS comprised of bottle roll testing and column leach testing.
-
Phase 1: Six column leach tests (including duplicates) were completed on predominantly alaskite samples (see Figure 1), yielding uranium extractions ranging from 77% to 87% (average of solids and solution based recovery) with acid consumption rates ranging from 17 kg/t up to 22 kg/t.
-
Phase 2: A further ten column leach tests (including duplicates) have been completed on samples sourced from various parts of the orebody, encompassing country rock and marbles. During these tests, uranium extractions ranged from 69% to 85% (average of solids and solution based recovery) dependant on leach operating conditions at a leach cycle duration of 30 days. Acid consumption ranged from 23 kg/t up to 38 kg/t.
-
Thirty-four bottle roll leach optimisation tests were completed to guide conditions for the column testing during Phase 1 and 2 of the programme.
Phase 1 of the programme focused on a composite sample comprising primarily alaskite material, with a head grade of approximately 187 ppm U3O8. Various crush sizes were examined after preparation in a laboratory-scale cone crusher to achieve a targeted particle size distribution (PSD). Testwork assessed crush sizes with a top size of 4.75 mm, 6.7 mm and 8 mm.
The programme's second phase evaluated three distinct ore samples sourced from different locations within the ore body, characterised by varying lithologies. These samples exhibited head grades ranging from 136 ppm to 201 ppm U3O8, with an increased presence of marbles, schists, and country rock lithologies. Crush sizes assessed ranged from a top size of approximately 6 mm to 8 mm.
SGS was chosen for its comprehensive laboratory services and global expertise. In addition to internal laboratory test procedures and quality control measures, numerous repeat assays and external laboratory assays were conducted throughout the programmes to interrogate the data set and critique accountabilities.
Leaching Columns at SGS South Africa
Figure 1: Leaching Columns at SGS South Africa
The current testwork programme has yielded the following observations and inferences:
-
Enhanced leach kinetics were noted in the latter part of the programme, attributed to the acid curing procedure conducted prior to sample introduction into the columns.
-
Comparative tests carried out at higher irrigation rates demonstrated improved leach kinetics and recoveries.
-
Preliminary evaluation of using flocculant as a binder warrants further investigation, potentially contributing to enhanced leach kinetics and recoveries.
-
The impact of crush size remains inconclusive at present. While some comparative tests indicate that finer crush sizes result in higher uranium extractions, others show no discernible effect. This aspect will be further investigated in the subsequent phase of the programme, with particular emphasis on the utilisation of HPGR crushing. Existing literature suggests a potential increase of between 4% to 6% in metal extractions in heap leach operations with HPGR crushing compared to conventional crushing methods.
-
The grade-recovery relationship remains partly defined, but preliminary observations suggest a correlation between grade and its subsequent impact on recovery. The precise extent of this relationship will also be further investigated in the subsequent phase of the programme
-
The acid consumption for the alaskite samples averaged approximately 17kg/ton for coarser crush sizes, with higher consumption observed for finer sizes. In the second part of the test programme, acid consumption increased up to 38kg/ton with the marble-containing samples. Optimisation of acid consumption, acid strength, irrigation rates, cycle duration and crush size are all planned for the next phase of the programme.
Grading analyses conducted on the alaskite sample leach residues revealed a higher proportion of uranium remaining in the coarser end of the size range, whereas the finer end of the size spectrum exhibited minimal uranium content. This suggests a potential liberation challenge, which will be investigated further in the next phase of the programme, particularly utilising an HPGR crushed product supported by further mineralogical analysis.
Workplan
Forsys is initiating the next phase of the test work programme along with ongoing optimisation efforts. The key workstreams will include two further phases of Column Leach tests at SGS with ongoing mineralogical analysis to complete the data evaluation.
These phases of follow up testing are aimed at enhancing the efficiency and effectiveness of extracting the uranium mineralisation from ore samples with a wider head grade range.
The programme is designed to test a range of leaching variables, including crushing by HPGR to assess the impact of the particle cracking effect to expose increased mineral surface area for improved leaching. Column work to date has shown higher uranium grades in coarser fractions of the residue, indicating the majority of mineralisation in the fines has been leached. Physical leaching variables will also be tested for optimising leach conditions.
As part of the programme a boxcut is planned which will enable access to adequate mass of bulk fresh ore material for large scale column leach testing to inform process design.
Qualified Persons Statement for Metallurgy Mr Aveshan Naidoo is a Specialist Engineer: Hydromet and Economics, for DRA South Africa Projects (Pty) Ltd of Building 33, Woodlands Office Park, 20 Woodlands Drive, Woodlands, Sandton, 2080. He holds a Bachelor of Science in Chemical Engineering from the University of KwaZulu-Natal and a Master of Business Administration from the University of Witwatersrand. He is a registered Professional Engineer with the Engineering Council of South Africa (Registration No. 20130523). Mr Naidoo has been practising his profession continuously since 2008 and has 16 years of experience across a range of African projects. He is familiar with NI 43-101 and, by reason of his education, experience, and professional registrations, he fulfils the requirements of an independent Qualified Person as defined in NI 43-101.
Qualified Persons Statement for Mining Mr Peter Christians is an Associate and Principal Mining Engineer with Qubeka Mining Consultants CC in Windhoek, Namibia. He holds a Bachelor of Science in Mining Engineering at Queen’s University in Kingston, Ontario, Canada. He is a registered Fellow Member of the Australian Institute of Mining and Metallurgy (FAusIMM, registration number 221754). Mr Christians has been practicing as a Mining Engineer continuously since 1985 in various roles and his ~40-years’ experience covers a range of projects across Africa, North America, Australia, and Russia. He is familiar with NI 43-101 and, by reason of his education, experience, and professional registrations, he fulfils the requirements of an independent Qualified Person as defined in NI 43-101.
Qualified Persons Statement for Geology The information in this release that relates to the Preliminary Leaching Test Work and Project Workplan at Norasa is based on information compiled or reviewed by Dr Guy Freemantle of The MSA Group (Pty) Ltd., Johannesburg, South Africa. The MSA Group are independent consultants to the Norasa Project, Namibia. Dr Freemantle holds a Bachelor of Science in Geology (2006) and Doctor of Philosophy in Geology (2017) both at the University of the Witwatersrand. He is a member of the Society of Economic Geologists (892905); a Fellow of the Geological Society of South Africa (965392); and is registered with SACNASP (Registration 117527). Dr Freemantle has practiced his profession continuously for 14 years and has sufficient experience and knowledge that is relevant to the style of mineralisation and type of deposits under consideration as well as to the activity that is being undertaken to fulfil requirements of a Qualified Person as per NI 43-101. Dr Freemantle consents to this release in the form and context in which it appears.
_________________________________________________________________________________________________________
About Forsys Metals Corp.
Forsys Metals Corp. (TSX: FSY, FSE: F2T, NSX: FSY) is an emerging uranium developer focused on advancing its wholly owned Norasa Uranium Project, located in the politically and uranium friendly jurisdiction of Namibia, Africa. The Norasa Uranium Project is comprised of the Valencia Uranium deposit (ML-149) and the nearby Namibplaas Uranium deposit (EPL-3638). Further information is available at the Company website www.forsysmetals.com
On behalf of the Board of Directors of Forsys Metals Corp. Richard Parkhouse, Director, Investor Relations. For additional information please contact:
Pine van Wyk, Country Director, Forsysemail: pine@forsysmetals.com
Richard Parkhouse, Director, Investor Relationsemail: rparkhouse@forsysmetals.com email: info@forsysmetals.comphone : +44 7730493432
Nikolas Matysek, Communications Manager (Canada)email: nmatysek@forsysmetals.com
Forward Looking Statement
Certain information contained in this press release constitutes "forward-looking information", within the meaning of Canadian legislation. Generally, these forward-looking statements can be identified by the use of forward-looking terminology such as "plans", "expects" or "does not expect", "is expected", "budget", "scheduled", "estimates", "forecasts", "intends", "anticipates" or "does not anticipate", or "believes", or variations of such words and phrases or state that certain actions, events or results "may", "could", "would", "might" or "will be taken", "occur", "be achieved" or "has the potential to". Forward looking statements contained in this press release are qualified in their entirety by the inherent risks and uncertainties surrounding future expectations. Among those factors which could cause actual results to differ materially are the following: market conditions and other risk factors listed from time to time in our reports filed with Canadian securities regulators on SEDAR+ at www.sedarplus.ca. The forward-looking statements included in this press release are made as of the date of this press release and Forsys Metals Corp disclaim any intention or obligation to update or revise any forward-looking statements, whether as a result of new information, future events or otherwise, except as expressly required by applicable securities legislation.
A photo accompanying this announcement is available at https://www.globenewswire.com/NewsRoom/AttachmentNg/51ce7a8d-fb7b-44dd-8e37-5e39d326d157
There's no doubt that money can be made by owning shares of unprofitable businesses. For example, although software-as-a-service business Salesforce.com lost money for years while it grew recurring revenue, if you held shares since 2005, you'd have done very well indeed. But the harsh reality is that very many loss making companies burn through all their cash and go bankrupt.
So, the natural question for Forsys Metals (TSE:FSY) shareholders is whether they should be concerned by its rate of cash burn. In this report, we will consider the company's annual negative free cash flow, henceforth referring to it as the 'cash burn'. First, we'll determine its cash runway by comparing its cash burn with its cash reserves.
View our latest analysis for Forsys Metals
How Long Is Forsys Metals' Cash Runway?
A company's cash runway is calculated by dividing its cash hoard by its cash burn. When Forsys Metals last reported its March 2024 balance sheet in May 2024, it had zero debt and cash worth CA$10m. Looking at the last year, the company burnt through CA$6.1m. So it had a cash runway of approximately 20 months from March 2024. That's not too bad, but it's fair to say the end of the cash runway is in sight, unless cash burn reduces drastically. The image below shows how its cash balance has been changing over the last few years.
debt-equity-history-analysisHow Is Forsys Metals' Cash Burn Changing Over Time?
Forsys Metals didn't record any revenue over the last year, indicating that it's an early stage company still developing its business. So while we can't look to sales to understand growth, we can look at how the cash burn is changing to understand how expenditure is trending over time. Over the last year its cash burn actually increased by a very significant 78%. While this spending increase is no doubt intended to drive growth, if the trend continues the company's cash runway will shrink very quickly. Forsys Metals makes us a little nervous due to its lack of substantial operating revenue. So we'd generally prefer stocks from this list of stocks that have analysts forecasting growth.
How Easily Can Forsys Metals Raise Cash?
While Forsys Metals does have a solid cash runway, its cash burn trajectory may have some shareholders thinking ahead to when the company may need to raise more cash. Companies can raise capital through either debt or equity. Many companies end up issuing new shares to fund future growth. By looking at a company's cash burn relative to its market capitalisation, we gain insight on how much shareholders would be diluted if the company needed to raise enough cash to cover another year's cash burn.
Since it has a market capitalisation of CA$178m, Forsys Metals' CA$6.1m in cash burn equates to about 3.5% of its market value. Given that is a rather small percentage, it would probably be really easy for the company to fund another year's growth by issuing some new shares to investors, or even by taking out a loan.
So, Should We Worry About Forsys Metals' Cash Burn?
Even though its increasing cash burn makes us a little nervous, we are compelled to mention that we thought Forsys Metals' cash burn relative to its market cap was relatively promising. Cash burning companies are always on the riskier side of things, but after considering all of the factors discussed in this short piece, we're not too worried about its rate of cash burn. Readers need to have a sound understanding of business risks before investing in a stock, and we've spotted 2 warning signs for Forsys Metals that potential shareholders should take into account before putting money into a stock.
Of course Forsys Metals may not be the best stock to buy. So you may wish to see this free collection of companies boasting high return on equity, or this list of stocks with high insider ownership.
Have feedback on this article? Concerned about the content? Get in touch with us directly. Alternatively, email editorial-team (at) simplywallst.com.This article by Simply Wall St is general in nature. We provide commentary based on historical data and analyst forecasts only using an unbiased methodology and our articles are not intended to be financial advice. It does not constitute a recommendation to buy or sell any stock, and does not take account of your objectives, or your financial situation. We aim to bring you long-term focused analysis driven by fundamental data. Note that our analysis may not factor in the latest price-sensitive company announcements or qualitative material. Simply Wall St has no position in any stocks mentioned.
Forsys Metals Corp
TORONTO, May 14, 2024 (GLOBE NEWSWIRE) — Forsys Metals Corp. (TSX: FSY) (FSE: F2T) (NSX: FSY) (“Forsys” or the “Company”)
Forsys is pleased to provide an update for the Company’s Norasa Uranium project (“Norasa1”) which comprises the deposits of Valencia Main and East, (“Valencia”), under Mining Licence (ML-149) and Namibplaas (“Namibplaas”) under EPL-3638, (ML-251 pending).
Highlights
Forsys has undertaken a comprehensive review and update of all of the parameters for a Mineral Resource Estimate (“MRE”) for the Norasa project using recent drill results together with the 2005-2011 previous MRE data. Confirmatory and geotechnical drilling, in conjunction with new survey information, including topographic surveys, down-the-hole optical televiewer surveys, trajectory surveys, and downhole gamma probe surveys, were used as inputs for mineral resource modelling. Re-interpretation of the previous database utilising all available data and modern estimation approaches has improved the definition of the MRE to more confidently support mine planning. This study, enhanced by an integrated and expanded drill program targeting existing and new areas together with a robust work plan of optimisation process testing and modelling, will help reinforce the upside potential of the Norasa project.
-
For the overall Norasa project, a conceptual pit constrained MRE for total deposits assessed from previous (2005-2011) and 2023 drilling results is estimated to be:
-
Valencia Main Measured and Indicated Resource at 40 ppm U3O8 cutoff is estimated to be 152 Mt at 136 ppm eU3O8 (equivalent U3O8). Measured and Indicated contained metal is estimated at 45 Mlbs U3O8, at 40 ppm U3O8 cutoff.
-
Valencia Main and East Inferred Resources are estimated at 5.7 Mt at 120 ppm eU3O8 with 1.3 Mlbs U3O8 contained metal oxide, at 40 ppm U3O8 cutoff.
-
Namibplaas Inferred Resources are estimated to be 218.7 Mt at 85 ppm eU3O8 with 41.1 Mlbs U3O8 contained metal oxide, at 40 ppm U3O8 cutoff.
-
Pine van Wyk, Country Director for Forsys commented: “The comprehensive work done over the last twelve months on the Norasa Uranium Project has created a solid foundation to advance project development. The revised mineral resource model will help optimise the mine economics and process parameters. Results are expected soon from a column leaching test program currently being undertaken at SGS Laboratories in South Africa, which would establish the design basis of the planned heap leaching pads. With the existing ML149 permitted to commence mining, the large scale Norasa project is well advanced to take advantage of the strong uranium sector fundamentals.”
Mineral ResourcesResults are reported from recent remodelling of historical (2005-2011) drilling and recent 2023 drilling results. The Mineral Resources are reported within US$120/lb U3O8 pit shells, with a cut-off grade of 40 ppm U3O8 for each of the deposits at Valencia Main and East, (“Valencia”), under Mining Licence (ML-149) and US$120/lb U3O8 at 40 ppm U3O8 cutoff at Namibplaas (“Namibplaas”) under EPL-3638. The MRE are summarised as follows:
For the overall Norasa project, a conceptual open-pit shell constrained MRE for total deposits assessed from previous (2005-2011) and recent (2023) drilling results is estimated to be Measured and Indicated of 151.9 Mt at 136 ppm eU3O8, with contained metal oxide of 45.4 Mlbs U3O8 at Valencia Main. Inferred Resources for the Norasa project are estimated to be 224.5 Mt at 86 ppm eU3O8, with contained metal oxide of 42.6 Mlbs U3O8 (refer to Table 1):
-
Measured and Indicated: 151.9 Mt at 136ppm eU3O8, with contained metal oxide of 45.4 Mlbs for Valencia Main.
-
Inferred Resource for Valencia Main is estimated to be 4.7 Mt at 121 ppm eU3O8 and 1.3 Mlbs eU3O8 contained metal oxide.
-
Inferred Resource for Valencia East is estimated to be 1.0 Mt at 114 ppm eU3O8 and 0.3 Mlbs U3O8 contained metal oxide; and
-
Inferred Resource for Namibplaas is estimated to be 218.7 Mt at 85 ppm eU3O8 and 41.1 Mlbs U3O8 contained metal oxide.
Table 1: Mineral Resource Estimate for Norasa project as at 30 April 2024 at a 40 ppm U3O8 cut-off grade.
|
Class |
Deposit |
Mass Mt (metric) |
Average Grade eU3O8 (ppm) |
Material Content U3O8 Mlbs |
Contained Metal U tonnes |
|
|
|
||||||
|
|
||||||
|
|
||||||
|
Measured |
Valencia East |
|
|
|
|
|
|
Valencia Main |
7.6 |
171 |
2.9 |
1,099 |
|
|
|
Namibplaas |
|
|
|
|
|
|
|
Norasa |
7.6 |
171 |
2.9 |
1,099 |
|
|
|
Indicated |
Valencia East |
|
|
|
|
|
|
Valencia Main |
144.3 |
134 |
42.6 |
16,368 |
|
|
|
Namibplaas |
|
|
|
|
|
|
|
Norasa |
144.3 |
134 |
42.6 |
16,368 |
|
|
|
Measured & Indicated |
Valencia East |
|
|
|
|
|
|
Valencia Main |
151.9 |
136 |
45.4 |
17,467 |
|
|
|
Namibplaas |
|
|
|
|
|
|
|
Norasa |
151.9 |
136 |
45.4 |
17,467 |
|
|
|
Inferred |
Valencia East |
1.0 |
114 |
0.3 |
97 |
|
|
Valencia Main |
4.7 |
121 |
1.3 |
487 |
|
|
|
Namibplaas |
218.7 |
85 |
41.1 |
15,817 |
|
|
|
Norasa |
224.5 |
86 |
42.6 |
16,401 |
|
|
Notes: |
|
|
1. |
All tabulated data have been rounded and as a result minor computational errors may occur. |
|
2. |
Mineral Resources, which are not Mineral Reserves, have no demonstrated economic viability. There is no guarantee that all or any part of the mineral resource will be converted into a mineral reserve. The estimate of mineral resources may be materially affected by geology, environment, permitting, legal, title, taxation, socio-political, marketing, or other relevant issues. |
|
3. |
The Mineral Resource Statement for Norasa as at 30th April 2024 is reported at a cut-off grade of 40ppm U3O8 from within a conceptual pit-shell using the following assumed parameters:
|
|
4. |
From the assumed parameters, a 40 ppm U3O8 cut-off grade was calculated, which together with the conceptual pit shell demonstrates reasonable prospects for eventual economic extraction (RPEEE) for the Mineral Resource. The assessment to satisfy the criteria of RPEEE is a high-level estimate and is not an attempt to estimate Mineral Reserves. |
|
|
|
Mineral Resource Estimation Methodology
A summary of the Mineral Resource modelling methodology is as follows:
-
The Mineral Resource was modelled using a combination of Leapfrog Geo® and Datamine Studio RM® software.
-
Valencia Main and East data:
-
Comprise a combined dataset of 141 diamond (DD), 148 reverse circulation (RC) and 446 percussion (PC) type drill holes (Figure 1).
-
Borehole data from Valencia Main and East with XRF assay and calculated equivalent grades (eU3O8) from gamma-probing for each of the deposits have been used to estimate the Mineral Resource.
-
Equivalent uranium grades have been factored to correlate practically well with the XRF data, which constitutes 25 % of the grade data.
-
Where XRF data are available these supercede the corresponding probe equivalent grade in the estimation data.
-
-
Namibplaas data:
-
Comprise a dataset of 530 percussion holes and 40 diamond drill holes (Figure 2).
-
Borehole data from Namibplaas XRF assay and calculated equivalent grades (eU3O8) have been used to estimate the Inferred Mineral Resource.
-
Equivalent uranium grades constitute the majority of the grade data and where XRF data are available, ~3.5 % of all grade data, these supercede the probe derived values.
-
-
Wireframe interpretations of the logged lithologies were used to define the various geological units.
-
Mineralisation is strongly associated with alaskite intrusions, that are in turn controlled by a structural architecture that comprises folded and planar strata surfaces, and fold-associated shears and cleavages. Importantly, the orientation of marble strata is a major control on the distribution of uranium mineralisation for REDOX chemistry reasons, at Valencia and the Erongo region alaskite deposits as whole. The alaskite orientations are therefore strataform, except where they have invaded sheared and strongly cleaved antiformal hinge zones, as at Valencia Main. In order to honour the geological controls in the estimates various surfaces were modelled:
-
String interpretations of the “stratiform” intrusions were digitised in cross-section and were used to create median surfaces for each of the intrusions.
-
The resulting mineralised zone wireframes align with the lithological strata while also cross-cutting the strata in places to accommodate axial-planar mineralisation orientations (see Figure 3).
-
The surfaces were then used to guide the orientation of the grade estimate through interpolation of individual dip and dip directions for each model block.
-
-
The geometry of the Namibplaas deposit comprises stratiform lithologies that dip toward the southwest. The alaskite intrusives have intruded in a strataform manner and have exploited disruptions in the overall fabric, such as local fold flexures and dilation zones associated with the NE-SW regional extensional setting. In order to honour the geological controls at Namibplaas in the estimates various surfaces were modelled with guidance from the directions of greatest structural continuity to guide implicit modelling:
-
Along the strike and dip direction of the host metasediments, and
-
Along a shallow-plunging hinge structure that is oriented to the NE, parallel to the regional extension regime.
-
Considering that mineralization at Namibplaas is strongly associated with the granitic intrusions, string interpretations of the mid-points of these “stratiform” intrusions were digitized in cross-section, thereafter linked to create median surfaces of each of the alaskite intrusions (see Figure 4).
-
The surfaces of the intrusions were then used to guide the orientation of the grade estimate through interpolation of individual dip and dip directions for each model block.
-
-
Grade shells using a 40 ppm U3O8 threshold were constructed using Leapfrog® implicit modelling with directional control surfaces from the geological model.
-
The model volumes were divided into four domains at Valencia Main and two domains at Namibplaas. Each domain is distinct in terms of its geographic/geometric position as well as statistical / geostatistical parameters.
-
Ordinary kriging estimation used three-dimensional directional variograms to estimate U3O8 grades within the mineralised zones for Valencia Main and Namibplaas. Inverse distance squared interpolation was used for Valancia East. The models underwent validation by comparison of estimated grade values against input sample grades, both visually and statistically.
-
Volumes covered by 30 m drill-spacing were classified as Indicated Mineral Resources at Valencia. All blocks outside of these volumes within the grade shells that received a grade estimate during the interpolation runs were considered Inferred.
-
At Namibplaas, although the tight drill spacing of approximately 30 m provides dense coverage of the deposit, the predominance of probe-derived eU3O8 assays warrants a confidence level for an Inferred Resource.
30 April 2024 MRE block model and US$120/lb U3O8 pit shells at Valencia Main and Valencia East, ML 149.
Figure 1: 30 April 2024 MRE block model and US$120/lb U3O8 pit shells at Valencia Main and Valencia East, ML 149.
30 April 2024 MRE block model and US$120/lb U3O8 pit shells at Namibplaas, EPL 3638.
Figure 2: 30 April 2024 MRE block model and US$120/lb U3O8 pit shells at Namibplaas, EPL 3638.
Figure 3 part 1.
Figure 3 part 2
Figure 3: Shows the stacked concordant surfaces generated parallel to the 3 marble bands and orientation of mineralisation aligned with the strata and axial planar cleavages in the fold hinge (guiding surfaces hidden) at Valencia.
Shows alaskite midpoint strings (yellow) linked in parallel to the the NE-SW oriented strike of the deposit.
Figure 4: Shows alaskite midpoint strings (yellow) linked in parallel to the the NE-SW oriented strike of the deposit.
In accordance with National Instrument 43-101 (“NI 43-101”) a Technical Report outlining the mineral resource estimation will be filed under Forsys’ profile on SEDAR+ (www.sedarplus.ca) within 45 days of the date of this release.
Assaying and QAQC
-
Recent (2023) Sampling and Assays
-
Samples were taken from the diamond drill cores and RC chips for geochemical assay guided by the routine downhole radiometric probe results, and sent to Trace Elements Analysis Laboratories (Pty) Ltd (“TEA Labs”) at Swakopmund for sample preparation and analyses by XRF. For internal quality control purposes TEA Labs has weekly round robins with independent laboratories at Rosh Pinah, Swakop Uranium and Langer Heinrich mines.
-
Forsys employs a QAQC programme with Certified Reference Materials (CRMs), blanks, coarse duplicates and pulp duplicates inserted into each batch of samples. The QAQC insert rate comprises 4 % CRMs using three CRM types with different grades of U3O8; 4 % blanks and 8 % to 10 % duplicates. RC sample batches have three types of duplicates; a field duplicate split at the drill rig; a coarse duplicate split at prescribed intervals at the laboratory; and pulp duplicates, also split at the laboratory. Core samples only have coarse and pulp duplicates split at the laboratory.
-
Four-percent of the samples sent to TEA Labs are sent for check analyses at SGS Laboratories (SGS) in South Africa, which serves as the independent accredited laboratory. The sample results are further validated by comparison with the radiometric scans.
-
-
Previous Sampling and Assays (2005-2011 Valencia Uranium Limited (VUL)):
-
All diamond drill half core and RC samples collected by VUL were assayed at the Setpoint Technology (“Setpoint”) laboratory in Johannesburg, South Africa. Setpoint was accredited with the South African Accreditation System (SANAS), accreditation number T0223, and was also an ISO17025 accredited laboratory. Setpoint crushed and pulverised the samples for analysis of U3O8 using the XRF pressed pellet method.
-
The VUL protocols for the QAQC were as follows:
-
CRMs inserted at a frequency of at least one per 20 samples.
-
Blanks inserted at a frequency of at least one per 50 samples.
-
Duplicates taken at a frequency of at least one per 20 samples.
-
-
The Setpoint laboratory included appropriate quality assurance and quality control (QAQC) procedures during the analysis of the VUL samples by including its own certified reference standards (CRM), blanks and duplicates.
-
VUL percussion holes were not physically sampled. Datasets were derived from two downhole probes that were calibrated against the XRF sample assays.
-
Snowden reviewed the assay results from Setpoint for the Valencia deposits in 20092 for the purposes of resource estimation and considered the QAQC results to be of a high standard of precision, unbiased and accurate.
-
Optiro reviewed the assay results from Setpoint for the Namibplaas deposit in 2011 and considered that the results of the QAQC indicate a high level of precision with no bias, no significant contamination and a high degree of accuracy (from Snowden 20092 and Optiro 20113)
-
-
Trekkopje Exploration (Goldfields 1974-1984):
-
Exploration data derived from Trekkopje Exploration era, up to and including 1984, have not been verified by the QP and therefore were not utilised in this Mineral Resource Estimate.
-
Workplan
Forsys is undertaking an infill and extension drilling program and optimisation work with the aim of expanding and upgrading the Mineral Resource:
Resource Infill Drilling and Resource Extension DrillingTotal of 85 percussion drill holes for 7,520 metres have been laid out on a 25 x 25 metre grid. The objective is to more than double the quantity of the Measured Mineral Resource. The holes target the 660 m elevation with drill depths up to 100 m from surface and is comparable to the previous Measured Resource grid.A subsequent program for potential resource extension is planned for the areas adjacent to the Valencia Main deposit; along strike to the west, on the hinge zone to the south, and north of the Main deposit at the Jolie Zone.
Pit Design ModelingThe updated resource block model is used to assess open pit economic models. Pit slope design parameters are being reviewed to include lithological logging and geomechanical test work from additional drilling.
Column Leaching Process Optimization WorkColumn Leach tests are presently underway at SGS in South Africa where the columns have been emptied and final analyses and data is pending. The next phase of testing will assess systematic processes to enhance the efficiency and effectiveness of extracting the uranium mineralisation from the ore using sulphuric acid solutions.
Process DesignDRA Global were appointed as the study contractor to deliver engineering to support preliminary cost estimates for a heap leach process. Ongoing engineering and optimisation continues.
Bulk SamplingAfter site assessment and selection, a detailed plan is being drawn up to develop a box cut with the objective of retrieving approximately 20,000 tonnes of typical run-of-mine, fresh and representative sample material from the deposit.
Qualified Persons Statement for Metallurgy Mr Aveshan Naidoo is a Specialist Engineer: Hydromet and Economics, for DRA South Africa Projects (Pty) Ltd of Building 33, Woodlands Office Park, 20 Woodlands Drive, Woodlands, Sandton, 2080. He holds a Bachelor of Science in Chemical Engineering and a Master of Business Administration at the University of Witwatersrand. He is a registered Professional Engineer with the Engineering Council of South Africa (Registration No. 20130523). Mr Naidoo has been practising his profession continuously since 2008 and has 16 years of experience across a range of African projects. He is familiar with NI 43-101 and, by reason of his education, experience, and professional registrations, he fulfils the requirements of an independent Qualified Person as defined in NI 43-101.
Qualified Persons Statement for Mineral Resource The information in this release that relates to the updated Mineral Resource Estimate for the Norasa Project is based on information compiled or reviewed by Dr Guy Freemantle of The MSA Group (Pty) Ltd., Johannesburg, South Africa. The MSA Group are independent consultants to the Norasa Project, Namibia. Dr Freemantle holds a Bachelor of Science in Geology and a PhD in Geology, both at the University of the Witwatersrand. He is a member of the Society of Economic Geologists (892905); a Fellow of the Geological Society of South Africa (965392); and is registered with SACNASP (Registration 117527). Dr Freemantle has practiced his profession continuously for 14 years and has sufficient experience and knowledge that is relevant to the style of mineralisation and type of deposits under consideration as well as to the activity that is being undertaken to fulfil requirements of a Qualified Person as per NI 43-101. Dr Freemantle consents to this release in the form and context in which it appears.
About Forsys Metals Corp.
Forsys Metals Corp. (TSX: FSY, FSE: F2T, NSX: FSY) is an emerging uranium developer focused on advancing its wholly-owned Norasa Uranium Project, located in the politically friendly jurisdiction of Namibia, Africa. The Norasa Uranium Project is comprised of the Valencia Uranium deposit (ML-149) and the nearby Namibplaas Uranium deposit (EPL-3638). Further information is available at the Company website www.forsysmetals.com
On behalf of the Board of Directors of Forsys Metals Corp. Richard Parkhouse, Director, Investor Relations. For additional information please contact:
Pine van Wyk, Country Director, Forsysemail: pine@forsysmetals.com
Richard Parkhouse, Director, Investor Relationsemail: rparkhouse@forsysmetals.com email: info@forsysmetals.comphone : +44 7730493432
Nikolas Matysek, Communications Manager (Canada)email: nmatysek@forsysmetals.com
Forward Looking Statement
Certain information contained in this press release constitutes "forward-looking information", within the meaning of Canadian legislation. Generally, these forward-looking statements can be identified by the use of forward-looking terminology such as "plans", "expects" or "does not expect", "is expected", "budget", "scheduled", "estimates", "forecasts", "intends", "anticipates" or "does not anticipate", or "believes", or variations of such words and phrases or state that certain actions, events or results "may", "could", "would", "might" or "will be taken", "occur", "be achieved" or "has the potential to". Forward looking statements contained in this press release are qualified in their entirety by the inherent risks and uncertainties surrounding future expectations. Among those factors which could cause actual results to differ materially are the following: market conditions and other risk factors listed from time to time in our reports filed with Canadian securities regulators on SEDAR at www.sedar+.com. The forward-looking statements included in this press release are made as of the date of this press release and Forsys Metals Corp disclaim any intention or obligation to update or revise any forward-looking statements, whether as a result of new information, future events or otherwise, except as expressly required by applicable securities legislation.
1 The Norasa Uranium Project (“Norasa”) is wholly-owned by the Company’s 100% subsidiary Valencia Uranium (Pty) Ltd. (“Valencia Uranium”) and comprises the Valencia uranium deposits (held under ML-149) ("Valencia”) and the Namibplaas uranium deposit (under EPL-3638, application for ML-251) (“Nambiplaas”), located in the Erongo region of Namibia,2 Valencia Uranium (Pty) Ltd. Valencia Project Namibia Technical Report, Snowden, 2009.3 Forsys Metals Corp. Technical Report on the Namibplaas Deposit, Namibia, Optiro, 2011
Photos accompanying this announcement are available at:https://www.globenewswire.com/NewsRoom/AttachmentNg/2016b8e9-e68f-483e-822b-1424733835e1https://www.globenewswire.com/NewsRoom/AttachmentNg/f1685ef1-81f0-4936-a3e8-074025530934https://www.globenewswire.com/NewsRoom/AttachmentNg/09bf2f9e-0ec3-4b95-ac2b-7d8c5269f43bhttps://www.globenewswire.com/NewsRoom/AttachmentNg/7103e818-7dd1-42aa-abe6-d85e3ff8d22bhttps://www.globenewswire.com/NewsRoom/AttachmentNg/97832d3f-51e4-413f-94c3-52d8e0b1d136
Forsys Metals Corp
Figure 1:
Recent boreholes drilled within the 2015 main pit outline on ML-149, Valencia West planned exploration drilling.
Figure 2:
Overview map of Norasa 2024 Q1 drill campaign on a radiometric background.
TORONTO, March 26, 2024 (GLOBE NEWSWIRE) — Forsys Metals Corp. (TSX: FSY) (FSE: F2T) (NSX: FSY) (“Forsys” or the “Company”)
Forsys is pleased to provide assay results from the Valencia 2023 drilling programme, from Mining License (“ML)-149("Valencia”) in the Erongo region of Namibia, which forms part of the Company’s larger Norasa Uranium Project (“Norasa¹”).
Fifteen boreholes were drilled with a combined total of 2,684.44 metres ("m") (Figure 1). The objectives of the drill program were:
-
geotechnical drilling, and logging and sampling for geo-mechanical testing for pit slope stability assessment and optimizing pit designs;
-
testing the continuity of mineralization for resource modelling;
-
confirming Mineral Resource Estimation (MRE) parameters; and
-
sampling for metallurgical test work and processing design optimization
Drilling, geological and geotechnical logging, down-hole optical televiewer and radiometric scans have been completed on the 15 holes. Eight hundred and nineteen samples from ten of the boreholes underwent assay with established quality control protocol and procedures. The chemical results have been verified by an accredited lab and reviewed by a third party professional geologist. Highlights are as follows:
-
Multiple zones of massive alaskite intrusions were intersected. Chemical assays confirm uranium mineralization in all six of the confirmation boreholes.
-
Best mineralized borehole PQ-5 intersected 77.34 m of continuous mineralisation, averaging 439 ppm U3O8, including 41.9 m of 683 ppm U3O8.
-
2023 intersections of mineralization correlate with the neighbouring, historic drilling, intersections and down-hole gamma survey results.
-
No major zones of rock weakness, i.e. no concerning geological structures, have been intersected. This is a positive result for the ongoing geotechnical specialist work, as it indicates conducive conditions for pit slope optimization and overall mine design.
Table 1: Highlights reported from the completed 2023 drill campaign, minimum width of 5m and cutoff of 50 ppm U3O8
|
BHID |
FROMm |
TOm |
LENGTHm |
U3O8ppm |
|
FROMm |
TOm |
LENGTHm |
U3O8ppm |
|
VA23GT001 |
23 |
29 |
6 |
108 |
|
|
|
|
|
|
VA23GT001 |
40 |
47 |
7 |
189 |
|
|
|
|
|
|
VA23GT001 |
77 |
82 |
5 |
66 |
|
|
|
|
|
|
VA23GT001 |
95 |
101 |
6 |
140 |
|
|
|
|
|
|
VA23GT002 |
38 |
77 |
39 |
106 |
|
|
|
|
|
|
VA23GT002 |
105.3 |
149 |
43.7 |
152 |
including |
104 |
124.1 |
20.1 |
334 |
|
VA23GT004 |
1 |
103.2 |
102.2 |
164 |
including |
73 |
103.2 |
30.2 |
216 |
|
VA23GT005 |
22 |
41 |
19 |
92 |
|
|
|
|
|
|
VA23GT005 |
51 |
63 |
12 |
218 |
|
|
|
|
|
|
VA23GT005 |
89 |
94 |
5 |
123 |
|
|
|
|
|
|
VA23GT005 |
101 |
106 |
5 |
114 |
|
|
|
|
|
|
VA23GT005 |
116.2 |
129 |
12.8 |
122 |
|
|
|
|
|
|
VA23GT005 |
141.8 |
147.11 |
5.31 |
241 |
|
|
|
|
|
|
VA23GT005 |
229.13 |
239 |
9.87 |
236 |
|
|
|
|
|
|
VA23GT005 |
244.77 |
272 |
27.23 |
184 |
|
|
|
|
|
|
VA23GT006 |
65 |
81 |
16 |
136 |
|
|
|
|
|
|
VA23GT006 |
100 |
105 |
5 |
143 |
|
|
|
|
|
|
VA23GT007 |
18 |
26 |
8 |
194 |
|
|
|
|
|
|
VA23GT007 |
33 |
38 |
5 |
194 |
|
|
|
|
|
|
VA23GT007 |
189 |
195 |
6 |
213 |
|
|
|
|
|
|
VA23PQ04 |
30 |
37.5 |
7.5 |
229 |
|
|
|
|
|
|
VA23PQ04 |
54 |
59 |
5 |
181 |
|
|
|
|
|
|
VA23PQ05 |
3.96 |
81.3 |
77.34 |
439 |
including |
36 |
77.9 |
41.9 |
683 |
|
VA23RE001 |
50 |
100 |
50 |
90 |
|
|
|
|
|
|
VA23RE001 |
114 |
119 |
5 |
215 |
|
|
|
|
|
|
VA23RE001 |
128.73 |
178 |
49.27 |
201 |
including |
142 |
169.05 |
27.05 |
275 |
|
VA23RE001 |
190 |
237 |
47 |
253 |
including |
202.37 |
225 |
22.63 |
371 |
|
VA23RE001 |
302.75 |
414 |
111.25 |
134 |
including |
322.88 |
345.24 |
22.36 |
331 |
|
VA23RE002 |
1 |
21 |
20 |
105 |
|
|
|
|
|
|
VA23RE002 |
95 |
124.1 |
29.1 |
271 |
including |
104 |
124.1 |
20.1 |
334 |
|
VA23RE002 |
129.7 |
152 |
22.3 |
376 |
including |
129.7 |
140.8 |
11.1 |
673 |
|
VA23RE002 |
160 |
180 |
20 |
162 |
|
|
|
|
|
|
VA23RE002 |
244 |
251.2 |
7.2 |
158 |
|
|
|
|
|
|
VA23RE002 |
258 |
268 |
10 |
171 |
|
|
|
|
|
|
VA23RE002 |
275 |
288 |
13 |
139 |
|
|
|
|
|
Geological context:
-
Boreholes GT-01 to GT-07 were drilled from within the planned Valencia Main mine pit, angled and directed away from the centre of the 2015 pit shell to investigate the ground conditions for the pit slope design.
-
Two boreholes, RE-01 and RE-02, were strategically positioned to confirm mineralization from the 2015 FS Mineral Resource Estimate at Valencia in a geologically unique zone.
-
Holes PQ-01 to PQ-05 were drilled at Valencia for a total of 285.31 m, providing approximately 3 tons of sample for metallurgical testing.
Recent boreholes drilled within the 2015 main pit outline on ML-149, Valencia West planned exploration drilling.
Figure 1: Recent boreholes drilled within the 2015 main pit outline on ML-149, Valencia West planned exploration drilling.https://www.globenewswire.com/NewsRoom/AttachmentNg/bdc97a7e-8ff7-4fa6-8c7e-6a71aa561a7d
Borehole samples were selected for geochemical assay from the routine downhole radiometric scanning results and sent to Trace Elements Analysis Laboratories (Pty) Ltd (“TEA Labs”) in Swakopmund for sample preparation and analyses by XRF. For internal quality control purposes TEA Labs has weekly round robins with independent laboratories at Rosh Pinah, Husab Uranium, and Langer Heinrich mine laboratories.
Forsys employs an industry standard QA/QC program with Standard Reference Materials, blanks, coarse duplicates and pulp duplicates inserted into each batch of samples analysed. 4% of the samples sent to TEA Labs were sent for check analyses to SGS Laboratories in South Africa, which is an independent accredited laboratory. The sample results are further validated by comparison with the downhole radiometric survey results.
Table-2 below lists borehole intersections with minimum intersections of 50ppm U3O8 over 5m:
Table 2: 2023 drill campaign: drill type, assay, composites, downhole gamma survey
|
BHID |
X |
Y |
Z |
FROM |
TO |
LENGTH |
EOH |
RC |
CORE |
Gamma |
U |
Th |
U3O8 |
|
|
UTM |
UTM |
m amsl |
m |
m |
m |
m |
m |
m |
cps |
ppm |
ppm |
ppm |
|
VA23GT001 |
523609 |
7528504 |
716.505 |
0 |
23 |
23 |
222 |
– |
222 |
– |
– |
– |
0 |
|
VA23GT001 |
523602 |
7528501 |
703.981 |
23 |
29 |
6 |
222 |
– |
222 |
722 |
92 |
– |
108 |
|
VA23GT001 |
523598 |
7528499 |
696.608 |
29 |
40 |
11 |
222 |
– |
222 |
308 |
– |
– |
0 |
|
VA23GT001 |
523594 |
7528498 |
688.796 |
40 |
47 |
7 |
222 |
– |
222 |
702 |
160 |
– |
189 |
|
VA23GT001 |
523586 |
7528494 |
672.673 |
47 |
77 |
30 |
222 |
– |
222 |
235 |
– |
– |
0 |
|
VA23GT001 |
523578 |
7528490 |
657.402 |
77 |
82 |
5 |
222 |
– |
222 |
761 |
55 |
– |
66 |
|
VA23GT001 |
523574 |
7528489 |
649.543 |
82 |
95 |
13 |
222 |
– |
222 |
204 |
– |
– |
0 |
|
VA23GT001 |
523570 |
7528487 |
641.25 |
95 |
101 |
6 |
222 |
– |
222 |
– |
119 |
– |
140 |
|
VA23GT001 |
523541 |
7528475 |
585.825 |
101 |
222 |
121 |
222 |
– |
222 |
– |
– |
– |
0 |
|
VA23GT002 |
523526 |
7528889 |
697.146 |
0 |
38 |
38 |
203.8 |
102 |
100 |
108 |
– |
– |
0 |
|
VA23GT002 |
523518 |
7528896 |
660.245 |
38 |
77 |
39 |
203.8 |
102 |
100 |
495 |
90 |
– |
106 |
|
VA23GT002 |
523510 |
7528904 |
628.372 |
77 |
105.3 |
28.3 |
203.8 |
102 |
100 |
201 |
– |
– |
2 |
|
VA23GT002 |
523502 |
7528914 |
594.818 |
105.3 |
149 |
43.7 |
203.8 |
102 |
100 |
744 |
129 |
36 |
152 |
|
VA23GT002 |
523496 |
7528926 |
561.152 |
149 |
177.95 |
28.95 |
203.8 |
102 |
100 |
214 |
– |
– |
1 |
|
VA23GT002 |
523491 |
7528936 |
533.545 |
184 |
202.8 |
18.8 |
203.8 |
102 |
100 |
216 |
– |
– |
0 |
|
VA23GT003 |
523841 |
7529328 |
692.427 |
0 |
102 |
102 |
102 |
102 |
– |
– |
– |
– |
0 |
|
VA23GT003 |
523861 |
7529274 |
633.213 |
0 |
227.28 |
227.28 |
227.28 |
– |
225 |
186 |
– |
– |
0 |
|
VA23GT004 |
524440 |
7529153 |
734.567 |
0 |
1 |
1 |
152.26 |
50.26 |
102 |
– |
– |
– |
0 |
|
VA23GT004 |
524467 |
7529148 |
690.761 |
1 |
103.2 |
102.2 |
152.26 |
50.26 |
102 |
1134 |
139 |
– |
164 |
|
VA23GT004 |
524507 |
7529140 |
627.146 |
103.2 |
152.26 |
49.06 |
152.26 |
50.26 |
102 |
150 |
– |
– |
1 |
|
VA23GT005 |
524189 |
7528751 |
729.233 |
0 |
22 |
22 |
275.47 |
102 |
173 |
– |
– |
– |
0 |
|
VA23GT005 |
524187 |
7528755 |
709.298 |
22 |
41 |
19 |
275.47 |
102 |
173 |
421 |
78 |
– |
92 |
|
VA23GT005 |
524185 |
7528759 |
695.341 |
41 |
51 |
10 |
275.47 |
102 |
173 |
265 |
– |
– |
0 |
|
VA23GT005 |
524184 |
7528762 |
684.832 |
51 |
63 |
12 |
275.47 |
102 |
173 |
1185 |
185 |
– |
218 |
|
VA23GT005 |
524181 |
7528767 |
667.017 |
63 |
89 |
26 |
275.47 |
102 |
173 |
252 |
– |
– |
0 |
|
VA23GT005 |
524178 |
7528773 |
652.66 |
89 |
94 |
5 |
275.47 |
102 |
173 |
496 |
104 |
– |
123 |
|
VA23GT005 |
524177 |
7528775 |
647.267 |
94 |
101 |
7 |
275.47 |
102 |
173 |
178 |
– |
– |
0 |
|
VA23GT005 |
524176 |
7528777 |
641.914 |
101 |
106 |
5 |
275.47 |
102 |
173 |
574 |
– |
– |
114 |
|
VA23GT005 |
524174 |
7528781 |
635.168 |
106 |
116.2 |
10.2 |
275.47 |
102 |
173 |
162 |
– |
– |
0 |
|
VA23GT005 |
524172 |
7528786 |
624.989 |
116.2 |
129 |
12.8 |
275.47 |
102 |
173 |
653 |
– |
– |
122 |
|
VA23GT005 |
524170 |
7528791 |
613.699 |
129 |
141.8 |
12.8 |
275.47 |
102 |
173 |
277 |
– |
– |
9 |
|
VA23GT005 |
524168 |
7528795 |
605.732 |
141.8 |
147.11 |
5.31 |
275.47 |
102 |
173 |
1282 |
205 |
7 |
241 |
|
VA23GT005 |
524159 |
7528815 |
567.876 |
147.11 |
229.13 |
82.02 |
275.47 |
102 |
173 |
180 |
– |
– |
0 |
|
VA23GT005 |
524150 |
7528836 |
528.09 |
229.13 |
239 |
9.87 |
275.47 |
102 |
173 |
1394 |
200 |
25 |
236 |
|
VA23GT005 |
524148 |
7528840 |
521.336 |
239 |
244.77 |
5.77 |
275.47 |
102 |
173 |
142 |
– |
– |
0 |
|
VA23GT005 |
524145 |
7528847 |
507.084 |
244.77 |
272 |
27.23 |
275.47 |
102 |
173 |
977 |
156 |
51 |
184 |
|
VA23GT005 |
524142 |
7528854 |
493.825 |
272 |
275.47 |
3.47 |
275.47 |
102 |
173 |
– |
– |
– |
0 |
|
VA23GT006 |
523928 |
7528337 |
693.644 |
0 |
65 |
65 |
225.14 |
100 |
125 |
251 |
– |
– |
0 |
|
VA23GT006 |
523936 |
7528330 |
654.546 |
65 |
81 |
16 |
225.14 |
100 |
125 |
504 |
115 |
– |
136 |
|
VA23GT006 |
523940 |
7528328 |
637.595 |
81 |
100 |
19 |
225.14 |
100 |
125 |
312 |
– |
– |
0 |
|
VA23GT006 |
523943 |
7528327 |
625.965 |
100 |
105 |
5 |
225.14 |
100 |
125 |
734 |
121 |
28 |
143 |
|
VA23GT006 |
523957 |
7528323 |
566.26 |
105 |
223.14 |
118.14 |
225.14 |
100 |
125 |
242 |
– |
– |
0 |
|
VA23GT007 |
524262 |
7529312 |
734.236 |
0 |
18 |
18 |
275.35 |
102 |
168 |
– |
– |
– |
0 |
|
VA23GT007 |
524257 |
7529316 |
723.059 |
18 |
26 |
8 |
275.35 |
102 |
168 |
1141 |
164 |
– |
194 |
|
VA23GT007 |
524254 |
7529318 |
716.725 |
26 |
33 |
7 |
275.35 |
102 |
168 |
350 |
– |
– |
0 |
|
VA23GT007 |
524251 |
7529320 |
711.742 |
33 |
38 |
5 |
275.35 |
102 |
168 |
515 |
165 |
– |
194 |
|
VA23GT007 |
524217 |
7529357 |
652.171 |
38 |
189 |
151 |
275.35 |
102 |
168 |
281 |
– |
– |
0 |
|
VA23GT007 |
524182 |
7529394 |
592.48 |
189 |
195 |
6 |
275.35 |
102 |
168 |
773 |
180 |
5 |
213 |
|
VA23GT007 |
524162 |
7529417 |
561.769 |
195 |
275.35 |
80.35 |
275.35 |
102 |
168 |
– |
– |
– |
0 |
|
VA23PQ01 |
523762 |
7528744 |
688.025 |
0 |
59.95 |
59.95 |
60 |
– |
59.95 |
892 |
– |
– |
0 |
|
VA23PQ02 |
523714 |
7529040 |
709.151 |
0 |
23.7 |
23.7 |
23.7 |
– |
23.7 |
– |
– |
– |
0 |
|
VA23PQ03 |
523869 |
7529019 |
702.407 |
0 |
61.27 |
61.27 |
60.27 |
– |
60.27 |
– |
– |
– |
0 |
|
VA23PQ04 |
523745 |
7529037 |
702.033 |
0 |
30 |
30 |
59 |
– |
59 |
291 |
– |
– |
0 |
|
VA23PQ04 |
523744 |
7529037 |
683.329 |
30 |
37.5 |
7.5 |
59 |
– |
59 |
1230 |
194 |
46 |
229 |
|
VA23PQ04 |
523743 |
7529038 |
671.361 |
37.5 |
54 |
16.5 |
59 |
– |
59 |
258 |
– |
– |
0 |
|
VA23PQ04 |
523743 |
7529038 |
660.637 |
54 |
59 |
5 |
59 |
– |
59 |
1019 |
– |
– |
181 |
|
VA23PQ05 |
523722 |
7528668 |
721.02 |
0 |
3.96 |
3.96 |
80 |
– |
80 |
– |
– |
– |
0 |
|
VA23PQ05 |
523722 |
7528668 |
680.372 |
3.96 |
81.3 |
77.34 |
80 |
– |
80 |
3138 |
372 |
48 |
439 |
|
VA23RE001 |
524309 |
7528910 |
724.265 |
0 |
50 |
50 |
419.72 |
102 |
318 |
512 |
– |
– |
0 |
|
VA23RE001 |
524286 |
7528933 |
686.478 |
50 |
100 |
50 |
419.72 |
102 |
318 |
375 |
76 |
– |
90 |
|
VA23RE001 |
524270 |
7528949 |
663.893 |
100 |
114 |
14 |
419.72 |
102 |
318 |
121 |
– |
– |
5 |
|
VA23RE001 |
524265 |
7528954 |
657.753 |
114 |
119 |
5 |
419.72 |
102 |
318 |
1319 |
190 |
– |
215 |
|
VA23RE001 |
524261 |
7528958 |
653.019 |
119 |
128.73 |
9.73 |
419.72 |
102 |
318 |
85 |
– |
– |
0 |
|
VA23RE001 |
524244 |
7528974 |
634.211 |
128.73 |
178 |
49.27 |
419.72 |
102 |
318 |
1266 |
– |
– |
201 |
|
VA23RE001 |
524227 |
7528991 |
614.788 |
178 |
190 |
12 |
419.72 |
102 |
318 |
156 |
– |
– |
0 |
|
VA23RE001 |
524210 |
7529007 |
596.799 |
190 |
237 |
47 |
419.72 |
102 |
318 |
1892 |
215 |
– |
253 |
|
VA23RE001 |
524178 |
7529038 |
563.102 |
237 |
302.75 |
65.75 |
419.72 |
102 |
318 |
83 |
– |
– |
1 |
|
VA23RE001 |
524127 |
7529089 |
511.66 |
302.75 |
414 |
111.25 |
419.72 |
102 |
318 |
– |
– |
– |
134 |
|
VA23RE001 |
524093 |
7529123 |
478.027 |
414 |
419.72 |
5.72 |
419.72 |
102 |
318 |
2 |
39 |
– |
47 |
|
VA23RE002 |
524153 |
7529118 |
748.623 |
0 |
1 |
1 |
296.21 |
102 |
153 |
– |
– |
– |
0 |
|
VA23RE002 |
524159 |
7529114 |
740.728 |
1 |
21 |
20 |
296.21 |
102 |
153 |
671 |
89 |
– |
105 |
|
VA23RE002 |
524186 |
7529096 |
706.86 |
21 |
95 |
74 |
296.21 |
102 |
153 |
107 |
15 |
– |
18 |
|
VA23RE002 |
524217 |
7529075 |
670.879 |
95 |
124.1 |
29.1 |
296.21 |
102 |
153 |
1980 |
229 |
– |
271 |
|
VA23RE002 |
524228 |
7529068 |
659.428 |
124.1 |
129.7 |
5.6 |
296.21 |
102 |
153 |
330 |
15 |
– |
17 |
|
VA23RE002 |
524237 |
7529063 |
650.437 |
129.7 |
152 |
22.3 |
296.21 |
102 |
153 |
2767 |
318 |
– |
376 |
|
VA23RE002 |
524247 |
7529057 |
640.726 |
152 |
160 |
8 |
296.21 |
102 |
153 |
200 |
– |
– |
0 |
|
VA23RE002 |
524256 |
7529051 |
631.919 |
160 |
180 |
20 |
296.21 |
102 |
153 |
1046 |
137 |
– |
162 |
|
VA23RE002 |
524285 |
7529034 |
606.377 |
180 |
244 |
64 |
296.21 |
102 |
153 |
130 |
– |
– |
0 |
|
VA23RE002 |
524309 |
7529019 |
585.009 |
244 |
251.2 |
7.2 |
296.21 |
102 |
153 |
1021 |
134 |
– |
158 |
|
VA23RE002 |
524314 |
7529016 |
580.956 |
251.2 |
258 |
6.8 |
296.21 |
102 |
153 |
613 |
– |
– |
12 |
|
VA23RE002 |
524319 |
7529012 |
576.141 |
258 |
268 |
10 |
296.21 |
102 |
153 |
1370 |
145 |
– |
171 |
|
VA23RE002 |
524325 |
7529008 |
571.309 |
268 |
275 |
7 |
296.21 |
102 |
153 |
380 |
– |
– |
0 |
|
VA23RE002 |
524332 |
7529004 |
565.685 |
275 |
288 |
13 |
296.21 |
102 |
153 |
786 |
118 |
– |
139 |
|
VA23RE002 |
524339 |
7528999 |
559.753 |
288 |
296.21 |
8.21 |
296.21 |
102 |
153 |
– |
– |
– |
0 |
2024 Drilling Program on ML-149, Valencia
The Company also announces that it has commenced a new drilling program at Valencia. Three zones of potential uranium mineralization situated outside of the existing resource block model are now being investigated.
The drilling program focusses on three target areas; refer to Table-3 and Figure-2 for individual drill hole locations:
-
A favourable horizon identified at the Jolie Zone (~ 1km north of Valencia pit)
-
Valencia West Extension
-
Valencia South
Twenty-nine boreholes are scheduled for a total of 5,236m of drilling to assess mineralization to depths of up to 380 m below collar.
The three areas of mineralization potential were delineated from historic exploration work that included; aerial photo interpretation, geological mapping, aeromagnetic surveys, airborne and ground scintillometer surveys and exploration drilling. Investigation by drilling is required to define the mine’s surface infrastructure development and also to explore for resource upside potential in these areas.
Table 3: Below lists the holes planned for RC drilling. A diamond drill rig is available for extension of the RC drill section, as required by the ground conditions.
|
BHID |
Rig / Ranking |
X COLLAR |
Y COLLAR |
Z COLLAR |
EOH |
BRG |
DIP |
|
|
|
UTM |
UTM |
m |
m |
degree |
degree |
|
VA24-01 |
VA_West |
523370 |
7528883 |
724 |
150 |
330 |
60 |
|
VA24-02 |
VA_West |
523303 |
7528855 |
725 |
132 |
330 |
60 |
|
VA24-03 |
VA_West |
523165 |
7528783 |
729 |
126 |
330 |
60 |
|
VA24-04 |
VA_West |
523178 |
7528750 |
721 |
150 |
330 |
60 |
|
VA24-05 |
VA_West |
523100 |
7528754 |
731 |
144 |
330 |
60 |
|
VA24-06 |
VA_West |
523113 |
7528729 |
726 |
180 |
330 |
70 |
|
VA24-07 |
VA_West |
522990 |
7528722 |
735 |
98 |
330 |
60 |
|
VA24-08 |
VA_West |
523015 |
7528674 |
727 |
132 |
330 |
60 |
|
VA24-09 |
VA_West |
522912 |
7528692 |
735 |
168 |
330 |
60 |
|
VA24-10 |
VA_West |
522818 |
7528684 |
736 |
120 |
330 |
60 |
|
Exp13 |
VA_West |
522738 |
7528660 |
741 |
98 |
330 |
60 |
|
Exp14 |
VA_West |
522763 |
7528616 |
734 |
172 |
330 |
60 |
|
Exp15 |
VA_West |
523439 |
7528939 |
730 |
138 |
340 |
60 |
|
Exp04 |
VA_West |
523139 |
7528852 |
743 |
84 |
330 |
61 |
|
Exp07 |
VA_West |
523066 |
7528822 |
743 |
72 |
330 |
60 |
|
Exp10 |
VA_West |
522885 |
7528741 |
750 |
120 |
330 |
60 |
|
Exp08 |
VA_West |
523411 |
7528974 |
724 |
78 |
330 |
60 |
|
Exp17 |
VA_West |
523493 |
7528994 |
721 |
98 |
330 |
60 |
|
Jolie01 |
Jolie |
523883 |
7529918 |
680 |
120 |
330 |
60 |
|
Jolie02 |
Jolie |
523917 |
7530008 |
694 |
66 |
330 |
60 |
|
Jolie03 |
Jolie |
524046 |
7529973 |
705 |
150 |
330 |
60 |
|
VA_S_1 |
VA_South |
523716 |
7528300 |
725 |
260 |
270 |
60 |
|
VA_S_2 |
VA_South |
523796 |
7528300 |
725 |
300 |
270 |
60 |
|
VA_S_3 |
VA_South |
523876 |
7528300 |
725 |
360 |
270 |
60 |
|
VA_S_4 |
VA_South |
523956 |
7528300 |
725 |
380 |
270 |
60 |
|
VA_S_5 |
VA_South |
523723 |
7528500 |
725 |
260 |
270 |
60 |
|
VA_S_6 |
VA_South |
523796 |
7528500 |
735 |
320 |
270 |
60 |
|
VA_S_7 |
VA_South |
523876 |
7528489 |
725 |
380 |
270 |
60 |
|
VA_S_8 |
VA_South |
523956 |
7528500 |
732 |
380 |
270 |
60 |
|
|
|
|
Total metres: |
5,236 |
|
|
|
Boreholes VA24-01 to VA10 are completed, awaiting down-hole surveys, detailed recording, and sampling for chemical assay. Additional drilling might be required to test at depth, dependent onthe results to be obtained from the campaign.
Overview map of Norasa 2024 Q1 drill campaign on a radiometric background.
Figure 2: Overview map of Norasa 2024 Q1 drill campaign on a radiometric background.https://www.globenewswire.com/NewsRoom/AttachmentNg/38b9bda9-00f8-4a9f-b9db-85c1beade129
Qualified Persons Statement
The information in this release that relates to “project update” for the Norasa Project is based on information compiled or reviewed by Dr Guy Freemantle of The MSA Group (Pty) Ltd., South Africa. Dr Freemantle is a consultant for Valencia Uranium (Pty) Ltd. and is a member of the SACNASP. Dr Freemantle has sufficient experience and knowledge that is relevant to the style of mineralisation and type of deposits under consideration as well as to the activity that is being undertaken to fulfill requirements of a Qualified Person as per NI 43-101. Dr Freemantle consents to this release in the form and context in which it appears.
About Forsys Metals Corp.
Forsys Metals Corp. (TSX: FSY, FSE: F2T, NSX: FSY) is an emerging uranium developer focused on advancing its wholly-owned Norasa Uranium Project, located in the politically friendly jurisdiction of Namibia, Africa. The Norasa Uranium Project is comprised of the Valencia Uranium deposit (ML-149) and the nearby Namibplaas Uranium deposit (EPL-3638).
Further information is available at the Company website www.forsysmetals.com.
On behalf of the Board of Directors of Forsys Metals Corp. Richard Parkhouse, Director, Investor Relations.
For additional information please contact:
Richard Parkhouse, Director, Investor Relationsemail: rparhkhouse@forsysmetals.com email: info@forsysmetals.com
Forward-Looking Statement
Certain information contained in this press release constitutes "forward-looking information", within the meaning of Canadian legislation. Generally, these forward-looking statements can be identified by the use of forward-looking terminology such as "plans", "expects" or "does not expect", "is expected", "budget", "scheduled", "estimates", "forecasts", "intends", "anticipates" or "does not anticipate", or "believes", or variations of such words and phrases or state that certain actions, events or results "may", "could", "would", "might" or "will be taken", "occur", "be achieved" or "has the potential to". Forward looking statements contained in this press release are qualified in their entirety by the inherent risks and uncertainties surrounding future expectations. Among those factors which could cause actual results to differ materially are the following: market conditions and other risk factors listed from time to time in our reports filed with Canadian securities regulators on SEDAR at www.sedarplus.ca. The forward-looking statements included in this press release are made as of the date of this press release and Forsys Metals Corp disclaim any intention or obligation to update or revise any forward-looking statements, whether as a result of new information, future events or otherwise, except as expressly required by applicable securities legislation.
_____________________________¹ The Norasa Uranium Project (“Norasa”) is wholly-owned by the Company’s 100% subsidiary Valencia Uranium (Pty) Ltd. (“Valencia Uranium”) and comprises the Valencia uranium deposits (held under ML-149) ("Valencia”) and the Namibplaas uranium deposit (under EPL-3638, application for ML-251) (“Nambiplaas”).
Forsys Metals Corp
Figure 1
Permits obtained
TORONTO, March 07, 2024 (GLOBE NEWSWIRE) — Forsys Metals Corp. (TSX: FSY) (FSE: F2T) (NSX: FSY) (“Forsys” or the “Company”) is pleased to announce that the Ministry of Mines and Energy of the Republic of Namibia (“Ministry”) has renewed the Company’s Namibplaas Exclusive Prospecting License (“EPL”)– 3638, that forms part of its Norasa Uranium Project (“Norasa1”).
This licence has been renewed for a further two years until February 2026. In September 2022 Forsys has also made an application to the Ministry to convert EPL-3638 to a full 25-year Mining Licence (“ML"), and this submission is pending as ML-251. EPL-3638 remains in good standing while the Ministry processes Forsys’ ML-251 submission.
“EPL-3638 covers a strategic land position with significant exploration upside,” commented Pine Van Wyk, Forsys’ In-Country Director. “We greatly appreciate the Ministry’s continued support as we accelerate development of the Norasa project and continue to work closely with the Ministry in obtaining the ML.”
Permits obtained
Figure 1: Permits obtained
_________________________________1 The Norasa Uranium Project (“Norasa“) is wholly-owned by the Company’s 100% subsidiary Valencia Uranium (Pty) Ltd. (“Valencia Uranium”) and comprises the Valencia uranium deposits (held under ML-149) ("Valencia”) and the Namibplaas uranium deposit (under EPL-3638, application for ML-251) (“Nambiplaas”).
About Forsys Metals Corp.
Forsys Metals Corp. (TSX: FSY, FSE: F2T, NSX: FSY) is an emerging uranium developer focused on advancing its wholly-owned Norasa Uranium Project, located in the politically friendly jurisdiction of Namibia, Africa. The Norasa Uranium Project is comprised of the Valencia Uranium deposit (ML-149) and the nearby Namibplaas Uranium deposit (EPL-3638).
Further information is available at the Company website www.forsysmetals.com
On behalf of the Board of Directors of Forsys Metals Corp. Richard Parkhouse, Director, Investor Relations.
For additional information please contact: Richard Parkhouse, Director, Investor Relationsemail: rparkhouse@forsysmetals.com
Forward Looking Statement
Certain information contained in this press release constitutes "forward-looking information", within the meaning of Canadian legislation. Generally, these forward-looking statements can be identified by the use of forward-looking terminology such as "plans", "expects" or "does not expect", "is expected", "budget", "scheduled", "estimates", "forecasts", "intends", "anticipates" or "does not anticipate", or "believes", or variations of such words and phrases or state that certain actions, events or results "may", "could", "would", "might" or "will be taken", "occur", "be achieved" or "has the potential to". Forward looking statements contained in this press release are qualified in their entirety by the inherent risks and uncertainties surrounding future expectations. Among those factors which could cause actual results to differ materially are the following: market conditions and other risk factors listed from time to time in our reports filed with Canadian securities regulators on SEDAR at www.sedar+.com. The forward-looking statements included in this press release are made as of the date of this press release and Forsys Metals Corp disclaim any intention or obligation to update or revise any forward-looking statements, whether as a result of new information, future events or otherwise, except as expressly required by applicable securities legislation.
A photo accompanying this announcement is available at https://www.globenewswire.com/NewsRoom/AttachmentNg/9390ef6c-7a69-4f1a-9a4f-a91f49d22e5f
If you would like to receive our free newsletter via email, simply enter your email address below & click subscribe.
 Follow us on Twitter
 Become our facebook fan
CONNECT WITH US
Tweets
Tweet with hash tag #miningfeeds or @miningfeeds and your tweets will be displayed across this site.
MOST ACTIVE MINING STOCKS
Daily Gainers
 CMC Metals Ltd. CMC Metals Ltd. |
CMB.V | +900.00% |
 Eden Energy Ltd Eden Energy Ltd |
EDE.AX | +200.00% |
| GoviEx Uranium Inc. |
GXU.V | +42.86% |
| Eagle Nickel Ltd. |
ENL.AX | +41.67% |
| Citigold Corp. Limited |
CTO.AX | +33.33% |
| Mount Burgess Mining NL |
MTB.AX | +33.33% |
| Exalt Resources Limited |
ERD.AX | +31.94% |
| Casa Minerals Inc. |
CASA.V | +30.00% |
| Cariboo Rose Resources Ltd |
CRB.V | +28.57% |
| Belmont Resources Inc. |
BEA.V | +28.57% |


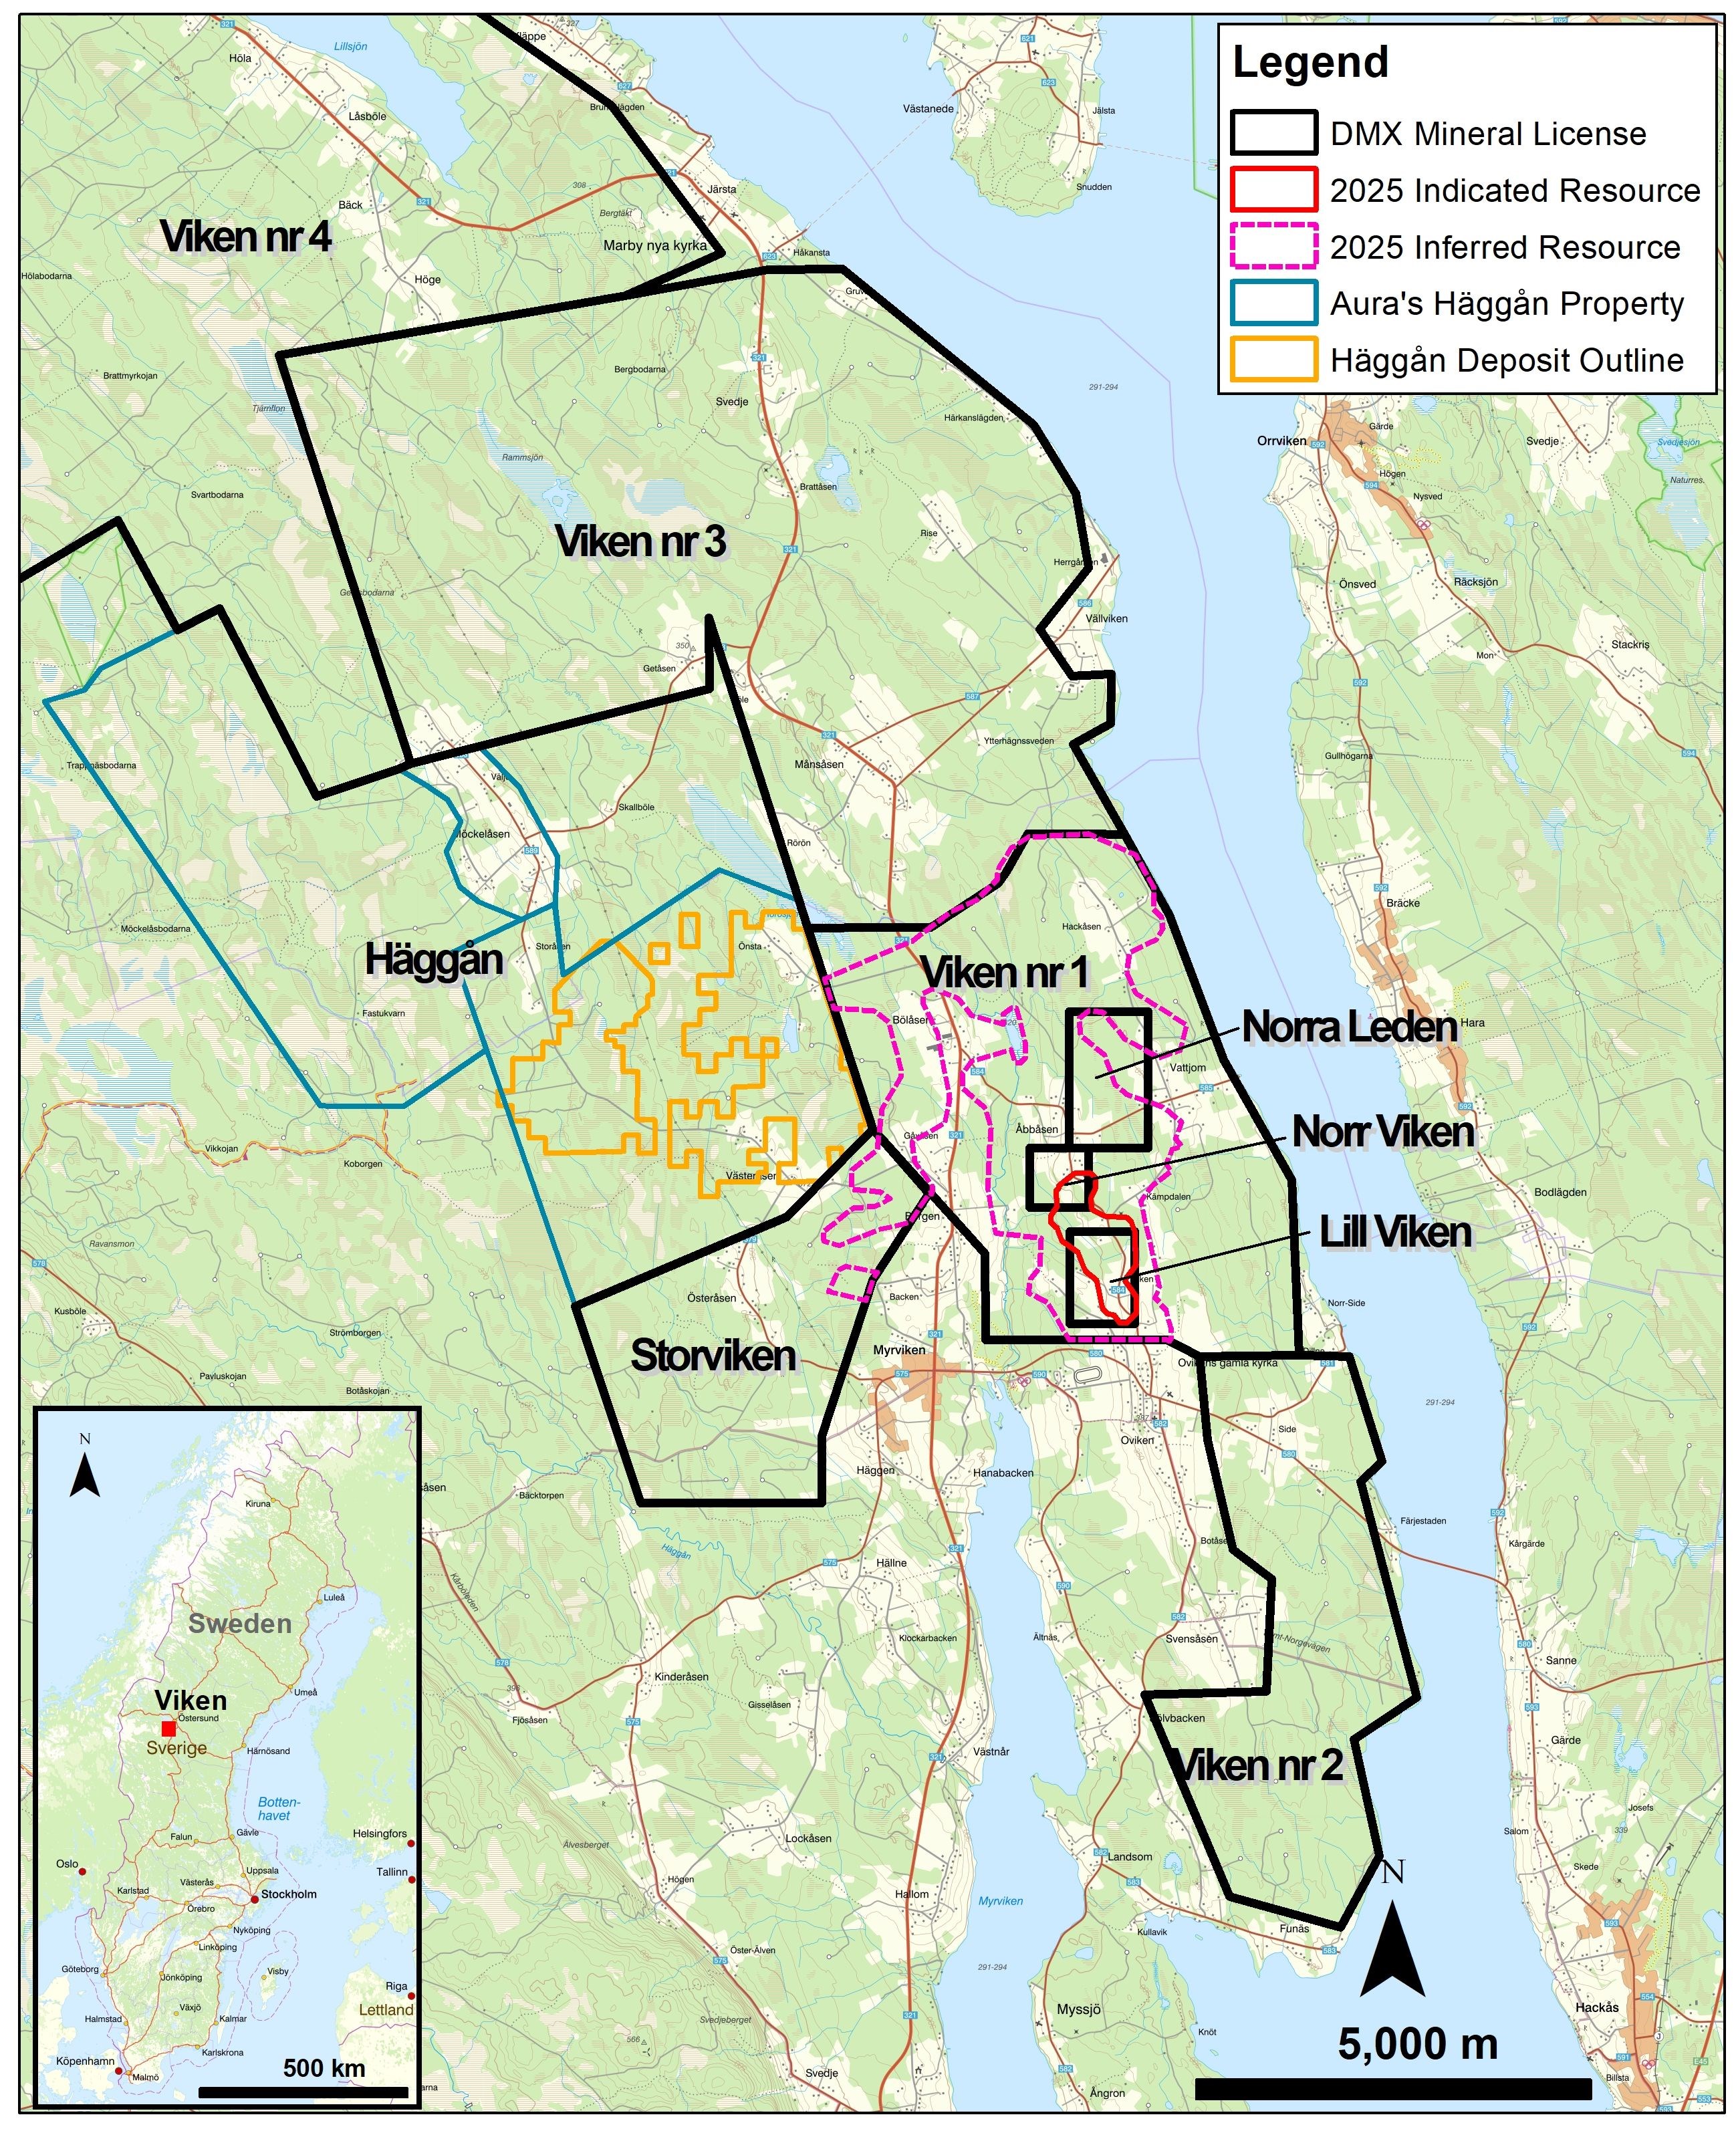
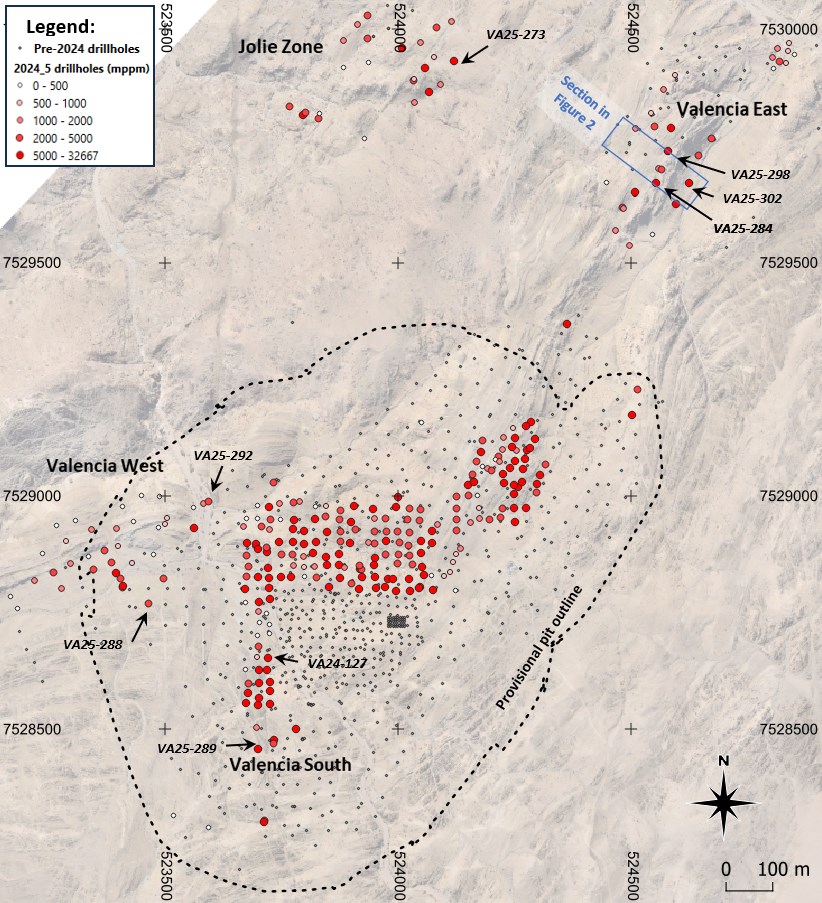
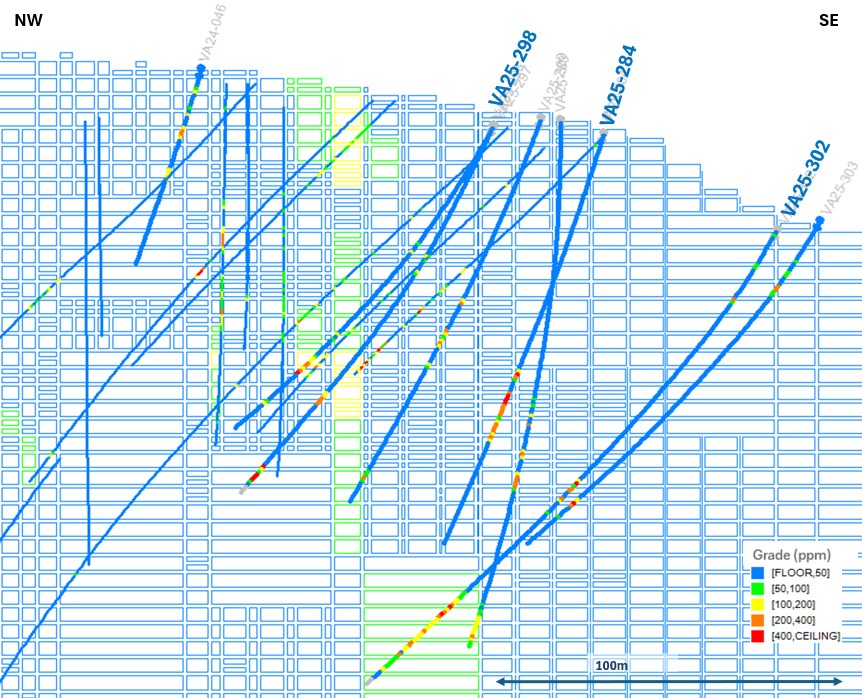