Harmony Gold Mining Company Limited (NYSE:HMY) is one of the top cheap stocks to buy with the biggest upside potential. Harmony Gold Mining Company Limited (NYSE:HMY) announced on April 29 that the MSCI upgraded the company’s environmental, social, and governance (ESG) rating from ‘BB’ to ‘A’ after its most recent assessment in March 2026. Management stated that the improvement points towards the company’s bolstered performance across key ESG pillars, and is supported by measurable progress in toxic emissions and waste reduction, water management, and enhanced governance practices.
Harmony Gold Mining Company Limited (NYSE:HMY) further reported that its environmental pillar score improved from 3.0 to 5.1, while its social score improved from 2.4 to 4.7, which shows concrete progress in community relations, operational efficiency, and employee engagement. In addition, governance remains a “core strength”, according to the company, with a consistently high score of 7.4.
In a separate development, Harmony Gold Mining Company Limited (NYSE:HMY) was upgraded to Overweight from Equal Weight by Morgan Stanley on April 16, with the firm lifting the price target on the stock to ZAR 34,000 from ZAR 30,000.
Harmony Gold Mining Company Limited (NYSE:HMY) is a gold mining and exploration company with a copper footprint that includes an open-pit mining operation, nine deep-level mines, and a number of surface retreatment facilities. Its operations are divided into the following segments: Tshepong North, Tshepong South, Moab Khotsong, Joel, Doornkop, Target 1, Kusasalethu, Masimong, Mponeng, Mine Waste Solutions, and Hidden Valley.
While we acknowledge the potential of HMY as an investment, we believe certain AI stocks offer greater upside potential and carry less downside risk. If you're looking for an extremely undervalued AI stock that also stands to benefit significantly from Trump-era tariffs and the onshoring trend, see our free report on the best short-term AI stock.
READ NEXT: 15 Stocks That Will Make You Rich in 10 Years AND 12 Best Stocks That Will Always Grow.
Disclosure: None. Follow Insider Monkey on Google News.
AngloGold Ashanti PLC AU and Harmony Gold Mining Co. Ltd. HMY are two prominent gold mining companies with a diversified portfolio of mines. Both AU and HMY are gaining from the surge in gold prices.Gold prices are benefiting from safe-haven demand, heightened geopolitical risks and trade tensions. The prices of gold are currently trading near $4,990 per ounce. The yellow metal has advanced 63.6% in a year.For investors seeking to ride this momentum, the question is: which stock offers better value? Let us examine the fundamentals, growth prospects and challenges for AngloGold Ashanti and Harmony Gold.
The Case for AU
AngloGold Ashanti, headquartered in Greenwood Village, CO, has operations in Argentina, Australia, Brazil, the Democratic Republic of the Congo, Egypt, Ghana, Guinea and Tanzania. In October 2025, it bolstered its asset base with the acquisition of Augusta Gold Corp. This addition expands AU’s footprint in the Beatty District of Nevada through the acquisition of the Reward and Bullfrog properties.AngloGold Ashanti also expanded its portfolio in November 2024 with the acquisition of Egyptian gold producer Centamin, adding the large-scale, long-life Sukari mine, which has the potential to produce 500,000 ounces annually. The Sukari mine produced a record 500,000 ounces of gold in 2025, positioning itself as a Tier 1 asset for the company.AU’s adjusted EBITDA surged 129% year over year in 2025 to a record $6.3 billion. This was driven by a 16% year-over-year increase in gold production in the year and higher metal prices. The upside in gold production was attributed to the contributions from the recently acquired Sukari mine and the solid performances of Obuasi, Siguiri, Geita, Cerro Vanguardia and Cuiabá.Gold production for 2026 is projected at 2.80-3.17 million ounces, suggesting a year-over-year dip of 3% at the mid-point. Higher costs are also expected to weigh on the company’s performance in 2026.The company has been facing headwinds from higher operating costs for the last few quarters due to inflationary cost pressures from increased labor and mining contractor costs. However, the impacts of these elevated costs on its earnings were offset by higher sales volumes and prices.AngloGold Ashanti generated a record $2.9 billion in free cash flow in 2025, a 204% year-over-year whopping rise. The company ended the year with $4.4 billion in liquidity, including cash and cash equivalents of $2.9 billion.AU remains focused on its Full Asset Potential program to offset the inflationary impacts. AngloGold Ashanti’s significant exploration success over the past five years has added 23.1 million ounces to its gold mineral reserve (including acquisitions and before accounting for depletion). At the end of Dec. 31, 2025, the company’s gold mineral reserve was 36.5 million ounces, marking the ninth consecutive year of annual increase in gold mineral reserve.
The Case for HMY
Harmony Gold is South Africa's biggest gold producer by volume, with production of 724,099 ounces in the first half of fiscal 2026. The company has been delivering over a decade of production consistency and is currently on track to meet fiscal 2026 guidance of 1.4 million to 1.5 million ounces. In fiscal 2025, the company produced 1.48 million ounces. The company’s adjusted EBITDA increased 39% year over year in the first half of fiscal 2026, ending on Dec. 31, 2025. Harmony Gold has a diverse portfolio of gold development projects spread across South Africa and Papua New Guinea. Harmony Gold is also progressing with development projects, including the Eva Copper project in Australia and its Tier 1 joint venture asset, the Wafi-Golpu copper-gold project. HMY is focused on strengthening its position as a higher-quality, lower-risk global gold and copper producer, which will be aided by these projects.Harmony Gold acquired the CSA Copper Mine in Australia in October 2025 and has been focused on integrating the mine into the company’s operating standards. CSA is the highest-grade copper mine in Australia with expansion potential. However, the company faces headwinds from higher costs. In the first half of fiscal 2026, the all-in sustaining cost increased 21% year over year. The company’s all-in sustaining cost guidance for fiscal 2026 indicates a year-over-year increase, suggesting inflationary pressure and higher sustaining capital expenditure. Nonetheless, Harmony Gold boasts a strong balance sheet and generates substantial cash flows, which allows it to finance its development projects and drive shareholder value. Its net debt/EBITDA was at 0.18X and liquidity was $895 million at the end of Dec. 31, 2025.
How Do Estimates Compare for AU & HMY?
The Zacks Consensus Estimate for AngloGold Ashanti’s 2026 earnings is pegged at $9.27 per share, indicating a year-over-year upsurge of 72.6%. The estimates for 2026 have been trending north over the past 60 days.
Image Source: Zacks Investment Research
The Zacks Consensus Estimate for Harmony Gold’s earnings for 2026 is pegged at $2.65 per share, indicating a year-over-year jump of 108.7%. The estimates for both years have been trending south over the past 60 days.
Image Source: Zacks Investment Research
AU & HMY: Price Performance & Valuation Comparisons
In the past year, the AU stock has skyrocketed 194.6%, whereas HMY has climbed 28.7%.
Image Source: Zacks Investment Research
HMY is currently trading at a forward 12-month earnings multiple of 5.68X, lower than its five-year median. AU is currently trading at a forward 12-month earnings multiple of 10.42X, lower than its five-year median.
Image Source: Zacks Investment Research
AU or HMY: Which Is the Better Pick?
Both AngloGold Ashanti and Harmony Gold are well-positioned to benefit from the ongoing rally in gold prices, along with their efforts to grow their production capabilities. AngloGold Ashanti has delivered a stronger one-year price performance than HMY. In addition, AU’s recent upward estimate revision, in contrast to HMY’s downward trend, gives it an edge. Given these factors, AU appears to be a more compelling investment choice right now. HMY currently carries a Zacks Rank #4 (Sell), whereas AU carries a Zacks Rank #3 (Hold).You can see the complete list of today’s Zacks #1 Rank (Strong Buy) stocks here.
Want the latest recommendations from Zacks Investment Research? Today, you can download 7 Best Stocks for the Next 30 Days. Click to get this free report
AngloGold Ashanti PLC (AU) : Free Stock Analysis Report
Harmony Gold Mining Company Limited (HMY) : Free Stock Analysis Report
This article originally published on Zacks Investment Research (zacks.com).
This article first appeared on GuruFocus.
- Gold Revenue: Increased by 20% to ZAR44 billion.
- EBITDA: Rose 39% to ZAR18 billion.
- Operating Profit: Increased by 61% to ZAR16 billion.
- Net Profit: Increased by 24% to ZAR10 billion.
- Free Cash Flows: Strong generation, contributing to a 61% increase in operating profit.
- All-in Sustaining Costs: Rose to ZAR1.18 million per kilogram or USD2,115 per ounce.
- Interim Dividend: More than doubled to ZAR3.4 billion.
- Net Debt to EBITDA: At 0.18 times, well below the 1x threshold.
- Gold Production: 724,000 ounces for the reporting period.
- Dividend Policy: Revised to allow up to 50% of net free cash as a dividend.
- Cash and Undrawn Facilities: Around ZAR15 billion or USD900 million.
- Capital Expenditure: Total group capital expected to be ZAR18.5 billion for FY26.
- Warning! GuruFocus has detected 4 Warning Sign with GBERF.
- Is HMY fairly valued? Test your thesis with our free DCF calculator.
Release Date: March 11, 2026
For the complete transcript of the earnings call, please refer to the full earnings call transcript.
Positive Points
- Harmony Gold Mining Co Ltd (NYSE:HMY) reported a significant increase in operating profit by 61%, reflecting strong financial performance.
- The company has revised its dividend policy to potentially return up to 50% of net free cash to shareholders, indicating confidence in cash flow generation.
- Harmony Gold Mining Co Ltd (NYSE:HMY) achieved an all-time low lost time injury frequency rate of 4.23, emphasizing its commitment to safety.
- The integration of CSA, Australia's highest-grade copper mine, is progressing well, with significant cost reductions since acquisition.
- The company is strategically investing in copper projects like Eva and CSA to diversify and enhance its portfolio, aiming for long-term growth and resilience.
Negative Points
- Harmony Gold Mining Co Ltd (NYSE:HMY) faced challenges with a cyanide shortage and lower plant recoveries, impacting gold production.
- The company's underground recovered grades decreased by 11% to 5.7 grams per tonne, affecting overall production efficiency.
- Group all-in sustaining costs rose to ZAR1.18 million per kilogram or USD2,115 per ounce, driven by lower volumes and higher royalties.
- The Hidden Valley production was disrupted by a tectonic-related mill motor failure and gold shipping delays.
- The development of the Upper Merrin mine has been paused, pending further drilling to improve orebody confidence, delaying potential production increases.
Q & A Highlights
Q: Could you address the impact of the cyanide shortage and lower recoverability issues? A: The cyanide shortage was a one-off issue due to a force majeure by our sole liquid cyanide supplier in South Africa. We have since normalized levels and are constructing a cyanide dissolution plant to mitigate future risks. The lower recoverability was due to variability in the plant process, but recoveries have now normalized.
Q: Can you elaborate on the new dividend policy and its implications if leverage exceeds 1x? A: The revised policy allows for up to 50% of net free cash to be returned to shareholders, subject to Board discretion and net debt to EBITDA levels. If leverage exceeds 1x, the Board will consider the situation at each reporting period to determine the appropriate dividend payout.
Q: What are the main constraints at the CSA mine, and what steps are being taken to address them? A: The main constraint at CSA is the ventilation circuit, which limits underground mining activities. We are working on establishing additional returns to improve ventilation. Other short-term issues include infrastructure maintenance, such as fixing shaft steelwork. We expect to optimize the mine over the next 18 to 24 months.
Q: How does the acquisition of CSA and Eva Copper impact Harmony's strategy regarding Wafi-Golpu? A: Wafi-Golpu remains a generational asset for Harmony. The focus is on obtaining the necessary permits to advance the project. The acquisition of CSA and Eva Copper strengthens our position and provides optionality, but Wafi-Golpu continues to be a priority due to its quality ore body.
Q: What is the expected production rate for CSA once optimization is complete? A: Currently, CSA is targeting 17,500 to 18,500 tonnes of copper for this financial year. The processing plant has a capacity of 1.8 million tonnes, and we aim to alleviate constraints to increase production. However, it will take time to achieve steady-state production.
For the complete transcript of the earnings call, please refer to the full earnings call transcript.
TORONTO, March 10, 2026 (GLOBE NEWSWIRE) — Goliath Resources Limited (TSX-V: GOT) (OTCQX: GOTRF) (Frankfurt: B4IF) (the "Company" or "Goliath"), further to its press release dated January 22, 2026 (the “Prior Press Release”), is very pleased to announce that it has received TSX Venture Exchange (“TSXV”) approval and has issued 3,000,000 common shares (the “Consideration Shares”) to The J2 Syndicate and J2 Syndicate Holdings Ltd. (the “Optionors”) pursuant to an amending agreement dated January 21, 2026 (the “Amending Agreement”) which amends its existing property option agreement with the Optionors (the “Option Agreement”) in respect of its Golddigger Property located in the Golden Triangle, B.C., which hosts the high-grade Surebet Gold Discovery. The Consideration Shares have a four month plus one day hold period from the date of issuance.
As a result of the issuance of the Consideration Shares, Goliath has earned the remaining 51% ownership interest in the Golddigger Property and now holds a 100% interest in the property. In addition, Goliath has bought down 1% of the 3% Net Smelter Returns (“NSR”) reducing it to a 2% NSR held by the Optionors.
Other key features of the Amending Agreement include:
- Goliath must publish a mineral resource estimate (“MRE”) on or before June 1, 2030, and thereafter on every three-year anniversary of June 1, 2030;
- Goliath will be required to pay the Optionors US$1 for every gold equivalent ounce over 4,000,000 gold equivalent ounces disclosed in an MRE rather than US$1 for every gold equivalent ounce over 2,000,000 gold equivalent ounces; and
- should there be a change of control prior to Goliath publishing an MRE, the acquirer would assume the obligations of the Company under the Option Agreement, including the requirement to deliver an MRE would be changed from June 1, 2030 to the third anniversary of the date of completion of such change of control.
Proposed McEwen Inc. Warrant Extension
The Company will not be proceeding with the proposed extension of the expiry date of the warrants issued to McEwen Inc., as first disclosed in the Company’s news release dated February 28, 2026. The TSXV did not approve the request as determined by the nature of McEwen Inc. acquiring Goliath units initially press released on January 9, 2025 and completed as an “expedited acquisition” that is treated according to their Policy 5.3. Accordingly, McEwen Inc.'s 2,590,673 common share purchase warrants of the Company with a strike price of $2.50 will expire end of day, March 10, 2026.
About Goliath Resources Limited
Goliath Resources is an explorer of precious metals projects in the highly prospective Golden Triangle of Northwestern British Columbia. All of its projects are in high quality geological settings and geopolitical safe jurisdictions amenable to mining in Canada. Goliath is a member and active supporter of CASERM which is an organization that represents a collaborative venture between Colorado School of Mines and Virginia Tech. Goliath completed its largest fully funded drill campaign to date for a total of 64,364 meters in 2025. It is fully funded for a similar sized drill program in 2026. The Company’s key strategic cornerstone shareholders include Crescat Capital, a Global Commodity Group (Singapore), McEwen Inc. (NYSE: MUX) (TSX: MUX), Waratah Capital Advisors, Rob McEwen, Eric Sprott and Larry Childress.
For more information please contact:
Goliath Resources Limited
Mr. Roger Rosmus Founder and CEO Tel: +1.416.488.2887roger@goliathresources.com www.goliathresourcesltd.com
This press release contains statements that constitute “forward-looking information” (“forward-looking information”) within the meaning of the applicable Canadian securities legislation. All statements, other than statements of historical fact, are forward-looking information and are based on expectations, estimates and projections as at the date of this news release. Any statement that discusses predictions, expectations, beliefs, plans, projections, objectives, assumptions, future events or performance (often but not always using phrases such as “expects”, or “does not expect”, “is expected”, “anticipates” or “does not anticipate”, “plans”, “budget”, “scheduled”, “forecasts”, “estimates”, “believes” or “intends” or variations of such words and phrases or stating that certain actions, events or results “may” or “could”, “would”, “might” or “will” be taken to occur or be achieved) are not statements of historical fact and may be forward-looking information. Forward-looking statements in this news release include statements regarding the terms of the Option Agreement as amended by the Amending Agreement. In disclosing the forward-looking information contained in this press release, the Company has made certain assumptions. Although the Company believes that the expectations reflected in such forward-looking information are reasonable, it can give no assurance that the expectations of any forward-looking information will prove to be correct. Known and unknown risks, uncertainties, and other factors which may cause the actual results and future events to differ materially from those expressed or implied by such forward-looking information. Such factors include but are not limited to: compliance with extensive government regulations; domestic and foreign laws and regulations adversely affecting the Company’s business and results of operations; and general business, economic, competitive, political and social uncertainties. Accordingly, readers should not place undue reliance on the forward-looking information contained in this press release. Except as required by law, the Company disclaims any intention and assumes no obligation to update or revise any forward-looking information to reflect actual results, whether as a result of new information, future events, changes in assumptions, changes in factors affecting such forward-looking information or otherwise.
Neither the TSX Venture Exchange nor its Regulation Services Provider (as that term is defined in the policies of the TSX Venture Exchange) accepts responsibility for the adequacy or accuracy of this release.
Vancouver, British Columbia–(Newsfile Corp. – March 10, 2026) – Gold Runner Exploration Inc. (CSE: GRUN) (FSE: CE70) ("Gold Runner" or the "Company") is pleased to announce its intention to complete a non-brokered private placement financing (the "Offering") for proceeds of up to $1,500,000 consisting of Critical Minerals Exploration Tax Credit ("CMETC") flow-through units ("FT Units") of the Company at a price of $1.45 per FT Unit and charity flow-through Units ("Charity FT Units", and collectively with the "FT Units", the "Units")) at a price of $1.45 per Charity FT Unit. The Company reserves the right to increase the size of the Offering, subject to the approval of the Canadian Securities Exchange (the "Exchange"). Each Unit will be comprised of one common share ("Common Share") of the Company and one Common Share purchase warrant (the "Warrants"), and each Warrant will entitle the holder thereof to acquire one Common Share of the Company at a price of $1.50 per Common Share for a period of 36 months from the date of issuance.
The securities issued under the Offering will have a hold period expiring four months and one day from the date of issuance pursuant to applicable Canadian securities laws. Closing of the Offering remains subject to regulatory approvals, including approval of the CSE.
Net proceeds from the Offering will be used for exploration of the Company's Golden Girl property situated in the Golden Triangle of British Columbia. The Company optioned the Golden Girl Property from the B-ALL Syndicate, the same team that generated and staked Goliath Resources (TSXV: GOT) Surebet Discovery and contributed to advancing that discovery to where it is today. The B-ALL Syndicate also generated and staked the Big One discovery that was subsequently optioned to Juggernaut Exploration (TSXV: JUGR) and is situated adjacent to Galore Creek. Golden Girl is located approximately mid-way between Goliath's Surebet Discovery and Juggernaut's Big One discovery.
This Offering qualifies for the Critical Mineral Exploration Tax Credit (CMETC) and each Unit shall be comprised of one common share of the Company that will qualify as a CMETC "flow-through share" (within the meaning of subsection 66(15) of the Income Tax Act (Canada)). The Company will incur expenditures that will qualify as "Canadian Exploration Expenses" and "flow-through critical mineral mining expenditures" as those terms are defined in the Income Tax Act (Canada), which will be renounced to the purchasers of the FT Units with an effective date no later than December 31, 2026.
The Company may pay finder's fees to eligible arm's-length third parties on gross proceeds of the Offering, consisting of 6% cash and/or 6% broker warrants, with each broker warrant exercisable for a period of 36 months from the date of issuance at a price of $1.50 per Common Share.
The securities have not been, and will not be, registered under the United States Securities Act of 1933, as amended (the "U.S. Securities Act"), or any U.S. state security laws, and may not be offered or sold in the United States without registration under the U.S. Securities Act and all applicable state securities laws or compliance with requirements of an applicable exemption therefrom. This press release shall not constitute an offer to sell or the solicitation of an offer to buy securities in the United States, nor shall there be any sale of these securities in any jurisdiction in which such offer, solicitation or sale would be unlawful.
On Behalf of the Board of Directors,
"Chris Wensley"
Chris Wensley, Director & Chief Executive Officer
About Gold Runner Exploration Inc.
Gold Runner Exploration is an exploration company focused on the exploration and development of its portfolio of gold and silver properties located in prolific mining districts of Canada and the United States of America. In British Columbia, Gold Runner holds the option to acquire a 100% interest in the Golden Girl Property, located in the prolific Golden Triangle of Northwestern British Columbia. In North Central Nevada, the Company holds the Rock Creek gold project, the Falcon Mine project and the Dry Creek project, located in the Tuscarora Mountains in close proximity to the world-renowned Carlin Trend. Gold Runner also holds a 10% carried interest in the Cimarron project located in the San Antonio Mountains of Nye County, Nevada, within the Walker Lane Trend.
For further information please contact:
Chris Wensley, Chief Executive Officer and Director639 5th Ave, Suite 1250Calgary, Alberta T2P 0L3Website: www.goldrunnerexploration.comEmail: info@goldrunnerexploration.com
Forward-Looking Information
This news release includes certain information that may be deemed "forward-looking information" under applicable securities laws. All statements in this release, other than statements of historical facts, including but not limited to those that address the Offering, completion (if any) and timing of the same and proposed use of proceeds from the Offering, acquisition of any properties and future work thereon, mineral resource and reserve potential, exploration activities and corporate initiatives. Although the Company believes the expectations expressed in such statements are based on reasonable assumptions, such statements are not guarantees of future performance and actual results or developments may differ materially from those in the statements. There are certain factors that could cause actual results to differ materially from those in the forward-looking information. These include the results of the Company's due diligence investigations, market prices, exploration successes, continued availability of capital financing, and general economic, market or business conditions, and those additionally described in the Company's filings with the Canadian securities authorities.
Investors are cautioned that any such statements are not guarantees of future performance and actual results or developments may differ materially from those projected in the forward-looking information. For more information on the Company, investors are encouraged to review the Company's public filings at www.sedarplus.ca. The Company disclaims any intention or obligation to update or revise any forward-looking information, whether as a result of new information, future events or otherwise, other than as required by law.
NEITHER THE CANADIAN SECURITIES EXCHANGE NOR ITS REGULATION SERVICES PROVIDER HAS REVIEWED OR ACCEPT RESPONSIBILITY FOR THE ADEQUACY OR ACCURACY OF THIS RELEASE
To view the source version of this press release, please visit https://www.newsfilecorp.com/release/287921
VANCOUVER, BC / ACCESS Newswire / February 18, 2026 / Lupaka Gold Corp. ("Lupaka" or the "Company") (TSXV:LPK)(FRA:LQP) advises as to current progress in pursing the proceeds of the ICSID Arbitration Award initially announced by the Company on July 2, 2025.
On December 31,2025, the Peru Ministry of Mining issued a supreme decree stating that the Ministry of Mines would be carrying out promotional activities at this year's Prospectors & Developers Association of Canada (PDAC) March 1-4, 2026 in Toronto, Canada in an effort to promote investment and foreign-funded development in Peru.
The Company wishes to remind the Republic of Peru and the Peru Ministry of Mines specifically that while they are promoting Peru as a good place to invest they are delinquent in their obligations regarding the Lupaka Gold Arbitration Award issued on June 30, 2025 by the ICSID Tribunal and the related Free Trade Agreement with Canada. It would be prudent for Peru to arrange for the payment of the Company's arbitration award prior to PDAC.
From a recent article in Bloomberg, the Chief Executive of one of Peru's largest banks stated "We continue to have cautious optimism, but we are even a little bit more upbeat because Peru's macroeconomic indicators are performing pretty well," Blomberg continued "Peru is one of Latin America's most stable economies-with low inflation and a strong currency-and a top exporter of copper and gold at a time of record-setting metal prices".
Gordon Ellis (CEO) commented "During this lengthy arbitration and award collection process, the price of gold has ascended from US1,500 to nearly US5,000 per ounce. From all accounts, Peru is financially strong and we see no reason why Peru cannot pay the Award amount immediately."
Award Background: In December 2019, the Company initiated an arbitration claim against the Republic of Peru under the Canada-Peru Free Trade Agreement. The related arbitration process was conducted through the International Centre for Settlement of Investment Disputes (ICSID) and continued until the ICSID Tribunal issued an Award in favour of the Company on June 30, 2025.
Subsequent to the Award date, Peru had 120 days in which to challenge the Award via a request for an annulment. The 120-day period passed on October 28, 2025, with no annulment being requested. Having no further recourse, the Republic of Peru must pay the Award amounts, otherwise risking serious impacts to its desired reputation as a welcoming mining jurisdiction that protects foreign investment.
As of January 31, 2026, accrued interest has brought the total Award to US$68.2 million.
For ongoing updates and more detail with respect to the Arbitration Award, please refer to the Company's website (www.lupakagold.com/projects/arbitration).
For background on the basis for the Claim, please refer to the Company's previous news releases, also available on the Company's website (www.lupakagold.com/news).
Lupaka was represented in the arbitration proceedings by the international law firm LALIVE (www.lalive.law), with the financial backing of Bench Walk Advisors (www.benchwalk.com). Both firms continue to be involved until the Award proceeds are received.
Neither the TSX Venture Exchange nor its Regulation Service Provider (as the term is defined in the policies of the TSX Venture Exchange) accepts responsibility for the adequacy of this news release.
About Lupaka Gold
Lupaka is a Canadian-based company focused on creating shareholder value through the identification and development of mining assets.
About LALIVE
LALIVE is an international law firm with offices in Geneva, Zurich and London, that specializes in international dispute resolution. The firm has extensive experience in international investment arbitration in the mining sector, amongst others, and is currently representing investors and States as counsel worldwide.
About Bench Walk Advisors
Bench Walk Advisors is a global litigation financier with over USD 250 million of capital deployed across in excess of 100 commercial cases. Bench Walk and its principals have consistently been ranked as leading lawyers and litigation funders in various global directories.
FOR FURTHER INFORMATION PLEASE CONTACT:
Gordon Ellis, C.E.O.gellis@lupakagold.com|Tel: (604) 985-3147
or visit the Company's profile at www.sedar.com or its website at www.lupakagold.com
SOURCE: Lupaka Gold Corp.
View the original press release on ACCESS Newswire
Vancouver, British Columbia–(Newsfile Corp. – January 23, 2026) – Gold Runner Exploration Inc. (CSE: GRUN) (FSE: CE7) ("Gold Runner" or the "Company") is pleased to announce that it has entered into an Option Agreement with the B-ALL Syndicate Ltd. ("B-All" or the "Optionor") to acquire a 100% interest in the Golden Girl Property ("Golden Girl Property", "Golden Girl" or "Property"), from the B-ALL Syndicate.
Chris Wensley, CEO of Gold Runner states, "We are excited to begin exploration on the Golden Girl property located in an underexplored part of British Columbia's renowned Golden Triangle. The excellent work done by the B-ALL Syndicate team who generated the property allows us to get right into it with follow up prospecting and mapping of known high-grade gold targets in preparation for future drilling. This is the same team that generated and staked Goliath Resources (TSXV: GOT), Surebet Discovery and contributed to advancing that discovery to where it is today. The B-ALL Syndicate also generated and staked the Big One discovery that was subsequently optioned to Juggernaut Exploration (TSXV: JUGR), who are actively exploring the project with drilling to commence this summer. We are looking forward to unlocking the full potential of this brand new discovery and bring long term value to our share holders."
Golden Girl is only 17 kilometers (km) from the Snip Mine and 14 km from the Bronson Air Strip, making for cost-effective exploration in the heart of the Golden Triangle of North-Western British Columbia.
Recent exploration, conducted by B-ALL, has identified a large new gold-silver system measuring 12 km by 7 km on the Golden Girl Property. The system features a gold-rich core surrounded by a silver-rich halo. Highlights from the 2024 exploration program include grab samples assaying up to 11.28 g/t Au, 3,262 g/t Ag, 5.37% Cu, 20% Pb, and 14.15% Zn and channel cuts assaying up to 3.74 g/t Au, 2105.45 g/t Ag, 0.88% Cu, 5.48% Pb and 7.42% Zn. Forty-seven (47) samples collected on the Property returned values exceeding 1 g/t AuEq (see table below for samples >1 g/t AuEq).
The Golden Girl property covers an area of 8,471 hectares (ha) located in the Iskut River region of Northwestern British Columbia. This acquisition places the Company in a richly endowed, underexplored geologic terrane in the heart of the Golden Triangle, approximately 17 km from the past-producing Snip Gold Mine, which historically produced approximately 1 million ounces of gold, 390,000 ounces of silver and 249,276 kilograms of copper (at an average 127.5 grams per ton gold over 8 years). Eskay Creek, which lies approximately 60 km east of Golden Girl, produced approximately 3.3 million ounces of gold and 160,000 ounces of silver between 1994 and 2008 (with an estimated 3.3 million ounces of gold, 88 million ounces of silver in reserves). Golden Girl is also located approximately mid-way between Goliath Resources Limited's Gold Digger/Surebet discovery and Juggernaut Exploration Ltd.'s Big One property, almost next door to Newmont's Galore Creek. The reader is reminded that the information provided herein from neighbouring projects and properties is not necessarily indicative of resources and should not be relied upon for the determination of mineralization or potential results of the Company's properties.
To view an enhanced version of this graphic, please visit:https://images.newsfilecorp.com/files/7042/281374_299315b9d415d99a_002full.jpg
High-grade mineralization at Golden Girl occurs in structurally controlled shear zones within sulphide-rich veins, stockwork, and breccias, similar to the nearby Snip Gold Mine. Hydrothermal fluids took advantage of pre-existing structures to deposit gold-silver rich mineralization as well as sulphides such as chalcopyrite, galena and sphalerite associated with quartz-carbonate rich veins. Pervasive alteration associated with fluid infiltration is often observed surrounding the zones of strong gold-silver mineralization.
More than 95% of the Golden Girl property remains unexplored. Rapid glacial retreat and snowpack abatement over the last 35 years have revealed vast areas of new outcrop that have never seen historical surface exploration. The Company is planning additional prospecting, sampling and mapping in areas surrounding the known mineralized showings, as well as detailed work augmented by geophysical survey in areas around the known drill ready targets in preparation for the inaugural drill program.
The Golden Girl Property is strategically located near major regional infrastructure with year-round helicopter access from the Forrest Kerr Road (39 km east), as well as in close proximity to a maintained power line and an active air strip. The project exploration qualifies for the Critical Mineral Exploration Tax Credit (CMETC).
Table 1: Golden Girl Property Samples with assays >1 g/t AuEq.
| Sample ID | Sample Type | Au (g/t) | Ag (g/t) | Cu (%) | Pb (%) | Zn (%) | AuEq (g/t) |
| D751631 | Grab | 5.50 | 3261.82 | 1.09 | 8.78 | 0.45 | 45.16 |
| D751628 | Grab | 8.59 | 1769.68 | 2.86 | 17.40 | 10.60 | 38.39 |
| D751915 | Grab | 0.92 | 2531.45 | 1.89 | 3.40 | 10.40 | 35.12 |
| D751738 | Channel | 3.74 | 2105.45 | 0.88 | 5.48 | 7.42 | 31.66 |
| D751551 | Grab | 11.28 | 1465.23 | 0.23 | 0.51 | 0.41 | 28.14 |
| D751629 | Grab | 1.32 | 1828.17 | 2.10 | 7.18 | 0.27 | 25.60 |
| D751807 | Grab | 0.17 | 1558.66 | 0.37 | 8.07 | 14.15 | 24.06 |
| D751554 | Grab | 0.25 | 1114.15 | 0.63 | 1.22 | 0.09 | 13.66 |
| D751552 | Grab | 5.48 | 644.81 | 0.13 | 0.27 | 0.39 | 13.00 |
| D751735 | Channel | 0.44 | 812.73 | 0.65 | 2.45 | 1.82 | 11.29 |
| D751516 | Channel | 1.80 | 82.99 | 0.05 | 20.00 | 12.30 | 10.89 |
| D751723 | Float | 5.07 | 2.75 | 5.37 | 0.10 | 0.46 | 10.86 |
| D751919 | Chip | 10.51 | 24.31 | 0.01 | 0.06 | 0.11 | 10.84 |
| D751535 | Grab | 3.44 | 369.77 | 0.28 | 5.95 | 1.30 | 9.56 |
| D751617 | Grab | 0.74 | 215.28 | 0.03 | 20.00 | 5.11 | 9.09 |
| D751514 | Channel | 2.52 | 2.75 | 0.18 | 11.95 | 3.42 | 6.39 |
| D751886 | Grab | 0.02 | 337.96 | 0.16 | 1.59 | 4.65 | 5.74 |
| D751664 | Grab | 0.59 | 411.92 | 0.22 | 0.01 | 0.03 | 5.44 |
| D751614 | Chip | 0.23 | 75.70 | 0.02 | 3.46 | 6.69 | 3.89 |
| D751515 | Channel | 0.27 | 90.68 | 0.01 | 6.12 | 3.02 | 3.55 |
| D751543 | Grab | 0.25 | 230.57 | 0.34 | 0.54 | 0.49 | 3.44 |
| D751736 | Channel | 0.22 | 247.74 | 0.13 | 0.84 | 0.10 | 3.34 |
| D751663 | Grab | 0.60 | 127.98 | 0.21 | 2.00 | 1.62 | 3.18 |
| D751659 | Grab | 0.65 | 131.22 | 0.18 | 0.74 | 0.65 | 2.67 |
| D751612 | Chip | 0.08 | 37.65 | 0.02 | 2.93 | 4.30 | 2.47 |
| D751615 | Grab | 0.36 | 83.42 | 0.07 | 2.95 | 0.47 | 2.15 |
| D751906 | Grab | 0.08 | 70.23 | 0.03 | 2.11 | 2.61 | 2.15 |
| D751825 | Grab | 0.22 | 39.98 | 0.07 | 1.58 | 2.27 | 1.77 |
| D751737 | Channel | 1.27 | 33.97 | 0.04 | 0.12 | 0.02 | 1.73 |
| D751534 | Grab | 0.98 | 57.04 | 0.01 | 0.18 | 0.06 | 1.69 |
| D751513 | Talus | 0.13 | 95.98 | 0.02 | 0.59 | 0.65 | 1.55 |
| D751002 | Channel | 0.03 | 2.75 | 0.04 | 5.10 | 1.09 | 1.54 |
| D751508 | Chip | 0.47 | 31.23 | 0.68 | 0.01 | 0.01 | 1.54 |
| D751959 | Chip | 0.03 | 32.57 | 0.03 | 0.12 | 3.43 | 1.50 |
| D751645 | Chip | 0.09 | 73.95 | 0.38 | 0.05 | 0.04 | 1.34 |
| D751646 | Grab | 0.06 | 87.81 | 0.27 | 0.02 | 0.04 | 1.34 |
| D751003 | Channel | 0.02 | 33.09 | 0.01 | 2.41 | 1.17 | 1.28 |
| D751809 | Grab | 0.01 | 11.20 | 1.06 | 0.00 | 0.01 | 1.24 |
| D751547 | Channel | 0.05 | 53.39 | 0.08 | 0.84 | 0.97 | 1.21 |
| D751745 | Float | 0.83 | 6.46 | 0.27 | 0.01 | 0.01 | 1.19 |
| D751883 | Grab | 0.02 | 16.52 | 0.00 | 1.22 | 2.29 | 1.17 |
| D751922 | Float | 0.16 | 15.51 | 0.78 | 0.01 | 0.01 | 1.15 |
| D751899 | Channel | 0.01 | 14.97 | 0.00 | 0.70 | 2.51 | 1.10 |
| D751549 | Channel | 0.04 | 23.75 | 0.01 | 1.24 | 1.65 | 1.09 |
| D751546 | Channel | 0.05 | 41.31 | 0.02 | 0.93 | 1.08 | 1.06 |
| D751608 | Talus | 0.09 | 7.30 | 0.55 | 0.08 | 0.92 | 1.05 |
| D751509 | Grab | 0.25 | 21.33 | 0.50 | 0.01 | 0.01 | 1.02 |
Terms of the Option Agreement
The Terms of the Option Agreement are as follows:
the Company will pay a non-refundable deposit of $250,000 to B-All (the "Escrow Funds") in trust and subject to the approval by the Canadian Securities Exchange ("CSE") (the "Regulatory Approvals") by September 2, 2026, as the initial payment under the Option Agreement, and if such approvals are not obtained by September 2, 2026 the Escrow Funds will be provided to B-All in full as a break fee;
The company will issue to B-All 1,830,000 common shares of the Company at the closing price of the date of execution of the Option Agreement and 1,830,000 common share purchase warrants ("Warrants"), with such Warrants being exercisable within five (5) years from the date of issuance at an exercise price equal to the closing price of the common shares of the Company on the CSE on the day prior to issuance plus $0.01 per Warrant (the common shares and Warrants, shall herein be referred to as, the "Trigger Date Securities"), and the Trigger Date Securities shall be issued in escrow and remain in escrow until receipt of the Regulatory Approvals regarding any necessary approvals for the Option Agreement and if such approvals is not obtained, the Trigger Date Securities shall be cancelled and returned to treasury of the Company;
The Company will incur a minimum of $1,500,000 in exploration expenditures, prior to October 1, 2027;
Upon each of the 1st through 6th anniversaries, the Company will pay $250,000 in cash to B-All no later than the respective anniversary (1st through 6th) of the Regulatory Approvals and issue 1,830,000 common shares at a deemed price equal to the closing price of the Company shares on the CSE on the last trading day prior to such issuance date and 1,830,000 common share purchase warrants (respective "First through Sixth Anniversary Warrants") exercisable within 5 years from the date of issuance at an exercise price equal to the closing price of the shares on the CSE on the last trading day prior to such issuance date plus $0.01 per each respective anniversary warrant;
the Company will incur a minimum of $3,000,000 in total exploration expenditures prior to October 1, 2029;
the Company will issue to B-All, not later than the seventh anniversary of the Regulatory Approvals, 4,000,000 common shares at the closing price of the Company shares on the CSE on the last trading day prior to the date of issuance and 4,000,000 common share purchase warrants ("Seventh Anniversary Warrants") exercisable within 5 years from the date of issuance at an exercise price equal to the closing price of the common shares of the Company on the CSE on the last trading day prior to the date of issuance plus $0.01 per Seventh Anniversary Warrant;
the Company will incur a minimum of $10,000,000 in Exploration Expenditures (including the previous annual expenditure amounts) not later than the seventh anniversary of the Regulatory Approvals (for total exploration expenditures of a minimum of $10,000,000) and filing and registering a work/assessment report under the Mineral Tenure Act for 100% of such exploration expenditures and delivering and filing on SEDAR+, not later than the seventh anniversary of the Regulatory Approval Date, a National Instrument 43-101 Technical Report on the Property (the "Initial NI 43-101 Report") which is based on the results of all exploration expenditures incurred on the Golden Girl Property prior to December 31 of the immediately preceding calendar year and includes a resource estimate of gold equivalent mineral reserves (proven and probable) and gold equivalent mineral resources (measured, indicated and inferred categories) (such resource estimate being herein referred to as the "Initial Resource" and each ounce of gold equivalent reserves and resources set out in the Initial NI 43-101 Report and all other NI 43-101 technical reports published in respect of the Property or part thereof being herein referred to as an "Ounce"), and paying to the Syndicate within five (5) Business Days of the date of such delivery and SEDAR+ filing (in such names and amounts as shall be set out in the Syndicate List most recently provided by the Syndicate), USD $3.00 in respect of each Ounce contained in the Initial Resource.
Having met and satisfied all of the above, Gold Runner will have exercised the Option.
If the option is exercised and the Company acquires the Golden Girl Property, there are additional bonus payments in cash that may be provided by the Company to B-All, based on additional Ounces defined in future National Instrument 43-101 Technical Report filed by the Company, subject to certain extensions.
Upon exercise of the Option, a royalty will be reserved to the Syndicate and the Company will pay the Royalty to the Syndicate (in cash or in kind [i.e. gold] at the option of the Syndicate); provided that the Company shall have the option to reduce the royalty from four percent (4%) to three Percent (3%) by paying USD $2,000,000 to the Syndicate not later than 24 months after the date of exercise of the Option.
The Option Agreement will be filed on SEDAR+ and the full terms of the Option can be found therein on the Company's SEDAR+ profile at www.sedarplus.ca.
Gold Runner CEO, Chris Wensley further states: "We are thrilled to have acquired the Golden Girl Option, and we are excited to begin work to build on the initial high grade poly metallic findings generated by the B-ALL Syndicate with a view to confirming a significant discovery. We are also very pleased to welcome the B-All Syndicate, Goliath Resources (TSXV: GOT), and Juggernaut Exploration (TSXV: JUGR) as significant corner stone shareholders as we move forward together."
Qualified Person
This News Release has been approved by Alan Morris, M.Sc., CPG #10550. Alan J. Morris is a Qualified Person as defined by NI 43-101 and has reviewed the scientific and technical disclosure included in this news release.
About Gold Runner Exploration Inc:
Gold Runner Exploration is an experienced exploration company focused on the exploration of gold and silver properties located in the prolific and Geopolitically stable mining districts of North Western British Columbia and Nevada.
The Rock Creek gold project is Gold Runner's flagship asset, with 74 unpatented lode mining claims wholly owned and controlled by the Company. Emboldened by the results coming out of Rock Creek, the Company strategically expanded the land position with the acquisition of the nearby Dry Creek prospect and the acquisition of the Falcon silver-gold prospect in September 2022. Between the three properties, all targeting similar mineralization and likely the same hydrothermal system, Gold Runner Exploration now holds 239 total claims in close proximity of one another. These three gold prospects are situated in a region with proven "world-class" gold deposits (including Midas, Jerritt Canyon, Betze-Post, Meikle, and Gold Quarry), where the potential of finding large, high-grade gold-silver deposits is favourable.
Gold Runner also holds a 10% carried interest in the Cimarron project located in the San Antonio Mountains of Nye County, Nevada, and comprises 31 unpatented lode mining claims, including control of 6 historically producing claims associated with the historic San Antonio mine. The property is located in the prolific Walker-Lane trend, approximately 44 km south of the "world-class" Round Mountain deposit.
About B-ALL Syndicate Ltd.
The B-ALL Syndicate is a highly specialized geologic team of project generators with a proven track record of success. The Syndicate is focused in unexplored areas of glacial and snowpack retreat providing new opportunity for material discovery in renowned geologic terrain. Projects generated by the same team include Goliath Resources' Surebet discovery on the Golddigger Property, Juggernaut Exploration's Big One discovery as well as multiple additional material discoveries. More information is available at https://www.ball-syndicate.com/.
For further information, please contact:
Chris Wensley, Director, Chief Executive OfficerEmail: info@goldrunnerexploration.comWebsite: www.Goldrunnerexploration.com
Forward-Looking Information
This news release includes certain information that may be deemed "forward-looking information" under applicable securities laws. All statements in this release, other than statements of historical facts, including but not limited to those statements relating to the properties exploration work and its results and potential, interpretations prospecting and exploration activities, geological, geophysical, and geochemical surveys, studies and interpretations of historical exploration and geological information, permitting, licences, environmental laws and regulations, changes in government regulations and laws, obtaining social licence to explore and operate, community engagements, timing of exploration activities, economic, competitive, reliance on third parties, the actual results of operations, and other risks of the natural resources industry, and mineral resource and reserve potential, exploration activities and events or developments that the Company expects is forward-looking information. Although the Company believes the expectations expressed in such statements are based on reasonable assumptions, such statements are not guarantees of future performance and actual results or developments may differ materially from those in the statements. There are certain factors that could cause actual results to differ materially from those in the forward-looking information. These include the results of the Company's due diligence investigations, market prices, exploration successes, continued availability of capital financing, and general economic, market or business conditions, and those additionally described in the Company's filings with the Canadian securities authorities.
Investors are cautioned that any such statements are not guarantees of future performance and actual results or developments may differ materially from those projected in the forward-looking information. For more information on the Company, investors are encouraged to review the Company's public filings at www.sedarplus.ca. The Company disclaims any intention or obligation to update or revise any forward- looking information, whether as a result of new information, future events or otherwise, other than as required by law.
NEITHER THE CANADIAN SECURITIES EXCHANGE NOR ITS REGULATION SERVICES PROVIDER HAS REVIEWED OR ACCEPT RESPONSIBILITY FOR THE ADEQUACY OR ACCURACY OF THIS RELEASE
To view the source version of this press release, please visit https://www.newsfilecorp.com/release/281374
Gold stocks are rallying with several in the IBD 50 near all-time highs as gold nears $5,000 an ounce.
Goliath Resources Limited (GOT.V) entered Thursday into an agreement to amend its existing property option agreement with The J2 Syndicate and J2 Syndicate Holdings Ltd. to "fast track" its ownership in the Golddigger Property located in the Golden Triangle, B.C. that hosts the high-grade Surebet gold discovery to 100%, from 40%. It will also reduce the Net Smelter Returns held by the syndicate from 3% to 2% for consideration including the issuance of 3 million Goliath common shares to the syndicate (no warrants) not later than March 15, 2026. The proposed transaction is subject to TSXV approval.
The company in a statement said other significant amendments to the existing property option agreement include: Goliath is to publish a Maiden Resource Estimate (MRE) on the Golddigger Property or before June, 1 2030, and on every 3 year anniversary of June 1, 2030, thereafter vs. the requirement in the original agreement to publish the MRE by June 1, 2027, and every 3 year anniversary thereafter.
Goliath will pay the Syndicate US$1 for every gold equivalent ounce over 4 million gold equivalant ounces in the MRE vs. the requirement in the original agreement to pay the Syndicate US$1.0 million plus US$1 for every gold equivalent ounce over 2 million gold equivalent ounces; also, should there be a change of control of Goliath prior to Goliath publishing a MRE, the acquirer would generally assume Goliath's obligations under the amended agreement although the requirement to deliver an Initial Resource Report (MRE) would be changed from June 1, 2030, to the third anniversary of the date of completion of the Change of Control transaction and the payment exemption for the first 4 million gold equivalent ounces in the MRE would be removed.
The company's key strategic cornerstone shareholders include Crescat Capital, a Global Commodity Group (Singapore), McEwen Inc. (NYSE and TSX: MUX), Waratah Capital Advisors, Rob McEwen, Eric Sprott and Larry Childress.
Shares in GOT fell 4.2% in Canada yesterday.
Goliath Resources Limited
TORONTO, Jan. 22, 2026 (GLOBE NEWSWIRE) — Goliath Resources Limited (TSX-V: GOT) (OTCQB: GOTRF) (Frankfurt: B4IF) (the "Company" or "Goliath") is very pleased to announce that it has entered into an agreement to amend its existing property option agreement with The J2 Syndicate and J2 Syndicate Holdings Ltd. (the “Syndicate”) to fast track its ownership in the Golddigger Property located in the Golden Triangle, B.C. that hosts the high-grade Surebet gold discovery from 49% to 100% and to reduce the Net Smelter Returns (“NSR”) held by the Syndicate from 3% to 2% for consideration including the issuance of 3,000,000 Goliath common shares to the Syndicate (no warrants) not later than March 15, 2026. The contemplated transaction is subject to TSXV approval.
Other significant amendments to the existing property option agreement include:
-
Goliath is to publish a Maiden Resource Estimate (MRE) on the Golddigger Property or before June, 1 2030 and on every 3 year anniversary of June 1,2030 thereafter vs. the requirement in the original agreement to publish the MRE by June 1, 2027 and every 3 year anniversary thereafter;
-
Goliath will pay the Syndicate US$1 for every gold equivalent ounce over 4,000,000 gold equivalant ounces in the MRE vs. the requirement in the original agreement to pay the Syndicate US $1.0 million plus US$1 for every gold equivalent ounce over 2,000,000 gold equivalent ounces; and
-
Should there be a change of control of Goliath prior to Goliath publishing a MRE, the Acquirer would generally assume Goliath’s obligations under the amended agreement although the requirement to deliver an Initial Resource Report (MRE) would be changed from June 1, 2030 to the third anniversary of the date of completion of the Change of Control transaction and the payment exemption for the first 4,000,000 gold equivalent ounces in the MRE would be removed.
About Goliath Resources Limited
Goliath Resources is an explorer of precious metals projects in the highly prospective Golden Triangle of Northwestern British Columbia. All of its projects are in high quality geological settings and geopolitical safe jurisdictions amenable to mining in Canada. Goliath is a member and active supporter of CASERM which is an organization that represents a collaborative venture between Colorado School of Mines and Virginia Tech. Goliath recently completed its largest drill campaign to date for a total of 64,364 meters in 2025. It is fully funded for a similiar sized drill program in 2026. A total of 110 holes have assays pending for gold equivalent results from its 2025 drill program. The Company’s key strategic cornerstone shareholders include Crescat Capital, a Global Commodity Group (Singapore), McEwen Inc. (NYSE: MUX) (TSX: MUX), Waratah Capital Advisors, Rob McEwen, Eric Sprott and Larry Childress.
For more information please contact:
Goliath Resources Limited
Mr. Roger Rosmus Founder and CEO Tel: +1.416.488.2887roger@goliathresources.comwww.goliathresourcesltd.com
This press release contains statements that constitute “forward-looking information” (“forward-looking information”) within the meaning of the applicable Canadian securities legislation. All statements, other than statements of historical fact, are forward-looking information and are based on expectations, estimates and projections as at the date of this news release. Any statement that discusses predictions, expectations, beliefs, plans, projections, objectives, assumptions, future events or performance (often but not always using phrases such as “expects”, or “does not expect”, “is expected”, “anticipates” or “does not anticipate”, “plans”, “budget”, “scheduled”, “forecasts”, “estimates”, “believes” or “intends” or variations of such words and phrases or stating that certain actions, events or results “may” or “could”, “would”, “might” or “will” be taken to occur or be achieved) are not statements of historical fact and may be forward-looking information. Forward-looking statements in this news release include statements regarding the Consolidation Proposal (including the completion of the Consolidation Proposal on the terms and timeline as announced or at all and the timing to implement the Consolidation Proposal), and the Company’s ability to obtain all regulatory approvals, including the approval of the Exchange. In disclosing the forward-looking information contained in this press release, the Company has made certain assumptions. Although the Company believes that the expectations reflected in such forward-looking information are reasonable, it can give no assurance that the expectations of any forward-looking information will prove to be correct. Known and unknown risks, uncertainties, and other factors which may cause the actual results and future events to differ materially from those expressed or implied by such forward-looking information. Such factors include but are not limited to: compliance with extensive government regulations; domestic and foreign laws and regulations adversely affecting the Company’s business and results of operations; and general business, economic, competitive, political and social uncertainties. Accordingly, readers should not place undue reliance on the forward-looking information contained in this press release. Except as required by law, the Company disclaims any intention and assumes no obligation to update or revise any forward-looking information to reflect actual results, whether as a result of new information, future events, changes in assumptions, changes in factors affecting such forward-looking information or otherwise.
Neither the TSX Venture Exchange nor its Regulation Services Provider (as that term is defined in the policies of the TSX Venture Exchange) accepts responsibility for the adequacy or accuracy of this release.
Gold Fields Limited’s GFI shares hit a fresh 52-week high of $53.31 yesterday, before retracing slightly to close the session at $52.89.
GFI has shot up 227.7% over the past year. The company has also outperformed the Zacks Mining-Gold industry’s 148.1% rise over the same time frame. The rally has been driven primarily by gold prices surging to fresh highs yesterday on concerns over a U.S.-EU trade war and mounting tensions over Greenland, boosting safe-haven demand, further supported by a weaker U.S. dollar.
Image Source: Zacks Investment Research
Let’s take a look at the factors that are driving GFI stock.
GFI Gains From Strong Production and Strategic Growth
Gold Fields delivered a strong third-quarter 2025 performance, with group attributable gold-equivalent production of 621,000 ounces, up 6% quarter on quarter and 22% year on year, led by the ramp-up at Salares Norte in Chile, which produced 112,200 ounces, a 53% quarterly increase. Commercial production, improved throughput and recoveries were achieved alongside cost discipline, with All-in Sustaining Costs (AISC) down 10% quarter on quarter to $1,557/oz and All-in Costs (AIC) down 11% to $1,835/oz. Australian assets Gruyere and St Ives remained steady, while South Deep in South Africa benefited from improved underground access and operational optimization.
Gold Fields’ growth strategy combines organic project development and strategic acquisitions to enhance scale and portfolio quality. Key highlights include the Salares Norte project in Chile, which reached commercial production in 2025 and is ramping up throughput and recoveries, and the 2024 acquisition of Osisko Mining, giving full ownership of the Windfall project in Quebec, targeting 300,000 ounces annually at an AISC of $758/oz with FID expected in the first quarter of 2026.
In Australia, Gold Fields completed its A$3.7 billion acquisition of Gold Road Resources, securing full ownership of the Gruyere mine, producing 350,000 ounces annually. South Deep in South Africa continues to optimize production, while St Ives in Australia contributed 184,500 ounces in the first half of 2025, supported by new open pits.
GFI’s Zacks Rank & Key Picks
GFI currently carries a Zacks Rank #3 (Hold).
Some better-ranked stocks in the Basic Materials space are Centerra Gold Inc. CGAU, Agnico Eagle Mines Limited AEM, and Harmony Gold Mining Company Limited HMY.
At present, CGAU and AEM sport a Zacks Rank #1 (Strong Buy), while HMY carries a Zacks Rank #2 (Buy). You can see the complete list of today’s Zacks #1 Rank stocks here.
The Zacks Consensus Estimate for CGAU’s current fiscal-year earnings is pinned at 98 cents per share, indicating a 38.03% year-over-year increase. Its earnings beat the Zacks Consensus Estimate in three of the trailing four quarters while missing once, with the average surprise being 21.63%. Its shares have popped around 198.7% over the past year.
The Zacks Consensus Estimate for AEM’s current-year earnings stands at $7.93 per share, implying an 87.5% year-over-year increase. Its earnings beat the Zacks Consensus Estimates in each of the trailing four quarters, with the average earnings surprise being 11.63%. AEM’s shares have rallied roughly 134.3% over the past year.
The Zacks Consensus Estimate for HMY’s current-year earnings is pegged at $2.68 per share, indicating a year-over-year rise of 111%. HMY’s shares have gained 120.1% over the past year.
Want the latest recommendations from Zacks Investment Research? Today, you can download 7 Best Stocks for the Next 30 Days. Click to get this free report
Agnico Eagle Mines Limited (AEM) : Free Stock Analysis Report
Gold Fields Limited (GFI) : Free Stock Analysis Report
Harmony Gold Mining Company Limited (HMY) : Free Stock Analysis Report
Centerra Gold Inc. (CGAU) : Free Stock Analysis Report
This article originally published on Zacks Investment Research (zacks.com).
Goliath Resources (GOT.V) reported Tuesday the latest high-grade intersections from the 2025 drill campaign at the Surebet discovery within its Golddigger property in British Columbia.
Assays include 19.13 grams per ton gold over 6.10 meters and 10.58 g/t gold over 8.30 m.
The company said its drilling significantly expanded the extent of gold mineralization in all five main zones, which remain open.
Goliath said it is awaiting gold equivalent results from the final 110 drill holes of the program.
"The Surebet high-grade gold discovery continues to grow during every new season of drilling," founder and chief executive officer Roger Rosmus said.
The company said its 2026 drill program will mainly focus on expanding the five main mineralized zones.
"We are in the best financial position the company has ever been in as we are fully funded for our 2026 drilling campaign and are looking forward to expanding on the tremendous Surebet high-grade gold discovery," Rosmus said.
At Surebet, 110 Holes From 2025 Are Pending Assays For Gold Equivalent Results
Infographic 1
Infographic 1
Infographic 2
Infographic 2
Infographic 3
Infographic 3
Infographic 4
Infographic 4
Infographic 5
Infographic 5
Infographic 6
Infographic 6
Infographic 7
Infographic 7
Infographic 8
Infographic 8
Infographic 9
Infographic 9
Infographic 10
Infographic 10
Infographic 11
Infographic 11
Infographic 12
Infographic 12
Infographic 13
Infographic 13
Infographic 14
Infographic 14
Infographic 15
Infographic 15
Infographic 16
Infographic 16
Infographic 17
Infographic 17
Infographic 18
Infographic 18
- This news release includes the final 70 holes completed during the 2025 drilling campaign that were assayed for Gold Only. Assays are still pending for 110 drill holes from 2025 for multi-element gold equivalent (AuEq) results. These results will be released in the near future once all assays have been received, compiled and interpreted.
- 100% of the drill holes completed to date, have all intersected gold mineralization clearly demonstrating the remarkable continuity, grades, and widths in 5 Main Gold-Rich Zones comprising 46 mineralized lodes that remain open for expansion.
- Of the holes drilled during the 2025 campaign, 83 out of 110 holes (or 76%) contained visible gold to the naked eye (VG-NE).
- The fully funded 2026 drill program will be mainly focused on expanding the 5 Main Mineralized Zones. Data compilation and interpretation is underway which will be used to vector in on the indicated Motherlode causative intrusive source to this extensive high grade gold system with widespread VG-NE.
DRILL HIGHLIGHTS:
All intercepts below are approximately true width, and these assays reflect gold only (The gold equivalent (AuEq) values in all 110 drill hole intervals will be adjusted accordingly and announced, once the Silver, Copper, Lead and Zinc values are received, compiled and interpreted):
GD-25-319
- Drill hole GD-25-319 intersected 19.13 g/t Au over 6.10 meters, including 22.86 g/t Au over 5.10 meters, including 29.09 g/t Au over 4.00 meters in quartz-sulphide veins, part of the Golden Gate Zone, containing multiple occurrences of gold visible to the naked eye (VG-NE); see image below.
- An accompanying infographic is available at: https://www.globenewswire.com/NewsRoom/AttachmentNg/d53fca16-084f-4c73-b55d-cc763f7dc1cf
GD-25-405
- Drill hole GD-25-405 intersected 10.58 g/t Au over 8.30 meters, including 14.04 g/t Au over 6.25 meters including 15.50 g/t Au over 5.60 meters from a quartz-sulphide breccia, part of the Bonanza Zone, containing multiple occurrences of VG-NE; see image below.
- Additional intervals include 3.25 meters of 2.47 g/t Au in quartz-sulphide veins part of the Surebet Zone.
- An accompanying infographic is available at: https://www.globenewswire.com/NewsRoom/AttachmentNg/8720c217-d2a4-43f9-a325-fd23e851781e
GD-25-312
- Drill hole GD-25-312 intersected 10.56 g/t Au over 3.70 meters from a gold-rich quartz-sulphide breccia interval, part of the Surebet Zone; see image below.
- An accompanying infographic is available at: https://www.globenewswire.com/NewsRoom/AttachmentNg/75322c0e-33ed-4b26-af06-9266777a064d
GD-25-345
- Drill hole GD-25-345 intersected 4.47 g/t Au over 6.00 meters including 6.68 g/t Au over 4.00 meters, including 7.93 g/t Au over 3.36 meters from a series of quartz-sulphide veins, part of the Golden Gate Zone, containing multiple occurrences of VG-NE as well as semi-massive to massive sphalerite and pyrrhotite; see image below.
- Additional separate intervals include 3.92 g/t Au over 3.79 meters part of the Whopper Zone and 3.83 g/t Au over 3.78 meters.
- An accompanying infographic is available at:https://www.globenewswire.com/NewsRoom/AttachmentNg/c1952d21-c3bf-49bd-9244-ea34a64454ae
GD-25-330
- Drill hole GD-25-330 intersected 7.48 g/t Au over 3.55 meters from an interval with quartz-sulphide veins, part of the Golden Gate Zone, containing VG-NE; see image below.
- An accompanying infographic is available at: https://www.globenewswire.com/NewsRoom/AttachmentNg/21f04898-eb56-495f-90d0-01b60a3c42fa
GD-25-326
- Drill hole GD-25-326 intersected 8.57 g/t Au over 3.00 meters from a quartz-sulphide vein and breccia interval part of the Surebet Zone; see image below.
- An accompanying infographic is available at: https://www.globenewswire.com/NewsRoom/AttachmentNg/e6116782-0b51-4ab5-8419-85e4e9608a48
GD-25-401
- Drill hole GD-25-401 intersected 4.89 g/t Au over 5.00 meters, within 2.96 g/t Au over 8.89 meters, part of the Surebet Zone, from a brecciated and strongly calc-silicate altered section; see image below.
- Additional intervals include 3.0 g/t Au over 4.11 meters part of the Surebet Zone, as well as 2.4 g/t Au over 3.1 meters, part of the Golden Gate Zone.
- An accompanying infographic is available at:https://www.globenewswire.com/NewsRoom/AttachmentNg/dcc469ca-c7a9-43fe-84c9-730be45980b6
GD-25-349
- Drill hole GD-25-349 intersected 5.50 g/t Au over 4.00 meters, including 7.34 g/t Au over 3.00 meters from a series of quartz-sulphide veins, part of the Bonanza Zone; see image below.
- An accompanying infographic is available at:https://www.globenewswire.com/NewsRoom/AttachmentNg/14b248cf-d785-433a-a3d0-1a7f60a87902
GD-25-367
- Drill hole GD-25-367 intersected 7.10 g/t Au over 3.00 meters from an interval of quartz-sulphide veining, part of the Golden Gate Zone, containing multiple occurrences of VG-NE; see image below.
- Three accompanying infographics are available at:https://www.globenewswire.com/NewsRoom/AttachmentNg/185756f2-4751-492d-8214-1e0fba442757https://www.globenewswire.com/NewsRoom/AttachmentNg/96889faf-4590-4dea-b065-d53b13f46558https://www.globenewswire.com/NewsRoom/AttachmentNg/7c9c67d8-b016-4419-a0de-63d0ffb0caea
- Assay results from the recently completed 64,364 meters of drilling have significantly expanded the extent of the high-grade gold mineralization at the Surebet Discovery that remains open for expansion laterally and at depth. The updated model for the Surebet system, which includes all the 2025 gold assay results, consists of 5 extensive mineralized zones comprising 46 gold-rich lodes as well as gold-rich Eocene-aged RIRG dykes:
- The Bonanza Zone has a strike of 1.8 km NW-SE and 1.1 km NE-SW containing 5 lodes up to 19 meters thick with a combined thickness of up to 27 meters and intercepts up to 13.53 g/t AuEq (12.10 g/t Au and 54.13 g/t Ag) over 11.00 meters (drill hole GD-22-100) and remains open for expansion.
- An accompanying infographic is available at: https://www.globenewswire.com/NewsRoom/AttachmentNg/33eb4b9c-9f92-45d4-b243-7e7879570957
- The Bonanza Zone has a strike of 1.8 km NW-SE and 1.1 km NE-SW containing 5 lodes up to 19 meters thick with a combined thickness of up to 27 meters and intercepts up to 13.53 g/t AuEq (12.10 g/t Au and 54.13 g/t Ag) over 11.00 meters (drill hole GD-22-100) and remains open for expansion.
-
- The Surebet Zone has a strike of 1.2 km NW-SE and 930 meters NE-SW containing 9 lodes up to 19 meters thick with a combined thickness of up to 30 meters and intercepts up to 21.08 g/t AuEq (18.95 g/t Au and 95.31 g/t Ag) over 23.00 m (drill hole GD-23-157) and remains open for expansion to the SW.
- An accompanying infographic is available at: https://www.globenewswire.com/NewsRoom/AttachmentNg/1ca40f5d-7221-4f92-94b8-d12e6bc5510c
- The Golden Gate Zone has a strike of 1.3 km E-W and 820 meters N-S containing 18 lodes up to 14 meters with a combined thickness of up to 49 meters and with intercepts up to 34.52 g/t AuEq (34.47 g/t Au and 3.96 g/t Ag) over 39.00 m (drill hole GD-24-260) and remains open for expansion.
- An accompanying infographic is available at: https://www.globenewswire.com/NewsRoom/AttachmentNg/a9a1d076-f66d-402c-98f9-bf75f159f738
- The Whopper Zone has a strike of 800 meters N-S and 450 meters E-W containing 12 lodes up to 6 meters thick with a combined thickness of up to 30 meters and intercepts up to 32.67 g/t AuEq (32.56 g/t Au and 8.92 g/t Ag) over 4.00 m (drill hole GD-24-262) and remains open for expansion.
- An accompanying infographic is available at: https://www.globenewswire.com/NewsRoom/AttachmentNg/b957c9e3-1419-42e7-9f52-a7a6f109c725
- The Surebet Zone has a strike of 1.2 km NW-SE and 930 meters NE-SW containing 9 lodes up to 19 meters thick with a combined thickness of up to 30 meters and intercepts up to 21.08 g/t AuEq (18.95 g/t Au and 95.31 g/t Ag) over 23.00 m (drill hole GD-23-157) and remains open for expansion to the SW.
-
- The Eldorado Zone has a strike of 680 meters E-W and 700 meters N-S containing 2 lodes up to 5 meters thick with a combined thickness of up to 7 meters and intercepts up to 7.91 g/t AuEq (7.44 g/t Au and 22.40 g/t Ag) over 7.15 m (drill hole GD-23-221) and remains open for expansion.
- An accompanying infographic is available at: https://www.globenewswire.com/NewsRoom/AttachmentNg/7c82f75a-f5c4-4396-a6b9-5fee42d08602
- The gold-rich Eocene-aged dykes extend for up to 1.4 km N-S and a vertical relief of up to 890 meters with widths up to 25 meters and intercepts up to 12.03 g/t AuEq (11.84 g/t Au and 15.61 g/t Ag) over 10.00 meters (drill hole GD-22-58) and remain open for expansion.
- An accompanying infographic is available at:https://www.globenewswire.com/NewsRoom/AttachmentNg/7c731f15-97e6-44f5-8017-e81c063d77a7
- The Eldorado Zone has a strike of 680 meters E-W and 700 meters N-S containing 2 lodes up to 5 meters thick with a combined thickness of up to 7 meters and intercepts up to 7.91 g/t AuEq (7.44 g/t Au and 22.40 g/t Ag) over 7.15 m (drill hole GD-23-221) and remains open for expansion.
UPDATED 3D MODEL VIDEO (CLICK HERE)
- 100% of the drill holes completed to date on the Surebet Discovery have intersected substantial quartz-sulphide mineralization. In 2025, VG-NE was observed in 83 drill holes out of 110 (or 76%).
- 355 out of 386 representing 92% drilled to date at the Surebet Discovery contain VG-NE (see heat map below).
- An accompanying infographic is available at:https://www.globenewswire.com/NewsRoom/AttachmentNg/df7e0fc8-3add-4db6-906c-26d54f8bfeed
- The remarkable continuity, widths and grades demonstrated by drilling in multiple lodes shows this extensive 1.8 km2 gold system continues to demonstrate strong potential to become one of the most significant gold discoveries in British Columbia’s Golden Triangle in many years. The strong results received to date will help vector in on drilling targets that remain open with excellent expansion potential.
- High-grade gold has been identified in three distinct rock packages discovered to date at the Surebet Discovery. This includes the gently dipping gold-rich stacked quartz-sulphide breccias/stockwork veins; the gold-rich intermediate to felsic Eocene-aged dykes; and the recently discovered broad gold-rich zones of calc-silicate altered breccia. All mineralized rock types contain substantial amounts of VG-NE (from fine-grained to coarse-grained gold) and remain open for expansion. This confirms the presence of a Motherlode magmatic source nearby, a causative intrusion responsible for the extensive 1.8 km2 high-grade gold system at Surebet.
TORONTO, Jan. 20, 2026 (GLOBE NEWSWIRE) — Goliath Resources Limited (TSX-V: GOT) (OTCQB: GOTRF) (FSE: B4IF) (the “Company” or “Goliath”) is pleased to report assay results (gold only) for the remaining holes from the 2025 drill campaign at the Surebet Discovery on its 100% controlled Golddigger Property (the “Property”), Golden Triangle, British Columbia. Highlights include drill hole GD-25-319 which intersected 19.13 g/t Au over 6.10 meters as well as drill hole GD-25-405 which intersected 10.58 g/t Au over 8.30 meters. Every drill hole completed so far, including all 110 holes from the 2025 season, has successfully intersected gold mineralization. These results confirm predictable continuity, grade, and width across 5 Gold-Rich Zones and 46 Distinct Lodes, all of which remain open for expansion. The fully funded 2026 drill program will focus on expanding the 5 Main Mineralized Zones, testing the Motherlode causative intrusive source, and build toward a future resource.
Dr. Quinton Hennigh, Geologic & Technical Advisor to Crescat Capital, a strategic investor in Goliath, states: “The consistent reporting of thick high-grade gold intercepts from Surebet is remarkable. Yet again, we see in this news release several more holes that demonstrate the strong predictability of this lode system. Visible gold in core consistently delivers strong assays. While we have to remain patient to see the gold equivalent results from the final 110 drill holes, the confidence around the continuity of these lodes, their thickness and grade is growing with every release. Goliath is doing a great job to continually update the geologic model, with the assistance from the Colorado School of Mines, to show the remarkable Surebet gold discovery.”
Mr. Roger Rosmus, Founder & CEO of Goliath states: “The Surebet high-grade gold discovery continues to grow during every new season of drilling. To date, we have discovered a series of stacked gently dipping high-grade gold veins analogous to the Pogo mine in Alaska. In addition, we have started to drill into a series of vertical Eocene-aged RIRG dykes were emplaced roughly the same as the stack veins. We have yet to find the limits of the stacked veins and RIRG dykes, which all remain open, or the source of where they come from, but we are excited about using them to vector into the Motherlode source. What is outstanding about the various high-grade gold mineralization is the vast distribution VG-NE over a large area, which makes the Surebet discovery unique. Another intriguing aspect of the VG-NE is that at the top of the system it is fine-grained and sporadic and as we drill deeper into the system it becomes abundant and course-grained. Which has us excited about following it toward the source. We have two sets of stacked veins (the Surebet series and Bonanza series) that dip in opposite directions but come together at the Hinge Zone. It is becoming clearer, especially through our 2025 drilling campaign, that the Hinge Zone has the potential to be a starter zone for underground high-grade gold bulk mining. Our team, including key people at the Colorado School of Mines, are excited about the advanced geological studies to help us prepare for the 2026 drilling season. We are in the best financial position the company has ever been in as we are fully funded for our 2026 drilling campaign and are looking forward to expanding on the tremendous Surebet high-grade gold discovery.”
Assay results from the recently concluded 64,364-meter drill program have significantly expanded the high-grade footprint of the Surebet Discovery, which remains open for further growth. An updated geological model incorporating all 2025 data identifies 5 primary mineralized Zones: Bonanza, Surebet, Golden Gate, Whopper, and Eldorado. Collectively these Zones comprise 46 gold-rich lodes and associated Eocene-aged RIRG dykes.
Table 1: Five main modelled gold rich zones and dykes.
| Zone | Number of lodes | Dimensions | Key Intercept | Status |
| Bonanza | 5 | 1.8 km x 1.1 km x 19 m | 13.53 g/t AuEq over 11 m | Remains Open |
| Surebet | 9 | 1.2 km x 930 m x 19 m | 21.08 g/t AuEq over 23 m | Remains Open |
| Golden Gate | 18 | 1.3 km x 820 m x 14 m | 34.52 g/t AuEq over 39 m | Remains Open |
| Whopper | 12 | 800 m x 450 m x 6 m | 32.67 g/t AuEq over 4 m | Remains Open |
| Eldorado | 2 | 680 m x 700 m x 5 m | 7.91 g/t AuEq over 7.15 m | Remains Open |
| Gold-rich dykes | 1.4 km x 890 m x 25 m | 12.03 g/t AuEq over 10 m | Remains Open |
Reported assay results from the 2025 drill campaign have yielded several high-grade gold intercepts across the Golden Gate, Bonanza, and Surebet Zones, characterized by frequent occurrences of VG-NE, as well as substantial sulphide mineralization. Highlights include drill hole GD-25-319 which intersected 19.13 g/t Au over 6.10 meters, including 22.86 g/t Au over 5.10 meters, including 29.09 g/t Au over 4.00 meters from the Golden Gate Zone. Drill hole GD-25-405 which intersected 10.58 g/t Au over 8.30 meters, including 14.04 g/t Au over 6.25 meters including 15.50 g/t Au over 5.60 meters from the Bonanza Zone, and drill hole GD-25-312 which intersected 10.56 g/t Au over 3.70 meters from the Surebet Zone. The gold grades, coupled with VG-NE within substantial quartz-sulphide veins, stockworks, and breccias, which are mineralized with sphalerite, pyrrhotite, and chalcopyrite, highlight the potential for further expansion. These intercepts are approximately true width, and the assays reflect gold only. Multi-element gold equivalent grades for all drill holes will be released once all assays have been received, compiled and interpreted in the near future. See Table 2 below for a full list of assay results for all the remaining holes of the 2025 drill campaign.
High-grade gold has been identified in three distinct rock packages discovered to date at the Surebet Discovery. This includes the gently dipping gold-rich stacked quartz-sulphide breccias/stockwork veins; the gold-rich intermediate to felsic gold-Rich dykes; and the recently discovered broad gold-rich zones of calc-silicate altered breccia. All mineralized rock types contain substantial amounts of VG-NE (from fine-grained to coarse-grained gold) and remain open for expansion. This confirms the presence of a Motherlode magmatic source nearby, a causative intrusion responsible for the extensive 1.8 km2 high-grade gold system at Surebet.
The remarkable continuity, widths and grades encountered across multiple lodes underscore the significance of this 1.8 km2 gold system which has strong potential to become one of the most significant gold discoveries in British Columbia’s Golden Triangle in many years. Success to date has effectively vectored toward several open targets, providing a strong foundation for further expansion in the 2026 drilling campaign.
Surebet Discovery Highlights
- Assay results are still pending for 110 holes from the 2025 exploration campaign for the gold equivalent (AuEq) values, that will be announced once received, compiled and interpreted.
- 83 out of 110 holes (or 76%) drilled in 2025 contain VG-NE, 100% of holes drilled to date at the Surebet Discovery have intersected substantial quartz-sulphide mineralization. See news releases dated: November 17, 2025, October 27, 2025, September 22, 2025, September 8, 2025, August 26, 2025, and July 28, 2025.
- 60 out of 64 holes (or 94%) drilled in 2024 contain VG-NE up to 11.5 mm (7/16 inches) in size, all of which returned high-grade gold. See news releases dated: July 7, 2025, June 23, 2025, January 7, 2025, January 13, 2025, February 10, 2025, February 18, 2025, February 27, 2025, December 12, 2024 and July 30, 2024.
- 92% of the holes (355 out of 386) drilled to date at Surebet contain VG-NE (see heat map above).
- The best hole drilled to date is GD-24-260 previously reported from the Bonanza Zone assayed 34.52 g/t AuEq (34.47 Au and 3.96 Ag) over 39.00 meters, including 132.93 g/t AuEq (132.78 Au and 12.98 Ag) over 10.00 meters, and 166.04 g/t AuEq (165.84 Au and 16.07 Ag) over 8.00 meters (see news release dated January 13, 2025). ). More details on the QA/QC protocol can be found in the section titled “QA/QC Protocol” below.
- The best hole drilled to date from the RIRG Eocene-aged dykes is GD-22-58 that assayed 12.03 g/t AuEq (11.84 g/t Au and 15.61 g/t Ag) over 10.00 meters including 19.91 g/t AuEq (19.62 g/t Au and 25.61 g/t Ag) over 6.00 meters, including 23.82 g/t AuEq (23.47 g/t Au and 30.54 g/t Ag) over 5.00 meters, plus a second separate interval down hole of 8.59 g/t AuEq (8.35 g/t Au and 20.74 g/t Ag) over 5.00 meters (see news release dated March 13, 2025). ). More details on the QA/QC protocol can be found in the section titled “QA/QC Protocol” below.
- The best hole drilled to date from the third distinct rock package consisting of calc-silicate altered breccia is drill hole GD-25-337, which intersected 10.60 g/t Au over 22.82 meters, including 15.19 g/t Au over 15.71 meters, including two separate intervals consisting of 37.28 g/t Au or 1.20 oz/t Au over 3.36 meters and 36.11 or 1.16 oz/t Au over 3.08 meters. The intercept is approximately true width, and these assays reflect gold only (AuEq value in the interval will be adjusted accordingly once Ag, Cu, Pb and Zn are received and interpreted). More details on the QA/QC protocol can be found in the section titled “QA/QC Protocol” below.
- Multiple gently dipping gold-mineralized stacked veins have been identified every year on the Surebet high-grade gold discovery. Recent discoveries include gold-rich RIRG dykes, Goldilocks Zones where the veins and vertical dykes crosscut (which are characterized by having high-grade gold in two temperature regimes) and recently discovered high-grade gold in a third distinct rock package characterized by calc-silicate altered breccia, which increases potential tonnage and gold content of the high-grade gold system at the Surebet Discovery.
- The footprint of the mineralization discovered to date at Surebet is 1.8 km2 and remains open in all directions.
- Thanks to the mountainous topography, mineralization in the veins is exposed on the surface for 2.1 km of strike (1.0 km on the south slope and 1.1 km on the north slope) with a vertical relief of 700 meters.
- A study completed by the Colorado School of Mines confirms a new interpretation of the ore forming process of high-grade gold mineralization at Surebet and outlines a common magmatic source for the high-grade gold system, now in three distinct rock packages. Which gives the Surebet untapped discovery potential to increase tonnage and gold content in the various known rock packages. Until this study, researchers and explorers in the Golden Triangle had not recognized the high-grade gold discovery potential in the Eocene-aged RIRG dykes (see news release March 13, 2025), which is showing the potential that these discoveries could be a geological breakthrough in the Golden Triangle of British Columbia.
- Goliath has drilled over 156,000 meters with over 600 pierce points in the Surebet Discovery located at the Golddigger property between 2021 and 2025.
- The Surebet Discovery has predictable continuity and good metallurgy with gold recoveries of 92.2% from gravity and flotation at a 327-micrometer crush including 48.8% free gold recovery from gravity alone (no cyanide required to recover the gold). The metallurgy completed to date shows a benign rock composition without deleterious elements (see news release March 1, 2023).
- Based on positive grassroots exploration and drill results in recent years, Goliath significantly increased its land package from 66,608 hectares to 91,518 hectares (226,146 acres) and now controls 56 kilometers of key terrain of the Red Line geologic trend providing for additional discovery potential.
- The Golddigger Property is located on tidewater with a barge route to Prince Rupert (190 km south) and close to infrastructure including the town of Kitsault adjacent to a permitted mine site on private property.
Table 2: Gold-only assay results from remaining 70 drill holes from 2025.
| Hole ID | From (m) | To (m) | Interval (m) | Au (g/t) | |
| GD-25-319 | Interval | 484.00 | 487.00 | 3.00 | 1.90 |
| Interval | 485.00 | 486.00 | 1.00 | 5.65 | |
| Interval | 510.00 | 527.00 | 17.00 | 1.07 | |
| Including | 510.00 | 523.00 | 13.00 | 1.31 | |
| Including | 516.05 | 523.00 | 6.95 | 1.97 | |
| Including | 516.05 | 522.10 | 6.05 | 2.23 | |
| Interval | 564.10 | 570.20 | 6.10 | 19.13 | |
| Including | 565.10 | 570.20 | 5.10 | 22.86 | |
| Including | 565.10 | 569.10 | 4.00 | 29.09 | |
| GD-25-405 | Interval | 84.00 | 87.25 | 3.25 | 2.47 |
| Interval | 165.70 | 174.00 | 8.30 | 10.58 | |
| including | 166.75 | 173.00 | 6.25 | 14.04 | |
| including | 166.75 | 172.35 | 5.60 | 15.50 | |
| including | 166.75 | 170.50 | 3.75 | 21.09 | |
| GD-25-312 | Interval | 390.30 | 394.00 | 3.70 | 10.56 |
| GD-25-345 | Interval | 3.09 | 6.87 | 3.78 | 3.83 |
| Interval | 354.36 | 358.15 | 3.79 | 3.92 | |
| Interval | 615.00 | 621.00 | 6.00 | 4.47 | |
| including | 616.00 | 620.00 | 4.00 | 6.68 | |
| including | 616.00 | 619.36 | 3.36 | 7.93 | |
| GD-25-330 | Interval | 533.00 | 536.55 | 3.55 | 7.48 |
| Interval | 534.14 | 535.48 | 1.34 | 19.51 | |
| GD-25-326 | Interval | 299.00 | 302.00 | 3.00 | 8.57 |
| GD-25-401 | Interval | 38.07 | 46.96 | 8.89 | 2.96 |
| including | 39.00 | 44.00 | 5.00 | 4.89 | |
| Interval | 57.00 | 61.11 | 4.11 | 3.00 | |
| including | 57.00 | 60.00 | 3.00 | 3.41 | |
| Interval | 431.75 | 434.85 | 3.10 | 2.40 | |
| GD-25-349 | Interval | 85.00 | 89.00 | 4.00 | 5.50 |
| Including | 86.00 | 89.00 | 3.00 | 7.34 | |
| Interval | 95.38 | 99.00 | 3.62 | 1.11 | |
| GD-25-367 | Interval | 388.00 | 393.00 | 5.00 | 2.69 |
| Interval | 523.00 | 526.00 | 3.00 | 7.10 | |
| GD-25-407 | Interval | 253.83 | 257.09 | 3.26 | 5.85 |
| GD-25-395 | Interval | 302.00 | 319.00 | 17.00 | 1.11 |
| Including | 306.00 | 318.00 | 12.00 | 1.51 | |
| Including | 309.49 | 316.15 | 6.66 | 2.16 | |
| Including | 311.90 | 316.15 | 4.25 | 3.03 | |
| GD-25-332 | Interval | 416.00 | 422.00 | 6.00 | 3.02 |
| including | 417.00 | 421.00 | 4.00 | 4.49 | |
| including | 417.00 | 420.00 | 3.00 | 5.90 | |
| GD-25-389 | Interval | 125.00 | 135.00 | 10.00 | 1.16 |
| including | 125.90 | 129.00 | 3.10 | 2.43 | |
| Interval | 155.00 | 163.00 | 8.00 | 1.83 | |
| including | 159.00 | 162.00 | 3.00 | 4.62 | |
| GD-25-393 | Interval | 385.00 | 390.00 | 5.00 | 3.78 |
| Including | 386.80 | 390.00 | 3.20 | 5.89 | |
| GD-25-382 | Interval | 4.73 | 16.00 | 11.27 | 1.44 |
| Including | 7.00 | 16.00 | 9.00 | 1.72 | |
| Including | 10.00 | 16.00 | 6.00 | 2.41 | |
| Including | 10.00 | 14.00 | 4.00 | 3.13 | |
| Interval | 65.00 | 71.00 | 6.00 | 1.05 | |
| Including | 66.00 | 70.00 | 4.00 | 1.56 | |
| Interval | 99.11 | 103.00 | 3.89 | 1.48 | |
| GD-25-396 | Interval | 127.15 | 130.97 | 3.82 | 4.01 |
| including | 244.00 | 247.19 | 3.19 | 2.47 | |
| GD-25-305 | Interval | 259.03 | 263.00 | 3.97 | 2.51 |
| Interval | 547.53 | 553.00 | 5.47 | 1.25 | |
| Including | 547.53 | 550.85 | 3.32 | 1.69 | |
| Interval | 585.00 | 596.00 | 11.00 | 1.30 | |
| Including | 588.00 | 595.02 | 7.02 | 1.93 | |
| Including | 588.00 | 592.97 | 4.97 | 2.59 | |
| Including | 589.11 | 592.97 | 3.86 | 3.27 | |
| GD-25-323 | Interval | 309.54 | 314.00 | 4.46 | 1.38 |
| Including | 310.17 | 314.00 | 3.83 | 1.59 | |
| Interval | 588.80 | 592.50 | 3.70 | 3.71 | |
| GD-25-334 | Interval | 397.00 | 408.00 | 11.00 | 1.24 |
| including | 404.00 | 407.00 | 3.00 | 3.91 | |
| GD-25-366 | Interval | 62.05 | 66.00 | 3.95 | 3.34 |
| Interval | 483.00 | 486.00 | 3.00 | 3.87 | |
| GD-25-381 | Interval | 265.00 | 269.00 | 4.00 | 3.32 |
| including | 265.00 | 268.00 | 3.00 | 4.33 | |
| GD-25-390 | Interval | 187.75 | 193.00 | 5.25 | 2.38 |
| including | 188.80 | 192.00 | 3.20 | 3.87 | |
| GD-25-335 | Interval | 236.00 | 240.00 | 4.00 | 2.79 |
| including | 236.00 | 239.00 | 3.00 | 3.71 | |
| Interval | 258.00 | 270.00 | 12.00 | 1.06 | |
| including | 262.05 | 270.00 | 7.95 | 1.32 | |
| GD-25-327 | Interval | 25.00 | 26.00 | 1.00 | 2.11 |
| Interval | 107.00 | 111.00 | 4.00 | 2.99 | |
| Including | 108.00 | 111.00 | 3.00 | 3.98 | |
| Interval | 275.00 | 282.00 | 7.00 | 1.52 | |
| Including | 276.00 | 282.00 | 6.00 | 1.77 | |
| Including | 276.00 | 281.00 | 5.00 | 2.09 | |
| Including | 277.00 | 280.00 | 3.00 | 3.12 | |
| GD-25-368 | Interval | 592.00 | 597.88 | 5.88 | 2.03 |
| Including | 592.00 | 596.69 | 4.69 | 2.54 | |
| GD-25-342 | Interval | 28.85 | 38.00 | 9.15 | 1.04 |
| Including | 31.00 | 38.00 | 7.00 | 1.25 | |
| Including | 34.00 | 38.00 | 4.00 | 1.30 | |
| Including | 35.00 | 38.00 | 3.00 | 1.66 | |
| Interval | 249.10 | 252.10 | 3.00 | 2.05 | |
| Interval | 250.25 | 251.25 | 1.00 | 6.11 | |
| GD-25-316 | Interval | 204.00 | 208.00 | 4.00 | 1.08 |
| Interval | 356.96 | 363.65 | 6.69 | 1.70 | |
| Including | 357.82 | 362.50 | 4.68 | 2.39 | |
| Interval | 365.85 | 369.00 | 3.15 | 1.24 | |
| GD-25-337 | Interval | 138.50 | 148.50 | 10.00 | 1.09 |
| Interval | 52.00 | 55.00 | 3.00 | 2.29 | |
| GD-25-375 | including | 216.21 | 220.00 | 3.79 | 2.39 |
| GD-25-363 | Interval | 313.46 | 320.00 | 6.54 | 1.63 |
| Including | 314.09 | 319.00 | 4.91 | 2.15 | |
| Including | 314.09 | 318.00 | 3.91 | 2.63 | |
| GD-25-329 | Interval | 215.91 | 224.02 | 8.11 | 1.01 |
| Including | 215.91 | 221.00 | 5.09 | 1.45 | |
| Including | 215.91 | 219.00 | 3.09 | 1.91 | |
| Interval | 317.00 | 322.12 | 5.12 | 1.95 | |
| Including | 317.00 | 321.00 | 4.00 | 2.49 | |
| Including | 318.00 | 321.00 | 3.00 | 3.29 | |
| GD-25-357 | Interval | 215.00 | 223.00 | 8.00 | 1.05 |
| Including | 217.00 | 223.00 | 6.00 | 1.26 | |
| Interval | 347.00 | 350.00 | 3.00 | 2.26 | |
| Interval | 348.00 | 349.00 | 1.00 | 6.72 | |
| GD-25-308 | Interval | 335.00 | 338.00 | 3.00 | 1.09 |
| Interval | 405.00 | 408.00 | 3.00 | 1.55 | |
| GD-25-301 | Interval | 301.00 | 305.00 | 4.00 | 2.26 |
| Including | 302.00 | 305.00 | 3.00 | 3.00 | |
| Interval | 415.00 | 419.00 | 4.00 | 2.47 | |
| Interval | 535.24 | 542.13 | 6.89 | 1.16 | |
| Including | 535.24 | 541.05 | 5.81 | 1.33 | |
| Including | 537.39 | 541.05 | 3.66 | 1.66 | |
| GD-25-394 | Interval | 118.00 | 121.85 | 3.85 | 1.02 |
| GD-25-403 | Interval | 254.02 | 258.00 | 3.98 | 2.35 |
| Interval | 255.00 | 256.05 | 1.05 | 8.70 | |
| GD-25-303 | Interval | 488.00 | 493.00 | 5.00 | 1.09 |
| Including | 488.00 | 491.00 | 3.00 | 1.31 | |
| Interval | 526.00 | 529.00 | 3.00 | 1.09 | |
| Interval | 532.00 | 536.04 | 4.04 | 1.21 | |
| Including | 532.00 | 535.00 | 3.00 | 1.25 | |
| GD-25-386 | Interval | 293.34 | 297.60 | 4.26 | 1.26 |
| Including | 294.38 | 297.60 | 3.22 | 1.66 | |
| Interval | 300.85 | 301.95 | 1.10 | 2.60 | |
| Including | 324.79 | 329.00 | 4.21 | 1.97 | |
| Including | 324.79 | 328.02 | 3.23 | 2.49 | |
| GD-25-352 | Interval | 338.00 | 343.00 | 5.00 | 1.74 |
| Interval | 374.00 | 377.02 | 3.02 | 1.98 | |
| Interval | 375.00 | 376.00 | 1.00 | 5.92 | |
| GD-25-351 | Interval | 418.00 | 423.00 | 5.00 | 1.44 |
| Including | 420.00 | 423.00 | 3.00 | 2.05 | |
| Interval | 511.00 | 514.00 | 3.00 | 1.79 | |
| Interval | 512.00 | 513.00 | 1.00 | 5.22 | |
| GD-25-344 | Interval | 215.82 | 220.94 | 5.12 | 1.59 |
| Including | 216.80 | 220.94 | 4.14 | 1.96 | |
| Including | 217.62 | 220.94 | 3.32 | 2.38 | |
| GD-25-399 | Interval | 58.50 | 61.50 | 3.00 | 2.71 |
| Interval | 59.00 | 60.50 | 1.50 | 5.34 | |
| GD-25-333 | Interval | 6.00 | 9.00 | 3.00 | 2.53 |
| Interval | 7.00 | 8.00 | 1.00 | 7.54 | |
| GD-25-306 | Interval | 135.00 | 141.00 | 6.00 | 1.25 |
| Including | 135.00 | 139.00 | 4.00 | 1.62 | |
| Interval | 281.70 | 282.35 | 0.65 | 1.47 | |
| GD-25-325 | Interval | 40.10 | 41.00 | 0.90 | 1.67 |
| Interval | 454.40 | 458.85 | 4.45 | 1.11 | |
| Including | 456.70 | 460.00 | 3.30 | 1.34 | |
| Interval | 576.00 | 579.00 | 3.00 | 2.44 | |
| Interval | 577.20 | 578.00 | 0.80 | 8.95 | |
| GD-25-371 | Interval | 545.10 | 549.00 | 3.90 | 0.68 |
| GD-25-406 | Interval | 122.00 | 125.00 | 3.00 | 1.70 |
| Interval | 137.00 | 143.00 | 6.00 | 1.20 | |
| Including | 139.00 | 142.00 | 3.00 | 2.20 | |
| GD-25-400 | Interval | 10.00 | 16.00 | 6.00 | 1.18 |
| Interval | 125.00 | 131.00 | 6.00 | 1.02 | |
| GD-25-331 | Interval | 146.00 | 151.00 | 5.00 | 1.00 |
| Including | 148.00 | 151.00 | 3.00 | 1.26 | |
| GD-25-361 | Interval | 303.80 | 310.08 | 6.28 | 1.06 |
| Including | 307.00 | 310.08 | 3.08 | 1.49 | |
| Interval | 315.00 | 318.00 | 3.00 | 1.08 | |
| Interval | 540.00 | 544.05 | 4.05 | 1.28 | |
| Interval | 542.00 | 542.85 | 0.85 | 5.72 | |
| GD-25-391 | Interval | 467.00 | 481.00 | 14.00 | 0.45 |
| GD-25-314 | Interval | 138.00 | 141.00 | 3.00 | 2.12 |
| GD-25-322 | Interval | 28.00 | 29.00 | 1.00 | 1.39 |
| Interval | 166.00 | 169.00 | 3.00 | 1.08 | |
| GD-25-309 | Interval | 296.03 | 299.07 | 3.04 | 1.72 |
| Interval | 296.92 | 298.00 | 1.08 | 4.80 | |
| GD-25-341 | Interval | 205.86 | 210.00 | 4.14 | 1.20 |
| Including | 205.86 | 209.00 | 3.14 | 1.51 | |
| Interval | 205.86 | 206.82 | 0.96 | 4.75 | |
| Interval | 394.00 | 399.00 | 5.00 | 1.04 | |
| Including | 395.00 | 398.03 | 3.03 | 1.68 | |
| GD-25-348 | Interval | 217.43 | 222.05 | 4.62 | 1.09 |
| Including | 217.43 | 221.12 | 3.69 | 1.34 | |
| Interval | 916.50 | 919.80 | 3.30 | 1.12 | |
| Interval | 917.52 | 918.73 | 1.21 | 2.98 | |
| GD-25-379 | Interval | 288.00 | 291.74 | 3.74 | 1.15 |
| Interval | 494.00 | 497.88 | 3.88 | 1.02 | |
| Interval | 496.00 | 497.00 | 1.00 | 3.71 | |
| Interval | 531.20 | 532.30 | 1.10 | 2.26 | |
| GD-25-346 | Interval | 220.88 | 225.00 | 4.12 | 1.03 |
| Including | 221.84 | 225.00 | 3.16 | 1.33 | |
| GD-25-315 | Interval | 224.00 | 227.00 | 3.00 | 1.22 |
| Interval | 225.00 | 226.00 | 1.00 | 3.52 | |
| GD-25-364 | Interval | 253.80 | 256.65 | 2.85 | 1.26 |
| Interval | 254.80 | 255.65 | 0.85 | 4.05 | |
| GD-25-339 | Interval | 635.75 | 639.00 | 3.25 | 1.09 |
| Interval | 636.48 | 637.32 | 0.84 | 3.95 | |
| GD-25-388 | Interval | 101.00 | 102.15 | 1.15 | 2.14 |
| GD-25-397 | Interval | 184.00 | 188.00 | 4.00 | 0.86 |
| GD-25-336 | Interval | 224.00 | 225.00 | 1.00 | 1.20 |
| Interval | 229.00 | 232.00 | 3.00 | 1.09 | |
| Interval | 230.00 | 231.00 | 1.00 | 3.11 | |
| GD-25-384 | Interval | 422.00 | 423.00 | 1.00 | 1.79 |
| Interval | 547.00 | 548.00 | 1.00 | 1.20 | |
| GD-25-402 | Interval | 196.00 | 197.25 | 1.25 | 2.44 |
| GD-25-338 | Interval | 426.00 | 429.00 | 3.00 | 0.80 |
| GD-25-369 | Interval | 667.00 | 671.00 | 4.00 | 0.70 |
| GD-25-409 | Interval | 124.00 | 127.00 | 3.00 | 0.79 |
| GD-25-307 | Interval | 304.78 | 305.66 | 0.88 | 2.64 |
| Interval | 410.36 | 411.51 | 1.15 | 1.94 | |
| Interval | 410.36 | 411.51 | 1.15 | 1.94 | |
| GD-25-392 | Interval | 93.57 | 94.80 | 1.23 | 1.09 |
| GD-25-404 | Interval | 183.00 | 186.00 | 3.00 | 0.44 |
| GD-25-340 | Interval | 367.45 | 370.47 | 3.02 | 0.36 |
| GD-25-347 | Interval | 334.00 | 335.00 | 1.00 | 1.70 |
| GD-25-353 | Interval | 292.96 | 294.00 | 1.04 | 1.07 |
| GD-25-320 | Interval | 216.00 | 219.00 | 3.00 | 0.48 |
| GD-25-408 | Interval | 111.00 | 115.08 | 4.08 | 0.25 |
| GD-25-310 | Interval | 150.00 | 151.00 | 1.00 | 1.08 |
| GD-25-304 | Interval | 255.00 | 256.00 | 1.00 | 0.69 |
Table 4: Collar information for drill holes reported in this news release.
| Hole ID | CRS | Easting (m) | Northing (m) | Elevation (m) | Azimuth (deg) | Dip (deg) | Length (m) |
| GD-25-301 | NAD83 / UTM zone 9N | 457445 | 6162773 | 1513 | 168 | 58 | 702 |
| GD-25-303 | NAD83 / UTM zone 9N | 457364 | 6162754 | 1508 | 157 | 61 | 676 |
| GD-25-304 | NAD83 / UTM zone 9N | 457214 | 6162332 | 1220 | 320 | 55 | 308 |
| GD-25-305 | NAD83 / UTM zone 9N | 457447 | 6162774 | 1513 | 155 | 54 | 687 |
| GD-25-306 | NAD83 / UTM zone 9N | 457214 | 6162332 | 1220 | 342 | 59 | 346 |
| GD-25-307 | NAD83 / UTM zone 9N | 456927 | 6163020 | 1651 | 152 | 72 | 678 |
| GD-25-308 | NAD83 / UTM zone 9N | 457364 | 6162756 | 1509 | 160 | 67 | 705 |
| GD-25-309 | NAD83 / UTM zone 9N | 456710 | 6162964 | 1638 | 295 | 89 | 612 |
| GD-25-310 | NAD83 / UTM zone 9N | 457214 | 6162332 | 1219 | 28 | 62 | 509 |
| GD-25-312 | NAD83 / UTM zone 9N | 457365 | 6162756 | 1509 | 150 | 71 | 681 |
| GD-25-314 | NAD83 / UTM zone 9N | 457018 | 6162591 | 1387 | 80 | 70 | 593 |
| GD-25-315 | NAD83 / UTM zone 9N | 457218 | 6162331 | 1219 | 63 | 63 | 486 |
| GD-25-316 | NAD83 / UTM zone 9N | 456927 | 6163020 | 1651 | 150 | 76 | 723 |
| GD-25-319 | NAD83 / UTM zone 9N | 457365 | 6162754 | 1505 | 141 | 62 | 629 |
| GD-25-320 | NAD83 / UTM zone 9N | 457215 | 6162328 | 1219 | 170 | 70 | 367 |
| GD-25-322 | NAD83 / UTM zone 9N | 457214 | 6162332 | 1219 | 250 | 70 | 594 |
| GD-25-323 | NAD83 / UTM zone 9N | 456927 | 6163020 | 1652 | 90 | 80 | 620 |
| GD-25-325 | NAD83 / UTM zone 9N | 457365 | 6162755 | 1509 | 128 | 88 | 669 |
| GD-25-326 | NAD83 / UTM zone 9N | 457236 | 6162867 | 1586 | 23 | 80 | 734 |
| GD-25-327 | NAD83 / UTM zone 9N | 457016 | 6162593 | 1388 | 5 | 65 | 459 |
| GD-25-329 | NAD83 / UTM zone 9N | 457444 | 6162778 | 1515 | 330 | 80 | 685 |
| GD-25-330 | NAD83 / UTM zone 9N | 457326 | 6162856 | 1582 | 206 | 73 | 681 |
| GD-25-331 | NAD83 / UTM zone 9N | 457815 | 6162506 | 1144 | 194 | 83 | 360 |
| GD-25-332 | NAD83 / UTM zone 9N | 456927 | 6163020 | 1653 | 10 | 75 | 708 |
| GD-25-333 | NAD83 / UTM zone 9N | 457365 | 6162757 | 1509 | 127 | 71 | 798 |
| GD-25-334 | NAD83 / UTM zone 9N | 457236 | 6162741 | 1490 | 128 | 66 | 696 |
| GD-25-335 | NAD83 / UTM zone 9N | 457015 | 6162587 | 1387 | 180 | 60 | 498 |
| GD-25-336 | NAD83 / UTM zone 9N | 456710 | 6162961 | 1639 | 315 | 75 | 606 |
| GD-25-337 | NAD83 / UTM zone 9N | 457813 | 6162507 | 1145 | 244 | 62 | 370 |
| GD-25-338 | NAD83 / UTM zone 9N | 457445 | 6162774 | 1514 | 173 | 69 | 621 |
| GD-25-339 | NAD83 / UTM zone 9N | 457236 | 6162865 | 1586 | 120 | 70 | 792 |
| GD-25-340 | NAD83 / UTM zone 9N | 456861 | 6162631 | 1451 | 300 | 55 | 405 |
| GD-25-341 | NAD83 / UTM zone 9N | 456927 | 6163020 | 1652 | 310 | 75 | 615 |
| GD-25-342 | NAD83 / UTM zone 9N | 457815 | 6162511 | 1146 | 336 | 70 | 350 |
| GD-25-344 | NAD83 / UTM zone 9N | 457319 | 6162857 | 1585 | 265 | 77 | 705 |
| GD-25-345 | NAD83 / UTM zone 9N | 457366 | 6162757 | 1509 | 120 | 52 | 822 |
| GD-25-346 | NAD83 / UTM zone 9N | 456863 | 6162632 | 1452 | 340 | 45 | 471 |
| GD-25-347 | NAD83 / UTM zone 9N | 456710 | 6162961 | 1639 | 270 | 65 | 442 |
| GD-25-348 | NAD83 / UTM zone 9N | 457413 | 6163252 | 1733 | 115 | 65 | 1001 |
| GD-25-349 | NAD83 / UTM zone 9N | 457817 | 6162512 | 1145 | 50 | 65 | 756 |
| GD-25-351 | NAD83 / UTM zone 9N | 457235 | 6162738 | 1489 | 170 | 57 | 723 |
| GD-25-352 | NAD83 / UTM zone 9N | 457038 | 6162952 | 1604 | 42 | 76 | 847 |
| GD-25-353 | NAD83 / UTM zone 9N | 456864 | 6162633 | 1453 | 7 | 56 | 501 |
| GD-25-357 | NAD83 / UTM zone 9N | 456865 | 6162628 | 1451 | 135 | 65 | 525 |
| GD-25-361 | NAD83 / UTM zone 9N | 457191 | 6163128 | 1712 | 160 | 85 | 699 |
| GD-25-363 | NAD83 / UTM zone 9N | 457411 | 6163251 | 1733 | 175 | 68 | 901 |
| GD-25-364 | NAD83 / UTM zone 9N | 457464 | 6163017 | 1633 | 230 | 80 | 795 |
| GD-25-366 | NAD83 / UTM zone 9N | 457399 | 6162901 | 1606 | 211 | 69 | 705 |
| GD-25-367 | NAD83 / UTM zone 9N | 457235 | 6162864 | 1585 | 213 | 74 | 651 |
| GD-25-368 | NAD83 / UTM zone 9N | 457485 | 6163165 | 1706 | 250 | 77 | 690 |
| GD-25-369 | NAD83 / UTM zone 9N | 457319 | 6162859 | 1585 | 310 | 85 | 738 |
| GD-25-371 | NAD83 / UTM zone 9N | 457190 | 6163130 | 1712 | 40 | 86 | 681 |
| GD-25-375 | NAD83 / UTM zone 9N | 457486 | 6163164 | 1706 | 250 | 85 | 747 |
| GD-25-379 | NAD83 / UTM zone 9N | 457189 | 6163129 | 1712 | 268 | 85 | 614 |
| GD-25-381 | NAD83 / UTM zone 9N | 457511 | 6163074 | 1660 | 115 | 66 | 360 |
| GD-25-382 | NAD83 / UTM zone 9N | 457591 | 6162372 | 1119 | 215 | 45 | 160 |
| GD-25-384 | NAD83 / UTM zone 9N | 457233 | 6162865 | 1585 | 255 | 78 | 674 |
| GD-25-386 | NAD83 / UTM zone 9N | 457512 | 6163073 | 1660 | 129 | 56 | 459 |
| GD-25-388 | NAD83 / UTM zone 9N | 457879 | 6162621 | 1179 | 270 | 65 | 498 |
| GD-25-389 | NAD83 / UTM zone 9N | 457849 | 6162680 | 1209 | 170 | 70 | 483 |
| GD-25-390 | NAD83 / UTM zone 9N | 457488 | 6163166 | 1707 | 70 | 80 | 792 |
| GD-25-391 | NAD83 / UTM zone 9N | 457465 | 6163019 | 1634 | 286 | 76 | 618 |
| GD-25-392 | NAD83 / UTM zone 9N | 457757 | 6162595 | 1200 | 280 | 55 | 423 |
| GD-25-393 | NAD83 / UTM zone 9N | 457322 | 6162859 | 1585 | 5 | 68 | 702 |
| GD-25-394 | NAD83 / UTM zone 9N | 457594 | 6162372 | 1119 | 168 | 55 | 345 |
| GD-25-395 | NAD83 / UTM zone 9N | 457402 | 6162902 | 1606 | 105 | 65 | 801 |
| GD-25-396 | NAD83 / UTM zone 9N | 457758 | 6162596 | 1201 | 284 | 75 | 274 |
| GD-25-397 | NAD83 / UTM zone 9N | 457850 | 6162683 | 1211 | 20 | 75 | 412 |
| GD-25-399 | NAD83 / UTM zone 9N | 457760 | 6162596 | 1201 | 356 | 64 | 288 |
| GD-25-400 | NAD83 / UTM zone 9N | 457598 | 6162374 | 1119 | 147 | 83 | 309 |
| GD-25-401 | NAD83 / UTM zone 9N | 457881 | 6162620 | 1179 | 210 | 80 | 600 |
| GD-25-402 | NAD83 / UTM zone 9N | 457972 | 6162658 | 1175 | 292 | 48 | 249 |
| GD-25-403 | NAD83 / UTM zone 9N | 457467 | 6163017 | 1633 | 147 | 83 | 600 |
| GD-25-404 | NAD83 / UTM zone 9N | 457848 | 6162684 | 1211 | 325 | 55 | 348 |
| GD-25-405 | NAD83 / UTM zone 9N | 457763 | 6162595 | 1200 | 82 | 75 | 312 |
| GD-25-406 | NAD83 / UTM zone 9N | 457973 | 6162657 | 1174 | 281 | 71 | 246 |
| GD-25-407 | NAD83 / UTM zone 9N | 457399 | 6162904 | 1608 | 350 | 82 | 395 |
| GD-25-408 | NAD83 / UTM zone 9N | 457972 | 6162655 | 1177 | 230 | 60 | 219 |
| GD-25-409 | NAD83 / UTM zone 9N | 457883 | 6162622 | 1178 | 60 | 75 | 302 |
About Golddigger Property
The Golddigger Property is 100% controlled and covers an area of 91,518 hectares in a highly prospective geological setting of the Eskay Rift, within 3 kilometers of the Red Line in the Golden Triangle of British Columbia. This area, in close proximity to the Red Line, has hosted some of Canada’s greatest gold mines including Eskay Creek, Premier and Snip. Other significant and well-known deposits in the Golden Triangle include Brucejack, Copper Canyon, Galore Creek, Granduc, KSM, Red Chris, and Schaft Creek. Goliath controls 56 kilometers of the Red Line which is a geologic contact between Triassic age Stuhini rocks and Jurassic age Hazelton rocks used as key markers when exploring for gold-copper-silver mineralization.
The Surebet discovery has predictable continuity and good metallurgy with gold recoveries from gravity and flotation at a 327-micrometer crush of 92.2% including 48.8% free gold from gravity alone (no cyanide required to recover the gold). The metallurgy completed to date shows no deleterious elements are present (see news release dated March 1, 2023).
The Property is in a well positioned location in close proximity to the communities of Alice Arm and Kitsault where there is a permitted mill site on private property. It is situated on tide water with direct barge access to Prince Rupert (190 kilometers via the Observatory inlet/Portland inlet). The town of Kitsault is accessible by road (190 kilometers from Terrace, 300 kilometers from Prince Rupert) and has a barge landing, dock, and infrastructure capable of housing at least 300 people, including high-tension power.
Additional infrastructure in the area includes the Dolly Varden Silver Mine Road (only 7 kilometers to the East of the Surebet discovery) with direct road access to Alice Arm barge landing (18 kilometers to the south of the Surebet discovery) and high-tension power (25 kilometers to the east of Surebet discovery). The city of Terrace (population 16,000) provides access to railway, major highways, and airport with supplies (food, fuel, lumber, etc.), while the town of Prince Rupert (population 12,000) is located on the West Coast of British Columbia and houses an international container seaport also with direct access to railway and an airport.
About CASERM (Center to Advance the Science of Exploration to Reclamation in Mining)
Goliath Resources is a paying member and active supporter of the Center to Advance the Science of Exploration to Reclamation in Mining (CASERM), which is one of the world’s largest research centers in the mining sector. CASERM is a collaborative research venture between Colorado School of Mines and Virginia Tech that is supported by a consortium of mining and exploration companies, analytical instrumentation and software companies, and federal agencies aiming to transform the way geoscience data is acquired and used across the mining value chain. The center forms part of the I-UCRC program of the National Science Foundation. Research focuses on the integration of diverse geoscience data to improve decision making across the mine life cycle, beginning with the exploration for subsurface resources continuing through mine operation as well as closure and environmental remediation. Over the past three years, Goliath Resources’ membership in CASERM has allowed a high level of research to be performed on the Surebet Discovery.
Independent Trading Group Engaged As Market Maker
Goliath has engaged the services of Independent Trading Group (“ITG”) to provide market-making services in accordance with TSX Venture Exchange TSXV, CSE, Cboe Canada policies subject to regulatory approval. ITG will trade shares of the Company on the TSXV and all other trading venues with the objective of maintaining a reasonable market and improving the liquidity of the Company's common shares.
Under the agreement, ITG will receive compensation of CAD$6,000 per month, payable monthly in advance. The agreement is for an initial term of one month and will renew for additional one-month terms unless terminated. The agreement may be terminated by either party with 30 days' notice. There are no performance factors contained in the agreement and ITG will not receive shares or options as compensation. ITG and the Company are unrelated and unaffiliated entities and at the time of the agreement, neither ITG nor its principals have an interest, directly or indirectly, in the securities of the Company.
About Independent Trading Group
Independent Trading Group (ITG) Inc. is a Toronto based CIRO dealer-member that specializes in market making, liquidity provision, agency execution, ultra-low latency connectivity, and bespoke algorithmic trading solutions. Established in 1992, with a focus on market structure, execution and trading, ITG has leveraged its own proprietary technology to deliver high quality liquidity provision and execution services to a broad array of public issuers and institutional investors.
RSU Grant
The Company has granted an aggregate of 3,165,000 restricted share units to officers and directors of the Company, which will vest equally over three years, with first vesting occurring after one year. Also, a total of 75,000 restricted share units granted to a consultant which will vest in one year. All restricted share units are subject to the Company's omnibus equity incentive plan.
Qualified Person
Rein Turna P. Geo is the qualified person as defined by National Instrument 43-101, for Goliath Resource Limited projects, and supervised the preparation of, and has reviewed and approved, the technical information in this release. Mr. Turna is an Independent Director of the Company.
About Goliath Resources Limited
Goliath Resources is an explorer of precious metals projects in the highly prospective Golden Triangle of Northwest-ern British Columbia. All of its projects are in high quality geological settings and geopolitical safe jurisdictions amenable to mining in Canada. Goliath is a member and active supporter of CASERM which is an organization that represents a collaborative venture between Colorado School of Mines and Virginia Tech. In 2025, Goliath completed its largest drill campaign to date for a total of 64,364 meters. It is fully funded for a similar sized drill program in 2026. Assay results are still pending for 110 holes from the 2025 exploration campaign for the gold equivalent (AuEq) values, that will be announced once received, compiled and interpreted. The Company’s key strategic cornerstone shareholders include Crescat Capital, a Global Commodity Group (Singapore), McEwen Inc. (NYSE: MUX) (TSX: MUX), Waratah Capital Advisors, Rob McEwen, Eric Sprott and Larry Childress.
For more information please contact:
Goliath Resources Limited Mr. Roger Rosmus Founder and CEO Tel: +1.416.488.2887roger@goliathresources.com www.goliathresourcesltd.com
Disclaimer
The reader is cautioned that grab samples are spot samples which are typically, but not exclusively, constrained to mineralization. Grab samples are selective in nature and collected to determine the presence or absence of mineralization and are not intended to be representative of the material sampled.
QA/QC Protocol
Oriented HQ-diameter or NQ-diameter diamond drill core from the drill campaign is placed in core boxes by the drill crew contracted by the Company. Core boxes are transported by helicopter to the staging area and then transported by truck to the core shack. The core is then re-orientated, meterage blocks are checked, meter marks are labelled, Recovery and RQD measurements taken, and primary bedding and secondary structural features including veins, dykes, cleavage, and shears are noted and measured. The core is then described and transcribed in MX DepositTM. Drill holes were planned using Leapfrog GeoTM and QGISTM software and data from the 2017-2024 exploration campaigns. Drill core containing quartz breccia, stockwork, veining and/or sulphide(s), or notable alteration is sampled in lengths of 0.5 to 1.5 meters. Core samples are cut lengthwise in half: one-half remains in the box and the other half is inserted in a clean plastic bag with a sample tag. The bagged samples are then weighed and secured with a zip tie. Certified reference materials (CRMs), blanks and duplicates are added in the sample stream at a rate of 10%. To ensure analytical anonymity, CRM identification labels are removed prior to submission to the laboratory. Additional out-of-sequence blanks are introduced immediately following core samples that contain VG-NE or high-grade sulphide mineralization.
Grab, channels, chip and talus samples were collected by foot with helicopter assistance. Prospective areas included, but were not limited to, proximity to MINFile locations, placer creek occurrences, regional soil anomalies, and potential gossans based on high-resolution satellite imagery. The rock grab and chip samples were extracted using a rock hammer, or hammer and chisel to expose fresh surfaces and to liberate a sample of anywhere between 0.5 to 5.0 kilograms. All sample sites were flagged with biodegradable flagging tape and marked with the sample number. All sample sites were recorded using hand-held GPS units (accuracy 3-10 meters) and sample ID, easting, northing, elevation, type of sample (outcrop, subcrop, float, talus, chip, grab, etc.) and a description of the rock were recorded on all-weather paper. Samples are then inserted in a clean plastic bag with a sample tag for transport and shipping to the geochemistry lab. QA/QC samples including blanks, certified reference materials, and duplicate samples are inserted regularly into the sample sequence at a rate of 10%.
All samples are transported in rice bags sealed with numbered security tags. The rice bags are transported from the core shacks to the MSALABS facilities in Terrace, BC. MSALABS is certified with both AC89-IAS and ISO/IEC Standard 17025:2017. The core samples undergo preparation via drying, crushing to ~70% of the material passing a 2 mm sieve and riffle splitting. The sample splits are weighed and transferred into three plastic jars, each containing between 300 g and 500 g of crushed sample material. A 250 g split is pulverized to ensure at least 85% of the material passes through a 75 µm sieve. The crushed samples are transported to the MSALABS PhotonAssayTM facility in Prince George, where gold concentrations are quantified via photon assay analysis (method CPA-Au1). Samples that result in gold concentrations ≥5 ppm are analyzed to extinction. Photon assay uses high-energy X-rays (photons) to excite atomic nuclei within the jarred samples, inducing the emission of secondary gamma rays, which are measured to quantify gold concentrations. The assays from all jars are combined on a weight-averaged basis. Multielement analyses are carried at the MSALABS facilities in Surrey, BC, where 250 g of pulverized splits are analyzed via ICF6xx and IMS-230 methods. The IMS-230 method uses 4-acid digestion (a combination of hydrochloric, nitric, perchloric and hydrofluoric acids) followed by inductively coupled plasma emission spectrometry to quantify concentrations of 48 elements. Samples with over-limit results for Ag, Cu, Pb and Zn undergo ore-grade analysis via the ICF-6xx method (where ‘xx’ denotes the target metal). This method employs 4-acid digestion followed by inductively coupled plasma emission spectrometry.
Widths are reported in drill core lengths and the true widths are estimated to be 80-90% and Gold Equivalent (AuEq) metal values are calculated using: Au 2797.16 USD/oz, Ag 31.28 USD/oz, Cu 4.25 USD/lbs, Pb 1955.58 USD/ton and Zn 2750.50 USD/ton on January 31st, 2025. There is potential for economic recovery of gold, silver, copper, lead, and zinc from these occurrences based on other mining and exploration projects in the same Golden Triangle Mining Camp where Goliath’s project is located such as the Homestake Ridge Gold Project (Auryn Resources Technical Report, Updated Mineral Resource Estimate and Preliminary Economic Assessment on the Homestake Ridge Gold Project, prepared by Minefill Services Inc. Bothell, Washington, dated May 29, 2020). Here, AuEq values were calculated using 3-year running averages for metal price, and included provisions for metallurgical recoveries, treatment charges, refining costs, and transportation. Recoveries for Gold were 85.5%, Silver at 74.6%, Copper at 74.6% and Lead at 45.3%. It will be assumed that Zinc can be recovered with the Copper at the same recovery rate of 74.6%. The quoted reference of metallurgical recoveries is not from Goliath’s Golddigger Project, Surebet Zone mineralization, and there is no guarantee that such recoveries will ever be achieved, unless detailed metallurgical work such as in a Feasibility Study can be eventually completed on the Golddigger Project.
Neither the TSX Venture Exchange nor its Regulation Services Provider (as that term is defined in the policies of the TSX Venture Exchange), nor the OTCQB Venture Market accepts responsibility for the adequacy or accuracy of this release.
Certain statements contained in this press release constitute forward-looking information. These statements relate to future events or future performance. The use of any of the words "could", "intend", "expect", "believe", "will", "projected", "estimated" and similar expressions and statements relating to matters that are not historical facts are intended to identify forward-looking information and are based on Goliath’s current belief or assumptions as to the outcome and timing of such future events. Actual future results may differ materially. In particular, this release contains forward-looking information relating to, among other things, the ability of the Company to complete financings and its ability to build value for its shareholders as it develops its mining properties. Various assumptions or factors are typically applied in drawing conclusions or making the forecasts or projections set out in forward-looking information. Those assumptions and factors are based on information currently available to Goliath. Although such statements are based on management's reasonable assumptions, there can be no assurance that the proposed transactions will occur, or that if the proposed transactions do occur, will be completed on the terms described above.
The forward-looking information contained in this release is made as of the date hereof and Goliath is not obligated to update or revise any forward-looking information, whether as a result of new information, future events or otherwise, except as required by applicable securities laws. Because of the risks, uncertainties and assumptions contained herein, investors should not place undue reliance on forward-looking information. The foregoing statements expressly qualify any forward-looking information contained herein.
This announcement does not constitute an offer, invitation, or recommendation to subscribe for or purchase any securities and neither this announcement nor anything contained in it shall form the basis of any contract or commitment. In particular, this announcement does not constitute an offer to sell, or a solicitation of an offer to buy, securities in the United States, or in any other jurisdiction in which such an offer would be illegal.
The securities referred to herein have not been and will not be will not be registered under the United States Securities Act of 1933, as amended (the “U.S. Securities Act”), or any state securities laws and may not be offered or sold within the United States or to or for the account or benefit of a U.S. person (as defined in Regulation S under the U.S. Securities Act) unless registered under the U.S. Securities Act and applicable state securities laws or an exemption from such registration is available.
The global Gold market is poised for growth, driven by economic volatility boosting investment demand, technological innovations enhancing mining efficiency, and increasing gold use in technology. The rising middle class in emerging economies also fuels jewelry demand, while geopolitical and economic shifts influence overall market dynamics.
Gold Market
Gold Market
Dublin, Jan. 20, 2026 (GLOBE NEWSWIRE) — The "Gold – Global Strategic Business Report" report has been added to ResearchAndMarkets.com's offering.The global market for Gold was sized at 4.7 Thousand Tonnes in 2024 and is projected to reach 6.3 Thousand Tonnes by 2030, growing at a CAGR of 5.1% from 2024 to 2030. This comprehensive report provides an in-depth analysis of market trends, drivers, and forecasts, helping you make informed business decisions.
Historically, gold has played a central role in many economies and has been used as a stable foundation for monetary systems. Even today, countries hold large reserves of gold as a safeguard to stabilize national economies and as a hedge against inflation or economic uncertainty. This precious metal is mined in several countries, with China, Australia, Russia, and the United States being the largest producers. The process of mining gold can be intensive and complex, involving extensive exploration, excavation, and processing.
What Drives the Growth of the Gold Market?The growth in the gold market is driven by several factors. Economic volatility and uncertainty often lead investors to gold as a safe store of value, pushing up its price and demand. Technological advancements that lower the cost of gold extraction and processing also contribute to market growth by sustaining its supply at lower costs.
Moreover, the expansion of the middle class in emerging economies boosts demand for gold jewelry and ornaments, further propelling the market. Additionally, as new uses for gold in technology and medicine are developed, its industrial demand continues to expand. Global trade policies and geopolitical tensions can also impact the gold market, influencing investor behavior and gold prices.How Are Technological Advancements Impacting Gold Production and Use?Technological advancements have significantly transformed the methods of extracting and processing gold, increasing efficiency and environmental sustainability. Modern techniques in gold mining include bio-mining, which uses microbial processes to extract gold from ore and reduce the environmental impact associated with traditional extraction methods such as cyanide leaching.
In gold refining, advancements have streamlined processes to reduce waste and improve the purity of the final product. Technology has also expanded the use of gold beyond adornment and currency into applications such as electronics, where gold's excellent conductivity makes it valuable for use in high-end connectors and circuit boards, and healthcare, where it is used in diagnostic procedures and treatments.What Are the Current Market Dynamics Influencing Gold Demand?The demand for gold is influenced by various factors that make it unique compared to other commodities. It is driven not only by its practical uses in jewelry and technology but also by its role as an investment vehicle. During times of economic uncertainty, gold is often seen as a 'safe haven' investment due to its intrinsic value and historical reliability.
This has been evident during economic downturns, where an increase in investment demand for gold often offsets the declines in its industrial and jewelry use. Additionally, the growing middle class in emerging markets has spurred demand for gold jewelry, particularly in countries like China and India, where gold is deeply woven into the cultural fabric. Central bank policies, inflation rates, and currency stability also significantly affect gold prices and investment demand.
Report Features:
- Comprehensive Market Data: Independent analysis of annual sales and market forecasts in US$ Million from 2024 to 2030.
- In-Depth Regional Analysis: Detailed insights into key markets, including the U.S., China, Japan, Canada, Europe, Asia-Pacific, Latin America, Middle East, and Africa.
- Company Profiles: Coverage of players such as AngloGold Ashanti, Barrick Gold Corporation, Furukawa Co., Ltd., Gabriel Resources Ltd., Harmony Gold Mining Company Limited and more.
- Complimentary Updates: Receive free report updates for one year to keep you informed of the latest market developments.
Key Insights:
- Market Growth: Understand the significant growth trajectory of the Gold Jewelry segment, which is expected to reach 3 Thousand Tonnes by 2030 with a CAGR of a 5.6%. The Gold Bars & Coins segment is also set to grow at 4.5% CAGR over the analysis period.
- Regional Analysis: Gain insights into the U.S. market, valued at 1.2 Thousand Tonnes in 2024, and China, forecasted to grow at an impressive 7.6% CAGR to reach 1.4 Thousand Tonnes by 2030. Discover growth trends in other key regions, including Japan, Canada, Germany, and the Asia-Pacific.
Report Scope
- Segments: Type (Jewelry, Bars & Coins, ETFs & Similar Products, Central Banks & Other Investments, Technology).
- Geographic Regions/Countries:World; United States; Canada; Japan; China; Europe (France; Germany; Italy; United Kingdom; Spain; Russia; and Rest of Europe); Asia-Pacific (Australia; India; South Korea; and Rest of Asia-Pacific); Latin America (Argentina; Brazil; Mexico; and Rest of Latin America); Middle East (Iran; Israel; Saudi Arabia; United Arab Emirates; and Rest of Middle East); and Africa.
Key Attributes:
| Report Attribute | Details |
| No. of Pages | 513 |
| Forecast Period | 2024 – 2030 |
| Estimated Market Value in 2024 | 4.7 Thousand Tonnes |
| Forecasted Market Value by 2030 | 6.3 Thousand Tonnes |
| Compound Annual Growth Rate | 5.1% |
| Regions Covered | Global |
Key Topics Covered: MARKET OVERVIEW
- Trade Shocks, Uncertainty, and the Structural Rewiring of the Global Economy
- How Trump's Tariffs Impact the Market? The Big Question on Everyone's Mind
- Global Economic Update
- Gold – Global Key Competitors Percentage Market Share in 2025 (E)
- Competitive Market Presence – Strong/Active/Niche/Trivial for Players Worldwide in 2025 (E)
MARKET TRENDS & DRIVERS
- Advances in Mining Technology Propel Growth in Gold Market
- Increasing Demand for Gold as an Investment Expands Addressable Market Opportunity
- Technological Innovations in Gold Extraction Generate Demand for Efficient Mining Solutions
- Growth in Jewelry and Luxury Goods Sector Drives Adoption of Gold
- Rising Focus on Sustainable and Ethical Sourcing Strengthens Business Case for Responsible Gold Mining
- Adoption of Gold in Electronics and Technology Spurs Growth in Market
- Advances in Gold Recycling and Recovery Sustain Growth in Secondary Markets
- Integration with Digital and Blockchain Technologies Drives Market Expansion
- Innovations in Gold-Based Nanomaterials Propel Growth in Medical and Industrial Applications
FOCUS ON SELECT PLAYERS:Some of the 366 companies featured in this Gold market report include:
- AngloGold Ashanti
- Barrick Gold Corporation
- Furukawa Co., Ltd.
- Gabriel Resources Ltd.
- Harmony Gold Mining Company Limited
- Jinshan Gold
- Johnson Matthey PLC
- Kinross Gold Corporation
- New Gold Inc.
- New mont Mining Corporation
- Tertiary Minerals PLC
- Vedanta Resources PLC
- Zijin Mining Group
For more information about this report visit https://www.researchandmarkets.com/r/28zwga
About ResearchAndMarkets.comResearchAndMarkets.com is the world's leading source for international market research reports and market data. We provide you with the latest data on international and regional markets, key industries, the top companies, new products and the latest trends.
Attachment
CONTACT:
CONTACT: ResearchAndMarkets.com
Laura Wood,Senior Press Manager
press@researchandmarkets.com
For E.S.T Office Hours Call 1-917-300-0470
For U.S./ CAN Toll Free Call 1-800-526-8630
For GMT Office Hours Call +353-1-416-8900
Goliath Resources Limited
TORONTO, Jan. 15, 2026 (GLOBE NEWSWIRE) — Goliath Resources Limited (TSX-V: GOT) (OTCQB: GOTRF) (Frankfurt: B4IF) (the "Company" or "Goliath") is pleased to announce the results of its annual and special meeting of shareholders held January 14, 2026 (the “Meeting). All items of business tabled at the Meeting were approved by the requisite majorities, including:
-
Roger Rosmus, Graham Warren, Wayne Isaacs and Rein Turna were re-elected as directors of the Company;
-
McGovern Hurley LLP was re-appointed as the auditor of the Company;
-
The omnibus equity incentive plan (the “Plan”) was re-approved for use by the Company;
-
Certain amendments to the Plan were approved by the disinterested shareholders of the Company; and
-
The consolidation of the outstanding common shares of the Company on the basis of one (new) for up to seven (old) Common Shares (the “Consolidation”) was approved.
Despite the approval of the shareholders of the Consolidation at the Meeting, the Board of Directors of the Company has exercised its discretion and determined not to proceed with the Consolidation.
The Meeting materials, including the management information circular dated November 30, 2025 (the “Circular”), are available under the Company’s profile on www.SEDARPLUS.ca and on the Company’s website at https://goliathresourcesltd.com/.
About Goliath Resources Limited
Goliath Resources is an explorer of precious metals projects in the highly prospective Golden Triangle of Northwestern British Columbia. All of its projects are in high quality geological settings and geopolitical safe jurisdictions amenable to mining in Canada. Goliath is a member and active supporter of CASERM which is an organization that represents a collaborative venture between Colorado School of Mines and Virginia Tech. Goliath recently completed its largest fully funded drill campaign to date for a total of 64,364 meters in 2025. It has assays pending for 70 gold only holes and 110 gold equivalent holes. It is fully funded for a similar sized drill program in 2026. The Company’s key strategic cornerstone shareholders include Crescat Capital, a Global Commodity Group (Singapore), McEwen Inc. (NYSE: MUX) (TSX: MUX), Waratah Capital Advisors, Rob McEwen, Eric Sprott and Larry Childress.
For more information please contact:
Goliath Resources Limited
Mr. Roger Rosmus Founder and CEO Tel: +1.416.488.2887roger@goliathresources.comwww.goliathresourcesltd.com
Neither the TSX Venture Exchange nor its Regulation Services Provider (as that term is defined in the policies of the TSX Venture Exchange) accepts responsibility for the adequacy or accuracy of this release.
Centerra Gold, Inc.’s CGAU shares hit a fresh 52-week high of $16.44 yesterday, before retracing slightly to close the session at $15.96.
CGAU has shot up 173.3% over the past year. The company has also outperformed the Zacks Mining-Gold industry’s 157% rise over the same time frame. Its rally has been driven primarily by higher gold prices, which have boosted margins, while steady production and better cost control have strengthened earnings visibility.
Image Source: Zacks Investment Research
Let’s take a look at the factors that are driving CGAU stock.
CGAU Boosted by Strong Q3 and Expansion Plans
Centerra Gold delivered a strong third-quarter performance, with revenues of $395.2 million, up 22% year over year, supported by higher prices of $3,178 per ounce for gold and $3.73 per pound for copper. The company produced 81,773 ounces of gold and 13.4 million pounds of copper, with stable operations, improved ore grades at Öksüt and effective plant management at Mount Milligan driving performance.
The company advanced several strategic growth initiatives. In September 2025, Centerra filed a Pre-Feasibility Study (PFS) for Mount Milligan, confirming a life-of-mine extension to 2045, a significant increase in mineral reserves, and planned throughput enhancements through plant upgrades and permitting activities extending into 2026–2027. In Nevada, the Goldfield project progressed with a technical study in August 2025, demonstrating strong economics and potential as a future production contributor.
On the development front, Centerra is moving ahead with the restart of the Thompson Creek mine and the Langeloth facility, with a feasibility-driven plan approved and ramp-up activities underway, targeting first production in the second half of 2027. Additionally, the company strengthened its exploration portfolio through a strategic equity investment in Midland Exploration in July 2025, supporting early-stage resource development and long-term growth potential.
CGAU’s Zacks Rank & Other Key Picks
CGAU currently sports a Zacks Rank #1 (Strong Buy).
Other top-ranked stocks in the Basic Materials space include Royal Gold Inc. RGLD, DPM Metals Inc. DPMLF and Harmony Gold Mining Company Limited HMY.
At present, RGLD and DPMLF sport a Zacks Rank #1, while HMY carries a Zacks Rank #2 (Buy). You can see the complete list of today’s Zacks #1 Rank stocks here.
The Zacks Consensus Estimate for RGLD’s current fiscal-year earnings is pinned at $8.04 per share, indicating a 53% year-over-year increase. Its earnings beat the Zacks Consensus Estimate in three of the trailing four quarters while missing once, with the average surprise being 4%. Its shares have popped around 83.6% over the past year.
The Zacks Consensus Estimate for DPMLF’s current-year earnings stands at $2.27 per share, implying a 76% year-over-year increase. Its earnings beat the Zacks Consensus Estimates in each of the trailing four quarters, with the average earnings surprise being 13%. DPMLF’s shares have rallied roughly 127.2% over the past year.
The Zacks Consensus Estimate for HMY’s current-year earnings is pegged at $2.68 per share, indicating a year-over-year rise of 111.02%. HMY’s shares have gained 129.2% over the past year.
Want the latest recommendations from Zacks Investment Research? Today, you can download 7 Best Stocks for the Next 30 Days. Click to get this free report
Harmony Gold Mining Company Limited (HMY) : Free Stock Analysis Report
Royal Gold, Inc. (RGLD) : Free Stock Analysis Report
DPM Metals Inc. (DPMLF) : Free Stock Analysis Report
Centerra Gold Inc. (CGAU) : Free Stock Analysis Report
This article originally published on Zacks Investment Research (zacks.com).
Goliath Resources Limited
TORONTO, Jan. 14, 2026 (GLOBE NEWSWIRE) — Goliath Resources Limited (TSX-V: GOT) (OTCQB: GOTRF) (FSE: B4IF) (the “Company” or “Goliath”) is focused on further expanding its new high-grade gold Surebet Discovery at its 100% controlled Golddigger Property that covers an area of 91,518 hectares in a highly prospective geological setting of the Eskay Rift, within 3 kilometers of the Red Line in the Golden Triangle of British Columbia. This area, in close proximity to the Red Line, has hosted some of Canada’s greatest gold mines including Eskay Creek, Premier and Snip. Other significant and well-known deposits in the Golden Triangle include Brucejack, Copper Canyon, Galore Creek, Granduc, KSM, Red Chris, and Schaft Creek. Goliath controls 56 kilometers of the Red Line which is a geologic contact between Triassic age Stuhini rocks and Jurassic age Hazelton rocks used as key markers when exploring for gold-copper-silver mineralization.
Goliath has completed over 150,000 meters of diamond drilling to date. It has confirmed a 1.8 square kilometer area that hosts multiple highly mineralized stacked zones containing high-grade gold grades that remains open. The Surebet discovery has predictable continuity and good metallurgy with gold recoveries from gravity and flotation at a 327-micrometer crush of 92.2% including 48.8% free gold from gravity alone (no cyanide required to recover the gold). The metallurgy completed to date shows no deleterious elements are present (see news release dated March 1, 2023).
AME Roundup 2026
To learn more about Goliath’s exciting new discovery, we would like to cordially invite you to visit us at our AME Roundup Core Shack, Booth # 1026C on Monday, January 26, 2026 – Tuesday, January 27, 2026 (9:00 AM – 4:00 PM). The event is being held at the Exhibit Hall – Vancouver Convention Centre East Building (1055 Canada Place, Vancouver, B.C.).
In case you are unable to see us at the core shack, please visit us at AME Roundup Booth #1104 as Goliath will also be exhibiting all 4 days Monday, January 26, 2026 – Wednesday, January 28, 2026 (9:00 AM – 4:00 PM) and Thursday, January 29, 2023 (9:00 AM – 2:30 PM).
Other Mining Conferences – Vancouver, January 2026
Vancouver Resource Investment Conference (VRIC), Goliath’s Booth #131. The event is being held at the Vancouver Convention Centre West Building (1055 Canada Place, Vancouver, B.C.) Sunday, January 25 – Monday, January 26, 2026 (8:30 AM – 6:00 PM). Roger Rosmus, Founder & CEO will be providing a corporate presentation on Sunday, January 25 (11:00 AM) at Workshop # 1.
Metals Investor Forum Vancouver, Goliath has a booth for the two day event and Roger Rosmus, Founder & CEO will be presenting Friday, January 23, 2026, during Session 1 at 10:00 AM. The event is being held at the Fairmont Pacific Rim (1038 Canada Place, Vancouver, B.C.) on Friday, January 23 – Saturday, January 24 (8:40 AM – 6:00 PM).
About the AME Roundup Conference
The AME Roundup is a dynamic four-day trade show featuring key players in mineral exploration, development, mining and reclamation. Among the hundreds of exhibitors under the sails in the Vancouver Convention Centre East, you will find prospectors and entrepreneurs, junior explorers and international mining companies, Indigenous groups, governments, universities, not-for-profits and an incredible collection of service and supply companies. For tickets and more information please visit: https://roundup.amebc.ca/
About the Vancouver Resource Investment Conference
The Vancouver Resource Investment Conference (VRIC) is the World’s Premier Mining Investment Event at a time when Gold & Silver are breaking records. The event will host 120 keynote speakers, 300 mining companies and over 12,000 attending investors. VRIC brings together the dealmakers, analysts, and operators shaping the future of precious metals — right when capital is surging back into the sector. For tickets and more information please visit: https://cambridgehouse.com/vancouver-resource-investment-conference
About the Metals Investor Forum Vancouver
Join 55 leading companies and 13 powerhouse keynote speakers at one of the most anticipated events of the year. Writers include: Eric Coffin (HRA Advisories), Joe Mazumdar (Exploration Insights), Jeff Clark (Paydirt Prospector), Brien Lundin (Gold Newsletter), Robert Sinn (Goldfinger Capital), Garrett Goggin (Golden Portfolio), Brian Leni (Junior Stock Review), John Kaiser (Kaiser Research Online), Chen Lin (What is Chen Buying? What is Chen Selling?), Peter Krauth (The Silver Stock Investor), and Greg McCoach (The Mining Speculator) for an exclusive, value-packed event. For tickets and more information please visit: https://metalsinvestorforum.com/metals-investor-forum-vancouver-jan-2026/
About the Golddigger Property
The Golddigger Property is 100% controlled and covers an area of 91,518 hectares in a highly prospective geological setting of the Eskay Rift, within 3 kilometers of the Red Line in the Golden Triangle of British Columbia. This area, in close proximity to the Red Line, has hosted some of Canada’s greatest gold mines including Eskay Creek, Premier and Snip. Other significant and well-known deposits in the Golden Triangle include Brucejack, Copper Canyon, Galore Creek, Granduc, KSM, Red Chris, and Schaft Creek. Goliath controls 56 kilometers of the Red Line which is a geologic contact between Triassic age Stuhini rocks and Jurassic age Hazelton rocks used as key markers when exploring for gold-copper-silver mineralization.
The Surebet discovery has predictable continuity and good metallurgy with gold recoveries from gravity and flotation at a 327-micrometer crush of 92.2% including 48.8% free gold from gravity alone (no cyanide required to recover the gold). The metallurgy completed to date shows no deleterious elements are present (see news release dated March 1, 2023).
The Property is in a well positioned location in close proximity to the communities of Alice Arm and Kitsault where there is a permitted mill site on private property. It is situated on tide water with direct barge access to Prince Rupert (190 kilometers via the Observatory inlet/Portland inlet). The town of Kitsault is accessible by road (190 kilometers from Terrace, 300 kilometers from Prince Rupert) and has a barge landing, dock, and infrastructure capable of housing at least 300 people, including high-tension power.
Additional infrastructure in the area includes the Dolly Varden Silver Mine Road (only 7 kilometers to the East of the Surebet discovery) with direct road access to Alice Arm barge landing (18 kilometers to the south of the Surebet discovery) and high-tension power (25 kilometers to the east of Surebet discovery). The city of Terrace (population 16,000) provides access to railway, major highways, and airport with supplies (food, fuel, lumber, etc.), while the town of Prince Rupert (population 12,000) is located on the West Coast of British Columbia and houses an international container seaport also with direct access to railway and an airport.
About CASERM (Center to Advance the Science of Exploration to Reclamation in Mining) Goliath Resources is a paying member and active supporter of the Center to Advance the Science of Exploration to Reclamation in Mining (CASERM), which is one of the world’s largest research centers in the mining sector. CASERM is a collaborative research venture between Colorado School of Mines and Virginia Tech that is supported by a consortium of mining and exploration companies, analytical instrumentation and software companies, and federal agencies aiming to transform the way geoscience data is acquired and used across the mining value chain. The center forms part of the I-UCRC program of the National Science Foundation. Research focuses on the integration of diverse geoscience data to improve decision making across the mine life cycle, beginning with the exploration for subsurface resources continuing through mine operation as well as closure and environmental remediation. Over the past three years, Goliath Resources’ membership in CASERM has allowed a high level of research to be performed on the Surebet Discovery.
Qualified Person
Rein Turna P. Geo is the qualified person as defined by National Instrument 43-101, for Goliath Resource Limited projects, and supervised the preparation of, and has reviewed and approved, the technical information in this release. Mr. Turna is an Independent Director of the Company.
About Goliath Resources Limited
Goliath Resources is an explorer of precious metals projects in the highly prospective Golden Triangle of Northwestern British Columbia. All of its projects are in high quality geological settings and geopolitical safe jurisdictions amenable to mining in Canada. Goliath is a member and active supporter of CASERM which is an organization that represents a collaborative venture between Colorado School of Mines and Virginia Tech. Goliath completed its largest fully funded drill campaign to date for a total of 64,364 meters in 2025. Assays are pending for gold only on 70 holes and 110 holes pending for gold equivalent assays. It is fully funded for a similar sized drill program in 2026. The Company’s key strategic cornerstone shareholders include Crescat Capital, a Global Commodity Group (Singapore), McEwen Inc. (NYSE: MUX) (TSX: MUX), Waratah Capital Advisors, Rob McEwen, Eric Sprott and Larry Childress.
For more information please contact: Goliath Resources Limited Mr. Roger Rosmus Founder and CEO Tel: +1-416-488-2887roger@goliathresources.com www.goliathresourcesltd.com
Neither the TSX Venture Exchange nor its Regulation Services Provider (as that term is defined in the policies of the TSX Venture Exchange), nor the OTCQB Venture Market accepts responsibility for the adequacy or accuracy of this release.
Certain statements contained in this press release constitute forward-looking information. These statements relate to future events or future performance. The use of any of the words "could", "intend", "expect", "believe", "will", "projected", "estimated" and similar expressions and statements relating to matters that are not historical facts are intended to identify forward-looking information and are based on Goliath’s current belief or assumptions as to the outcome and timing of such future events. Actual future results may differ materially. In particular, this release contains forward-looking information relating to, among other things, the ability of the Company to complete financings and its ability to build value for its shareholders as it develops its mining properties. Various assumptions or factors are typically applied in drawing conclusions or making the forecasts or projections set out in forward-looking information. Those assumptions and factors are based on information currently available to Goliath. Although such statements are based on management's reasonable assumptions, there can be no assurance that the proposed transactions will occur, or that if the proposed transactions do occur, will be completed on the terms described above.
The forward-looking information contained in this release is made as of the date hereof and Goliath is not obligated to update or revise any forward-looking information, whether as a result of new information, future events or otherwise, except as required by applicable securities laws. Because of the risks, uncertainties and assumptions contained herein, investors should not place undue reliance on forward-looking information. The foregoing statements expressly qualify any forward-looking information contained herein.
This announcement does not constitute an offer, invitation, or recommendation to subscribe for or purchase any securities and neither this announcement nor anything contained in it shall form the basis of any contract or commitment. In particular, this announcement does not constitute an offer to sell, or a solicitation of an offer to buy, securities in the United States, or in any other jurisdiction in which such an offer would be illegal.
The securities referred to herein have not been and will not be will not be registered under the United States Securities Act of 1933, as amended (the “U.S. Securities Act”), or any state securities laws and may not be offered or sold within the United States or to or for the account or benefit of a U.S. person (as defined in Regulation S under the U.S. Securities Act) unless registered under the U.S. Securities Act and applicable state securities laws or an exemption from such registration is available.
IAMGOLD Corporation IAG shares hit a fresh 52-week high of $18.07 yesterday, before retracing slightly to close the session at $17.8.
IAG has shot up 220.1% over the past year. The company has also outperformed the Zacks Mining-Gold industry’s 146.5% rise over the same time frame. The rally has been driven primarily by higher gold prices, record production at Cote Gold, improved cost efficiency across its West African operations, debt reduction and growing investor optimism.
Zacks Investment Research
Image Source: Zacks Investment Research
Let’s take a look at the factors that are driving IAG stock.
Production Expansion Drives IAG’s Momentum
IAMGOLD’s production and revenue results reflected a mix of strong growth at Cote Gold and operational challenges at Westwood and Essakane. Total attributable gold production rose 9.8% year over year to 190,000 ounces, driven largely by the Cote Gold ramp-up, which delivered 75,000 attributable ounces (106,000 ounces on a 100% basis), up roughly 83% from 41,000 ounces in the third quarter of 2024 as the mine progressed toward design capacity.
By contrast, Westwood’s production declined 28% to 23,000 ounces due to lower grades and transitional mining, while Essakane’s attributable output fell 8% to 92,000 ounces amid grade variability. Despite the uneven asset-level performance, revenues surged 61% year over year to $706.7 million from $438.9 million, supported by higher realized gold prices averaging $3,492 per ounce and increased sales volumes, with the ramp-up at Cote Gold making a significant contribution to the top-line growth.
In 2025, IAMGOLD advanced key projects and strategic initiatives to bolster growth. Cote Gold reached sustained nameplate capacity, improving production and costs with incremental investments like added crushing capacity. The company expanded its Quebec pipeline by acquiring Northern Superior Resources and Mines d’Or Orbec, consolidating multiple deposits into the Nelligan Mining Complex. Ongoing drilling at Nelligan and Monster Lake continues to enhance resource potential, while debt repayment strengthens the balance sheet and financial flexibility as IAMGOLD moves into a higher-production phase.
IAG’s Zacks Rank & Key Picks
IAG currently carries a Zacks Rank #3 (Hold).
Some better-ranked stocks in the Basic Materials space are Royal Gold Inc. RGLD, DPM Metals Inc. DPMLF and Harmony Gold Mining Company Limited HMY.
At present, RGLD and DPMLF sport a Zacks Rank #1 (Strong Buy), while HMY carries a Zacks Rank #2 (Buy). You can see the complete list of today’s Zacks #1 Rank stocks here.
The Zacks Consensus Estimate for RGLD’s current fiscal-year earnings is pinned at $8.04 per share, indicating a 53% year-over-year increase. Its earnings beat the Zacks Consensus Estimate in three of the trailing four quarters while missing once, with the average surprise being 4%. Its shares have popped around 82.9% over the past year.
The Zacks Consensus Estimate for DPMLF’s current-year earnings stands at $2.27 per share, indicating a 76% year-over-year increase. Its earnings beat the Zacks Consensus Estimate in each of the trailing four quarters, with the average earnings surprise being 13%. DPMLF’s shares have rallied roughly 124.1 over the past year.
The Zacks Consensus Estimate for HMY’s current-year earnings is pegged at $2.68 per share, indicating a year-over-year rise of 111%. HMY’s shares have gained 136.2% over the past year.
Want the latest recommendations from Zacks Investment Research? Today, you can download 7 Best Stocks for the Next 30 Days. Click to get this free report
Harmony Gold Mining Company Limited (HMY) : Free Stock Analysis Report
Iamgold Corporation (IAG) : Free Stock Analysis Report
Royal Gold, Inc. (RGLD) : Free Stock Analysis Report
DPM Metals Inc. (DPMLF) : Free Stock Analysis Report
This article originally published on Zacks Investment Research (zacks.com).
Gold capped an exceptional 2025 with one of its strongest annual performances in decades. According to the World Gold Council, throughout the calendar year, gold achieved more than 50 all-time highs and returned over 60%. Persistent geopolitical uncertainty, aggressive central-bank purchases and growing expectations of interest-rate cuts fueled steady inflows into the safe-haven asset, making gold a clear outperformer across global markets.
That momentum carried into 2026, culminating in gold hitting a record high on Jan. 12. The rally was underpinned primarily by rising geopolitical risks that kept investors on edge. Renewed tensions in the Middle East, alongside concerns around Iran and broader global flashpoints, increased demand for assets perceived as stores of value during periods of instability. In such environments, gold traditionally benefits as investors seek protection from sudden market shocks.
Gold also surged in the session as the Justice Department’s threat against the Fed revived fears over the central bank’s independence, undermining confidence in U.S. institutions. The episode raised policy uncertainty, weakened the dollar outlook and drove investors toward gold as a safe-haven asset. Bullion climbed close to $4,600 an ounce and silver neared a record after Fed Chair Jerome Powell said the indictment threat reflected broader pressure on the central bank. In such an environment, stocks like Harmony Gold Mining Company Limited HMY, Agnico Eagle Mines Limited AEM, Royal Gold, Inc. RGLD and Kinross Gold Corporation KGC emerge as viable safe-haven options.
Economic signals from the United States have been playing a crucial role. Softer-than-expected labor market data and signs of slowing growth strengthened expectations that the Fed could begin cutting interest rates later in 2026. Lower interest rates slash the opportunity cost of holding non-yielding assets like gold, making bullion more attractive relative to bonds and other interest-bearing instruments. These expectations were quickly reflected in higher gold prices.
Central-bank demand continued to provide a strong structural support. After heavy purchases throughout 2025, several central banks maintained their gold buying into early 2026 as part of efforts to diversify reserves away from the U.S. dollar and hedge against currency and geopolitical risks. This sustained official-sector demand tightened supply and reinforced bullish sentiment in the market.
Unlike stocks or bonds, gold does not generate income, and it pays no interest or dividends. Therefore, when interest rates are high, investors can earn better returns by holding fixed-income assets, making gold less appealing. Conversely, when rates fall, the opportunity cost of holding gold declines. With bond yields and savings returns offering less reward, investors are more willing to allocate money into non-yielding assets like gold, driving up demand and prices.
Our Choices
The stocks below flaunt a Zacks Rank #1 (Strong Buy) or #2 (Buy). You can see the complete list of today’s Zacks #1 Rank stocks here.
Harmony Gold is a South Africa-based gold mining and exploration company that engages in the exploration, extraction and processing of gold and other minerals. HMY’s expected earnings growth rate for the current year is 111%. The Zacks Consensus Estimate for its current-year earnings has improved 0.8% over the past 60 days. HMY has a Zacks Rank #2.
Agnico Eagle Mines is a global gold mining company engaged in the exploration, development and production of gold. AEM’s expected earnings growth rate for the current year is 86.1%. The Zacks Consensus Estimate for its current-year earnings has improved 2.1% over the past 60 days. AEM has a Zacks Rank #1.
Royal Gold is a Denver-based precious metals royalty and streaming company. RGLD’s expected earnings growth rate for the current year is 52.9%. The Zacks Consensus Estimate for its current-year earnings has improved 1% over the past 60 days. RGLD has a Zacks Rank #1.
Kinross Gold is a gold mining company focused on the exploration, development and production of gold from mines across the Americas and West Africa. KGC’s expected earnings growth rate for the current year is 147.1%. The Zacks Consensus Estimate for its current-year earnings has improved 7.7% over the past 60 days. KGC has a Zacks Rank #1.
Bottom Line
Gold remains an attractive investment today because ongoing inflation and economic uncertainty elevate its safe-haven appeal. Central banks and investors are diversifying away from risky assets. Also, recent political turmoil, including the U.S. DOJ threat to the Fed chair amid pressure over monetary policy, has boosted gold’s demand as a hedge against market and policy risks.
Want the latest recommendations from Zacks Investment Research? Today, you can download 7 Best Stocks for the Next 30 Days. Click to get this free report
Kinross Gold Corporation (KGC) : Free Stock Analysis Report
Agnico Eagle Mines Limited (AEM) : Free Stock Analysis Report
Harmony Gold Mining Company Limited (HMY) : Free Stock Analysis Report
Royal Gold, Inc. (RGLD) : Free Stock Analysis Report
This article originally published on Zacks Investment Research (zacks.com).
Investors might want to bet on Harmony Gold (HMY), as it has been recently upgraded to a Zacks Rank #2 (Buy). This upgrade is essentially a reflection of an upward trend in earnings estimates — one of the most powerful forces impacting stock prices.
The sole determinant of the Zacks rating is a company's changing earnings picture. The Zacks Consensus Estimate — the consensus of EPS estimates from the sell-side analysts covering the stock — for the current and following years is tracked by the system.
The power of a changing earnings picture in determining near-term stock price movements makes the Zacks rating system highly useful for individual investors, since it can be difficult to make decisions based on rating upgrades by Wall Street analysts. These are mostly driven by subjective factors that are hard to see and measure in real time.
Therefore, the Zacks rating upgrade for Harmony Gold basically reflects positivity about its earnings outlook that could translate into buying pressure and an increase in its stock price.
Most Powerful Force Impacting Stock Prices
The change in a company's future earnings potential, as reflected in earnings estimate revisions, and the near-term price movement of its stock are proven to be strongly correlated. That's partly because of the influence of institutional investors that use earnings and earnings estimates for calculating the fair value of a company's shares. An increase or decrease in earnings estimates in their valuation models simply results in higher or lower fair value for a stock, and institutional investors typically buy or sell it. Their transaction of large amounts of shares then leads to price movement for the stock.
For Harmony Gold, rising earnings estimates and the consequent rating upgrade fundamentally mean an improvement in the company's underlying business. And investors' appreciation of this improving business trend should push the stock higher.
Harnessing the Power of Earnings Estimate Revisions
Empirical research shows a strong correlation between trends in earnings estimate revisions and near-term stock movements, so it could be truly rewarding if such revisions are tracked for making an investment decision. Here is where the tried-and-tested Zacks Rank stock-rating system plays an important role, as it effectively harnesses the power of earnings estimate revisions.
The Zacks Rank stock-rating system, which uses four factors related to earnings estimates to classify stocks into five groups, ranging from Zacks Rank #1 (Strong Buy) to Zacks Rank #5 (Strong Sell), has an impressive externally-audited track record, with Zacks Rank #1 stocks generating an average annual return of +25% since 1988. You can see the complete list of today's Zacks #1 Rank (Strong Buy) stocks here >>>> .
Earnings Estimate Revisions for Harmony Gold
This gold miner is expected to earn $2.68 per share for the fiscal year ending June 2026, which represents no year-over-year change.
Analysts have been steadily raising their estimates for Harmony Gold. Over the past three months, the Zacks Consensus Estimate for the company has increased 13.6%.
Bottom Line
Unlike the overly optimistic Wall Street analysts whose rating systems tend to be weighted toward favorable recommendations, the Zacks rating system maintains an equal proportion of "buy" and "sell" ratings for its entire universe of more than 4,000 stocks at any point in time. Irrespective of market conditions, only the top 5% of the Zacks-covered stocks get a "Strong Buy" rating and the next 15% get a "Buy" rating. So, the placement of a stock in the top 20% of the Zacks-covered stocks indicates its superior earnings estimate revision feature, making it a solid candidate for producing market-beating returns in the near term.
You can learn more about the Zacks Rank here >>>
The upgrade of Harmony Gold to a Zacks Rank #2 positions it in the top 20% of the Zacks-covered stocks in terms of estimate revisions, implying that the stock might move higher in the near term.
Want the latest recommendations from Zacks Investment Research? Today, you can download 7 Best Stocks for the Next 30 Days. Click to get this free report
Harmony Gold Mining Company Limited (HMY) : Free Stock Analysis Report
This article originally published on Zacks Investment Research (zacks.com).
Reports longtime strategic and cornerstone shareholders, inclusive of Crescat Capital, have exercised the balance of their remaining warrants. The Company has received proceeds totaling $1,730,882 in the past few weeks from warrant exercises. Goliath Resources Limited shares V.GOT are trading up $0.12 at $2.54.
Read:
-
Blueprint for Profit: 5 Gold Stocks Engineering Their Own Upside
-
Medical Breakthroughs: 5 AI Innovators Redefining What's Possible
-
The Gold Bull Market: Record Margins for Majors Create Ideal Conditions for Discovery Plays
-
Pivotal Cancer Trials Gain Momentum as Regulatory Clarity Emerges
TORONTO, Dec. 22, 2025 (GLOBE NEWSWIRE) — Goliath Resources Limited (TSX-V: GOT) (OTCQB: GOTRF) (FSE: B4IF) (the “Company” or “Goliath”) is pleased to report longtime strategic and cornerstone shareholders, inclusive of Crescat Capital, have exercised the balance of their remaining warrants. The Company has received proceeds totaling $1,730,882 in the past few weeks from warrant exercises.
The only warrants that remain outstanding for Goliath are 2,590,673 priced at $2.50 expiring March 10, 2026 all held by one cornerstone strategic investor (see news December 18, 2026), not including 841,777 finder warrants all expiring in 2027 with an average strike price of $2.59.
Kevin C. Smith, CFA, Founder and CEO of Crescat Capital, states: “Go, Roger and team. What an awesome and expansive gold layer cake you have uncovered! We are so happy to have been cornerstone investors since 2020. This new discovery has only continued to get bigger and better with more drilling, and it’s still open. Now, there’s a solid new hypothesis for even more growth, a potential gold-bearing magmatic causative intrusive source nearby. We have built a strong faith in Goliath’s management and geologic team; we are very excited to see a lot more to come.”
Roger Rosmus, Founder and CEO of Goliath, states: “Crescat Capital was one of the first strategic cornerstone investors in Goliath and we greatly appreciate their ongoing support. As well, the continued support of all our strategic investors which I believe is a true testament to the high quality of Surebet, our high-grade gold discovery in the Golden Triangle, B.C.”
About Crescat Capital
Crescat is a multi-disciplinary hedge fund firm headquartered in Denver, Colorado. Its mission is to grow and protect wealth over complete business cycles by deploying tactical and strategic investment themes. The firm’s investment process combines proprietary value-driven equity and macro models with veteran industry advisors. Crescat has been building activist stakes in a portfolio of precious and critical metals mining companies, one of its strongest conviction long-term investment themes. Crescat’s funds include Precious Metals, Institutional Commodity, Long/Short, Global Macro, and Institutional Macro.
About Golddigger Property
The Golddigger Property is 100% controlled and covers an area of 91,518 hectares in a highly prospective geological setting of the Eskay Rift, within 3 kilometers of the Red Line in the Golden Triangle of British Columbia. This area, in close proximity to the Red Line, has hosted some of Canada’s greatest gold mines including Eskay Creek, Premier and Snip. Other significant and well-known deposits in the Golden Triangle include Brucejack, Copper Canyon, Galore Creek, Granduc, KSM, Red Chris, and Schaft Creek. Goliath controls 56 kilometers of the Red Line which is a geologic contact between Triassic age Stuhini rocks and Jurassic age Hazelton rocks used as key markers when exploring for gold-copper-silver mineralization.
The Surebet discovery has predictable continuity and good metallurgy with gold recoveries from gravity and flotation at a 327-micrometer crush of 92.2% including 48.8% free gold from gravity alone (no cyanide required to recover the gold). The metallurgy completed to date shows no deleterious elements are present (see news release dated March 1, 2023).
The Property is in a well positioned location in close proximity to the communities of Alice Arm and Kitsault where there is a permitted mill site on private property. It is situated on tide water with direct barge access to Prince Rupert (190 kilometers via the Observatory inlet/Portland inlet). The town of Kitsault is accessible by road (190 kilometers from Terrace, 300 kilometers from Prince Rupert) and has a barge landing, dock, and infrastructure capable of housing at least 300 people, including high-tension power.
Additional infrastructure in the area includes the Dolly Varden Silver Mine Road (only 7 kilometers to the East of the Surebet discovery) with direct road access to Alice Arm barge landing (18 kilometers to the south of the Surebet discovery) and high-tension power (25 kilometers to the east of Surebet discovery). The city of Terrace (population 16,000) provides access to railway, major highways, and airport with supplies (food, fuel, lumber, etc.), while the town of Prince Rupert (population 12,000) is located on the West Coast of British Columbia and houses an international container seaport also with direct access to railway and an airport.
About CASERM (Center to Advance the Science of Exploration to Reclamation in Mining) Goliath Resources is a paying member and active supporter of the Center to Advance the Science of Exploration to Reclamation in Mining (CASERM), which is one of the world’s largest research centers in the mining sector. CASERM is a collaborative research venture between Colorado School of Mines and Virginia Tech that is supported by a consortium of mining and exploration companies, analytical instrumentation and software companies, and federal agencies aiming to transform the way geoscience data is acquired and used across the mining value chain. The center forms part of the I-UCRC program of the National Science Foundation. Research focuses on the integration of diverse geoscience data to improve decision making across the mine life cycle, beginning with the exploration for subsurface resources continuing through mine operation as well as closure and environmental remediation. Over the past three years, Goliath Resources’ membership in CASERM has allowed a high level of research to be performed on the Surebet Discovery.
Qualified Person
Rein Turna P. Geo is the qualified person as defined by National Instrument 43-101, for Goliath Resource Limited projects, and supervised the preparation of, and has reviewed and approved, the technical information in this release. Mr. Turna is an Independent Director of the Company.
About Goliath Resources Limited
Goliath Resources is an explorer of precious metals projects in the highly prospective Golden Triangle of Northwestern British Columbia. All of its projects are in high quality geological settings and geopolitical safe jurisdictions amenable to mining in Canada. Goliath is a member and active supporter of CASERM which is an organization that represents a collaborative venture between Colorado School of Mines and Virginia Tech. Goliath recently completed its largest fully funded drill campaign to date for a total of 64,364 meters in 2025 and has 70 holes with assays pending. It is fully funded for another large (40k – 50k meter) drill program in 2026. The Company’s key strategic cornerstone shareholders include Crescat Capital, a Global Commodity Group (Singapore), McEwen Inc. (NYSE: MUX) (TSX: MUX), Waratah Capital Advisors, Rob McEwen, Eric Sprott and Larry Childress.For more information please contact:
Goliath Resources Limited Mr. Roger Rosmus Founder and CEO Tel: +1.416.488.2887roger@goliathresources.com www.goliathresourcesltd.com
QA/QC Protocol & Disclaimer
Oriented HQ-diameter or NQ-diameter diamond drill core from the drill campaign is placed in core boxes by the drill crew contracted by the Company. Core boxes are transported by helicopter to the staging area and then transported by truck to the core shack. The core is then re-orientated, meterage blocks are checked, meter marks are labelled, Recovery and RQD measurements taken, and primary bedding and secondary structural features including veins, dykes, cleavage, and shears are noted and measured. The core is then described and transcribed in MX DepositTM. Drill holes were planned using Leapfrog GeoTM and QGISTM software and data from the 2017-2024 exploration campaigns. Drill core containing quartz breccia, stockwork, veining and/or sulphide(s), or notable alteration is sampled in lengths of 0.5 to 1.5 meters. Core samples are cut lengthwise in half: one-half remains in the box and the other half is inserted in a clean plastic bag with a sample tag. The bagged samples are then weighed and secured with a zip tie. Certified reference materials (CRMs), blanks and duplicates are added in the sample stream at a rate of 10%. To ensure analytical anonymity, CRM identification labels are removed prior to submission to the laboratory. Additional out-of-sequence blanks are introduced immediately following core samples that contain VG-NE or high-grade sulphide mineralization.
Grab, channels, chip and talus samples were collected by foot with helicopter assistance. Prospective areas included, but were not limited to, proximity to MINFile locations, placer creek occurrences, regional soil anomalies, and potential gossans based on high-resolution satellite imagery. The rock grab and chip samples were extracted using a rock hammer, or hammer and chisel to expose fresh surfaces and to liberate a sample of anywhere between 0.5 to 5.0 kilograms. All sample sites were flagged with biodegradable flagging tape and marked with the sample number. All sample sites were recorded using hand-held GPS units (accuracy 3-10 meters) and sample ID, easting, northing, elevation, type of sample (outcrop, subcrop, float, talus, chip, grab, etc.) and a description of the rock were recorded on all-weather paper. Samples are then inserted in a clean plastic bag with a sample tag for transport and shipping to the geochemistry lab. QA/QC samples including blanks, certified reference materials, and duplicate samples are inserted regularly into the sample sequence at a rate of 10%.All samples are transported in rice bags sealed with numbered security tags. The rice bags are transported from the core shacks to the MSALABS facilities in Terrace, BC. MSALABS is certified with both AC89-IAS and ISO/IEC Standard 17025:2017. The core samples undergo preparation via drying, crushing to ~70% of the material passing a 2 mm sieve and riffle splitting. The sample splits are weighed and transferred into three plastic jars, each containing between 300 g and 500 g of crushed sample material. A 250 g split is pulverized to ensure at least 85% of the material passes through a 75 µm sieve. The crushed samples are transported to the MSALABS PhotonAssayTM facility in Prince George, where gold concentrations are quantified via photon assay analysis (method CPA-Au1). Samples that result in gold concentrations ≥5 ppm are analyzed to extinction. Photon assay uses high-energy X-rays (photons) to excite atomic nuclei within the jarred samples, inducing the emission of secondary gamma rays, which are measured to quantify gold concentrations. The assays from all jars are combined on a weight-averaged basis. Multielement analyses are carried at the MSALABS facilities in Surrey, BC, where 250 g of pulverized splits are analyzed via ICF6xx and IMS-230 methods. The IMS-230 method uses 4-acid digestion (a combination of hydrochloric, nitric, perchloric and hydrofluoric acids) followed by inductively coupled plasma emission spectrometry to quantify concentrations of 48 elements. Samples with over-limit results for Ag, Cu, Pb and Zn undergo ore-grade analysis via the ICF-6xx method (where ‘xx’ denotes the target metal). This method employs 4-acid digestion followed by inductively coupled plasma emission spectrometry.
Widths are reported in drill core lengths and the true widths are estimated to be 80-90% and Gold Equivalent (AuEq) metal values are calculated using: Au 2797.16 USD/oz, Ag 31.28 USD/oz, Cu 4.25 USD/lbs, Pb 1955.58 USD/ton and Zn 2750.50 USD/ton on January 31st, 2025. There is potential for economic recovery of gold, silver, copper, lead, and zinc from these occurrences based on other mining and exploration projects in the same Golden Triangle Mining Camp where Goliath’s project is located such as the Homestake Ridge Gold Project (Auryn Resources Technical Report, Updated Mineral Resource Estimate and Preliminary Economic Assessment on the Homestake Ridge Gold Project, prepared by Minefill Services Inc. Bothell, Washington, dated May 29, 2020). Here, AuEq values were calculated using 3-year running averages for metal price, and included provisions for metallurgical recoveries, treatment charges, refining costs, and transportation. Recoveries for Gold were 85.5%, Silver at 74.6%, Copper at 74.6% and Lead at 45.3%. It will be assumed that Zinc can be recovered with the Copper at the same recovery rate of 74.6%. The quoted reference of metallurgical recoveries is not from Goliath’s Golddigger Project, Surebet Zone mineralization, and there is no guarantee that such recoveries will ever be achieved, unless detailed metallurgical work such as in a Feasibility Study can be eventually completed on the Golddigger Project.
The reader is cautioned that grab samples are spot samples which are typically, but not exclusively, constrained to mineralization. Grab samples are selective in nature and collected to determine the presence or absence of mineralization and are not intended to be representative of the material sampled.Neither the TSX Venture Exchange nor its Regulation Services Provider (as that term is defined in the policies of the TSX Venture Exchange), nor the OTCQB Venture Market accepts responsibility for the adequacy or accuracy of this release.
Certain statements contained in this press release constitute forward-looking information. These statements relate to future events or future performance. The use of any of the words "could", "intend", "expect", "believe", "will", "projected", "estimated" and similar expressions and statements relating to matters that are not historical facts are intended to identify forward-looking information and are based on Goliath’s current belief or assumptions as to the outcome and timing of such future events. Actual future results may differ materially. In particular, this release contains forward-looking information relating to, among other things, the ability of the Company to complete financings and its ability to build value for its shareholders as it develops its mining properties. Various assumptions or factors are typically applied in drawing conclusions or making the forecasts or projections set out in forward-looking information. Those assumptions and factors are based on information currently available to Goliath. Although such statements are based on management's reasonable assumptions, there can be no assurance that the proposed transactions will occur, or that if the proposed transactions do occur, will be completed on the terms described above.
The forward-looking information contained in this release is made as of the date hereof and Goliath is not obligated to update or revise any forward-looking information, whether as a result of new information, future events or otherwise, except as required by applicable securities laws. Because of the risks, uncertainties and assumptions contained herein, investors should not place undue reliance on forward-looking information. The foregoing statements expressly qualify any forward-looking information contained herein.
This announcement does not constitute an offer, invitation, or recommendation to subscribe for or purchase any securities and neither this announcement nor anything contained in it shall form the basis of any contract or commitment. In particular, this announcement does not constitute an offer to sell, or a solicitation of an offer to buy, securities in the United States, or in any other jurisdiction in which such an offer would be illegal. The securities referred to herein have not been and will not be will not be registered under the United States Securities Act of 1933, as amended (the “U.S. Securities Act”), or any state securities laws and may not be offered or sold within the United States or to or for the account or benefit of a U.S. person (as defined in Regulation S under the U.S. Securities Act) unless registered under the U.S. Securities Act and applicable state securities laws or an exemption from such registration is available.
A large number of precious metals names are on the IBD 50 list of growth stocks as gold, silver, and copper prices hit record highs in 2025.
TORONTO, Dec. 18, 2025 (GLOBE NEWSWIRE) — Goliath Resources Limited (TSX-V: GOT) (OTCQB: GOTRF) (FSE: B4IF) (the “Company” or “Goliath”) is pleased to report Rob McEwen a cornerstone strategic investor has increased his direct ownership by exercising all of his warrants for total proceeds of $1,214,285. This exercise takes Rob’s direct ownership to 4,445,142 common shares of the Company representing 2.6% of the total issued and outstanding shares.
McEwen Inc. (TSX: MUX, NYSE: MUX) an additional cornerstone strategic investor holds 5,181,347 common shares in Goliath plus 2,590,673 warrants. These warrants have a strike price of $2.50 expiring March 10, 2026 representing $6,476,683 and if exercised, McEwen Inc. would own directly 7,772,020 of the Company or ~4.5%.
Roger Rosmus, Founder and CEO of Goliath, states: “We want to thank the continued support of all our cornerstone strategic and long term investors, specifically Rob McEwen for the exercise of his warrants. The funds received of $1,214,285 will further enhance and strengthen Goliath’s already healthy financial position.”
About Golddigger Property
The Golddigger Property is 100% controlled and covers an area of 91,518 hectares in a highly prospective geological setting of the Eskay Rift, within 3 kilometers of the Red Line in the Golden Triangle of British Columbia. This area, in close proximity to the Red Line, has hosted some of Canada’s greatest gold mines including Eskay Creek, Premier and Snip. Other significant and well-known deposits in the Golden Triangle include Brucejack, Copper Canyon, Galore Creek, Granduc, KSM, Red Chris, and Schaft Creek. Goliath controls 56 kilometers of the Red Line which is a geologic contact between Triassic age Stuhini rocks and Jurassic age Hazelton rocks used as key markers when exploring for gold-copper-silver mineralization.
The Surebet discovery has predictable continuity and good metallurgy with gold recoveries from gravity and flotation at a 327-micrometer crush of 92.2% including 48.8% free gold from gravity alone (no cyanide required to recover the gold). The metallurgy completed to date shows no deleterious elements are present (see news release dated March 1, 2023).
The Property is in a well positioned location in close proximity to the communities of Alice Arm and Kitsault where there is a permitted mill site on private property. It is situated on tide water with direct barge access to Prince Rupert (190 kilometers via the Observatory inlet/Portland inlet). The town of Kitsault is accessible by road (190 kilometers from Terrace, 300 kilometers from Prince Rupert) and has a barge landing, dock, and infrastructure capable of housing at least 300 people, including high-tension power.
Additional infrastructure in the area includes the Dolly Varden Silver Mine Road (only 7 kilometers to the East of the Surebet discovery) with direct road access to Alice Arm barge landing (18 kilometers to the south of the Surebet discovery) and high-tension power (25 kilometers to the east of Surebet discovery). The city of Terrace (population 16,000) provides access to railway, major highways, and airport with supplies (food, fuel, lumber, etc.), while the town of Prince Rupert (population 12,000) is located on the West Coast of British Columbia and houses an international container seaport also with direct access to railway and an airport.
About CASERM (Center to Advance the Science of Exploration to Reclamation in Mining) Goliath Resources is a paying member and active supporter of the Center to Advance the Science of Exploration to Reclamation in Mining (CASERM), which is one of the world’s largest research centers in the mining sector. CASERM is a collaborative research venture between Colorado School of Mines and Virginia Tech that is supported by a consortium of mining and exploration companies, analytical instrumentation and software companies, and federal agencies aiming to transform the way geoscience data is acquired and used across the mining value chain. The center forms part of the I-UCRC program of the National Science Foundation. Research focuses on the integration of diverse geoscience data to improve decision making across the mine life cycle, beginning with the exploration for subsurface resources continuing through mine operation as well as closure and environmental remediation. Over the past three years, Goliath Resources’ membership in CASERM has allowed a high level of research to be performed on the Surebet Discovery.
Qualified Person
Rein Turna P. Geo is the qualified person as defined by National Instrument 43-101, for Goliath Resource Limited projects, and supervised the preparation of, and has reviewed and approved, the technical information in this release. Mr. Turna is an Independent Director of the Company.
About Goliath Resources Limited
Goliath Resources is an explorer of precious metals projects in the highly prospective Golden Triangle of Northwestern British Columbia. All of its projects are in high quality geological settings and geopolitical safe jurisdictions amenable to mining in Canada. Goliath is a member and active supporter of CASERM which is an organization that represents a collaborative venture between Colorado School of Mines and Virginia Tech. Goliath recently completed its largest fully funded drill campaign to date for a total of 64,364 meters in 2025 and has 70 holes with assays pending. It is fully funded for another large (40k – 50k meter) drill program in 2026. The Company’s key strategic cornerstone shareholders include Crescat Capital, a Global Commodity Group (Singapore), McEwen Inc. (NYSE: MUX) (TSX: MUX), Waratah Capital Advisors, Rob McEwen, Eric Sprott and Larry Childress.
For more information please contact:
Goliath Resources Limited Mr. Roger Rosmus Founder and CEO Tel: +1.416.488.2887roger@goliathresources.com www.goliathresourcesltd.com
QA/QC Protocol & Disclaimer
Oriented HQ-diameter or NQ-diameter diamond drill core from the drill campaign is placed in core boxes by the drill crew contracted by the Company. Core boxes are transported by helicopter to the staging area and then transported by truck to the core shack. The core is then re-orientated, meterage blocks are checked, meter marks are labelled, Recovery and RQD measurements taken, and primary bedding and secondary structural features including veins, dykes, cleavage, and shears are noted and measured. The core is then described and transcribed in MX DepositTM. Drill holes were planned using Leapfrog GeoTM and QGISTM software and data from the 2017-2024 exploration campaigns. Drill core containing quartz breccia, stockwork, veining and/or sulphide(s), or notable alteration is sampled in lengths of 0.5 to 1.5 meters. Core samples are cut lengthwise in half: one-half remains in the box and the other half is inserted in a clean plastic bag with a sample tag. The bagged samples are then weighed and secured with a zip tie. Certified reference materials (CRMs), blanks and duplicates are added in the sample stream at a rate of 10%. To ensure analytical anonymity, CRM identification labels are removed prior to submission to the laboratory. Additional out-of-sequence blanks are introduced immediately following core samples that contain VG-NE or high-grade sulphide mineralization.
Grab, channels, chip and talus samples were collected by foot with helicopter assistance. Prospective areas included, but were not limited to, proximity to MINFile locations, placer creek occurrences, regional soil anomalies, and potential gossans based on high-resolution satellite imagery. The rock grab and chip samples were extracted using a rock hammer, or hammer and chisel to expose fresh surfaces and to liberate a sample of anywhere between 0.5 to 5.0 kilograms. All sample sites were flagged with biodegradable flagging tape and marked with the sample number. All sample sites were recorded using hand-held GPS units (accuracy 3-10 meters) and sample ID, easting, northing, elevation, type of sample (outcrop, subcrop, float, talus, chip, grab, etc.) and a description of the rock were recorded on all-weather paper. Samples are then inserted in a clean plastic bag with a sample tag for transport and shipping to the geochemistry lab. QA/QC samples including blanks, certified reference materials, and duplicate samples are inserted regularly into the sample sequence at a rate of 10%.All samples are transported in rice bags sealed with numbered security tags. The rice bags are transported from the core shacks to the MSALABS facilities in Terrace, BC. MSALABS is certified with both AC89-IAS and ISO/IEC Standard 17025:2017. The core samples undergo preparation via drying, crushing to ~70% of the material passing a 2 mm sieve and riffle splitting. The sample splits are weighed and transferred into three plastic jars, each containing between 300 g and 500 g of crushed sample material. A 250 g split is pulverized to ensure at least 85% of the material passes through a 75 µm sieve. The crushed samples are transported to the MSALABS PhotonAssayTM facility in Prince George, where gold concentrations are quantified via photon assay analysis (method CPA-Au1). Samples that result in gold concentrations ≥5 ppm are analyzed to extinction. Photon assay uses high-energy X-rays (photons) to excite atomic nuclei within the jarred samples, inducing the emission of secondary gamma rays, which are measured to quantify gold concentrations. The assays from all jars are combined on a weight-averaged basis. Multielement analyses are carried at the MSALABS facilities in Surrey, BC, where 250 g of pulverized splits are analyzed via ICF6xx and IMS-230 methods. The IMS-230 method uses 4-acid digestion (a combination of hydrochloric, nitric, perchloric and hydrofluoric acids) followed by inductively coupled plasma emission spectrometry to quantify concentrations of 48 elements. Samples with over-limit results for Ag, Cu, Pb and Zn undergo ore-grade analysis via the ICF-6xx method (where ‘xx’ denotes the target metal). This method employs 4-acid digestion followed by inductively coupled plasma emission spectrometry.
Widths are reported in drill core lengths and the true widths are estimated to be 80-90% and Gold Equivalent (AuEq) metal values are calculated using: Au 2797.16 USD/oz, Ag 31.28 USD/oz, Cu 4.25 USD/lbs, Pb 1955.58 USD/ton and Zn 2750.50 USD/ton on January 31st, 2025. There is potential for economic recovery of gold, silver, copper, lead, and zinc from these occurrences based on other mining and exploration projects in the same Golden Triangle Mining Camp where Goliath’s project is located such as the Homestake Ridge Gold Project (Auryn Resources Technical Report, Updated Mineral Resource Estimate and Preliminary Economic Assessment on the Homestake Ridge Gold Project, prepared by Minefill Services Inc. Bothell, Washington, dated May 29, 2020). Here, AuEq values were calculated using 3-year running averages for metal price, and included provisions for metallurgical recoveries, treatment charges, refining costs, and transportation. Recoveries for Gold were 85.5%, Silver at 74.6%, Copper at 74.6% and Lead at 45.3%. It will be assumed that Zinc can be recovered with the Copper at the same recovery rate of 74.6%. The quoted reference of metallurgical recoveries is not from Goliath’s Golddigger Project, Surebet Zone mineralization, and there is no guarantee that such recoveries will ever be achieved, unless detailed metallurgical work such as in a Feasibility Study can be eventually completed on the Golddigger Project.
The reader is cautioned that grab samples are spot samples which are typically, but not exclusively, constrained to mineralization. Grab samples are selective in nature and collected to determine the presence or absence of mineralization and are not intended to be representative of the material sampled.Neither the TSX Venture Exchange nor its Regulation Services Provider (as that term is defined in the policies of the TSX Venture Exchange), nor the OTCQB Venture Market accepts responsibility for the adequacy or accuracy of this release.
Certain statements contained in this press release constitute forward-looking information. These statements relate to future events or future performance. The use of any of the words "could", "intend", "expect", "believe", "will", "projected", "estimated" and similar expressions and statements relating to matters that are not historical facts are intended to identify forward-looking information and are based on Goliath’s current belief or assumptions as to the outcome and timing of such future events. Actual future results may differ materially. In particular, this release contains forward-looking information relating to, among other things, the ability of the Company to complete financings and its ability to build value for its shareholders as it develops its mining properties. Various assumptions or factors are typically applied in drawing conclusions or making the forecasts or projections set out in forward-looking information. Those assumptions and factors are based on information currently available to Goliath. Although such statements are based on management's reasonable assumptions, there can be no assurance that the proposed transactions will occur, or that if the proposed transactions do occur, will be completed on the terms described above.The forward-looking information contained in this release is made as of the date hereof and Goliath is not obligated to update or revise any forward-looking information, whether as a result of new information, future events or otherwise, except as required by applicable securities laws. Because of the risks, uncertainties and assumptions contained herein, investors should not place undue reliance on forward-looking information. The foregoing statements expressly qualify any forward-looking information contained herein.
This announcement does not constitute an offer, invitation, or recommendation to subscribe for or purchase any securities and neither this announcement nor anything contained in it shall form the basis of any contract or commitment. In particular, this announcement does not constitute an offer to sell, or a solicitation of an offer to buy, securities in the United States, or in any other jurisdiction in which such an offer would be illegal.The securities referred to herein have not been and will not be will not be registered under the United States Securities Act of 1933, as amended (the “U.S. Securities Act”), or any state securities laws and may not be offered or sold within the United States or to or for the account or benefit of a U.S. person (as defined in Regulation S under the U.S. Securities Act) unless registered under the U.S. Securities Act and applicable state securities laws or an exemption from such registration is available.
TORONTO, Dec. 16, 2025 (GLOBE NEWSWIRE) — Goliath Resources Limited (TSX-V: GOT) (OTCQB: GOTRF) (Frankfurt: B4IF) (the "Company" or "Goliath") is pleased to announce that it has mailed the meeting materials in connection with its annual and special meeting of shareholders of the Company to be held on January 14, 2026 (the “Meeting”). The Meeting materials, including the management information circular dated November 30, 2025 (the “Circular”), are available under the Company’s profile on www.SEDARPLUS.ca and on the Company’s website at https://goliathresourcesltd.com/. At the Meeting, among other things, shareholders will be asked to consider a resolution approving a consolidation (the “Consolidation Proposal”) of the Company’s issued and outstanding common shares (the “Common Shares”) on the basis of one (new) for up to seven (old) Common Shares (up to 1:7). Approval of the Consolidation Proposal will provide the Board of Directors (the “Board”) with the discretion to determine the actual consolidation basis within this range. Please note that if the Consolidation Proposal is approved, no more than one consolidation will take place – there will be no successive consolidations without the further approval of shareholders. Furthermore, approval of the Consolidation Proposal does not mean that a Common Share consolidation will occur, as the Board will have the discretion not to proceed with the Consolidation Proposal if it is deemed to be in the best interests of the Company not to do so.
The potential benefits of the Consolidation include:
(a) attracting greater investor interest – the Consolidation may have the effect of raising, on a proportionate basis, the price of the Company’s Common Shares, which could appeal to certain investors that find shares valued above certain prices to be more attractive from an investment perspective;
(b) increasing institutional investor participation – certain institutional investors have internal guidelines which prevent them from investing in small- or micro-cap stocks, regardless of the strength of the operations and management of the target investee company;
(c) providing greater flexibility in business opportunities – the Company believes that the Consolidation may provide the Company with greater flexibility in considering business opportunities that are affected by the share capital of the Company and pricing of warrants and options;
(d) complying with listing criteria for U.S. stock exchanges that require a certain minimum price per share should the Company pursue a new listing; and
(e) improving the prospects of raising additional capital at a higher price per share – the higher anticipated price of the post-consolidation Common Shares may allow the Company to raise additional capital through the sale of additional Common Shares at a higher price per Common Share than would be possible in the absence of the Consolidation.
Proposed Consolidation Ratios
As of today’s date, the Company has 171,754,056 Common Shares issued and outstanding. Following the completion of the proposed Consolidation, the number of Common Shares of the Company issued and outstanding will depend on the ratio selected by the Board of Directors. The following table sets out the appropriate number of Common Shares that would be outstanding as a result of the Company at the ratios suggested below.
| Selected Proposed Consolidation Ratios | Approximate Number of Outstanding Common Shares(Post Consolidation)(1) (2) |
| 1 (new) for 2 (old) | 85,877,028 |
| 1 (new) for 3 (old) | 57,251,352 |
| 1 (new) for 4 (old) | 42,938,514 |
| 1 (new) for 5 (old) | 34,350,811 |
| 1 (new) for 6 (old) | 28,625,676 |
| 1 (new) for 7 (old) | 24,536,294 |
Notes:
(1) The exact number of Common Shares outstanding after the consolidation will vary based on the elimination of fractional shares, and certain other factors.(2) Based on the number of outstanding Common Shares as at the date hereof, being 171,754,056 Common Shares.
The Board is recommending that shareholders approve the Consolidation Proposal at the Meeting. The Company is not expected to change its name or trading symbol in conjunction with the Consolidation Proposal. All outstanding convertible securities such as stock options, RSUs and warrants will also be affected by the Consolidation Proposal, if approved.
The Board proposes to reduce the number of Common Shares of the Company in order to increase its flexibility with respect to potential business transactions, if determined by the Board of Directors to be necessary and/or desirable. Please see the Circular for more information in regard to the Consolidation Proposal. The Consolidation is subject to the approval of the shareholders of the Company, any required regulatory approvals as well as the approval of the TSX Venture Exchange.
About Goliath Resources Limited
Goliath is an explorer of precious metals projects in the prolific Golden Triangle of northwestern British Columbia. All of its projects are in high quality geological settings and geopolitical safe jurisdictions amenable to mining in Canada. Goliath is a member and active supporter of CASERM which is an organization that represents a collaborative venture between Colorado School of Mines and Virginia Tech. Goliath’s key strategic cornerstone shareholders include Crescat Capital, McEwen Mining Inc. (NYSE: MUX) (TSX: MUX), Mr. Rob McEwen, a Global Commodity Group based in Singapore, Mr. Eric Sprott and Mr. Larry Childress.
For more information please contact:
Goliath Resources Limited
Mr. Roger Rosmus Founder and CEO Tel: +1.416.488.2887 roger@goliathresources.comwww.goliathresourcesltd.com
This press release contains statements that constitute “forward-looking information” (“forward-looking information”) within the meaning of the applicable Canadian securities legislation. All statements, other than statements of historical fact, are forward-looking information and are based on expectations, estimates and projections as at the date of this news release. Any statement that discusses predictions, expectations, beliefs, plans, projections, objectives, assumptions, future events or performance (often but not always using phrases such as “expects”, or “does not expect”, “is expected”, “anticipates” or “does not anticipate”, “plans”, “budget”, “scheduled”, “forecasts”, “estimates”, “believes” or “intends” or variations of such words and phrases or stating that certain actions, events or results “may” or “could”, “would”, “might” or “will” be taken to occur or be achieved) are not statements of historical fact and may be forward-looking information. Forward-looking statements in this news release include statements regarding the Consolidation Proposal (including the completion of the Consolidation Proposal on the terms and timeline as announced or at all and the timing to implement the Consolidation Proposal), and the Company’s ability to obtain all regulatory approvals, including the approval of the Exchange. In disclosing the forward-looking information contained in this press release, the Company has made certain assumptions. Although the Company believes that the expectations reflected in such forward-looking information are reasonable, it can give no assurance that the expectations of any forward-looking information will prove to be correct. Known and unknown risks, uncertainties, and other factors which may cause the actual results and future events to differ materially from those expressed or implied by such forward-looking information. Such factors include but are not limited to: compliance with extensive government regulations; domestic and foreign laws and regulations adversely affecting the Company’s business and results of operations; and general business, economic, competitive, political and social uncertainties. Accordingly, readers should not place undue reliance on the forward-looking information contained in this press release. Except as required by law, the Company disclaims any intention and assumes no obligation to update or revise any forward-looking information to reflect actual results, whether as a result of new information, future events, changes in assumptions, changes in factors affecting such forward-looking information or otherwise.
Neither the TSX Venture Exchange nor its Regulation Services Provider (as that term is defined in the policies of the TSX Venture Exchange) accepts responsibility for the adequacy or accuracy of this release.
Westlake Corporation WLK announced it has approved a plan to cease operations at three of the North American chlorovinyl production facilities and the Styrene manufacturing unit amid challenging conditions in the global commodities chemicals industry. The closure is expected to take place in December 2025.
The affected facilities include the PVC plant in Aberdeen, MS, the VCM plant in Lake Charles, LA, North site and a diaphragm chlor-alkali unit at Lake Charles, LA, South site. Operations will also cease at its Lake Charles styrene plant.
The seven other North American chlorovinyl facilities will continue supplying customers with PVC, VCM and chlor-alkali products. The company will end up with annual production capacity of approximately 520 million pounds of suspension PVC globally, including 4,900 million pounds in North America, 7,630 million pounds of VCM globally, including 6,050 million pounds in North America and 6,680 million pounds of chlorine and 7,510 million pounds of caustic soda globally, including 5,410 million pounds of chlorine and 6,100 million pounds of caustic soda in North America.
The closures will also result in a workforce reduction of about 295 employees. Westlake expects pre-tax costs of approximately $415 million, mainly from non-cash accelerated depreciation, amortization and asset write-offs, along with employee severance and other shutdown costs. Most of these costs are expected to be recognized in the fourth quarter of 2025.
Westlake Corporation Price and Consensus
Westlake Corporation price-consensus-chart | Westlake Corporation Quote
WLK’s Zacks Rank & Key Picks
WLK currently carries a Zacks Rank #4 (Sell).
Some better-ranked stocks in the Basic Materials space are Kinross Gold Corporation KGC, Fortuna Mining Corp. FSM and Harmony Gold Mining Company Limited HMY.
At present, KGC sports a Zacks Rank #1 (Strong Buy), while FSM and HMY carry a Zacks Rank #2 (Buy) each. You can see the complete list of today’s Zacks #1 Rank stocks here.
The Zacks Consensus Estimate for KGC’s current-year earnings is pegged at $1.67 per share, indicating a rise of 145.59%. Its earnings beat the Zacks Consensus Estimate in three of the trailing four quarters while missing once, with an average surprise of 17.37%. KGC shares have gained 196.5% over the past year.
The Zacks Consensus Estimate for FSM’s current fiscal-year earnings is pinned at 76 cents per share, indicating a 65.22% year-over-year increase. Its shares have surged 108.3% over the past year.
The Zacks Consensus Estimate for HMY’s 2026 earnings is pegged at $2.68 per share, indicating a 132.1% year-over-year increase. HMY shares have gained 134.6% over the past year.
Want the latest recommendations from Zacks Investment Research? Today, you can download 7 Best Stocks for the Next 30 Days. Click to get this free report
Westlake Corporation (WLK) : Free Stock Analysis Report
Kinross Gold Corporation (KGC) : Free Stock Analysis Report
Harmony Gold Mining Company Limited (HMY) : Free Stock Analysis Report
Fortuna Mining Corp. (FSM) : Free Stock Analysis Report
This article originally published on Zacks Investment Research (zacks.com).
BASF SE BASFY partnered with San Fang Chemical Industrial Co., and Nichetech Advanced Materials Co. by signing a Memorandum of Understanding (MoU) to collaborate in the development of sustainable, circular solutions for the global footwear industry, with a shared ambition to achieve net-zero carbon emissions by 2050.
The collaboration’s first milestone is the launch of Global Recycled Standard (GRS)-certified TPU films. These high-performance films have verified recycled content that does not compromise the durability, flexibility, and quality of footwear. The certification enables tracking recycled content throughout the supply chain. Building on this launch, the partners plan to enhance the portfolio with more GRS-certified TPU products that comply with international recycling standards, supporting the adoption of innovative solutions worldwide.
The alliance brings forward the individual expertise of each of the partners. BASF contributes with its extensive knowledge in sustainable solutions and applications, San Fang adds expertise in recycled polyester polyols, as well as key raw materials, and Nichetech provides specialization in manufacturing capabilities and strong market knowledge. San Fang and Nichetech, collectively, bring deep expertise in TPU film applications.
All three companies emphasized the goal of accelerating circular solutions, reducing carbon emissions, and enabling brands to incorporate recycled materials on a wide scale. Through joint innovation, integrated resources and strict quality control, BASF, San Fang and Nichetech will promote sustainability in the footwear industry.
BASFY’s shares have gained 17.8% over the past year compared with the industry’s 16.7% decline.
Zacks Investment Research
Image Source: Zacks Investment Research
BASFY’s Zacks Rank & Key Picks
BASFY currently carries a Zacks Rank #3 (Hold).
Some better-ranked stocks in the Basic Materials space are Kinross Gold Corporation KGC, Fortuna Mining Corp. FSM and Harmony Gold Mining Company Limited HMY.
At present, KGC sports a Zacks Rank #1 (Strong Buy), while FSM and HMY carry a Zacks Rank #2 (Buy) each. You can see the complete list of today’s Zacks #1 Rank stocks here.
The Zacks Consensus Estimate for KGC’s current-year earnings is pegged at $1.67 per share, indicating a rise of 145.59%. Its earnings beat the Zacks Consensus Estimate in three of the trailing four quarters while missing once, with an average surprise of 17.37%. KGC shares have gained 196.5% over the past year.
The Zacks Consensus Estimate for FSM’s current fiscal-year earnings is pinned at 76 cents per share, indicating a 65.22% year-over-year increase. Its shares have surged 108.3% over the past year.
The Zacks Consensus Estimate for HMY’s 2026 earnings is pegged at $2.68 per share, indicating a 132.1% year-over-year increase. HMY shares have gained 134.6% over the past year.
Want the latest recommendations from Zacks Investment Research? Today, you can download 7 Best Stocks for the Next 30 Days. Click to get this free report
Kinross Gold Corporation (KGC) : Free Stock Analysis Report
BASF SE (BASFY) : Free Stock Analysis Report
Harmony Gold Mining Company Limited (HMY) : Free Stock Analysis Report
Fortuna Mining Corp. (FSM) : Free Stock Analysis Report
This article originally published on Zacks Investment Research (zacks.com).
The financial and materials sectors of the stock market are sprinting higher as 2025 nears its end, and looking at Global Leaders in Investor's Business Daily's Screen of the Day shows Deutsche Bank and two gold names — DRDGold and Harmony Gold Mining — in or near buy zones.
Deutsche Bank shares, which have more than doubled in price this year, were rising in a cup-with-handle base ahead of the European Central Bank's expected decision this week to hold its key interest rates steady. Rates that were held higher for longer than anticipated have benefited bank stocks worldwide. DRD Gold and Harmony Gold also rose in cup-with-handle bases as gold prices returned to record highs.
Deutsche Bank Base-Building Leads To Buy Zone
Deutsche Bank, Germany's largest bank by assets, was trading inside a buy zone ranging from 36.83 to 38.67 on Monday. The New York Stock Exchange-listed shares have already soared about 120% this year.
The stock's pattern is third stage, considered a late movement. Shares on Nov. 10 broke out above a then-entry of 37.86 during a broad-based jump in equities, as investors saw encouraging signs that the U.S. government shutdown was nearing an end.
Deutsche Bank's current entry was established on Oct. 29. That's when shares climbed 4.1% after the financial firm unexpectedly swung to a third-quarter profit, aided by a revenue rise in its global investment banking business.
The bank stock ran into weakness after a Nov. 10 spike up to 38.78, including nearly undercutting its base on Nov. 20 when the stock market reversed lower. Investors eager for a Fed rate cut were spooked by the prospect that the fed funds rate held steady.
Since Nov. 20, the stock has been building the right side of its base, leading to its move into a buy zone.
DRDGold Gets Precious Metals Boost
Gold prices on Monday edged up to trade above $4,338 an ounce, approaching a two-month high. Bullion prices have surged nearly 63% this year, with the non-yielding asset growing more attractive to investors as the Federal Reserve signaled a move toward rate cuts.
The Fed began reducing the fed funds rate in September. Gold has also been playing its traditional role as a haven asset amid economic uncertainty and concerns about a pickup in inflation.
DRDGold on Monday was trading just below its 30.88 entry in the fourth stage of its pattern. Later-stage patterns tend to produce lower returns than early-stage ones. The gold stock marked a breakout day on Dec. 12, popping 4.5% and piercing into the buy zone as it bucked a broader drop in stocks.
Shares overall have pushed higher since Aug. 20 after the miner doubled its dividend and posted a 69% climb in quarterly earnings.
Harmony Gold Stock Sits In Buy Zone
Meanwhile, Harmony Gold was in a buy zone from 20.06 to 21.06. The gold stock's cup-with-handle base was in its second stage, considered an early stage. The shares held in the buy zone despite slipping during Monday's session. The stock posted its most recent breakout day on Dec. 10
Based in South Africa, the miner shot up to a high of 22.25 on Aug. 16 as gold prices surged on Fed rate-cut expectations. The stock then turned lower in the following session, sliding 8.9%. Its downward trend continued through Nov 4. before the price found upward traction.
Harmony Gold and DRDGold hold top-notch 99 Composite Ratings while Deutsche Bank has a 93 Composite Rating.
Please follow Carla Mozee on X/Twitter for more news on stocks.
YOU MAY ALSO LIKE:
IBD Live: Learn And Analyze Growth Stocks With The Pros
MarketSurge: Research, Charts, Data And Coaching All In One Place
The Four Pillars Of The IBD Methodology
Risk Management In The Stock Market: How Much Money To Invest
Albemarle Corporation ALB has entered into a cesium concentrate offtake agreement with Power Metals Corp. Under the agreement, ALB has agreed to a pre-payment of C$5 million to Power Metals Corp for cesium oxide concentrate from the latter’s Case Lake Project located in Ontario, Canada. The deal involves ALB's purchase of the current offtake rights held by Winsome Resources in the project.
The Case Lake Project has been of growing strategic importance as it hosts near-surface, high-grade cesium and has the potential to play a significant role in securing North America’s cesium supply chain. While the project’s offtake rights are being assigned to ALB, Winsome will retain its 15.8% shareholding of Power Metals. Albemarle’s participation strengthens Power Metals’ Canadian critical minerals strategy by securing downstream expertise in high-value cesium chemicals and supporting the development of an integrated cesium market.
The transfer of offtake rights from Hong Kong-based Sinomine Resources Limited to Winsome Resources and now, Albemarle marks a shift in the global critical-minerals landscape as the focus on securing the North American supply chain increases.
The pre-payment is subject to Power Metals securing the necessary approvals and permits to commence mining at Case Lake. It has laid out financing in stages as key development milestones are achieved, with the first portion amounting to C$2M paid following execution of the pre-payment commitment and the second C$3M paid on delivery of Environmental Compliance Approval for the Case Lake Project in 2026.
ALB’s shares have gained 36.1% over the past year compared with the industry’s 17% decline.
Image Source: Zacks Investment Research
ALB’s Zacks Rank & Key Picks
ALB currently carries a Zacks Rank #3 (Hold).
Some better-ranked stocks in the Basic Materials space are Kinross Gold Corporation KGC, Fortuna Mining Corp. FSM and Harmony Gold Mining Company Limited HMY.
At present, KGC sports a Zacks Rank #1 (Strong Buy), while FSM and HMY carry a Zacks Rank #2 (Buy) each. You can see the complete list of today’s Zacks #1 Rank stocks here.
The Zacks Consensus Estimate for KGC’s current-year earnings is pegged at $1.67 per share, indicating a rise of 145.59%. Its earnings beat the Zacks Consensus Estimate in three of the trailing four quarters while missing it in one, with an average surprise of 17.37%. KGC’s shares have risen 188.2% over the past year.
The Zacks Consensus Estimate for FSM’s current fiscal-year earnings is pinned at 76 cents per share, indicating a 65.22% year-over-year increase. Its shares have surged 110.8% over the past year.
The Zacks Consensus Estimate for HMY’s 2026 earnings is pegged at $2.68 per share, indicating a 132.1% year-over-year increase. HMY’s shares have gained 133.9% over the past year.
Want the latest recommendations from Zacks Investment Research? Today, you can download 7 Best Stocks for the Next 30 Days. Click to get this free report
Kinross Gold Corporation (KGC) : Free Stock Analysis Report
Albemarle Corporation (ALB) : Free Stock Analysis Report
Harmony Gold Mining Company Limited (HMY) : Free Stock Analysis Report
Fortuna Mining Corp. (FSM) : Free Stock Analysis Report
This article originally published on Zacks Investment Research (zacks.com).
Nutrien Ltd.’s NTR shares have popped 40.5% so far this year, outperforming the industry’s 14.8% gain and the S&P 500’s 18.3% rise.
Price Performance of NTR vs. Industry and S&P 500
Image Source: Zacks Investment Research
Let’s take a look at the factors that are driving this fertilizer maker.
Global Fertilizer Demand Strength Supports NTR’s Rally
NTR’s rally has been underpinned by a combination of favorable agricultural market conditions, effective operational execution and improving investor confidence. The key driver has been sustained global fertilizer demand — particularly for potash, nitrogen and phosphate — bolstered by expectations of strong crop production and higher input requirements in 2025, alongside tight inventories and limited new supply.
Healthy demand from major markets such as North America, Brazil and Southeast Asia has supported firm pricing and higher sales volumes, prompting Nutrien to lift its 2025 potash sales outlook to around 14-14.5 million tons after delivering record shipment levels in the first nine months of the year.
Nutrien is also gaining from acquisitions and the growing adoption of its digital platform. It continues expanding in Brazil and plans to use free cash flow to pursue targeted growth investments and tuck-in acquisitions across its retail business in 2025.
Operational Leverage & Cash Flow Reinforce Confidence
Operational performance and financial results have further strengthened investor confidence. In the third quarter of 2025, Nutrien delivered strong EBITDA growth, supported by higher fertilizer sales volumes and firmer pricing across all segments, with potash, nitrogen and retail each contributing meaningfully, reflecting improved operating leverage alongside continued portfolio optimization and cost-control initiatives.
The company reported margin expansion and a sharp increase in free cash flow, which provided flexibility to return capital to its shareholders through dividends and share buybacks totaling well over $1 billion in the first nine months, underscoring Nutrien’s disciplined capital allocation and balance-sheet strength.
Nutrien Advances Cost Cuts & Efficiency Gains
Nutrien’s cost and operational efficiency efforts are set to further support performance. The company is focused on lowering potash production costs and has implemented several strategic actions to reduce controllable expenses and improve free cash flow. With accelerated efficiency and savings initiatives, Nutrien expects to achieve about $200 million in total cost reductions in 2025 and is currently ahead of schedule on this target.
NTR’s Zacks Rank & Key Picks
NTR currently carries a Zacks Rank #3 (Hold).
Some better-ranked stocks in the basic materials space include Agnico Eagle Mines Limited AEM, Harmony Gold Mining Company Limited HMY and Paladin Energy Ltd PALAF.
The Zacks Consensus Estimate for Agnico Eagle’s current-year earnings is pegged at $7.78 per share. AEM, currently flaunting a Zacks Rank #1 (Strong Buy), surpassed the Zacks Consensus Estimate in each of the trailing four quarters, with an average earnings surprise of 12%. The company's shares have surged 115.2% year to date. You can see the complete list of today's Zacks #1 Rank stocks here.
The Zacks Consensus Estimate for HMY’s current-year earnings is pegged at $2.68 per share. HMY carries a Zacks Rank #2 (Buy) at present. The company's shares have soared 148.5% year to date.
The Zacks Consensus Estimate for PALAF’s current-year earnings is pegged at 5 cents per share. PALAF currently carries a Zacks Rank #2. The company's shares have risen 31.7% year to date.
Want the latest recommendations from Zacks Investment Research? Today, you can download 7 Best Stocks for the Next 30 Days. Click to get this free report
Agnico Eagle Mines Limited (AEM) : Free Stock Analysis Report
Harmony Gold Mining Company Limited (HMY) : Free Stock Analysis Report
Paladin Energy Ltd. (PALAF) : Free Stock Analysis Report
Nutrien Ltd. (NTR) : Free Stock Analysis Report
This article originally published on Zacks Investment Research (zacks.com).
If you would like to receive our free newsletter via email, simply enter your email address below & click subscribe.
 Follow us on Twitter
 Become our facebook fan
CONNECT WITH US
Tweets
Tweet with hash tag #miningfeeds or @miningfeeds and your tweets will be displayed across this site.
MOST ACTIVE MINING STOCKS
Daily Gainers
 CMC Metals Ltd. CMC Metals Ltd. |
CMB.V | +900.00% |
 Eden Energy Ltd Eden Energy Ltd |
EDE.AX | +200.00% |
| GoviEx Uranium Inc. |
GXU.V | +42.86% |
| Eagle Nickel Ltd. |
ENL.AX | +41.67% |
| Citigold Corp. Limited |
CTO.AX | +33.33% |
| Mount Burgess Mining NL |
MTB.AX | +33.33% |
| Exalt Resources Limited |
ERD.AX | +31.94% |
| Casa Minerals Inc. |
CASA.V | +30.00% |
| Cariboo Rose Resources Ltd |
CRB.V | +28.57% |
| Belmont Resources Inc. |
BEA.V | +28.57% |


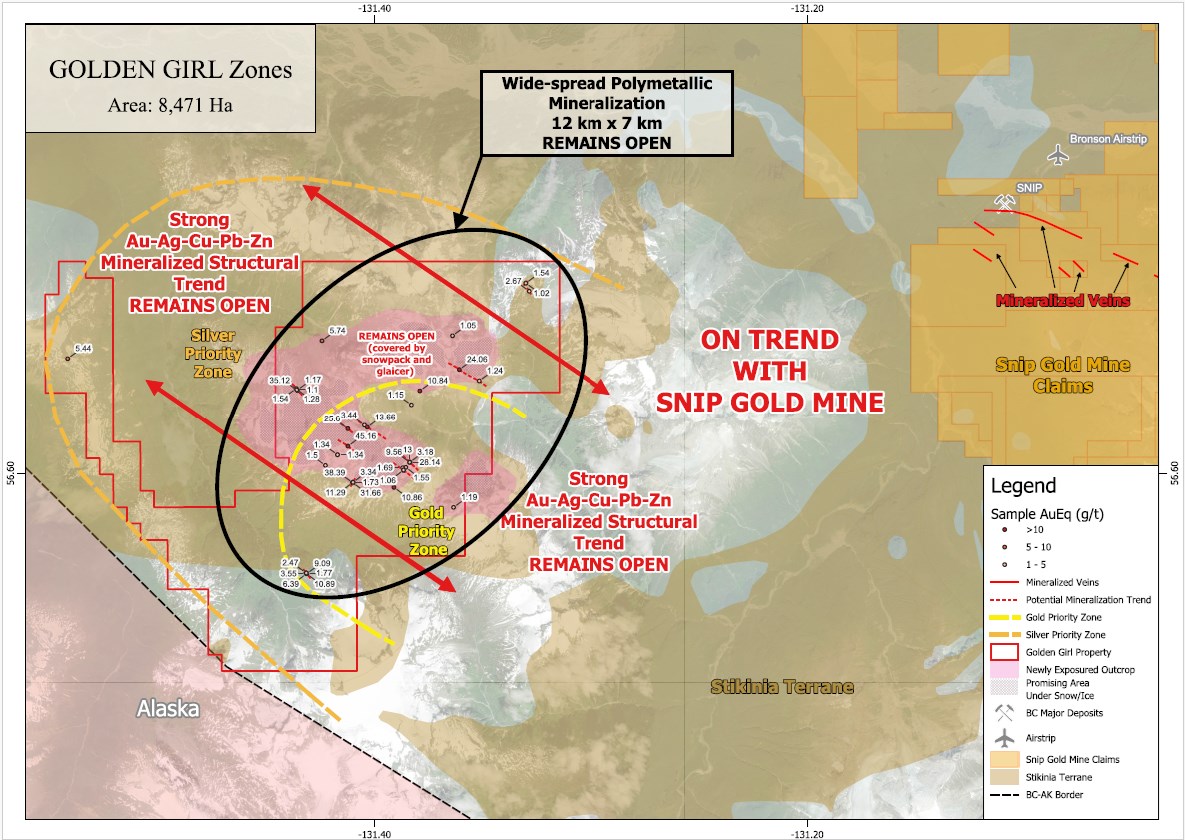