Investors with an interest in Mining – Miscellaneous stocks have likely encountered both Norsk Hydro ASA (NHYDY) and BHP (BHP). But which of these two stocks offers value investors a better bang for their buck right now? We'll need to take a closer look.
We have found that the best way to discover great value opportunities is to pair a strong Zacks Rank with a great grade in the Value category of our Style Scores system. The proven Zacks Rank emphasizes companies with positive estimate revision trends, and our Style Scores highlight stocks with specific traits.
Norsk Hydro ASA has a Zacks Rank of #1 (Strong Buy), while BHP has a Zacks Rank of #3 (Hold) right now. The Zacks Rank favors stocks that have recently seen positive revisions to their earnings estimates, so investors should rest assured that NHYDY has an improving earnings outlook. But this is only part of the picture for value investors.
Value investors also try to analyze a wide range of traditional figures and metrics to help determine whether a company is undervalued at its current share price levels.
The Style Score Value grade factors in a variety of key fundamental metrics, including the popular P/E ratio, P/S ratio, earnings yield, cash flow per share, and a number of other key stats that are commonly used by value investors.
NHYDY currently has a forward P/E ratio of 9.44, while BHP has a forward P/E of 16.39. We also note that NHYDY has a PEG ratio of 0.74. This popular figure is similar to the widely-used P/E ratio, but the PEG ratio also considers a company's expected EPS growth rate. BHP currently has a PEG ratio of 1.10.
Another notable valuation metric for NHYDY is its P/B ratio of 2.15. Investors use the P/B ratio to look at a stock's market value versus its book value, which is defined as total assets minus total liabilities. By comparison, BHP has a P/B of 3.75.
These are just a few of the metrics contributing to NHYDY's Value grade of B and BHP's Value grade of C.
NHYDY sticks out from BHP in both our Zacks Rank and Style Scores models, so value investors will likely feel that NHYDY is the better option right now.
Want the latest recommendations from Zacks Investment Research? Today, you can download 7 Best Stocks for the Next 30 Days. Click to get this free report
Norsk Hydro ASA (NHYDY) : Free Stock Analysis Report
BHP Group Limited Sponsored ADR (BHP) : Free Stock Analysis Report
This article originally published on Zacks Investment Research (zacks.com).
Toronto, Ontario–(Newsfile Corp. – May 14, 2026) – Mogotes Metals Inc. (TSXV: MOG) (FSE: OY4) (OTCQB: MOGMF) ("Mogotes", or the "Company") is pleased to announce partial laboratory assay results from diamond drillhole FS_DDH_016 at the Company's flagship Filo Sur project in Argentina, immediately along strike from BHP and Lundin Mining's Filo del Sol copper-gold-silver discovery¹.
Assays received for the first 194 m within the 464 m deep hole confirm a continuous zone starting from 108 m depth of near surface, high-grade copper-gold-silver-molybdenum mineralization within chalcopyrite – bornite – covellite bearing breccias, stockwork and dissemination within the altered porphyry matrix (Table 1). Mogotes geologists have noted strong parallels with the characteristics of mineralization in hole FS_DDH_016 and those reported from the nearby Filo del Sol deposit2.
Highlights
- 86 m at 0.7% Cu, 0.55 g/t Au, 2.7 g/t Ag & 169 ppm Mo from 108 m to 194 m down hole to end of assays received to date. (Table 1)
- Including 43 m at 1.1% Cu, 0.82 g/t Au, 4.0 g/t Ag & 281 ppm Mo from 111 m
- Reported interval ends in mineralization
- Assays for the remaining 270 m of the hole are pending.
- This interval also includes peak intercepts of:
- 10 m at 1.4% Cu, 1.2 g/t Au, 4.6 g/t Ag and 383 ppm Mo from 133 m.
- 5 m at 1.75% Cu, 1.1 g/t Au, 3.6 g/t Ag and 393 ppm Mo from 146 m.
- Core shows evidence of several stages of mineralization as is seen in the nearby Filo del Sol deposit (Figure 3): chalcopyrite – bornite with porphyry-stage potassic alteration (breccias, stockwork, dissemination and anhydrite megacryst pegmatite veins), interpreted hypogene epithermal enrichment with fine grained dark copper minerals including probable covellite/digenite as disseminated overgrowths on pyrite and distinctive fracture coatings and localized sulphide rich veins with enargite, as well as some evidence of supergene copper mineralization with localized fracture coat malachite, brochantite and probable chalcocite.
- Shallow high-grade copper, gold, silver and molybdenum mineralization: mineralization starts at 108 m down hole, and trenching results along strike at surface indicate that mineralization projects to surface beneath a thin scree cover that may also be concealing a larger mineralized target.
- Generally low levels of arsenic for the Vicuña district: Arsenic levels are typically low (median for this interval is 2 ppm As) within this mineralized interval with only specific narrow structures with elevated arsenic indicating the local presence of the copper-bearing epithermal mineral enargite.
- Larger mineral system at play: The newly identified "Albor" target is part of a 3.5 km long Mogotes (Meseta – Luz del Sol – Cumbre – Albor) Miocene age target trend aligned within the regional scale, transorogen, Macho Muerto Fault Zone. Observed multistage alteration and mineralization features in the drill core suggest association with a larger Cu-Au-Ag-Mo mineral system.
- "Albor" is the second copper-gold-silver-molybdenum discovery by Mogotes in its inaugural drilling season at Filo Sur (see Cruz del Sur press release) and is part of the large Luz del Sol target trend where drill results are pending for a number of holes drilled in the 2025-2026 exploration season.
Figure 1: Core from 125.75m (FS_DDH_016), 125-126m assays at 1.67% Cu, 1.62 g/t Au, 1.69 g/t Ag, 685 ppm Mo
To view an enhanced version of this graphic, please visit:https://images.newsfilecorp.com/files/10597/297424_bac167e3f45afbcc_002full.jpg
CEO Comment
Allen Sabet, President and CEO of Mogotes, commented:
"In our first fully funded drill season at Filo Sur we have now made two significant copper-gold-silver-molybdenum discoveries at Cruz del Sur and at the Albor target, where we have just scratched the surface of something we believe will be significant.
"This partial assay release from Albor is a first hole into a shallow and high-grade copper-gold-silver-molybdenum system, strategically located adjacent to the large Vicuña district deposits, where BHP and Lundin Mining are developing the Josemaria copper-gold porphyry and evaluating development options for the very large Filo del Sol deposit.
"As this style of mineralization has implications for the broader Vicuña district, we felt it prudent to release partial results for FS_DDH_016 as received. We continue to be humbled by the geological endowment of this very special part of the world and are grateful for the continued support of our patient shareholders. Stay tuned for more!"
Figure 2: Plan View of Drillhole FS_DDH_016 and Albor Target Zones
Albor target zones untested by drilling prior to this campaign.
To view an enhanced version of this graphic, please visit:https://images.newsfilecorp.com/files/10597/297424_bac167e3f45afbcc_003full.jpg
Figure 3: Core photographs of FS_DDH_016 up to 194 m
All intervals shown are down-hole depth. (A, B, E, and G) Pyrite + chalcopyrite + bornite ± covellite ± digenite in hydrothermal breccia matrix. (A) 113-114 m. (B) 119-120 m. (E) 157-158 m. (G) 187-188m. (C, F, and D) Pyrite + chalcopyrite + covellite/digenite veins. (C) 116-117 m. (F) 180-181 m. (D) 135-136 m.
To view an enhanced version of this graphic, please visit:https://images.newsfilecorp.com/files/10597/297424_bac167e3f45afbcc_004full.jpg
Next Steps on rest of Filo Sur drill campaign:
- Lab assays for the 194–464 m portion of FS_DDH_016 are expected by end of May 2026.
- The drill campaign has now formally ended, with both Chile and Argentina field camps demobilized.
- Efforts were made to drill as much as possible this season, using 4 rigs and drilling a total of 6207 metres, of which 2652 metres have been reported on including in this press release.
- 3681 metres of drilling will be reported on in the coming months.
- Chile drill holes started later in the season and will be reported later than the Argentina drill holes due to timing of drilling and laboratory assay timing.
Figure 4: Filo Sur Project Luz del Sol Trend
To view an enhanced version of this graphic, please visit:https://images.newsfilecorp.com/files/10597/297424_bac167e3f45afbcc_005full.jpg
To view an enhanced version of this graphic, please visit:https://images.newsfilecorp.com/files/10597/297424_bac167e3f45afbcc_007full.jpg
To view an enhanced version of this graphic, please visit:https://images.newsfilecorp.com/files/10597/297424_bac167e3f45afbcc_008full.jpg
To view an enhanced version of this graphic, please visit:https://images.newsfilecorp.com/files/10597/297424_bac167e3f45afbcc_009full.jpg
To view an enhanced version of this graphic, please visit:https://images.newsfilecorp.com/files/10597/297424_bac167e3f45afbcc_010full.jpg
To view an enhanced version of this graphic, please visit:https://images.newsfilecorp.com/files/10597/297424_bac167e3f45afbcc_011full.jpg
To view an enhanced version of this graphic, please visit:https://images.newsfilecorp.com/files/10597/297424_bac167e3f45afbcc_012full.jpg
Table 2: Location details of FS_DDH_016
| Hole number | Initial Azimuth | Initial Dip | Depth (m) | Grid | Easting | Northing |
| FS_DDH_016 | 245.4 | -69.8 | 464 | UTM zone 19S | 435711 | 6842226 |
References
1 May 4, 2025. News Release, Lundin Mining Announces Initial Mineral Resource at Filo del Sol Demonstrating One of the World's Largest Copper, Gold, and Silver Resources. Lundin Mining
2 Perelló, J., Sillitoe, R. H., Rossello, J., Forestier, J., Merino, G., & Charchaflié, D. (2023). Geology of porphyry Cu-Au and epithermal Cu-Au-Ag mineralization at Filo del Sol, Argentina-Chile: Extreme telescoping during Andean uplift. Economic Geology, 118(3), 611–654.
About Mogotes Metals Inc.
Mogotes Metals Inc. is a mineral exploration company focused on copper, gold, and silver in the prospective Vicuña district of Argentina and Chile. The Company's flagship Filo Sur project adjoins Lundin Mining's Filo del Sol — one of the world's largest copper-gold-silver discoveries¹ — and lies along the same N-S trending belt as the Filo del Sol–Aurora deposits and NGEx Minerals' Lunahuasi and Los Helados copper-gold deposits.
For further information, please contact:
Mogotes Metals Inc.Allen Sabet, President and Chief Executive OfficerPhone: (647) 846-3313Email: info@mogotesmetals.com
Follow Us
Twitter: https://x.com/mogotesmetals
Additional Information
The information contained in this news release was accurate at the time of dissemination but may be superseded by subsequent news release(s). The Company is under no obligation, nor does it intend to update or revise the forward-looking information, whether as a result of new information, future events or otherwise.
Qualified Persons
The scientific and technical disclosure for the Filo Sur project included in this news release have been reviewed and approved by Stephen Nano who is the Qualified Person as defined by NI 43-101. Mr. Nano is a Director and Technical Advisor of the Company and is not independent.
Note that the Qualified Person has not verified the information regarding adjacent properties such as Filo del Sol and that the information regarding the mineralization of the Filo del Sol project is not necessarily indicative of the mineralization on the Filo Sur project.
Mogotes applies industry-standard exploration sampling methodologies and techniques. All geochemical soil, stream, rock and drill samples are collected under the supervision of the company's geologists in accordance with industry practice. Geochemical assays are obtained and reported under a quality assurance and quality control (QA/QC) program. Samples from Argentina are dispatched bagged in raffia bags and packaged for shipment by a dedicated truck to the ALS laboratory in Mendoza, Argentina. Samples from Chile are dispatched bagged in raffia bags and delivered to the ALS laboratory in Copiapo, Chile. These facilities carried out sample preparation (PREP-31B) which includes crush to 70% less than 2 mm, riffle split off 1 kg, pulverize to 85% passing 75 microns. The prepared samples are sent to the ALS laboratory in Lima, Peru for gold and multi-element analysis. Gold (Au-ICP21) was analyzed by fire assay fusion with ICP-AES finish on a 30 g sample. Samples were also analyzed for a suite of 48 elements (ME-MS61) with four acid digestion and ICP-MS finish.
Assay results from drill core samples may be higher, lower or similar to results obtained from surface rock, channel, trench samples due to surficial oxidation and enrichment processes or due to natural geological grade variations in the primary mineralization.
Cautionary Note Regarding Forward-Looking Statements:
Neither TSX Venture Exchange nor its Regulation Services Provider (as that term is defined in the policies of the TSX Venture Exchange) accepts responsibility for the adequacy or accuracy of this release.
Certain statements made and information contained herein constitute "forward-looking information" and "forward-looking statements" within the meaning of applicable securities legislation (collectively, "forward-looking information"). The forward-looking information contained in this news release is based on information available to the Company as of the date of this news release. Except as required under applicable securities legislation, the Company does not intend, and does not assume any obligation, to update this forward-looking information. Generally, this forward-looking information can frequently, but not always, be identified by use of forward-looking terminology such as "plans", "expects" or "does not expect", "is expected", "budget", "scheduled", "estimates", "forecasts", "intends", "projects", "targets", "assumes", "strategy", "goals", "objectives", "potential", "possible", "anticipates" or "does not anticipate", or "believes", or variations of such words and phrases or statements that certain actions, events, conditions or results "will", "may", "could", "would", "should", "might" or "will be taken", "will occur" or "will be achieved" or the negative connotations thereof. All statements other than statements of historical fact may be forward-looking statements.
No assurance can be given that this information will prove to be correct and such forward-looking information included in this news release should not be relied upon. In particular, this press release contains forward-looking information pertaining to assumptions made in the interpretation of drill results, geology, grade, geochemistry, potential implications of geophysics interpretations, and continuity of mineral deposits; the assumption that any further assay results from the remaining approximately 270 m of drill hole FS_DDH_016, or from any other drill hole at the Filo Sur project, will return grades, widths or styles of mineralization comparable to the partial assay results from FS_DDH_016 reported in this news release; the assumption that visual estimates, core-logging observations and pXRF measurements referenced in this news release (including in the figure captions) will be confirmed by subsequent laboratory assays; the assumption that future drill holes at the Albor target or elsewhere on the Filo Sur project will encounter mineralization of similar grade, width, continuity or character to that reported herein; expectations regarding access and demand for equipment, skilled labour and services needed for exploration and development of mineral properties; and that activities will not be adversely disrupted or impeded by exploration, development, operating, regulatory, political, community, economic, environmental and/or health and safety risks. In addition, this news release may contain forward-looking statements or information pertaining to: potential exploration upside at the Filo Sur Project, including the extent and significance of the porphyry copper-gold system and the prospectivity of exploration targets; exploration plans and expenditures; the ability of the Company to conduct its field programs as planned; the success of future exploration activities; potential for resource expansion; ability to build shareholder value; expectations with regard to adding to its Mineral Reserves or Resources through exploration; ability to execute planned work programs; plans or ability to mobilize or add additional drill rigs; timing or anticipated results of laboratory results; government regulation of mining activities; environmental risks; unanticipated reclamation expenses; title disputes or claims; limitations on insurance coverage; and other risks and uncertainties. While the Company anticipates running an exploration program, it may encounter unexpected logistics, community, access, permitting, legal, environmental, drilling and other challenges, costs, or delays that could prevent the Company from completing the program on the expected timeline or at all. Any further drilling is dependent on pending results from this year's program and the Company securing additional funding. This program could be delayed or not be carried out at all.
Although the Company believes that the expectations reflected in such forward-looking statements and/or information are based on assumptions that are reasonable, undue reliance should not be placed on forward-looking statements since the Company can give no assurance that such expectations will prove to be correct. These statements involve known and unknown risks, uncertainties and other factors that may cause actual results or events to differ materially from those anticipated in such forward-looking statements, including the risks, uncertainties and other factors identified in the Company's periodic filings with Canadian securities regulators, available under the Company's SEDAR+ profile at www.sedarplus.ca, as well as among other things: general business, economic and mining industry conditions; foreign exchange rates; geological conditions; the supply and demand for commodities; that financing will be available if and when needed on reasonable terms and that the Company will not experience any material labour dispute, accident, or failure of plant or equipment; the stability and predictability of the political environments and legal and regulatory frameworks; the ability of the Company to obtain, maintain, renew and/or extend required permits, licences, authorizations and/or approvals from the appropriate regulatory authorities; that contractual counterparties perform as agreed; and the ability of the Company to continue to obtain qualified staff and equipment in a timely and cost-efficient manner to meet its needs. These factors are not, and should not be construed as being, exhaustive. Although the Company has attempted to identify important factors that would cause actual results to differ materially from those contained in forward-looking information, there may be other factors that cause results not to be as anticipated, estimated, or intended. There can be no assurance that such statements will prove to be accurate, as actual results and future events could differ materially from those anticipated in such statements. All of the forward-looking information contained in this document is qualified by these cautionary statements. Readers are cautioned not to place undue reliance on forward-looking information due to the inherent uncertainty thereof. Statements relating to "mineral resources" are deemed to be forward-looking information, as they involve the implied assessment, based on certain estimates and assumptions that the mineral resources described can be profitably produced in the future. Forward-looking information is provided for the purpose of providing information about management's current expectations and plans and allowing investors and others to get a better understanding of the Company's operating environment.
To view the source version of this press release, please visit https://www.newsfilecorp.com/release/297424
Freeport-McMoRan Inc. FCX delivered first-quarter 2026 earnings and revenue above expectations, driven by higher copper and gold prices, though weaker sales volumes were a drag. Its copper sales volumes tumbled approximately 25% year over year in the first quarter to 657 million pounds, and fell from 709 million pounds in the prior quarter. The downside primarily resulted from lower operating rates due to the temporary suspension of operations since the mud rush incident at the Grasberg Block Cave mine in Indonesia in September 2025. While the company’s outlook for copper sales volumes for the second quarter of 690 million pounds indicates a sequential improvement, it still suggests a 32% year-over-year decline. For full-year 2026, consolidated sales volume projections were revised lower to around 3.1 billion pounds of copper from the prior view of 3.4 billion pounds due to an expected delay in achieving full ramp-up of the Grasberg Block Cave mine. Sales volume growth underpins Freeport’s ability to leverage higher copper and gold prices, maintain margin expansion and deliver on its targets. Despite gains in realized prices, lower expected volumes are likely to strain its financials. Among FCX’s peers, Southern Copper Corporation SCCO logged lower copper sales volumes in the first quarter. Southern Copper sold 231,770 tons of copper in the quarter, declining nearly 5% year over year. Southern Copper also saw lower molybdenum sales volumes, which fell roughly 3% year over year. BHP Group Limited BHP saw lower year-over-year copper sales in the third quarter of fiscal 2026 (ended March 31, 2026). BHP Group’s copper sales for the quarter fell roughly 12% year over year to 468.7kt. BHP Group’s total copper sales for the nine-month period also declined around 7% from the prior-year period.
The Zacks Rundown for FCX
Shares of Freeport-McMoRan have gained 32.2% year to date compared with the Zacks Mining – Non Ferrous industry’s rise of 31%.
Image Source: Zacks Investment Research
From a valuation standpoint, FCX is currently trading at a forward 12-month earnings multiple of 23.29, a 3.5% discount to the industry average of 24.14X. It carries a Value Score of C.
Image Source: Zacks Investment Research
The Zacks Consensus Estimate for FCX’s 2026 and 2027 earnings implies a year-over-year rise of 44.6% and 34%, respectively. The EPS estimates for 2026 and 2027 have been trending higher over the past 60 days.
Image Source: Zacks Investment Research
FCX stock currently carries a Zacks Rank #3 (Hold). You can see the complete list of today’s Zacks #1 Rank (Strong Buy) stocks here.
Want the latest recommendations from Zacks Investment Research? Today, you can download 7 Best Stocks for the Next 30 Days. Click to get this free report
Freeport-McMoRan Inc. (FCX) : Free Stock Analysis Report
BHP Group Limited Sponsored ADR (BHP) : Free Stock Analysis Report
Southern Copper Corporation (SCCO) : Free Stock Analysis Report
This article originally published on Zacks Investment Research (zacks.com).
OVERLAND PARK, Kan., May 13, 2026–(BUSINESS WIRE)–Compass Minerals (NYSE: CMP), a leading global provider of essential minerals, today announced that the company will participate in one-on-one meetings at Deutsche Bank’s 17th Annual Basic Materials Conference on June 2, 2026, in New York City.
Updated presentation materials will be available at the time of the event through the investor relations section of the Compass Minerals website at compassminerals.com.
About Compass Minerals
Compass Minerals (NYSE: CMP) is a leading global provider of essential minerals focused on safely delivering where and when it matters to help solve nature’s challenges for customers and communities. The company’s salt products help keep roadways safe during winter weather and are used in numerous other consumer, industrial, chemical and agricultural applications. Its plant nutrition products help improve the quality and yield of crops while supporting sustainable agriculture. Compass Minerals operates 11 production and packaging facilities with more than 1,800 employees throughout the U.S., Canada and the U.K. Visit compassminerals.com for more information about the company and its products.
View source version on businesswire.com: https://www.businesswire.com/news/home/20260513367661/en/
Contacts
Investor Contact Brent CollinsVice President, Treasurer & Investor Relations+1.913.344.9111InvestorRelations@compassminerals.com
Media Contact Kevin GabrielSenior Director, Corporate Affairs+1.913.344.9265MediaRelations@compassminerals.com
- In early May 2026, Compass Minerals International reported fiscal second-quarter results showing sales of US$453.2 million and net income of US$12.7 million, marking a shift from a loss a year earlier.
- Alongside the earnings release, the company retired US$150.0 million of senior notes, extended its receivables facility to 2029, and simplified its portfolio by selling its Wynyard sulfate of potash business.
- We’ll now examine how Compass Minerals’ return to profitability and recent debt reduction efforts may influence its existing investment narrative.
Uncover the next big thing with 25 elite penny stocks that balance risk and reward.
Compass Minerals International Investment Narrative Recap
To own Compass Minerals today, you need to be comfortable with a business that still leans on highly variable winter Salt demand while working to strengthen its Plant Nutrition earnings and balance sheet. The return to profitability in the latest quarter and the retirement of US$150.0 million of senior notes help the near term story, but do not remove the key short term catalyst of operational execution in Salt or the biggest current risk of weather driven revenue swings.
Among the latest announcements, the full redemption of the remaining US$150.0 million of 2027 senior notes stands out as most relevant. It directly addresses earlier concerns about leverage, which had implied that a large share of future cash flows might be tied up in debt repayment rather than growth. For investors watching how quickly Compass can translate its recent profitability into more financial flexibility, this move is central to the evolving thesis.
But investors also need to be aware that Compass remains heavily exposed to unpredictable winter weather patterns, which…
Read the full narrative on Compass Minerals International (it's free!)
Compass Minerals International's narrative projects $1.3 billion revenue and $76.7 million earnings by 2028. This requires 2.1% yearly revenue growth and a $197.6 million earnings increase from -$120.9 million today.
Uncover how Compass Minerals International's forecasts yield a $25.75 fair value, a 9% downside to its current price.
Exploring Other PerspectivesCMP 1-Year Stock Price Chart
Four members of the Simply Wall St Community currently estimate Compass Minerals’ fair value between US$14.18 and US$25.75, highlighting very different expectations. You can weigh these views against the company’s continued dependence on volatile winter Salt demand, which has important implications for how steady future earnings might be.
Explore 4 other fair value estimates on Compass Minerals International – why the stock might be worth 50% less than the current price!
Reach Your Own Conclusion
Don't just follow the ticker – dig into the data and build a conviction that's truly your own.
- A great starting point for your Compass Minerals International research is our analysis highlighting 2 key rewards and 2 important warning signs that could impact your investment decision.
- Our free Compass Minerals International research report provides a comprehensive fundamental analysis summarized in a single visual – the Snowflake – making it easy to evaluate Compass Minerals International's overall financial health at a glance.
Curious About Other Options?
Markets shift fast. These stocks won't stay hidden for long. Get the list while it matters:
- Invest in the nuclear renaissance through our list of 91 elite nuclear energy infrastructure plays powering the global AI revolution.
- Find 51 companies with promising cash flow potential yet trading below their fair value.
- AI is about to change healthcare. These 35 stocks are working on everything from early diagnostics to drug discovery. The best part – they are all under $10b in market cap – there's still time to get in early.
This article by Simply Wall St is general in nature. We provide commentary based on historical data
and analyst forecasts only using an unbiased methodology and our articles are not intended to be financial advice. It does not constitute a recommendation to buy or sell any stock, and does not take account of your objectives, or your
financial situation. We aim to bring you long-term focused analysis driven by fundamental data.
Note that our analysis may not factor in the latest price-sensitive company announcements or qualitative material.
Simply Wall St has no position in any stocks mentioned.
Companies discussed in this article include CMP.
Have feedback on this article? Concerned about the content? Get in touch with us directly. Alternatively, email editorial-team@simplywallst.com
Find your next quality investment with Simply Wall St’s easy and powerful screener, trusted by over 7 million individual investors worldwide.
- BHP Group lost a UK court appeal over its liability for the 2015 Brazil dam disaster, clearing the way for a major damages trial.
- Copper has overtaken iron ore as BHP’s largest earnings contributor, supported by demand from AI related infrastructure.
- BHP agreed a yuan priced iron ore deal with a Chinese state entity and is open to issuing yuan denominated debt.
ASX:BHP is trading at A$57.95, with the stock up 5.5% over the past week and 26.6% year to date. Over 1 year, the share price return is 60.8%, while the 3 year and 5 year returns are 53.6% and 84.9% respectively. These moves frame a company that is already in focus as it faces legal, earnings mix and funding changes at the same time.
For investors, the combination of a high profile UK legal process, copper taking the lead in earnings, and closer links to China’s currency and capital markets points to a company in the middle of significant shifts. How BHP manages legal liabilities, capital allocation and exposure across iron ore and copper will be key factors to watch when assessing risk and potential resilience in ASX:BHP.
Stay updated on the most important news stories for BHP Group by adding it to your watchlist or portfolio. Alternatively, explore our Community to discover new perspectives on BHP Group.
ASX:BHP 1-Year Stock Price Chart
Quick Assessment
- ❌ Price vs Analyst Target: At A$57.95, BHP trades about 8.9% above the A$53.22 analyst consensus target.
- ❌ Simply Wall St Valuation: Shares are trading 44.5% above the estimated fair value, so the stock screens as overvalued.
- ✅ Recent Momentum: The stock is up 6.3% over the last 30 days, continuing a strong recent run.
There is only one way to know the right time to buy, sell or hold BHP Group. Head to Simply Wall St’s
company report for the latest analysis of BHP Group’s Fair Value.
Key Considerations
- 📊 The UK court setback keeps the 2015 Brazil dam disaster front and center, so legal provisions and potential damages remain an important part of the thesis.
- 📊 Copper now leading earnings, supported by AI related infrastructure demand, makes volume, pricing and new copper projects key data points to watch.
- ⚠️ The yuan priced iron ore deal and potential yuan debt increase exposure to Chinese credit and currency terms at a time when the stock already looks expensive on DCF estimates.
Dig Deeper
For the full picture, including more risks and rewards, check out the
complete BHP Group analysis. Alternatively, you can visit the
community page for BHP Group to see how other investors believe this latest news will impact the company’s narrative.
This article by Simply Wall St is general in nature. We provide commentary based on historical data
and analyst forecasts only using an unbiased methodology and our articles are not intended to be financial advice. It does not constitute a recommendation to buy or sell any stock, and does not take account of your objectives, or your
financial situation. We aim to bring you long-term focused analysis driven by fundamental data.
Note that our analysis may not factor in the latest price-sensitive company announcements or qualitative material.
Simply Wall St has no position in any stocks mentioned.
Companies discussed in this article include BHP.AX.
Have feedback on this article? Concerned about the content? Get in touch with us directly. Alternatively, email editorial-team@simplywallst.com
Freeport-McMoRan Inc.’s FCX shares have popped 48% in the past six months, thanks to its strong earnings performance riding on higher copper prices driven by concerns over tighter global supply and solid demand. Although sales volumes declined, the company saw a sharp increase in realized copper prices, driving its first-quarter earnings.Freeport has outperformed the Zacks Mining – Non Ferrous industry’s rise of 37.1% and the S&P 500’s increase of 9.4% over the same period. Its peers, Southern Copper Corporation SCCO and BHP Group Limited BHP, have rallied 28.7% and 47.7%, respectively.
Freeport’s 6-month Price Performance
Image Source: Zacks Investment Research
FCX stock is currently trading below the 50-day simple moving average (SMA). FCX has been trading above the 200-day SMA since late November 2025, suggesting a long-term uptrend. Following a golden crossover on July 8, 2025, the 50-day SMA is higher than the 200-day SMA, indicating a bullish trend.
FCX Stock Trades Below 50-Day SMA
Image Source: Zacks Investment Research
Let’s take a look at FCX’s fundamentals to analyze the stock better.
Freeport’s Growth Actions to Drive Capacity & Production
Freeport continues to leverage its portfolio of high-quality copper assets, emphasizing disciplined execution and organic growth initiatives to strengthen its production profile. At its Cerro Verde operation in Peru, a large-scale concentrator expansion provided incremental annual production of around 600 million pounds of copper and 15 million pounds of molybdenum. It has completed the evaluation of a large-scale expansion at El Abra in Chile to define a large sulfide resource that could potentially support a major mill project similar to the large-scale concentrator at Cerro Verde, with an estimated resource of approximately 20 billion recoverable pounds of copper. In Arizona, FCX is progressing with pre-feasibility studies at its Safford/Lone Star operations, with completion targeted for 2026, to assess a sizable sulfide expansion opportunity. It has expansion opportunities at Bagdad in Arizona that can more than double the concentrator capacity of the operation. Technical and economic studies have revealed the potential to build concentrating facilities to boost copper production by 200-250 million pounds annually. PT Freeport Indonesia (PT-FI) substantially completed the construction of the new greenfield smelter in Eastern Java during 2024, with the start-up of operations having commenced in the second quarter of 2025. The first production of copper anode was achieved in July 2025. PT-FI is also developing the Kucing Liar ore body within the Grasberg district with a targeted ramp-up to commence in 2030. FCX completed studies in 2025 that showed an opportunity to increase Kucing Liar’s design capacity to 130,000 metric tons of ore per day and reserves by roughly 20% at low costs.
FCX’s Solid Financial Health & Capital Discipline Bode Well
FCX has a strong liquidity profile and generates substantial cash flows, providing ample flexibility to fund expansion projects, reduce debt and enhance shareholder returns. It generated solid operating cash flows of $5.6 billion in 2025. Cash flows provided by operations surged 36% year over year to around $1.5 billion in the first quarter of 2026. Freeport ended the first quarter with strong liquidity, including $3.7 billion in cash and cash equivalents, $3 billion in availability under the FCX revolving credit facility, and $1.5 billion in availability under the PT-FI credit facility.At the end of the first quarter, Freeport had a net debt of $2.4 billion, excluding PTFI’s new downstream processing facilities. Its net debt is below its targeted range of $3-$4 billion. Freeport has a policy of distributing 50% of the available cash to its shareholders and the balance to either reduce debt or invest in growth projects. FCX has no significant debt maturities until 2027. Its long-term debt-to-capitalization is around 22.1% compared with 36.3% for Southern Copper and 29.3% for BHP Group.FCX offers a dividend yield of roughly 0.5% at the current stock price. Its payout ratio is 14% (a ratio below 60% is a good indicator that the dividend will be sustainable). Backed by strong financial health, the company's dividend is perceived to be safe and reliable.
Favorable Copper Prices Augur Well for Freeport
Prices of copper, the backbone of electrification, were volatile yet mostly favorable last year due to global economic and trade uncertainties. Copper prices started 2026 on a strong note, underpinned by robust demand from China and the United States. Structural tailwinds, including electric vehicles (EVs), renewable energy projects, data center growth and grid modernization, continue to boost copper consumption. Worries about tightening supply amid rising EV and infrastructure demand also supported the red metal. Supply risks increased amid concerns over lower output and potential disruptions at major global mining operations. These factors led to prices surging to roughly $6.4 per pound in late January. Prices of the red metal were mostly volatile during February, largely trading near $6 per pound. Copper prices came under pressure in March amid concerns about the impact of surging oil prices on the global economy due to the war in the Middle East, dragging down prices to a three-month low of around $5.3 per pound in late March. Prices rebounded in April on hopes of a de-escalation in the Iran war and are currently hovering around $6.2 per pound. Freeport’s average realized copper price climbed around 30% year over year to $5.78 per pound in the first quarter. Favorable prices are expected to continue to support its performance.
Higher Unit Costs Weigh on FCX’s Margins
Freeport faces headwinds from higher costs. Freeport's outlook for the second quarter of 2026 suggests higher costs on a sequential basis. It expects unit net cash costs to rise to $2.24 per pound, while projecting a full-year average of roughly $1.95 (compared with $1.65 in 2025). The projected second-quarter unit cost reflects a roughly 98% year over year and 17% increase from the prior quarter. The uptick in costs reflects higher costs of energy and other consumables due to the Middle East conflict and persistent pressure on volumes. Higher costs are expected to weigh on the company's margins.
Volume Weakness a Drag on FCX’s Prospects
Freeport’s copper sales volumes tumbled approximately 25% year over year in the first quarter to 657 million pounds, and fell from 709 million pounds in the prior quarter. The downside primarily resulted from lower operating rates due to the temporary suspension of operations since the mud rush incident at the Grasberg Block Cave mine in Indonesia in September 2025. While the company’s outlook for copper sales volumes for the second quarter of 2026 of 690 million pounds indicates a sequential improvement, it still suggests a 32% year-over-year decline. For full-year 2026, consolidated sales volume projections were revised lower to around 3.1 billion pounds of copper from the prior view of 3.4 billion pounds due to an expected delay in achieving full ramp-up of the Grasberg Block Cave mine. Lower sales volumes are expected to weigh on its top line.
FCX’s Earnings Estimates Going Down
Freeport’s earnings estimates have been going down over the past 60 days. The Zacks Consensus Estimate for 2026 earnings has been revised down over the same time frame.
Image Source: Zacks Investment Research
A Look at FCX’s Valuation
FCX is currently trading at a forward price/earnings of 21.52X, a 6.1% discount to the industry average of 22.91X. The FCX stock is trading at a discount to Southern Copper and at a premium to BHP Group.
FCX’s P/E F12M Vs. Industry, SCCO and BHP
Image Source: Zacks Investment Research
How Should Investors Play FCX Stock?
Freeport stands to benefit from progress in its expansion projects, which should boost production capacity. Its solid balance sheet offers the flexibility to invest in growth while continuing to support shareholder returns. Favorable copper prices further support the outlook. However, softer sales volume expectations and rising unit costs call for caution. Investors who already hold this Zacks Rank #3 (Hold) stock may find it prudent to maintain their positions.You can see the complete list of today’s Zacks #1 Rank (Strong Buy) stocks here.
Want the latest recommendations from Zacks Investment Research? Today, you can download 7 Best Stocks for the Next 30 Days. Click to get this free report
Freeport-McMoRan Inc. (FCX) : Free Stock Analysis Report
BHP Group Limited Sponsored ADR (BHP) : Free Stock Analysis Report
Southern Copper Corporation (SCCO) : Free Stock Analysis Report
This article originally published on Zacks Investment Research (zacks.com).
VANCOUVER, BC / ACCESS Newswire / May 7, 2026 / Faraday Copper Corp. ("Faraday" or the "Company") (TSX:FDY) announces its financial results for the three months ended March 31, 2026.
Highlights Year to Date
-
Reported additional near-surface copper mineralization from eight drill holes at the American Eagle and Keel areas on March 24, 2026.
-
Closed a non-brokered private placement with participation by a Lundin Family Trust and BHP Group Limited ("BHP"), involving the issuance of 23,810,000 common shares at a price of $4.20 per share for aggregate gross proceeds of $100,002,000 on March 11, 2026.
-
Signed a letter of intent to acquire BHP's San Manuel property in Arizona on February 20, 2026, creating the potential for a multi-asset copper district in the USA (see news release dated February 20, 2026).
-
Reported near-surface copper mineralization from five drill holes in the American Eagle Area on January 22, 2026.
Upcoming Milestones
-
Drill results from the ongoing Phase IV drill program at the Copper Creek Project.
-
Signing definitive purchase agreements for BHP's San Manuel property in Arizona by the end of the third quarter of 2026.
Copper Creek Project Update
The project is a 100% owned, large copper deposit, located ~80 road kilometres ("km") northeast of Tucson, Arizona, and ~19 km northeast of San Manuel, Arizona. The resource area is ~3 km in length and is open in all directions. The property consists of ~80 square km of private land, patented and unpatented mining claims, and state prospecting permits. In addition, the Company controls ~26,000 acres of grazing leases which partially overlap with the claims and permits. The property is located within a historical mining district and a politically stable jurisdiction with extensive infrastructure including power, rail, roads, and access to skilled personnel.
The property is in the heart of the prolific southwestern porphyry copper region of North America at the projected intersection of a major northwest trending belt of copper deposits (Ray, Miami/Globe, Superior/Resolution, Johnson Camp) and a major east-northeast trending belt of deposits (San Manuel/Kalamazoo, Silver Bell, Lakeshore, Safford, Morenci).
The property hosts an early halo vein style porphyry copper deposit with high-grade, near-surface, breccia-hosted mineralization. Both mineralization types form the basis of the current Mineral Resource Estimate ("MRE") prepared in accordance with the Canadian Institute of Mining, Metallurgy and Petroleum standards. Copper is the primary commodity, with molybdenum, silver and gold present in varying amounts associated with both types of mineralization.
On May 3, 2023, the Company announced an updated MRE and Preliminary Economic Assessment ("PEA") for the project, with a technical report titled "Copper Creek Project NI 43-101 Technical Report and Preliminary Economic Assessment" filed on SEDAR+ on June 13, 2023.
With a total of over 260,000 m of recent and historical drilling and modest past production, significant exploration upside remains. There are over 320 known breccia occurrences mapped at the surface, of which less than 15% have been drill tested and only 17 are included in the 2023 MRE.
In the Phase II drill program, assay results confirmed the potential for gold to occur in economic concentrations in certain phases of the mineralization. Gold is not currently included in the 2023 MRE. A sampling program for potential gold inclusion in future technical studies was undertaken. The results from the Childs Aldwinkle and Copper Prince breccias, as well as the Keel underground zone, have been returned and released. The Company continues to evaluate other areas for potential inclusion of gold in future mineral resource updates.
Phase III drilling was completed in mid-April 2025 with 79 drill holes and 30,071 m of drilling. All results from the Phase III drilling have been released. The program's framework was based on historical work, knowledge from the geological and recently updated structural model, the results from the Phase I and Phase II drill programs, geophysical and airborne spectral data sets, and economic criteria defined in the 2023 PEA base case. The focus of drilling was on the near-surface mineralization in the American Eagle, Area 51 and Rum areas.
On June 30, 2025, the Company received approval of its Exploration Plan of Operations ("EPO") by the BLM. The BLM published the final environmental assessment, and finding of no significant impact and issued a related decision record approving the EPO. The EPO includes up to 67 drill pads located on Federal land:
-
48 drill pads in or near the American Eagle area and the southern portion of the Mammoth resource area;
-
10 drill pads in or near other existing resource areas at Old Reliable, Globe, Copper Prince and Copper Giant; and
-
9 drill pads that enable reconnaissance drilling on previously untested targets.
Phase IV drilling commenced on September 18, 2025, with a planned 40,000 m diamond drill program with the goal of building on the Company's previous drilling success. The program will focus on the American Eagle area as well as new targets, infill, geotechnical, infrastructure, and hydrological drilling:
-
~20,000 m focused on American Eagle near-surface mineralization;
-
~10,000 m targeting oxide mineralization to increase the potential of copper cathode production; and
-
~10,000 m for new discoveries in the Copper Creek district.
The Company has reported results from metallurgical programs focused on grind size optimization that demonstrated the viability of coarse particle flotation, gold recoveries in concentrate and test work on near surface oxide mineralization.
The Company is focusing on exploration at the property while continuing to advance technical studies, environmental data gathering, and stakeholder outreach.
Financial Results
|
Three months ended |
||||||||
| In Canadian dollars |
March 31, 2026 |
March 31, 2025 |
||||||
| Exploration and evaluation expenses |
$ |
10,220,794 |
$ |
6,484,508 |
||||
| General and administration |
$ |
871,811 |
$ |
681,672 |
||||
| Share-based compensation |
$ |
652,018 |
$ |
384,126 |
||||
| Net loss |
$ |
9,891,214 |
$ |
7,820,431 |
||||
| Basic and diluted loss per share |
$ |
0.04 |
$ |
0.04 |
||||
Note: The financial information in this table was selected from the Company's condensed interim consolidated financial statements for the three months ended March 31, 2026 and 2025 (the "Financial Statements"), which are available on SEDAR+ at www.sedarplus.ca and the Company's website www.faradaycopper.com.
Selected Financial Information
| In Canadian dollars |
March 31, 2026 |
December 31, 2025 |
||||||
| Cash and cash equivalents |
$ |
120,799,916 |
$ |
37,880,822 |
||||
| Property and equipment |
$ |
17,724,931 |
$ |
17,513,854 |
||||
| Resource properties |
$ |
5,197,517 |
$ |
5,197,517 |
||||
| Total assets |
$ |
169,930,873 |
$ |
61,495,286 |
||||
Note: The financial information in this table was selected from the Financial Statements, which are available on SEDAR+ at www.sedarplus.ca and the Company's website www.faradaycopper.com.
Cash Flow, Liquidity and Capital Resources
The Company is a resource exploration-stage company and does not generate any revenue and has been mainly relying on equity-based financing to fund its operations. As at March 31, 2026, the Company had cash and cash equivalents of $120,799,916 (December 31, 2025 – $37,880,822) and current assets less current liabilities of $131,939,454 (December 31, 2025 – $35,424,377). While the Company has sufficient capital resources to fund its operations for the next 12 months, it is an exploration-stage company and does not anticipate achieving positive cash flow from operations for the foreseeable future. Accordingly, the Company anticipates needing to raise additional capital to fund its long-term business objectives.
During the three months ended March 31, 2026, cash provided by operating activities was $1,818,073 (2025 – cash used in operating activities of $9,253,611), cash used in investing activities was $24,472,947 (2025 – $222,601), and cash provided by financing activities was $105,572,608 (2025 – $35,200). The Company continues to incur operating costs primarily related to exploration and evaluation expenses. During the three months ended March 31, 2026, the Company raised net proceeds of $99,702,608 (2025 – $nil) from the issuance of common shares in a non‑brokered private placement. In addition, the Company raised $4,385,000 (2025 – $35,200) from the exercise of stock options and $1,485,000 (2025 – $nil) from the exercise of warrants.
On July 29, 2025, the Company completed a private placement financing for net proceeds of $46,964,411, which included share issuance costs of $1,809,039. The Company intends to use the proceeds from the financing to advance the Copper Creek Project and for general working capital purposes.
On March 11, 2026, the Company completed a private placement financing for net proceeds of $99,702,608, which included share issuance costs of $299,392. The Company intends to use the proceeds from the financing to advance the Copper Creek Project, due diligence and integration costs related to the acquisition of San Manuel, and for general working capital purposes.
Qualified Persons
The scientific and technical information contained in this news release has been reviewed and approved by Faraday's VP Exploration, Dr. Thomas Bissig, P. Geo., and VP, Projects and Evaluations, Zach Allwright, P.Eng.,who are considered a Qualified Person under National Instrument 43-101 – Standards of Disclosure for Mineral Projects ("NI 43-101").
About Faraday Copper
Faraday Copper is an exploration company focused on advancing its flagship copper project in Arizona, U.S. The Copper Creek Project is one of the largest undeveloped copper projects in North America with significant district scale exploration potential. Faraday has entered into a non-binding letter of intent with a subsidiary of BHP Group for the proposed acquisition of BHP's San Manuel Property, adjacent to the Copper Creek Project. The Company is well-funded to deliver on its key milestones and benefits from a management team and board of directors with senior mining company experience and expertise. Faraday trades on the TSX under the symbol "FDY".
For additional information please contact:
Stacey Pavlova, CFAVice President, Investor Relations & CommunicationsFaraday Copper Corp.E-mail: info@faradaycopper.comWebsite: www.faradaycopper.com
Cautionary Note on Forward Looking Statements
Some of the statements in this news release, other than statements of historical fact, are "forward-looking statements" and are based on the opinions and estimates of management as of the date such statements are made and are necessarily based on estimates and assumptions that are inherently subject to known and unknown risks, uncertainties and other factors that may cause actual results, level of activity, performance or achievements of Faraday to be materially different from those expressed or implied by such forward-looking statements. Such forward-looking statements and forward-looking information specifically include, but are not limited to, statements regarding: the Company's planned and ongoing exploration and drilling activities at the Copper Creek Project, including the scope, timing and results of the Phase IV drill program; the exploration potential and future development of the Copper Creek Project; the Company's ability to advance technical studies, environmental data collection and stakeholder engagement; the proposed acquisition of BHP's San Manuel property, including the ability to enter into and complete definitive purchase agreements and the expected timing thereof; the anticipated use of proceeds from recent financings; the sufficiency of the Company's capital resources to fund planned activities over the next 12 months; and the Company's expectations regarding future financing requirements.
Although Faraday believes the expectations expressed in such forward-looking statements are based on reasonable assumptions, such statements should not be in any way construed as guarantees of future performance and actual results or developments may differ materially. Accordingly, readers should not place undue reliance on forward-looking statements or information.
Factors that could cause actual results to differ materially from those in forward-looking statements include without limitation: market prices for metals; the conclusions of detailed feasibility and technical analyses; lower than expected grades and quantities of resources; receipt of regulatory approval; receipt of shareholder approval; mining rates and recovery rates; significant capital requirements; price volatility in the spot and forward markets for commodities; fluctuations in rates of exchange; taxation; controls, regulations and political or economic developments in the countries in which Faraday does or may carry on business; the speculative nature of mineral exploration and development, competition; loss of key employees; rising costs of labour, supplies, fuel and equipment; actual results of current exploration or reclamation activities; accidents; labour disputes; defective title to mineral claims or property or contests over claims to mineral properties; unexpected delays and costs inherent to consulting and accommodating rights of Indigenous peoples and other groups; risks, uncertainties and unanticipated delays associated with obtaining and maintaining necessary licenses, permits and authorizations and complying with permitting requirements, including those associated with the Copper Creek property; and uncertainties with respect to any future acquisitions by Faraday. In addition, there are risks and hazards associated with the business of mineral exploration, development and mining, including environmental events and hazards, industrial accidents, unusual or unexpected formations, pressures, cave-ins, flooding and the risk of inadequate insurance or inability to obtain insurance to cover these risks as well as "Risk Factors" included in Faraday's disclosure documents filed on and available at www.sedarplus.ca.
This press release does not constitute an offer to sell or a solicitation of an offer to buy any securities in any jurisdiction to any person to whom it is unlawful to make such an offer or solicitation in such jurisdiction. This press release is not, and under no circumstances is to be construed as, a prospectus, an offering memorandum, an advertisement or a public offering of securities in Faraday in Canada, the United States or any other jurisdiction. No securities commission or similar authority in Canada or in the United States has reviewed or in any way passed upon this press release, and any representation to the contrary is an offence.
SOURCE: Faraday Copper Corp.
View the original press release on ACCESS Newswire
Dow Jones futures rose slightly early Thursday, along with S&P 500 futures and Nasdaq futures. Crude oil prices continued to slide on Iran deal hopes. Arm Holdings, Coherent and Albemarle were key earnings movers
The stock market rallied strongly Wednesday on Iran deal hopes and generally strong earnings. The S&P 500, Nasdaq and small-cap Russell 2000 all hit new highs.
Advanced Micro Devices soared on earnings, while Corning spiked on a big partnership with Nvidia. But there were some notable earnings losers, too.
TG Therapeutics bolted above a buy point on earnings. Rio Tinto, BHP Inc., ATI Inc. and Nvidia stock also moved above buy points.
Nvidia and Rio Tinto stock are on Leaderboard. AMD stock and ATI are on the IBD 50. Rio Tinto was Wednesday's IBD Stock Of The Day.
Dow Jones Futures Today
Dow Jones futures rose 0.2% vs. fair value. S&P 500 futures climbed 0.15% and Nasdaq-100 futures advanced 0.1%.
Crude oil futures fell 4% to nearly $91 a barrel. The U.S. is waiting for Iran's response to its latest peace plan.
The 10-year Treasury yield dipped to 4.33%.
Remember that overnight action in Dow futures and elsewhere doesn't necessarily translate into actual trading in the next regular stock market session.
Akamai, Iren Are Big Winners Late After AI-Led Market Retreat
Key Earnings
Arm Holdings, Coherent and Albemarle reported late Wednesday, along with AppLovin, Fortinet and many more.
ARM earnings beat but sales and sales guidance were just above consensus. The chip design firm initially jumped late but is sharply lower before Thursday's open. ARM stock surged 13.6% in Wednesday's session following strong results from fellow chipmaker AMD.
Coherent stock fell modestly after slightly beating views.
Albemarle earnings solidly beat. ALB stock jumped, signaling a move back toward a 206 cup-base buy point.
AppLovin stock rose slightly before the open while Fortinet soared on better-than-expected earnings, with both trying to recover from downturns.
Stock Market Rally
The stock market rally got a big boost from reports that a U.S.-Iran deal could be close. U.S. crude oil prices dived 7% to $95.08 a barrel, well below $100 but off early-Wednesday lows under $90. Generally positive earnings and other news also buoyed indexes.
The Dow Jones Industrial Average rose 1.4% in Wednesday's stock market trading. The S&P 500 index popped 1.5%, the Nasdaq composite jumped 2%, and the Russell 2000 gained 1.5%, all hitting new highs.
The Invesco S&P 500 Equal Weight ETF climbed 0.8%, briefly marking an all-time best intraday before backing off.
AMD stock spiked 18.6% on Wednesday's strong earnings and guidance. But Astera Labs reversed lower despite a beat-and-raise report, off 0.8% to just below a buy point. Lumentum Holdings sank 5.1%, Arista Networks dived 13.6%, and heavy construction firm Primoris crashed 50.1%.
Corning jumped 12% as Nvidia will help fund a massive expansion of the company's optical products capacity.
The 10-year Treasury yield fell six basis points to 4.35%.
ETFs
Among growth ETFs, the CapStone IBD 50 ETF stepped up 2.5%. The iShares Expanded Tech-Software Sector ETF fell 0.5%. The VanEck Vectors Semiconductor ETF surged 5.2%. Nvidia stock is the No. 1 holding in SMH, with AMD also a notable position and ARM also in the ETF.
ARK Innovation gained 3.9% and ARK Genomics ran 4.3% higher.
The SPDR S&P Metals & Mining ETF jumped 4.4%%. The Energy Select SPDR ETF tumbled 4.1%, while the Health Care Select Sector SPDR Fund rose a fraction. The Industrial Select Sector SPDR Fund advanced 2.6%. The Financial Select SPDR ETF climbed 0.5%.
Best Growth Stocks To Buy And Watch
Stocks In Buy Areas
Nvidia stock jumped 5.7% to 207.67, back above a 197.63 buy point from a cup base within a larger consolidation. NVDA has a 216.82 high-handle entry to the larger pattern, but broke the downtrend of that high handle Wednesday.
Rio Tinto gapped up 5% to 105.50, clearing a 101.33 cup-with-handle buy point. Base metal miner peer BHP stock leaped 6.4% to 84.33, topping a 81.26 entry from its own cup-with-handle base, according to MarketSurge. Both rallied with copper and other metal prices. Treasury yields and the U.S. dollar fell Wednesday.
ATI stock ran up 6.3% to 165.08, breaking the downtrend of a handle within a cup-with-handle base. The aerospace-exposed specialty metals play has a traditional buy point of 166.61.
TG Therapeutics stock surged 16.3% to 41.97, clearing a 38.38 early entry from a handle that was just a few cents too low to be proper. The year-long consolidation buy point is 46.48. Early Wednesday, TG Therapeutics missed earnings views on marketing and testing costs. But the biotech beat on revenue and guided up on full-year sales.
What To Do Now
The stock market rally continues to power ahead. Chip and AI stocks are still dominating, but some stocks from other sectors are showing strength too.
With the market running up for several days after pausing, the number of buying opportunities is slowing. But keep working on watchlists. Don't chase after extended stocks, and still be watchful for earnings. While there have been huge earnings winners, including AMD on Wednesday, the risk of big to huge losses is very real.
Read The Big Picture every day to stay in sync with the market direction and leading stocks and sectors.
Please follow Ed Carson on Threads at @edcarson1971 and X/Twitter at @IBD_ECarson for stock market updates and more.
YOU MAY ALSO LIKE:
Why This IBD Tool Simplifies The Search For Top Stocks
Want To Get Quick Profits And Avoid Big Losses? Try SwingTrader
IBD Digital: Unlock IBD's Premium Stock Lists, Tools And Analysis Today
Time The Market With IBD's ETF Market Strategy
How To Invest: Rules For When To Buy And Sell Stocks In Bull And Bear Markets
Average True Range: Your New Tool To Avoid Excessive Swings In Growth Stocks
Compass Minerals (CMP) came out with quarterly earnings of $0.63 per share, missing the Zacks Consensus Estimate of $0.66 per share. This compares to earnings of $0.63 per share a year ago. These figures are adjusted for non-recurring items.
This quarterly report represents an earnings surprise of -5.18%. A quarter ago, it was expected that this minerals producer would post earnings of $0.11 per share when it actually produced earnings of $0.43, delivering a surprise of +290.91%.
Over the last four quarters, the company has surpassed consensus EPS estimates just once.
Compass, which belongs to the Zacks Chemical – Diversified industry, posted revenues of $453.2 million for the quarter ended March 2026, surpassing the Zacks Consensus Estimate by 10.03%. This compares to year-ago revenues of $494.6 million. The company has topped consensus revenue estimates four times over the last four quarters.
The sustainability of the stock's immediate price movement based on the recently-released numbers and future earnings expectations will mostly depend on management's commentary on the earnings call.
Compass shares have added about 34.7% since the beginning of the year versus the S&P 500's gain of 6%.
What's Next for Compass?
While Compass has outperformed the market so far this year, the question that comes to investors' minds is: what's next for the stock?
There are no easy answers to this key question, but one reliable measure that can help investors address this is the company's earnings outlook. Not only does this include current consensus earnings expectations for the coming quarter(s), but also how these expectations have changed lately.
Empirical research shows a strong correlation between near-term stock movements and trends in earnings estimate revisions. Investors can track such revisions by themselves or rely on a tried-and-tested rating tool like the Zacks Rank, which has an impressive track record of harnessing the power of earnings estimate revisions.
Ahead of this earnings release, the estimate revisions trend for Compass was mixed. While the magnitude and direction of estimate revisions could change following the company's just-released earnings report, the current status translates into a Zacks Rank #3 (Hold) for the stock. So, the shares are expected to perform in line with the market in the near future. You can see the complete list of today's Zacks #1 Rank (Strong Buy) stocks here.
It will be interesting to see how estimates for the coming quarters and the current fiscal year change in the days ahead. The current consensus EPS estimate is -$0.03 on $203.86 million in revenues for the coming quarter and $0.89 on $1.23 billion in revenues for the current fiscal year.
Investors should be mindful of the fact that the outlook for the industry can have a material impact on the performance of the stock as well. In terms of the Zacks Industry Rank, Chemical – Diversified is currently in the bottom 39% of the 250 plus Zacks industries. Our research shows that the top 50% of the Zacks-ranked industries outperform the bottom 50% by a factor of more than 2 to 1.
Another stock from the same industry, Olin (OLN), has yet to report results for the quarter ended March 2026. The results are expected to be released on May 7.
This chlor-alkali and ammunition producer' is expected to post quarterly loss of $0.67 per share in its upcoming report, which represents a year-over-year change of -1775%. The consensus EPS estimate for the quarter has been revised 88.6% higher over the last 30 days to the current level.
Olin's revenues are expected to be $1.57 billion, down 4.8% from the year-ago quarter.
Want the latest recommendations from Zacks Investment Research? Today, you can download 7 Best Stocks for the Next 30 Days. Click to get this free report
Compass Minerals International, Inc. (CMP) : Free Stock Analysis Report
Olin Corporation (OLN) : Free Stock Analysis Report
This article originally published on Zacks Investment Research (zacks.com).
Never miss an important update on your stock portfolio and cut through the noise. Over 7 million investors trust Simply Wall St to stay informed where it matters for FREE.
BHP Group's A$ fair value estimate has shifted from A$52.50 to A$53.40, giving you an updated anchor for how analysts are framing the stock today. That modest move lines up with recent Street research, where some firms have lifted price targets in A$, US$ and GBp while others remain cautious and hold to Neutral, Sell or Market Perform calls. As you read on, you will see how these changing targets fit into the broader analyst story and what signals to watch next.
What Wall Street Has Been Saying 🐂 Bullish Takeaways
- Argus has taken one of the more optimistic stances, lifting its US$ price target to $90 from $68 and pointing to what it describes as supportive long term fundamentals for BHP Group.
- Barclays, Citi and Berenberg have all raised their GBp targets through early 2026, which signals that several firms see room for the stock to better reflect their updated valuation work.
- Berenberg moved from an earlier Sell view to an upgrade in April 2026, suggesting that, in its view, execution and positioning now better support the stock than before.
🐻 Bearish Takeaways
- Bernstein trimmed its US$ target to $48 from $49.50 and kept a Market Perform rating, stressing that commodity mix and valuation remain central to its more measured stance.
- Several banks, including JPMorgan, Citi and Deutsche Bank, continue to sit at Neutral or Hold, reflecting caution around how BHP Group converts its asset base into growth and returns at current pricing.
Do your thoughts align with the Bull or Bear Analysts? Perhaps you think there's more to the story. Head to the Simply Wall St Community to discover more perspectives!
ASX:BHP 1-Year Stock Price Chart
We've flagged 1 risk for BHP Group. See which could impact your investment.
What's in the News
- BHP entered an agreement with China Mineral Resources Group, indicating closer engagement with a major Chinese counterparty on iron ore supply and pricing terms.
- BHP reported March quarter production of 476.8 kt of copper, 62.8 Mt of iron ore, 3.8 Mt of steelmaking coal and 4.0 Mt of energy coal, along with year to date volumes across these commodities.
- BHP completed a long term silver streaming agreement with Wheaton Precious Metals International for its share of silver output from the Antamina mine in Peru, receiving upfront consideration of US$4.3b in exchange for a portion of future silver production.
- BHP's Board announced that Brandon Craig will become CEO on 1 July 2026, succeeding Mike Henry, and the company declared an interim dividend of US$0.73 per share for the six months ended 31 December 2025.
How This Changes the Fair Value For BHP Group
- Fair value in A$ has moved from A$52.50 to A$53.40.
- Assumed $ revenue growth has shifted from 1.07% to 1.15%.
- Assumed net profit margin has adjusted from 23.84% to 23.50%.
- The future P/E multiple has changed from 18.41x to 19.05x.
- The discount rate has remained unchanged at 8.56%.
Never Miss an Update: Follow The Narrative
Narratives connect BHP Group's business story to analyst forecasts and fair value estimates, updating as new data, news and projections come through. They give you a single place to see how the thesis is evolving over time.
Head over to the Simply Wall St Community and follow the Narrative on BHP Group to stay up to date on:
- How copper and potash projects are tied to decarbonization and electrification trends, and what that could mean for future demand for BHP Group's output.
- The role of long life, low cost assets and disciplined capital spending in supporting earnings resilience and BHP Group's capacity for shareholder returns.
- Key risks around iron ore concentration, project execution, regulation, inflation and ESG pressures that could affect margins and long term profitability.
This article by Simply Wall St is general in nature. We provide commentary based on historical data
and analyst forecasts only using an unbiased methodology and our articles are not intended to be financial advice. It does not constitute a recommendation to buy or sell any stock, and does not take account of your objectives, or your
financial situation. We aim to bring you long-term focused analysis driven by fundamental data.
Note that our analysis may not factor in the latest price-sensitive company announcements or qualitative material.
Simply Wall St has no position in any stocks mentioned.
Companies discussed in this article include BHP.AX.
Have feedback on this article? Concerned about the content? Get in touch with us directly. Alternatively, email editorial-team@simplywallst.com
European equities traded in the US as American depositary receipts were tracking higher late Wednesday morning, rising 1.98% to 1,843.18 on the S&P Europe Select ADR Index.
From continental Europe, the gainers were led by accommodations booking company trivago (TRVG) and lender ING Group (ING), which advanced 14% and 5% respectively. They were followed by biopharmaceutical company Cellectis (CLLS) and lender Banco Santander (SAN), which climbed 4.8% and 4.2% respectively.
The decliners from continental Europe were led by internet advertising firm Criteo (CRTO) and petroleum refiner Equinor (EQNR), which shed 18% and 8.4% respectively. They were followed by semiconductor company Sequans Communications (SQNS) and oil and gas company Eni (E), which dropped 5.8% and 4.5% respectively.
The gainers from the UK were led by biopharmaceutical company Akari Therapeutics (AKTX) and insurance company Prudential (PUK), which rose 9.4% and 6.2% respectively. They were followed by mining company BHP Group (BHP) and lender Barclays (BCS), which were up 5.3% and 5.2% respectively.
The decliners from the UK and Ireland were led by biopharmaceutical companies Mereo BioPharma Group (MREO) and NuCana (NCNA), which fell 5.1% and 4% respectively. They were followed by oil and gas companies BP (BP) and Shell (SHEL), which lost 3.7% and 2.7% respectively.
OVERLAND PARK, Kan., May 06, 2026–(BUSINESS WIRE)–Compass Minerals (NYSE: CMP), a leading global provider of essential minerals, today reported fiscal 2026 second-quarter results. The company also announced that unionized employees at its Goderich mine have ratified a new three-year collective bargaining agreement.
Unless otherwise noted, it should be assumed that time periods referenced below are on a fiscal-year basis and financial amounts are in U.S. dollars.
MANAGEMENT COMMENTARY
"Consistent with our Back-to-Basics framework, during the quarter we took a significant step in strengthening our balance sheet by retiring the remaining $150 million of senior unsecured notes due in 2027 and removing our nearest debt maturity," said Edward C. Dowling Jr., president and CEO. "We had a strong winter across much of North America, and our Salt platform delivered on a high level of sales commitments while continuing to realize pricing gains. Our Plant Nutrition segment delivered another strong quarter at Ogden, with meaningful year-over-year improvement in cost performance and margins. Total company adjusted EBITDA for the quarter was $86.4 million, bringing us to $151.7 million for the first half of the year and on track to achieve our full-year outlook. We increased our Plant Nutrition guidance to reflect the strong results we continue to see in that operation, including higher expected sales volumes, better pricing and lower costs. We decreased our Salt guidance to reflect the differences in regional and product sales mix relative to forecast. Additionally, while we are seeing improvements in mine-level product costs, we have not yet achieved the level of production and efficiency gains in our mining operations that we had expected earlier in the year.
"Goderich mine is important for Compass Minerals, and I am pleased that we reached a new three-year agreement with the represented workforce. We believe we have struck a mutually beneficial arrangement that allows us to continue building upon the safe and reliable operations while allowing us to take steps to improve the mine's efficiency and flexibility.
"The hard work being done across the company is beginning to bear fruit. Some of this is manifesting itself currently in our financial results, while other initiatives will take a little more time. We know what we need to do and we are heading in the right direction, but there is more work to be done. We remain focused on reducing debt, improving our operations in all areas of the company, and building long-term value for shareholders."
QUARTERLY HIGHLIGHTS
- Net income of $12.7 million for the second quarter of 2026, compared to a net loss of $32.0 million in the prior year;
- Total company adjusted EBITDA for the second quarter of 2026 of $86.4 million, up 3% year over year;
- Operating earnings and adjusted EBITDA margins within the Salt business improved year over year; absolute operating earnings and adjusted EBITDA both declined 3% between comparative periods, driven principally by lower highway deicing sales volume;
- Continued improvements in pricing and cost structure increased Plant Nutrition segment operating earnings and adjusted EBITDA on both absolute and per-ton bases;
- Total debt declined 12% year over year to $713.0 million as March 31, 2026, while net debt decreased $119.2 million, or 16%, to $638.9 million over the same period; and
- Mid-point of full-year 2026 guidance for total company adjusted EBITDA maintained within modified range of $212 million to $236 million, reflecting stronger-than-expected results in the Plant Nutrition segment and adjustments related to changes in sales mix and operational matters in the Salt segment.
QUARTERLY FINANCIAL RESULTS
|
(in millions, except per share data) |
|
Three Months Ended Mar. 31, |
|
Six Months Ended Mar. 31, |
||||||||||||
|
|
2026 |
|
2025 |
|
2026 |
|
2025 |
|||||||||
|
GAAP Results: |
|
|
|
|
|
|
|
|
||||||||
|
Revenue |
|
$ |
453.2 |
|
$ |
494.6 |
|
|
$ |
849.3 |
|
$ |
801.8 |
|
||
|
Operating income (loss) |
|
|
56.0 |
|
|
|
(3.1 |
) |
|
|
92.6 |
|
|
|
(2.6 |
) |
|
Net income (loss) |
|
|
12.7 |
|
|
|
(32.0 |
) |
|
|
31.3 |
|
|
|
(55.6 |
) |
|
Net income (loss) per diluted share |
|
|
0.30 |
|
|
|
(0.77 |
) |
|
|
0.73 |
|
|
|
(1.34 |
) |
|
Non-GAAP Results*: |
|
|
|
|
|
|
|
|
||||||||
|
Adjusted operating income* |
|
|
56.0 |
|
|
|
54.8 |
|
|
|
92.6 |
|
|
|
56.2 |
|
|
Adjusted EBITDA* |
|
|
86.4 |
|
|
|
84.1 |
|
|
|
151.7 |
|
|
|
116.2 |
|
|
Adjusted net income (loss)* |
|
|
27.3 |
|
|
|
25.7 |
|
|
|
45.9 |
|
|
|
2.8 |
|
|
Adjusted net income (loss)* per diluted share |
|
|
0.63 |
|
|
|
0.63 |
|
|
|
1.06 |
|
|
|
0.07 |
|
|
*Non-GAAP financial measure. Reconciliations to the most directly comparable GAAP financial measure are provided in tables at the end of this press release. |
||||||||||||||||
SALT BUSINESS RECAP
Salt revenue for the second quarter decreased 12% year over year to $382.6 million, as a result of 22% lower sales volumes in highway deicing and flat consumer and industrial (C&I) volumes. Highway deicing sales tons made up 87% of total salt sales for the quarter, compared to 90% of prior year's sales volumes. Salt segment pricing increased 10% year over year, with highway deicing pricing up 10% and C&I sales prices down of 3%, respectively, year over year.
Salt segment operating earnings for the quarter decreased by 3% to $65.2 million from the prior-year period. Adjusted EBITDA decreased to $83.2 million, down 3% from the prior-year period. These financial results reflect lower sales volumes between the periods and the pricing dynamics described above, offset by higher per-unit production costs and distribution costs year over year.
For the first half of the year, Salt revenue increased 6% year over year to $714.1 million. Highway deicing revenue increased 6% from the comparable prior year period, driven by 8% higher pricing offset by a 2% decrease in sales volumes. C&I revenue for the same period also increased 6%, driven by a 7% increase in sales volumes offset by a 1% decrease in pricing.
In the first half of 2026, Salt segment operating earnings for the quarter increased by 19% to $114.3 million compared to the first half of 2025. For the same period, adjusted EBITDA increased 13% to $150.4 million. These results reflect the stronger deicing season experienced in 2025/2026 in the company's served markets, which drove higher sales volumes between the periods, and improved pricing. Stronger sales were partially offset by higher per-unit production costs and distribution costs year over year. The regional mix of sales volumes impacted cost comparability between periods due to different cost structures across the company's production facilities and storage depots.
PLANT NUTRITION BUSINESS RECAP
Plant Nutrition revenue for the quarter totaled $67.0 million, up 15% year over year on 4% stronger sales volume over the same period. The average segment sales price for the quarter was up 10% year over year to approximately $690 per ton.
Operating earnings in the Plant Nutrition segment were $7.6 million for the quarter, compared to an operating loss of $1.8 million in the prior-year quarter. Adjusted EBITDA improved to $16.9 million versus $5.6 million last year. These financial results reflect higher sales volumes and higher average sales prices. Both product costs and distribution costs were down on a per-unit basis year over year.
The Company completed the sale of its sulfate of potash (SOP) business in Wynyard, Saskatchewan, Canada, on March 1, 2026, for total consideration of $30.8 million prior to customary closing adjustments, $3.9 million of which was placed in escrow. Compass Minerals recognized a non-cash loss on the sale of $14.6 million, including $13.1 million of cumulative foreign currency translation adjustments reclassified from accumulated other comprehensive loss.
CASH FLOW AND FINANCIAL POSITION
Net cash provided by operating activities amounted to $160.4 million for the six months ended March 31, 2026, compared to $182.8 million in the prior year. Changes in working capital reflect the settlement of the previously disclosed tax dispute in Ontario during the first quarter of 2026.
Net cash used in investing activities was $18.6 million for the six months ended March 31, 2026, a decrease from $35.9 million used in the prior year. Total capital spending for the six months ended March 31, 2026, was $41.0 million compared to $35.8 million in 2025. The company received $23.2 million of cash proceeds, net of amounts held in escrow and customary closing adjustments related to the aforementioned sale of the Wynyard SOP business.
Net cash used in financing activities was $127.3 million for the six months ended March 31, 2026, which included net payments of $120.8 million, inclusive of the redemption of the $150 million in 2027 Senior Unsecured Notes in March of 2026. In the prior year, net cash used in financing activities was $116.8 million and reflected net payments of $109.8 million in the period.
The company ended the quarter with $378.9 million of liquidity, comprised of $74.1 million in cash and cash equivalents and $304.8 million of availability under its $325.0 million revolving credit facility.
Total debt as of March 31, 2026, was $713.0 million compared to $807.6 million a year earlier. Net debt was $638.9 million at the end of the second quarter of 2026, down $119.2 million from $758.1 million at the end of the comparable prior year period. The net leverage ratio for the quarter ended March 31, 2026, was 2.7 times, down from 4.6 times for the comparable prior year period.
UPDATED OPERATING AND FISCAL 2026 OUTLOOK
Based on stronger-than-expected results in the Plant Nutrition segment and adjustments related to changes in sales mix and operational matters in the Salt segment, Compass Minerals is updating its previously issued full-year fiscal 2026 outlook as follows:
|
Salt Segment |
|||
|
|
2026 |
||
|
|
Previous Guidance |
|
Current Guidance |
|
Highway deicing sales volumes (thousands of tons) |
8,200 – 8,500 |
|
8,450 – 8,800 |
|
Consumer and industrial sales volumes (thousands of tons) |
1,700 – 1,950 |
|
1,900 – 2,000 |
|
Total salt sales volumes (thousands of tons) |
9,900 – 10,450 |
|
10,350 – 10,800 |
|
|
|
|
|
|
Revenue (in millions) |
$980 – $1,050 |
|
$1,025 – $1,080 |
|
Adjusted EBITDA (in millions) |
$230 – $252 |
|
$225 – $240 |
|
Plant Nutrition Segment1 |
|||
|
|
2026 |
||
|
|
Previous Guidance |
|
Current Guidance |
|
Sales volumes (thousands of tons) |
255 – 275 |
|
280 – 300 |
|
Revenue (in millions) |
$170 – $185 |
|
$190 – $210 |
|
Adjusted EBITDA (in millions) |
$34 – $ 39 |
|
$43 – $ 47 |
|
1) Reflects the impact of the sale of the Wynyard SOP business. |
|||
|
Corporate & Other |
|||
|
|
2026 |
||
|
|
Previous Guidance |
|
Current Guidance |
|
Adj. EBITDA (in millions) |
($56) – ($51) |
|
($56) – ($51) |
Projected Corporate and Other results shown in the table above include corporate expenses in support of our core businesses and the results of DeepStore, the company's records management business in the U.K.
|
Total Compass Minerals |
|||||||
|
|
Current 2026 Adjusted EBITDA Guidance |
||||||
|
|
Salt |
|
Plant Nutrition |
|
Corporate |
|
Total |
|
Adjusted EBITDA (in millions) |
$225 – $240 |
|
$43 – $47 |
|
($56) – ($51) |
|
$212 – $236 |
|
|
|
|
|
|
|
|
|
|
|
2026 Capital Expenditures |
||||||
|
|
|
|
|
|
|
|
Total |
|
Capital expenditures (in millions) |
|
|
|
|
|
|
$90 – $110 |
|
Other Financial Assumptions |
|||
|
|
2026 |
||
|
($ in millions) |
Previous Guidance |
|
Current Guidance |
|
Depreciation, depletion and amortization |
$105 – $115 |
|
$105 – $115 |
|
Interest expense, net |
$65 – $70 |
|
$62 – $67 |
|
Effective income tax rate (excl. valuation allowance) |
30% – 34% |
|
30% – 34% |
Guidance for the 2026 effective income tax rate reflects the income mix by country with income recognized in foreign jurisdictions offset by losses recognized in the U.S.
CONFERENCE CALL
Compass Minerals will discuss its results on a conference call tomorrow morning, Thursday, May 7, at 9:30 a.m. ET (8:30 a.m. CT). To access the conference call, please visit the company’s website at investors.compassminerals.com or dial 800-715-9871. Callers must provide the conference ID number 7896827. Outside of the U.S. and Canada, callers may dial 646-307-1963. Replays of the call will be available on the company’s website.
A supporting company presentation supporting 2026 second-quarter results is available at investors.compassminerals.com.
About Compass Minerals
Compass Minerals (NYSE: CMP) is a leading global provider of essential minerals focused on safely delivering where and when it matters to help solve nature’s challenges for customers and communities. The company’s salt products help keep roadways safe during winter weather and are used in numerous other consumer, industrial, chemical and agricultural applications. Its plant nutrition products help improve the quality and yield of crops while supporting sustainable agriculture. Compass Minerals operates 11 production and packaging facilities with more than 1,800 employees throughout the U.S., Canada and the U.K. Visit compassminerals.com for more information about the company and its products.
Forward-Looking Statements and Other Disclaimers
This press release may contain forward-looking statements, including, without limitation, statements about future costs, production, mutual benefits of our arrangement with the workforce at Goderich, debt reduction, shareholder value, and the company's outlook for 2026, including its expectations regarding sales volumes, revenue, Adjusted EBITDA, depreciation, depletion, and amortization, interest expense, tax rates, and capital expenditures. Forward-looking statements are those that predict or describe future events or trends and that do not relate solely to historical matters. The company uses words such as "may," "would," "could," "should," "will," "likely," "expect," "anticipate," "believe," "intend," "plan," "forecast," "outlook," "project," "estimate" and similar expressions suggesting future outcomes or events to identify forward-looking statements or forward-looking information. These statements are based on the company’s current expectations and involve risks and uncertainties that could cause the company’s actual results to differ materially. The differences could be caused by a number of factors, including without limitation (i) weather conditions, (ii) inflation, the cost and availability of transportation for the distribution of the company’s products and foreign exchange rates, (iii) pressure on prices and impact from competitive products, and (iv) any inability by the company to successfully implement its strategic priorities or its cost-saving or enterprise optimization initiatives. For further information on these and other risks and uncertainties that may affect the company’s business, see the "Risk Factors" and "Management’s Discussion and Analysis of Financial Condition and Results of Operations" sections of the company’s Annual Report on Form 10-K for the period ended Sept. 30, 2025, and its Quarterly Reports on Form 10-Q for the quarter ended Mar. 31, 2026, filed or to be filed with the SEC, as well as the company's other SEC filings. The company undertakes no obligation to update any forward-looking statements made in this press release to reflect future events or developments, except as required by law. Because it is not possible to predict or identify all such factors, this list cannot be considered a complete set of all potential risks or uncertainties.
Non-GAAP Measures
In addition to using U.S. generally accepted accounting principles ("GAAP") financial measures, management uses a variety of non-GAAP financial measures described below to evaluate the company’s and its operating segments’ performance. While the consolidated financial statements provide an understanding of the company’s overall results of operations, financial condition and cash flows, management analyzes components of the consolidated financial statements to identify certain trends and evaluate specific performance areas.
Management uses EBITDA, EBITDA adjusted for items which management believes are not indicative of the company’s ongoing operating performance ("Adjusted EBITDA") and EBITDA margin to evaluate the operating performance of the company’s core business operations because its resource allocation, financing methods and cost of capital, and income tax positions are managed at a corporate level, apart from the activities of the operating segments, and the operating facilities are located in different taxing jurisdictions, which can cause considerable variation in net earnings. Management also uses adjusted operating earnings, adjusted operating margin, adjusted net earnings, and adjusted net earnings per diluted share, which eliminate the impact of certain items that management does not consider indicative of underlying operating performance. The presentation of these measures should not be construed as an inference that future results will be unaffected by unusual or non-recurring items. Management believes these non-GAAP financial measures provide management and investors with additional information that is helpful when evaluating underlying performance. EBITDA and Adjusted EBITDA exclude interest expense, income taxes and depreciation, depletion and amortization, each of which is an essential element of the company’s cost structure and cannot be eliminated. In addition, Adjusted EBITDA and Adjusted EBITDA margin exclude certain cash and non-cash items, including stock-based compensation, impairment charges and certain restructuring charges. Consequently, any measure that excludes these elements has material limitations. The non-GAAP financial measures used by management should not be considered in isolation or as a substitute for net earnings, operating earnings, cash flows or other financial data prepared in accordance with GAAP or as a measure of overall profitability or liquidity. These measures are not necessarily comparable to similarly titled measures of other companies due to potential inconsistencies in the method of calculation. The calculation of non-GAAP financial measures as used by management is set forth in the following tables. All margin numbers are defined as the relevant measure divided by sales. The company does not provide a reconciliation of forward-looking non-GAAP financial measures to the most directly comparable financial measures calculated and reported in accordance with GAAP, as the company is unable to estimate significant non-recurring, unusual items and/or distinct non-core initiatives without unreasonable effort. The amounts and timing of these items are uncertain and could be material to the company’s results.
Adjusted operating earnings, adjusted operating margin, adjusted net earnings (loss), adjusted net earnings (loss) per diluted share, net debt and net leverage ratio are presented as supplemental measures of the company’s performance. Management believes these measures provide management and investors with additional information that is helpful when evaluating underlying performance and comparing results on a year-over-year normalized basis. These measures eliminate the impact of certain items that management does not consider indicative of underlying operating performance. These adjustments are itemized below. Adjusted net earnings (loss) per diluted share is adjusted net earnings (loss) divided by weighted average diluted shares outstanding. Net debt is calculated as current and long-term debt minus cash and cash equivalents used to evaluate our financial position. Management defines net leverage ratio as net debt divided by Adjusted EBITDA for the previous twelve-month period ("last twelve months," or "LTM"). You are encouraged to evaluate the adjustments itemized above and the reasons management considers them appropriate for supplemental analysis. In evaluating these measures you should be aware that in the future the company may incur expenses that are the same as or similar to some of the adjustments presented below.
|
Special Items Impacting the Three Months Ended Mar. 31, 2025 (unaudited, in millions, except per share data) |
||||||||||||||||||||
|
Item Description |
|
Segment |
|
Line Item |
|
Amount |
|
Tax Effect(1) |
|
After Tax |
|
EPS Impact |
||||||||
|
Product recall costs(1) |
|
Salt |
|
Product cost and Other operating expense |
|
$ |
0.9 |
|
$ |
(0.2 |
) |
|
$ |
0.7 |
|
$ |
0.02 |
|||
|
Restructuring charges(2) |
|
Salt |
|
Other operating income |
|
|
0.3 |
|
|
|
— |
|
|
|
0.3 |
|
|
|
0.01 |
|
|
Restructuring charges(2) |
|
Corporate and Other |
|
Other operating income |
|
|
3.7 |
|
|
|
— |
|
|
|
3.7 |
|
|
|
0.09 |
|
|
Impairments(3) |
|
Corporate and Other |
|
Loss on impairments |
|
|
53.0 |
|
|
|
— |
|
|
|
53.0 |
|
|
|
1.28 |
|
|
Total |
|
|
|
|
|
$ |
57.9 |
|
|
$ |
(0.2 |
) |
|
$ |
57.7 |
|
|
$ |
1.40 |
|
|
Special Items Impacting the Six Months Ended Mar. 31, 2025 (unaudited, in millions, except per share data) |
||||||||||||||||||||
|
Item Description |
|
Segment |
|
Line Item |
|
Amount |
|
Tax Effect(1) |
|
After Tax |
|
EPS Impact |
||||||||
|
Product recall costs(1) |
|
Salt |
|
Product cost and Other operating income |
|
$ |
1.8 |
|
$ |
(0.4 |
) |
|
$ |
1.4 |
|
$ |
0.03 |
|||
|
Restructuring charges(2) |
|
Salt |
|
Other operating income |
|
|
0.3 |
|
|
|
— |
|
|
|
0.3 |
|
|
|
0.01 |
|
|
Restructuring charges(2) |
|
Corporate and Other |
|
Other operating income |
|
|
3.7 |
|
|
|
— |
|
|
|
3.7 |
|
|
|
0.09 |
|
|
Impairments(3) |
|
Corporate and Other |
|
Loss on impairments |
|
|
53.0 |
|
|
|
— |
|
|
|
53.0 |
|
|
|
1.28 |
|
|
Total |
|
|
|
|
|
$ |
58.8 |
|
|
$ |
(0.4 |
) |
|
$ |
58.4 |
|
|
$ |
1.41 |
|
|
(1) |
The Company recorded costs related to a recall of food-grade salt produced at its Goderich plant. Charges for the three and six months ended March 31, 2025, were $0.9 million and $1.8 million, respectively. |
|
|
(2) |
The Company incurred severance and related charges of $4.0 million, due to a reduction in workforce, changes to executive leadership and additional restructuring costs related to the exit of the Fortress fire retardant business, during the three and six months ended March 31, 2025. |
|
|
(3) |
For the three and six months ended March 31, 2025, the Company recorded a loss on impairments of $53.0 million, related to intangible assets due to the exit of the Fortress fire retardant business. |
|
Reconciliation for Adjusted Operating Income (unaudited, in millions) |
||||||||||||||||
|
|
|
Three Months Ended Mar. 31, |
|
Six Months Ended Mar. 31, |
||||||||||||
|
|
|
2026 |
|
2025 |
|
2026 |
|
2025 |
||||||||
|
Operating income (loss) |
|
$ |
56.0 |
|
|
$ |
(3.1 |
) |
|
$ |
92.6 |
|
|
$ |
(2.6 |
) |
|
Product recall costs(1) |
|
|
— |
|
|
|
0.9 |
|
|
|
— |
|
|
|
1.8 |
|
|
Restructuring charges(2) |
|
|
— |
|
|
|
4.0 |
|
|
|
— |
|
|
|
4.0 |
|
|
Loss on impairments(3) |
|
|
— |
|
|
|
53.0 |
|
|
|
— |
|
|
|
53.0 |
|
|
Adjusted operating income |
|
$ |
56.0 |
|
|
$ |
54.8 |
|
|
$ |
92.6 |
|
|
$ |
56.2 |
|
|
Sales |
|
|
453.2 |
|
|
|
494.6 |
|
|
|
849.3 |
|
|
|
801.8 |
|
|
Operating margin |
|
|
12.4 |
% |
|
|
(0.6 |
)% |
|
|
10.9 |
% |
|
|
(0.3 |
)% |
|
Adjusted operating margin |
|
|
12.4 |
% |
|
|
11.1 |
% |
|
|
10.9 |
% |
|
|
7.0 |
% |
|
(1) |
The Company recorded costs related to a recall of food-grade salt produced at its Goderich plant. Charges for the three and six months ended March 31, 2025, were $0.9 million and $1.8 million, respectively. |
|
|
(2) |
The Company incurred severance and related charges of $4.0 million, due to a reduction in workforce, changes to executive leadership and additional restructuring costs related to the exit of the Fortress fire retardant business, during the three and six months ended March 31, 2025. |
|
|
(3) |
For the three and six months ended March 31, 2025, the Company recorded a loss on impairments of $53.0 million, related to intangible assets due to the exit of the Fortress fire retardant business. |
|
Reconciliation for Adjusted Net Income (unaudited, in millions) |
||||||||||||||||
|
|
|
Three Months Ended Mar. 31, |
|
Six Months Ended Mar. 31, |
||||||||||||
|
|
|
2026 |
|
2025 |
|
2026 |
|
2025 |
||||||||
|
Net income (loss) |
|
$ |
12.7 |
|
$ |
(32.0 |
) |
|
$ |
31.3 |
|
$ |
(55.6 |
) |
||
|
Loss on sale of business, net(1) |
|
|
14.6 |
|
|
|
— |
|
|
|
14.6 |
|
|
|
— |
|
|
Product recall costs(2) |
|
|
— |
|
|
|
0.9 |
|
|
|
— |
|
|
|
1.8 |
|
|
Restructuring charges(3) |
|
|
— |
|
|
|
4.0 |
|
|
|
— |
|
|
|
4.0 |
|
|
Loss on impairments(4) |
|
|
— |
|
|
|
53.0 |
|
|
|
— |
|
|
|
53.0 |
|
|
Income tax effect |
|
|
— |
|
|
|
(0.2 |
) |
|
$ |
— |
|
|
|
(0.4 |
) |
|
Adjusted net income |
|
$ |
27.3 |
|
|
$ |
25.7 |
|
|
$ |
45.9 |
|
|
$ |
2.8 |
|
|
|
|
|
|
|
|
|
|
|
||||||||
|
Net income (loss) per diluted share |
|
$ |
0.30 |
|
|
$ |
(0.77 |
) |
|
$ |
0.73 |
|
|
$ |
(1.34 |
) |
|
Adjusted net income per diluted share |
|
$ |
0.63 |
|
|
$ |
0.63 |
|
|
$ |
1.06 |
|
|
$ |
0.07 |
|
|
Weighted-average common shares outstanding (in thousands): |
|
|
|
|
|
|
|
|
||||||||
|
Diluted |
|
|
42,357 |
|
|
|
41,521 |
|
|
|
42,297 |
|
|
|
41,480 |
|
|
(1) |
For the three and six months ended March 31, 2026, the Company recorded a loss on sale of the Wynyard business of $14.6 million, which included a $13.1 million recognition of cumulative foreign currency translation adjustments reclassified from Accumulated other comprehensive loss. |
|
|
(2) |
The Company recorded costs related to a recall of food-grade salt produced at its Goderich plant. Charges for the three and six months ended March 31, 2025, were $0.9 million and $1.8 million, respectively. |
|
|
(3) |
The Company incurred severance and related charges of $4.0 million, due to a reduction in workforce, changes to executive leadership and additional restructuring costs related to the exit of the Fortress fire retardant business, during the three and six months ended March 31, 2025. |
|
|
(4) |
For the three and six months ended March 31, 2025, the Company recorded a loss on impairments of $53.0 million, related to intangible assets due to the exit of the Fortress fire retardant business. |
|
Reconciliation for EBITDA and Adjusted EBITDA (unaudited, in millions) |
||||||||||||||||||||||||||||||||||||||||||||
|
|
|
Three Months Ended Mar. 31, |
|
Six Months Ended Mar. 31, |
||||||||||||||||||||||||||||||||||||||||
|
|
|
2026 |
|
2025 |
|
2026 |
|
2025 |
||||||||||||||||||||||||||||||||||||
|
Net income (loss) |
|
$ |
12.7 |
|
|
$ |
(32.0 |
) |
|
$ |
31.3 |
|
|
$ |
(55.6 |
) |
||||||||||||||||||||||||||||
|
Interest expense |
|
|
17.9 |
|
|
|
18.0 |
|
|
|
36.0 |
|
|
|
34.9 |
|
||||||||||||||||||||||||||||
|
Income tax expense |
|
|
16.0 |
|
|
|
9.8 |
|
|
|
13.8 |
|
|
|
19.5 |
|
||||||||||||||||||||||||||||
|
Depreciation, depletion and amortization |
|
|
28.2 |
|
|
|
26.5 |
|
|
|
54.6 |
|
|
|
53.3 |
|
||||||||||||||||||||||||||||
|
EBITDA |
|
|
74.8 |
|
|
|
22.3 |
|
|
|
135.7 |
|
|
|
52.1 |
|
||||||||||||||||||||||||||||
|
Adjustments to EBITDA: |
|
|
|
|
|
|
|
|
||||||||||||||||||||||||||||||||||||
|
Stock-based compensation – non-cash |
|
|
2.2 |
|
|
|
2.8 |
|
|
|
4.5 |
|
|
|
6.7 |
|
||||||||||||||||||||||||||||
|
Interest income |
|
|
(0.6 |
) |
|
|
(0.2 |
) |
|
|
(0.9 |
) |
|
|
(0.6 |
) |
||||||||||||||||||||||||||||
|
Gain on foreign exchange, net |
|
|
(5.6 |
) |
|
|
(0.1 |
) |
|
|
(3.5 |
) |
|
|
(5.3 |
) |
||||||||||||||||||||||||||||
|
Loss on sale of business, net(1) |
|
|
14.6 |
|
|
|
— |
|
|
|
14.6 |
|
|
|
— |
|
||||||||||||||||||||||||||||
|
Loss on extinguishment of debt(2) |
|
|
0.5 |
|
|
|
— |
|
|
|
0.5 |
|
|
|
— |
|
||||||||||||||||||||||||||||
|
Product recall costs(3) |
|
|
— |
|
|
|
0.9 |
|
|
|
— |
|
|
|
1.8 |
|
||||||||||||||||||||||||||||
|
Restructuring charges(4) |
|
|
— |
|
|
|
4.0 |
|
|
|
— |
|
|
|
4.0 |
|
||||||||||||||||||||||||||||
|
Loss on impairments(5) |
|
|
— |
|
|
|
53.0 |
|
|
|
…
Pan American Silver (PAAS) came out with quarterly earnings of $1.09 per share, beating the Zacks Consensus Estimate of $1.06 per share. This compares to earnings of $0.42 per share a year ago. These figures are adjusted for non-recurring items. This quarterly report represents an earnings surprise of +2.59%. A quarter ago, it was expected that this silver mining company would post earnings of $0.9 per share when it actually produced earnings of $1.11, delivering a surprise of +23.33%. Over the last four quarters, the company has surpassed consensus EPS estimates three times. Pan American Silver, which belongs to the Zacks Mining – Silver industry, posted revenues of $1.15 billion for the quarter ended March 2026, missing the Zacks Consensus Estimate by 7.38%. This compares to year-ago revenues of $773.2 million. The company has topped consensus revenue estimates two times over the last four quarters. The sustainability of the stock's immediate price movement based on the recently-released numbers and future earnings expectations will mostly depend on management's commentary on the earnings call. Pan American Silver shares have lost about 1.4% since the beginning of the year versus the S&P 500's gain of 5.2%. What's Next for Pan American Silver? While Pan American Silver has underperformed the market so far this year, the question that comes to investors' minds is: what's next for the stock? There are no easy answers to this key question, but one reliable measure that can help investors address this is the company's earnings outlook. Not only does this include current consensus earnings expectations for the coming quarter(s), but also how these expectations have changed lately. Empirical research shows a strong correlation between near-term stock movements and trends in earnings estimate revisions. Investors can track such revisions by themselves or rely on a tried-and-tested rating tool like the Zacks Rank, which has an impressive track record of harnessing the power of earnings estimate revisions. Ahead of this earnings release, the estimate revisions trend for Pan American Silver was mixed. While the magnitude and direction of estimate revisions could change following the company's just-released earnings report, the current status translates into a Zacks Rank #3 (Hold) for the stock. So, the shares are expected to perform in line with the market in the near future. You can see the complete list of today's Zacks #1 Rank (Strong Buy) stocks here. It will be interesting to see how estimates for the coming quarters and the current fiscal year change in the days ahead. The current consensus EPS estimate is $1.10 on $1.3 billion in revenues for the coming quarter and $4.45 on $5.19 billion in revenues for the current fiscal year. Investors should be mindful of the fact that the outlook for the industry can have a material impact on the performance of the stock as well. In terms of the Zacks Industry Rank, Mining – Silver is currently in the bottom 35% of the 250 plus Zacks industries. Our research shows that the top 50% of the Zacks-ranked industries outperform the bottom 50% by a factor of more than 2 to 1. Compass Minerals (CMP), another stock in the broader Zacks Basic Materials sector, has yet to report results for the quarter ended March 2026. The results are expected to be released on May 6. This minerals producer is expected to post quarterly earnings of $0.66 per share in its upcoming report, which represents a year-over-year change of +4.8%. The consensus EPS estimate for the quarter has remained unchanged over the last 30 days. Compass Minerals' revenues are expected to be $411.89 million, down 16.7% from the year-ago quarter. Want the latest recommendations from Zacks Investment Research? Today, you can download 7 Best Stocks for the Next 30 Days. Click to get this free report Pan American Silver Corp. (PAAS) : Free Stock Analysis Report Compass Minerals International, Inc. (CMP) : Free Stock Analysis Report This article originally published on Zacks Investment Research (zacks.com). ATI Inc. ATI posted adjusted earnings of $1 per share for the first quarter of 2026, up 39% from the year-ago quarter. The figure beat the Zacks Consensus Estimate of 88 cents by 13.6%. Sales of $1,151.5 million rose 1% year over year but missed the consensus estimate of $1,186.1 million by 2.9%. Strength in aerospace and defense demand supported results, while profitability benefited from improved mix and pricing. The consolidated adjusted EBITDA lift of 19% year over year to $231.7 million pointed to better operating leverage and a richer product mix, particularly in the company’s higher-value materials portfolio. ATI Inc. Price, Consensus and EPS Surprise ATI Inc. price-consensus-eps-surprise-chart | ATI Inc. Quote ATI’s Segment Highlights High-Performance Materials & Components (HPMC) generated sales of $614.3 million, up 5.2% from the year-ago quarter. However, the figure fell short of the consensus estimate of $647 million. Segment EBITDA rose 16.7% year over year to $152.9 million. Advanced Alloys & Solutions (AA&S) posted sales of $537.2 million, down 4.1% year over year. The figure missed the consensus estimate of $559 million. Segment EBITDA increased 16.3% to $97 million, reflecting stronger price/mix despite the sales decline. ATI's Financials ATI ended the quarter with cash and cash equivalents of $401.7 million, compared with $416.7 million at the end of 2025. The company’s cash position reflected the combination of higher operating cash generation and continued capital returns, alongside typical working-capital movements. Long-term debt totaled $1,794.7 million at quarter end, up from $1,718.3 million at the end of 2025. ATI’s 2026 Outlook Raised Management lifted full-year expectations following the first-quarter performance. For the second quarter of 2026, ATI expects adjusted EBITDA of $245-$255 million and adjusted earnings of 98 cents-$1.04 per share. For full-year 2026, adjusted EBITDA is now expected to be in the range of $1,010-$1,060 million, up from the prior $975-$1,025 million view. Adjusted earnings guidance was raised to $4.20-$4.48 per share from $3.99-$4.27 previously, alongside a higher adjusted free cash flow outlook of $465-$525 million versus the prior $430-$490 million range. ATI’s Price Performance ATI’s shares are up 123.7% over a year compared with the 23.8% growth recorded by the industry. Image Source: Zacks Investment Research ATI’s Zacks Rank & Key Picks ATI currently carries a Zacks Rank #3 (Hold). Some better-ranked stocks in the basic materials space are CF Industries Holdings, Inc. CF,Compass Minerals International, Inc. CMP and Aris Mining Corporation ARIS. CF Industries is slated to report first-quarter 2026 results on May 6. The Zacks Consensus Estimate for earnings is pegged at $2.35 per share, indicating 27.03% year-over-year growth. CF sports a Zacks Rank #1 (Strong Buy) at present. You can see the complete list of today’s Zacks #1 Rank stocks here. Compass Mineral is slated to report second-quarter fiscal 2026 results on May 6. The consensus estimate for CMP’s earnings per share is pegged at 66 cents. CMP presently carries a Zacks Rank #1. Aris is scheduled to report first-quarter 2026 results on May 6. The Zacks Consensus Estimate for ARIS’ first-quarter earnings per share is pegged at 77 cents, indicating 381.25% year-over-year growth. ARIS carries a Zacks Rank #2 (Buy) at present. Want the latest recommendations from Zacks Investment Research? Today, you can download 7 Best Stocks for the Next 30 Days. Click to get this free report ATI Inc. (ATI) : Free Stock Analysis Report CF Industries Holdings, Inc. (CF) : Free Stock Analysis Report Compass Minerals International, Inc. (CMP) : Free Stock Analysis Report Aris Mining Corporation (ARIS) : Free Stock Analysis Report This article originally published on Zacks Investment Research (zacks.com). DuPont de Nemours, Inc. DD reported adjusted earnings of 55 cents per share for the first quarter of 2026, up 52.8% year over year. The figure topped the Zacks Consensus Estimate of 48 cents by 14.6%. Net sales of $1,681 million were up 4.3% from the year-ago quarter and beat the consensus estimate of $1,664.9 million by 1%. Organic sales increased 2%, reflecting strength in healthcare and aerospace end markets. Profitability strengthened meaningfully in the reported quarter through organic growth, favorable mix, productivity gains and lower interest expense. DuPont’s materials and solutions portfolio benefited from execution gains, even as certain end markets remained uneven during the quarter. DuPont de Nemours, Inc. Price, Consensus and EPS Surprise DuPont de Nemours, Inc. price-consensus-eps-surprise-chart | DuPont de Nemours, Inc. Quote DD’s Segment Highlights Healthcare & Water Technologies posted net sales of $806 million, up 6% year over year, reflecting 3% organic growth and a 3% currency benefit. Within the segment, Healthcare Technologies delivered high-single-digit organic growth on broad-based demand led by medical packaging and biopharma, while Water Technologies declined in low to mid-single digits organically as strength in industrial water and microelectronics markets was more than offset by Middle East logistics disruptions. Diversified Industrials generated net sales of $875 million, up 3% year over year, driven by a 3% currency tailwind, while organic sales were about flat. Building Technologies was down low single digits organically due to continued weakness in construction markets, while Industrial Technologies rose low-single digits organically on strength in aerospace and automotive, partly offset by declines in printing and packaging. DD’s Financials DuPont ended the quarter with cash and cash equivalents of $710 million. The balance sheet reflected long-term debt of $3,132 million, providing a snapshot of the company’s capital structure following recent portfolio actions. Cash provided by operating activities from continuing operations was $232 million in the quarter, underscoring improved cash generation versus the year-ago period. DuPont announced a $275 million accelerated share repurchase plan, reinforcing its emphasis on capital deployment alongside operational execution. DuPont’s Outlook For the second quarter of 2026, DuPont expects net sales of about $1.8 billion and operating EBITDA of about $430 million. Adjusted earnings are projected at approximately 59 cents per share, with guidance assuming about 3% organic sales growth year over year and currency as a slight tailwind. Management raised its full-year 2026 outlook following the first-quarter outperformance and the interest income benefit tied to the Aramids transaction. The company now expects net sales of $7.155-$7.215 billion, operating EBITDA of $1.730-$1.760 billion and adjusted earnings of $2.35-$2.40 per share for 2026. DD’s Price Performance DuPont’s shares have lost 30.2% in a year against a 20.8% gain in the industry. Image Source: Zacks Investment Research DD’s Zacks Rank & Stocks to Consider DD currently carries a Zacks Rank #3 (Hold). Some better-ranked stocks in the basic materials space are CF Industries Holdings, Inc. CF, Compass Minerals International, Inc. CMP and Aris Mining Corporation ARIS. CF Industries is slated to report first-quarter 2026 results on May 6. The Zacks Consensus Estimate for earnings is pegged at $2.35 per share, indicating 27.03% year-over-year growth. CF sports a Zacks Rank #1 (Strong Buy) at present. You can see the complete list of today’s Zacks #1 Rank stocks here. Compass Mineral is slated to report second-quarter fiscal 2026 results on May 6. The consensus estimate for CMP’s earnings per share is pegged at 66 cents. CMP presently carries a Zacks Rank #1. Aris is scheduled to report first-quarter 2026 results on May 6. The Zacks Consensus Estimate for ARIS’s first-quarter earnings per share is pegged at 77 cents, indicating 381.25% year-over-year growth. ARIS carries a Zacks Rank #2 (Buy) at present. Want the latest recommendations from Zacks Investment Research? Today, you can download 7 Best Stocks for the Next 30 Days. Click to get this free report DuPont de Nemours, Inc. (DD) : Free Stock Analysis Report CF Industries Holdings, Inc. (CF) : Free Stock Analysis Report Compass Minerals International, Inc. (CMP) : Free Stock Analysis Report Aris Mining Corporation (ARIS) : Free Stock Analysis Report This article originally published on Zacks Investment Research (zacks.com). European equities traded in the US as American depositary receipts were higher late Tuesday morning, rising 0.27% to 1,794.86 on the S&P Europe Select ADR Index. From continental Europe, the gainers were led by brewing firm Anheuser-Busch InBev (BUD) and medical device maker EDAP TMS (EDAP), which advanced 9% and 3% respectively. They were followed by telecommunications companies Ericsson (ERIC) and Nokia (NOK), which rose 2.5% and 2.4% respectively. The decliners from continental Europe were led by semiconductor company Sequans Communications (SQNS) and internet advertising firm Criteo (CRTO), which shed 9.7% and 3.9% respectively. They were followed by biotech firm BioNTech (BNTX) and consumer goods company Unilever (UL), which fell 3.1% and 0.6% respectively. The gainers from the UK were led by Biodexa Pharmaceuticals (BDRX) and insurance company Prudential (PUK), which climbed 32% and 2.2% respectively. They were followed by education company Pearson (PSO) and mining company BHP Group (BHP) were up 1.8% and 1.5% respectively. The decliners from the UK and Ireland were led by lender HSBC (HSBC) and Mereo BioPharma (MREO), which fell 5% and 2.1% respectively. They were followed by Lloyds Banking Group (LYG) and software firm Endava (DAVA), which were down 1.9% each. Methanex Corporation MEOH reported adjusted earnings of 30 cents per share for the first quarter of 2026, down 76.9% from $1.30 in the year-ago quarter. The figure missed the Zacks Consensus Estimate of 47 cents by 36.2%. The profitability was pressured by weaker year-over-year methanol pricing and higher total cash costs, even as higher sales volume provided a meaningful offset. Methanex posted a net loss attributable to shareholders of $14 million, or 18 cents per share, primarily due to mark-to-market expense from share-based compensation linked to the company’s higher share price during the quarter. Quarterly revenues rose 8.7% year over year to $974 million and beat the Zacks Consensus Estimate of $963.9 million by 1%. Methanex Corporation Price, Consensus and EPS Surprise Methanex Corporation price-consensus-eps-surprise-chart | Methanex Corporation Quote MEOH’s Operational Highlights Methanex produced 2,391,000 tons of methanol in the first quarter, up from 1,619,000 tons a year ago. Management attributed the strong output to safe and reliable operations across the global portfolio, including contributions from the acquired Beaumont, TX assets, while noting that early-quarter production was briefly reduced in North America in response to high natural gas prices. The figure beat our estimate of 2,171,000 tons. Total methanol sales volume was 2,622,000 tons in the quarter versus 2,217,000 tons a year ago. The figure missed our estimate of 2,690,000 tons. The average realized price was $351 per ton, below $404 per ton in the year-ago quarter, reflecting a less favorable pricing environment year over year despite improvement from the prior quarter. The figure was above our estimate of $338. Methanex’s Financials Methanex ended the quarter with cash and cash equivalents of $379 million compared with $425.3 million at the end of the prior quarter. Cash flow from operating activities was $132 million in the first quarter, reflecting working-capital headwinds as accounts receivable rose alongside higher pricing and inventory levels. Shareholder returns remained in place, with $14 million paid through regular dividends during the quarter. Methanex also repaid $60 million of Term Loan A as part of its stated priority to de-lever, and it reiterated access to a $600 million revolving credit facility to support liquidity. MEOH’s Outlook Methanex reiterated its expectation for 2026 production to be 9 million tons of methanol (Methanex interest) and 0.3 million tons of ammonia, with quarterly variability tied to gas availability, planned turnarounds and unplanned outages. Management also noted that global supply and demand dynamics remain fluid, particularly given uncertainty around production and logistics in the Middle East. With posted prices surging into April and May, Methanex expects significantly higher adjusted EBITDA in the second quarter on a higher realized price and similar sales of produced methanol. Management expects its average realized price to be approximately $500 to $525 per ton across those two months based on posted prices and discounts, setting up a materially stronger near-term pricing environment. The supply-chain disruption tied to the Middle East conflict is a key factor behind the rapid escalation in methanol pricing moving into the second quarter. MEOH’s Price Performance Shares of Methanex have gained 101.8% in the past year compared with the 20.6% rise in the industry. Image Source: Zacks Investment Research MEOH’s Zacks Rank & Other Key Picks MEOH currently sports a Zacks Rank #1 (Strong Buy). Some other top-ranked stocks in the basic materials space are CF Industries Holdings, Inc. CF, Compass Minerals International, Inc. CMP and Aris Mining Corporation ARIS. CF Industries is slated to report first-quarter 2026 results on May 6. The Zacks Consensus Estimate for earnings is pegged at $2.35 per share, indicating 27.03% year-over-year growth. CF sports a Zacks Rank #1 at present. You can see the complete list of today’s Zacks #1 Rank stocks here. Compass Mineral is slated to report second-quarter fiscal 2026 results on May 6. The consensus estimate for CMP’s earnings per share is pegged at 66 cents. CMP presently sports a Zacks Rank #1. Aris is scheduled to report first-quarter 2026 results on May 6. The Zacks Consensus Estimate for ARIS’s first-quarter earnings per share is pegged at 67 cents, indicating 318.75% year-over-year growth. ARIS carries a Zacks Rank #2 (Buy) at present. Want the latest recommendations from Zacks Investment Research? Today, you can download 7 Best Stocks for the Next 30 Days. Click to get this free report CF Industries Holdings, Inc. (CF) : Free Stock Analysis Report Methanex Corporation (MEOH) : Free Stock Analysis Report Compass Minerals International, Inc. (CMP) : Free Stock Analysis Report Aris Mining Corporation (ARIS) : Free Stock Analysis Report This article originally published on Zacks Investment Research (zacks.com). Freeport-McMoRan Inc. FCX is slated to report first-quarter 2026 results before the opening bell on April 23. While higher unit costs and weaker volumes are likely to have impacted FCX’s performance, it is expected to have benefited from favorable copper prices.The Zacks Consensus Estimate for first-quarter earnings has been revised lower in the past 60 days. The consensus estimate for earnings is pegged at 47 cents per share, suggesting a 95.8% year-over-year rise. The Zacks Consensus Estimate for revenues currently stands at $5.61 billion, indicating a 2% decline on a year-over-year basis. Image Source: Zacks Investment Research FCX beat the Zacks Consensus Estimate for earnings in three of the last four quarters and reported in-line results once. It has a trailing four-quarter earnings surprise of 26.8% on average. Image Source: Zacks Investment Research Q1 Earnings Whispers for FCX Stock Our proven model does not conclusively predict an earnings beat for FCX this season. The combination of a positive Earnings ESP and a Zacks Rank #1 (Strong Buy), 2 (Buy) or 3 (Hold) increases the chances of an earnings beat. But that’s not the case here. You can uncover the best stocks to buy or sell before they’re reported with our Earnings ESP Filter.FCX has an Earnings ESP of -0.86% and a Zacks Rank #3. You can see the complete list of today’s Zacks #1 Rank stocks here. Factors Shaping FCX’s Q1 Results Freeport’s first-quarter results are expected to reflect favorable copper prices. Copper prices started 2026 on a strong note, underpinned by robust demand from China and the United States. Structural tailwinds, including electric vehicles (EVs), renewable energy projects, data center growth and grid modernization, continue to boost copper consumption. Worries about tightening supply amid rising EV and infrastructure demand also supported the red metal. Supply risks increased amid concerns over lower output and potential disruptions at major global mining operations. These factors led to prices surging to roughly $6.4 per pound in late January. Prices of the red metal were mostly volatile during February, largely trading near $6 per pound. Copper prices came under pressure last month amid concerns about the impact of surging oil prices on the global economy due to the war in the Middle East, dragging down prices to a three-month low of around $5.3 per pound in late March. Prices have rebounded since then on hopes of a de-escalation in the Iran war and are currently hovering around $6 per pound. Our estimate for the first-quarter average realized copper price for FCX is $5.70 per pound, which indicates a year-over-year rise of 28.3%.FCX’s results are likely to be unfavorably impacted by lower sales volumes due to the Grasberg mine incident. The company’s outlook for copper sales volumes for the first quarter assumes minimal contribution from its Indonesian operations due to the mine incident. FCX expects copper sales volumes of 640 million pounds, indicating a 10% sequential and 27% year-over-year decline. The company has issued weaker guidance for gold sales volume of 60,000 ounces, suggesting sequential and year-over-year decreases. Lower sales volumes are expected to weigh on its top line.Higher unit costs are also likely to have affected the company’s performance in the March quarter. FCX saw a sharp increase in its average unit net cash cost per pound of copper in the fourth quarter of 2025 to $2.22 from $1.40 in the prior quarter, marking a roughly 59% spike. It also climbed 34% year over year. Freeport's outlook for the first quarter suggests higher costs on a sequential basis. It expects unit net cash costs to rise to $2.60 per pound, while projecting a full-year average of roughly $1.75. FCX Stock’s Price Performance and Valuation FCX’s shares have gained 106% in a year, underperforming the Zacks Mining – Non Ferrous industry’s 117.4% rise, while topping the S&P 500’s increase of 39.2%. Its peers, Southern Copper Corporation SCCO and BHP Group Limited BHP, have rallied 114% and 67%, respectively, over the same period. FCX’s One-year Price Performance Image Source: Zacks Investment Research From a valuation standpoint, Freeport is currently trading at a forward 12-month earnings multiple of 24.82, a roughly 0.7% discount to the peer group average of 25X. FCX is trading at a premium to BHP Group and at a discount to Southern Copper. Freeport currently has a Value Score of C. BHP Group has a Value Score of B, while Southern Copper has a Value Score of D. FCX’s P/E F12M Vs. Industry, SCCO & BHP Image Source: Zacks Investment Research Investment Thesis for FCX Stock Freeport is well-placed with high-quality copper assets and remains focused on strong execution and advancing its organic growth opportunities. It is expected to gain from progress in exploration activities that will boost production capacity. FCX also has a strong liquidity position and generates substantial cash flows, which allow it to finance its growth projects, pay down debt and drive shareholder value. Backed by strong financial health, the company's dividend is perceived to be safe and reliable. The strength in copper prices should also support its profitability and drive cash flow generation. Freeport, however, faces headwinds from higher costs, which may eat into its margins. Weaker copper volumes due to the Grasberg mine incident are also likely to weigh on its performance. Final Thoughts: Hold Onto FCX Shares FCX stands to benefit from the ongoing expansion initiatives that will enhance its production capacity. Its strong financial position supports continued investment in growth projects and shareholder returns. Despite these positives, softer sales volume expectations and rising unit costs remain concerns. Holding onto the FCX stock will be prudent for investors who already own it, awaiting clearer direction from the upcoming earnings release. Want the latest recommendations from Zacks Investment Research? Today, you can download 7 Best Stocks for the Next 30 Days. Click to get this free report Freeport-McMoRan Inc. (FCX) : Free Stock Analysis Report BHP Group Limited Sponsored ADR (BHP) : Free Stock Analysis Report Southern Copper Corporation (SCCO) : Free Stock Analysis Report This article originally published on Zacks Investment Research (zacks.com). COSTA MESA, Calif., April 20, 2026 /PRNewswire/ — The following statement is being issued by Simpluris, Inc., Fund Administrator for the United States Securities and Exchange Commission, regarding the Compass Minerals International, Inc., Fair Fund and Plan of Distribution. NOTICE OF FAIR FUND DISTRIBUTION PLANIn the Matter of Compass Minerals International, Inc.Administrative Proceeding File No. 3-21145 For more information, visit www.CompassMineralsFairFund.com The United States Securities and Exchange Commission ("SEC") has settled administrative proceedings (the "Order") against Compass Minerals International, Inc. ("Compass"). In the Order, the Commission found that from 2017 to 2018, Compass made repeated misrepresentations about its plans to reduce costs and about the production levels at its Goderich salt mine in Canada. In addition to these violations, Compass filed materials that did not comply with Generally Accepted Accounting Principles ("GAAP") standards. The SEC found that Compass' statements violated Section 8(A) of the Securities Act, and Section 21C of the Securities Exchange Act. The SEC ordered the Respondents to pay a $12,000,000 civil money penalty to the Commission. The SEC also created a Fair Fund, pursuant to Section 308(a) of the Sarbanes-Oxley Act of 2002, so that the penalty collected can be distributed to harmed investors (the "Fair Fund"). The Fair Fund will be paid out according to the Plan of Distribution ("Plan"). A summary of the eligibility criteria and claims process is below. Full details are available at www.CompassMineralsFairFund.com. You may also request a copy of the Plan from the Fund Administrator via email at info@CompassMineralsFairFund.com or by calling 866-675-2446. Who is eligible to receive a payment from the Fair Fund? To receive a payment, you must have: How do I submit a Claim? The easiest way to submit a claim is online at the Compass Fair Fund website: www.CompassMineralsFairFund.com. Claim Forms completed online must be submitted on or before 11:59 p.m. Eastern Standard Time on July 12, 2026. If you are unable to submit a Claim Form online, you may request a copy of the paper Claim Form from the Fund Administrator via email at info@CompassMineralsFairFund.com or by calling 866-675-2446. You may also download a copy of the Claim Form to print from: www.CompassMineralsFairFund.com. Claim Forms submitted via mail must be sent to the address provided on the Claim Form and postmarked (or if not sent by U.S. Mail, then received) by July 12, 2026. The Fund Administrator will send a Determination Notice advising each Eligible Claimant who timely submitted a Claim Form of their eligibility determination and will provide a calculation of the claimant's Recognized Loss. The Fund Administrator may consider disputes of an Eligible Claimant's Recognized Loss calculation if timely submitted in accordance with the Plan. This notice is a summary. For more information, visitwww.CompassMineralsFairFund.com
View original content:https://www.prnewswire.com/news-releases/all-individuals-who-purchased-compass-minerals-international-inc-common-stock-between-march-2-2017-and-october-23-2018-302746198.html Friday, April 17, 2026The Zacks Research Daily presents the best research output of our analyst team. Today's Research Daily features new research reports on 16 major stocks, including Microsoft Corp. (MSFT), AbbVie Inc. (ABBV) and BHP Group Ltd. (BHP), as well as two micro-cap stocks CBL & Associates Properties, Inc. (CBL) and IRIDEX Corp. (IRIX). The Zacks microcap research is unique as our research content on these small and under-the-radar companies is the only research of its type in the country.These research reports have been hand-picked from the roughly 70 reports published by our analyst team today.You can see all of today’s research reports here >>>Ahead of Wall StreetThe daily 'Ahead of Wall Street' article is a must-read for all investors who would like to be ready for that day's trading action. The article comes out before the market opens, attempting to make sense of that morning's economic releases and how they will affect that day's market action. You can read this article for free on our home page and can actually sign up there to get an email notification as this article comes out each morning.You can read today's AWS here >>> Pre-Markets Very Happy About Middle East DevelopmentsToday's Featured Research ReportsMicrosoft’s shares have outperformed the Zacks Computer – Software industry over the past year (+16.3% vs. +9.3%). The company capitalizes on AI business momentum and Copilot adoption alongside accelerating Azure cloud infrastructure expansion. Strong Office 365 Commercial demand has been propeling Productivity and Business Processes revenue growth. ARPU is increasing through E5 and M365 Copilot uptake across key segments. Strategic execution through expanding scale and enterprise customer growth is driving non-AI services. Conversely, Azure growth guidance projects continued deceleration to 37-38% for Q3, suggesting demand saturation despite massive infrastructure investments. Customer concentration risk intensifies with 45% of backlog tied to OpenAI. Microsoft confronts intense competition from AWS and Google Cloud and escalating regulatory scrutiny. Capacity constraints persisting through fiscal year-end limit revenue potential despite unprecedented spending.(You can read the full research report on Microsoft here >>>)Shares of AbbVie have outperformed the Zacks Large Cap Pharmaceuticals industry over the past year (+25.9% vs. +20.5%). The company has successfully navigated Humira's loss of exclusivity (LOE) by launching two other successful new immunology medicines, Skyrizi and Rinvoq, which are performing extremely well, bolstered by approvals in new indications, and should support top-line growth in the next few years. AbbVie’s neuroscience portfolio is also contributing to top-line growth. AbbVie delivered robust net sales growth in 2025, which is just the second full year following the Humira LOE in the United States and expects another year of robust growth in 2026. However, the company faces several headwinds like Humira LOE impact, slowing oncology sales and continued macro headwinds for Aesthetics. Estimates have declined ahead of Q1 earnings. AbbVie has a positive record of earnings surprises in recent quarters. (You can read the full research report on AbbVie here >>>)BHP’s shares have outperformed the Zacks Mining – Miscellaneous industry over the past year (+79.8% vs. +63.8%). The company reported a 2% rise in iron ore output in the first half of fiscal 2026, while copper production remained flat. For fiscal 2026, BHP projects iron ore production of 258–269 Mt, including 251–262 Mt from Western Australia Iron Ore (WAIO). WAIO continues to perform strongly, retaining its status as a lowest-cost producer, with medium-term output expected to surpass 305 Mt annually. Copper guidance of 1,900–2,000 kt suggests a 3% decline at the midpoint, mainly due to lower planned grades in Chile. BHP’s strategic shift toward future-facing commodities like copper and potash positions it well to benefit from global decarbonization and trends. Backed by its robust pipeline, the company targets roughly 2 Mtpa of attributable copper production by the 2030s. Strong cash flow has also enabled BHP to steadily reduce debt.(You can read the full research report on BHP here >>>)Shares of CBL & Associates Properties have outperformed the Zacks REIT and Equity Trust – Retail industry over the past year (+98.4% vs. +28.3%). This microcap company with a market capitalization of $1.33 billion represents a value-oriented retail REIT anchored by market-dominant middle-market assets, generating stable cash flows supported by resilient occupancy and steady leasing demand. Management’s strategy of capital recycling and balance sheet optimization enhances financial flexibility and supports incremental free cash flow, underpinning a growing dividend profile. Reinvestment into tenant mix and experiential retail should improve income quality. Operating leverage remains limited, with earnings growth constrained by expense pressures, tenant disruptions and softer renewal economics. Execution risk persists around redevelopment and backfilling. The current valuation implies investor skepticism around cash flow durability and long-term growth, suggesting headwinds. Upside depends on leasing momentum, cost control and consistent cash flow delivery.(You can read the full research report on CBL & Associates Properties here >>>)IRIDEX’s shares have gained +3.9% over the past year against the Zacks Lasers Systems and Components industry’s gain of +123.2%. This microcap company with a market capitalization of $18 million enters 2026 with improving operating leverage, supported by a leaner cost structure and 22% lower operating expenses in 2025. Management expects continued discipline and positive operating cash flow. Growth is increasingly driven by a rising installed base that supports recurring revenue from consumables and service, alongside strong retina momentum led by the PASCAL platform. Expanded access through EyeProGPO enhances U.S. penetration with limited incremental cost, while large ophthalmology markets provide favorable long-term demand tailwinds.However, near-term growth remains muted, with 2026 guidance implying flat to low-single-digit revenue, limiting re-rating potential. Margin compression from tariffs and inefficiencies raises concerns about profitability sustainability. The stock trades at a steep discount to peers on EV/sales and P/S multiples. (You can read the full research report on IRIDEX here >>>)Other noteworthy reports we are featuring today include AppLovin Corp. (APP), Simon Property Group, Inc. (SPG) and Venture Global, Inc. (VG).Mark VickerySenior EditorNote: Sheraz Mian heads the Zacks Equity Research department and is a well-regarded expert of aggregate earnings. He is frequently quoted in the print and electronic media and publishes the weekly Earnings Trends and Earnings Preview reports. If you want an email notification each time Sheraz publishes a new article, please click here>>> Today's Must Read Adoption of Cloud and Office 365 Strength Aid Microsoft (MSFT) AbbVie's (ABBV) Skyrizi, Rinvoq Key to Top-Line Growth BHP Group (BHP) Bets on Growth Investments as Costs Hurt Margins Featured Reports AppLovin (APP) Maintains Strong Profit Amid Limited Mix VisibilityPer the Zacks analyst, AppLovin maintains strong, durable profitability and cash generation to fund AI and self-serve investments and buybacks. Limited mix disclosure constrains visibility. Premium Acquisitions Aid Simon Property Group (SPG), High Debt HurtsPer the Zacks Analyst, SPG's portfolio restructuring, aimed at premium acquisitions, focus on omnichannel retailing and developing mixed-use assets bode well. Yet, a high debt burden raise concerns. Modular Approach and Projects Aid Venture Global's (VG) ProfitabilityPer the Zacks analyst, VG's innovative modular approach and Gulf Coast projects boost profitability. However, global supply-chain delays, tariffs and volatile spot LNG prices drag performance. Strong Data Center Market Aids ON Semiconductor (ON) ProspectsPer the Zacks analyst, ON Semiconductor is benefiting from solid momentum across data center and automotive end-markets. Loan Growth to Support East West Bancorp (EWBC) Amid Cost WoesPer the Zacks analyst, continued decent rise in the demand for loans will likely support East West Bancorp's revenue growth. Elevated costs due to investments in technology might hurt profitability. Expanding Customer Base, Steady Investment Aid Spire (SR)Per the Zacks analyst, Spire is seeing stronger demand from its increasing customer base. Infrastructure investments are enhancing service capacity and supporting improved profitability. Clover Health (CLOV) Gains on Membership, AI Assistant, 4-Star RatingPer the Zack analyst, Clover Health benefits from MA growth, a 4-Star rating and AI-driven care gains from Clover Assistant and SaaS expansion, though CMS risks and limited reach remain concerns. New Upgrades Chewy (CHWY) Benefits from Autoship Strength, Sees Solid 2026 GrowthPer the Zacks analyst, Chewy benefits from strong Autoship growth, rising active customers and AI-driven efficiencies. Fiscal 2026 sales are expected to grow 8-9% alongside continued margin expansion. Solid Retention Rates, Better Pricing Aid Palomar (PLMR)Per the Zacks analyst, Palomar should grow on the strength of increased volume of policies fueled by strong premium retention rates, new partnerships, rate increases and new business generated. Credit Sales, Solid Balance Sheet Aid Bread Financial (BFH)Per the Zacks analyst, Bread Financial is set to grow on strong credit sales aided by solid consumer spending. Moreover, its healthy balance sheet should drive long-term growth. New Downgrades Lower Volumes and Manufacturing Downturn to Weigh on Greif (GEF) The Zacks analyst is concerned that lower volumes across segments and continued headwinds from the prolonged downturn in the manufacturing sector will impair Greif's results. Calix (CALX) Plagued by Margin Woes Owing to High Operating CostsPer the Zacks analyst, Calix is likely to be plagued by lower margins owing to modest pressure from customer and product mix, accelerated AI development and overlapping dual-cloud costs. Carnival (CCL) Faces Pressure From Rising Costs and Fuel VolatilityPer the Zacks analyst, rising costs and fuel volatility are hurting Carnival's margins. High expenses and geopolitical risks tied to fuel and currency fluctuations may weigh on profitability. Want the latest recommendations from Zacks Investment Research? Today, you can download 7 Best Stocks for the Next 30 Days. Click to get this free report Microsoft Corporation (MSFT) : Free Stock Analysis Report Simon Property Group, Inc. (SPG) : Free Stock Analysis Report BHP Group Limited Sponsored ADR (BHP) : Free Stock Analysis Report CBL & Associates Properties, Inc. (CBL): Free Stock Analysis Report IRIDEX Corporation (IRIX) : Free Stock Analysis Report AbbVie Inc. (ABBV) : Free Stock Analysis Report AppLovin Corporation (APP) : Free Stock Analysis Report Venture Global, Inc. (VG) : Free Stock Analysis Report This article originally published on Zacks Investment Research (zacks.com). For those looking to find strong Basic Materials stocks, it is prudent to search for companies in the group that are outperforming their peers. Has Compass Minerals (CMP) been one of those stocks this year? By taking a look at the stock's year-to-date performance in comparison to its Basic Materials peers, we might be able to answer that question. Compass Minerals is a member of our Basic Materials group, which includes 248 different companies and currently sits at #12 in the Zacks Sector Rank. The Zacks Sector Rank considers 16 different sector groups. The average Zacks Rank of the individual stocks within the groups is measured, and the sectors are listed from best to worst. The Zacks Rank is a proven model that highlights a variety of stocks with the right characteristics to outperform the market over the next one to three months. The system emphasizes earnings estimate revisions and favors companies with improving earnings outlooks. Compass Minerals is currently sporting a Zacks Rank of #1 (Strong Buy). The Zacks Consensus Estimate for CMP's full-year earnings has moved 27% higher within the past quarter. This is a sign of improving analyst sentiment and a positive earnings outlook trend. Based on the most recent data, CMP has returned 31.6% so far this year. Meanwhile, stocks in the Basic Materials group have gained about 18.9% on average. This shows that Compass Minerals is outperforming its peers so far this year. One other Basic Materials stock that has outperformed the sector so far this year is NWPX Infrastructure (NWPX). The stock is up 28% year-to-date. The consensus estimate for NWPX Infrastructure's current year EPS has increased 10.8% over the past three months. The stock currently has a Zacks Rank #1 (Strong Buy). To break things down more, Compass Minerals belongs to the Chemical – Diversified industry, a group that includes 29 individual companies and currently sits at #220 in the Zacks Industry Rank. This group has gained an average of 36.2% so far this year, so CMP is slightly underperforming its industry in this area. On the other hand, NWPX Infrastructure belongs to the Steel – Speciality industry. This 6-stock industry is currently ranked #166. The industry has moved +27.8% year to date. Investors with an interest in Basic Materials stocks should continue to track Compass Minerals and NWPX Infrastructure. These stocks will be looking to continue their solid performance. Want the latest recommendations from Zacks Investment Research? Today, you can download 7 Best Stocks for the Next 30 Days. Click to get this free report Compass Minerals International, Inc. (CMP) : Free Stock Analysis Report NWPX Infrastructure, Inc. (NWPX) : Free Stock Analysis Report This article originally published on Zacks Investment Research (zacks.com). BASF SE BASFY has announced a 40 million euro investment to expand and modernize its next-generation seed processing facilities at its vegetable seeds headquarters in Nunhem, Netherlands, reinforcing its Agricultural Solutions business. The project involves upgrading two existing processing buildings and adding around 6,000 square meters of new infrastructure, taking the total site to roughly 26,000 square meters. The enhanced facilities will incorporate advanced technologies to improve seed cleaning, treatment, storage, quality testing and global distribution efficiency. Construction is set to begin in the second quarter of 2026 and conclude by the end of 2028. Upon completion, the facilities will operate entirely on renewable energy, enabling greater energy efficiency while substantially reducing emissions. The Nunhem site processes more than 1,200 vegetable seed varieties across 20 crops, and the expansion will help BASF meet rising global demand for high-quality, climate-resilient seeds while strengthening supply chain reliability. The investment also prioritizes sustainability, with improved energy efficiency and a planned shift to renewable electricity, aligning with BASF’s broader strategy of driving innovation and sustainable growth in agriculture. Shares of BASFY are up 31.4% over the past year compared with the industry’s 21.5% rise. Image Source: Zacks Investment Research BASFY’s Zacks Rank & Key Picks BASFY carries a Zacks Rank of #3 (Hold). Better-ranked stocks in the Basic Materials space include DuPont de Nemours, Inc. DD, Compass Minerals International, Inc. CMP and Johnson Matthey plc JMPLY. DD and CMP sport a Zacks Rank of #1 (Strong Buy), while JMPLY carries a Zacks Rank of #2 (Buy). You can see the complete list of today’s Zacks #1 Rank stocks here. The Zacks Consensus Estimate for DD’s current fiscal-year earnings stands at $2.28 per share, implying a 35.7% year-over-year increase. Its earnings beat the Zacks Consensus Estimate in each of the trailing four quarters, with the average earnings surprise being 6.5%. The Zacks Consensus Estimate for CMP’s current fiscal-year earnings is pegged at 89 cents per share, indicating a 285.4% year-over-year rise. Its earnings beat the Zacks Consensus Estimate in two of the trailing four quarters and missed twice, with the average earnings surprise being 34.8%. The Zacks Consensus Estimate for JMPLY’s current fiscal-year earnings is pegged at $4.34 per share, indicating a 13.9% year-over-year decrease. Shares of JMPLY have jumped 73.5% over the past year. Want the latest recommendations from Zacks Investment Research? Today, you can download 7 Best Stocks for the Next 30 Days. Click to get this free report DuPont de Nemours, Inc. (DD) : Free Stock Analysis Report BASF SE (BASFY) : Free Stock Analysis Report Compass Minerals International, Inc. (CMP) : Free Stock Analysis Report Johnson Matthey PLC (JMPLY) : Free Stock Analysis Report This article originally published on Zacks Investment Research (zacks.com). Vancouver, British Columbia–(Newsfile Corp. – April 16, 2026) – Mundoro Capital Inc. (TSXV: MUN) (OTCQB: MUNMF) (www.mundoro.com) ("Mundoro" or the "Company") is pleased to announce the commencement of drilling at the high-priority Skorusa East target within the Central Timok project (the "Project"), located within the Timok Magmatic Complex ("Timok") in Serbia. The Project is part of the previously announced BHP-Mundoro option earn-in agreement¹ where BHP is sole funding the exploration activities. Highlight ● Planned 1,000 meters of drilling across two drill holes at the Skorusa East Target Central Timok Project The Project area is a comprehensive package of 7 exploration licenses covering 418 km² within the Timok Magmatic Complex in eastern Serbia (see Figure 1). Timok is one of the most prolific metallogenic domains in the western portion of the Tethyan Belt, hosting several large-scale deposits and producing mines. This land package encompasses four alteration zones, each extending approximately 4 km for a cumulative 16 km of alteration. These zones display characteristic soil geochemistry and alteration zonation indicative of porphyry systems. Skorusa East Target The Exploration Technical Committee has approved 1,000 meters of drilling across 1 to 2 drill holes at the Skorusa East target. Upon completion, the drill rig will be relocated to the high priority Tilva Rosh South target.
The Opportunity: Skorusa East is defined by a surface soil geochemical anomaly and alteration zone, located immediately east of the Skorusa West porphyry. Prior drilling in hole STRD-005 intersected hydrothermally altered medium to fine grained porphyritic diorite with trace disseminated chalcopyrite and quartz-chalcopyrite-pyrite-magnetite "A-B-Type" porphyry veinlets and a late mineral dyke postdating early veinlets, suggesting the existence of an additional mineralized center. The two drill holes in the current drilling campaign are designed to test the eastern extent of Skorusa East target with approximately 1,000 meters of drilling where there are demonstrated geochemical and alteration vectors along with a coincident magnetic anomaly. Figure 1: Regional map highlighting Central Timok target areasTo view an enhanced version of this graphic, please visit:https://images.newsfilecorp.com/files/2408/292719_98563d1c74edca46_001full.jpg Qualified Persons R. Jemielita, PhD, MIMMM, a Qualified Person as defined by National Instrument 43-101 and consultant to the Company, has reviewed, verified and approved the disclosure of the technical information contained in this news release. About Mundoro Capital Inc. Mundoro is a publicly listed company on the TSX-V in Canada and OTCQB in the USA with a portfolio of mineral properties focused primarily on base and precious metals. To drive value for shareholders, Mundoro's asset portfolio generates near-term cash payments to Mundoro and creates royalties attached to each mineral property optioned to partners. The portfolio of mineral properties is currently focused on predominantly copper in two mineral districts: Western Tethyan Belt in Eastern Europe and the Laramide Belt in the southwest USA. For more information, please visit www.mundoro.com. Follow our ongoing updates via: LinkedIn and X. Latest Corporate Presentation. For further information about Mundoro, please contact: Teo Dechev, Chief Executive Officer, President and DirectorChristian Elferink, Investor Relations Manager+1-604-669-8055info@mundoro.com References ¹ Mundoro Capital website (Link), October 13, 2025 News release² Mundoro Capital website (Link), July 6, 2021 News release Caution Concerning Forward-Looking Statements This News Release contains forward-looking statements. Forward-looking statements can be identified by the use of forward-looking words such as "will", "expect", "intend", "plan", "estimate", "anticipate", "believe" or "continue" or similar words or the negative thereof, and include the following: completion of earn-in expenditures, options and completion of a definitive agreement by the parties. The material assumptions that were applied in making the forward-looking statements in this News Release include expectations as to the mineral potential of the Company's projects, the Company's future strategy and business plan and execution of the Company's existing plans. We caution readers of this News Release not to place undue reliance on forward-looking statements contained in this News Release, as there can be no assurance that they will occur and they are subject to a number of uncertainties and other factors that could cause actual results to differ materially from those expressed or implied by such forward-looking statements. These factors include general economic and market conditions, exploration results, commodity prices, changes in law, regulatory processes, the status of Mundoro's assets and financial condition, actions of competitors and the ability to implement business strategies and pursue business opportunities. The forward-looking statements contained in this News Release are expressly qualified in their entirety by this cautionary statement. The forward-looking statements included in this News Release are made as of the date of this News Release and the Board undertakes no obligation to publicly update such forward-looking statements, except as required by law. Shareholders are cautioned that all forward-looking statements involve risks and uncertainties and for a more detailed discussion of such risks and other factors that could cause actual results to differ materially from those expressed or implied by such forward-looking statements, refer to the Company's filings with the Canadian securities regulators available on SEDAR+ at www.sedarplus.ca. Neither TSX Venture Exchange nor its Regulation Services Provider (as that term is defined in the policies of the TSX Venture Exchange) accepts responsibility for the adequacy or accuracy of this release.
To view the source version of this press release, please visit https://www.newsfilecorp.com/release/292719 Eldorado Gold Corporation EGO announced that it acquired all outstanding shares of Foran Mining Corporation. The deal will boost the balance and resilience of EGO’s existing asset base. Details on EGO’s Deal With Foran Eldorado Gold inked a deal with Foran on Feb. 2, 2026, to form a sector-leading gold-copper mining company that will yield notable near???term growth and cash flow generation. The acquisition of Foran adds two high-quality, fully financed development assets — Skouries and McIlvenna Bay — to Eldorado Gold’s portfolio. Both assets are set to achieve commercial production in mid-2026, positioning Eldorado Gold to gain from solid metal prices and rising demand for critical minerals. The assets are expected to produce 900 thousand gold-equivalent ounces in 2027. The addition of McIlvenna Bay gives Eldorado Gold the exposure to copper, offering exploration potential and long-term portfolio growth. The combined portfolio will offer a strategic mix of gold (around 77%), copper (about 15%) and other metals (around 8%). Eldorado Gold’s Q4 Performance EGO reported adjusted earnings of 63 cents per share in fourth-quarter 2025, missing the Zacks Consensus Estimate of 64 cents. The bottom line increased 2% year over year. Eldorado Gold generated revenues of $577 million in the reported quarter, marking a year-over-year increase of 32.3%.EGO produced 123,416 ounces of gold in the fourth quarter of 2025, marking a year-over-over dip of 20.7% Eldorado Gold Stock’s Price Performance EGO shares have soared 73.5% in the past year compared with the industry’s surge of 80.9%.
Image Source: Zacks Investment Research EGO’s Zacks Rank & Stocks to Consider The company currently has a Zacks Rank #3 (Hold). Some better-ranked stocks from the basic materials space are DuPont de Nemours, Inc. DD, Compass Minerals International, Inc. CMP and Johnson Matthey plc JMPLY. DD and CMP sport a Zacks Rank #1 (Strong Buy) each at present, and JMPLY carries a Zacks Rank #2 (Buy). You can see the complete list of today’s Zacks #1 Rank stocks here. The consensus estimate for DuPont de Nemours’ 2026 earnings is pegged at $2.28 per share. The estimate indicates year-over-year growth of 35.7%. DuPont de Nemours’ shares have surged 90% in a year. The consensus estimate for Compass Minerals’s 2026 earnings is pegged at 89 cents per share. The estimate indicates year-over-year growth of 285%. It has an average trailing four-quarter earnings surprise of 34.7%. Compass Minerals’ shares have surged 145% in a year. The Zacks Consensus Estimate for Johnson Matthey’s 2026 earnings is pegged at $4.34 per share, indicating a year-over-year increase of 13.9%. JMPLY shares have skyrocketed 81.6% in a year. Want the latest recommendations from Zacks Investment Research? Today, you can download 7 Best Stocks for the Next 30 Days. Click to get this free report DuPont de Nemours, Inc. (DD) : Free Stock Analysis Report Compass Minerals International, Inc. (CMP) : Free Stock Analysis Report Johnson Matthey PLC (JMPLY) : Free Stock Analysis Report Eldorado Gold Corporation (EGO) : Free Stock Analysis Report This article originally published on Zacks Investment Research (zacks.com). DuPont de Nemours, Inc. DD has launched its DuPont AmberChrom XT SL chromatography resins to enhance efficiency in biopharmaceutical manufacturing and simplify downstream purification workflows. The company introduced two variants, AmberChrom XT20 SL and AmberChrom XT30 SL, which are designed for the purification of oligonucleotide and peptide therapeutics. These therapies are gaining importance in treating conditions such as genetic disorders, metabolic diseases, and cancer, increasing the need for scalable and efficient purification solutions. A key feature of the XT SL resins is slurried format. This eliminates the need for a separate hydration step before column packing. As a result, manufacturers can move directly to packing columns, reducing preparation time and simplifying operations. This lowers equipment needs and reduces overall capital costs. AmberChrom XT20 SL is optimized for high-resolution separations where purity is critical. It supports higher flow rates and offers a balance between resolution and throughput. Both resins provide strong mechanical stability and chemical resistance, ensuring reliable performance under demanding conditions. The launch strengthens DuPont’s AmberChrom portfolio and reflects its focus on improving efficiency in bioprocessing. The new resins are expected to help manufacturers scale production while maintaining high-quality standards. Shares of DD have lost 22.8% over the past year against the industry’s 23.5% growth. Image Source: Zacks Investment Research DD’s Zacks Rank & Other Key Picks DD currently carries a Zacks Rank #1 (Strong Buy). Some other top-ranked stocks in the Basic Materials space are Compass Minerals International, Inc. CMP, Johnson Matthey Plc JMPLY and Asahi Kasei Corporation AHKSY. CMP carries a Zacks Rank #1, while JMPLY and AHKSY have a Zacks Rank #2 (Buy) each at present. You can see the complete list of today’s Zacks #1 Rank stocks here. The Zacks Consensus Estimate for CMP’s current-year earnings is pegged at 89 cents per share, indicating a 285.4% year-over-year increase. Its earnings beat the Zacks Consensus Estimate in two of the trailing four quarters and missed in the other two, with the average surprise being 34.9%. The Zacks Consensus Estimate for JMPLY’s current-year earnings is pinned at $4.34 per share, implying a 13.9% year-over-year increase. Shares of JMPLY have surged 75.3% over the past year. The Zacks Consensus Estimate for AHKSY’s current fiscal-year earnings is pegged at $1.38 per share, indicating a 7.8% year-over-year increase. Shares of AHKSY have surged 48.4% over the past year. Want the latest recommendations from Zacks Investment Research? Today, you can download 7 Best Stocks for the Next 30 Days. Click to get this free report DuPont de Nemours, Inc. (DD) : Free Stock Analysis Report Compass Minerals International, Inc. (CMP) : Free Stock Analysis Report Asahi Kasei Corp. (AHKSY) : Free Stock Analysis Report Johnson Matthey PLC (JMPLY) : Free Stock Analysis Report This article originally published on Zacks Investment Research (zacks.com). Company Announces Participation in BMO Chemicals Conference in May 2026 OVERLAND PARK, Kan., April 15, 2026–(BUSINESS WIRE)–Compass Minerals (NYSE: CMP), a leading global provider of essential minerals, will release its second-quarter fiscal 2026 results on Wednesday, May 6, 2026, after the markets close. The company’s president and CEO, Edward C. Dowling Jr., and CFO, Peter Fjellman, will discuss these results on a conference call on Thursday, May 7, 2026, at 9:30 a.m. ET. Access to the conference call will be available via webcast at investors.compassminerals.com or by dialing 1-800-715-9871. Callers must provide the conference ID number 7896827. Outside of the U.S. and Canada, callers may dial 1-646-307-1963. An audio replay of the conference call will be available on the company’s website. The company also announced that Edward C. Dowling Jr., president and CEO, and other leadership team members will participate in one-on-one meetings at the BMO Chemicals Conference on May 13, 2026, in New York City. Updated presentation materials will be available at the time of the event through the investor relations section of the Compass Minerals website at compassminerals.com About Compass Minerals Compass Minerals (NYSE: CMP) is a leading global provider of essential minerals focused on safely delivering where and when it matters to help solve nature’s challenges for customers and communities. The company’s salt products help keep roadways safe during winter weather and are used in numerous other consumer, industrial, chemical and agricultural applications. Its plant nutrition products help improve the quality and yield of crops while supporting sustainable agriculture. Compass Minerals operates 11 production and packaging facilities with more than 1,800 employees throughout the U.S., Canada and the U.K. Visit compassminerals.com for more information about the company and its products. View source version on businesswire.com: https://www.businesswire.com/news/home/20260415683177/en/ Contacts Investor Contact Brent CollinsVice President, Treasurer & Investor Relations+1.913.344.9111InvestorRelations@compassminerals.com Media Contact Kevin GabrielSenior Director, Corporate Affairs+1.913.344.9265MediaRelations@compassminerals.com Get insights on thousands of stocks from the global community of over 7 million individual investors at Simply Wall St.
BHP Group scores just 2/6 on our valuation checks. See what other red flags we found in the full valuation breakdown. Approach 1: BHP Group Discounted Cash Flow (DCF) Analysis A Discounted Cash Flow model takes estimates of the cash a company could generate in the future and discounts those back to a single value today, so you can compare that figure with the current share price. For BHP Group, the DCF here is a 2 Stage Free Cash Flow to Equity model using cash flow projections. The latest twelve month free cash flow is reported at $10.33b. Analyst estimates and extrapolations point to free cash flow of $11.15b by 2030, with a series of annual projections in between that are discounted back to today using a required return. Putting those discounted figures together gives an estimated intrinsic value of $36.43 per share. Compared with the current share price of around A$56.10, this DCF suggests the stock is around 54.0% overvalued on these assumptions and inputs. Result: OVERVALUED Our Discounted Cash Flow (DCF) analysis suggests BHP Group may be overvalued by 54.0%. Discover 10 high quality undervalued stocks or create your own screener to find better value opportunities. BHP Discounted Cash Flow as at Apr 2026 Approach 2: BHP Group Price vs Earnings For a profitable company like BHP Group, the P/E ratio is a useful way to see how much you are paying for each dollar of earnings, because it ties the share price directly to the bottom line rather than just sales or assets. What counts as a “normal” or “fair” P/E depends on how the market views a company’s earnings growth potential and risk. Higher expected growth or lower perceived risk can support a higher multiple, while lower growth or higher risk usually justifies a lower one. BHP Group currently trades on a P/E of 19.81x. This sits above the Metals and Mining industry average of 13.11x and below the peer average of 29.45x, so the raw comparison sends a mixed message. To refine this, Simply Wall St uses a “Fair Ratio” of 21.86x, which reflects factors such as earnings growth, profit margins, industry, market cap and company specific risks. This Fair Ratio is more tailored than a simple peer or industry comparison because it adjusts for the quality and risk of BHP Group’s earnings rather than assuming all miners deserve the same multiple. With the current P/E of 19.81x sitting below the Fair Ratio of 21.86x, the shares screen as undervalued on this metric. Result: UNDERVALUED ASX:BHP P/E Ratio as at Apr 2026 P/E ratios tell one story, but what if the real opportunity lies elsewhere? Start investing in legacies, not executives. Discover our 4 top founder-led companies. Upgrade Your Decision Making: Choose your BHP Group Narrative Earlier it was mentioned that there is an even better way to think about valuation, so Narratives are introduced as a simple way for you to attach a story to your numbers, linking what you believe about a company to a forecast for revenue, earnings and margins, and then to a fair value that you can compare with the current share price. On Simply Wall St’s Community page, Narratives are easy to use because you start with your view of the business, translate that into assumptions for growth, profitability and risk, and the tool turns this into a fair value that updates automatically when fresh news or earnings are added to the platform. For BHP Group, one investor might build a Narrative around copper and potash growth, use inputs similar to a fair value of A$121.48 and see the shares as offering more upside. Another investor might focus on project risk and commodity cycles, lean toward a fair value closer to A$31.79 and see far less appeal at today’s price. This helps each investor make clearer decisions based on their own assumptions rather than a single “right” answer. For BHP Group however we will make it really easy for you with previews of two leading BHP Group Narratives: Fair value in this narrative: A$121.48 per share Implied discount to this fair value at around A$56.10: approximately 54% below the narrative fair value Revenue growth assumption used: 28%
Fair value in this narrative: A$53.37 per share Implied premium to this fair value at around A$56.10: approximately 5% above the narrative fair value Revenue growth assumption used: 1.01%
Do you think there’s more to the story for BHP Group? Head over to our Community to see what others are saying! ASX:BHP 1-Year Stock Price Chart This article by Simply Wall St is general in nature. We provide commentary based on historical data Companies discussed in this article include BHP.AX. Have feedback on this article? Concerned about the content? Get in touch with us directly. Alternatively, email editorial-team@simplywallst.com BHP Group Limited BHP is reshaping its growth strategy around commodities with durable, long-term demand. Copper sits at the core of this shift, while potash is emerging as a complementary pillar that can diversify earnings over time. The company plans to allocate roughly 70% of its medium-term capital expenditure to these two segments, aligning its portfolio with structural themes such as electrification, decarbonization, population growth and rising living standards in emerging markets. Notably, in fiscal 2025, capital and exploration spending totaled $9.8 billion, which included a $4.5 billion on copper, $1.6 billion in potash and $3.2 billion in steelmaking materials. Backed by its efforts, BHP has delivered strong momentum, with copper production rising 30% over the past four years. The company expects copper output in the range of 1.9–2.0 million tons in fiscal 2026. BHP recently submitted the “Escondida New Concentrator” project to the Environmental Assessment System, a step that supports its growth agenda while addressing asset longevity. The new concentrator is designed to replace the historic Los Colorados plant as it approaches the end of its operating life. The project carries a likely investment range of $4.4-$5.9 billion and targets new capacity to produce 220-260 kt of copper annually. If advanced on schedule, that single project can represent a meaningful increment within BHP’s broader copper buildout. BHP’s pipeline also includes exposure to U.S. copper through Resolution Copper, a joint venture owned by BHP (45%) and Rio Tinto RIO (55%). The project, located in Arizona, is positioned as one of the most significant undeveloped copper resources in the United States. BHP’s longer-range ambition is to deliver around 2 million tons per annum of attributable copper production by the 2030s. The goal reflects a pipeline that includes projects already under execution and additional opportunities in development. Among peers, Southern Copper Corporation SCCO produced 956,270 tons of copper in 2025. The company guides copper production at around 911,400 tons. Southern Copper maintains a strong long-term outlook, targeting a significant ramp-up in output to roughly 1.6 million tons by 2035. This implies a compound annual growth rate (CAGR) of approximately 5.3% from 2025 levels. Key growth catalysts include the Tía María, Los Chancas and Michiquillay projects in Peru, along with El Pilar and El Arco in Mexico, all of which underpin SCCO’s long-term expansion pipeline. To support this growth plan, Southern Copper intends to invest nearly $19.9 billion over the next decade. Copper is also a major pillar for Rio Tinto’s long-term growth strategy. Rio Tinto’s total copper production reached 883 kt in 2025, up 11% on a year-over-year basis. Rio Tinto expects copper production in the range of 800-870 kt for 2026. The company remains on track to deliver on its 3% CAGR copper production target over 2024-2033. BHP’s Price Performance, Valuation & Estimates BHP shares have gained 68.7% in the past year compared with the industry’s 56.1% growth. Image Source: Zacks Investment Research BHP is trading at a forward 12-month price/sales multiple of 3.67X, higher than the industry’s 1.60X. Image Source: Zacks Investment Research The Zacks Consensus Estimate for BHP’s fiscal 2026 earnings is pegged at $4.95 per share, suggesting 36% year-over-year growth. The same for fiscal 2027 indicates a decline of 0.6%. Here is how the EPS estimates for fiscal 2026 and 2027 have been revised over the past 60 days. Image Source: Zacks Investment Research BHP currently carries a Zacks Rank #3 (Hold). You can see the complete list of today’s Zacks #1 Rank (Strong Buy) stocks here. Want the latest recommendations from Zacks Investment Research? Today, you can download 7 Best Stocks for the Next 30 Days. Click to get this free report BHP Group Limited Sponsored ADR (BHP) : Free Stock Analysis Report Rio Tinto PLC (RIO) : Free Stock Analysis Report Southern Copper Corporation (SCCO) : Free Stock Analysis Report This article originally published on Zacks Investment Research (zacks.com). DuPont de Nemours, Inc. DD is expanding its FilmTec Fortilife portfolio by introducing new membrane elements aimed at improving industrial water treatment, particularly for Zero Liquid Discharge (ZLD), Minimal Liquid Discharge (MLD) and resource recovery applications. The company launched two new reverse osmosis membrane elements, the FilmTec Fortilife XC220 and the FilmTec Fortilife XC-Max UHP. These products are designed to help industrial users enhance water recovery while optimizing system performance under increasingly stringent environmental regulations. The FilmTec Fortilife XC220 operates at pressures up to 83 bar and handles brine concentrations of up to 220 g/L sodium chloride. This helps reduce downstream treatment needs, cut liquid waste and lower operating costs. It also enables efficient resource recovery in integrated MLD systems. The XC-Max UHP is built for ultra-high salinity and pressures up to 120 bar. It can process reject streams with TDS levels up to 250 g/L. This capability allows membrane systems to move into areas traditionally served by thermal methods like evaporation, improving efficiency and reducing energy use. The expansion highlights a wider industry move toward membrane-based solutions. Traditional ZLD systems depend heavily on thermal methods, while MLD technologies are gaining adoption due to their lower cost and better energy efficiency. DuPont’s new elements are designed to support this shift by delivering strong performance even under extreme conditions. Shares of DD are down 22% in the past year against the industry’s 21.6% growth. Image Source: Zacks Investment Research DD’s Zacks Rank & Other Key Picks DD currently carries a Zacks Rank #1 (Strong Buy). Other top-ranked stocks in the Basic Materials space include Compass Minerals International, Inc. CMP, Johnson Matthey Plc JMPLY and Asahi Kasei Corporation AHKSY. CMP carries a Zacks Rank of #1, while JMPLY and AHKSY have a Zacks Rank of #2 (Buy). You can see the complete list of today’s Zacks #1 Rank stocks here. The Zacks Consensus Estimate for CMP’s current fiscal-year earnings is pegged at 89 cents per share, indicating a 285.4% year-over-year increase. Its earnings beat the Zacks Consensus Estimate in two of the trailing four quarters while missing twice, with the average surprise being 34.9%. The Zacks Consensus Estimate for JMPLY’s current-year earnings stands at $4.34 per share, implying a 13.9% year-over-year increase. Shares of JMPLY have surged 70.8% over the past year. The Zacks Consensus Estimate for AHKSY’s current fiscal-year earnings is pegged at $1.38 per share, indicating a 7.8% year-over-year increase. Shares of AHKSY have surged 52.2% over the past year.
Want the latest recommendations from Zacks Investment Research? Today, you can download 7 Best Stocks for the Next 30 Days. Click to get this free report DuPont de Nemours, Inc. (DD) : Free Stock Analysis Report Compass Minerals International, Inc. (CMP) : Free Stock Analysis Report Asahi Kasei Corp. (AHKSY) : Free Stock Analysis Report Johnson Matthey PLC (JMPLY) : Free Stock Analysis Report This article originally published on Zacks Investment Research (zacks.com). If you would like to receive our free newsletter via email, simply enter your email address below & click subscribe. CONNECT WITH USTweetsTweet with hash tag #miningfeeds or @miningfeeds and your tweets will be displayed across this site. MOST ACTIVE MINING STOCKSDaily Gainers
© 2026 MiningFeeds.com. All rights reserved.
MENU
| |||||||||||||||||||||||||||||||||
 Follow us on Twitter
 Become our facebook fan


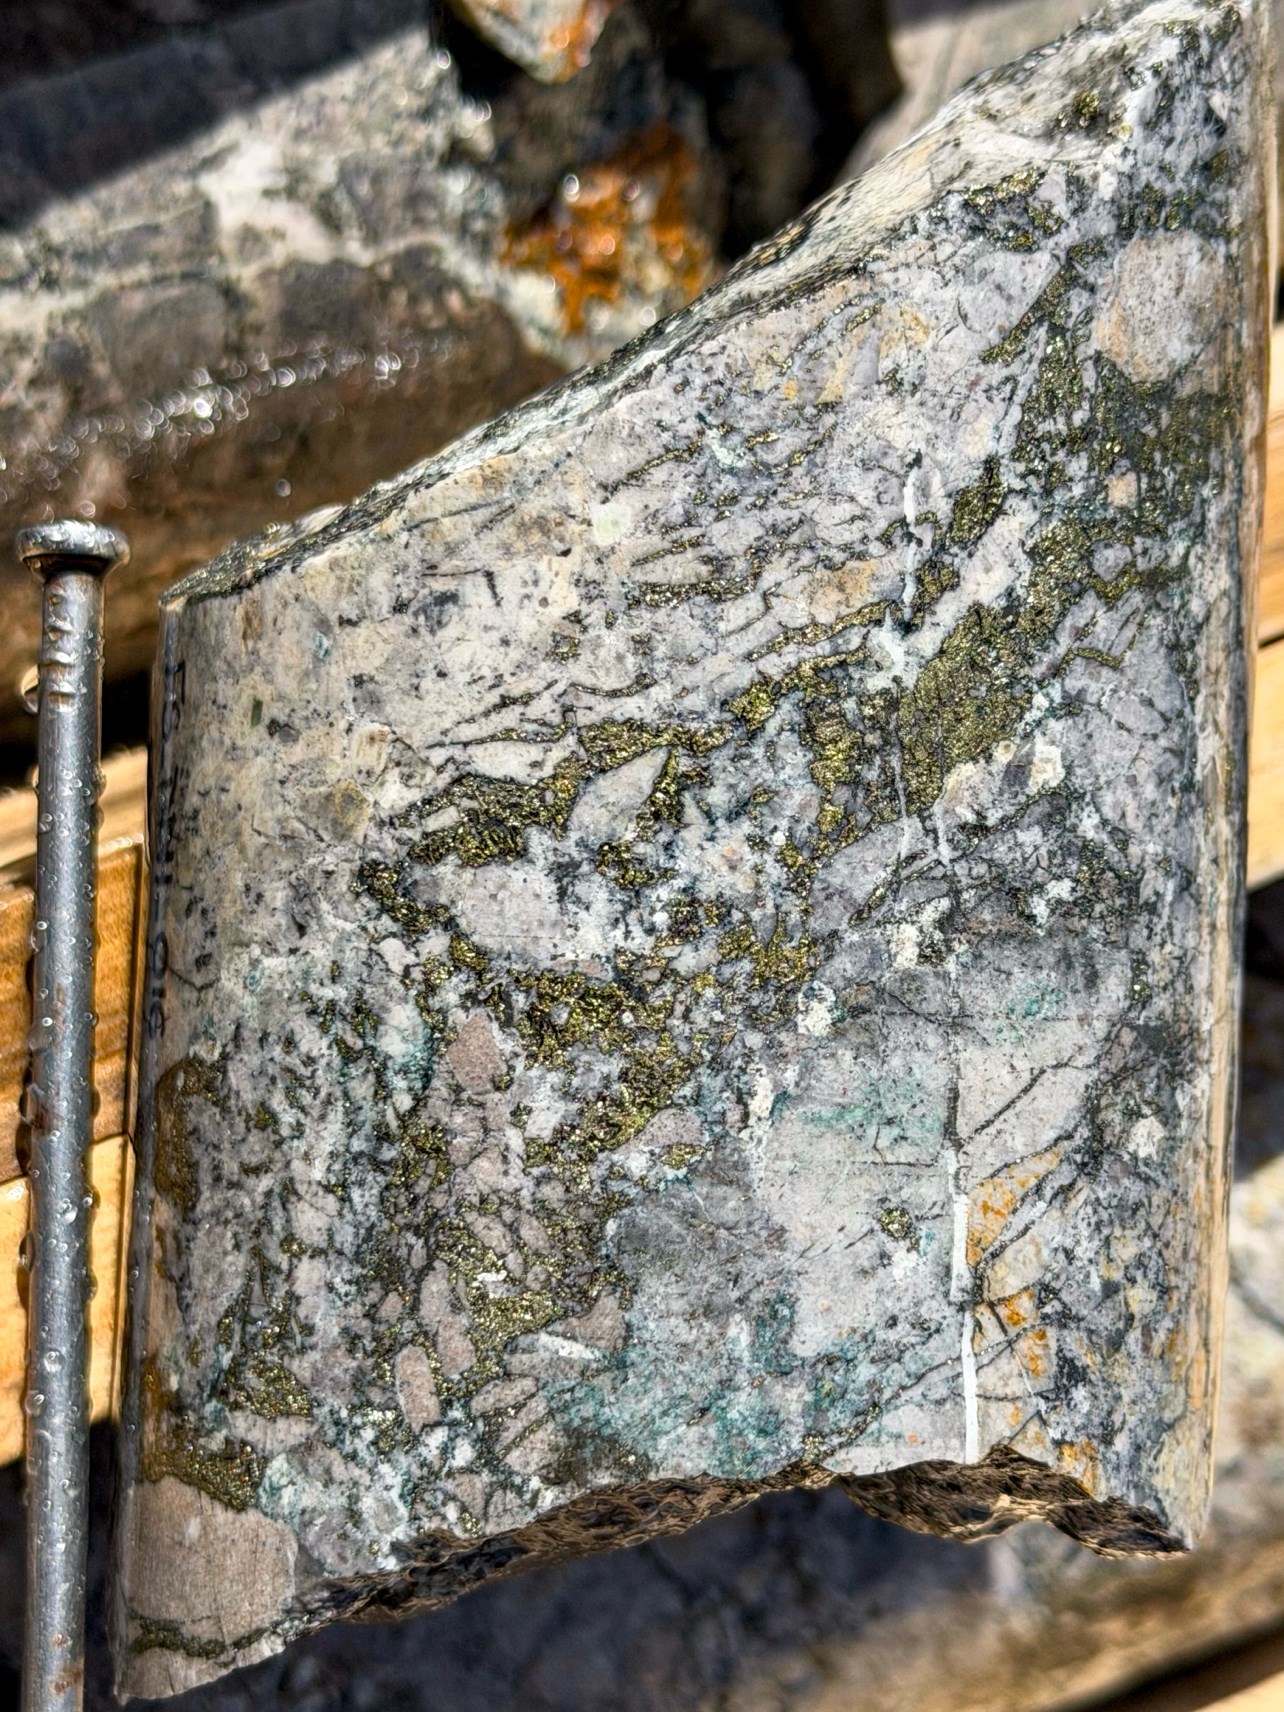
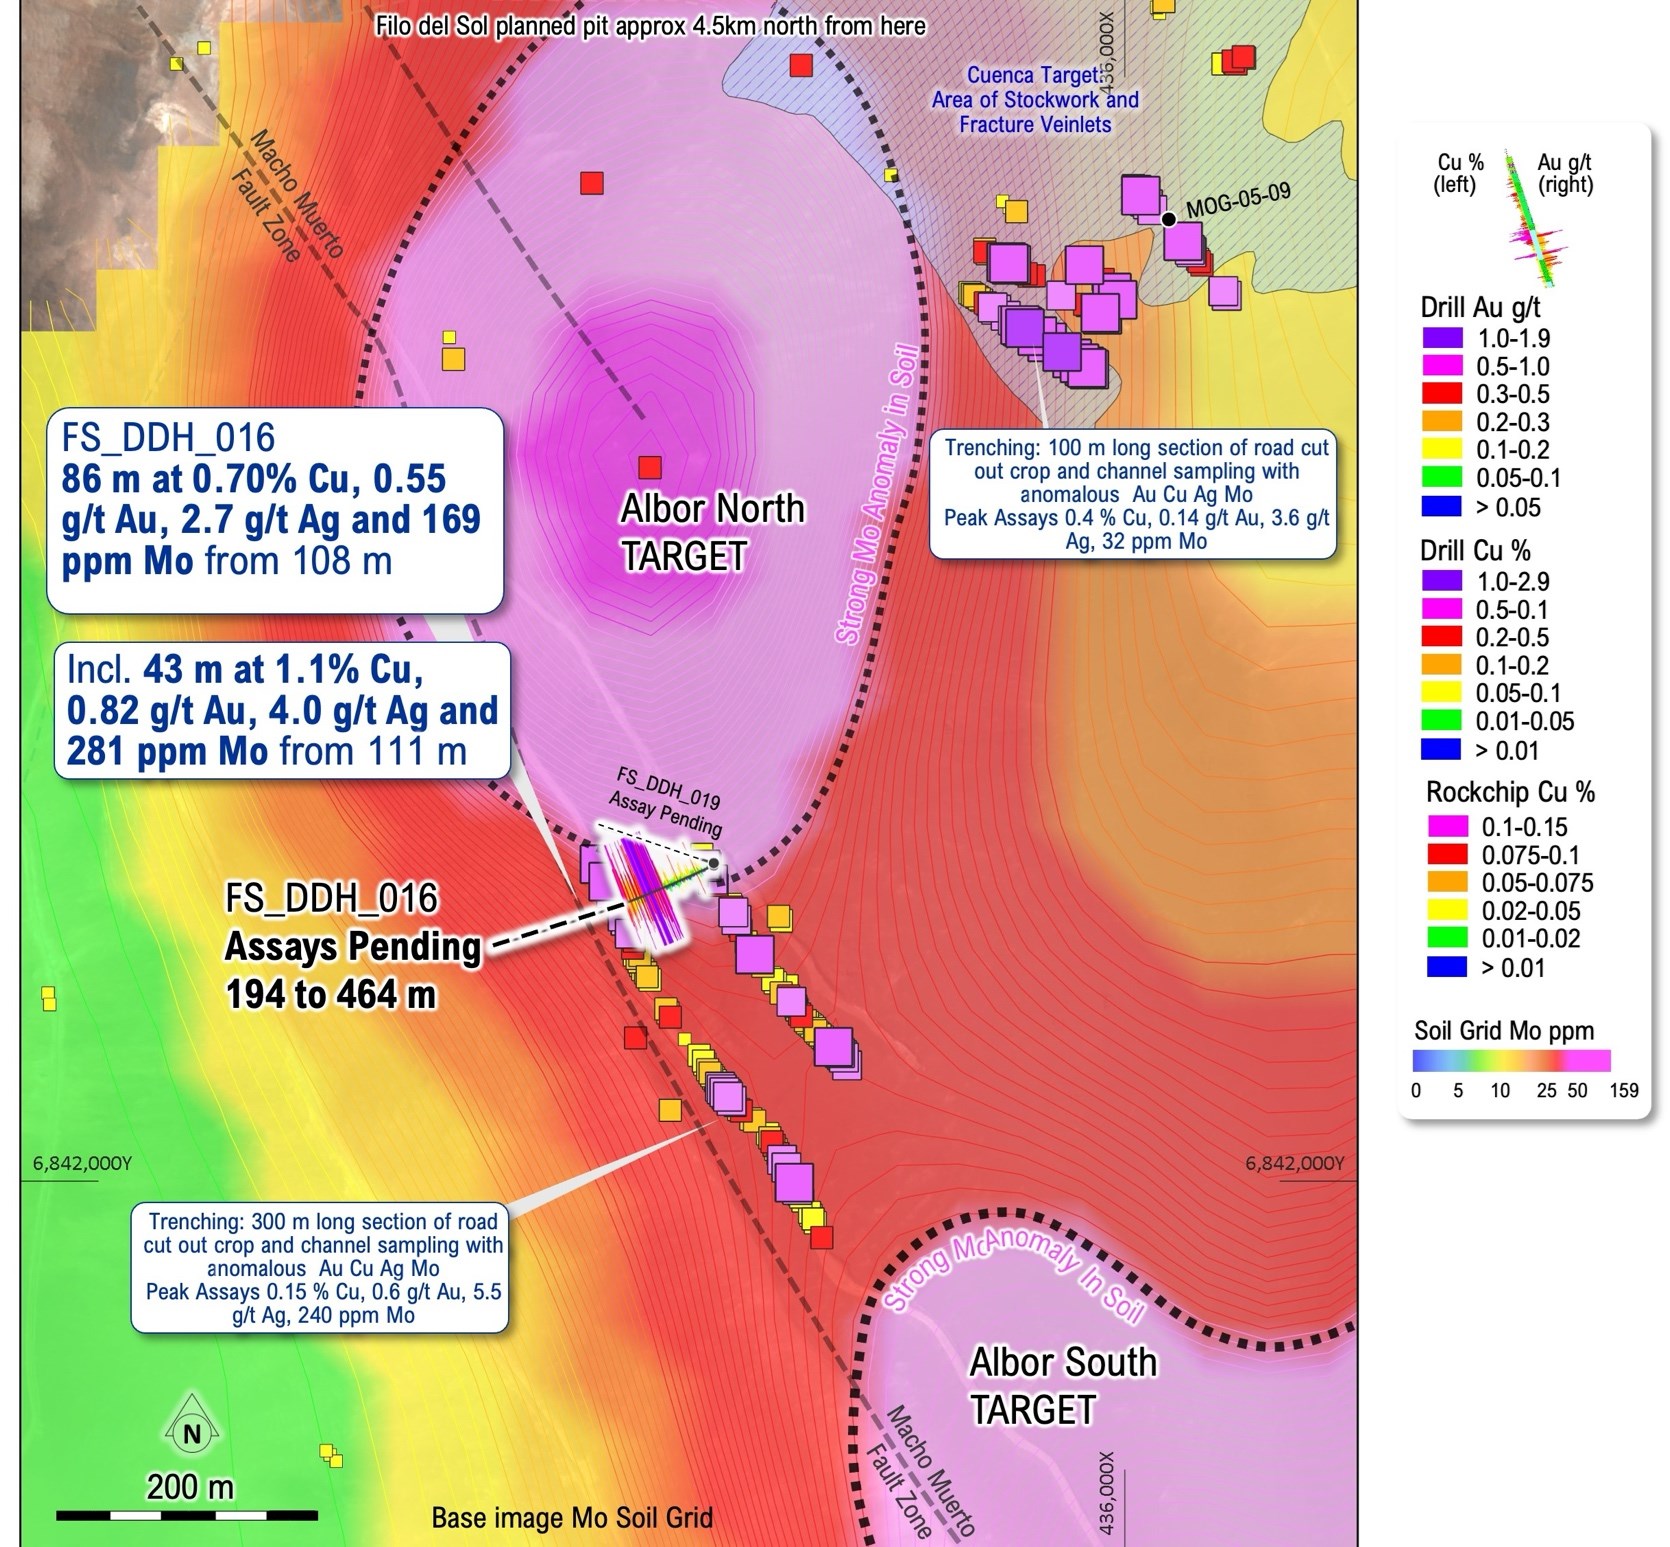
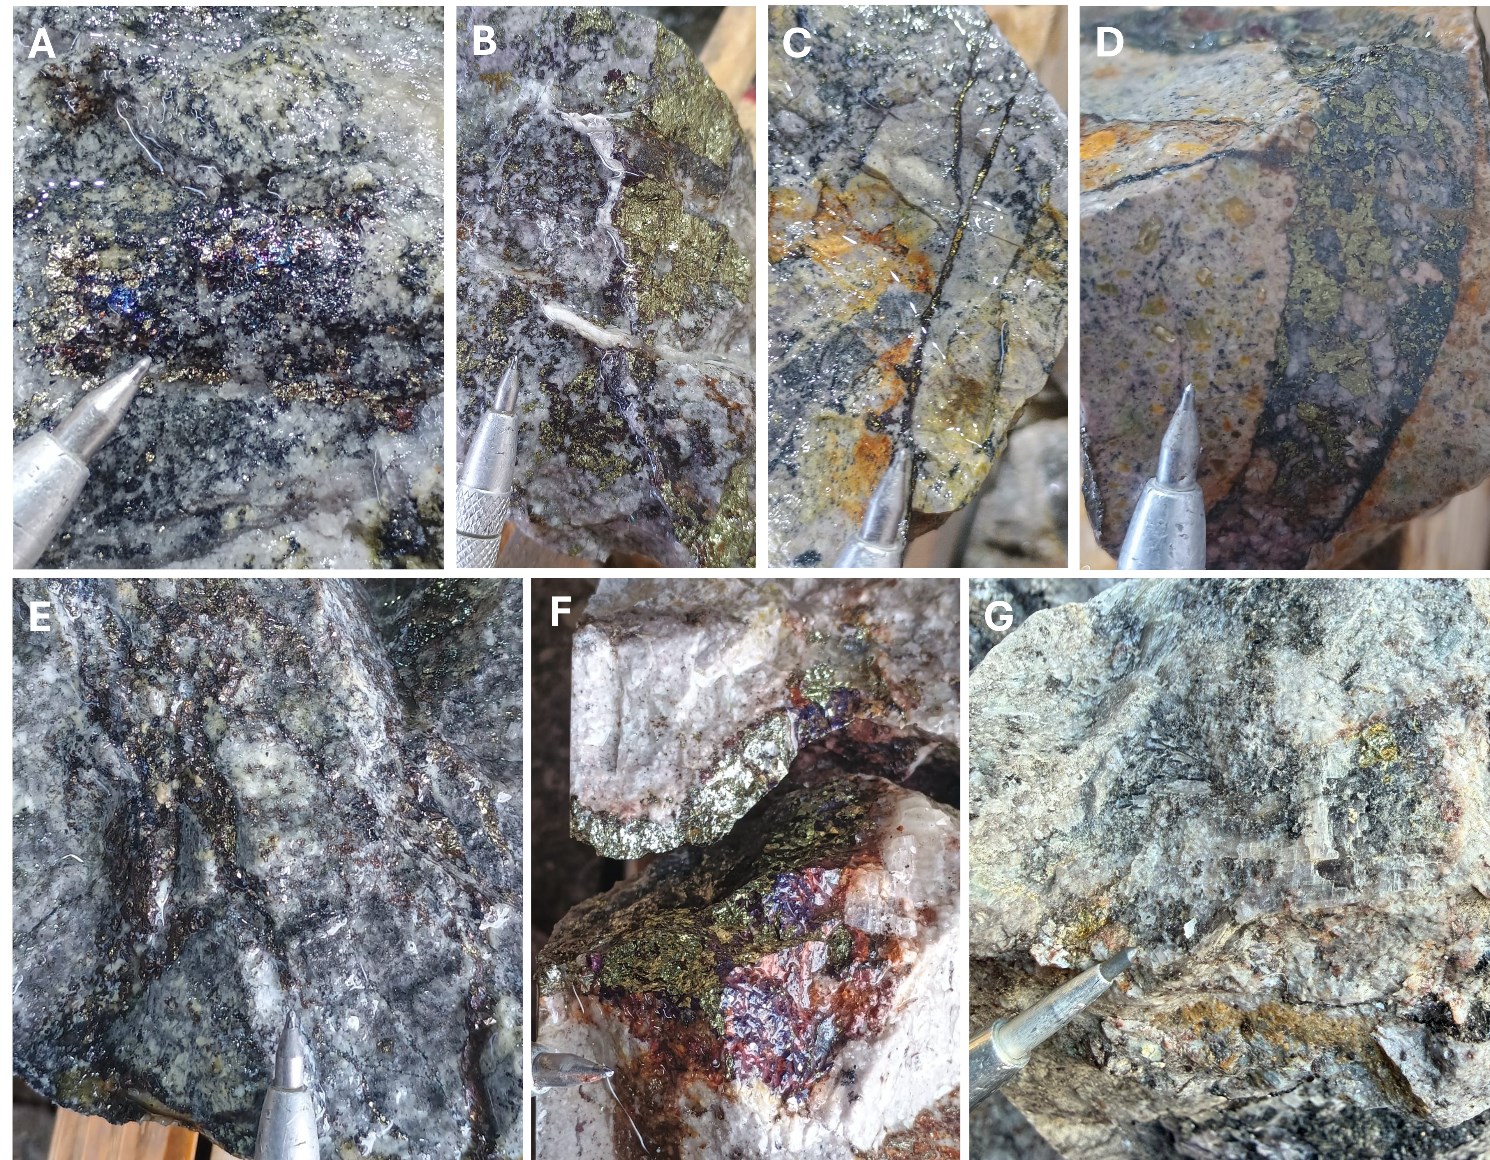
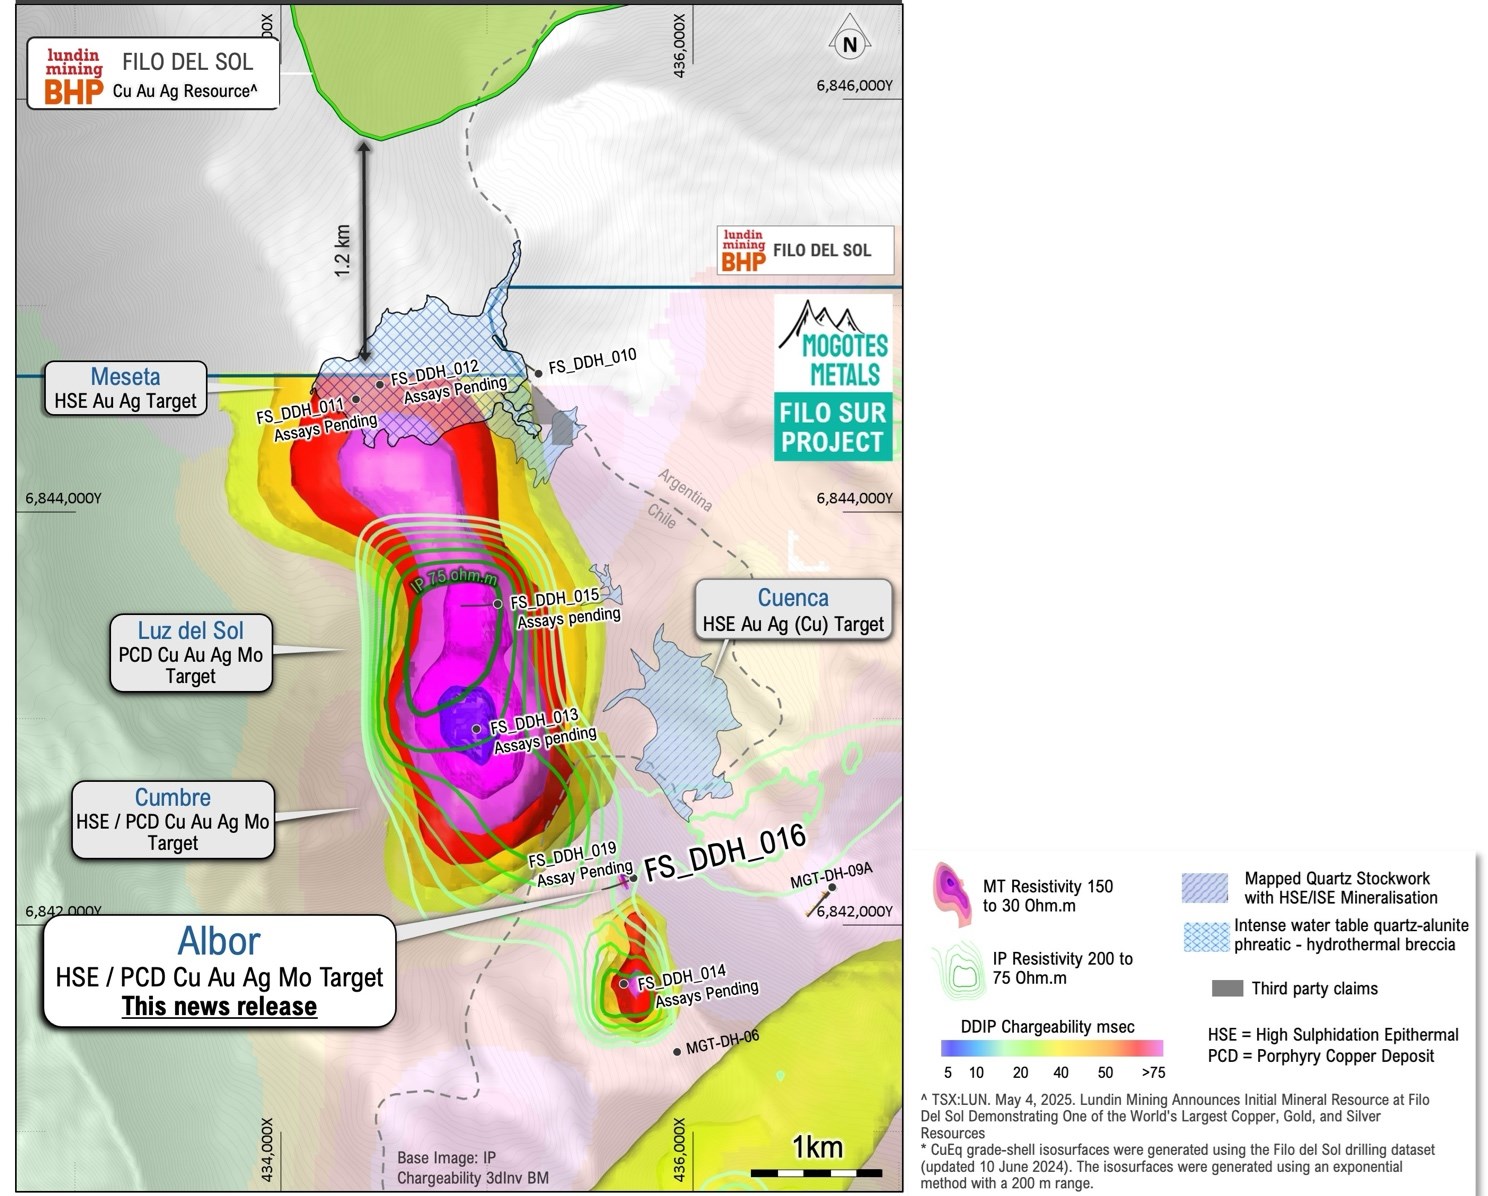
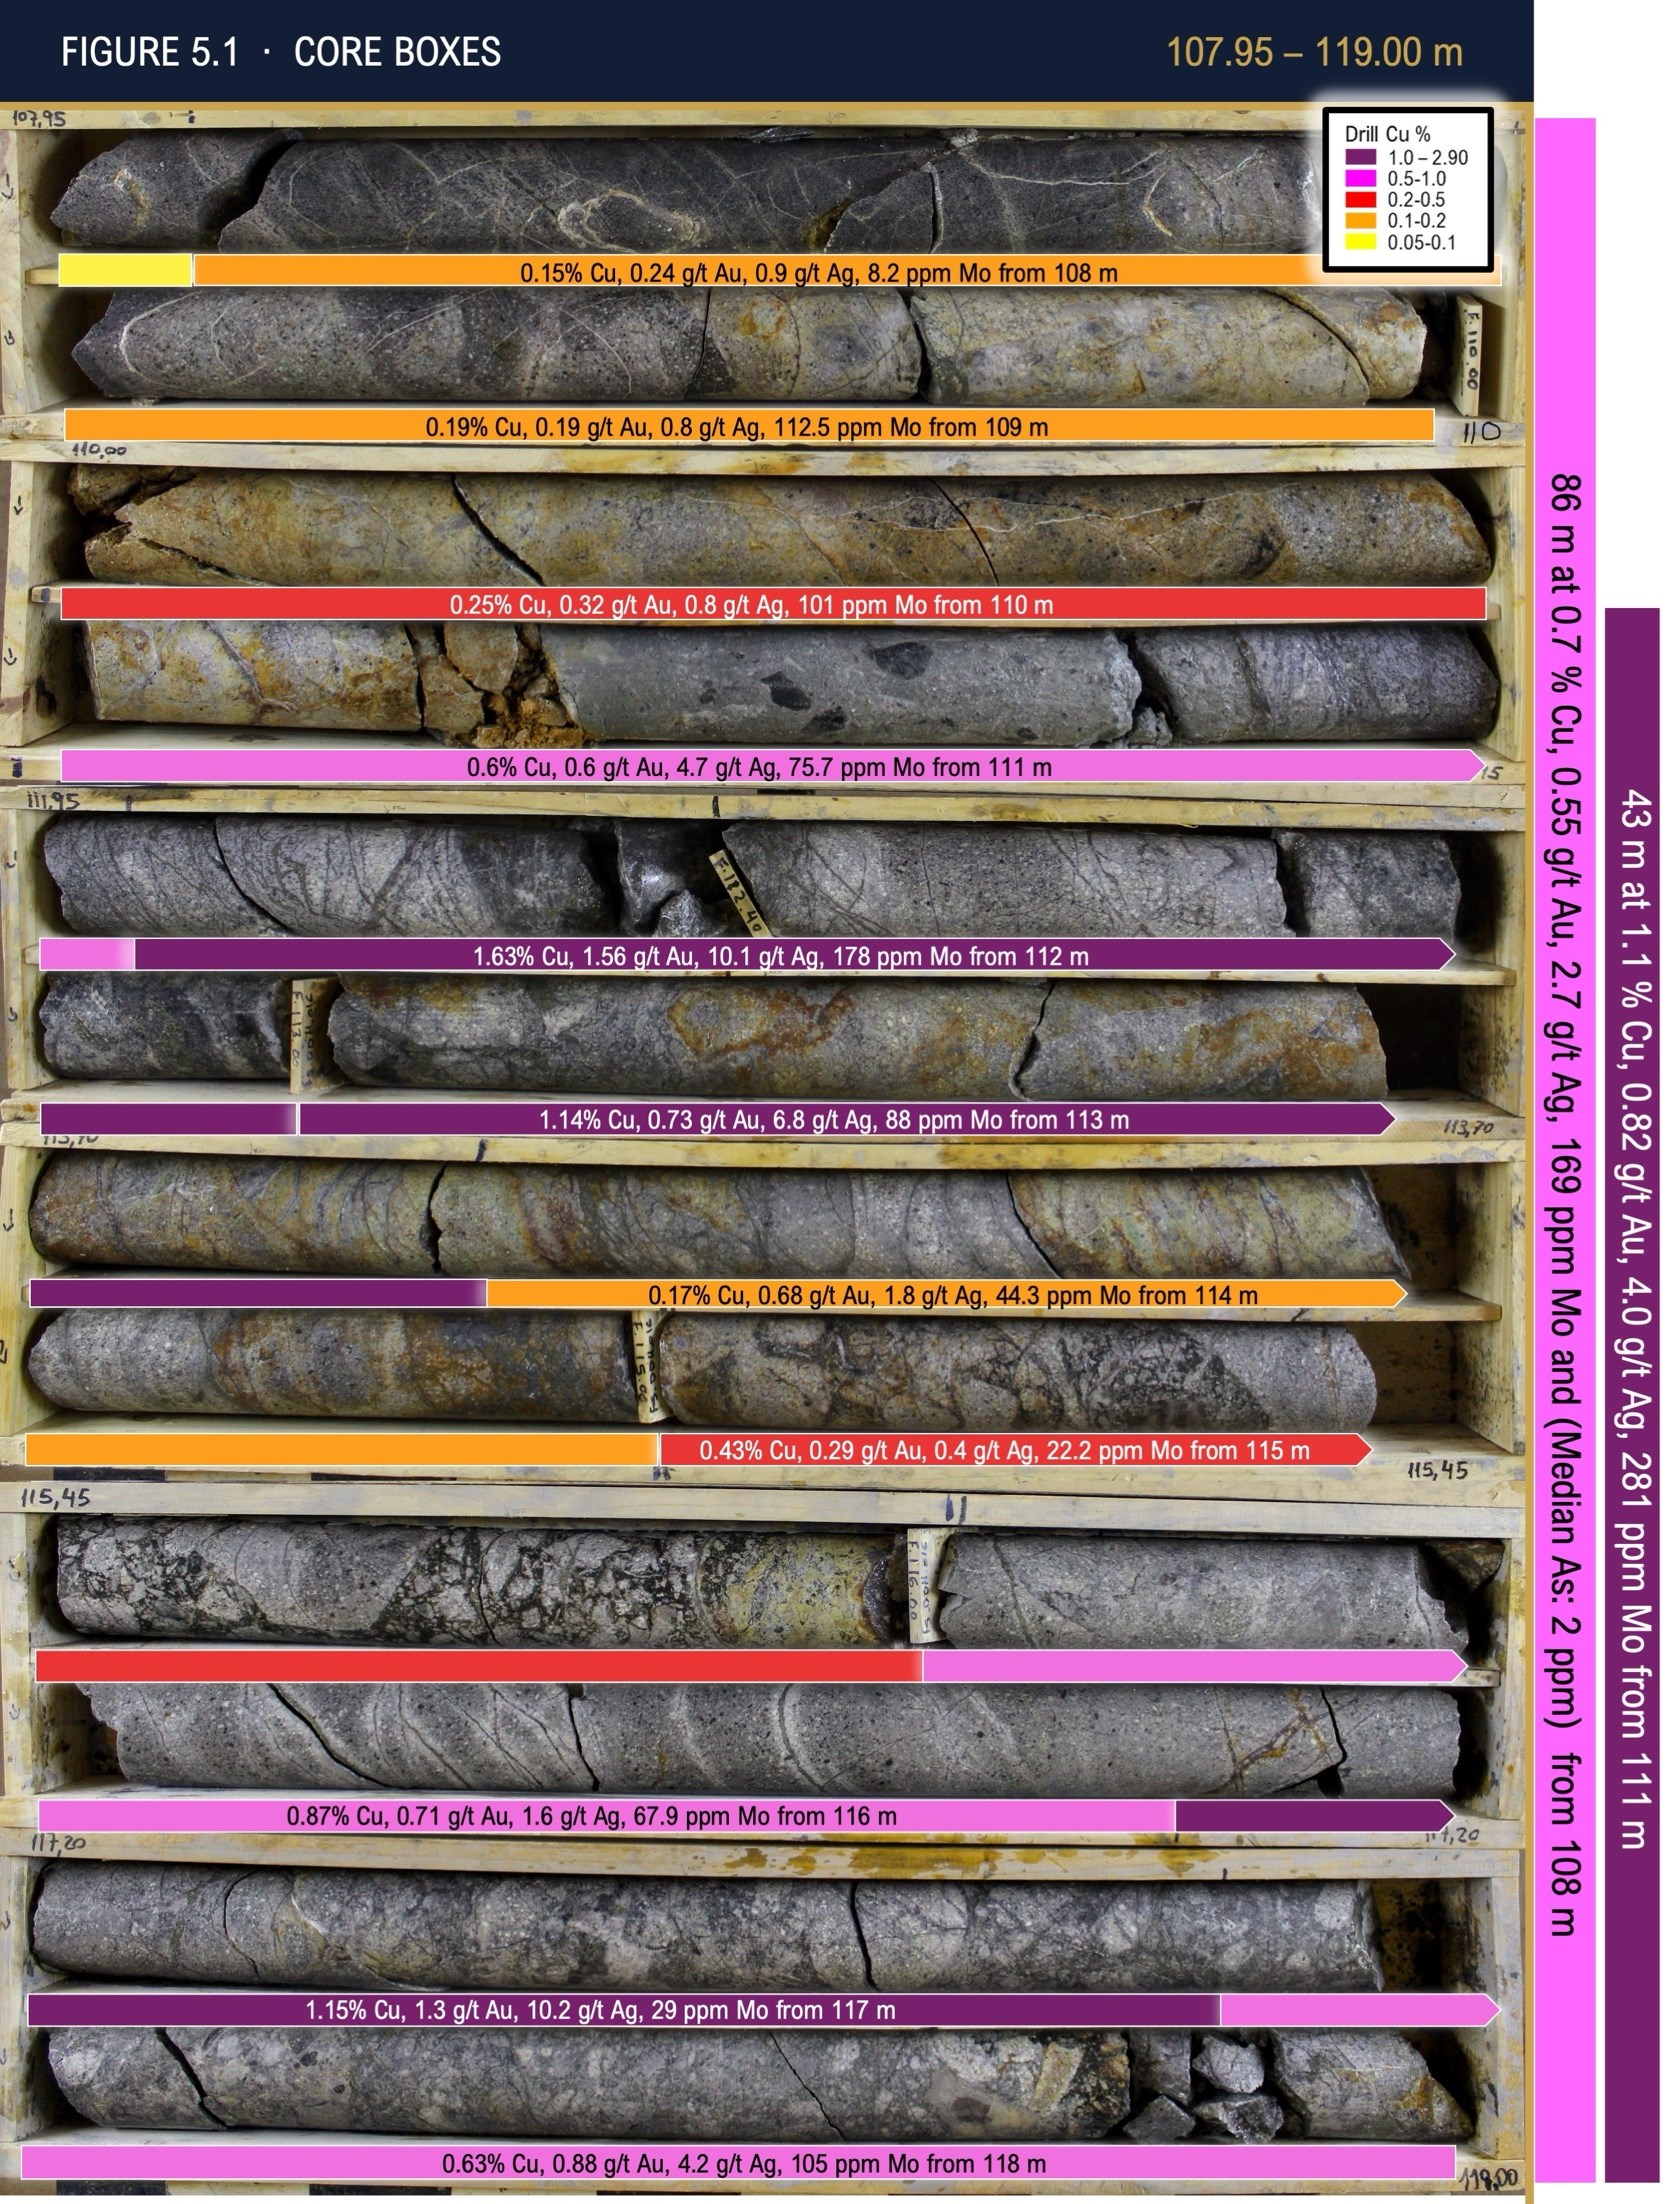
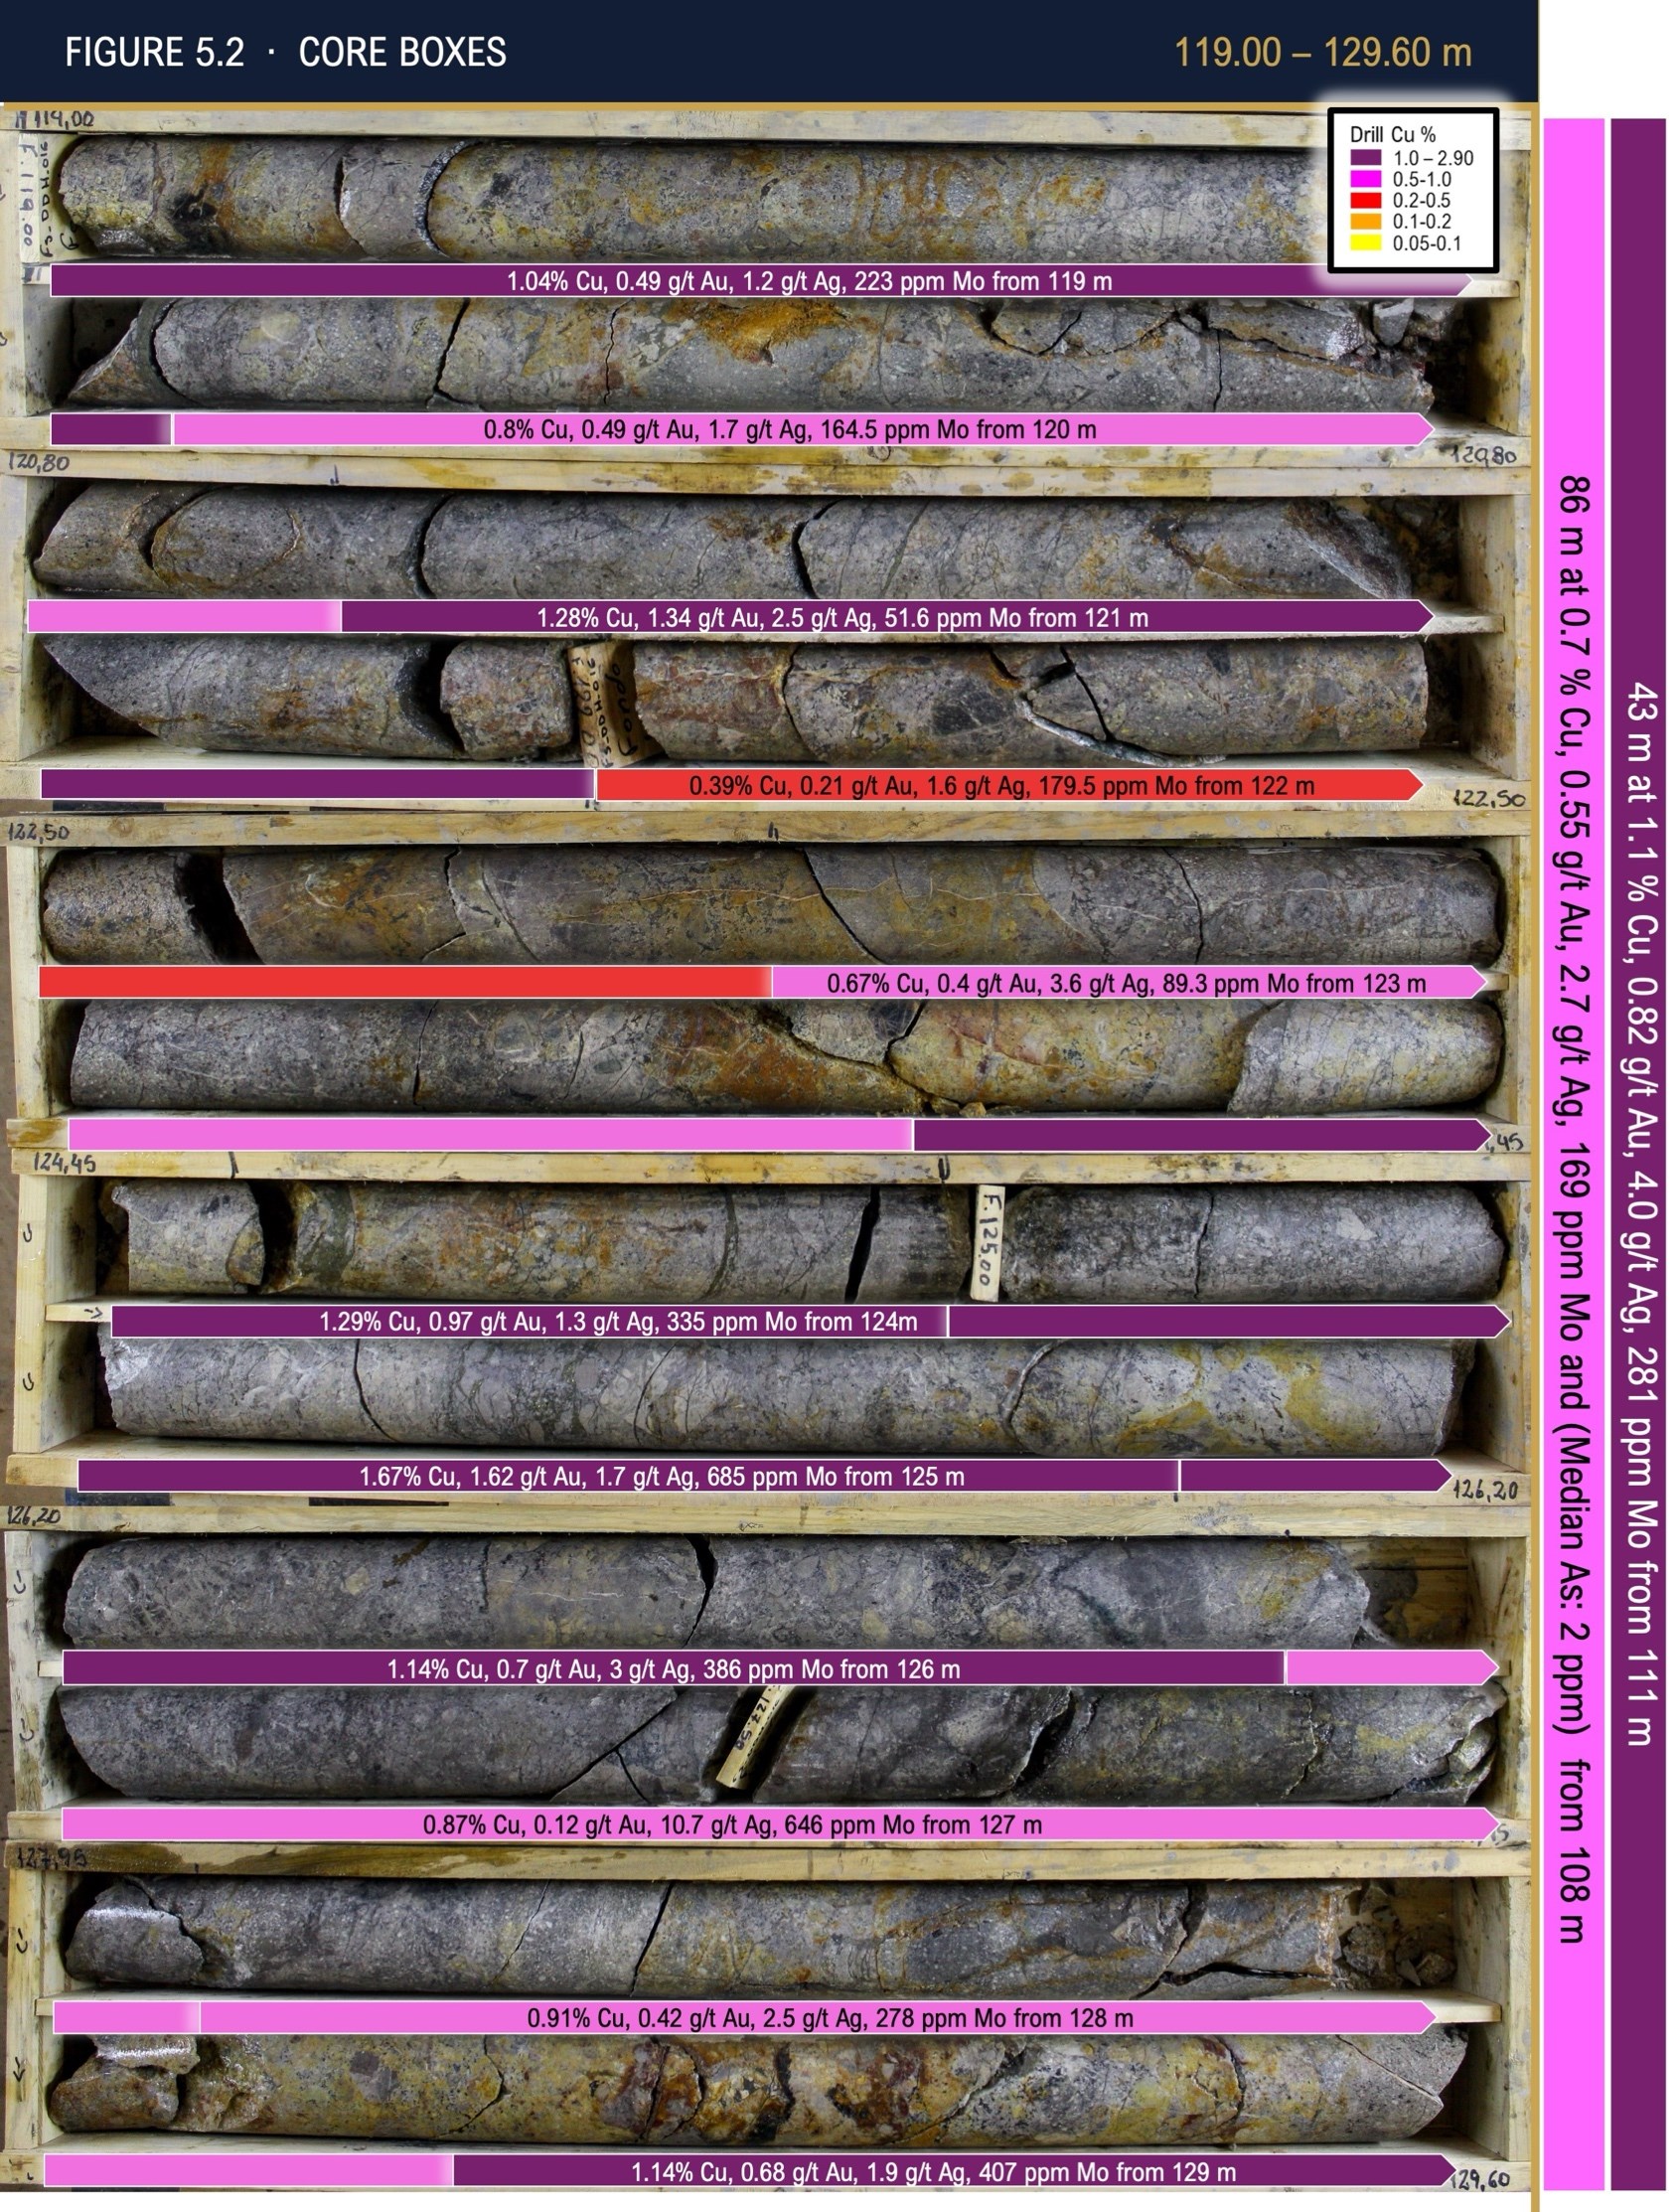
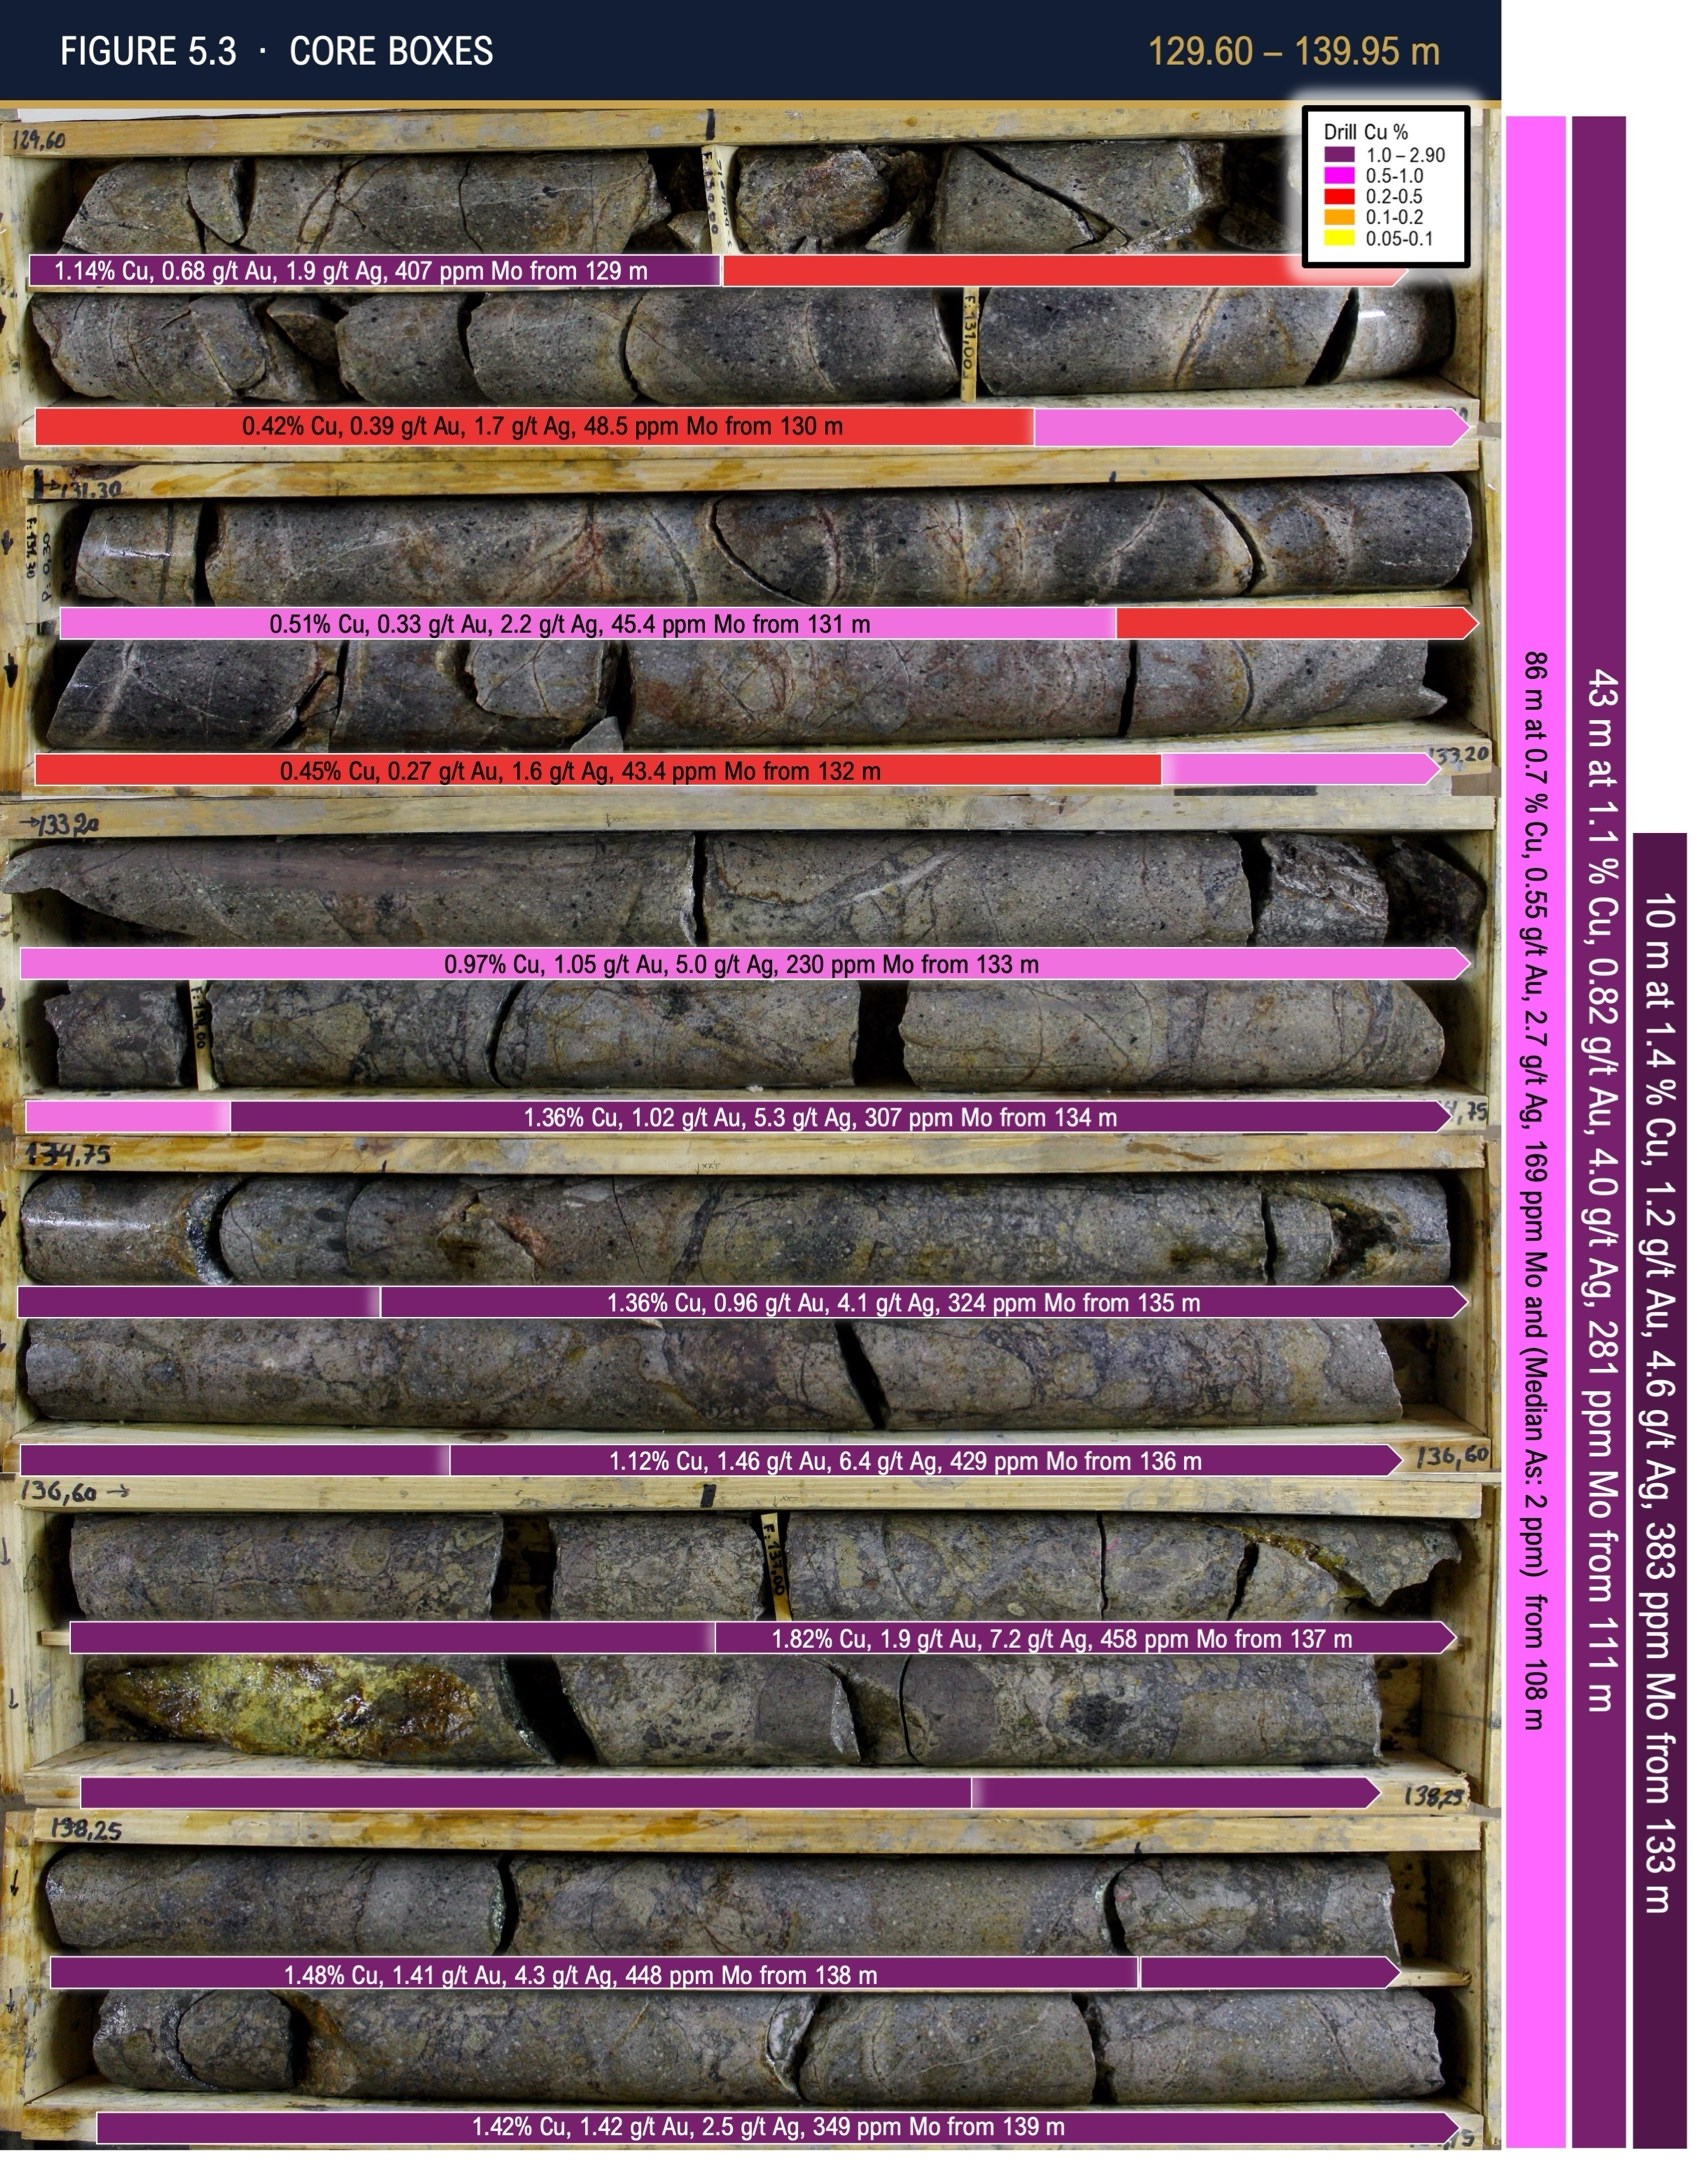
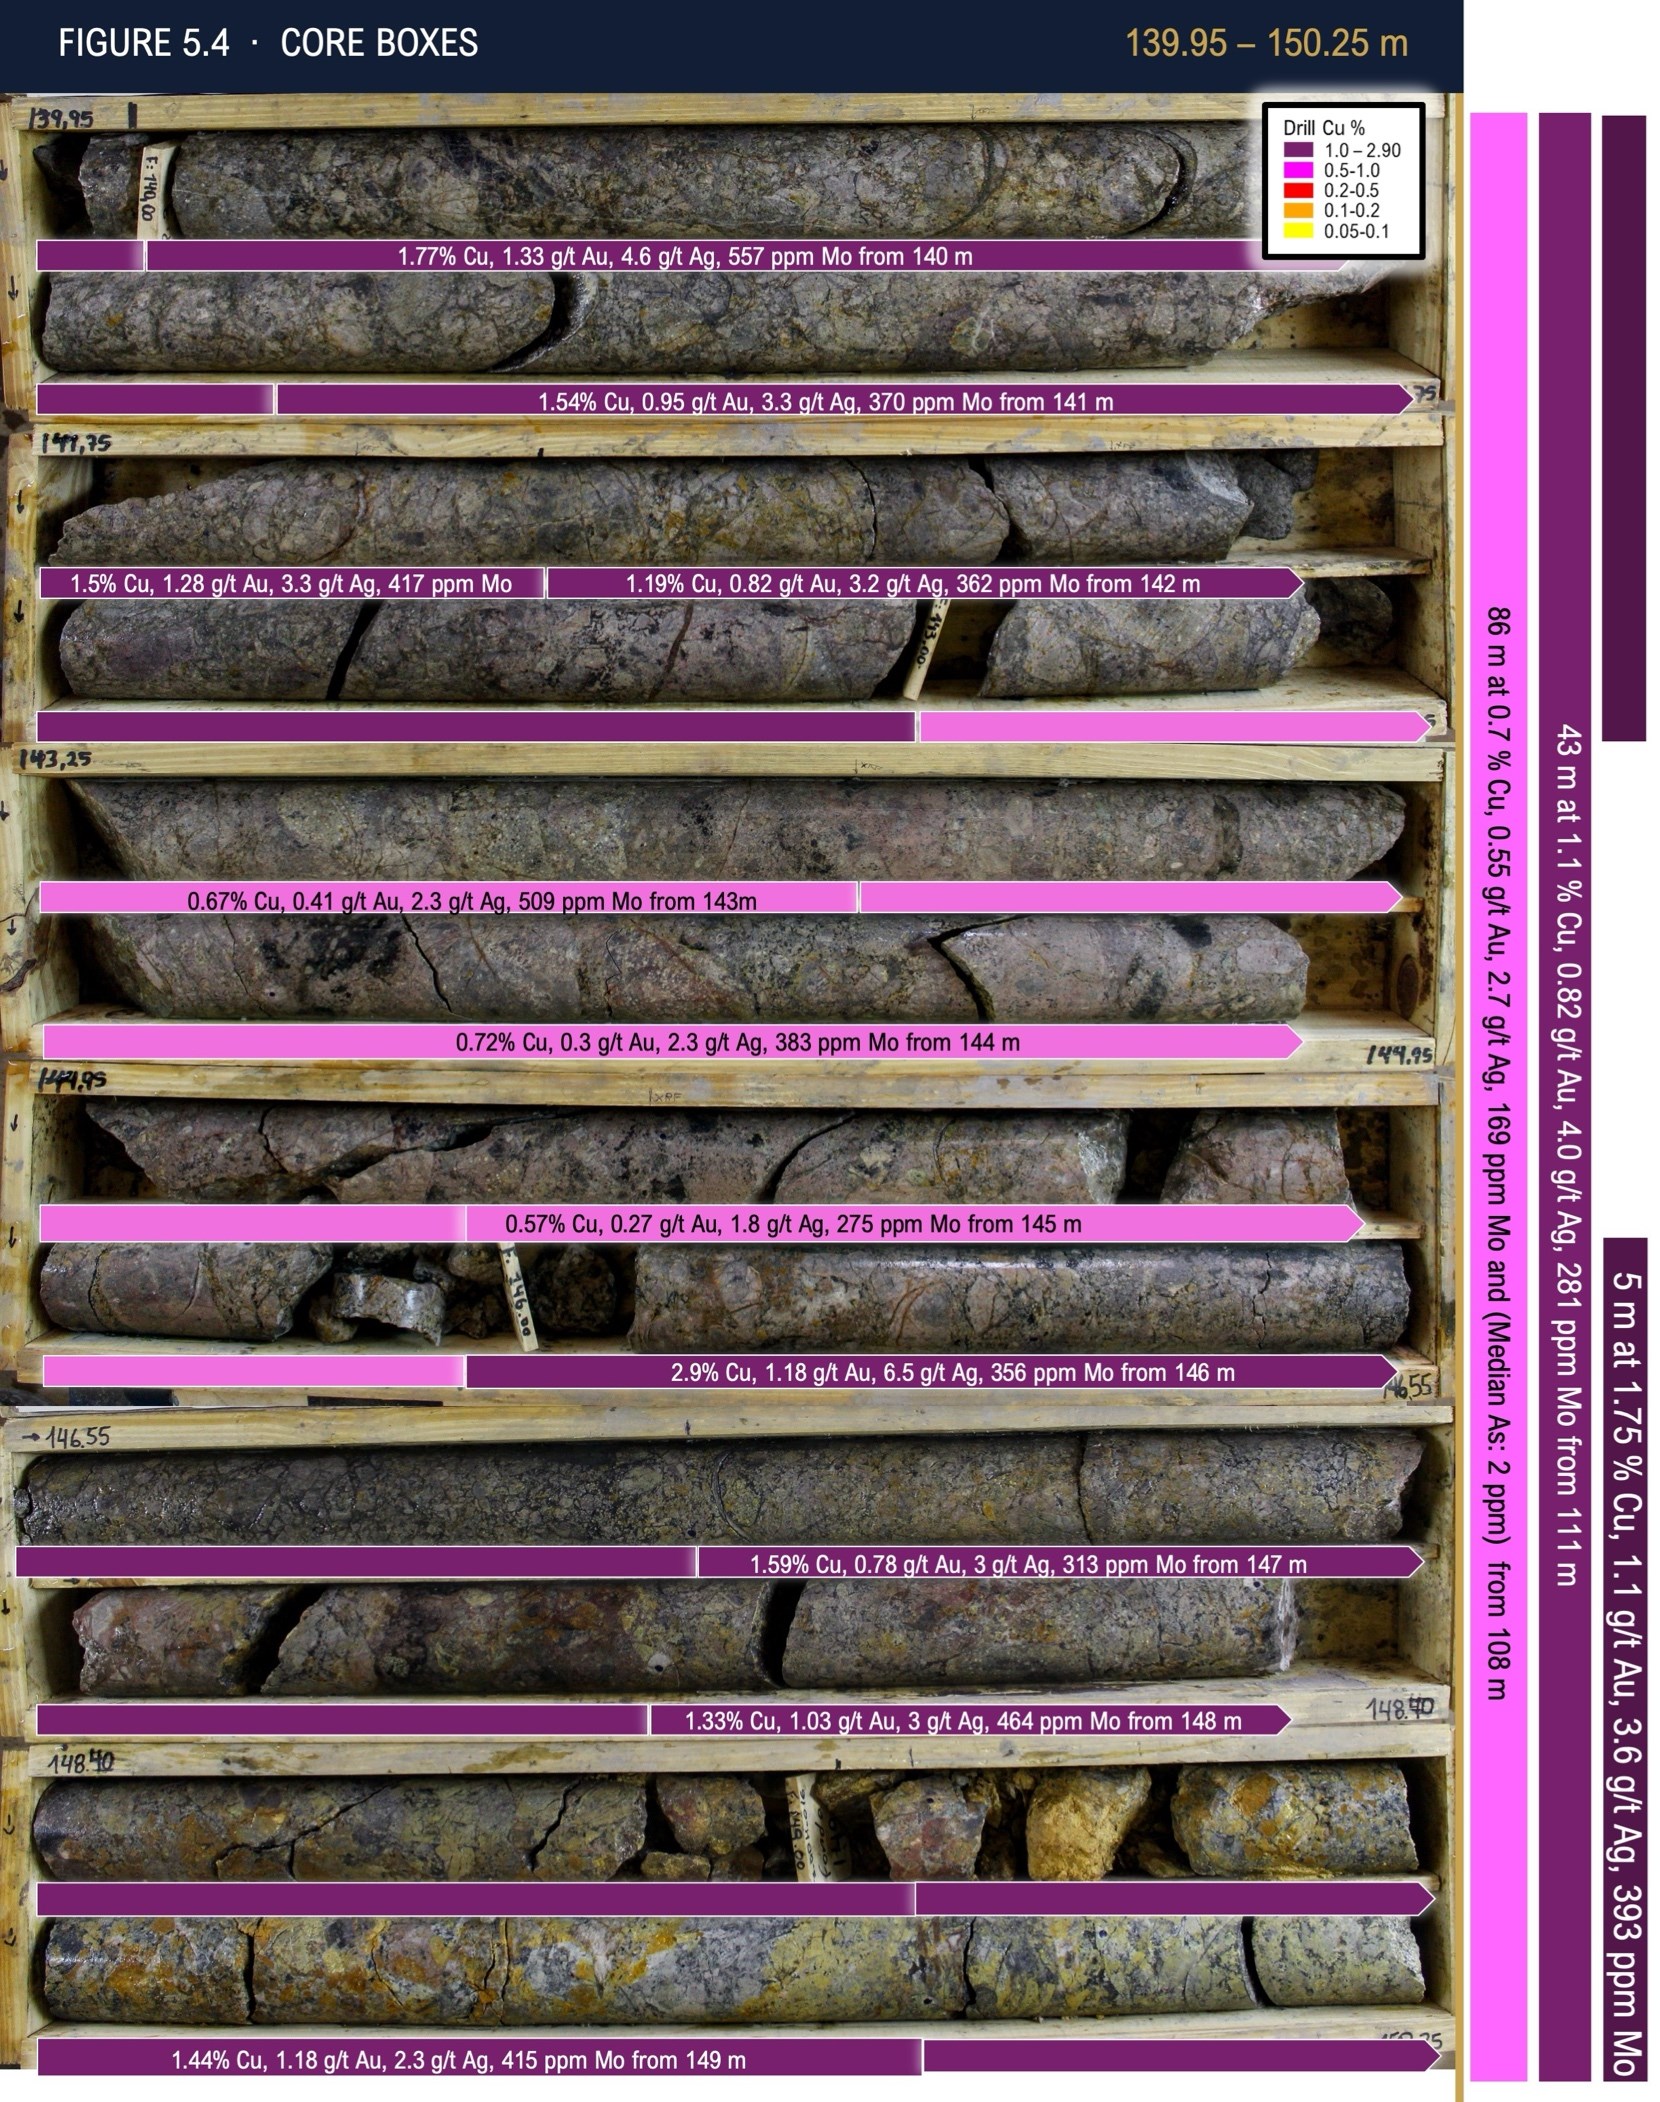
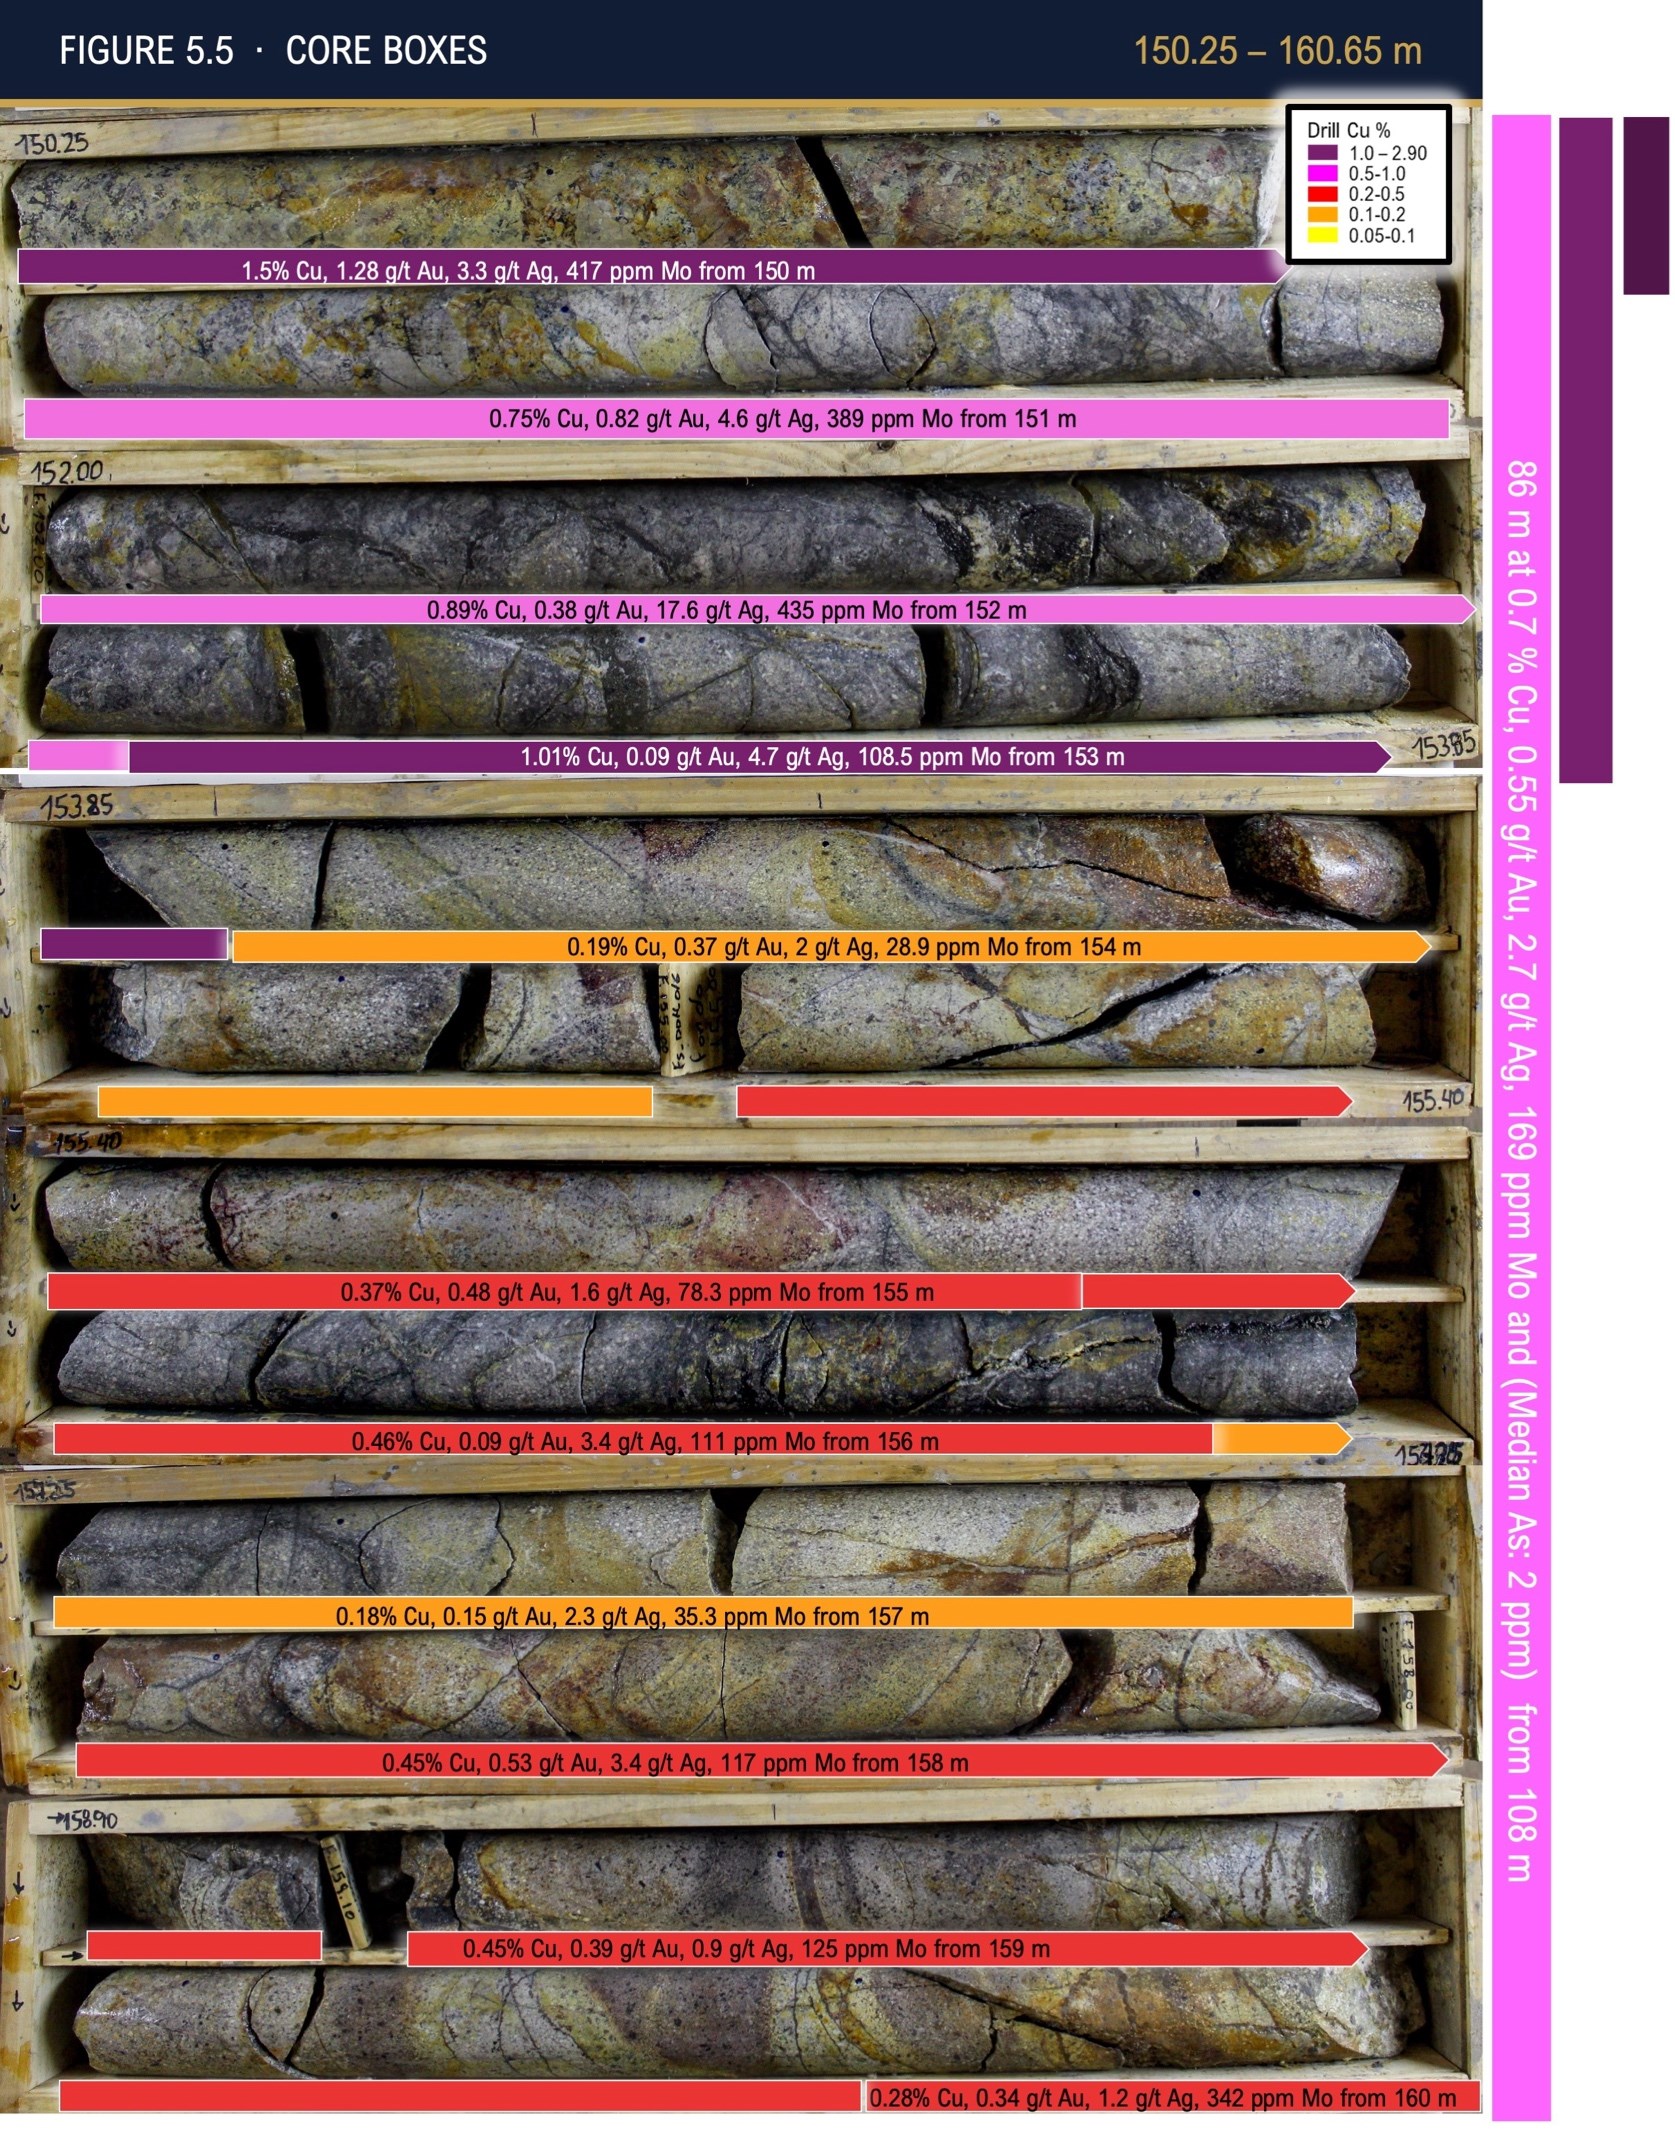
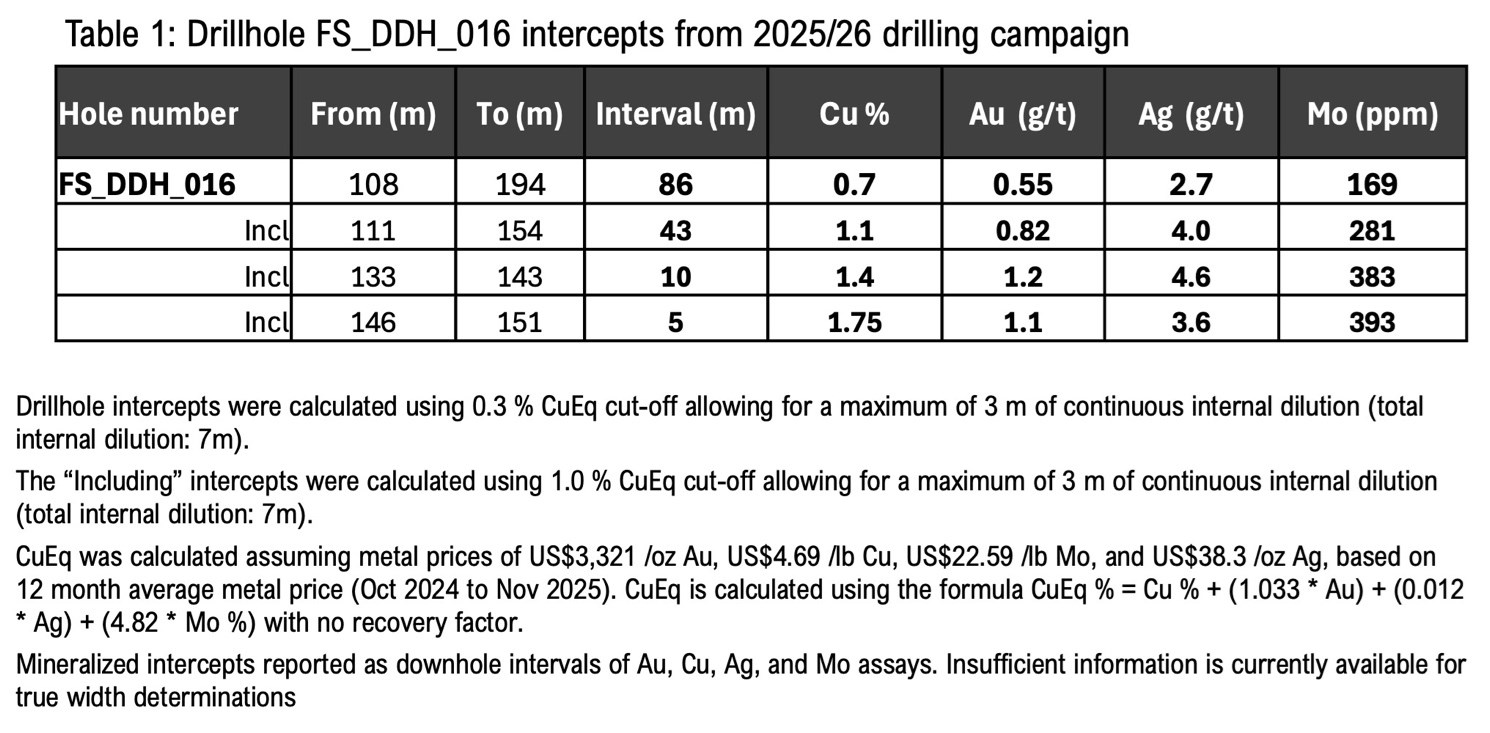
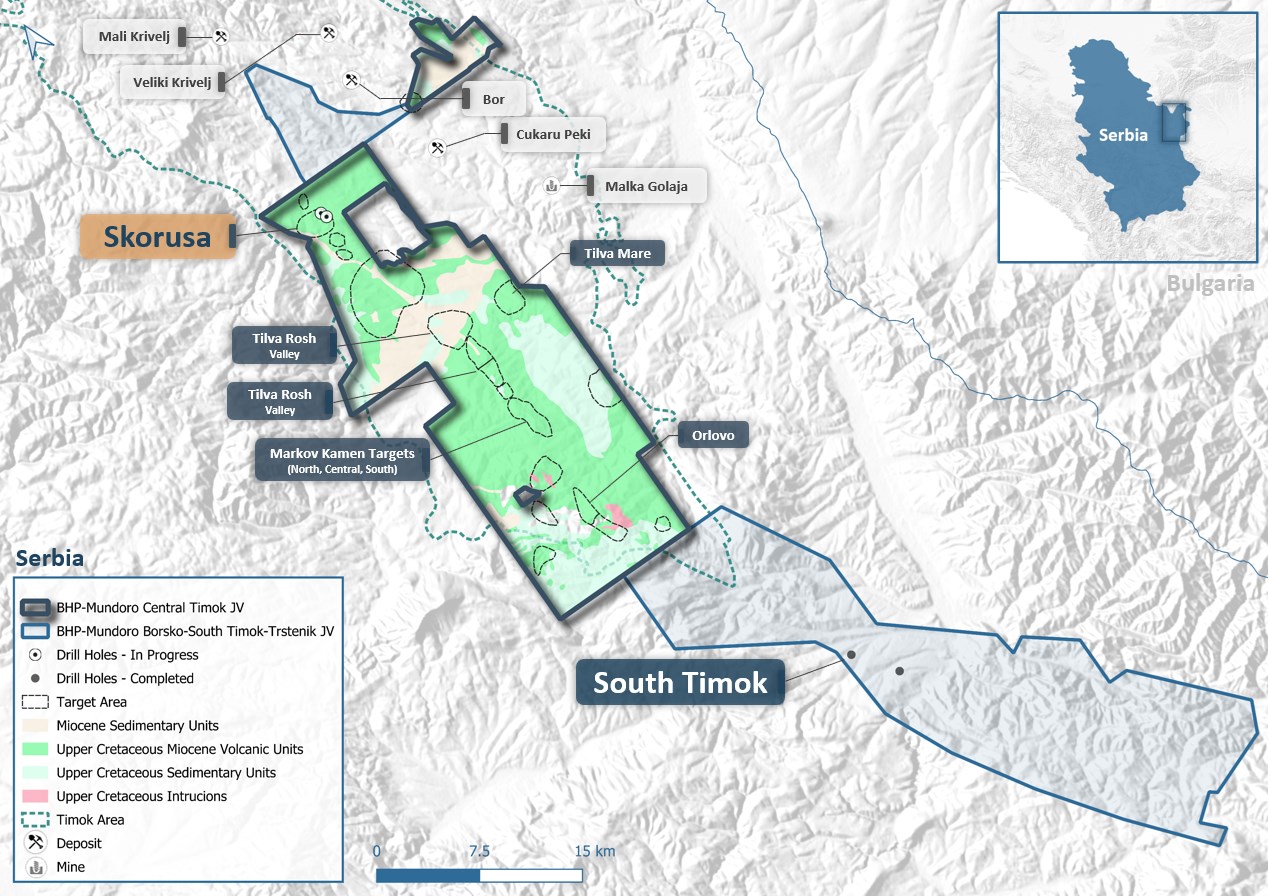