VANCOUVER, BC / ACCESS Newswire / June 16, 2026 / Apex Critical Metals Corp. (CSE:APXC)(OTCQX:APXCF)(FWB:KL9) ("Apex" or the "Company"), a mineral exploration company focused on advancing its strategic 100%-controlled Rift Rare Earth Project (the "Rift Project") within the Elk Creek Carbonatite Complex in southeastern Nebraska, U.S.A., is pleased to announce that the Company filed a technical report for the Rift Project entitled "NI 43-101 Technical Report on the Rift Project, Johnson and Pawnee Counties, Nebraska, USA" with an effective date of May 15, 2026, prepared for Apex by Robin J. Wilson, B.Sc. (Hons) Geology, MAusIMM, MAIG (the "Technical Report"). The Technical Report was prepared in accordance with National Instrument 43-101 – Standards of Disclosure for Mineral Projects ("NI 43-101") and is available under the Company's issuer profile on SEDAR+ (available at www.sedarplus.ca).
About Apex Critical Metals Corp. (CSE:APXC)(OTCQX:APXCF)(FWB:KL9)
Apex Critical Metals Corp. is a Canadian exploration company focused on advancing rare earth element (REE) and niobium projects that support the growing demand for critical and strategic metals across the United States and Canada. The Company's flagship Rift Project, located within the highly prospective Elk Creek Carbonatite Complex in Nebraska, U.S.A., hosts extensive rare earth rights surrounding one of North America's most advanced niobium deposits. Two historical drillholes located within the 700 m corridor of interest returned broad intervals of >2.00% REO, with higher grade (>3.00% REO) intervals within. The Company's 2026 drilling has continued to demonstrate this grade profile and have expanded the footprint of the high-grade mineralization ("Trinity Zone) over approximately 380 m from the historical drillholes to-date. Additionally, drilling has delineated a new deeper horizon ("Neo Zone") of strongly elevated NdPr beneath the high-grade material with NdPr distributions between 30-50%. For more information, please see the Company's news releases dated April 7, 2026, April 28, 2026, May 6, 2026 and May 15, 2026, which are available under the Company's issuer profile on SEDAR+ (available at www.sedarplus.ca).
In Canada, Apex continues to advance its 100%-owned Cap Project, located 85 kilometres northeast of Prince George, British Columbia. The 2025 drill program confirmed an emerging niobium discovery with 0.59% Nb₂O₅ over 36 metres, including 1.08% Nb₂O₅ over 10 metres, within a 1.8-kilometre-long niobium trend. The Cap Project continues to demonstrate strong potential for niobium mineralization within a large and previously unrecognized carbonatite system.
With a growing portfolio of critical mineral projects in both Canada and the United States, Apex Critical Metals is strategically positioned to help strengthen domestic supply chains for the minerals essential to advanced technologies, clean energy, and national security. Apex is publicly listed in Canada on the Canadian Securities Exchange (CSE) under the symbol APXC and quoted on the OTCQX market in the United States under the symbol APXCF, and in Germany on the Borse Frankfurt under the symbol KL9 and/or WKN: A40CCQ. Find out more at www.apexcriticalmetals.com and watch our videos at https://apexcriticalmetals.com/apex-critical-metals-corporate-video/ and make sure to stay in touch by signing up for free news alerts at https://apexcriticalmetals.com/news/news-alerts/, or by following us on X (formerly Twitter), Facebook or LinkedIn.
On Behalf of the Board of Directors of
APEX CRITICAL METALS CORP.
Sean CharlandChief Executive OfficerTel: 604.681.1568Email: info@apexcriticalmetals.com
Neither the Canadian Securities Exchange (CSE) nor its Market Regulator (as that term is defined in the policies of the CSE) accepts responsibility for the adequacy or accuracy of this release.
CAUTIONARY STATEMENT REGARDING FORWARD-LOOKING STATEMENTS
This news release may contain "forward-looking information" as defined under applicable Canadian securities legislation and "forward-looking statements" as defined under applicable United States securities laws (collectively, "forward-looking statements"). Forward-looking statements consist of statements that are not purely historical, including any statements regarding beliefs, plans, expectations or intentions regarding the future. Forward-looking statements in this news release include (without limitation) statements regarding: the Company's exploration plans, drill programs and advancement of its mineral properties, including the Company's Rift Project, Cap Project, and other prospective asset; the potential for growing the portfolio through additional acquisitions or exploration; and the growing demand for critical and strategic metals across the United States and Canada. Forward-looking statements are subject to various known and unknown risks and uncertainties that may cause actual results, performance or developments to differ materially from those contained in the statements. Risks that could change or prevent these events, activities or developments from coming to fruition include: the Company's properties are at an early stage of development and no current mineral resources or reserves have been identified by the Company thereof, that we may not be able to fully finance any additional exploration on the Company's properties; that even if we are able to raise capital, costs for exploration activities may increase such that we may not have sufficient funds to pay for such exploration or processing activities; the timing and content of any future work programs; geological interpretations based on drilling that may change with more detailed information; potential process methods and mineral recoveries assumptions based on limited test work and by comparison to what are considered analogous deposits that, with further test work, may not be comparable; testing of our process may not prove successful or samples derived from our properties may not yield positive results, and even if such tests are successful or initial sample results are positive, the economic and other outcomes may not be as expected; the anticipated market demand for REE and other minerals may not be as expected; the availability of labour and equipment to undertake future exploration work and testing activities; geopolitical risks which may result in market and economic instability. There can be no assurance that such statements will prove to be accurate, as actual results and future events could differ materially from those anticipated in such statements. Accordingly, readers should not place undue reliance on forward-looking statements. The forward-looking statements herein are made as of the date hereof, and the Company disclaims any intention or obligation to update or revise any forward-looking statements, whether as a result of new information, future events or otherwise, except as required by law.
SOURCE: Apex Critical Metals Corp.
View the original press release on ACCESS Newswire
VANCOUVER, BC / ACCESS Newswire / June 15, 2026 / Stillwater Critical Minerals Corp. (TSXV:PGE)(OTCQB:PGEZF)(FSE:J0G) (the "Company", or "Stillwater") is pleased to announce that contractors have been retained and mobilization of drill rigs is expected in short order for the Company's largest exploration and resource expansion campaign to date at its flagship Stillwater West Ni-PGE-Cu-Co-Cr + Au project in Montana, USA.
The 2026 drill program is designed to build upon the successful 2025 program and the upcoming updated Mineral Resource Estimate, with a focus on expanding mid- to high-grade polymetallic sulphide mineralization within and adjacent to existing resource areas.
The program follows significant advancements achieved over the past year, including the expansion of the Company's geological model across more than 20 kilometres of strike length, completion of resource growth drilling, and continued refinement of multiple large-scale polymetallic sulphide targets identified through the Company's district-scale geological and geophysical programs.
Primary objectives of the 2026 field program include:
-
Expansion of existing near-surface resources at Chrome Mountain and Iron Mountain, the Company's primary resource growth areas, and other priority areas;
-
Continued delineation of higher-grade nickel-copper-PGE sulphide and polymetallic mineralization within the existing resource footprint;
-
Follow-up drilling on priority geophysical and geological targets identified through the Company's district-scale targeting programs;
-
Completion of ground geophysical surveys to refine existing deposit expansion targets and generate additional exploration drill targets across the project area;
-
Testing new zones of sulphide mineralization within the lower Stillwater Igneous Complex; and
-
Supporting future technical and economic studies through continued resource growth and geological de-risking.
Michael Rowley, President and CEO of Stillwater Critical Minerals, commented "We are excited to begin another important field season at Stillwater West as we continue advancing a large-scale domestic source of ten critical minerals in Montana. With strong support from our strategic partner Glencore plc, a growing U.S. focus on critical mineral security, and an upcoming updated Mineral Resource Estimate expected shortly, we believe 2026 will mark another significant step in advancing the project. Our objective remains clear: to continue growing and advancing the resource base while demonstrating the strategic importance of the Stillwater district to U.S. critical mineral supply chains."
Dr. Danie Grobler, Vice-President Exploration, commented "The successful completion of our 2025 drilling program has significantly advanced our understanding of the scale and potential of the Stillwater West project. The combination of resource expansion opportunities and multiple district-scale near-surface exploration targets provide an exceptional platform for continued growth as we advance one of the most significant undeveloped critical mineral systems in the United States.
Having spent much of my career working on large-scale polymetallic magmatic sulphide systems in South Africa's Bushveld Complex, including the Platreef deposit, I continue to be impressed by the geological similarities we are seeing at Stillwater West. While each project is unique, the scale of the mineralized system, the presence of extensive bulk-tonnage nickel-copper-PGE sulphide mineralization, and the opportunity for continued resource growth across a large district-scale land package underscore the significant long-term potential of the project."
Strategic Positioning
The Company believes that Stillwater West represents one of the largest undeveloped polymetallic critical mineral systems in the United States. The project hosts large-scale resources containing ten minerals identified as critical by the U.S. government and benefits from excellent infrastructure, access to power, water, rail and skilled labour within an established mining district. Results from the 2026 program are expected to contribute to ongoing resource growth, further definition of higher-grade mineralization, and the advancement of future development studies aimed at evaluating potential mining scenarios within the district.
Stillwater West hosts mineralization containing 1.6 billion pounds ("Blbs") of nickel, copper, and cobalt, 3.8 million ounces of platinum, palladium, rhodium, and gold, 2.3 Blbs of defined chromium plus undefined quantities of ruthenium and iridium. The project is located adjacent to Sibanye-Stillwater's producing operations in Montana's historic Stillwater mining district, providing access to established infrastructure, workforce, and mining expertise.
The Company expects to provide regular updates throughout the 2026 field season and looks forward to the release of the updated Mineral Resource Estimate in the near-term.
Upcoming Events
Company representatives will be attending the following events to discuss upcoming catalysts:
Fastmarkets Global Battery and Critical Materials Conference – Las Vegas, NV, June 22-25, 2026.
Montana Mining Association Annual Meeting 2026 – Butte, MT, USA, July 13-15, 2026.
Precious Metals Summit – Beaver Creek, CO, USA, September 22-25, 2026.
About Stillwater Critical Minerals Corp.
Stillwater Critical Minerals (TSXV:PGE)(OTCQB:PGEZF)(FSE:J0G) is a mineral exploration and development company advancing its 100%-owned Stillwater West Ni-PGE-Cu-Co-Cr + Au project in the Stillwater mining district of Montana, USA. Stillwater West is directly adjacent to Sibanye-Stillwater's operating Stillwater mines and processing infrastructure, the only primary platinum group element-producing complex in the United States. An NI 43-101 Mineral Resource Estimate released in January 2023 positions Stillwater West as one of the largest nickel and platinum group element resources in the United States and contains ten minerals currently listed as critical in the United States. With strategic investments by Glencore and an experienced technical team with expertise in Bushveld- and Platreef-style systems, the Company is advancing Stillwater West through ongoing resource expansion and technical studies.
Stillwater also holds a 49% interest in the high-grade Drayton-Black Lake-gold project adjacent to Nexgold Mining's development-stage Goliath Gold Complex in northwest Ontario, currently under an earn-in agreement with Heritage Mining, and the Kluane PGE-Ni-Cu-Co critical minerals project on trend with Nickel Creek Platinum's Wellgreen deposit in Canada's Yukon Territory. The Company also holds the Duke Island Cu-Ni-PGE property in Alaska and maintains a back-in right on the high-grade past-producing Yankee-Dundee in BC, following its sale in 2013.
FOR FURTHER INFORMATION, PLEASE CONTACT:Michael Rowley, President, CEO & Director – Stillwater Critical MineralsEmail: info@criticalminerals.com Phone: (604) 357 4790Web: http://criticalminerals.com Toll Free: (888) 432 0075
Forward-Looking Statements
This news release includes certain statements that may be deemed "forward-looking statements" or "forward-looking information". In particular, this press release contains forward-looking information relating to, among other things, the interpretation of exploration results, the potential for resource expansion, the timing and results of future resource estimates (including the targeted H1 2026 updated MRE), the timing and success of exploration activities, permitting timelines, and future plans and objectives of the Company. All statements in this release, other than statements of historical facts, are forward-looking statements that involve various risks and uncertainties. Although Stillwater Critical Minerals believes the expectations expressed in such forward-looking statements are based on reasonable assumptions, such statements are not guarantees of future performance and actual results or developments may differ materially from those in the forward-looking statements. For more information on Stillwater Critical Minerals and the risks and challenges of their businesses, investors should review their annual filings that are available at www.sedarplus.ca.
Neither the TSX Venture Exchange nor its Regulation Services Provider (as that term is defined in the policies of the TSX Venture Exchange) accepts responsibility for the adequacy or accuracy of this release.
SOURCE: Stillwater Critical Minerals Corp.
View the original press release on ACCESS Newswire
Rock Tech Lithium (RCK.V) has started trading its shares on Xetra, the electronic system of Deutsche Borse in Germany, under the ticker symbol RCK, the company said in a Friday news release.nnThe listing is expected to strengthen Rock Tech's presence in global capital markets, along with its listing in Canada and planned trading on NASDAQ.nnThe listing also broaden's the company's institutional investor base and enhances liquidity.nnTrading of Rock Tech's shares will be handled by mwb Wertpapierhandelsbank AG, as designated sponsor, with immediate effect.nnRock Tech's shares have already been available to German retail investors through venues such as Tradegate and Frankfurt, but the company recognizes Xetra as being Deutsche Borse's primary electronic trading platform and the reference market used by most German institutional investors.nnThis is not a new primary listing and does not change Rock Tech's status as a Canadian issuer. Rock Tech will continue to be governed by Canadian securities regulations and reporting requirements.
VANCOUVER, BC, June 9, 2026 /CNW/ – Eastern Platinum Limited (TSX: ELR) (JSE: EPS) ("Eastplats" or the "Company") is pleased to announce that the Supreme Court of British Columbia has struck out all three of 2538520 Ontario Limited's ("253") claims against the Company and its affiliates. The three proceedings include docket numbers S201427, S244818, and S252308. The Company and its advisors will review the decision in detail and consider next steps in due course.
About Eastern Platinum Limited
Eastplats owns directly and indirectly a number of PGM and chrome assets in the Republic of South Africa. All of the Company's properties are situated on the western limb (Crocodile River Mine) and eastern limb (Kennedy's Vale, Spitzkop, Mareesburg) of the Bushveld Complex, the geological environment that hosts approximately 80% of the world's PGM-bearing ore.
Operations at the Crocodile River Mine currently include mining and processing ore from the Zandfontein underground section to both produce PGM and chrome concentrates, respectively.
Cautionary Statement Regarding Forward-Looking Information
This news release contains "forward-looking statements" or "forward-looking information" (collectively referred to herein as "forward-looking statements") within the meaning of applicable securities legislation. Such forward-looking statements include, without limitation, forecasts, estimates, expectations and objectives for future operations that are subject to a number of assumptions, risks and uncertainties, many of which are beyond the control of the Company. Forward-looking statements are statements that are not historical facts and are generally, but not always, identified by the words "will," "plan," "intends," "may," "could," "expects," "anticipates" and similar expressions. Further disclosure of the risks and uncertainties facing the Company and other forward-looking statements are discussed in the Company's most recent Annual Information Form available under the Company's profile on www.sedarplus.ca.
In particular, this press release contains, without limitation, forward-looking statements pertaining to amongst other things, consideration of next steps based on the Supreme Court of British Columbia's decision. These forward-looking statements are based on assumptions made by and information currently available to the Company. Although management considers these assumptions to be reasonable based on information currently available to it, they may prove to be incorrect. By their very nature, forward-looking statements involve inherent risks and uncertainties and readers are cautioned not to place undue reliance on these statements as a number of factors could cause actual results to differ materially from the beliefs, plans, objectives, expectations, estimates and intentions expressed in such forward-looking statements. These factors include, but are not limited to, unanticipated problems that may arise in the Company's production processes, commodity prices, lower than expected grades and quantities of resources, need for additional funding and availability of such additional funding on acceptable terms, economic conditions, currency fluctuations, competition and regulations, legal proceedings and risks related to operations in foreign countries.
All forward-looking statements in this news release are expressly qualified in their entirety by this cautionary statement, the "Cautionary Statement on Forward-Looking Information" section contained in the Company's most recent Management's Discussion and Analysis available under the Company's profile on www.sedarplus.ca. The forward-looking statements in this news release are made as of the date they are given and, except as required by applicable securities laws, the Company disclaims any intention or obligation, and does not undertake, to update or revise any forward-looking statements, whether as a result of new information, future events or otherwise.
No stock exchange, securities commission or other regulatory authority has approved or disapproved the information contained herein.
View original content to download multimedia: http://www.newswire.ca/en/releases/archive/June2026/09/c2622.html
Viewing insider transactions for Vital Metals Limited's (ASX:VML ) over the last year, we see that insiders were net buyers. This means that a larger number of shares were purchased by insiders in relation to shares sold.
While we would never suggest that investors should base their decisions solely on what the directors of a company have been doing, we do think it is perfectly logical to keep tabs on what insiders are doing.
The Last 12 Months Of Insider Transactions At Vital Metals
Over the last year, we can see that the biggest insider purchase was by Non-Executive Director Alexius Chan for AU$84k worth of shares, at about AU$0.10 per share. That implies that an insider found the current price of AU$0.11 per share to be enticing. While their view may have changed since the purchase was made, this does at least suggest they have had confidence in the company's future. We do always like to see insider buying, but it is worth noting if those purchases were made at well below today's share price, as the discount to value may have narrowed with the rising price. The good news for Vital Metals share holders is that an insider was buying at near the current price. Alexius Chan was the only individual insider to buy during the last year.
You can see the insider transactions (by companies and individuals) over the last year depicted in the chart below. By clicking on the graph below, you can see the precise details of each insider transaction!
Check out our latest analysis for Vital Metals
ASX:VML Insider Trading Volume June 9th 2026
Vital Metals is not the only stock insiders are buying. So take a peek at this free list of under-the-radar companies with insider buying.
Does Vital Metals Boast High Insider Ownership?
Looking at the total insider shareholdings in a company can help to inform your view of whether they are well aligned with common shareholders. We usually like to see fairly high levels of insider ownership. Our data indicates that Vital Metals insiders own about AU$2.8m worth of shares (which is 10% of the company). We do note, however, it is possible insiders have an indirect interest through a private company or other corporate structure. Whilst better than nothing, we're not overly impressed by these holdings.
What Might The Insider Transactions At Vital Metals Tell Us?
It doesn't really mean much that no insider has traded Vital Metals shares in the last quarter. On a brighter note, the transactions over the last year are encouraging. While we have no worries about the insider transactions, we'd be more comfortable if they owned more Vital Metals stock. While it's good to be aware of what's going on with the insider's ownership and transactions, we make sure to also consider what risks are facing a stock before making any investment decision. Every company has risks, and we've spotted 3 warning signs for Vital Metals (of which 2 make us uncomfortable!) you should know about.
Of course, you might find a fantastic investment by looking elsewhere. So take a peek at this free list of interesting companies.
For the purposes of this article, insiders are those individuals who report their transactions to the relevant regulatory body. We currently account for open market transactions and private dispositions of direct interests only, but not derivative transactions or indirect interests.
Have feedback on this article? Concerned about the content? Get in touch with us directly. Alternatively, email editorial-team (at) simplywallst.com.This article by Simply Wall St is general in nature. We provide commentary based on historical data and analyst forecasts only using an unbiased methodology and our articles are not intended to be financial advice. It does not constitute a recommendation to buy or sell any stock, and does not take account of your objectives, or your financial situation. We aim to bring you long-term focused analysis driven by fundamental data. Note that our analysis may not factor in the latest price-sensitive company announcements or qualitative material. Simply Wall St has no position in any stocks mentioned.
Announces a significant vote of confidence from Company leadership, with members of management and insiders committing approximately $990,112.65 to acquire common shares of the Company at a deemed price of $0.28 per share, representing approximately 3.53 million shares. Ares Strategic Mining Inc shares C.ARS are trading up one cent at $0.28.
Read:
- Quantum Secure Encryption Scales Commercial Deployment as U.S. Pours Billions Into Quantum Computing
- The $1 Trillion Data Problem Quantum Computing Is About to Make Worse
- Seven Months After Its IPO, Starfighters Space (FJET) Lands in the Russell 3000® — And It Isn't Alone
- Cardiac AI Diagnostics Clears China Regulatory Gate Via Lishman Global As Edison Award, Northern California Deployment, And Indigenous Partnership Stack Validation
- The Quiet $35 Million Deal That Could Reshape the Western Rare Earth Race
Sociedad Química y Minera de Chile S.A. (NYSE:SQM) is one of the 8 Most Undervalued Growth Stocks to Buy Right Now.
n
On May 28, 2026, Scotiabank raised the firm’s price target on Sociedad Química y Minera de Chile S.A. (NYSE:SQM) to $105 from $100 and maintained an Outperform rating on the shares. Scotiabank said that, following the company’s Q1 results and guidance revisions, there are multiple ways to win with the stock.
n
Meanwhile, BofA raised the firm’s price target on Sociedad Química y Minera de Chile S.A. (NYSE:SQM) to $58 from $53 and maintained an Underperform rating on the shares. BofA cited “strong” Q1 operating results and raised its 2026-27 EBITDA estimates by 6.2%, reflecting higher Specialty Plant Nutrition volumes and modestly stronger lithium prices after a 15% rebound since the end of March.
n
n
On May 26, 2026, Sociedad Química y Minera de Chile S.A. (NYSE:SQM) reported Q1 revenue of $1.76B, above the consensus estimate of $1.70B. CEO Ricardo Ramos said the company delivered “strong results” in the quarter, with lithium sales volumes reaching approximately 69 thousand metric tons of LCE as SQM operated at full capacity to meet customer demand. Ramos said global lithium demand could exceed 1.9 million metric tons of LCE this year, while market dynamics suggest a tight supply-demand balance. SQM raised its expected sales volume growth guidance for the year from 10% to 15%.
n
Sociedad Química y Minera de Chile S.A. (NYSE:SQM) produces and sells specialty plant nutrients, iodine and its derivatives, and related products across Chile, Latin America, the Caribbean, Europe, North America, Asia, and internationally.
n
n
While we acknowledge the potential of SQM as an investment, we believe certain AI stocks offer greater upside potential and carry less downside risk. If you're looking for an extremely undervalued AI stock that also stands to benefit significantly from Trump-era tariffs and the onshoring trend, see our free report on the best short-term AI stock.
n
n
n
READ NEXT: 33 Stocks That Should Double in 3 Years and Cathie Wood 2026 Portfolio: 10 Best Stocks to Buy.
n
Disclosure: None. Follow Insider Monkey on Google News.
Vancouver, British Columbia–(Newsfile Corp. – June 5, 2026) – Sego Resources Inc. (TSXV: SGZ) ("Sego" or "the Company"), has closed its non-brokered critical minerals flow through financing announced May 29, 2026, by issuing 21,200,000 common shares at $0.05 per share for gross proceeds of $1,060,000. The financing was oversubscribed due to investor demand. The closing of the placement is subject to receipt of approval of the TSX-V.
Private Placement
The offering consisted of 21,200,000 shares at $0.05 per share for gross proceeds of $1,060,000. There were no warrants attached to the private placement.
Finder's fees paid on the placement consisted of $52,500 and 1,050,000 share purchase warrants. The non-transferable share purchase warrants are exercisable at $0.05 for one year.
MI 61-101 Disclosure
MI 61-101 Disclosure
Elliot Strashin, an insider of the Company by right of holding >10% of the issued and outstanding shares of the Company, participated in the private placement for 2,000,000 common shares. A director of the Company, J Paul Stevenson, participated for 1,000,000 common shares. The participation by such insiders is considered a "related-party transaction" within the meaning of Multilateral Instrument 61-101 – Protection of Minority Security Holders in Special Transactions ("MI 61-101"). The Company has relied on exemptions from the formal valuation and minority shareholder approval requirements of MI 61-101 contained in sections 5.5(a) and 5.7(1)(a) of MI 61-101 in respect of related party participation in the Offering as neither the fair market value (as determined under MI 61-101) of the subject matter of, nor the fair market value of the consideration for, the transaction, insofar as it involved the related parties, exceeded 25% of the Company's market capitalization (as determined under MI 61-101).
All of the securities sold pursuant to the offering will be subject to a four-month-and-one-day hold period from the date of closing. The hold period will expire on October 6, 2026.
Proceeds of the private placement will be spent on exploration of the Company's Miner Mountain project. The gross proceeds received by the Company from the sale of the FT Units will be used to incur "Canadian exploration expenses" that are "flow-through critical mineral mining expenditures" (as such terms are defined in the Income Tax Act (Canada)) on the Company's properties located in British Columbia.
None of the securities issued in the Offering will be registered under the United States Securities Act of 1933, as amended (the "1933 Act").
There is no material change about the issuer that has not been generally disclosed.
For further information please contact: J. Paul Stevenson, CEO, and Director
(604) 682-2933 email: ceo@segoresources.com
About the Project
Sego is 100% owner of the Miner Mountain Project, an alkalic copper-gold porphyry and gold exploration project located near Princeton, British Columbia. The property is 2,056 hectares in size and is 15 km north of the Copper Mountain Mine operated by Hudbay Minerals Inc. Sego has a Memorandum of Understanding with the Upper Similkameen Indian Band on whose Traditional Territory the Miner Mountain Project is situated. Sego has received an Award of Excellence for its reclamation work on the Miner Mountain Project.
Neither the TSX Venture Exchange nor its Regulation Services Provider (as that term is defined in the policies of the TSX Venture Exchange) accepts responsibility for the adequacy or accuracy of this release. No regulatory authority has approved or disapproved the information contained in this news release.
This release includes certain statements that may be deemed "forward-looking statements". All statements in this release, other than statement of historical facts that address future production, reserve potential, exploration drilling, exploitation activities and events or developments that the Company expects re forward-looking statements. Although the Company believes the expectations expressed in such forward-looking statements are based on reasonable assumptions, statements are not guarantees of future performance and actual results or developments may differ materially from the forward-looking statements. Factors that could cause actual results to differ materially from those in forward-looking statements include market prices, exploitation and exploration successes, continued availability of capital and financing, general economic, market or business conditions. Investors are cautioned that any such statements are not guarantees of future performance and those actual results or developments may differ materially from those projected in the forward-looking statements.
To view the source version of this press release, please visit https://www.newsfilecorp.com/release/300356
TORONTO, June 5, 2026 /CNW/ – Bravo Mining Corp. (TSXV: BRVO) (OTCQX: BRVMF) ("Bravo" or the "Company") today announces the results of voting from the Annual General and Special Meeting ("AGM") of shareholders held on June 4, 2026 (the "Meeting").
A total of 99,768,634 common shares were represented at the meeting, representing 72.83% of the issued and outstanding shares of the Company at the record date.
All matters presented for approval at the Meeting were approved by shareholders, as detailed below.
Number of Directors
Results of voting for the resolution to set the number of directors to be elected at four (4) were as follows:
|
Votes For |
% Vote For |
Votes Against |
% Vote Against |
|
99,713,160 |
99.94 |
55,474 |
0.06 |
Election of Directors
The following four individuals were elected as directors of the Company until the next annual meeting of shareholders or until their successors are elected or appointed, with the votes being cast by ballot were as follows:
|
Name of Nominee |
Votes For |
% Vote For |
Votes Withheld/Abstained |
% Withheld/Abstained |
|
Luis Mauricio F. Azevedo |
96,649,427 |
99.99 |
10,991 |
0.01 |
|
Margot Naudie |
90,721,193 |
93.86 |
5,939,225 |
6.14 |
|
Anthony Polglase |
96,649,427 |
99.99 |
10,991 |
0.01 |
|
Stephen Quin |
94,194,387 |
97.45 |
2,466,031 |
2.55 |
Appointment of Auditor
Results of voting for the resolution approving the re-appointment of KPMG LLP, Chartered Professional Accountants, as independent auditor of the Company for the ensuing year and authorizing the directors to fix the auditor's remuneration were as follows:
|
Votes For |
% Vote For |
Votes Withheld/Abstained |
% Withheld/Abstained |
|
99,750,360 |
99.98 |
18,264 |
0.02 |
Approval of Stock Option Plan
Results of voting by disinterested shareholders for the resolution to approve the Stock Option Plan were as follows:
|
Votes For |
% Vote For |
Votes Against |
% Withheld/Abstained |
|
36,043,432* |
93.65 |
2,443,529 |
6.35 |
|
* Excluding 58,173,457 shares held by Insiders |
Stock Option Grant
The Company also announces that it has granted a total of 2,182,000 stock options ("Options") to purchase common shares of the Company to directors, officers, employees and consultants of the Company pursuant to the Company's Stock Option Plan. Such Options are exercisable into common shares of the Company at an exercise price of $ 3.65 per common share, and vest as to 25% one year from the date of grant followed by 25% annually thereafter until fully vested. All the Options expire on June 3, 2031.
About Bravo Mining Corp.
Bravo is a Canadian and Brazil-based mineral exploration and development company focused on advancing its PGM+Au+Ni deposit while also exploring for IOCG-style Cu+Au and magmatic-style Ni+Cu+/-PGM+/-Au mineralization within its Luanga Project in the Carajás Mineral Province, Pará State, Brazil. Bravo is one of the most active explorers in Carajás.
The team, comprising of local and international geologists, has a proven track record of PGM, nickel, and copper discoveries in the region. They have successfully taken a past IOCG greenfield project from discovery to development and production in the Carajás while defining other significant deposit types in the region.
The Luanga Project is situated on mature freehold farming land and benefits from being located close to operating mines and a mining-experienced workforce, with excellent access and proximity to existing infrastructure, including road, rail, and hydroelectric grid power. Bravo's current Environmental, Social and Governance activities include planting more than 55,000 high-value trees in and around the project area and hiring and contracting locally.
Neither TSX Venture Exchange nor its Regulation Services Provider (as that term is defined in policies of the TSX Venture Exchange) accepts responsibility for the adequacy or accuracy of this release.
View original content to download multimedia: http://www.newswire.ca/en/releases/archive/June2026/05/c3852.html
Management Commits Additional Capital as Company Advances Toward Production, Government Deliveries, and Next Phase of Growth
n
VANCOUVER, BC – June 5, 2026 (NEWMEDIAWIRE) – Ares Strategic Mining Inc. (CSE: ARS) (OTCQX: ARSMF) (FRA: N8I1) is pleased to announce a significant vote of confidence from Company leadership, with members of management and insiders committing approximately $990,112.65 to acquire common shares of the Company at a deemed price of $0.28 per share, representing approximately 3.53 million shares.
n
The investment comes as Ares continues to achieve major milestones across its operations, including the commencement of mining, growing ore stockpiles at surface, continued construction progress across its processing facilities, and the recently announced U.S. Department of Defense fluorspar supply contract.
n
Management Demonstrates Confidence in Company's Future
n
The insider investment reflects management's belief in the Company's long-term value and future growth prospects. Over the past year, Ares has transformed from a development-stage company into an emerging producer with:
n
– Active mining operations at the Lost Sheep Mine;
n
– Growing surface ore stockpiles awaiting processing;
n
– Significant progress on both the Lumps Plant and Acidspar Flotation Plant;
n
– Major U.S. government contract awards;
n
– Strategic critical mineral positioning within the United States;
n
– A growing portfolio of assets and infrastructure.
n
James Walker, President and CEO of Ares Strategic Mining, commented: "Management believes the Company has reached a point where its operational progress, strategic assets, government relationships, and production trajectory are not fully reflected in the current market valuation. This investment demonstrates our confidence in the future we are building and our commitment to creating long-term value alongside shareholders."
n
Building Momentum
n
The Company believes it is entering one of the most significant periods in its history, with multiple catalysts expected over the coming months, including:
n
– Continued mine production and stockpiling;
n
– Advancement toward processing operations;
n
– Development of domestic acidspar production capacity;
n
– Execution of government contract opportunities;
n
– Expansion of commercial relationships;
n
– Continued strengthening of the Company's balance sheet and market position.
n
Walker concluded: "The story of Ares today is one of execution. We have built the mine, we are mining, we are building the processing facilities, and we are securing customers. Management's decision to invest nearly one million dollars alongside shareholders reflects our belief that the most exciting chapters of Ares are still ahead of us."
n
Renewal of Strategic Marketing and Investor Communications Program
n
The Company is also pleased to announce the renewal of its engagement with Pivotal CM Limited, which has supported Ares' investor communications, digital strategy, marketing initiatives, shareholder engagement, website management, conference organization, content development, and advertising campaigns.
n
Under the renewed arrangement, approximately US$356,250 of services will be satisfied through the issuance of common shares at the current market price, representing approximately 1.76 million shares, subject to regulatory approvals and final documentation. The renewed engagement is intended to support the Company's growing profile as it advances toward production and expands its visibility within North American and international capital markets.
n
Ares is also pleased to announce that the Company has agreed to the settlement of an aggregate of $69,046.47 of debt incurred by the Company for financial services provided by Prospero, and Craven Capital. The Company issued an aggregate of 246,595 common shares at a deemed price of $0.28 per Share.
n
Board Evolution Supports Company's Next Phase
n
The Company also announces that in response to public response, Lorenzo Esteva elected to step down from the Board of Directors. The Board thanks Mr. Esteva for his contributions and support during a period of significant growth for the Company.
n
Ares notes that certain public commentary regarding Mr. Esteva's prior regulatory history contained misrepresentation and erroneous characterizations. Responding to public comments, Mr. Esteva's lawyer clarified that he voluntarily resigned his FINRA registrations and disputed most allegations that have circulated publicly. The Company appreciates Lorenzo's professionalism throughout and regrets the inaccurate and false publications that caused him to step down. We wish him success in his future endeavors.
n
About Ares Strategic Mining
n
Ares Strategic Mining Inc. is a mining company focused on the development of its fluorspar projects in the U.S. The Company aims to become a significant supplier of high-grade fluorspar to North American markets, supporting industries vital to modern technology and infrastructure.
n
Lost Sheep Fluorspar Project – Delta, Utah
n
– 100% owned – 5,982 acres – 353 Claims
n
– Located in the Spor Mountain area, Juab County, Utah, approximately 214 km south-west of Salt Lake City.
n
– Fully Permitted – including mining permits.
n
– NI 43-101 Technical Report identified extensive high-grade fluorspar with low levels of impurities.
n
– Mining plan approved by BLM
n
First approved by Rex Rowley – Area Manager, Bureau of Land Management – 24th August 1992.
n
Renewed by Paul B. Baker – Minerals Program Manager, Bureau of Land Management – 12th December 2016.
n
ON BEHALF OF THE BOARD OF DIRECTORS OF ARES STRATEGIC MINING INC.
n
James WalkerChief Executive Officer and President
n
For further information, please contact James Walker by email at info@aresmining.com
n
DISCLOSURE AND FORWARD-LOOKING STATEMENTS:
n
Companies typically rely on comprehensive feasibility reports on mineral reserve estimates to reduce the risks and uncertainties associated with a production decision. Historically, situations where the issuer decides to put a mineral project into production without first establishing mineral reserves supported by a technical report and completing a feasibility study have a higher risk of economic or technical failure, though some industrial mineral ventures are relatively simple operations with low levels of investment and risk, where the operating entity has determined that a formal prefeasibility or feasibility study in conformance with NI 43-101 and 43-101 CP is not required for a production decision. Based on historical engineering work, geological reports, historical production data and current engineering work completed or in the process by Ares, the Company intends to move forward with the development of its Utah asset.
n
Certain information in this news release may contain forward-looking statements that involve substantial known and unknown risks and uncertainties. Forward-looking statements are often identified by terms such as "will", "may", "should", "anticipate", "expects" and similar expressions. All statements other than statements of historical fact included in this news release are forward-looking statements that involve risks and uncertainties. There can be no assurance that such statements will prove to be accurate and actual results and future events could differ materially from those anticipated in such statements. Important factors that could cause actual results to differ materially from the Company's expectations include the failure to satisfy the conditions of the relevant securities exchange(s) and other risks detailed from time to time in the filings made by the Company with securities regulations. The reader is cautioned that assumptions used in the preparation of any forward-looking information may prove to be incorrect. Events or circumstances may cause actual results to differ materially from those predicted, as a result of numerous known and unknown risks, uncertainties, and other factors, many of which are beyond the control of the Company. The reader is cautioned not to place undue reliance on any forward-looking information. Such information, although considered reasonable by management at the time of preparation, may prove to be incorrect and actual results may differ materially from those anticipated. Forward-looking statements contained in this news release are expressly qualified by this cautionary statement. The forward-looking statements contained in this news release are made as of the date of this news release and the Company disclaims any intention or obligation to update or revise such information, except as required by applicable law.
View the original release on www.newmediawire.com
Toronto, Ontario–(Newsfile Corp. – June 2, 2026) – Olive Resource Capital Inc. (TSXV: OC) ("Olive" or the "Company") is pleased to provide investors an update on its investments for the period ending May 31, 2026.
Table 1: Olive's Investment Portfolio
| Name | Ticker | Sector | Category | (Audited)Value | (Unaudited)Value | (Unaudited)Value |
| Dec 31, 2025(1) | Apr 30, 2026(1) | May 31, 2026(1) | ||||
| Omai Gold Mines Corp.(2) | OMG.v | Precious Metals | Public Equity | $3,504,200 | $5,806,960 | $6,733,070 |
| Black Sheep Ventures Inc. | Private | Real Estate | Private Equity & Conv. Debenture | $1,527,912 | $1,541,063 | $1,514,543 |
| Arizona Sonoran Copper Co. | ASCU | Base Metals | Public Equity | $908,200 | $1,059,800 | $964,000 |
| Goldsky Resources Corp. (inc. Warrants) | GSKR.v | Precious Metals | Public Equity | $296,829 | $789,245 | $864,280 |
| Sun Valley Minerals Inc.(2) | Private | Precious Metals | Private Equity | $375,000 | $562,500 | $562,500 |
| Bravo Mining Corp. | BRVO.v | Precious Metals | Public Equity | $601,250 | $504,064 | $532,704 |
| GeoPark Ltd. | GPRK | Oil & Gas | Public Equity | $203,123 | $461,581 | $523,289 |
| Prospector Metals Corp. | PPP.v | Precious Metals | Public Equity | $295,029 | $455,699 | $486,698 |
| West Point Gold Corp.(2) | WPG.v | Precious Metals | Public Equity | $515,551 | $537,805 | $456,207 |
| Troilus Gold Corp (inc. Warrants) | TLG | Precious Metals | Public Equity | $482,000 | $327,500 | $455,000 |
| Other Public Equity Liquid Investments and Cash Equivalents (3) | $2,645,285 | $4,535,814 | $4,522,343 | |||
| Other Public Equity Fundamental Investments Incl. Warrants (4) | $4,031,648 | $1,968,791 | $2,473,948 | |||
| Other Private Equity, Loans, & Convertible Debenture Investments | $1,087,181 | $1,180,367 | $1,162,449 | |||
| Total | $16,473,208(5) | $19,731,191(5) | $21,251,033(5) | |||
Samuel Pelaez, the Company's President, CEO, CIO, and Director stated: "U.S. bond yields and the U.S. dollar both advanced in May. Gold and oil retreated as markets anticipate a resolution to the crisis at the Strait of Hormuz. Copper was a standout positive performer as warehouse inventories unexpectedly declined. Commodity equities outperformed their respective commodity references as perceived risk in markets decreased. At Olive, we made minor specific net additions to the portfolio. However, we remain cautious as major seasonal tailwinds begin to wind down at a time investors appear to show complacency toward the risks posed by a prolonged disruption in global energy markets."
Derek Macpherson, the Company's Executive Chairman stated: "Despite significant volatility in markets and most commodity related equity indices being relatively flat, Olive's portfolio continued to outperform, with the investments up more than 7% in the month. This is reflective in a shift in the portfolio as we look to add more copper exposure, following some significant wins with gold-focused equities. We continue to maintain above typical cash levels, based on our current market view and we are ready to take advantage of any market dislocations that may occur in the near-term."
Normal Course Issuer Bid ("NCIB")
As of the date of this release, the Company holds 4,000,000 common shares in treasury pending cancellation.
As of the date of this release Olive Resource Capital Inc. has 107,207,209 common shares outstanding inclusive of the shares in treasury pending cancellation.
About Olive Resource Capital Inc.:Olive is a resource-focused merchant bank and investment company with a portfolio of publicly listed and private securities. The Company's assets consist primarily of investments in natural resource companies in all stages of development.
For further information, please contact:
Derek Macpherson, Executive Chairman at derek@olive-resource.com or by phone at (416)294-6713 or Samuel Pelaez, President, CEO & CIO at sam@olive-resource.com. Olive's website is located at www.olive-resource.com.
Neither the TSX Venture Exchange Inc. nor its Regulation Services Provider (as that term is defined in the policies of the TSX Venture Exchange Inc.) accepts responsibility for the adequacy or accuracy of this release. The TSX Venture Exchange Inc. has in no way approved nor disapproved the information contained herein.
Cautionary Note Regarding Forward-Looking Statements: This press release contains "forward-looking information" within the meaning of applicable Canadian securities laws. Any statements that express or involve discussions with respect to predictions, expectations, beliefs, plans, projections, objectives, assumptions or future events or performance (often, but not always, identified by words or phrases such as "believes", "anticipates", "expects", "is expected", "scheduled", "estimates", "pending", "intends", "plans", "forecasts", "targets", or "hopes", or variations of such words and phrases or statements that certain actions, events or results "may", "could", "would", "will", "should", "might", "will be taken", or "occur" and similar expressions) are not statements of historical fact and may be forward-looking statements.
This news release includes forward-looking statements that are subject to risks and uncertainties. Forward-looking statements involve known and unknown risks, uncertainties, and other factors that could cause the actual results of Olive to be materially different from the historical results or from any future results expressed or implied by such forward-looking statements. All statements contained in this news release, other than statements of historical fact, are to be considered forward-looking, including, without limitation, statements concerning Olive's intended future disclosure practices. Although Olive believes the expectations expressed in such forward-looking statements are based on reasonable assumptions, such statements are not guarantees of future performance and actual results or developments may differ materially from those in the forward-looking statements. Factors that could cause actual results to differ materially from such forward-looking information include, but are not limited to: past success or achievement does not guarantee future success; negative investment performance; downward market fluctuations; downward fluctuations in commodity prices and changes in the prices of commodities in general; uncertainties relating to the availability and costs of financing needed in the future; interest rate and exchange rate fluctuations; changes in economic and political conditions that could negatively affect certain commodity prices; and those risks set out in the Company's public documents filed on SEDAR+. Accordingly, readers should not place undue reliance on forward-looking information. Olive does not undertake to update any forward-looking information except in accordance with applicable securities laws.
This commentary is provided for general informational purposes only and does not constitute financial, investment, tax, legal or accounting advice nor does it constitute an offer or solicitation to buy or sell any securities referred to. The information provided in this recording has been obtained from sources believed to be reliable and is believed to be accurate at the time of publishing but we do not represent that it is accurate or complete and it should not be relied upon as such.
To view the source version of this press release, please visit https://www.newsfilecorp.com/release/299744
- Sociedad Química y Minera de Chile S.A. recently held a board meeting on May 26, 2026, appointing Hernán Büchi Buc as Vice Chairman, and reported first-quarter 2026 results with sales of US$1,760.11 million and net income of US$364.72 million, both higher than a year earlier.
- The sharp increase in basic earnings per share from continuing operations to US$1.2769, compared with US$0.4815 a year ago, highlights a step-up in profitability that may influence how investors view the company’s earnings power.
- With this strong first-quarter earnings performance as context, we’ll now assess how the results may reshape Sociedad Química y Minera de Chile’s investment narrative.
We've uncovered the 10 dividend fortresses yielding 5%+ that don't just survive market storms, but thrive in them.
Sociedad Química y Minera de Chile Investment Narrative Recap
To own Sociedad Química y Minera de Chile, you generally need to believe that lithium, iodine and specialty fertilizers can support attractive earnings, even through price swings and regulatory noise in Chile. The sharp Q1 2026 earnings jump is encouraging, but it does not remove key short term questions around lithium price volatility and the timing or terms of any Codelco related agreements, which remain the biggest swing factors for the story right now.
The Q1 2026 earnings release is the clearest reference point for assessing those catalysts today, with sales of US$1,760.11 million and net income of US$364.72 million well above the prior year’s levels. This step up in basic EPS to US$1.2769 gives investors more recent evidence about current earnings power, which may influence how comfortable they feel with higher capital spending plans and potential regulatory cost pressures tied to Chilean operations.
Yet despite the strong quarter, investors should be aware that mounting environmental and regulatory scrutiny in Chile could still…
Read the full narrative on Sociedad Química y Minera de Chile (it's free!)
Sociedad Química y Minera de Chile's narrative projects $6.5 billion revenue and $1.9 billion earnings by 2028. This requires 15.4% yearly revenue growth and about $1.4 billion earnings increase from $477.5 million today.
Uncover how Sociedad Química y Minera de Chile's forecasts yield a $75.33 fair value, a 12% downside to its current price.
Exploring Other PerspectivesSQM 1-Year Stock Price Chart
Some of the most optimistic analysts were already assuming revenue could reach about US$8.2 billion and earnings about US$2.3 billion, so Q1’s strong numbers may either support that upbeat view or prompt others to reassess how environmental and regulatory risks could still affect SQM’s long term path.
Explore 9 other fair value estimates on Sociedad Química y Minera de Chile – why the stock might be worth as much as 23% more than the current price!
Decide For Yourself
Disagree with existing narratives? Extraordinary investment returns rarely come from following the herd, so go with your instincts.
- A great starting point for your Sociedad Química y Minera de Chile research is our analysis highlighting 2 key rewards and 1 important warning sign that could impact your investment decision.
- Our free Sociedad Química y Minera de Chile research report provides a comprehensive fundamental analysis summarized in a single visual – the Snowflake – making it easy to evaluate Sociedad Química y Minera de Chile's overall financial health at a glance.
Contemplating Other Strategies?
Opportunities like this don't last. These are today's most promising picks. Check them out now:
- Invest in the nuclear renaissance through our list of 88 elite nuclear energy infrastructure plays powering the global AI revolution.
- Uncover the next big thing with 23 elite penny stocks that balance risk and reward.
- Capitalize on the AI infrastructure supercycle with our selection of the 47 best 'picks and shovels' of the AI gold rush converting record-breaking demand into massive cash flow.
This article by Simply Wall St is general in nature. We provide commentary based on historical datan and analyst forecasts only using an unbiased methodology and our articles are not intended to be financial advice. It does not constitute a recommendation to buy or sell any stock, and does not take account of your objectives, or yourn financial situation. We aim to bring you long-term focused analysis driven by fundamental data.n Note that our analysis may not factor in the latest price-sensitive company announcements or qualitative material.n Simply Wall St has no position in any stocks mentioned.
Companies discussed in this article include SQM.
Have feedback on this article? Concerned about the content? Get in touch with us directly. Alternatively, email editorial-team@simplywallst.com
The United States market has shown robust performance, climbing 1.6% in the last week and rising 28% over the past year, with earnings expected to grow by 17% annually. In this thriving environment, identifying small-cap stocks that may be undervalued and exhibit insider buying can provide unique opportunities for investors looking to leverage potential growth across various regions.
Top 10 Undervalued Small Caps With Insider Buying In The United States
| Name | PE | PS | Discount to Fair Value | Value Rating |
|---|---|---|---|---|
| Financial Institutions | 9.2x | 3.0x | 29.47% | ★★★★★☆ |
| Angel Oak Mortgage REIT | 12.9x | 5.8x | 26.66% | ★★★★★☆ |
| AVITA Medical | NA | 1.8x | 47.33% | ★★★★★☆ |
| Ferroglobe | NA | 0.6x | 21.14% | ★★★★★☆ |
| First Bancorp | 9.0x | 3.4x | 30.27% | ★★★★☆☆ |
| New Peoples Bankshares | 8.8x | 2.3x | 20.57% | ★★★★☆☆ |
| Similarweb | NA | 1.3x | 40.81% | ★★★★☆☆ |
| Metropolitan Bank Holding | 12.9x | 3.7x | 40.25% | ★★★☆☆☆ |
| Bank of Marin Bancorp | NA | 11.7x | 34.36% | ★★★☆☆☆ |
| Angel Studios | NA | 1.3x | -42.42% | ★★★☆☆☆ |
We’ll examine a selection from our screener results.
Simply Wall St Value Rating: ★★★★☆☆
Overview: Arbor Realty Trust is a real estate investment trust that primarily focuses on investing in a diversified portfolio of structured finance assets in the multifamily, single-family rental, and commercial real estate markets, with a market cap of approximately $2.95 billion.
Operations: The company generates revenue primarily from its Agency Business and Structured Business segments. Its gross profit margin has shown a trend of reaching up to 93.44% in recent periods, indicating efficient cost management relative to revenue. Operating expenses, including general and administrative costs, form a significant portion of the company’s expenditure structure.
PE: 14.3x
Arbor Realty Trust, a smaller U.S. company, recently enhanced its financial flexibility by redeeming $787 million of notes and transferring $1.21 billion in assets to improved repurchase facilities with JPMorgan Chase Bank, N.A., boosting liquidity by $132.3 million. Despite a dip in net income to US$10.97 million for Q1 2026 from US$40.78 million the previous year, insider confidence is evident through share purchases earlier this year, suggesting potential growth prospects amidst current challenges like lower profit margins and impairment losses.
- Dive into the specifics of Arbor Realty Trust here with our thorough valuation report.
-
Examine Arbor Realty Trust’s past performance report to understand how it has performed in the past.
ABR Share price vs Value as at Jun 2026FMC
Simply Wall St Value Rating: ★★★★★☆
Overview: FMC is a company that operates in the agricultural sciences sector, focusing on providing innovative solutions, with a market capitalization of approximately $13.45 billion.
Operations: The company’s revenue primarily stems from its Innovative Solutions segment, with recent figures showing $3.43 billion in revenue. The gross profit margin has shown a notable downward trend, dropping to 32.09% as of March 2026. Operating expenses have been significant, with general and administrative costs being a major component alongside research and development expenses. Net income has experienced volatility, recently recording substantial losses driven by high non-operating expenses.
PE: -0.7x
FMC Corporation, a smaller player in the market, is catching attention with its recent financial maneuvers. Despite facing challenges like a net loss of US$281.3 million in Q1 2026 and declining sales, FMC’s strategic debt offerings—US$1.2 billion and US$750 million notes—aim to refinance existing obligations and support corporate activities. The company’s earnings are projected to grow significantly at 112% annually, hinting at potential recovery. Insider confidence through share purchases underscores belief in future prospects amid ongoing product innovations like Isoflex active’s EU approval for agricultural use starting 2027.
- Unlock comprehensive insights into our analysis of FMC stock in this valuation report.
-
Gain insights into FMC’s historical performance by reviewing our past performance report.
FMC Share price vs Value as at Jun 2026Exzeo Group
Simply Wall St Value Rating: ★★★☆☆☆
Overview: Exzeo Group operates in the insurance industry, focusing on property and casualty segments, with a market capitalization of $3.45 billion.
Operations: Exzeo Group’s revenue is primarily derived from its Property & Casualty insurance segment, with recent figures showing $226.52 million. The company has experienced a notable shift in its financials, achieving a gross profit margin of 100% over the last six periods, reflecting efficient cost management.
PE: 15.4x
Exzeo Group, a dynamic player in the insurance tech sector, has caught attention with its recent inclusion in multiple Russell indexes, signaling potential growth. The company’s earnings for Q1 2026 reached US$20.41 million, up from US$17.95 million last year. Its innovative WindForm Pro solution addresses new regulatory requirements in Florida, enhancing operational efficiency for insurers. Insider confidence is reflected through a share repurchase program of up to US$12 million announced recently.
- Click here and access our complete valuation analysis report to understand the dynamics of Exzeo Group.
-
Evaluate Exzeo Group’s historical performance by accessing our past performance report.
XZO Share price vs Value as at Jun 2026Summing It All Up
- Click here to access our complete index of 73 Undervalued US Small Caps With Insider Buying.
- Shareholder in one or more of these companies? Ensure you’re never caught off-guard by adding your portfolio in Simply Wall St for timely alerts on significant stock developments.
- Unlock the power of informed investing with Simply Wall St, your free guide to navigating stock markets worldwide.
Interested In Other Possibilities?
- Explore high-performing small cap companies that haven’t yet garnered significant analyst attention.
- Fuel your portfolio with companies showing strong growth potential, backed by optimistic outlooks both from analysts and management.
- Find companies with promising cash flow potential yet trading below their fair value.
This article by Simply Wall St is general in nature. We provide commentary based on historical data n and analyst forecasts only using an unbiased methodology and our articles are not intended to be financial advice. It does not constitute a recommendation to buy or sell any stock, and does not take account of your objectives, or your n financial situation. We aim to bring you long-term focused analysis driven by fundamental data. n Note that our analysis may not factor in the latest price-sensitive company announcements or qualitative material. n Simply Wall St has no position in any stocks mentioned.
Companies discussed in this article include ABR FMC and XZO.
Have feedback on this article? Concerned about the content? Get in touch with us directly. Alternatively, email editorial-team@simplywallst.com
A month has gone by since the last earnings report for FMC (FMC). Shares have lost about 11.8% in that time frame, underperforming the S&P 500.
Will the recent negative trend continue leading up to its next earnings release, or is FMC due for a breakout? Well, first let's take a quick look at the latest earnings report in order to get a better handle on the recent catalysts for FMC Corporation before we dive into how investors and analysts have reacted as of late.
FMC’s Q1 Earnings Beat Estimates on Volume Gains and FX Tailwind
FMC reported a first-quarter 2026 adjusted loss per share of 23 cents. This compares unfavorably to the year-ago quarter’s adjusted earnings per share of 18 cents. The result was narrower than the Zacks Consensus Estimate of a loss of 39 cents.Quarterly revenues of $759 million declined 4% year over year but topped the consensus estimate of $721.8 million by 5.2%. Performance reflected favorable currency and stronger demand in select markets, partly offset by pricing pressure and partner-related volume headwinds. New active ingredient sales doubled year over year.Profitability also declined as lower pricing and higher costs more than offset benefits from volume and currency. Tariffs and unfavorable raw material costs were the key cost headwinds, while lower R&D expenses provided some relief. The decline was also driven by tax charges related to higher valuation allowances, along with lower sales, higher restructuring costs and higher interest expense.
Regional Sales Performance
North America sales increased 6% year over year to $198 million. FMC attributed the gain to high-teens sales growth for branded products led by herbicides, alongside solid growth in Plant Health and strong Cyazypyr performance. Sales topped the consensus estimate of $185.1 million.EMEA revenues rose 13% to $307 million on solid branded volume growth led by herbicides and Cyazypyr. Branded pricing was similar to the year-ago quarter, while registration losses were in line with expectations and represented an estimated 5% headwind. It outpaced the consensus estimate of $282.4 million.Latin America revenues fell 14% to $177 million. FMC cited lower branded volumes mainly for core portfolio products and a competitive market for core products that pressured branded pricing, though higher growth-portfolio sales led by Cyazypyr and new actives provided a partial offset. It missed the consensus estimate of $178.7 million.Asia revenues, excluding India, declined 36% year over year to $81 million. The company pointed to lower branded pricing in line with expectations and weaker insecticide volumes amid challenged grower economics tied to geopolitical uncertainty, partially offset by strong Cyazypyr growth. It beat the consensus estimate of $72.4 million.
Financials
The company had cash and cash equivalents of $390.9 million at the end of the quarter. Long-term debt was $2.77 billion.
Outlook
FMC reaffirmed its full-year 2026 outlook, calling for revenue excluding India of $3.6 billion to $3.8 billion and adjusted EBITDA of $670 million to $730 million. Adjusted earnings per diluted share are still expected in the $1.63-$1.89 range, while free cash flow is projected between negative $65 million and positive $65 million.The company’s full-year framework assumes interest expense of $255-$275 million and an adjusted tax rate of 16-18%, with depreciation and amortization of $160-$170 million. Capital additions and other investing activities are projected at $90-$110 million. FMC also expects the India contribution loss in 2026 to be roughly $90 million of revenue and $0 million of EBITDA.For the second quarter, FMC expects revenue excluding India of $850 million to $900 million, with adjusted EBITDA of $130 million to $150 million and adjusted earnings per diluted share of 16-26 cents. The company expects year-over-year pressure to be driven largely by reduced orders from diamide partners and the removal of India from the reported base period.
How Have Estimates Been Moving Since Then?
Since the earnings release, investors have witnessed a downward trend in fresh estimates.
The consensus estimate has shifted -47.5% due to these changes.
VGM Scores
At this time, FMC has a poor Growth Score of F, a score with the same score on the momentum front. However, the stock has a grade of C on the value side, putting it in the middle 20% for this investment strategy.
Overall, the stock has an aggregate VGM Score of F. If you aren't focused on one strategy, this score is the one you should be interested in.
Outlook
Estimates have been broadly trending downward for the stock, and the magnitude of these revisions indicates a downward shift. Interestingly, FMC has a Zacks Rank #3 (Hold). We expect an in-line return from the stock in the next few months.
Want the latest recommendations from Zacks Investment Research? Today, you can download 7 Best Stocks for the Next 30 Days. Click to get this free report
FMC Corporation (FMC) : Free Stock Analysis Report
This article originally published on Zacks Investment Research (zacks.com).
Vancouver, British Columbia–(Newsfile Corp. – May 29, 2026) – Sego Resources Inc.(TSXV: SGZ) ("Sego" or "the Company"), is pleased to announce a critical minerals flow through financing.
The gross proceeds of the financing will be used for exploration at the Miner Mountain project, located near Princeton, BC..
The Miner Mountain project is an Alkalic Porphyry Copper-Gold exploration project which encompasses near-surface disseminated gold mineralization and porphyry copper-gold targets.
Private Placement
The offering will consist of up to 19,400,000 flow-through common shares at $0.05 per share for gross proceeds of up to $ 970,000. There will be no warrants attached to the offering.
Insiders of the Company will participate in the private placement. A commission of 7% cash and 7% warrants exercisable at $0.05 for one year will be paid on a portion of the private placement .
This offering will be subject to the completion of formal documentation, receipt of all necessary regulatory approvals, including the TSX Venture Exchange and other customary conditions. All of the securities sold pursuant to the offering will be subject to a four-month hold period from the date of closing.
None of the securities issued in the Offering will be registered under the United States Securities Act of 1933, as amended (the "1933 Act").
There is no material change about the issuer that has not been generally disclosed.
For further information please contact: J. Paul Stevenson, CEO
(604) 682-2933
About the Project
Sego is 100% owner of the Miner Mountain Project, an alkalic copper-gold porphyry and gold exploration project located near Princeton, British Columbia. The property is 2,056 hectares in size and is 15 km north of the Copper Mountain Mine operated by Hudbay Minerals Inc. Sego has a Memorandum of Understanding with the Upper Similkameen Indian Band on whose Traditional Territory the Miner Mountain Project is situated. Sego has received an Award of Excellence for its reclamation work on the Miner Mountain Project.
Neither the TSX Venture Exchange nor its Regulation Services Provider (as that term is defined in the policies of the TSX Venture Exchange) accepts responsibility for the adequacy or accuracy of this release. No regulatory authority has approved or disapproved the information contained in this news release.
This release includes certain statements that may be deemed "forward-looking statements". All statements in this release, other than statement of historical facts that address future production, reserve potential, exploration drilling, exploitation activities and events or developments that the Company expects re forward-looking statements. Although the Company believes the expectations expressed in such forward-looking statements are based on reasonable assumptions, statements are not guarantees of future performance and actual results or developments may differ materially from the forward-looking statements. Factors that could cause actual results to differ materially from those in forward-looking statements include market prices, exploitation and exploration successes, continued availability of capital and financing, general economic, market or business conditions. Investors are cautioned that any such statements are not guarantees of future performance and those actual results or developments may differ materially from those projected in the forward-looking statements.
NOT FOR DISTRIBUTION TO UNITED STATES NEWSWIRE SERVICES OR FOR DISSEMINATION IN THE UNITED STATES
To view the source version of this press release, please visit https://www.newsfilecorp.com/release/299494
Albemarle Corporation ALB remains committed to driving shareholder value by leveraging solid liquidity and healthy cash flows. At the end of the first quarter of 2026, ALB had liquidity of around $2.7 billion, including cash and cash equivalents of around $1.1 billion. It generated an operating cash flow of $346 million and free cash flow of $248 million in the quarter. ALB generated free cash flow of $692 million for full-year 2025, driven by strong cash conversion, lower capital spending and productivity measures. Free cash flow in 2026 is expected to be supported by the recent uptick in lithium prices, strong cash conversion and productivity. Its ability to convert improving operating performance into free cash is likely to result in incremental returns to shareholders. ALB expected full-year 2026 operating cash flow conversion to be within its long-term target range of 60-70% at the average lithium market price of $20 per kilogram.The company remains focused on maintaining its dividend payout. It has raised its quarterly dividend for the 30th straight year. ALB offers a dividend yield of 0.9% at the current stock price. Backed by healthy cash flows and sound financial health, the company's dividend is perceived to be safe and reliable.Among its peers, Sociedad Quimica y Minera de Chile S.A. SQM exited the first quarter with strong liquidity, with cash and cash equivalents being around $2.8 billion. Sociedad Quimica’s solid cash position supports its capital investment in growth projects and shareholder-friendly actions. Sociedad Quimica projects total capital expenditure of $2.7 billion for the 2025-2027 period, which includes the expansion of lithium carbonate and lithium hydroxide capacity in Chile. ICL Group Ltd. ICL ended the first quarter with cash and cash equivalents, and short-term investments and deposits of $581 million. Including unutilized revolving credit facility and securitization, ICL Group had cash resources of $1,491 million at the end of the quarter. ICL generated an operating cash flow of $195 million in the first quarter. It distributed roughly $224 million in dividends to its shareholders last year.
ALB’s Price Performance, Valuation & Estimates
Albemarle has gained 38.3% in the past six months compared with the Zacks Chemical – Diversified industry’s rise of 25.6%.
Image Source: Zacks Investment Research
ALB is currently trading at a forward price-to-sales ratio of 3.37, above the industry. It carries a Value Score of D.
Image Source: Zacks Investment Research
The Zacks Consensus Estimate for ALB’s 2026 earnings implies a year-over-year rise of 1,555.7%. The EPS estimates for 2026 have been trending higher over the past 60 days.
Image Source: Zacks Investment Research
ALB stock currently carries a Zacks Rank #1 (Strong Buy). You can see the complete list of today’s Zacks #1 Rank stocks here.
Want the latest recommendations from Zacks Investment Research? Today, you can download 7 Best Stocks for the Next 30 Days. Click to get this free report
Albemarle Corporation (ALB) : Free Stock Analysis Report
Sociedad Quimica y Minera S.A. (SQM) : Free Stock Analysis Report
ICL Group Ltd. (ICL) : Free Stock Analysis Report
This article originally published on Zacks Investment Research (zacks.com).
This article first appeared on GuruFocus.
- Lithium Sales Volume: Increased by 25% year-over-year, reaching approximately 69,000 metric tons of lithium carbonate equivalent.
- Contribution to Chilean State: Over $530 million in contributions through payments, taxes, and transfers to local governments in the first quarter.
- Projected Lithium Sales Volume Growth: Expected to grow by approximately 15% compared to 2025.
- Specialty Plant Nutrition Sales Volume Growth: Expected to grow by approximately 10% compared to 2025.
- Warning! GuruFocus has detected 5 Warning Signs with SQM.
- Is SQM fairly valued? Test your thesis with our free DCF calculator.
Release Date: May 27, 2026
For the complete transcript of the earnings call, please refer to the full earnings call transcript.
Positive Points
- Sociedad Quimica Y Minera De Chile SA (NYSE:SQM) reported strong results for the first quarter of 2026, reflecting robust performance across key business lines.
- The partnership with Codelco through Novandinolithium completed its first full quarter of operations, generating over $530 million in contributions to the Chilean state.
- Lithium sales volumes increased by 25% year-over-year, with expectations for total lithium sales volumes to grow by approximately 15% compared to 2025.
- The specialty plant nutrition business line is expected to see a 10% growth in sales volumes, driven by reduced potassium nitrate exports from China.
- The company is advancing in the Salar Futuro project and expects to begin the environmental permitting process soon, indicating future growth potential.
Negative Points
- The company faces a high volatile price scenario in the lithium market, making it difficult to predict prices beyond the second quarter.
- Despite higher cash and cash equivalents, the company has significant obligations, including payments to Corfo and tax-related payments, which may limit cash availability for other uses.
- The iodine market faces potential supply disruptions, and there is uncertainty about whether supply will accelerate in the next two to three years, affecting pricing.
- Inflation and global uncertainties could impact the cost and returns of the Salar Futuro project, although the company remains optimistic about its viability.
- The effective tax rate was higher than usual due to increased profitability in the lithium business, leading to higher mining taxes.
Q & A Highlights
Q: How does the movement in the lithium battery business over the last year affect SQM's outlook on mid-cycle pricing? A: Pablo Hernandez, Vice President of Strategy and Development of the Lithium Chile Division, noted that the average sales price in Q1 2026 was approximately $18 per kilo, significantly higher than the $10 per kilo in Q4 2025. Prices are expected to remain volatile, making it difficult to predict beyond Q2 2026.
Q: How does SQM plan to utilize the windfall free cash flow generated by higher lithium prices? A: Gerardo Illanes Gonzalez, Chief Financial Officer, stated that while the company has historically distributed special dividends, no decision has been made yet for this quarter. The company is assessing opportunities for dividend distribution while considering tax-related payments and investments.
Q: What is causing the increase in specialty plant nutrition (SPN) business volumes, and how sustainable is this trend? A: Pablo Altimiras, Executive Vice President – Nitrates and Iodine, explained that the increase is due to China's suspension of potassium nitrate exports, allowing SQM to capture market share. The sustainability of this trend is uncertain due to potential changes in China's export policies.
Q: What gives SQM confidence that iodine prices will remain elevated despite potential supply increases? A: Pablo Altimiras highlighted that the iodine market has evolved with increased demand from applications like contrast media. Marginal projects are costlier, and strong demand growth supports current price levels.
Q: Can you provide details on the Salar Futuro project's CapEx and the impact of inflation on returns? A: Ricardo Ramos Rodriguez, Chief Executive Officer, mentioned that the estimated investment is around $30 billion. Inflation affects costs but also increases commodity prices, which should maintain project returns. The environmental study is expected to be filed by Q3 2026, with investment starting in 2030.
Q: What is the outlook for lithium volume growth, and how is it being achieved? A: Pablo Hernandez stated that SQM expects a 15% increase in lithium sales volumes year-over-year, driven by strong demand and production capacity maximization. The company aims to meet market needs with over 270,000 metric tons of production.
Q: How does SQM view the impact of inflation on the Salar Futuro project and its returns? A: Ricardo Ramos Rodriguez explained that while inflation is a concern, it also raises commodity prices, which should offset cost increases and maintain project returns. The project is expected to start investment in 2030.
Q: Can you explain the higher effective tax rate in the quarter? A: Gerardo Illanes Gonzalez noted that the higher tax rate is due to increased profitability from higher lithium prices, which raised the mining tax rate. The mining tax is based on profitability and export revenues.
For the complete transcript of the earnings call, please refer to the full earnings call transcript.
This article first appeared on GuruFocus.
SQM (NYSE:SQM) reported a sharp rebound in first-quarter profit as lithium demand shows signs of tightening again, helped by battery storage systems and electric vehicles. The Chilean lithium producer posted adjusted Ebitda of $837 million for the three months ended March 31, more than double the year-earlier level and above the average analyst estimate. Revenue rose to $1.8 billion, also slightly ahead of expectations, giving investors one of SQM's strongest quarters since the 2022 lithium boom.
- Warning! GuruFocus has detected 5 Warning Signs with SQM.
- Is SQM fairly valued? Test your thesis with our free DCF calculator.
The bigger story is volume. SQM sold about 69,000 metric tons of lithium carbonate equivalent in the quarter while operating at full capacity to meet demand. Management now expects lithium sales volumes to rise about 15% this year, up from its earlier forecast of 10%. That matters because the lithium market has spent two years under pressure, with falling prices forcing producers to cut costs, delay projects and idle capacity. SQM's updated outlook suggests demand from energy storage and EVs could be pulling the market back toward a tighter supply-demand balance.
CEO Ricardo Ramos said global lithium demand could exceed 1.9 million tons in 2026, supported in part by rapid growth in battery energy storage systems. Ramos said market conditions continue to point to a tight balance between supply and demand, and that the positive pricing trend seen in recent months could continue in the short term. SQM is choosing to maximize output and keep costs low rather than restrict supply to support prices, while investors are likely to focus next on pricing trends, Salar Futuro and the company's Codelco partnership, which extends Atacama operations through 2060.
| Highlights |
|
|
|
|
| SQM will hold a conference call to discuss these results on Wednesday, May 27, 2026 at 12:00pm EDT (12:00pm Chile time). |
| Participant Call link: https://register-conf.media-server.com/register/BIf194b8fef0d7479a82018f16e2c31fe3 |
| Webcast: https://edge.media-server.com/mmc/p/9qtcu4gc |
SANTIAGO, Chile, May 26, 2026 (GLOBE NEWSWIRE) — Sociedad Química y Minera de Chile S.A. (SQM) (NYSE: SQM; Santiago Stock Exchange: SQM-B, SQM-A) reported today net income for the three months ended March 31, 2026, of US$364.7 million or US$1.28 per share, an increase of 165.2% compared to US$137.5 million or US$0.48 per share reported for the same period last year.
Gross profit(1) reached US$778.6 million (44.2% of revenues) for the three months ended March 31, 2026, higher than US$304.7 million (29.4% of revenues) recorded for the three months ended March 31, 2025. Revenues totaled US$1,760.1 million for the three months ended March 31, 2026, representing an increase of 69.8% compared to US$1,036.6 million reported for the three months ended March 31, 2025.
SQM’s Chief Executive Officer, Ricardo Ramos, stated, “We delivered strong results during the first quarter of the year. In lithium, sales volumes reached approximately 69 thousand metric tons of LCE across our operations, as we continued to operate at full capacity to meet strong customer demand. Based on our current estimates, global lithium demand could exceed 1.9 million metric tons of LCE this year, while market dynamics continue to suggest a tight supply-demand balance. As a result, we have upgraded our sales volume guidance for the year, increasing our expected growth from 10% to 15%.”
He added, “The first quarter of 2026 marked our first full quarter operating alongside CODELCO through our partnership Nova Andino Litio, and the results underscore the strength of this partnership. We are operating at full capacity, delivering strong financial results, while we continue to expand production capacity. In the first quarter alone, Nova Andino Litio generated more than US$530 million in contributions to the Chilean state, including payments to CORFO, local governments, and taxes.”
“We are currently finalizing the documentation required to begin the environmental permitting process for the Salar Futuro project. We expect to submit the project to the environmental authorities in the coming months and to share further details with the market in the near term. This project will be developed by Nova Andino, and we are very enthusiastic about its potential to establish a new benchmark in lithium production.”
Mr. Ramos continued, “In our SPN business lines, we are also increasing our sales volume guidance for the year. We now expect total sales volumes to grow by approximately 10% compared to last year, driven by tighter supply conditions in Asia. This reflects reduced export availability, as Chinese producers prioritize domestic consumption and scale back potassium nitrate shipments, creating opportunities for us to serve previously undersupplied markets.”
He further noted, “In Iodine, we observed strong sales volumes and higher year-over-year prices, a trend we expect to continue into the next quarter. We are maintaining our full-year sales volume guidance, with volumes expected to be in line with last year. The seawater pipeline is currently in the commissioning phase, and we expect to bring it online during the second half of the year.”
The CEO concluded, “We continue to see positive market dynamics across our key business lines, particularly in lithium, while remaining optimistic about our iodine and specialty plant nutrition segments. We believe we are well positioned to deliver solid results and improved returns to our shareholders, while continuing to advance our expansion plans in both lithium and iodine”
To see full press release please visit: https://ir.sqm.com/
CONTACT: Contact informationnNova Andino Litio:nIgnacia Lopez / ignacia.lopez@novandino.comnnInternational Lithium Division:nDiana Wearing Smith / diana.wearingsmith@sqm.comnnIodine & Plant Nutrition Division:nCarolina Guzman / carolina.guzman@sqm.com
PHILADELPHIA, May 26, 2026 /PRNewswire/ —
FMC Corporation (NYSE: FMC) today announced that Andrew Sandifer, FMC executive vice president and chief financial officer, will speak at the 16th Annual Wells Fargo Industrials & Materials Conference on June 9, 2026, at 2:15 p.m. Central Time. A live webcast will be available at www.fmc.com/investors.
About FMC
FMC Corporation is a global agricultural sciences company dedicated to helping growers produce food, feed, fiber and fuel for an expanding world population while adapting to a changing environment. FMC's innovative crop protection solutions – including biologicals, crop nutrition, digital and precision agriculture – enable growers and crop advisers to address their toughest challenges economically while protecting the environment. FMC is committed to discovering new herbicide, insecticide and fungicide active ingredients, product formulations and pioneering technologies that are consistently better for the planet. Visit fmc.com to learn more and follow us on LinkedIn®.
View original content to download multimedia:https://www.prnewswire.com/news-releases/fmc-corporation-cfo-andrew-sandifer-to-speak-at-16th-annual-wells-fargo-industrials–materials-conference-302782193.html
Make better investment decisions with Simply Wall St’s easy, visual tools that give you a competitive edge.
- Arafura Rare Earths (ASX:ARU) has approved a final investment decision for its Nolans Rare Earths Project.
- The company has secured major equity financing, backing from Hancock Prospecting and sovereign funds, and multi-governmental support.
- Binding offtake agreements with large global manufacturers position Nolans as what the company describes as Australia’s first fully integrated ore to oxide rare earths operation.
Arafura Rare Earths enters this phase with its shares at A$0.31, after a gain of 82.4% over the past year and 87.9% over five years, while the three year return is down 15.1%. The share price move over the past month, down 12.7%, and over the past week, down 1.6%, indicates that short term sentiment has been more cautious even as longer term performance has been stronger.
For investors tracking the rare earths theme, the Nolans decision and funding mix put ASX:ARU in focus as a potential contributor to supply chains for renewables and EVs. The project aims to add another source of ore to oxide production, which many readers will be watching closely as construction and future ramp up milestones unfold.
Stay updated on the most important news stories for Arafura Rare Earths by adding it to your watchlist or portfolio. Alternatively, explore our Community to discover new perspectives on Arafura Rare Earths.
ASX:ARU Earnings & Revenue Growth as at May 2026
1 thing going right for Arafura Rare Earths that this headline doesn’t cover.
Quick Assessment
- ⚖️ Price vs Analyst Target: At A$0.31, the share price is in line with the A$0.31 consensus target, sitting within the A$0.28 to A$0.35 range.
- ❌ Simply Wall St Valuation: Valuation status is unknown as DCF data is not available, so there is no clear undervalued or overvalued signal yet.
- ❌ Recent Momentum: The shares are down 12.7% over the last 30 days, showing weak short term momentum into this project decision.
There is only one way to know the right time to buy, sell or hold Arafura Rare Earths. Head to Simply Wall St’s
company report for the latest analysis of Arafura Rare Earths’s Fair Value.
Key Considerations
- 📊 The final investment decision, financing and offtakes move Arafura closer to potential production, which is central to any long term investment case.
- 📊 Watch funding drawdowns, construction progress at Nolans and any updates to cost or schedule, as well as how the share price trades around the A$0.31 analyst target.
- ⚠️ Key risks include past shareholder dilution and very low current revenue, which highlight execution and financing risk while the project is built out.
Dig Deeper
For the full picture including more risks and rewards, check out the
complete Arafura Rare Earths analysis. Alternatively, you can visit the
community page for Arafura Rare Earths to see how other investors believe this latest news will impact the company’s narrative.
This article by Simply Wall St is general in nature. We provide commentary based on historical data
and analyst forecasts only using an unbiased methodology and our articles are not intended to be financial advice. It does not constitute a recommendation to buy or sell any stock, and does not take account of your objectives, or your
financial situation. We aim to bring you long-term focused analysis driven by fundamental data.
Note that our analysis may not factor in the latest price-sensitive company announcements or qualitative material.
Simply Wall St has no position in any stocks mentioned.
Companies discussed in this article include ARU.AX.
Have feedback on this article? Concerned about the content? Get in touch with us directly. Alternatively, email editorial-team@simplywallst.com
This article first appeared on GuruFocus.
Arafura Rare Earths Ltd. (ARAFF) is entering a high-stakes funding phase as Australia's richest person, Gina Rinehart, moves to deepen her exposure to the company's rare earths strategy. The company launched a A$375 million capital raising plan, built around a two-tranche share placement at 26 cents per share to raise A$350 million, plus a stock purchase plan at the same price that could bring in up to A$25 million. The timing matters for investors because the raise comes just one day after Arafura made its final investment decision to develop the Nolans mine in Australia's Northern Territory, a project expected to produce about 5% of global rare earths.
- Warning! GuruFocus has detected 1 Warning Sign with ARAFF.
- Is ARAFF fairly valued? Test your thesis with our free DCF calculator.
Rinehart is already Arafura's largest shareholder, with a position of around 15%, and Hancock Prospecting Ltd. has committed to buy A$85 million worth of new stock. That purchase would lift Hancock's stake to around 17.5%, giving Rinehart an even larger position in one of Australia's more closely watched rare earths developments. For investors, the move could be read as another sign of rising conviction around critical minerals supply chains, especially as Arafura has already secured offtake agreements and more than A$1 billion in Australian government financial support, including loans and an equity investment through Export Finance Australia.
The broader context is that Rinehart was an early mover in rare earths and has built the world's largest portfolio of rare-earth element investments outside China, more than 20 years after first making her fortune in steelmaking iron ore. Her exposure also includes stakes in MP Materials Corp. (MP), Lynas Rare Earths Ltd. (LYSDY), and Rare Earths Americas Inc., while Hancock has also expanded into military and defense shares including RTX Corp. (RTX), Northrop Grumman Corp. (NYSE:NOC), L3Harris Technologies Inc. (NYSE:LHX), and Lockheed Martin Corp. (NYSE:LMT), worth a combined $97 million as of March 31. Arafura plans to sell around 20% of its targeted neodymium-praseodymium oxide output on the spot market, which could make pricing exposure an important part of the investment story as the Nolans project moves forward.
May 22 (Reuters) – Australia's Arafura Rare Earths said on Friday it plans to raise about A$350 million ($250 million) in a share placement backed by Gina Rinehart's Hancock Prospecting, to help fund development of its Nolans project.
The share placement plan comes a day after the miner approved the development of its $1.6 billion project in the Northern Territory, which is set to be the country's third-biggest rare earths operation by the end of the decade.
Arafura will issue shares worth about A$175.5 million at A$0.260 apiece in the initial tranche, representing a 16.1% discount to the stock's last close on Thursday. In the second tranche, it will issue shares of A$174.5 million subject to shareholder approval.
Hancock Prospecting, owned by Australia's richest person Gina Rinehart and also Arafura's largest shareholder, has committed to invest about A$85 million in the raising.
Upon completion of the fundraising, Hancock's stake in Arafura will rise to roughly 17.5% from 15.5% at present.
Arafura said proceeds from the placement will fully fund the equity component required to develop the Nolans project.
The miner has already secured financing commitments from the export credit agencies of the United States, Canada, Germany and South Korea, alongside global trading houses and manufacturers, as Western countries step up efforts to diversify away from China, the dominant rare earths producer.
The company said it has now secured about 93% of its binding offtake target for neodymium-praseodymium (NdPr) oxide from the project, following recent supply agreements and support from export credit agencies.
Australia is pushing to become the top supplier of rare earths to its allies, and Arafura is slated to supply 500 metric tons of NdPr to the country's strategic minerals reserve, which is set to be operational by year-end.
Arafura is also undertaking a share purchase plan to raise up to A$25 million from retail investors, it said.
Shares of the firm were on a trading halt.
($1 = 1.3998 Australian dollars)
(Reporting by Rajasik Mukherjee; Editing by Subhranshu Sahu)
VANCOUVER, BC / ACCESS Newswire / May 21, 2026 / Stillwater Critical Minerals Corp. (TSXV:PGE)(OTCQB:PGEZF)(FSE:J0G) (the "Company", or "Stillwater") reports results of rhodium ("Rh") assays from the 2025 resource expansion drill campaign and highlights chromium defined at the Company's 100%-owned Stillwater West project in Montana, USA.
Highlights
-
Rhodium assays from the 2025 drill campaign confirm widespread rhodium mineralization at potential co-product levels across the Chrome Mountain and Iron Mountain resource areas within the broader district-scale polymetallic system including the Pine and Picket Pin target areas at Stillwater West.
-
Results will be incorporated into the updated Mineral Resource Estimate targeted for the first half of 2026, including the current 115,000-ounce rhodium component which represents the only known rhodium resource in the United States (as announced January 25, 2023, and October 27, 2025).
-
Drilling intersected up to 0.167 g/t Rh over 1.22 metres ("m") in hole CM2025-01 from 358m depth, with a second interval of 0.107 g/t Rh over 1.22m from 388m, supporting rhodium as a potential co-product within the broader polymetallic system (see Table 1).
-
Approximately seven kilometers to the east, IM2025-01 returned 1.22m at 0.148g/t Rh starting at 272m, continuing to demonstrate the district-scale nature of the mineralized system.
-
Previous drilling at Chrome Mountain also intersected elevated Rh values including 1.13 g/t Rh over 1.2m in hole CM2023-03 and 0.162 g/t Rh over 3.7m in hole CM2023-01.
-
Historic rock sample programs returned up to 5.78 g/t Rh in the HGR deposit area at Iron Mountain, and up to 1.07 g/t Rh at Chrome Mountain.
-
Rock sampling by Stillwater from 2019 to 2022 included 31 rhodium assays with an average of 0.162 g/t Rh and a maximum value of 0.644 g/t Rh across known deposit areas and also the pre-resource Picket Pine and Pine targets (Figure 1).
-
The five-year average Rh price and the current spot price is approximately US$10,000/oz.
-
Rhodium is identified as a critical mineral in the United States and is used in emissions control, high-temperature alloys, defense-related industrial applications and other advanced technologies.
-
In addition, Stillwater has defined a resource of 2.3 billion pounds ("Blbs") of contained chromium at Stillwater West, underscoring the project's strategic significance as a potential domestic source of a mineral essential to steel production, industrial manufacturing and defense related applications.
Michael Rowley, President and CEO of Stillwater Critical Minerals, commented "Rhodium tops the U.S. government list of priority critical minerals as ranked for potential GDP disruption. Against this backdrop, the continued identification of elevated rhodium levels further supports the polymetallic nature of the Stillwater West system. The current NI 43-101 Mineral Resource Estimate for Stillwater West includes significant nickel, copper, cobalt, palladium, platinum and gold resources, yet-to-be-quantified amounts of iridium, ruthenium and osmium, and the largest formal resources of rhodium and chromium in the U.S. The updated Mineral Resource Estimate, targeted for the first half of 2026, is expected to further define the scale of the Stillwater West system and support its advancement as a large-scale domestic source of ten minerals currently listed as critical in the United States."
Dr. Danie Grobler, Vice-President Exploration, commented "The 2025 rhodium results continue to support the scale and polymetallic nature of the Stillwater West system, with rhodium associated with broader platinum group element and nickel-copper sulphide mineralization across multiple resource areas. The Stillwater Igneous Complex remains unique in the United States as the country's only primary source of platinum group elements, and similarities to large polymetallic systems such as the Bushveld Igneous Complex continue to support the exploration model being applied at Stillwater West."
Table 1 – Highlight 2025 Drill Results from Chrome Mountain and Iron Mountain Deposit Areas
Notes: 1) Highlighted significant intercepts with grade-thickness values over 7 percent-meter recovered NiEq are presented above, except as noted. 2) Recovered Nickel Equivalents ("NiEq") are presented for comparative purposes using conservative long-term metal prices (all USD): $8.00/lb nickel (Ni), $4.50/lb copper (Cu), $15.00/lb cobalt (Co), $1,250/oz platinum (Pt), $1,250/oz palladium (Pd), $3,000/oz gold (Au), and $6,500/oz rhodium (Rh). 3) NiEq is determined as follows: NiEq% = [Ni% x recovery] + [Cu% x recovery x Cu price/ Ni price] + [Co% x recovery x Co price / Ni price] + [Pt g/t x recovery / 31.103 x Pt price / Ni price / 2,204 x 100] + [Pd g/t x recovery / 31.103 x Pd price / Ni price / 2,204 x 100] + [Au g/t x recovery / 31.103 x Au price / Ni price / 2,204 x 100]. 4) In the above calculations: 31.103 = grams per troy ounce, 2,204 = lbs per metric tonne, and 100 and 0.01 convert assay results reported in % and g/t. 5) The following recoveries have been assumed for purposes of the above equivalent calculations: 85% for Ni and 90% for all other listed metals, based on recoveries at similar nearby operations. 6) Total metal equivalent values include both base and precious metals. In terms of dollar value, 0.20% nickel equates to a copper value of 0.36%, or a palladium value of 0.88 g/t, using the above metal values. 7) Intervals are reported as drilled widths and are believed to be representative of the actual width of mineralization.
Table 2 – Drill Hole Location and Depths
Picket Pin Target
The Picket Pin horizon is a historically known high-grade reef-type PGE target situated above the J-M Reef in the upper stratigraphy of the Stillwater Igneous Complex. Work by Stillwater in 2019 returned rock samples up to 0.162 g/t Rh alongside 5.09 g/t 3E (Pt, Pd, and Au), confirming the presence of rhodium as a co-product in this pre-resource target area.
Pine Target
The Pine target is a high-grade gold, nickel and PGE target that the Company is advancing towards a formal resource estimate. A 2019 rock sample returned 0.541 g/t Rh and a 2022 trench sampling campaign returning an average of 9.0 g/t Au, 0.69 g/t Pd, and 0.69 g/t Pt, with historic drilling recording up to 31.02 g/t 3E (Pt, Pd and Au) over 2.6 m.
Critical Minerals at Stillwater West
Stillwater West benefits from being a large and polymetallic system that offers a balanced suite of base and precious metals, many of which are now listed as critical.
Rhodium has been identified by the U.S. Geological Survey as one of the highest-risk critical minerals in terms of potential economic impact from supply disruptions. The metal is produced solely as a co-product and has limited domestic supply in the United States.
Rhodium is a critical component in catalytic converters, used alongside platinum and palladium to reduce vehicle emissions. It is also increasingly recognized as strategically important to U.S. national security and the defense industrial base due to its role in high-performance, high-temperature, and corrosion-resistant applications.
In addition to rhodium, Stillwater West contains multiple other minerals considered strategically important to U.S. industrial, energy and defense supply chains, including nickel, copper, cobalt, chromium and platinum group metals. Chromium is of particular importance due to the United States' near-total reliance on imports and limited domestic production. Historic chromium production from the Stillwater Complex is well documented, and the district continues to host the majority of known domestic chromium resources.
Current mineral resources at Stillwater West include nickel, copper, cobalt, chromium, palladium, platinum, rhodium and gold, in addition to yet-to-be-quantified amounts of iridium and ruthenium (see news release January 25, 2023). The Company continues to engage with U.S. government agencies as it advances Stillwater West through ongoing technical and development studies.
Upcoming Events
Company representatives will be attending the following events to discuss upcoming catalysts:
Commodities Global Expo – Ft. Lauderdale, FL, USA, May 20-22, 2026.
The Evolving Climate and Energy Landscape in Greece – Athens, Greece, May 25-26, 2026.
Montana Mining Association Annual Meeting 2026 – Butte, MT, USA, July 13-15, 2026.
Precious Metals Summit – Beaver Creek, CO, USA, September 22-25, 2026.
Option Grant
The Company is pleased to announce that, subject to the approval of the TSX Venture Exchange ("TSXV"), it has granted an aggregate of 2,715,000 options (each, an "Option") to certain directors and officers of the Company in accordance with the Company's Long-Term Performance Incentive Plan ("LTIP"). Each Option is exercisable to acquire one common share in the capital of the Company (each, a "Share") at an exercise price of $0.32 per Share, based on the five trading-day volume weighted average trading price of the Shares on the TSXV as of May 20, 2026. The Options are valid for a period of five years from the date of grant and vest over time in accordance with the terms of the LTIP. All options granted are subject to the policies of the TSXV and applicable hold periods.
About Stillwater Critical Minerals Corp.
Stillwater Critical Minerals (TSX.V: PGE | OTCQB: PGEZF | FSE: J0G) is a mineral exploration and development company advancing its 100%-owned Stillwater West Ni-PGE-Cu-Co-Cr + Au project in the Stillwater mining district of Montana, USA. Stillwater West is directly adjacent to Sibanye-Stillwater's operating Stillwater mines and processing infrastructure, the only primary platinum group element-producing complex in the United States. An NI 43-101 Mineral Resource Estimate released in January 2023 positions Stillwater West as one of the largest nickel and platinum group element resources in the United States and includes ten minerals currently listed as critical. With strategic investments by Glencore and an experienced technical team with expertise in Bushveld- and Platreef-style systems, the Company is advancing Stillwater West through ongoing resource expansion and technical studies. Stillwater also holds a 49% interest in the high-grade Drayton-Black Lake-gold project adjacent to Nexgold
Mining's development-stage Goliath Gold Complex in northwest Ontario, currently under an earn-in agreement with Heritage Mining, and the Kluane PGE-Ni-Cu-Co critical minerals project on trend with Nickel Creek Platinum‘s Wellgreen deposit in Canada‘s Yukon Territory. The Company also holds the Duke Island Cu-Ni-PGE property in Alaska and maintains a back-in right on the high-grade past-producing Yankee-Dundee in BC, following its sale in 2013.
FOR FURTHER INFORMATION, PLEASE CONTACT:Michael Rowley, President, CEO & Director – Stillwater Critical MineralsEmail: info@criticalminerals.com Phone: (604) 357 4790Web: http://criticalminerals.com Toll Free: (888) 432 0075
Quality Control and Quality Assurance
2025 drill core samples were analyzed by ACT Labs in Vancouver, B.C. Sample preparation: crush (< 7 kg) up to 80% passing 2 mm, riffle split (250 g) and pulverize (mild steel) to 95% passing 105 µm included cleaner sand. Gold, platinum, and palladium were analyzed by fire assay (1C-OES) with ICP finish. Selected major and trace elements were analyzed by peroxide fusion with 8-Peroxide ICP-OES finish to insure complete dissolution of resistate minerals. Following industry QA/QC standards, blanks, duplicate samples, and certified standards were also assayed.
Mr. Mike Ostenson, P.Geo., is the qualified person for the purposes of National Instrument 43-101, and he has reviewed and approved the technical disclosure contained in this news release. Mr. Ostenson is a Geologist at Stillwater and is not independent of the Company.
Forward-Looking Statements
This news release includes certain statements that may be deemed "forward-looking statements" or "forward-looking information". In particular, this press release contains forward-looking information relating to, among other things, the interpretation of exploration results, the potential for resource expansion, the timing and results of future resource estimates (including the targeted H1 2026 updated MRE), the timing and success of exploration activities, permitting timelines, and future plans and objectives of the Company. All statements in this release, other than statements of historical facts, are forward-looking statements that involve various risks and uncertainties. Although Stillwater Critical Minerals believes the expectations expressed in such forward-looking statements are based on reasonable assumptions, such statements are not guarantees of future performance and actual results or developments may differ materially from those in the forward-looking statements. For more information on Stillwater Critical Minerals and the risks and challenges of their businesses, investors should review their annual filings that are available at www.sedarplus.ca.
Neither the TSX Venture Exchange nor its Regulation Services Provider (as that term is defined in the policies of the TSX Venture Exchange) accepts responsibility for the adequacy or accuracy of this release.
SOURCE: Stillwater Critical Minerals Corp.
View the original press release on ACCESS Newswire
MELBOURNE, May 21 (Reuters) – Arafura Rare Earths said on Thursday it approved the development of its $1.6 billion Nolans project in Australia's Northern Territory, which is set to be the country's third-biggest rare earths operation by the end of the decade.
Shares of the company rose as much as 13.6% to A$0.335 in their best intraday gain since March 11. The benchmark stock index was up 0.9%, as of 0215 GMT.
Arafura secured financing commitments from the export credit agencies of the United States, Canada, Germany and South Korea, alongside global trading houses and manufacturers as Western countries step up efforts to diversify away from dominant rare earths producer China.
Arafura will supply South Korean automakers Hyundai and Kia, Germany's Siemens Gamesa RE, and commodity trader Traxys' Luxembourg and U.S. units.
Construction on the project, which has been in the making since the deposit was discovered three decades ago, will begin in September, with first production expected from mid-2029.
Arafura secured a $1.6 billion funding package including a significant buffer and is backed by Australia's richest person, Gina Rinehart, whose Hancock Prospecting owns a 15.5% stake.
The Nolans project is designed to deliver 4,440 metric tons of neodymium-praseodymium (NdPr) oxide annually, targeting markets outside China amid growing demand for rare earths used in electric vehicles and wind turbines.
The size would make it Australia's third-biggest operation after Lynas Rare Earths, the world's largest producer outside China, which produced 6,600 metric tons in the last financial year, and Iluka, which has 5,500 tons of NdPr capacity and is expected to start next year.
Australia is pushing to be the top supplier of rare earths to its allies, and Arafura is slated to supply 500 tons of NdPr to the country's strategic minerals reserve, which is set to be up and running by year-end.
Arafura said engineering contractor Hatch has been engaged to support development.
The final investment decision came after a multi-year financing and offtake strategy.
($1 = 1.3988 Australian dollars)
(Reporting by Rajasik Mukherjee and Melanie Burton in Melbourne; Editing by Subhranshu Sahu and Jamie Freed)
NOT FOR DISTRIBUTION TO U.S. NEWSWIRE SERVICES OR DISSEMINATION IN THE UNITED STATES
VANCOUVER, British Columbia, May 19, 2026 (GLOBE NEWSWIRE) — Apex Critical Metals Corp. (CSE: APXC) (OTCQX: APXCF) (FWB: KL9) (“Apex” or the “Company”), a Canadian mineral exploration company focused on the identification and development of critical and strategic metals, announces that, further to its news release dated May 18, 2026, it has entered into an amended agreement with Canaccord Genuity Corp. to act as lead agent and sole bookrunner along with a syndicate of agents to be formed (the “Agents”) in connection with a “best efforts” private placement now upsized to up to 7,895,000 units of the Company (each, a “Unit”, and, collectively, the “Units”) at a price of C$1.90 per Unit (the “Offering Price”) for aggregate gross proceeds of up to C$15,000,500 (the “Offering”) under the Listed Issuer Financing Exemption (as defined below).
Each Unit will consist of one common share of the Company (each, a “Common Share” and, collectively, the “Common Shares”) and one Common Share purchase warrant of the Company (each, a “Warrant” and, collectively, the “Warrants”). Each Warrant will be exercisable to acquire one Common Share (each, a “Warrant Share”, and, collectively, the “Warrant Shares”) at a price of C$2.60 per Warrant Share for a period of 24 months from the Closing Date (as defined below). The Warrants to be issued pursuant to the Offering will not be listed for trading on any stock exchange. The Offering is expected to close on or about June 2, 2026 (the “Closing Date”), or such other date as determined by the Company and the Agents, such date being no later than 45 days from the date hereof.
Subject to compliance with applicable regulatory requirements and in accordance with National Instrument 45-106 – Prospectus Exemptions (“NI 45-106”), the Offering is being made to purchasers resident in all provinces and territories of Canada, except Québec, pursuant to the listed issuer financing exemption under Part 5A of NI 45-106 (the “Listed Issuer Financing Exemption”). The Units to be offered under the Listed Issuer Financing Exemption will not be subject to a hold period in Canada in accordance with applicable Canadian securities laws.
The Units will also be offered to investors outside of Canada pursuant to BC Instrument 72-503 – Distributions of Securities outside British Columbia, provided it is understood that no prospectus filing or comparable obligation arises in such other jurisdiction. Any sale of Units to persons in the United States will be made to “Accredited Investors” pursuant to Rule 506(b) of Regulation D (including “Qualified Institutional Buyers” as defined in Rule 144A who are also “Accredited Investors”) adopted by the United States Securities and Exchange Commission under the United States Securities Act of 1933, as amended (the “U.S. Securities Act”).
As consideration for their services in connection with the Offering, the Agents will receive a cash commission equal to 6% of the gross proceeds of the Offering and compensation warrants equal to 3% of the aggregate number of Units sold under the Offering (the “Compensation Warrants”), with each Compensation Warrant exercisable to purchase one Common Share at C$1.90 for a period of 24 months from the Closing Date. In each case, the consideration will be reduced to 3% in the case of President’s List investors.
The gross proceeds of the Offering will be used to fund exploration of the Company’s Rift, CAP, and Lac Le Moyne Projects, and for general working capital purposes as further set out in the Offering Document (as defined below).
The Agents will no longer be granted the over-allotment option announced on May 18, 2026. All other terms of the Offering, other than the upsize, remain unchanged.
There is an amended and restated offering document (the “Offering Document”) related to the Offering that can be accessed under the Company’s issuer profile on SEDAR+ at www.sedarplus.ca and on the Company’s website at: www.apexcriticalmetals.com. Prospective investors should read this Offering Document before making an investment decision.
This news release does not constitute an offer to sell or a solicitation of an offer to buy securities in the United States, nor will there be any sale of the securities in any jurisdiction in which such offer, solicitation, or sale would be unlawful. The securities offered have not been and will not be registered under the U.S. Securities Act or any state securities laws and may not be offered or sold in the United States or to U.S. Persons unless registered under the U.S. Securities Act and applicable state securities laws or an exemption from such registration is available.
About Apex Critical Metals Corp. (CSE: APXC) (OTCQX: APXCF) (FWB: KL9)Apex Critical Metals Corp. is a Canadian exploration company focused on advancing rare earth element (REE) and niobium projects that support the growing demand for critical and strategic metals across the United States and Canada.
With a growing portfolio of critical mineral projects in both Canada and the United States, Apex Critical Metals is strategically positioned to help strengthen domestic supply chains for the minerals essential to advanced technologies, clean energy, and national security. Apex is publicly listed in Canada on the Canadian Securities Exchange (CSE) under the symbol APXC and quoted on the OTCQX market in the United States under the symbol APXCF, and in Germany on the Borse Frankfurt under the symbol KL9 and/or WKN: A40CCQ. Find out more at www.apexcriticalmetals.com and watch our videos at https://apexcriticalmetals.com/media/ and make sure to stay in touch by signing up for free news alerts at https://apexcriticalmetals.com/news/news-alerts/, or by following us on X (formerly Twitter), Facebook or LinkedIn.
On Behalf of the Board of Directors
APEX CRITICAL METALS CORP.,Sean CharlandChief Executive OfficerTel: 604.681.1568Email: info@apexcriticalmetals.com
Neither the Canadian Securities Exchange nor its Regulation Services Provider (as that term is defined in the policies of the CSE) accepts responsibility for the adequacy or accuracy of this release.
Cautionary Note Regarding Forward-Looking Statements
This news release contains forward-looking statements and other statements that are not historical facts. Forward-looking statements are often identified by terms such as “will”, “may”, “should”, “anticipate”, “expects” and similar expressions. All statements other than statements of historical fact, included in this news release are forward-looking statements that involve risks and uncertainties. Forward-looking statements in this press release include, but are not limited to, statements regarding the Company’s exploration and development plans with respect to its projects, statements regarding the Offering including, without limitation, statements regarding the size of the Offering, the completion or the expected Closing Date, the completion of all required regulatory filings, the use of gross proceeds, and the Company’s anticipated business and operational activities. There can be no assurance that such statements will prove to be accurate and actual results and future events could differ materially from those anticipated in such statements. Important factors that could cause actual results to differ materially from the Company’s expectations include, but are not limited to, delay or failure to receive regulatory approvals, investor demand, inability to complete the Offering, delay or failure to close the Offering, the inherently unpredictable nature of resource exploration, market conditions and the risks detailed from time to time in the filings made by the Company with securities regulators. The reader is cautioned that assumptions used in the preparation of any forward-looking information may prove to be incorrect. Events or circumstances may cause actual results to differ materially from those predicted, as a result of numerous known and unknown risks, uncertainties, and other factors, many of which are beyond the control of the Company. The reader is cautioned not to place undue reliance on any forward-looking information. Such information, although considered reasonable by management at the time of preparation, may prove to be incorrect, and actual results may differ materially from those anticipated.
Forward-looking statements contained in this news release are expressly qualified by this cautionary statement. The forward-looking statements contained in this news release are made as of the date of this news release and the Company will update or revise publicly any of the included forward- looking statements as expressly required by applicable law.
VANCOUVER, B.C. – May 19, 2026 (NEWMEDIAWIRE) – Ares Strategic Mining Inc. (CSE: ARS) (OTCQX: ARSMF) (FRA: N8I1) is pleased to announce a strategic evolution of its Board of Directors as the Company advances toward its next phase of growth, operational maturity, and planned transition to a senior U.S. exchange.
Company Appoints Senior Financial and International Business Executive Lorenzo Esteva to Board as ARES Advances Toward Greater Institutional and Commercial Expansion
To support ARES' continued expansion and increasing engagement with U.S. institutional, commercial, and financial markets, the Company is pleased to announce the appointment of Lorenzo Esteva to the Board of Directors.
Strengthening the Board for the Next Stage of Development
Mr. Esteva brings more than 30 years of senior financial, restructuring, wealth management, corporate advisory, and international business experience across the United States and Latin America. His background includes senior leadership roles at:
-
UBS Financial Services
-
Merrill Lynch
-
Prospero International
-
Golden Ratio CS LLC
Throughout his career, Mr. Esteva has specialized in:
-
Institutional and private capital markets
-
Corporate restructuring and operational optimization
-
International business expansion
-
Strategic partnerships and mergers
-
Ultra-high-net-worth client advisory
-
Cross-border finance and offshore operations
James Walker, President and CEO of Ares Strategic Mining, commented: "As Ares continues to mature into a larger and more institutionally focused company, it is essential that our Board evolves alongside it. Lorenzo brings an exceptional combination of banking, corporate finance, restructuring, and international commercial expertise that will be invaluable as we continue scaling operations, expanding internationally, and preparing for the next level of public market participation."
Positioning ARES for Institutional Growth
The Board transition reflects Ares' evolution from a development-stage mining company into an emerging strategic materials supplier with:
-
Active mining operations
-
Expanding processing infrastructure
-
Major U.S. government contracts
-
Increasing international commercial opportunities
-
Planned uplisting initiatives
Mr. Esteva's appointment is expected to strengthen the Company's:
-
Institutional market readiness
-
Banking and financial relationships
-
Commercial structuring capabilities
-
International business development efforts
-
Strategic growth planning
"Ares is entering a transformative period," added Walker. "Our operational progress, strategic government relationships, and expanding market position require a board with deep commercial and financial expertise capable of supporting a company operating at a much larger scale."
As part of this transition, Paul Sarjeant and Raul Sanabria have agreed to step down from the Board of Directors. The Company sincerely thanks both individuals for their commitment, guidance, and support during Ares' formative growth stages and its successful advancement toward becoming the only domestic fluorspar producer in the United States.
About Lorenzo Esteva
Mr. Esteva is a seasoned financial executive and strategic advisor with decades of experience in corporate finance, operational restructuring, capital solutions, and international business expansion. He graduated with honors from Tufts University in Boston, MA with degrees in Economics/Finance and Classical Studies. He has worked extensively with institutional investors, family offices, private equity groups, and multinational commercial operations throughout the Americas. His expertise spans:
-
Business development
-
Risk management
-
Capital structuring
-
Mergers and acquisitions
-
Financial optimization
-
Strategic operational growth
About Ares Strategic Mining
Ares Strategic Mining Inc. is a mining company focused on the development of its fluorspar projects in the U.S. The Company aims to become a significant supplier of high-grade fluorspar to North American markets, supporting industries vital to modern technology and infrastructure.
Lost Sheep Fluorspar Project – Delta, Utah
-
100% owned – 5,982 acres – 353 Claims
-
Located in the Spor Mountain area, Juab County, Utah, approximately 214 km south-west of Salt Lake City.
-
Fully Permitted – including mining permits.
-
NI 43-101 Technical Report identified extensive high-grade fluorspar with low levels of impurities.
-
Mining plan approved by BLM
*First approved by Rex Rowley – Area Manager, Bureau of Land Management – 24th August 1992.
**Renewed by Paul B. Baker – Minerals Program Manager, Bureau of Land Management – 12th December 2016.
ON BEHALF OF THE BOARD OF DIRECTORS OF ARES STRATEGIC MINING INC.
James Walker
Chief Executive Officer and President
For further information, please contact James Walker by email at info@aresmining.com
DISCLOSURE AND FORWARD-LOOKING STATEMENTS:
Companies typically rely on comprehensive feasibility reports on mineral reserve estimates to reduce the risks and uncertainties associated with a production decision. Historically, situations where the issuer decides to put a mineral project into production without first establishing mineral reserves supported by a technical report and completing a feasibility study have a higher risk of economic or technical failure, though some industrial mineral ventures are relatively sim statements of historical fact included in this news release are forward-looking statements that involve risks and uncertainties. There can be no assurance that such statements will prove to be accurate and actual results and future events could differ materially from those anticipated in such statements. Important factors that could cause actual results to differ materially from the ple operations with low levels of investment and risk, where the operating entity has determined that a formal prefeasibility or feasibility study in conformance with NI 43-101 and 43-101 CP is not required for a production decision. Based on historical engineering work, geological reports, historical production data and current engineering work completed or in the process by Ares, the Company intends to move forward with the development of its Utah asset.
Certain information in this news release may contain forward-looking statements that involve substantial known and unknown risks and uncertainties. Forward-looking statements are often identified by terms such as "will", "may", "should", "anticipate", "expects" and similar expressions. All statements other thanCompany's expectations include the failure to satisfy the conditions of the relevant securities exchange(s) and other risks detailed from time to time in the filings made by the Company with securities regulations. The reader is cautioned that assumptions used in the preparation of any forward-looking information may prove to be incorrect. Events or circumstances may cause actual results to differ materially from those predicted, as a result of numerous known and unknown risks, uncertainties, and other factors, many of which are beyond the control of the Company. The reader is cautioned not to place undue reliance on any forward-looking information. Such information, although considered reasonable by management at the time of preparation, may prove to be incorrect and actual results may differ materially from those anticipated. Forward-looking statements contained in this news release are expressly qualified by this cautionary statement. The forward-looking statements contained in this news release are made as of the date of this news release and the Company disclaims any intention or obligation to update or revise such information, except as required by applicable law.
Rock Tech Lithium (RCK.V) on Monday said the ore-sorting program for the Georgia Lake Lithium Project in northern Ontario is complete, providing a way to restart key Georgia Lake development.
The ore-sorting program, funded by Ontario's Critical Minerals Innovation Fund (CMIF), and conducted with Queen's University and Stark Resources, a German company, evaluated UV laser-based sorting and sensor-based sorting for the pre-concentration of mineralized material from the project. Test work was also conducted on two sample sets.
Early engineering work also identified a potential pathway to halve future crushing and concentrator capital cost, Rock Tech said. The reduction is expected to be driven by a combination of ore sorting and plant specification optimization.
Georgia Lake project's 2022 pre-feasibility study (PFS) contemplated a 9-year mine life, production of 100,000 tonnes per year of 6% spodumene concentrate, and an indicated mineral resource of 10.6-million tonnes at 0.88% lithium oxide and an inferred mineral resource of 4.2 million-tonnes at 1.00% of lithium oxide.
Against this PFS baseline, the CMIF-supported ore-sorting results indicate a potential pathway to further improve project economics in future technical studies. The observed 1.4x to 1.8x upgrade factor means that sorted material can carry materially higher lithium grade into downstream processing than the original feed stream, improving concentrator efficiency and potentially allowing lower-grade material to be considered in future mine planning scenarios, the company said.
Rock Tech Lithium shares were last seen up $0.05 to $1.00 on the TSX Venture Exchange.
Optical sorting test works, co-financed through Ontario Critical Minerals Innovation Fund, identifies a potential pathway to improve project efficiency and lower capital and operating costs
Key program highlights include:
- Ontario's Critical Minerals Processing Fund ("CMIF") helped demonstrate potential to unlock real value at the Georgia Lake Project.
- Collaboration with Queen's University and STARK Resources demonstrated the effectiveness of government, industry, and research partnership.
- Ore-sorting test work removed approximately 25 to 45 per cent of waste material before downstream processing. 1
- The upgraded material stream improved ore quality by approximately 1.4x to 1.8×1.
- Early engineering work identified a potential pathway to materially reduce future crushing and concentrator capital costs by up to 50 per cent1.
- The Georgia Lake Project further supports Rock Tech's broader Ontario mine-to-converter strategy alongside the planned Red Rock Converter.
|
1 |
Based on preliminary test work on representative Georgia Lake material and subject to further engineering, validation and integration into future technical studies. |
TORONTO, May 19, 2026 /CNW/ – Rock Tech Lithium Inc. (TSXV: RCK) (OTCQX: RCKTF) (FWB: RJIB) (WKN: A1XF0V) (the "Company" or "Rock Tech") is pleased to announce the successful completion of its Ontario Critical Minerals Innovation Fund supported ore-sorting program for the Georgia Lake Lithium Project ("the Project") in Northern Ontario. The Project is part of Rock Tech's broader Ontario mine-to-converter strategy and, alongside the planned Red Rock Converter, supports the development of a domestic, made-in-Canada sovereign defence and battery materials supply chain.
Completed in partnership with Queen's University and STARK Resources, the ore sorting program evaluated UV Laser-based sorting from Optimum N.V. and X-ray Transmission ("XRT") sensor-based sorting from allmineral Aufbereitungstechnik GmbH & Co. KG for the pre-concentration of mineralized material from the Project (refer to Press Release – Rock Tech Lithium Receives $388,074 in Funding from Ontario's Critical Minerals Innovation Fund, dated June 23, 2025).
Test work was conducted on two sample sets: selected drill core used to establish and calibrate sorting algorithms, and a blended surface-derived sample used for small-scale testing. Testing was completed under controlled conditions at both ore sorting test facilities using pilot-scale equipment.
The program indicates a pathway to improve process efficiency and reduce future capital and operating costs, which, if successful, could strengthen the long-term competitiveness of the Project and support a more resilient Ontario critical minerals supply chain.
The results provide a foundation to restart key Georgia Lake development activities, including drilling, additional cost-optimizing engineering, and workstreams that support a future Definitive Feasibility Study.
"These results demonstrate how government, industry and research partnerships produce innovation that can directly strengthen the economics and competitiveness of strategically important critical minerals projects," said Mirco Wojnarowicz, CEO of Rock Tech. "Backed by the Ontario government's investment through the CMIF, our work positions Georgia Lake to be more resilient and competitive through lithium price cycles and supports Rock Tech's broader integrated lithium strategy in Northern Ontario, which can help bolster economic security and long-term defence readiness through the development of a made-in-Canada critical minerals supply chain."
Government-Industry-Research Partnership Unlocks Ontario Critical Minerals Innovation
With support from the Ontario government, through the Critical Minerals Innovation Fund, Rock Tech worked with Queen's University and STARK Resources, a Germany-based specialist in sensor-based ore sorting and mineral processing technology, to evaluate practical technologies that improve processing efficiency, reduce waste, strengthen the long-term competitiveness of the Project, and support Ontario's efforts to build a more resilient domestic critical minerals supply chain.
"The Critical Minerals Processing Lab is proud to have collaborated with Rock Tech Lithium and Stark Resources on this important project, which advanced our understanding of lithium mineral processing characteristics and contributed to the advancement of the Georgia Lake project" said Charlotte Gibson, Assistant Professor & Associate Head for Robert M Buchan Department of Mining. "This innovative process development work was made possible through the support of the CMIF, whose investment is helping drive critical minerals processing innovation and strengthen Ontario's critical minerals value chain."
Advancing the Next Phase of Development at the Georgia Lake Lithium Project
The results arrive at an important moment for Ontario's critical minerals sector. While lithium markets have experienced near-term volatility, governments and industry across North America and Europe continue to move aggressively to secure regional battery and critical minerals supply chains.
The Project was the subject of a 2022 Pre-Feasibility Study, which outlined a conventional mine and concentrator development concept based on a 1.0 million tonne per year concentrator. The 2022 PFS contemplated a 9-year mine life, targeted production of approximately 100,000 tonnes per year of 6% spodumene concentrate, and an Indicated Mineral Resource of approximately 10.6 million tonnes at 0.88 per cent Li₂O and an Inferred Mineral Resource of approximately 4.2 million tonnes at 1.00 per cent Li₂O.
The PFS estimated a pre-tax NPV of USD$223 million, an after-tax NPV of USD$146 million, a pre-tax IRR of 47.8 per cent, and an after-tax IRR of 35.6%, based on an average life-of-mine SC6 price of USD$1,500 per tonne. The PFS also estimated pre-production capital costs of USD$192 million, life-of-project capital costs of USD$291 million, total life-of-project operating costs of USD$536 million, and AISC of USD$1,082 per tonne of concentrate (see Press Release – Rock Tech Lithium completes Pre-Feasibility Study for its Georgia Lake Project dated November 16, 2022).
Against this PFS baseline, the CMIF-supported ore sorting results indicate a potential pathway to further improve project economics in future technical studies. The observed 1.4x to 1.8x upgrade factor means that sorted material can carry materially higher lithium grade into downstream processing than the original feed stream, improving concentrator efficiency and potentially allowing lower-grade material to be considered in future mine planning scenarios.
Similarly, the potential to reduce crushing and concentrator plant capital costs by up to 50 per cent is expected to be driven by a combination of ore sorting and plant specification optimization, providing an opportunity to optimize overall plant design. If confirmed through further engineering and study work, this could materially improve the capital intensity and investment case for the next phase of Georgia Lake development.
As part of this renewed focus, Rock Tech has begun preparations for a potential future drilling program and the next phase of technical studies, including workstreams that could support a Definitive Feasibility Study. These activities would be designed to support resource growth, improve geological confidence, and provide additional data for future mine planning and project development work.
Supporting Rock Tech's Ontario Mine-to-Converter Strategy
The successful completion of the CMIF-supported ore sorting program strengthens this strategy by indicating a potential pathway to improve the cost structure and development flexibility of the Project. By reducing the amount of waste material processed through the concentrator, ore sorting may support lower operating costs, improve processing efficiency, and provide greater optionality in future mine planning and throughput scenarios.
"Georgia Lake remains foundational to Rock Tech's Ontario strategy," said Dirk Harbecke, Chairman of Rock Tech. "These results strengthen the project's long-term economics and profitability and reinforce the strategic importance of an integrated lithium supply chain in Ontario. As North America and Europe work to secure reliable sources of critical minerals, projects like Georgia Lake and the Red Rock Converter become increasingly important pieces of allied industrial infrastructure."
Next Steps
Building on the successful outcomes of the program, Rock Tech expects that a future value engineering phase would evaluate the combined impact of ore sorting integration, plant design optimization, and alternative execution strategies across the crushing plant, concentrator plant, and related infrastructure. The results of the CMIF-supported program are conceptual in nature and do not define final economic outcomes, mineral reserve estimates, or plant-scale design changes. Any potential impact on capital costs, operating costs, project economics, mineral reserves, or development plans will require further engineering, feasibility-level studies, and appropriate technical disclosure.
Ontario Innovation Supporting a Stronger Critical Minerals Supply Chain
"Ontario is building a made-in-Canada critical minerals supply chain that creates jobs, strengthens our economic security, and reduces our reliance on foreign adversaries," said Stephen Lecce, Minister of Energy and Mines. "Through the Critical Minerals Innovation Fund, our government is backing Ontario innovation that lowers costs, unlocks investment, and accelerates responsible mining development in the North. The success of this project shows how Ontario can lead the world in critical minerals, battery materials, and the technologies that will power the future."
Qualified Persons
The technical content of this press release has been reviewed and approved by Cameron Andrews, P.Eng., General Manager, Canada for Rock Tech Lithium, and Dian Heinrich Page, Pr. Sci. Nat., Principal Consultant – Geology for STARK Resources, an independent Qualified Person, each of whom is a Qualified Person as defined by National Instrument 43-101 – Standards of Disclosure for Mineral Projects. Mr. Cameron Andrews, P.Eng. has reviewed and approved the portions of this news release relating to the 2022 Pre-Feasibility Study on Georgia Lake Project, Mr. Dian Heinrich Page, Pr. Sci. Nat., has reviewed and approved the portions relating to the CMIF ore sorting project and value engineering.
The ore-sorting test work results described above are preliminary in nature and based on limited-scale testing. These results have not been incorporated into any current mineral resource or reserve estimate or pre-feasibility or feasibility study, and do not represent defined economic outcomes.
Mineral resources disclosed in this news release that are not mineral reserves do not have demonstrated economic viability.
On behalf of the ManagementMirco WojnarowiczCEO, Rock Tech Lithium Inc.
ABOUT ROCK TECH LITHIUM
Rock Tech is enabling the battery age by making the battery industries in Europe and North America more independent and competitive. The Company's goal is to ensure the supply of high-quality, locally produced lithium — supporting a resilient, sustainable, and transparent value chain from mine to battery-grade material.
Rock Tech relies on responsible sourcing, state-of-the-art and proven technologies, and a clear focus on circular economy principles. The Company's lithium converter projects in Guben, Germany (24,000 tonnes LHM per year) and Ontario, Canada (up to 32,000 tonnes LCE per year) form the foundation for a stable and regional supply to the battery and automotive industries. The Guben converter has been recognized as a Strategic Project under the EU Critical Raw Materials Act.
The raw materials for Rock Tech's converter projects are sourced exclusively from verifiably ESG-compliant suppliers. In Canada, Rock Tech relies, among other sources, on its wholly-owned Georgia Lake Project, which ensures a stable and sustainable supply for the North American market and is being developed in close partnership with local Indigenous communities. By integrating recycled materials, the company aims to close the local battery loop.
With its facilities, Rock Tech makes a central contribution to battery-grade material sovereignty and the achievement of climate targets. The company works in partnership with industry, policymakers, and community groups, and is committed to open communication and the highest environmental standards.
CAUTIONARY STATEMENT REGARDING FORWARD-LOOKING INFORMATION:
Certain statements contained in this news release constitute "forward-looking information" under applicable securities laws and are referred to herein as "forward-looking statements". All statements, other than statements of historical fact, which address events, results, outcomes or developments that the Company expects to occur are forward-looking statements. When used in this news release, words such as "expects", "anticipates", "plans", "predicts", "believes", "estimates", "intends", "targets", "projects", "forecasts", "may", "will", "should", "would", "could" or negative versions thereof and other similar expressions are intended to identify forward-looking statements. In particular, this news release contains forward-looking information relating to, among other things: the potential integration of ore-sorting technology into the Georgia Lake Lithium Project; the anticipated benefits of the ore-sorting program, including potential improvements in process efficiency, reduction of waste material, reductions in future capital and operating costs and the identified pathway to reductions of up to 50 per cent; the potential impact of ore-sorting on project design, plant configuration, throughput, and mine planning; the advancement of the Georgia Lake Lithium Project, including future drilling programs, engineering studies and other workstreams; the potential preparation and timing of a Definitive Feasibility Study; the Company's ability to improve project economics and capital intensity; and the Company's broader Ontario mine-to-converter strategy and related development plans.
Forward‑looking information is based on management's reasonable assumptions, estimates, expectations and opinions as of the date of this news release. Such assumptions include, without limitation: that the results of the ore-sorting test work are representative of the Project's mineralization and can be replicated at scale; that ore-sorting technology can be successfully integrated into the Project's process flowsheet and plant design; that the preliminary test work results can be translated into engineering and design optimizations; that anticipated reductions in material throughput to downstream processing circuits will support reductions in plant size, equipment requirements and associated capital costs; that the Company will be able to undertake further engineering, metallurgical test work and drilling activities as planned; that required regulatory, environmental and other approvals will be obtained in a timely manner; that contractors, suppliers and equipment will be available on reasonable terms; and that market conditions, including lithium prices and demand for battery materials, will remain supportive of project development.
Forward-looking information is subject to known and unknown risks, uncertainties, and other factors that may cause actual results to differ materially from those expressed or implied by such statements, including but not limited to, the risk that ore-sorting test work results may not be representative of full-scale operations or may not be replicated in future studies; uncertainties relating to the scalability and integration of ore-sorting technology into the Project; the risk that further engineering or technical studies do not confirm the anticipated reductions in capital or operating costs; the risk that the identified pathway to capital cost reductions, including potential reductions of up to 50 per cent, may not be realized; risks associated with changes in project scope, design or assumptions; uncertainties relating to mineral resource estimates and geological continuity; risks relating to further drilling and exploration activities; permitting, regulatory and environmental risks; risks related to availability of financing, cost inflation, supply chain constraints and contractor performance; fluctuations in lithium prices and market demand; and general economic, market and business conditions.
Additional risk factors are discussed in the Company's public disclosure documents available under its profile on SEDAR+. Except as may be required by law, Rock Tech undertakes no obligation and expressly disclaims any responsibility to update or revise any forward-looking information, whether as a result of new information, future events or otherwise.
View original content to download multimedia:https://www.prnewswire.com/news-releases/rock-tech-advances-georgia-lake-lithium-project-identifies-potential-pathway-to-reduce-processing-capex-by-up-to-50-per-cent-302776268.html
View original content to download multimedia: http://www.newswire.ca/en/releases/archive/May2026/19/c7585.html
The Australian stock market is facing a challenging environment, with futures suggesting further declines and global economic pressures contributing to investor caution. Despite these headwinds, the search for promising small-cap opportunities continues, as investors look for companies with strong fundamentals and growth potential that can weather market volatility.
Top 10 Undiscovered Gems With Strong Fundamentals In Australia
| Name | Debt To Equity | Revenue Growth | Earnings Growth | Health Rating |
|---|---|---|---|---|
| Peet | 43.28% | 13.82% | 20.62% | ★★★★★★ |
| Fiducian Group | NA | 9.85% | 10.78% | ★★★★★★ |
| Joyce | NA | 7.70% | 7.34% | ★★★★★★ |
| Euroz Hartleys Group | NA | -2.67% | -37.02% | ★★★★★★ |
| Focus Minerals | NA | 75.66% | 75.61% | ★★★★★★ |
| WAM Strategic Value | NA | -9.74% | 30.51% | ★★★★★★ |
| SDI | 14.65% | 8.06% | 12.66% | ★★★★★☆ |
| Zimplats Holdings | 3.35% | -10.45% | -46.73% | ★★★★★☆ |
| AMCIL | NA | 2.99% | 1.18% | ★★★★★☆ |
| Australian United Investment | 6.80% | 2.27% | 1.31% | ★★★★☆☆ |
Let’s explore several standout options from the results in the screener.
Simply Wall St Value Rating: ★★★★★★
Overview: Regal Partners Limited is a privately owned hedge fund sponsor with a market cap of A$889.93 million.
Operations: Regal Partners generates revenue primarily through its investment management services, amounting to A$377.39 million. The company’s net profit margin is a key financial metric to consider when evaluating its profitability.
Regal Partners, a nimble player in the investment management space, has shown impressive growth with earnings surging 97% over the past year, far outpacing the industry average of 14%. With no debt on its books and a price-to-earnings ratio of 6.8x—well below the Australian market’s 17.2x—it presents an attractive valuation. Recent leadership changes, including appointing Peter Yates as Chair-Elect, signal strategic shifts to bolster governance and innovation. Despite facing competition from passive strategies and regulatory challenges, Regal’s expansion into alternative assets positions it well for future revenue growth amid rising demand for sophisticated investment solutions.
ASX:RPL Earnings and Revenue Growth as at May 2026Servcorp
Simply Wall St Value Rating: ★★★★☆☆
Overview: Servcorp Limited offers executive serviced and virtual offices, coworking spaces, and a range of IT, communications, and secretarial services across various regions including Australia, New Zealand, Southeast Asia, the United States, Europe, the Middle East, North Asia, and internationally with a market cap of A$608.87 million.
Operations: Revenue for Servcorp Limited primarily comes from real estate rental, amounting to A$367.86 million. The company’s financial performance is influenced by its net profit margin trends over time.
Servcorp, a nimble player in the flexible workspace sector, is leveraging its global expansion and cutting-edge IT infrastructure to enhance client retention and command premium pricing. Financially disciplined, it has maintained debt-free status over the past five years while achieving an impressive 27.3% annual earnings growth. Despite facing high operational costs and competitive pressures, Servcorp trades at a compelling value—34% below estimated fair value—with projected revenue growth of 5.9% annually over three years and profit margins expected to climb from 15.7% to 20.2%. Currently priced at A$6.51, analysts see potential upside with a target of A$10.69 per share.
ASX:SRV Debt to Equity as at May 2026Vysarn
Simply Wall St Value Rating: ★★★★★★
Overview: Vysarn Limited offers water services to sectors such as resources, urban development, government, and utilities in Australia with a market cap of A$408.77 million.
Operations: Vysarn Limited generates revenue primarily from its Industrial and Advisory segments, contributing A$72.44 million and A$30.46 million, respectively.
Vysarn, a promising player in the Australian market, showcased impressive performance with earnings growth of 93.7% over the past year, outpacing the Metals and Mining industry’s 59.9%. Its debt-to-equity ratio plummeted from 34.8% to a mere 0.2% over five years, indicating solid financial management. Despite significant insider selling recently, Vysarn’s earnings quality remains high and its interest coverage is sound as it earns more than it pays on interest obligations. For the half-year ending December 2025, sales surged to A$66.81 million from A$41.02 million previously, while net income climbed to A$7.25 million from A$3.56 million year-on-year.
- Dive into the specifics of Vysarn here with our thorough health report.
-
Examine Vysarn’s past performance report to understand how it has performed in the past.
ASX:VYS Debt to Equity as at May 2026Seize The Opportunity
- Unlock our comprehensive list of 62 ASX Undiscovered Gems With Strong Fundamentals by clicking here.
- Are you invested in these stocks already? Keep abreast of every twist and turn by setting up a portfolio with Simply Wall St, where we make it simple for investors like you to stay informed and proactive.
- Discover a world of investment opportunities with Simply Wall St’s free app and access unparalleled stock analysis across all markets.
Curious About Other Options?
- Explore high-performing small cap companies that haven’t yet garnered significant analyst attention.
- Fuel your portfolio with companies showing strong growth potential, backed by optimistic outlooks both from analysts and management.
- Find companies with promising cash flow potential yet trading below their fair value.
This article by Simply Wall St is general in nature. We provide commentary based on historical data
and analyst forecasts only using an unbiased methodology and our articles are not intended to be financial advice. It does not constitute a recommendation to buy or sell any stock, and does not take account of your objectives, or your
financial situation. We aim to bring you long-term focused analysis driven by fundamental data.
Note that our analysis may not factor in the latest price-sensitive company announcements or qualitative material.
Simply Wall St has no position in any stocks mentioned.
Companies discussed in this article include ASX:RPL ASX:SRV and ASX:VYS.
Have feedback on this article? Concerned about the content? Get in touch with us directly. Alternatively, email editorial-team@simplywallst.com
If you would like to receive our free newsletter via email, simply enter your email address below & click subscribe.
 Follow us on Twitter
 Become our facebook fan
CONNECT WITH US
Tweets
Tweet with hash tag #miningfeeds or @miningfeeds and your tweets will be displayed across this site.
MOST ACTIVE MINING STOCKS
Daily Gainers
 CMC Metals Ltd. CMC Metals Ltd. |
CMB.V | +900.00% |
 Eden Energy Ltd Eden Energy Ltd |
EDE.AX | +200.00% |
| GoviEx Uranium Inc. |
GXU.V | +42.86% |
| Eagle Nickel Ltd. |
ENL.AX | +41.67% |
| Citigold Corp. Limited |
CTO.AX | +33.33% |
| Mount Burgess Mining NL |
MTB.AX | +33.33% |
| Exalt Resources Limited |
ERD.AX | +31.94% |
| Casa Minerals Inc. |
CASA.V | +30.00% |
| Cariboo Rose Resources Ltd |
CRB.V | +28.57% |
| Belmont Resources Inc. |
BEA.V | +28.57% |


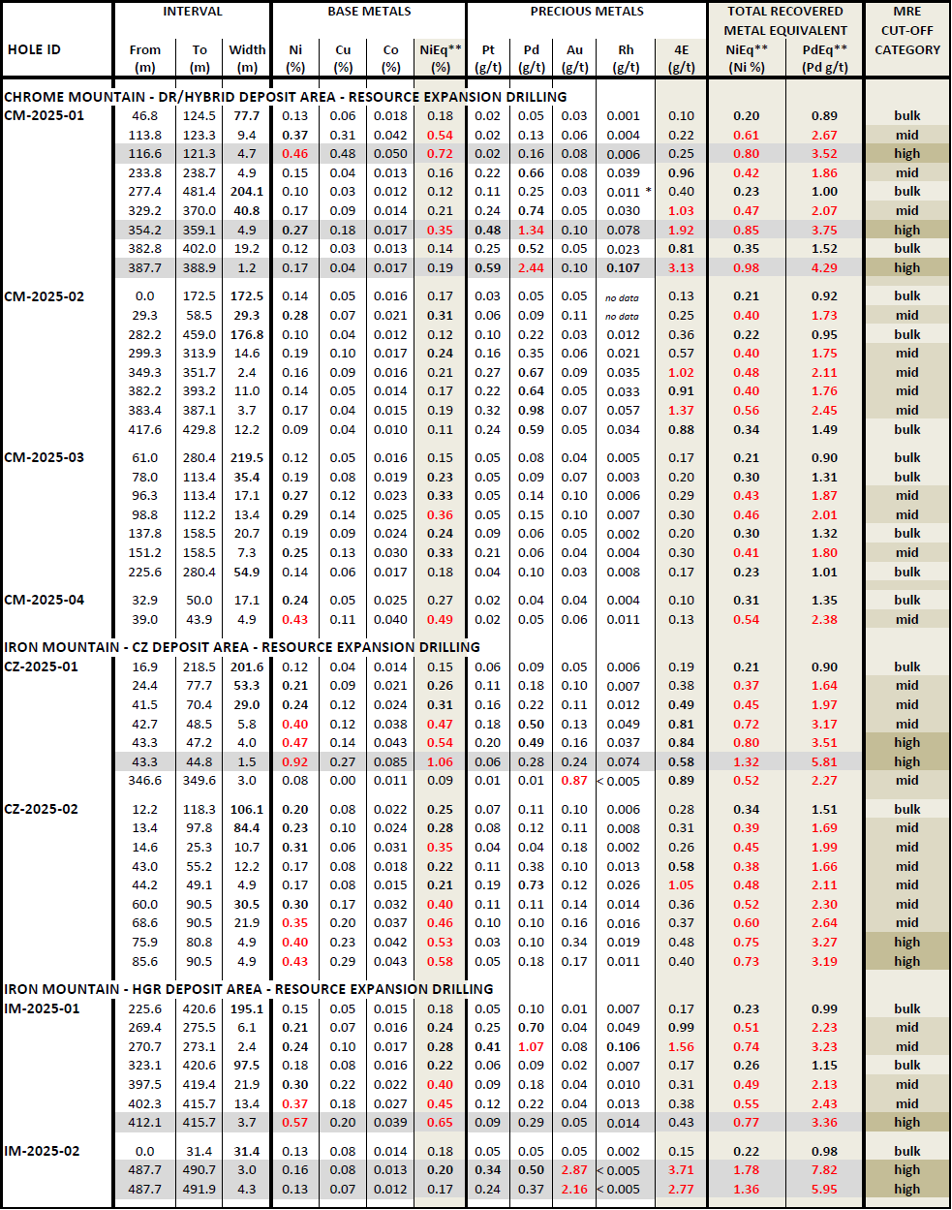
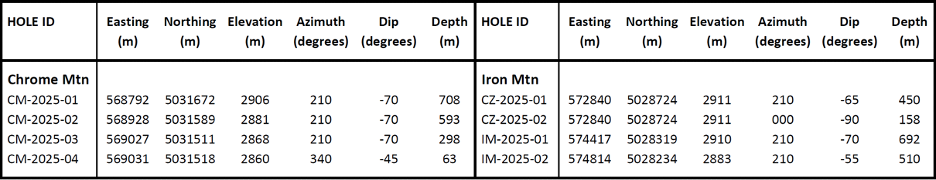
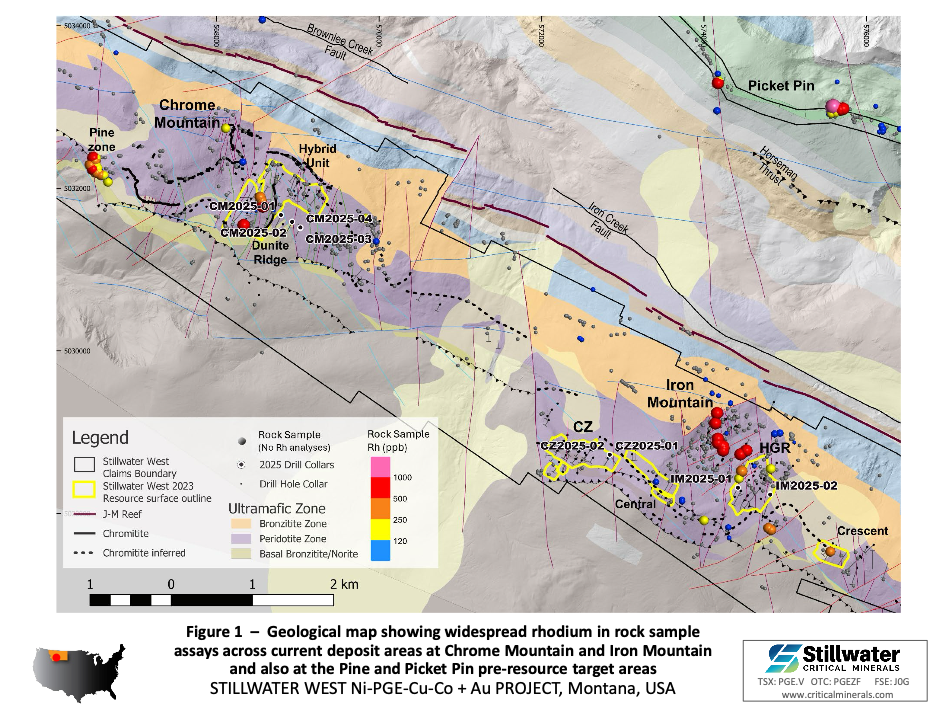