PHILADELPHIA, Sept. 30, 2024 /PRNewswire/ —
FMC Corporation (NYSE: FMC), a leading global agricultural sciences company, today announced an agreement with Ballagro Agro Tecnologia Ltda., a pioneer and leader in fungi-based biosolutions, to provide growers in Brazil with a broad portfolio of differentiated biological solutions. The agreement is part of FMC's strategic plan to grow its biologicals platform in key markets like Brazil.
As part of the agreement, FMC Brazil will license and distribute key leading biosolutions from Ballagro. The partnership brings together the companies' deep technical expertise – FMC in microbial and Ballagro in fungi-based solutions – to strengthen the biosolutions business in Brazil by expanding growers' access to superior crop protection technologies.
"This agreement is an exciting step forward in FMC's global Plant Health business to drive growth, differentiation and strong market positioning through innovation," said Dr. Bénédicte Flambard, vice president, FMC Plant Health. "FMC and Ballagro bring a high level of portfolio differentiation and technologies to deliver novel, science-backed biological solutions to growers. By joining knowledge and forces, we can redefine the landscape of biosolutions in Brazil."
FMC's investment in growing its Plant Health portfolio with complementary solutions to its biological, synthetic and precision agriculture technologies supports an integrated approach to pest management for more sustainable agricultural production. Together, FMC and Ballagro will be able to provide growers a comprehensive portfolio of biological solutions to improve their productivity, efficiency and sustainability.
"Growers across Brazil are eager for new technologies to help them sustainably protect their crops as they face new and evolving pest pressure, a changing climate and a more challenging regulatory environment," said Renato Guimarães, vice president and president of FMC Latin America. "Partnering with Ballagro enhances our go-to-market strategy in Brazil with innovative biosolutions that meet growers' evolving needs."
"Brazil has become a role model for the application of biological control, and this agreement is an important step in delivering advanced technologies and expertise to Brazilian farmers," said Arnelo Nedel, commercial director of Ballagro. "With a shared focus on innovation and knowledge, Ballagro and FMC are poised to accelerate the development of cutting-edge solutions that promote sustainable agriculture."
FMC has a significant presence in Brazil and has been at the forefront of promoting sustainable agriculture with a diverse portfolio of biological solutions that complement its synthetic and precision agriculture technologies. This includes product launches such as Ataplan® and Provilar® biofungicides, Quartzo® and Presence® Full bionematicides, and Seed+ and Seed+CoMo biostimulants. Globally, FMC has launched nearly 50 biological products in 42 countries in the past five years. The company will continue to invest in growing its Plant Health business through in-house research and development, strategic partnerships and commercialization of its proprietary pheromones platform.
About FMC
FMC Corporation is a global agricultural sciences company dedicated to helping growers produce food, feed, fiber and fuel for an expanding world population while adapting to a changing environment. FMC's innovative crop protection solutions – including biologicals, crop nutrition, digital and precision agriculture – enable growers, crop advisers and turf and pest management professionals to address their toughest challenges economically while protecting the environment. With approximately 5,800 employees at more than 100 sites worldwide, FMC is committed to discovering new herbicide, insecticide and fungicide active ingredients, product formulations and pioneering technologies that are consistently better for the planet. Visit fmc.com to learn more and follow us on LinkedIn®.
FMC, the FMC logo, Ataplan® and Provilar® biofungicides, Quartzo® and Presence® Full bionematicides, and Seed+ and Seed+CoMo biostimulants are trademarks of FMC Corporation and/or an affiliate. Always read and follow all label directions, restrictions and precautions for use. Products listed here may not be registered for sale or use in all states, countries or jurisdictions.
Cision
View original content to download multimedia:https://www.prnewswire.com/news-releases/fmc-corporation-announces-distribution-agreement-with-ballagro-agro-tecnologia-ltda-to-expand-biologicals-crop-protection-offering-in-brazil-302261523.html
SOURCE FMC Corporation
Just because a business does not make any money, does not mean that the stock will go down. For example, biotech and mining exploration companies often lose money for years before finding success with a new treatment or mineral discovery. But the harsh reality is that very many loss making companies burn through all their cash and go bankrupt.
So should Stillwater Critical Minerals (CVE:PGE) shareholders be worried about its cash burn? In this report, we will consider the company's annual negative free cash flow, henceforth referring to it as the 'cash burn'. We'll start by comparing its cash burn with its cash reserves in order to calculate its cash runway.
Check out our latest analysis for Stillwater Critical Minerals
When Might Stillwater Critical Minerals Run Out Of Money?
A company's cash runway is calculated by dividing its cash hoard by its cash burn. When Stillwater Critical Minerals last reported its June 2024 balance sheet in August 2024, it had zero debt and cash worth CA$3.4m. Importantly, its cash burn was CA$6.3m over the trailing twelve months. That means it had a cash runway of around 7 months as of June 2024. That's quite a short cash runway, indicating the company must either reduce its annual cash burn or replenish its cash. The image below shows how its cash balance has been changing over the last few years.
debt-equity-history-analysisHow Is Stillwater Critical Minerals' Cash Burn Changing Over Time?
Because Stillwater Critical Minerals isn't currently generating revenue, we consider it an early-stage business. Nonetheless, we can still examine its cash burn trajectory as part of our assessment of its cash burn situation. In fact, it ramped its spending strongly over the last year, increasing cash burn by 192%. It's fair to say that sort of rate of increase cannot be maintained for very long, without putting pressure on the balance sheet. Stillwater Critical Minerals makes us a little nervous due to its lack of substantial operating revenue. We prefer most of the stocks on this list of stocks that analysts expect to grow.
How Easily Can Stillwater Critical Minerals Raise Cash?
Given its cash burn trajectory, Stillwater Critical Minerals shareholders should already be thinking about how easy it might be for it to raise further cash in the future. Generally speaking, a listed business can raise new cash through issuing shares or taking on debt. One of the main advantages held by publicly listed companies is that they can sell shares to investors to raise cash and fund growth. By looking at a company's cash burn relative to its market capitalisation, we gain insight on how much shareholders would be diluted if the company needed to raise enough cash to cover another year's cash burn.
Since it has a market capitalisation of CA$27m, Stillwater Critical Minerals' CA$6.3m in cash burn equates to about 23% of its market value. That's not insignificant, and if the company had to sell enough shares to fund another year's growth at the current share price, you'd likely witness fairly costly dilution.
So, Should We Worry About Stillwater Critical Minerals' Cash Burn?
We must admit that we don't think Stillwater Critical Minerals is in a very strong position, when it comes to its cash burn. While its cash burn relative to its market cap wasn't too bad, its increasing cash burn does leave us rather nervous. Once we consider the metrics mentioned in this article together, we're left with very little confidence in the company's ability to manage its cash burn, and we think it will probably need more money. On another note, we conducted an in-depth investigation of the company, and identified 6 warning signs for Stillwater Critical Minerals (3 shouldn't be ignored!) that you should be aware of before investing here.
If you would prefer to check out another company with better fundamentals, then do not miss this free list of interesting companies, that have HIGH return on equity and low debt or this list of stocks which are all forecast to grow.
Have feedback on this article? Concerned about the content? Get in touch with us directly. Alternatively, email editorial-team (at) simplywallst.com.This article by Simply Wall St is general in nature. We provide commentary based on historical data and analyst forecasts only using an unbiased methodology and our articles are not intended to be financial advice. It does not constitute a recommendation to buy or sell any stock, and does not take account of your objectives, or your financial situation. We aim to bring you long-term focused analysis driven by fundamental data. Note that our analysis may not factor in the latest price-sensitive company announcements or qualitative material. Simply Wall St has no position in any stocks mentioned.
-
While the Company's fully permitted German Lithium Converter approaches full financing, Rock Tech's engineers have confirmed the economic and operational viability of a large Lithium conversion facility in North America with post-tax NPV(8) of CAD 2.3b and IRR of 22.2%.
-
The study affirms Rock Tech's leading role in establishing the first Lithium processing capacities to produce sustainable, local, and high-quality Lithium products in Ontario, Canada.
-
The proposed Lithium Converter will produce up to 32 ktpa LCE using Rock Tech's and third-party feedstock, leveraging Rock Tech's merchant Lithium refining flowsheet thereby providing Lithium mines in the province and Canada a local processing destination.
TORONTO, Sept. 19, 2024 /PRNewswire/ – Rock Tech Lithium Inc. (TSXV: RCK) (OTCQX: RCKTF) (FWB: RJIB) (WKN: A1XF0V) ("Rock Tech", or the "Company") is pleased to announce the completion of an engineering study ("Scoping Study") that confirms the economic viability and operational feasibility for the construction and operation of a Lithium conversion facility ("Converter") in Ontario, Canada.
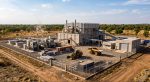
Red Rock Converter as seen from the north-east on the proposed site in Red Rock, ON, CAN (CNW Group/Rock Tech Lithium Inc.)
Rock Tech's CEO Dirk Harbecke comments: "The Scoping Study supports our North American plans with a strong business case. We believe in the tremendous opportunity our projects will bring for the region. Our experience also shows that world-class partners and strong political support are critical for the success of Lithium projects. This is essential in challenging markets."
Building on its proven success in Europe, where Rock Tech's engineering team has advanced a fully permitted Converter in Germany with €100 million in secured government funding and is moving towards a Financial Investment Decision (FID) at the end of this year, the team has now completed a Scoping Study for a second Converter to be built in Ontario, Canada. The study confirms that Rock Tech can transfer a substantial portion of its technical expertise from the German Converter to Canada. It is estimated that up to 80% of basic engineering can be applied, resulting in significant cost saving and an accelerated timeline. Considering Canadian and Ontario jurisdictional, environmental, and operational aspects, the Company has developed a robust CAPEX and OPEX model based on the fully permitted Guben Converter, as well as a strong project execution strategy and time schedule. This approach of replicating Rock Tech's proven strategy from the Guben Converter not only accelerates project development, but also provides a competitive advantage to constructing the first Converter in Ontario.
Specifically, the Company proposes to build and operate a Converter with a capacity of up to 32 ktpa LCE in Red Rock, Ontario, located 110 km northeast of Thunder Bay. The lithium raw material (spodumene concentrate) will be locally sourced from the Company's Georgia Lake Project ("Georgia Lake") and other Lithium mining projects in Ontario and Canada. The project benefits from Rock Tech's advanced merchant refining competencies and is prepared to become a regional Lithium refining hub. The proposed Converter will be designed to produce Lithium Carbonate or Lithium Hydroxide Monohydrate A final decision on output material will be made in the coming months based on market needs.
Jennifer Main, COO for the Ontario Converter Project adds: "We successfully validated our knowledge transfer capabilities and have laid out a realistic path to bringing Lithium conversion to Ontario. Our proven experience in Guben provides Rock Tech with a strong competitive edge and demonstrates our leadership in advancing lithium processing in Ontario before the end of the decade."
Highlights of the study include:
|
Life-of-project (LOP) |
25 years |
|
Nameplate capacity |
32 ktpa LCE |
|
Post-tax IRR |
22.2 % |
|
Post-tax NPV (8%) |
CAD 2.3b |
|
CAPEX |
CAD 1.6b |
|
Conversion OPEX (excluding raw materials) |
CAD 6.2k |
|
Price Spodumene Concentrate (SC5.75) over LOP* |
USD 1.8k |
|
Sales Price LCE over LOP* |
USD 31k |
|
* Source: Price forecasts for LCE and Spodumene as of Q2 2024. Consensus pricing: Wood Mackenzie, Benchmark Minerals |
ABOUT ROCK TECH
Rock Tech's vision is to supply the electric vehicle and battery industry with sustainable, locally produced lithium, targeting a 100% recycling rate. To ensure resilient supply chains, the company plans to build lithium converters at the doorstep of its customers, beginning with the Company's proposed Lithium Hydroxide Converter in Guben, Brandenburg, Germany. The second Converter is planned to be built in Red Rock, Ontario, Canada. Rock Tech Lithium plans to source raw material from its own Georgia Lake spodumene project in the Thunder Bay Mining District of Ontario, Canada, and procure from other ESG-compliant mines. Ultimately, Rock Tech's goal is to create a closed-loop lithium production system. Rock Tech has gathered one of the strongest teams in the industry to close the most pressing gap in the clean mobility story. The Company has adopted strict environmental, social and governance standards and is developing a proprietary refining process to increase efficiency and sustainability further.
NEITHER THE TSX VENTURE EXCHANGE NOR ITS REGULATION SERVICES PROVIDER (AS THAT TERM IS DEFINED IN POLICIES OF THE TSX VENTURE EXCHANGE) ACCEPTS RESPONSIBILITY FOR THE ADEQUACY OR ACCURACY OF THIS RELEASE.
CAUTIONARY NOTE CONCERNING FORWARD-LOOKING INFORMATION Certain statements contained in this news release constitute "forward-looking information" under applicable securities laws and are referred to herein as "forward-looking statements". All statements, other than statements of historical fact, which address events, results, outcomes or developments that the Company expects to occur are forward-looking statements. When used in this news release, words such as "expects", "anticipates", "plans", "predicts", "believes", "estimates", "intends", "targets", "projects", "forecasts", "may", "will", "should", "would", "could" or negative versions thereof and other similar expressions are intended to identify forward-looking statements. In particular, this press release contains forward-looking information pertaining to expectations concerning the North American Converter, including the design and features of the North American Converter, as well as the expected costs, capital expenditures, timing and outcomes thereof; statements regarding the Company's future plans, estimates, and schedules relating to the North American Converter, including the anticipated timing of future activities taken in support of the development thereof;; Rock Tech's potential financing arrangements; the expected economic performance of the North American Converter and anticipated production of Lithium chemicals and related processing methods employed; the estimated capital and operating costs of the North American Converter; the anticipated timing and outcomes of a final investment decision, construction activities and commissioning of the North American Converter; statements regarding the Company's sustainability and ESG related goals and strategy, including the benefits and achievement thereof and future actions taken by the Company in relation thereto; expected regulatory processes and final outcomes; expectations regarding the electric vehicle industry, including the demand for and pricing of battery-grade lithium chemicals and the benefits therefrom, and the development of political and regulatory frameworks especially in Canada ; Rock Tech's opinions, beliefs and expectations regarding the Company's business strategy, development and exploration opportunities and projects; and plans and objectives of management for the Company's operations and properties. Forward-looking statements by their nature are based on assumptions and involve known and unknown risks, uncertainties and other factors which may cause the actual results to differ materially from the forward-looking statements, including the risks, uncertainties and other factors discussed in the Company's most recent management's discussion and analysis and annual information form filed with the applicable securities regulators. No assurances can be given that any of the events anticipated by the forward-looking statements will transpire or occur, and the Company cautions the reader not to place undue reliance upon any such forward-looking statements. The Company does not intend, nor does it assume any obligation to update or revise any of the forward-looking statements, whether as a result of new information, changes in assumptions, future events or otherwise, except to the extent required by applicable law.
Cision
View original content to download multimedia:https://www.prnewswire.com/news-releases/rock-tech-completes-scoping-study-for-canadian-lithium-converter-with-npv-of-cad-2-3b-study-highlights-significant-knowledge-transfer-from-the-guben-converter-project-to-north-american-operations-302252848.html
SOURCE Rock Tech Lithium Inc.
Most readers would already be aware that FMC's (NYSE:FMC) stock increased significantly by 14% over the past three months. Given that the market rewards strong financials in the long-term, we wonder if that is the case in this instance. Particularly, we will be paying attention to FMC's ROE today.
Return on equity or ROE is a key measure used to assess how efficiently a company's management is utilizing the company's capital. In simpler terms, it measures the profitability of a company in relation to shareholder's equity.
View our latest analysis for FMC
How Is ROE Calculated?
The formula for return on equity is:
Return on Equity = Net Profit (from continuing operations) ÷ Shareholders' Equity
So, based on the above formula, the ROE for FMC is:
32% = US$1.5b ÷ US$4.6b (Based on the trailing twelve months to June 2024).
The 'return' is the profit over the last twelve months. One way to conceptualize this is that for each $1 of shareholders' capital it has, the company made $0.32 in profit.
Why Is ROE Important For Earnings Growth?
We have already established that ROE serves as an efficient profit-generating gauge for a company's future earnings. Depending on how much of these profits the company reinvests or "retains", and how effectively it does so, we are then able to assess a company’s earnings growth potential. Assuming everything else remains unchanged, the higher the ROE and profit retention, the higher the growth rate of a company compared to companies that don't necessarily bear these characteristics.
FMC's Earnings Growth And 32% ROE
To begin with, FMC has a pretty high ROE which is interesting. Secondly, even when compared to the industry average of 9.6% the company's ROE is quite impressive. This likely paved the way for the modest 17% net income growth seen by FMC over the past five years.
We then compared FMC's net income growth with the industry and we're pleased to see that the company's growth figure is higher when compared with the industry which has a growth rate of 13% in the same 5-year period.
Earnings growth is an important metric to consider when valuing a stock. What investors need to determine next is if the expected earnings growth, or the lack of it, is already built into the share price. This then helps them determine if the stock is placed for a bright or bleak future. If you're wondering about FMC's's valuation, check out this gauge of its price-to-earnings ratio, as compared to its industry.
Is FMC Efficiently Re-investing Its Profits?
With a three-year median payout ratio of 34% (implying that the company retains 66% of its profits), it seems that FMC is reinvesting efficiently in a way that it sees respectable amount growth in its earnings and pays a dividend that's well covered.
Moreover, FMC is determined to keep sharing its profits with shareholders which we infer from its long history of paying a dividend for at least ten years. Our latest analyst data shows that the future payout ratio of the company is expected to rise to 43% over the next three years. Consequently, the higher expected payout ratio explains the decline in the company's expected ROE (to 14%) over the same period.
Summary
Overall, we are quite pleased with FMC's performance. In particular, it's great to see that the company is investing heavily into its business and along with a high rate of return, that has resulted in a sizeable growth in its earnings. That being so, according to the latest industry analyst forecasts, the company's earnings are expected to shrink in the future. Are these analysts expectations based on the broad expectations for the industry, or on the company's fundamentals? Click here to be taken to our analyst's forecasts page for the company.
Have feedback on this article? Concerned about the content? Get in touch with us directly. Alternatively, email editorial-team (at) simplywallst.com.This article by Simply Wall St is general in nature. We provide commentary based on historical data and analyst forecasts only using an unbiased methodology and our articles are not intended to be financial advice. It does not constitute a recommendation to buy or sell any stock, and does not take account of your objectives, or your financial situation. We aim to bring you long-term focused analysis driven by fundamental data. Note that our analysis may not factor in the latest price-sensitive company announcements or qualitative material. Simply Wall St has no position in any stocks mentioned.
-
26.4 Meters Averaging 2.6 g/t Gold; including 14.4 Meters at 4.2 g/t
-
32.0 Meters Averaging 1.7 g/t Gold; including 14.2 Meters at 3.1 g/t
DENVER, CO / ACCESSWIRE / September 16, 2024 / Solitario Resources Corp. ("Solitario") (NYSE American:XPL)(TSX:SLR) is pleased to announce the results of the first three core holes ever drilled on its Golden Crest Project. All three holes intersected significant thicknesses of mineralization, with two of the holes displaying high-grade intercepts. Cross sections of the three holes can be viewed here. This zone, although currently limited in size due to the lack of offset drilling, is laterally open in all directions. Highlights include:
|
DDH Hole |
Interval |
Thickness |
Grade |
|
Number |
(meters) |
(meters) |
(grams/tonne) |
|
GC-001 |
9.1 to 41.1 |
32.0 |
1.68 |
|
including |
10.7 to 24.9 |
14.2 |
3.10 |
|
GC-002 |
7.9 to 17.8 |
9.9 |
0.72 |
|
23.3 to 33.2 |
9.9 |
1.88 |
|
|
40.2 to 46.3 |
6.1 |
0.55 |
|
|
GC-003 |
5.0 to 31.4 |
26.4 |
2.56 |
|
including |
11.4 to 25.8 |
14.4 |
4.18 |
|
including |
19.8 to 21.8 |
2.0 |
13.13 |
|
38.9 to 50.6 |
11.7 |
0.60 |
|
|
Estimated true thickness of reported intervals: GC-001: 75% +/-10%; GC-002: 90% +/-10%; GC-003: 90% +/-10% |
|||
Chris Herald, President and CEO of Solitario, stated: "These core holes represent a true new gold discovery that are potentially part of a major new district-scale extension of the Homestake-Wharf super giant gold district. Considering that these are the first holes ever drilled on our huge 35,000-acre property, they are truly outstanding. Significant gold mineralization over substantial widths with excellent continuity was intersected in all three holes. Importantly, these results also confirm that the multiple high-quality surface anomalies we have generated during the past three years have the potential to have sizable subsurface roots in both grade and size.
We also firmly believe the best is yet to come. This year's program is only testing two of our ten best high-potential target areas. The other eight are still undergoing various stages of permitting with drilling planned on four more in 2025. We are also encouraged that other potential gold horizons below the mineralized Downpour zone are returning anomalous gold and trace element values.. With additional drilling, we will have the ability to vector into significant mineralization in structures and multiple stratigraphic horizons that have been very productive in the historic Homestake-Wharf mining district. All mineralization encountered to date is oxidized."
What Do These Results Mean and Drilling Details
Gold mineralization at Downpour occurs within an intensely brecciated evaporite stratigraphic horizon that has undergone significant silicification and hydrothermal alteration. This favorable zone is sub-horizontal and appears to occur throughout Solitario's land position. Solitario has identified a number of other high-priority prospects in this favorable horizon. Besides the excellent grade and thickness of mineralization encountered in drilling, the potential for high-grade feeder structures is considered excellent.
All three core holes were drilled at the Downpour prospect from the same platform near exceptional gold assay results in trenches (previously reported). Total meterage for the first three holes is 963.5 meters. We expect drilling to continue well into November. Remaining drilling consists of widely spaced holes over Solitario's vast 35,000-acre land holding. We are on track to complete about a dozen core holes totaling up to 5,000 meters.
Golden Crest Future Drill Hole Plans
Solitario has identified ten high priority surface targets as shown in the table below. Two of the targets, Downpour and Eleventh Hour, will be drilled this year. Four new targets are currently being permitted and are scheduled to be drilled in 2025. The other four high-priority targets may undergo future permitting after further review. Besides the ten currently defined high-priority targets, Solitario has identified another dozen promising target areas that require additional surface exploration work. Three years of concentrated exploration surface work has defined approximately 80-square kilometers of gold bearing hydrothermal alteration.
Permitting Still at Early Stage for Priority Targets
Solitario's 100%-owned Golden Crest properties in South Dakota constitute strategic land holdings along the western and southwestern extensions of the Homestake-Wharf mining district that has produced approximately 52 million ounces of gold and contains another 30 million ounces in historical resources (not SK-1300 or NI-4301 compliant and not on Solitario's property). The project area is in a safe jurisdiction with highly developed infrastructure, an unbroken 150-year record of continuous gold mining, a skilled mining workforce, and a history of high-grade, underground mineable gold deposits.
Sample Type, Sampling Methodology, Chain of Custody, Quality Control and Assurance
All Golden Crest exploration core samples have been prepared and analyzed at the American Assay Laboratories in Reno, Nevada, which is independent from Solitario. Thorough QA/QC protocols are followed on the Project, including insertion of duplicate, blank and standard samples in the assay stream for all drill holes. The samples are collected directly from the drill rig, logged, photographed, split into two samples, and half of each sample submitted directly to American Assay Labs through secure chain of custody protocols. All activities prior to shipment are directly supervised by Solitario geologists. Samples are pulverized from a 250g sample to 85% passing 75 mesh. Approximately 225g of pulp sample is used for fire assay. Assays are based on a 30g fire assay aliquot for gold with Atomic Absorption finish. If the gold value from Atomic Absorption is >10g/t, an additional 30g of pulp sample is fire assayed for gold using a gravimetric finish.
Qualified Person
The scientific and technical information contained in this news release has been reviewed and approved by Sandor Ringhoffer, CPG, SME RM, a geologic consultant of Solitario, who is a qualified person as defined by NI 43-101, Standards of Disclosure for Mineral Projects.
About Solitario
Solitario is a natural resource exploration company focused on high-quality Tier-1 gold and zinc exploration projects. The Company is traded on the NYSE American ("XPL") and on the Toronto Stock Exchange ("SLR"). In addition to its South Dakota property holdings, Solitario holds a 50% joint venture interest (Teck Resources 50%) in the high-grade Lik zinc deposit in Alaska and a 39% joint venture interest (Nexa Resources 61%) in the high-grade Florida Canyon zinc project in Peru. At Florida Canyon, Solitario is carried to production through its joint venture arrangement with Nexa. Solitario's Management and Directors hold approximately 8.4% (excluding options) of the Company's 81.6 million shares outstanding. Solitario's cash balance and marketable securities stand at approximately US$8.3 million. Additional information about Solitario is available online at www.solitarioresources.com.
Solitario has a long history of committed Environmental, Social and Responsible Governance ("ESG") of its business. We realize ESG issues are also important to investors, employees, and all stakeholders, including communities in which we work. We are committed to conducting our business in a manner that supports positive environmental and social initiatives and responsible corporate governance. Importantly, we work with joint venture partners that not only value the importance of ESG issues in the conduct of their business on our joint venture projects but are leaders in the industry in this important segment of our business.
For More Information Please Contact:
Chris Herald, President and CEOSolitario Resources Corp.Tel. 303-534-1030 ext. 1
Cautionary Statement Regarding Forward Looking Information
This press release contains forward-looking statements within the meaning of the U.S. Securities Act of 1933 and the U.S. Securities Exchange Act of 1934, and as defined in the United States Private Securities Litigation Reform Act of 1995 (and the equivalent under Canadian securities laws),that are intended to be covered by the safe harbor created by such sections. Forward-looking statements are statements that are not historical facts. They are based on the beliefs, estimates and opinions of the Company's management on the date the statements are made and address activities, events or developments that Solitario expects or anticipates will or may occur in the future, and are based on current expectations and assumptions. Forward-looking statements involve numerous risks and uncertainties. Consequently, there can be no assurances that such statements will prove to be accurate and actual results and future events could differ materially from those anticipated in such statements. Solitario's Golden Crest land position does not cover any of the areas of historical gold production or historical unmined resources. Certain historical information concerning exploration and gold production in the Black Hills region has been obtained through both public and private sources and are believed to be substantially factual, but Solitario can give no assurances of the accuracy of such information. The existence of historic mines and resources adjacent to Solitario's land position do not necessarily support the existence economic mineral deposits on Solitario's land position. Such forward-looking statements include, without limitation, statements regarding the Company's expectation of the projected timing and outcome of engineering studies; expectations regarding the receipt of all necessary permits and approvals to implement a mining plan, if any, at any of its mineral properties. Important factors that could cause actual results to differ materially from those in the forward-looking statements include, among others, risks relating to risks that Solitario's and its joint venture partners' exploration and property advancement efforts will not be successful; risks relating to fluctuations in the price of zinc, gold, lead and silver; the inherently hazardous nature of mining-related activities; uncertainties concerning reserve and resource estimates; availability of outside contractors, and other activities; uncertainties relating to obtaining approvals and permits from governmental regulatory authorities; the possibility that environmental laws and regulations will change over time and become even more restrictive; and availability and timing of capital for financing the Company's exploration and development activities, including uncertainty of being able to raise capital on favorable terms or at all; risks relating to the impacts of Covid-19 or similar variants; as well as those factors discussed in Solitario's filings with the U.S. Securities and Exchange Commission (the "SEC") including Solitario's latest Annual Report on Form 10-K and its other SEC filings (and Canadian filings) including, without limitation, its latest Quarterly Report on Form 10-Q. The Company does not intend to publicly update any forward-looking statements, whether as a result of new information, future events, or otherwise, except as may be required under applicable securities laws.
SOURCE: Solitario Resources Corp.
View the original press release on accesswire.com
There's no doubt that money can be made by owning shares of unprofitable businesses. For example, biotech and mining exploration companies often lose money for years before finding success with a new treatment or mineral discovery. Having said that, unprofitable companies are risky because they could potentially burn through all their cash and become distressed.
So should Bravo Mining (CVE:BRVO) shareholders be worried about its cash burn? In this report, we will consider the company's annual negative free cash flow, henceforth referring to it as the 'cash burn'. The first step is to compare its cash burn with its cash reserves, to give us its 'cash runway'.
See our latest analysis for Bravo Mining
How Long Is Bravo Mining's Cash Runway?
A company's cash runway is calculated by dividing its cash hoard by its cash burn. When Bravo Mining last reported its June 2024 balance sheet in August 2024, it had zero debt and cash worth US$28m. In the last year, its cash burn was US$13m. So it had a cash runway of about 2.1 years from June 2024. Arguably, that's a prudent and sensible length of runway to have. The image below shows how its cash balance has been changing over the last few years.
debt-equity-history-analysisHow Is Bravo Mining's Cash Burn Changing Over Time?
Bravo Mining didn't record any revenue over the last year, indicating that it's an early stage company still developing its business. Nonetheless, we can still examine its cash burn trajectory as part of our assessment of its cash burn situation. Over the last year its cash burn actually increased by 4.2%, which suggests that management are increasing investment in future growth, but not too quickly. That's not necessarily a bad thing, but investors should be mindful of the fact that will shorten the cash runway. While the past is always worth studying, it is the future that matters most of all. For that reason, it makes a lot of sense to take a look at our analyst forecasts for the company.
Can Bravo Mining Raise More Cash Easily?
While its cash burn is only increasing slightly, Bravo Mining shareholders should still consider the potential need for further cash, down the track. Issuing new shares, or taking on debt, are the most common ways for a listed company to raise more money for its business. Commonly, a business will sell new shares in itself to raise cash and drive growth. By comparing a company's annual cash burn to its total market capitalisation, we can estimate roughly how many shares it would have to issue in order to run the company for another year (at the same burn rate).
Bravo Mining has a market capitalisation of US$197m and burnt through US$13m last year, which is 6.8% of the company's market value. Given that is a rather small percentage, it would probably be really easy for the company to fund another year's growth by issuing some new shares to investors, or even by taking out a loan.
Is Bravo Mining's Cash Burn A Worry?
On this analysis of Bravo Mining's cash burn, we think its cash burn relative to its market cap was reassuring, while its increasing cash burn has us a bit worried. Considering all the factors discussed in this article, we're not overly concerned about the company's cash burn, although we do think shareholders should keep an eye on how it develops. Its important for readers to be cognizant of the risks that can affect the company's operations, and we've picked out 1 warning sign for Bravo Mining that investors should know when investing in the stock.
Of course Bravo Mining may not be the best stock to buy. So you may wish to see this free collection of companies boasting high return on equity, or this list of stocks with high insider ownership.
Have feedback on this article? Concerned about the content? Get in touch with us directly. Alternatively, email editorial-team (at) simplywallst.com.This article by Simply Wall St is general in nature. We provide commentary based on historical data and analyst forecasts only using an unbiased methodology and our articles are not intended to be financial advice. It does not constitute a recommendation to buy or sell any stock, and does not take account of your objectives, or your financial situation. We aim to bring you long-term focused analysis driven by fundamental data. Note that our analysis may not factor in the latest price-sensitive company announcements or qualitative material. Simply Wall St has no position in any stocks mentioned.
DENVER, CO / ACCESSWIRE / September 12, 2024 / Solitario Resources Corp. ("Solitario") (NYSE American:XPL)(TSX:SLR) is pleased to report President and CEO Chris Herald will provide a live webcast presentation at the 36th Annual Gold Forum Americas/XPL-Dev conference on Monday, September 16, 2024, at 3:10 pm Mountain Time. Mr. Herald plans to present the assay results for the first three drill holes from the company's maiden drilling program at its Golden Crest gold project in South Dakota. Mr. Herald will also provide an update on its other Golden Crest exploration activities as well as a brief review of the advanced-stage Florida Canyon and Lik high-grade zinc projects. To access the live presentation, please click Gold Forum Americas.
About Solitario
Solitario is a natural resource exploration company focused on high-quality Tier-1 gold and zinc projects. Solitario's 100%-owned Golden Crest properties in South Dakota constitute strategic land holdings along the western and southwestern extensions of the Homestake-Wharf mining district that has produced approximately 52 million ounces of gold (not a part of the Company's land holdings). The project area is located in a safe jurisdiction with highly developed infrastructure, an unbroken 150-year record of continuous gold mining, a skilled mining workforce, and a history of high-grade, underground mineable gold deposits.
The Company is traded on the NYSE American ("XPL") and on the Toronto Stock Exchange ("SLR"). In addition to its South Dakota property holdings, Solitario holds a 50% joint venture interest (Teck Resources 50%) in the high-grade Lik zinc deposit in Alaska and a 39% joint venture interest (Nexa Resources holds the remaining 61% interest) on the high-grade Florida Canyon zinc project in Peru. Solitario is carried to production through its joint venture arrangement with Nexa. Solitario's Management and Directors hold approximately 9.1% (excluding options) of the Company's 81.6 million shares outstanding. Solitario's cash balance and marketable securities stand at approximately US$8.3 million. Additional information about Solitario is available online at www.solitariozinc.com.
For More Information Please Contact:
Chris Herald, President & CEO303-534-1030 ext. 1
SOURCE: Solitario Resources Corp.
View the original press release on accesswire.com
FMC Corporation’s FMC shares have gained 9.6% over the past three months. The company has also outperformed its industry’s decline of 7.8% over the same time frame. FMC has also topped the S&P 500’s roughly 2.9% rise over the same period.Let’s dive into the factors behind this Zacks Rank #3 (Hold) stock’s price appreciation.
Zacks Investment Research
Image Source: Zacks Investment Research
New Products, Restructuring Actions Aid FMC Stock
FMC delivered better-than-expected results in the second quarter on the back of higher volumes. It saw improved demand in the quarter, leading to an increase in sales volumes, especially in the United States and Brazil. The company is gaining from efforts to expand its product portfolio through new product launches and restructuring actions. FMC is investing in technologies as well as new product launches to enhance value to the farmers. New products launched in Europe, North America and Asia are gaining significant traction. Product introductions are expected to support the company’s results this year. The company generated $590 million in sales in 2023 from new products launched in the past five years. It expects revenues from new products to grow by roughly $200 million in 2024. It expects a significant amount of volume growth to come from new products in the second half of 2024. FMC is seeing strong gains in new products including Coragen eVo and Premio Star insecticides and the Onsuva fungicide in Latin America.The acquisition of BioPhero ApS, a Denmark-based pheromone research and production company, also adds biologically produced state-of-the-art pheromone insect control technology to the company’s product portfolio and R&D pipeline, highlighting FMC's role as a leader in delivering innovative and sustainable crop protection solutions.FMC is also expected to benefit from reduced input costs, a favorable product mix and its cost-control actions. It benefited from favorable input costs in the second quarter of 2024. FMC is also making progress with its global restructuring and cost-reduction program. It sees benefits from restructuring to contribute $75-$100 million to full-year 2024 adjusted EBITDA, net of inflation.
FMC Corporation Price and Consensus
FMC Corporation Price and Consensus
FMC Corporation price-consensus-chart | FMC Corporation Quote
Stocks to Consider
Better-ranked stocks in the Basic Materials space are Newmont Corporation NEM, Element Solutions Inc ESI and Eldorado Gold Corporation EGO, each sporting a Zacks Rank #1 (Strong Buy). You can see the complete list of today’s Zacks #1 Rank stocks here.The Zacks Consensus Estimate for Newmont’s current-year earnings is pegged at $2.82, indicating a rise of 75.2% from year-ago levels. The Zacks Consensus Estimate for NEM’s earnings has increased 16% in the past 60 days. The stock has rallied around 29% in the past year. The consensus estimate for Element Solutions’ current-year earnings has increased by 0.7% in the past 60 days. ESI beat the consensus estimate in three of the last four quarters while delivering in-line results on the other occasion. In this timeframe, it delivered an earnings surprise of around 3.8%, on average.The Zacks Consensus Estimate for Eldorado Gold’s current year earnings is pegged at $1.35 per share, indicating a year-over-year rise of 136.8%. EGO beat the consensus estimate in each of the last four quarters, with the average earnings surprise being 430.3%. The company's shares have rallied roughly 61% in the past year.
Want the latest recommendations from Zacks Investment Research? Today, you can download 7 Best Stocks for the Next 30 Days. Click to get this free report
Element Solutions Inc. (ESI) : Free Stock Analysis Report
Newmont Corporation (NEM) : Free Stock Analysis Report
FMC Corporation (FMC) : Free Stock Analysis Report
Eldorado Gold Corporation (EGO) : Free Stock Analysis Report
To read this article on Zacks.com click here.
OTTAWA, ON, Sept. 5, 2024 /CNW/ – Northern Shield Resources Inc. ("Northern Shield" or the "Company") (TSXV: NRN) is pleased to announce results from the recently completed trenching / prospecting program at the Conquest Zone, Root & Cellar Property ("Root & Cellar" or the "Property"), on the Burin Peninsula in southeastern Newfoundland. The Property is being explored for epithermal gold mineralization and associated porphyry copper systems and includes 5 gold zones over a 6-kilometre strike-length. Tellurium (Te), a critical metal, is associated with 4 of the showings and also with some of the copper mineralization.
The visible gold (VG) bearing grab sample, exposed in outcrop by trenching in the Discovery Trench area of the Conquest Zone, returned 78.5 g/t Au. The sample contained 4 patches of fine-grained visible gold hosted in quartz-hematite veins associated with intense chlorite alteration, coarse pyrite and fine marcasite (see Company news release August 13, 2024). Three other grab samples, from a strongly silicified and brecciated unit adjacent to the quartz hematite vein, returned 5.0, 4.9 and 2.5 g/t Au with 14 of 23 additional samples from throughout the Property, returning 0.13 to 1.3 g/t Au. Grab samples by their nature are single selected samples and may not be representative of all mineralization expected to be found on the Property.
A high-resolution drone magnetic and LiDAR survey was also completed by RPM Aerial Services of Holyrood, Newfoundland and the data is currently being processed. The survey results will be used to fine-tune the positioning of drill holes planned for this fall.
Early results of the innovative application of geochemistry by an M.Sc. thesis student from Memorial University of Newfoundland, have strongly reinforced the interpretation of the Discovery Trench area as marking an up-flow zone within an epithermal system. Potassium / Aluminum (K/Al) ratios were used as a proxy for alteration minerals with higher K/Al ratios indicating the hottest portion of the hydrothermal alteration as would be expected near the main epithermal veins. The spatial distribution of high K/Al samples also suggests that the Conquest vein system continues 750 m westward from the Discovery Trench area. Case studies utilizing K/Al ratios at the Waihi epithermal gold deposit in New Zealand have highlighted the up-flow zones and the proximity to gold-bearing veins (Barker et al; New Zealand Journal of Geology and Geophysics, 2019)
"We are very happy with the way everything is coming together. We have been very diligent over the summer at squeezing all the information we can out of the rocks, the geophysical data and the geochemistry, and the M.Sc. research being conducted by Mr Kaine Johnson has now added to that body of evidence. The integration of those datasets all pointing in the same direction gives us great confidence heading into drilling. We look forward to the processed magnetic data to fine-tune the drill targets."
– Ian Bliss, President and CEO, Northern Shield
Samples were analyzed by ALS Global in Vancouver, BC, for Au by Fire Assay and multi-elements by four acid digestion and ICP-AES. All standards and duplicates by ALS Global meet targeted values. Technical information in this news release was reviewed and approved by Christine Vaillancourt, P.Geo., the Company's Chief Geologist and a Qualified Person under National Instrument 43-101.
Northern Shield Resources
Northern Shield Resources Inc. is a Canadian-based company known as a leader in generating high-quality exploration targets that views greenfield exploration as an opportunity to find a Tier 1 asset, near surface, and at relatively low cost. We implement a model driven exploration approach to reduce the risk associated with early-stage projects for ourselves, our shareholders, and the environment. This approach led us to option the Root & Cellar Property from a Newfoundland prospector, who discovered the mineralization, and then its advancement to a large gold-silver-tellurium system.
Forward-Looking Statements Advisory
This news release contains statements concerning the exploration plans, results and potential for epithermal gold deposits, and other mineralization at the Company's Root & Cellar Property , geological, geophysical and geometrical analyses of the properties and comparisons of the properties to known epithermal gold deposits and other expectations, plans, goals, objectives, assumptions, information or statements about future, conditions, results of exploration or performance that may constitute forward-looking statements or information under applicable securities legislation. Such forward-looking statements or information are based on a number of assumptions, which may prove to be incorrect.
Although Northern Shield believes that the expectations reflected in such forward-looking statements or information are reasonable, undue reliance should not be placed on forward‑looking statements because Northern Shield can give no assurance that such expectations will prove to be correct. Forward-looking statements or information are based on current expectations, estimates and projections that involve a number of risks and uncertainties which could cause actual results to differ materially from those anticipated by Northern Shield and described in the forward‑looking statements or information. These risks and uncertainties include, but are not limited to, risks associated with geological, geometrical and geophysical interpretation and analysis, the ability of Northern Shield to obtain financing, equipment, supplies and qualified personnel necessary to carry on exploration and the general risks and uncertainties involved in mineral exploration and analysis.
The forward-looking statements or information contained in this news release are made as of the date hereof and Northern Shield undertakes no obligation to update publicly or revise any forward‑looking statements or information, whether as a result of new information, future events or otherwise, unless so required by applicable securities laws.
Neither TSX Venture Exchange nor its Regulation Services Provider (as that term is defined in policies of the TSX Venture Exchange) accepts responsibility for the adequacy or accuracy of this release.
SOURCE Northern Shield Resources Inc.
Cision
View original content: http://www.newswire.ca/en/releases/archive/September2024/05/c8205.html
We recently compiled a list of the 10 Best Battery Stocks To Buy Now According to Short Sellers. In this article, we are going to take a look at where Sociedad Química y Minera de Chile S.A. (NYSE:SQM) stands against the other battery stocks.
Electric vehicles are the latest trend in the automotive market which is revolutionizing the whole industry. According to Grand View Research, the global electric vehicle (EV) market was valued at $1.07 trillion in 2023 and is projected to grow at a compound annual growth rate (CAGR) of 33.6% from 2024 to 2030 and reach $8.85 trillion by the end of the forecast.
The growth is driven by government policies, incentives, and advancements in battery technology, which are making EVs more affordable and appealing. The transportation and logistics sectors are increasingly adopting EVs due to their lower emissions and operational costs, with companies like Amazon integrating electric trucks into their fleets.
Similarly, Grand View Research believes that the global EV battery market was valued at $44.69 billion in 2022 and is projected to grow at a CAGR of 21.1% from 2023 to 2030. Strategic collaborations among battery manufacturers, e-mobility providers, and energy suppliers are improving battery durability and lifespan, while the increasing production of EVs in countries like China, Germany, and Japan, along with government investments in EV charging infrastructure, is further accelerating the market. However, fluctuating raw material prices, such as lithium-ion, could impact production costs.
The Growing Importance of Critical Minerals in Energy Transition
According to BP’s Energy Outlook 2024, the transition to a low-carbon energy system will require a substantial increase in the use of critical minerals, such as copper, lithium, and nickel, essential for supporting the infrastructure and assets needed for this transition. According to the report, the rapid expansion of electric vehicles is projected to reach 1.2 billion (current trajectory) to 2.1 billion (goal to reach Net Zero) by 2050, which will significantly increase the demand for batteries and in turn, higher demand for minerals like lithium and nickel.
Copper demand is expected to rise by 75-100% by 2050, mostly due to its use in EVs and the extension of electricity networks. Lithium demand could grow 8 to 14 times by 2050, mainly driven by its use in EV batteries, which will account for about 80% of total lithium demand by 2050. Lastly, nickel demand is projected to increase two to three times by 2050, with most of this growth linked to lithium-ion batteries in EVs.
How Competitive Pricing and Leasing Are Shaping the EV Market
In an interview at CNBC Power Lunch, Erin Keating, Cox Automotives executive analyst, explored the factors shaping the EV market. She noted that Tesla and Chevy initially dominated EV sales, which is why a growing supply of used cars from the former is now available. These used EVs have become more affordable, partly due to tax credits of up to $4,000. This is helping to drive sales in the used EV market and making it a more attractive option for consumers.
However, the lease market is offering deals that compete with used EV prices. According to Keating, while this puts downward pressure on used EV prices, she emphasized the benefit of the situation and said that more leased vehicles today will enter the used market in a few years, which will ensure a steady supply of affordable used EVs in the future.
Keating also addressed the issue of buyer’s remorse, as some people are frustrated with the slower development of EV infrastructure and range anxiety. Despite this, she reassured consumers that the batteries in used EVs are holding up well with minimal degradation.
It means consumers can trust the longevity of these vehicles, and automakers are committed to supporting them. Although some challenges remain, she believes that as infrastructure improves, consumer confidence and adoption of EVs will continue to grow.
Our Methodology
For this article, we used stock screeners and ETFs including Amplify Lithium & Battery Technology ETF and Lithium & Battery Tech ETF to identify companies involved in the EV battery market. We then selected 10 stocks with the smallest short interest and listed them in descending order of their short interest. We also mentioned the hedge fund sentiment around each stock which was taken from Insider Monkey’s database of over 900 elite hedge funds.
Why are we interested in the stocks that hedge funds pile into? The reason is simple: our research has shown that we can outperform the market by imitating the top stock picks of the best hedge funds. Our quarterly newsletter’s strategy selects 14 small-cap and large-cap stocks every quarter and has returned 275% since May 2014, beating its benchmark by 150 percentage points (see more details here).
A laboratory technician pouring a specialty blend of industrial chemicals into a beaker.
Sociedad Química y Minera de Chile S.A. (NYSE:SQM)
Short Interest as % of Shares Outstanding: 2.27%
Number of Hedge Fund Holders: 9
Sociedad Química y Minera de Chile S.A. (NYSE:SQM) is a leading Chilean company recognized globally for its production of lithium, iodine, and specialty plant nutrients. It is the world’s largest lithium producer. The company was founded in 1968 and over the years, it has expanded its operations internationally.
The company has become a key player in the global supply chain for essential minerals like lithium, which is vital for the production of batteries used in EVs and renewable energy storage. It is among our best battery stocks to buy now according to short sellers.
The company has operations in 110 countries across 5 continents. It has a unique advantage due to its exclusive access to the world's largest and richest deposits of caliche and brine, located in the Atacama Desert between Chile's First and Second Regions. These resources provide the company with extensive reserves of essential minerals, including the largest reserves of iodine and nitrate, along with the highest concentrations of lithium and potassium ever recorded.
Additionally, starting in 2017, Sociedad Química (NYSE:SQM) began expanding its geographic reach, particularly in lithium production. This expansion includes acquiring new lithium resources from spodumene in Western Australia through a partnership with Kidman Resources, further strengthening its global presence in the lithium market.
According to its 2023 annual report, the company continued expanding its production capacity across its main business lines. In the lithium sector, the company increased its Lithium Chemical Plant's capacity to 200,000 metric tons of lithium carbonate by the end of 2023 and aims to reach 210,000 metric tons in 2024. It also began operations at its Mt. Holland mining and concentrator facilities and is on track to complete refining capacity in Kwinana, Perth, by 2025. Additionally, the company refurbished a lithium hydroxide plant in China and began production using lithium sulfate from the Salar de Atacama.
As of 2023, Sociedad Química (NYSE:SQM) sold lithium products to 207 customers across 39 countries, with 92% of sales going to Asia. The company’s largest customers accounted for about 67% of its revenues. In 2023, the company held an 18% market share in lithium production.
As of August 9, Goldman Sachs sees long-term potential in the company. The firm’s analyst, Marcio Farid, upgraded the stock from a Neutral to a Buy rating, while keeping the price target at $46.50 per share, as reported by The Fly. Farid believes that the potential rewards of investing in the stock outweigh the risks. The analyst noted that the company is strategically positioned to benefit from an anticipated improvement in the lithium supply and demand dynamics by 2027.
In Q2, 9 hedge funds had stakes in Sociedad Química y Minera de Chile S.A. (NYSE:SQM), at a combined value of $44.8 million. Kopernik Global Investors initiated a position with 640,997 shares, worth $26.12 million in the company and is the biggest shareholder of the company, as of June 30.
Overall SQM ranks 3rd on our list of the best battery stocks to buy. While we acknowledge the potential of SQM as an investment, our conviction lies in the belief that AI stocks hold greater promise for delivering higher returns and doing so within a shorter timeframe. If you are looking for an AI stock that is more promising than SQM but that trades at less than 5 times its earnings, check out our report about the cheapest AI stock.
Read Next: $30 Trillion Opportunity: 15 Best Humanoid Robot Stocks to Buy According to Morgan Stanley and Jim Cramer Says NVIDIA ‘Has Become A Wasteland’.
Disclosure: None. This article is originally published at Insider Monkey.
Sociedad Quimica y Minera de Chile S.A. SQM posted a profit of $213.6 million or 75 cents per share in second-quarter 2024. The figure marks a decline from the $580.2 million or $2.03 per share registered in the year-ago quarter. Quarterly earnings also fell short of the Zacks Consensus Estimate of 99 cents per share.
SQM generated revenues of $1,293.6 million in the quarter, down around 37% year over year. The figure beat the Zacks Consensus Estimate of $1,260.7 million.
Sociedad Quimica y Minera S.A. Price, Consensus and EPS Surprise
Sociedad Quimica y Minera S.A. Price, Consensus and EPS Surprise
Sociedad Quimica y Minera S.A. price-consensus-eps-surprise-chart | Sociedad Quimica y Minera S.A. Quote
Segment Highlights
Revenues from the Lithium and Derivatives segment fell nearly 55% year over year to $664.7 million in the reported quarter. Despite a near 21% increase in sales volumes, the downside was caused by a sharp 63% reduction in average sales prices.
The Specialty Plant Nutrients (SPN) segment generated revenues of $260.5 million, up 5% year over year. This upside was primarily driven by higher sales volumes, though it was tempered by lower average sales prices.
The Iodine and Derivatives segment posted revenues of $269.2 million, up around 22% from the prior year’s levels, benefiting from higher sales volumes and increased sales prices.
Revenues from the Potassium business rose 10% year over year to $73.1 million, supported by higher sales volumes, though partially offset by lower average sales prices.
The Industrial Chemicals unit recorded sales of $20.5 million, down around 56% year over year. The figure was partially dented by significantly lower sales volumes despite higher average sales prices.
Financials
The company’s cash and cash equivalents were $1,033.1 million at the end of the quarter, down around 22% sequentially. Long-term debt was $2,946.2 million, flat sequentially.
Outlook
SQM’s production guidance remains unchanged from earlier this year, with expectations to produce approximately 210,000 metric tons of lithium carbonate equivalent from its production facilities. Sales volumes in the second half of the year are anticipated to be similar to those reported in the first half of 2024.
Positive trends have been observed in the potassium nitrate market during the first half of this year, driven by strong demand growth and stable market prices. The firm projects that total market demand for potassium nitrate could rise by nearly 13% compared with 2023 levels. As a result, its sales volumes are expected to outpace this demand growth, increasing by close to 20% in 2024 from the previous year’s tally. Price stability seen in the first half of 2024 is expected to continue through the remainder of the year, assuming market conditions remain consistent.
In the iodine market, stronger-than-anticipated demand growth was seen in the first half of the year, a trend the company believes could extend into the second half. Total iodine demand growth in 2024 is projected to reach approximately 7% year over year, primarily driven by applications in X-ray contrast media and LCD/LED screen segments. Given these favorable trends, SQM expects its iodine sales volumes in 2024 to exceed 14,500 metric tons, surpassing the levels reported for 2023. Iodine prices have shown a slight increase since the first quarter, with the potential for further price gains in the second half due to robust demand and limited supply.
Global demand growth for potassium remained robust in the first half of 2024, with total demand projected to exceed 70 million metric tons by the year-end. The company expects its sales volumes to reach 650,000 metric tons in 2024.
Quarterly sales volumes for industrial chemicals are anticipated to remain steady throughout the year, with market prices likely to stay stable for the remainder of 2024.
Price Performance
SQM’s shares have plunged 41.8% over a year compared with the industry’s decline of 22.1%.
Zacks Investment Research
Image Source: Zacks Investment Research
Zacks Rank & Key Picks
SQM currently carries a Zacks Rank #5 (Strong Sell).
Some better-ranked stocks in the Basic Materials space are Newmont Corporation NEM, Element Solutions Inc ESI and Barrick Gold Corporation GOLD. Newmont and ElementSolutionssport a Zacks Rank #1 (Strong Buy), while Barrick Gold carries a Zacks Rank #2 (Buy) each. You can see the complete list of today’s Zacks #1 Rank stocks here.
The Zacks Consensus Estimate for Newmont’s current-year earnings is pegged at $2.82, indicating a rise of 75% from the year-ago levels. The consensus for NEM’s earnings has increased 16% in the past 60 days.The stock has gained nearly 34.4% in the past year.
The Zacks Consensus Estimate for ESI’s current-year earnings is pegged at $1.42, indicating a rise of 10% from the year-ago levels. ESI beat the consensus estimate in three of the last four quarters, with the average earnings surprise being 3.8%. The stock has rallied nearly 36.8% in the past year.
The Zacks Consensus Estimate for GOLD’s current year earnings is pegged at $1.21, indicating a year-over-year rise of 44%. GOLD’s earnings beat the Zacks Consensus Estimate in all of the last four quarters, the average earnings surprise being 21.2%. The company’s shares have increased 30.2% in the past year.
Want the latest recommendations from Zacks Investment Research? Today, you can download 7 Best Stocks for the Next 30 Days. Click to get this free report
Element Solutions Inc. (ESI) : Free Stock Analysis Report
Newmont Corporation (NEM) : Free Stock Analysis Report
Sociedad Quimica y Minera S.A. (SQM) : Free Stock Analysis Report
Barrick Gold Corporation (GOLD) : Free Stock Analysis Report
To read this article on Zacks.com click here.
As the S&P 500 approaches a new record, buoyed by optimism surrounding potential interest rate cuts and strong earnings reports, investors are keenly watching for opportunities in an increasingly bullish market. In this environment, identifying undervalued stocks can be particularly rewarding, as these equities may offer significant upside potential when their intrinsic value is recognized.
Top 10 Undervalued Stocks Based On Cash Flows In The United States
|
Name |
Current Price |
Fair Value (Est) |
Discount (Est) |
|
Kaspi.kz (NasdaqGS:KSPI) |
$127.08 |
$252.16 |
49.6% |
|
Owens Corning (NYSE:OC) |
$163.36 |
$316.48 |
48.4% |
|
Sociedad Química y Minera de Chile (NYSE:SQM) |
$38.45 |
$76.18 |
49.5% |
|
Fluence Energy (NasdaqGS:FLNC) |
$18.32 |
$35.79 |
48.8% |
|
American Superconductor (NasdaqGS:AMSC) |
$20.65 |
$40.94 |
49.6% |
|
Vitesse Energy (NYSE:VTS) |
$24.58 |
$48.59 |
49.4% |
|
MaxLinear (NasdaqGS:MXL) |
$12.79 |
$24.91 |
48.7% |
|
QuinStreet (NasdaqGS:QNST) |
$17.45 |
$34.44 |
49.3% |
|
Cytek Biosciences (NasdaqGS:CTKB) |
$5.38 |
$10.61 |
49.3% |
|
Zillow Group (NasdaqGS:ZG) |
$53.11 |
$104.15 |
49% |
Here we highlight a subset of our preferred stocks from the screener.
Overview: Corning Incorporated operates in display technologies, optical communications, environmental technologies, specialty materials, and life sciences sectors across the United States and internationally, with a market cap of approximately $34.85 billion.
Operations: Corning’s revenue segments include $3.86 billion from Optical Communications, $3.73 billion from Display Technologies, $1.99 billion from Specialty Materials, $1.76 billion from Environmental Technologies, and $957 million from Life Sciences.
Estimated Discount To Fair Value: 19.1%
Corning, trading at US$42.08, is undervalued based on discounted cash flow analysis with a fair value estimate of US$52. Despite significant insider selling and a high level of debt, Corning’s earnings are forecast to grow significantly at 27.8% annually, outpacing the market average. Recent strategic moves include an extended distribution agreement with Axion BioSystems and substantial share buybacks totaling 5.57% for US$1.81 billion since July 2019, indicating confidence in its financial position and future growth prospects.
-
The analysis detailed in our Corning growth report hints at robust future financial performance.
-
Delve into the full analysis health report here for a deeper understanding of Corning.
NYSE:GLW Discounted Cash Flow as at Aug 2024Palantir Technologies
Overview: Palantir Technologies Inc. develops and implements software platforms for intelligence and counterterrorism operations across the United States, the United Kingdom, and globally, with a market cap of $72.38 billion.
Operations: Palantir’s revenue segments include $1.14 billion from commercial operations and $1.34 billion from government contracts.
Estimated Discount To Fair Value: 37.7%
Palantir Technologies, trading at US$32.54, is significantly undervalued based on discounted cash flow analysis with a fair value estimate of US$52.24. The company recently became profitable and forecasts earnings growth of 22.78% per year, outpacing the market average. Despite past shareholder dilution, Palantir’s strategic partnerships with Microsoft and Wendy’s QSCC highlight its expanding AI capabilities and potential for future revenue growth in various sectors including defense and supply chain management.
NYSE:PLTR Discounted Cash Flow as at Aug 2024Sociedad Química y Minera de Chile
Overview: Sociedad Química y Minera de Chile S.A. is a global mining company with a market cap of $10.65 billion.
Operations: The company’s revenue segments include Potassium ($255.75 million), Industrial Chemicals ($131.14 million), Iodine and Derivatives ($892.61 million), Lithium and Derivatives ($4.08 billion), and Specialty Plant Nutrition ($900.72 million).
Estimated Discount To Fair Value: 49.5%
Sociedad Química y Minera de Chile (SQM), trading at US$38.45, is highly undervalued based on discounted cash flow analysis with a fair value estimate of US$76.18. Despite recent declines in revenue and net income, SQM’s earnings are forecast to grow significantly at 36% per year over the next three years, outpacing the US market average. However, its debt is not well covered by operating cash flow and its dividend yield of 28.45% is unsustainable based on free cash flows.
NYSE:SQM Discounted Cash Flow as at Aug 2024Seize The Opportunity
-
Delve into our full catalog of 176 Undervalued US Stocks Based On Cash Flows here.
-
Invested in any of these stocks? Simplify your portfolio management with Simply Wall St and stay ahead with our alerts for any critical updates on your stocks.
-
Take control of your financial future using Simply Wall St, offering free, in-depth knowledge of international markets to every investor.
Searching for a Fresh Perspective?
-
Explore high-performing small cap companies that haven’t yet garnered significant analyst attention.
-
Diversify your portfolio with solid dividend payers offering reliable income streams to weather potential market turbulence.
-
Fuel your portfolio with companies showing strong growth potential, backed by optimistic outlooks both from analysts and management.
This article by Simply Wall St is general in nature. We provide commentary based on historical data and analyst forecasts only using an unbiased methodology and our articles are not intended to be financial advice. It does not constitute a recommendation to buy or sell any stock, and does not take account of your objectives, or your financial situation. We aim to bring you long-term focused analysis driven by fundamental data. Note that our analysis may not factor in the latest price-sensitive company announcements or qualitative material. Simply Wall St has no position in any stocks mentioned.
Companies discussed in this article include NYSE:GLW NYSE:PLTR and NYSE:SQM.
Have feedback on this article? Concerned about the content? Get in touch with us directly. Alternatively, email editorial-team@simplywallst.com
|
Highlights
|
|
• SQM reported total revenues for the six months ended June 30, 2024 of US$2,378.1 million compared to total revenues of US$4,315.6 million for the same period last year. |
|
• Net loss for the six months ended June 30, 2024 of (US$655.9) million or (US$2.30) per share, compared to net income of US$1,330.1 million or US$4.66 per share for the same period last year. |
|
• Strong sales volumes growth in lithium, iodine and fertilizer businesses. |
|
• Record-high quarterly sales volumes in lithium and iodine businesses, surpassing 52,000 metric tons and 4,000 metric tons, respectively. |
|
• Signed definitive partnership agreement with Codelco to jointly develop and operate lithium assets in the Salar de Atacama until 2060. |
|
• Signed a long-term agreement with Hyundai Motors Co. Ltd. and Kia Corporation. |
|
• Launched SQM International Lithium to develop our lithium business outside of Chile. |
|
SQM will hold a conference call to discuss these results on Wednesday, August 21, 2024 at 12:00pm ET (12:00pm Chile time). |
|
Participant Dial-In (Toll Free): 1-844-282-4852 |
|
Participant International Dial-In: 1-412-317-5626 |
|
Webcast: https://event.choruscall.com/mediaframe/webcast.html?webcastid=FRfGBEBZ |
SANTIAGO, Chile, Aug. 21, 2024 /PRNewswire/ — Sociedad Química y Minera de Chile S.A. (SQM) (NYSE: SQM; Santiago Stock Exchange: SQM-B, SQM-A) reported today net loss(1) for the six months ended June 30, 2024, of (US$655.9) million or (US$2.30) per share, compared to US$1,330.1 million or US$4.66 per share reported for the same period last year.
(PRNewsfoto/Sociedad Quimica y Minera de Chile, S.A. (SQM))
Gross profit reached US$752.5 million (31.6% of revenues) for the six months ended June 30, 2024, lower than US$1,920.7 million (44.5% of revenues) recorded for the six months ended June 30, 2023. Revenues totaled US$2,378.1 million for the six months ended June 30, 2024, representing a decrease of 44.9% compared to US$4,315.6 million reported for the six months ended June 30, 2023.
The Company also announced net income for the second quarter of 2024 of US$213.6 million or US$0.75 per share, a decrease of 63.2% compared to US$580.2 million or US$2.03 per share for the second quarter of 2023. Gross profit for the second quarter of 2024 reached US$383.9 million, 55.1% lower than the US$855.1 million reported for the second quarter of 2023. Revenues totaled US$1,293.6 million for the second quarter of 2024, a decrease of 37.0% compared to US$2,051.7 million for the second quarter of 2023.
SQM's Chief Executive Officer, Ricardo Ramos, stated, "We are very pleased to highlight that during the second quarter, we entered into a partnership agreement with Codelco to extend our operations in the Salar de Atacama until 2060. Together with Codelco, we are working to fulfill the remaining conditions for the partnership to take effect in 2025. The most pivotal of these is the consultation process with the communities surrounding the Salar de Atacama. We are committed to reaching a mutually beneficial agreement with the Atacameño communities founded upon the most rigorous standards, transparency and promotion of the human rights of these communities."
He continued by saying, "In the second quarter, we continued to see positive sales volumes growth in the lithium, iodine and fertilizer businesses. While sales volumes in the lithium and iodine businesses again reached record levels, increasing by more than 20% and 11%, respectively, compared to the same period last year, sales volumes in the fertilizer business confirmed the strong demand recovery trends anticipated since the beginning of the year, increasing by more than 20% compared to the same period last year."
Mr. Ramos further stated, "The strong sales volumes growth in the lithium business in the second quarter was offset by significantly lower average realized lithium prices, as a result of lower market prices when compared to the same period last year. We see this pricing trend continuing in the second half of this year, with current lithium price indices in China nearly 20% lower than the average lithium price indices in the second quarter of 2024. This trend could have a negative impact on our realized prices, which reflect the prevailing market price trends, in the second half of the year. Given current price levels, we anticipate that some lithium producers may reduce their output, as many projects, especially greenfield, are not economically viable at these prices. In our situation, while we continue to advance our previously announced expansions, we are currently reevaluating specific markets and initiatives that may be less attractive in the near term under these conditions."
Mr. Ramos closed by saying, "In light of our confidence in the long-term growth of the lithium industry, we launched SQM International Lithium to focus on developing SQM's lithium business outside of Chile. Leveraging our expertise in exploration, project development, M&A and innovation, SQM International Lithium's objective is to expand the portfolio of lithium assets we have with various partners outside of Chile, allowing us to increase SQM's production volumes by at least 100,000 metric tons of LCE per year by the end of this decade."
About SQM
SQM is a global company that is listed on the New York Stock Exchange and the Santiago Stock Exchange (NYSE: SQM; Santiago Stock Exchange: SQM-B, SQM-A). SQM develops and produces diverse products for several industries essential for human progress, such as health, nutrition, renewable energy and technology through innovation and technological development. We aim to maintain our leading world position in the lithium, potassium nitrate, iodine and thermo-solar salts markets.
For further information, contact:
Gerardo Illanes / gerardo.illanes@sqm.comIrina Axenova / irina.axenova@sqm.comIsabel Bendeck / isabel.bendeck@sqm.com
For media inquiries, contact:
Maria Ignacia Lopez / ignacia.lopez@sqm.comPablo Pisani / pablo.pisani@sqm.com
Cautionary Note Regarding Forward-Looking Statements
This news release contains "forward-looking statements" within the meaning of the safe harbor provisions of the U.S. Private Securities Litigation Reform Act of 1995. Forward-looking statements can be identified by words such as: "anticipate," "plan," "believe," "estimate," "expect," "strategy," "should," "will" and similar references to future periods. Examples of forward-looking statements include, among others, statements we make concerning the completion and implementation of the proposed partnership with Codelco, the development of Salar Futuro Project, Company's capital expenditures, financing sources, Sustainable Development Plan, business and demand outlook, future economic performance, anticipated sales volumes and sales prices, profitability, revenues, expenses, or other financial items, anticipated cost synergies and product or service line growth.
Forward-looking statements are neither historical facts nor assurances of future performance. Instead, they are estimates that reflect the best judgment of SQM management based on currently available information. Because forward-looking statements relate to the future, they involve a number of risks, uncertainties and other factors that are outside of our control and could cause actual results to differ materially from those stated in such statements, including our ability to successfully implement the Sustainable Development Plan. Therefore, you should not rely on any of these forward-looking statements. Readers are referred to the documents filed by SQM with the United States Securities and Exchange Commission, including the most recent annual report on Form 20-F, which identifies other important risk factors that could cause actual results to differ from those contained in the forward-looking statements. All forward-looking statements are based on information available to SQM on the date hereof and SQM assumes no obligation to update such statements, whether as a result of new information, future developments or otherwise, except as required by law.
(1) Includes the net effect of accounting adjustments for the payments of the specific tax on mining activities for the exploitation of lithium for the six months ended June 30, 2024, in a total amount of US$1,106.9 million. For more detail, please refer to Note (1) to this Earnings release.
Cision
View original content to download multimedia:https://www.prnewswire.com/news-releases/sqm-reports-earnings-for-the-six-months-ended-june-30-2024-302227225.html
SOURCE Sociedad Quimica y Minera de Chile, S.A. (SQM)
FMC Corporation FMC recently filed regulatory applications for the Dodhylex active herbicide in eight rice-growing countries. Registration dossiers were submitted in India, Brazil, the Philippines, the United States, Colombia, South Korea, Peru and Taiwan, accounting for roughly 35% of the estimated 165 million hectares of planted rice worldwide. Dodhylex active regulatory filings are planned for a number of other significant global markets.The Herbicide Resistance Action Committee and the Weed Science Society of America have categorized Dodhylex active, FMC's brand name, as tetflupyrolimet, which is a Group 28 herbicide, thereby making it the first novel mode of action herbicide globally in more than three decades. Dodhylex active will be a significant new rotational tool for farmers to manage herbicide resistance, which is becoming an increasingly difficult concern for growers around the world.Dodhylex active is a key improvement for the agriculture industry because it combats resistant grass weeds. According to studies, this proprietary molecule provides season-long control of resistant grass weeds in rice, irrespective of cultivation method. FMC is continuing to evaluate the application of Dodhylex active in other crops such as sugarcane, wheat, soybeans and corn.FMC's innovation and methodical approach to develop novel molecules to facilitate food security for an expanding population and fight resistance are demonstrated by the discovery and development of Dodhylex active at the Stine Research Centre. Subject to regulatory decisions, FMC expects the first launches of Dodhylex in 2026.Shares of FMC have lost 28.5% over the past year compared with its industry’s 6.5% decline.
Image Source: Zacks Investment Research
FMC, on its second-quarter call, updated its revenue outlook for full-year 2024 and now expects revenues to be between $4.30 billion and $4.50 billion, indicating a 2% decline at the midpoint from 2023. Adjusted EBITDA is now expected to be in the range of $880- $940 million, indicating a 7% decline at the midpoint from the prior year. Adjusted earnings per share are now forecast to be between $3.02 and $3.64, implying a 12% year-over-year decline at the midpoint. Full-year free cash flow is anticipated to be in the band of $400-$500 million.FMC also forecasts third-quarter revenues to be between $1 billion and $1.09 billion, indicating a 6% increase at the midpoint from the third quarter of 2023. Adjusted EBITDA is forecast to be in the band of $165-$195 million, indicating a 3% rise from the prior-year level. Adjusted earnings per share are expected to be in the range of 39-67 cents, indicating a 20% rise at the midpoint from the third-quarter 2023 level.
FMC Corporation Price and Consensus
FMC Corporation price-consensus-chart | FMC Corporation Quote
Zacks Rank & Key Picks
FMC currently carries a Zacks Rank #3 (Hold).Better-ranked stocks in the basic materials space are Carpenter Technology Corporation CRS, Eldorado Gold Corporation EGO and Agnico Eagle Mines Limited AEM. CRS beat the Zacks Consensus Estimate in the last four quarters, with the average earnings surprise being 15.9%. The company's shares have gained 154.7% in the past year. Carpenter Technology currently sports a Zacks Rank #1 (Strong Buy). You can see the complete list of today's Zacks #1 Rank stocks here.The Zacks Consensus Estimate for Eldorado’s current-year earnings is pegged at $1.32 per share, indicating a year-over-year rise of 131.6%. The consensus estimate for EGO's current-year earnings has gone up in the past 30 days. EGO, which currently sports a Zacks Rank of 1, beat the consensus estimate in the last four quarters, with the average earnings surprise being 430.3%. The company's shares have gained roughly 107.3% in the past year.Agnico Eagle Mines currently carries a Zacks Rank #2 (Buy). AEM beat the Zacks Consensus Estimate in the last four quarters, with the average earnings surprise being 15.7%. The company's shares have gained 73.5% in the past year.
Want the latest recommendations from Zacks Investment Research? Today, you can download 7 Best Stocks for the Next 30 Days. Click to get this free report
Carpenter Technology Corporation (CRS) : Free Stock Analysis Report
Agnico Eagle Mines Limited (AEM) : Free Stock Analysis Report
FMC Corporation (FMC) : Free Stock Analysis Report
Eldorado Gold Corporation (EGO) : Free Stock Analysis Report
To read this article on Zacks.com click here.
Emerging Growth
MIAMI, Aug. 21, 2024 (GLOBE NEWSWIRE) — EmergingGrowth.com a leading independent small cap media portal announces the schedule of the 74th Emerging Growth Conference on August 21 – 22, 2024.
The Emerging Growth Conference identifies companies in a wide range of growth sectors, with strong management teams, innovative products & services, focused strategy, execution, and the overall potential for long-term growth.
Register for the Conference here.
Submit Questions for any of the presenting companies to: Questions@EmergingGrowth.com
For updates, follow us on Twitter
Sponsors:QuoteMedia – Keep Investors Informed with Dynamic Plug and Play IR Solutions(844) 485-8200Sales@QuoteMedia.comQuoteMedia.com
ProCore Advisory – Unleashing the power of strategic investor relations for public and pre-IPO companies(832)-847-1327pierre@procoreadvisory.comwww.procoreadvisory.com
Day 2 – TomorrowAugust 22, 2024
8:45Virtual Lobby opens.Register for the Conference. If you already registered, go back to the registration link and click “Already registered” and enter your email.
9:00Introduction
9:05 – 9:35SunCar Technology Group, Inc. (NASDAQ: SDA)Keynote speakers: Breaux Walker, GM, International
9:40 – 10:10Bioxytran, Inc. (OTCQB: BIXT) Keynote speakers: Mike Sheikh, Executive Vice President Business Development
10:50 – 11:20Citizens, Inc. (NYSE: CIA)Keynote speakers: Jon Stenberg, President / CEO, and Jeff Conklin, CFO
11:25 – 11:55Interstellar Communication HoldingsKeynote speakers: Seda Hewitt, Space Ambassador, Harri Laitinen, CEO of Planix Oy., and Lijie Zhu, Founder and managing director of Dragon Gate Investment Partners
12:00 – 12:30Gossamer Bio, Inc. (NASDAQ: GOSS)Keynote speaker: Bryan Giraudo, CFO & COO
1:10 – 1:40Regen BioPharma Inc. (OTC Pink: RGBP) Keynote speakers: David Koos, President / CEO, and Harry M. Lander, Ph.D. Senior Scientific Consultant
1:45 – 2:15Nature’s Miracle Holding, Inc. (NASDAQ: NMHI)Keynote speakers: James Li, CEO, and George Yutuc, CFO
2:55 – 3:05Unusual Machines, Inc. (NYSE American: UMAC)Keynote speaker: Allan Evans, CEO
3:10 – 3:20Peninsula Energy Limited (OTCQB: PENMF) (ASX: PEN)Keynote speaker: Wayne W. Heili, MD, CEO & Director
3:25 – 3:35Sucro Limited (OTCQB: SUGRF) (TSXV: SUG)Keynote speaker: Don Hill, Chairman
3:40 – 3:50Immuron Limited (NASDAQ: IMRN)Keynote speaker: Steve Lydeamore, CEO
3:55 – 4:05LeddarTech Holdings, Inc. (NASDAQ: LDTC) Keynote speakers: Frantz Saintellemy – CEO, and Chris Stewart, CFO
4:10 – 4:20Cyios Corp. (OTC Pink: CYIO) Keynote speaker: John O’Shea, Chairman
4:25 – 4:35Targa Exploration Corp. (CSE: TEX) (OTCQB: TRGEF)Keynote speaker: Cameron Tymstra, President & CEO
4:40 – 4:50Stillwater Critical Minerals (TSXV:PGE) (OTCQB:PGEZF) Keynote speaker: Michael Rowley, President & CEO
Day 1 – TodayAugust 21, 2024
8:45Virtual Lobby opens.Register for the Conference. If you already registered, go back to the registration link and click “Already registered” and enter your email.
9:00Introduction
9:05 – 9:35EUDA Health Holdings Limited, (NASDAQ: EUDA)Keynote speaker: Kelvin Chen, CEO
10:50 – 11:20BlueRush, Inc. (OTCQB: BTVRF) (TSXV: BTV)Keynote speaker: Steve Taylor, CEO
11:25 – 11:55iQSTEL Inc. (OTCQX: IQST)Keynote speaker: Leandro Jose Iglesias, Co-Founder, Chairman, President & CEO
1:10 – 1:40Nova Minerals Limited (NASDAQ: NVA) (OTC Pink: NVAAF) (ASX: NVA)Keynote speakers: Christopher Gerteisen – CEO & Executive Director
1:45 – 2:15Pure Cycle Corporation (NASDAQ: PCYO)Keynote speaker: Mark Harding, President
2:20 – 2:50Peraso Inc. (NASDAQ: PRSO) Keynote speaker: Ronald Glibbery, Co-Founder, CEO & Director
2:55 – 3:05Elutia, Inc. (NASDAQ: ELUT)Keynote speaker: Dr. Randy Mills, President & CEO
3:10 – 3:20Ascend Wellness Holdings Inc. (OTCQX: AAWH) Keynote speaker: John Hartman, CEO
3:25 – 3:35AseptiScope, Inc.Keynote speaker: Scott W Mader – Founder & CEO
3:40 – 3:50BlockchainK2 Corp. (OTCQB: BIDCF) (TSXV: BITK) Keynote speaker: Scott Brooks, CEO of RealBlocks
3:55 – 4:05Cadrenal Therapeutics, Inc. (NASDAQ: CVKD)Keynote speaker: Mr. Quang X. Pham, Chairman & CEO
4:10 – 4:20GeoVax Labs, Inc. (NASDAQ: GOVX)Keynote speaker: David Dodd, Chairman, President / CEO
4:25 – 4:3522nd Century Group, Inc. (NASDAQ: XXII)Keynote speaker: Lawrence D. Firestone, Chairman & CEO
4:40 – 4:50Sigyn Therapeutics, Inc. (OTCQB: SIGY)Keynote speaker: James Allen Joyce, CEO
4:55 – 5:05CytoMed Therapeutics, Ltd. (NASDAQ: GDTC)Keynote speaker: Peter Choo, Chairman
Visit the following link to register. You will then receive an email containing the link and time to sign into the conference.
Register for the Conference here.
Submit Questions for any of the presenting companies to: Questions@EmergingGrowth.com
Replays: Subscribe to our YouTube Channel
About EmergingGrowth.com
Founded in 2009, Emerging Growth.com quickly became a leader in its space and has developed an extensive history of identifying emerging growth companies that can be overlooked by the investment community.
About the Emerging Growth ConferenceThe Emerging Growth Conference is an effective way for public companies to engage with the investment community regarding their Company, new products, services and other major announcements from anywhere, in an effective and time efficient manner.
All sessions are conducted through video webcasts. Our conference serves as a vehicle for Emerging Growth to build relationships with our existing and potential clients. Accordingly, a certain number of the presenting companies are our current clients, and some may become our clients in the future. In exchange for services we provide, our clients pay us fees in the form of cash and securities, and we may currently have, or in the future may have investments in the securities of certain of the presenting companies. Finally, certain of the presenting companies have paid us a fee to secure a presentation time slot or to present generally. The presentations to be delivered by the presenting companies (including any virtual handouts of written materials) have not been approved, endorsed by or otherwise reviewed by EmergingGrowth.com nor should they in any way be construed to have been made in connection with an offer to sell or a solicitation of an offer to buy securities. Please consult an investment professional before investing in anything viewed on the Emerging Growth Conference or on EmergingGrowth.com.
If you believe or know of a company that might fit our audience, contact us here.
Thank you for your interest in our conference, and we look forward to your participation in future conferences.
Contact:Emerging GrowthPhone: 1-305-330-1985Email: Conference@EmergingGrowth.com
This first new mode of action herbicide in over 30 years will be an important tool for managing resistance
PHILADELPHIA, Aug. 20, 2024 /PRNewswire/ — FMC Corporation (NYSE: FMC), a leading agricultural sciences company, recently submitted regulatory applications for Dodhylex™ active herbicide in eight rice-growing countries. Registration dossiers were submitted in India, Brazil, the Philippines, the United States, Colombia, South Korea, Peru and Taiwan, which account for approximately 35% of the estimated 165 million hectares of planted rice globally. Regulatory submissions for Dodhylex™ active are planned in additional key global markets.
Dodhylex™ active, FMC's brand name for tetflupyrolimet, has been classified by the Herbicide Resistance Action Committee (HRAC) and the Weed Science Society of America (WSSA) as a Group 28 herbicide, making it the first new mode of action herbicide globally in over three decades. Dodhylex™ active will be an important new rotational tool for growers to manage herbicide resistance, which poses an increasing challenge for growers worldwide.
"Dodhylex™ active is a significant advancement for the agriculture industry as it will help combat resistant grass weeds," said Dr. Seva Rostovtsev, FMC executive vice president and chief technology officer. "This is particularly remarkable because rice is a grass, and controlling grass weeds in a grass crop is challenging."
Studies show this proprietary molecule will offer season-long control of resistant grass weeds in rice, regardless of the cultivation method. FMC continues to research the use of Dodhylex™ active in additional crops, including sugarcane, wheat, soybean and corn.
"Dodhylex™ active is one of many new active ingredients in our robust development pipeline that will contribute to FMC's near and long-term growth," said Brian P. Angeli, FMC executive vice president and chief marketing officer. "There are opportunities to control resistant grass weeds in other crops, and we are exploring additional markets for Dodhylex™ active outside of rice. We believe this will expand our global addressable market in the future."
Dodhylex™ active, which was discovered and developed at FMC's Stine Research Center, is a testament to FMC's commitment to innovation and disciplined approach to advancing new molecules to help combat resistance and support food security for a growing population. Pending regulatory decisions, FMC anticipates the first launches of Dodhylex™ active in 2026.
For more information, please visit www.fmc.com/dodhylexactive
About FMC
FMC Corporation is a global agricultural sciences company dedicated to helping growers produce food, feed, fiber and fuel for an expanding world population while adapting to a changing environment. FMC's innovative crop protection solutions – including biologicals, crop nutrition, digital and precision agriculture – enable growers, crop advisers and turf and pest management professionals to address their toughest challenges economically while protecting the environment. With approximately 5,800 employees at more than 100 sites worldwide, FMC is committed to discovering new herbicide, insecticide and fungicide active ingredients, product formulations and pioneering technologies that are consistently better for the planet. Visit fmc.com to learn more and follow us on LinkedIn®.
Dodhylex is a trademark of FMC Corporation and/or an affiliate. Always read and follow all label directions, restrictions and precautions for use. Dodhylex™ active is not registered for sale or use in any country. No offer for sale, sale, or use of this product is permitted prior to the issuance of the required registrations by the relevant regulatory entity.
Statement under the Safe Harbor Provisions of the Private Securities Litigation Reform Act of 1995: FMC and its representatives may from time to time make written or oral statements that are "forward-looking" and provide other than historical information, including statements contained in this press release, in FMC's other filings with the SEC, and in presentations, reports or letters to FMC stockholders.
In some cases, FMC has identified these forward-looking statements by such words or phrases as "outlook", "will likely result," "is confident that," "expect," "expects," "should," "could," "may," "will continue to," "believe," "believes," "anticipates," "predicts," "forecasts," "estimates," "projects," "potential," "intends" or similar expressions identifying "forward-looking statements" within the meaning of the Private Securities Litigation Reform Act of 1995, including the negative of those words or phrases. Such forward-looking statements are based on our current views and assumptions regarding future events, future business conditions and the outlook for the company based on currently available information. The forward-looking statements involve known and unknown risks, uncertainties and other factors that may cause actual results to be materially different from any results, levels of activity, performance or achievements expressed or implied by any forward-looking statement. These statements are qualified by reference to the risk factors included in Part I, Item 1A of our Annual Report on Form 10-K for the year ended December 31, 2023 (the "2023 Form 10-K"), the section captioned "Forward-Looking Information" in Part II of the 2023 Form 10-K and to similar risk factors and cautionary statements in all other reports and forms filed with the Securities and Exchange Commission ("SEC"). We wish to caution readers not to place undue reliance on any such forward-looking statements, which speak only as of the date made. Forward-looking statements are qualified in their entirety by the above cautionary statement.
We specifically decline to undertake any obligation, and specifically disclaims any duty, to publicly update or revise any forward-looking statements that have been made to reflect events or circumstances after the date of such statements or to reflect the occurrence of anticipated or unanticipated events, except as may be required by law.
Cision
View original content to download multimedia:https://www.prnewswire.com/news-releases/fmc-corporation-submits-regulatory-applications-in-eight-countries-for-dodhylex-active-302226844.html
SOURCE FMC Corporation
Eastern Platinum (TSE:ELR) Second Quarter 2024 ResultsKey Financial Results
-
Revenue: US$18.8m (down 49% from 2Q 2023).
-
Net income: US$3.48m (down 55% from 2Q 2023).
-
Profit margin: 19% (down from 21% in 2Q 2023). The decrease in margin was driven by lower revenue.
-
EPS: US$0.017 (down from US$0.044 in 2Q 2023).
All figures shown in the chart above are for the trailing 12 month (TTM) period
Eastern Platinum shares are down 12% from a week ago.
Risk Analysis
Before we wrap up, we've discovered 2 warning signs for Eastern Platinum that you should be aware of.
Have feedback on this article? Concerned about the content? Get in touch with us directly. Alternatively, email editorial-team (at) simplywallst.com.This article by Simply Wall St is general in nature. We provide commentary based on historical data and analyst forecasts only using an unbiased methodology and our articles are not intended to be financial advice. It does not constitute a recommendation to buy or sell any stock, and does not take account of your objectives, or your financial situation. We aim to bring you long-term focused analysis driven by fundamental data. Note that our analysis may not factor in the latest price-sensitive company announcements or qualitative material. Simply Wall St has no position in any stocks mentioned.
Investors in Sociedad Quimica y Minera de Chile S.A. SQM need to pay close attention to the stock based on moves in the options market lately. That is because the Jan 17, 2025 $125 Call had some of the highest implied volatility of all equity options today.
What is Implied Volatility?
Implied volatility shows how much movement the market is expecting in the future. Options with high levels of implied volatility suggest that investors in the underlying stocks are expecting a big move in one direction or the other. It could also mean there is an event coming up soon that may cause a big rally or a huge sell-off. However, implied volatility is only one piece of the puzzle when putting together an options trading strategy.
What do the Analysts Think?
Clearly, options traders are pricing in a big move for Sociedad Quimica y Minera shares, but what is the fundamental picture for the company? Currently, Sociedad Quimica y Minerais a Zacks Rank #5 (Strong Sell) in the Fertilizers industry that ranks in the Bottom 35% of our Zacks Industry Rank. Over the last 60 days, one analyst has increased its earnings estimate for the current quarter, while no analysts have revised their estimates downward. The net effect has taken our Zacks Consensus Estimate for the current quarter from 96 cents per share to $1.01 per share in that period.
Given the way analysts feel about Sociedad Quimica y Mineraright now, this huge implied volatility could mean there’s a trade developing. Oftentimes, options traders look for options with high levels of implied volatility to sell premium. This is a strategy many seasoned traders use because it captures decay. At expiration, the hope for these traders is that the underlying stock does not move as much as originally expected.
Looking to Trade Options?
Check out the simple yet high-powered approach that Zacks Executive VP Kevin Matras has used to close recent double and triple-digit winners. In addition to impressive profit potential, these trades can actually reduce your risk.
Click to see the trades now >>
Want the latest recommendations from Zacks Investment Research? Today, you can download 7 Best Stocks for the Next 30 Days. Click to get this free report
Sociedad Quimica y Minera S.A. (SQM) : Free Stock Analysis Report
To read this article on Zacks.com click here.
VANCOUVER, BC, Aug. 13, 2024 /CNW/ – Eastern Platinum Limited (TSX: ELR) (JSE: EPS) ("Eastplats" or the "Company") is pleased to report that it has filed its condensed interim consolidated financial statements for the three and six months ended June 30, 2024 and the corresponding management's discussion and analysis ("MD&A"). Below is a summary of the Company's financial results for the second quarter of 2024 ("Q2 2024") and for the six months ended June 30, 2024 ("YTD 2024") in comparison to the same respective period in in 2023 ("Q2 2023" and "YTD 2023") (all amounts in USD unless specified):
-
Revenue for Q2 2024 decreased to $18.8 million (Q2 2023 – $36.6 million), representing a $17.8 million or 48.6% decrease. Revenue for YTD 2024 decreased to $34.5 million (YTD 2023 – $54.7 million), representing a $20.2 million or 36.9% decrease.
-
Mine operating income decreased by $8.9 million (or -66.9%) to $4.4 million in Q2 2024 (Q2 2023 – $13.3 million) as gross margin declined to 23.6% in Q2 2024 from 36.2% in Q2 2023. Mine operating income in YTD 2024 decreased by $7.1 million (or -42.3%) to $9.7 million (YTD 2023 – $16.8 million), resulting from a reduced gross margin of 28.2% in YTD 2024 from 30.7% in YTD 2023.
-
Operating income was $1.6 million in Q2 2024 compared to $10.4 million in Q2 2023. Operating income was $1.6 million in YTD 2024 compared to $12.2 million in YTD 2023.
-
Net income attributable to equity shareholders was $3.5 million ($0.02 earnings per share) in Q2 2024 versus net income attributable to equity shareholders of $7.7 million ($0.04 earnings per share) in Q2 2023. The decrease in Q2 2024 net income was largely attributable to lower chrome sales in the quarter offset by a decrease in finance costs and a foreign exchange gain in the period due to the strengthening of the South African Rand.
-
Net income attributable to equity shareholders was $2.6 million ($0.01 earnings per share) in YTD 2024 compared to net income attributable to equity shareholders of $7.3 million ($0.05 earnings per share) in YTD 2023. The decrease of YTD 2024 net income was mainly attributable to lower gross margins earned on year-to-date chrome sales offset by a decrease in finance costs.
-
The Company had a working capital deficit (current assets less current liabilities) of $17.0 million as at June 30, 2024 (December 31, 2023 – working capital deficit of $15.5 million) and short-term cash resources of $17.4 million (consisting of cash, cash equivalents and short-term investments) (December 31, 2023 – $21.3 million).
Wanjin Yang, Chief Executive Officer and President of Eastplats commented, "We continue to focus our efforts on ramping up production in the Zandfontein underground section at the Crocodile River Mine and expect to process the run-of-mine ore soon. We are all working hard to improve chrome recoveries from the remaining tailings resource."
Operations
The Company derived revenue from the processing of PGM and chrome concentrates at the Crocodile River Mine ("CRM"). Eastplats' majority of revenue (approximately 96% and 95% for Q2 2024 and YTD 2024, respectively) is from chrome concentrate sales to third parties.
Summary of chrome production for the three and six months ended June 30, 2024 and 2023:
|
Q2 2024 |
Q2 2023 |
YTD 2024 |
YTD 2023 |
|
|
Total Tailings Feed (Tons) |
281,867 |
615,060 |
667,166 |
1,247,014 |
|
Average grade Cr concentrate |
38.4 % |
39.0 % |
38.5 % |
38.8 % |
|
Tons of Cr concentrate |
72,305 |
127,122 |
152,187 |
274,221 |
The Company continues the tailings storage facility ("TSF") wall building program, utilizing waste rock and paddocking, to raise the wall to facilitate continued depositing of reprocessed tailings. The reprocessing of the original CRM tailings (the "Retreatment Project") is expected to be completed by the end of 2024.
Summary of PGM production for the three and six months ended June 30, 2024 and 2023:
|
Q2 2024 |
Q2 2023 |
YTD 2024 |
YTD 2023 |
|
|
Tons of PGM concentrate |
808 |
959 |
1,753 |
2,115 |
|
PGM ounces produced (6E)* |
1,060 |
1,973 |
2,548 |
4,108 |
|
*PGM 6E ounces are estimates until final exchanges and umpire results have been concluded, which can take up to three months |
Year-over-year production decreased between Q2 2023 and Q2 2024 due to inclement weather and operational challenges incurred in the current period, as lower grade sections of the TSF, containing vegetation and other impediments, were being processed.
As the end of the Retreatment Project approaches, Eastplats continues underground blasting activities at the CRM and started to raise and stockpile run-of-mine ("ROM") ore at the surface for processing. The commissioning of the processing plant is expected to be completed by the end of August or early September of 2024, which will mitigate revenue decreases at the CRM. At the normalized run rate, this soft restart phase is expected to produce 40,000 tons of ROM ore per month for processing by the end of 2024. The next phase will see operations ramp up to 70,000 tons of ROM ore for processing by the end of 2025, operating at a steady state rate of 70,000 to 80,000 tons monthly by 2026.
Prior Period Restatement of Comparatives
Certain 2023 comparative numbers in the condensed interim consolidated financial statements and corresponding MD&A have been restated to show the impact of an error that was identified and reported during the 2023 year end process, as discussed below.
As discussed in the previous news release of May 3, 2024, in connection with the preparation of the Company's consolidated financial statements for the year ended December 31, 2023, an error was identified in the recognition of revenue related to a chrome concentrate sales transaction in the fourth quarter of 2022 which impacted the Company's previously filed audited consolidated financial statements for the year ended December 31, 2022 and its unaudited condensed interim consolidated financial statements up to and including the three and nine months ended September 30, 2023.
A sales transaction that was included in deferred revenue at the end of 2022 and recognized as revenue in the first quarter of 2023 should have been recognized in the fourth quarter of 2022 based on the fact that the Company had met all of its required performance obligations at the time, as supported by the underlying contract and bill of lading. Previously reported revenue for the first quarter of 2023 was overstated by $4.0 million, with associated adjustments in production costs, accumulated other comprehensive loss and deficit. These adjustments carried forward into the year-to-date figures reported as comparatives in the Company's quarterly financial statements.
The following table presents the effects of the restatement on the individual line items within the Company's unaudited Condensed Interim Consolidated Statement of Income (Loss), Condensed Interim Statement of Comprehensive Income (Loss) and Condensed Interim Statement of Financial Position, expressed in thousands of U.S. dollars, except for per share amounts. There was no impact on cash flows.
|
Six months ended June 30, 2023 |
|||
|
As previouslyreported |
Adjustment |
As restatedandreported inthe interimfinancial statements |
|
|
$ |
$ |
$ |
|
|
Revenue |
58,694 |
(4,021) |
54,673 |
|
Production costs |
(36,820) |
2,324 |
(34,496) |
|
Mine operating income (loss) |
18,493 |
(1,697) |
16,796 |
|
Operating income (loss) |
13,898 |
(1,697) |
12,201 |
|
Net income (loss) for the period |
8,999 |
(1,697) |
7,302 |
|
Net income (loss) attributable to equity shareholders of the Company |
9,007 |
(1,697) |
7,310 |
|
Earnings (loss) per share, basic and diluted |
0.06 |
(0.01) |
0.05 |
|
Comprehensive income (loss) for the period |
1,211 |
(1,766) |
(555) |
|
As at June 30, 2023 |
|||
|
As previouslyreported |
Adjustment |
As restatedandreported inthe interimfinancialstatements |
|
|
$ |
$ |
$ |
|
|
Accumulated other comprehensive loss |
(325,586) |
(13) |
(325,599) |
|
Deficit |
(843,237) |
13 |
(843,224) |
The Company's audited consolidated financial statements for the year ended December 31, 2023 reflected these changes. The unaudited interim consolidated financial statements and related financial information for the affected period contained in the Company's unaudited interim filings prior to May 13, 2024 should no longer be relied upon.
The Company has a primary listing on the Toronto Stock Exchange and a secondary listing on the JSE Limited.
The Company has filed the following documents, under the Company's profile on SEDAR+ at www.sedarplus.ca:
-
Condensed interim consolidated financial statements for the three and six months ended June 30, 2024; and
-
Management's discussion and analysis for the three and six months ended June 30, 2024.
The condensed interim consolidated financial statements for the three and six months ended June 30, 2024 are available for download at https://www.eastplats.com/investors/quarterly-reports/F2024/ and are also available on the JSE's website at: https://senspdf.jse.co.za/documents/2024/JSE/ISSE/EPS/Q224.pdf.
About Eastern Platinum Limited
Eastplats owns directly and indirectly a number of platinum group metals ("PGM") and chrome assets in the Republic of South Africa. All of the Company's properties are situated on the western limb (Crocodile River Mine) and eastern limb (Kennedy's Vale, Spitzkop, Mareesburg) of the Bushveld Complex, the geological environment that hosts approximately 80% of the world's PGM-bearing ore.
Operations at the Crocodile River Mine currently include re-mining and processing its tailings resource from the Barplats Zandfontein tailings dam and mining and processing ore from the Zandfontein underground section to both produce PGM and chrome concentrates.
Cautionary Statement Regarding Forward-Looking Information
This news release contains "forward-looking statements" or "forward-looking information" (collectively referred to herein as "forward-looking statements") within the meaning of applicable securities legislation. Such forward-looking statements include, without limitation, forecasts, estimates, expectations and objectives for future operations that are subject to a number of assumptions, risks and uncertainties, many of which are beyond the control of the Company. Forward-looking statements are statements that are not historical facts and are generally, but not always, identified by the words "will," "plan," "intends," "may," "could," "expects," "anticipates" and similar expressions. Further disclosure of the risks and uncertainties facing the Company and other forward-looking statements are discussed in the Company's most recent Annual Information Form available under the Company's profile on www.sedarplus.ca.
In particular, this press release contains, without limitation, forward-looking statements pertaining to: completion of the original CRM tailings, timing of the completion of the commissioning of the processing plant, mitigation of revenue decreases at the CRM, the monthly ROM ore tonnage ramp up at the Zandfontein underground operations, and timing of expected monthly production rates of ROM ore. These forward-looking statements are based on assumptions made by and information currently available to the Company. Although management considers these assumptions to be reasonable based on information currently available to it, they may prove to be incorrect. By their very nature, forward-looking statements involve inherent risks and uncertainties and readers are cautioned not to place undue reliance on these statements as a number of factors could cause actual results to differ materially from the beliefs, plans, objectives, expectations, estimates and intentions expressed in such forward-looking statements. These factors include, but are not limited to, unanticipated problems that may arise in the Company's production processes, commodity prices, lower than expected grades and quantities of resources, need for additional funding and availability of such additional funding on acceptable terms, economic conditions, currency fluctuations, competition and regulations, legal proceedings and risks related to operations in foreign countries.
All forward-looking statements in this news release are expressly qualified in their entirety by this cautionary statement, the "Cautionary Statement on Forward-Looking Information" section contained in the Company's most recent Management's Discussion and Analysis available under the Company's profile on www.sedarplus.ca. The forward-looking statements in this news release are made as of the date they are given and, except as required by applicable securities laws, the Company disclaims any intention or obligation, and does not undertake, to update or revise any forward-looking statements, whether as a result of new information, future events or otherwise.
No stock exchange, securities commission or other regulatory authority has approved or disapproved the information contained herein.
SOURCE Eastern Platinum Ltd.
Cision
View original content to download multimedia: http://www.newswire.ca/en/releases/archive/August2024/13/c0342.html
Highlights include 39.6m at 5.41g/t PGM+Au, 51.3m at 3.12g/t PGM+Au and 52.0m at 2.23g/t PGM+Au
VANCOUVER, BC, Aug. 13, 2024 /CNW/ – Bravo Mining Corp. (TSXV: BRVO) (OTCQX: BRVMF), ("Bravo" or the "Company") has received assay results from seven trenches in the Central Sector at its 100% owned Luanga palladium + platinum + rhodium + gold + nickel deposit ("Luanga deposit" or "Luanga PGM+Au+Ni deposit"), located in the Carajás Mineral Province, state of Pará, Brazil.
"Bravo's trenching program continues to return excellent results, with grades higher than the average oxide grades reported in the Mineral Resource Estimate ("MRE"). In addition, the greater lateral extent of oxide PGM+Au mineralization at surface is likely to increase the volume of oxide material," said Luis Azevedo, Chairman and CEO of Bravo. "Furthermore, it is encouraging to see that trenching results from the Central Sector continue to follow the trend observed in the North Sector, with broad lateral distribution at surface, combined with supergene enrichment. With trenching now completed across more than half of the Luanga deposit, results continue to outperform expectations."
Highlights Include:
-
Results from the Central Sector trenches continue to demonstrate the broader lateral extent of surface oxide mineralization in comparison to the zones of primary (fresh rock) mineralization observed in drilling below the trenches (including 52m wide in TRC24LU007 and 51m wide in TRC24LU008).
-
Results continue to confirm the presence of supergene enrichment in the saprolite zone (above the base of oxidation), encountering grades that are generally higher than MRE average grades for oxide mineralization.
-
Grades in trenches further corroborate or improve upon intersections encountered by drilling in the underlying fresh rock, while higher-grade zones within trenches, such as TRC24LU001 (39.6m at 5.41g/t PGM+Au) also validate or surpass the high-grade intersections encountered by prior drilling.
-
Results to date suggest more tonnes of oxide at higher grades, assuming similar cut-off grades to prior estimates.
-
Trenching is planned to cover the entire 8.1km strike length of the Luanga deposit and, with work nearly complete in the Central Sector, only the Southwest Sector and a small portion of the North Sector remains.
-
Outside of the main PGM+Au+Ni deposit, the project remains prospective for Cu+Au+/-Ni discoveries with drilling in progress at T5 and T6. This will be followed by drilling at new HeliTEM targets.
|
TRENCH-ID |
From (m) |
To (m) |
Thickness (m) |
Pd (g/t) |
Pt (g/t) |
Rh (g/t) |
Au (g/t) |
PGM + Au(g/t) |
TYPE |
|
TRC24LU001 |
45.60 |
85.20 |
39.60 |
3.06 |
1.93 |
0.22 |
0.20 |
5.41 |
Ox |
|
TRC24LU007 |
113.15 |
165.15 |
52.00 |
1.29 |
0.71 |
0.17 |
0.07 |
2.23 |
Ox |
|
TRC24LU008 |
66.60 |
117.85 |
51.25 |
1.72 |
1.09 |
0.21 |
0.10 |
3.12 |
Ox |
|
TRC24LU026 |
187.40 |
232.50 |
45.10 |
0.30 |
0.76 |
0.11 |
0.01 |
1.18 |
Ox |
|
TRC24LU027B |
0.00 |
44.00 |
44.00 |
1.39 |
0.63 |
0.11 |
0.03 |
2.14 |
Ox |
|
TRC24LU028 |
149.60 |
203.00 |
53.40 |
0.89 |
0.40 |
0.05 |
0.01 |
1.35 |
Ox |
|
TRC24LU029 |
34.70 |
73.95 |
39.25 |
0.65 |
0.29 |
0.00 |
0.01 |
1.00 |
Ox |
Notes: All 'From', 'To' depths, and 'Thicknesses' are along the topographic surface. Type: Ox = Oxide. FR = Fresh Rock. Recovery methods and results will differ based on the type of mineralization.
Luanga Trenching Program
Trenching across the strike of the mineralization in the Central Sector (Figure 1) aims to better interpret near surface mineralization, reduce the distance/spacing between assay data points for later resource classification, and define the lateral extent, or dispersion of, surface oxide mineralization. The program continues to be successful, demonstrating that surface enrichment of surface oxide material is not confined to areas of more pronounced topographic relief, like the North Sector of the Luanga Deposit. Initially, the Central Sector, with its flatter terrain, was thought to have less potential for supergene enrichment and/or extensive lateral dispersion due to its lower topographic relief. However, this is now proven not to be the case as results from a further seven adjacent trenches (Figure 1) continue to demonstrate in the core of the Central Sector. Further, the highest grades in the oxides appear to correlate with the up-dip projection of the Main Sulphide Zone (Figure 3).
Recent results continue to confirm the presence of supergene enrichment in the saprolite zone (above the base of oxidation), encountering grades that are generally higher than MRE average grades for oxide mineralization, and higher than grades reported in drilling intersections directly below the trenches (Figure 2). These new trench results support results reported previously for the first seven trenches at the Central Sector (see April 15th 2024). Like previous Central Sector trenching, results again show significantly greater dispersion as compared to the mineralized thicknesses encountered in drilling below the trenches.
Trenches shown in Figure 1 cover the central part of the Central Sector. Trenching continues in the Central Sector, progressing towards the Southwest Sector. Figure 4 shows the location of trenches reported in this press release.
Figure 1: Arial View of Trenching in the Central Sector, with Assay Results (CNW Group/Bravo Mining Corp.)
Figure 2 (Section 1) demonstrates the extent of surface oxide mineralization, in comparison to the thickness of mineralization intersected by drilling in the primary (fresh rock) zone below the trench. This "mushrooming" of oxide mineralization in the supergene zone demonstrates the potential for increased volumes of oxide mineralization as compared to prior estimates, assuming similar cut-off grades.
Trenching is continuing to cover the entire 8.1km strike length of the Luanga deposit, with work close to completion in the Central Sector, which will leave only the Southwest Sector and a small portion of the North Sector to complete the trenching program.
Figure 2: Central Sector (Section 1 on Figure 4) – Trenching showing supergene enrichment and lateral extents to surface mineralization. (CNW Group/Bravo Mining Corp.)
Figure 3 also shows a plan view of trench results reported in this press release, together with their geological mapping and interpretation. This work provides a consistent surface plan of mineralization which, when combined with the drill sections below, creates a far more accurate 3D of both geology and mineralization. This detail is expected to enhance the accuracy and reliability of future MRE's and 3D geological models.
The same sampling, assay laboratory procedures and QAQC protocols as applied to drill core sampling are applied to trench samples.
Figure 3: Trenching in the Central Sector showing supergene enrichment and lateral extents to surface mineralization. (CNW Group/Bravo Mining Corp.)
Drill Results Status Update
A total of 315 drill holes have been completed by Bravo to date, for 67,168 metres, including 8 metallurgical holes (not subject to routine assaying). Results have been reported for 267 Bravo drill holes to date. Assay results for 40 Bravo drill holes that have been completed are currently outstanding (excluding the metallurgical holes).
Complete Table of Recent Intercepts – Trenching
|
TRENCH-ID |
From (m) |
To (m) |
Thickness (m) |
Pd (g/t) |
Pt (g/t) |
Rh (g/t) |
Au (g/t) |
PGM + Au (g/t) |
TYPE |
|
TRC24LU001 |
45.60 |
85.20 |
39.60 |
3.06 |
1.93 |
0.22 |
0.20 |
5.41 |
Ox |
|
122.50 |
184.80 |
62.30 |
0.29 |
0.48 |
0.03 |
0.01 |
0.81 |
Ox |
|
|
TRC24LU007 |
113.15 |
165.15 |
52.00 |
1.29 |
0.71 |
0.17 |
0.07 |
2.23 |
Ox |
|
176.05 |
247.00 |
70.95 |
0.23 |
0.37 |
0.04 |
0.01 |
0.64 |
Ox |
|
|
271.00 |
284.20 |
13.20 |
0.17 |
0.36 |
0.01 |
0.03 |
0.57 |
Ox |
|
|
TRC24LU008 |
66.60 |
117.85 |
51.25 |
1.72 |
1.09 |
0.21 |
0.10 |
3.12 |
Ox |
|
158.00 |
163.15 |
5.15 |
0.12 |
0.41 |
0.07 |
0.00 |
0.60 |
Ox |
|
|
167.15 |
192.15 |
25.00 |
0.16 |
0.47 |
0.10 |
0.01 |
0.73 |
Ox |
|
|
TRC24LU026 |
13.70 |
16.70 |
3.00 |
0.90 |
0.36 |
0.01 |
0.19 |
1.46 |
Ox |
|
187.40 |
232.50 |
45.10 |
0.30 |
0.76 |
0.11 |
0.01 |
1.18 |
Ox |
|
|
TRC24LU027A |
16.85 |
18.85 |
2.00 |
1.13 |
1.14 |
0.07 |
0.05 |
2.39 |
Ox |
|
31.55 |
77.65 |
46.10 |
0.33 |
0.15 |
0.01 |
0.06 |
0.54 |
Ox |
|
|
TRC24LU027B |
0.00 |
44.00 |
44.00 |
1.39 |
0.63 |
0.11 |
0.03 |
2.14 |
Ox |
|
59.90 |
97.90 |
38.00 |
0.42 |
0.31 |
0.03 |
0.02 |
0.77 |
Ox |
|
|
TRC24LU028 |
46.30 |
62.70 |
16.40 |
0.61 |
0.34 |
0.00 |
0.04 |
1.00 |
Ox |
|
124.10 |
136.60 |
12.50 |
0.39 |
0.25 |
0.04 |
0.03 |
0.71 |
Ox |
|
|
149.60 |
203.00 |
53.40 |
0.89 |
0.40 |
0.05 |
0.01 |
1.35 |
Ox |
|
|
239.40 |
321.40 |
82.00 |
0.21 |
0.31 |
0.01 |
0.01 |
0.53 |
Ox |
|
|
TRC24LU029 |
34.70 |
73.95 |
39.25 |
0.65 |
0.29 |
0.00 |
0.01 |
1.00 |
Ox |
|
139.15 |
172.95 |
33.80 |
0.64 |
0.28 |
0.04 |
0.02 |
0.98 |
Ox |
|
|
200.15 |
290.85 |
90.70 |
0.33 |
0.28 |
0.01 |
0.01 |
0.63 |
Ox |
Notes: All 'From', 'To' depths, and 'Thicknesses' are along the topographic surface. Type: Ox = Oxide. FR = Fresh Rock. Recovery methods and results will differ based on the type of mineralization.
Figure 4: Location of Bravo Trenches and Sections Reported in this News Release (CNW Group/Bravo Mining Corp.)
About Bravo Mining Corp.
Bravo is a Canadian and Brazil-based mineral exploration and development company focused on advancing its Luanga PGM+Au+Ni Project in the world-class Carajás Mineral Province of Brazil. The project is also prospective for copper-gold+/-nickel discoveries, as seen by recent drill intercepts in initial testing of geophysical targets outside of the main Luanga PGM+Au+Ni deposit (see news releases dated May 28, 2024 and June 10, 2024).
The Luanga Project is situated on mature freehold farming land and benefits from being in a location close to operating mines and a mining-experienced workforce, with excellent access and proximity to existing infrastructure, including road, rail, and clean renewable hydro grid power. A fully funded 63,000m infill, step out and exploration drilling and trenching program is well advanced for 2024. Bravo's current Environmental, Social and Governance activities includes planting more than 30,000 high-value trees in the project area and surrounding communities, hiring and contracting locally, and ensuring protection of the environment during its exploration activities.
Technical Disclosure
Technical information in this news release has been reviewed and approved by Simon Mottram, F.AusIMM (Fellow Australia Institute of Mining and Metallurgy), President of Bravo Mining Corp. who serves as the Company's "qualified person" as defined in National Instrument 43-101 Standards of Disclosure for Mineral Projects ("NI 43-101"). Mr. Mottram has verified the technical data and opinions contained in this news release.
For further information about Bravo, please visit www.bravomining.com or contact:
Neither TSX Venture Exchange nor its Regulation Services Provider (as that term is defined in policies of the TSX Venture Exchange) accepts responsibility for the adequacy or accuracy of this release
Forward Looking Statements
This news release contains forward-looking information which is not comprised of historical facts. Forward-looking information is characterized by words such as "extends", "excellent", "higher", "greater", "increase", "encouraging", "trend", "enrichment", "outperform", "improve", "high-grade", "prospective", "better", "successful", "extensive", "significantly", "greater", "potential", "increased", "enhance", variants of these words and other similar words, phrases, or statements that certain events or conditions "may" or "will" occur. This news release contains forward-looking information pertaining to the Company's ongoing trenching program; the interpretation of the results of trench data, including that the mineralization thickens in the saprolite, is locally supergene enriched, and the impact on future mineral resource estimates thereof; the potential that similar thickening and supergene enrichment may be present along the entire strike length of the Luanga deposit and the impact on mineral resource estimates thereafter; the potential future economics of the saprolite material, including the recoverability of PGMs and Au therein; the results of planned additional trenching; the potential for discoveries of Cu+Au+/-Ni mineralization outside of the main Luanga PGM+Au+Ni deposit, the potential tonnes, grade and commercial viability of such, and the results of continuing exploration of geophysical targets; and the Company's plans in respect thereof. Forward-looking information involves risks, uncertainties and other factors that could cause actual events, results, and opportunities to differ materially from those expressed or implied by such forward-looking information. Factors that could cause actual results to differ materially from such forward-looking information include, but are not limited to, unexpected results from exploration programs, changes in the state of equity and debt markets, fluctuations in commodity prices, delays in obtaining required regulatory or governmental approvals, environmental risks, limitations on insurance coverage; and other risks and uncertainties involved in the mineral exploration and development industry. Forward-looking information in this news release is based on the opinions and assumptions of management considered reasonable as of the date hereof, including, but not limited to, the assumption that the assay results confirm that the interpreted mineralization contains significant values of nickel, PGMs and Au; that the mineralization remains open to depth, that PGM and/or Ni grades and mineralized thicknesses are improving to depth; that final drill and assay results will be in line with management's expectations; that activities will not be adversely disrupted or impeded by regulatory, political, community, economic, environmental and/or healthy and safety risks; that the Luanga Project will not be materially affected by potential supply chain disruptions; and general business and economic conditions will not change in a materially adverse manner. Although the Company believes that the assumptions and factors used in preparing the forward-looking information in this news release are reasonable, undue reliance should not be placed on such information. The Company disclaims any intention or obligation to update or revise any forward-looking information, other than as required by applicable securities laws.
Schedule 1: Drill Hole Collar Details
|
HOLE-ID |
Company |
East (m) |
North (m) |
RL (m) |
Datum |
Depth (m) |
Azimuth |
Dip |
Sector |
|
TRC24LU001 |
Bravo |
659028.185 |
9341003.328 |
241.494 |
SIRGAS2000_UTM_22S |
226.80 |
330.00 |
0.00 |
Central |
|
TRC24LU007 |
Bravo |
659143.711 |
9341000.943 |
243.001 |
SIRGAS2000_UTM_22S |
284.20 |
330.00 |
0.00 |
Central |
|
TRC24LU008 |
Bravo |
659196.555 |
9341116.940 |
227.050 |
SIRGAS2000_UTM_22S |
221.35 |
330.00 |
0.00 |
Central |
|
TRC24LU026 |
Bravo |
658924.640 |
9340885.370 |
255.150 |
SIRGAS2000_UTM_22S |
326.90 |
330.00 |
0.00 |
Central |
|
TRC24LU027A |
Bravo |
658819.286 |
9340860.187 |
244.319 |
SIRGAS2000_UTM_22S |
90.75 |
330.00 |
0.00 |
Central |
|
TRC24LU027B |
Bravo |
658754.052 |
9340972.798 |
229.766 |
SIRGAS2000_UTM_22S |
97.90 |
330.00 |
0.00 |
Central |
|
TRC24LU028 |
Bravo |
658757.330 |
9340779.860 |
251.650 |
SIRGAS2000_UTM_22S |
332.30 |
330.00 |
0.00 |
Central |
|
TRC24LU029 |
Bravo |
658667.461 |
9340730.460 |
262.254 |
SIRGAS2000_UTM_22S |
333.15 |
330.00 |
0.00 |
Central |
Schedule 2: Assay Methodologies and QAQC
Samples follow a chain of custody between collection, processing, and delivery to the SGS Geosol laboratory in Parauapebas, state of Pará, Brazil. The drill core is delivered to the core shack at Bravo's Luanga site facilities and processed by geologists who insert certified reference materials, blanks, and duplicates into the sampling sequence. Drill core is half cut and placed in secured polyurethane bags, then in security-sealed sacks before being delivered directly from the Luanga site facilities to the Parauapebas SGS Geosol laboratory by Bravo staff. Additional information about the methodology can be found on the SGS Geosol website (SGS) in their analytical guides. Information regarding preparation and analysis of historic drill core is also presented in the table below, where the information is known.
Quality Assurance and Quality Control ("QAQC") is maintained internally at the lab through rigorous use of internal certified reference materials, blanks, and duplicates. An additional QAQC program is administered by Bravo using certified reference materials, duplicate samples and blank samples that are blindly inserted into the sample batch. If a QAQC sample returns an unacceptable value an investigation into the results is triggered and when deemed necessary, the samples that were tested in the batch with the failed QAQC sample are re-tested.
|
Bravo SGS Geosol |
||
|
Preparation |
Method |
Method |
|
For All Elements |
Pt, Pd, Au |
Rh |
|
PRPCLI (85% at 200#) |
FAI515 |
FAI30V |
Bravo Mining Corp. Logo (CNW Group/Bravo Mining Corp.)
SOURCE Bravo Mining Corp.
Cision
View original content to download multimedia: http://www.newswire.ca/en/releases/archive/August2024/13/c2580.html
Canada Carbon Inc.
Toronto, ON, Canada, Aug. 09, 2024 (GLOBE NEWSWIRE) — Canada Carbon Inc. (the “Company”) (TSX-V:CCB), (FF:U7N1) reports that it has completed the first phase of a Bulk Sample Program for its 100% owned Asbury Graphite Project located 80 kilometers (“km”) NNE of Gatineau, near Notre-Dame-du-Laus, Québec. Working with SGS Lakefield, the Company completed work in the following critical areas:
-
Head assays
-
Bond Ball Work Index Analysis
-
Two Flotation Tests (F01 and F02)
Head AssaysThree samples were received: BK1 – high grade drill core, BK2 – low grade drill core, and BK3 – outcrop. These samples were prepared for testing, and a composite of the two drill core samples (BK1 and BK2) was prepared and named Core Comp.
Carbon speciation analyses of these samples shows total carbon ranging from 1.71% to 7.60% from low to high grade drill core, and a very high carbon total concentration of 18.5% in the outcrop sample. In all samples, carbon occurs as both graphitic carbon (C(g)) as well as in carbonate (CO3) minerals. In this flotation program, CCB will evaluate the recovery of graphitic carbon as opposed to total carbon. Any carbonate concentration is expected to be flushed to our tailings products.
Bond Ball Work Index AnalysisBond Ball Work Index testing was conducted on the three samples, BK1, BK2 and BK3 which produced similar work indices ranging from 14.1 (BK2) to 14.6 (BK1). In comparison with SGS’s database of thousands of ore types, shown in the graph below, the Asbury samples fall in the median range of hardness percentile, ranging from 47.4% to 53.3%.
Rougher Floatation TestsTwo rougher flotation tests were conducted on the low grade BK2 composite.
-
F01 applied an MF2 style flowsheet, where a flash flotation stage was conducted on the crushed ore producing flash rougher concentrates. The flash rougher tailings were ground and a rougher concentrate produced.
-
F02 applied a traditional flowsheet where the crushed ore was ground in its entirety and rougher concentrates were collected.
Results were promising even with the low-grade sample, with 92.4% and 92.3% graphitic carbon recovery in F01 and F02, respectively. In particular, the F01 first flash concentrate gave a very high grade of 70.3% C(t) at 57.3% recovery of graphitic carbon. The benefits of the MF2 flowsheet are a reduction in required grinding power as well as the potential for preservation of coarse-flake graphite by not grinding the entire sample.
The next step will be to optimize the MF2 flowsheet using the Core Composite. The Company and SGS aim to complete the Bulk Sample Analysis within the next six weeks followed by extensive lab testing of Asbury concentrate for a variety of industry verticals.
"We are very excited about the phase 1 results of our Bulk Sample Program currently underway with SGS. These results, along with the ongoing geotechnical work on Asbury will continue to confirm what we firmly believe: Asbury is a large, high-quality deposit with the ability to provide premium graphite concentrate for use in a significant number of high margin applications, including the battery anode space." declared Ellerton Castor, CEO of Canada Carbon.
Asbury Project OverviewThe 100%-owned Asbury Graphite Project is a past producing property made up of 25 claims with a total surface area of 1,384.59 ha. It is located 8.1 km northeast of Notre-Dame-Du-Laus in the Laurentides Region of southern Quebec. The property is accessible via gravel roads from Provincial Road 309 and Chemin du Ruisseau Serpent in the Notre-Dame-du-Laus area. A power transmission line runs through the property. Mont-Laurier, located approximately 44 km north, provides all amenities needed to perform basic mineral exploration, such as a hospital, accommodations, restaurants, groceries and other primary services. Additional amenities for exploration, and a seasoned mining and exploration workforce, are available from nearby towns of Gatineau to the south.
CANADA CARBON INC.“Ellerton Castor”Chief Executive Officer and DirectorContact InformationE-mail inquiries: info@canadacarbon.com P: (905) 407-1212
FORWARD LOOKING INFORMATION
This press release contains statements that constitute “forward-looking information” (“forward-looking information”) within the meaning of the applicable Canadian securities legislation. All statements, other than statements of historical fact, are forward-looking information and are based on expectations, estimates and projections as at the date of this press release. Any statement that discusses predictions, expectations, beliefs, plans, projections, objectives, assumptions, future events or performance (often but not always using phrases such as “expects”, or “does not expect”, “is expected”, “anticipates” or “does not anticipate”, “plans”, “budget”, “scheduled”, “forecasts”, “estimates”, “believes” or “intends” or variations of such words and phrases or stating that certain actions, events or results “may” or “could”, “would”, “might” or “will” be taken to occur or be achieved) are not statements of historical fact and may be forward-looking information. Forward-looking information in this press release includes statements regarding the development of the Company’s Asbury deposit and financing thereof, the entering of the joint venture with Irondequoit Offering, future production from the Company’s Asbury deposit, sales agreements and other matters related thereto. In disclosing the forward-looking information contained in this press release, the Company has made certain assumptions. Although the Company believes that the expectations reflected in such forward-looking information are reasonable, it can give no assurance that the expectations of any forward-looking information will prove to be correct. Known and unknown risks, uncertainties, and other factors which may cause the actual results and future events to differ materially from those expressed or implied by such forward-looking information. Such factors include but are not limited to: compliance with extensive government regulations; financial abilities; the ability to develop the Asbury deposit; domestic and foreign laws and regulations adversely affecting the Company’s business and results of operations; the impact of COVID-19; and general business, economic, competitive, political, and social uncertainties. Accordingly, readers should not place undue reliance on the forward-looking information contained in this press release. Except as required by law, the Company disclaims any intention and assumes no obligation to update or revise any forward-looking information to reflect actual results, whether as a result of new information, future events, changes in assumptions, changes in factors affecting such forward-looking information or otherwise.
Neither TSX Venture Exchange nor its Regulation Services Provider (as that term is defined in the policies of the TSX Venture Exchange) accepts responsibility for the adequacy or accuracy of this release.
The market for FMC Corporation's (NYSE:FMC) stock was strong after it released a healthy earnings report last week. However, we think that shareholders should be cautious as we found some worrying factors underlying the profit.
See our latest analysis for FMC
earnings-and-revenue-historyHow Do Unusual Items Influence Profit?
To properly understand FMC's profit results, we need to consider the US$182m expense attributed to unusual items. While deductions due to unusual items are disappointing in the first instance, there is a silver lining. We looked at thousands of listed companies and found that unusual items are very often one-off in nature. And, after all, that's exactly what the accounting terminology implies. If FMC doesn't see those unusual expenses repeat, then all else being equal we'd expect its profit to increase over the coming year.
That might leave you wondering what analysts are forecasting in terms of future profitability. Luckily, you can click here to see an interactive graph depicting future profitability, based on their estimates.
An Unusual Tax Situation
Having already discussed the impact of the unusual items, we should also note that FMC received a tax benefit of US$1.5b. It's always a bit noteworthy when a company is paid by the tax man, rather than paying the tax man. The receipt of a tax benefit is obviously a good thing, on its own. However, the devil in the detail is that these kind of benefits only impact in the year they are booked, and are often one-off in nature. Assuming the tax benefit is not repeated every year, we could see its profitability drop noticeably, all else being equal. So while we think it's great to receive a tax benefit, it does tend to imply an increased risk that the statutory profit overstates the sustainable earnings power of the business.
Our Take On FMC's Profit Performance
In the last year FMC received a tax benefit, which boosted its profit in a way that might not be much more sustainable than turning prime farmland into gas fields. Having said that, it also had a unusual item reducing its profit. Based on these factors, we think it's very unlikely that FMC's statutory profits make it seem much weaker than it is. In light of this, if you'd like to do more analysis on the company, it's vital to be informed of the risks involved. Every company has risks, and we've spotted 3 warning signs for FMC (of which 2 shouldn't be ignored!) you should know about.
In this article we've looked at a number of factors that can impair the utility of profit numbers, as a guide to a business. But there are plenty of other ways to inform your opinion of a company. For example, many people consider a high return on equity as an indication of favorable business economics, while others like to 'follow the money' and search out stocks that insiders are buying. While it might take a little research on your behalf, you may find this free collection of companies boasting high return on equity, or this list of stocks with significant insider holdings to be useful.
Have feedback on this article? Concerned about the content? Get in touch with us directly. Alternatively, email editorial-team (at) simplywallst.com.This article by Simply Wall St is general in nature. We provide commentary based on historical data and analyst forecasts only using an unbiased methodology and our articles are not intended to be financial advice. It does not constitute a recommendation to buy or sell any stock, and does not take account of your objectives, or your financial situation. We aim to bring you long-term focused analysis driven by fundamental data. Note that our analysis may not factor in the latest price-sensitive company announcements or qualitative material. Simply Wall St has no position in any stocks mentioned.
FMC Corporation's (NYSE:FMC) investors are due to receive a payment of $0.58 per share on 17th of October. Based on this payment, the dividend yield on the company's stock will be 4.1%, which is an attractive boost to shareholder returns.
See our latest analysis for FMC
FMC's Earnings Easily Cover The Distributions
Impressive dividend yields are good, but this doesn't matter much if the payments can't be sustained. Before making this announcement, FMC was paying a whopping 139% as a dividend, but this only made up 24% of its overall earnings. A cash payout ratio this high could put the dividend under pressure and force the company to reduce it in the future if it were to run into tough times.
Over the next year, EPS is forecast to fall by 45.0%. If the dividend continues along recent trends, we estimate the payout ratio could be 50%, which we consider to be quite comfortable, with most of the company's earnings left over to grow the business in the future.
historic-dividendFMC Has A Solid Track Record
Even over a long history of paying dividends, the company's distributions have been remarkably stable. The annual payment during the last 10 years was $0.54 in 2014, and the most recent fiscal year payment was $2.32. This works out to be a compound annual growth rate (CAGR) of approximately 16% a year over that time. So, dividends have been growing pretty quickly, and even more impressively, they haven't experienced any notable falls during this period.
The Dividend Looks Likely To Grow
Investors who have held shares in the company for the past few years will be happy with the dividend income they have received. We are encouraged to see that FMC has grown earnings per share at 21% per year over the past five years. Earnings per share is growing at a solid clip, and the payout ratio is low which we think is an ideal combination in a dividend stock as the company can quite easily raise the dividend in the future.
Our Thoughts On FMC's Dividend
In summary, while it's good to see that the dividend hasn't been cut, we are a bit cautious about FMC's payments, as there could be some issues with sustaining them into the future. While FMC is earning enough to cover the payments, the cash flows are lacking. Overall, we don't think this company has the makings of a good income stock.
Companies possessing a stable dividend policy will likely enjoy greater investor interest than those suffering from a more inconsistent approach. Meanwhile, despite the importance of dividend payments, they are not the only factors our readers should know when assessing a company. To that end, FMC has 4 warning signs (and 2 which are potentially serious) we think you should know about. Looking for more high-yielding dividend ideas? Try our collection of strong dividend payers.
Have feedback on this article? Concerned about the content? Get in touch with us directly. Alternatively, email editorial-team (at) simplywallst.com.This article by Simply Wall St is general in nature. We provide commentary based on historical data and analyst forecasts only using an unbiased methodology and our articles are not intended to be financial advice. It does not constitute a recommendation to buy or sell any stock, and does not take account of your objectives, or your financial situation. We aim to bring you long-term focused analysis driven by fundamental data. Note that our analysis may not factor in the latest price-sensitive company announcements or qualitative material. Simply Wall St has no position in any stocks mentioned.
Have feedback on this article? Concerned about the content? Get in touch with us directly. Alternatively, email editorial-team@simplywallst.com
FMC (FMC) is expected to deliver a year-over-year decline in earnings on lower revenues when it reports results for the quarter ended June 2024. This widely-known consensus outlook gives a good sense of the company's earnings picture, but how the actual results compare to these estimates is a powerful factor that could impact its near-term stock price.
The earnings report, which is expected to be released on July 31, 2024, might help the stock move higher if these key numbers are better than expectations. On the other hand, if they miss, the stock may move lower.
While management's discussion of business conditions on the earnings call will mostly determine the sustainability of the immediate price change and future earnings expectations, it's worth having a handicapping insight into the odds of a positive EPS surprise.
Zacks Consensus Estimate
This chemical producer is expected to post quarterly earnings of $0.49 per share in its upcoming report, which represents a year-over-year change of -2%.
Revenues are expected to be $1 billion, down 1.3% from the year-ago quarter.
Estimate Revisions Trend
The consensus EPS estimate for the quarter has remained unchanged over the last 30 days. This is essentially a reflection of how the covering analysts have collectively reassessed their initial estimates over this period.
Investors should keep in mind that the direction of estimate revisions by each of the covering analysts may not always get reflected in the aggregate change.
Earnings Whisper
Estimate revisions ahead of a company's earnings release offer clues to the business conditions for the period whose results are coming out. Our proprietary surprise prediction model — the Zacks Earnings ESP (Expected Surprise Prediction) — has this insight at its core.
The Zacks Earnings ESP compares the Most Accurate Estimate to the Zacks Consensus Estimate for the quarter; the Most Accurate Estimate is a more recent version of the Zacks Consensus EPS estimate. The idea here is that analysts revising their estimates right before an earnings release have the latest information, which could potentially be more accurate than what they and others contributing to the consensus had predicted earlier.
Thus, a positive or negative Earnings ESP reading theoretically indicates the likely deviation of the actual earnings from the consensus estimate. However, the model's predictive power is significant for positive ESP readings only.
A positive Earnings ESP is a strong predictor of an earnings beat, particularly when combined with a Zacks Rank #1 (Strong Buy), 2 (Buy) or 3 (Hold). Our research shows that stocks with this combination produce a positive surprise nearly 70% of the time, and a solid Zacks Rank actually increases the predictive power of Earnings ESP.
Please note that a negative Earnings ESP reading is not indicative of an earnings miss. Our research shows that it is difficult to predict an earnings beat with any degree of confidence for stocks with negative Earnings ESP readings and/or Zacks Rank of 4 (Sell) or 5 (Strong Sell).
How Have the Numbers Shaped Up for FMC?
For FMC, the Most Accurate Estimate is higher than the Zacks Consensus Estimate, suggesting that analysts have recently become bullish on the company's earnings prospects. This has resulted in an Earnings ESP of +9.76%.
On the other hand, the stock currently carries a Zacks Rank of #4.
So, this combination makes it difficult to conclusively predict that FMC will beat the consensus EPS estimate.
Does Earnings Surprise History Hold Any Clue?
While calculating estimates for a company's future earnings, analysts often consider to what extent it has been able to match past consensus estimates. So, it's worth taking a look at the surprise history for gauging its influence on the upcoming number.
For the last reported quarter, it was expected that FMC would post earnings of $0.35 per share when it actually produced earnings of $0.36, delivering a surprise of +2.86%.
Over the last four quarters, the company has beaten consensus EPS estimates just once.
Bottom Line
An earnings beat or miss may not be the sole basis for a stock moving higher or lower. Many stocks end up losing ground despite an earnings beat due to other factors that disappoint investors. Similarly, unforeseen catalysts help a number of stocks gain despite an earnings miss.
That said, betting on stocks that are expected to beat earnings expectations does increase the odds of success. This is why it's worth checking a company's Earnings ESP and Zacks Rank ahead of its quarterly release. Make sure to utilize our Earnings ESP Filter to uncover the best stocks to buy or sell before they've reported.
FMC doesn't appear a compelling earnings-beat candidate. However, investors should pay attention to other factors too for betting on this stock or staying away from it ahead of its earnings release.
Stay on top of upcoming earnings announcements with the Zacks Earnings Calendar.
Want the latest recommendations from Zacks Investment Research? Today, you can download 7 Best Stocks for the Next 30 Days. Click to get this free report
FMC Corporation (FMC) : Free Stock Analysis Report
To read this article on Zacks.com click here.
Toronto, Ontario–(Newsfile Corp. – July 23, 2024) – Minnova Corp. (TSXV: MCI) (OTC Pink: AGRDF) ("Minnova" or the "Company"), announces that the Company applied to the Ontario Securities Commission (the "OSC") for a management cease trade order ("MCTO") with respect to its audited consolidated financial statements for the year ended March 31, 2024, the annual management's discussion and analysis for the same period and management certifications of the annual filings (collectively, the "Annual Filings"). The MCTO was denied. As a result, the Company anticipates that the Annual Filings will not be filed by the prescribed deadline of July 29, 2024, and the Company anticipates that on or about July 29, 2024, the OSC will issue a failure to file cease trade order against the Company ("CTO") which orders that general trading, whether direct or indirect, of the securities of the Company cease.
Despite the CTO, a beneficial holder of a security of the Company who is not, and was not as of the date of the CTO, an insider or control person of the Company may sell securities of the Company acquired before the date of the CTO if: (a) the sale is made through a "foreign organized regulated market", as defined in section 1.1 of the Universal Market Integrity Rules of the Investment Industry Regulatory Organization of Canada; and (b) the sale is made through an investment dealer registered in a jurisdiction of Canada in accordance with applicable securities legislation. Holders of the Company's securities are urged to consult with their own investment advisors or legal counsel about the implications of the CTO.
The Company does not expect an interruption to its project development plans during the CTO. Revocation of the CTO is expected to occur within a few days after the Annual Filings are made.
Until the Company has filed the Annual Filings, members of the Company's management and other insiders are subject to an insider trading black-out. The Company confirms that, other than as disclosed in prior press releases and material change reports, there have been no material business developments since the filing of the Company's latest interim financial report.
About Minnova Corp.
Minnova Corp. is an evolving cleantech company building a worldwide pipeline of green energy projects. Our subsidiary, Minnova Renewable Energy, is focused on innovative carbon reduction technologies such as biomass gasification technology. Separately the company is advancing large scale green hydrogen production via electrolysis at its Flin Flon Clean Energy Hub initiative.
Prior to 2021 Minnova Corp. has focused on the restart of its PL Gold Mine, which included completion of a Positive Feasibility Study in 2018. The study concluded the restart of the PL Mine, at an average annual production rate of 46,493 ounces over a minimum 5-year mine life, was economically robust. Importantly the global resource remains open to expansion, as does the reserve. The PL Gold Mine benefits from a short pre-production timeline forecast at 15 months, a valid underground mining permit (Environment Act 1207E), an existing 1,000 tpd processing plant, over 7,000 meters of developed underground ramp to -135 metres depth. The project is fully road accessible and close to existing mining infrastructure in the prolific Flin Flon Greenstone Belt of Central Manitoba.
For more information please contact:
Minnova Corp.Gorden GlennPresident & Chief Executive Officer
For further information, please contact Investor Relations at 647-985-2785 or info@minnovacorp.ca
Visit our website at www.minnovacorp.ca
Forward-Looking Statements
This news release contains "forward-looking information" within the meaning of applicable Canadian securities legislation. Forward-looking information includes, but is not limited to, information regarding the Company including management's assessment of future plans and operations, that may involve risks associated with mining exploration and development, volatility of prices, currency fluctuations, imprecision of resource estimates, environmental and permitting risks, access to labour and services, competition from other companies and ability to access sufficient capital. As a consequence, actual results may differ materially from those anticipated in the forward-looking statements. A feasibility study has been completed on the PL Gold Mine development project but there is no certainty the disclosed targets will be achieved nor that the proposed operations will be economically viable. Minnova has attempted to identify important factors that could cause actual results to differ materially from those contained in forward-looking information. Forward-looking information is provided for the purpose of providing information about management's expectations and plans relating to the future. The Company disclaims any intention or obligation to update or revise any forward-looking information or to explain any material difference between subsequent actual events and such forward-looking information, except to the extent required by applicable law. There may be other factors that cause results not to be as anticipated, estimated or intended. There can be no assurance that such information will prove to be accurate, as actual results and future events could differ materially from those anticipated in such information. Accordingly, readers should not place undue reliance on forward-looking information. Minnova does not undertake to update any forward-looking information, except in accordance with applicable securities laws.
Trading in the securities of the Company should be considered highly speculative. No stock exchange, securities commission or other regulatory authority has approved or disapproved the information contained herein. Neither the TSX Venture Exchange nor its Regulation Services Provider (as that term is defined in the policies of the TSX Venture Exchange) accepts responsibility for the adequacy or accuracy of this release.
To view the source version of this press release, please visit https://www.newsfilecorp.com/release/217431
PHILADELPHIA, July 15, 2024 /PRNewswire/ —
FMC Corporation (NYSE: FMC), a leading global agricultural sciences company, today announced the election of John M. Raines to the company's Board of Directors, effective July 15, 2024. Raines will serve on the Audit and Sustainability Committees.
With a distinguished career in agriculture and consumer goods spanning over three decades, Raines brings a wealth of global experience, having led major agriculture and food businesses across all four regions of the world. Most recently, Raines served as president of Digital Agriculture and Consumer Goods at TELUS Corporation, a global technology leader, from 2021 to 2024. In this role, he harnessed digital technology to enable data-driven decision making across various sectors. Prior to TELUS, Raines held leadership positions at The Climate Corporation and Monsanto Company. He is currently the president of Paris Bancshares, Inc. and serves as a member of the Board of Directors for both TPNB Bank and Sydenstricker Nobbe Partners.
"We are pleased to welcome John to the FMC Board of Directors," said Pierre Brondeau, FMC chairman and chief executive officer. "He brings extensive knowledge and experience as a global executive of major agriculture and food businesses. His oversight of M&A transactions and implementation of modern technology into the agriculture sector positions him to deliver substantial contributions to the board. We look forward to his engagement and insight."
Raines commented, "I am honored to be appointed to the FMC Board. FMC has a reputation as a pioneer in crop protection and I am eager to collaborate with the board and management team to foster growth and enhance long-term shareholder value."
About FMC
FMC Corporation is a global agricultural sciences company dedicated to helping growers produce food, feed, fiber and fuel for an expanding world population while adapting to a changing environment. FMC's innovative crop protection solutions – including biologicals, crop nutrition, digital and precision agriculture – enable growers, crop advisers and turf and pest management professionals to address their toughest challenges economically while protecting the environment. With approximately 6,200 employees at more than 100 sites worldwide, FMC is committed to discovering new herbicide, insecticide and fungicide active ingredients, product formulations and pioneering technologies that are consistently better for the planet. Visit fmc.com to learn more and follow us on LinkedIn®.
Cision
View original content to download multimedia:https://www.prnewswire.com/news-releases/fmc-corporation-board-elects-john-m-raines-to-board-of-directors-302197294.html
SOURCE FMC Corporation
DENVER, CO / ACCESSWIRE / July 15, 2024 / Solitario Resources Corp. ("Solitario") (NYSE American:XPL)(TSX:SLR) is pleased to announce core drilling has begun on its 100%-owned Golden Crest gold project in South Dakota. Phase-One of the 2024 drilling program consists of drilling approximately 10-12 holes totaling 5,000 meters. The first area to be drill tested is the high-grade Downpour Zone where trenching and surface rock sampling has revealed high-grade gold at surface (Trench and Surface Sample Assay Maps). Assay highlights of the trenching program are as follows:
|
Trench Number |
Length |
Avg. Gold Grade |
|
(meters) |
(grams/tonne) |
|
|
Tr-1 |
36 |
17.60 |
|
Tr-2 |
60 |
8.55 |
|
Tr-3 |
12 |
0.56 |
|
Tr-4 |
15 |
2.18 |
|
Tr-5 |
15.6 |
17.1 |
Downpour Trenching Results (Previously Released)
In addition to the high-grade trenching results, surface grab sampling of the area surrounding the trenches revealed significant gold values over a corridor of approximately 800 meters long and up to 500 meters wide. Within this zone, 37 select surface grab samples were collected and displayed the following gold-grade distributions (previously released results):
-
7 samples above 10 gpt gold
-
16 samples above 3 gpt gold
-
25 samples above 1 gpt gold
Chris Herald, President and CEO of Solitario, stated: "With the drill now turning, we are beginning a new phase in the exploration of our Golden Crest project. It is remarkable that such a large well-endowed gold region has never been drill tested, especially one that is situated so close to one of America's largest historic gold districts, the Homestake-Wharf mining complex. We are excited to begin drilling at Golden Crest and look forward to reporting our progress and results."
Sampling Methodology, Chain of Custody, Quality Control and Assurance
The collection of all trench and surface rock samples was supervised by project geologists, including chain of custody. Rock samples were reconnaissance select grab samples that display alteration, usually silicification and hydrothermal brecciation. These samples were derived mainly from residually weathered rock fragments, sub-crop, and less commonly, outcrop. The significance of these samples is limited to determining whether gold, or trace elements usually associated with gold, are present within rocks affected by hydrothermal alteration fluids. Assay results may not be representative of, nor verify economically mineable mineralization. Samples were analyzed by ALS Laboratories in Reno, NV, a laboratory accredited in accordance with the standards of ISO 17025:2017. The samples were crushed and pulverized, and sample pulps were analyzed using industry standard fire assay methods. A certified reference sample or duplicate was inserted at least every 20th sample.
Sandor Ringhoffer, CPG, SME RM, is a geologic consultant of Solitario and a qualified person as defined by NI 43-101, Standards of Disclosure for Mineral Projects, responsible for approving the scientific and technical information contained in this news release.
About Solitario
Solitario is a natural resource exploration company focused on high-quality Tier-1 gold and zinc exploration projects. Solitario's 100%-owned Golden Crest properties in South Dakota constitute strategic land holdings along the western and southwestern extensions of the Homestake-Wharf mining district that has produced approximately 52 million ounces of gold and is reported to contain another 30 million ounces in historical resources (not SK-1300 or NI-4301 compliant). The project area is located in a safe jurisdiction with highly developed infrastructure, an unbroken 150-year record of continuous gold mining, a skilled mining workforce, and a history of high-grade, underground mineable gold deposits.
The Company is traded on the NYSE American ("XPL") and on the Toronto Stock Exchange ("SLR"). In addition to its South Dakota property holdings, Solitario holds a 50% joint venture interest (Teck Resources 50%) in the high-grade Lik zinc deposit in Alaska and a 39% joint venture interest (Nexa Resources 61%) on the high-grade Florida Canyon zinc project in Peru. At Florida Canyon, Solitario is carried to production through its joint venture arrangement with Nexa. Solitario's Management and Directors hold approximately 9.1% (excluding options) of the Company's 81.4 million shares outstanding. Solitario's cash balance and marketable securities stand at approximately US$9.3 million. Additional information about Solitario is available online at www.solitarioresources.com.
Solitario has a long history of committed Environmental, Social and Responsible Governance ("ESG") of its business. We realize ESG issues are also important to investors, employees, and all stakeholders, including communities in which we work. We are committed to conducting our business in a manner that supports positive environmental and social initiatives and responsible corporate governance. Importantly, we work with joint venture partners that not only value the importance of ESG issues in the conduct of their business on our joint venture projects but are leaders in the industry in this important segment of our business.
For More Information Please Contact:
Chris Herald, President and CEOSolitario Resources Corp.Tel. 303-534-1030 ext. 1
Cautionary Statement Regarding Forward Looking Information
This press release contains forward-looking statements within the meaning of the U.S. Securities Act of 1933 and the U.S. Securities Exchange Act of 1934, and as defined in the United States Private Securities Litigation Reform Act of 1995 (and the equivalent under Canadian securities laws), that are intended to be covered by the safe harbor created by such sections. Forward-looking statements are statements that are not historical facts. They are based on the beliefs, estimates and opinions of the Company's management on the date the statements are made and address activities, events or developments that Solitario expects or anticipates will or may occur in the future, and are based on current expectations and assumptions. Forward-looking statements involve numerous risks and uncertainties. Consequently, there can be no assurances that such statements will prove to be accurate and actual results and future events could differ materially from those anticipated in such statements. Solitario's Golden Crest land position does not cover any of the areas of historical gold production or historical unmined resources. Certain historical information concerning exploration and gold production in the Black Hills region has been obtained through both public and private sources and are believed to be substantially factual, but Solitario can give no assurances of the accuracy of such information. The existence of historic mines and resources adjacent to Solitario's land position do not necessarily support the existence of economic mineral deposits on Solitario's land position. Such forward-looking statements include, without limitation, statements regarding the Company's expectation of the projected timing and outcome of engineering studies; expectations regarding the receipt of all necessary permits and approvals to implement a mining plan, if any, at any of its mineral properties. Important factors that could cause actual results to differ materially from those in the forward-looking statements include, among others, risks relating to risks that Solitario's and its joint venture partners' exploration and property advancement efforts will not be successful; risks relating to fluctuations in the price of zinc, gold, lead and silver; the inherently hazardous nature of mining-related activities; uncertainties concerning reserve and resource estimates; availability of outside contractors, and other activities; uncertainties relating to obtaining approvals and permits from governmental regulatory authorities; the possibility that environmental laws and regulations will change over time and become even more restrictive; and availability and timing of capital for financing the Company's exploration and development activities, including uncertainty of being able to raise capital on favorable terms or at all; risks relating to the impacts of pandemics or similar epidemics; as well as those factors discussed in Solitario's filings with the U.S. Securities and Exchange Commission (the "SEC") including Solitario's latest Annual Report on Form 10-K and its other SEC filings (and Canadian filings) including, without limitation, its latest Quarterly Report on Form 10-Q. The Company does not intend to publicly update any forward-looking statements, whether as a result of new information, future events, or otherwise, except as may be required under applicable securities laws.
SOURCE: Solitario Resources Corp.
View the original press release on accesswire.com
OTTAWA, ON, July 9, 2024 /CNW/ – Northern Shield Resources Inc. ("Northern Shield" or the "Company") (TSXV: NRN) is pleased to announce that the Company has received certain refunds pertaining to its 2017 and 2018 Quebec Tax Return and Mining Tax Return. The total amount returned to the Company to date, including interest, amounts to $702,781. A further refund of approximately $70,000 is expected very shortly.
In 2023, the Court of Quebec ruled in the Company's favour in a case the Company initiated against the Quebec Revenue Agency with the practical consequence of the judgement being that Northern Shield's right to object to the notices of assessment in dispute had been restored. Northern Shield filed a Notice of Objection immediately after that ruling and the refund announced today is the result of the objection process running through to fruition.
A denial of tax credits had also previously been placed on the Company's 2016 Quebec Tax Return and Mining Tax Return which was eventually settled by Revenue Quebec in the Company's favour in 2021 after Northern Shield filed a Notice of Objection and subsequently commenced a judicial litigation case.
"This has been an exercise in patience and persistence. Although one does not embark on such a course without confidence of success, the six-year time frame to recover the monies rightfully owed to the Company, has tested all our patience. But persistence has paid off and we look forward to focussing on advancing our exploration projects."
–Ian Bliss President/CEO, Northern Shield
Northern Shield Resources
Northern Shield Resources Inc. is a Canadian-based company known as a leader in generating high-quality exploration targets that views greenfield exploration as an opportunity, an opportunity to find a Tier 1 asset, near surface, and at relatively low cost. We implement a model driven approach in exploration to reduce any risk associated with early-stage projects for ourselves, our shareholders, and the environment. This approach is what led us to firstly option the Root & Cellar Property from a Newfoundland based prospector, who found and exposed the mineralization, and then its advancement as a large alkaline-related gold-silver-tellurium and porphyry copper system.
Forward-Looking Statements Advisory
Neither TSX Venture Exchange nor its Regulation Services Provider (as that term is defined in policies of the TSX Venture Exchange) accepts responsibility for the adequacy or accuracy of this release.
SOURCE Northern Shield Resources Inc.
Cision
View original content: http://www.newswire.ca/en/releases/archive/July2024/09/c1685.html
VANCOUVER, BC / ACCESSWIRE / July 8, 2024 / Commerce Resources Corp. (TSXv:CCE)(FSE:D7H0)(OTCQX:CMRZF) (the "Company" or "Commerce") announces that is has filed on SEDAR+ a technical report prepared in accordance with National Instrument 43-101 – Standards of Disclosure for Mineral Projects ("NI 43-101") titled "Mineral Resource Estimate for the Ashram Rare Earth Element and Fluorspar Deposit, Nunavik, Québec, Canada". This filing follows the May 22, 2024 announcement of an updated mineral resource estimate for the Ashram Rare Earth Element and Fluorspar Deposit (the "Ashram Deposit" or "Ashram") with 73.2 Mt at 1.89% TREOǂand 6.6% CaF2 indicated, and 131.1 Mt at 1.91% TREO and 4.0% CaF2 inferred1.
The technical Report has been prepared by BBA Inc., with contributions from PLR Resources, DRA Global Limited and L3 Process Development, all consulting groups independent of the Company, in accordance with NI 43-101. The report is available on SEDAR+ and will shortly be available on the Company's website.
ǂ TREO = sum of all lanthanide oxides + yttrium oxide1 Ashram mineral resource estimate is reported at a cut-off of CAD 287 Net Metal Return (NMR) per tonne with an effective date of April 4, 2024. Mineral resources are not mineral reserves as they do not have demonstrated economic viability.
NI 43-101 DisclosurePatrik T. Schmidt, M.Sc., P.Geo., Dahrouge Geological Consulting Ltd., a Permit holder with the Ordre des Géologues du Québec and Qualified Person as defined by National Instrument 43-101, supervised the preparation of the technical information in this news release.
About the Ashram DepositThe Ashram Deposit is central to the Eldor Carbonatite Complex and bordered by an earlier staged calcio-carbonatite and various altered (fenitized) wallrock units. In contrast to its host rocks, the Ashram Deposit appears as a magnetic low and gravity high. Currently, the deposit geometry and geology can best be described as a moderate to steeply NE dipping ovoid, with simple rare earth mineralogy (monazite, bastnaesite, xenotime) that has an unusual enrichment in magnet feed elements (i.e. higher Nd+Pr Oxide/TREO). The Ashram Deposit is a single mineralized body outcropping at surface and has a drill delineated footprint of over 700 m along strike, 300 m across, and 600 m deep, and remains open at depth.
About Commerce Resources Corp.Commerce Resources Corp. is a junior mineral resource company focused on the development of the Ashram Rare Earth and Fluorspar Deposit located within their Eldor Property, in northern Quebec, Canada. The Ashram Deposit is characterized by simple rare earth (monazite, bastnaesite, xenotime) and gangue (carbonates) mineralogy, a large tonnage resource at favourable grade, and has demonstrated the production of high-grade (more than 30 – 45% TREO) mineral concentrates at high recovery (more than 60 – 75%) in line with active global producers. The Ashram Deposit also has a fluorspar component which makes it one of the largest potential sources of fluorspar in the world and could be a long-term supplier to the met-spar and acid-spar markets. The Company is positioning to be one of the lowest cost rare earth producers globally, with a specific focus on being a long-term supplier of mixed rare earth carbonate and/or NdPr oxide to the global market. Additionally, Commerce is committed to exploring the potential of other high-value commodities on the Property such as niobium and phosphate minerals, which may help advance Ashram by reducing costs through shared development.
For more information, please visit the corporate website at www.commerceresources.com or email info@commerceresources.com.
On Behalf of the Board of DirectorsCOMMERCE RESOURCES CORP."Chris Grove"Chris GroveCEO and PresidentTel: 604.484.2700Email: cgrove@commerceresources.comWeb: http://www.commerceresources.com
Neither TSX Venture Exchange nor its Regulation Services Provider (as that term is defined in policies of the TSX Venture Exchange) accepts responsibility for the adequacy or accuracy of this release.
Forward Looking Statements This news release contains forward-looking statements, which includes any information about activities, events or developments that the Company believes, expects or anticipates will or may occur in the future. Forward looking statements in this news release include that Ashram has the potential to become one of the largest fluorspar sources in the world and a long-term supplier to the met-spar and acid-spar markets; that the Company is positioning to be one of the lowest cost rare earth element producers globally, with a focus on being a long-term global supplier of mixed rare earth carbonate and/or NdPr oxide; and that the Company may explore the potential of other high-value commodities on the Eldor property. These forward-looking statements are subject to a variety of risks and uncertainties and other factors that could cause actual events or results to differ materially from those projected in the forward-looking information. Risks that could change or prevent these events, activities or developments from coming to fruition include: that the Company may not be able to fully finance any additional exploration on the Ashram Project; that even if the Company is able raise capital, costs for exploration activities may increase such that the Company may not have sufficient funds to pay for such exploration or processing activities; the timing and content of the proposed drill program and any future work programs may not be completed as proposed or at all; geological interpretations based on drilling that may change with more detailed information; potential process methods and mineral recoveries assumptions based on limited test work and by comparison to what are considered analogous deposits that, with further test work, may not be comparable; testing of our process may not prove successful or samples derived from the Ashram Project may not yield positive results, and even if such tests are successful or initial sample results are positive, the economic and other outcomes may not be as expected; the anticipated market demand for rare earth elements and other minerals may not be as expected; the availability of labour and equipment to undertake future exploration work and testing activities; that mineral resource estimates may not be indicative of actual deposits; geopolitical risks which may result in market and economic instability; and despite the current expected viability of the Ashram Project, conditions changing such that even if metals or minerals are discovered on the Ashram Project, the project may not be commercially viable. The forward-looking statements contained in this news release are made as of the date hereof and the Company assumes no responsibility to update or revise such information to reflect new events or circumstances, except as required by law.
SOURCE: Commerce Resources Corp.
View the original press release on accesswire.com
Announces the Exercise of Additional Share Purchase Warrants and the Closing of a Private Placement
ESTES PARK, CO / ACCESSWIRE / July 8, 2024 / Taranis Resources Inc. ("Taranis" or the "Company") (TSX.V:TRO)(OTCQB:TNREF) is providing an update on its 2024 exploration program at Thor.
Taranis has initiated its deep drilling program at Thor that is targeting magnetotelluric and magnetic targets identified in an airborne survey completed in 2022. The initial focus area is a series of deep anomalies below the Broadview Mine area of the Thor epithermal deposit.
Exercise of Additional Warrants
Pursuant to Taranis announcing the exercise of warrants in its May 2, 2024 and May 9, 2024 News Releases, Taranis is pleased to announce the exercise of a third tranche of warrants in the amount of $100,000 that will be used for ongoing exploration activities at Thor. Taranis has now received a total of $600,000 pursuant to the exercise of 3,000,000 share purchase warrants, all at a price of $0.20 per share.
Closing of Private Placements
Taranis also announces the closing of the following private placements, each as announced on May 2, 2024:
|
(a) |
1,353,888 non-flow-through units (the "NFT Units") at a price of $0.27 per NFT Unit, for gross proceeds of $365,500; and |
|
|
(b) |
20,000 flow-through units (the "FT Units") at a price of $0.30 per FT Unit, for gross proceeds of $6,000. |
(Taranis also received subscriptions for $200,000 for additional FT Units. These subscriptions are subject to the subscribers obtaining a waiver of certain Exchange Policies, and, if those waivers are granted, also subject to Taranis receiving disinterested shareholder approval for these subscriptions at its next Annual General Meeting, to be held in September 2024. Further information in this regard will be disseminated when it is available.)
Each NFT Unit consisted of one common share and one share purchase warrant (a "NFT Warrant"), with each NFT Warrant entitling the holder to purchase one additional common share at a price of $0.35 until July 3, 2026. Each FT Unit consisted of one flow-through common share and one share purchase warrant (a "FT Warrant"). Each FT Warrant entitles the holder to purchase one additional common share at a price of $0.35 until July 3, 2026.
All of the securities issued pursuant to these private placements, including any shares that may be issued pursuant to the exercise of either the NFT Warrants or the FT Warrants, are subject to a hold period in Canada until November 4, 2024.
About Taranis and Thor
Taranis Resources is a Canadian mineral exploration company. The Thor Project is located in southeast British Columbia and is comprised of 3,807 hectares of Mineral Tenures and 27 Crown Grant titles to precious and base minerals, many of which include surface rights. Taranis has completed upwards of 250 drill holes, linking all previously known mines into a single, near-surface epithermal deposit that has been recently updated into an NI 43-101 Mineral Resource Estimate (see Taranis News Release dated April 11, 2024).
Qualified Person
Exploration activities at Thor were overseen by John Gardiner (P. Geo.), who is a Qualified Person under the meaning of Canadian National Instrument 43-101. John Gardiner is a principal of John J. Gardiner & Associates, LLC which operates in British Columbia under Firm Permit Number 1002256. Mr. Gardiner has reviewed and approved the comments contained within this News Release.
For additional information on Taranis or its 100%-owned Thor project in British Columbia, visit www.taranisresources.com
Taranis currently has 98,960,915 shares issued and outstanding (112,009,803 shares on a fully-diluted basis).
TARANIS RESOURCES INC.
|
Per: |
John J. Gardiner (P. Geo.), |
|
|
President and CEO |
For further information contact:
John J. Gardiner681 Conifer LaneEstes Park, Colorado 80517Phone: (303) 716-5922 Cell: (720) 209-3049johnjgardiner@earthlink.net
The securities referred to in this news release have not been, nor will they be, registered under the United States Securities Act of 1933, as amended, and may not be offered or sold within the United States or to, or for the account or benefit of, U.S. persons absent U.S. registration or an applicable exemption from the U.S. registration requirements. This news release does not constitute an offer for the sale of securities, nor a solicitation for offers to buy any securities. Any public offering of securities in the United States must be made by means of a prospectus containing detailed information about the company and management, as well as financial statements.
NEITHER THE TSX VENTURE EXCHANGE NOR ITS REGULATION SERVICES PROVIDER (AS THAT TERM IS DEFINED IN THE POLICIES OF THE TSX VENTURE EXCHANGE) ACCEPTS RESPONSIBILITY FOR THE ADEQUACY OR ACCURACY OF THIS NEWS RELEASE.
This News Release may contain forward looking statements based on assumptions and judgments of management regarding future events or results that may prove to be inaccurate as a result of factors beyond its control, and actual results may differ materially from expected results.
SOURCE: Taranis Resources, Inc.
View the original press release on accesswire.com
If you would like to receive our free newsletter via email, simply enter your email address below & click subscribe.
 Follow us on Twitter
 Become our facebook fan
CONNECT WITH US
Tweets
Tweet with hash tag #miningfeeds or @miningfeeds and your tweets will be displayed across this site.
MOST ACTIVE MINING STOCKS
Daily Gainers
 Wallbridge Mining Co. Ltd. |
WM.TO | +1,900.00% |
| Galore Resources Inc. |
GRI.V | +100.00% |
| Midlands Minerals Corp. |
MEX.V | +66.88% |
 Redstone Resources Ltd |
RDS.AX | +50.00% |
| GoviEx Uranium Inc. |
GXU.V | +42.86% |
| Mount Burgess Mining NL |
MTB.AX | +33.33% |
| Casa Minerals Inc. |
CASA.V | +30.00% |
| Poseidon Nickel Limited |
POS.AX | +25.00% |
| Azincourt Energy Corp. |
AAZ.V | +20.00% |
| ALX Uranium Corp. |
AL.V | +16.67% |