Insiders who bought Lindian Resources Limited (ASX:LIN) in the last 12 months may probably not pay attention to the stock's recent 13% drop. Reason being, despite the recent loss, insiders original purchase value of AU$135.0k is now worth AU$637.5k.
While we would never suggest that investors should base their decisions solely on what the directors of a company have been doing, we would consider it foolish to ignore insider transactions altogether.
The Last 12 Months Of Insider Transactions At Lindian Resources
The Independent Executive Chairman Robert Martin made the biggest insider purchase in the last 12 months. That single transaction was for AU$90k worth of shares at a price of AU$0.09 each. Even though the purchase was made at a significantly lower price than the recent price (AU$0.42), we still think insider buying is a positive. Because the shares were purchased at a lower price, this particular buy doesn't tell us much about how insiders feel about the current share price.
In the last twelve months Lindian Resources insiders were buying shares, but not selling. The chart below shows insider transactions (by companies and individuals) over the last year. By clicking on the graph below, you can see the precise details of each insider transaction!
View our latest analysis for Lindian Resources
ASX:LIN Insider Trading Volume January 30th 2026
Lindian Resources is not the only stock that insiders are buying. For those who like to find small cap companies at attractive valuations, this free list of growing companies with recent insider purchasing, could be just the ticket.
Insider Ownership Of Lindian Resources
I like to look at how many shares insiders own in a company, to help inform my view of how aligned they are with insiders. A high insider ownership often makes company leadership more mindful of shareholder interests. It appears that Lindian Resources insiders own 16% of the company, worth about AU$111m. This level of insider ownership is good but just short of being particularly stand-out. It certainly does suggest a reasonable degree of alignment.
So What Do The Lindian Resources Insider Transactions Indicate?
It doesn't really mean much that no insider has traded Lindian Resources shares in the last quarter. But insiders have shown more of an appetite for the stock, over the last year. With high insider ownership and encouraging transactions, it seems like Lindian Resources insiders think the business has merit. So while it's helpful to know what insiders are doing in terms of buying or selling, it's also helpful to know the risks that a particular company is facing. In terms of investment risks, we've identified 3 warning signs with Lindian Resources and understanding these should be part of your investment process.
Of course Lindian Resources may not be the best stock to buy. So you may wish to see this free collection of high quality companies.
For the purposes of this article, insiders are those individuals who report their transactions to the relevant regulatory body. We currently account for open market transactions and private dispositions of direct interests only, but not derivative transactions or indirect interests.
Have feedback on this article? Concerned about the content? Get in touch with us directly. Alternatively, email editorial-team (at) simplywallst.com.This article by Simply Wall St is general in nature. We provide commentary based on historical data and analyst forecasts only using an unbiased methodology and our articles are not intended to be financial advice. It does not constitute a recommendation to buy or sell any stock, and does not take account of your objectives, or your financial situation. We aim to bring you long-term focused analysis driven by fundamental data. Note that our analysis may not factor in the latest price-sensitive company announcements or qualitative material. Simply Wall St has no position in any stocks mentioned.
As the Australian market steadies amidst cautious investor sentiment following the U.S. Federal Reserve’s decision to hold rates and a surprise inflation hike, many are keeping a close watch for signals from the Reserve Bank of Australia that could influence future movements. In this environment, identifying promising small-cap stocks like GenusPlus Group can be an attractive strategy for those looking to diversify their portfolios with potential growth opportunities that align with current market dynamics.
Top 10 Undiscovered Gems With Strong Fundamentals In Australia
| Name | Debt To Equity | Revenue Growth | Earnings Growth | Health Rating |
|---|---|---|---|---|
| Fiducian Group | NA | 10.00% | 9.57% | ★★★★★★ |
| Joyce | NA | 9.93% | 17.54% | ★★★★★★ |
| Spheria Emerging Companies | NA | -1.31% | 0.28% | ★★★★★★ |
| Hearts and Minds Investments | NA | 56.27% | 59.19% | ★★★★★★ |
| Euroz Hartleys Group | NA | 1.82% | -25.32% | ★★★★★★ |
| Focus Minerals | NA | 75.35% | 51.34% | ★★★★★★ |
| Energy World | NA | -47.50% | -44.86% | ★★★★★☆ |
| AMCIL | NA | 2.99% | 1.18% | ★★★★★☆ |
| Zimplats Holdings | 5.44% | -9.79% | -42.03% | ★★★★★☆ |
| Australian United Investment | 1.90% | 5.23% | 4.56% | ★★★★☆☆ |
Below we spotlight a couple of our favorites from our exclusive screener.
Simply Wall St Value Rating: ★★★★★★
Overview: GenusPlus Group Ltd focuses on the installation, construction, and maintenance of power and communication systems in Australia, with a market cap of A$1.39 billion.
Operations: GenusPlus Group Ltd generates revenue primarily from three segments: Infrastructure (A$405.10 million), Energy & Engineering (A$224.06 million), and Services (A$122.11 million).
GenusPlus Group is carving its niche in the Australian market with a strategic focus on renewable energy and grid infrastructure, boasting an impressive earnings growth of 83.6% over the past year. The company has reduced its debt to equity ratio from 7% to 6.3% over five years, while maintaining high-quality earnings and positive free cash flow. With analysts projecting a revenue growth of 14.2% annually for the next three years, GenusPlus is poised for expansion into battery energy storage systems and substations, potentially enhancing profit margins despite challenges like acquisition integration and cost pressures.
ASX:GNP Earnings and Revenue Growth as at Jan 2026Lycopodium
Simply Wall St Value Rating: ★★★★★☆
Overview: Lycopodium Limited is an Australian company offering engineering and project delivery services across the resources, rail infrastructure, and industrial processes sectors, with a market cap of A$623.13 million.
Operations: Lycopodium’s primary revenue stream comes from the resources segment, generating A$342.76 million, while its rail infrastructure and process industries segments contribute A$11.03 million and A$10.08 million, respectively.
Lycopodium, a player in the engineering and project management space, is trading at 36.8% below its estimated fair value, suggesting potential undervaluation. Despite a challenging year with earnings growth of -16.8%, it remains free cash flow positive with A$30.77 million as of September 2024, and has more cash than total debt, indicating financial resilience. The company anticipates revenue between A$390 million to A$410 million for fiscal 2026, reflecting optimism about future performance. Recently appointed as lead consultant for ValOre Metals’ Pedra Branca project in Brazil, Lycopodium continues to expand its footprint internationally through strategic partnerships and projects.
- Click here to discover the nuances of Lycopodium with our detailed analytical health report.
-
Explore historical data to track Lycopodium’s performance over time in our Past section.
ASX:LYL Earnings and Revenue Growth as at Jan 2026Tribune Resources
Simply Wall St Value Rating: ★★★★★★
Overview: Tribune Resources Limited, along with its subsidiaries, is involved in the development, exploration, and production of mineral properties in Australia and has a market capitalization of A$370.42 million.
Operations: Tribune Resources generates revenue primarily from its mining and exploration operations, totaling A$160.34 million.
Tribune Resources, a nimble player in Australia’s mining sector, showcases impressive financial health with no debt for the past five years and high-quality earnings. It trades at 73% below its estimated fair value, suggesting potential undervaluation. Despite a remarkable 666.9% earnings growth over the past year, it faces challenges with a 36.9% annual decline in earnings over five years. The company recently affirmed a fully franked dividend of A$0.20 per share and appointed Maddison Cramer as Joint Company Secretary, bringing her extensive corporate experience to the table for future strategic moves.
- Navigate through the intricacies of Tribune Resources with our comprehensive health report here.
-
Examine Tribune Resources’ past performance report to understand how it has performed in the past.
ASX:TBR Debt to Equity as at Jan 2026Seize The Opportunity
- Reveal the 63 hidden gems among our ASX Undiscovered Gems With Strong Fundamentals screener with a single click here.
- Hold shares in these firms? Setup your portfolio in Simply Wall St to seamlessly track your investments and receive personalized updates on your portfolio’s performance.
- Take control of your financial future using Simply Wall St, offering free, in-depth knowledge of international markets to every investor.
Looking For Alternative Opportunities?
- Explore high-performing small cap companies that haven’t yet garnered significant analyst attention.
- Fuel your portfolio with companies showing strong growth potential, backed by optimistic outlooks both from analysts and management.
- Find companies with promising cash flow potential yet trading below their fair value.
This article by Simply Wall St is general in nature. We provide commentary based on historical data
and analyst forecasts only using an unbiased methodology and our articles are not intended to be financial advice. It does not constitute a recommendation to buy or sell any stock, and does not take account of your objectives, or your
financial situation. We aim to bring you long-term focused analysis driven by fundamental data.
Note that our analysis may not factor in the latest price-sensitive company announcements or qualitative material.
Simply Wall St has no position in any stocks mentioned.
Companies discussed in this article include ASX:GNP ASX:LYL and ASX:TBR.
Have feedback on this article? Concerned about the content? Get in touch with us directly. Alternatively, email editorial-team@simplywallst.com
Wall Street expects a year-over-year decline in earnings on lower revenues when FMC (FMC) reports results for the quarter ended December 2025. While this widely-known consensus outlook is important in gauging the company's earnings picture, a powerful factor that could impact its near-term stock price is how the actual results compare to these estimates.
The earnings report, which is expected to be released on February 4, might help the stock move higher if these key numbers are better than expectations. On the other hand, if they miss, the stock may move lower.
While the sustainability of the immediate price change and future earnings expectations will mostly depend on management's discussion of business conditions on the earnings call, it's worth handicapping the probability of a positive EPS surprise.
Zacks Consensus Estimate
This chemical producer is expected to post quarterly earnings of $1.21 per share in its upcoming report, which represents a year-over-year change of -32.4%.
Revenues are expected to be $1.15 billion, down 6.1% from the year-ago quarter.
Estimate Revisions Trend
The consensus EPS estimate for the quarter has been revised 12.07% lower over the last 30 days to the current level. This is essentially a reflection of how the covering analysts have collectively reassessed their initial estimates over this period.
Investors should keep in mind that the direction of estimate revisions by each of the covering analysts may not always get reflected in the aggregate change.
Price, Consensus and EPS Surprise
Price, Consensus and EPS Surprise Chart for FMCEarnings Whisper
Estimate revisions ahead of a company's earnings release offer clues to the business conditions for the period whose results are coming out. Our proprietary surprise prediction model — the Zacks Earnings ESP (Expected Surprise Prediction) — has this insight at its core.
The Zacks Earnings ESP compares the Most Accurate Estimate to the Zacks Consensus Estimate for the quarter; the Most Accurate Estimate is a more recent version of the Zacks Consensus EPS estimate. The idea here is that analysts revising their estimates right before an earnings release have the latest information, which could potentially be more accurate than what they and others contributing to the consensus had predicted earlier.
Thus, a positive or negative Earnings ESP reading theoretically indicates the likely deviation of the actual earnings from the consensus estimate. However, the model's predictive power is significant for positive ESP readings only.
A positive Earnings ESP is a strong predictor of an earnings beat, particularly when combined with a Zacks Rank #1 (Strong Buy), 2 (Buy) or 3 (Hold). Our research shows that stocks with this combination produce a positive surprise nearly 70% of the time, and a solid Zacks Rank actually increases the predictive power of Earnings ESP.
Please note that a negative Earnings ESP reading is not indicative of an earnings miss. Our research shows that it is difficult to predict an earnings beat with any degree of confidence for stocks with negative Earnings ESP readings and/or Zacks Rank of 4 (Sell) or 5 (Strong Sell).
How Have the Numbers Shaped Up for FMC?
For FMC, the Most Accurate Estimate is lower than the Zacks Consensus Estimate, suggesting that analysts have recently become bearish on the company's earnings prospects. This has resulted in an Earnings ESP of -4.68%.
On the other hand, the stock currently carries a Zacks Rank of #3.
So, this combination makes it difficult to conclusively predict that FMC will beat the consensus EPS estimate.
Does Earnings Surprise History Hold Any Clue?
Analysts often consider to what extent a company has been able to match consensus estimates in the past while calculating their estimates for its future earnings. So, it's worth taking a look at the surprise history for gauging its influence on the upcoming number.
For the last reported quarter, it was expected that FMC would post earnings of $0.85 per share when it actually produced earnings of $0.89, delivering a surprise of +4.71%.
Over the last four quarters, the company has beaten consensus EPS estimates four times.
Bottom Line
An earnings beat or miss may not be the sole basis for a stock moving higher or lower. Many stocks end up losing ground despite an earnings beat due to other factors that disappoint investors. Similarly, unforeseen catalysts help a number of stocks gain despite an earnings miss.
That said, betting on stocks that are expected to beat earnings expectations does increase the odds of success. This is why it's worth checking a company's Earnings ESP and Zacks Rank ahead of its quarterly release. Make sure to utilize our Earnings ESP Filter to uncover the best stocks to buy or sell before they've reported.
FMC doesn't appear a compelling earnings-beat candidate. However, investors should pay attention to other factors too for betting on this stock or staying away from it ahead of its earnings release.
An Industry Player's Expected Results
Another stock from the Zacks Agriculture – Operations industry, Archer Daniels Midland (ADM), is soon expected to post earnings of $0.83 per share for the quarter ended December 2025. This estimate indicates a year-over-year change of -27.2%. Revenues for the quarter are expected to be $22.31 billion, up 3.8% from the year-ago quarter.
Over the last 30 days, the consensus EPS estimate for ADM has been revised 22.2% down to the current level. Nevertheless, the company now has an Earnings ESP of +2.41%, reflecting a higher Most Accurate Estimate.
This Earnings ESP, combined with its Zacks Rank #3 (Hold), suggests that ADM will most likely beat the consensus EPS estimate. The company beat consensus EPS estimates in each of the trailing four quarters.
Stay on top of upcoming earnings announcements with the Zacks Earnings Calendar.
Want the latest recommendations from Zacks Investment Research? Today, you can download 7 Best Stocks for the Next 30 Days. Click to get this free report
FMC Corporation (FMC) : Free Stock Analysis Report
Archer Daniels Midland Company (ADM) : Free Stock Analysis Report
This article originally published on Zacks Investment Research (zacks.com).
As Australian shares extend their rally, buoyed by positive sentiment from Wall Street and anticipation around upcoming inflation data, the market is abuzz with potential opportunities. In such an environment, identifying stocks with solid fundamentals and growth potential can be particularly rewarding for investors seeking to capitalize on the current momentum.
Top 10 Undiscovered Gems With Strong Fundamentals In Australia
| Name | Debt To Equity | Revenue Growth | Earnings Growth | Health Rating |
|---|---|---|---|---|
| Fiducian Group | NA | 10.00% | 9.57% | ★★★★★★ |
| Hearts and Minds Investments | NA | 56.27% | 59.19% | ★★★★★★ |
| Euroz Hartleys Group | NA | 1.82% | -25.32% | ★★★★★★ |
| Joyce | NA | 9.93% | 17.54% | ★★★★★★ |
| Argosy Minerals | NA | -12.81% | -19.89% | ★★★★★★ |
| Focus Minerals | NA | 75.35% | 51.34% | ★★★★★★ |
| Energy World | NA | -47.50% | -44.86% | ★★★★★☆ |
| AMCIL | NA | 2.99% | 1.18% | ★★★★★☆ |
| Zimplats Holdings | 5.44% | -9.79% | -42.03% | ★★★★★☆ |
| Australian United Investment | 1.90% | 5.23% | 4.56% | ★★★★☆☆ |
We’ll examine a selection from our screener results.
Simply Wall St Value Rating: ★★★★☆☆
Overview: Australian United Investment Company Limited is a publicly owned investment manager with a market cap of A$1.40 billion.
Operations: Australian United Investment generates revenue primarily from its investment segment, amounting to A$57.00 million. The company has a market cap of approximately A$1.40 billion.
Australian United Investment showcases a robust financial profile, with its debt to equity ratio significantly reduced from 9.1% to 1.9% over the past five years, indicating prudent financial management. The company’s earnings have been growing at an annual rate of 4.6%, although this pace lags behind the broader Capital Markets industry growth of 14.4%. Notably, AUI’s interest payments are well covered by EBIT at a healthy 22.8x coverage, reflecting sound operational efficiency. With high-quality earnings and positive free cash flow, AUI stands as a promising player in Australia’s investment landscape despite some competitive challenges in growth rates.
ASX:AUI Debt to Equity as at Jan 2026MFF Capital Investments
Simply Wall St Value Rating: ★★★★★★
Overview: MFF Capital Investments Limited is an investment firm manager with a market capitalization of A$2.83 billion.
Operations: MFF Capital Investments generates revenue primarily through equity investments, amounting to A$631.43 million.
MFF Capital, a nimble player in the investment space, is debt-free and trades at a notable 67.8% below its estimated fair value. Despite experiencing negative earnings growth of 3.4% over the past year compared to the industry average of 14.4%, MFF boasts high-quality earnings and positive free cash flow, with recent figures showing A$372 million in levered free cash flow as of March 2025. The recent appointment of Gerald Stack as CEO signals strategic leadership changes aimed at enhancing investment capabilities, potentially positioning MFF for future growth in Australia’s competitive financial landscape.
- Get an in-depth perspective on MFF Capital Investments’ performance by reading our health report here.
-
Learn about MFF Capital Investments’ historical performance.
ASX:MFF Earnings and Revenue Growth as at Jan 2026Smart Parking
Simply Wall St Value Rating: ★★★★★☆
Overview: Smart Parking Limited, with a market cap of A$514.51 million, specializes in the design, development, and management of parking solutions across New Zealand, Australia, Denmark, Germany, and the United Kingdom.
Operations: Smart Parking Limited generates revenue primarily from its Parking Management segment, with the United Kingdom contributing A$52.52 million and the United States adding A$10.22 million. The Technology Division also plays a role, bringing in A$5.27 million.
Smart Parking’s focus on market expansion into the U.S., Germany, and New Zealand seems to bolster its growth prospects, aiming to diversify earnings and reduce risks associated with geographic concentration. The company’s digital platforms enhance efficiency and compliance, aligning well with regulatory trends that could improve profit margins. Despite a debt-to-equity ratio increase from 0% to 0.9% over five years, it has more cash than debt, ensuring financial stability. With earnings growth of 46.8% last year surpassing industry averages, Smart Parking is trading at 44.2% below estimated fair value but faces challenges from evolving urban mobility trends and rising competition.
ASX:SPZ Earnings and Revenue Growth as at Jan 2026Summing It All Up
- Investigate our full lineup of 65 ASX Undiscovered Gems With Strong Fundamentals right here.
- Shareholder in one or more of these companies? Ensure you’re never caught off-guard by adding your portfolio in Simply Wall St for timely alerts on significant stock developments.
- Enhance your investing ability with the Simply Wall St app and enjoy free access to essential market intelligence spanning every continent.
Seeking Other Investments?
- Explore high-performing small cap companies that haven’t yet garnered significant analyst attention.
- Fuel your portfolio with companies showing strong growth potential, backed by optimistic outlooks both from analysts and management.
- Find companies with promising cash flow potential yet trading below their fair value.
This article by Simply Wall St is general in nature. We provide commentary based on historical data
and analyst forecasts only using an unbiased methodology and our articles are not intended to be financial advice. It does not constitute a recommendation to buy or sell any stock, and does not take account of your objectives, or your
financial situation. We aim to bring you long-term focused analysis driven by fundamental data.
Note that our analysis may not factor in the latest price-sensitive company announcements or qualitative material.
Simply Wall St has no position in any stocks mentioned.
Companies discussed in this article include ASX:AUI ASX:MFF and ASX:SPZ.
Have feedback on this article? Concerned about the content? Get in touch with us directly. Alternatively, email editorial-team@simplywallst.com
As the Australian market enters Week 5 with a notable rise in precious metals and equities, small-cap stocks are drawing attention amid a “risk-on” sentiment that echoes early 2022. In this dynamic environment, identifying promising small caps requires an eye for companies poised to benefit from current economic trends and sector-specific developments.
Top 10 Undiscovered Gems With Strong Fundamentals In Australia
| Name | Debt To Equity | Revenue Growth | Earnings Growth | Health Rating |
|---|---|---|---|---|
| Fiducian Group | NA | 10.00% | 9.57% | ★★★★★★ |
| Joyce | NA | 9.93% | 17.54% | ★★★★★★ |
| Spheria Emerging Companies | NA | -1.31% | 0.28% | ★★★★★★ |
| Euroz Hartleys Group | NA | 1.82% | -25.32% | ★★★★★★ |
| Hearts and Minds Investments | NA | 56.27% | 59.19% | ★★★★★★ |
| Argosy Minerals | NA | -12.81% | -19.89% | ★★★★★★ |
| Focus Minerals | NA | 75.35% | 51.34% | ★★★★★★ |
| AMCIL | NA | 2.99% | 1.18% | ★★★★★☆ |
| Zimplats Holdings | 5.44% | -9.79% | -42.03% | ★★★★★☆ |
| Australian United Investment | 1.90% | 5.23% | 4.56% | ★★★★☆☆ |
Let’s uncover some gems from our specialized screener.
Simply Wall St Value Rating: ★★★★★☆
Overview: Diversified United Investment Limited is a publicly owned investment manager with a market capitalization of A$1.14 billion.
Operations: DUI generates revenue primarily from its investment company segment, amounting to A$46.71 million.
Diversified United Investment (DUI) stands out with its debt-free status, a significant shift from a 9% debt-to-equity ratio five years ago. Earnings have increased by 5% annually over the past five years, although recent growth of 5.4% lagged behind the industry’s 14.4%. Despite this, DUI boasts high-quality earnings and positive free cash flow, providing a stable foundation for future endeavors. However, notable insider selling in the last quarter may raise some eyebrows among investors. With A$39 million in levered free cash flow as of June 2025, DUI’s financial health appears robust amidst industry challenges.
ASX:DUI Debt to Equity as at Jan 2026Metals X
Simply Wall St Value Rating: ★★★★★★
Overview: Metals X Limited is an Australian company focused on tin production, with a market capitalization of A$1.14 billion.
Operations: The primary revenue stream for Metals X comes from its 50% stake in the Renison Tin Operation, generating A$271.38 million.
Metals X, a nimble player in the mining sector, showcases a compelling financial profile with its debt-free status contrasting sharply against its previous 58.3% debt-to-equity ratio five years ago. The company reported a staggering earnings growth of 708%, significantly outpacing the industry average of 10%. Despite this impressive performance, it’s worth noting that their earnings are expected to see an average annual decline of nearly 15% over the next three years. A recent one-off gain of A$38 million has notably impacted their latest financial results, adding complexity to evaluating ongoing profitability.
- Dive into the specifics of Metals X here with our thorough health report.
-
Evaluate Metals X’s historical performance by accessing our past performance report.
ASX:MLX Earnings and Revenue Growth as at Jan 2026Wagners Holding
Simply Wall St Value Rating: ★★★★★☆
Overview: Wagners Holding Company Limited is involved in the production and sale of construction materials and related building products across several international markets, including Australia, the United States, New Zealand, the United Kingdom, Papua New Guinea, and Malaysia, with a market cap of A$742.97 million.
Operations: Wagners Holding generates revenue primarily from Construction Materials (A$257.69 million), Project Services (A$105.71 million), and Composite Fibre Technology (A$68.45 million). The net profit margin is a key indicator to assess financial performance, but specific trends are not provided here.
Wagners Holding, a small player in the Australian market, has shown impressive earnings growth of 120.9% over the past year, outpacing the Basic Materials industry significantly. The company’s net debt to equity ratio stands at a satisfactory 12.6%, having improved from 65.9% five years ago, indicating prudent financial management. Their interest payments are well covered by EBIT at 3.9 times coverage, reflecting robust operational performance. With operations expanding in concrete and quarry sectors and momentum in Composite Fiber Technologies driven by utility investments, Wagners is set for growth despite risks from capital expenditures and regional construction dependency.
ASX:WGN Debt to Equity as at Jan 2026Next Steps
- Navigate through the entire inventory of 64 ASX Undiscovered Gems With Strong Fundamentals here.
- Are any of these part of your asset mix? Tap into the analytical power of Simply Wall St’s portfolio to get a 360-degree view on how they’re shaping up.
- Streamline your investment strategy with Simply Wall St’s app for free and benefit from extensive research on stocks across all corners of the world.
Want To Explore Some Alternatives?
- Explore high-performing small cap companies that haven’t yet garnered significant analyst attention.
- Fuel your portfolio with companies showing strong growth potential, backed by optimistic outlooks both from analysts and management.
- Find companies with promising cash flow potential yet trading below their fair value.
This article by Simply Wall St is general in nature. We provide commentary based on historical data
and analyst forecasts only using an unbiased methodology and our articles are not intended to be financial advice. It does not constitute a recommendation to buy or sell any stock, and does not take account of your objectives, or your
financial situation. We aim to bring you long-term focused analysis driven by fundamental data.
Note that our analysis may not factor in the latest price-sensitive company announcements or qualitative material.
Simply Wall St has no position in any stocks mentioned.
Companies discussed in this article include ASX:DUI ASX:MLX and ASX:WGN.
Have feedback on this article? Concerned about the content? Get in touch with us directly. Alternatively, email editorial-team@simplywallst.com
TORONTO, Jan. 26, 2026 /CNW/ – Bravo Mining Corp. (TSXV: BRVO) (OTCQX: BRVMF) ("Bravo" or the "Company") welcomes the publication of Presidential Decree No. 12,823, signed on January 22, 2026, by President Luiz Inácio Lula da Silva, which formally creates the Export Processing Zone of Barcarena (ZPE Barcarena) in the Municipality of Barcarena, State of Pará. The Decree was published on January 23, 2026 in the Diário Oficial da União, Brazil's Federal Gazette. Link here: DECRETO Nº 12.823
The decree represents the final federal act establishing the ZPE, following its prior approval by Brazil's National Council of Export Processing Zones (CZPE). As previously announced on November 5, 2025, Bravo has been selected to anchor the ZPE Barcarena, becoming the first mineral project ever designated as an anchor tenant of a Brazilian ZPE.
In this context, the publication of the Presidential Decree strengthens Bravo's Alternate Case development scenario as such detailed in our Preliminary Economic Assessment ("PEA", see press release dated on July 7, 2025), which contemplates the use of the ZPE Barcarena fiscal framework to enable local processing and vertical integration of metals potentially produced from the Luanga palladium + platinum + rhodium + gold + nickel project ("Luanga Project" or "Luanga PGM+Au+Ni Project").
The formal creation of the ZPE enhances regulatory certainty around this complementary pathway and reinforces the strategic alignment of the Company's potential development plans with Brazil's national industrial policy and Pará's economic development agenda.
The initiative was led by the Government of the State of Pará, through the Secretariat of Economic Development, Mining and Energy (SEDEME) and the Economic Development Company of Pará (CODEC), in partnership with Bravo, and in coordination with the Brazil's Ministry of Mines and Energy (MME), Federation of Industries of Pará (FIEPA), the State Secretariat for the Environment of Pará (SEMA), and the Municipality of Barcarena.
"The signing of the Presidential Decree formally creating the ZPE Barcarena is a significant milestone for Bravo and materially advances regulatory certainty around our development scenario," said Luís Azevedo, Chairman and CEO of Bravo. "Coming on the heels of the recent closing of our oversubscribed equity financing for net proceeds of ~C$81.8 million, completed amid strong investor demand and an improving PGM price environment, with the 4PGE* basket price now approximately 60% higher than the price used in our PEA, this development further reinforces our confidence in the long-term strategic positioning of the Luanga Project. Together, these milestones highlight both the strength of our asset and the growing alignment between Bravo's development strategy and Brazil's industrial and economic objectives".
*4PGE = Platinum, Palladium, Rhodium and Gold
Barcarena Export Processing Zone (ZPE)
As detailed in the Company's press release dated November 5, 2025, the ZPE Barcarena is located within the Industrial District of Barcarena, at the Port of Vila do Conde in Barcarena, and comprises approximately 271 hectares, strategically positioned near deep-water ports, energy infrastructure, and established industrial logistics corridors.
Under Brazil's ZPE framework, companies operating within the zone benefit from a differentiated regulatory, tax, and customs regime designed to promote industrialization, exports, and value-added processing.
The establishment of the ZPE significantly enhances Bravo's PEA Alternate Scenario (vertical integration) by providing access to a range of structural benefits, including potential capital and operating cost savings through exemptions on imported equipment and supplies, as well as tax-advantaged export treatment from a strategically located industrial hub with direct access to the existing maritime infrastructure.
The ZPE Barcarena is an established industrial district that hosts multiple fertilizer and chemical producers, many of which are constrained by reliance on imported sulphuric acid. This limitation creates a potential local market for sulphuric acid that would be produced as a by-product of the vertical integration smelting process. Consequently, sulphuric acid is an essential component for fertilizer production in Brazil, and Bravo's potential acid by-product may represent an additional revenue stream.
To illustrate the potential of this opportunity, the PEA assumed a sulphuric acid sales credit of US$160/t, while recent market prices have reached approximately US$440/t. At current prices, it has been reported that some major fertilizer producers have temporarily suspended production. Consequently, providing a local source of acid could potentially benefit the local fertilizer producers and Bravo's margins.
Importantly, the Base Case for the Luanga Project, which contemplates concentrate sales only, already exhibits strong standalone economics, providing a solid foundation for the evaluation of additional development alternatives. This highlights the potential project's resilience across a range of scenarios, particularly in the context of prevailing PGM prices and supportive market fundamentals.
While vertical (downstream) integration is typical in the PGM sector, many projects still face constraints related to limited smelting capacity and/or access to processing facilities. In this context, the Barcarena ZPE provides Bravo with additional optionality and strategic flexibility, strengthening the range of complementary development pathways available to the Company. Further, the Barcarana ZPE with access to the Atlantic Ocean provides opportunities for import and re-export of third-party nickel and/or PGM concentrates within the ZPE framework.
About Bravo Mining Corp.
Bravo is a Canadian and Brazil-based mineral exploration and development company focused on advancing its PGM and copper-gold Luanga Project in the Carajás Mineral Province, Pará State, Brazil.
Bravo is one of the most active explorers in Carajás. The team, comprising of local and international geologists, has a proven track record of PGM, nickel, and copper discoveries in the region. They have successfully taken a past IOCG greenfield project from discovery to development and production in the Carajás.
The Luanga Project is situated on mature freehold farming land and benefits from being located close to operating mines and a mining-experienced workforce, with excellent access and proximity to existing infrastructure, including road, rail, and hydroelectric grid power. Bravo's current Environmental, Social and Governance activities include planting more than 50,000 high-value trees in and around the project area and hiring and contracting locally.
Neither TSX Venture Exchange nor its Regulation Services Provider (as that term is defined in policies of the TSX Venture Exchange) accepts responsibility for the adequacy or accuracy of this release.
Forward Looking Statements
This news release contains forward-looking information which is not comprised of historical facts. Forward-looking information is characterized by words such as "potential", "benefit", ''significant ", "supports", "positions", "aims", "is aligned with", variants of these words and other similar words, phrases, or statements that certain events or conditions "could", "may", "should", "will" or "would" occur. Forward-looking information involves risks, uncertainties and other factors that could cause actual events, results, and opportunities to differ materially from those expressed or implied by such forward-looking information. Factors that could cause actual results to differ materially from such forward-looking information include, but are not limited to, unexpected results from exploration programs, changes in the state of equity and debt markets, fluctuations in commodity prices, delays in obtaining required regulatory or governmental approvals, environmental risks, limitations on insurance coverage; and other risks and uncertainties involved in the mineral exploration and development industry. Forward-looking information in this news release is based on the opinions and assumptions of management considered reasonable as of the date hereof, including, but not limited to: whether or not the economic scenarios outlined in the Luanga PEA are supported by any future pre-feasibility and feasibility studies and the timing and result thereof; whether or not the Luanga deposit is developed; whether or not the Barcarena ZPE is utilized for downstream processing of concentrates from the Luanga deposit; whether there will be buyers of acid in proximity to any smelter developed and, if so, under what terms and conditions; whether any third parties would want to use a smelter developed within the Barcarana ZPE and, if so, on what terms and conditions; whether currently higher PGM prices will be sustained and, if so, for how long; that activities will not be adversely disrupted or impeded by regulatory, political, community, economic, environmental and/or healthy and safety risks; that the Luanga Project will not be materially affected by potential supply chain disruptions; and general business and economic conditions will not change in a materially adverse manner. Although the Company believes that the assumptions and factors used in preparing the forward-looking information in this news release are reasonable, undue reliance should not be placed on such information. The Company disclaims any intention or obligation to update or revise any forward-looking information, other than as required by applicable securities laws.
View original content to download multimedia: http://www.newswire.ca/en/releases/archive/January2026/26/c8506.html
As we enter January 2026, the Australian market is navigating a landscape marked by global economic tensions and fluctuating commodity prices, with gold reaching new highs and the Australian dollar strengthening against the U.S. dollar. In this environment of uncertainty and opportunity, identifying undiscovered gems in the small-cap sector requires a keen eye for companies that demonstrate resilience amidst market volatility and potential for growth despite broader economic challenges.
Top 10 Undiscovered Gems With Strong Fundamentals In Australia
| Name | Debt To Equity | Revenue Growth | Earnings Growth | Health Rating |
|---|---|---|---|---|
| Fiducian Group | NA | 10.00% | 9.57% | ★★★★★★ |
| Joyce | NA | 9.93% | 17.54% | ★★★★★★ |
| Euroz Hartleys Group | NA | 1.82% | -25.32% | ★★★★★★ |
| Hearts and Minds Investments | NA | 56.27% | 59.19% | ★★★★★★ |
| Argosy Minerals | NA | -12.81% | -19.89% | ★★★★★★ |
| Focus Minerals | NA | 75.35% | 51.34% | ★★★★★★ |
| AMCIL | NA | 2.99% | 1.18% | ★★★★★☆ |
| Zimplats Holdings | 5.44% | -9.79% | -42.03% | ★★★★★☆ |
| Australian United Investment | 1.90% | 5.23% | 4.56% | ★★★★☆☆ |
| Reef Casino Trust | 19.84% | 6.96% | 10.88% | ★★★★☆☆ |
Let’s uncover some gems from our specialized screener.
Simply Wall St Value Rating: ★★★★★☆
Overview: Carlton Investments Limited is a publicly owned asset management holding company with a market capitalization of A$937.81 million.
Operations: Carlton Investments generates revenue primarily from the acquisition and long-term holding of shares and units, amounting to A$41.60 million.
Carlton Investments, a relatively small player in the Australian market, shows a promising financial profile. Its debt to equity ratio has decreased from 0.03% to 0.02% over five years, indicating prudent financial management. While earnings growth of 8.7% annually over the past five years is notable, recent performance at just 0.09% trails behind industry peers growing at 14.4%. The company’s interest payments are comfortably covered by EBIT with a coverage ratio of 3390x, highlighting robust operational efficiency and profitability that supports its cash flow positivity and high-quality earnings profile without debt concerns looming large.
- Dive into the specifics of Carlton Investments here with our thorough health report.
-
Explore historical data to track Carlton Investments’ performance over time in our Past section.
ASX:CIN Earnings and Revenue Growth as at Jan 2026GR Engineering Services
Simply Wall St Value Rating: ★★★★★★
Overview: GR Engineering Services Limited offers engineering, process control, automation, and construction services primarily to the mining and mineral processing industries both in Australia and internationally, with a market cap of A$721.61 million.
Operations: GR Engineering Services Limited generates revenue primarily from two segments: Mineral Processing, contributing A$383.09 million, and Oil and Gas, contributing A$95.93 million. The company’s financial performance is significantly influenced by its operations in these sectors.
GR Engineering Services, a nimble player in the engineering sector, showcases robust financial health with its debt-free status and high-quality earnings. Over the past five years, it has achieved an impressive 21.8% annual growth in earnings, though recent performance at 9.7% slightly trails the broader Metals and Mining industry at 10.1%. Trading at a notable discount of 42.2% below estimated fair value suggests potential upside for investors seeking undervalued opportunities. Despite significant insider selling recently, GR Engineering remains attractive due to its positive free cash flow and forecasted revenue growth of 7.8% annually, indicating promising prospects ahead for this Australian gem.
- Click here and access our complete health analysis report to understand the dynamics of GR Engineering Services.
-
Gain insights into GR Engineering Services’ past trends and performance with our Past report.
ASX:GNG Earnings and Revenue Growth as at Jan 2026Kina Securities
Simply Wall St Value Rating: ★★★★☆☆
Overview: Kina Securities Limited operates in Papua New Guinea, offering commercial banking, financial services, fund administration, investment management, and share brokerage with a market capitalization of A$363.28 million.
Operations: Kina Securities Limited generates revenue primarily from its Banking & Finance segment, contributing PGK 441.25 million, and Wealth Management segment, adding PGK 50.19 million.
Kina Securities, a notable player in the financial sector, showcases a compelling profile with its total assets at PGK5.4 billion and equity of PGK680.3 million. The company’s price-to-earnings ratio of 9.2x is favorably below the Australian market average of 21.7x, indicating potential value for investors. Despite challenges such as a high bad loans level at 7.7%, KSL’s earnings have grown significantly by 14.8% over the past year, surpassing industry averages and highlighting its growth trajectory within the banking sector in Australia and Papua New Guinea markets alike.
- Unlock comprehensive insights into our analysis of Kina Securities stock in this health report.
-
Examine Kina Securities’ past performance report to understand how it has performed in the past.
ASX:KSL Earnings and Revenue Growth as at Jan 2026Taking Advantage
- Click here to access our complete index of 64 ASX Undiscovered Gems With Strong Fundamentals.
- Are these companies part of your investment strategy? Use Simply Wall St to consolidate your holdings into a portfolio and gain insights with our comprehensive analysis tools.
- Streamline your investment strategy with Simply Wall St’s app for free and benefit from extensive research on stocks across all corners of the world.
Looking For Alternative Opportunities?
- Explore high-performing small cap companies that haven’t yet garnered significant analyst attention.
- Fuel your portfolio with companies showing strong growth potential, backed by optimistic outlooks both from analysts and management.
- Find companies with promising cash flow potential yet trading below their fair value.
This article by Simply Wall St is general in nature. We provide commentary based on historical data
and analyst forecasts only using an unbiased methodology and our articles are not intended to be financial advice. It does not constitute a recommendation to buy or sell any stock, and does not take account of your objectives, or your
financial situation. We aim to bring you long-term focused analysis driven by fundamental data.
Note that our analysis may not factor in the latest price-sensitive company announcements or qualitative material.
Simply Wall St has no position in any stocks mentioned.
Companies discussed in this article include ASX:CIN ASX:GNG and ASX:KSL.
Have feedback on this article? Concerned about the content? Get in touch with us directly. Alternatively, email editorial-team@simplywallst.com
While "the trend is your friend" when it comes to short-term investing or trading, timing entries into the trend is a key determinant of success. And increasing the odds of success by making sure the sustainability of a trend isn't easy.
Often, the direction of a stock's price movement reverses quickly after taking a position in it, making investors incur a short-term capital loss. So, it's important to ensure that there are enough factors — such as sound fundamentals, positive earnings estimate revisions, etc. — that could keep the momentum in the stock going.
Our "Recent Price Strength" screen, which is created on a unique short-term trading strategy, could be pretty useful in this regard. This predefined screen makes it really easy to shortlist the stocks that have enough fundamental strength to maintain their recent uptrend. Also, the screen passes only the stocks that are trading in the upper portion of their 52-week high-low range, which is usually an indicator of bullishness.
Impala Platinum Holdings Ltd. (IMPUY) is one of the several suitable candidates that passed through the screen. Here are the key reasons why it could be a profitable bet for "trend" investors.
A solid price increase over a period of 12 weeks reflects investors' continued willingness to pay more for the potential upside in a stock. IMPUY is quite a good fit in this regard, gaining 106.2% over this period.
However, it's not enough to look at the price change for around three months, as it doesn't reflect any trend reversal that might have happened in a shorter time frame. It's important for a potential winner to maintain the price trend. A price increase of 31.4% over the past four weeks ensures that the trend is still in place for the stock of this company.
Moreover, IMPUY is currently trading at 99.9% of its 52-week High-Low Range, hinting that it can be on the verge of a breakout.
Looking at the fundamentals, the stock currently carries a Zacks Rank #1 (Strong Buy), which means it is in the top 5% of more than the 4,000 stocks that we rank based on trends in earnings estimate revisions and EPS surprises — the key factors that impact a stock's near-term price movements.
The Zacks Rank stock-rating system, which uses four factors related to earnings estimates to classify stocks into five groups, ranging from Zacks Rank #1 (Strong Buy) to Zacks Rank #5 (Strong Sell), has an impressive externally-audited track record, with Zacks Rank #1 stocks generating an average annual return of +25% since 1988. You can see the complete list of today's Zacks Rank #1 (Strong Buy) stocks here >>>>
Another factor that confirms the company's fundamental strength is its Average Broker Recommendation of #1 (Strong Buy). This indicates that the brokerage community is highly optimistic about the stock's near-term price performance.
So, the price trend in IMPUY may not reverse anytime soon.
In addition to IMPUY, there are several other stocks that currently pass through our "Recent Price Strength" screen. You may consider investing in them and start looking for the newest stocks that fit these criteria.
This is not the only screen that could help you find your next winning stock pick. Based on your personal investing style, you may choose from over 45 Zacks Premium Screens that are strategically created to beat the market.
However, keep in mind that the key to a successful stock-picking strategy is to ensure that it produced profitable results in the past. You could easily do that with the help of the Zacks Research Wizard. In addition to allowing you to backtest the effectiveness of your strategy, the program comes loaded with some of our most successful stock-picking strategies.
Click here to sign up for a free trial to the Research Wizard today.
Want the latest recommendations from Zacks Investment Research? Today, you can download 7 Best Stocks for the Next 30 Days. Click to get this free report
Impala Platinum Holdings Ltd. (IMPUY) : Free Stock Analysis Report
This article originally published on Zacks Investment Research (zacks.com).
VANCOUVER, BC / ACCESS Newswire / January 26, 2026 / Apex Critical Metals Corp. (CSE:APXC)(OTCQX:APXCF)(FWB:KL9) ("Apex" or the "Company"), a Canadian mineral exploration company focused on the identification and development of critical and strategic metals, is pleased to announce that the first drill rig has arrived at site for the Company's inaugural drill program at its 100%-controlled Rift Rare Earth Project, located within the Elk Creek Carbonatite Complex in southeastern Nebraska, U.S.A.
Figure 1. First drill rig arriving and being staged at the first drill pad at the Rift Rare Earth Project, southeastern Nebraska, U.S.A.
The first rig is currently being assembled and commissioned, while site preparation activities, including access routes, drill pad construction, and logistical staging, are underway to support upcoming drilling operations.
The planned Phase I drill program will focus on verifying and expanding on the significant rare earth (REE) mineralization defined by previous operators, with drilling planned to cover 850 metres of north-south strike in the high-priority southeastern portion of the Company's Rift Rare Earth Project. Targeting has been supported by geophysical, geochemical, and historical drilling data that has all been incorporated into a modern 3D geological model. Phase I has been designed to advance the understanding of the Rift Project's rare earth and associated critical mineral potential within one of North America's most prospective carbonatite systems.
Sean Charland, CEO of Apex Critical Metals, commented: "The arrival of our first drill rig at Rift represents a key milestone as we officially embark on a drill campaign that we believe will elevate the awareness of the Rift Rare Earth Project significantly and put the Company in a position to accelerate our path towards a maiden mineral resource with additional follow-up drilling later this year."
Drilling will ramp up with a second drill rig expected to arrive imminently. The Company will provide periodic updates as the program advances.
Grant of Restricted Share Units
The Company also announces that it has granted 750,000 restricted share units ("RSUs") to a director of the Company in accordance with the Company's omnibus equity incentive plan (the "Plan"), which was last approved by the Company's shareholders on February 26, 2025.
The RSUs were granted on January 23, 2026 and will vest as follows: 375,000 RSU's will vest twelve (12) months from the date of the grant and 375,000 RUS's will vest twenty-four (24) months from the date of the grant. Each vested RSU represents the right of the holder to receive one common share of the Company (each, a "Share") in accordance with the terms of the Plan.
The Shares underlying the RSUs are subject to a hold period of four months and one day from the date of issuance of the RSUs.
Qualified Person
The technical content of this news release has been reviewed and approved by Nathan Schmidt, P. Geo., a Qualified Person under NI 43-101 on standards of disclosure for mineral projects. Mr. Schmidt is a Geologist with Dahrouge Geological Consulting Ltd., the consulting firm engaged by Apex Critical Metals Corp. to conduct and oversee all of the Company's exploration work, including the 2026 drill program.
About Apex Critical Metals Corp. (CSE:APXC)(OTCQX:APXCF)(FWB:KL9)
Apex Critical Metals Corp. is a Canadian exploration company focused on advancing rare earth element (REE) and niobium projects that support the growing demand for critical and strategic metals across the United States and Canada. The Company's flagship Rift Project, located within the highly prospective Elk Creek Carbonatite Complex in Nebraska, U.S.A., hosts extensive rare earth rights surrounding one of North America's most advanced niobium-REE deposits. Historical drilling across the complex has reported broad intervals of high-grade REE mineralization, including intercepts such as 155.5 m of 2.70% REO and 68.2 m of 3.32% REO.
In Canada, Apex continues to advance its 100%-owned Cap Project, located 85 kilometres northeast of Prince George, British Columbia. The 2025 drill program confirmed a significant niobium discovery with 0.59% Nb₂O₅ over 36 metres, including 1.08% Nb₂O₅ over 10 metres, within a 1.8-kilometre-long niobium trend. The Cap Project continues to demonstrate strong potential for niobium mineralization within a large and previously unrecognized carbonatite system.
With a growing portfolio of critical mineral projects in both Canada and the United States, Apex Critical Metals is strategically positioned to help strengthen domestic supply chains for the minerals essential to advanced technologies, clean energy, and national security. Apex is publicly listed in Canada on the Canadian Securities Exchange (CSE) under the symbol APXC and quoted on the OTCQX market in the United States under the symbol APXCF, and in Germany on the Borse Frankfurt under the symbol KL9 and/or WKN: A40CCQ. Find out more at www.apexcriticalmetals.com and watch our videos at https://apexcriticalmetals.com/apex-critical-metals-corporate-video/ and make sure to stay in touch by signing up for free news alerts at https://apexcriticalmetals.com/news/news-alerts/, or by following us on X (formerly Twitter), Facebook or LinkedIn.
On Behalf of the Board of Directors
APEX CRITICAL METALS CORP.,
Sean CharlandChief Executive OfficerTel: 604.681.1568Email: info@apexcriticalmetals.com
Neither the Canadian Securities Exchange nor its Regulation Services Provider (as that term is defined in the policies of the CSE) accepts responsibility for the adequacy or accuracy of this release.
CAUTIONARY STATEMENT REGARDING FORWARD-LOOKING INFORMATION:
This news release may contain "forward-looking statements" under applicable Canadian securities legislation. Forward-looking statements consist of statements that are not purely historical, including any statements regarding beliefs, plans, expectations or intentions regarding the future. Forward-looking statements in this news release include (without limitation) statements regarding the Company's planned Phase I drill program and any subsequent drill programs and statements regarding the Company's US-based prospective assets (more particularly described above), including the potential for additional acquisitions and the potential for exploration, and statements regarding the potential for future exploration and drilling to confirm the source of magnetic anomalies. Forward-looking statements are subject to various known and unknown risks and uncertainties that may cause actual results, performance or developments to differ materially from those contained in the statements. Risks that could change or prevent these events, activities or developments from coming to fruition include: the Company's properties are at an early stage of development and no current mineral resources or reserves have been identified by the Company thereof, that we may not be able to fully finance any additional exploration on the Company's properties; that even if we are able to raise capital, costs for exploration activities may increase such that we may not have sufficient funds to pay for such exploration or processing activities; the timing and content of any future work programs; geological interpretations based on drilling that may change with more detailed information; potential process methods and mineral recoveries assumptions based on limited test work and by comparison to what are considered analogous deposits that, with further test work, may not be comparable; testing of our process may not prove successful or samples derived from our properties may not yield positive results, and even if such tests are successful or initial sample results are positive, the economic and other outcomes may not be as expected; the anticipated market demand for REE and other minerals may not be as expected; the availability of labour and equipment to undertake future exploration work and testing activities; geopolitical risks which may result in market and economic instability. There can be no assurance that such statements will prove to be accurate, as actual results and future events could differ materially from those anticipated in such statements. Accordingly, readers should not place undue reliance on forward-looking statements. The forward-looking statements herein are made as of the date hereof, and the Company disclaims any intention or obligation to update or revise any forward-looking statements, whether as a result of new information, future events or otherwise, except as required by law.
SOURCE: Apex Critical Metals Corp.
View the original press release on ACCESS Newswire
The Australian market is navigating a period of uncertainty, with mixed unemployment figures and global economic tensions influencing investor sentiment. Amidst this backdrop, identifying promising small-cap stocks can be particularly rewarding, as these companies often possess unique growth potential that may not yet be fully recognized by the broader market.
Top 10 Undiscovered Gems With Strong Fundamentals In Australia
| Name | Debt To Equity | Revenue Growth | Earnings Growth | Health Rating |
|---|---|---|---|---|
| Fiducian Group | NA | 10.00% | 9.57% | ★★★★★★ |
| Joyce | NA | 9.93% | 17.54% | ★★★★★★ |
| Hearts and Minds Investments | NA | 56.27% | 59.19% | ★★★★★★ |
| Euroz Hartleys Group | NA | 1.82% | -25.32% | ★★★★★★ |
| Argosy Minerals | NA | -12.81% | -19.89% | ★★★★★★ |
| Focus Minerals | NA | 75.35% | 51.34% | ★★★★★★ |
| AMCIL | NA | 2.99% | 1.18% | ★★★★★☆ |
| Zimplats Holdings | 5.44% | -9.79% | -42.03% | ★★★★★☆ |
| Australian United Investment | 1.90% | 5.23% | 4.56% | ★★★★☆☆ |
| Reef Casino Trust | 19.84% | 6.96% | 10.88% | ★★★★☆☆ |
We’re going to check out a few of the best picks from our screener tool.
Simply Wall St Value Rating: ★★★★☆☆
Overview: Cobram Estate Olives Limited is involved in the production and marketing of olive oil across Australia, the United States, and internationally, with a market capitalization of approximately A$1.86 billion.
Operations: Cobram Estate Olives generates revenue primarily from its Australian olive oil operations, contributing A$183.82 million, and its US operations with A$64.97 million. The company also records eliminations and corporate adjustments of -A$7.13 million.
Cobram Estate Olives, a notable player in the Australian market, has seen its earnings soar by 168% over the past year, outpacing the food industry average of 56%. Despite this impressive growth, the company carries a high net debt to equity ratio of 72%, although it has improved from 119.5% in five years. Their interest payments are well covered with an EBIT coverage of 8.1 times. Recently, they completed a follow-on equity offering worth A$3.89 million and announced an annual dividend increase to A$0.045 per share, reflecting their strong financial position and commitment to returning value to shareholders.
ASX:CBO Debt to Equity as at Jan 2026Focus Minerals
Simply Wall St Value Rating: ★★★★★★
Overview: Focus Minerals Limited is involved in the exploration and development of gold properties in Western Australia, with a market capitalization of A$1.13 billion.
Operations: Focus Minerals generates revenue primarily from its Coolgardie segment, amounting to A$151.74 million. The company has a market capitalization of A$1.13 billion.
Focus Minerals, an intriguing player in the Australian mining sector, has shown impressive earnings growth of 136% over the past year, outpacing the industry average of 10%. The company operates without debt, eliminating concerns about interest payments and highlighting its financial prudence. Despite this robust earnings performance, Focus Minerals is not yet generating positive free cash flow. However, its high-quality earnings suggest a strong operational foundation. With A$74 million in cash equivalents as of mid-2025 and continued investment in capital expenditure at approximately A$26 million recently, Focus seems positioned for potential future growth within its niche market.
- Navigate through the intricacies of Focus Minerals with our comprehensive health report here.
-
Gain insights into Focus Minerals’ past trends and performance with our Past report.
ASX:FML Earnings and Revenue Growth as at Jan 2026United Overseas Australia
Simply Wall St Value Rating: ★★★★★☆
Overview: United Overseas Australia Ltd, with a market cap of A$1.24 billion, operates in the development and resale of land and buildings across Malaysia, Singapore, Vietnam, and Australia.
Operations: United Overseas Australia Ltd generates revenue primarily from its land development and resale segment, which accounts for A$438.18 million. The investment segment contributes A$257.51 million to the total revenue.
United Overseas Australia, a smaller player in the real estate sector, shows promising financial health with a price-to-earnings ratio of 12.2x, notably below the Australian market average of 21.7x. Over five years, its debt-to-equity ratio rose from 5.5% to 8.8%, yet it holds more cash than total debt, indicating solid financial footing. Despite not surpassing industry earnings growth last year at 27.5%, UOS has maintained high-quality earnings and positive free cash flow throughout this period, suggesting resilience and potential for future stability in its operations within the competitive real estate landscape.
ASX:UOS Debt to Equity as at Jan 2026Next Steps
- Investigate our full lineup of 64 ASX Undiscovered Gems With Strong Fundamentals right here.
- Hold shares in these firms? Setup your portfolio in Simply Wall St to seamlessly track your investments and receive personalized updates on your portfolio’s performance.
- Enhance your investing ability with the Simply Wall St app and enjoy free access to essential market intelligence spanning every continent.
Looking For Alternative Opportunities?
- Explore high-performing small cap companies that haven’t yet garnered significant analyst attention.
- Fuel your portfolio with companies showing strong growth potential, backed by optimistic outlooks both from analysts and management.
- Find companies with promising cash flow potential yet trading below their fair value.
This article by Simply Wall St is general in nature. We provide commentary based on historical data
and analyst forecasts only using an unbiased methodology and our articles are not intended to be financial advice. It does not constitute a recommendation to buy or sell any stock, and does not take account of your objectives, or your
financial situation. We aim to bring you long-term focused analysis driven by fundamental data.
Note that our analysis may not factor in the latest price-sensitive company announcements or qualitative material.
Simply Wall St has no position in any stocks mentioned.
Companies discussed in this article include ASX:CBO ASX:FML and ASX:UOS.
Have feedback on this article? Concerned about the content? Get in touch with us directly. Alternatively, email editorial-team@simplywallst.com
Investors in FMC Corporation FMC need to pay close attention to the stock based on moves in the options market lately. That is because the Feb. 20, 2026 $35 Put had some of the highest implied volatility of all equity options today.
What is Implied Volatility?
Implied volatility shows how much movement the market is expecting in the future. Options with high levels of implied volatility suggest that investors in the underlying stocks are expecting a big move in one direction or the other. It could also mean there is an event coming up soon that may cause a big rally or a huge sell-off. However, implied volatility is only one piece of the puzzle when putting together an options trading strategy.
What do the Analysts Think?
Clearly, options traders are pricing in a big move for FMC shares, but what is the fundamental picture for the company? Currently, FMC is a Zacks Rank #3 (Hold) in the Agriculture – Operations industry that ranks in the Top 22% of our Zacks Industry Rank. Over the last 60days, one analyst has increased the earnings estimates for the current quarter, while three have dropped their estimates. The net effect has taken our Zacks Consensus Estimate for the current quarter from $1.23 per share to $1.21 in that period.
Given the way analysts feel about FMC right now, this huge implied volatility could mean there’s a trade developing. Oftentimes, options traders look for options with high levels of implied volatility to sell premium. This is a strategy many seasoned traders use because it captures decay. At expiration, the hope for these traders is that the underlying stock does not move as much as originally expected.
Want the latest recommendations from Zacks Investment Research? Today, you can download 7 Best Stocks for the Next 30 Days. Click to get this free report
FMC Corporation (FMC) : Free Stock Analysis Report
This article originally published on Zacks Investment Research (zacks.com).
PHILADELPHIA, Jan. 22, 2026 /PRNewswire/ — FMC Corporation (NYSE: FMC) announced today that its 2026 Annual Meeting of Stockholders will be held via live webcast on Tuesday, April 28, 2026, at 2:00 p.m. ET. The board of directors established the close of business on Friday, February 27, 2026, as the record date for determining stockholders entitled to receive notice of and vote at the annual meeting.
Further information regarding the annual meeting will be set forth in the proxy statement and other proxy materials. Instructions for accessing the webcast will be available on the company's Investor Relations website at https://investors.fmc.com.
About FMC
FMC Corporation is a global agricultural sciences company dedicated to helping growers produce food, feed, fiber and fuel for an expanding world population while adapting to a changing environment. FMC's innovative crop protection solutions – including biologicals, crop nutrition, digital and precision agriculture – enable growers and crop advisers to address their toughest challenges economically while protecting the environment. FMC is committed to discovering new herbicide, insecticide and fungicide active ingredients, product formulations and pioneering technologies that are consistently better for the planet. Visit fmc.com to learn more and follow us on LinkedIn®.
Cautionary Note Regarding Forward-Looking Statements
Statement under the Safe Harbor Provisions of the Private Securities Litigation Reform Act of 1995: FMC and its representatives may from time to time make written or oral statements that are "forward-looking" and provide other than historical information, including statements contained in this press release, in FMC's other filings with the SEC, and in reports or letters to FMC stockholders.
In some cases, FMC has identified these forward-looking statements by such words or phrases as "outlook," "will," "will likely result," "is confident that," "expect," "expects," "should," "could," "may," "will continue to," "believe," "believes," "anticipates," "predicts," "forecasts," "estimates," "projects," "potential," "intends" or similar expressions identifying "forward-looking statements" within the meaning of the Private Securities Litigation Reform Act of 1995, including the negative of those words or phrases. Such forward-looking statements are based on management's current views and assumptions regarding future events, future business conditions and the outlook for the company based on currently available information. The forward-looking statements involve known and unknown risks, uncertainties and other factors that may cause actual results to be materially different from any results, levels of activity, performance or achievements expressed or implied by any forward-looking statement. These statements are qualified by reference to the risk factors included in Part I, Item 1A of our Annual Report on Form 10-K for the year ended December 31, 2024 (the "2024 Form 10-K"), the section captioned "Forward-Looking Information" in Part II of the 2024 Form 10-K and to similar risk factors and cautionary statements in all other reports and forms filed with the Securities and Exchange Commission ("SEC"). Such factors may be updated from time to time in our periodic filings with the SEC, which are accessible on the SEC's website at www.sec.gov. FMC cautions readers not to place undue reliance on any such forward-looking statements, which speak only as of the date made. Forward-looking statements are qualified in their entirety by the above cautionary statement.
FMC undertakes no obligation, and specifically disclaims any duty, to update or revise any forward-looking statements to reflect events or circumstances arising after the date of such statements or to reflect the occurrence of anticipated events, except as otherwise required by law.
This press release may contain certain "non-GAAP financial terms" which are defined on our website www.fmc.com/investors. Such terms include adjusted EBITDA, adjusted earnings, free cash flow, organic revenue growth and return on invested capital. In addition, we have also provided on our website reconciliations of non-GAAP terms to the most directly comparable GAAP term.
Media contact: Nicole Canning +1.215.299.5916Nicole.Canning@fmc.com
Investor contact: Curt Brooks 215-299-6137Curt.Brooks@fmc.com
View original content to download multimedia:https://www.prnewswire.com/news-releases/fmc-corporation-announces-date-of-2026-annual-meeting-of-stockholders-302666946.html
Vancouver, British Columbia–(Newsfile Corp. – January 22, 2026) – Sego Resources Inc. (TSXV: SGZ) ("Sego" or "the Company") is pleased to report that the Company will have a booth at VRIC on January 25 and January 26, 2026.
We will be at Booth 1030 and will have maps and polished drill core available from Diamond Drill Holes 69 and 71. The core from DDH 69 will display clearly the potassic alteration and DDH 71 core will display phyllic alteration.
We will also have maps available of the complete areas of interest.
About the Project
Sego is 100% owner of the Miner Mountain Project, an alkalic copper-gold porphyry and gold exploration project located near Princeton, British Columbia. The property is 2,056 hectares in size and is 15 kilometres north of the Copper Mountain Mine operated by Hudbay Minerals Inc. Sego has a Memorandum of Understanding with the Upper Similkameen Indian Band on whose Traditional Territory the Miner Mountain Project is situated. Sego has received an Award of Excellence for its reclamation work on the Miner Mountain Project.
For further information, please contact: J. Paul Stevenson, CEO (604) 682-2933, email: ceo@segoresources.com
Neither the TSX Venture Exchange nor its Regulation Services Provider (as that term is defined in the policies of the TSX Venture Exchange) accepts responsibility for the adequacy or accuracy of this release. No regulatory authority has approved or disapproved the information contained in this news release.
This release includes certain statements that may be deemed "forward-looking statements". All statements in this release, other than statement of historical facts that address future production, reserve potential, exploration drilling, exploitation activities and events or developments that the Company expects re forward-looking statements. Although the Company believes the expectations expressed in such forward-looking statements are based on reasonable assumptions, statements are not guarantees of future performance and actual results or developments may differ materially from the forward-looking statements. Factors that could cause actual results to differ materially from those in forward-looking statements include market prices, exploitation and exploration successes, continued availability of capital and financing, general economic, market or business conditions. Investors are cautioned that any such statements are not guarantees of future performance and those actual results or developments may differ materially from those projected in the forward-looking statements.
To view the source version of this press release, please visit https://www.newsfilecorp.com/release/281295
DENVER, CO / ACCESS Newswire / January 22, 2026 / Solitario Resources Corp. ("Solitario" or the "Company") (NYSE American:XPL)(TSX:SLR) is pleased to announce that it has acquired the Bright Angel copper-gold project in Colorado. At Bright Angel, mineralized porphyry stockwork contains significant values of gold and copper, with minor silver values. Mineralization has been traced over an area approximately 750 meters long and up to 600 meters wide. Both gold and copper are trading at all-time highs, with copper being designated as a critical metal by the U.S. government.
Bright Angel was originally discovered and drilled in the late 1960's by a private party. Anaconda Copper leased the property in 1970 and drilled eleven core holes, maintaining the lease for ten years. The property has sat idle for the past 50 years until Solitario acquired the rights to earn 100% interest in the minerals from a private entity in September 2025.
To date, Solitario has completed a surface reconnaissance rock sampling program and has initiated drill hole permitting. Results of the surface sampling program have been highly encouraging with consistently anomalous to strong values of gold and copper (see table below and sample map here). Solitario has submitted a Notice of Intent to the U.S. Forest Service to commence an exploration drilling program at Bright Angel and is currently working on submitting a Plan of Operations.
Chris Herald, President and CEO of Solitario, stated: "With gold and copper prices at all-time highs, we are extremely excited about the potential of our newly acquired Bright Angel gold-copper property. Our geologic evaluation of Bright Angel is that it is an alkaline pipe-like porphyry system characterized by potentially high grades for both gold and copper with deep roots. We are focused on obtaining a drilling permit and testing this exceptional target, hopefully in late-2026.
The importance of this type of gold-copper deposit is now well-known, in large part due to Newcrest Mining's (now Newmont) world-class Cadia – Ridgeway copper-gold pipe-like porphyry deposits discovered in the mid-1990's. The Cadia – Ridgeway gold/copper endowment is estimated to be in excess of 20 million ounces of gold and 10 billion pounds of copper. The lateral footprint of alkaline copper/gold pipe-like porphyry systems are rather small, generally limited to several hundred meters in diameter, but often extending to depths greater than 1,000 meters. Another important attribute is that these deposits often occur in clusters."
|
Chris Herald, President and CEO, will present at the 2026 Metals Investor Forum in Vancouver, British Columbia, Canada on January 23 at 5:20 pm PST. The in-person live presentation will not be webcast. Mr. Herald plans to present an overview of Solitario's exploration plans for the Golden Crest gold project – Ponderosa area, Cat Creek molybdenum-rhenium project, Bright Angel copper-gold property, and its Florida Canyon and Lik zinc projects. |
History of Project
Drilling at Bright Angel began in the late-1960's when its initial owner completed 186 very shallow (~16 meters) and widely spaced drill holes. Twelve of the more mineralized holes were deepened to depths of up to 200 meters. Two of the holes reportedly intersected significant grades of gold and copper but are not reported here as Solitario is unable to verify the historic drill hole assay results. However, Solitario's surface rock sampling (see table below and sample map here) produced gold/copper grades consistent with the grades in the upper 20 meters of the reported historic drill holes. Drilling will be required to confirm drill hole grades reported in the historic files.
Anaconda Copper, formerly one of the largest mining companies in the world, leased the property in 1970 and drilled 11 widely spaced core holes ranging in depth from 270 to 783 meters. Anaconda's exploration program focused upon testing for a classic large-scale mushroom-shaped, calc-alkaline copper porphyry system common in the Arizona and Chilean copper belts. Calc-alkaline copper systems tend to be laterally extensive, often well over 1,000 meters in diameter. These copper systems are generally gold poor.
Anaconda intersected thick sections of 0.1% to 0.3% Cu in six of their core holes but generally did not assay for gold as gold price was fixed at $38 per ounce at that time and its exploration priority was a primary copper resource. Anaconda concluded that the Bright Angel porphyry was not a calc-alkaline porphyry system but continued to hold the lease for 10 years before exiting the mineral exploration business, when the property was dropped.
Solitario Surface Sampling
During late-fall, Solitario collected 27 select surface grab samples from an area approximately 750 meters x 600 meters. Results are presented in the Table below. This work confirmed widespread gold and copper mineralization in both porphyry intrusive rocks and skarn.
|
Surface Rock Assays |
||||||||
|
Sample # |
Cu % |
Au ppm |
Ag ppm |
Sample # |
Cu % |
Au ppm |
Ag ppm |
|
|
TBST-1 |
0.38 |
1.16 |
2.17 |
5942 |
0.43 |
0.07 |
0.47 |
|
|
TBST-2 |
0.044 |
0.04 |
0.3 |
5943 |
0.09 |
0.08 |
1.49 |
|
|
TBST-3 |
0.57 |
0.14 |
0.96 |
5944 |
0.73 |
0.35 |
4.95 |
|
|
TBST-4 |
0.85 |
0.74 |
1.35 |
5945 |
0.53 |
0.13 |
3.59 |
|
|
TBST-5 |
1.12 |
2.15 |
1.56 |
5946 |
0.15 |
0.31 |
1.47 |
|
|
TBST-6 |
1.17 |
0.37 |
3.04 |
5947 |
0.06 |
0.15 |
1.01 |
|
|
TBST-7 |
3.22 |
0.29 |
15 |
5948 |
3.30 |
0.37 |
27.00 |
|
|
TBST-8 |
8.45 |
0.67 |
38.8 |
5949 |
0.26 |
0.31 |
1.50 |
|
|
TBST-9 |
3.97 |
0.16 |
38 |
5950 |
0.57 |
0.10 |
0.62 |
|
|
5937 |
0.03 |
0.27 |
1.27 |
5951 |
0.02 |
0.02 |
0.24 |
|
|
5938 |
0.19 |
0.03 |
0.18 |
5952 |
0.34 |
0.09 |
1.08 |
|
|
5939 |
0.22 |
0.09 |
0.67 |
5953 |
1.00 |
0.12 |
8.88 |
|
|
5940 |
0.43 |
0.12 |
0.56 |
4747 |
0.00 |
0.03 |
0.17 |
|
|
5941 |
0.49 |
0.09 |
0.58 |
|||||
Plans are also underway to conduct a drone magnetic survey and possibly an Induced Polarization geophysical survey in the upcoming field season.
Sample Type, Sampling Methodology, Chain of Custody, Quality Control and Assurance
The reported Bright Angel rock assays are all select surface rock grab/float samples and were generally not collected from a bedrock source. However, these samples are thought to be derived from the underlying bedrock in the immediate area. Rock samples are reconnaissance select grab samples that display alteration, usually with silicification and silica-filled fractures +/- sulfide and copper mineralization. The significance of these results is limited to determining whether copper, gold, or trace elements usually associated with copper and gold, are present within the sampled rocks. These assay results should not be considered as representative of, nor verify economically mineable mineralization.
Samples were analyzed by ALS Laboratories in Reno, Nevada, a laboratory accredited in accordance with the standards of ISO 17025:2017. ALS is independent from Solitario. The samples were collected by Solitario geologists and submitted directly to ALS through secure chain of custody protocols or an independent sample preparation laboratory prior to being shipped to ALS. All activities prior to shipment were directly supervised by Solitario geologists. The samples were crushed and pulverized, and sample pulps were analyzed using industry standard fire assay and Inductively Coupled Plasma – Mass Spectrometry (ICP-MS) analytical methods.
Qualified Person
The scientific and technical information contained in this news release has been reviewed and approved by Walter Hunt, a qualified person as defined by Canadian instrument NI 43-101, Standards of Disclosure for Mineral Projects.
About Solitario
Solitario is a natural resource exploration company focused on high-quality Tier-1 gold, copper, zinc and critical metals (molybdenum and rhenium) projects. Solitario's 100%-owned Golden Crest properties in South Dakota constitute strategic land holdings (31,500 acres) along the western and southwestern extensions of the Homestake-Wharf mining district that has produced approximately 52 million ounces of gold. Golden Crest is scheduled for a major drilling campaign in 2026.
In addition to its Bright Angel and Golden Crest projects, Solitario holds a 100% interest in the Cat Creek critical minerals project (molybdenum-rhenium) in Colorado. Solitario also has a 50% joint venture interest (Teck Resources 50%) in the high-grade Lik zinc deposit in Alaska and a 39% joint venture interest (Nexa Resources 61%) in the high-grade Florida Canyon zinc project in Peru. Both Florida Canyon and Lik represent advanced exploration projects with over $110 million spent collectively on the properties. Solitario is carried to production on its Florida Canyon project through its joint venture arrangement with Nexa.
The Company is traded on the NYSE American ("XPL") and on the Toronto Stock Exchange ("SLR"). Solitario's Management and Directors hold approximately 8.0% (excluding options) and Newmont Corporation owns 9.3% of the Company's 90.9 million shares outstanding. Solitario's cash balance and marketable securities stand at approximately US$7.6 million. Additional information about Solitario is available online at www.solitarioresources.com.
Solitario has a long history of committed Environmental, Social and Responsible Governance ("ESG") of its business. We realize ESG issues are also important to investors, employees, and all stakeholders, including communities in which we work. We are committed to conducting our business in a manner that supports positive environmental and social initiatives and responsible corporate governance. Importantly, we work with joint venture partners that not only value the importance of ESG issues in the conduct of their business on our joint venture projects but are leaders in the industry in this important segment of our business.
For More Information Please Contact:
|
Christopher Herald, President and CEO |
303-534-1030 Ext. 1 |
Cautionary Statement Regarding Forward Looking Information
This press release contains forward-looking statements within the meaning of the U.S. Securities Act of 1933 and the U.S. Securities Exchange Act of 1934, and as defined in the United States Private Securities Litigation Reform Act of 1995 (and the equivalent under Canadian securities laws), that are intended to be covered by the safe harbor created by such sections. Forward-looking statements are statements that are not historical facts. They are based on the beliefs, estimates and opinions of the Company's management on the date the statements are made and address activities, events or developments that Solitario expects or anticipates will or may occur in the future, and are based on current expectations and assumptions. Technical data from the Bright Angel project was derived primarily from historic Anaconda files thought to be accurate, but have not verified by QAQC quality controls as defined by NI 43-101, Standards of Disclosure for Mineral Projects. Forward-looking statements involve numerous risks and uncertainties. Consequently, there can be no assurances that such statements will prove to be accurate and actual results and future events could differ materially from those anticipated in such statements. Such forward-looking statements include, without limitation, statements regarding the Company's expectation of the projected timing and outcome of engineering studies; expectations regarding the receipt of all necessary permits and approvals to implement a mining plan, if any, at any of its mineral properties. Important factors that could cause actual results to differ materially from those in the forward-looking statements include, among others, risks relating to risks that Solitario's and its joint venture partners' exploration and property advancement efforts will not be successful; risks relating to fluctuations in the price of gold, silver, copper, zinc, lead, and molybdenum; the inherently hazardous nature of mining-related activities; uncertainties concerning reserve and resource estimates; availability of outside contractors, and other activities; uncertainties relating to obtaining approvals and permits from governmental regulatory authorities; the possibility that environmental laws and regulations will change over time and become even more restrictive; and availability and timing of capital for financing the Company's exploration and development activities, including uncertainty of being able to raise capital on favorable terms or at all; as well as those factors discussed in Solitario's filings and reports with the U.S. Securities and Exchange Commission (the "SEC"), including Solitario's latest Annual Report on Form 10-K and its other SEC filings (and Canadian filings) including, without limitation, its latest Quarterly Report on Form 10-Q. The Company does not intend to publicly update any forward-looking statements, whether as a result of new information, future events, or otherwise, except as may be required under applicable securities laws.
SOURCE: Solitario Resources Corp.
View the original press release on ACCESS Newswire
Taranis Has One of the Best Silver Projects in British Columbia!
ESTES PARK, CO / ACCESS Newswire / January 20, 2026 / Taranis Resources Inc. ("Taranis" or the "Company") (TSX.V:TRO)(OTCQB:TNREF) is pleased to announce a major expansion of its flagship project in the historic Silver Cup Mining District located in southeast British Columbia. With the acquisition of new Mineral Tenures south and east of the "Thor" silver, gold, base metals, and critical minerals deposit, Taranis now controls upwards of 6,000 hectares in one of British Columbia's premier past producing silver districts. This expansion unites the five historical, past-producing mines of "Thor" into a continuous mineralized body and has now added at least five more historic mines, including four past producers, under Taranis' stewardship.
Taranis' Core Exploration Philosophy
In British Columbia's shifting legal landscape where the meaning and legitimacy of mineral ownership is now actively up for debate, Taranis' commitment to productive stewardship, labour, and value creation offers a compelling model for responsible and equitable land use. In today's rapidly evolving theatre of mineral exploration, it is important to define Management's perspective on not just technical, management and financial matters, but also on land use, and the many interactions with government that are required to conduct meaningful exploration in British Columbia.
The Silver Cup District, known since the 1890's for its high-grade silver and gold, is once again poised for resurgence. Taranis' systematic exploration and diamond drilling at the Thor Project have established a robust Mineral Resource, with recent drilling in 2025 identifying the Borr Zone – interpreted as the down-dip extension of the main deposit at Thor. The initial drill hole in this new zone intersected 5.25 meters of 26.2 g/t silver, 0.163 g/t gold, and 3.55% combined lead and zinc, underscoring exploration potential outside of known mineral deposits. (see Taranis News Release, October 27, 2025).
Taranis is now allocating more resources to its newly acquired clusters of historic mines, each with similar historical underground workings, and the potential to host additional Mineral Resources. These areas, untouched by modern exploration for a century, are strategic areas of growth for Taranis to generate value for its shareholders and for the broader community as formerly underutilized and idle lands are worked once more.
Taranis' Commitment to Productive Stewardship
Taranis holds Mineral Tenures solely to discover and define new Mineral Resources, not to extract rent, displace others, or speculate on future metal price increases. Management and our shareholders understand that while mining is by its nature an extractive activity, it is necessary for today's standard of living. Exploration and mining can be done responsibly. For two decades, Taranis has focused all of our available capital on exploration and resource growth, seeking objective facts about the Silver Cup district's mineral endowment that could eventually lead to developing a mine. We have successfully permitted a 10,000 tonne Bulk Sample that will help better define the quality of the Mineral Resource at Thor, and better define the economics of commercial development of the expanding Mineral Resource.
The Value of Labour and Stewardship in Property Rights
Taranis' approach to exploration and development is grounded in the principle that property rights of any kind should only be earned and kept through labour, investment, and responsible stewardship. By transforming idle ground into productive assets, Taranis creates tangible value for shareholders and the wider community. The company's pioneering work in the Silver Cup District – being the first to drill, explore, and develop these lands in almost 100 years – embodies the idea that ownership is not just a matter of legal title, but of active engagement and improvement.
Theories of property rights based on labour and improvement have been both foundational and controversial. Regardless, many of these concepts have historically been entrenched in the Mineral Tenure system in British Columbia, including the idea that registration of physical work on Mineral tenures should be available in lieu of payment to maintain mining claims. While some critiques highlight the risk of justifying dispossession or exploitation, Taranis believes that legitimate ownership arises from productive stewardship and the creation of value through work. We affirm that all people deserve the fruits of their labour, and are skeptical to claims of property based solely on first possession or inherited privilege – principles that can disadvantage communities, those that seek to grow the economy, and which overlook or actively undermine contributions of those who develop and work on the land.
In the current climate of shifting property paradigms in British Columbia, Taranis' model – rooted in active labour, stewardship, community benefit and participation – stands as a practical and ethical framework for resource development.
Administrative and Reconciliation Challenges to Mineral Exploration
The uncertainties associated with mineral exploration in British Columbia are vast. The historic domains of geological and financial risk are now overshadowed by regulatory uncertainty, and this has led to dramatic drops in exploration investment in the province in the past six years. As an example, Taranis acquired additional claims to the south and east of the new mine clusters on July 1, 2025. These Mineral Tenures were sent out for First Nations Consultation on August 28, 2025, under the newly created Mineral Claims Consultation Framework ("MCCF"). The Ministry of Critical Minerals indicated that Mineral Tenure consultations should last 90-120 days. However, as of 120+ days, Taranis has not received any comments as outlined under the MCCF. On December 26, 2025, the company contacted the Chief Gold Commissioner's Office for an explanation, but no response has been received from any level of government.
Taranis recognizes the importance of reconciliation with First Nations and supports British Columbia's efforts to address the complicated issues involved. At the same time, the company has a duty to its shareholders and the business community to disclose when critical regulatory benchmarks are missed. The lack of timely administrative clarity threatens to undermine both reconciliation and economic progress in the province, and Taranis calls for transparent, predictable processes that honour tradition while enabling responsible mineral resource development.
Brownfield Exploration – Integrating Modern Exploration Science with History
The Silver Cup Mining District is one of British Columbia's oldest silver mining areas. Historic mines such as Silver Cup, True Fissure, Great Northern and Blue Bell (Thor), Meridian/Eva, Spider, Triune, Nettie L, have operated in the district producing primarily silver. The lack of access and transportation in the area and the rugged terrain still makes exploration of the area extremely challenging. The many past producing mines are surrounded by areas of overburden and rockslide cover making exploration challenging – but at the same time offering exploration opportunities to make substantive virgin discoveries. Exploration diamond drilling technology did not even exist when most of these mines were developed. In the Company's Management opinion, integrating modern exploration methods with the certainty of historical information, provides a robust base to enable discovery.
2025 Ajax Mine Dump Sampling
A new Mineral Tenure acquired during a prior expansion of the Thor Property (See Taranis News Release dated 01/20/2025) serves to demonstrate the exploration potential outside of the Thor deposit. The Ajax Mine was accessed by helicopter in the fall of 2025 and cursory evaluation showed that it has remained idle and unworked since shortly after World War II. Historic reports throughout the Silver Cup district often ignored gold content, focusing on silver and avoiding zinc due to a price penalty at the smelter for zinc-heavy ores. Taranis sampled dump material from two adits and found anomalous gold content in all samples. Silver and base metals were not analyzed, but strong tetrahedrite, chalcopyrite, and sphalerite mineralization was observed. In the table below, we have outlined some of the gold values that are found in the previously mined material, and the reader is reminded that grab samples are selective and not representative of average grade or true metal content.
2025 Ajax Mine Dump Sampling Table
|
Sample Number |
Au (g/t) |
Grab Sample Description |
Location (UTM Zone 11N, WGS84) |
|
379751 |
1.14 |
Massive pyrite heavily oxidized on outside (hematite) |
Middle Adit Portal Dump (468447E, 5614845N) |
|
379752 |
0.02 |
Vuggy quartz-carbonate (siderite?) with iron oxide |
Middle Adit Portal Dump (468447E, 5614845N) |
|
379753 |
0.65 |
Quartz-sulfide breccia with tetrahedrite and carbonate clasts. |
Middle Adit Portal Dump (468447E, 5614845N) |
|
379754 |
0.15 |
Quartz-Carbonate rocks with quartz veins and balance of groundmass carbonate, minor pyrite. |
Middle Adit Portal Dump (468447E, 5614845N) |
|
379755 |
0.93 |
Heavily weathered quartz carbonate rocks (hematite). Pitted and vuggy due to weathering. |
Middle Adit Portal Dump (468447E, 5614845N) |
|
379756 |
0.01 |
Massive pyrite with fragments of white quartz |
Middle Adit Portal Dump (468447E, 5614845N) |
|
379757 |
0.23 |
Quartz sulfide breccia with abundant sphalerite and tetrahedrite. Abundant quartz fragments. |
Middle Adit Portal Dump (468447E, 5614845N) |
|
379758 |
19.90 |
Quartz-pyrite vein with pyrite). Extensive vugging similar to SIF at Thor. |
Upper Adit Portal Dump (468469E, 5614828N) |
|
379759 |
0.39 |
Massive sphalerite var. marmatite |
Upper Adit Portal Dump (468469E, 5614828N) |
|
379760 |
1.62 |
Vuggy quartz-sulfide breccia. Minor pyrite, similar to SIF material at Thor. |
Upper Adit Portal Dump (468469E, 5614828N) |
Comments
Most significant mineral deposits occur in clusters, and the Silver Cup Mining District contains many old groups of mines exploited in the early 1900's. Taranis continues to consolidate land in the district, transforming the area into a district-scale opportunity now totaling over 6,000 hectares. Despite the rugged terrain, Taranis has developed an exploration toolbox that makes it uniquely qualified to add valuable Mineral Resources throughout the re-emerging area.
Responsible and meaningful exploration in British Columbia by ‘junior exploration companies' is a complicated process that historically has been driven by technical and financial decisions. A third aspect, Mineral Tenure procurement and subsequent use, and access to those lands, has now taken a front row seat. Much the same as exploration companies report drilling results, resource companies now need to publicly address regulatory and ownership issues stemming from countervailing claims and titles. An individual company's perspective on these issues is arguably more important than reporting on exploration programs, because without a path forward to develop those mineral lands – exploration results are meaningless and work programs in general are stalled by a regulatory system that is paralyzed by competing interests.
Taranis' unique position as the only major explorer systematically advancing the Silver Cup Mining District is not just a strategic advantage – it is an important philosophical one. In a time when the foundations of property rights are being reconsidered, Taranis has chosen to be a living example of how active labor, stewardship, and community benefit can and should define legitimate ownership and responsible resource development in British Columbia.
Qualified Person
Exploration activities at Thor were overseen by John Gardiner (P. Geo.), President and CEO of Taranis Resources Inc., and a Qualified Person under Canadian National Instrument 43-101. Mr. Gardiner is the principal of John J. Gardiner & Associates, LLC, operating in British Columbia under Firm Permit Number 1002256. Mr. Gardiner has reviewed and approved the comments contained within this News Release.
Quality Control and Laboratory Methods
All samples for the Thor project were securely delivered to Actlabs in Kamloops, British Columbia. Analytical work was completed at both the Kamloops and Ancaster, Ontario locations. Actlabs is ISO 17025 accredited. Grab samples were sawed in half and analyzed for gold by 30g Fire Assay / Atomic Absorption Spectrophotometry ("AAS"). Overlimit gold values were quantified using gravimetric methods.
Taranis currently has 102,421,487 shares issued and outstanding (119,972,613 shares on a fully-diluted basis).
TARANIS RESOURCES INC.Per: John J. Gardiner (P. Geo.), President and CEO
For further information contact:John J. Gardiner681 Conifer LaneEstes Park, Colorado 80517Cell: (720) 209-3049johnjgardiner@earthlink.net
NEITHER THE TSX VENTURE EXCHANGE NOR ITS REGULATION SERVICES PROVIDER (AS THAT TERM IS DEFINED IN THE POLICIES OF THE TSX VENTURE EXCHANGE) ACCEPTS RESPONSIBILITY FOR THE ADEQUACY OR ACCURACY OF THIS NEWS RELEASE.
This News Release may contain forward-looking statements based on assumptions and judgments of management regarding future events or results that may prove to be inaccurate as a result of factors beyond its control, and actual results may differ materially from expected results.
SOURCE: Taranis Resources, Inc.
View the original press release on ACCESS Newswire
TORONTO, Jan. 20, 2026 /CNW/ – Bravo Mining Corp. (TSXV: BRVO) (OTCQX: BRVMF) ("Bravo" or the "Company") announces that it has closed the previously announced public offering (the "Offering") of common shares of the Company (the "Common Shares"). Pursuant to the Offering, the Company has issued 19,607,500 Common Shares at a price of C$4.40 per Common Share for gross proceeds of C$86,273,000, which includes the exercise in full of the over-allotment option granted to the Underwriters (as defined below). The Offering was co-led by BMO Capital Markets and National Bank Capital Markets on behalf of a syndicate that included Beacon Securities Limited and Canaccord Genuity Corp. (collectively, the "Underwriters").
In connection with the Offering, the Company has paid the Underwriters a cash commission in the aggregate amount of $4,313,650 equal to 5.0% of the gross proceeds of the Offering.
The Offering was made by way of a prospectus supplement dated January 15, 2026 to the Company's existing Canadian base shelf prospectus dated December 22, 2025, in the United States on a private placement basis pursuant to exemptions from the registration requirements of the United States Securities Act of 1933, as amended (the "U.S. Securities Act"), and in certain other jurisdictions outside of Canada and the United States.
The Common Shares have not been and will not be registered under the U.S. Securities Act and may not be offered or sold in the United States absent registration or an applicable exemption from the registration requirements under the U.S. Securities Act and applicable state securities laws. This news release shall not constitute an offer to sell or the solicitation of an offer to buy nor shall there be any sale of any securities in any jurisdiction in which such offer, solicitation or sale would be unlawful.
About Bravo Mining Corp.
Bravo is a Canadian and Brazil-based mineral exploration and development company focused on advancing its PGM and copper-gold Luanga Project in the Carajás Mineral Province, Pará State, Brazil.
Bravo is one of the most active explorers in Carajás. The team, comprising of local and international geologists, has a proven track record of PGM, nickel, and copper discoveries in the region. They have successfully taken a past IOCG greenfield project from discovery to development and production in the Carajás.
The Luanga Project is situated on mature freehold farming land and benefits from being located close to operating mines and a mining-experienced workforce, with excellent access and proximity to existing infrastructure, including road, rail, and hydroelectric grid power. Bravo's current Environmental, Social and Governance activities include planting more than 50,000 high-value trees in and around the project area and hiring and contracting locally.
Neither TSX Venture Exchange nor its Regulation Services Provider (as that term is defined in policies of the TSX Venture Exchange) accepts responsibility for the adequacy or accuracy of this release.
View original content to download multimedia: http://www.newswire.ca/en/releases/archive/January2026/20/c7613.html
As the U.S. stock market navigates a landscape of mixed bank earnings and fluctuating economic data, major indices have recently edged lower, while gold and silver reach new heights. In such an environment, identifying stocks that may be trading below their intrinsic value can present potential opportunities for investors seeking to capitalize on market inefficiencies.
Top 10 Undervalued Stocks Based On Cash Flows In The United States
| Name | Current Price | Fair Value (Est) | Discount (Est) |
| Workiva (WK) | $84.75 | $166.67 | 49.2% |
| WesBanco (WSBC) | $34.58 | $68.86 | 49.8% |
| UMB Financial (UMBF) | $123.30 | $243.75 | 49.4% |
| Motorcar Parts of America (MPAA) | $13.60 | $26.25 | 48.2% |
| Krystal Biotech (KRYS) | $282.01 | $555.39 | 49.2% |
| Investar Holding (ISTR) | $27.62 | $53.60 | 48.5% |
| Horizon Bancorp (HBNC) | $17.65 | $34.30 | 48.5% |
| Fifth Third Bancorp (FITB) | $49.02 | $95.11 | 48.5% |
| Dime Community Bancshares (DCOM) | $31.13 | $60.91 | 48.9% |
| Aptiv (APTV) | $82.61 | $163.62 | 49.5% |
We’ll examine a selection from our screener results.
Overview: The Kroger Co. operates as a food and drug retailer in the United States with a market cap of approximately $39.53 billion.
Operations: Kroger generates revenue primarily through its retail operations, amounting to $147.23 billion.
Estimated Discount To Fair Value: 22.2%
Kroger’s stock appears undervalued based on discounted cash flow analysis, trading over 20% below its estimated fair value of US$80.33. Despite slower revenue growth expectations compared to the market, Kroger’s earnings are forecasted to grow significantly at 29.7% annually, outpacing the broader market. Recent strategic moves include a significant share buyback plan and expanded delivery partnerships with Uber Eats and Instacart, potentially enhancing customer reach and operational efficiency amidst ongoing legal challenges and regulatory scrutiny.
- Upon reviewing our latest growth report, Kroger’s projected financial performance appears quite optimistic.
- Click to explore a detailed breakdown of our findings in Kroger’s balance sheet health report.
KR Discounted Cash Flow as at Jan 2026Lazard
Overview: Lazard, Inc. is a financial advisory and asset management firm with operations across the Americas, Europe, the Middle East, Africa, and the Asia Pacific, holding a market cap of approximately $4.92 billion.
Operations: Lazard, Inc. generates revenue primarily from its Financial Advisory segment at $1.81 billion and Asset Management segment at $1.22 billion.
Estimated Discount To Fair Value: 30.3%
Lazard’s stock is trading over 20% below its estimated fair value of US$77.11, highlighting potential undervaluation based on cash flows. While the company faces unstable dividend history and high debt levels, its earnings are projected to grow significantly at 29.9% annually, surpassing market averages. Recent leadership appointments in the Global Industrials Group may bolster strategic advisory capabilities across key sectors, potentially supporting revenue growth forecasts of 12.5% per year amidst a competitive landscape.
- Insights from our recent growth report point to a promising forecast for Lazard’s business outlook.
- Navigate through the intricacies of Lazard with our comprehensive financial health report here.
LAZ Discounted Cash Flow as at Jan 2026Sociedad Química y Minera de Chile
Overview: Sociedad Química y Minera de Chile S.A. is a global producer and seller of specialty plant nutrients and iodine derivatives, with a market cap of approximately $23.76 billion.
Operations: The company generates revenue from several segments, including Lithium and Derivatives at $2.08 billion, Iodine and Derivatives at $996.40 million, Specialty Plant Nutrition at $957.03 million, Potassium at $182.60 million, and Industrial Chemicals at $74.26 million.
Estimated Discount To Fair Value: 10.5%
Sociedad Química y Minera de Chile trades at US$79.58, about 10.5% below its fair value estimate of US$88.93, suggesting potential undervaluation based on cash flows. Despite high debt levels and a dividend not well covered by earnings, the company has returned to profitability with earnings projected to grow significantly at 28.6% annually, outpacing market averages. Recent strategic alliances in China may enhance long-term growth prospects amidst steady production and sales guidance for 2025.
- Our comprehensive growth report raises the possibility that Sociedad Química y Minera de Chile is poised for substantial financial growth.
- Dive into the specifics of Sociedad Química y Minera de Chile here with our thorough financial health report.
SQM Discounted Cash Flow as at Jan 2026Seize The Opportunity
- Discover the full array of 185 Undervalued US Stocks Based On Cash Flows right here.
- Are any of these part of your asset mix? Tap into the analytical power of Simply Wall St’s portfolio to get a 360-degree view on how they’re shaping up.
- Simply Wall St is your key to unlocking global market trends, a free user-friendly app for forward-thinking investors.
Contemplating Other Strategies?
- Explore high-performing small cap companies that haven’t yet garnered significant analyst attention.
- Diversify your portfolio with solid dividend payers offering reliable income streams to weather potential market turbulence.
- Fuel your portfolio with companies showing strong growth potential, backed by optimistic outlooks both from analysts and management.
This article by Simply Wall St is general in nature. We provide commentary based on historical data
and analyst forecasts only using an unbiased methodology and our articles are not intended to be financial advice.
It does not constitute a recommendation to buy or sell any stock, and does not take account of your objectives, or your
financial situation. We aim to bring you long-term focused analysis driven by fundamental data.
Note that our analysis may not factor in the latest price-sensitive company announcements or qualitative material.
Simply Wall St has no position in any stocks mentioned.
Companies discussed in this article include KR LAZ and SQM.
This article was originally published by Simply Wall St.
Have feedback on this article? Concerned about the content? Get in touch with us directly. Alternatively, email editorial-team@simplywallst.com
Why Sociedad Química y Minera de Chile (NYSE:SQM) is on investors’ radar
Sociedad Química y Minera de Chile (NYSE:SQM) has drawn attention after a strong share price move, with the stock up 2.7% over the past day and 10.8% over the past week.
Over the past month the stock shows a 28.0% return, while the past 3 months add up to an 87.2% gain. This makes recent performance a key focus for investors assessing what is driving sentiment.
See our latest analysis for Sociedad Química y Minera de Chile.
Looking beyond the recent jump, the stock shows building momentum, with an 87.2% 3 month share price return and a 106.6% 1 year total shareholder return. This points to a sharp shift in how the market is pricing Sociedad Química y Minera de Chile’s prospects and risks.
If SQM’s move has you thinking about what else is on the move, this could be a good moment to widen your search with fast growing stocks with high insider ownership.
With SQM up strongly over the past year and trading at a small intrinsic discount of about 6%, the key question is whether the recent optimism leaves any mispricing or if the market already reflects future growth.
Most Popular Narrative: 35.4% Overvalued
Compared with the narrative fair value of about US$61.44, Sociedad Química y Minera de Chile’s last close at US$83.18 implies a rich valuation that leans heavily on future execution.
Strong demand growth in electric vehicles (EVs) and renewable energy storage, particularly in China and Europe, is driving a sustained recovery in lithium prices and providing visible upside to SQM’s revenues and margins as sales volumes are guided to increase by at least 10% in 2025.
Curious what kind of revenue and margin profile could justify a higher future earnings base and still assume a lower P/E multiple than many peers? The narrative sets out a detailed earnings path, specific margin expansion, and a discount rate that together underpin that fair value. The tension between ambitious growth and a compressed future multiple is where the real story sits.
Result: Fair Value of $61.44 (OVERVALUED)
Have a read of the narrative in full and understand what’s behind the forecasts.
However, lithium price volatility and the unresolved Codelco joint venture terms could still upend these assumptions, potentially shifting earnings power and the valuation story quite quickly.
Find out about the key risks to this Sociedad Química y Minera de Chile narrative.
Another View: DCF Points in a Different Direction
While the narrative fair value of about US$61.44 suggests Sociedad Química y Minera de Chile is overvalued at US$83.18, our DCF model paints a different picture, with fair value at roughly US$88.76 and the shares trading at a 6.3% discount. Which set of assumptions do you find more realistic?
Look into how the SWS DCF model arrives at its fair value.
SQM Discounted Cash Flow as at Jan 2026
Simply Wall St performs a discounted cash flow (DCF) on every stock in the world every day (check out Sociedad Química y Minera de Chile for example). We show the entire calculation in full. You can track the result in your watchlist or portfolio and be alerted when this changes, or use our stock screener to discover 884 undervalued stocks based on their cash flows. If you save a screener we even alert you when new companies match – so you never miss a potential opportunity.
Build Your Own Sociedad Química y Minera de Chile Narrative
If you see the data differently or simply prefer to test your own assumptions, you can put together a full narrative in just a few minutes with Do it your way.
A great starting point for your Sociedad Química y Minera de Chile research is our analysis highlighting 3 key rewards and 2 important warning signs that could impact your investment decision.
Looking for more investment ideas?
If SQM has caught your eye, do not stop there; broaden your watchlist with a few focused stock ideas that could sharpen your next move.
-
Spot opportunities in smaller names by scanning these 3531 penny stocks with strong financials that pair lower share prices with more robust financial profiles.
-
Position yourself in the AI shift by checking out these 25 AI penny stocks targeting companies tied to artificial intelligence themes.
-
Hunt for value by reviewing these 884 undervalued stocks based on cash flows that screen for stocks pricing in less optimistic cash flow assumptions.
This article by Simply Wall St is general in nature. We provide commentary based on historical data and analyst forecasts only using an unbiased methodology and our articles are not intended to be financial advice. It does not constitute a recommendation to buy or sell any stock, and does not take account of your objectives, or your financial situation. We aim to bring you long-term focused analysis driven by fundamental data. Note that our analysis may not factor in the latest price-sensitive company announcements or qualitative material. Simply Wall St has no position in any stocks mentioned.
Companies discussed in this article include SQM.
Have feedback on this article? Concerned about the content? Get in touch with us directly. Alternatively, email editorial-team@simplywallst.com
Key Insights
- The projected fair value for FMC is US$26.28 based on 2 Stage Free Cash Flow to Equity
- Current share price of US$15.14 suggests FMC is potentially 42% undervalued
- The US$21.21 analyst price target for FMC is 19% less than our estimate of fair value
Today we will run through one way of estimating the intrinsic value of FMC Corporation (NYSE:FMC) by taking the expected future cash flows and discounting them to their present value. This will be done using the Discounted Cash Flow (DCF) model. There's really not all that much to it, even though it might appear quite complex.
Remember though, that there are many ways to estimate a company's value, and a DCF is just one method. If you want to learn more about discounted cash flow, the rationale behind this calculation can be read in detail in the Simply Wall St analysis model.
The Model
We are going to use a two-stage DCF model, which, as the name states, takes into account two stages of growth. The first stage is generally a higher growth period which levels off heading towards the terminal value, captured in the second 'steady growth' period. To begin with, we have to get estimates of the next ten years of cash flows. Where possible we use analyst estimates, but when these aren't available we extrapolate the previous free cash flow (FCF) from the last estimate or reported value. We assume companies with shrinking free cash flow will slow their rate of shrinkage, and that companies with growing free cash flow will see their growth rate slow, over this period. We do this to reflect that growth tends to slow more in the early years than it does in later years.
A DCF is all about the idea that a dollar in the future is less valuable than a dollar today, so we discount the value of these future cash flows to their estimated value in today's dollars:
10-year free cash flow (FCF) estimate
| 2026 | 2027 | 2028 | 2029 | 2030 | 2031 | 2032 | 2033 | 2034 | 2035 | |
| Levered FCF ($, Millions) | US$285.0m | US$354.1m | US$295.0m | US$330.0m | US$338.8m | US$348.4m | US$358.7m | US$369.6m | US$381.2m | US$393.2m |
| Growth Rate Estimate Source | Analyst x5 | Analyst x4 | Analyst x1 | Analyst x1 | Est @ 2.65% | Est @ 2.84% | Est @ 2.96% | Est @ 3.05% | Est @ 3.11% | Est @ 3.16% |
| Present Value ($, Millions) Discounted @ 12% | US$254 | US$281 | US$208 | US$207 | US$190 | US$174 | US$159 | US$146 | US$134 | US$123 |
("Est" = FCF growth rate estimated by Simply Wall St)Present Value of 10-year Cash Flow (PVCF) = US$1.9b
After calculating the present value of future cash flows in the initial 10-year period, we need to calculate the Terminal Value, which accounts for all future cash flows beyond the first stage. The Gordon Growth formula is used to calculate Terminal Value at a future annual growth rate equal to the 5-year average of the 10-year government bond yield of 3.3%. We discount the terminal cash flows to today's value at a cost of equity of 12%.
Terminal Value (TV)= FCF2035 × (1 + g) ÷ (r – g) = US$393m× (1 + 3.3%) ÷ (12%– 3.3%) = US$4.5b
Present Value of Terminal Value (PVTV)= TV / (1 + r)10= US$4.5b÷ ( 1 + 12%)10= US$1.4b
The total value is the sum of cash flows for the next ten years plus the discounted terminal value, which results in the Total Equity Value, which in this case is US$3.3b. The last step is to then divide the equity value by the number of shares outstanding. Relative to the current share price of US$15.1, the company appears quite undervalued at a 42% discount to where the stock price trades currently. Remember though, that this is just an approximate valuation, and like any complex formula – garbage in, garbage out.
NYSE:FMC Discounted Cash Flow January 15th 2026 Important Assumptions
The calculation above is very dependent on two assumptions. The first is the discount rate and the other is the cash flows. You don't have to agree with these inputs, I recommend redoing the calculations yourself and playing with them. The DCF also does not consider the possible cyclicality of an industry, or a company's future capital requirements, so it does not give a full picture of a company's potential performance. Given that we are looking at FMC as potential shareholders, the cost of equity is used as the discount rate, rather than the cost of capital (or weighted average cost of capital, WACC) which accounts for debt. In this calculation we've used 12%, which is based on a levered beta of 1.958. Beta is a measure of a stock's volatility, compared to the market as a whole. We get our beta from the industry average beta of globally comparable companies, with an imposed limit between 0.8 and 2.0, which is a reasonable range for a stable business.
View our latest analysis for FMC
SWOT Analysis for FMCStrength
- Debt is well covered by .
Weakness
- Interest payments on debt are not well covered.
- Dividend is low compared to the top 25% of dividend payers in the Chemicals market.
Opportunity
- Expected to breakeven next year.
- Has sufficient cash runway for more than 3 years based on current free cash flows.
- Good value based on P/S ratio and estimated fair value.
- Significant insider buying over the past 3 months.
Threat
- Debt is not well covered by operating cash flow.
- Paying a dividend but company is unprofitable.
Next Steps:
Whilst important, the DCF calculation ideally won't be the sole piece of analysis you scrutinize for a company. DCF models are not the be-all and end-all of investment valuation. Rather it should be seen as a guide to "what assumptions need to be true for this stock to be under/overvalued?" For example, changes in the company's cost of equity or the risk free rate can significantly impact the valuation. Why is the intrinsic value higher than the current share price? For FMC, we've compiled three additional items you should look at:
PS. The Simply Wall St app conducts a discounted cash flow valuation for every stock on the NYSE every day. If you want to find the calculation for other stocks just search here.
Have feedback on this article? Concerned about the content? Get in touch with us directly. Alternatively, email editorial-team (at) simplywallst.com.This article by Simply Wall St is general in nature. We provide commentary based on historical data and analyst forecasts only using an unbiased methodology and our articles are not intended to be financial advice. It does not constitute a recommendation to buy or sell any stock, and does not take account of your objectives, or your financial situation. We aim to bring you long-term focused analysis driven by fundamental data. Note that our analysis may not factor in the latest price-sensitive company announcements or qualitative material. Simply Wall St has no position in any stocks mentioned.
OTTAWA, ON, Jan. 14, 2026 /CNW/ – Northern Shield Resources Inc. ("Northern Shield" or the "Company") (TSXV: NRN) is pleased to announce that a large area of mineralization has been exposed at the Creston Copper target, on the Company's 100% owned Root & Cellar Property ("Root & Cellar" or the "Property"), Burin Peninsula, southeastern Newfoundland. The Property hosts 5 epithermal gold-silver-(tellurium) zones over a 6-kilometre strike-length, and a large, associated polymetallic porphyry copper-molybdenite-silver-tellurium-gold system.
This new area of mineralization, covering approximately 50 m x 30 m, has been exposed as quarrying continues in one of several aggregate quarries on the Property (Fig 1). Mineralization consists of variable concentrations of pyrite-galena (lead sulphide) -sphalerite (lead-zinc) bearing quartz veinlets, fractures and breccia fillings with minor chalcopyrite, chalcocite, molybdenite and other sulphide minerals hosted in a diatreme breccia and rhyolite dikes that cut the breccia (Fig 2). This zone is adjacent to a recently discovered hydrothermal breccia vent and 50 m from breccia-hosted copper mineralization with grades up to 1.2% Cu, originally discovered by a prospector (see Company news release May 21, 2019). Copper mineralization, +/- molybdenite, gold, silver and tellurium with grades, from previously collected rock grab samples, include 8.5% Cu, 1.1% Mo, 0.13 g/t Au and 54 g/t Ag and 60 ppm Te, (see Company news release April 19, 2023), are exposed in 4 of the 5 aggregate quarries on the Property over a strike-length of 570 metres. The zone, which continues to the northeast, follows a magnetic trend coincident with copper-molybdenite-anomalous soil samples.
Assay results from the new rock grab samples are pending.
Induced polarization (IP) and/or magneto-telluric (MT) geophysical surveys over the expanded Creston target area are out for tender.
"We are excited by the rapid changes in geology and mineralization and the zone of lead-zinc veins and breccias. This is the largest area of mineralization exposed to date at the Creston target and its position adjacent to the copper mineralization is consistent with the outer zone of Cu-Mo-Ag (Au-Te) porphyry systems and is most encouraging. We have been discovering increasingly substantial mineralization since intensifying our focus on the Creston target last summer, and we are eager to see the results of the geophysical surveys." – Ian Bliss, President and CEO, Northern Shield
Technical information in this news release was reviewed and approved by Christine Vaillancourt, P. Geo., the Company's Chief Geologist and a Qualified Person under National Instrument 43-101.
About Northern Shield Resources
Northern Shield Resources Inc. is a Canadian-based company, a leader in generating high-quality exploration targets, that views greenfield exploration as an opportunity to find a mineable, near surface deposit at relatively low cost. We implement a model driven exploration approach to reduce the risk associated with early-stage projects for ourselves, our shareholders, and the environment. This approach led us to option the Root & Cellar Property from a Newfoundland prospector, who discovered the copper mineralization, and then to its advancement to the large gold-silver-tellurium and porphyry copper/moly system that it has become.
Forward-Looking Statements Advisory
This news release contains statements concerning the exploration plans, results and potential for epithermal gold deposits, and other mineralization at the Company's Root & Cellar Property , geological, geophysical and geometrical analyses of the properties and comparisons of the properties to known epithermal gold deposits and other expectations, plans, goals, objectives, assumptions, information or statements about future, conditions, results of exploration or performance that may constitute forward-looking statements or information under applicable securities legislation. Such forward-looking statements or information are based on a number of assumptions, which may prove to be incorrect.
Although Northern Shield believes that the expectations reflected in such forward-looking statements or information are reasonable, undue reliance should not be placed on forward looking statements because Northern Shield can give no assurance that such expectations will prove to be correct. Forward-looking statements or information are based on current expectations, estimates and projections that involve a number of risks and uncertainties which could cause actual results to differ materially from those anticipated by Northern Shield and described in the forward looking statements or information. These risks and uncertainties include, but are not limited to, risks associated with geological, geometrical and geophysical interpretation and analysis, the ability of Northern Shield to obtain financing, equipment, supplies and qualified personnel necessary to carry on exploration and the general risks and uncertainties involved in mineral exploration and analysis.
The forward-looking statements or information contained in this news release are made as of the date hereof and Northern Shield undertakes no obligation to update publicly or revise any forward looking statements or information, whether as a result of new information, future events or otherwise, unless so required by applicable securities laws.
Neither TSX Venture Exchange nor its Regulation Services Provider (as that term is defined in policies of the TSX Venture Exchange) accepts responsibility for the adequacy or accuracy of this release.
Figure 1. Map showing location of recently exposed lead-zinc +/- molybdenite veins relative to copper mineralization and hydrothermal vent breccia. Locations are draped over analytical signature of the total magnetic intensity and satellite image. Figure 1b. Gossanous blocks of rock from the lead-zinc zone. (CNW Group/Northern Shield Resources Inc.)Figure 2a. Quartz-pyrite stockwork veining associated with strong potassium alteration of rhyolite and, Figure 2b, B-type vein (?) with pyrite along centreline, strong potassic altered margins and minor galena or molybdenite. Figure 2c. Crackled brecciated rhyolite with sphalerite-filled fractures (zinc sulphide) and pyrite veins. (CNW Group/Northern Shield Resources Inc.)Figure 2d, Galena (?)-pyrite +/- sphalerite vein within rhyolite dyke and diatreme breccia (2e&f). (CNW Group/Northern Shield Resources Inc.)
Cision
View original content to download multimedia: http://www.newswire.ca/en/releases/archive/January2026/14/c5812.html
With the business potentially at an important milestone, we thought we'd take a closer look at Rock Tech Lithium Inc.'s (CVE:RCK) future prospects. Rock Tech Lithium Inc. engages in the exploration and development of lithium properties. With the latest financial year loss of CA$15m and a trailing-twelve-month loss of CA$12m, the CA$104m market-cap company alleviated its loss by moving closer towards its target of breakeven. Many investors are wondering about the rate at which Rock Tech Lithium will turn a profit, with the big question being “when will the company breakeven?” Below we will provide a high-level summary of the industry analysts’ expectations for the company.
Consensus from 2 of the Canadian Metals and Mining analysts is that Rock Tech Lithium is on the verge of breakeven. They anticipate the company to incur a final loss in 2025, before generating positive profits of CA$10m in 2026. So, the company is predicted to breakeven approximately a year from now or less! At what rate will the company have to grow in order to realise the consensus estimates forecasting breakeven in under 12 months? Using a line of best fit, we calculated an average annual growth rate of -33%,
TSXV:RCK Earnings Per Share Growth January 9th 2026
Given this is a high-level overview, we won’t go into details of Rock Tech Lithium's upcoming projects, though, bear in mind that typically metals and mining companies, depending on the stage of operation and metals mined, have irregular periods of cash flow. So, periods of lower growth in the upcoming years is not out of the ordinary, particularly when a company is in a period of investment.
View our latest analysis for Rock Tech Lithium
Before we wrap up, there’s one aspect worth mentioning. Rock Tech Lithium currently has no debt on its balance sheet, which is rare for a loss-making metals and mining company, which typically has high debt relative to its equity. This means that the company has been operating purely on its equity investment and has no debt burden. This aspect reduces the risk around investing in the loss-making company.
Next Steps:
This article is not intended to be a comprehensive analysis on Rock Tech Lithium, so if you are interested in understanding the company at a deeper level, take a look at Rock Tech Lithium's company page on Simply Wall St. We've also compiled a list of pertinent factors you should further examine:
Valuation: What is Rock Tech Lithium worth today? Has the future growth potential already been factored into the price? The intrinsic value infographic in our free research report helps visualize whether Rock Tech Lithium is currently mispriced by the market.
Management Team: An experienced management team on the helm increases our confidence in the business – take a look at who sits on Rock Tech Lithium’s board and the CEO’s background.
Other High-Performing Stocks: Are there other stocks that provide better prospects with proven track records? Explore our free list of these great stocks here.
Have feedback on this article? Concerned about the content? Get in touch with us directly. Alternatively, email editorial-team (at) simplywallst.com.This article by Simply Wall St is general in nature. We provide commentary based on historical data and analyst forecasts only using an unbiased methodology and our articles are not intended to be financial advice. It does not constitute a recommendation to buy or sell any stock, and does not take account of your objectives, or your financial situation. We aim to bring you long-term focused analysis driven by fundamental data. Note that our analysis may not factor in the latest price-sensitive company announcements or qualitative material. Simply Wall St has no position in any stocks mentioned.
While "the trend is your friend" when it comes to short-term investing or trading, timing entries into the trend is a key determinant of success. And increasing the odds of success by making sure the sustainability of a trend isn't easy.
Often, the direction of a stock's price movement reverses quickly after taking a position in it, making investors incur a short-term capital loss. So, it's important to ensure that there are enough factors — such as sound fundamentals, positive earnings estimate revisions, etc. — that could keep the momentum in the stock going.
Our "Recent Price Strength" screen, which is created on a unique short-term trading strategy, could be pretty useful in this regard. This predefined screen makes it really easy to shortlist the stocks that have enough fundamental strength to maintain their recent uptrend. Also, the screen passes only the stocks that are trading in the upper portion of their 52-week high-low range, which is usually an indicator of bullishness.
There are several stocks that passed through the screen and Impala Platinum Holdings Ltd. (IMPUY) is one of them. Here are the key reasons why this stock is a solid choice for "trend" investing.
A solid price increase over a period of 12 weeks reflects investors' continued willingness to pay more for the potential upside in a stock. IMPUY is quite a good fit in this regard, gaining 37.1% over this period.
However, it's not enough to look at the price change for around three months, as it doesn't reflect any trend reversal that might have happened in a shorter time frame. It's important for a potential winner to maintain the price trend. A price increase of 37.9% over the past four weeks ensures that the trend is still in place for the stock of this company.
Moreover, IMPUY is currently trading at 97.6% of its 52-week High-Low Range, hinting that it can be on the verge of a breakout.
Looking at the fundamentals, the stock currently carries a Zacks Rank #1 (Strong Buy), which means it is in the top 5% of more than the 4,000 stocks that we rank based on trends in earnings estimate revisions and EPS surprises — the key factors that impact a stock's near-term price movements.
The Zacks Rank stock-rating system, which uses four factors related to earnings estimates to classify stocks into five groups, ranging from Zacks Rank #1 (Strong Buy) to Zacks Rank #5 (Strong Sell), has an impressive externally-audited track record, with Zacks Rank #1 stocks generating an average annual return of +25% since 1988. You can see the complete list of today's Zacks Rank #1 (Strong Buy) stocks here >>>>
Another factor that confirms the company's fundamental strength is its Average Broker Recommendation of #1 (Strong Buy). This indicates that the brokerage community is highly optimistic about the stock's near-term price performance.
So, the price trend in IMPUY may not reverse anytime soon.
In addition to IMPUY, there are several other stocks that currently pass through our "Recent Price Strength" screen. You may consider investing in them and start looking for the newest stocks that fit these criteria.
This is not the only screen that could help you find your next winning stock pick. Based on your personal investing style, you may choose from over 45 Zacks Premium Screens that are strategically created to beat the market.
However, keep in mind that the key to a successful stock-picking strategy is to ensure that it produced profitable results in the past. You could easily do that with the help of the Zacks Research Wizard. In addition to allowing you to backtest the effectiveness of your strategy, the program comes loaded with some of our most successful stock-picking strategies.
Click here to sign up for a free trial to the Research Wizard today.
Want the latest recommendations from Zacks Investment Research? Today, you can download 7 Best Stocks for the Next 30 Days. Click to get this free report
Impala Platinum Holdings Ltd. (IMPUY) : Free Stock Analysis Report
This article originally published on Zacks Investment Research (zacks.com).
American Resources Corporation AREC, via its minority holding in ReElement Technologies Corporation, has formed a partnership with Transition Equity Partners (“TEP”) for a $200 million strategic equity facility to accelerate global critical mineral and rare earth refining capacity and strengthen U.S. supply chains.
The capital will initially be used to expand the deployment of ReElement’s proprietary modular, multi-mineral refining platform and buildout of its Marion, IN facility, with targeted initial capacity exceeding 10,000 metric tons per year of refined critical minerals, including light and heavy rare earths and defense-related elements, sourced from recycled materials and mined concentrates.
The partnership also envisions the development of additional refining facilities across the United States and select international locations. ReElement’s chromatographic separation technology enables the production of high-purity critical minerals that are currently unavailable at a commercial scale domestically, helping address strategic supply gaps and reduce dependence on foreign suppliers.
The company is reinforcing its U.S. supply chain footprint through collaborations with the U.S. Department of War, Vulcan Elements and POSCO International to support the production of rare earth magnets and defense-critical materials. TEP’s global investment experience and advisory capabilities are expected to support ReElement’s international expansion further while enhancing resilient supply chains for energy, defense and advanced manufacturing markets.
Shares of AREC have rallied 276% in the past six months compared with the industry’s 21.6% rise.
Image Source: Zacks Investment Research
AREC’s Zacks Rank & Key Picks
AREC currently carries a Zacks Rank of #3 (Hold).
Some better-ranked stocks in the Basic Materials space are BHP Group Limited BHP, Impala Platinum Holdings Limited IMPUY and Sibanye Stillwater Limited SBSW. BHP, IMPUY and SBSW sport a Zacks Rank of #1 (Strong Buy). You can see the complete list of today’s Zacks #1 Rank stocks here.
The Zacks Consensus Estimate for BHP’s current fiscal-year earnings is pegged at $4.51 per share, indicating a 23.9% year-over-year increase. Shares of BHP have gained 31.3% over the past six months.
The Zacks Consensus Estimate for IMPUY’s current fiscal-year earnings stands at $1.33 per share, implying a 2,560% year-over-year increase. Shares of IMPUY have gained 86.1% over the past six months.
The Zacks Consensus Estimate for SBSW’s current fiscal-year earnings is pegged at $2.4 per share, indicating a 1,614.3% year-over-year increase. Shares of SBSW have soared 116.7% over the past six months.
Want the latest recommendations from Zacks Investment Research? Today, you can download 7 Best Stocks for the Next 30 Days. Click to get this free report
BHP Group Limited Sponsored ADR (BHP) : Free Stock Analysis Report
Impala Platinum Holdings Ltd. (IMPUY) : Free Stock Analysis Report
American Resources Corporation (AREC) : Free Stock Analysis Report
Sibanye Gold Limited (SBSW) : Free Stock Analysis Report
This article originally published on Zacks Investment Research (zacks.com).
As the Australian market navigates a post-holiday slump, with key indices trending downward despite a rally in the materials sector, investors are keenly watching for opportunities amidst fluctuating commodity prices and geopolitical developments. In this dynamic environment, identifying stocks that can thrive involves looking at companies with strong fundamentals and potential to capitalize on emerging trends, such as those in ethical investment and innovative sectors.
Top 10 Undiscovered Gems With Strong Fundamentals In Australia
|
Name |
Debt To Equity |
Revenue Growth |
Earnings Growth |
Health Rating |
|---|---|---|---|---|
|
Fiducian Group |
NA |
10.00% |
9.57% |
★★★★★★ |
|
Joyce |
NA |
9.93% |
17.54% |
★★★★★★ |
|
Hearts and Minds Investments |
NA |
56.27% |
59.19% |
★★★★★★ |
|
Euroz Hartleys Group |
NA |
1.82% |
-25.32% |
★★★★★★ |
|
Argosy Minerals |
NA |
-12.81% |
-19.89% |
★★★★★★ |
|
Focus Minerals |
NA |
75.35% |
51.34% |
★★★★★★ |
|
Energy World |
NA |
-47.50% |
-44.86% |
★★★★★☆ |
|
Zimplats Holdings |
5.44% |
-9.79% |
-42.03% |
★★★★★☆ |
|
Australian United Investment |
1.90% |
5.23% |
4.56% |
★★★★☆☆ |
|
Reef Casino Trust |
19.84% |
6.96% |
10.88% |
★★★★☆☆ |
Here’s a peek at a few of the choices from the screener.
Simply Wall St Value Rating: ★★★★★★
Overview: Australian Ethical Investment Ltd is a publicly owned investment manager with a market cap of A$581.84 million, focusing on ethical and sustainable investment strategies.
Operations: The company generates revenue primarily from its funds management segment, amounting to A$119.38 million.
Australian Ethical Investment, a smaller player in the financial sector, has been making waves with its impressive performance metrics. Over the past year, earnings surged by 75.1%, outpacing the industry average of 6%. The company is debt-free and boasts high-quality earnings, suggesting a robust financial health. With levered free cash flow reaching A$26.35 million as of June 2025 and no debt for over five years, it seems well-positioned for continued growth. Earnings are projected to grow at an annual rate of 18.34%, painting a promising picture for future prospects in ethical investing.
ASX:AEF Earnings and Revenue Growth as at Jan 2026Advanced Innergy Holdings
Simply Wall St Value Rating: ★★★★☆☆
Overview: Advanced Innergy Holdings Limited specializes in the design, engineering, manufacturing, and installation of essential insulation, buoyancy, cable protection, and fire protection systems for energy and industrial sectors with a market capitalization of approximately A$405.45 million.
Operations: Advanced Innergy Holdings generates revenue through the design, engineering, manufacturing, and installation of insulation, buoyancy, cable protection, and fire protection systems. The company has a market capitalization of approximately A$405.45 million.
Advanced Innergy Holdings, a compact player in the machinery sector, has shown impressive financial strides. Their earnings skyrocketed by 163% over the past year, outpacing the industry’s 13.6% growth rate. Despite a high net debt to equity ratio of 55%, their interest payments are comfortably covered by EBIT at 3.8 times. The company reported A$150 million from its recent IPO and trades at 32% below estimated fair value, suggesting potential upside for investors. With revenue climbing to £150 million and net income more than doubling to £10 million in fiscal year 2025, AIH seems poised for continued expansion with forecasted revenue growth of nearly A$388 million in 2026.
ASX:AIH Debt to Equity as at Jan 2026Ricegrowers
Simply Wall St Value Rating: ★★★★★☆
Overview: Ricegrowers Limited is a rice food company with operations spanning Australia, New Zealand, the Pacific Islands, Europe, the Middle East, Africa, Asia, and North America and has a market cap of A$1.13 billion.
Operations: Ricegrowers Limited generates revenue primarily from its rice food segment, with reported figures reaching A$1.82 billion. The company’s financial performance is influenced by various factors, including market conditions across its diverse geographical operations.
Ricegrowers, a key player in the rice industry, is capitalizing on expanding markets like the Middle East and the U.S., driven by growing demand. The company reported A$882.34 million in sales for the half-year ending October 2025, with net income rising to A$35.95 million from A$31.25 million a year prior. Its earnings per share increased to A$0.534 from A$0.472, indicating strong operational performance despite sales dipping slightly from last year’s figures of A$910.67 million. With a satisfactory net debt to equity ratio of 23%, Ricegrowers is well-positioned for strategic acquisitions and continued growth initiatives.
ASX:SGLLV Debt to Equity as at Jan 2026Next Steps
-
Delve into our full catalog of 60 ASX Undiscovered Gems With Strong Fundamentals here.
-
Are you invested in these stocks already? Keep abreast of every twist and turn by setting up a portfolio with Simply Wall St, where we make it simple for investors like you to stay informed and proactive.
-
Maximize your investment potential with Simply Wall St, the comprehensive app that offers global market insights for free.
Want To Explore Some Alternatives?
-
Explore high-performing small cap companies that haven’t yet garnered significant analyst attention.
-
Fuel your portfolio with companies showing strong growth potential, backed by optimistic outlooks both from analysts and management.
-
Find companies with promising cash flow potential yet trading below their fair value.
This article by Simply Wall St is general in nature. We provide commentary based on historical data and analyst forecasts only using an unbiased methodology and our articles are not intended to be financial advice. It does not constitute a recommendation to buy or sell any stock, and does not take account of your objectives, or your financial situation. We aim to bring you long-term focused analysis driven by fundamental data. Note that our analysis may not factor in the latest price-sensitive company announcements or qualitative material. Simply Wall St has no position in any stocks mentioned.
Companies discussed in this article include ASX:AEF ASX:AIH and ASX:SGLLV.
Have feedback on this article? Concerned about the content? Get in touch with us directly. Alternatively, email editorial-team@simplywallst.com
Denison Mines Corp. DNN recently announced that its flagship Phoenix In-Situ Recovery (ISR) uranium project, located at the Wheeler River in Saskatchewan, is now fully prepared to advance into the construction phase, subject to final regulatory approval, expected in the first quarter of 2026. DNN expects to make a final investment decision (FID) following receipt of final regulatory approvals.
The company noted that major progress was achieved throughout 2025 across regulatory approvals, detailed engineering, procurement and construction planning, including the completion of the Canadian Nuclear Safety Commission’s public hearing process and prior provincial environmental clearance.
Denison reaffirmed that Phoenix is on track to become Canada’s first new large-scale uranium mine since Cigar Lake, with an expected 24-month construction period and first production targeted for mid-2028, assuming permits are finalized and a positive FID. The company updated the post-FID initial capital cost to approximately $600 million on a Class 2 budget basis, reflecting inflation and project refinements compared to the 2023 feasibility study, including roughly $65 million in contingency funds. No further revisions are anticipated before construction commencement.
Construction readiness is supported by largely completed detailed engineering, procurement of long-lead items, near-final construction contracts for 2026, and initial provincial approval for early site works.
Shares of DNN rallied 67.4% over the past six months compared with the industry’s 18.1% rise.
Zacks Investment Research
Image Source: Zacks Investment Research
DNN Zacks Rank & Key Picks
DNN currently carries a Zacks Rank of #3 (Hold).
Some better-ranked stocks in the Basic Materials space areImpala Platinum Holdings Limited IMPUY, BHP Group Limited BHP and Paladin Energy Ltd. PALAF. IMPUY sports a Zacks Rank of #1 (Strong Buy), while BHP and PALAF carry a Zacks Rank of #2 (Buy). You can see the complete list of today’s Zacks #1 Rank stocks here.
The Zacks Consensus Estimate for IMPUY’s current fiscal-year earnings is pegged at $1.33 per share, indicating a 2,560% year-over-year increase. Shares of IMPUY have jumped 67.2% over the past six months.
The Zacks Consensus Estimate for BHP’s current fiscal-year earnings stands at $4.51 per share, implying a 23.9% year-over-year increase. Shares of BHP have gained 25% over the past six months.
The Zacks Consensus Estimate for PALAF’s current fiscal-year earnings is pegged at 5 cents per share, indicating a 139% year-over-year increase. Shares of PALAF have soared 39.9% over the past six months.
Want the latest recommendations from Zacks Investment Research? Today, you can download 7 Best Stocks for the Next 30 Days. Click to get this free report
BHP Group Limited Sponsored ADR (BHP) : Free Stock Analysis Report
Impala Platinum Holdings Ltd. (IMPUY) : Free Stock Analysis Report
Denison Mine Corp (DNN) : Free Stock Analysis Report
Paladin Energy Ltd. (PALAF) : Free Stock Analysis Report
This article originally published on Zacks Investment Research (zacks.com).
As we usher in 2026, the Australian market has been marked by a flat trading session with materials leading gains, while IT sectors lagged behind. In this landscape of cautious optimism and sector-specific movements, identifying hidden opportunities requires a keen eye for stocks that can thrive despite broader market uncertainties.
Top 10 Undiscovered Gems With Strong Fundamentals In Australia
| Name | Debt To Equity | Revenue Growth | Earnings Growth | Health Rating |
|---|---|---|---|---|
| Fiducian Group | NA | 10.00% | 9.57% | ★★★★★★ |
| Joyce | NA | 9.93% | 17.54% | ★★★★★★ |
| Hearts and Minds Investments | NA | 56.27% | 59.19% | ★★★★★★ |
| Euroz Hartleys Group | NA | 1.82% | -25.32% | ★★★★★★ |
| Argosy Minerals | NA | -12.81% | -19.89% | ★★★★★★ |
| Focus Minerals | NA | 75.35% | 51.34% | ★★★★★★ |
| Energy World | NA | -47.50% | -44.86% | ★★★★★☆ |
| Zimplats Holdings | 5.44% | -9.79% | -42.03% | ★★★★★☆ |
| Peet | 53.46% | 12.70% | 31.21% | ★★★★☆☆ |
| Australian United Investment | 1.90% | 5.23% | 4.56% | ★★★★☆☆ |
Here we highlight a subset of our preferred stocks from the screener.
Simply Wall St Value Rating: ★★★★★★
Overview: Cedar Woods Properties Limited is an Australian company that focuses on property development and investment, with a market cap of A$727.40 million.
Operations: Cedar Woods Properties generates revenue primarily from its property development and investment activities, totaling A$465.94 million. The company’s financial performance is influenced by its cost structure, which impacts the net profit margin.
Cedar Woods Properties, a notable player in the Australian property market, has shown consistent earnings growth of 12.1% annually over the past five years. The company’s net debt to equity ratio stands at a satisfactory 25.8%, with interest payments well-covered by EBIT at 7.2 times. Trading at 43.8% below its estimated fair value, Cedar Woods is poised for further growth with an expected earnings increase of 19.8% per year and a robust presales pipeline valued at A$660 million providing revenue stability. Despite challenges like potential interest rate hikes and rising construction costs, recent guidance indicates record profits for financial year 2026, supporting increased dividends and reflecting strong sales volumes.
ASX:CWP Earnings and Revenue Growth as at Jan 2026IVE Group
Simply Wall St Value Rating: ★★★★★☆
Overview: IVE Group Limited, along with its subsidiaries, operates in the marketing sector in Australia and has a market capitalization of A$465.68 million.
Operations: IVE Group generates revenue primarily from its advertising segment, amounting to A$959.25 million.
IVE Group, a small player in Australia’s media and communications sector, has shown impressive financial performance with earnings growth of 69.2% over the past year. This growth outpaced the broader media industry, which saw a contraction of 42.8%. Despite its high net debt to equity ratio at 51.7%, IVE’s interest payments are well covered by EBIT at 5.1 times coverage, indicating solid operational efficiency. The company’s debt to equity ratio has improved from 105.1% to 75.2% over five years, suggesting prudent financial management while trading at a significant discount of 72.8% below estimated fair value offers potential upside for investors.
- Take a closer look at IVE Group’s potential here in our health report.
-
Gain insights into IVE Group’s historical performance by reviewing our past performance report.
ASX:IGL Earnings and Revenue Growth as at Jan 2026Mayfield Group Holdings
Simply Wall St Value Rating: ★★★★★★
Overview: Mayfield Group Holdings Limited, along with its subsidiaries, offers electrical and telecommunications infrastructure products and services in Australia, with a market capitalization of A$376 million.
Operations: Mayfield Group Holdings generates revenue primarily from its electrical and telecommunications infrastructure segment, amounting to A$118.14 million. The company’s financial performance can be analyzed through its net profit margin trends over recent periods.
Mayfield Group Holdings, a notable player in the electrical industry, has seen its earnings grow by 32.5% over the past year, outpacing the industry’s 9.9% growth rate. With a debt to equity ratio that has improved from 8.9% to just 0.2% in five years, it appears financially stable and holds more cash than total debt, easing concerns about interest payments. Despite recent significant insider selling and shareholder dilution due to follow-on equity offerings totaling A$33 million at A$1.90 per share, the company remains profitable with high-quality earnings and positive free cash flow of A$15 million as of June 2024.
- Click to explore a detailed breakdown of our findings in Mayfield Group Holdings’ health report.
-
Explore historical data to track Mayfield Group Holdings’ performance over time in our Past section.
ASX:MYG Debt to Equity as at Jan 2026Where To Now?
- Get an in-depth perspective on all 59 ASX Undiscovered Gems With Strong Fundamentals by using our screener here.
- Have you diversified into these companies? Leverage the power of Simply Wall St’s portfolio to keep a close eye on market movements affecting your investments.
- Simply Wall St is a revolutionary app designed for long-term stock investors, it’s free and covers every market in the world.
Contemplating Other Strategies?
- Explore high-performing small cap companies that haven’t yet garnered significant analyst attention.
- Fuel your portfolio with companies showing strong growth potential, backed by optimistic outlooks both from analysts and management.
- Find companies with promising cash flow potential yet trading below their fair value.
This article by Simply Wall St is general in nature. We provide commentary based on historical data
and analyst forecasts only using an unbiased methodology and our articles are not intended to be financial advice. It does not constitute a recommendation to buy or sell any stock, and does not take account of your objectives, or your
financial situation. We aim to bring you long-term focused analysis driven by fundamental data.
Note that our analysis may not factor in the latest price-sensitive company announcements or qualitative material.
Simply Wall St has no position in any stocks mentioned.
Companies discussed in this article include ASX:CWP ASX:IGL and ASX:MYG.
Have feedback on this article? Concerned about the content? Get in touch with us directly. Alternatively, email editorial-team@simplywallst.com
VANCOUVER, BC / ACCESS Newswire / January 5, 2026 / Apex Critical Metals Corp. (CSE:APXC)(OTCQX:APXCF)(FWB:KL9) ("Apex" or the "Company"), a Canadian mineral exploration company focused on the identification and development of critical and strategic metals, is pleased to announce that it has received approval from the Nebraska Department of Water, Energy and Environment ("NDEE") for its mineral exploration permit ("drill permit") at the Company's flagship Rift Rare Earth Project, located within the Elk Creek Carbonatite Complex in southeastern Nebraska, U.S.A.
Apex CEO, Sean Charland, stated: "We have been very active expanding and consolidating our property position and completing historical re-logging, re-assaying and 3D modelling work in preparation for our inaugural drill campaign at the Rift Rare Earth Project. We are very pleased to receive our drill permit, which marks a significant step forward as we transition from planning and preparation to drill program execution. We are eager to begin verifying and expanding upon the excellent historical results, which we believe can rapidly position the Rift Project as one of the premier rare earth projects in North America."
The Rift Project now covers approximately 3,500 acres across the Elk Creek Carbonatite Complex-an area with extensive historical drilling by previous operators, including Molycorp (1973-1986) and Quantum Rare Earth Developments (2010-2011). Historical programs reported broad, high-grade REE mineralized intervals, including:
-
155.5 metres ("m") of 2.70% REO(1), including 54.9 m at 3.30% REO (EC-93).
-
236.2 m of 2.10% REO, including 68.2 m of 3.32% REO (NEC11-004).
Drill Program Preparations
With a permit now in hand, Apex has begun advancing all pre-drilling activities, with drilling expected to commence during the first half of Q1/2026. Ongoing preparations include:
-
Finalizing discussions with contractors
-
Securing drill mobilization schedules and support services
-
Establishing access routes and planned drill pad locations
-
Completing logistical planning for core handling, sampling, and onsite operations; and
-
Target refinement based on historical data and detailed geological review.
A detailed summary of the drillhole locations and planned meterage will be released as the program commences.
Management cautions that drillhole EC-93 is historical and was originally completed by Molycorp between 1984-1986 with reanalysis performed by Quantum Rare Earth Development Corp. in 2010. The EC-93 results presented herein are from the 2010 reanalysis.
1Rare earth oxide (REO), includes the sum of Ce2O3, La2O3, Pr2O3, Nd2O3, Eu2O3, Sm2O3, Gd2O3, Tb2O3, Dy2O3, Ho2O3, Er2O3, Tm2O3, Yb2O3, Lu2O3, and Y2O3
Qualified Person
The technical content of this news release has been reviewed and approved by Nathan Schmidt, P. Geo., a Qualified Person under NI 43-101 on standards of disclosure for mineral projects. Mr. Schmidt is a Geologist with Dahrouge Geological Consulting Ltd., the consulting firm engaged by Apex Critical Metals Corp. to conduct and oversee all of the Company's exploration work, including the 2026 drill program.
References
Molycorp, Inc. (1973-1986). Elk Creek Carbonatite Exploration Drill Program Reports. Internal company records, archived at the Nebraska Geological Survey, Lincoln, Nebraska, USA.
Daigle, P., P.Geo. (2012).; NI 43-101 Elk Creek NB Project, Nebraska, US – Resource Estimate Update, Prepared for Quantum Rare Earth Development Corp., by Tetra Tech Wardrop, April 23, 2012.
Quantum Rare Earth Developments Corp. (2011). "Quantum Announces Significant Rare Earth Results from Elk Creek, Nebraska." News Release, September 20, 2011.
About Apex Critical Metals Corp. (CSE: APXC) (OTCQX: APXCF) (FWB: KL9)
Apex Critical Metals Corp. is a Canadian exploration company focused on advancing rare earth element (REE) and niobium projects that support the growing demand for critical and strategic metals across the United States and Canada. The Company's flagship Rift Project, located within the highly prospective Elk Creek Carbonatite Complex in Nebraska, U.S.A., hosts extensive rare earth rights surrounding one of North America's most advanced niobium-REE deposits. Historical drilling across the complex has reported broad intervals of high-grade REE mineralization, including intercepts such as 155.5 m of 2.70% REO and 68.2 m of 3.32% REO.
In Canada, Apex continues to advance its 100%-owned Cap Project, located 85 kilometres northeast of Prince George, British Columbia. The 2025 drill program confirmed a significant niobium discovery with 0.59% Nb₂O₅ over 36 metres, including 1.08% Nb₂O₅ over 10 metres, within a 1.8-kilometre-long niobium trend. The Cap Project continues to demonstrate strong potential for niobium mineralization within a large and previously unrecognized carbonatite system.
With a growing portfolio of critical mineral projects in both Canada and the United States, Apex Critical Metals is strategically positioned to help strengthen domestic supply chains for the minerals essential to advanced technologies, clean energy, and national security. Apex is publicly listed in Canada on the Canadian Securities Exchange (CSE) under the symbol APXC and quoted on the OTCQX market in the United States under the symbol APXCF, and in Germany on the Borse Frankfurt under the symbol KL9 and/or WKN: A40CCQ. Find out more at www.apexcriticalmetals.com and to sign up for free news alerts please go to https://apexcriticalmetals.com/news/news-alerts/, or follow us on X (formerly Twitter), Facebook or LinkedIn.
On Behalf of the Board of Directors
APEX CRITICAL METALS CORP.,
Sean CharlandChief Executive OfficerTel: 604.681.1568Email: info@apexcriticalmetals.com
Neither the Canadian Securities Exchange nor its Regulation Services Provider (as that term is defined in the policies of the CSE) accepts responsibility for the adequacy or accuracy of this release.
CAUTIONARY STATEMENT REGARDING FORWARD-LOOKING INFORMATION:
This news release may contain "forward-looking statements" under applicable Canadian securities legislation. Forward-looking statements consist of statements that are not purely historical, including any statements regarding beliefs, plans, expectations or intentions regarding the future. Forward-looking statements in this news release include (without limitation) statements regarding the Company's Canadian and US-based prospective assets (more particularly described above), including the potential for additional acquisitions, statements about the potential for the Rift Project's potential as a premier rare earth project in North America and statements regarding the anticipated drilling program on the Rift Project in 2026. Forward-looking statements are subject to various known and unknown risks and uncertainties that may cause actual results, performance or developments to differ materially from those contained in the statements. Risks that could change or prevent these events, activities or developments from coming to fruition include: the Company's properties are at an early stage of development and no current mineral resources or reserves have been identified by the Company thereof, that we may not be able to fully finance any additional exploration on the Company's properties; that even if we are able to raise capital, costs for exploration activities may increase such that we may not have sufficient funds to pay for such exploration or processing activities; the timing and content of any future work programs; geological interpretations based on drilling that may change with more detailed information; potential process methods and mineral recoveries assumptions based on limited test work and by comparison to what are considered analogous deposits that, with further test work, may not be comparable; testing of our process may not prove successful or samples derived from our properties may not yield positive results, and even if such tests are successful or initial sample results are positive, the economic and other outcomes may not be as expected; the anticipated market demand for REE and other minerals may not be as expected; the availability of labour and equipment to undertake future exploration work and testing activities; geopolitical risks which may result in market and economic instability. There can be no assurance that such statements will prove to be accurate, as actual results and future events could differ materially from those anticipated in such statements. Accordingly, readers should not place undue reliance on forward-looking statements. The forward-looking statements herein are made as of the date hereof, and the Company disclaims any intention or obligation to update or revise any forward-looking statements, whether as a result of new information, future events or otherwise, except as required by law.
SOURCE: Apex Critical Metals Corp.
View the original press release on ACCESS Newswire
After a tough 2025, the global lithium market is gearing up for a new growth cycle. Prices fell about 90% by mid-year from their 2022 peak levels as electric vehicle (EV) demand slowed and supply built up, but 2026 looks very different.
EVs will still drive demand, but new sources are joining the mix. Strong growth in solar power installations across Europe, the United States and the Asia-Pacific region is boosting the use of battery energy storage systems (BESS), which rely on lithium to store electricity from renewable energy.
Artificial intelligence is also creating a new need for lithium. Massive AI data centers use as much electricity as small cities, and many are now adding lithium-ion batteries on-site to handle peak energy use and reduce pressure on local grids. Autonomous machines and humanoid robots could become another steady source of lithium demand over the next decade.
Governments are taking notice, too. Many now treat lithium as strategic, like energy grids or defense equipment. This means governments may support production and investments, adding stability to the market.
Per Fortune Business Insights, the global lithium market is expected to expand from $13.9 billion in 2024 to $55.5 billion by 2032, implying a CAGR of nearly 19%.
While lithium prices have been under pressure, sentiment is turning. Lithium carbonate prices in China have rallied more than 20% so far this month. Major producer Ganfeng Lithium expects global lithium demand to grow 30-40% in 2026 and has flagged high price targets of 150,000-200,000 RMB/ton as the market moves back toward balance.
Against this backdrop, a few lithium stocks — Rio Tinto plc RIO, Lithium Americas Corp. LAC, Albemarle Corporation ALB and Sociedad Quimica y Minera de Chile S.A. SQM — are worth keeping on your watchlist.
Rio Tinto
Rio Tinto is making a serious push into lithium, aiming to become one of the world’s major producers. Earlier this year, the company completed its $6.7 billion acquisition of Arcadium Lithium, giving it access to one of the largest lithium resource bases globally. With Arcadium’s high-quality assets and broad product portfolio, Rio Tinto plans to grow capacity at its Tier 1 lithium operations to more than 200,000 tons of lithium carbonate equivalent per year by 2028.
Rio Tinto is also expanding its lithium footprint in South America. It acquired the Rincon project in Argentina in 2022 and made a $2.5 billion investment in the project in 2024. Rincon is expected to produce up to 60,000 tons of battery-grade lithium carbonate annually, with first production targeted for 2028 and a gradual ramp-up to full capacity.
In Chile, Rio Tinto has formed joint ventures with Codelco and ENAMI this year to develop high-grade lithium projects, strengthening its long-term supply pipeline.
For investors, Rio Tinto offers diversified exposure to lithium alongside its established global mining business. The stock sports a Zacks Rank #1 (Strong Buy). The Zacks Consensus Estimate for RIO’s next year EPS implies a year-over-year uptick of 11%. You can see the complete list of today’s Zacks #1 Rank stocks here.
Lithium Americas
Lithium Americas is making a bold play on the U.S. lithium market with its Thacker Pass project in Nevada, home to the largest lithium resource in the country. This project plays a critical role in securing domestic lithium supply. Thacker Pass is expected to produce up to 40,000 tons of lithium carbonate per year, enough for roughly 800,000 electric vehicles. If fully realized, this output could push the United States to the world’s second-largest lithium producer. Phase 1 of the project is on track, with mechanical construction of the processing plant expected to finish by late 2027.
The project has also attracted strong government backing. In October, the U.S. Department of Energy (“DOE”) acquired a 5% stake in both Lithium Americas and the Thacker Pass joint venture. Lithium Americas also drew the first $435 million from a larger $2.23 billion DOE loan, fueling construction and securing funding for the next stages.
For investors looking at the lithium rebound, LAC stands out as a key domestic play. Its combination of scale, government support and a clear production roadmap positions it well to benefit from rising lithium demand in the coming years.
LAC carries a Zacks Rank #3 (Hold). The Zacks Consensus Estimate for LAC’s next year’s bottom line suggests a year-over-year improvement of 42%.
Albermarle
Albemarle is one of the world’s top lithium producers, well-positioned to benefit from long-term growth in battery-grade lithium. The company is actively boosting its global lithium conversion capacity through strategic projects, focusing on high-return investments that improve productivity and efficiency. Production milestones are supporting growth. In Chile, the Salar yield improvement project has reached a 50% operating rate, while ramp-up at the Meishan lithium conversion facility in China is ahead of schedule. Record output from integrated conversion plants contributed to higher sales volumes in Albemarle’s Energy Storage unit in the third quarter of 2025.
Albemarle is also streamlining operations, cutting costs and optimizing its conversion network to maintain a strong competitive edge. In 2025, these initiatives are expected to deliver around $450 million in cost and productivity gains, exceeding the initial target of $300-400 million.
With robust customer demand, expanded capacity and efficiency improvements, ALB is positioned to capture rising lithium demand globally. Its scale, diversified operations and focus on cost management make it a key player for investors looking to ride on the lithium rebound in 2026.
ALB carries a Zacks Rank #3. The Zacks Consensus Estimate for ALB’s 2026 EPS implies a year-over-year jump of 217%.
Sociedad Quimica
Sociedad Química is one of the noted producers of lithium, supplying battery and energy storage markets worldwide. Its scale and global footprint make it a key player as lithium demand rebounds.
SQM has built a highly diversified lithium platform across Chile, Australia and China. In Chile, the company is expanding operations at the Salar de Atacama, targeting lithium carbonate production of 240,000 metric tons by 2026. It is also ramping up lithium hydroxide capacity to 100,000 metric tons by the end of 2025.
In Australia, SQM is advancing the Mt. Holland project, a 50,000-metric-ton lithium hydroxide operation developed through a joint venture, while pursuing additional exploration projects. In China, the company operates a lithium hydroxide refinery and tolling facility with 40,000 metric tons of capacity, strengthening its downstream reach and global supply chain.
SQM expects long-term lithium demand to outpace supply and has already completed major capacity upgrades. With these improvements in place, the company believes it can grow market share, especially in supplying lithium for EV batteries.
For investors, SQM offers scale, diversification and strong leverage to a lithium market recovery. The stock carries a Zacks Rank #3. The Zacks Consensus Estimate for SQM’s 2026 EPS indicates a year-over-year surge of 117%.
Want the latest recommendations from Zacks Investment Research? Today, you can download 7 Best Stocks for the Next 30 Days. Click to get this free report
Rio Tinto PLC (RIO) : Free Stock Analysis Report
Albemarle Corporation (ALB) : Free Stock Analysis Report
Sociedad Quimica y Minera S.A. (SQM) : Free Stock Analysis Report
Lithium Americas Corp. (LAC) : Free Stock Analysis Report
This article originally published on Zacks Investment Research (zacks.com).
Bravo Mining’s (BRVO.V) Chairman and Chief Executive Luis Azevedo on Wednesday issued his annual let
TORONTO, Dec. 31, 2025 /CNW/ – Bravo Mining Corp. (TSX.V: BRVO) (OTCQX: BRVMF), ("Bravo" or the "Company") today issued its Annual Letter to Shareholders as per below (the "Letter").
Dear fellow Shareholders,
It is with immense gratitude and a profound sense of accomplishment that I address you at the close of 2025, a year that will undoubtedly be marked as a watershed moment for Bravo Mining Corp.
This past year represents a clear inflection point in the Company's evolution, one defined by disciplined execution, material de-risking of our flagship asset and consistent value creation; a year that consolidated our Luanga palladium + platinum + rhodium + gold + nickel project ("Luanga Project" or "Luanga PGM+Au+Ni Project") as one of the few large-scale, multi-million-ounce, open-pit PGM+Au+Ni deposits globally, located in a mining-friendly, geopolitically favourable and infrastructure-rich jurisdiction.
Our philosophy has remained consistent: to de-risk and advance Luanga methodically while maintaining disciplined capital allocation, enabling us to endure challenging commodity cycles and remain well positioned to benefit from shifts in market sentiment, as is now the case with PGMs and gold. This approach has allowed us to deliver a series of significant milestones while maintaining a strong financial position providing a solid platform for continued progress in 2026.
Strategic and Operational Milestones in 2025:
This year was punctuated by the delivery of a series of significant milestones that placed Luanga in the premier league of PGM projects globally:
Updated Mineral Resource Estimate1 ("MRE"): Exceeding our own expectations for resource growth, early in the year we reported the follow-on to our 2023 maiden MRE1, delivering significant increases in tonnage, grade, and resource confidence, while keeping the door open for continued resource expansion.
The updated MRE1 outlines total Measured and Indicated ("M&I") resources of 158 million tonnes ("Mt") grading 2.04 grams per tonne ("g/t") PdEq¹, containing 10.4 million ounces ("Moz") of PdEq¹, along with Inferred Resources of 78 Mt grading 2.01 g/t PdEq¹ for an additional 5.0 Moz PdEq¹. Importantly, approximately two-thirds of the total resource is now classified in the M&I category, with 86% of the MRE1 tonnage defined to a depth of only 250 metres, while mineralization has been confirmed to at least 400 metres, clearly indicating strong potential for further growth at depth.
1 Notes and Disclaimers on MRE and Palladium Equivalent – For MRE details, grades by individual metals and details for the basis of the Palladium Equivalent calculation, please see "Luanga Project 2025 MRE" section at the end of this press release.
Preliminary License (LP) Obtained: In February 2025 we secured the Preliminary License (LP) for our Luanga Project, the most critical and time-intensive permit in Brazil's environmental licensing process. Preparation for Luanga's permitting began well before our IPO in July 2022, with early environmental studies, proactive community engagement, and strong collaboration with government agencies.
This dedication culminated in a highly successful public hearing on December 12, 2024, where we received overwhelming community support, paving the way for this achievement.
Preliminary Economic Assessment2 ("PEA") Completed: In June 2025, we completed the PEA2 for the Luanga Project, outlining a potential for 17-year Life of Mine with average annual payable production of approximately 436,000 Ounces of 4 PGE (255,000 oz Palladium, 158,000 oz Platinum, 15,000 oz Rhodium, 8,500 oz Gold) plus 8,549 tonnes of Nickel.
The PEA2 evaluated two development scenarios. The Base Case, based on flotation concentrate sales to a third-party refiner, illustrated potential for an after-tax Net Present Value at 8% ("NPV8%") of US$1.25 billion and an IRR of 49%. The Alternate Case, which contemplates a vertically integrated operation, enhances value with an after-tax NPV8% of US$1.86 billion and a 49% IRR. Such economics were achieved assuming a 4 PGE basket price about 30% lower than prevailing prices (Dec 30, 2025).
The combination of high margins and a low CAPEX-to-NPV ratio underscores the potential of Luanga's open-pit nature over its 8.1km of continuous mineralized strike and favorable setting for project development, where existing infrastructure, such as paved roads alongside the deposit, power lines, cost-effective hydropower, water availability, a skilled mining workforce and tax incentives, result in operating costs that could be meaningfully more competitive than many other PGM deposits worldwide.
2For complete details, forward looking statements and disclaimers of the PEA, please see press release published on July 7, 2025. The PEA is based on the 2025 MRE for the Luanga Project (see later section: Luanga Project 2025 MRE and press release published on February 18, 2025)
Bravo to Anchor New Port of Vila do Conde Export Processing Zone (ZPE): One of the year's most significant strategic advancements was the selection of Bravo as the anchor company for the newly created Barcarena Export Processing Zone (ZPE) at the Port of Vila do Conde, Pará, the first mineral project ever to anchor a ZPE in Brazil. This designation materially strengthens Luanga's vertical integration optionality outlined in the PEA's Alternate Case2, providing a framework to support potential future concentrate processing through a smelter, whether developed by Bravo, in partnership, or by a third party.
The ZPE significantly enhances this opportunity through potential CAPEX savings, import exemptions on equipment and supplies, and tax-free exports from a strategically located deep-sea port. Importantly, the Barcarena industrial corridor hosts multiple fertilizer and chemical producers that currently rely on imported sulphuric acid. Acid generated locally as a by-product of Luanga's potential processing route could be sold directly to fertilizer blenders, creating a meaningful additional revenue stream while helping address Brazil's structural deficit in sulphuric acid supply. To illustrate this opportunity, the PEA conservatively assumed a sulphuric acid sales credit of US$160/t, while recent market prices have reached approximately US$440/t, levels that have forced major fertilizer producers to temporarily suspend production.
While Luanga's Base Case2 already illustrates potential standalone economics, the ZPE-enabled Alternate Case could meaningfully enhance project optionality and resilience. With few viable PGM development projects globally, the ZPE represents a clear differentiator within the "Bravo package", positioning Luanga not only as a compelling PGM and nickel project, but also as a potential mine-to-agro solution aligned with Brazil's strategic minerals and agricultural agendas.
Advancement in Copper-Gold Potential: We continue to make progress in understanding and advancing the copper–gold potential at and around the Luanga Project, adding another track for value creation to Bravo. Both IOCG-style (Iron Oxide Copper Gold) and magmatic Ni–Cu mineralization have now been identified across several of the 17 prioritized targets.
The 2025 exploration program has confirmed extensions of copper-gold mineralization at T5 target, delivered encouraging results from initial scout drilling at T16 and T17, and expanded focus to new targets such as Babylon, which is associated with a large magnetic anomaly.
In parallel, reprocessed geophysical datasets are being used to investigate potential depth extensions of Luanga's PGM+Au+Ni mineralization, while refining drill targeting across both IOCG and magmatic Ni–Cu systems. These efforts are systematically building a robust pipeline of exploration prospects that highlight Luanga's potential well beyond the core PGM+Au+Ni deposit.
Member of the World Platinum Investment Council (WPIC): Bravo became the first pre-production PGM company to join the World Platinum Investment Council (WPIC), gaining access to valuable market intelligence and deeper engagement with both upstream and downstream participants across the global PGM value chain. This membership also provides a platform to increase awareness of the strategic significance and quality of the Luanga Project, reflecting important recognition of Bravo's growing role in the global PGM market.
Commitment to ESG: A Year of Legacy and Impact:
In terms of ESG (Environmental, Social, and Governance), 2025 was a truly remarkable year of great personal significance for me and for the entire Bravo team.
Serra Feliz Project and Partnership with the RCF Foundation: We maintained and extended our support program for children and youth in the Serra Feliz Project. We are immensely grateful to the RCF Foundation, which, part of the same group as one of our key investors, the RCF Opportunities Fund, continues to be an invaluable partner. Together, we positively impacted over 300 children, youth, and adults, promoting education, sports, dance, theater, and leisure, and contributing to improving school performance, reducing absenteeism, and boosting self-esteem and motivation. We closed the year by promoting our usual "Solidarity Christmas" for a "Christmas without Hunger" campaign, distributing basic food baskets ("Cestas Básicas") to 715 families across the communities that surround our operations.
Historic Reforestation Mark: Our reforestation program reached the impressive milestone of 44,510 trees planted. This is a significant leap from the 30,000 trees we had planted by January 2025, with over 10,000 additional ones already in our nursery and planned for the year. We prioritize planting high-value, fruit-bearing trees, such as Brazil nuts, cocoa, açaí, acerola cherry, and other native species, aiming for the rehabilitation of degraded areas within and outside the Luanga project, including in local communities and areas affected by artisanal mining. This effort demonstrates our respect for the environment, support food security for local residents and our commitment to biodiversity.
Safety and Well-being: The safety of our team is paramount. With pride, we surpassed the mark of 650,000 hours without lost-time injuries. This achievement is a testament to our safety culture, continuous training, and diligent supervision of all field activities, building upon the 522,307 hours achieved in January 2025.
Industry and Personal Recognition: For the second time (the first being in 2023), Bravo had the honor of being recognized at the 2025 Brasil Mineral Awards as Mining Company of the Year – Exploration & Prospector (small–mid companies). This distinction validates our strategy, the quality of our team, and the excellence of our work.
In addition, I had the privilege of being honored as Mineral Sector Personality of the Year ("Miner of the Year"), marking the second time I have received this award in my professional career (previously in 2018). This recognition is one I share with our entire team, as it reflects the collective dedication and effort behind Bravo's success.
Gratitude and the Vision Beyond Reflection:
The primary purpose of this letter is to express my sincere gratitude to our shareholders, directors, stakeholders, and the entire Bravo team for your continued support over the past three years. From the outset, our ambition has been clear: to build long-term value anchored by our highly valued and sought-after basket of commodities while creating a legacy of responsible and sustainable mining that benefits the communities surrounding our project and, ultimately, Brazil.
As in prior years, our progress has often been assessed through charts, trends, short-term results, and market comparisons, a constant flow of information that can sometimes reflect little more than momentary sentiment. Throughout this process, the support of our executive team, Board, and shareholders has been instrumental in maintaining focus on the underlying value of Luanga and its potential to become a benchmark asset within our industry.
There were periods when prevailing narratives questioned the future relevance of PGMs, with some characterizing them as commodities in decline and encouraging us to shift course. We listened carefully but remained committed to our long-term strategic view. That conviction has been validated: in 2025, PGMs emerged as one of the strongest-performing commodities. I thank you for the trust, patience, and confidence that allowed us to stay the course and emerge stronger.
Looking Ahead to 2026: Consolidation and Responsible Expansion:
Looking ahead, even as we potentially navigate a more favorable commodity-cycle environment, we will not compromise our principles, convictions, or discipline. We remain focused on de-risking the project with the same cash discipline that preserves our strong capital structure. Our decisions will not be driven solely by commodity prices, but by long-term value creation.
We are advancing toward the delivery of a Pre-Feasibility Study ("PFS"), continuing to optimize metallurgical processes and plant design, while maintaining ongoing dialogue with potential strategic partners capable of enhancing project value and development strategies, not only across PGMs, but also through our copper–gold opportunities. At the same time, we will continue to strengthen our ESG practices and deepen our community and institutional engagement with the government agencies overseeing our development.
With the guidance of our strong Board of Directors, further strengthened in April 2025 by the appointment of the highly regarded Margot Naudie, and with the continued support of our friend and PGM expert Stuart Comline, who remains a consultant to the Company, I am confident that we will deliver on our objectives and translate our success into value for both existing and future shareholders.
Bravo's journey is a story of vision, resilience, and, above all, collaboration. We believe in Luanga's potential to become a key supplier of essential and critical metals, contributing to a greener and technologically advanced global economy, always with the commitment to operate responsibly and generate value for all.
On behalf of the Board of Directors and management, I thank you once again for your invaluable support. Let us toast to an even more promising future.
We are Bravo!
Luis AzevedoChairman and CEOBravo Mining Corp.
About Bravo Mining Corp.
Bravo is a Canadian and Brazil-based mineral exploration and development company focused on advancing its PGM+Au+Ni Luanga Project, as well as our copper-gold exploration opportunities in the world-class Carajás Mineral Province, Para State, Brazil.
Bravo is one of the most active explorers in Carajás. The team, comprising of local and international geologists and engineers, has a proven track record of PGM, nickel, and copper discoveries in the region and elsewhere. The individuals in the team have successfully taken a past iron oxide copper gold (IOCG) greenfield project from discovery to development and production in the Carajás.
The Luanga Project is situated on mature freehold farming land and benefits from being located close to operating mines and a mining-experienced workforce, with excellent access and proximity to existing infrastructure, including road, rail, ports, and hydroelectric grid power. Bravo's current Environmental, Social and Governance activities include planting and donating more than 42,000 high-value trees in and around the project area in the past 30 months, while hiring personnel and contracting services locally.
Technical Disclosure
Technical information in this news release has been reviewed and approved by Simon Mottram, F.AusIMM (Fellow Australia Institute of Mining and Metallurgy), President of Bravo Mining Corp. who serves as the Company's "qualified person" as defined in NI 43-101. Mr. Mottram has verified the technical data and opinions contained in this news release.
Details of the MRE and PEA with cautionary language are provided in a technical report titled "NI 43-101 Preliminary Economic Assessment (PEA) Independent Technical Report for the Luanga PGM + Au + Ni Project Pará, Brazil", with an effective date of July 7, 2025, filed under the Company's SEDAR+. It can also be found in the Company's website in the link: NI 43-101 Preliminary Economic Assessment (PEA) Independent Technical Report for the Luanga PGM + Au + Ni Project, Pará, Brazil
Neither TSX Venture Exchange nor its Regulation Services Provider (as that term is defined in policies of the TSX Venture Exchange) accepts responsibility for the adequacy or accuracy of this release.
Forward Looking Statements.
This news release contains forward-looking information, words and statements which are not comprised of historical facts. Forward-looking information is characterized by words and statements such as "clearly indicating", "potential", "further growth", "materially strengthens", "meaningfully enhances", "continue to strengthen", "will deliver on our objectives", "solid", "assumed", "significant", "success", "translate", "well positioned", similar words, phrases, or statements that certain events or conditions "could", "may", "should", "will" or "would" occur. This news release contains forward-looking information pertaining to the Company's 2025 PEA; the potential for future MRE growth; whether or not current or future discoveries of copper-gold mineralization at Luanga will have sufficient economic merit to consider development; potential repeatability and improvements to the economic assumptions and/or to metallurgical recoveries used in the PEA and MRE in future studies; the potential to convert some or all of the MRE to mineral reserves through economic studies and the timing and results of any such studies; the assumption that onsite vertical integration/downstream processing will be technically and economically feasible and that an experienced/strategic partner will be identified and terms of a relationship be acceptable to Bravo; the ultimate cost of power for any future mine developed; the duration and prices in future commodity cycles; whether more value can be unlocked within the Luanga in the future; changes in the exchange rate between the US$ and Brazilian Real; the results of subsequent stages of permitting, including but not limited to the timing, granting and conditions of the Installation License (LI) and Operation License ("LO") referred to herein; the outcomes of future economic studies and the Company's plans in respect thereof. Forward-looking information involves risks, uncertainties and other factors that could cause actual events, results, and opportunities to differ materially from those expressed or implied by such forward-looking information. Factors that could cause actual results to differ materially from such forward-looking information include, but are not limited to, unexpected results from exploration programs, changes in the state of equity and debt markets, fluctuations in commodity prices, delays in obtaining required regulatory or governmental approvals, environmental risks, limitations on insurance coverage; and other risks and uncertainties involved in the mineral exploration and development industry. Forward-looking information in this news release is based on the opinions and assumptions of management considered reasonable as of the date hereof, including, but not limited to, the assumption that the assay results confirm that the interpreted mineralization contains significant values of nickel, PGMs and Au; that the mineralization remains open at depth, that PGM and/or Ni grades and mineralized thicknesses are improving at depth; that activities will not be adversely disrupted or impeded by regulatory, political, community, economic, environmental and/or healthy and safety risks; that the Luanga Project will not be materially affected by potential supply chain disruptions; and general business and economic conditions will not change in a materially adverse manner. Although the Company believes that the assumptions and factors used in preparing the forward-looking information in this news release are reasonable, undue reliance should not be placed on such information. The Company disclaims any intention or obligation to update or revise any forward-looking information, other than as required by applicable securities laws.
Luanga Project 2025 MRE
Mineral resources that are not mineral reserves do not have demonstrated economic viability. There is no certainty that all mineral resources would be converted into mineral reserves. This MRE includes Inferred Mineral Resources which have not had sufficient work to classify them as Indicated mineral resources. It is uncertain but reasonably expected that inferred mineral resources could be upgraded to indicated mineral resources with continued exploration. For further information please refer to the 2025 MRE NI 43-101 Independent Technical Report (SEDAR+) with an effective date of February 18, 2025.
Note that the assumed PEA production schedule is based on a subset of this 2025 MRE and uses a higher cut-off grade (0.87g/t PdEq for the PEA versus 0.5g/t PdEq for the MRE) to provide what Bravo deems to be an optimal return in the PEA economic model, which also excludes consideration of Oxide material at this point in time.
|
Resource Classification |
Weathering |
Average Grades and Contained Metal Estimates |
||||||||||||
|
Tonnes |
PdEq |
Pd |
Pt |
Rh |
Au |
Ni |
||||||||
|
Mt |
g/t |
Oz |
g/t |
Oz |
g/t |
Oz |
g/t |
Oz |
g/t |
Oz |
% |
Tonnes |
||
|
Measured |
Oxide |
4 |
1.51 |
197 |
0.90 |
117 |
0.88 |
115 |
0.12 |
15 |
0.05 |
7 |
— |
— |
|
High talc |
— |
— |
— |
— |
— |
— |
— |
— |
— |
— |
— |
— |
— |
|
|
Fresh Rock |
32 |
2.06 |
2,144 |
0.97 |
1,009 |
0.67 |
694 |
0.08 |
88 |
0.04 |
46 |
0.11 |
35,282 |
|
|
Total |
36 |
2.00 |
2,340 |
0.96 |
1,126 |
0.69 |
809 |
0.09 |
104 |
0.04 |
53 |
0.10 |
35,282 |
|
|
Indicated |
Oxide |
6 |
1.51 |
314 |
0.97 |
200 |
0.73 |
151 |
0.11 |
23 |
0.04 |
9 |
— |
— |
|
High talc |
2 |
1.83 |
146 |
1.12 |
89 |
0.54 |
43 |
0.08 |
6 |
0.11 |
9 |
0.13 |
3,160 |
|
|
Fresh Rock |
113 |
2.09 |
7,599 |
0.99 |
3,583 |
0.59 |
2,133 |
0.09 |
318 |
0.05 |
193 |
0.14 |
156,406 |
|
|
Total |
122 |
2.06 |
8,058 |
0.99 |
3,872 |
0.59 |
2,326 |
0.09 |
348 |
0.05 |
210 |
0.13 |
159,566 |
|
|
Measured + Indicated |
Oxide |
10 |
1.51 |
510 |
0.94 |
317 |
0.79 |
266 |
0.11 |
38 |
0.04 |
15 |
— |
— |
|
High talc |
2 |
1.83 |
146 |
1.12 |
89 |
0.54 |
43 |
0.08 |
6 |
0.11 |
9 |
0.13 |
3,160 |
|
|
Fresh Rock |
145 |
2.08 |
9,743 |
0.98 |
4,592 |
0.60 |
2,827 |
0.09 |
407 |
0.05 |
239 |
0.13 |
191,688 |
|
|
Total |
158 |
2.04 |
10,399 |
0.98 |
4,998 |
0.62 |
3,135 |
0.09 |
451 |
0.05 |
262 |
0.12 |
194,848 |
|
|
Inferred |
Oxide |
3 |
1.57 |
130 |
0.88 |
73 |
1.04 |
86 |
0.13 |
11 |
0.05 |
4 |
— |
— |
|
High talc |
0.1 |
1.76 |
5 |
1.08 |
3 |
0.53 |
2 |
0.07 |
0 |
0.10 |
0 |
0.14 |
133 |
|
|
Fresh Rock |
75 |
2.02 |
4,878 |
0.97 |
2,344 |
0.58 |
1,389 |
0.08 |
191 |
0.05 |
123 |
0.13 |
97,586 |
|
|
Total |
78 |
2.01 |
5,013 |
0.97 |
2,421 |
0.59 |
1,476 |
0.08 |
202 |
0.05 |
128 |
0.13 |
97,719 |
|
|
Table 8: MRE Declaration at a Cut-off of 0.5g/t PdEq* |
|
Table 11: Luanga Project 2025 MRE |
|
Notes to the MRE: |
|
1. |
The 2025 MRE was prepared by Bernardo Horta de Cerqueira Viana, Geologist, BSc (Geology), FAIG, CEO of GE21 Consultoria Mineral Ltda. and Porfírio Cabaleiro Rodriguez, Mining Engineer, BSc (Mine Eng), FAIG, CKO of GE21 Consultoria Mineral Ltda., both independent Qualified Person ("QP") for the purposes of National Instrument 43-101 Standards of Disclosure for Mineral Projects ("NI 43-101"). The effective date of the MRE is 18 February 2025. |
|
2. |
Mineral resources are reported using the 2014 CIM Definition Standards and were estimated in accordance with the CIM 2019 Best Practices Guidelines, as required by National Instrument 43-101 Standards of Disclosure for Mineral Projects ("NI 43-101"). |
|
3. |
The MRE Estimate is reported/confined within an economic pit shell generated by Dassault Geovia Whittle software, using the following assumptions:
|
|
4. |
The 2025 MRE supersedes and replaces the Previous Estimate (2023), which should be no longer relied upon. |
|
5. |
The QP is not aware of political, environmental, or other risks that could materially affect the potential development of the Mineral Resources other than those typical for mining projects at this stage of development, including those listed in the Technical Report dated October 22nd, 2023, and in the Company's Annual Information Form dated April 22nd, 2024. |
|
6. |
Totals may not sum due to rounding. |
Cision
View original content to download multimedia: http://www.newswire.ca/en/releases/archive/December2025/31/c0187.html
If you would like to receive our free newsletter via email, simply enter your email address below & click subscribe.
 Follow us on Twitter
 Become our facebook fan
CONNECT WITH US
Tweets
Tweet with hash tag #miningfeeds or @miningfeeds and your tweets will be displayed across this site.
MOST ACTIVE MINING STOCKS
Daily Gainers
 CMC Metals Ltd. CMC Metals Ltd. |
CMB.V | +900.00% |
 Eden Energy Ltd Eden Energy Ltd |
EDE.AX | +200.00% |
| GoviEx Uranium Inc. |
GXU.V | +42.86% |
| Eagle Nickel Ltd. |
ENL.AX | +41.67% |
| Citigold Corp. Limited |
CTO.AX | +33.33% |
| Mount Burgess Mining NL |
MTB.AX | +33.33% |
| Exalt Resources Limited |
ERD.AX | +31.94% |
| Casa Minerals Inc. |
CASA.V | +30.00% |
| Cariboo Rose Resources Ltd |
CRB.V | +28.57% |
| Belmont Resources Inc. |
BEA.V | +28.57% |


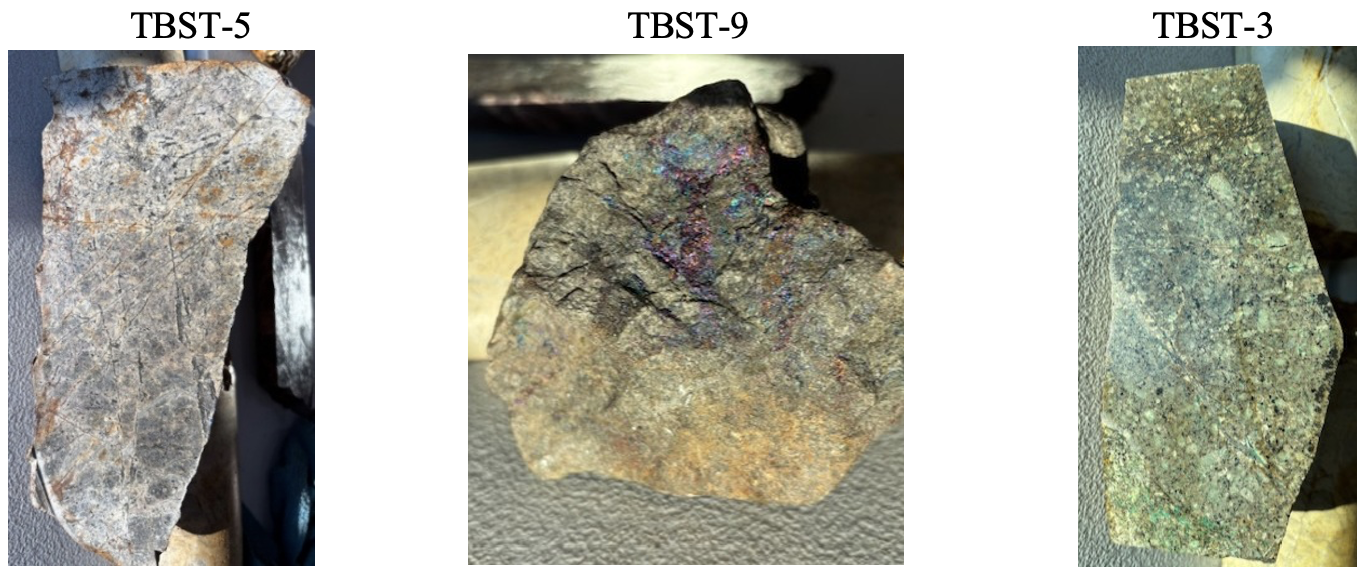